Exhibit (c) (4)
Project Carbon PRELIMINARY DISCUSSION MATERIALS FOR THE SPECIAL COMMITTEE SEPTEMBER 9, 2021 | CONFIDENTIAL | PRELIMINARY DRAFT
CONFIDENTIAL - PRELIMINARY DRAFT - SUBJECT TO FURTHER REVIEW Table of Contents 2 Page 1. Executive Summary 3 2. Preliminary Financial Analyses Summary 6 3. Preliminary Financial Observations and Analyses 12 IWCO 13 ModusLink 25 4. Preliminary Considerations Related to Proposal 35 5. Appendices 45 Supplemental Financial Analysis Schedules 46 Form of Consideration Observations 48 6. Disclaimer 52

Page 1. Executive Summary 3 2. Preliminary Financial Analyses Summary 6 3. Preliminary Financial Observations and Analyses 12 4. Preliminary Considerations Related to Proposal 35 5. Appendices 45 6. Disclaimer 52
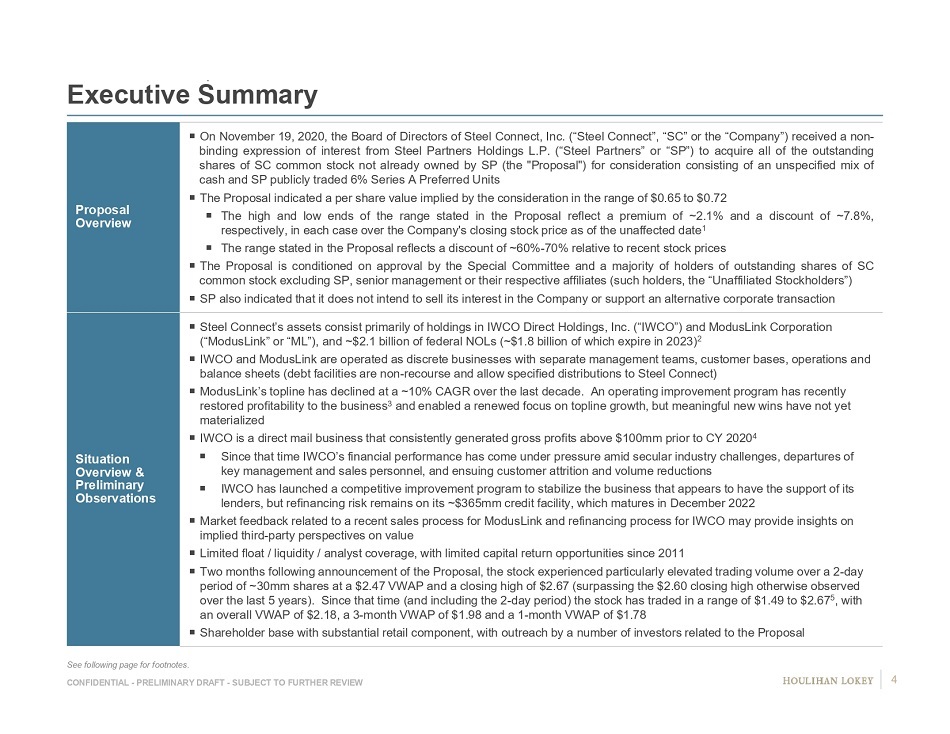
CONFIDENTIAL - PRELIMINARY DRAFT - SUBJECT TO FURTHER REVIEW Executive Summary Proposal Overview On November 19 , 2020 , the Board of Directors of Steel Connect, Inc . (“Steel Connect”, “SC” or the “Company”) received a non - binding expression of interest from Steel Partners Holdings L . P . (“Steel Partners” or “SP”) to acquire all of the outstanding shares of SC common stock not already owned by SP (the "Proposal") for consideration consisting of an unspecified mix of cash and SP publicly traded 6 % Series A Preferred Units The Proposal indicated a per share value implied by the consideration in the range of $ 0 . 65 to $ 0 . 72 The high and low ends of the range stated in the Proposal reflect a premium of ~ 2 . 1 % and a discount of ~ 7 . 8 % , respectively, in each case over the Company's closing stock price as of the unaffected date 1 The range stated in the Proposal reflects a discount of ~ 60 % - 70 % relative to recent stock prices The Proposal is conditioned on approval by the Special Committee and a majority of holders of outstanding shares of SC common stock excluding SP, senior management or their respective affiliates (such holders, the “Unaffiliated Stockholders”) SP also indicated that it does not intend to sell its interest in the Company or support an alternative corporate transaction Situatio n Overview & Preliminary Observations Steel Connect’s assets consist primarily of holdings in IWCO Direct Holdings, Inc. (“IWCO”) and ModusLink Corporation (“ModusLink” or “ML”), and ~$2.1 billion of federal NOLs (~$1.8 billion of which expire in 2023) 2 IWCO and ModusLink are operated as discrete businesses with separate management teams, customer bases, operations and balance sheets (debt facilities are non - recourse and allow specified distributions to Steel Connect) ModusLink’s topline has declined at a ~10% CAGR over the last decade. An operating improvement program has recently restored profitability to the business 3 and enabled a renewed focus on topline growth, but meaningful new wins have not yet materialized IWCO is a direct mail business that consistently generated gross profits above $100mm prior to CY 2020 4 Since that time IWCO’s financial performance has come under pressure amid secular industry challenges, departures of key management and sales personnel, and ensuing customer attrition and volume reductions IWCO has launched a competitive improvement program to stabilize the business that appears to have the support of its lenders, but refinancing risk remains on its ~$365mm credit facility, which matures in December 2022 Market feedback related to a recent sales process for ModusLink and refinancing process for IWCO may provide insights on implied third - party perspectives on value Limited float / liquidity / analyst coverage, with limited capital return opportunities since 2011 Two months following announcement of the Proposal, the stock experienced particularly elevated trading volume over a 2 - day period of ~30mm shares at a $2.47 VWAP and a closing high of $2.67 (surpassing the $2.60 closing high otherwise observed over the last 5 years). Since that time (and including the 2 - day period) the stock has traded in a range of $1.49 to $2.67 5 , with an overall VWAP of $2.18, a 3 - month VWAP of $1.98 and a 1 - month VWAP of $1.78 Shareholder base with substantial retail component, with outreach by a number of investors related to the Proposal See following page for footnotes. 4
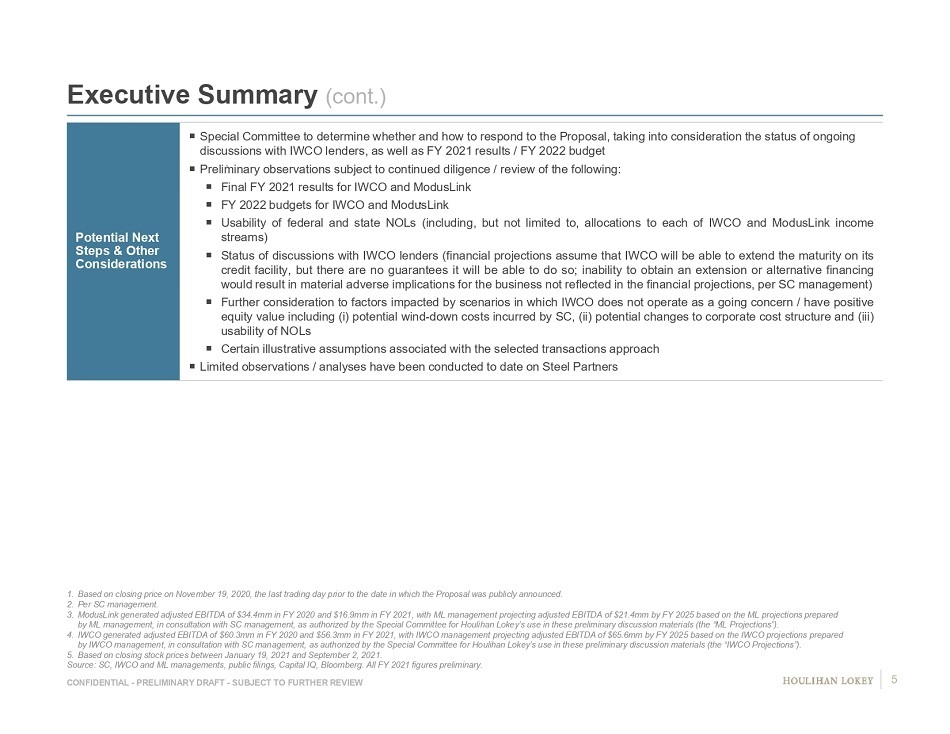
CONFIDENTIAL - PRELIMINARY DRAFT - SUBJECT TO FURTHER REVIEW Executive Summary (cont.) Potential Next Steps & Other Considerations Special Committee to determine whether and how to respond to the Proposal, taking into consideration the status of ongoing discussions with IWCO lenders, as well as FY 2021 results / FY 2022 budget Preliminary observations subject to continued diligence / review of the following: Final FY 2021 results for IWCO and ModusLink FY 2022 budgets for IWCO and ModusLink Usability of federal and state NOLs (including, but not limited to, allocations to each of IWCO and ModusLink income streams) Status of discussions with IWCO lenders (financial projections assume that IWCO will be able to extend the maturity on its credit facility, but there are no guarantees it will be able to do so ; inability to obtain an extension or alternative financing would result in material adverse implications for the business not reflected in the financial projections, per SC management) Further consideration to f actors impacted by scenarios in which IWCO does not operate as a going concern / have positive equity value including (i) potential wind - down costs incurred by SC, (ii) potential changes to corporate cost structure and (iii) usability of NOLs Certain illustrative assumptions associated with the selected transactions approach Limited observations / analyses have been conducted to date on Steel Partners 1. Based on closing price on November 19, 2020, the last trading day prior to the date in which the Proposal was publicly announ ced . 2. Per SC management. 3. ModusLink generated adjusted EBITDA of $34.4mm in FY 2020 and $16.9mm in FY 2021, with ML management projecting adjusted EBIT DA of $21.4mm by FY 2025 based on the ML projections prepared by ML management, in consultation with SC management, as authorized by the Special Committee for Houlihan Lokey’s use in thes e p reliminary discussion materials (the “ML Projections”). 4. IWCO generated adjusted EBITDA of $60.3mm in FY 2020 and $56.3mm in FY 2021, with IWCO management projecting adjusted EBITDA of $65.6mm by FY 2025 based on the IWCO projections prepared by IWCO management, in consultation with SC management, as authorized by the Special Committee for Houlihan Lokey’s use in th ese preliminary discussion materials (the “IWCO Projections”). 5. Based on closing stock prices between January 19, 2021 and September 2, 2021. Source: SC, IWCO and ML managements, public filings, Capital IQ, Bloomberg. All FY 2021 figures preliminary. 5
Page 1. Executive Summary 3 2. Preliminary Financial Analyses Summary 6 3. Preliminary Financial Observations and Analyses 12 4. Preliminary Considerations Related to Proposal 35 5. Appendices 45 6. Disclaimer 52
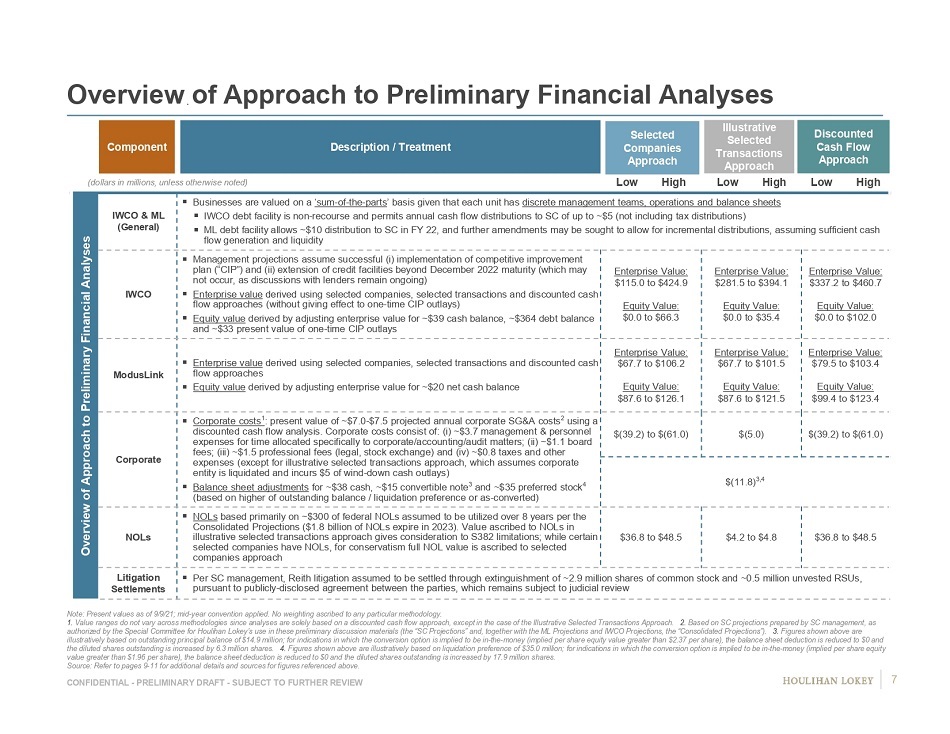
CONFIDENTIAL - PRELIMINARY DRAFT - SUBJECT TO FURTHER REVIEW b Low High Low High Low High Overview of Approach to Preliminary Financial Analyses IWCO & ML (General) ▪ Businesses are valued on a ‘sum - of - the - parts ’ basis given that each unit has discrete management teams, operations and balance sheets ▪ IWCO debt facility is non - recourse and permits annual cash flow distributions to SC of up to ~$5 (not including tax distributions) ▪ ML debt facility allows ~$10 distribution to SC in FY 22, and further amendments may be sought to allow for incremental distr ibu tions, assuming sufficient cash flow generation and liquidity IWCO ▪ Management projections assume successful (i) implementation of competitive improvement plan (“CIP”) and (ii) extension of credit facilities beyond December 2022 maturity (which may not occur, as discussions with lenders remain ongoing) ▪ Enterprise value derived using selected companies, selected transactions and discounted cash flow approaches (without giving effect to one - time CIP outlays) ▪ Equity value derived by adjusting enterprise value for ~$39 cash balance, ~$364 debt balance and ~$33 present value of one - time CIP outlays Enterprise Value: $115.0 to $424.9 Equity Value: $0.0 to $66.3 Enterprise Value: $281.5 to $394.1 Equity Value: $0.0 to $35.4 Enterprise Value: $337.2 to $460.7 Equity Value: $0.0 to $102.0 ModusLink ▪ Enterprise value derived using selected companies, selected transactions and discounted cash flow approaches ▪ Equity value derived by adjusting enterprise value for ~$20 net cash balance Enterprise Value: $67.7 to $106.2 Equity Value: $87.6 to $126.1 Enterprise Value: $67.7 to $101.5 Equity Value: $87.6 to $121.5 Enterprise Value: $79.5 to $103.4 Equity Value: $99.4 to $123.4 Corporate ▪ Corporate costs 1 : present value of ~$7.0 - $7.5 projected annual corporate SG&A costs 2 using a discounted cash flow analysis. Corporate costs consist of: (i) ~$3.7 management & personnel expenses for time allocated specifically to corporate/accounting/audit matters; (ii) ~$1.1 board fees; (iii) ~$1.5 professional fees (legal, stock exchange) and (iv) ~$0.8 taxes and other expenses (except for illustrative selected transactions approach, which assumes corporate entity is liquidated and incurs $5 of wind - down cash outlays) ▪ Balance sheet adjustments for ~$38 cash, ~$15 convertible note 3 and ~$35 preferred stock 4 (based on higher of outstanding balance / liquidation preference or as - converted) $(39.2) to $(61.0) $(5.0) $(39.2) to $(61.0) $(11.8) 3,4 NOLs ▪ NOLs based primarily on ~$300 of federal NOLs assumed to be utilized over 8 years per the Consolidated Projections ($1.8 billion of NOLs expire in 2023). Value ascribed to NOLs in illustrative selected transactions approach gives consideration to S382 limitations; while certain selected companies have NOLs, for conservatism full NOL value is ascribed to selected companies approach $36.8 to $48.5 $4.2 to $4.8 $36.8 to $48.5 Litigation Settlements ▪ Per SC management, Reith litigation assumed to be settled through extinguishment of ~2.9 million shares of common stock and ~0.5 million unvested RSUs , pursuant to publicly - disclosed agreement between the parties, which remains subject to judicial review Overview of Approach to Preliminary Financial Analyses Description / Treatment Selected Companies Approach Illustrative Selected Transactions Approach Component Discounted Cash Flow Approach (dollars in millions, unless otherwise noted) Note: Present values as of 9/9/21; mid - year convention applied. No weighting ascribed to any particular methodology. 1. Value ranges do not vary across methodologies since analyses are solely based on a discounted cash flow approach, except in t he case of the Illustrative Selected Transactions Approach. 2. Based on SC projections prepared by SC management, as authorized by the Special Committee for Houlihan Lokey’s use in these preliminary discussion materials (the “SC Projections” and , together with the ML Projections and IWCO Projections, the “Consolidated Projections”). 3. Figures shown above are illustratively based on outstanding principal balance of $14.9 million; for indications in which the conversion option is imp lie d to be in - the - money (implied per share equity value greater than $2.37 per share), the balance sheet deduction is reduced to $0 and the diluted shares outstanding is increased by 6.3 million shares. 4. Figures shown above are illustratively based on liquidation preference of $35.0 million; for indications in which the convers io n option is implied to be in - the - money (implied per share equity value greater than $1.96 per share), the balance sheet deduction is reduced to $0 and the diluted shares outstanding is incre ase d by 17.9 million shares. Source: Refer to pages 9 - 11 for additional details and sources for figures referenced above. 7
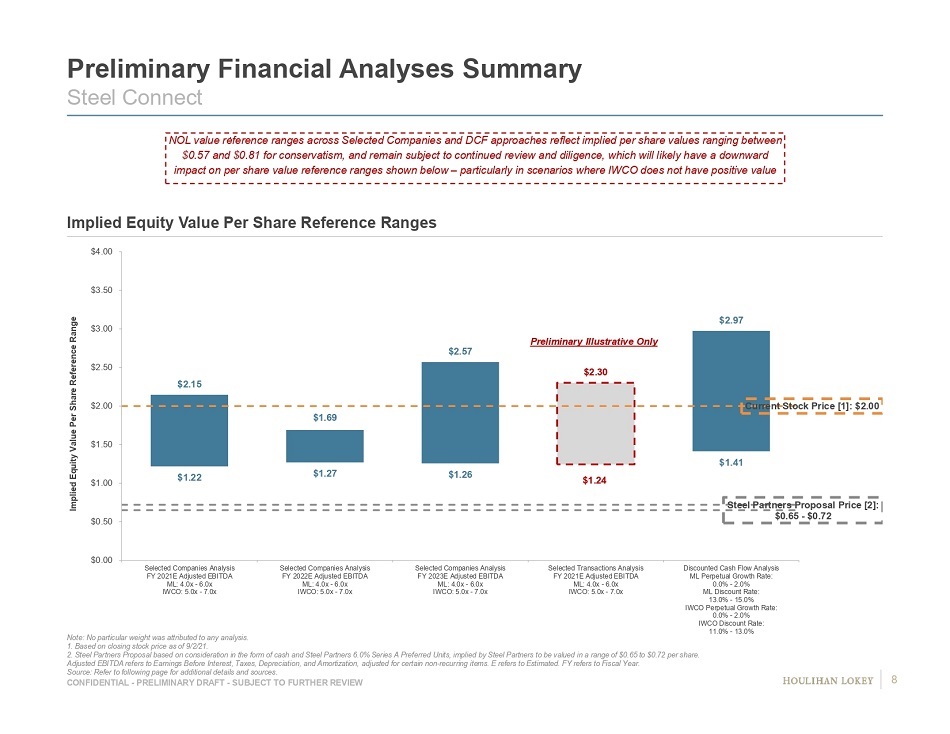
CONFIDENTIAL - PRELIMINARY DRAFT - SUBJECT TO FURTHER REVIEW $1.22 $1.27 $1.26 $1.24 $1.41 $2.15 $1.69 $2.57 $2.30 $2.97 Current Stock Price [1]: $2.00 Steel Partners Proposal Price [2]: $0.65 - $0.72 $0.00 $0.50 $1.00 $1.50 $2.00 $2.50 $3.00 $3.50 $4.00 Selected Companies Analysis FY 2021E Adjusted EBITDA ML: 4.0x - 6.0x IWCO: 5.0x - 7.0x Selected Companies Analysis FY 2022E Adjusted EBITDA ML: 4.0x - 6.0x IWCO: 5.0x - 7.0x Selected Companies Analysis FY 2023E Adjusted EBITDA ML: 4.0x - 6.0x IWCO: 5.0x - 7.0x Selected Transactions Analysis FY 2021E Adjusted EBITDA ML: 4.0x - 6.0x IWCO: 5.0x - 7.0x Discounted Cash Flow Analysis ML Perpetual Growth Rate: 0.0% - 2.0% ML Discount Rate: 13.0% - 15.0% IWCO Perpetual Growth Rate: 0.0% - 2.0% IWCO Discount Rate: 11.0% - 13.0% Implied Equity Value Per Share Reference Range Preliminary Financial Analyses Summary Steel Connect Implied Equity Value Per Share Reference Ranges Note: No particular weight was attributed to any analysis. 1. Based on closing stock price as of 9/2/21. 2. Steel Partners Proposal based on consideration in the form of cash and Steel Partners 6.0% Series A Preferred Units, impli ed by Steel Partners to be valued in a range of $0.65 to $0.72 per share. Adjusted EBITDA refers to Earnings Before Interest, Taxes, Depreciation, and Amortization, adjusted for certain non - recurring it ems. E refers to Estimated. FY refers to Fiscal Year. Source: Refer to following page for additional details and sources. Preliminary Illustrative Only NOL value reference ranges across Selected Companies and DCF approaches reflect implied per share values ranging between $0.57 and $0.81 for conservatism, and remain subject to continued review and diligence, which will likely have a downward impact on per share value reference ranges shown below – particularly in scenarios where IWCO does not have positive value 8
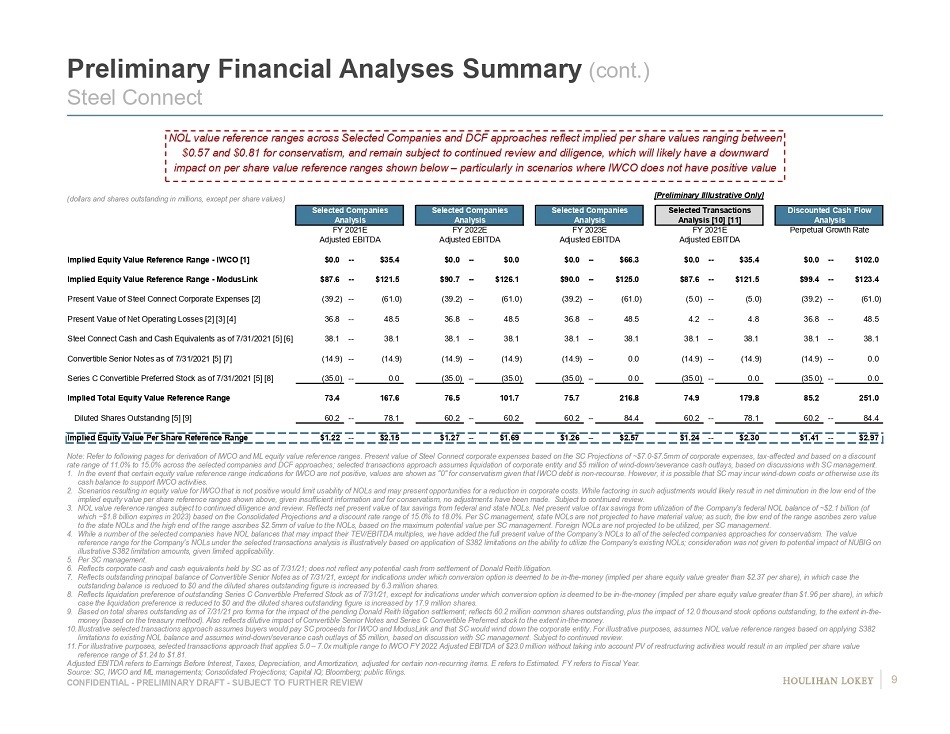
CONFIDENTIAL - PRELIMINARY DRAFT - SUBJECT TO FURTHER REVIEW [Preliminary Illlustrative Only] Selected Companies Selected Companies Selected Companies Selected Transactions Discounted Cash Flow Analysis Analysis Analysis Analysis [10] [11] Analysis FY 2021E FY 2022E FY 2023E FY 2021E Perpetual Growth Rate Adjusted EBITDA Adjusted EBITDA Adjusted EBITDA Adjusted EBITDA 0.0% -- 2.0% Implied Equity Value Reference Range - IWCO [1] $0.0 -- $35.4 $0.0 -- $0.0 $0.0 -- $66.3 $0.0 -- $35.4 $0.0 -- $102.0 Implied Equity Value Reference Range - ModusLink $87.6 -- $121.5 $90.7 -- $126.1 $90.0 -- $125.0 $87.6 -- $121.5 $99.4 -- $123.4 Present Value of Steel Connect Corporate Expenses [2] (39.2) -- (61.0) (39.2) -- (61.0) (39.2) -- (61.0) (5.0) -- (5.0) (39.2) -- (61.0) Present Value of Net Operating Losses [2] [3] [4] 36.8 -- 48.5 36.8 -- 48.5 36.8 -- 48.5 4.2 -- 4.8 36.8 -- 48.5 Steel Connect Cash and Cash Equivalents as of 7/31/2021 [5] [6] 38.1 -- 38.1 38.1 -- 38.1 38.1 -- 38.1 38.1 -- 38.1 38.1 -- 38.1 Convertible Senior Notes as of 7/31/2021 [5] [7] (14.9) -- (14.9) (14.9) -- (14.9) (14.9) -- 0.0 (14.9) -- (14.9) (14.9) -- 0.0 Series C Convertible Preferred Stock as of 7/31/2021 [5] [8] (35.0) -- 0.0 (35.0) -- (35.0) (35.0) -- 0.0 (35.0) -- 0.0 (35.0) -- 0.0 Implied Total Equity Value Reference Range 73.4 167.6 76.5 101.7 75.7 216.8 74.9 179.8 85.2 251.0 Diluted Shares Outstanding [5] [9] 60.2 -- 78.1 60.2 -- 60.2 60.2 -- 84.4 60.2 -- 78.1 60.2 -- 84.4 Implied Equity Value Per Share Reference Range $1.22 -- $2.15 $1.27 -- $1.69 $1.26 -- $2.57 $1.24 -- $2.30 $1.41 -- $2.97 Preliminary Financial Analyses Summary (cont.) Steel Connect (dollars and shares outstanding in millions, except per share values) Note: Refer to following pages for derivation of IWCO and ML equity value reference ranges. Present value of Steel Connect co rpo rate expenses based on the SC Projections of ~$7.0 - $7.5mm of corporate expenses, tax - affected and based on a discount rate range of 11.0% to 15.0% across the selected companies and DCF approaches; selected transactions approach assumes liquida tio n of corporate entity and $5 million of wind - down/severance cash outlays, based on discussions with SC management. 1. In the event that certain equity value reference range indications for IWCO are not positive, values are shown as "0" for con ser vatism given that IWCO debt is non - recourse. However, it is possible that SC may incur wind - down costs or otherwise use its cash balance to support IWCO activities. 2. Scenarios resulting in equity value for IWCO that is not positive would limit usability of NOLs and may present opportunities fo r a reduction in corporate costs. While factoring in such adjustments would likely result in net diminution in the low end of th e implied equity value per share reference ranges shown above, given insufficient information and for conservatism, no adjustme nts have been made. Subject to continued review. 3. NOL value reference ranges subject to continued diligence and review. Reflects net present value of tax savings from federal and state NOLs. Net present value of tax savings from utilization of the Company's federal NOL balance of ~$2.1 billion (of which ~$1.8 billion expires in 2023) based on the Consolidated Projections and a discount rate range of 15.0% to 18.0%. Per S C m anagement, state NOLs are not projected to have material value; as such, the low end of the range ascribes zero value to the state NOLs and the high end of the range ascribes $2.5mm of value to the NOLs, based on the maximum potential value pe r S C management. Foreign NOLs are not projected to be utilized, per SC management. 4. While a number of the selected companies have NOL balances that may impact their TEV/EBITDA multiples, we have added the full pr esent value of the Company's NOLs to all of the selected companies approaches for conservatism. The value reference range for the Company's NOLs under the selected transactions analysis is illustratively based on application of S38 2 l imitations on the ability to utilize the Company's existing NOLs; consideration was not given to potential impact of NUBIG on illustrative S382 limitation amounts, given limited applicability. 5. Per SC management. 6. Reflects corporate cash and cash equivalents held by SC as of 7/31/21; does not reflect any potential cash from settlement of Do nald Reith litigation. 7. Reflects outstanding principal balance of Convertible Senior Notes as of 7/31/21, except for indications under which conversi on option is deemed to be in - the - money (implied per share equity value greater than $2.37 per share), in which case the outstanding balance is reduced to $0 and the diluted shares outstanding figure is increased by 6.3 million shares. 8. Reflects liquidation preference of outstanding Series C Convertible Preferred Stock as of 7/31/21, except for indications und er which conversion option is deemed to be in - the - money (implied per share equity value greater than $1.96 per share), in which case the liquidation preference is reduced to $0 and the diluted shares outstanding figure is increased by 17.9 million share s. 9. Based on total shares outstanding as of 7/31/21 pro forma for the impact of the pending Donald Reith litigation settlement; r efl ects 60.2 million common shares outstanding, plus the impact of 12.0 thousand stock options outstanding, to the extent in - the - money (based on the treasury method). Also reflects dilutive impact of Convertible Senior Notes and Series C Convertible Pref err ed stock to the extent in - the - money. 10. Illustrative selected transactions approach assumes buyers would pay SC proceeds for IWCO and ModusLink and that SC would win d d own the corporate entity. For illustrative purposes, assumes NOL value reference ranges based on applying S382 limitations to existing NOL balance and assumes wind - down/severance cash outlays of $5 million, based on discussion with SC mana gement. Subject to continued review. 11. For illustrative purposes, selected transactions approach that applies 5.0 – 7.0x multiple range to IWCO FY 2022 Adjusted EBITDA of $23.0 million without taking into account PV of restructuring activities would result in an implied per share value reference range of $1.24 to $1.81. Adjusted EBITDA refers to Earnings Before Interest, Taxes, Depreciation, and Amortization, adjusted for certain non - recurring it ems. E refers to Estimated. FY refers to Fiscal Year. Source: SC, IWCO and ML managements; Consolidated Projections; Capital IQ; Bloomberg; public filings. NOL value reference ranges across Selected Companies and DCF approaches reflect implied per share values ranging between $0.57 and $0.81 for conservatism, and remain subject to continued review and diligence, which will likely have a downward impact on per share value reference ranges shown below – particularly in scenarios where IWCO does not have positive value 9
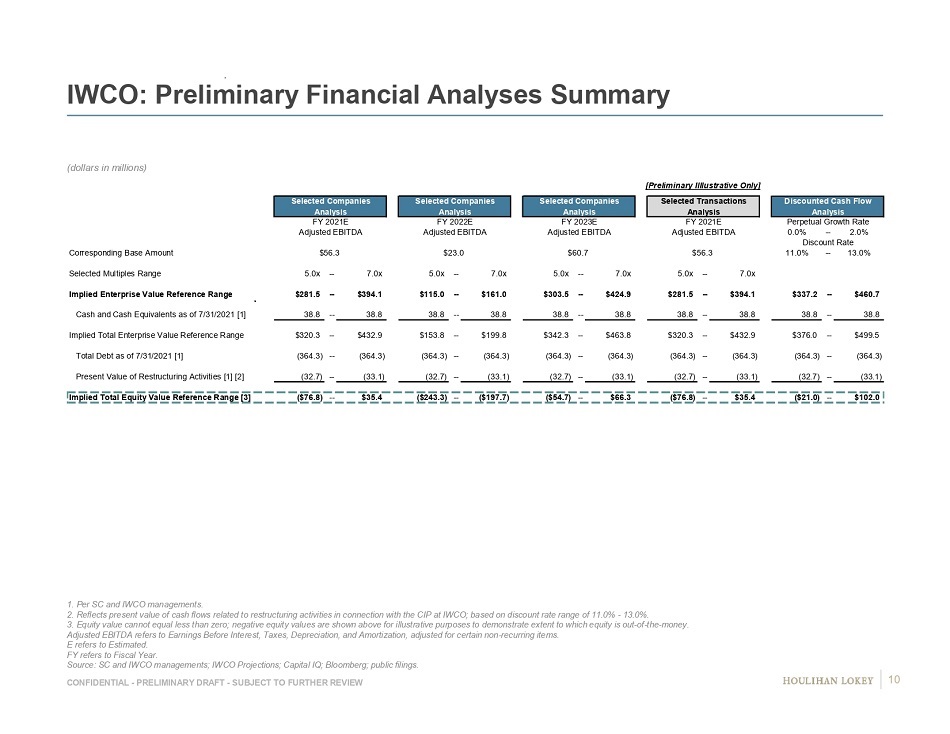
CONFIDENTIAL - PRELIMINARY DRAFT - SUBJECT TO FURTHER REVIEW IWCO: Preliminary Financial Analyses Summary (dollars in millions) 1. Per SC and IWCO managements. 2. Reflects present value of cash flows related to restructuring activities in connection with the CIP at IWCO; based on disc oun t rate range of 11.0% - 13.0%. 3. Equity value cannot equal less than zero; negative equity values are shown above for illustrative purposes to demonstrate ext ent to which equity is out - of - the - money. Adjusted EBITDA refers to Earnings Before Interest, Taxes, Depreciation, and Amortization, adjusted for certain non - recurring it ems. E refers to Estimated. FY refers to Fiscal Year. Source: SC and IWCO managements; IWCO Projections; Capital IQ; Bloomberg; public filings. [Preliminary Illlustrative Only] Selected Companies Selected Companies Selected Companies Selected Transactions Discounted Cash Flow Analysis Analysis Analysis Analysis Analysis FY 2021E FY 2022E FY 2023E FY 2021E Perpetual Growth Rate Adjusted EBITDA Adjusted EBITDA Adjusted EBITDA Adjusted EBITDA 0.0% -- 2.0% Discount Rate Corresponding Base Amount $56.3 $23.0 $60.7 $56.3 11.0% -- 13.0% Selected Multiples Range 5.0x -- 7.0x 5.0x -- 7.0x 5.0x -- 7.0x 5.0x -- 7.0x Implied Enterprise Value Reference Range $281.5 -- $394.1 $115.0 -- $161.0 $303.5 -- $424.9 $281.5 -- $394.1 $337.2 -- $460.7 Cash and Cash Equivalents as of 7/31/2021 [1] 38.8 -- 38.8 38.8 -- 38.8 38.8 -- 38.8 38.8 -- 38.8 38.8 -- 38.8 Implied Total Enterprise Value Reference Range $320.3 -- $432.9 $153.8 -- $199.8 $342.3 -- $463.8 $320.3 -- $432.9 $376.0 -- $499.5 Total Debt as of 7/31/2021 [1] (364.3) -- (364.3) (364.3) -- (364.3) (364.3) -- (364.3) (364.3) -- (364.3) (364.3) -- (364.3) Present Value of Restructuring Activities [1] [2] (32.7) -- (33.1) (32.7) -- (33.1) (32.7) -- (33.1) (32.7) -- (33.1) (32.7) -- (33.1) Implied Total Equity Value Reference Range [3] ($76.8) -- $35.4 ($243.3) -- ($197.7) ($54.7) -- $66.3 ($76.8) -- $35.4 ($21.0) -- $102.0 10
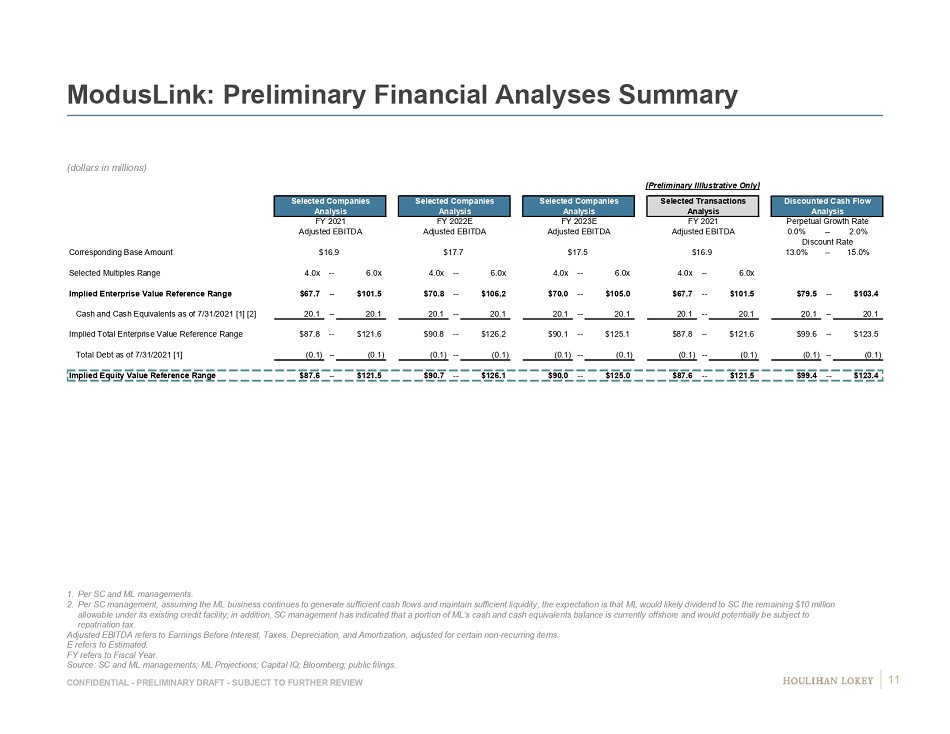
CONFIDENTIAL - PRELIMINARY DRAFT - SUBJECT TO FURTHER REVIEW ModusLink: Preliminary Financial Analyses Summary (dollars in millions) 1. Per SC and ML managements. 2. Per SC management, assuming the ML business continues to generate sufficient cash flows and maintain sufficient liquidity, th e e xpectation is that ML would likely dividend to SC the remaining $10 million allowable under its existing credit facility; in addition, SC management has indicated that a portion of ML’s cash and cash e qui valents balance is currently offshore and would potentially be subject to repatriation tax. Adjusted EBITDA refers to Earnings Before Interest, Taxes, Depreciation, and Amortization, adjusted for certain non - recurring it ems. E refers to Estimated. FY refers to Fiscal Year. Source: SC and ML managements; ML Projections; Capital IQ; Bloomberg; public filings. [Preliminary Illlustrative Only] Selected Companies Selected Companies Selected Companies Selected Transactions Discounted Cash Flow Analysis Analysis Analysis Analysis Analysis FY 2021 FY 2022E FY 2023E FY 2021 Perpetual Growth Rate Adjusted EBITDA Adjusted EBITDA Adjusted EBITDA Adjusted EBITDA 0.0% -- 2.0% Discount Rate Corresponding Base Amount $16.9 $17.7 $17.5 $16.9 13.0% -- 15.0% Selected Multiples Range 4.0x -- 6.0x 4.0x -- 6.0x 4.0x -- 6.0x 4.0x -- 6.0x Implied Enterprise Value Reference Range $67.7 -- $101.5 $70.8 -- $106.2 $70.0 -- $105.0 $67.7 -- $101.5 $79.5 -- $103.4 Cash and Cash Equivalents as of 7/31/2021 [1] [2] 20.1 -- 20.1 20.1 -- 20.1 20.1 -- 20.1 20.1 -- 20.1 20.1 -- 20.1 Implied Total Enterprise Value Reference Range $87.8 -- $121.6 $90.8 -- $126.2 $90.1 -- $125.1 $87.8 -- $121.6 $99.6 -- $123.5 Total Debt as of 7/31/2021 [1] (0.1) -- (0.1) (0.1) -- (0.1) (0.1) -- (0.1) (0.1) -- (0.1) (0.1) -- (0.1) Implied Equity Value Reference Range $87.6 -- $121.5 $90.7 -- $126.1 $90.0 -- $125.0 $87.6 -- $121.5 $99.4 -- $123.4 11
Page 1. Executive Summary 3 2. Preliminary Financial Analyses Summary 6 3. Preliminary Financial Observations and Analyses 12 IWCO 13 ModusLink 25 4. Preliminary Considerations Related to Proposal 35 5. Appendices 45 6. Disclaimer 52
Page 1. Executive Summary 3 2. Preliminary Financial Analyses Summary 6 3. Preliminary Financial Observations and Analyses 12 IWCO 13 ModusLink 25 4. Preliminary Considerations Related to Proposal 35 5. Appendices 45 6. Disclaimer 52
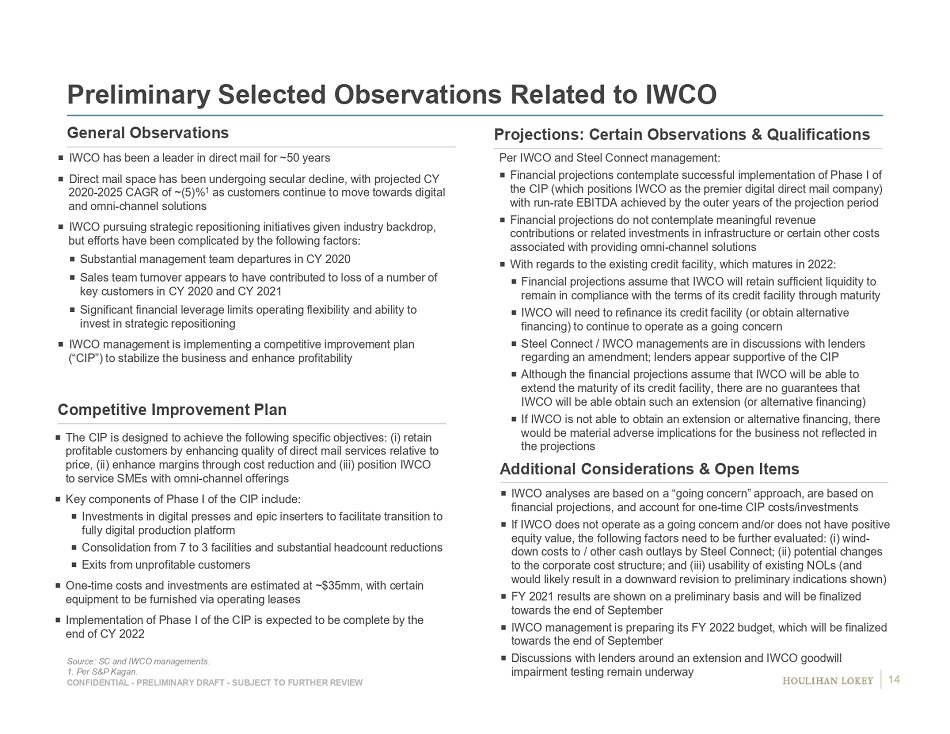
CONFIDENTIAL - PRELIMINARY DRAFT - SUBJECT TO FURTHER REVIEW IWCO has been a leader in direct mail for ~50 years Direct mail space has been undergoing secular decline, with projected CY 2020 - 2025 CAGR of ~(5)% 1 as customers continue to move towards digital and omni - channel solutions IWCO pursuing strategic repositioning initiatives given industry backdrop, but efforts have been complicated by the following factors: Substantial management team departures in CY 2020 Sales team turnover appears to have contributed to loss of a number of key customers in CY 2020 and CY 2021 Significant financial leverage limits operating flexibility and ability to invest in strategic repositioning IWCO management is implementing a competitive improvement plan (“CIP”) to stabilize the business and enhance profitability Per IWCO and Steel Connect management: Financial projections contemplate successful implementation of Phase I of the CIP (which positions IWCO as the premier digital direct mail company) with run - rate EBITDA achieved by the outer years of the projection period Financial projections do not contemplate meaningful revenue contributions or related investments in infrastructure or certain other costs associated with providing omni - channel solutions With regards to the existing credit facility, which matures in 2022: Financial projections assume that IWCO will retain sufficient liquidity to remain in compliance with the terms of its credit facility through maturity IWCO will need to refinance its credit facility (or obtain alternative financing) to continue to operate as a going concern Steel Connect / IWCO managements are in discussions with lenders regarding an amendment; lenders appear supportive of the CIP Although the financial projections assume that IWCO will be able to extend the maturity of its credit facility, there are no guarantees that IWCO will be able obtain such an extension (or alternative financing) If IWCO is not able to obtain an extension or alternative financing, there would be material adverse implications for the business not reflected in the projections Preliminary Selected Observations Related to IWCO General Observations Projections: Certain Observations & Qualifications Source: SC and IWCO managements. 1. Per S&P Kagan. The CIP is designed to achieve the following specific objectives: (i) retain profitable customers by enhancing quality of direct mail services relative to price, (ii) enhance margins through cost reduction and (iii) position IWCO to service SMEs with omni - channel offerings Key components of Phase I of the CIP include: Investments in digital presses and epic inserters to facilitate transition to fully digital production platform Consolidation from 7 to 3 facilities and substantial headcount reductions Exits from unprofitable customers One - time costs and investments are estimated at ~$35mm, with certain equipment to be furnished via operating leases Implementation of Phase I of the CIP is expected to be complete by the end of CY 2022 Competitive Improvement Plan Additional Considerations & Open Items IWCO analyses are based on a “going concern” approach, are based on financial projections, and account for one - time CIP costs/investments If IWCO does not operate as a going concern and/or does not have positive equity value, the following factors need to be further evaluated: (i) wind - down costs to / other cash outlays by Steel Connect; (ii) potential changes to the corporate cost structure; and (iii) usability of existing NOLs (and would likely result in a downward revision to preliminary indications shown) FY 2021 results are shown on a preliminary basis and will be finalized towards the end of September IWCO management is preparing its FY 2022 budget, which will be finalized towards the end of September Discussions with lenders around an extension and IWCO goodwill impairment testing remain underway 14
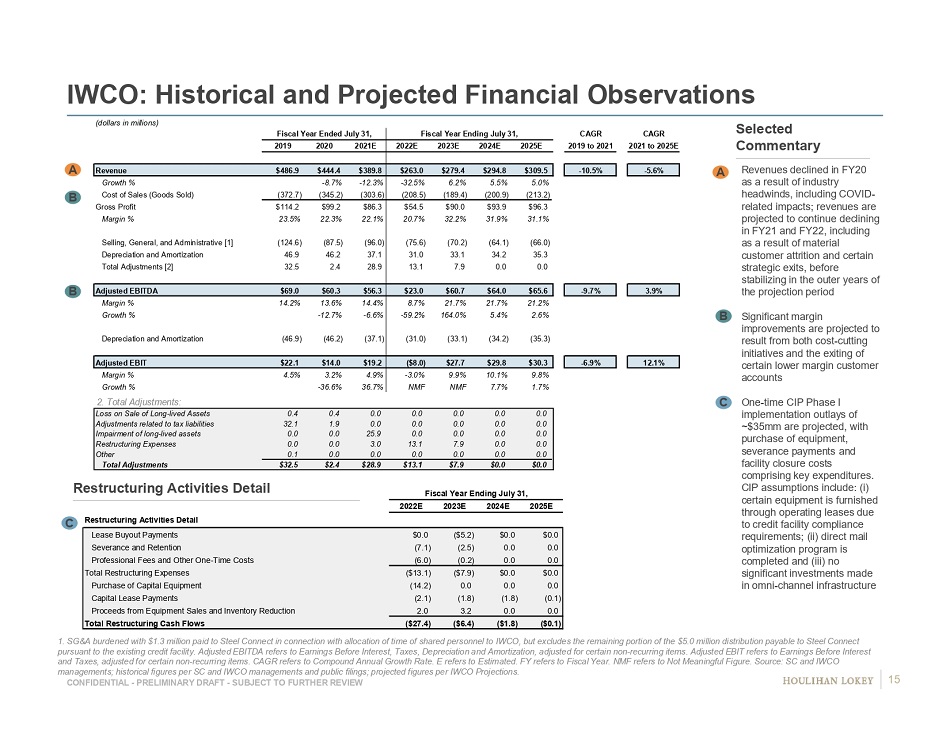
CONFIDENTIAL - PRELIMINARY DRAFT - SUBJECT TO FURTHER REVIEW A B B IWCO: Historical and Projected Financial Observations 1. SG&A burdened with $1.3 million paid to Steel Connect in connection with allocation of time of shared personnel to IWCO, b ut excludes the remaining portion of the $5.0 million distribution payable to Steel Connect pursuant to the existing credit facility. Adjusted EBITDA refers to Earnings Before Interest, Taxes, Depreciation and Amortiz ati on, adjusted for certain non - recurring items. Adjusted EBIT refers to Earnings Before Interest and Taxes, adjusted for certain non - recurring items. CAGR refers to Compound Annual Growth Rate. E refers to Estimated. FY refers to Fiscal Year. NMF refers to Not Meaningful Figure. Source: SC and IWCO managements; historical figures per SC and IWCO managements and public filings; projected figures per IWCO Projections. Revenues declined in FY20 as a result of industry headwinds, including COVID - related impacts; revenues are projected to continue declining in FY21 and FY22, including as a result of material customer attrition and certain strategic exits, before stabilizing in the outer years of the projection period Significant margin improvements are projected to result from both cost - cutting initiatives and the exiting of certain lower margin customer accounts One - time CIP Phase I implementation outlays of ~$35mm are projected, with purchase of equipment, severance payments and facility closure costs comprising key expenditures. CIP assumptions include: (i) certain equipment is furnished through operating leases due to credit facility compliance requirements; (ii) direct mail optimization program is completed and (iii) no significant investments made in omni - channel infrastructure C B A Selected Commentary C Restructuring Activities Detail Fiscal Year Ending July 31, 2022E 2023E 2024E 2025E Restructuring Activities Detail Lease Buyout Payments $0.0 ($5.2) $0.0 $0.0 Severance and Retention (7.1) (2.5) 0.0 0.0 Professional Fees and Other One-Time Costs (6.0) (0.2) 0.0 0.0 Total Restructuring Expenses ($13.1) ($7.9) $0.0 $0.0 Purchase of Capital Equipment (14.2) 0.0 0.0 0.0 Capital Lease Payments (2.1) (1.8) (1.8) (0.1) Proceeds from Equipment Sales and Inventory Reduction 2.0 3.2 0.0 0.0 Total Restructuring Cash Flows ($27.4) ($6.4) ($1.8) ($0.1) 2. Total Adjustments: (dollars in millions) Fiscal Year Ended July 31, Fiscal Year Ending July 31, CAGR CAGR 2019 2020 2021E 2022E 2023E 2024E 2025E 2019 to 2021 2021 to 2025E Revenue $486.9 $444.4 $389.8 $263.0 $279.4 $294.8 $309.5 -10.5% -5.6% Growth % -8.7% -12.3% -32.5% 6.2% 5.5% 5.0% Cost of Sales (Goods Sold) (372.7) (345.2) (303.6) (208.5) (189.4) (200.9) (213.2) Gross Profit $114.2 $99.2 $86.3 $54.5 $90.0 $93.9 $96.3 Margin % 23.5% 22.3% 22.1% 20.7% 32.2% 31.9% 31.1% Selling, General, and Administrative [1] (124.6) (87.5) (96.0) (75.6) (70.2) (64.1) (66.0) Depreciation and Amortization 46.9 46.2 37.1 31.0 33.1 34.2 35.3 Total Adjustments [2] 32.5 2.4 28.9 13.1 7.9 0.0 0.0 Adjusted EBITDA $69.0 $60.3 $56.3 $23.0 $60.7 $64.0 $65.6 -9.7% 3.9% Margin % 14.2% 13.6% 14.4% 8.7% 21.7% 21.7% 21.2% Growth % -12.7% -6.6% -59.2% 164.0% 5.4% 2.6% Depreciation and Amortization (46.9) (46.2) (37.1) (31.0) (33.1) (34.2) (35.3) Adjusted EBIT $22.1 $14.0 $19.2 ($8.0) $27.7 $29.8 $30.3 -6.9% 12.1% Margin % 4.5% 3.2% 4.9% -3.0% 9.9% 10.1% 9.8% Growth % -36.6% 36.7% NMF NMF 7.7% 1.7% Loss on Sale of Long-lived Assets 0.4 0.4 0.0 0.0 0.0 0.0 0.0 Adjustments related to tax liabilities 32.1 1.9 0.0 0.0 0.0 0.0 0.0 Impairment of long-lived assets 0.0 0.0 25.9 0.0 0.0 0.0 0.0 Restructuring Expenses 0.0 0.0 3.0 13.1 7.9 0.0 0.0 Other 0.1 0.0 0.0 0.0 0.0 0.0 0.0 Total Adjustments $32.5 $2.4 $28.9 $13.1 $7.9 $0.0 $0.0 15
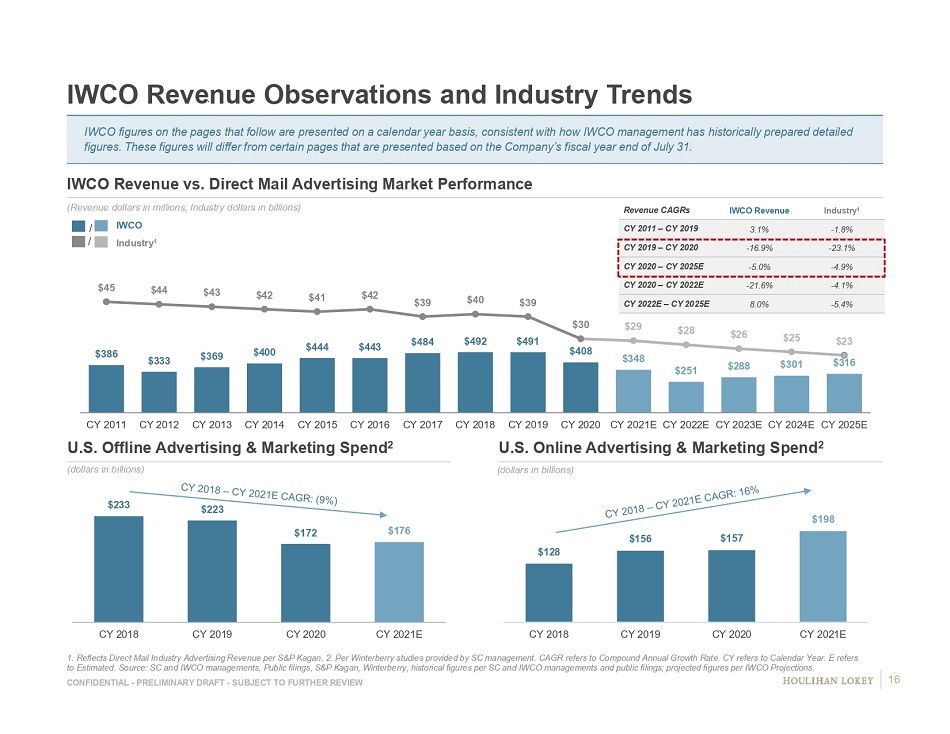
CONFIDENTIAL - PRELIMINARY DRAFT - SUBJECT TO FURTHER REVIEW $128 $156 $157 $198 CY 2018 CY 2019 CY 2020 CY 2021E $233 $223 $172 $176 CY 2018 CY 2019 CY 2020 CY 2021E IWCO Revenue Observations and Industry Trends 1. Reflects Direct Mail Industry Advertising Revenue per S&P Kagan. 2. Per Winterberry studies provided by SC management. CAG R r efers to Compound Annual Growth Rate. CY refers to Calendar Year. E refers to Estimated. Source: SC and IWCO managements, Public filings, S&P Kagan, Winterberry, historical figures per SC and IWCO man age ments and public filings; projected figures per IWCO Projections. IWCO Revenue vs. Direct Mail Advertising Market Performance (Revenue dollars in millions; Industry dollars in billions) (dollars in billions) IWCO Industry 1 / / Revenue CAGRs IWCO Revenue Industry 1 CY 2011 – CY 2019 3.1% - 1.8% CY 2019 – CY 2020 - 16.9% - 23.1% CY 2020 – CY 2025E - 5.0% - 4.9% CY 2020 – CY 2022E - 21.6% - 4.1% CY 2022E – CY 2025E 8.0% - 5.4% U.S. Offline Advertising & Marketing Spend 2 U.S. Online Advertising & Marketing Spend 2 (dollars in billions) IWCO figures on the pages that follow are presented on a calendar year basis, consistent with how IWCO management has histori cal ly prepared detailed figures. These figures will differ from certain pages that are presented based on the Company’s fiscal year end of July 31. $386 $333 $369 $400 $444 $443 $484 $492 $491 $408 $348 $251 $288 $301 $316 $45 $44 $43 $42 $41 $42 $39 $40 $39 $30 $29 $28 $26 $25 $23 CY 2011 CY 2012 CY 2013 CY 2014 CY 2015 CY 2016 CY 2017 CY 2018 CY 2019 CY 2020 CY 2021E CY 2022E CY 2023E CY 2024E CY 2025E 16
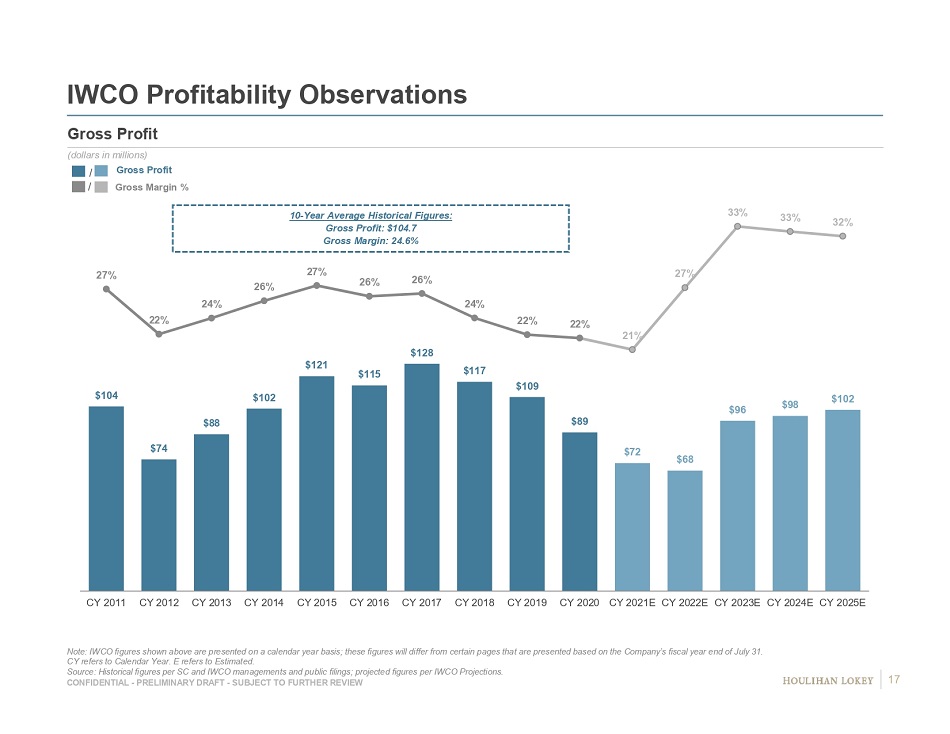
CONFIDENTIAL - PRELIMINARY DRAFT - SUBJECT TO FURTHER REVIEW Gross Profit (dollars in millions) IWCO Profitability Observations Note: IWCO figures shown above are presented on a calendar year basis; these figures will differ from certain pages that are pre sented based on the Company’s fiscal year end of July 31. CY refers to Calendar Year. E refers to Estimated. Source: Historical figures per SC and IWCO managements and public filings; projected figures per IWCO Projections. Gross Profit Gross Margin % / / 10 - Year Average Historical Figures: Gross Profit: $104.7 Gross Margin: 24.6% $104 $74 $88 $102 $121 $115 $128 $117 $109 $89 $72 $68 $96 $98 $102 27% 22% 24% 26% 27% 26% 26% 24% 22% 22% 21% 27% 33% 33% 32% CY 2011 CY 2012 CY 2013 CY 2014 CY 2015 CY 2016 CY 2017 CY 2018 CY 2019 CY 2020 CY 2021E CY 2022E CY 2023E CY 2024E CY 2025E 17
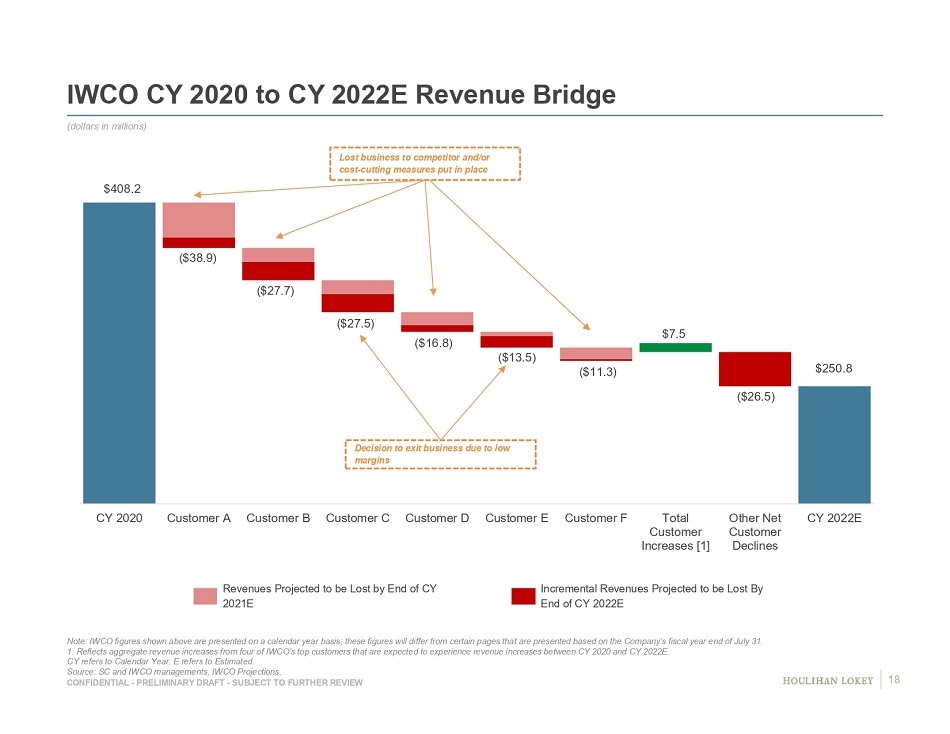
CONFIDENTIAL - PRELIMINARY DRAFT - SUBJECT TO FURTHER REVIEW $408.2 $250.8 CY 2020 Customer A Customer B Customer C Customer D Customer E Customer F Total Customer Increases [1] Other Net Customer Declines CY 2022E IWCO CY 2020 to CY 2022E Revenue Bridge Note: IWCO figures shown above are presented on a calendar year basis; these figures will differ from certain pages that are pre sented based on the Company’s fiscal year end of July 31. 1. Reflects aggregate revenue increases from four of IWCO’s top customers that are expected to experience revenue increases b etw een CY 2020 and CY 2022E. CY refers to Calendar Year. E refers to Estimated. Source: SC and IWCO managements, IWCO Projections. (dollars in millions) ($38.9) ($27.7) ($27.5) ($16.8) ($13.5) ($11.3) $7.5 ($26.5) Revenues Projected to be Lost by End of CY 2021E Incremental Revenues Projected to be Lost By End of CY 2022E Lost business to competitor and/or cost - cutting measures put in place Decision to exit business due to low margins 18
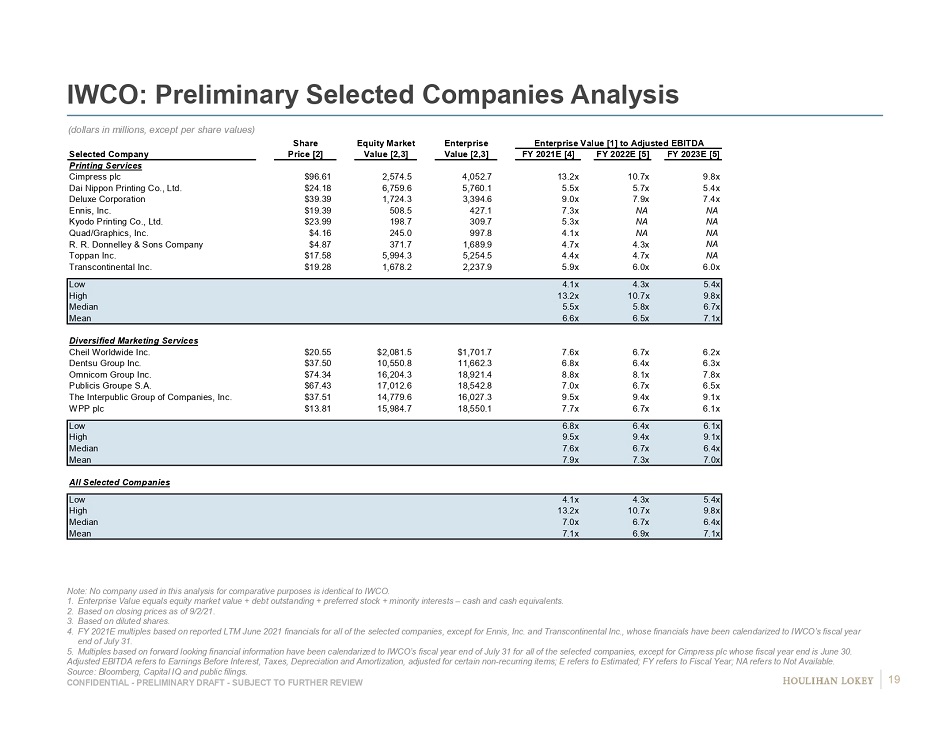
CONFIDENTIAL - PRELIMINARY DRAFT - SUBJECT TO FURTHER REVIEW IWCO: Preliminary Selected Companies Analysis (dollars in millions, except per share values) Note: No company used in this analysis for comparative purposes is identical to IWCO. 1. Enterprise Value equals equity market value + debt outstanding + preferred stock + minority interests – cash and cash equivalent s. 2. Based on closing prices as of 9/2/21. 3. Based on diluted shares. 4. FY 2021E multiples based on reported LTM June 2021 financials for all of the selected companies, except for Ennis, Inc. and T ran scontinental Inc., whose financials have been calendarized to IWCO’s fiscal year end of July 31. 5. Multiples based on forward looking financial information have been calendarized to IWCO’s fiscal year end of July 31 for all of the selected companies, except for Cimpress plc whose fiscal year end is June 30. Adjusted EBITDA refers to Earnings Before Interest, Taxes, Depreciation and Amortization, adjusted for certain non - recurring ite ms; E refers to Estimated; FY refers to Fiscal Year; NA refers to Not Available. Source: Bloomberg, Capital IQ and public filings. Share Equity Market Enterprise Enterprise Value [1] to Adjusted EBITDA Selected Company Price [2] Value [2,3] Value [2,3] FY 2021E [4] FY 2022E [5] FY 2023E [5] Printing Services Cimpress plc $96.61 2,574.5 4,052.7 13.2x 10.7x 9.8x Dai Nippon Printing Co., Ltd. $24.18 6,759.6 5,760.1 5.5x 5.7x 5.4x Deluxe Corporation $39.39 1,724.3 3,394.6 9.0x 7.9x 7.4x Ennis, Inc. $19.39 508.5 427.1 7.3x NA NA Kyodo Printing Co., Ltd. $23.99 198.7 309.7 5.3x NA NA Quad/Graphics, Inc. $4.16 245.0 997.8 4.1x NA NA R. R. Donnelley & Sons Company $4.87 371.7 1,689.9 4.7x 4.3x NA Toppan Inc. $17.58 5,994.3 5,254.5 4.4x 4.7x NA Transcontinental Inc. $19.28 1,678.2 2,237.9 5.9x 6.0x 6.0x Low 4.1x 4.3x 5.4x High 13.2x 10.7x 9.8x Median 5.5x 5.8x 6.7x Mean 6.6x 6.5x 7.1x Diversified Marketing Services Cheil Worldwide Inc. $20.55 $2,081.5 $1,701.7 7.6x 6.7x 6.2x Dentsu Group Inc. $37.50 10,550.8 11,662.3 6.8x 6.4x 6.3x Omnicom Group Inc. $74.34 16,204.3 18,921.4 8.8x 8.1x 7.8x Publicis Groupe S.A. $67.43 17,012.6 18,542.8 7.0x 6.7x 6.5x The Interpublic Group of Companies, Inc. $37.51 14,779.6 16,027.3 9.5x 9.4x 9.1x WPP plc $13.81 15,984.7 18,550.1 7.7x 6.7x 6.1x Low 6.8x 6.4x 6.1x High 9.5x 9.4x 9.1x Median 7.6x 6.7x 6.4x Mean 7.9x 7.3x 7.0x All Selected Companies Low 4.1x 4.3x 5.4x High 13.2x 10.7x 9.8x Median 7.0x 6.7x 6.4x Mean 7.1x 6.9x 7.1x 19
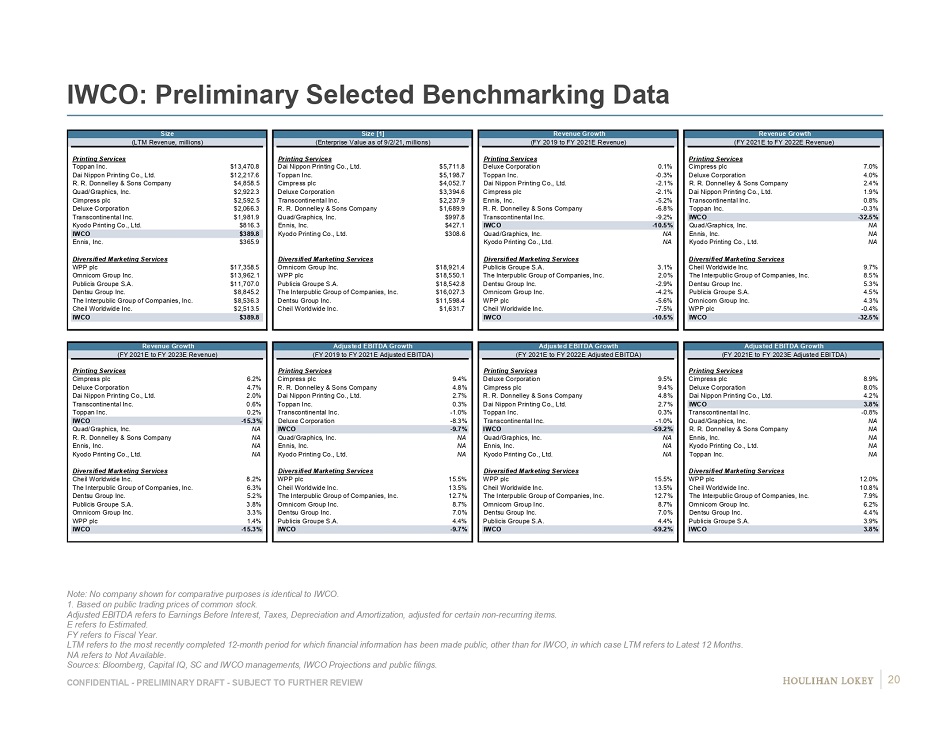
CONFIDENTIAL - PRELIMINARY DRAFT - SUBJECT TO FURTHER REVIEW IWCO: Preliminary Selected Benchmarking Data Note: No company shown for comparative purposes is identical to IWCO. 1. Based on public trading prices of common stock. Adjusted EBITDA refers to Earnings Before Interest, Taxes, Depreciation and Amortization, adjusted for certain non - recurring ite ms. E refers to Estimated. FY refers to Fiscal Year. LTM refers to the most recently completed 12 - month period for which financial information has been made public, other than for I WCO, in which case LTM refers to Latest 12 Months. NA refers to Not Available. Sources: Bloomberg, Capital IQ, SC and IWCO managements, IWCO Projections and public filings. Size Size [1] Revenue Growth Revenue Growth (LTM Revenue, millions) (Enterprise Value as of 9/2/21, millions) (FY 2019 to FY 2021E Revenue) (FY 2021E to FY 2022E Revenue) Name Value Name Value Name Value Name Value Printing Services Printing Services Printing Services Printing Services Toppan Inc. $13,470.8 Dai Nippon Printing Co., Ltd. $5,711.8 Deluxe Corporation 0.1% Cimpress plc 7.0% Dai Nippon Printing Co., Ltd. $12,217.6 Toppan Inc. $5,198.7 Toppan Inc. -0.3% Deluxe Corporation 4.0% R. R. Donnelley & Sons Company $4,858.5 Cimpress plc $4,052.7 Dai Nippon Printing Co., Ltd. -2.1% R. R. Donnelley & Sons Company 2.4% Quad/Graphics, Inc. $2,922.3 Deluxe Corporation $3,394.6 Cimpress plc -2.1% Dai Nippon Printing Co., Ltd. 1.9% Cimpress plc $2,592.5 Transcontinental Inc. $2,237.9 Ennis, Inc. -5.2% Transcontinental Inc. 0.8% Deluxe Corporation $2,066.3 R. R. Donnelley & Sons Company $1,689.9 R. R. Donnelley & Sons Company -6.8% Toppan Inc. -0.3% Transcontinental Inc. $1,981.9 Quad/Graphics, Inc. $997.8 Transcontinental Inc. -9.2% IWCO -32.5% Kyodo Printing Co., Ltd. $816.3 Ennis, Inc. $427.1 IWCO -10.5% Quad/Graphics, Inc. NA IWCO $389.8 Kyodo Printing Co., Ltd. $308.6 Quad/Graphics, Inc. NA Ennis, Inc. NA Ennis, Inc. $365.9 Kyodo Printing Co., Ltd. NA Kyodo Printing Co., Ltd. NA Diversified Marketing Services Diversified Marketing Services Diversified Marketing Services Diversified Marketing Services WPP plc $17,358.5 Omnicom Group Inc. $18,921.4 Publicis Groupe S.A. 3.1% Cheil Worldwide Inc. 9.7% Omnicom Group Inc. $13,962.1 WPP plc $18,550.1 The Interpublic Group of Companies, Inc. 2.0% The Interpublic Group of Companies, Inc. 8.5% Publicis Groupe S.A. $11,707.0 Publicis Groupe S.A. $18,542.8 Dentsu Group Inc. -2.9% Dentsu Group Inc. 5.3% Dentsu Group Inc. $8,845.2 The Interpublic Group of Companies, Inc. $16,027.3 Omnicom Group Inc. -4.2% Publicis Groupe S.A. 4.5% The Interpublic Group of Companies, Inc. $8,536.3 Dentsu Group Inc. $11,598.4 WPP plc -5.6% Omnicom Group Inc. 4.3% Cheil Worldwide Inc. $2,513.5 Cheil Worldwide Inc. $1,631.7 Cheil Worldwide Inc. -7.5% WPP plc -0.4% IWCO $389.8 IWCO -10.5% IWCO -32.5% Revenue Growth Adjusted EBITDA Growth Adjusted EBITDA Growth Adjusted EBITDA Growth (FY 2021E to FY 2023E Revenue) (FY 2019 to FY 2021E Adjusted EBITDA) (FY 2021E to FY 2022E Adjusted EBITDA) (FY 2021E to FY 2023E Adjusted EBITDA) Name Value Name Value Name Value Name Value Printing Services Printing Services Printing Services Printing Services Cimpress plc 6.2% Cimpress plc 9.4% Deluxe Corporation 9.5% Cimpress plc 8.9% Deluxe Corporation 4.7% R. R. Donnelley & Sons Company 4.8% Cimpress plc 9.4% Deluxe Corporation 8.0% Dai Nippon Printing Co., Ltd. 2.0% Dai Nippon Printing Co., Ltd. 2.7% R. R. Donnelley & Sons Company 4.8% Dai Nippon Printing Co., Ltd. 4.2% Transcontinental Inc. 0.6% Toppan Inc. 0.3% Dai Nippon Printing Co., Ltd. 2.7% IWCO 3.8% Toppan Inc. 0.2% Transcontinental Inc. -1.0% Toppan Inc. 0.3% Transcontinental Inc. -0.8% IWCO -15.3% Deluxe Corporation -8.3% Transcontinental Inc. -1.0% Quad/Graphics, Inc. NA Quad/Graphics, Inc. NA IWCO -9.7% IWCO -59.2% R. R. Donnelley & Sons Company NA R. R. Donnelley & Sons Company NA Quad/Graphics, Inc. NA Quad/Graphics, Inc. NA Ennis, Inc. NA Ennis, Inc. NA Ennis, Inc. NA Ennis, Inc. NA Kyodo Printing Co., Ltd. NA Kyodo Printing Co., Ltd. NA Kyodo Printing Co., Ltd. NA Kyodo Printing Co., Ltd. NA Toppan Inc. NA Diversified Marketing Services Diversified Marketing Services Diversified Marketing Services Diversified Marketing Services Cheil Worldwide Inc. 8.2% WPP plc 15.5% WPP plc 15.5% WPP plc 12.0% The Interpublic Group of Companies, Inc. 6.3% Cheil Worldwide Inc. 13.5% Cheil Worldwide Inc. 13.5% Cheil Worldwide Inc. 10.8% Dentsu Group Inc. 5.2% The Interpublic Group of Companies, Inc. 12.7% The Interpublic Group of Companies, Inc. 12.7% The Interpublic Group of Companies, Inc. 7.9% Publicis Groupe S.A. 3.8% Omnicom Group Inc. 8.7% Omnicom Group Inc. 8.7% Omnicom Group Inc. 6.2% Omnicom Group Inc. 3.3% Dentsu Group Inc. 7.0% Dentsu Group Inc. 7.0% Dentsu Group Inc. 4.4% WPP plc 1.4% Publicis Groupe S.A. 4.4% Publicis Groupe S.A. 4.4% Publicis Groupe S.A. 3.9% IWCO -15.3% IWCO -9.7% IWCO -59.2% IWCO 3.8% 20
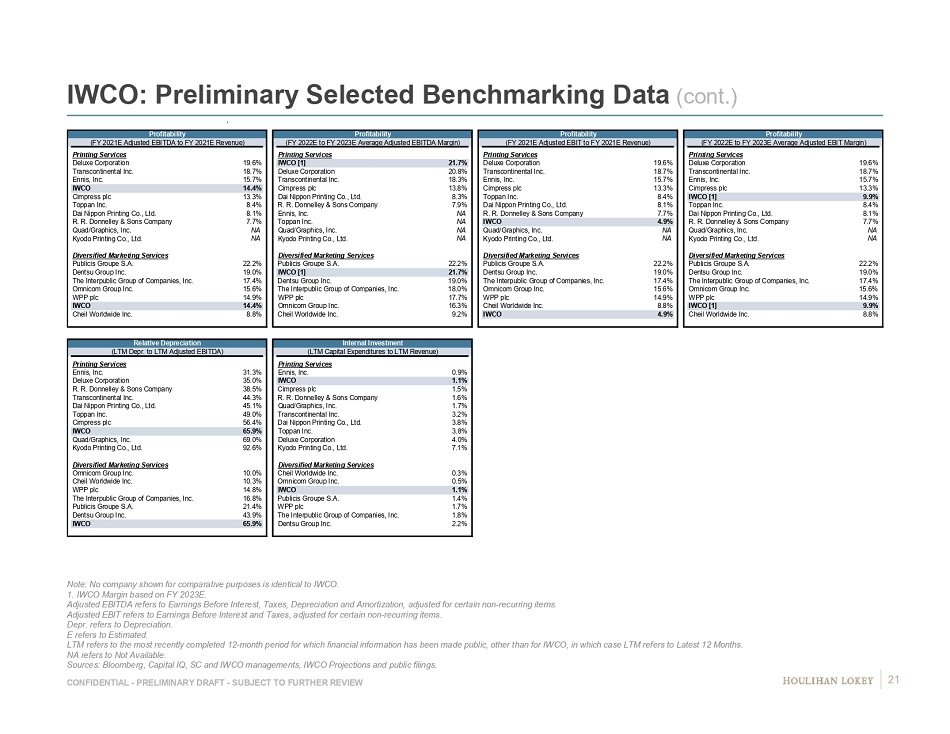
CONFIDENTIAL - PRELIMINARY DRAFT - SUBJECT TO FURTHER REVIEW IWCO: Preliminary Selected Benchmarking Data (cont.) Note: No company shown for comparative purposes is identical to IWCO. 1. IWCO Margin based on FY 2023E. Adjusted EBITDA refers to Earnings Before Interest, Taxes, Depreciation and Amortization, adjusted for certain non - recurring ite ms. Adjusted EBIT refers to Earnings Before Interest and Taxes, adjusted for certain non - recurring items. Depr. refers to Depreciation. E refers to Estimated. LTM refers to the most recently completed 12 - month period for which financial information has been made public, other than for I WCO, in which case LTM refers to Latest 12 Months. NA refers to Not Available. Sources: Bloomberg, Capital IQ, SC and IWCO managements, IWCO Projections and public filings. Profitability Profitability Profitability Profitability (FY 2021E Adjusted EBITDA to FY 2021E Revenue) (FY 2022E to FY 2023E Average Adjusted EBITDA Margin) (FY 2021E Adjusted EBIT to FY 2021E Revenue) (FY 2022E to FY 2023E Average Adjusted EBIT Margin) Name Value Name Value Name Value Name Value Printing Services Printing Services Printing Services Printing Services Deluxe Corporation 19.6% IWCO [1] 21.7% Deluxe Corporation 19.6% Deluxe Corporation 19.6% Transcontinental Inc. 18.7% Deluxe Corporation 20.8% Transcontinental Inc. 18.7% Transcontinental Inc. 18.7% Ennis, Inc. 15.7% Transcontinental Inc. 18.3% Ennis, Inc. 15.7% Ennis, Inc. 15.7% IWCO 14.4% Cimpress plc 13.8% Cimpress plc 13.3% Cimpress plc 13.3% Cimpress plc 13.3% Dai Nippon Printing Co., Ltd. 8.3% Toppan Inc. 8.4% IWCO [1] 9.9% Toppan Inc. 8.4% R. R. Donnelley & Sons Company 7.9% Dai Nippon Printing Co., Ltd. 8.1% Toppan Inc. 8.4% Dai Nippon Printing Co., Ltd. 8.1% Ennis, Inc. NA R. R. Donnelley & Sons Company 7.7% Dai Nippon Printing Co., Ltd. 8.1% R. R. Donnelley & Sons Company 7.7% Toppan Inc. NA IWCO 4.9% R. R. Donnelley & Sons Company 7.7% Quad/Graphics, Inc. NA Quad/Graphics, Inc. NA Quad/Graphics, Inc. NA Quad/Graphics, Inc. NA Kyodo Printing Co., Ltd. NA Kyodo Printing Co., Ltd. NA Kyodo Printing Co., Ltd. NA Kyodo Printing Co., Ltd. NA Diversified Marketing Services Diversified Marketing Services Diversified Marketing Services Diversified Marketing Services Publicis Groupe S.A. 22.2% Publicis Groupe S.A. 22.2% Publicis Groupe S.A. 22.2% Publicis Groupe S.A. 22.2% Dentsu Group Inc. 19.0% IWCO [1] 21.7% Dentsu Group Inc. 19.0% Dentsu Group Inc. 19.0% The Interpublic Group of Companies, Inc. 17.4% Dentsu Group Inc. 19.0% The Interpublic Group of Companies, Inc. 17.4% The Interpublic Group of Companies, Inc. 17.4% Omnicom Group Inc. 15.6% The Interpublic Group of Companies, Inc. 18.0% Omnicom Group Inc. 15.6% Omnicom Group Inc. 15.6% WPP plc 14.9% WPP plc 17.7% WPP plc 14.9% WPP plc 14.9% IWCO 14.4% Omnicom Group Inc. 16.3% Cheil Worldwide Inc. 8.8% IWCO [1] 9.9% Cheil Worldwide Inc. 8.8% Cheil Worldwide Inc. 9.2% IWCO 4.9% Cheil Worldwide Inc. 8.8% Relative Depreciation Internal Investment (LTM Depr. to LTM Adjusted EBITDA) (LTM Capital Expenditures to LTM Revenue) Name Value Name Value Printing Services Printing Services Ennis, Inc. 31.3% Ennis, Inc. 0.9% Deluxe Corporation 35.0% IWCO 1.1% R. R. Donnelley & Sons Company 38.5% Cimpress plc 1.5% Transcontinental Inc. 44.3% R. R. Donnelley & Sons Company 1.6% Dai Nippon Printing Co., Ltd. 45.1% Quad/Graphics, Inc. 1.7% Toppan Inc. 49.0% Transcontinental Inc. 3.2% Cimpress plc 56.4% Dai Nippon Printing Co., Ltd. 3.8% IWCO 65.9% Toppan Inc. 3.8% Quad/Graphics, Inc. 69.0% Deluxe Corporation 4.0% Kyodo Printing Co., Ltd. 92.6% Kyodo Printing Co., Ltd. 7.1% Diversified Marketing Services Diversified Marketing Services Omnicom Group Inc. 10.0% Cheil Worldwide Inc. 0.3% Cheil Worldwide Inc. 10.3% Omnicom Group Inc. 0.5% WPP plc 14.8% IWCO 1.1% The Interpublic Group of Companies, Inc. 16.8% Publicis Groupe S.A. 1.4% Publicis Groupe S.A. 21.4% WPP plc 1.7% Dentsu Group Inc. 43.9% The Interpublic Group of Companies, Inc. 1.8% IWCO 65.9% Dentsu Group Inc. 2.2% 21
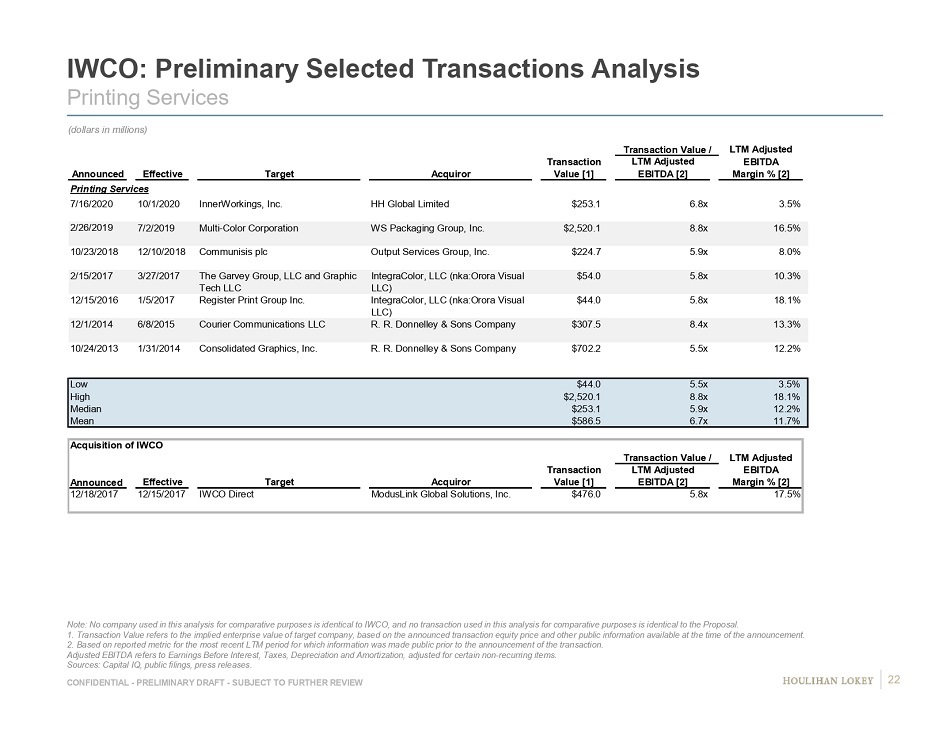
CONFIDENTIAL - PRELIMINARY DRAFT - SUBJECT TO FURTHER REVIEW IWCO: Preliminary Selected Transactions Analysis Printing Services Note: No company used in this analysis for comparative purposes is identical to IWCO, and no transaction used in this analysi s f or comparative purposes is identical to the Proposal. 1. Transaction Value refers to the implied enterprise value of target company, based on the announced transaction equity pric e a nd other public information available at the time of the announcement. 2. Based on reported metric for the most recent LTM period for which information was made public prior to the announcement of th e transaction. Adjusted EBITDA refers to Earnings Before Interest, Taxes, Depreciation and Amortization, adjusted for certain non - recurring ite ms. Sources: Capital IQ, public filings, press releases. Transaction Value / LTM Adjusted Transaction LTM Adjusted EBITDA Announced Effective Target Acquiror Value [1] EBITDA [2] Margin % [2] Printing Services 10/1/2020 InnerWorkings, Inc. HH Global Limited $253.1 6.8x 3.5% 7/2/2019 Multi-Color Corporation WS Packaging Group, Inc. $2,520.1 8.8x 16.5% 12/10/2018 Communisis plc Output Services Group, Inc. $224.7 5.9x 8.0% 3/27/2017 The Garvey Group, LLC and Graphic Tech LLC IntegraColor, LLC (nka:Orora Visual LLC) $54.0 5.8x 10.3% 1/5/2017 Register Print Group Inc. IntegraColor, LLC (nka:Orora Visual LLC) $44.0 5.8x 18.1% 6/8/2015 Courier Communications LLC R. R. Donnelley & Sons Company $307.5 8.4x 13.3% 1/31/2014 Consolidated Graphics, Inc. R. R. Donnelley & Sons Company $702.2 5.5x 12.2% Low $44.0 5.5x 3.5% High $2,520.1 8.8x 18.1% Median $253.1 5.9x 12.2% Mean $586.5 6.7x 11.7% Acquisition of IWCO Transaction Value / LTM Adjusted Transaction LTM Adjusted EBITDA Effective Target Acquiror Value [1] EBITDA [2] Margin % [2] 12/15/2017 IWCO Direct ModusLink Global Solutions, Inc. $476.0 5.8x 17.5% 7/16/2020 2/26/2019 2/15/2017 12/15/2016 10/23/2018 12/1/2014 10/24/2013 12/18/2017 Announced (dollars in millions) 22

CONFIDENTIAL - PRELIMINARY DRAFT - SUBJECT TO FURTHER REVIEW IWCO: Preliminary Selected Transactions Analysis (cont.) Diversified Marketing Services Note: No company used in this analysis for comparative purposes is identical to IWCO, and no transaction used in this analysi s f or comparative purposes is identical to the Proposal. 1. Transaction Value refers to the implied enterprise value of target company, based on the announced transaction equity pric e a nd other public information available at the time of the announcement. 2. Based on reported metric for the most recent LTM period prior to the announcement of the transaction. Adjusted EBITDA refers to Earnings Before Interest, Taxes, Depreciation and Amortization, adjusted for certain non - recurring ite ms. NA refers to Not Available. Sources: Capital IQ, public filings, press releases. (dollars in millions) Transaction Value / LTM Adjusted Transaction LTM Adjusted EBITDA Announced Effective Target Acquiror Value [1] EBITDA [2] Margin % [2] Diversified Marketing Services Pending ZetaDisplay AB Alpha Acquisition AB $109.1 16.5x 15.0% 8/2/2021 MDC Partners Inc. Stagwell Media LP ; The Stagwell Group LLC $1,201.4 9.2x 10.5% 4/27/2020 Growww Media Co., Ltd. Hakuhodo Zeta Inc. $96.0 6.2x 11.7% 4/20/2020 Sanoma Media Netherlands DPG Media $510.4 6.5x 19.7% 10/25/2019 Firewood Marketing, Inc. MediaMonks $150.0 13.2x NA 7/2/2019 Epsilon Data Management, LLC Publicis Groupe Holdings B.V.; MMS USA Investments, Inc. $4,400.0 8.2x 28.2% 12/24/2018 MightyHive, Inc. S4 Capital plc $150.0 13.5x 27.3% 11/2/2018 Eleven Inc. Vision 7 Communications U.S. Inc. $30.0 NANA NA 4/1/2018 Daehong Communications Inc. LOTTE Corporation $208.6 5.5x 9.7% 8/24/2018 Goldbach Group AG Tamedia AG $180.7 4.8x 7.4% 12/7/2017 Asatsu-DK Inc Bain Capital Private Equity, LP $1,186.5 17.3x 2.2% 7/3/2017 Havas SA Vivendi SA $4,069.8 9.9x 16.6% 4/12/2017 SinnerSchrader Aktiengesellschaft Accenture Holding GmbH & Co. KG $103.4 16.9x NA 12/23/2016 Creston plc RedWhiteBlue Champion Limited $89.3 5.5x 12.0% 9/27/2016 Sizmek Inc Vector Capital $76.8 8.8x 4.7% Low $30.0 4.8x 2.2% High $4,400.0 17.3x 28.2% Median $150.0 9.0x 11.8% Mean $837.5 10.1x 13.7% 6/28/2021 12/10/2019 12/4/2018 10/8/2019 10/2/2017 8/3/2016 10/31/2018 2/20/2017 1/2/2018 12/22/2017 5/11/2017 11/17/2016 4/14/2019 12/21/2020 2/25/2020 23
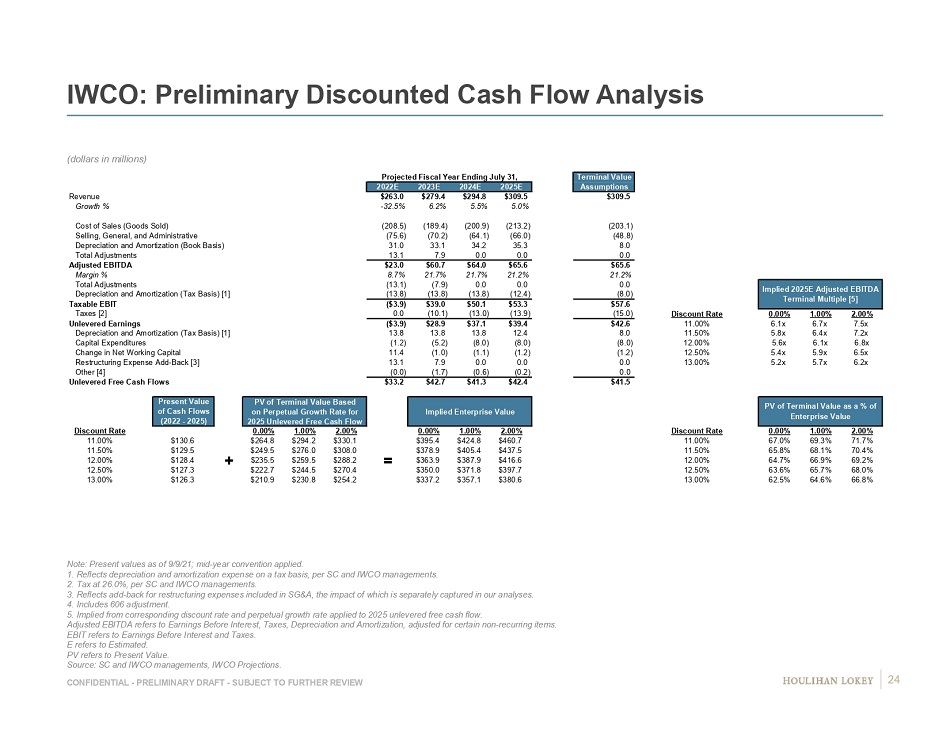
CONFIDENTIAL - PRELIMINARY DRAFT - SUBJECT TO FURTHER REVIEW IWCO: Preliminary Discounted Cash Flow Analysis (dollars in millions) Note: Present values as of 9/9/21; mid - year convention applied. 1. Reflects depreciation and amortization expense on a tax basis, per SC and IWCO managements. 2. Tax at 26.0%, per SC and IWCO managements. 3. Reflects add - back for restructuring expenses included in SG&A, the impact of which is separately captured in our analyses. 4. Includes 606 adjustment. 5. Implied from corresponding discount rate and perpetual growth rate applied to 2025 unlevered free cash flow. Adjusted EBITDA refers to Earnings Before Interest, Taxes, Depreciation and Amortization, adjusted for certain non - recurring ite ms. EBIT refers to Earnings Before Interest and Taxes. E refers to Estimated. PV refers to Present Value. Source: SC and IWCO managements, IWCO Projections. Projected Fiscal Year Ending July 31, Terminal Value 2022E 2023E 2024E 2025E Assumptions Revenue $263.0 $279.4 $294.8 $309.5 $309.5 Growth % -32.5% 6.2% 5.5% 5.0% Cost of Sales (Goods Sold) (208.5) (189.4) (200.9) (213.2) (203.1) Selling, General, and Administrative (75.6) (70.2) (64.1) (66.0) (48.8) Depreciation and Amortization (Book Basis) 31.0 33.1 34.2 35.3 8.0 Total Adjustments 13.1 7.9 0.0 0.0 0.0 Adjusted EBITDA $23.0 $60.7 $64.0 $65.6 $65.6 Margin % 8.7% 21.7% 21.7% 21.2% 21.2% Total Adjustments (13.1) (7.9) 0.0 0.0 0.0 Depreciation and Amortization (Tax Basis) [1] (13.8) (13.8) (13.8) (12.4) (8.0) Taxable EBIT ($3.9) $39.0 $50.1 $53.3 $57.6 Taxes [2] 0.0 (10.1) (13.0) (13.9) (15.0) Discount Rate 0.00% 1.00% 2.00% Unlevered Earnings ($3.9) $28.9 $37.1 $39.4 $42.6 11.00% 6.1x 6.7x 7.5x Depreciation and Amortization (Tax Basis) [1] 13.8 13.8 13.8 12.4 8.0 11.50% 5.8x 6.4x 7.2x Capital Expenditures (1.2) (5.2) (8.0) (8.0) (8.0) 12.00% 5.6x 6.1x 6.8x Change in Net Working Capital 11.4 (1.0) (1.1) (1.2) (1.2) 12.50% 5.4x 5.9x 6.5x Restructuring Expense Add-Back [3] 13.1 7.9 0.0 0.0 0.0 13.00% 5.2x 5.7x 6.2x Other [4] (0.0) (1.7) (0.6) (0.2) 0.0 Unlevered Free Cash Flows $33.2 $42.7 $41.3 $42.4 $41.5 DCF Assumptions Present Value PV of Terminal Value Based of Cash Flows on Perpetual Growth Rate for Implied Enterprise Value (2022 - 2025) 2025 Unlevered Free Cash Flow Discount Rate 0.00% 1.00% 2.00% 0.00% 1.00% 2.00% Discount Rate 0.00% 1.00% 2.00% 11.00% $130.6 $264.8 $294.2 $330.1 $395.4 $424.8 $460.7 11.00% 67.0% 69.3% 71.7% 11.50% $129.5 $249.5 $276.0 $308.0 $378.9 $405.4 $437.5 11.50% 65.8% 68.1% 70.4% 12.00% $128.4 + $235.5 $259.5 $288.2 = $363.9 $387.9 $416.6 12.00% 64.7% 66.9% 69.2% 12.50% $127.3 $222.7 $244.5 $270.4 $350.0 $371.8 $397.7 12.50% 63.6% 65.7% 68.0% 13.00% $126.3 $210.9 $230.8 $254.2 $337.2 $357.1 $380.6 13.00% 62.5% 64.6% 66.8% Implied 2025E Adjusted EBITDA Terminal Multiple [5] PV of Terminal Value as a % of Enterprise Value 24
Page 1. Executive Summary 3 2. Preliminary Financial Analyses Summary 6 3. Preliminary Financial Observations and Analyses 12 IWCO 13 ModusLink 25 4. Preliminary Considerations Related to Proposal 35 5. Appendices 45 6. Disclaimer 52
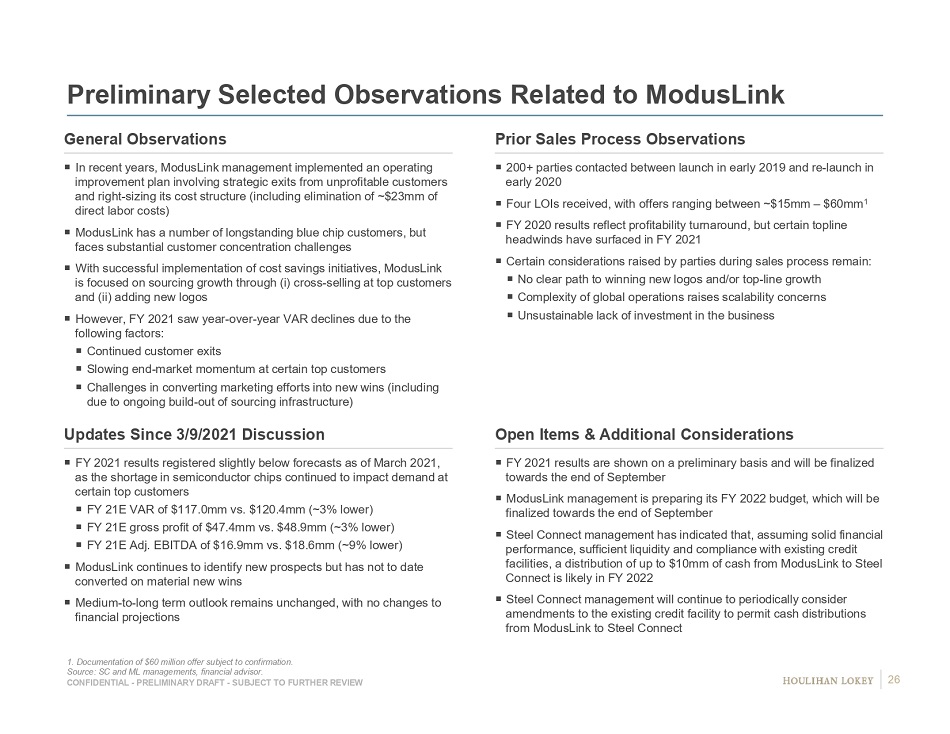
CONFIDENTIAL - PRELIMINARY DRAFT - SUBJECT TO FURTHER REVIEW 200+ parties contacted between launch in early 2019 and re - launch in early 2020 Four LOIs received, with offers ranging between ~$15mm – $60mm 1 FY 2020 results reflect profitability turnaround, but certain topline headwinds have surfaced in FY 2021 Certain considerations raised by parties during sales process remain: No clear path to winning new logos and/or top - line growth Complexity of global operations raises scalability concerns Unsustainable lack of investment in the business Preliminary Selected Observations Related to ModusLink General Observations Prior Sales Process Observations Updates Since 3/9/2021 Discussion Open Items & Additional Considerations 1. Documentation of $60 million offer subject to confirmation. Source: SC and ML managements, financial advisor. In recent years, ModusLink management implemented an operating improvement plan involving strategic exits from unprofitable customers and right - sizing its cost structure (including elimination of ~$23mm of direct labor costs) ModusLink has a number of longstanding blue chip customers, but faces substantial customer concentration challenges With successful implementation of cost savings initiatives, ModusLink is focused on sourcing growth through (i) cross - selling at top customers and (ii) adding new logos However, FY 2021 saw year - over - year VAR declines due to the following factors: Continued customer exits Slowing end - market momentum at certain top customers Challenges in converting marketing efforts into new wins (including due to ongoing build - out of sourcing infrastructure) FY 2021 results registered slightly below forecasts as of March 2021, as the shortage in semiconductor chips continued to impact demand at certain top customers FY 21E VAR of $117.0mm vs. $120.4mm (~3% lower) FY 21E gross profit of $47.4mm vs. $48.9mm (~3% lower) FY 21E Adj. EBITDA of $16.9mm vs. $18.6mm (~9% lower) ModusLink continues to identify new prospects but has not to date converted on material new wins Medium - to - long term outlook remains unchanged, with no changes to financial projections FY 2021 results are shown on a preliminary basis and will be finalized towards the end of September ModusLink management is preparing its FY 2022 budget, which will be finalized towards the end of September Steel Connect management has indicated that, assuming solid financial performance, sufficient liquidity and compliance with existing credit facilities, a distribution of up to $10mm of cash from ModusLink to Steel Connect is likely in FY 2022 Steel Connect management will continue to periodically consider amendments to the existing credit facility to permit cash distributions from ModusLink to Steel Connect 26
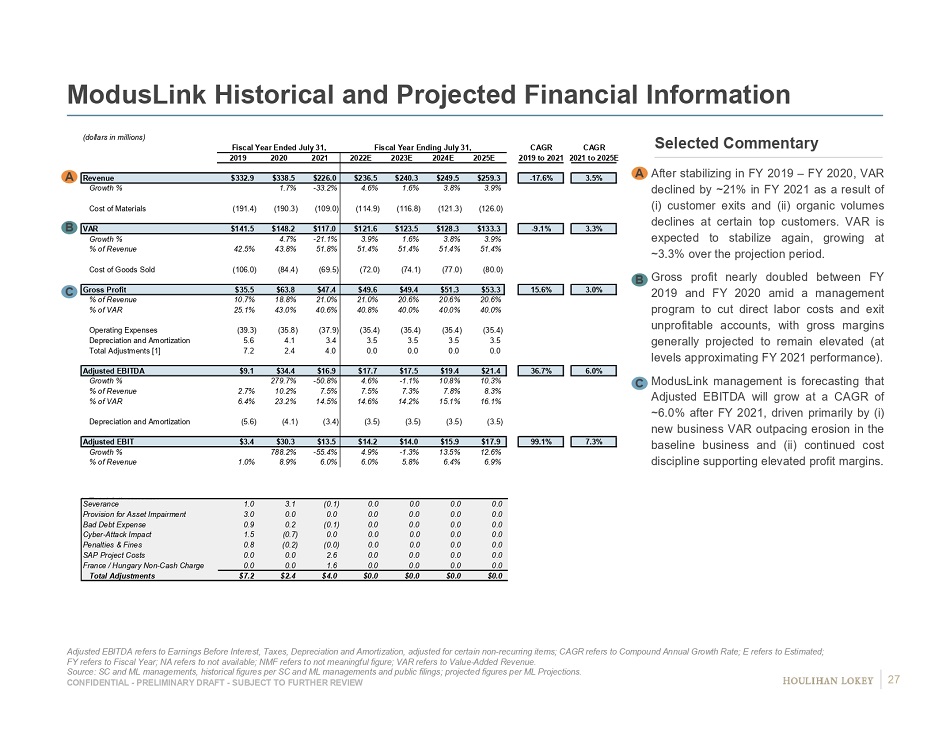
CONFIDENTIAL - PRELIMINARY DRAFT - SUBJECT TO FURTHER REVIEW (dollars in millions) Fiscal Year Ended July 31, Fiscal Year Ending July 31, CAGR CAGR 2019 2020 2021 2022E 2023E 2024E 2025E 2019 to 2021 2021 to 2025E Revenue $332.9 $338.5 $226.0 $236.5 $240.3 $249.5 $259.3 -17.6% 3.5% Growth % 1.7% -33.2% 4.6% 1.6% 3.8% 3.9% Cost of Materials (191.4) (190.3) (109.0) (114.9) (116.8) (121.3) (126.0) VAR $141.5 $148.2 $117.0 $121.6 $123.5 $128.3 $133.3 -9.1% 3.3% Growth % 4.7% -21.1% 3.9% 1.6% 3.8% 3.9% % of Revenue 42.5% 43.8% 51.8% 51.4% 51.4% 51.4% 51.4% Cost of Goods Sold (106.0) (84.4) (69.5) (72.0) (74.1) (77.0) (80.0) Gross Profit $35.5 $63.8 $47.4 $49.6 $49.4 $51.3 $53.3 15.6% 3.0% % of Revenue 10.7% 18.8% 21.0% 21.0% 20.6% 20.6% 20.6% % of VAR 25.1% 43.0% 40.6% 40.8% 40.0% 40.0% 40.0% Operating Expenses (39.3) (35.8) (37.9) (35.4) (35.4) (35.4) (35.4) Depreciation and Amortization 5.6 4.1 3.4 3.5 3.5 3.5 3.5 Total Adjustments [1] 7.2 2.4 4.0 0.0 0.0 0.0 0.0 Adjusted EBITDA $9.1 $34.4 $16.9 $17.7 $17.5 $19.4 $21.4 36.7% 6.0% Growth % 279.7% -50.8% 4.6% -1.1% 10.8% 10.3% % of Revenue 2.7% 10.2% 7.5% 7.5% 7.3% 7.8% 8.3% % of VAR 6.4% 23.2% 14.5% 14.6% 14.2% 15.1% 16.1% Depreciation and Amortization (5.6) (4.1) (3.4) (3.5) (3.5) (3.5) (3.5) Adjusted EBIT $3.4 $30.3 $13.5 $14.2 $14.0 $15.9 $17.9 99.1% 7.3% Growth % 788.2% -55.4% 4.9% -1.3% 13.5% 12.6% % of Revenue 1.0% 8.9% 6.0% 6.0% 5.8% 6.4% 6.9% ModusLink Historical and Projected Financial Information 1. Total Adjustments: Adjusted EBITDA refers to Earnings Before Interest, Taxes, Depreciation and Amortization, adjusted for certain non - recurring ite ms; CAGR refers to Compound Annual Growth Rate; E refers to Estimated; FY refers to Fiscal Year; NA refers to not available; NMF refers to not meaningful figure; VAR refers to Value - Added Revenue. Source: SC and ML managements, historical figures per SC and ML managements and public filings; projected figures per ML Proj ect ions. After stabilizing in FY 2019 – FY 2020 , VAR declined by ~ 21 % in FY 2021 as a result of (i) customer exits and (ii) organic volumes declines at certain top customers . VAR is expected to stabilize again, growing at ~ 3 . 3 % over the projection period . Gross profit nearly doubled between FY 2019 and FY 2020 amid a management program to cut direct labor costs and exit unprofitable accounts, with gross margins generally projected to remain elevated (at levels approximating FY 2021 performance) . ModusLink management is forecasting that Adjusted EBITDA will grow at a CAGR of ~ 6 . 0 % after FY 2021 , driven primarily by (i) new business VAR outpacing erosion in the baseline business and (ii) continued cost discipline supporting elevated profit margins . C B A Selected Commentary C A B Severance 1.0 3.1 (0.1) 0.0 0.0 0.0 0.0 Provision for Asset Impairment 3.0 0.0 0.0 0.0 0.0 0.0 0.0 Bad Debt Expense 0.9 0.2 (0.1) 0.0 0.0 0.0 0.0 Cyber-Attack Impact 1.5 (0.7) 0.0 0.0 0.0 0.0 0.0 Penalties & Fines 0.8 (0.2) (0.0) 0.0 0.0 0.0 0.0 SAP Project Costs 0.0 0.0 2.6 0.0 0.0 0.0 0.0 France / Hungary Non-Cash Charge 0.0 0.0 1.6 0.0 0.0 0.0 0.0 Total Adjustments $7.2 $2.4 $4.0 $0.0 $0.0 $0.0 $0.0 27
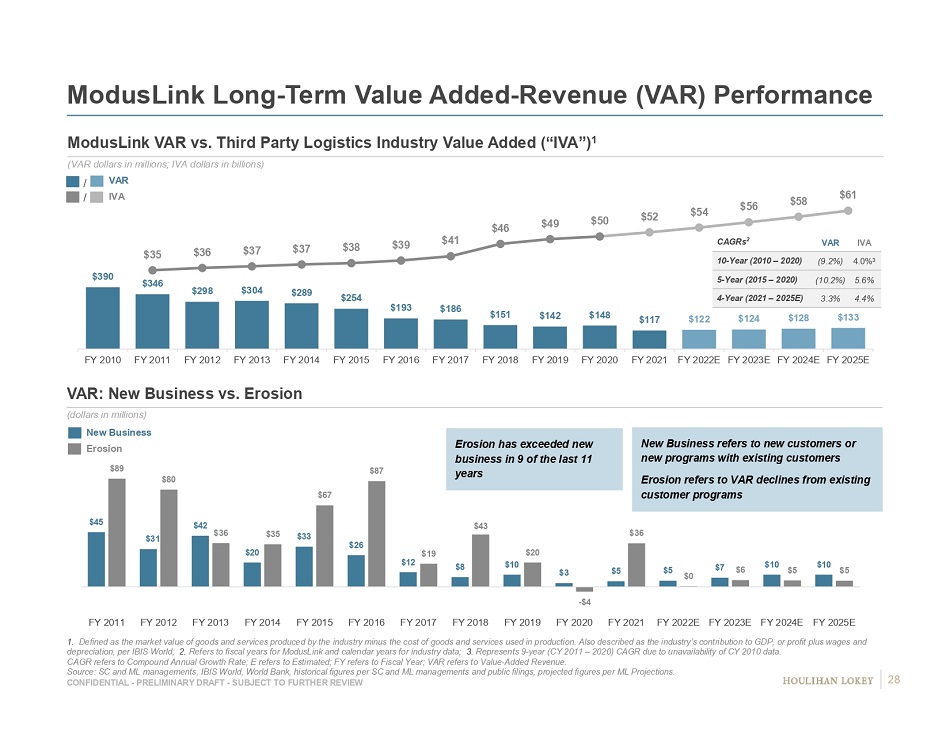
CONFIDENTIAL - PRELIMINARY DRAFT - SUBJECT TO FURTHER REVIEW $45 $31 $42 $20 $33 $26 $12 $8 $10 $3 $5 $5 $7 $10 $10 $89 $80 $36 $35 $67 $87 $19 $43 $20 - $4 $36 $0 $6 $5 $5 FY 2011 FY 2012 FY 2013 FY 2014 FY 2015 FY 2016 FY 2017 FY 2018 FY 2019 FY 2020 FY 2021 FY 2022E FY 2023E FY 2024E FY 2025E Erosion has exceeded new business in 9 of the last 11 years ModusLink Long - Term Value Added - Revenue (VAR) Performance 1. Defined as the market value of goods and services produced by the industry minus the cost of goods and services used in produ c tion. Also described as the industry’s contribution to GDP, or profit plus wages and depreciation, per IBIS World; 2. Refers to fiscal years for ModusLink and calendar years for industry data; 3. Represents 9 - year (CY 2011 – 2020) CAGR due to unavailability of CY 2010 data. CAGR refers to Compound Annual Growth Rate; E refers to Estimated; FY refers to Fiscal Year; VAR refers to Value - Added Revenue. Source: SC and ML managements, IBIS World, World Bank, historical figures per SC and ML managements and public filings, projected figures per ML Projections . ModusLink VAR vs. Third Party Logistics Industry Value Added (“IVA”) 1 (VAR dollars in millions; IVA dollars in billions) VAR: New Business vs. Erosion (dollars in millions) New Business Erosion VAR IVA / / New Business refers to new customers or new programs with existing customers Erosion refers to VAR declines from existing customer programs $390 $346 $298 $304 $289 $254 $193 $186 $151 $142 $148 $117 $122 $124 $128 $133 $35 $36 $37 $37 $38 $39 $41 $46 $49 $50 $52 $54 $56 $58 $61 $- $100.0 $200.0 $300.0 $400.0 $500.0 $600.0 $700.0 $800.0 $900.0 $1,000.0 FY 2010 FY 2011 FY 2012 FY 2013 FY 2014 FY 2015 FY 2016 FY 2017 FY 2018 FY 2019 FY 2020 FY 2021 FY 2022E FY 2023E FY 2024E FY 2025E $0.0 $10.0 $20.0 $30.0 $40.0 $50.0 $60.0 $70.0 CAGRs 2 VAR IVA 10 - Year (2010 – 2020) (9.2%) 4.0% 3 5 - Year (2015 – 2020) (10.2%) 5.6% 4 - Year (2021 – 2025E) 3.3% 4.4% 28
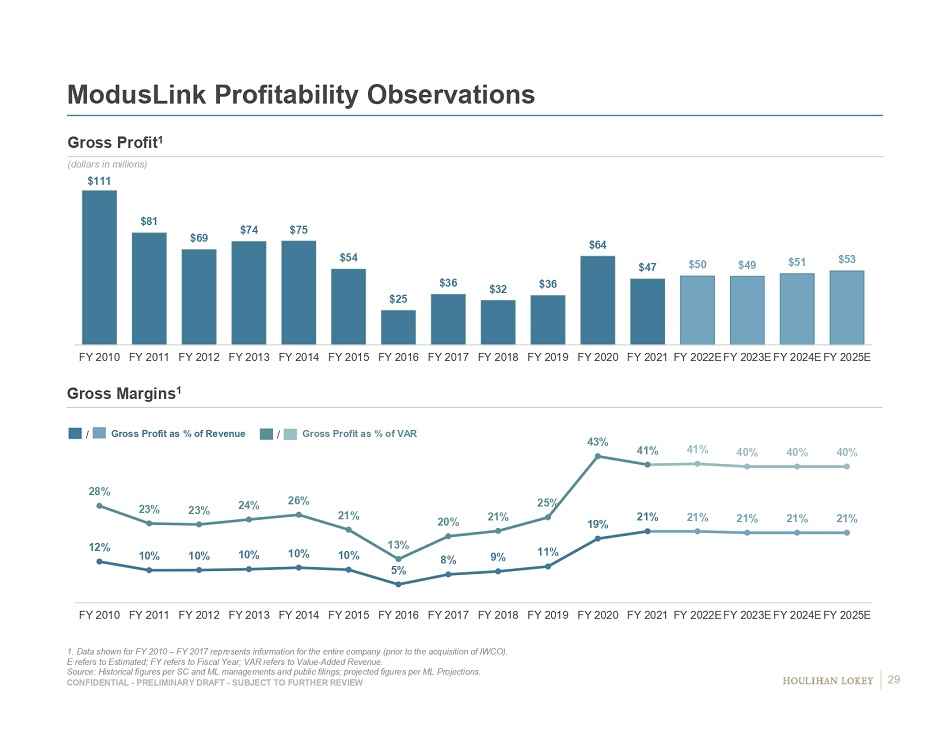
CONFIDENTIAL - PRELIMINARY DRAFT - SUBJECT TO FURTHER REVIEW ModusLink Profitability Observations 1. Data shown for FY 2010 – FY 2017 represents information for the entire company (prior to the acquisition of IWCO). E refers to Estimated; FY refers to Fiscal Year; VAR refers to Value - Added Revenue. Source: Hi storical figures per SC and ML managements and public filings; projected figures per ML Projections . Gross Profit 1 (dollars in millions) Gross Margins 1 Gross Profit as % of Revenue / Gross Profit as % of VAR / $111 $81 $69 $74 $75 $54 $25 $36 $32 $36 $64 $47 $50 $49 $51 $53 FY 2010 FY 2011 FY 2012 FY 2013 FY 2014 FY 2015 FY 2016 FY 2017 FY 2018 FY 2019 FY 2020 FY 2021 FY 2022E FY 2023E FY 2024E FY 2025E 12% 10% 10% 10% 10% 10% 5% 8% 9% 11% 19% 21% 21% 21% 21% 21% 28% 23% 23% 24% 26% 21% 13% 20% 21% 25% 43% 41% 41% 40% 40% 40% FY 2010 FY 2011 FY 2012 FY 2013 FY 2014 FY 2015 FY 2016 FY 2017 FY 2018 FY 2019 FY 2020 FY 2021 FY 2022E FY 2023E FY 2024E FY 2025E 29

CONFIDENTIAL - PRELIMINARY DRAFT - SUBJECT TO FURTHER REVIEW $31.9 $63.8 $47.4 $5.0 $1.2 $7.8 $2.3 $0.0 $10.0 $20.0 $30.0 $40.0 $50.0 $60.0 $70.0 FY 18A FY 20A Customer Y Customer Z Customer B Other Net Erosion FY 21A $151.3 $148.2 $117.0 $20.4 $7.8 $11.7 $7.3 $5.2 $7.0 $4.4 $7.7 $7.6 $4.9 $80.0 $100.0 $120.0 $140.0 $160.0 $180.0 $200.0 FY 18A Growth Erosion FY 20A Customer Y Customer Z Customer B Other Net Erosion FY 21A ModusLink FY 2018 to FY 2021 VAR & Gross Profit Bridge FY refers to Fiscal Year; VAR refers to Value - Added Revenue. Source: SC and ML managements, ML Projections. Gross Profit Bridge (dollars in millions) VAR Bridge (dollars in millions) Gross profit growth is attributable to the following factors : (i) elimination of approximately $ 23 million of direct labor costs between FY 2018 and FY 2020 ; (ii) exits from unprofitable customers ; and (iii) organic growth in VAR at certain high margin customers Exits from unprofitable customers Organic growth from existing programs at Customer A and B Customer exits Organic declines in existing programs $31.9 Growth 30
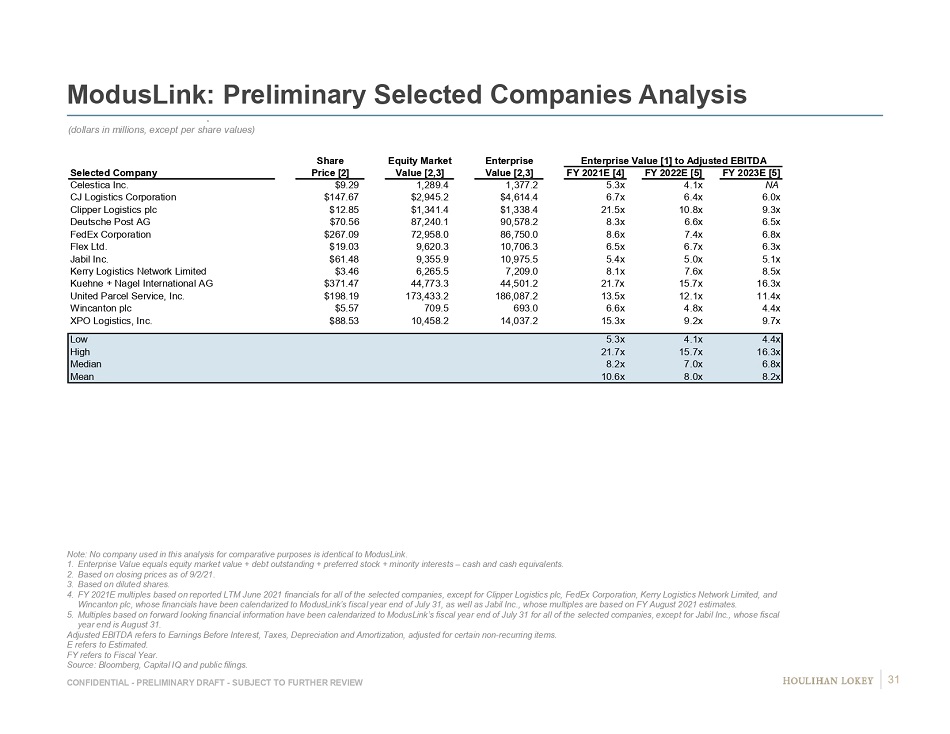
CONFIDENTIAL - PRELIMINARY DRAFT - SUBJECT TO FURTHER REVIEW ModusLink: Preliminary Selected Companies Analysis (dollars in millions, except per share values) Note: No company used in this analysis for comparative purposes is identical to ModusLink. 1. Enterprise Value equals equity market value + debt outstanding + preferred stock + minority interests – cash and cash equivalent s. 2. Based on closing prices as of 9/2/21. 3. Based on diluted shares. 4. FY 2021E multiples based on reported LTM June 2021 financials for all of the selected companies, except for Clipper Logistics pl c, FedEx Corporation, Kerry Logistics Network Limited, and Wincanton plc, whose financials have been calendarized to ModusLink’s fiscal year end of July 31, as well as Jabil Inc., whos e m ultiples are based on FY August 2021 estimates. 5. Multiples based on forward looking financial information have been calendarized to ModusLink’s fiscal year end of July 31 for al l of the selected companies, except for Jabil Inc., whose fiscal year end is August 31. Adjusted EBITDA refers to Earnings Before Interest, Taxes, Depreciation and Amortization, adjusted for certain non - recurring ite ms. E refers to Estimated. FY refers to Fiscal Year. Source: Bloomberg, Capital IQ and public filings. Share Equity Market Enterprise Enterprise Value [1] to Adjusted EBITDA Selected Company Price [2] Value [2,3] Value [2,3] FY 2021E [4] FY 2022E [5] FY 2023E [5] Celestica Inc. $9.29 1,289.4 1,377.2 5.3x 4.1x NA CJ Logistics Corporation $147.67 $2,945.2 $4,614.4 6.7x 6.4x 6.0x Clipper Logistics plc $12.85 $1,341.4 $1,338.4 21.5x 10.8x 9.3x Deutsche Post AG $70.56 87,240.1 90,578.2 8.3x 6.6x 6.5x FedEx Corporation $267.09 72,958.0 86,750.0 8.6x 7.4x 6.8x Flex Ltd. $19.03 9,620.3 10,706.3 6.5x 6.7x 6.3x Jabil Inc. $61.48 9,355.9 10,975.5 5.4x 5.0x 5.1x Kerry Logistics Network Limited $3.46 6,265.5 7,209.0 8.1x 7.6x 8.5x Kuehne + Nagel International AG $371.47 44,773.3 44,501.2 21.7x 15.7x 16.3x United Parcel Service, Inc. $198.19 173,433.2 186,087.2 13.5x 12.1x 11.4x Wincanton plc $5.57 709.5 693.0 6.6x 4.8x 4.4x XPO Logistics, Inc. $88.53 10,458.2 14,037.2 15.3x 9.2x 9.7x Low 5.3x 4.1x 4.4x High 21.7x 15.7x 16.3x Median 8.2x 7.0x 6.8x Mean 10.6x 8.0x 8.2x 31

CONFIDENTIAL - PRELIMINARY DRAFT - SUBJECT TO FURTHER REVIEW ModusLink: Preliminary Selected Benchmarking Data Note: No company shown for comparative purposes is identical to ModusLink; certain selected companies do not report VAR. 1. Based on public trading prices of common stock. Adjusted EBITDA refers to Earnings Before Interest, Taxes, Depreciation and Amortization, adjusted for certain non - recurring ite ms. Adjusted EBIT refers to Earnings Before Interest and Taxes, adjusted for certain non - recurring items. Depr. refers to Depreciation. E refers to Estimated. LTM refers to the most recently completed 12 - month period for which financial information has been made public, other than for M odusLink, in which case LTM refers to Latest 12 Months. NA refers to Not Available. Source: Bloomberg, Capital IQ, SC and ML managements, public filings, and ML Projections. Size Size [1] Revenue Growth Revenue Growth (LTM Revenue, millions) (Enterprise Value as of 9/2/21, millions) (FY 2019 to FY 2021 Revenue) (FY 2021 to FY 2023E Revenue) Name Value Name Value Name Value Name Value United Parcel Service, Inc. $92,466.0 United Parcel Service, Inc. $186,087.2 Kerry Logistics Network Limited 28.7% Clipper Logistics plc 7.8% Deutsche Post AG $87,470.9 Deutsche Post AG $90,578.2 Clipper Logistics plc 23.1% Jabil Inc. 4.6% FedEx Corporation $83,959.0 FedEx Corporation $86,750.0 United Parcel Service, Inc. 11.3% FedEx Corporation 4.2% Jabil Inc. $29,175.7 Kuehne + Nagel International AG $44,501.2 FedEx Corporation 10.6% Kuehne + Nagel International AG 4.1% Kuehne + Nagel International AG $26,062.0 XPO Logistics, Inc. $14,037.2 Kuehne + Nagel International AG 9.3% Flex Ltd. 3.4% Flex Ltd. $25,313.0 Jabil Inc. $10,975.5 XPO Logistics, Inc. 8.8% United Parcel Service, Inc. 3.4% XPO Logistics, Inc. $11,399.5 Flex Ltd. $10,706.3 Jabil Inc. 8.1% Wincanton plc 3.2% CJ Logistics Corporation $9,547.0 Kerry Logistics Network Limited $7,209.0 Deutsche Post AG 7.5% CJ Logistics Corporation 3.1% Kerry Logistics Network Limited $8,774.2 CJ Logistics Corporation $4,614.4 CJ Logistics Corporation 5.9% ModusLink 3.1% Celestica Inc. $5,592.3 Celestica Inc. $1,377.2 Wincanton plc 3.3% Kerry Logistics Network Limited 3.0% Wincanton plc $1,689.7 Clipper Logistics plc $1,338.4 Flex Ltd. -1.5% Deutsche Post AG 2.9% Clipper Logistics plc $962.7 Wincanton plc $693.0 Celestica Inc. -4.3% XPO Logistics, Inc. 1.9% ModusLink $226.0 ModusLink -17.6% Celestica Inc. NA Adjusted EBITDA Growth Adjusted EBITDA Growth Profitability Profitability (FY 2019 to FY 2021 Adjusted EBITDA) (FY 2021 to FY 2023E Adjusted EBITDA) (LTM Adjusted EBITDA to LTM Revenue) (FY 2021 to FY 2023 Average Adjusted EBITDA Margin) Name Value Name Value Name Value Name Value Kerry Logistics Network Limited 42.9% Clipper Logistics plc 23.5% United Parcel Service, Inc. 14.9% United Parcel Service, Inc. 15.7% Deutsche Post AG 37.9% Wincanton plc 14.5% Deutsche Post AG 12.4% Deutsche Post AG 14.3% ModusLink 36.7% Jabil Inc. 12.4% FedEx Corporation 11.6% FedEx Corporation 12.7% Clipper Logistics plc 35.8% FedEx Corporation 8.3% XPO Logistics, Inc. 8.1% Clipper Logistics plc 10.4% Kuehne + Nagel International AG 33.0% Deutsche Post AG 7.5% Kuehne + Nagel International AG 7.9% XPO Logistics, Inc. 10.1% Flex Ltd. 16.9% United Parcel Service, Inc. 7.2% Kerry Logistics Network Limited 7.8% Kerry Logistics Network Limited 10.0% Jabil Inc. 15.0% XPO Logistics, Inc. 7.1% ModusLink 7.5% Kuehne + Nagel International AG 8.9% United Parcel Service, Inc. 14.5% Kuehne + Nagel International AG 5.4% CJ Logistics Corporation 7.3% Wincanton plc 7.5% Celestica Inc. 14.0% CJ Logistics Corporation 3.8% Flex Ltd. 6.5% ModusLink 7.4% CJ Logistics Corporation 14.0% Flex Ltd. 3.8% Clipper Logistics plc 6.5% CJ Logistics Corporation 7.2% FedEx Corporation 12.9% ModusLink 1.7% Jabil Inc. 6.5% Jabil Inc. 7.0% XPO Logistics, Inc. 8.9% Kerry Logistics Network Limited -1.8% Wincanton plc 5.1% Flex Ltd. 6.2% Wincanton plc 4.9% Celestica Inc. NA Celestica Inc. 4.7% Celestica Inc. NA Profitability Profitability Relative Depreciation Internal Investment (LTM Adjusted EBIT to LTM Revenue) (FY 2021 to FY 2023 Average Adjusted EBIT Margin) (LTM Depr. to LTM Adjusted EBITDA) (LTM Capital Expenditures to LTM Revenue) Name Value Name Value Name Value Name Value United Parcel Service, Inc. 11.9% United Parcel Service, Inc. 12.5% Kuehne + Nagel International AG 11.5% Wincanton plc 0.7% Deutsche Post AG 10.2% Deutsche Post AG 9.5% Wincanton plc 14.7% Kuehne + Nagel International AG 0.8% FedEx Corporation 7.1% FedEx Corporation 8.2% Clipper Logistics plc 15.3% Celestica Inc. 0.9% Kuehne + Nagel International AG 6.9% Kuehne + Nagel International AG 6.4% Deutsche Post AG 17.8% Clipper Logistics plc 1.0% Kerry Logistics Network Limited 6.2% ModusLink 5.9% ModusLink 20.1% ModusLink 1.4% ModusLink 6.0% XPO Logistics, Inc. 5.8% Kerry Logistics Network Limited 20.4% Flex Ltd. 1.4% Clipper Logistics plc 5.5% Clipper Logistics plc 5.8% United Parcel Service, Inc. 20.6% Kerry Logistics Network Limited 1.9% Wincanton plc 4.3% Wincanton plc 4.8% Celestica Inc. 35.4% CJ Logistics Corporation 2.4% Flex Ltd. 4.0% Flex Ltd. 4.4% Flex Ltd. 38.0% Jabil Inc. 4.2% XPO Logistics, Inc. 3.9% Jabil Inc. 4.3% FedEx Corporation 38.8% Deutsche Post AG 4.5% Jabil Inc. 3.6% CJ Logistics Corporation 3.4% Jabil Inc. 44.5% XPO Logistics, Inc. 4.6% Celestica Inc. 3.0% Kerry Logistics Network Limited NA XPO Logistics, Inc. 51.5% United Parcel Service, Inc. 5.4% CJ Logistics Corporation 2.9% Celestica Inc. NA CJ Logistics Corporation 61.0% FedEx Corporation 7.0% 32
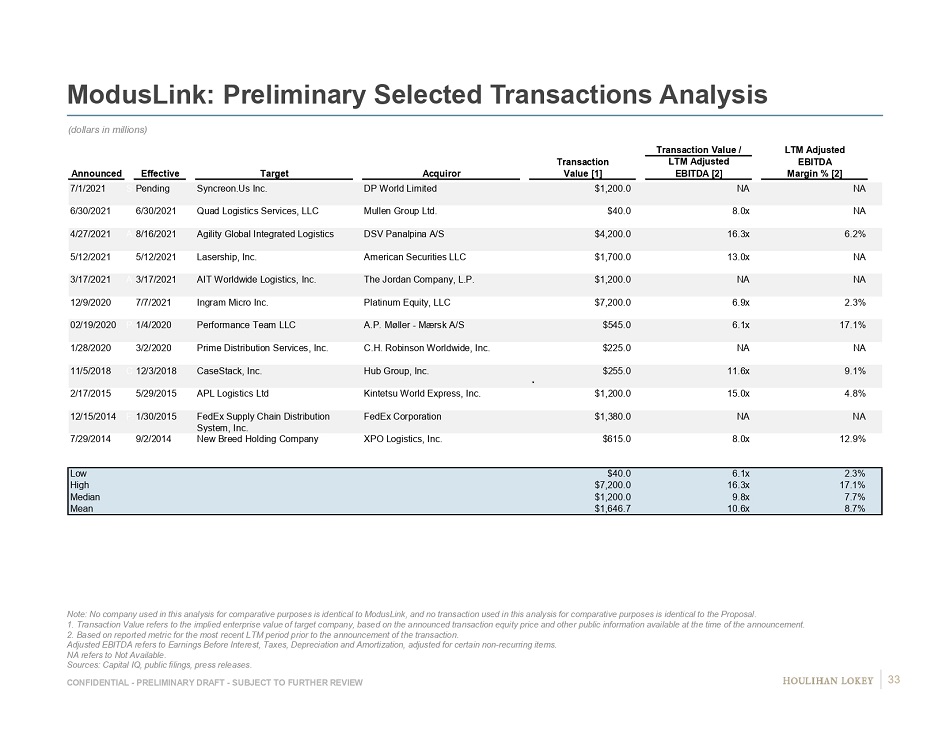
CONFIDENTIAL - PRELIMINARY DRAFT - SUBJECT TO FURTHER REVIEW ModusLink: Preliminary Selected Transactions Analysis Note: No company used in this analysis for comparative purposes is identical to ModusLink, and no transaction used in this an aly sis for comparative purposes is identical to the Proposal. 1. Transaction Value refers to the implied enterprise value of target company, based on the announced transaction equity pric e a nd other public information available at the time of the announcement. 2. Based on reported metric for the most recent LTM period prior to the announcement of the transaction. Adjusted EBITDA refers to Earnings Before Interest, Taxes, Depreciation and Amortization, adjusted for certain non - recurring ite ms. NA refers to Not Available. Sources: Capital IQ, public filings, press releases. (dollars in millions) Transaction Value / LTM Adjusted Transaction LTM Adjusted EBITDA Announced Effective Target Acquiror Value [1] EBITDA [2] Margin % [2] Syncreon Syncreon.Us Inc. DP World Limited $1,200.0 NA NA 6/30/2021 Quad Logistics Services, LLC Mullen Group Ltd. $40.0 8.0x NA AGI Agility Global Integrated Logistics DSV Panalpina A/S $4,200.0 16.3x 6.2% Lasership Lasership, Inc. American Securities LLC $1,700.0 13.0x NA AIT AIT Worldwide Logistics, Inc. The Jordan Company, L.P. $1,200.0 NA NA Ingram Ingram Micro Inc. Platinum Equity, LLC $7,200.0 6.9x 2.3% Performance Performance Team LLC A.P. Møller - Mærsk A/S $545.0 6.1x 17.1% PDS Prime Distribution Services, Inc. C.H. Robinson Worldwide, Inc. $225.0 NA NA CaseStack CaseStack, Inc. Hub Group, Inc. $255.0 11.6x 9.1% APL APL Logistics Ltd Kintetsu World Express, Inc. $1,200.0 15.0x 4.8% FSCDS FedEx Supply Chain Distribution System, Inc. FedEx Corporation $1,380.0 NA NA New Breed New Breed Holding Company XPO Logistics, Inc. $615.0 8.0x 12.9% Low $40.0 6.1x 2.3% High $7,200.0 16.3x 17.1% Median $1,200.0 9.8x 7.7% Mean $1,646.7 10.6x 8.7% 1/30/2015 9/2/2014 3/2/2020 7/7/2021 1/4/2020 12/3/2018 5/29/2015 12/9/2020 02/19/2020 1/28/2020 11/5/2018 2/17/2015 12/15/2014 7/29/2014 5/12/2021 5/12/2021 3/17/2021 3/17/2021 7/1/2021 Pending 4/27/2021 8/16/2021 6/30/2021 33
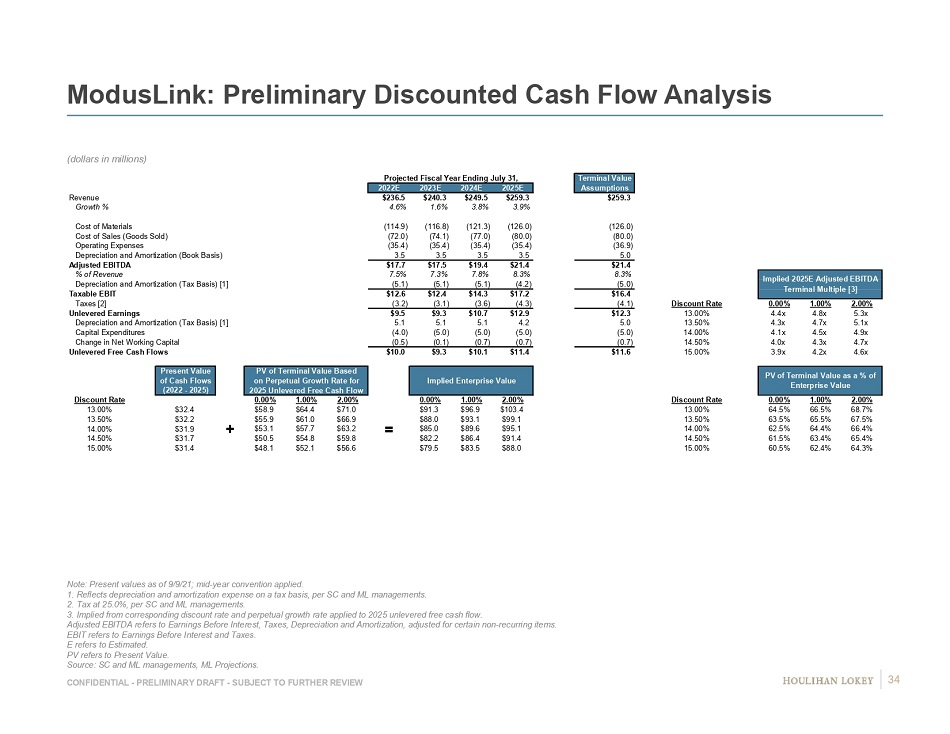
CONFIDENTIAL - PRELIMINARY DRAFT - SUBJECT TO FURTHER REVIEW ModusLink: Preliminary Discounted Cash Flow Analysis (dollars in millions) Note: Present values as of 9/9/21; mid - year convention applied. 1. Reflects depreciation and amortization expense on a tax basis, per SC and ML managements. 2. Tax at 25.0%, per SC and ML managements. 3. Implied from corresponding discount rate and perpetual growth rate applied to 2025 unlevered free cash flow. Adjusted EBITDA refers to Earnings Before Interest, Taxes, Depreciation and Amortization, adjusted for certain non - recurring ite ms. EBIT refers to Earnings Before Interest and Taxes. E refers to Estimated. PV refers to Present Value. Source: SC and ML managements, ML Projections. Projected Fiscal Year Ending July 31, Terminal Value 2022E 2023E 2024E 2025E Assumptions Revenue $236.5 $240.3 $249.5 $259.3 $259.3 Growth % 4.6% 1.6% 3.8% 3.9% Cost of Materials (114.9) (116.8) (121.3) (126.0) (126.0) Cost of Sales (Goods Sold) (72.0) (74.1) (77.0) (80.0) (80.0) Operating Expenses (35.4) (35.4) (35.4) (35.4) (36.9) Depreciation and Amortization (Book Basis) 3.5 3.5 3.5 3.5 5.0 Adjusted EBITDA $17.7 $17.5 $19.4 $21.4 $21.4 % of Revenue 7.5% 7.3% 7.8% 8.3% 8.3% Depreciation and Amortization (Tax Basis) [1] (5.1) (5.1) (5.1) (4.2) (5.0) Taxable EBIT $12.6 $12.4 $14.3 $17.2 $16.4 Taxes [2] (3.2) (3.1) (3.6) (4.3) (4.1) Discount Rate 0.00% 1.00% 2.00% Unlevered Earnings $9.5 $9.3 $10.7 $12.9 $12.3 13.00% 4.4x 4.8x 5.3x Depreciation and Amortization (Tax Basis) [1] 5.1 5.1 5.1 4.2 5.0 13.50% 4.3x 4.7x 5.1x Capital Expenditures (4.0) (5.0) (5.0) (5.0) (5.0) 14.00% 4.1x 4.5x 4.9x Change in Net Working Capital (0.5) (0.1) (0.7) (0.7) (0.7) 14.50% 4.0x 4.3x 4.7x Unlevered Free Cash Flows $10.0 $9.3 $10.1 $11.4 $11.6 15.00% 3.9x 4.2x 4.6x DCF Assumptions Present Value PV of Terminal Value Based of Cash Flows on Perpetual Growth Rate for Implied Enterprise Value (2022 - 2025) 2025 Unlevered Free Cash Flow Discount Rate 0.00% 1.00% 2.00% 0.00% 1.00% 2.00% Discount Rate 0.00% 1.00% 2.00% 13.00% $32.4 $58.9 $64.4 $71.0 $91.3 $96.9 $103.4 13.00% 64.5% 66.5% 68.7% 13.50% $32.2 $55.9 $61.0 $66.9 $88.0 $93.1 $99.1 13.50% 63.5% 65.5% 67.5% 14.00% $31.9 + $53.1 $57.7 $63.2 = $85.0 $89.6 $95.1 14.00% 62.5% 64.4% 66.4% 14.50% $31.7 $50.5 $54.8 $59.8 $82.2 $86.4 $91.4 14.50% 61.5% 63.4% 65.4% 15.00% $31.4 $48.1 $52.1 $56.6 $79.5 $83.5 $88.0 15.00% 60.5% 62.4% 64.3% PV of Terminal Value as a % of Enterprise Value Implied 2025E Adjusted EBITDA Terminal Multiple [3] 34
Page 1. Executive Summary 3 2. Preliminary Financial Analyses Summary 6 3. Preliminary Financial Observations and Analyses 12 4. Preliminary Considerations Related to Proposal 35 5. Appendices 45 6. Disclaimer 52
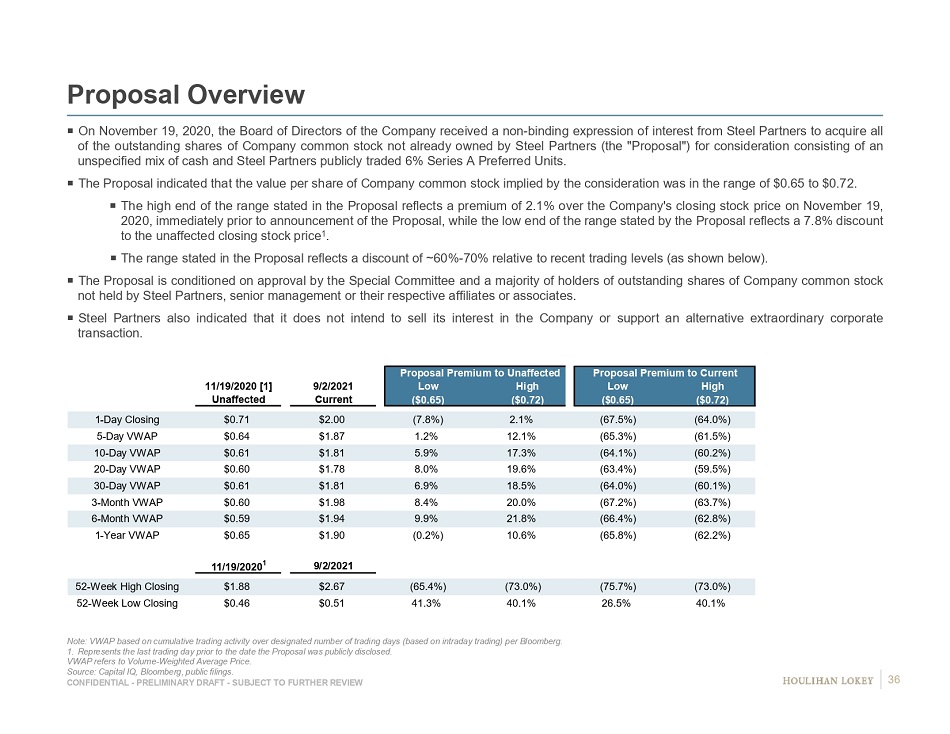
CONFIDENTIAL - PRELIMINARY DRAFT - SUBJECT TO FURTHER REVIEW Proposal Overview Note: VWAP based on cumulative trading activity over designated number of trading days (based on intraday trading) per Bloomb erg . 1. Represents the last trading day prior to the date the Proposal was publicly disclosed. VWAP refers to Volume - Weighted Average Price. Source: Capital IQ, Bloomberg, public filings. On November 19 , 2020 , the Board of Directors of the Company received a non - binding expression of interest from Steel Partners to acquire all of the outstanding shares of Company common stock not already owned by Steel Partners (the "Proposal") for consideration consisting of an unspecified mix of cash and Steel Partners publicly traded 6 % Series A Preferred Units . The Proposal indicated that the value per share of Company common stock implied by the consideration was in the range of $ 0 . 65 to $ 0 . 72 . The high end of the range stated in the Proposal reflects a premium of 2 . 1 % over the Company's closing stock price on November 19 , 2020 , immediately prior to announcement of the Proposal, while the low end of the range stated by the Proposal reflects a 7 . 8 % discount to the unaffected closing stock price 1 . The range stated in the Proposal reflects a discount of ~ 60 % - 70 % relative to recent trading levels (as shown below) . The Proposal is conditioned on approval by the Special Committee and a majority of holders of outstanding shares of Company common stock not held by Steel Partners, senior management or their respective affiliates or associates . Steel Partners also indicated that it does not intend to sell its interest in the Company or support an alternative extraordinary corporate transaction . Proposal Premium to Unaffected Proposal Premium to Current 11/19/2020 [1] 9/2/2021 Low High Low High Unaffected Current ($0.65) ($0.72) ($0.65) ($0.72) 1-Day Closing $0.71 $2.00 (7.8%) 2.1% (67.5%) (64.0%) 5-Day VWAP $0.64 $1.87 1.2% 12.1% (65.3%) (61.5%) 10-Day VWAP $0.61 $1.81 5.9% 17.3% (64.1%) (60.2%) 20-Day VWAP $0.60 $1.78 8.0% 19.6% (63.4%) (59.5%) 30-Day VWAP $0.61 $1.81 6.9% 18.5% (64.0%) (60.1%) 3-Month VWAP $0.60 $1.98 8.4% 20.0% (67.2%) (63.7%) 6-Month VWAP $0.59 $1.94 9.9% 21.8% (66.4%) (62.8%) 1-Year VWAP $0.65 $1.90 (0.2%) 10.6% (65.8%) (62.2%) 11/19/2020 1 9/2/2021 52-Week High Closing $1.88 $2.67 (65.4%) (73.0%) (75.7%) (73.0%) 52-Week Low Closing $0.46 $0.51 41.3% 40.1% 26.5% 40.1% 36
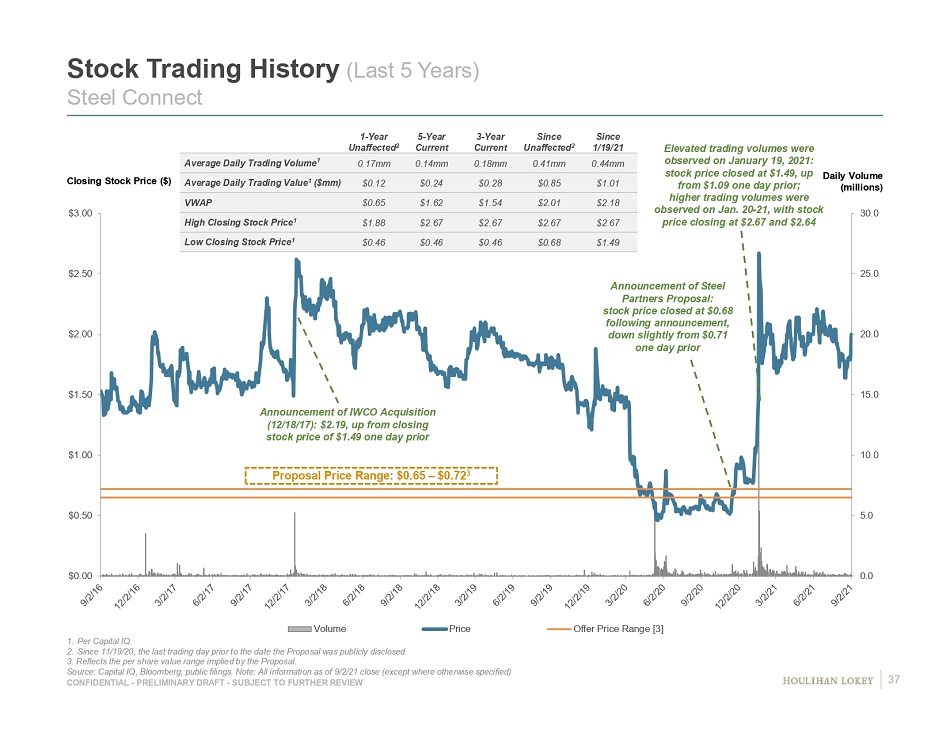
CONFIDENTIAL - PRELIMINARY DRAFT - SUBJECT TO FURTHER REVIEW 0.0 5.0 10.0 15.0 20.0 25.0 30.0 $0.00 $0.50 $1.00 $1.50 $2.00 $2.50 $3.00 Volume Price Offer Price Range [3] Daily Volume (millions) Closing Stock Price ($) 1 - Year Unaffected 2 5 - Year Current 3 - Year Current Since Unaffected 2 Since 1/19/21 Average Daily Trading Volume 1 0.17mm 0.14mm 0.18mm 0.41mm 0.44mm Average Daily Trading Value 1 ($mm) $0.12 $0.24 $0.28 $0.85 $1.01 VWAP $0.65 $1.62 $1.54 $2.01 $2.18 High Closing Stock Price 1 $1.88 $2.67 $2.67 $2.67 $2.67 Low Closing Stock Price 1 $0.46 $0.46 $0.46 $0.68 $1.49 Stock Trading History (Last 5 Years) Steel Connect 1. Per Capital IQ. 2. Since 11/19/20, the last trading day prior to the date the Proposal was publicly disclosed. 3. Reflects the per share value range implied by the Proposal. Source: Capital IQ , Bloomberg, public filings. Note: All information as of 9/2/21 close (except where otherwise specified) Proposal Price Range: $0.65 – $0.72 3 Announcement of IWCO Acquisition (12/18/17): $2.19, up from closing stock price of $1.49 one day prior Announcement of Steel Partners Proposal: stock price closed at $0.68 following announcement, down slightly from $0.71 one day prior Elevated trading volumes were observed on January 19, 2021: stock price closed at $1.49, up from $1.09 one day prior; higher trading volumes were observed on Jan. 20 - 21, with stock price closing at $2.67 and $2.64 37
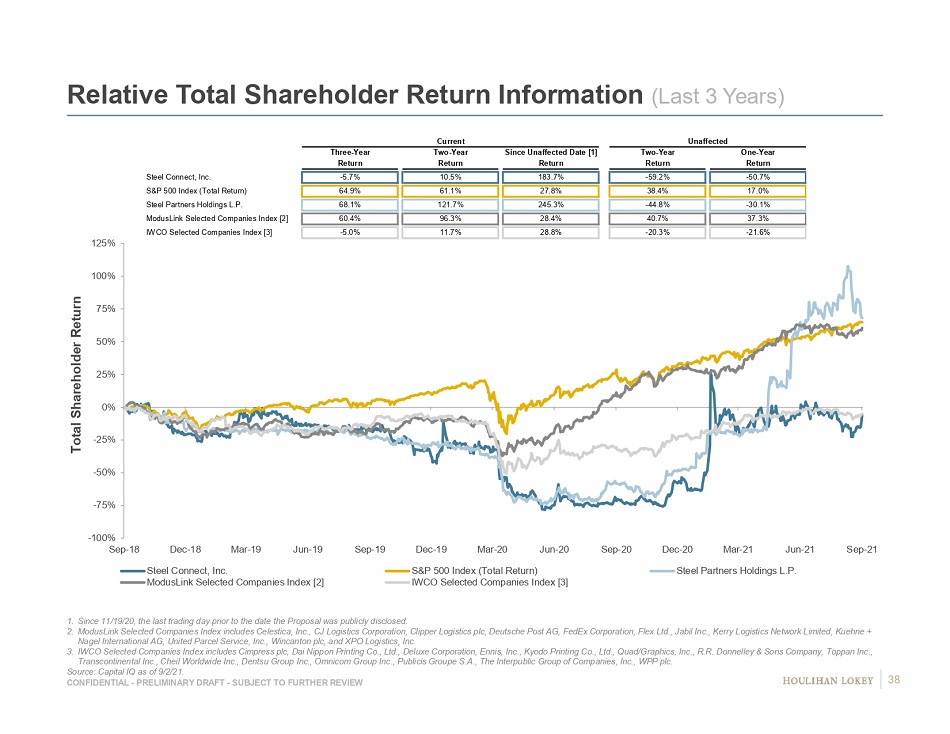
CONFIDENTIAL - PRELIMINARY DRAFT - SUBJECT TO FURTHER REVIEW Relative Total Shareholder Return Information (Last 3 Years) 1. Since 11/19/20, the last trading day prior to the date the Proposal was publicly disclosed. 2. ModusLink Selected Companies Index includes Celestica, Inc., CJ Logistics Corporation, Clipper Logistics plc, Deutsche Post A G, FedEx Corporation, Flex Ltd., Jabil Inc., Kerry Logistics Network Limited, Kuehne + Nagel International AG, United Parcel Service, Inc., Wincanton plc, and XPO Logistics, Inc. 3. IWCO Selected Companies Index includes Cimpress plc, Dai Nippon Printing Co., Ltd., Deluxe Corporation, Ennis, Inc., Kyodo Pr int ing Co., Ltd., Quad/Graphics, Inc., R.R. Donnelley & Sons Company, Toppan Inc., Transcontinental Inc., Cheil Worldwide Inc., Dentsu Group Inc., Omnicom Group Inc., Publicis Groupe S.A., The Interpublic Gro up of Companies, Inc., WPP plc. Source: Capital IQ as of 9/2/21. Total Shareholder Return -100% -75% -50% -25% 0% 25% 50% 75% 100% 125% Sep-18 Dec-18 Mar-19 Jun-19 Sep-19 Dec-19 Mar-20 Jun-20 Sep-20 Dec-20 Mar-21 Jun-21 Sep-21 Steel Connect, Inc. S&P 500 Index (Total Return) Steel Partners Holdings L.P. ModusLink Selected Companies Index [2] IWCO Selected Companies Index [3] Current Unaffected Three-Year Two-Year Since Unaffected Date [1] Two-Year One-Year Return Return Return Return Return Steel Connect, Inc. -5.7% 10.5% 183.7% -59.2% -50.7% S&P 500 Index (Total Return) 64.9% 61.1% 27.8% 38.4% 17.0% Steel Partners Holdings L.P. 68.1% 121.7% 245.3% -44.8% -30.1% ModusLink Selected Companies Index [2] 60.4% 96.3% 28.4% 40.7% 37.3% IWCO Selected Companies Index [3] -5.0% 11.7% 28.8% -20.3% -21.6% 38
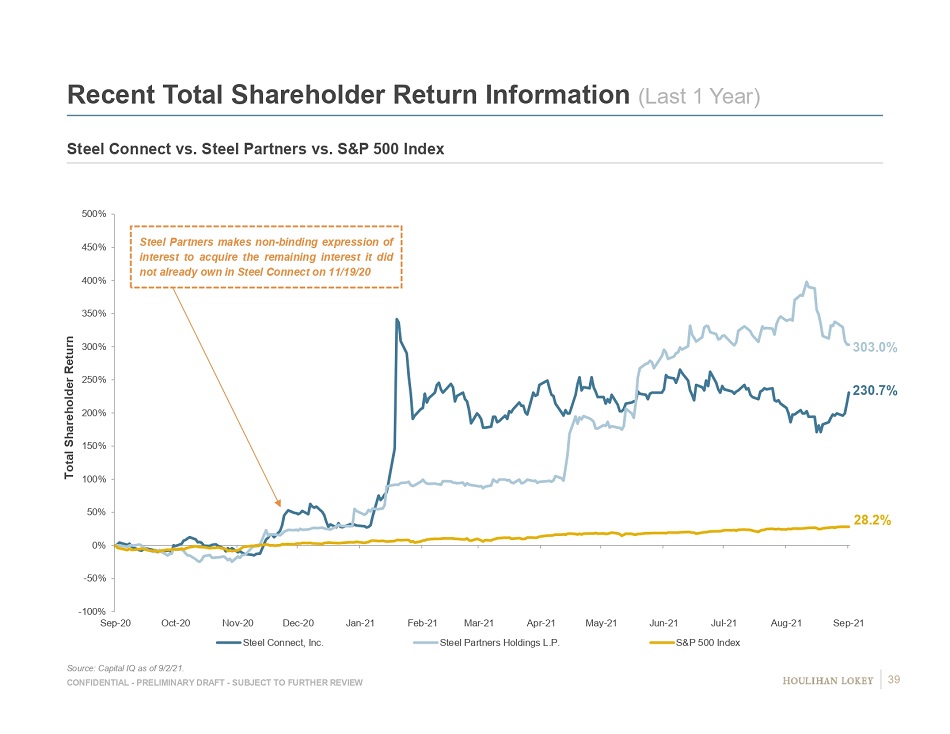
CONFIDENTIAL - PRELIMINARY DRAFT - SUBJECT TO FURTHER REVIEW -100% -50% 0% 50% 100% 150% 200% 250% 300% 350% 400% 450% 500% Sep-20 Oct-20 Nov-20 Dec-20 Jan-21 Feb-21 Mar-21 Apr-21 May-21 Jun-21 Jul-21 Aug-21 Sep-21 Steel Connect, Inc. Steel Partners Holdings L.P. S&P 500 Index Recent Total Shareholder Return Information (Last 1 Year) Source: Capital IQ as of 9/2/21. Steel Connect vs. Steel Partners vs. S&P 500 Index Total Shareholder Return Steel Partners makes non - binding expression of interest to acquire the remaining interest it did not already own in Steel Connect on 11 / 19 / 20 230.7% 28.2% 303.0% 39
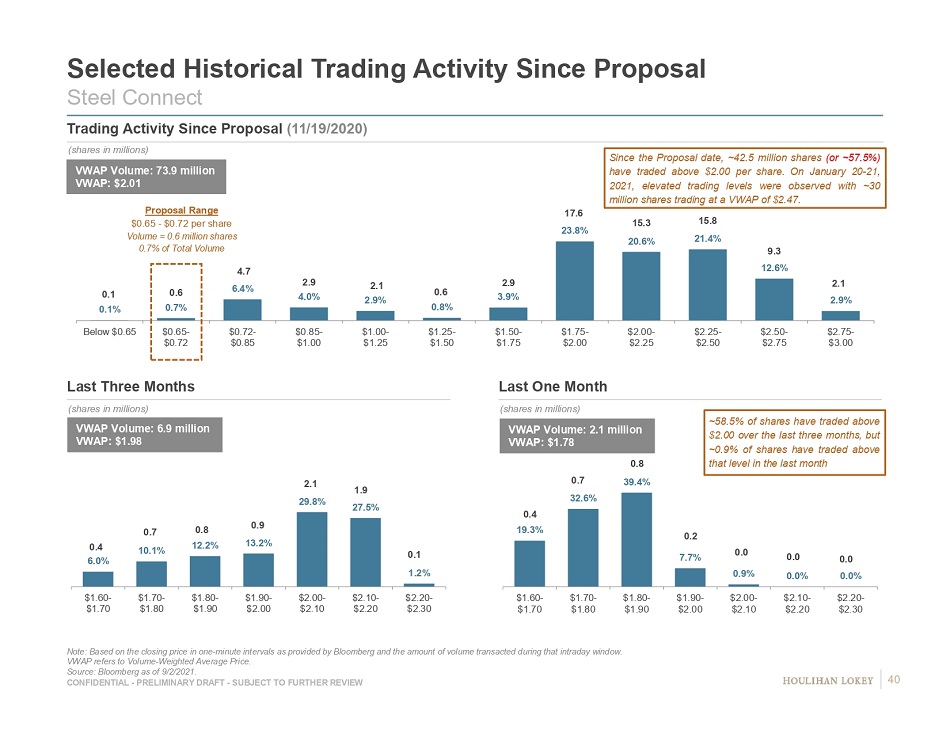
CONFIDENTIAL - PRELIMINARY DRAFT - SUBJECT TO FURTHER REVIEW 19.3% 32.6% 39.4% 7.7% 0.9% 0.0% 0.0% 0.4 0.7 0.8 0.2 0.0 0.0 0.0 $1.60- $1.70 $1.70- $1.80 $1.80- $1.90 $1.90- $2.00 $2.00- $2.10 $2.10- $2.20 $2.20- $2.30 6.0% 10.1% 12.2% 13.2% 29.8% 27.5% 1.2% 0.4 0.7 0.8 0.9 2.1 1.9 0.1 $1.60- $1.70 $1.70- $1.80 $1.80- $1.90 $1.90- $2.00 $2.00- $2.10 $2.10- $2.20 $2.20- $2.30 0.1% 0.7% 6.4% 4.0% 2.9% 0.8% 3.9% 23.8% 20.6% 21.4% 12.6% 2.9% 0.1 0.6 4.7 2.9 2.1 0.6 2.9 17.6 15.3 15.8 9.3 2.1 Below $0.65 $0.65- $0.72 $0.72- $0.85 $0.85- $1.00 $1.00- $1.25 $1.25- $1.50 $1.50- $1.75 $1.75- $2.00 $2.00- $2.25 $2.25- $2.50 $2.50- $2.75 $2.75- $3.00 Selected Historical Trading Activity Since Proposal Steel Connect Note: Based on the closing price in one - minute intervals as provided by Bloomberg and the amount of volume transacted during tha t intraday window. VWAP refers to Volume - Weighted Average Price. Source: Bloomberg as of 9/2/2021. Trading Activity Since Proposal (11/19/2020) Proposal Range $0.65 - $0.72 per share Volume = 0.6 million shares 0.7% of Total Volume VWAP Volume: 73.9 million VWAP: $2.01 Last Three Months Last One Month VWAP Volume: 6.9 million VWAP: $1.98 Since the Proposal date, ~ 42 . 5 million shares (or ~ 57 . 5 % ) have traded above $ 2 . 00 per share . On January 20 - 21 , 2021 , elevated trading levels were observed with ~ 30 million shares trading at a VWAP of $ 2 . 47 . VWAP Volume: 2.1 million VWAP: $1.78 (shares in millions) (shares in millions) (shares in millions) ~ 58 . 5 % of shares have traded above $ 2 . 00 over the last three months, but ~ 0 . 9 % of shares have traded above that level in the last month 40
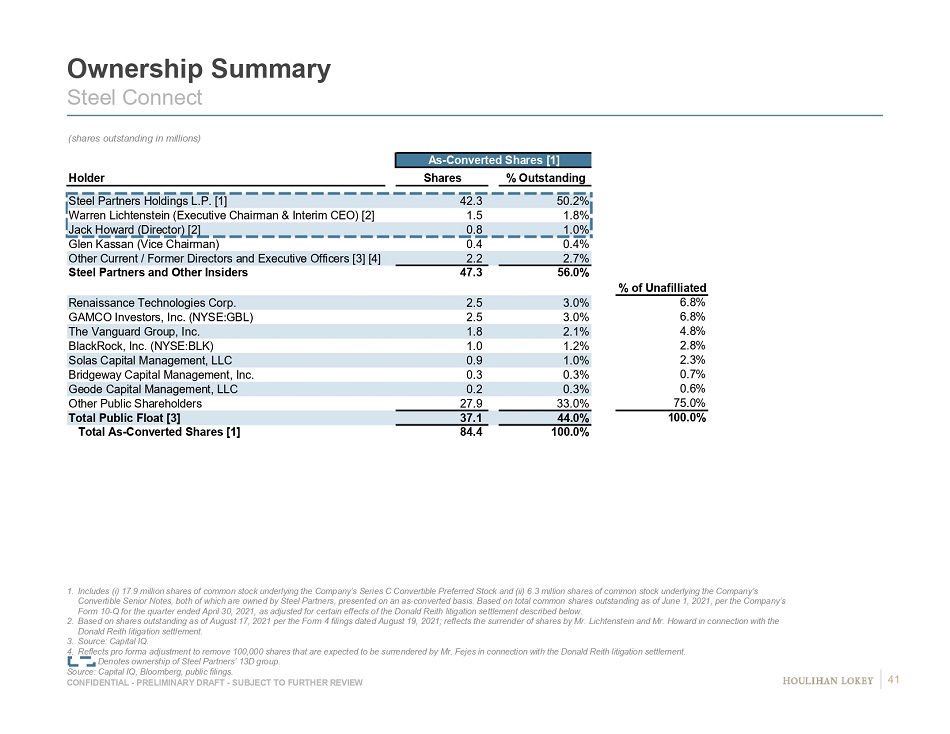
CONFIDENTIAL - PRELIMINARY DRAFT - SUBJECT TO FURTHER REVIEW Ownership Summary Steel Connect 1. Includes (i) 17.9 million shares of common stock underlying the Company’s Series C Convertible Preferred Stock and (ii) 6.3 m ill ion shares of common stock underlying the Company’s Convertible Senior Notes, both of which are owned by Steel Partners, presented on an as - converted basis. Based on total common s hares outstanding as of June 1, 2021, per the Company’s Form 10 - Q for the quarter ended April 30, 2021, as adjusted for certain effects of the Donald Reith litigation settlement descri bed below. 2. Based on shares outstanding as of August 17, 2021 per the Form 4 filings dated August 19, 2021; reflects the surrender of sha res by Mr. Lichtenstein and Mr. Howard in connection with the Donald Reith litigation settlement. 3. Source: Capital IQ. 4. Reflects pro forma adjustment to remove 100,000 shares that are expected to be surrendered by Mr. Fejes in connection with th e D onald Reith litigation settlement. Denotes ownership of Steel Partners’ 13D group. Source: Capital IQ, Bloomberg, public filings. (shares outstanding in millions) As-Converted Shares [1] Holder Shares % Outstanding Steel Partners Holdings L.P. [1] 42.3 50.2% Warren Lichtenstein (Executive Chairman & Interim CEO) [2] 1.5 1.8% Jack Howard (Director) [2] 0.8 1.0% Glen Kassan (Vice Chairman) 0.4 0.4% Other Current / Former Directors and Executive Officers [3] [4] 2.2 2.7% Steel Partners and Other Insiders 47.3 56.0% Renaissance Technologies Corp. 2.5 3.0% 6.8% GAMCO Investors, Inc. (NYSE:GBL) 2.5 3.0% 6.8% The Vanguard Group, Inc. 1.8 2.1% 4.8% BlackRock, Inc. (NYSE:BLK) 1.0 1.2% 2.8% Solas Capital Management, LLC 0.9 1.0% 2.3% Bridgeway Capital Management, Inc. 0.3 0.3% 0.7% Geode Capital Management, LLC 0.2 0.3% 0.6% Other Public Shareholders 27.9 33.0% 75.0% Total Public Float [3] 37.1 44.0% 100.0% Total As-Converted Shares [1] 84.4 100.0% % of Unafilliated 41
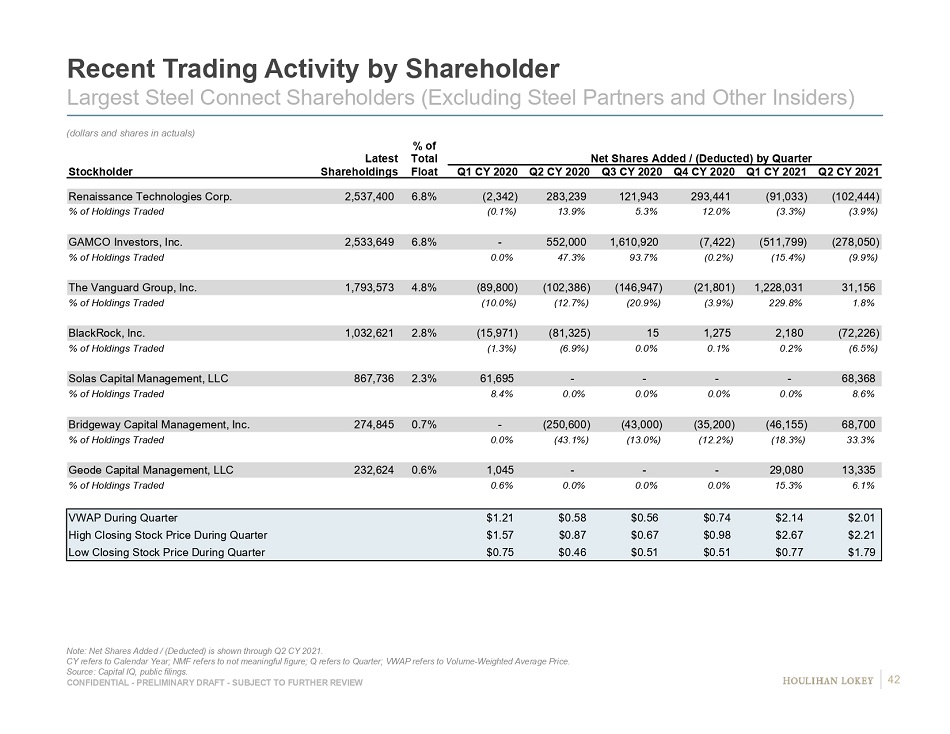
CONFIDENTIAL - PRELIMINARY DRAFT - SUBJECT TO FURTHER REVIEW Recent Trading Activity by Shareholder Largest Steel Connect Shareholders (Excluding Steel Partners and Other Insiders) Note: Net Shares Added / (Deducted) is shown through Q2 CY 2021. CY refers to Calendar Year; NMF refers to not meaningful figure; Q refers to Quarter; VWAP refers to Volume - Weighted Average Pri ce. Source: Capital IQ, public filings. (dollars and shares in actuals) % of Latest Total Net Shares Added / (Deducted) by Quarter Stockholder Shareholdings Float Q1 CY 2020 Q2 CY 2020 Q3 CY 2020 Q4 CY 2020 Q1 CY 2021 Q2 CY 2021 Renaissance Technologies Corp. 2,537,400 6.8% (2,342) 283,239 121,943 293,441 (91,033) (102,444) % of Holdings Traded (0.1%) 13.9% 5.3% 12.0% (3.3%) (3.9%) GAMCO Investors, Inc. 2,533,649 6.8% - 552,000 1,610,920 (7,422) (511,799) (278,050) % of Holdings Traded 0.0% 47.3% 93.7% (0.2%) (15.4%) (9.9%) The Vanguard Group, Inc. 1,793,573 4.8% (89,800) (102,386) (146,947) (21,801) 1,228,031 31,156 % of Holdings Traded (10.0%) (12.7%) (20.9%) (3.9%) 229.8% 1.8% BlackRock, Inc. 1,032,621 2.8% (15,971) (81,325) 15 1,275 2,180 (72,226) % of Holdings Traded (1.3%) (6.9%) 0.0% 0.1% 0.2% (6.5%) Solas Capital Management, LLC 867,736 2.3% 61,695 - - - - 68,368 % of Holdings Traded 8.4% 0.0% 0.0% 0.0% 0.0% 8.6% Bridgeway Capital Management, Inc. 274,845 0.7% - (250,600) (43,000) (35,200) (46,155) 68,700 % of Holdings Traded 0.0% (43.1%) (13.0%) (12.2%) (18.3%) 33.3% Geode Capital Management, LLC 232,624 0.6% 1,045 - - - 29,080 13,335 % of Holdings Traded 0.6% 0.0% 0.0% 0.0% 15.3% 6.1% VWAP During Quarter $1.21 $0.58 $0.56 $0.74 $2.14 $2.01 High Closing Stock Price During Quarter $1.57 $0.87 $0.67 $0.98 $2.67 $2.21 Low Closing Stock Price During Quarter $0.75 $0.46 $0.51 $0.51 $0.77 $1.79 42
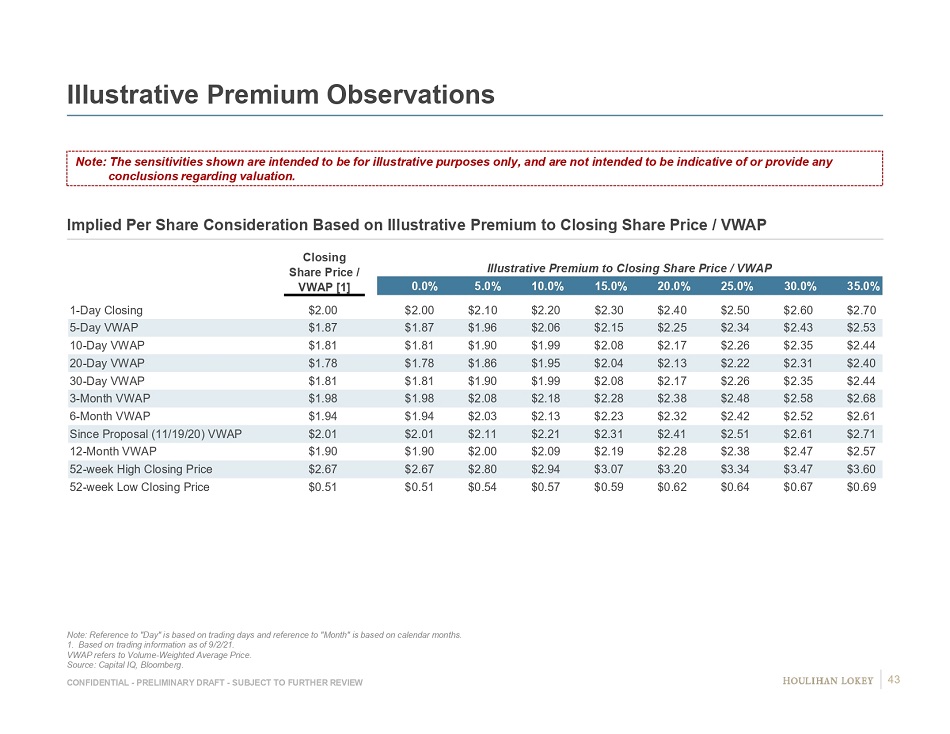
CONFIDENTIAL - PRELIMINARY DRAFT - SUBJECT TO FURTHER REVIEW Illustrative Premium Observations Implied Per Share Consideration Based on Illustrative Premium to Closing Share Price / VWAP Note: Reference to "Day" is based on trading days and reference to "Month" is based on calendar months. 1. Based on trading information as of 9/2/21. VWAP refers to Volume - Weighted Average Price. Source: Capital IQ, Bloomberg. 43 0.0% 5.0% 10.0% 15.0% 20.0% 25.0% 30.0% 35.0% 1-Day Closing $2.00 $2.00 $2.10 $2.20 $2.30 $2.40 $2.50 $2.60 $2.70 5-Day VWAP $1.87 $1.87 $1.96 $2.06 $2.15 $2.25 $2.34 $2.43 $2.53 10-Day VWAP $1.81 $1.81 $1.90 $1.99 $2.08 $2.17 $2.26 $2.35 $2.44 20-Day VWAP $1.78 $1.78 $1.86 $1.95 $2.04 $2.13 $2.22 $2.31 $2.40 30-Day VWAP $1.81 $1.81 $1.90 $1.99 $2.08 $2.17 $2.26 $2.35 $2.44 3-Month VWAP $1.98 $1.98 $2.08 $2.18 $2.28 $2.38 $2.48 $2.58 $2.68 6-Month VWAP $1.94 $1.94 $2.03 $2.13 $2.23 $2.32 $2.42 $2.52 $2.61 Since Proposal (11/19/20) VWAP $2.01 $2.01 $2.11 $2.21 $2.31 $2.41 $2.51 $2.61 $2.71 12-Month VWAP $1.90 $1.90 $2.00 $2.09 $2.19 $2.28 $2.38 $2.47 $2.57 52-week High Closing Price $2.67 $2.67 $2.80 $2.94 $3.07 $3.20 $3.34 $3.47 $3.60 52-week Low Closing Price $0.51 $0.51 $0.54 $0.57 $0.59 $0.62 $0.64 $0.67 $0.69 Illustrative Premium to Closing Share Price / VWAP Closing Share Price / VWAP [1] Note: The sensitivities shown are intended to be for illustrative purposes only, and are not intended to be indicative of or pro vide any conclusions regarding valuation.

CONFIDENTIAL - PRELIMINARY DRAFT - SUBJECT TO FURTHER REVIEW Preliminary Overview of Potential Alternatives □ Certain potential alternatives to a transaction with Steel Partners include but are not limited to the following: » Status Quo » Sale of one or both businesses to one or more third - parties » Recapitalization » Acquisitions » Share Repurchases / Dividends □ Preliminary considerations related to certain alternatives include but are not limited to the following: » Steel Partners has indicated that it does not intend to sell its holdings of Company common stock or vote in favor of any alt ern ative sale, merger or similar transaction involving the Company » Universe of potential buyers for Steel Connect likely to be limited given that IWCO and ModusLink are distinct businesses wit h l ittle to no overlap in business models, services provided, customers served and end markets » Steel Connect has been exploring the potential sale of the ModusLink business for several years (including via broad market o utr each in early 2019 and a follow - on process in early 2020), but has not received any proposals above $60 million 1 » IWCO faces refinancing risk related to ~$365 million of debt that matures in December 2022 – the business has faced significant headwinds over the last 1 - 2 years due to secular industry challenges, departures of key management and sales personnel, and resulting cust omer attrition and volume reductions. IWCO has launched a “competitive improvement plan” to stabilize the business, but its exist ing capital structure may present challenges to operating flexibility and ability to effectuate a strategic repositioning towards digital an d omni - channel offerings » The Company has been in discussions with lenders regarding an amendment and maturity extension to its term loan facility at I WCO , but has not yet reached an agreement » The Company has limited ability to support incremental leverage to facilitate potential acquisitions or capital return opport uni ties (i.e., stock buybacks, dividends, etc.) and has not made material distributions to common stockholders or engaged in a material stock buyb ack since 2011 1. Documentation of $60 million subject to confirmation. Source: SC, IWCO and ML managements, advisors. 44
Page 1. Executive Summary 3 2. Preliminary Financial Analyses Summary 6 3. Preliminary Financial Observations and Analyses 12 4. Preliminary Considerations Related to Proposal 35 5. Appendices 45 Supplemental Financial Analysis Schedules 46 Form of Consideration Observations 48 6. Disclaimer 52
Page 1. Executive Summary 3 2. Preliminary Financial Analyses Summary 6 3. Preliminary Financial Observations and Analyses 12 4. Preliminary Considerations Related to Proposal 35 5. Appendices 45 Supplemental Financial Analysis Schedules 46 Form of Consideration Observations 48 6. Disclaimer 52

CONFIDENTIAL - PRELIMINARY DRAFT - SUBJECT TO FURTHER REVIEW Present Value of Corporate Costs Note: Present values as of 9/9/21; mid - year convention applied. Discount Rate range informed by 11% to 13% discount rate range u sed for IWCO and 13% to 15% discount rate range used for ModusLink. 1. Includes salary and wages for employees at Steel Connect (primarily related to corporate accounting and audit work) as wel l a s Steel Partners shared services fee, which reflects salaries of Steel Partners employees based on allocation of time for functions performed for the benefit of Steel Connect. 2. Includes legal fees, investor relations fees, and stock market fees, among other professional fees. E refers to Estimated. Source: SC management, SC Projections. (dollars in millions) Projected Fiscal Year Ending July 31, 2022E 2023E 2024E 2025E Management Salary and Wages [1] ($3.7) ($3.7) ($3.7) ($3.8) Board Fees ($1.1) ($1.1) ($1.2) ($1.2) Other Professional Fees [2] ($1.5) ($1.5) ($1.6) ($1.6) Tax and Other Expenses ($0.8) ($0.8) ($0.8) ($0.8) Total Corporate Operating Expenses ($7.1) ($7.2) ($7.3) ($7.4) Taxes @ 26.0% $1.8 $1.9 $1.9 $1.9 Tax-Effected Corporate Expenses ($5.3) ($5.3) ($5.4) ($5.4) Present Value PV of Terminal Value Based of Cash Flows on Perpetual Growth Rate for (2022 - 2025) 2025 Tax-Effected Corporate Expenses Discount Rate 0.00% 1.00% 2.00% 0.00% 1.00% 2.00% 11.00% ($17.6) ($34.8) ($38.6) ($43.3) ($52.4) ($56.3) ($61.0) 12.00% ($17.4) ($30.9) ($34.1) ($37.8) ($48.3) ($51.4) ($55.2) 13.00% ($17.1) + ($27.7) ($30.3) ($33.4) = ($44.8) ($47.4) ($50.5) 14.50% ($16.7) ($23.7) ($25.8) ($28.1) ($40.4) ($42.5) ($44.8) 15.00% ($16.6) ($22.6) ($24.5) ($26.6) ($39.2) ($41.0) ($43.2) Implied Present Value of Tax-Effected Corporate Expenses 47
Page 1. Executive Summary 3 2. Preliminary Financial Analyses Summary 6 3. Preliminary Financial Observations and Analyses 12 4. Preliminary Considerations Related to Proposal 35 5. Appendices 45 Supplemental Financial Analysis Schedules 46 Form of Consideration Observations 48 6. Disclaimer 52
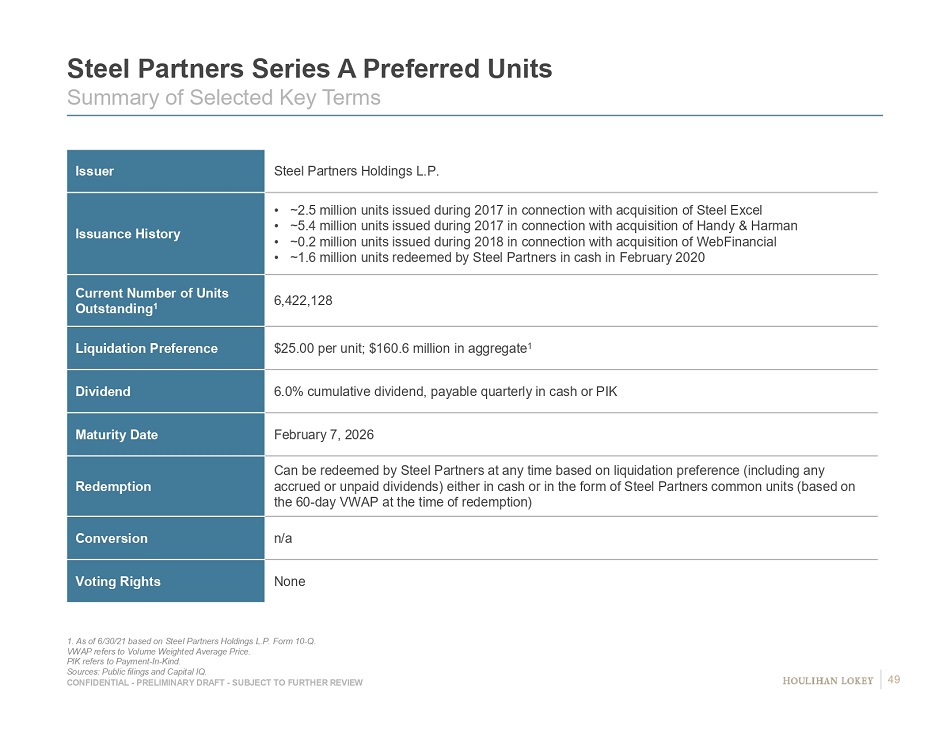
CONFIDENTIAL - PRELIMINARY DRAFT - SUBJECT TO FURTHER REVIEW Steel Partners Series A Preferred Units Summary of Selected Key Terms 1. As of 6/30/21 based on Steel Partners Holdings L.P. Form 10 - Q. VWAP refers to Volume Weighted Average Price. PIK refers to Payment - In - Kind. Sources: Public filings and Capital IQ. Issuer Steel Partners Holdings L.P. Issuance History • ~2.5 million units issued during 2017 in connection with acquisition of Steel Excel • ~5.4 million units issued during 2017 in connection with acquisition of Handy & Harman • ~0.2 million units issued during 2018 in connection with acquisition of WebFinancial • ~1.6 million units redeemed by Steel Partners in cash in February 2020 Current Number of Units Outstanding 1 6,422,128 Liquidation Preference $25.00 per unit; $160.6 million in aggregate 1 Dividend 6.0% cumulative dividend, payable quarterly in cash or PIK Maturity Date February 7, 2026 Redemption Can be redeemed by Steel Partners at any time based on liquidation preference (including any accrued or unpaid dividends) either in cash or in the form of Steel Partners common units (based on the 60 - day VWAP at the time of redemption) Conversion n/a Voting Rights None 49
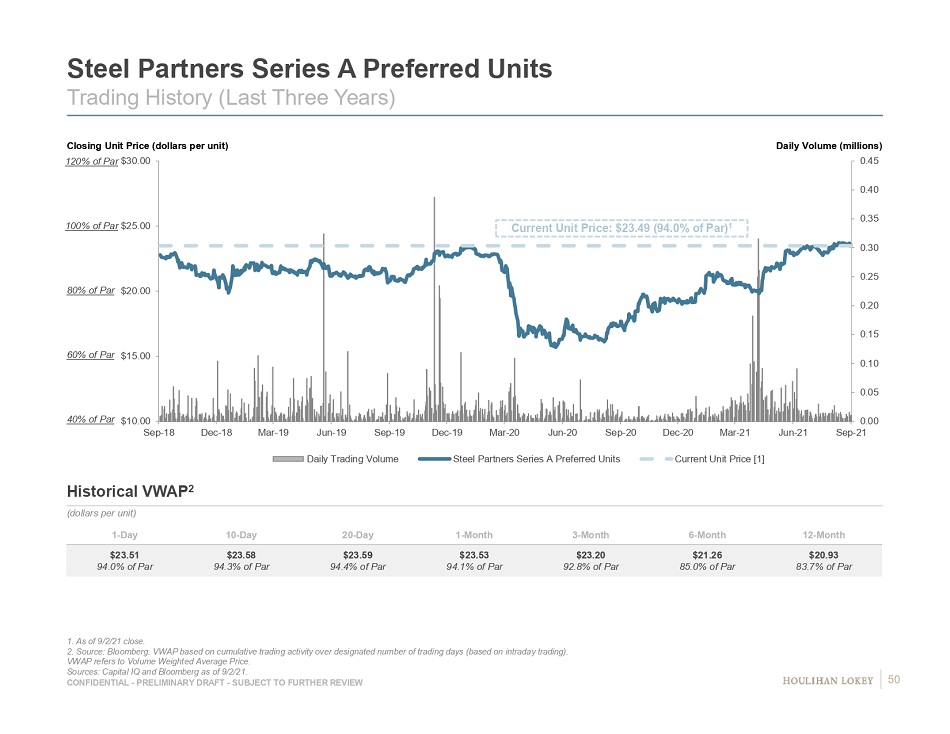
CONFIDENTIAL - PRELIMINARY DRAFT - SUBJECT TO FURTHER REVIEW 0.00 0.05 0.10 0.15 0.20 0.25 0.30 0.35 0.40 0.45 $10.00 $15.00 $20.00 $25.00 $30.00 Sep-18 Dec-18 Mar-19 Jun-19 Sep-19 Dec-19 Mar-20 Jun-20 Sep-20 Dec-20 Mar-21 Jun-21 Sep-21 Daily Trading Volume Steel Partners Series A Preferred Units Current Unit Price [1] Closing Unit Price (dollars per unit ) Daily Volume (millions) Steel Partners Series A Preferred Units Trading History (Last Three Years) 1. As of 9/2/21 close. 2. Source: Bloomberg. VWAP based on cumulative trading activity over designated number of trading days (based on intraday tra din g). VWAP refers to Volume Weighted Average Price. Sources: Capital IQ and Bloomberg as of 9/2/21. Current Unit Price: $23.49 (94.0% of Par) 1 1 - Day 10 - Day 20 - Day 1 - Month 3 - Month 6 - Month 12 - Month $23.51 94.0% of Par $23.58 94.3% of Par $23.59 94.4% of Par $23.53 94.1% of Par $23.20 92.8% of Par $21.26 85.0% of Par $20.93 83.7% of Par (dollars per unit) Historical VWAP 2 120% of Par 100% of Par 80% of Par 60% of Par 40% of Par 50
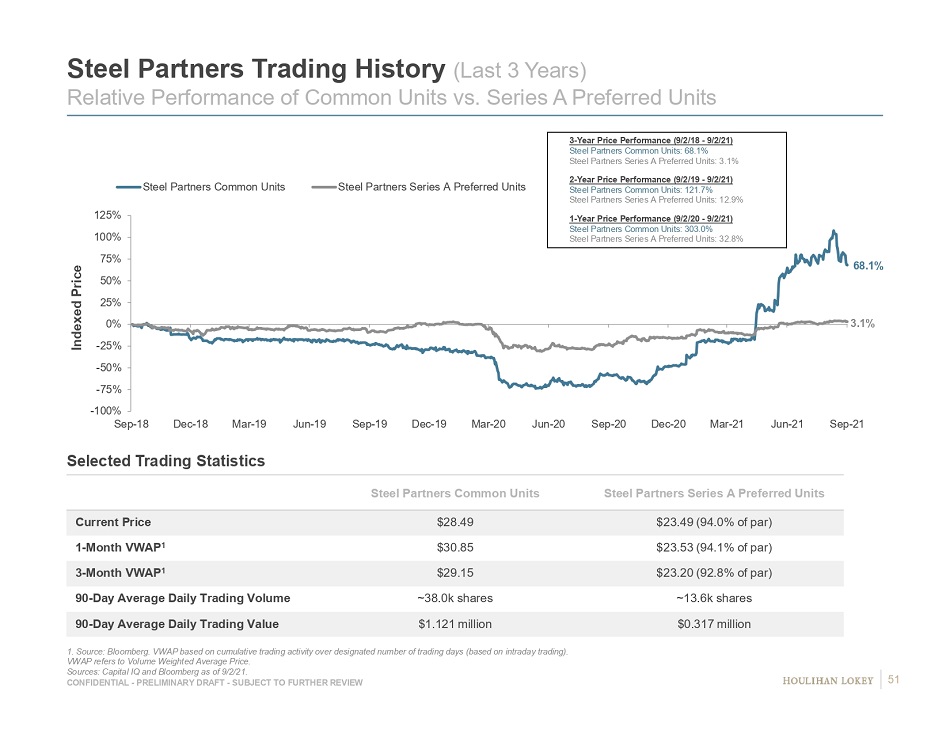
CONFIDENTIAL - PRELIMINARY DRAFT - SUBJECT TO FURTHER REVIEW Steel Partners Trading History (Last 3 Years) Relative Performance of Common Units vs. Series A Preferred Units 1. Source: Bloomberg. VWAP based on cumulative trading activity over designated number of trading days (based on intraday tra din g). VWAP refers to Volume Weighted Average Price. Sources: Capital IQ and Bloomberg as of 9/2/21. -100% -75% -50% -25% 0% 25% 50% 75% 100% 125% Sep-18 Dec-18 Mar-19 Jun-19 Sep-19 Dec-19 Mar-20 Jun-20 Sep-20 Dec-20 Mar-21 Jun-21 Sep-21 Steel Partners Common Units Steel Partners Series A Preferred Units Selected Trading Statistics Steel Partners Common Units Steel Partners Series A Preferred Units Current Price $28.49 $23.49 (94.0% of par) 1 - Month VWAP 1 $30.85 $23.53 (94.1% of par) 3 - Month VWAP 1 $29.15 $23.20 (92.8% of par) 90 - Day Average Daily Trading Volume ~38.0k shares ~13.6k shares 90 - Day Average Daily Trading Value $1.121 million $0.317 million Indexed Price 68.1% 3.1% 3-Year Price Performance (9/2/18 - 9/2/21) Steel Partners Common Units: 68.1% Steel Partners Series A Preferred Units: 3.1% 2-Year Price Performance (9/2/19 - 9/2/21) Steel Partners Common Units: 121.7% Steel Partners Series A Preferred Units: 12.9% 1-Year Price Performance (9/2/20 - 9/2/21) Steel Partners Common Units: 303.0% Steel Partners Series A Preferred Units: 32.8% 51
Page 1. Executive Summary 3 2. Preliminary Financial Analyses Summary 6 3. Preliminary Financial Observations and Analyses 12 4. Preliminary Considerations Related to Proposal 35 5. Appendices 45 6. Disclaimer 52

CONFIDENTIAL - PRELIMINARY DRAFT - SUBJECT TO FURTHER REVIEW This presentation, and any supplemental information (written or oral) or other documents provided in connection therewith (collectively, the “materials”), are provided solely for the information of the Special Committee (the “Committee”) of the Board of Directors (the “Board”) of Steel Connect, Inc . (the “Company”) by Houlihan Lokey in connection with the Committee’s consideration of a potential transaction (the “Transaction”) involving the Company . This presentation is incomplete without reference to, and should be considered in conjunction with, any supplemental information provided by and discussions with Houlihan Lokey in connection therewith . Any defined terms used herein shall have the meanings set forth herein, even if such defined terms have been given different meanings elsewhere in the materials . The materials are for discussion purposes only . Houlihan Lokey expressly disclaims any and all liability, whether direct or indirect, in contract or tort or otherwise, to any person in connection with the materials . The materials were prepared for specific persons familiar with the business and affairs of the Company for use in a specific context and were not prepared with a view to public disclosure or to conform with any disclosure standards under any state, federal or international securities laws or other laws, rules or regulations, and none of the Committee, the Company or Houlihan Lokey takes any responsibility for the use of the materials by persons other than the Committee . The materials are provided on a confidential basis solely for the information of the Committee and may not be disclosed, summarized, reproduced, disseminated or quoted or otherwise referred to, in whole or in part, without Houlihan Lokey’s express prior written consent . Notwithstanding any other provision herein, the Company (and each employee, representative or other agent of the Company) may disclose to any and all persons without limitation of any kind, the tax treatment and tax structure of any transaction and all materials of any kind (including opinions or other tax analyses, if any) that are provided to the Company relating to such tax treatment and structure . However, any information relating to the tax treatment and tax structure shall remain confidential (and the foregoing sentence shall not apply) to the extent necessary to enable any person to comply with securities laws . For this purpose, the tax treatment of a transaction is the purported or claimed U . S . income or franchise tax treatment of the transaction and the tax structure of a transaction is any fact that may be relevant to understanding the purported or claimed U . S . income or franchise tax treatment of the transaction . If the Company plans to disclose information pursuant to the first sentence of this paragraph, the Company shall inform those to whom it discloses any such information that they may not rely upon such information for any purpose without Houlihan Lokey’s prior written consent . Houlihan Lokey is not an expert on, and nothing contained in the materials should be construed as advice with regard to, legal, accounting, regulatory, insurance, tax or other specialist matters . Houlihan Lokey’s role in reviewing any information was limited solely to performing such a review as it deemed necessary to support its own advice and analysis and was not on behalf of the Committee . The materials necessarily are based on financial, economic, market and other conditions as in effect on, and the information available to Houlihan Lokey as of, the date of the materials . Although subsequent developments may affect the contents of the materials, Houlihan Lokey has not undertaken, and is under no obligation, to update, revise or reaffirm the materials, except as may be expressly contemplated by Houlihan Lokey’s engagement letter . The materials are not intended to provide the sole basis for evaluation of the Transaction and do not purport to contain all information that may be required . The materials do not address the underlying business decision of the Company or any other party to proceed with or effect the Transaction, or the relative merits of the Transaction as compared to any alternative business strategies or transactions that might be available for the Company or any other party . The materials do not constitute any opinion, nor do the materials constitute a recommendation to the Board, the Committee, the Company, any security holder of the Company or any other party as to how to vote or act with respect to any matter relating to the Transaction or otherwise or whether to buy or sell any assets or securities of any company . Houlihan Lokey’s only opinion is the opinion, if any, that is actually delivered to the Committee . In preparing the materials Houlihan Lokey has acted as an independent contractor and nothing in the materials is intended to create or shall be construed as creating a fiduciary or other relationship between Houlihan Lokey and any party . The materials may not reflect information known to other professionals in other business areas of Houlihan Lokey and its affiliates . The preparation of the materials was a complex process involving quantitative and qualitative judgments and determinations with respect to the financial, comparative and other analytic methods employed and the adaption and application of these methods to the unique facts and circumstances presented and, therefore, is not readily susceptible to partial analysis or summary description . Furthermore, Houlihan Lokey did not attribute any particular weight to any analysis or factor considered by it, but rather made qualitative judgments as to the significance and relevance of each analysis and factor . Each analytical technique has inherent strengths and weaknesses, and the nature of the available information may further affect the value of particular techniques . Accordingly, the analyses contained in the materials must be considered as a whole . Selecting portions of the analyses, analytic methods and factors without considering all analyses and factors could create a misleading or incomplete view . The materials reflect judgments and assumptions with regard to industry performance, general business, economic, regulatory, market and financial conditions and other matters, many of which are beyond the control of the participants in the Transaction . Any estimates of value contained in the materials are not necessarily indicative of actual value or predictive of future results or values, which may be significantly more or less favorable . Any analyses relating to the value of assets, businesses or securities do not purport to be appraisals or to reflect the prices at which any assets, businesses or securities may actually be sold . The materials do not constitute a valuation opinion or credit rating . The materials do not address the consideration to be paid or received in, the terms of any arrangements, understandings, agreements or documents related to, or the form, structure or any other portion or aspect of, the Transaction or otherwise . Furthermore, the materials do not address the fairness of any portion or aspect of the Transaction to any party . In preparing the materials, Houlihan Lokey has not conducted any physical inspection or independent appraisal or evaluation of any of the assets, properties or liabilities (contingent or otherwise) of the Company or any other party and has no obligation to evaluate the solvency of the Company or any other party under any law . Disclaimer 53
CONFIDENTIAL - PRELIMINARY DRAFT - SUBJECT TO FURTHER REVIEW All budgets, projections, estimates, financial analyses, reports and other information with respect to operations (including estimates of potential cost savings and expenses) reflected in the materials have been prepared by management of the relevant party or are derived from such budgets, projections, estimates, financial analyses, reports and other information or from other sources, which involve numerous and significant subjective determinations made by management of the relevant party and/or which such management has reviewed and found reasonable . The budgets, projections and estimates (including, without limitation, estimates of potential cost savings and synergies) contained in the materials may or may not be achieved and differences between projected results and those actually achieved may be material . Houlihan Lokey has relied upon representations made by management of the Company and other participants in the Transaction that such budgets, projections and estimates have been reasonably prepared in good faith on bases reflecting the best currently available estimates and judgments of such management (or, with respect to information obtained from public sources, represent reasonable estimates), and Houlihan Lokey expresses no opinion with respect to such budgets, projections or estimates or the assumptions on which they are based . The scope of the financial analysis contained herein is based on discussions with the Company (including, without limitation, regarding the methodologies to be utilized), and Houlihan Lokey does not make any representation, express or implied, as to the sufficiency or adequacy of such financial analysis or the scope thereof for any particular purpose . Houlihan Lokey has assumed and relied upon the accuracy and completeness of the financial and other information provided to, discussed with or reviewed by it without (and without assuming responsibility for) independent verification of such information, makes no representation or warranty (express or implied) in respect of the accuracy or completeness of such information and has further relied upon the assurances of the Company and other participants in the Transaction that they are not aware of any facts or circumstances that would make such information inaccurate or misleading . In addition, Houlihan Lokey has relied upon and assumed, without independent verification, that there has been no change in the business, assets, liabilities, financial condition, results of operations, cash flows or prospects of the Company or any other participant in the Transaction since the respective dates of the most recent financial statements and other information, financial or otherwise, provided to, discussed with or reviewed by Houlihan Lokey that would be material to its analyses, and that the final forms of any draft documents reviewed by Houlihan Lokey will not differ in any material respect from such draft documents . The materials are not an offer to sell or a solicitation of an indication of interest to purchase any security, option, commodity, future, loan or currency . The materials do not constitute a commitment by Houlihan Lokey or any of its affiliates to underwrite, subscribe for or place any securities, to extend or arrange credit, or to provide any other services . In the ordinary course of business, certain of Houlihan Lokey’s affiliates and employees, as well as investment funds in which they may have financial interests or with which they may co - invest, may acquire, hold or sell, long or short positions, or trade or otherwise effect transactions, in debt, equity, and other securities and financial instruments (including loans and other obligations) of, or investments in, the Company, any Transaction counterparty, any other Transaction participant, any other financially interested party with respect to any transaction, other entities or parties that are mentioned in the materials, or any of the foregoing entities’ or parties’ respective affiliates, subsidiaries, investment funds, portfolio companies and representatives (collectively, the “Interested Parties”), or any currency or commodity that may be involved in the Transaction . Houlihan Lokey provides mergers and acquisitions, restructuring and other advisory and consulting services to clients, which may have in the past included, or may currently or in the future include, one or more Interested Parties, for which services Houlihan Lokey has received, and may receive, compensation . Although Houlihan Lokey in the course of such activities and relationships or otherwise may have acquired, or may in the future acquire, information about one or more Interested Parties or the Transaction, or that otherwise may be of interest to the Board, the Committee, or the Company, Houlihan Lokey shall have no obligation to, and may not be contractually permitted to, disclose such information, or the fact that Houlihan Lokey is in possession of such information, to the Board, the Committee, or the Company or to use such information on behalf of the Board, the Committee, or the Company . Houlihan Lokey’s personnel may make statements or provide advice that is contrary to information contained in the materials . Disclaimer (cont.) 54

CONFIDENTIAL - PRELIMINARY DRAFT - SUBJECT TO FURTHER REVIEW 55 CORPORATE FINANCE FINANCIAL RESTRUCTURING FINANCI AL AND VALUATION ADVISORY HL .com