Exhibit (c) (7)
Project Carbon PRELIMINARY DISCUSSION MATERIALS FOR THE SPECIAL COMMITTEE APRIL 4, 2022 | CONFIDENTIAL | PRELIMINARY DRAFT

CONFIDENTIAL - PRELIMINARY DRAFT - SUBJECT TO FURTHER REVIEW Table of Contents 2 Page 1. Selected General Updates 3 2. Preliminary Financial Analyses Summary 12 3. Selected Changes to Preliminary Discussion Materials Dated 1/10/22 18 4. Preliminary Financial Analyses: ModusLink 22 5. Appendices 29 Supplemental Financial Analysis Schedule 30 Selected Public Market Observations 32 6. Disclaimer 36

Page 1. Selected General Updates 3 2. Preliminary Financial Analyses Summary 12 3. Selected Changes to Preliminary Discussion Materials Dated 1/10/22 18 4. Preliminary Financial Analyses: ModusLink 22 5. Appendices 29 6. Disclaimer 36
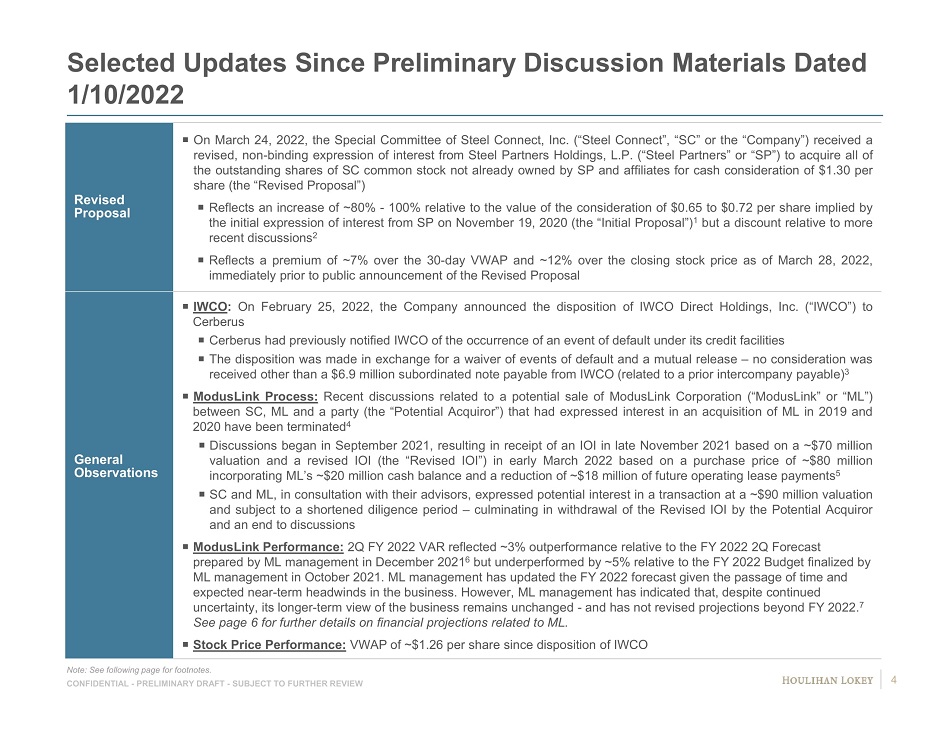
CONFIDENTIAL - PRELIMINARY DRAFT - SUBJECT TO FURTHER REVIEW Selected Updates Since Preliminary Discussion Materials Dated 1/10/2022 Revised Proposal On March 24 , 2022 , the Special Committee of Steel Connect, Inc . (“Steel Connect”, “SC” or the “Company”) received a revised, non - binding expression of interest from Steel Partners Holdings, L . P . (“Steel Partners” or “SP”) to acquire all of the outstanding shares of SC common stock not already owned by SP and affiliates for cash consideration of $ 1 . 30 per share (the “Revised Proposal”) Reflects an increase of ~ 80 % - 100 % relative to the value of the consideration of $ 0 . 65 to $ 0 . 72 per share implied by the initial expression of interest from SP on November 19 , 2020 (the “Initial Proposal”) 1 but a discount relative to more recent discussions 2 Reflects a premium of ~ 7 % over the 30 - day VWAP and ~ 12 % over the closing stock price as of March 28 , 2022 , immediately prior to public announcement of the Revised Proposal General Observations IWCO : On February 25 , 2022 , the Company announced the disposition of IWCO Direct Holdings, Inc . (“IWCO”) to Cerberus Cerberus had previously notified IWCO of the occurrence of an event of default under its credit facilities The disposition was made in exchange for a waiver of events of default and a mutual release – no consideration was received other than a $ 6 . 9 million subordinated note payable from IWCO (related to a prior intercompany payable) 3 ModusLink Process : Recent discussions related to a potential sale of ModusLink Corporation (“ ModusLink ” or “ML”) between SC, ML and a party (the “Potential Acquiror”) that had expressed interest in an acquisition of ML in 2019 and 2020 have been terminated 4 Discussions began in September 2021 , resulting in receipt of an IOI in late November 2021 based on a ~ $ 70 million valuation and a revised IOI (the “Revised IOI”) in early March 2022 based on a purchase price of ~ $ 80 million incorporating ML’s ~ $ 20 million cash balance and a reduction of ~ $ 18 million of future operating lease payments 5 SC and ML, in consultation with their advisors, expressed potential interest in a transaction at a ~ $ 90 million valuation and subject to a shortened diligence period – culminating in withdrawal of the Revised IOI by the Potential Acquiror and an end to discussions ModusLink Performance: 2Q FY 2022 VAR reflected ~3% outperformance relative to the FY 2022 2Q Forecast prepared by ML management in December 2021 6 but underperformed by ~5% relative to the FY 2022 Budget finalized by ML management in October 2021. ML management has updated the FY 2022 forecast given the passage of time and expected near - term headwinds in the business. However, ML management has indicated that, despite continued uncertainty, its longer - term view of the business remains unchanged - and has not revised projections beyond FY 2022. 7 See page 6 for further details on financial projections related to ML. Stock Price Performance: VWAP of ~$1.26 per share since disposition of IWCO Note: See following page for footnotes. 4
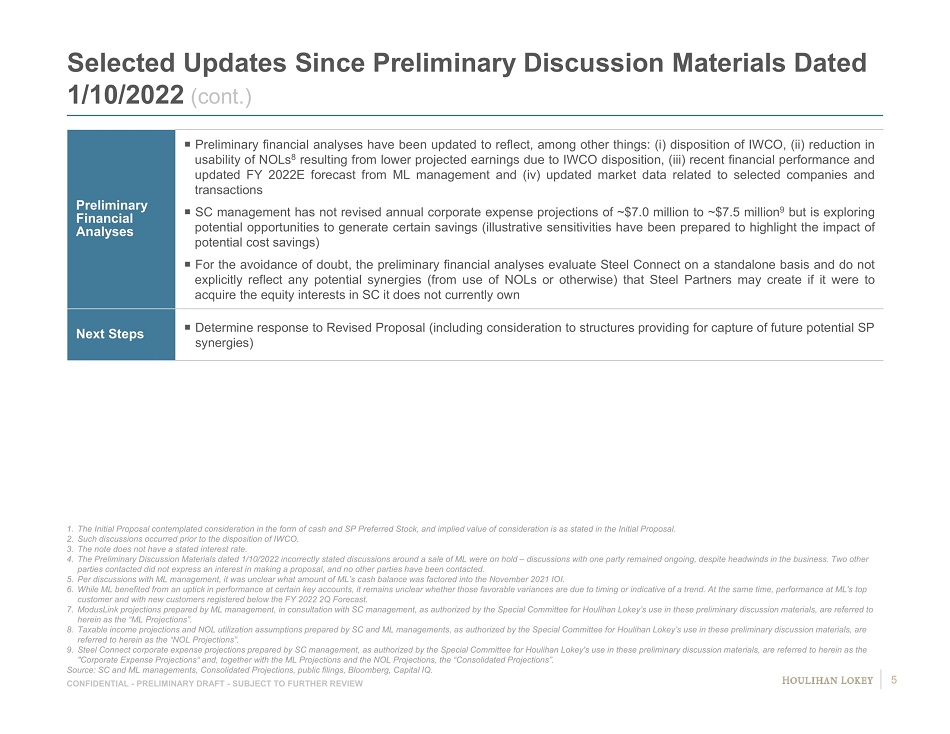
CONFIDENTIAL - PRELIMINARY DRAFT - SUBJECT TO FURTHER REVIEW Selected Updates Since Preliminary Discussion Materials Dated 1/10/2022 (cont.) Preliminary Financial Analyses Preliminary financial analyses have been updated to reflect, among other things : ( i ) disposition of IWCO, (ii) reduction in usability of NOLs 8 resulting from lower projected earnings due to IWCO disposition, (iii) recent financial performance and updated FY 2022 E forecast from ML management and (iv) updated market data related to selected companies and transactions SC management has not revised annual corporate expense projections of ~ $ 7 . 0 million to ~ $ 7 . 5 million 9 but is exploring potential opportunities to generate certain savings (illustrative sensitivities have been prepared to highlight the impact of potential cost savings) For the avoidance of doubt, the preliminary financial analyses evaluate Steel Connect on a standalone basis and do not explicitly reflect any potential synergies (from use of NOLs or otherwise) that Steel Partners may create if it were to acquire the equity interests in SC it does not currently own Next Steps Determine response to Revised Proposal (including consideration to structures providing for capture of future potential SP synergies) 1. The Initial Proposal contemplated consideration in the form of cash and SP Preferred Stock, and implied value of consideratio n i s as stated in the Initial Proposal. 2. Such discussions occurred prior to the disposition of IWCO. 3. The note does not have a stated interest rate. 4. The Preliminary Discussion Materials dated 1/10/2022 incorrectly stated discussions around a sale of ML were on hold – discussio ns with one party remained ongoing, despite headwinds in the business. Two other parties contacted did not express an interest in making a proposal, and no other parties have been contacted. 5. Per discussions with ML management, it was unclear what amount of ML’s cash balance was factored into the November 2021 IOI. 6. While ML benefited from an uptick in performance at certain key accounts, it remains unclear whether those favorable variance s a re due to timing or indicative of a trend. At the same time, performance at ML's top customer and with new customers registered below the FY 2022 2Q Forecast. 7. ModusLink projections prepared by ML management, in consultation with SC management, as authorized by the Special Committee for Houliha n Lokey’s use in these preliminary discussion materials, are referred to herein as the “ML Projections”. 8. Taxable income projections and NOL utilization assumptions prepared by SC and ML managements, as authorized by the Special Co mmi ttee for Houlihan Lokey’s use in these preliminary discussion materials, are referred to herein as the “NOL Projections”. 9. Steel Connect corporate expense projections prepared by SC management, as authorized by the Special Committee for Houlihan Lo key 's use in these preliminary discussion materials, are referred to herein as the "Corporate Expense Projections“ and, together with the ML Projections and the NOL Projections, the “Consolidated Projections” . Source: SC and ML managements, Consolidated Projections, public filings, Bloomberg, Capital IQ. 5
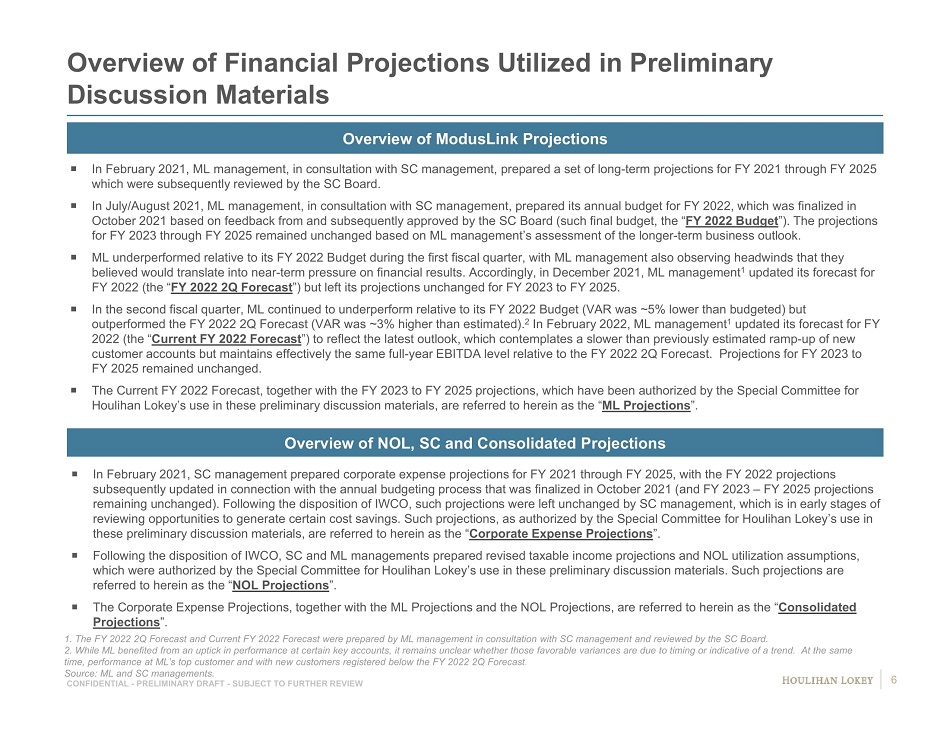
CONFIDENTIAL - PRELIMINARY DRAFT - SUBJECT TO FURTHER REVIEW Overview of Financial Projections Utilized in Preliminary Discussion Materials Overview of ModusLink Projections Overview of NOL, SC and Consolidated Projections In February 2021, ML management, in consultation with SC management, prepared a set of long - term projections for FY 2021 through FY 2025 which were subsequently reviewed by the SC Board. In July/August 2021, ML management, in consultation with SC management, prepared its annual budget for FY 2022, which was fin ali zed in October 2021 based on feedback from and subsequently approved by the SC Board (such final budget, the “ FY 2022 Budget ”). The projections for FY 2023 through FY 2025 remained unchanged based on ML management’s assessment of the longer - term business outlook. ML underperformed relative to its FY 2022 Budget during the first fiscal quarter, with ML management also observing headwinds th at they believed would translate into near - term pressure on financial results. Accordingly, in December 2021, ML management 1 updated its forecast for FY 2022 (the “ FY 2022 2Q Forecast ”) but left its projections unchanged for FY 2023 to FY 2025. In the second fiscal quarter, ML continued to underperform relative to its FY 2022 Budget (VAR was ~5% lower than budgeted) b ut outperformed the FY 2022 2Q Forecast (VAR was ~3% higher than estimated). 2 In February 2022, ML management 1 updated its forecast for FY 2022 (the “ Current FY 2022 Forecast ”) to reflect the latest outlook, which contemplates a slower than previously estimated ramp - up of new customer accounts but maintains effectively the same full - year EBITDA level relative to the FY 2022 2Q Forecast. Projections fo r FY 2023 to FY 2025 remained unchanged. The Current FY 2022 Forecast, together with the FY 2023 to FY 2025 projections, which have been authorized by the Special Com mit tee for Houlihan Lokey’s use in these preliminary discussion materials, are referred to herein as the “ ML Projections ”. In February 2021, SC management prepared corporate expense projections for FY 2021 through FY 2025, with the FY 2022 projecti ons subsequently updated in connection with the annual budgeting process that was finalized in October 2021 (and FY 2023 – FY 2025 p rojections remaining unchanged). Following the disposition of IWCO, such projections were left unchanged by SC management, which is in e arl y stages of reviewing opportunities to generate certain cost savings. Such projections, as authorized by the Special Committee for Houlih an Lokey’s use in these preliminary discussion materials, are referred to herein as the “ Corporate Expense Projections ”. Following the disposition of IWCO, SC and ML managements prepared revised taxable income projections and NOL utilization assu mpt ions, which were authorized by the Special Committee for Houlihan Lokey’s use in these preliminary discussion materials. Such proje cti ons are referred to herein as the “ NOL Projections ”. The Corporate Expense Projections, together with the ML Projections and the NOL Projections, are referred to herein as the “ Consolidated Projections ”. 1. The FY 2022 2Q Forecast and Current FY 2022 Forecast were prepared by ML management in consultation with SC management and re viewed by the SC Board. 2. While ML benefited from an uptick in performance at certain key accounts, it remains unclear whether those favorable varia nce s are due to timing or indicative of a trend. At the same time, performance at ML’s top customer and with new customers registered below the FY 2022 2Q Forecast . Source: ML and SC managements. 6
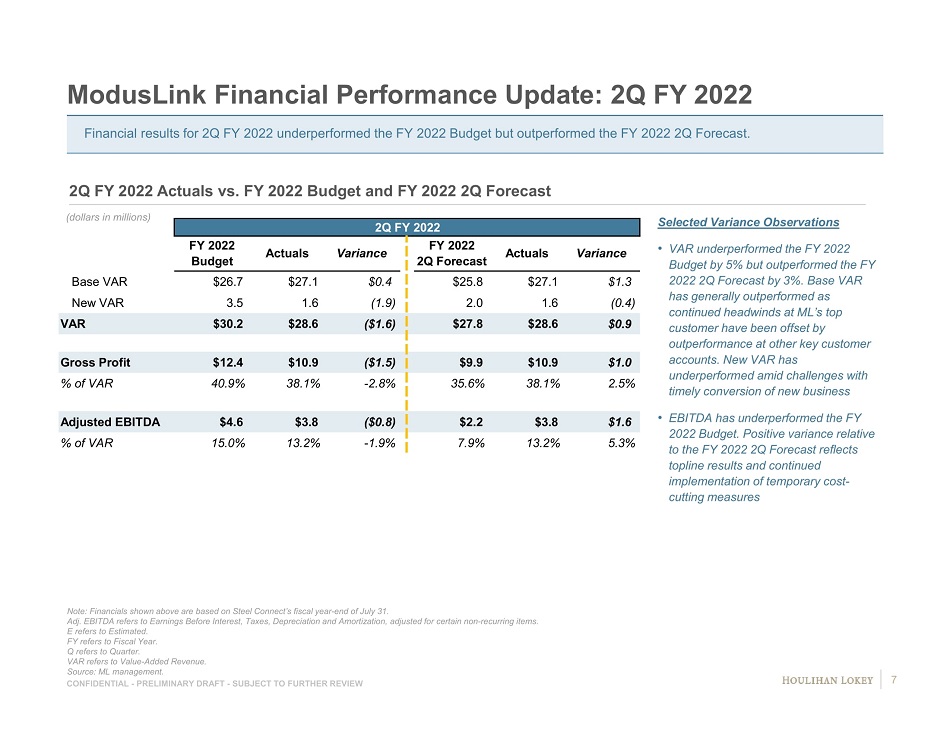
CONFIDENTIAL - PRELIMINARY DRAFT - SUBJECT TO FURTHER REVIEW ModusLink Financial Performance Update: 2Q FY 2022 Note: Financials shown above are based on Steel Connect’s fiscal year - end of July 31. Adj. EBITDA refers to Earnings Before Interest, Taxes, Depreciation and Amortization, adjusted for certain non - recurring items. E refers to Estimated. FY refers to Fiscal Year. Q refers to Quarter. VAR refers to Value - Added Revenue. Source: ML management. (dollars in millions) 2Q FY 2022 Actuals vs. FY 2022 Budget and FY 2022 2Q Forecast Selected Variance Observations • VAR underperformed the FY 2022 Budget by 5% but outperformed the FY 2022 2Q Forecast by 3%. Base VAR has generally outperformed as continued headwinds at ML’s top customer have been offset by outperformance at other key customer accounts. New VAR has underperformed amid challenges with timely conversion of new business • EBITDA has underperformed the FY 2022 Budget. Positive variance relative to the FY 2022 2Q Forecast reflects topline results and continued implementation of temporary cost - cutting measures Financial results for 2Q FY 2022 underperformed the FY 2022 Budget but outperformed the FY 2022 2Q Forecast. 7 2Q FY 2022 Base VAR $26.7 $27.1 $0.4 $25.8 $27.1 $1.3 New VAR 3.5 1.6 (1.9) 2.0 1.6 (0.4) VAR $30.2 $28.6 ($1.6) $27.8 $28.6 $0.9 Gross Profit $12.4 $10.9 ($1.5) $9.9 $10.9 $1.0 % of VAR 40.9% 38.1% -2.8% 35.6% 38.1% 2.5% Adjusted EBITDA $4.6 $3.8 ($0.8) $2.2 $3.8 $1.6 % of VAR 15.0% 13.2% -1.9% 7.9% 13.2% 5.3% FY 2022 2Q Forecast Actuals Variance FY 2022 Budget Actuals Variance
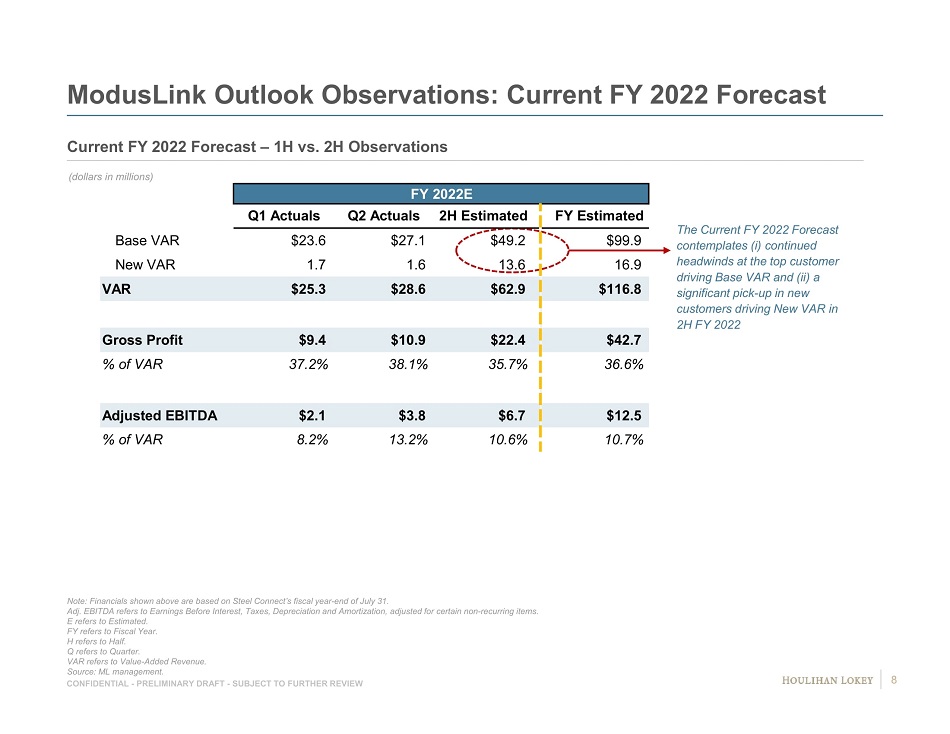
CONFIDENTIAL - PRELIMINARY DRAFT - SUBJECT TO FURTHER REVIEW ModusLink Outlook Observations: Current FY 2022 Forecast Note: Financials shown above are based on Steel Connect’s fiscal year - end of July 31. Adj. EBITDA refers to Earnings Before Interest, Taxes, Depreciation and Amortization, adjusted for certain non - recurring items. E refers to Estimated. FY refers to Fiscal Year. H refers to Half. Q refers to Quarter. VAR refers to Value - Added Revenue. Source: ML management. (dollars in millions) Current FY 2022 Forecast – 1H vs. 2H Observations The Current FY 2022 Forecast contemplates ( i ) continued headwinds at the top customer driving Base VAR and (ii) a significant pick - up in new customers driving New VAR in 2H FY 2022 FY 2022E Base VAR $23.6 $27.1 $49.2 $99.9 New VAR 1.7 1.6 13.6 16.9 VAR $25.3 $28.6 $62.9 $116.8 Gross Profit $9.4 $10.9 $22.4 $42.7 % of VAR 37.2% 38.1% 35.7% 36.6% Adjusted EBITDA $2.1 $3.8 $6.7 $12.5 % of VAR 8.2% 13.2% 10.6% 10.7% Q1 Actuals 2H EstimatedQ2 Actuals FY Estimated 8
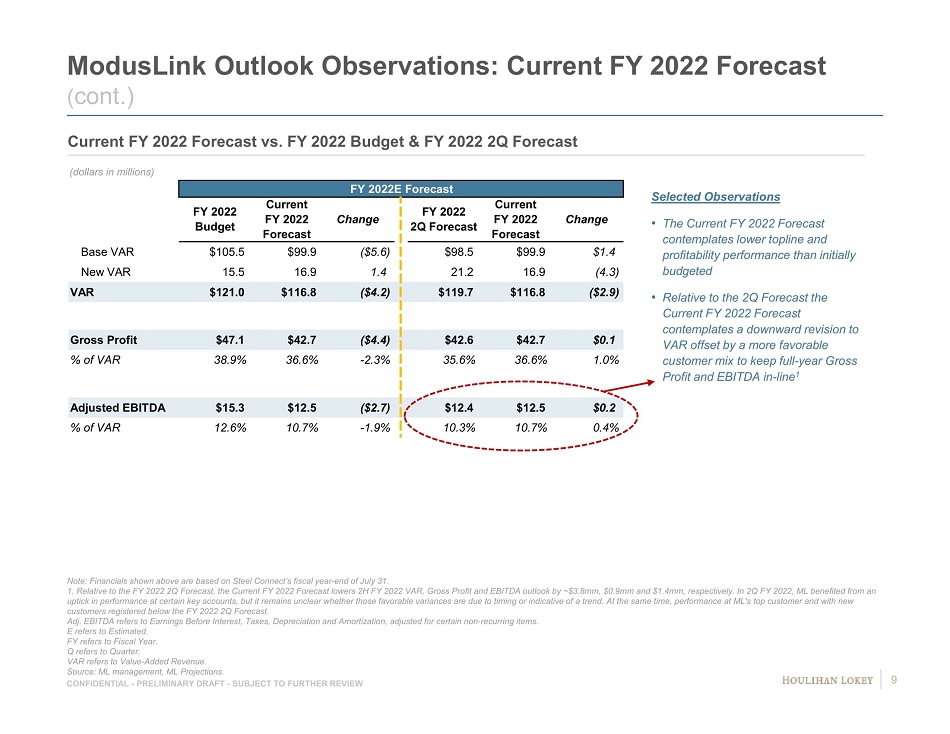
CONFIDENTIAL - PRELIMINARY DRAFT - SUBJECT TO FURTHER REVIEW FY 2022E Forecast Base VAR $105.5 $99.9 ($5.6) $98.5 $99.9 $1.4 New VAR 15.5 16.9 1.4 21.2 16.9 (4.3) VAR $121.0 $116.8 ($4.2) $119.7 $116.8 ($2.9) Gross Profit $47.1 $42.7 ($4.4) $42.6 $42.7 $0.1 % of VAR 38.9% 36.6% -2.3% 35.6% 36.6% 1.0% Adjusted EBITDA $15.3 $12.5 ($2.7) $12.4 $12.5 $0.2 % of VAR 12.6% 10.7% -1.9% 10.3% 10.7% 0.4% FY 2022 2Q Forecast Current FY 2022 Forecast Change FY 2022 Budget Change Current FY 2022 Forecast ModusLink Outlook Observations: Current FY 2022 Forecast ( cont.) Note: Financials shown above are based on Steel Connect’s fiscal year - end of July 31. 1. Relative to the FY 2022 2Q Forecast, the Current FY 2022 Forecast lowers 2H FY 2022 VAR, Gross Profit and EBITDA outlook by ~ $3. 8mm, $0.9mm and $1.4mm, respectively. In 2Q FY 2022, ML benefited from an uptick in performance at certain key accounts, but it remains unclear whether those favorable variances are due to timing or ind icative of a trend. At the same time, performance at ML's top customer and with new customers registered below the FY 2022 2Q Forecast. Adj. EBITDA refers to Earnings Before Interest, Taxes, Depreciation and Amortization, adjusted for certain non - recurring items. E refers to Estimated. FY refers to Fiscal Year. Q refers to Quarter. VAR refers to Value - Added Revenue. Source: ML management, ML Projections. (dollars in millions) Selected Observations • The Current FY 2022 Forecast contemplates lower topline and profitability performance than initially budgeted • Relative to the 2Q Forecast the Current FY 2022 Forecast contemplates a downward revision to VAR offset by a more favorable customer mix to keep full - year Gross Profit and EBITDA in - line 1 Current FY 2022 Forecast vs. FY 2022 Budget & FY 2022 2Q Forecast 9

CONFIDENTIAL - PRELIMINARY DRAFT - SUBJECT TO FURTHER REVIEW 0.0% 4.0% 72.1% 16.2% 7.7% 0.0% 0.0 0.2 0.6 0.3 0.0 $0.85- $1.00 $1.00- $1.15 $1.15- $1.30 $1.30- $1.45 $1.45- $1.60 $1.60- $1.75 2.7% 14.8% 51.5% 16.4% 13.3% 1.4% 0.2 1.0 3.5 1.1 0.9 0.1 $0.85- $1.00 $1.00- $1.15 $1.15- $1.30 $1.30- $1.45 $1.45- $1.60 $1.60- $1.75 3 - Month High: $1.69 3 - Month Low: $0.92 0.0 5.0 10.0 15.0 20.0 25.0 $0.00 $0.50 $1.00 $1.50 $2.00 $2.50 $3.00 11/19/20 12/19/20 1/19/21 2/19/21 3/19/21 4/19/21 5/19/21 6/19/21 7/19/21 8/19/21 9/19/21 10/19/21 11/19/21 12/19/21 1/19/22 2/19/22 3/19/22 Volume (millions) Closing Price ($) Volume Price Recent Stock Performance Stock Performance Since Initial Proposal (11/19/20) Last Three Months 1 Since IWCO Disposition (2/25/22) 1 (shares in millions) (shares in millions) Intraday High : $ 1 . 69 Intraday Low : $ 0 . 92 Intraday High : $ 1 . 53 Intraday Low : $ 1 . 11 1. Based on the closing price in one - minute intervals as provided by Bloomberg and the amount of volume transacted during that i ntraday window. 2. Per Bloomberg, reflects the number of shares traded over the period that are included for purposes of the VWAP calculation s. FY refers to Fiscal Year. Q refers to Quarter. VWAP refers to Volume - Weighted Average Price. Source: Bloomberg and Capital IQ as of 3/31/22. Indicates Earnings Announcement Q1 FY 21 Q2 FY 21 Q3 FY 21 Q4 FY 21 Q2 FY 22 Announcement of IWCO Disposition (2/25/22) VWAP Volume 2 : 6.8 million VWAP: $1.26 VWAP Volume 2 : 3.8 million VWAP: $1.26 Q1 FY 22 2.8 Announcement of Revised Proposal (3/28/22) 10
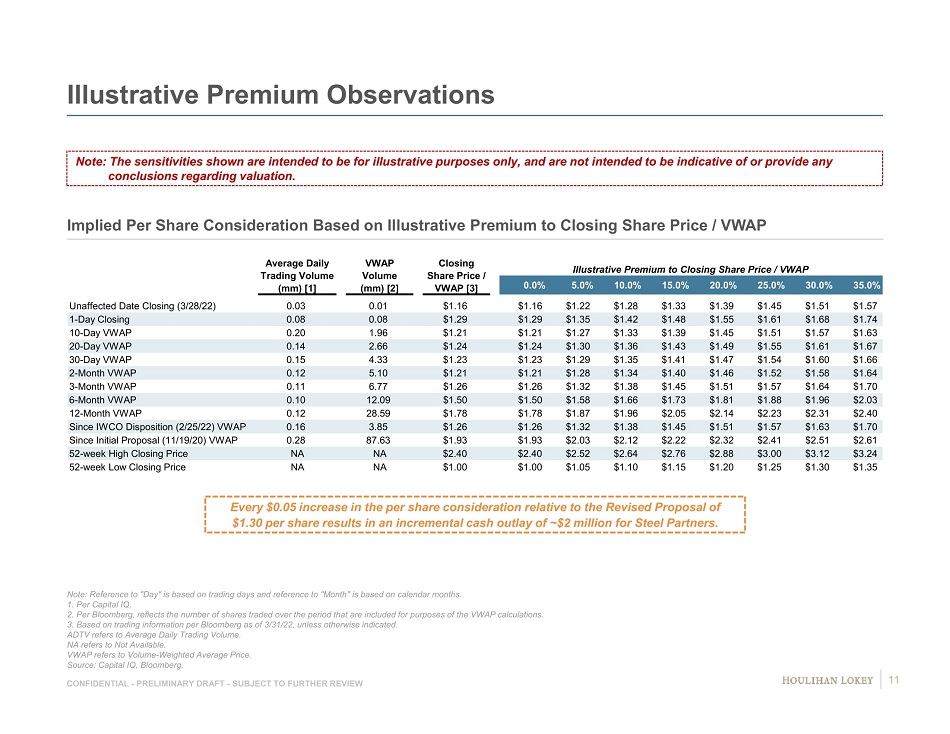
CONFIDENTIAL - PRELIMINARY DRAFT - SUBJECT TO FURTHER REVIEW Illustrative Premium Observations Implied Per Share Consideration Based on Illustrative Premium to Closing Share Price / VWAP Note: Reference to "Day" is based on trading days and reference to "Month" is based on calendar months. 1. Per Capital IQ. 2. Per Bloomberg, reflects the number of shares traded over the period that are included for purposes of the VWAP calculations. 3. Based on trading information per Bloomberg as of 3/31/22, unless otherwise indicated. ADTV refers to Average Daily Trading Volume. NA refers to Not Available. VWAP refers to Volume - Weighted Average Price. Source: Capital IQ, Bloomberg. Note: The sensitivities shown are intended to be for illustrative purposes only, and are not intended to be indicative of or pro vide any conclusions regarding valuation. Every $0.05 increase in the per share consideration relative to the Revised Proposal of $1.30 per share results in an incremental cash outlay of ~$2 million for Steel Partners. 0.0% 5.0% 10.0% 15.0% 20.0% 25.0% 30.0% 35.0% Unaffected Date Closing (3/28/22) 0.03 0.01 $1.16 $1.16 $1.22 $1.28 $1.33 $1.39 $1.45 $1.51 $1.57 1-Day Closing 0.08 0.08 $1.29 $1.29 $1.35 $1.42 $1.48 $1.55 $1.61 $1.68 $1.74 10-Day VWAP 0.20 1.96 $1.21 $1.21 $1.27 $1.33 $1.39 $1.45 $1.51 $1.57 $1.63 20-Day VWAP 0.14 2.66 $1.24 $1.24 $1.30 $1.36 $1.43 $1.49 $1.55 $1.61 $1.67 30-Day VWAP 0.15 4.33 $1.23 $1.23 $1.29 $1.35 $1.41 $1.47 $1.54 $1.60 $1.66 2-Month VWAP 0.12 5.10 $1.21 $1.21 $1.28 $1.34 $1.40 $1.46 $1.52 $1.58 $1.64 3-Month VWAP 0.11 6.77 $1.26 $1.26 $1.32 $1.38 $1.45 $1.51 $1.57 $1.64 $1.70 6-Month VWAP 0.10 12.09 $1.50 $1.50 $1.58 $1.66 $1.73 $1.81 $1.88 $1.96 $2.03 12-Month VWAP 0.12 28.59 $1.78 $1.78 $1.87 $1.96 $2.05 $2.14 $2.23 $2.31 $2.40 Since IWCO Disposition (2/25/22) VWAP 0.16 3.85 $1.26 $1.26 $1.32 $1.38 $1.45 $1.51 $1.57 $1.63 $1.70 Since Initial Proposal (11/19/20) VWAP 0.28 87.63 $1.93 $1.93 $2.03 $2.12 $2.22 $2.32 $2.41 $2.51 $2.61 52-week High Closing Price NA NA $2.40 $2.40 $2.52 $2.64 $2.76 $2.88 $3.00 $3.12 $3.24 52-week Low Closing Price NA NA $1.00 $1.00 $1.05 $1.10 $1.15 $1.20 $1.25 $1.30 $1.35 Illustrative Premium to Closing Share Price / VWAP Closing Share Price / VWAP [3] Average Daily Trading Volume (mm) [1] VWAP Volume (mm) [2] 11
Page 1. Selected General Updates 3 2. Preliminary Financial Analyses Summary 12 3. Selected Changes to Preliminary Discussion Materials Dated 1/10/22 18 4. Preliminary Financial Analyses: ModusLink 22 5. Appendices 29 6. Disclaimer 36
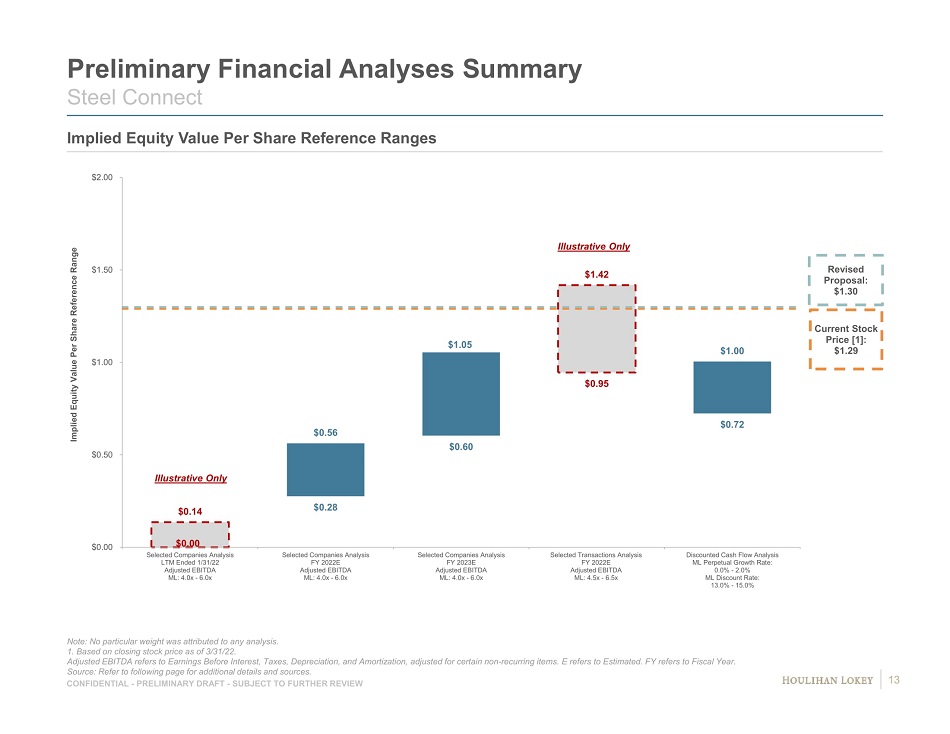
CONFIDENTIAL - PRELIMINARY DRAFT - SUBJECT TO FURTHER REVIEW $0.00 $0.28 $0.60 $0.95 $0.72 $0.14 $0.56 $1.05 $1.42 $1.00 Current Stock Price [1]: $1.29 Revised Proposal: $1.30 $0.00 $0.50 $1.00 $1.50 $2.00 Selected Companies Analysis LTM Ended 1/31/22 Adjusted EBITDA ML: 4.0x - 6.0x Selected Companies Analysis FY 2022E Adjusted EBITDA ML: 4.0x - 6.0x Selected Companies Analysis FY 2023E Adjusted EBITDA ML: 4.0x - 6.0x Selected Transactions Analysis FY 2022E Adjusted EBITDA ML: 4.5x - 6.5x Discounted Cash Flow Analysis ML Perpetual Growth Rate: 0.0% - 2.0% ML Discount Rate: 13.0% - 15.0% Implied Equity Value Per Share Reference Range Preliminary Financial Analyses Summary Steel Connect Implied Equity Value Per Share Reference Ranges Note: No particular weight was attributed to any analysis. 1. Based on closing stock price as of 3/31/22. Adjusted EBITDA refers to Earnings Before Interest, Taxes, Depreciation, and Amortization, adjusted for certain non - recurring it ems. E refers to Estimated. FY refers to Fiscal Year. Source: Refer to following page for additional details and sources. Illustrative Only Illustrative Only 13
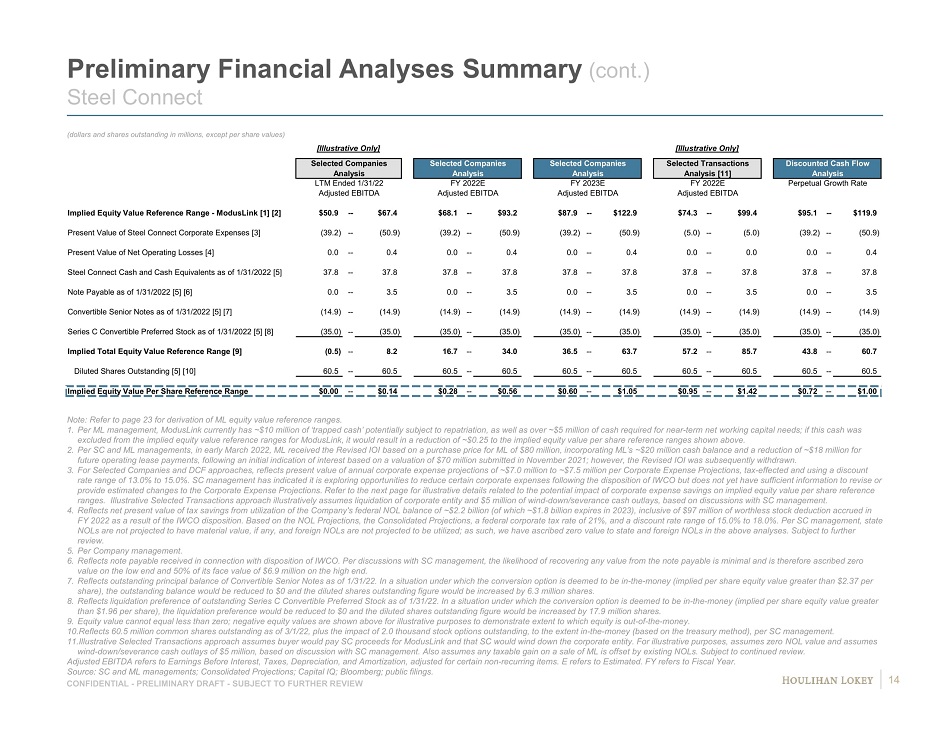
CONFIDENTIAL - PRELIMINARY DRAFT - SUBJECT TO FURTHER REVIEW Preliminary Financial Analyses Summary (cont.) Steel Connect (dollars and shares outstanding in millions, except per share values) Note: Refer to page 23 for derivation of ML equity value reference ranges. 1. Per ML management, ModusLink currently has ~$10 million of ‘trapped cash’ potentially subject to repatriation, as well as over ~$5 million of cash require d for near - term net working capital needs; if this cash was excluded from the implied equity value reference ranges for ModusLink , it would result in a reduction of ~$0.25 to the implied equity value per share reference ranges shown above. 2. Per SC and ML managements, in early March 2022, ML received the Revised IOI based on a purchase price for ML of $80 million, inc orporating ML’s ~$20 million cash balance and a reduction of ~$18 million for future operating lease payments, following an initial indication of interest based on a valuation of $70 million submitted in No vember 2021; however, the Revised IOI was subsequently withdrawn. 3. For Selected Companies and DCF approaches, reflects present value of annual corporate expense projections of ~$7.0 million to ~$ 7.5 million per Corporate Expense Projections, tax - effected and using a discount rate range of 13.0% to 15.0%. SC management has indicated it is exploring opportunities to reduce certain corporate expenses fol lowing the disposition of IWCO but does not yet have sufficient information to revise or provide estimated changes to the Corporate Expense Projections. Refer to the next page for illustrative details related to th e p otential impact of corporate expense savings on implied equity value per share reference ranges. Illustrative Selected Transactions approach illustratively assumes liquidation of corporate entity and $5 million of wi nd - down/severance cash outlays, based on discussions with SC management. 4. Reflects net present value of tax savings from utilization of the Company's federal NOL balance of ~$2.2 billion (of which ~$ 1.8 billion expires in 2023), inclusive of $97 million of worthless stock deduction accrued in FY 2022 as a result of the IWCO disposition. Based on the NOL Projections, the Consolidated Projections, a federal corporate tax rate of 21%, and a discount rate range of 15.0% to 18.0%. Per SC management, state NOLs are not projected to have material value, if any, and foreign NOLs are not projected to be utilized; as such, we have as cri bed zero value to state and foreign NOLs in the above analyses. Subject to further review. 5. Per Company management. 6. Reflects note payable received in connection with disposition of IWCO. Per discussions with SC management, the likelihood of rec overing any value from the note payable is minimal and is therefore ascribed zero value on the low end and 50% of its face value of $6.9 million on the high end. 7. Reflects outstanding principal balance of Convertible Senior Notes as of 1/31/22. In a situation under which the conversion o pti on is deemed to be in - the - money (implied per share equity value greater than $2.37 per share), the outstanding balance would be reduced to $0 and the diluted shares outstanding figure would be increased by 6.3 mi lli on shares. 8. Reflects liquidation preference of outstanding Series C Convertible Preferred Stock as of 1/31/22. In a situation under which th e conversion option is deemed to be in - the - money (implied per share equity value greater than $1.96 per share), the liquidation preference would be reduced to $0 and the diluted shares outstanding figure would be i ncr eased by 17.9 million shares. 9. Equity value cannot equal less than zero; negative equity values are shown above for illustrative purposes to demonstrate ext ent to which equity is out - of - the - money. 10. Reflects 60.5 million common shares outstanding as of 3/1/22, plus the impact of 2.0 thousand stock options outstanding, to t he extent in - the - money (based on the treasury method), per SC management. 11. Illustrative Selected Transactions approach assumes buyer would pay SC proceeds for ModusLink and that SC would wind down the corporate entity. For illustrative purposes, assumes zero NOL value and assumes wind - down/severance cash outlays of $5 million, based on discussion with SC management. Also assumes any taxable gain on a sale of ML is offset by existing NOLs. Subject to continued review. Adjusted EBITDA refers to Earnings Before Interest, Taxes, Depreciation, and Amortization, adjusted for certain non - recurring it ems. E refers to Estimated. FY refers to Fiscal Year. Source: SC and ML managements; Consolidated Projections; Capital IQ; Bloomberg; public filings. 14 [Illustrative Only] [Illustrative Only] Selected Companies Selected Companies Selected Companies Selected Transactions Discounted Cash Flow Analysis Analysis Analysis Analysis [11] Analysis LTM Ended 1/31/22 FY 2022E FY 2023E FY 2022E Perpetual Growth Rate Adjusted EBITDA Adjusted EBITDA Adjusted EBITDA Adjusted EBITDA 0.0% -- 2.0% Implied Equity Value Reference Range - ModusLink [1] [2] $50.9 -- $67.4 $68.1 -- $93.2 $87.9 -- $122.9 $74.3 -- $99.4 $95.1 -- $119.9 Present Value of Steel Connect Corporate Expenses [3] (39.2) -- (50.9) (39.2) -- (50.9) (39.2) -- (50.9) (5.0) -- (5.0) (39.2) -- (50.9) Present Value of Net Operating Losses [4] 0.0 -- 0.4 0.0 -- 0.4 0.0 -- 0.4 0.0 -- 0.0 0.0 -- 0.4 Steel Connect Cash and Cash Equivalents as of 1/31/2022 [5] 37.8 -- 37.8 37.8 -- 37.8 37.8 -- 37.8 37.8 -- 37.8 37.8 -- 37.8 Note Payable as of 1/31/2022 [5] [6] 0.0 -- 3.5 0.0 -- 3.5 0.0 -- 3.5 0.0 -- 3.5 0.0 -- 3.5 Convertible Senior Notes as of 1/31/2022 [5] [7] (14.9) -- (14.9) (14.9) -- (14.9) (14.9) -- (14.9) (14.9) -- (14.9) (14.9) -- (14.9) Series C Convertible Preferred Stock as of 1/31/2022 [5] [8] (35.0) -- (35.0) (35.0) -- (35.0) (35.0) -- (35.0) (35.0) -- (35.0) (35.0) -- (35.0) Implied Total Equity Value Reference Range [9] (0.5) -- 8.2 16.7 -- 34.0 36.5 -- 63.7 57.2 -- 85.7 43.8 -- 60.7 Diluted Shares Outstanding [5] [10] 60.5 -- 60.5 60.5 -- 60.5 60.5 -- 60.5 60.5 -- 60.5 60.5 -- 60.5 Implied Equity Value Per Share Reference Range $0.00 -- $0.14 $0.28 -- $0.56 $0.60 -- $1.05 $0.95 -- $1.42 $0.72 -- $1.00
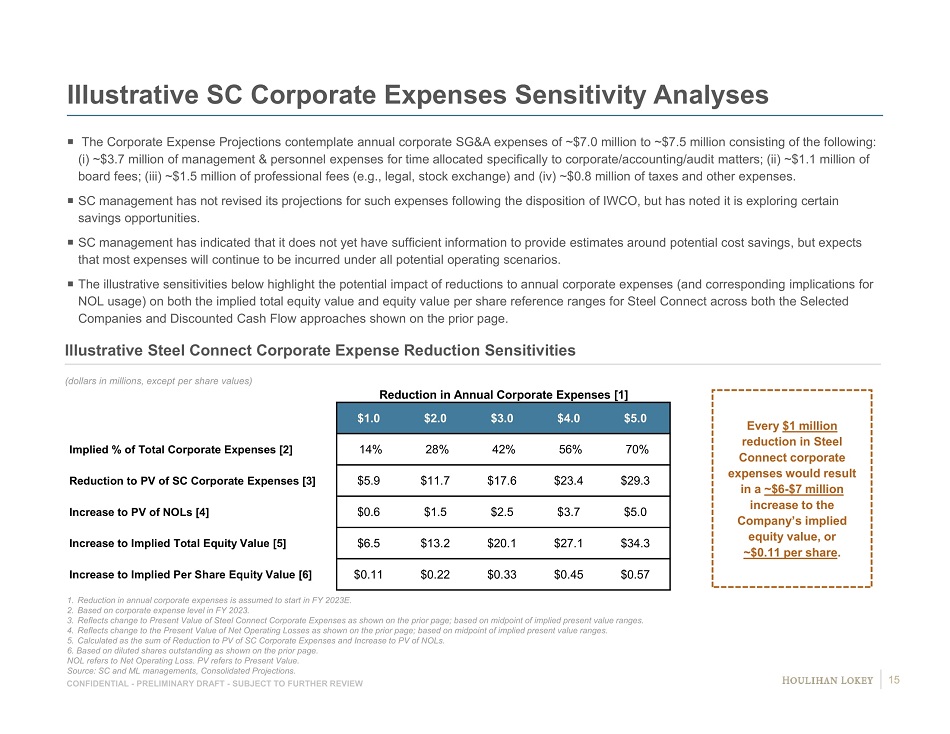
CONFIDENTIAL - PRELIMINARY DRAFT - SUBJECT TO FURTHER REVIEW Illustrative SC Corporate Expenses Sensitivity Analyses 1. Reduction in annual corporate expenses is assumed to start in FY 2023E. 2. Based on corporate expense level in FY 2023. 3. Reflects change to Present Value of Steel Connect Corporate Expenses as shown on the prior page; based on midpoint of implied pr esent value ranges. 4. Reflects change to the Present Value of Net Operating Losses as shown on the prior page; based on midpoint of implied present va lue ranges. 5. Calculated as the sum of Reduction to PV of SC Corporate Expenses and Increase to PV of NOLs. 6. Based on diluted shares outstanding as shown on the prior page. NOL refers to Net Operating Loss. PV refers to Present Value. Source: SC and ML managements, Consolidated Projections. (dollars in millions, except per share values) Every $1 million reduction in Steel Connect corporate expenses would result in a ~$6 - $7 million increase to the Company’s implied equity value, or ~$0.11 per share . Illustrative Steel Connect Corporate Expense Reduction Sensitivities The Corporate Expense Projections contemplate annual corporate SG&A expenses of ~$7.0 million to ~$7.5 million consisting of th e following: ( i ) ~$3.7 million of management & personnel expenses for time allocated specifically to corporate/accounting/audit matters; (ii ) ~ $1.1 million of board fees; (iii) ~$1.5 million of professional fees (e.g., legal, stock exchange) and (iv) ~$0.8 million of taxes and other exp enses. SC management has not revised its projections for such expenses following the disposition of IWCO, but has noted it is explor ing certain savings opportunities. SC management has indicated that it does not yet have sufficient information to provide estimates around potential cost savin gs, but expects that most expenses will continue to be incurred under all potential operating scenarios. The illustrative sensitivities below highlight the potential impact of reductions to annual corporate expenses (and correspon din g implications for NOL usage) on both the implied total equity value and equity value per share reference ranges for Steel Connect across both t he Selected Companies and Discounted Cash Flow approaches shown on the prior page. Reduction in Annual Corporate Expenses [1] $1.0 $2.0 $3.0 $4.0 $5.0 Implied % of Total Corporate Expenses [2] 14% 28% 42% 56% 70% Reduction to PV of SC Corporate Expenses [3] $5.9 $11.7 $17.6 $23.4 $29.3 Increase to PV of NOLs [4] $0.6 $1.5 $2.5 $3.7 $5.0 Increase to Implied Total Equity Value [5] $6.5 $13.2 $20.1 $27.1 $34.3 Increase to Implied Per Share Equity Value [6] $0.11 $0.22 $0.33 $0.45 $0.57 15
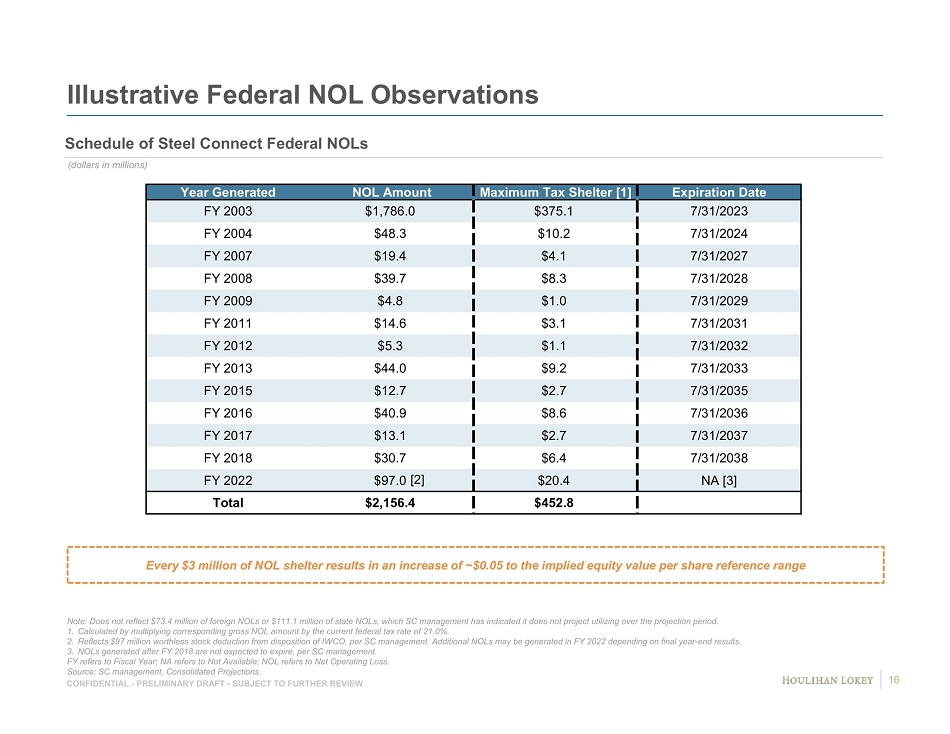
CONFIDENTIAL - PRELIMINARY DRAFT - SUBJECT TO FURTHER REVIEW Year Generated NOL Amount Maximum Tax Shelter [1] Expiration Date FY 2003 $1,786.0 $375.1 7/31/2023 FY 2004 $48.3 $10.2 7/31/2024 FY 2007 $19.4 $4.1 7/31/2027 FY 2008 $39.7 $8.3 7/31/2028 FY 2009 $4.8 $1.0 7/31/2029 FY 2011 $14.6 $3.1 7/31/2031 FY 2012 $5.3 $1.1 7/31/2032 FY 2013 $44.0 $9.2 7/31/2033 FY 2015 $12.7 $2.7 7/31/2035 FY 2016 $40.9 $8.6 7/31/2036 FY 2017 $13.1 $2.7 7/31/2037 FY 2018 $30.7 $6.4 7/31/2038 FY 2022 $97.0 $20.4 NA [3] Total $2,156.4 $452.8 Illustrative Federal NOL Observations Note: Does not reflect $73.4 million of foreign NOLs or $111.1 million of state NOLs, which SC management has indicated it do es not project utilizing over the projection period. 1. Calculated by multiplying corresponding gross NOL amount by the current federal tax rate of 21.0%. 2. Reflects $97 million worthless stock deduction from disposition of IWCO, per SC management. Additional NOLs may be generated in FY 2022 depending on final year - end results. 3. NOLs generated after FY 2018 are not expected to expire, per SC management. FY refers to Fiscal Year; NA refers to Not Available; NOL refers to Net Operating Loss. Source: SC management, Consolidated Projections. (dollars in millions) Every $3 million of NOL shelter results in an increase of ~$0.05 to the implied equity value per share reference range Schedule of Steel Connect Federal NOLs [2] 16
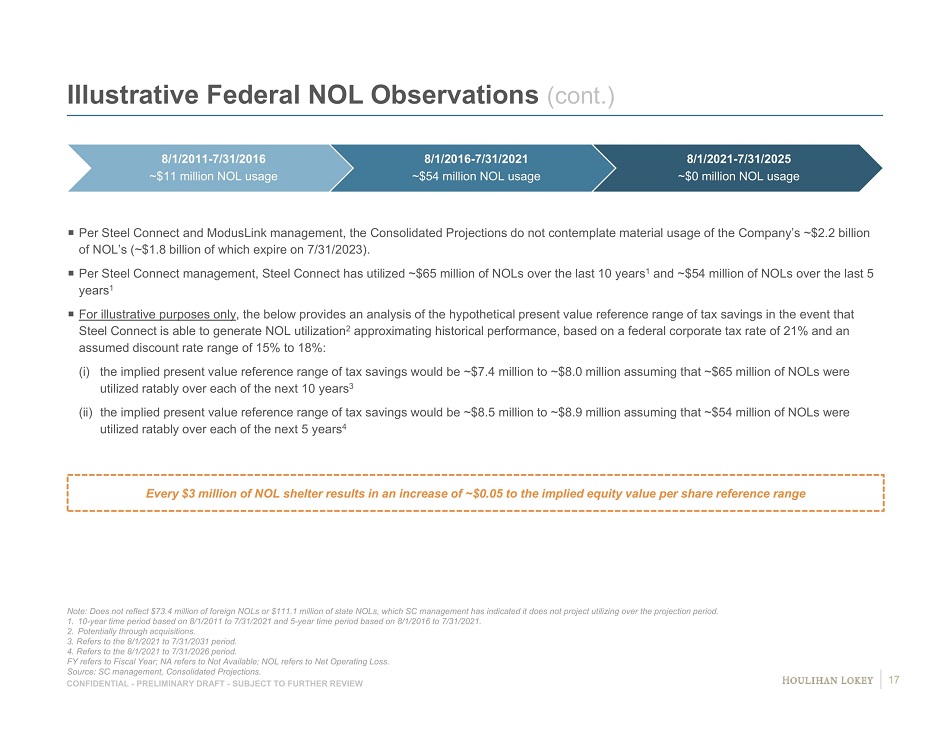
CONFIDENTIAL - PRELIMINARY DRAFT - SUBJECT TO FURTHER REVIEW Illustrative Federal NOL Observations (cont.) Note: Does not reflect $73.4 million of foreign NOLs or $111.1 million of state NOLs, which SC management has indicated it do es not project utilizing over the projection period. 1. 10 - year time period based on 8/1/2011 to 7/31/2021 and 5 - year time period based on 8/1/2016 to 7/31/2021. 2. Potentially through acquisitions. 3. Refers to the 8/1/2021 to 7/31/2031 period. 4. Refers to the 8/1/2021 to 7/31/2026 period. FY refers to Fiscal Year; NA refers to Not Available; NOL refers to Net Operating Loss. Source: SC management, Consolidated Projections. Per Steel Connect and ModusLink management, the Consolidated Projections do not contemplate material usage of the Company’s ~ $2. 2 billion of NOL’s (~$1.8 billion of which expire on 7/31/2023). Per Steel Connect management, Steel Connect has utilized ~$65 million of NOLs over the last 10 years 1 and ~$54 million of NOLs over the last 5 years 1 For illustrative purposes only , the below provides an analysis of the hypothetical present value reference range of tax savings in the event that Steel Connect is able to generate NOL utilization 2 approximating historical performance, based on a federal corporate tax rate of 21% and an assumed discount rate range of 15% to 18%: (i) the implied present value reference range of tax savings would be ~$7.4 million to ~$8.0 million assuming that ~$65 million o f N OLs were utilized ratably over each of the next 10 years 3 (ii) the implied present value reference range of tax savings would be ~$8.5 million to ~$8.9 million assuming that ~$54 million o f N OLs were utilized ratably over each of the next 5 years 4 Every $3 million of NOL shelter results in an increase of ~$0.05 to the implied equity value per share reference range 8/1/2011 - 7/31/2016 ~$11 million NOL usage 8/1/2016 - 7/31/2021 ~$54 million NOL usage 8/1/2021 - 7/31/2025 ~$0 million NOL usage 17
Page 1. Selected General Updates 3 2. Preliminary Financial Analyses Summary 12 3. Selected Changes to Preliminary Discussion Materials Dated 1/10/22 18 4. Preliminary Financial Analyses: ModusLink 22 5. Appendices 29 6. Disclaimer 36
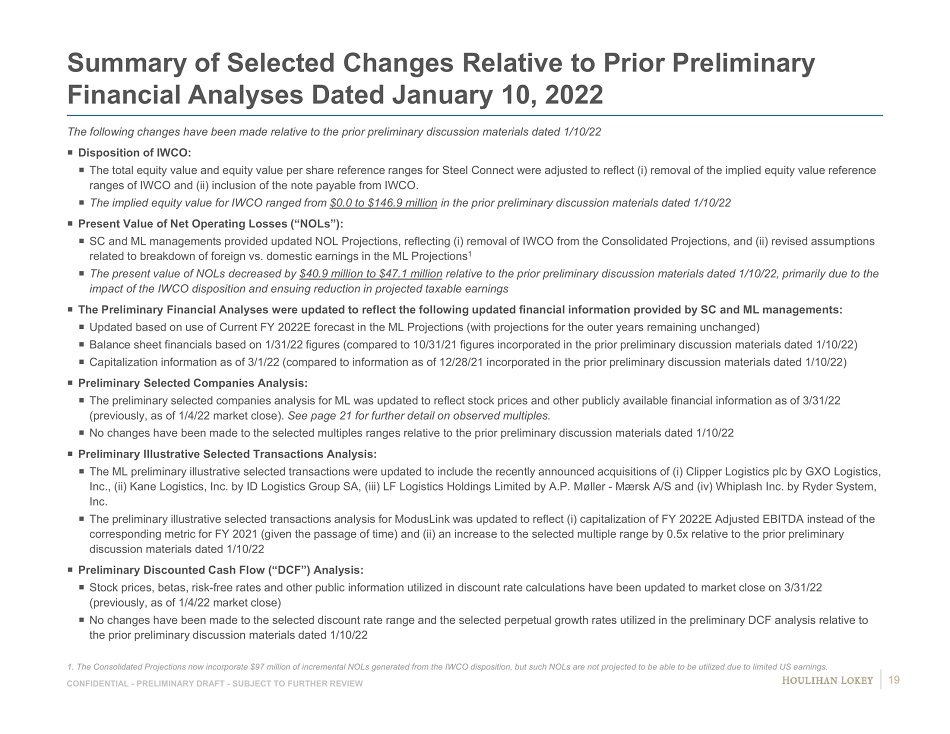
CONFIDENTIAL - PRELIMINARY DRAFT - SUBJECT TO FURTHER REVIEW Summary of Selected Changes Relative to Prior Preliminary Financial Analyses Dated January 10, 2022 The following changes have been made relative to the prior preliminary discussion materials dated 1/10/22 Disposition of IWCO: The total equity value and equity value per share reference ranges for Steel Connect were adjusted to reflect ( i ) removal of the implied equity value reference ranges of IWCO and (ii) inclusion of the note payable from IWCO. The implied equity value for IWCO ranged from $0.0 to $146.9 million in the prior preliminary discussion materials dated 1/10/22 Present Value of Net Operating Losses (“NOLs”): SC and ML managements provided updated NOL Projections, reflecting ( i ) removal of IWCO from the Consolidated Projections, and (ii) revised assumptions related to breakdown of foreign vs. domestic earnings in the ML Projections 1 The present value of NOLs decreased by $40.9 million to $47.1 million relative to the prior preliminary discussion materials dated 1/10/22, primarily due to the impact of the IWCO disposition and ensuing reduction in projected taxable earnings The Preliminary Financial Analyses were updated to reflect the following updated financial information provided by SC and ML man agements: Updated based on use of Current FY 2022E forecast in the ML Projections (with projections for the outer years remaining uncha nge d) Balance sheet financials based on 1/31/22 figures (compared to 10/31/21 figures incorporated in the prior preliminary discuss ion materials dated 1/10/22) Capitalization information as of 3/1/22 (compared to information as of 12/28/21 incorporated in the prior preliminary discuss ion materials dated 1/10/22) Preliminary Selected Companies Analysis: The preliminary selected companies analysis for ML was updated to reflect stock prices and other publicly available financial in formation as of 3/31/22 (previously, as of 1/4/22 market close). See page 21 for further detail on observed multiples. No changes have been made to the selected multiples ranges relative to the prior preliminary discussion materials dated 1/10/ 22 Preliminary Illustrative Selected Transactions Analysis: The ML preliminary illustrative selected transactions were updated to include the recently announced acquisitions of ( i ) Clipper Logistics plc by GXO Logistics, Inc., (ii) Kane Logistics, Inc. by ID Logistics Group SA, (iii) LF Logistics Holdings Limited by A.P. Møller - Mærsk A/S and (iv) Whiplash Inc. by Ryder System, Inc. The preliminary illustrative selected transactions analysis for ModusLink was updated to reflect ( i ) capitalization of FY 2022E Adjusted EBITDA instead of the corresponding metric for FY 2021 (given the passage of time) and (ii) an increase to the selected multiple range by 0.5x rela tiv e to the prior preliminary discussion materials dated 1/10/22 Preliminary Discounted Cash Flow (“DCF”) Analysis: Stock prices, betas, risk - free rates and other public information utilized in discount rate calculations have been updated to ma rket close on 3/31/22 (previously, as of 1/4/22 market close) No changes have been made to the selected discount rate range and the selected perpetual growth rates utilized in the prelimi nar y DCF analysis relative to the prior preliminary discussion materials dated 1/10/22 1. The Consolidated Projections now incorporate $97 million of incremental NOLs generated from the IWCO disposition, but such NO Ls are not projected to be able to be utilized due to limited US earnings . 19
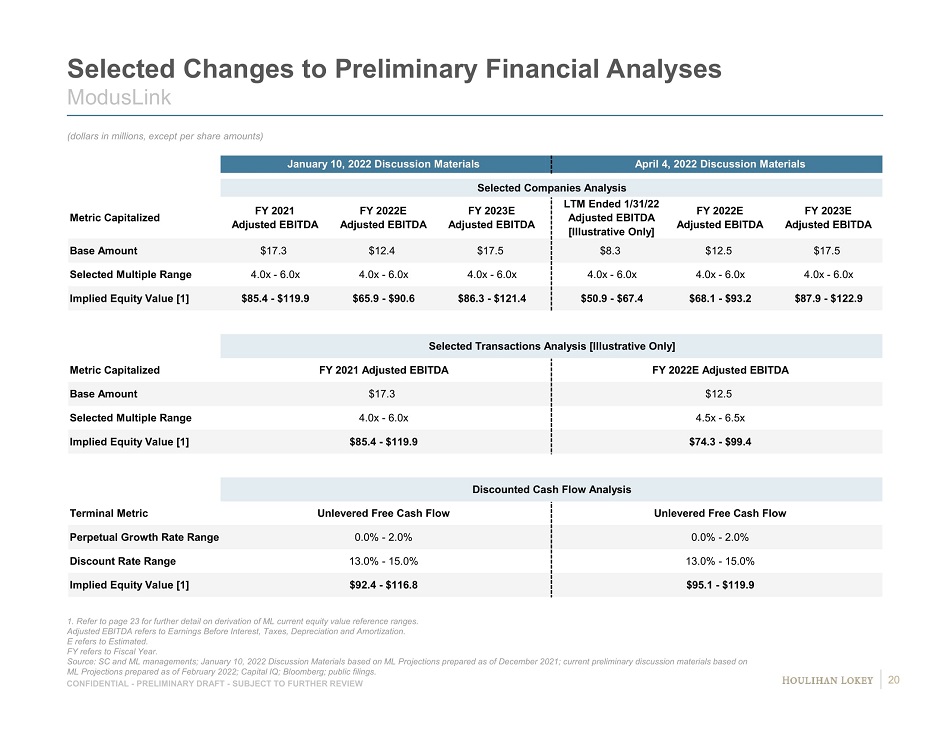
CONFIDENTIAL - PRELIMINARY DRAFT - SUBJECT TO FURTHER REVIEW Selected Changes to Preliminary Financial Analyses ModusLink 1. Refer to page 23 for further detail on derivation of ML current equity value reference ranges. Adjusted EBITDA refers to Earnings Before Interest, Taxes, Depreciation and Amortization. E refers to Estimated. FY refers to Fiscal Year. Source: SC and ML managements; January 10, 2022 Discussion Materials based on ML Projections prepared as of December 2021; cu rre nt preliminary discussion materials based on ML Projections prepared as of February 2022; Capital IQ; Bloomberg; public filings. (dollars in millions, except per share amounts) January 10, 2022 Discussion Materials April 4, 2022 Discussion Materials Selected Companies Analysis Metric Capitalized FY 2021 Adjusted EBITDA FY 2022E Adjusted EBITDA FY 2023E Adjusted EBITDA LTM Ended 1/31/22 Adjusted EBITDA [Illustrative Only] FY 2022E Adjusted EBITDA FY 2023E Adjusted EBITDA Base Amount $17.3 $12.4 $17.5 $8.3 $12.5 $17.5 Selected Multiple Range 4.0x - 6.0x 4.0x - 6.0x 4.0x - 6.0x 4.0x - 6.0x 4.0x - 6.0x 4.0x - 6.0x Implied Equity Value [1] $85.4 - $119.9 $65.9 - $90.6 $86.3 - $121.4 $50.9 - $67.4 $68.1 - $93.2 $87.9 - $122.9 Selected Transactions Analysis [Illustrative Only] Metric Capitalized FY 2021 Adjusted EBITDA FY 2022E Adjusted EBITDA Base Amount $17.3 $12.5 Selected Multiple Range 4.0x - 6.0x 4.5x - 6.5x Implied Equity Value [1] $85.4 - $119.9 $74.3 - $99.4 Discounted Cash Flow Analysis Terminal Metric Unlevered Free Cash Flow Unlevered Free Cash Flow Perpetual Growth Rate Range 0.0% - 2.0% 0.0% - 2.0% Discount Rate Range 13.0% - 15.0% 13.0% - 15.0% Implied Equity Value [1] $92.4 - $116.8 $95.1 - $119.9 20
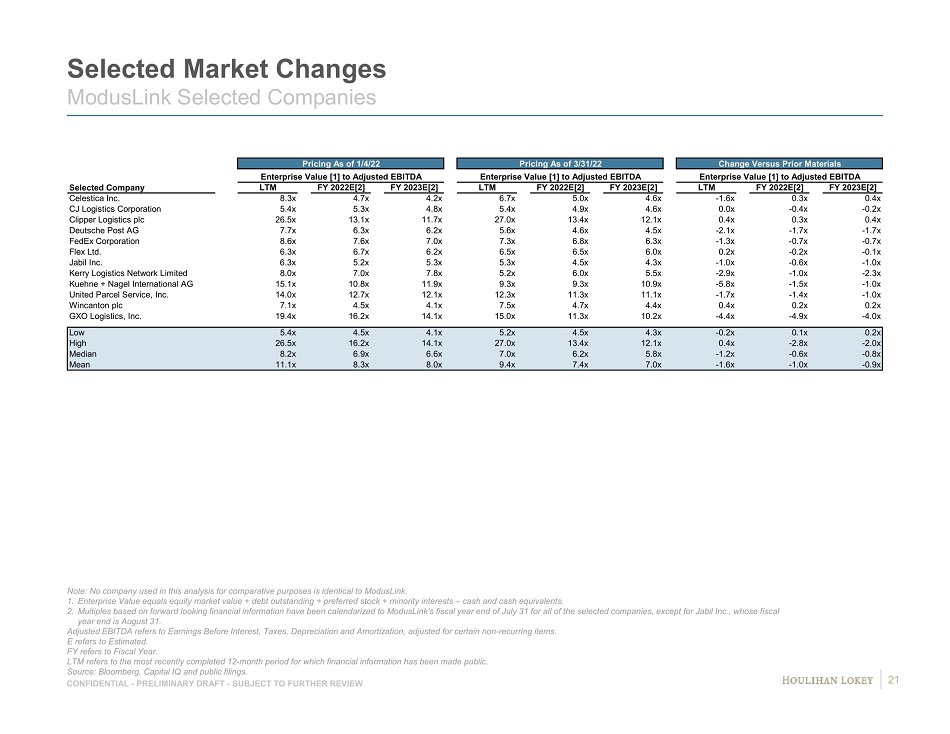
CONFIDENTIAL - PRELIMINARY DRAFT - SUBJECT TO FURTHER REVIEW Selected Market Changes ModusLink Selected Companies Note: No company used in this analysis for comparative purposes is identical to ModusLink. 1. Enterprise Value equals equity market value + debt outstanding + preferred stock + minority interests – cash and cash equivalent s. 2. Multiples based on forward looking financial information have been calendarized to ModusLink’s fiscal year end of July 31 for all of the selected companies, except for Jabil Inc., whose fiscal year end is August 31. Adjusted EBITDA refers to Earnings Before Interest, Taxes, Depreciation and Amortization, adjusted for certain non - recurring ite ms. E refers to Estimated. FY refers to Fiscal Year. LTM refers to the most recently completed 12 - month period for which financial information has been made public. Source: Bloomberg, Capital IQ and public filings. Pricing As of 1/4/22 Pricing As of 3/31/22 Change Versus Prior Materials Enterprise Value [1] to Adjusted EBITDA Enterprise Value [1] to Adjusted EBITDA Enterprise Value [1] to Adjusted EBITDA Selected Company LTM FY 2022E[2] FY 2023E[2] LTM FY 2022E[2] FY 2023E[2] LTM FY 2022E[2] FY 2023E[2] Celestica Inc. 8.3x 4.7x 4.2x 6.7x 5.0x 4.6x -1.6x 0.3x 0.4x CJ Logistics Corporation 5.4x 5.3x 4.8x 5.4x 4.9x 4.6x 0.0x -0.4x -0.2x Clipper Logistics plc 26.5x 13.1x 11.7x 27.0x 13.4x 12.1x 0.4x 0.3x 0.4x Deutsche Post AG 7.7x 6.3x 6.2x 5.6x 4.6x 4.5x -2.1x -1.7x -1.7x FedEx Corporation 8.6x 7.6x 7.0x 7.3x 6.8x 6.3x -1.3x -0.7x -0.7x Flex Ltd. 6.3x 6.7x 6.2x 6.5x 6.5x 6.0x 0.2x -0.2x -0.1x Jabil Inc. 6.3x 5.2x 5.3x 5.3x 4.5x 4.3x -1.0x -0.6x -1.0x Kerry Logistics Network Limited 8.0x 7.0x 7.8x 5.2x 6.0x 5.5x -2.9x -1.0x -2.3x Kuehne + Nagel International AG 15.1x 10.8x 11.9x 9.3x 9.3x 10.9x -5.8x -1.5x -1.0x United Parcel Service, Inc. 14.0x 12.7x 12.1x 12.3x 11.3x 11.1x -1.7x -1.4x -1.0x Wincanton plc 7.1x 4.5x 4.1x 7.5x 4.7x 4.4x 0.4x 0.2x 0.2x GXO Logistics, Inc. 19.4x 16.2x 14.1x 15.0x 11.3x 10.2x -4.4x -4.9x -4.0x Low 5.4x 4.5x 4.1x 5.2x 4.5x 4.3x -0.2x 0.1x 0.2x High 26.5x 16.2x 14.1x 27.0x 13.4x 12.1x 0.4x -2.8x -2.0x Median 8.2x 6.9x 6.6x 7.0x 6.2x 5.8x -1.2x -0.6x -0.8x Mean 11.1x 8.3x 8.0x 9.4x 7.4x 7.0x -1.6x -1.0x -0.9x 21
Page 1. Selected General Updates 3 2. Preliminary Financial Analyses Summary 12 3. Selected Changes to Preliminary Discussion Materials Dated 1/10/22 18 4. Preliminary Financial Analyses: ModusLink 22 5. Appendices 29 6. Disclaimer 36
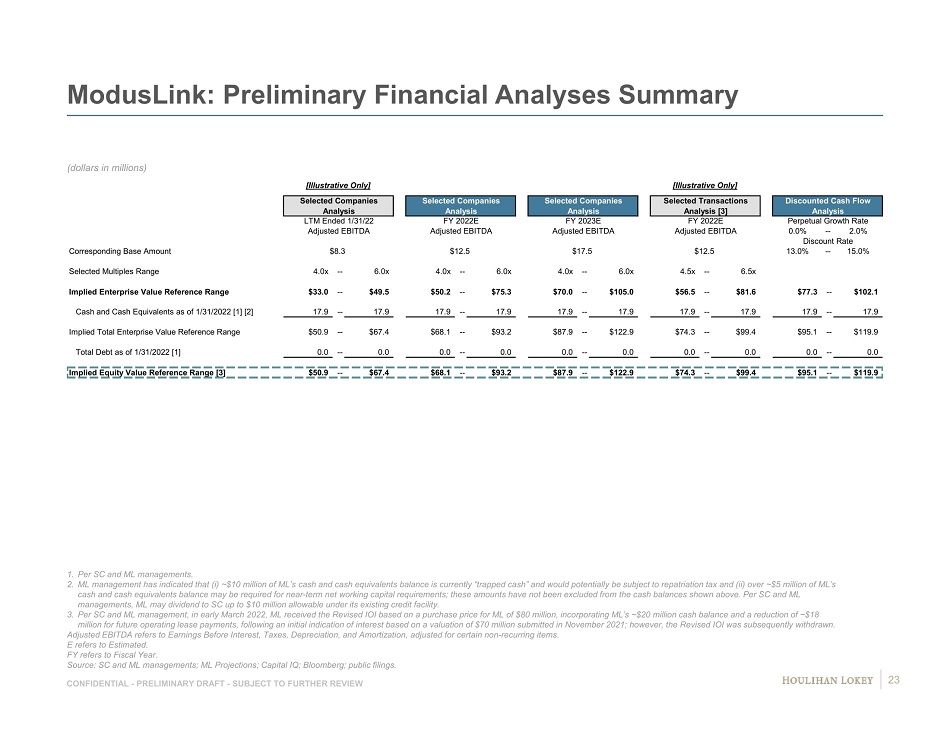
CONFIDENTIAL - PRELIMINARY DRAFT - SUBJECT TO FURTHER REVIEW ModusLink : Preliminary Financial Analyses Summary (dollars in millions) 1. Per SC and ML managements. 2. ML management has indicated that ( i ) ~$10 million of ML’s cash and cash equivalents balance is currently “trapped cash” and would potentially be subject to repa tri ation tax and (ii) over ~$5 million of ML’s cash and cash equivalents balance may be required for near - term net working capital requirements; these amounts have not been ex cluded from the cash balances shown above. Per SC and ML managements, ML may dividend to SC up to $10 million allowable under its existing credit facility. 3. Per SC and ML management, in early March 2022, ML received the Revised IOI based on a purchase price for ML of $80 million, i nco rporating ML’s ~$20 million cash balance and a reduction of ~$18 million for future operating lease payments, following an initial indication of interest based on a valuation of $70 million sub mitted in November 2021; however, the Revised IOI was subsequently withdrawn. Adjusted EBITDA refers to Earnings Before Interest, Taxes, Depreciation, and Amortization, adjusted for certain non - recurring it ems. E refers to Estimated. FY refers to Fiscal Year. Source: SC and ML managements; ML Projections; Capital IQ; Bloomberg; public filings. [Illustrative Only] [Illustrative Only] Selected Companies Selected Companies Selected Companies Selected Transactions Discounted Cash Flow Analysis Analysis Analysis Analysis [3] Analysis LTM Ended 1/31/22 FY 2022E FY 2023E FY 2022E Perpetual Growth Rate Adjusted EBITDA Adjusted EBITDA Adjusted EBITDA Adjusted EBITDA 0.0% -- 2.0% Discount Rate Corresponding Base Amount $8.3 $12.5 $17.5 $12.5 13.0% -- 15.0% Selected Multiples Range 4.0x -- 6.0x 4.0x -- 6.0x 4.0x -- 6.0x 4.5x -- 6.5x Implied Enterprise Value Reference Range $33.0 -- $49.5 $50.2 -- $75.3 $70.0 -- $105.0 $56.5 -- $81.6 $77.3 -- $102.1 Cash and Cash Equivalents as of 1/31/2022 [1] [2] 17.9 -- 17.9 17.9 -- 17.9 17.9 -- 17.9 17.9 -- 17.9 17.9 -- 17.9 Implied Total Enterprise Value Reference Range $50.9 -- $67.4 $68.1 -- $93.2 $87.9 -- $122.9 $74.3 -- $99.4 $95.1 -- $119.9 Total Debt as of 1/31/2022 [1] 0.0 -- 0.0 0.0 -- 0.0 0.0 -- 0.0 0.0 -- 0.0 0.0 -- 0.0 Implied Equity Value Reference Range [3] $50.9 -- $67.4 $68.1 -- $93.2 $87.9 -- $122.9 $74.3 -- $99.4 $95.1 -- $119.9 23
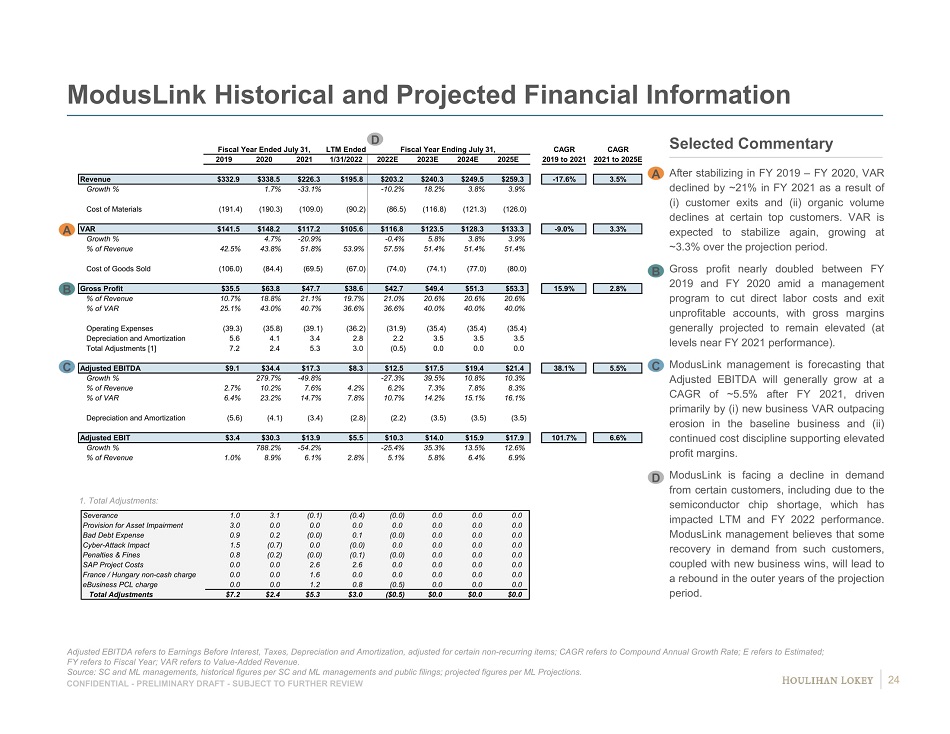
CONFIDENTIAL - PRELIMINARY DRAFT - SUBJECT TO FURTHER REVIEW ModusLink Historical and Projected Financial Information 1. Total Adjustments: Adjusted EBITDA refers to Earnings Before Interest, Taxes, Depreciation and Amortization, adjusted for certain non - recurring ite ms; CAGR refers to Compound Annual Growth Rate; E refers to Estimated; FY refers to Fiscal Year; VAR refers to Value - Added Revenue. Source: SC and ML managements, historical figures per SC and ML managements and public filings; projected figures per ML Proj ect ions. After stabilizing in FY 2019 – FY 2020 , VAR declined by ~ 21 % in FY 2021 as a result of (i) customer exits and (ii) organic volume declines at certain top customers . VAR is expected to stabilize again, growing at ~ 3 . 3 % over the projection period . Gross profit nearly doubled between FY 2019 and FY 2020 amid a management program to cut direct labor costs and exit unprofitable accounts, with gross margins generally projected to remain elevated (at levels near FY 2021 performance) . ModusLink management is forecasting that Adjusted EBITDA will generally grow at a CAGR of ~ 5 . 5 % after FY 2021 , driven primarily by (i) new business VAR outpacing erosion in the baseline business and (ii) continued cost discipline supporting elevated profit margins . ModusLink is facing a decline in demand from certain customers, including due to the semiconductor chip shortage, which has impacted LTM and FY 2022 performance . ModusLink management believes that some recovery in demand from such customers, coupled with new business wins, will lead to a rebound in the outer years of the projection period . C B A Selected Commentary C A B D D Fiscal Year Ended July 31, LTM Ended Fiscal Year Ending July 31, CAGR CAGR 2019 2020 2021 1/31/2022 2022E 2023E 2024E 2025E 2019 to 2021 2021 to 2025E Revenue $332.9 $338.5 $226.3 $195.8 $203.2 $240.3 $249.5 $259.3 -17.6% 3.5% Growth % 1.7% -33.1% -10.2% 18.2% 3.8% 3.9% Cost of Materials (191.4) (190.3) (109.0) (90.2) (86.5) (116.8) (121.3) (126.0) VAR $141.5 $148.2 $117.2 $105.6 $116.8 $123.5 $128.3 $133.3 -9.0% 3.3% Growth % 4.7% -20.9% -0.4% 5.8% 3.8% 3.9% % of Revenue 42.5% 43.8% 51.8% 53.9% 57.5% 51.4% 51.4% 51.4% Cost of Goods Sold (106.0) (84.4) (69.5) (67.0) (74.0) (74.1) (77.0) (80.0) Gross Profit $35.5 $63.8 $47.7 $38.6 $42.7 $49.4 $51.3 $53.3 15.9% 2.8% % of Revenue 10.7% 18.8% 21.1% 19.7% 21.0% 20.6% 20.6% 20.6% % of VAR 25.1% 43.0% 40.7% 36.6% 36.6% 40.0% 40.0% 40.0% Operating Expenses (39.3) (35.8) (39.1) (36.2) (31.9) (35.4) (35.4) (35.4) Depreciation and Amortization 5.6 4.1 3.4 2.8 2.2 3.5 3.5 3.5 Total Adjustments [1] 7.2 2.4 5.3 3.0 (0.5) 0.0 0.0 0.0 Adjusted EBITDA $9.1 $34.4 $17.3 $8.3 $12.5 $17.5 $19.4 $21.4 38.1% 5.5% Growth % 279.7% -49.8% -27.3% 39.5% 10.8% 10.3% % of Revenue 2.7% 10.2% 7.6% 4.2% 6.2% 7.3% 7.8% 8.3% % of VAR 6.4% 23.2% 14.7% 7.8% 10.7% 14.2% 15.1% 16.1% Depreciation and Amortization (5.6) (4.1) (3.4) (2.8) (2.2) (3.5) (3.5) (3.5) Adjusted EBIT $3.4 $30.3 $13.9 $5.5 $10.3 $14.0 $15.9 $17.9 101.7% 6.6% Growth % 788.2% -54.2% -25.4% 35.3% 13.5% 12.6% % of Revenue 1.0% 8.9% 6.1% 2.8% 5.1% 5.8% 6.4% 6.9% Severance 1.0 3.1 (0.1) (0.4) (0.0) 0.0 0.0 0.0 Provision for Asset Impairment 3.0 0.0 0.0 0.0 0.0 0.0 0.0 0.0 Bad Debt Expense 0.9 0.2 (0.0) 0.1 (0.0) 0.0 0.0 0.0 Cyber-Attack Impact 1.5 (0.7) 0.0 (0.0) 0.0 0.0 0.0 0.0 Penalties & Fines 0.8 (0.2) (0.0) (0.1) (0.0) 0.0 0.0 0.0 SAP Project Costs 0.0 0.0 2.6 2.6 0.0 0.0 0.0 0.0 France / Hungary non-cash charge 0.0 0.0 1.6 0.0 0.0 0.0 0.0 0.0 eBusiness PCL charge 0.0 0.0 1.2 0.8 (0.5) 0.0 0.0 0.0 Total Adjustments $7.2 $2.4 $5.3 $3.0 ($0.5) $0.0 $0.0 $0.0 24
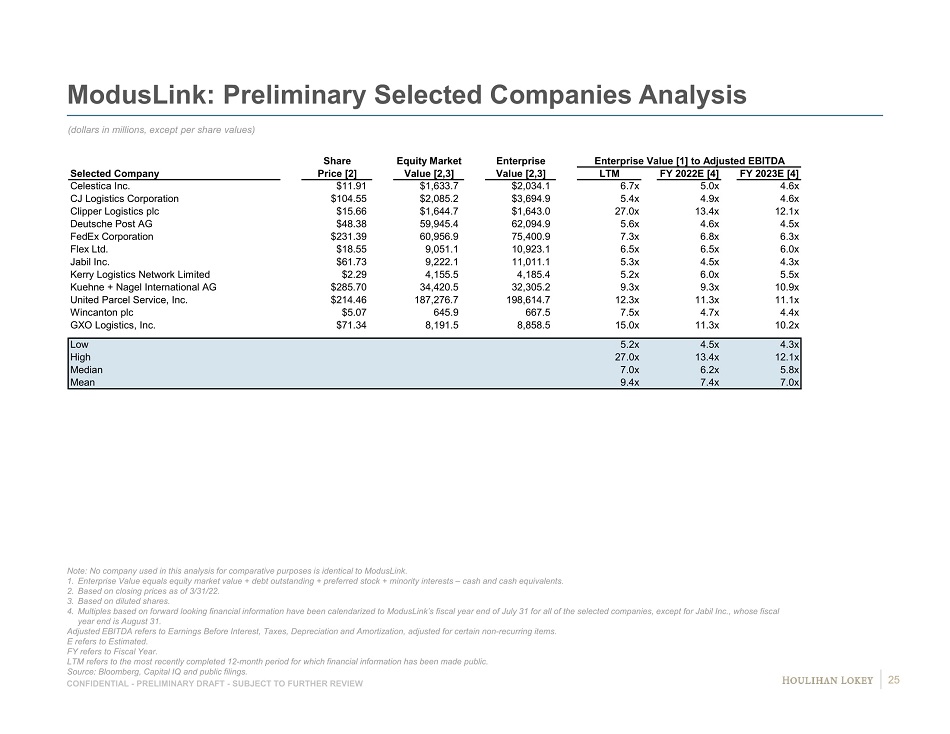
CONFIDENTIAL - PRELIMINARY DRAFT - SUBJECT TO FURTHER REVIEW ModusLink: Preliminary Selected Companies Analysis (dollars in millions, except per share values) Note: No company used in this analysis for comparative purposes is identical to ModusLink. 1. Enterprise Value equals equity market value + debt outstanding + preferred stock + minority interests – cash and cash equivalent s. 2. Based on closing prices as of 3/31/22. 3. Based on diluted shares. 4. Multiples based on forward looking financial information have been calendarized to ModusLink’s fiscal year end of July 31 for al l of the selected companies, except for Jabil Inc., whose fiscal year end is August 31. Adjusted EBITDA refers to Earnings Before Interest, Taxes, Depreciation and Amortization, adjusted for certain non - recurring ite ms. E refers to Estimated. FY refers to Fiscal Year. LTM refers to the most recently completed 12 - month period for which financial information has been made public. Source: Bloomberg, Capital IQ and public filings. Share Equity Market Enterprise Enterprise Value [1] to Adjusted EBITDA Selected Company Price [2] Value [2,3] Value [2,3] LTM FY 2022E [4] FY 2023E [4] Celestica Inc. $11.91 $1,633.7 $2,034.1 6.7x 5.0x 4.6x CJ Logistics Corporation $104.55 $2,085.2 $3,694.9 5.4x 4.9x 4.6x Clipper Logistics plc $15.66 $1,644.7 $1,643.0 27.0x 13.4x 12.1x Deutsche Post AG $48.38 59,945.4 62,094.9 5.6x 4.6x 4.5x FedEx Corporation $231.39 60,956.9 75,400.9 7.3x 6.8x 6.3x Flex Ltd. $18.55 9,051.1 10,923.1 6.5x 6.5x 6.0x Jabil Inc. $61.73 9,222.1 11,011.1 5.3x 4.5x 4.3x Kerry Logistics Network Limited $2.29 4,155.5 4,185.4 5.2x 6.0x 5.5x Kuehne + Nagel International AG $285.70 34,420.5 32,305.2 9.3x 9.3x 10.9x United Parcel Service, Inc. $214.46 187,276.7 198,614.7 12.3x 11.3x 11.1x Wincanton plc $5.07 645.9 667.5 7.5x 4.7x 4.4x GXO Logistics, Inc. $71.34 8,191.5 8,858.5 15.0x 11.3x 10.2x Low 5.2x 4.5x 4.3x High 27.0x 13.4x 12.1x Median 7.0x 6.2x 5.8x Mean 9.4x 7.4x 7.0x 25
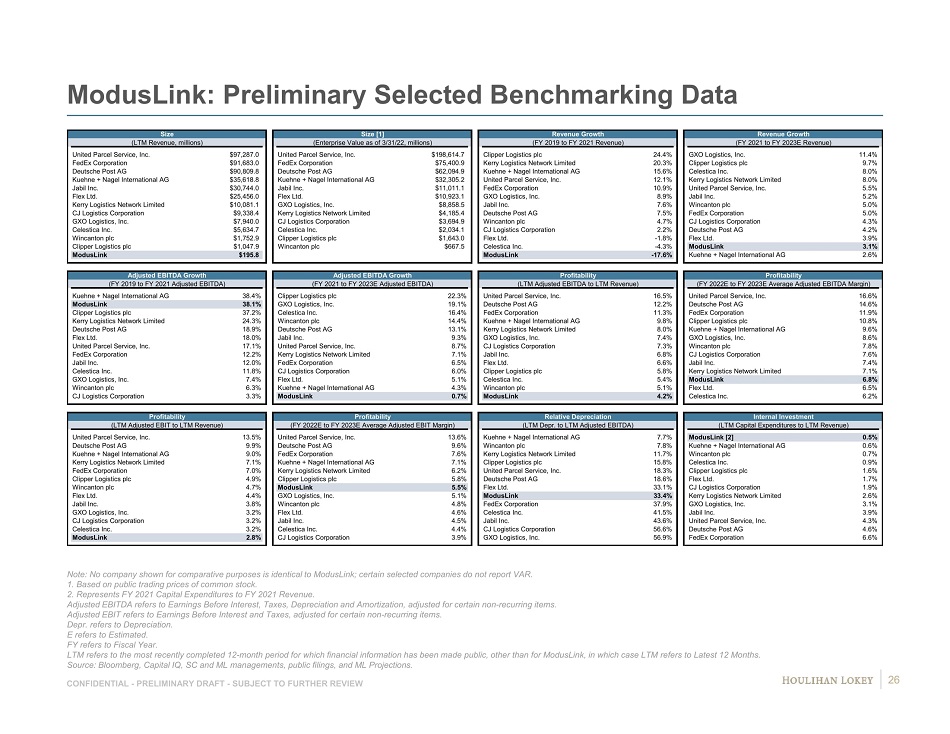
CONFIDENTIAL - PRELIMINARY DRAFT - SUBJECT TO FURTHER REVIEW ModusLink: Preliminary Selected Benchmarking Data Note: No company shown for comparative purposes is identical to ModusLink; certain selected companies do not report VAR. 1. Based on public trading prices of common stock. 2. Represents FY 2021 Capital Expenditures to FY 2021 Revenue. Adjusted EBITDA refers to Earnings Before Interest, Taxes, Depreciation and Amortization, adjusted for certain non - recurring ite ms. Adjusted EBIT refers to Earnings Before Interest and Taxes, adjusted for certain non - recurring items. Depr. refers to Depreciation. E refers to Estimated. FY refers to Fiscal Year. LTM refers to the most recently completed 12 - month period for which financial information has been made public, other than for M odusLink, in which case LTM refers to Latest 12 Months. Source: Bloomberg, Capital IQ, SC and ML managements, public filings, and ML Projections. Size Size [1] Revenue Growth Revenue Growth (LTM Revenue, millions) (Enterprise Value as of 3/31/22, millions) (FY 2019 to FY 2021 Revenue) (FY 2021 to FY 2023E Revenue) Name Value Name Value Name Value Name Value United Parcel Service, Inc. $97,287.0 United Parcel Service, Inc. $198,614.7 Clipper Logistics plc 24.4% GXO Logistics, Inc. 11.4% FedEx Corporation $91,683.0 FedEx Corporation $75,400.9 Kerry Logistics Network Limited 20.3% Clipper Logistics plc 9.7% Deutsche Post AG $90,809.8 Deutsche Post AG $62,094.9 Kuehne + Nagel International AG 15.6% Celestica Inc. 8.0% Kuehne + Nagel International AG $35,618.8 Kuehne + Nagel International AG $32,305.2 United Parcel Service, Inc. 12.1% Kerry Logistics Network Limited 8.0% Jabil Inc. $30,744.0 Jabil Inc. $11,011.1 FedEx Corporation 10.9% United Parcel Service, Inc. 5.5% Flex Ltd. $25,456.0 Flex Ltd. $10,923.1 GXO Logistics, Inc. 8.9% Jabil Inc. 5.2% Kerry Logistics Network Limited $10,081.1 GXO Logistics, Inc. $8,858.5 Jabil Inc. 7.6% Wincanton plc 5.0% CJ Logistics Corporation $9,338.4 Kerry Logistics Network Limited $4,185.4 Deutsche Post AG 7.5% FedEx Corporation 5.0% GXO Logistics, Inc. $7,940.0 CJ Logistics Corporation $3,694.9 Wincanton plc 4.7% CJ Logistics Corporation 4.3% Celestica Inc. $5,634.7 Celestica Inc. $2,034.1 CJ Logistics Corporation 2.2% Deutsche Post AG 4.2% Wincanton plc $1,752.9 Clipper Logistics plc $1,643.0 Flex Ltd. -1.8% Flex Ltd. 3.9% Clipper Logistics plc $1,047.9 Wincanton plc $667.5 Celestica Inc. -4.3% ModusLink 3.1% ModusLink $195.8 ModusLink -17.6% Kuehne + Nagel International AG 2.6% Adjusted EBITDA Growth Adjusted EBITDA Growth Profitability Profitability (FY 2019 to FY 2021 Adjusted EBITDA) (FY 2021 to FY 2023E Adjusted EBITDA) (LTM Adjusted EBITDA to LTM Revenue) (FY 2022E to FY 2023E Average Adjusted EBITDA Margin) Name Value Name Value Name Value Name Value Kuehne + Nagel International AG 38.4% Clipper Logistics plc 22.3% United Parcel Service, Inc. 16.5% United Parcel Service, Inc. 16.6% ModusLink 38.1% GXO Logistics, Inc. 19.1% Deutsche Post AG 12.2% Deutsche Post AG 14.6% Clipper Logistics plc 37.2% Celestica Inc. 16.4% FedEx Corporation 11.3% FedEx Corporation 11.9% Kerry Logistics Network Limited 24.3% Wincanton plc 14.4% Kuehne + Nagel International AG 9.8% Clipper Logistics plc 10.8% Deutsche Post AG 18.9% Deutsche Post AG 13.1% Kerry Logistics Network Limited 8.0% Kuehne + Nagel International AG 9.6% Flex Ltd. 18.0% Jabil Inc. 9.3% GXO Logistics, Inc. 7.4% GXO Logistics, Inc. 8.6% United Parcel Service, Inc. 17.1% United Parcel Service, Inc. 8.7% CJ Logistics Corporation 7.3% Wincanton plc 7.8% FedEx Corporation 12.2% Kerry Logistics Network Limited 7.1% Jabil Inc. 6.8% CJ Logistics Corporation 7.6% Jabil Inc. 12.0% FedEx Corporation 6.5% Flex Ltd. 6.6% Jabil Inc. 7.4% Celestica Inc. 11.8% CJ Logistics Corporation 6.0% Clipper Logistics plc 5.8% Kerry Logistics Network Limited 7.1% GXO Logistics, Inc. 7.4% Flex Ltd. 5.1% Celestica Inc. 5.4% ModusLink 6.8% Wincanton plc 6.3% Kuehne + Nagel International AG 4.3% Wincanton plc 5.1% Flex Ltd. 6.5% CJ Logistics Corporation 3.3% ModusLink 0.7% ModusLink 4.2% Celestica Inc. 6.2% Profitability Profitability Relative Depreciation Internal Investment (LTM Adjusted EBIT to LTM Revenue) (FY 2022E to FY 2023E Average Adjusted EBIT Margin) (LTM Depr. to LTM Adjusted EBITDA) (LTM Capital Expenditures to LTM Revenue) Name Value Name Value Name Value Name Value United Parcel Service, Inc. 13.5% United Parcel Service, Inc. 13.6% Kuehne + Nagel International AG 7.7% ModusLink [2] 0.5% Deutsche Post AG 9.9% Deutsche Post AG 9.6% Wincanton plc 7.8% Kuehne + Nagel International AG 0.6% Kuehne + Nagel International AG 9.0% FedEx Corporation 7.6% Kerry Logistics Network Limited 11.7% Wincanton plc 0.7% Kerry Logistics Network Limited 7.1% Kuehne + Nagel International AG 7.1% Clipper Logistics plc 15.8% Celestica Inc. 0.9% FedEx Corporation 7.0% Kerry Logistics Network Limited 6.2% United Parcel Service, Inc. 18.3% Clipper Logistics plc 1.6% Clipper Logistics plc 4.9% Clipper Logistics plc 5.8% Deutsche Post AG 18.6% Flex Ltd. 1.7% Wincanton plc 4.7% ModusLink 5.5% Flex Ltd. 33.1% CJ Logistics Corporation 1.9% Flex Ltd. 4.4% GXO Logistics, Inc. 5.1% ModusLink 33.4% Kerry Logistics Network Limited 2.6% Jabil Inc. 3.8% Wincanton plc 4.8% FedEx Corporation 37.9% GXO Logistics, Inc. 3.1% GXO Logistics, Inc. 3.2% Flex Ltd. 4.6% Celestica Inc. 41.5% Jabil Inc. 3.9% CJ Logistics Corporation 3.2% Jabil Inc. 4.5% Jabil Inc. 43.6% United Parcel Service, Inc. 4.3% Celestica Inc. 3.2% Celestica Inc. 4.4% CJ Logistics Corporation 56.6% Deutsche Post AG 4.6% ModusLink 2.8% CJ Logistics Corporation 3.9% GXO Logistics, Inc. 56.9% FedEx Corporation 6.6% 26
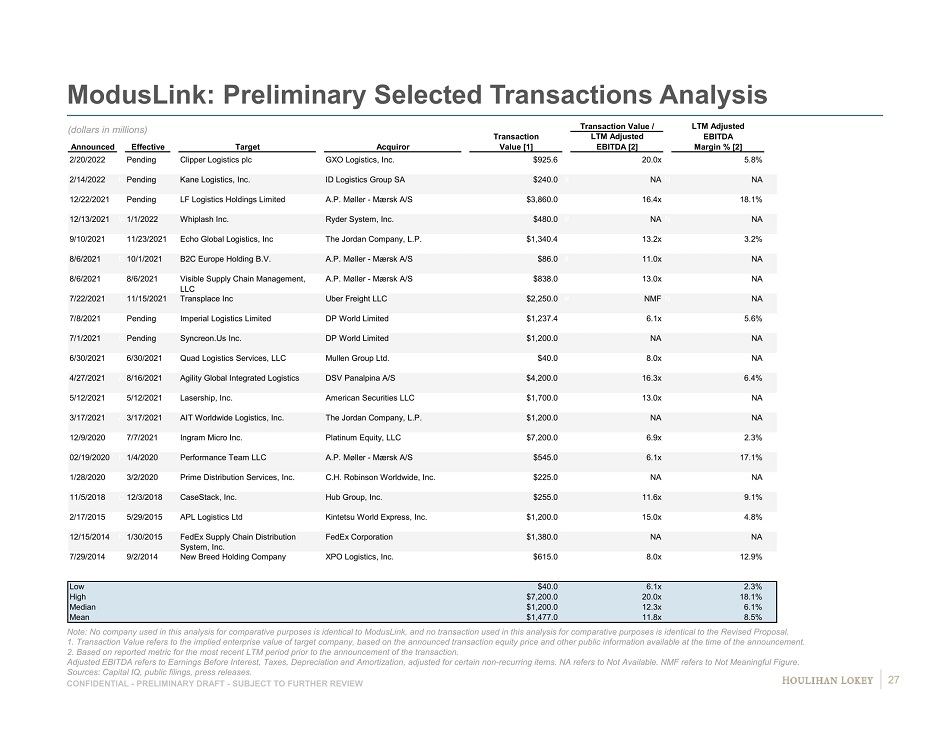
CONFIDENTIAL - PRELIMINARY DRAFT - SUBJECT TO FURTHER REVIEW ModusLink: Preliminary Selected Transactions Analysis Note: No company used in this analysis for comparative purposes is identical to ModusLink, and no transaction used in this an aly sis for comparative purposes is identical to the Revised Proposal. 1. Transaction Value refers to the implied enterprise value of target company, based on the announced transaction equity pric e a nd other public information available at the time of the announcement. 2. Based on reported metric for the most recent LTM period prior to the announcement of the transaction. Adjusted EBITDA refers to Earnings Before Interest, Taxes, Depreciation and Amortization, adjusted for certain non - recurring ite ms. NA refers to Not Available. NMF refers to Not Meaningful Figure. Sources: Capital IQ, public filings, press releases. (dollars in millions) Transaction Value / LTM Adjusted Transaction LTM Adjusted EBITDA Announced Effective Target Acquiror Value [1] EBITDA [2] Margin % [2] CLGPending Clipper Logistics plc GXO Logistics, Inc. $925.6 # 20.0x 5.8% KLIPending Kane Logistics, Inc. ID Logistics Group SA $240.0 # NANA NA LFLPending LF Logistics Holdings Limited A.P. Møller - Mærsk A/S $3,860.0 # 16.4x 18.1% WHIP1/1/2022 Whiplash Inc. Ryder System, Inc. $480.0 # NANA NA ECHO11/23/2021 Echo Global Logistics, Inc The Jordan Company, L.P. $1,340.4 # 13.2x 3.2% BCEH10/1/2021 B2C Europe Holding B.V. A.P. Møller - Mærsk A/S $86.0 # 11.0x NA VSCM8/6/2021 Visible Supply Chain Management, LLC A.P. Møller - Mærsk A/S $838.0 # 13.0x NA Trans11/15/2021 Transplace Inc Uber Freight LLC $2,250.0 # NMFNMF NA IPLPending Imperial Logistics Limited DP World Limited $1,237.4 # 6.1x 5.6% Syncreon Syncreon.Us Inc. DP World Limited $1,200.0 NA NA 6/30/2021 Quad Logistics Services, LLC Mullen Group Ltd. $40.0 8.0x NA AGI Agility Global Integrated Logistics DSV Panalpina A/S $4,200.0 16.3x 6.4% Lasership Lasership, Inc. American Securities LLC $1,700.0 13.0x NA AIT AIT Worldwide Logistics, Inc. The Jordan Company, L.P. $1,200.0 NA NA Ingram Ingram Micro Inc. Platinum Equity, LLC $7,200.0 6.9x 2.3% Performance Performance Team LLC A.P. Møller - Mærsk A/S $545.0 6.1x 17.1% PDS Prime Distribution Services, Inc. C.H. Robinson Worldwide, Inc. $225.0 NA NA CaseStack CaseStack, Inc. Hub Group, Inc. $255.0 11.6x 9.1% APL APL Logistics Ltd Kintetsu World Express, Inc. $1,200.0 15.0x 4.8% FSCDS FedEx Supply Chain Distribution System, Inc. FedEx Corporation $1,380.0 NA NA New Breed New Breed Holding Company XPO Logistics, Inc. $615.0 8.0x 12.9% Low $40.0 6.1x 2.3% High $7,200.0 20.0x 18.1% Median $1,200.0 12.3x 6.1% Mean $1,477.0 11.8x 8.5% 1/30/2015 9/2/2014 3/2/2020 7/7/2021 1/4/2020 12/3/2018 5/29/2015 12/9/2020 02/19/2020 1/28/2020 11/5/2018 2/17/2015 12/15/2014 7/29/2014 5/12/2021 3/17/2021 3/17/2021 7/1/2021 Pending 4/27/2021 8/16/2021 6/30/2021 7/8/2021 8/6/2021 8/6/2021 9/10/2021 5/12/2021 2/20/2022 2/14/2022 12/22/2021 12/13/2021 7/22/2021 27
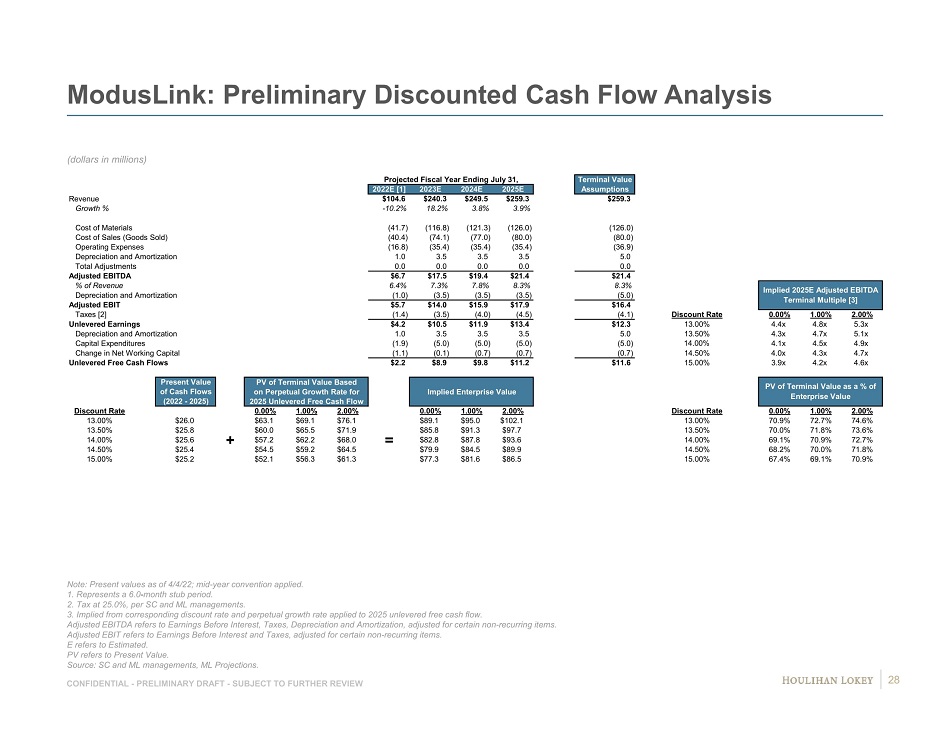
CONFIDENTIAL - PRELIMINARY DRAFT - SUBJECT TO FURTHER REVIEW ModusLink: Preliminary Discounted Cash Flow Analysis (dollars in millions) Note: Present values as of 4/4/22; mid - year convention applied. 1. Represents a 6.0 - month stub period. 2. Tax at 25.0%, per SC and ML managements. 3. Implied from corresponding discount rate and perpetual growth rate applied to 2025 unlevered free cash flow. Adjusted EBITDA refers to Earnings Before Interest, Taxes, Depreciation and Amortization, adjusted for certain non - recurring ite ms. Adjusted EBIT refers to Earnings Before Interest and Taxes, adjusted for certain non - recurring items. E refers to Estimated. PV refers to Present Value. Source: SC and ML managements, ML Projections. Projected Fiscal Year Ending July 31, Terminal Value 2022E [1] 2023E 2024E 2025E Assumptions Revenue $104.6 $240.3 $249.5 $259.3 $259.3 Growth % -10.2% 18.2% 3.8% 3.9% Cost of Materials (41.7) (116.8) (121.3) (126.0) (126.0) Cost of Sales (Goods Sold) (40.4) (74.1) (77.0) (80.0) (80.0) Operating Expenses (16.8) (35.4) (35.4) (35.4) (36.9) Depreciation and Amortization 1.0 3.5 3.5 3.5 5.0 Total Adjustments 0.0 0.0 0.0 0.0 0.0 Adjusted EBITDA $6.7 $17.5 $19.4 $21.4 $21.4 % of Revenue 6.4% 7.3% 7.8% 8.3% 8.3% Depreciation and Amortization (1.0) (3.5) (3.5) (3.5) (5.0) Adjusted EBIT $5.7 $14.0 $15.9 $17.9 $16.4 Taxes [2] (1.4) (3.5) (4.0) (4.5) (4.1) Discount Rate 0.00% 1.00% 2.00% Unlevered Earnings $4.2 $10.5 $11.9 $13.4 $12.3 13.00% 4.4x 4.8x 5.3x Depreciation and Amortization 1.0 3.5 3.5 3.5 5.0 13.50% 4.3x 4.7x 5.1x Capital Expenditures (1.9) (5.0) (5.0) (5.0) (5.0) 14.00% 4.1x 4.5x 4.9x Change in Net Working Capital (1.1) (0.1) (0.7) (0.7) (0.7) 14.50% 4.0x 4.3x 4.7x Unlevered Free Cash Flows $2.2 $8.9 $9.8 $11.2 $11.6 15.00% 3.9x 4.2x 4.6x DCF Assumptions Present Value PV of Terminal Value Based of Cash Flows on Perpetual Growth Rate for Implied Enterprise Value (2022 - 2025) 2025 Unlevered Free Cash Flow Discount Rate 0.00% 1.00% 2.00% 0.00% 1.00% 2.00% Discount Rate 0.00% 1.00% 2.00% 13.00% $26.0 $63.1 $69.1 $76.1 $89.1 $95.0 $102.1 13.00% 70.9% 72.7% 74.6% 13.50% $25.8 $60.0 $65.5 $71.9 $85.8 $91.3 $97.7 13.50% 70.0% 71.8% 73.6% 14.00% $25.6 + $57.2 $62.2 $68.0 = $82.8 $87.8 $93.6 14.00% 69.1% 70.9% 72.7% 14.50% $25.4 $54.5 $59.2 $64.5 $79.9 $84.5 $89.9 14.50% 68.2% 70.0% 71.8% 15.00% $25.2 $52.1 $56.3 $61.3 $77.3 $81.6 $86.5 15.00% 67.4% 69.1% 70.9% Implied 2025E Adjusted EBITDA Terminal Multiple [3] PV of Terminal Value as a % of Enterprise Value 28
Page 1. Selected General Updates 3 2. Preliminary Financial Analyses Summary 12 3. Selected Changes to Preliminary Discussion Materials Dated 1/10/22 18 4. Preliminary Financial Analyses: ModusLink 22 5. Appendices 29 Supplemental Financial Analysis Schedule 30 Selected Public Market Observations 32 6. Disclaimer 36

Page 1. Selected General Updates 3 2. Preliminary Financial Analyses Summary 12 3. Selected Changes to Preliminary Discussion Materials Dated 1/10/22 18 4. Preliminary Financial Analyses: ModusLink 22 5. Appendices 29 Supplemental Financial Analysis Schedule 30 Selected Public Market Observations 32 6. Disclaimer 36
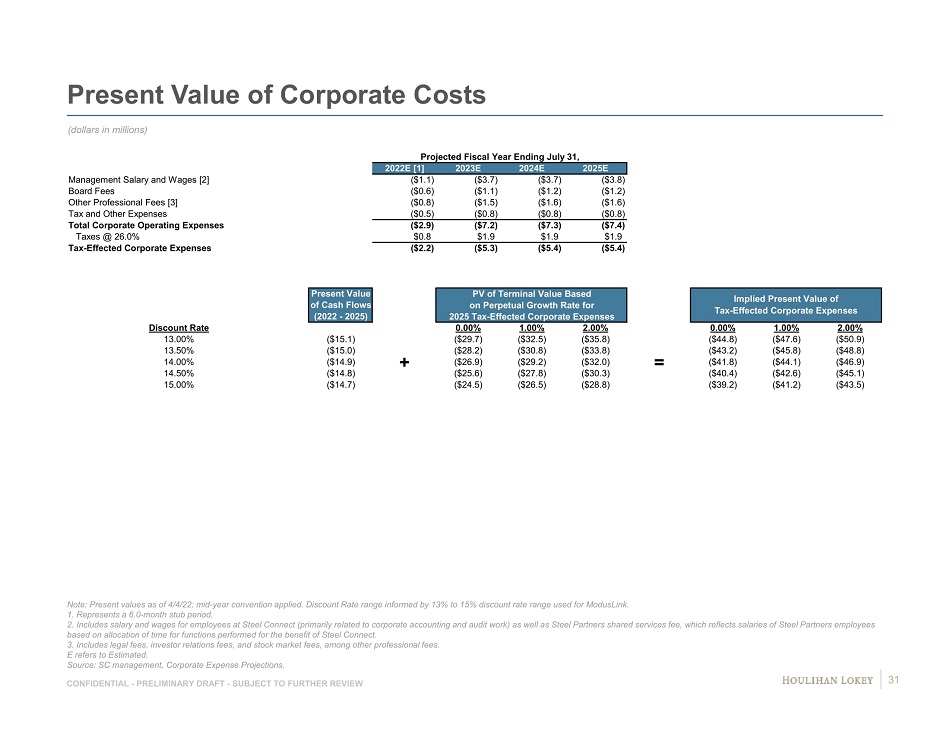
CONFIDENTIAL - PRELIMINARY DRAFT - SUBJECT TO FURTHER REVIEW Present Value of Corporate Costs Note: Present values as of 4/4/22; mid - year convention applied. Discount Rate range informed by 13% to 15% discount rate range u sed for ModusLink. 1. Represents a 6.0 - month stub period. 2. Includes salary and wages for employees at Steel Connect (primarily related to corporate accounting and audit work) as wel l a s Steel Partners shared services fee, which reflects salaries of Steel Partners employees based on allocation of time for functions performed for the benefit of Steel Connect. 3. Includes legal fees, investor relations fees, and stock market fees, among other professional fees. E refers to Estimated. Source: SC management, Corporate Expense Projections. (dollars in millions) Projected Fiscal Year Ending July 31, 2022E [1] 2023E 2024E 2025E Management Salary and Wages [2] ($1.1) ($3.7) ($3.7) ($3.8) Board Fees ($0.6) ($1.1) ($1.2) ($1.2) Other Professional Fees [3] ($0.8) ($1.5) ($1.6) ($1.6) Tax and Other Expenses ($0.5) ($0.8) ($0.8) ($0.8) Total Corporate Operating Expenses ($2.9) ($7.2) ($7.3) ($7.4) Taxes @ 26.0% $0.8 $1.9 $1.9 $1.9 Tax-Effected Corporate Expenses ($2.2) ($5.3) ($5.4) ($5.4) Present Value PV of Terminal Value Based of Cash Flows on Perpetual Growth Rate for (2022 - 2025) 2025 Tax-Effected Corporate Expenses Discount Rate 0.00% 1.00% 2.00% 0.00% 1.00% 2.00% 13.00% ($15.1) ($29.7) ($32.5) ($35.8) ($44.8) ($47.6) ($50.9) 13.50% ($15.0) ($28.2) ($30.8) ($33.8) ($43.2) ($45.8) ($48.8) 14.00% ($14.9) + ($26.9) ($29.2) ($32.0) = ($41.8) ($44.1) ($46.9) 14.50% ($14.8) ($25.6) ($27.8) ($30.3) ($40.4) ($42.6) ($45.1) 15.00% ($14.7) ($24.5) ($26.5) ($28.8) ($39.2) ($41.2) ($43.5) Implied Present Value of Tax-Effected Corporate Expenses 31
Page 1. Selected General Updates 3 2. Preliminary Financial Analyses Summary 12 3. Selected Changes to Preliminary Discussion Materials Dated 1/10/22 18 4. Preliminary Financial Analyses: ModusLink 22 5. Appendices 29 Supplemental Financial Analysis Schedule 30 Selected Public Market Observations 32 6. Disclaimer 36
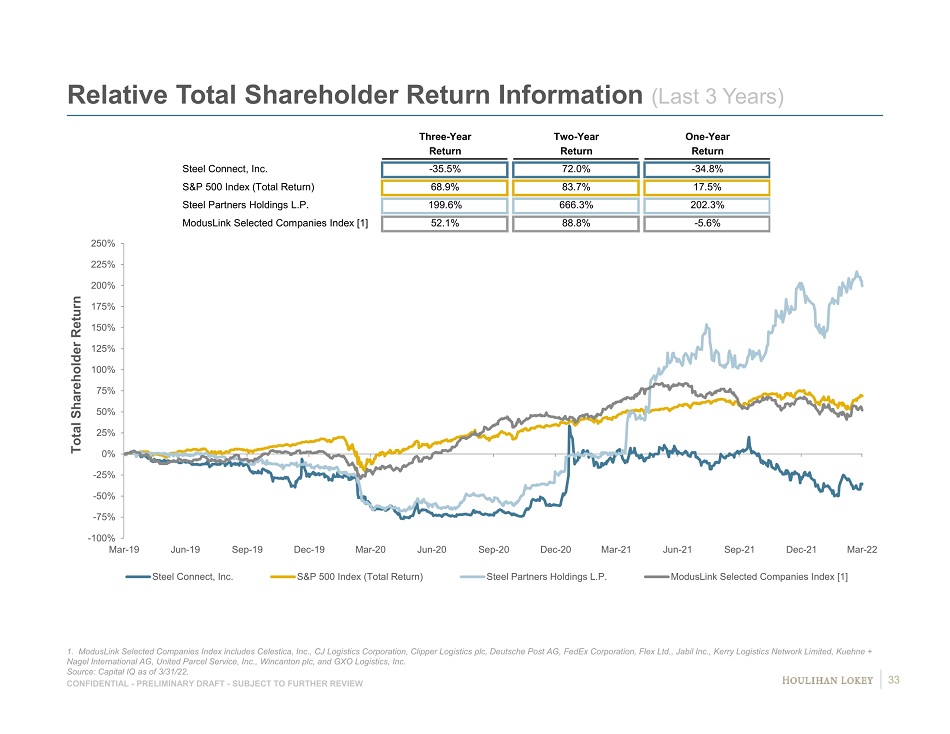
CONFIDENTIAL - PRELIMINARY DRAFT - SUBJECT TO FURTHER REVIEW Relative Total Shareholder Return Information (Last 3 Years) 1. ModusLink Selected Companies Index includes Celestica, Inc., CJ Logistics Corporation, Clipper Logistics plc, Deutsche Post AG, FedEx C or poration, Flex Ltd., Jabil Inc., Kerry Logistics Network Limited, Kuehne + Nagel International AG, United Parcel Service, Inc., Wincanton plc, and GXO Logistics, Inc. Source: Capital IQ as of 3/31/22. Total Shareholder Return -100% -75% -50% -25% 0% 25% 50% 75% 100% 125% 150% 175% 200% 225% 250% Mar-19 Jun-19 Sep-19 Dec-19 Mar-20 Jun-20 Sep-20 Dec-20 Mar-21 Jun-21 Sep-21 Dec-21 Mar-22 Steel Connect, Inc. S&P 500 Index (Total Return) Steel Partners Holdings L.P. ModusLink Selected Companies Index [1] Three-Year Two-Year One-Year Return Return Return Steel Connect, Inc. -35.5% 72.0% -34.8% S&P 500 Index (Total Return) 68.9% 83.7% 17.5% Steel Partners Holdings L.P. 199.6% 666.3% 202.3% ModusLink Selected Companies Index [1] 52.1% 88.8% -5.6% 33
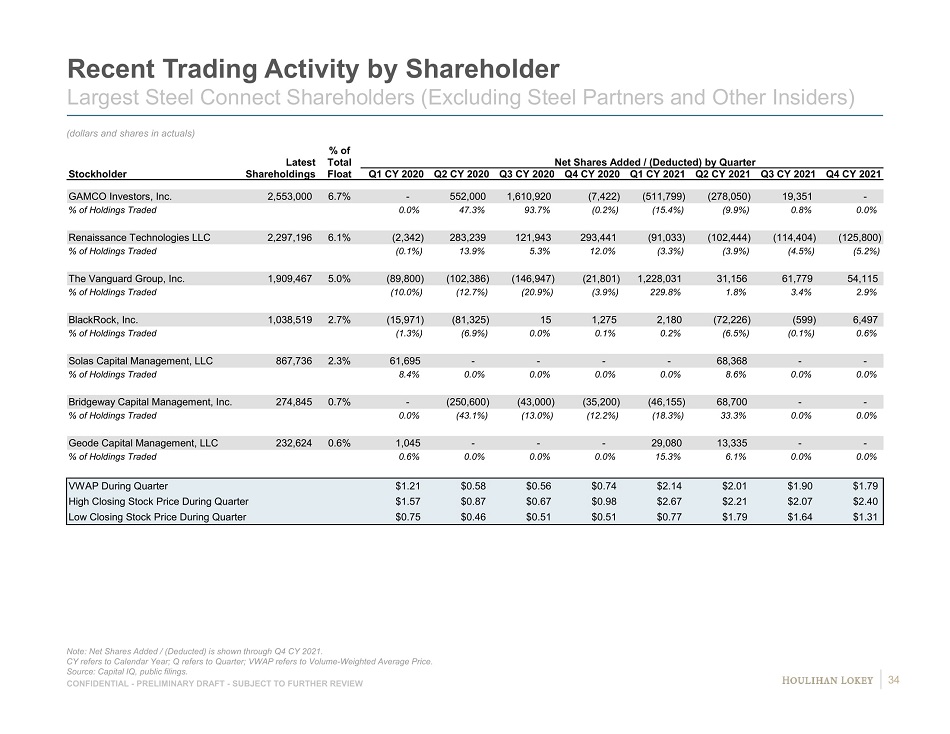
CONFIDENTIAL - PRELIMINARY DRAFT - SUBJECT TO FURTHER REVIEW Recent Trading Activity by Shareholder Largest Steel Connect Shareholders (Excluding Steel Partners and Other Insiders) Note: Net Shares Added / (Deducted) is shown through Q4 CY 2021. CY refers to Calendar Year; Q refers to Quarter; VWAP refers to Volume - Weighted Average Price. Source: Capital IQ, public filings. (dollars and shares in actuals) % of Latest Total Net Shares Added / (Deducted) by Quarter Stockholder Shareholdings Float Q1 CY 2020 Q2 CY 2020 Q3 CY 2020 Q4 CY 2020 Q1 CY 2021 Q2 CY 2021 Q3 CY 2021 Q4 CY 2021 GAMCO Investors, Inc. 2,553,000 6.7% - 552,000 1,610,920 (7,422) (511,799) (278,050) 19,351 - % of Holdings Traded 0.0% 47.3% 93.7% (0.2%) (15.4%) (9.9%) 0.8% 0.0% Renaissance Technologies LLC 2,297,196 6.1% (2,342) 283,239 121,943 293,441 (91,033) (102,444) (114,404) (125,800) % of Holdings Traded (0.1%) 13.9% 5.3% 12.0% (3.3%) (3.9%) (4.5%) (5.2%) The Vanguard Group, Inc. 1,909,467 5.0% (89,800) (102,386) (146,947) (21,801) 1,228,031 31,156 61,779 54,115 % of Holdings Traded (10.0%) (12.7%) (20.9%) (3.9%) 229.8% 1.8% 3.4% 2.9% BlackRock, Inc. 1,038,519 2.7% (15,971) (81,325) 15 1,275 2,180 (72,226) (599) 6,497 % of Holdings Traded (1.3%) (6.9%) 0.0% 0.1% 0.2% (6.5%) (0.1%) 0.6% Solas Capital Management, LLC 867,736 2.3% 61,695 - - - - 68,368 - - % of Holdings Traded 8.4% 0.0% 0.0% 0.0% 0.0% 8.6% 0.0% 0.0% Bridgeway Capital Management, Inc. 274,845 0.7% - (250,600) (43,000) (35,200) (46,155) 68,700 - - % of Holdings Traded 0.0% (43.1%) (13.0%) (12.2%) (18.3%) 33.3% 0.0% 0.0% Geode Capital Management, LLC 232,624 0.6% 1,045 - - - 29,080 13,335 - - % of Holdings Traded 0.6% 0.0% 0.0% 0.0% 15.3% 6.1% 0.0% 0.0% VWAP During Quarter $1.21 $0.58 $0.56 $0.74 $2.14 $2.01 $1.90 $1.79 High Closing Stock Price During Quarter $1.57 $0.87 $0.67 $0.98 $2.67 $2.21 $2.07 $2.40 Low Closing Stock Price During Quarter $0.75 $0.46 $0.51 $0.51 $0.77 $1.79 $1.64 $1.31 34
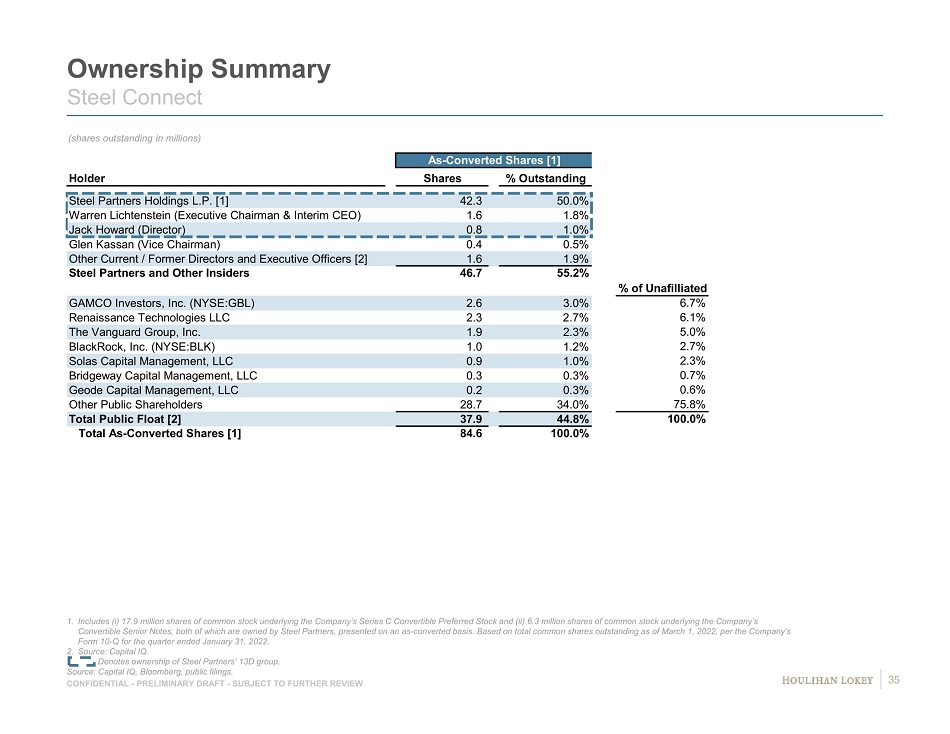
CONFIDENTIAL - PRELIMINARY DRAFT - SUBJECT TO FURTHER REVIEW Ownership Summary Steel Connect 1. Includes (i) 17.9 million shares of common stock underlying the Company’s Series C Convertible Preferred Stock and (ii) 6.3 m ill ion shares of common stock underlying the Company’s Convertible Senior Notes, both of which are owned by Steel Partners, presented on an as - converted basis. Based on total common s hares outstanding as of March 1, 2022, per the Company’s Form 10 - Q for the quarter ended January 31, 2022. 2. Source: Capital IQ. Denotes ownership of Steel Partners’ 13D group. Source: Capital IQ, Bloomberg, public filings. (shares outstanding in millions) As-Converted Shares [1] Holder Shares % Outstanding Steel Partners Holdings L.P. [1] 42.3 50.0% Warren Lichtenstein (Executive Chairman & Interim CEO) 1.6 1.8% Jack Howard (Director) 0.8 1.0% Glen Kassan (Vice Chairman) 0.4 0.5% Other Current / Former Directors and Executive Officers [2] 1.6 1.9% Steel Partners and Other Insiders 46.7 55.2% GAMCO Investors, Inc. (NYSE:GBL) 2.6 3.0% 6.7% Renaissance Technologies LLC 2.3 2.7% 6.1% The Vanguard Group, Inc. 1.9 2.3% 5.0% BlackRock, Inc. (NYSE:BLK) 1.0 1.2% 2.7% Solas Capital Management, LLC 0.9 1.0% 2.3% Bridgeway Capital Management, LLC 0.3 0.3% 0.7% Geode Capital Management, LLC 0.2 0.3% 0.6% Other Public Shareholders 28.7 34.0% 75.8% Total Public Float [2] 37.9 44.8% 100.0% Total As-Converted Shares [1] 84.6 100.0% % of Unafilliated 35
Page 1. Selected General Updates 3 2. Preliminary Financial Analyses Summary 12 3. Selected Changes to Preliminary Discussion Materials Dated 1/10/22 18 4. Preliminary Financial Analyses: ModusLink 22 5. Appendices 29 6. Disclaimer 36

CONFIDENTIAL - PRELIMINARY DRAFT - SUBJECT TO FURTHER REVIEW This presentation, and any supplemental information (written or oral) or other documents provided in connection therewith (collectively, the “materials”), are provided solely for the information of the Special Committee (the “Committee”) of the Board of Directors (the “Board”) of Steel Connect, Inc . (the “Company”) by Houlihan Lokey in connection with the Committee’s consideration of a potential transaction (the “Transaction”) involving the Company . This presentation is incomplete without reference to, and should be considered in conjunction with, any supplemental information provided by and discussions with Houlihan Lokey in connection therewith . Any defined terms used herein shall have the meanings set forth herein, even if such defined terms have been given different meanings elsewhere in the materials . The materials are for discussion purposes only . Houlihan Lokey expressly disclaims any and all liability, whether direct or indirect, in contract or tort or otherwise, to any person in connection with the materials . The materials were prepared for specific persons familiar with the business and affairs of the Company for use in a specific context and were not prepared with a view to public disclosure or to conform with any disclosure standards under any state, federal or international securities laws or other laws, rules or regulations, and none of the Committee, the Company or Houlihan Lokey takes any responsibility for the use of the materials by persons other than the Committee . The materials are provided on a confidential basis solely for the information of the Committee and may not be disclosed, summarized, reproduced, disseminated or quoted or otherwise referred to, in whole or in part, without Houlihan Lokey’s express prior written consent . Notwithstanding any other provision herein, the Company (and each employee, representative or other agent of the Company) may disclose to any and all persons without limitation of any kind, the tax treatment and tax structure of any transaction and all materials of any kind (including opinions or other tax analyses, if any) that are provided to the Company relating to such tax treatment and structure . However, any information relating to the tax treatment and tax structure shall remain confidential (and the foregoing sentence shall not apply) to the extent necessary to enable any person to comply with securities laws . For this purpose, the tax treatment of a transaction is the purported or claimed U . S . income or franchise tax treatment of the transaction and the tax structure of a transaction is any fact that may be relevant to understanding the purported or claimed U . S . income or franchise tax treatment of the transaction . If the Company plans to disclose information pursuant to the first sentence of this paragraph, the Company shall inform those to whom it discloses any such information that they may not rely upon such information for any purpose without Houlihan Lokey’s prior written consent . Houlihan Lokey is not an expert on, and nothing contained in the materials should be construed as advice with regard to, legal, accounting, regulatory, insurance, tax or other specialist matters . Houlihan Lokey’s role in reviewing any information was limited solely to performing such a review as it deemed necessary to support its own advice and analysis and was not on behalf of the Committee . The materials necessarily are based on financial, economic, market and other conditions as in effect on, and the information available to Houlihan Lokey as of, the date of the materials . Although subsequent developments may affect the contents of the materials, Houlihan Lokey has not undertaken, and is under no obligation, to update, revise or reaffirm the materials, except as may be expressly contemplated by Houlihan Lokey’s engagement letter . The materials are not intended to provide the sole basis for evaluation of the Transaction and do not purport to contain all information that may be required . The materials do not address the underlying business decision of the Company or any other party to proceed with or effect the Transaction, or the relative merits of the Transaction as compared to any alternative business strategies or transactions that might be available for the Company or any other party . The materials do not constitute any opinion, nor do the materials constitute a recommendation to the Board, the Committee, the Company, any security holder of the Company or any other party as to how to vote or act with respect to any matter relating to the Transaction or otherwise or whether to buy or sell any assets or securities of any company . Houlihan Lokey’s only opinion is the opinion, if any, that is actually delivered to the Committee . In preparing the materials Houlihan Lokey has acted as an independent contractor and nothing in the materials is intended to create or shall be construed as creating a fiduciary or other relationship between Houlihan Lokey and any party . The materials may not reflect information known to other professionals in other business areas of Houlihan Lokey and its affiliates . The preparation of the materials was a complex process involving quantitative and qualitative judgments and determinations with respect to the financial, comparative and other analytic methods employed and the adaption and application of these methods to the unique facts and circumstances presented and, therefore, is not readily susceptible to partial analysis or summary description . Furthermore, Houlihan Lokey did not attribute any particular weight to any analysis or factor considered by it, but rather made qualitative judgments as to the significance and relevance of each analysis and factor . Each analytical technique has inherent strengths and weaknesses, and the nature of the available information may further affect the value of particular techniques . Accordingly, the analyses contained in the materials must be considered as a whole . Selecting portions of the analyses, analytic methods and factors without considering all analyses and factors could create a misleading or incomplete view . The materials reflect judgments and assumptions with regard to industry performance, general business, economic, regulatory, market and financial conditions and other matters, many of which are beyond the control of the participants in the Transaction . Any estimates of value contained in the materials are not necessarily indicative of actual value or predictive of future results or values, which may be significantly more or less favorable . Any analyses relating to the value of assets, businesses or securities do not purport to be appraisals or to reflect the prices at which any assets, businesses or securities may actually be sold . The materials do not constitute a valuation opinion or credit rating . The materials do not address the consideration to be paid or received in, the terms of any arrangements, understandings, agreements or documents related to, or the form, structure or any other portion or aspect of, the Transaction or otherwise . Furthermore, the materials do not address the fairness of any portion or aspect of the Transaction to any party . In preparing the materials, Houlihan Lokey has not conducted any physical inspection or independent appraisal or evaluation of any of the assets, properties or liabilities (contingent or otherwise) of the Company or any other party and has no obligation to evaluate the solvency of the Company or any other party under any law . Disclaimer 37

CONFIDENTIAL - PRELIMINARY DRAFT - SUBJECT TO FURTHER REVIEW All budgets, projections, estimates, financial analyses, reports and other information with respect to operations (including estimates of potential cost savings and expenses) reflected in the materials have been prepared by management of the relevant party or are derived from such budgets, projections, estimates, financial analyses, reports and other information or from other sources, which involve numerous and significant subjective determinations made by management of the relevant party and/or which such management has reviewed and found reasonable . The budgets, projections and estimates (including, without limitation, estimates of potential cost savings and synergies) contained in the materials may or may not be achieved and differences between projected results and those actually achieved may be material . Houlihan Lokey has relied upon representations made by management of the Company and other participants in the Transaction that such budgets, projections and estimates have been reasonably prepared in good faith on bases reflecting the best currently available estimates and judgments of such management (or, with respect to information obtained from public sources, represent reasonable estimates), and Houlihan Lokey expresses no opinion with respect to such budgets, projections or estimates or the assumptions on which they are based . The scope of the financial analysis contained herein is based on discussions with the Company (including, without limitation, regarding the methodologies to be utilized), and Houlihan Lokey does not make any representation, express or implied, as to the sufficiency or adequacy of such financial analysis or the scope thereof for any particular purpose . Houlihan Lokey has assumed and relied upon the accuracy and completeness of the financial and other information provided to, discussed with or reviewed by it without (and without assuming responsibility for) independent verification of such information, makes no representation or warranty (express or implied) in respect of the accuracy or completeness of such information and has further relied upon the assurances of the Company and other participants in the Transaction that they are not aware of any facts or circumstances that would make such information inaccurate or misleading . In addition, Houlihan Lokey has relied upon and assumed, without independent verification, that there has been no change in the business, assets, liabilities, financial condition, results of operations, cash flows or prospects of the Company or any other participant in the Transaction since the respective dates of the most recent financial statements and other information, financial or otherwise, provided to, discussed with or reviewed by Houlihan Lokey that would be material to its analyses, and that the final forms of any draft documents reviewed by Houlihan Lokey will not differ in any material respect from such draft documents . The materials are not an offer to sell or a solicitation of an indication of interest to purchase any security, option, commodity, future, loan or currency . The materials do not constitute a commitment by Houlihan Lokey or any of its affiliates to underwrite, subscribe for or place any securities, to extend or arrange credit, or to provide any other services . In the ordinary course of business, certain of Houlihan Lokey’s affiliates and employees, as well as investment funds in which they may have financial interests or with which they may co - invest, may acquire, hold or sell, long or short positions, or trade or otherwise effect transactions, in debt, equity, and other securities and financial instruments (including loans and other obligations) of, or investments in, the Company, any Transaction counterparty, any other Transaction participant, any other financially interested party with respect to any transaction, other entities or parties that are mentioned in the materials, or any of the foregoing entities’ or parties’ respective affiliates, subsidiaries, investment funds, portfolio companies and representatives (collectively, the “Interested Parties”), or any currency or commodity that may be involved in the Transaction . Houlihan Lokey provides mergers and acquisitions, restructuring and other advisory and consulting services to clients, which may have in the past included, or may currently or in the future include, one or more Interested Parties, for which services Houlihan Lokey has received, and may receive, compensation . Although Houlihan Lokey in the course of such activities and relationships or otherwise may have acquired, or may in the future acquire, information about one or more Interested Parties or the Transaction, or that otherwise may be of interest to the Board, the Committee, or the Company, Houlihan Lokey shall have no obligation to, and may not be contractually permitted to, disclose such information, or the fact that Houlihan Lokey is in possession of such information, to the Board, the Committee, or the Company or to use such information on behalf of the Board, the Committee, or the Company . Houlihan Lokey’s personnel may make statements or provide advice that is contrary to information contained in the materials . Disclaimer (cont.) 38

CONFIDENTIAL - PRELIMINARY DRAFT - SUBJECT TO FURTHER REVIEW 39 CORPORATE FINANCE FINANCIAL RESTRUCTURING FINANCI AL AND VALUATION ADVISORY HL .com