| UNITED STATES |
| SECURITIES AND EXCHANGE COMMISSION |
| Washington, D.C. 20549 |
| CERTIFIED SHAREHOLDER REPORT OF REGISTERED MANAGEMENT |
| INVESTMENT COMPANIES |
| Investment Company Act file number | | 811-7123 |
| Advantage Funds, Inc. |
| (Exact name of Registrant as specified in charter) |
| c/o The Dreyfus Corporation |
| 200 Park Avenue |
| New York, New York 10166 |
| (Address of principal executive offices) | | (Zip code) |
| Michael A. Rosenberg, Esq. |
| 200 Park Avenue |
| New York, New York 10166 |
| (Name and address of agent for service) |
| Registrant's telephone number, including area code: | | (212) 922-6000 |
| Date of fiscal year end: | | 10/31 | | |
| Date of reporting period: | | 10/31/08 | | |
The following N-CSR relates only to the Registrant’s series listed below and does not affect the other series of the Registrant, which has a different fiscal year end and, therefore, different N-CSR reporting requirements. A separate N-CSR Form will be filed for this series, as appropriate.
ADVANTAGE FUNDS, INC.
- DREYFUS GLOBAL ABSOLUTE RETURN FUND
- DREYFUS TOTAL RETURN ADVANTAGE FUND
- GLOBAL ALPHA FUND
| Item 1. | | Reports to Stockholders. |
| | Dreyfus
Global Absolute
Return Fund |
| | ANNUAL REPORT October 31, 2008 |

Save time. Save paper. View your next shareholder report online as soon as it’s available. Log into www.dreyfus.com and sign up for Dreyfus eCommunications. It’s simple and only takes a few minutes.
The views expressed in this report reflect those of the portfolio manager only through the end of the period covered and do not necessarily represent the views of Dreyfus or any other person in the Dreyfus organization. Any such views are subject to change at any time based upon market or other conditions and Dreyfus disclaims any responsibility to update such views.These views may not be relied on as investment advice and, because investment decisions for a Dreyfus fund are based on numerous factors, may not be relied on as an indication of trading intent on behalf of any Dreyfus fund.

| | Contents |
| |
| | THE FUND |
| |
| 2 | A Letter from the CEO |
| |
| 3 | Discussion of Fund Performance |
| |
| 6 | Fund Performance |
| |
| 8 | Understanding Your Fund’s Expenses |
| |
| 8 | Comparing Your Fund’s Expenses With Those of Other Funds |
| |
| 9 | Statement of Investments |
| |
| 11 | Statement of Financial Futures |
| |
| 12 | Statement of Assets and Liabilities |
| |
| 13 | Statement of Operations |
| |
| 14 | Statement of Changes in Net Assets |
| |
| 15 | Financial Highlights |
| |
| 16 | Notes to Financial Statements |
| |
| 30 | Report of Independent Registered Public Accounting Firm |
| |
| 31 | Board Members Information |
| |
| 34 | Officers of the Fund |
| |
| | FOR MORE INFORMATION |
| |
| | Back Cover |
| |
The Fund
Dreyfus
Global Absolute
Return Fund |

A LETTER FROM THE CEO
Dear Shareholder:
We present to you this annual report for Dreyfus Global Absolute Return Fund, covering the period since the fund’s inception of December 18, 2007, through October 31, 2008.
These are difficult times for international investors. A credit crunch that began in the United States in 2007 has developed into a full-blown global financial crisis, recently resulting in the failure of several major financial institutions. Meanwhile, the global economic slowdown has gathered momentum, depressing investor sentiment, consumer confidence and business investment around the world.These factors undermined equity returns in most regions,including formerly high-flying emerging markets.
The depth and duration of the economic downturn will depend on how quickly the global financial system can be stabilized. We believe that government efforts in the United States and Europe meet several critical requirements for addressing today’s financial stresses, and we expect them to contribute to a more orderly deleveraging process. However, recuperation from the financial crisis is likely to take time. In the meantime, we encourage you to keep in touch with your financial advisor and maintain a long-term and disciplined perspective to investing. Indeed, we already are seeing some positive signs, including a likely peak in global inflationary pressures, attractive valuations among fundamentally sound companies and a large pool of worldwide financial liquidity that could be deployed gradually as the economic cycle turns.
For information about how the fund performed during the reporting period, as well as market perspectives, we have provided a Discussion of Fund Performance given by the fund’s Portfolio Managers.
Thank you for your continued confidence and support.
| | Jonathan R. Baum
Chief Executive Officer
The Dreyfus Corporation |

DISCUSSION OF FUND PERFORMANCE
For the period of December 18, 2007, through October 31, 2008, as provided by Helen Potter, James Stavena and Vassilis Dagioglu, Portfolio Managers
Fund and Market Performance Overview
For the period between the fund’s inception on December 18,2007,and the end of its annual reporting period on October 31, 2008, Dreyfus Global Absolute Return Fund’s Class A shares produced a total return of –14.00%, Class C shares produced a total return of –14.56%, Class I shares produced a total return of –13.76% and Class T shares produced a total return of –14.16% .1 In comparison, the fund’s benchmark, the Citibank 30-Day Treasury Bill Index produced a total return of 1.33% for the period December 31, 2007 through October 31, 2008.2
A credit crunch developed into a global financial crisis late in the reporting period, intensifying a worldwide economic slowdown and sparking a massive sell-off by equity investors. International bond markets, while volatile, generally fared better than equities. In currency markets, the U.S. dollar strengthened relative to the euro and yen.The fund’s returns lagged its benchmark, primarily due to its overweighted allocations to global stocks, the U.K. pound and the euro.
The Fund’s Investment Approach
The fund seeks total return through investments in securities and instruments that provide exposure to global stock, bond and currency markets,and in fixed-income securities.The strategy utilizes a proprietary, fundamentals-based quantitative model to construct and optimally integrate a diverse set of four alpha-generating signals: stock markets vs. bond markets within each country, country allocation among equity markets, country allocation among sovereign bond markets and currency allocation. Our quantitative investment approach is designed to identify and exploit these relative misvaluations across and within major developed capital markets such as the United States, Japan and Western Europe.
The Fund 3
| DISCUSSION OF FUND PERFORMANCE (continued) |
Deteriorating Global Economy Weighed on Markets
An ongoing credit crunch mushroomed into a global financial crisis late in the reporting period, forcing U.S. and international stock markets into steep declines as slumping housing prices, rising unemployment, dampened consumer spending and reduced business investment gave rise to fears of a potentially deep and prolonged global recession.Stocks declined sharply as the financial crisis worsened and a barrage of negative economic news discouraged investors. Even higher quality stocks were subject to broad selling pressure in an environment where valuations and fundamental strengths appeared largely disconnected from share prices.
In addition, previously skyrocketing commodities prices began to reverse course over the summer of 2008, relieving some pressure on cash-strapped consumers and businesses, but damaging resource-oriented economies. In global bond markets, lower-rated sovereign and corporate bonds suffered as risk-averse investors fled to the traditional safe havens of high-quality bonds in developed markets. Currency markets also experienced a “flight to quality” as nervous global investors flocked to the U.S. dollar, driving its value higher.
Stocks and European Currencies Dampened Returns
The fund’s relatively heavy exposure to global stock markets was the most significant driver of its underperformance during the reporting period. Although our determination early in the reporting period that global stocks were undervalued may have been correct, deteriorating investor sentiment triggered further declines in valuations. Overweighted positions in the U.K. pound and the euro also hampered the fund’s results, as these countries’ previously high short-term interest rates were reduced by their central banks in efforts to stimulate lending and jumpstart their economies.This development contributed to broad selling pressure on both currencies, as investors flocked to the U.S. dollar, which historically has been considered a safer investment.
Other investment decisions produced positive results despite the poor market environment. Conviction in our belief that skyrocketing commodity-related stocks would reverse course benefited the fund through an underweighted allocation to the currencies of commodities producers
4
such as Australia, Canada and Norway, which dropped precipitously midway through the reporting period. In addition, unattractively low short-term interest rates weighed on the Canadian dollar.
Relatively high exposures to U.K. and French stocks also delivered positive contributions to the fund’s relative performance, as both countries’ stock markets posted gains during the second half of the reporting period. In addition,European (ex-the United Kingdom) bond prices advanced by the middle of the reporting period, bolstering the fund’s relative results.
Positioned for New Opportunities
Although economic conditions worldwide appeared bleaker at the end of the reporting period than at the beginning, we have focused on three potential investment opportunities. First, recently sharp declines in equity markets have driven high-quality stocks to historically low prices. Because we focus on company fundamentals and hold a long-term view of investing, we believe the fund’s overweighted exposure to such companies position it well for an eventual market recovery. Second, large variances in stock market valuations worldwide have enabled us to position the fund to potentially benefit from these valuations. Likewise, variations in the bond markets of different regions also have expanded over the last few months, due in large part to the credit crisis, and we have made investments that we believe may benefit as those differences narrow toward historical norms.
November 17, 2008
| | | Investing in foreign companies involves special risks, including changes in currency rates, |
| | | political, economic and social instability, a lack of comprehensive company information, |
| | | differing auditing and legal standards, and less market liquidity. An investment in this fund |
| | | should be considered only as a supplement to an overall investment program. |
| 1 | | Total return includes reinvestment of dividends and any capital gains paid, and does not take into |
| | | consideration the maximum initial sales charges in the case of Class A or Class T shares, or the |
| | | applicable contingent deferred sales charge imposed on redemptions in the case of Class C shares. |
| | | Had these charges been reflected, returns would have been lower. Past performance is no guarantee |
| | | of future results. Share price, yield and investment return fluctuate such that upon redemption, |
| | | fund shares may be worth more or less than their original cost. Return figures provided reflect the |
| | | absorption of certain fund expenses by The Dreyfus Corporation pursuant to an agreement in |
| | | effect through March 1, 2010, at which time it may be extended, terminated or modified. Had |
| | | these expenses not been absorbed, the fund’s returns would have been lower. |
| 2 | | SOURCE: CITIGROUP – Citigroup 30-Day Treasury Bill Index is a market value-weighted |
| | | index of public obligations of the U.S.Treasury with maturities of 30 days. |
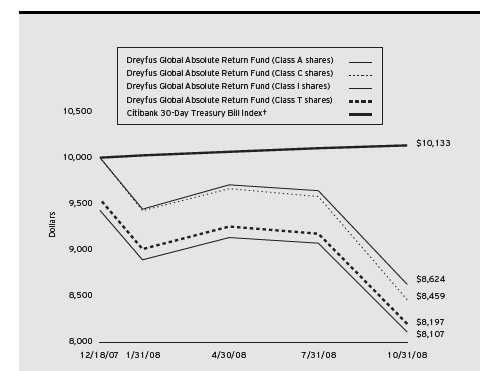
Comparison of change in value of $10,000 investment in Dreyfus Global Absolute Return Fund Class A shares, Class C shares, Class I shares and Class T shares and the Citibank 30-Day Treasury Bill Index
| † Source: Bloomberg L.P. |
| Past performance is not predictive of future performance.The fund’s performance shown in the graph and table does not |
| reflect the deduction of taxes that a shareholder would pay on fund distributions or the redemption of fund shares. |
| The above graph compares a $10,000 investment made in Class A, Class C, Class I and Class T shares of Dreyfus |
| Global Absolute Return Fund on 12/18/07 (inception date) to a $10,000 investment made in the Citibank 30-Day |
| Treasury Bill Index (the “Index”) on that date. All dividends and capital gain distributions are reinvested. For |
| comparative purposes, the value of the Index on 12/31/07 is used as the beginning value on 12/18/07. |
| The fund’s performance shown in the line graph takes into account the maximum initial sales charges on Class A shares |
| and Class T shares, the applicable contingent deferred sales charge on Class C shares and all other applicable fees and |
| expenses on all classes.The Index is a market value-weighted index of public obligations of the U.S.Treasury with |
| maturities of 30 days. Unlike a mutual fund, the Index is not subject to charges, fees and other expenses. Investors cannot |
| invest directly in any index. Further information relating to fund performance, including expense reimbursements, if |
| applicable, is contained in the Financial Highlights section of the prospectus and elsewhere in this report. |
6
| Actual Aggregate Total Return as of 10/31/08 | | | | |
| |
| | | Inception | | From |
| | | Date | | Inception |
| |
| |
|
| Class A shares | | | | |
| with maximum sales charge (5.75%) | | 12/18/07 | | (18.93)% |
| without sales charge | | 12/18/07 | | (14.00)% |
| Class C shares | | | | |
| with applicable redemption charge † | | 12/18/07 | | (15.41)% |
| without redemption | | 12/18/07 | | (14.56)% |
| Class I shares | | 12/18/07 | | (13.76)% |
| Class T shares | | | | |
| with applicable sales charge (4.5%) | | 12/18/07 | | (18.03)% |
| without sales charge | | 12/18/07 | | (14.16)% |
Past performance is not predictive of future performance.The fund’s performance shown in the graph and table does not reflect the deduction of taxes that a shareholder would pay on fund distributions or the redemption of fund shares.
| † The maximum contingent deferred sales charge for Class C shares is 1% for shares redeemed within one year of the |
| date of purchase. |
UNDERSTANDING YOUR FUND’S EXPENSES (Unaudited)
As a mutual fund investor, you pay ongoing expenses, such as management fees and other expenses. Using the information below, you can estimate how these expenses affect your investment and compare them with the expenses of other funds.You also may pay one-time transaction expenses, including sales charges (loads) and redemption fees, which are not shown in this section and would have resulted in higher total expenses. For more information, see your fund’s prospectus or talk to your financial adviser.
Review your fund’s expenses
The table below shows the expenses you would have paid on a $1,000 investment in Dreyfus Global Absolute Return Fund from May 1, 2008 to October 31, 2008. It also shows how much a $1,000 investment would be worth at the close of the period, assuming actual returns and expenses.
| Expenses and Value of a $1,000 Investment |
| assuming actual returns for the six months ended October 31, 2008 |
| | | Class A | | Class C | | Class I | | Class T |
| |
| |
| |
| |
|
| Expenses paid per $1,000† | | $ 3.89 | | $ 7.81 | | $ 4.84 | | $ 4.60 |
| Ending value (after expenses) | | $887.70 | | $884.10 | | $888.70 | | $886.00 |
| | COMPARING YOUR FUND’S EXPENSES
WITH THOSE OF OTHER FUNDS (Unaudited) |
Using the SEC’s method to compare expenses
The Securities and Exchange Commission (SEC) has established guidelines to help investors assess fund expenses. Per these guidelines, the table below shows your fund’s expenses based on a $1,000 investment, assuming a hypothetical 5% annualized return. You can use this information to compare the ongoing expenses (but not transaction expenses or total cost) of investing in the fund with those of other funds.All mutual fund shareholder reports will provide this information to help you make this comparison. Please note that you cannot use this information to estimate your actual ending account balance and expenses paid during the period.
Expenses and Value of a $1,000 Investment assuming a hypothetical 5% annualized return for the six months ended October 31, 2008
| | | Class A | | Class C | | Class I | | Class T |
| |
| |
| |
| |
|
| Expenses paid per $1,000† | | $ 4.17 | | $ 8.36 | | $ 5.18 | | $ 4.93 |
| Ending value (after expenses) | | $1,021.01 | | $1,016.84 | | $1,020.01 | | $1,020.26 |
| † Expenses are equal to the fund’s annualized expense ratio of .82% for Class A, 1.65% for Class C, 1.02% for |
| Class I and .97% for Class T, multiplied by the average account value over the period, multiplied by 184/366 (to |
| reflect the one-half year period). |
8
STATEMENT OF INVESTMENTS
October 31, 2008 |
| | | Principal | | |
| Short-Term Investments—85.0% | | Amount ($) | | Value ($) |
| |
| |
|
| Commercial Paper—11.4% | | | | |
| Bank of Scotland | | | | |
| 5.00%, 11/7/08 | | 300,000 | | 299,750 |
| BNP Paribas Finance Inc. | | | | |
| 2.73%, 12/9/08 | | 300,000 | | 299,135 |
| CBA (Delaware) Finance Inc. | | | | |
| 2.72%, 11/21/08 | | 300,000 | | 299,547 |
| Nordea North America Inc. | | | | |
| 2.62%, 12/8/08 | | 250,000 | | 249,327 |
| | | | | 1,147,759 |
| U.S. Government Agencies—39.0% | | | | |
| Federal Home Loan Banks, Notes, | | | | |
| 2.39%, 11/7/08 | | 1,550,000 | | 1,549,383 |
| Federal Home Loan Mortgage Corp., | | | | |
| Notes, 2.43%, 11/4/08 | | 1,200,000 a | | 1,199,757 |
| Federal National Mortgage | | | | |
| Association, Notes, 2.48%, 11/6/08 | | 1,200,000 a | | 1,199,587 |
| | | | | 3,948,727 |
| U.S. Treasury Bills—34.6% | | | | |
| 0.26%, 12/18/08 | | 950,000 b | | 949,497 |
| 1.60%, 12/4/08 | | 1,550,000 | | 1,549,612 |
| 1.79%, 11/13/08 | | 1,000,000 | | 999,972 |
| | | | | 3,499,081 |
| Total Short-Term Investments | | | | |
| (cost $8,593,285) | | | | 8,595,567 |
| |
| |
|
| | | Face Amount | | |
| | | Covered by | | |
| Options—2.1% | | Contracts ($) | | Value ($) |
| |
| |
|
| Call Options | | | | |
| U.S. Treasury 10-Year Notes | | | | |
| November 2008 @ 105 | | | | |
| (cost $281,472) | | 2,700,000 | | 218,531 |
| | STATEMENT OF INVESTMENTS (continued) |
| Other Investment—13.1% | | Shares | | Value ($) |
| |
| |
|
| Registered Investment Company; | | | | |
| Dreyfus Institutional Preferred | | | | |
| Plus Money Market Fund | | | | |
| (cost $1,322,000) | | 1,322,000 c | | 1,322,000 |
| |
| |
|
| |
| Total Investments (cost $10,196,757) | | 100.2% | | 10,136,098 |
| Liabilities, Less Cash and Receivables | | (.2%) | | (23,885) |
| Net Assets | | 100.0% | | 10,112,213 |
| a On September 7, 2008, the Federal Housing Finance Agency (FHFA) placed Federal National Mortgage Association |
| and Federal Home Loan Mortgage Corporation into conservatorship with FHFA as the conservator.As such, the |
| FHFA will oversee the continuing affairs of the companies. |
| b All or partially held by a broker as collateral for open financial futures positions. |
| c Investment in affiliated money market mutual fund. |
| Portfolio Summary (Unaudited)† | | | | |
| | | Value (%) | | | | Value (%) |
| |
| |
| |
|
| Short-Term/ | | | | Options | | 2.1 |
| Money Market Investments | | 98.1 | | | | 100.2 |
| † Based on net assets. |
| See notes to financial statements. |
10
STATEMENT OF FINANCIAL FUTURES
October 31, 2008 |
| | | | | | | | | Unrealized |
| | | | | Market Value | | | | Appreciation |
| | | | | Covered by | | | | (Depreciation) |
| | | Contracts | | Contracts ($) | | Expiration | | at 10/31/2008 ($) |
| |
| |
| |
| |
|
| Financial Futures Long | | | | | | | | |
| U.S. Treasury 10 Year Notes | | 18 | | 2,035,406 | | December 2008 | | (10,117) |
| FTSE 100 Index | | 38 | | 2,688,323 | | December 2008 | | (223,326) |
| CAC 40 10 Euro | | 24 | | 1,055,883 | | November 2008 | | 50,291 |
| Financial Futures Short | | | | | | | | |
| 10 Year Euro-Bond | | 19 | | (2,793,104) | | December 2008 | | (11,841) |
| British Long Gilt | | 5 | | (899,081) | | December 2008 | | 6,140 |
| DAX Index | | 2 | | (321,135) | | December 2008 | | (9,517) |
| Japanese 10 Year Bond | | 30 | | 4,201,220 | | December 2008 | | (26,414) |
| S & P 500 E-mini | | 4 | | (193,460) | | December 2008 | | 45,276 |
| TOPIX Index | | 7 | | (607,829) | | December 2008 | | 39,242 |
| | | | | | | | | (140,266) |
| |
| See notes to financial statements. | | | | | | | | |
STATEMENT OF ASSETS AND LIABILITIES
October 31, 2008 |
| | | Cost | | Value |
| |
| |
|
| Assets ($): | | | | |
| Investments in securities—See Statement of Investments: | | | | |
| Unaffiliated issuers | | 8,874,757 | | 8,814,098 |
| Affiliated issuers | | 1,322,000 | | 1,322,000 |
| Cash | | | | 28,360 |
| Unrealized appreciation on forward currency | | | | |
| exchange contracts—Note 4 | | | | 476,803 |
| Receivable for investment securities sold | | | | 211,348 |
| Receivable for futures variation margin—Note 4 | | | | 152,320 |
| Receivable for shares of Capital Stock subscribed | | | | 5,015 |
| Dividends and interest receivable | | | | 1,951 |
| Prepaid expenses | | | | 128,654 |
| Due from The Dreyfus Corporation and affiliates—Note 3(c) | | | | 22,791 |
| | | | | 11,163,340 |
| |
| |
|
| Liabilities ($): | | | | |
| Unrealized depreciation on forward currency | | | | |
| exchange contracts—Note 4 | | | | 523,437 |
| Payable for investment securities purchased | | | | 483,138 |
| Accrued expenses | | | | 44,552 |
| | | | | 1,051,127 |
| |
| |
|
| Net Assets ($) | | | | 10,112,213 |
| |
| |
|
| Composition of Net Assets ($): | | | | |
| Paid-in capital | | | | 11,547,820 |
| Accumulated undistributed investment income—net | | | | 164,191 |
| Accumulated net realized gain (loss) on investments | | | | (1,352,239) |
| Accumulated net unrealized appreciation (depreciation) on investments, | | |
| foreign currency transactions and options transactions [including | | | | |
| ($140,266) net unrealized (depreciation) on financial futures] | | | | (247,559) |
| |
| |
|
| Net Assets ($) | | | | 10,112,213 |
| Net Asset Value Per Share | | | | | | | | |
| | | Class A | | Class C | | Class I | | Class T |
| |
| |
| |
| |
|
| Net Assets ($) | | 4,630,199 | | 997,112 | | 3,851,428 | | 633,474 |
| Shares Outstanding | | 430,724 | | 93,358 | | 357,305 | | 59,029 |
| |
| |
| |
| |
|
| Net Asset Value Per Share ($) | | 10.75 | | 10.68 | | 10.78 | | 10.73 |
See notes to financial statements.
12
STATEMENT OF OPERATIONS
From December 18, 2007 (commencement of operations) to October 31, 2008 |
| Investment Income ($): | | |
| Income: | | |
| Interest | | 154,234 |
| Dividends; | | |
| Affiliated issuers | | 38,584 |
| Total Income | | 192,818 |
| Expenses: | | |
| Management fee—Note 3(a) | | 84,397 |
| Auditing fees | | 47,627 |
| Registration fees | | 24,024 |
| Shareholder servicing costs—Note 3(c) | | 14,087 |
| Custodian fees—Note 3(c) | | 9,958 |
| Distribution fees—Note 3(b) | | 6,275 |
| Prospectus and shareholders’ reports | | 5,524 |
| Directors’ fees and expenses—Note 3(d) | | 563 |
| Legal fees | | 333 |
| Loan commitment fees—Note 2 | | 2 |
| Miscellaneous | | 49,655 |
| Total Expenses | | 242,445 |
| Less—expense reimbursement from The Dreyfus | | |
| Corporation due to undertaking—Note 3(a) | | (127,135) |
| Less—reduction in fees due to earnings credits—Note 1(c) | | (1,456) |
| Net Expenses | | 113,854 |
| Investment Income—Net | | 78,964 |
| |
|
| Realized and Unrealized Gain (Loss) on Investments—Note 4 ($): | | |
| Net realized gain (loss) on investments and foreign currency transactions | | 83,023 |
| Net realized gain (loss) on options transactions | | 24,409 |
| Net realized gain (loss) on financial futures | | (663,697) |
| Net realized gain (loss) on forward currency exchange contracts | | (712,642) |
| Net Realized Gain (Loss) | | (1,268,907) |
| Net unrealized appreciation (depreciation) on investments, options | | |
| transactions and foreign currency transactions [including | | |
| ($140,266) net unrealized depreciation on financial futures] | | (247,559) |
| Net Realized and Unrealized Gain (Loss) on Investments | | (1,516,466) |
| Net (Decrease) in Net Assets Resulting from Operations | | (1,437,502) |
| |
| See notes to financial statements. | | |
STATEMENT OF CHANGES IN NET ASSETS
From December 18, 2007 (commencement of operations) to October 31, 2008 |
| Operations ($): | | |
| Investment income—net | | 78,964 |
| Net realized gain (loss) on investments | | (1,268,907) |
| Net unrealized appreciation | | |
| (depreciation) on investments | | (247,559) |
| Net Increase (Decrease) in Net Assets | | |
| Resulting from Operations | | (1,437,502) |
| |
|
| Capital Stock Transactions ($): | | |
| Net proceeds from shares sold: | | |
| Class A Shares | | 5,364,489 |
| Class C Shares | | 1,144,813 |
| Class I Shares | | 4,606,499 |
| Class T Shares | | 734,620 |
| Cost of shares redeemed: | | |
| Class A Shares | | (9,726) |
| Class C Shares | | (15,000) |
| Class I Shares | | (275,980) |
| Increase (Decrease) in Net Assets | | |
| from Capital Stock Transactions | | 11,549,715 |
| Total Increase (Decrease) in Net Assets | | 10,112,213 |
| |
|
| Net Assets ($): | | |
| Beginning of Period | | — |
| End of Period | | 10,112,213 |
| Undistributed investment income—net | | 164,191 |
| |
|
| Capital Share Transactions (Shares): | | |
| Class A | | |
| Shares sold | | 431,580 |
| Shares redeemed | | (856) |
| Net Increase (Decrease) in Shares Outstanding | | 430,724 |
| |
|
| Class C | | |
| Shares sold | | 94,769 |
| Shares redeemed | | (1,411) |
| Net Increase (Decrease) in Shares Outstanding | | 93,358 |
| |
|
| Class I | | |
| Shares sold | | 382,830 |
| Shares redeemed | | (25,525) |
| Net Increase (Decrease) in Shares Outstanding | | 357,305 |
| |
|
| Class T | | |
| Shares sold | | 59,029 |
| |
| See notes to financial statements. | | |
14
FINANCIAL HIGHLIGHTS
The following table describes the performance for each share class for the period from December 18, 2007 (commencement of operations) to October 31, 2008. All information (except portfolio turnover rate) reflects financial results for a single fund share.Total return shows how much your investment in the fund would have increased (or decreased) during each period, assuming you had reinvested all dividends and dis-tributions.These figures have been derived from the fund’s financial statements.
| | | Class A | | Class C | | Class I | | Class T |
| | | Shares | | Shares | | Shares | | Shares |
| |
| |
| |
| |
|
| Per Share Data ($): | | | | | | | | |
| Net asset value, beginning of period | | 12.50 | | 12.50 | | 12.50 | | 12.50 |
| Investment Operations: | | | | | | | | |
| Investment income—neta | | .12 | | .03 | | .09 | | .10 |
| Net realized and unrealized | | | | | | | | |
| gain (loss) on investments | | (1.87) | | (1.85) | | (1.81) | | (1.87) |
| Total from Investment Operations | | (1.75) | | (1.82) | | (1.72) | | (1.77) |
| Net asset value, end of period | | 10.75 | | 10.68 | | 10.78 | | 10.73 |
| |
| |
| |
| |
|
| Total Return (%)b | | (14.00)c | | (14.56)c | | (13.76) | | (14.16)c |
| |
| |
| |
| |
|
| Ratios/Supplemental Data (%): | | | | | | | | |
| Ratio of total expenses | | | | | | | | |
| to average net assetsd | | 3.04 | | 4.00 | | 3.12 | | 3.27 |
| Ratio of net expenses | | | | | | | | |
| to average net assetd | | 1.48 | | 2.23 | | 1.23 | | 1.69 |
| Ratio of net investment income | | | | | | | | |
| to average net assetsd | | 1.14 | | .35 | | 1.03 | | .94 |
| Portfolio Turnover Rate | | — | | — | | — | | — |
| |
| |
| |
| |
|
| Net Assets, end of period ($ x 1,000) | | 4,630 | | 997 | | 3,851 | | 633 |
| a | | Based on average shares outstanding at each month end. |
| b | | Not annualized. |
| c | | Exclusive of sales charge. |
| d | | Annualized. |
| See notes to financial statements. |
NOTES TO FINANCIAL STATEMENTS
NOTE 1—Significant Accounting Policies:
Dreyfus Global Absolute Return Fund (the “fund”) is a separate diversified series of Advantage Funds, Inc. (the “Company”), which is registered under the Investment Company Act of 1940, as amended (the “Act”), as an open-end management investment company and operates as a series company that offers twelve series, including the fund, which commenced operations on December 18, 2007.The fund’s investment objective seeks total return by investing in instruments that provide investment exposure to global equity, bond and currency markets, and in fixed-income securities.The Dreyfus Corporation (the “Manager” or “Dreyfus”), a wholly-owned subsidiary of The Bank of New York Mellon Corporation (“BNY Mellon”), serves as the fund’s investment adviser. Mellon Capital Management Corporation (“MCM”), a subsidiary of BNY Mellon, serves as the fund’s sub-investment adviser.
At a meeting of the fund’s Board of Directors held on July 15, 2008, the Board approved, effective December 1, 2008, a proposal to change the name of the fund from “Dreyfus Premier Global Absolute Return Fund” to “Dreyfus Global Absolute Return Fund”.
Effective July 1, 2008, BNY Mellon has reorganized and consolidated a number of its banking and trust company subsidiaries. As a result of the reorganization, any services previously provided to the fund by Mellon Bank, N.A. or Mellon Trust of New England, N.A. are now provided by The Bank of New York, which has changed its name to The Bank of New York Mellon.
MBSC Securities Corporation (the “Distributor”), a wholly-owned subsidiary of Dreyfus, is the distributor of the fund’s shares.The fund is authorized to issue 400 million shares of $.001 par value Common Stock.The fund currently offers four classes of shares: Class A (100 million shares authorized), Class C (100 million shares authorized), Class I (100 million shares authorized) and Class T (100 million shares authorized). Class A and Class T shares are subject to a sales charge imposed at the time of purchase. Class C shares are subject to a contingent deferred sales charge (“CDSC”) imposed on Class C shares redeemed
16
within one year of purchase. Class I shares are sold at net asset value per share only to institutional investors. Other differences between the classes include the services offered to and the expenses borne by each class, the allocation of certain transfer agency costs and certain voting rights. Income, expenses (other than expenses attributable to a specific class), and realized and unrealized gains or losses on investments are allocated to each class of shares based on its relative net assets.
As of October 31, 2008, MBC Investments Corp., an indirect subsidiary of BNY Mellon, held 392,000 of the outstanding Class A shares and 56,000 each of the outstanding Class C, Class I and Class T shares of the fund.
The Company accounts separately for the assets, liabilities and operations of each series. Expenses directly attributable to each series are charged to that series’ operations; expenses which are applicable to all series are allocated among them on a pro rata basis.
The fund’s financial statements are prepared in accordance with U.S. generally accepted accounting principles, which may require the use of management estimates and assumptions. Actual results could differ from those estimates.
The fund enters into contracts that contain a variety of indemnifications. The fund’s maximum exposure under these arrangements is unknown.The fund does not anticipate recognizing any loss related to these arrangements.
(a) Portfolio valuation: Investments in equity securities are valued at the last sales price on the securities exchange or national securities market on which such securities are primarily traded. Securities listed on the National Market System for which market quotations are available are valued at the official closing price or, if there is no official closing price that day, at the last sales price. Securities not listed on an exchange or the national securities market, or securities for which there were no transactions, are valued at the average of the most recent bid and asked prices, except for open short positions, where the asked price
| NOTES TO FINANCIAL STATEMENTS (continued) |
is used for valuation purposes. Bid price is used when no asked price is available. Registered investment companies that are not traded on an exchange are valued at their net asset value.When market quotations or official closing prices are not readily available, or are determined not to reflect accurately fair value, such as when the value of a security has been significantly affected by events after the close of the exchange or market on which the security is principally traded (for example, a foreign exchange or market), but before the fund calculates its net asset value, the fund may value these investments at fair value as determined in accordance with the procedures approved by the Board of Directors. Fair valuing of securities may be determined with the assistance of a pricing service using calculations based on indices of domestic securities and other appropriate indicators, such as prices of relevant ADRs and futures contracts. For other securities that are fair valued by the Board of Directors, certain factors may be considered such as: fundamental analytical data, the nature and duration of restrictions on disposition, an evaluation of the forces that influence the market in which the securities are purchased and sold, and public trading in similar securities of the issuer or comparable issuers.
Investments in debt securities excluding short-term investments (other than U.S.Treasury Bills), financial futures, options and forward currency exchange contracts are valued each business day by an independent pricing service (the “Service”) approved by the Board of Directors. Investments for which quoted bid prices are readily available and are representative of the bid side of the market in the judgment of the Service are valued at the mean between the quoted bid prices (as obtained by the Service from dealers in such securities) and asked prices (as calculated by the Service based upon its evaluation of the market for such securities). Other investments are valued as determined by the Service, based on methods which include consideration of: yields or prices of securities of comparable quality, coupon, maturity and type; indications as to values from dealers; and general market conditions. Restricted securities, as well as securities or other assets for which recent market quotations are not readily available, that are not valued by a pricing service approved by the Board of Directors, or are determined
18
by the fund not to reflect accurately fair value, are valued at fair value as determined in good faith under the direction of the Board of Directors.The factors that may be considered when fair valuing a security include fundamental analytical data, the nature and duration of restrictions on disposition, an evaluation of the forces that influence the market in which the securities are purchased and sold and public trading in similar securities of the issuer or comparable issuers. Short-term investments, excluding U.S.Treasury Bills, are carried at amortized cost, which approximates value. Financial futures and options, which are traded on an exchange, are valued at the last sales price on the securities exchange on which such securities are primarily traded or at the last sales price on the national securities market on each business day. Options traded over-the-counter are priced at the mean between the bid and asked price. Investments denominated in foreign currencies are translated to U.S. dollars at the prevailing rates of exchange. Forward currency exchange contracts are valued at the forward rate.
The Financial Accounting Standards Board (“FASB”) released Statement of Financial Accounting Standards No. 157 “Fair Value Measurements” (“FAS 157”). FAS 157 establishes an authoritative definition of fair value, sets out a framework for measuring fair value, and requires additional disclosures about fair-value measurements. The application of FAS 157 is required for fiscal years beginning after November 15, 2007 and interim periods within those fiscal years. Management does not believe that the application of this standard will have a material impact on the financial statements of the fund.
(b) Foreign currency transactions: The fund does not isolate that portion of the results of operations resulting from changes in foreign exchange rates on investments from the fluctuations arising from changes in the market prices of securities held. Such fluctuations are included with the net realized and unrealized gain or loss on investments.
Net realized foreign exchange gains or losses arise from sales and maturities of short-term securities, sales of foreign currencies, currency gains or losses realized on securities transactions and the difference between
The Fund 19
| NOTES TO FINANCIAL STATEMENTS (continued) |
the amounts of dividends, interest and foreign withholding taxes recorded on the fund’s books and the U.S. dollar equivalent of the amounts actually received or paid. Net unrealized foreign exchange gains and losses arise from changes in the value of assets and liabilities other than investments in securities, resulting from changes in exchange rates. Such gains and losses are included with net realized and unrealized gain or loss on investments.
(c) Securities transactions and investment income: Securities transactions are recorded on a trade date basis. Realized gains and losses from securities transactions are recorded on the identified cost basis. Dividend income is recognized on the ex-dividend date and interest income, including, where applicable, accretion of discount and amortization of premium on investments, is recognized on the accrual basis.
The fund has arrangements with the custodian and cash management banks whereby the fund may receive earnings credits when positive cash balances are maintained, which are used to offset custody and cash management fees. For financial reporting purposes, the fund includes net earnings credits as an expense offset in the Statement of Operations.
(d) Affiliated issuers: Investments in other investment companies advised by Dreyfus are defined as “affiliated” in the Act.
(e) Dividends to shareholders: Dividends are recorded on the ex-dividend date. Dividends from investment income-net and dividends from net realized capital gains, if any, are normally declared and paid annually, but the fund may make distributions on a more frequent basis to comply with the distribution requirements of the Internal Revenue Code of 1986, as amended (the “Code”).To the extent that net realized capital gains can be offset by capital loss carryovers, it is the policy of the fund not to distribute such gains. Income and capital gain distributions are determined in accordance with income tax regulations, which may differ from U.S. generally accepted accounting principles.
(f) Federal income taxes: It is the policy of the fund to continue to qualify as a regulated investment company, if such qualification is in the best interests of its shareholders, by complying with the applicable pro-
20
visions of the Code, and to make distributions of taxable income sufficient to relieve it from substantially all federal income and excise taxes.
The fund adopted FASB Interpretation No. 48 “Accounting for Uncertainty in Income Taxes” (“FIN 48”). FIN 48 provides guidance for how uncertain tax positions should be recognized, measured, presented and disclosed in the financial statements. FIN 48 requires the evaluation of tax positions taken or expected to be taken in the course of preparing the fund’s tax returns to determine whether the tax positions are “more-likely-than-not” of being sustained by the applicable tax authority. Liability for tax positions not deemed to meet the more-likely-than-not threshold would be recorded as a tax expense in the current year.The adoption of FIN 48 had no impact on the operations of the fund for the period ended October 31, 2008.
As of and during the period ended October 31, 2008, the fund did not have any liabilities for any unrecognized tax positions. The fund recognizes interest and penalties, if any, related to unrecognized tax positions as income tax expense in the Statement of Operations. During the period, the fund did not incur any interest or penalties.
The tax year for the period ended October 31, 2008 remains subject to examination by the Internal Revenue Service and state taxing authorities.
At October 31, 2008, the components of accumulated earnings on a tax basis were as follows: undistributed ordinary income $164,191, accumulated capital losses $1,426,727 and unrealized depreciation $173,071.
The accumulated capital loss carryover is available for federal income tax purposes to be applied against future net securities profits, if any, realized subsequent to October 31, 2008. If not applied the carryover expires in fiscal 2016.
During the period ended October 31, 2008, as a result of permanent book to tax differences, primarily due to the tax treatment for foreign currency gains and losses, the fund increased accumulated undistributed investment income-net by $85,227, decreased accumulated net realized gain (loss) on investments by $83,332 and decreased paid-in
| NOTES TO FINANCIAL STATEMENTS (continued) |
capital by $1,895. Net assets and net asset value per share were not affected by this reclassification.
NOTE 2—Bank Lines of Credit:
Prior to October 15, 2008, the fund participated with other Dreyfus-managed funds in a $350 million redemption credit facility. Effective October 15, 2008, the fund participates with other Dreyfus-managed funds in a $145 million redemption credit facility (the “Facility”) to be utilized for temporary or emergency purposes, including the financing of redemptions. In connection therewith, the fund has agreed to pay commitment fees on its pro rata portion of the Facility. Interest is charged to the fund based on prevailing market rates in effect at the time of borrowing. During the period ended October 31, 2008, the fund did not borrow under either Facility.
NOTE 3—Management Fee, Sub-Investment Advisory Fee and Other Transactions With Affiliates:
(a) Pursuant to a Management Agreement (“Agreement”) with Dreyfus, the management fee is computed at the annual rate of 1.10% of the value of the fund’s average daily net assets and is payable monthly. Dreyfus has agreed, to waive receipt of its fees and/or assume the expenses of the fund, until March 1, 2010, so that the expenses of none of the classes, exclusive of taxes, brokerage fees, Rule 12b-1 distribution plan fees, interest on borrowings, shareholder services plan fees, commitment fees and extraordinary expenses, exceed an annual rate of 1.25% of the value of the average daily net assets of their class. The expense reimbursement, pursuant to the undertaking, amounted to $127,135 during the period ended October 31, 2008.
Pursuant to a Sub-Investment Advisory Agreement between Dreyfus and MCM, Dreyfus pays MCM an annual fee of .65% of the value of the fund’s average daily net assets, payable monthly.
(b) Under the Distribution Plan (the “Plan”) adopted pursuant to Rule 12b-1 under the Act, Class C and Class T shares pay the Distributor for distributing their shares at an annual rate of .75% and .25% of the value
22
of their respective average daily net assets. During the period ended October 31, 2008, Class C and Class T shares were charged $4,799 and $1,476, respectively, pursuant to the Plan.
(c) Under the Shareholder Services Plan, Class A, Class C and Class T shares pay the Distributor at an annual rate of .25% of the value of their average daily net assets for the provision of certain services.The services provided may include personal services relating to shareholder accounts, such as answering shareholder inquiries regarding the fund and providing reports and other information, and services related to the maintenance of shareholder accounts.The Distributor may make payments to Service Agents (a securities dealer, financial institution or other industry professional) in respect of these services.The Distributor determines the amounts to be paid to Service Agents. During the period ended October 31, 2008, Class A, Class C and Class T shares were charged $10,310, $1,600 and $1,476, respectively, pursuant to the Shareholder Services Plan.
The fund compensates Dreyfus Transfer, Inc., a wholly-owned subsidiary of Dreyfus, under a transfer agency agreement for providing personnel and facilities to perform transfer agency services for the fund. During the period ended October 31, 2008, the fund was charged $608 pursuant to the transfer agency agreement.
The fund compensates The Bank of New York Mellon, a subsidiary of BNY Mellon and an affiliate of Dreyfus, under a cash management agreement for performing cash management services related to fund subscriptions and redemptions. During the period ended October 31, 2008, the fund was charged $26 pursuant to the cash management agreement.
The fund compensates The Bank of New York Mellon under a custody agreement for providing custodial services for the fund. During the period ended October 31, 2008, the fund was charged $9,958 pursuant to the custody agreement.
| NOTES TO FINANCIAL STATEMENTS (continued) |
During the period ended October 31, 2008, the fund was charged $6,203 for services performed by the Chief Compliance Officer.
The components of “Due from The Dreyfus Corporation and affiliates” in the Statement of Assets and Liabilities consist of: an expense reimbursement of $37,506, which is offset by management fees $9,556, Rule 12b-1 distribution plan fees $754, shareholder services plan fees $1,323, custodian fees $1,033, chief compliance officer fees $1,973 and transfer agency per account fees $76.
(d) Each Board member also serves as a Board member of other funds within the Dreyfus complex. Annual retainer fees and attendance fees are allocated to each fund based on net assets.
NOTE 4—Securities Transactions:
During the period ended October 31, 2008, there were no purchases and sales of investment securities, excluding short-term securities, financial futures, options transactions and forward currency exchange contracts.
The fund may invest in financial futures contracts in order to gain exposure to or protect against changes in the market. The fund is exposed to market risk as a result of changes in the value of the underlying financial instruments. Investments in financial futures require the fund to “mark to market” on a daily basis, which reflects the change in the market value of the contract at the close of each day’s trading. Accordingly, variation margin payments are received or made to reflect daily unrealized gains or losses.When the contracts are closed, the fund recognizes a realized gain or loss.These investments require initial margin deposits with a broker, which consist of cash or cash equivalents. The amount of these deposits is determined by the exchange or Board of Trade on which the contract is traded and is subject to change. Contracts open at October 31, 2008, are set forth in the Statement of Financial Futures.
The fund may purchase and write (sell) put and call options in order to gain exposure to or to protect against changes in the market.
24
As a writer of call options, the fund receives a premium at the outset and then bears the market risk of unfavorable changes in the price of the financial instrument underlying the option. Generally, the fund would incur a gain, to the extent of the premium, if the price of the underlying financial instrument decreases between the date the option is written and the date on which the option is terminated. Generally, the fund would realize a loss, if the price of the financial instrument increases between those dates.At October 31, 2008, there were no call options written.
As a writer of put options, the fund receives a premium at the outset and then bears the market risk of unfavorable changes in the price of the financial instrument underlying the option. Generally, the fund would incur a gain, to the extent of the premium, if the price of the underlying financial instrument increases between the date the option is written and the date on which the option is terminated. Generally, the fund would realize a loss, if the price of the financial instrument decreases between those dates.At October 31, 2008, there were no put options written.
The fund enters into forward currency exchange contracts in order to hedge its exposure to changes in foreign currency exchange rates on its foreign portfolio holdings and to settle foreign currency transac-tions.When executing forward currency exchange contracts, the fund is obligated to buy or sell a foreign currency at a specified rate on a certain date in the future. With respect to sales of forward currency exchange contracts, the fund would incur a loss if the value of the contract increases between the date the forward contract is opened and the date the forward contract is closed.The fund realizes a gain if the value of the contract decreases between those dates. With respect to purchases of forward currency exchange contracts, the fund would incur a loss if the value of the contract decreases between the date the forward contract is opened and the date the forward contract is closed. The fund realizes a gain if the value of the contract increases between those dates. The fund is also exposed to credit risk associated with
| NOTES TO FINANCIAL STATEMENTS (continued) |
counterparty nonperformance on these forward currency exchange contracts, which is typically limited to the unrealized gain on each open contract. The following summarizes open forward currency exchange contracts at October 31, 2008:
| | | Foreign | | | | | | Unrealized |
| Forward Currency | | Currency | | | | | | Appreciation |
| Exchange Contracts | | Amounts | | Cost ($) | | Value ($) (Depreciation) ($) |
| |
| |
| |
|
| Purchases: | | | | | | | | |
| British Pound, | | | | | | | | |
| Expiring 12/17/2008 | | 132,623 | | 231,938 | | 212,851 | | (19,087) |
| British Pound, | | | | | | | | |
| Expiring 12/17/2008 | | 357,789 | | 622,639 | | 574,227 | | (48,412) |
| British Pound, | | | | | | | | |
| Expiring 12/17/2008 | | 413,693 | | 722,126 | | 663,949 | | (58,177) |
| Canadian Dollar, | | | | | | | | |
| Expiring 12/17/2008 | | 590,750 | | 564,944 | | 490,100 | | (74,844) |
| Canadian Dollar, | | | | | | | | |
| Expiring 12/17/2008 | | 37,710 | | 36,567 | | 31,285 | | (5,281) |
| Canadian Dollar, | | | | | | | | |
| Expiring 12/17/2008 | | 90,000 | | 72,831 | | 74,666 | | 1,835 |
| Euro | | | | | | | | |
| Expiring 12/17/2008 | | 189,984 | | 266,901 | | 241,813 | | (25,088) |
| Euro | | | | | | | | |
| Expiring 12/17/2008 | | 348,045 | | 491,373 | | 442,995 | | (48,379) |
| Euro | | | | | | | | |
| Expiring 12/17/2008 | | 1,010,117 | | 1,443,962 | | 1,285,685 | | (158,277) |
| Swiss Franc, | | | | | | | | |
| Expiring 12/17/2008 | | 129,205 | | 118,157 | | 111,503 | | (6,655) |
| Swiss Franc, | | | | | | | | |
| Expiring 12/17/2008 | | 213,120 | | 188,972 | | 183,920 | | (5,051) |
| Swiss Franc, | | | | | | | | |
| Expiring 12/17/2008 | | 769,600 | | 677,881 | | 664,157 | | (13,724) |
| Swiss Franc, | | | | | | | | |
| Expiring 12/17/2008 | | 66,880 | | 59,318 | | 57,717 | | (1,601) |
| Swiss Franc, | | | | | | | | |
| Expiring 12/17/2008 | | 101,908 | | 90,689 | | 87,946 | | (2,744) |
| Swiss Franc, | | | | | | | | |
| Expiring 12/17/2008 | | 596,092 | | 533,232 | | 514,421 | | (18,811) |
| Swiss Franc, | | | | | | | | |
| Expiring 12/17/2008 | | 190,200 | | 163,741 | | 164,141 | | 400 |
| Swiss Franc, | | | | | | | | |
| Expiring 12/17/2008 | | 57,000 | | 50,627 | | 49,190 | | (1,436) |
| Swiss Franc, | | | | | | | | |
| Expiring 12/17/2008 | | 189,000 | | 163,437 | | 163,105 | | (332) |
| Japanese Yen, | | | | | | | | |
| Expiring 12/17/2008 | | 7,403,922 | | 74,420 | | 75,323 | | 903 |
26
| | | Foreign | | | | | | Unrealized |
| Forward Currency | | Currency | | | | | | Appreciation |
| Exchange Contracts | | Amounts | | Cost ($) | | Value ($) (Depreciation) ($) |
| |
| |
| |
|
| Purchases (continued): | | | | | | | | |
| Japanese Yen, | | | | | | | | |
| Expiring 12/17/2008 | | 43,271,950 | | 437,444 | | 440,221 | | 2,777 |
| Japanese Yen, | | | | | | | | |
| Expiring 12/17/2008 | | 3,016,400 | | 29,535 | | 30,687 | | 1,152 |
| Japanese Yen, | | | | | | | | |
| Expiring 12/17/2008 | | 30,099,240 | | 323,585 | | 306,210 | | (17,375) |
| Japanese Yen, | | | | | | | | |
| Expiring 12/17/2008 | | 9,771,860 | | 105,098 | | 99,413 | | (5,685) |
| Sales: | | | | Proceeds ($) | | | | |
| Australian Dollar, | | | | | | | | |
| Expiring 12/17/2008 | | 1,057,041 | | 828,403 | | 699,366 | | 129,037 |
| Australian Dollar, | | | | | | | | |
| Expiring 12/17/2008 | | 305,620 | | 257,485 | | 202,206 | | 55,278 |
| Australian Dollar, | | | | | | | | |
| Expiring 12/17/2008 | | 5,180 | | 4,329 | | 3,427 | | 902 |
| Australian Dollar, | | | | | | | | |
| Expiring 12/17/2008 | | 59,200 | | 49,204 | | 39,168 | | 10,036 |
| Australian Dollar, | | | | | | | | |
| Expiring 12/17/2008 | | 167,000 | | 129,575 | | 110,492 | | 19,084 |
| Australian Dollar, | | | | | | | | |
| Expiring 12/17/2008 | | 121,200 | | 81,594 | | 80,189 | | 1,405 |
| Australian Dollar, | | | | | | | | |
| Expiring 12/17/2008 | | 30,300 | | 21,219 | | 20,047 | | 1,172 |
| Australian Dollar, | | | | | | | | |
| Expiring 12/17/2008 | | 35,552 | | 24,250 | | 23,522 | | 728 |
| Australian Dollar, | | | | | | | | |
| Expiring 12/17/2008 | | 14,948 | | 10,060 | | 9,890 | | 170 |
| Australian Dollar, | | | | | | | | |
| Expiring 12/17/2008 | | 46,400 | | 33,205 | | 30,699 | | 2,505 |
| Australian Dollar, | | | | | | | | |
| Expiring 12/17/2008 | | 81,200 | | 56,457 | | 53,724 | | 2,733 |
| British Pounds, | | | | �� | | | | |
| Expiring 12/17/2008 | | 97,200 | | 156,161 | | 155,999 | | 162 |
| British Pounds, | | | | | | | | |
| Expiring 12/17/2008 | | 224,591 | | 349,374 | | 360,453 | | (11,080) |
| Canadian Dollar, | | | | | | | | |
| Expiring 12/17/2008 | | 1,140,180 | | 1,066,985 | | 945,920 | | 121,064 |
| Canadian Dollar, | | | | | | | | |
| Expiring 12/17/2008 | | 110,000 | | 97,250 | | 91,259 | | 5,992 |
| Euro, | | | | | | | | |
| Expiring 12/17/2008 | | 96,000 | | 135,025 | | 122,190 | | 12,835 |
| Euro, | | | | | | | | |
| Expiring 12/17/2008 | | 329,000 | | 474,866 | | 418,754 | | 56,112 |
The Fund 27
| NOTES TO FINANCIAL STATEMENTS (continued) |
| | | Foreign | | | | | | Unrealized |
| Forward Currency | | Currency | | | | | | Appreciation |
| Exchange Contracts | | Amounts | | Proceeds ($) | | Value ($) (Depreciation) ($) |
| |
| |
| |
|
| Sales (continued): | | | | | | | | |
| Euro, | | | | | | | | |
| Expiring 12/17/2008 | | 386,008 | | 522,307 | | 491,314 | | 30,993 |
| Euro, | | | | | | | | |
| Expiring 12/17/2008 | | 49,053 | | 61,037 | | 62,435 | | (1,398) |
| Euro, | | | | | | | | |
| Expiring 12/17/2008 | | 331,450 | | 427,767 | | 421,872 | | 5,894 |
| Swiss Franc, | | | | | | | | |
| Expiring 12/17/2008 | | 56,526 | | 50,255 | | 48,781 | | 1,473 |
| Swiss Franc, | | | | | | | | |
| Expiring 12/17/2008 | | 273,306 | | 248,021 | | 235,860 | | 12,161 |
| Total | | | | | | | | (46,634) |
At October 31, 2008, the cost of investments for federal income tax purposes was $10,196,757; accordingly, accumulated net unrealized depreciation on investments was $60,659, consisting of $2,465 gross unrealized appreciation and $63,124 gross unrealized depreciation.
In March 2008, the FASB released Statement of Financial Accounting Standards No. 161 “Disclosures about Derivative Instruments and Hedging Activities” (“FAS 161”). FAS 161 requires qualitative disclosures about objectives and strategies for using derivatives, quantitative disclosures about fair value amounts of gains and losses on derivative instruments and disclosures about credit-risk-related contingent features in derivative agreements.The application of FAS 161 is required for fiscal years and interim periods beginning after November 15, 2008. At this time, management is evaluating the implications of FAS 161 and its impact on the financial statements and the accompanying notes has not yet been determined.
28
NOTE 5—Subsequent Event:
Effective on or about February 4, 2009 (the “Effective Date”), the fund will issue to each holder of its Class T shares, in exchange for said shares, Class A shares of the fund having an aggregate net asset value equal to the aggregate net asset value of the shareholder’s Class T shares.Thereafter, the fund will no longer offer Class T shares.
Effective on or about December 3, 2008, no investments for new accounts were permitted in Class T of the fund, except that participants in certain group retirement plans were able to open a new account in Class T of the fund, provided that the fund was established as an investment option under the plans before December 3, 2008. After the Effective Date, subsequent investments in the fund’s Class A shares made by holders of the fund’s Class T shares who received Class A shares of the fund in exchange for their Class T shares will be subject to the front-end sales load schedule currently in effect for Class T shares. Otherwise, all other Class A share attributes will be in effect.
The Fund 29
REPORT OF INDEPENDENT REGISTERED
PUBLIC ACCOUNTING FIRM |
| | Shareholders and Board of Directors
Dreyfus Global Absolute Return Fund |
We have audited the accompanying statement of assets and liabilities, including the statements of investments and financial futures, of Dreyfus Global Absolute Return Fund (one of the series comprising Advantage Funds, Inc.) as of October 31, 2008, and the related statements of operations and changes in net assets and financial highlights for the period from December 18, 2007 (commencement of operations) to October 31, 2008.These financial statements and financial highlights are the responsibility of the Fund’s management. Our responsibility is to express an opinion on these financial statements and financial highlights based on our audit.
We conducted our audit in accordance with the standards of the Public Company Accounting Oversight Board (United States).Those standards require that we plan and perform the audit to obtain reasonable assurance about whether the financial statements and financial highlights are free of material misstatement.We were not engaged to perform an audit of the Fund’s internal control over financial reporting. Our audit included consideration of internal control over financial reporting as a basis for designing audit procedures that are appropriate in the circumstances, but not for the purpose of expressing an opinion on the effectiveness of the Fund’s internal control over financial reporting.Accordingly, we express no such opinion. An audit also includes examining, on a test basis, evidence supporting the amounts and disclosures in the financial statements and financial highlights, assessing the accounting principles used and significant estimates made by management, and evaluating the overall financial statement presentation. Our procedures included confirmation of securities owned as of October 31, 2008 by correspondence with the custodian and others. We believe that our audit provides a reasonable basis for our opinion.
In our opinion, the financial statements and financial highlights referred to above present fairly, in all material respects, the financial position of Dreyfus Global Absolute Return Fund at October 31, 2008, and the results of its operations,the changes in its net assets and the financial highlights for the period from December 18, 2007 to October 31, 2008, in conformity with U.S. generally accepted accounting principles.

30
BOARD MEMBERS INFORMATION (Unaudited)

BOARD MEMBERS INFORMATION (Unaudited) (continued)

32

OFFICERS OF THE FUND (Unaudited)
34

The Fund 35
NOTES
| Dreyfus |
| Total Return |
| Advantage Fund |
| | ANNUAL REPORT October 31, 2008 |

Save time. Save paper. View your next shareholder report online as soon as it’s available. Log into www.dreyfus.com and sign up for Dreyfus eCommunications. It’s simple and only takes a few minutes.
The views expressed in this report reflect those of the portfolio manager only through the end of the period covered and do not necessarily represent the views of Dreyfus or any other person in the Dreyfus organization. Any such views are subject to change at any time based upon market or other conditions and Dreyfus disclaims any responsibility to update such views.These views may not be relied on as investment advice and, because investment decisions for a Dreyfus fund are based on numerous factors, may not be relied on as an indication of trading intent on behalf of any Dreyfus fund.

| | Contents |
| |
| | THE FUND |
| |
| 2 | A Letter from the CEO |
| |
| 3 | Discussion of Fund Performance |
| |
| 6 | Fund Performance |
| |
| 8 | Understanding Your Fund’s Expenses |
| |
| 8 | Comparing Your Fund’s Expenses With Those of Other Funds |
| |
| 9 | Statement of Investments |
| |
| 20 | Statement of Financial Futures |
| |
| 21 | Statement of Options Written |
| |
| 22 | Statement of Assets and Liabilities |
| |
| 23 | Statement of Operations |
| |
| 24 | Statement of Changes in Net Assets |
| |
| 26 | Financial Highlights |
| |
| 29 | Notes to Financial Statements |
| |
| 43 | Report of Independent Registered Public Accounting Firm |
| |
| 44 | Important Tax Information |
| |
| 45 | Board Members Information |
| |
| 48 | Officers of the Fund |
| |
| | FOR MORE INFORMATION |
| |
| | Back Cover |
| |
The Fund
Dreyfus
Total Return
Advantage Fund |

A LETTER FROM THE CEO
Dear Shareholder:
We present to you this annual report for Dreyfus Total Return Advantage Fund, covering the 12-month period from November 1, 2007, through October 31, 2008.
These are difficult times for fixed-income investors. A credit crunch that began in 2007 has developed into a full-blown global financial crisis, recently resulting in the failure of several major financial institutions and prompting a massive government rescue effort.The U.S. economic slowdown also has gathered momentum, depressing investor sentiment and consumer confidence. These factors undermined returns in the bond market’s higher-yielding sectors, including high yield corporate and municipal securities, and even the traditional safe haven of U.S. government securities has encountered heightened yield volatility. The depth and duration of the economic downturn will depend on how quickly the financial system can be stabilized.We believe that the Temporary Guarantee Program for Money Market Funds and the $700 billion rescue package intended to promote greater liquidity in the financial markets meet several critical requirements for addressing today’s financial stresses, and we expect these measures to contribute to a more orderly deleveraging process. However, recuperation from the financial crisis is likely to take time. In the meantime, we encourage you to keep in touch with your financial advisor and maintain a long-term and disciplined perspective to investing. Indeed, we already are seeing some positive signs, including a likely peak in global inflationary pressures, a bottoming of the U.S. dollar and a large pool of worldwide financial liquidity that could be deployed gradually to riskier assets as the economic cycle turns.
For information about how the fund performed during the reporting period, as well as market perspectives, we have provided a Discussion of Fund Performance given by the fund’s Portfolio Managers.
Thank you for your continued confidence and support.

Jonathan R. Baum
Chief Executive Officer
The Dreyfus Corporation
November 17, 2008 |
2

DISCUSSION OF FUND PERFORMANCE
For the period of November 1, 2007, through October 31, 2008, as provided by David Kwan and Lowell Bennett, Portfolio Managers
Fund and Market Performance Overview
For the 12-month period ended October 31, 2008, DreyfusTotal Return Advantage Fund’s Class A shares achieved a total return of 0.21%, Class C shares returned –0.55% and Class I shares returned 0.54% .1 In comparison, the fund’s benchmark, the Barclays Capital U.S.Aggregate Index (the “Index”), produced a total return of 0.30% for the same period.2
Bond and currency markets proved highly volatile as a global financial crisis culminated in the near collapse of the global banking system in September 2008.The fund produced returns that were roughly in line with its benchmark, as success in our core bond strategy was offset by lagging results in our currency strategy.
The Fund’s Investment Approach
The fund seeks to maximize total return from capital appreciation and income.To pursue its goal, the fund normally invests primarily in securities and other instruments that provide exposure to fixed income and currency markets.
To focus the fund’s investments on the U.S. fixed income market, we employ an active core bond strategy, in which four proprietary quantitative models are run and implemented independently of one another. We overlay the active core bond strategy with a separate global bond strategy, setting the fund’s exposures to the world’s major bond markets according to our view of their relative valuations. Finally, we employ an active currency strategy in which we evaluate and establish exposure to various currencies based on relative valuations as determined by real interest rates and purchasing power parity.
The fund typically will invest in bonds rated investment grade or the unrated equivalent, but we may invest up to 30% of the fund’s assets in securities rated below investment grade at the time of purchase. The average effective maturity of the fund’s portfolio typically will range between three and 10 years. Although the fund’s investment will be
The Fund 3
| DISCUSSION OF FUND PERFORMANCE (continued) |
focused among the major developed capital markets of the world, the fund may invest up to 30% of its assets in emerging markets.
Global Financial Crisis Sparked Broad Market Declines
A credit crunch developed into a global financial crisis later in the reporting period, nearly leading to the collapse of the global banking system. Intervention by government authorities pumped billions of dollars of liquidity into the system, helping to begin to thaw frozen credit markets by the reporting period’s end.These efforts included the passage of the controversialTroubled Asset Relief Program by the U.S. Congress and a coordinated reduction of short-term interest rates by central banks.
Meanwhile, slumping housing markets, rising unemployment and plummeting consumer confidence gave rise to fears regarding a potentially deep and prolonged recession in the United States and overseas. Many commodity prices that had soared over the reporting period’s first half plunged over the second half when global demand abated for energy and construction materials.
As market conditions worsened, highly leveraged institutional investors were forced to sell their more liquid investments to raise cash for margin calls. Selling pressure intensified even among fundamentally sound securities, leading to broadly lower prices for corporate bonds, asset-backed securities, mortgage-backed securities and the sovereign debt of developing nations. U.S. Treasury securities fared better as newly risk-averse investors flocked to the relatively safe haven provided by U.S.government securities. Meanwhile, after slumping for much of the reporting period, the U.S. dollar rallied late in the reporting period as investors engaged in a “flight to quality” during the financial crisis.
Core Strategy Success Offset by Lagging Currency Strategy
As the financial crisis intensified, treasury yields moved, at times dramatically, ending the year lower, especially on the short end of the yield curve.The fund’s core bond strategy benefited from this movement, as our term structure model successfully positioned the fund in the more advantageous segments of the yield curve. In addition, an emphasis on quality, including U.S. government related securities and highly rated bonds in other sectors, supported relative performance. The fund’s global bond strategy produced returns that generally were in line with
4
industry averages, with above-average returns from the U.S. markets offset by lagging results in Japan and other overseas markets.
In the fund’s currency strategy, unfortunate timing in allocations to the U.S. dollar was the major factor that undermined performance.An overweighted position hurt results early in the reporting period as the dollar’s value declined, and an underweighted position later in the reporting period fared poorly when the currency rallied.An overweighted position in the euro also detracted from performance later in the reporting period.
Finding Opportunities in Distressed Markets
Recent government intervention in the financial crisis has given us greater confidence in global credit and currency markets. Our core strategy has continued to focus on higher-quality bonds, but we may begin to take advantage of historically low valuations toward the lower end of the investment-grade range. Due to a steep U.S. yield curve, we have continued to favor U.S. bonds over Japanese bonds in our global bond strategy, and our currency strategy has de-emphasized the U.S. dollar and the euro in favor of the Swedish krona and Swiss franc.
November 17, 2008
Foreign bonds are subject to special risks including exposure to currency fluctuations, changing political and economic conditions, and potentially less liquidity.
Investments in foreign currencies are subject to the risk that those currencies will decline in value relative to the U.S. dollar, or, in the case of hedged positions, that the U.S. dollar will decline relative to the currency being hedged. Currency rates in foreign countries may fluctuate significantly over short periods of time. A decline in the value of foreign currencies relative to the U.S. dollar will reduce the value of securities held by the fund and denominated in those currencies.
| 1 | Total return includes reinvestment of dividends and any capital gains paid and does not take into consideration the maximum initial sales charge in the case of Class A shares or the applicable contingent deferred sales charge imposed on redemptions in the case of Class C shares. Had these charges been reflected, returns would have been lower. Past performance is no guarantee of future results. Share price and investment return fluctuate such that upon redemption, fund shares may be worth more or less than their original cost. Return figures provided reflect the absorption of certain fund expenses by The Dreyfus Corporation pursuant to an agreement in effect through March 1, 2010, at which time it may be extended, modified or terminated. Had these expenses not been absorbed, the fund’s returns would have been lower. |
| |
| 2 | SOURCE: LIPPER INC. — Reflects reinvestment of dividends and, where applicable, capital gain distributions.The Barclays Capital U.S.Aggregate Index is a widely accepted, unmanaged total return index of corporate, U.S. government and U.S. government agency debt instruments, mortgage- backed securities and asset-backed securities with an average maturity of 1-10 years. Index returns do not reflect fees and expenses associated with operating a mutual fund. |
| |
The Fund 5
FUND PERFORMANCE
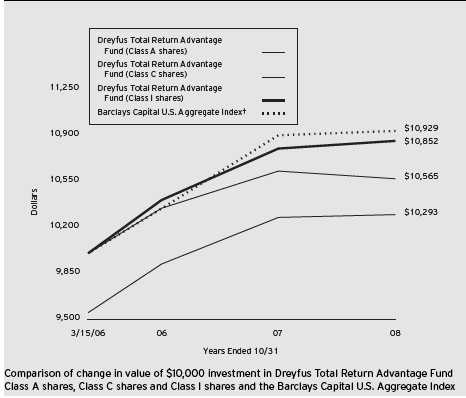
| † Source: Lipper Inc. |
| Past performance is not predictive of future performance. |
| The above graph compares a $10,000 investment made in Class A, Class C and Class I shares of Dreyfus Total |
| Return Advantage Fund on 3/15/06 (inception date) to a $10,000 investment made in the Barclays Capital U.S. |
| Aggregate Index (the “Index”) on that date. For comparative purposes, the value of the Index on 2/28/06 is used as |
| the beginning value on 3/15/06. All dividends and capital gain distributions are reinvested. |
| The fund invests primarily in fixed-income securities and instruments that provide investment exposure to fixed-income |
| markets.The fund’s performance shown in the line graph takes into account the maximum initial sales charge on Class A |
| shares and all other applicable fees and expenses on all classes.The Index is a widely accepted, unmanaged total return |
| index of corporate, U.S. government and U.S. government agency debt instruments, mortgage-backed securities and asset- |
| backed securities with an average maturity of 1-10 years. Unlike a mutual fund, the Index is not subject to charges, fees |
| and other expenses. Investors cannot invest directly in any index. Further information relating to fund performance, |
| including expense reimbursements, if applicable, is contained in the Financial Highlights section of the prospectus and |
| elsewhere in this report. |
6
| Average Annual Total Returns as of 10/31/08 | | | | | | |
| |
| | | Inception | | | | From |
| | | Date | | 1 Year | | Inception |
| |
| |
| |
|
| Class A shares | | | | | | |
| with maximum sales charge (4.5%) | | 3/15/06 | | (4.27)% | | 1.11% |
| without sales charge | | 3/15/06 | | 0.21% | | 2.90% |
| Class C shares | | | | | | |
| with applicable redemption charge † | | 3/15/06 | | (1.51)% | | 2.11% |
| without redemption | | 3/15/06 | | (0.55)% | | 2.11% |
| Class I shares | | 3/15/06 | | 0.54% | | 3.16% |
Past performance is not predictive of future performance.The fund’s performance shown in the graph and table does not reflect the deduction of taxes that a shareholder would pay on fund distributions or the redemption of fund shares.
| † The maximum contingent deferred sales charge for Class C shares is 1% for shares redeemed within one year of the |
| date of purchase. |
The Fund 7
UNDERSTANDING YOUR FUND’S EXPENSES (Unaudited)
As a mutual fund investor, you pay ongoing expenses, such as management fees and other expenses. Using the information below, you can estimate how these expenses affect your investment and compare them with the expenses of other funds.You also may pay one-time transaction expenses, including sales charges (loads) and redemption fees, which are not shown in this section and would have resulted in higher total expenses. For more information, see your fund’s prospectus or talk to your financial adviser.
Review your fund’s expenses
The table below shows the expenses you would have paid on a $1,000 investment in DreyfusTotal Return Advantage Fund from May 1, 2008 to October 31, 2008. It also shows how much a $1,000 investment would be worth at the close of the period, assuming actual returns and expenses.
| Expenses and Value of a $1,000 Investment |
| assuming actual returns for the six months ended October 31, 2008 |
| | | Class A | | Class C | | Class I |
| |
| |
| |
|
| Expenses paid per $1,000† | | $ 4.45 | | $ 8.14 | | $ 3.21 |
| Ending value (after expenses) | | $965.40 | | $961.50 | | $966.90 |
| | COMPARING YOUR FUND’S EXPENSES
WITH THOSE OF OTHER FUNDS (Unaudited) |
Using the SEC’s method to compare expenses
The Securities and Exchange Commission (SEC) has established guidelines to help investors assess fund expenses. Per these guidelines, the table below shows your fund’s expenses based on a $1,000 investment, assuming a hypothetical 5% annualized return. You can use this information to compare the ongoing expenses (but not transaction expenses or total cost) of investing in the fund with those of other funds.All mutual fund shareholder reports will provide this information to help you make this comparison. Please note that you cannot use this information to estimate your actual ending account balance and expenses paid during the period.
| | Expenses and Value of a $1,000 Investment
assuming a hypothetical 5% annualized return for the six months ended October 31, 2008 |
| | | Class A | | Class C | | Class I |
| |
| |
| |
|
| Expenses paid per $1,000† | | $ 4.57 | | $ 8.36 | | $ 3.30 |
| Ending value (after expenses) | | $1,020.61 | | $1,016.84 | | $1,021.87 |
| † Expenses are equal to the fund’s annualized expense ratio of .90% for Class A, 1.65% for Class C and .65% |
| for Class I, multiplied by the average account value over the period, multiplied by 184/366 (to reflect the one-half |
| year period). |
8
STATEMENT OF INVESTMENTS
October 31, 2008
| | | Coupon | | Maturity | | Principal | | | | |
| Bonds and Notes—83.2% | | Rate (%) | | Date | | Amount ($) | | | | Value ($) |
| |
| |
| |
| |
| |
|
| Aerospace & Defense—.1% | | | | | | | | | | |
| Northrop Grumman, | | | | | | | | | | |
| Gtd. Notes | | 7.13 | | 2/15/11 | | 20,000 | | | | 20,185 |
| Agriculture—.1% | | | | | | | | | | |
| UST, | | | | | | | | | | |
| Sr. Unscd. Notes | | 6.63 | | 7/15/12 | | 25,000 | | | | 22,462 |
| Asset-Backed Ctfs./ | | | | | | | | | | |
| Auto Receivables—2.7% | | | | | | | | | | |
| Americredit Automobile Receivables | | | | | | | | | | |
| Trust, Ser. 2007-CM, Cl. A4A | | 5.55 | | 4/7/14 | | 50,000 | | | | 41,873 |
| Americredit Automobile Receivables | | | | | | | | | | |
| Trust, Ser. 2007-DF, Cl. A4A | | 5.56 | | 6/6/14 | | 65,000 | | | | 57,161 |
| Chase Manhattan Auto Owner Trust, | | | | | | | | | | |
| Ser. 2006-B, Cl. A4 | | 5.11 | | 4/15/14 | | 100,000 | | | | 97,696 |
| Honda Auto Receivables Owner | | | | | | | | | | |
| Trust, Ser. 2005-5, Cl. A4 | | 4.69 | | 2/15/11 | | 126,069 | | | | 125,936 |
| Honda Auto Receivables Owner | | | | | | | | | | |
| Trust, Ser. 2006-2, Cl. A4 | | 5.28 | | 1/23/12 | | 100,000 | | | | 97,705 |
| Nissan Auto Receivables Owner | | | | | | | | | | |
| Trust, Ser. 2006-A, Cl. A4 | | 4.77 | | 7/15/11 | | 50,000 | | | | 49,356 |
| | | | | | | | | | | 469,727 |
| Asset-Backed Ctfs./Credit Cards—1.5% | | | | | | | | | | |
| Capital One Multi-Asset Execution | | | | | | | | | | |
| Trust, Ser. 2006-A10, Cl. A10 | | 5.15 | | 6/16/14 | | 80,000 | | | | 73,671 |
| Chase Issuance Trust, | | | | | | | | | | |
| Ser. 2005-A10, Cl. A10 | | 4.65 | | 12/17/12 | | 100,000 | | | | 94,220 |
| Citibank Credit Card Master Trust | | | | | | | | | | |
| I, Ser. 1999-2 Cl. A | | 5.88 | | 3/10/11 | | 100,000 | | | | 99,624 |
| | | | | | | | | | | 267,515 |
| Asset-Backed Ctfs./ | | | | | | | | | | |
| Home Equity Loans—.9% | | | | | | | | | | |
| MASTR Asset-Backed Securities | | | | | | | | | | |
| Trust, Ser. 2005-AB1, Cl. A2 | | 5.05 | | 11/25/35 | | 26,970 | | a | | 26,817 |
| Renaissance Home Equity Loan | | | | | | | | | | |
| Trust, Ser. 2005-2, Cl. AF3 | | 4.50 | | 8/25/35 | | 52,232 | | a | | 51,684 |
| Residential Asset Mortgage | | | | | | | | | | |
| Products, Ser. 2003-RZ4, Cl. A7 | | 4.79 | | 6/25/33 | | 84,019 | | a | | 80,998 |
| | | | | | | | | | | 159,499 |
The Fund 9
| STATEMENT OF INVESTMENTS (continued) |
| | | Coupon | | Maturity | | Principal | | |
| Bonds and Notes (continued) | | Rate (%) | | Date | | Amount ($) | | Value ($) |
| |
| |
| |
| |
|
| Banks—4.3% | | | | | | | | |
| Bank of Tokyo-Mitsubishi, | | | | | | | | |
| Sr. Sub. Notes | | 8.40 | | 4/15/10 | | 15,000 | | 14,884 |
| Bank One, | | | | | | | | |
| Sub. Notes | | 7.88 | | 8/1/10 | | 100,000 | | 102,401 |
| BSCH Issuances, | | | | | | | | |
| Bank Gtd. Notes | | 7.63 | | 9/14/10 | | 50,000 | | 47,170 |
| Comerica Bank, | | | | | | | | |
| Sub. Notes | | 5.75 | | 11/21/16 | | 15,000 | | 9,952 |
| Deutsche Bank AG London, | | | | | | | | |
| Sr. Unscd. Notes | | 5.38 | | 10/12/12 | | 50,000 | | 48,100 |
| Deutsche Bank London, | | | | | | | | |
| Sr. Unscd. Notes | | 6.00 | | 9/1/17 | | 10,000 | | 8,890 |
| Fifth Third Bancorp, | | | | | | | | |
| Sr. Unscd. Notes | | 6.25 | | 5/1/13 | | 30,000 | | 26,054 |
| HSBC Holdings, | | | | | | | | |
| Sr. Sub. Notes | | 5.25 | | 12/12/12 | | 50,000 | | 46,388 |
| Key Bank, | | | | | | | | |
| Sub. Notes | | 7.00 | | 2/1/11 | | 50,000 | | 46,521 |
| Marshall & Ilsley, | | | | | | | | |
| Sr. Unscd. Notes | | 4.38 | | 8/1/09 | | 75,000 | | 67,579 |
| National Westminster Bank, | | | | | | | | |
| Sub. Notes | | 7.38 | | 10/1/09 | | 50,000 | | 48,283 |
| PNC Funding, | | | | | | | | |
| Bank Gtd. Notes | | 5.63 | | 2/1/17 | | 15,000 | | 12,721 |
| Prudential Financial, | | | | | | | | |
| Sr. Unscd. Notes, Ser. B | | 5.10 | | 9/20/14 | | 20,000 | | 15,149 |
| Regions Financial, | | | | | | | | |
| Sub. Notes | | 6.38 | | 5/15/12 | | 25,000 | | 21,548 |
| Royal Bank of Canada, | | | | | | | | |
| Notes | | 3.88 | | 5/4/09 | | 100,000 | | 100,200 |
| US Bancorp, | | | | | | | | |
| Sr. Unscd. Notes, Ser. P | | 4.50 | | 7/29/10 | | 10,000 | | 9,790 |
| Wachovia, | | | | | | | | |
| Sub. Notes | | 5.63 | | 10/15/16 | | 25,000 | | 19,577 |
| Wells Fargo & Co., | | | | | | | | |
| Sr. Unscd. Notes | | 4.20 | | 1/15/10 | | 50,000 | | 49,275 |
| Wells Fargo & Co., | | | | | | | | |
| Sr. Unscd. Notes | | 5.25 | | 10/23/12 | | 20,000 | | 19,155 |
10
| | | Coupon | | Maturity | | Principal | | | | |
| Bonds and Notes (continued) | | Rate (%) | | Date | | Amount ($) | | | | Value ($) |
| |
| |
| |
| |
| |
|
| Banks (continued) | | | | | | | | | | |
| Wells Fargo & Co., | | | | | | | | | | |
| Sr. Unscd. Notes | | 5.30 | | 8/26/11 | | 30,000 | | | | 29,719 |
| Wells Fargo & Co., | | | | | | | | | | |
| Sr. Unscd. Notes | | 5.63 | | 12/11/17 | | 5,000 | | | | 4,419 |
| | | | | | | | | | | 747,775 |
| Chemicals—.1% | | | | | | | | | | |
| Lubrizol, | | | | | | | | | | |
| Gtd. Notes | | 4.63 | | 10/1/09 | | 15,000 | | | | 14,453 |
| Commercial Mortgage | | | | | | | | | | |
| Pass-Through Ctfs.—3.9% | | | | | | | | | | |
| Credit Suisse Mortgage Capital | | | | | | | | | | |
| Ctfs., Ser. 2006-C3, Cl. A3 | | 5.83 | | 6/15/38 | | 100,000 | | a | | 80,024 |
| GMAC Commercial Mortgage | | | | | | | | | | |
| Securities, Ser. 2001-C2, Cl. A1 | | 6.25 | | 4/15/34 | | 4,478 | | | | 4,460 |
| J.P. Morgan Chase Commercial | | | | | | | | | | |
| Mortgage Securities, | | | | | | | | | | |
| Ser. 2005-LDP3, Cl. A4A | | 4.94 | | 8/15/42 | | 102,000 | | a | | 80,688 |
| J.P. Morgan Chase Commercial | | | | | | | | | | |
| Mortgage Securities, | | | | | | | | | | |
| Ser. 2005-LDP3, Cl. A3 | | 4.96 | | 8/15/42 | | 75,000 | | | | 64,932 |
| Merrill Lynch Countrywide | | | | | | | | | | |
| Commercial Mortgage Trust, | | | | | | | | | | |
| Ser. 2007-5, Cl. A3 | | 5.36 | | 8/12/48 | | 100,000 | | | | 75,951 |
| Merrill Lynch/Countrywide | | | | | | | | | | |
| Commercial Mortgage, | | | | | | | | | | |
| Ser. 2006-2, Cl. A4 | | 5.91 | | 6/12/46 | | 100,000 | | a | | 80,368 |
| Morgan Stanley Capital I, | | | | | | | | | | |
| Ser. 2006-T21, Cl. A3 | | 5.19 | | 10/12/52 | | 110,000 | | a | | 92,950 |
| Morgan Stanley Capital I, | | | | | | | | | | |
| Ser. 2006-HQ8, Cl. AJ | | 5.47 | | 3/12/44 | | 65,000 | | a | | 40,419 |
| Morgan Stanley Dean Witter Capital | | | | | | | | | | |
| I, Ser. 2003-HQ2, Cl. A1 | | 4.18 | | 3/12/35 | | 104,508 | | | | 94,234 |
| Wachovia Bank Commercial Mortgage | | | | | | | | | | |
| Trust, Ser. 2005-C16, Cl. A2 | | 4.38 | | 10/15/41 | | 58,447 | | | | 56,270 |
| | | | | | | | | | | 670,296 |
| Consumer Discretionary—.3% | | | | | | | | | | |
| Clorox, | | | | | | | | | | |
| Sr. Unscd. Notes | | 4.20 | | 1/15/10 | | 15,000 | | | | 14,401 |
The Fund 11
| STATEMENT OF INVESTMENTS (continued) |
| | | Coupon | | Maturity | | Principal | | | | |
| Bonds and Notes (continued) | | Rate (%) | | Date | | Amount ($) | | | | Value ($) |
| |
| |
| |
| |
| |
|
| Consumer Discretionary (continued) | | | | | | | | | | |
| Fortune Brands, | | | | | | | | | | |
| Sr. Unscd. Notes | | 5.13 | | 1/15/11 | | 15,000 | | | | 13,878 |
| Xerox, | | | | | | | | | | |
| Gtd. Notes | | 7.13 | | 6/15/10 | | 25,000 | | | | 22,545 |
| | | | | | | | | | | 50,824 |
| Diversified Financial Services—7.2% | | | | | | | | | | |
| Allstate Life Global Funding | | | | | | | | | | |
| Trusts, Sr. Scd. Notes, | | | | | | | | | | |
| Ser. 04-1 | | 4.50 | | 5/29/09 | | 100,000 | | | | 99,456 |
| Ameriprise Financial, | | | | | | | | | | |
| Sr. Unscd. Notes | | 5.65 | | 11/15/15 | | 15,000 | | | | 11,457 |
| Bear Stearns, | | | | | | | | | | |
| Sr. Unscd. Notes | | 4.50 | | 10/28/10 | | 10,000 | | | | 9,725 |
| Bear Stearns, | | | | | | | | | | |
| Sr. Unscd. Notes | | 6.40 | | 10/2/17 | | 10,000 | | | | 8,903 |
| Blackrock, | | | | | | | | | | |
| Sr. Unsub. Notes | | 6.25 | | 9/15/17 | | 10,000 | | | | 8,750 |
| CIT Group, | | | | | | | | | | |
| Sr. Unscd. Notes | | 3.38 | | 4/1/09 | | 50,000 | | | | 45,439 |
| Citigroup, | | | | | | | | | | |
| Sr. Unscd. Notes | | 2.95 | | 6/9/09 | | 50,000 | | a | | 48,399 |
| Citigroup, | | | | | | | | | | |
| Sub. Notes | | 5.00 | | 9/15/14 | | 30,000 | | | | 23,742 |
| Citigroup, | | | | | | | | | | |
| Sr. Unscd. Notes | | 5.13 | | 5/5/14 | | 50,000 | | | | 42,745 |
| Citigroup, | | | | | | | | | | |
| Sr. Unscd. Notes | | 6.50 | | 1/18/11 | | 20,000 | | | | 19,478 |
| Countrywide Home Loans, | | | | | | | | | | |
| Gtd. Notes | | 4.13 | | 9/15/09 | | 25,000 | | | | 23,980 |
| Credit Suisse First Boston USA, | | | | | | | | | | |
| Gtd. Notes | | 2.94 | | 12/9/08 | | 50,000 | | a | | 49,763 |
| Credit Suisse First Boston USA, | | | | | | | | | | |
| Gtd. Notes | | 4.13 | | 1/15/10 | | 50,000 | | | | 48,826 |
| Credit Suisse First Boston USA, | | | | | | | | | | |
| Unscd. Notes | | 4.88 | | 8/15/10 | | 50,000 | | | | 48,539 |
| Credit Suisse USA, | | | | | | | | | | |
| Gtd. Notes | | 6.13 | | 11/15/11 | | 10,000 | | | | 9,567 |
12
| | | Coupon | | Maturity | | Principal | | | | |
| Bonds and Notes (continued) | | Rate (%) | | Date | | Amount ($) | | | | Value ($) |
| |
| |
| |
| |
| |
|
| Diversified Financial | | | | | | | | | | |
| Services (continued) | | | | | | | | | | |
| General Electric Capital, | | | | | | | | | | |
| Sr. Unscd. Notes, Ser. A | | 5.45 | | 1/15/13 | | 100,000 | | | | 92,506 |
| General Electric Capital, | | | | | | | | | | |
| Sr. Unscd. Notes, Ser. A | | 6.00 | | 6/15/12 | | 100,000 | | | | 95,681 |
| Goldman Sachs Group, | | | | | | | | | | |
| Sr. Unscd. Notes | | 5.70 | | 9/1/12 | | 100,000 | | | | 89,871 |
| Goldman Sachs Group, | | | | | | | | | | |
| Sr. Unscd. Notes | | 6.88 | | 1/15/11 | | 30,000 | | | | 29,264 |
| Household Finance, | | | | | | | | | | |
| Sr. Unscd. Notes | | 4.13 | | 11/16/09 | | 100,000 | | | | 96,038 |
| Household Finance, | | | | | | | | | | |
| Sr. Unscd. Notes | | 8.00 | | 7/15/10 | | 10,000 | | | | 9,734 |
| International Lease Finance, | | | | | | | | | | |
| Sr. Unscd. Notes | | 5.75 | | 6/15/11 | | 50,000 | | | | 34,279 |
| JPMorgan Chase & Co., | | | | | | | | | | |
| Sr. Unscd. Notes | | 4.72 | | 1/17/11 | | 100,000 | | a | | 98,969 |
| JPMorgan Chase & Co., | | | | | | | | | | |
| Sr. Unscd. Notes | | 6.00 | | 1/15/18 | | 10,000 | | | | 8,986 |
| Lehman Brothers Holdings, | | | | | | | | | | |
| Jr. Sub. Notes | | 6.50 | | 7/19/17 | | 20,000 | | b | | 75 |
| MBNA, | | | | | | | | | | |
| Sr. Unscd. Notes | | 5.00 | | 6/15/15 | | 50,000 | | | | 38,661 |
| Merrill Lynch & Co., | | | | | | | | | | |
| Sr. Unscd. Notes, Ser. C | | 4.25 | | 2/8/10 | | 50,000 | | | | 46,739 |
| Merrill Lynch & Co., | | | | | | | | | | |
| Sr. Unscd. Notes | | 6.40 | | 8/28/17 | | 20,000 | | | | 16,926 |
| Morgan Stanley, | | | | | | | | | | |
| Sub. Notes | | 4.75 | | 4/1/14 | | 25,000 | | | | 17,801 |
| Morgan Stanley, | | | | | | | | | | |
| Sr. Unscd. Notes | | 6.75 | | 4/15/11 | | 50,000 | | | | 46,681 |
| Western Union, | | | | | | | | | | |
| Sr. Unscd. Bonds | | 5.40 | | 11/17/11 | | 30,000 | | | | 29,195 |
| | | | | | | | | | | 1,250,175 |
| Diversified Metals & Mining—.2% | | | | | | | | | | |
| Alcoa, | | | | | | | | | | |
| Sr. Unscd. Notes | | 7.38 | | 8/1/10 | | 25,000 | | | | 23,940 |
The Fund 13
| STATEMENT OF INVESTMENTS (continued) |
| | | Coupon | | Maturity | | Principal | | |
| Bonds and Notes (continued) | | Rate (%) | | Date | | Amount ($) | | Value ($) |
| |
| |
| |
| |
|
| Electric Utilities—1.8% | | | | | | | | |
| Con Edison NY, | | | | | | | | |
| Sr. Unscd. Notes, Ser. 05-C | | 5.38 | | 12/15/15 | | 35,000 | | 30,677 |
| Duke Energy, | | | | | | | | |
| Sr. Unscd. Notes | | 6.25 | | 1/15/12 | | 50,000 | | 49,719 |
| NSTAR, | | | | | | | | |
| Unscd. Notes | | 8.00 | | 2/15/10 | | 50,000 | | 51,065 |
| SCANA, | | | | | | | | |
| Sr. Unscd. Notes | | 6.88 | | 5/15/11 | | 50,000 | | 50,035 |
| Scottish Power, | | | | | | | | |
| Sr. Unscd. Notes | | 4.91 | | 3/15/10 | | 50,000 | | 49,149 |
| Southern California Edison, | | | | | | | | |
| First Mortgage Bonds, | | | | | | | | |
| Ser. 05-A | | 5.00 | | 1/15/16 | | 35,000 | | 31,260 |
| Union Electric, | | | | | | | | |
| Sr. Scd. Notes | | 6.40 | | 6/15/17 | | 5,000 | | 4,190 |
| Wisconsin Energy, | | | | | | | | |
| Sr. Unscd. Notes | | 5.50 | | 12/1/08 | | 50,000 | | 50,024 |
| | | | | | | | | 316,119 |
| Food & Beverages—.7% | | | | | | | | |
| Conagra Foods, | | | | | | | | |
| Sr. Unscd. Notes | | 7.88 | | 9/15/10 | | 15,000 | | 14,933 |
| General Mills, | | | | | | | | |
| Sr. Unscd. Notes | | 6.00 | | 2/15/12 | | 15,000 | | 14,725 |
| Kellogg, | | | | | | | | |
| Sr. Unscd. Notes, Ser. B | | 6.60 | | 4/1/11 | | 20,000 | | 20,167 |
| Kraft Foods, | | | | | | | | |
| Sr. Unscd. Notes | | 5.63 | | 8/11/10 | | 30,000 | | 29,673 |
| Pepsico, | | | | | | | | |
| Sr. Unscd. Notes | | 5.15 | | 5/15/12 | | 25,000 | | 24,550 |
| Safeway, | | | | | | | | |
| Sr. Unscd. Notes | | 6.50 | | 3/1/11 | | 20,000 | | 19,523 |
| | | | | | | | | 123,571 |
14
| | | Coupon | | Maturity | | Principal | | |
| Bonds and Notes (continued) | | Rate (%) | | Date | | Amount ($) | | Value ($) |
| |
| |
| |
| |
|
| Foreign/Governmental—.3% | | | | | | | | |
| Province of Manitoba Canada, | | | | | | | | |
| Sr. Unscd. Debs., Ser. FH | | 4.90 | | 12/6/16 | | 5,000 | | 5,121 |
| United Mexican States, | | | | | | | | |
| Sr. Unscd. Notes | | 6.63 | | 3/3/15 | | 50,000 | | 48,250 |
| | | | | | | | | 53,371 |
| Health Care—1.4% | | | | | | | | |
| Abbott Laboratories, | | | | | | | | |
| Sr. Unscd. Notes | | 5.60 | | 5/15/11 | | 50,000 | | 51,159 |
| Aetna, | | | | | | | | |
| Sr. Unscd. Notes | | 6.00 | | 6/15/16 | | 15,000 | | 12,567 |
| Astrazeneca, | | | | | | | | |
| Sr. Unscd. Notes | | 5.90 | | 9/15/17 | | 10,000 | | 9,246 |
| Eli Lilly & Co., | | | | | | | | |
| Sr. Unscd. Notes | | 6.00 | | 3/15/12 | | 30,000 | | 30,785 |
| Hospira, | | | | | | | | |
| Sr. Unscd. Notes | | 4.95 | | 6/15/09 | | 15,000 | | 14,882 |
| Merck & Co., | | | | | | | | |
| Sr. Unscd. Notes | | 4.38 | | 2/15/13 | | 100,000 | | 96,720 |
| UnitedHealth Group, | | | | | | | | |
| Sr. Unscd. Notes | | 5.25 | | 3/15/11 | | 20,000 | | 19,323 |
| | | | | | | | | 234,682 |
| Industrial—.1% | | | | | | | | |
| Waste Management, | | | | | | | | |
| Sr. Unscd. Notes | | 7.38 | | 8/1/10 | | 20,000 | | 19,109 |
| Media—.7% | | | | | | | | |
| Comcast Cable Communications, | | | | | | | | |
| Gtd. Notes | | 6.75 | | 1/30/11 | | 75,000 | | 73,710 |
| New York Times, | | | | | | | | |
| Sr. Unscd. Notes | | 4.50 | | 3/15/10 | | 15,000 | | 12,166 |
| Viacom, | | | | | | | | |
| Sr. Unscd. Notes | | 5.75 | | 4/30/11 | | 20,000 | | 17,902 |
The Fund 15
| STATEMENT OF INVESTMENTS (continued) |
| | | Coupon | | Maturity | | Principal | | |
| Bonds and Notes (continued) | | Rate (%) | | Date | | Amount ($) | | Value ($) |
| |
| |
| |
| |
|
| Media (continued) | | | | | | | | |
| Viacom, | | | | | | | | |
| Gtd. Notes | | 7.70 | | 7/30/10 | | 25,000 | | 23,401 |
| | | | | | | | | 127,179 |
| Oil & Gas—.8% | | | | | | | | |
| Anadarko Finance, | | | | | | | | |
| Gtd. Notes, Ser. B | | 6.75 | | 5/1/11 | | 25,000 | | 24,929 |
| KeySpan, | | | | | | | | |
| Sr. Unsub. Notes | | 7.63 | | 11/15/10 | | 50,000 | | 51,790 |
| Trans-Canada Pipelines, | | | | | | | | |
| Sr. Unscd. Notes | | 4.00 | | 6/15/13 | | 50,000 | | 42,078 |
| XTO Energy, | | | | | | | | |
| Sr. Unscd. Notes | | 5.90 | | 8/1/12 | | 20,000 | | 18,583 |
| | | | | | | | | 137,380 |
| Paper & Paper Related—.1% | | | | | | | | |
| International Paper, | | | | | | | | |
| Sr. Unscd. Notes | | 4.00 | | 4/1/10 | | 15,000 | | 14,026 |
| Property & Casualty Insurance—2.1% | | | | | | | | |
| Ace INA Holdings, | | | | | | | | |
| Gtd. Notes | | 5.88 | | 6/15/14 | | 15,000 | | 13,775 |
| Berkshire Hathaway, | | | | | | | | |
| Gtd. Notes | | 4.13 | | 1/15/10 | | 40,000 | | 40,120 |
| Hartford Life Global Funding | | | | | | | | |
| Trusts, Sr. Scd. Notes | | 5.20 | | 2/15/11 | | 150,000 | | 136,706 |
| MetLife, | | | | | | | | |
| Sr. Unscd. Notes | | 5.00 | | 6/15/15 | | 20,000 | | 16,680 |
| Principal Life Income Funding | | | | | | | | |
| Trusts, Sr. Scd. Notes | | 5.13 | | 3/1/11 | | 150,000 | | 150,530 |
| | | | | | | | | 357,811 |
| Retail—.7% | | | | | | | | |
| CVS Caremark, | | | | | | | | |
| Sr. Unscd. Notes | | 5.75 | | 8/15/11 | | 20,000 | | 18,880 |
| Wal-Mart Stores, | | | | | | | | |
| Sr. Unscd. Notes | | 6.88 | | 8/10/09 | | 100,000 | | 103,118 |
| | | | | | | | | 121,998 |
| Technology—.1% | | | | | | | | |
| NCR, | | | | | | | | |
| Sr. Unscd. Notes | | 7.13 | | 6/15/09 | | 15,000 | | 14,997 |
16
| | | Coupon | | Maturity | | Principal | | |
| Bonds and Notes (continued) | | Rate (%) | | Date | | Amount ($) | | Value ($) |
| |
| |
| |
| |
|
| Telecommunications—1.9% | | | | | | | | |
| AT & T Wireless, | | | | | | | | |
| Sr. Unscd. Notes | | 8.13 | | 5/1/12 | | 25,000 | | 24,800 |
| BellSouth, | | | | | | | | |
| Sr. Unscd. Notes | | 6.00 | | 10/15/11 | | 100,000 | | 97,393 |
| British Telecommunications, | | | | | | | | |
| Sr. Unscd. Notes | | 8.63 | | 12/15/10 | | 25,000 a | | 24,712 |
| CenturyTel, | | | | | | | | |
| Sr. Unscd. Notes, Ser. H | | 8.38 | | 10/15/10 | | 25,000 | | 23,010 |
| Cox Communications, | | | | | | | | |
| Sr. Unscd. Notes | | 4.63 | | 1/15/10 | | 25,000 | | 23,971 |
| Motorola, | | | | | | | | |
| Sr. Unscd. Notes | | 7.63 | | 11/15/10 | | 50,000 | | 43,757 |
| Telefonica, | | | | | | | | |
| Gtd. Notes | | 7.75 | | 9/15/10 | | 50,000 | | 48,425 |
| Verizon New York, | | | | | | | | |
| Sr. Unscd. Notes, Ser. A | | 6.88 | | 4/1/12 | | 50,000 | | 47,294 |
| | | | | | | | | 333,362 |
| Transportation—.3% | | | | | | | | |
| Burlington North Santa Fe, | | | | | | | | |
| Sr. Unscd. Notes | | 7.13 | | 12/15/10 | | 20,000 | | 20,336 |
| CSX, | | | | | | | | |
| Sr. Unscd. Notes | | 6.75 | | 3/15/11 | | 20,000 | | 19,314 |
| Union Pacific, | | | | | | | | |
| Sr. Unscd. Bonds | | 5.45 | | 1/31/13 | | 20,000 | | 18,466 |
| | | | | | | | | 58,116 |
| U.S. Government Agencies/ | | | | | | | | |
| Mortgage-Backed—46.1% | | | | | | | | |
| Federal Home Loan Mortgage Corp.: | | | | | | | | |
| 3.88%, 6/29/11 | | | | | | 450,000 c | | 458,311 |
| 4.50%, 12/1/19 | | | | | | 694,817 c | | 663,812 |
| 5.00%, 11/1/33—7/1/35 | | | | | | 419,654 c | | 397,673 |
| 5.50%, 12/1/18—10/1/21 | | | | | | 537,677 c | | 537,183 |
| 5.65%, 2/1/37 | | | | | | 43,082 a,c | | 42,863 |
| 5.73%, 2/1/37 | | | | | | 78,796 a,c | | 79,676 |
| 5.93%, 1/1/37 | | | | | | 73,708 a,c | | 74,620 |
| 6.00%, 10/1/19—9/1/34 | | | | | | 189,003 c | | 189,888 |
| 6.50%, 8/1/12 | | | | | | 63,097 c | | 65,391 |
| 7.00%, 1/1/36 | | | | | | 151,690 c | | 155,255 |
The Fund 17
| STATEMENT OF INVESTMENTS (continued) |
| | | Principal | | |
| Bonds and Notes (continued) | | Amount ($) | | Value ($) |
| |
| |
|
| U.S. Government Agencies/ | | | | |
| Mortgage-Backed (continued) | | | | |
| Federal National Mortgage Association: | | | | |
| 4.38%, 9/13/10 | | 450,000 c | | 460,555 |
| 5.50% | | 100,000 c,d | | 97,547 |
| 5.75%, 4/1/37 | | 80,310 a,c | | 81,279 |
| 6.00% | | 200,000 c,d | | 199,594 |
| 4.00%, 3/1/21 | | 85,199 c | | 78,983 |
| 4.48%, 12/1/34 | | 183,731 a,c | | 184,532 |
| 5.00%, 7/1/19—10/1/33 | | 188,739 c | | 189,942 |
| 5.50%, 7/1/17—1/1/37 | | 1,421,303 c | | 1,396,374 |
| 6.00%, 11/1/16—11/1/37 | | 737,726 c | | 740,969 |
| 6.50%, 7/1/33—8/1/38 | | 765,508 c | | 777,942 |
| 7.00%, 4/1/32 | | 74,031 c | | 76,689 |
| Government National Mortgage Association I: | | | | |
| 5.50% | | 200,000 d | | 195,719 |
| 6.00% | | 400,000 d | | 400,062 |
| 6.50% | | 450,000 d | | 454,851 |
| | | | | 7,999,710 |
| U.S. Government Securities—4.8% | | | | |
| U.S. Treasury Bonds: | | | | |
| 4.75%, 2/15/37 | | 400,000 | | 424,219 |
| 6.25%, 5/15/30 | | 295,000 | | 356,674 |
| U.S. Treasury Notes | | | | |
| 4.88%, 7/31/11 | | 40,000 | | 43,397 |
| | | | | 824,290 |
| Total Bonds and Notes | | | | |
| (cost $14,920,541) | | | | 14,432,572 |
| |
| |
|
| |
| |
| Short-Term Investments—.8% | | | | |
| |
| |
|
| U.S. Treasury Bills; | | | | |
| 0.58%, 11/28/08 | | | | |
| (cost $134,941) | | 135,000 | | 134,990 |
18
| Other Investment—19.5% | | Shares | | Value ($) |
| |
| |
|
| Registered Investment Company; | | | | |
| Dreyfus Institutional Preferred | | | | |
| Plus Money Market Fund | | | | |
| (cost $3,390,000) | | 3,390,000 e | | 3,390,000 |
| |
| |
|
| |
| Total Investments (cost $18,445,482) | | 103.5% | | 17,957,562 |
| Liabilities, Less Cash and Receivables | | (3.5%) | | (603,899) |
| Net Assets | | 100.0% | | 17,353,663 |
| a Variable rate security—interest rate subject to periodic change. |
| b Issuer filed for bankruptcy. |
| c On September 7, 2008, the Federal Housing Finance Agency (FHFA) placed Federal National Mortgage Association |
| and Federal Home Loan Mortgage Corporation into conservatorship with FHFA as the conservator.As such, the |
| FHFA will oversee the continuing affairs of these companies. |
| d Purchased on a forward commitment basis. |
| e Investment in affiliated money market mutual fund. |
| Portfolio Summary (Unaudited)† | | | | |
| |
| | | Value (%) | | | | Value (%) |
| |
| |
| |
|
| U.S. Government & Agencies | | 50.9 | | Asset/Mortgage-Backed | | 9.0 |
| Corporate Bonds | | 23.0 | | Foreign/Governmental | | .3 |
| Short-Term/ | | | | | | |
| Money Market Investments | | 20.3 | | | | 103.5 |
| † Based on net assets. |
| See notes to financial statements. |
The Fund 19
STATEMENT OF FINANCIAL FUTURES
October 31, 2008 |
| | | | | | | | | Unrealized |
| | | | | Market Value | | | | Appreciation |
| | | | | Covered by | | | | (Depreciation) |
| | | Contracts | | Contracts ($) | | Expiration | | at 10/31/2008 ($) |
| |
| |
| |
| |
|
| Financial Futures Long | | | | | | | | |
| Euro Dollar | | 2 | | 488,900 | | March 2009 | | 1,818 |
| Euro Dollar | | 2 | | 485,300 | | March 2010 | | 731 |
| Euro Dollar | | 1 | | 239,625 | | March 2011 | | (704) |
| Euro Dollar | | 2 | | 487,900 | | June 2009 | | (757) |
| Euro Dollar | | 2 | | 484,150 | | June 2010 | | (1,170) |
| Euro Dollar | | 1 | | 239,013 | | June 2011 | | (929) |
| Euro Dollar | | 2 | | 486,925 | | September 2009 | | 856 |
| Euro Dollar | | 2 | | 482,625 | | September 2010 | | 250 |
| Euro Dollar | | 1 | | 238,575 | | September 2011 | | (1,129) |
| Euro Dollar | | 1 | | 244,387 | | December 2008 | | 522 |
| Euro Dollar | | 2 | | 485,800 | | December 2009 | | (1,557) |
| Euro Dollar | | 1 | | 240,288 | | December 2010 | | (479) |
| U.S. Treasury 5 year Notes | | 9 | | 1,019,320 | | December 2008 | | (2,421) |
| U.S. Treasury 10 year Notes | | 41 | | 4,636,204 | | December 2008 | | (11,981) |
| U.S. Long Bond | | 6 | | 678,750 | | December 2008 | | (20,673) |
| Financial Futures Short | | | | | | | | |
| U.S. Treasury 2 year Notes | | 13 | | (2,792,766) | | December 2008 | | (2,914) |
| 10 Year Euro-Bond | | 3 | | (441,016) | | December 2008 | | (2,364) |
| Australian 10 Year Bonds | | 3 | | (210,468) | | December 2008 | | 1,514 |
| British Long Gilt | | 1 | | (179,816) | | December 2008 | | 381 |
| Japanese 10 Year Bond | | 7 | | (980,285) | | December 2008 | | (6,539) |
| | | | | | | | | (47,545) |
| |
| See notes to financial statements. | | | | | | | | |
20
STATEMENT OF OPTIONS WRITTEN
October 31, 2008 |
| | | Face Amount | | |
| | | Covered by | | |
| | | Contracts ($) | | Value ($) |
| |
| |
|
| Call Options | | | | |
| U.S. Treasury 10 Year Notes | | | | |
| November 2008 @ 115 | | 10,000 a | | (5,156) |
| Put Options | | | | |
| U.S. Treasury 10 Year Notes | | | | |
| November 2008 @ 114 | | 10,000 a | | (17,188) |
| (Premiums received $29,815) | | | | (22,344) |
| | a Non-income producing security.
See notes to financial statements. |
The Fund 21
| | STATEMENT OF ASSETS AND LIABILITIES
October 31, 2008 |
| | | Cost | | Value |
| |
| |
|
| Assets ($): | | | | |
| Investments in securities—See Statement of Investments: | | | | |
| Unaffiliated issuers | | 15,055,482 | | 14,567,562 |
| Affiliated issuers | | 3,390,000 | | 3,390,000 |
| Cash | | | | 196,140 |
| Cash on Initial Margin—Note 4 | | | | 126,394 |
| Receivable for investment securities sold | | | | 1,335,458 |
| Receivable for open mortgage-backed dollar rolls—Note 4 | | | | 297,686 |
| Dividends and interest receivable | | | | 130,333 |
| Receivable for shares of Common Stock subscribed | | | | 36,546 |
| Unrealized appreciation on forward currency exchange contracts—Note 4 | | 35,007 |
| Prepaid expenses | | | | 14,233 |
| | | | | 20,129,359 |
| |
| |
|
| Liabilities ($): | | | | |
| Due to The Dreyfus Corporation and affiliates—Note 3(c) | | | | 1,693 |
| Payable for open mortage-backed dollar rolls—Note 4 | | | | 1,650,798 |
| Payable for investment securities purchased | | | | 942,818 |
| Unrealized depreciation on forward currency exchange contracts—Note 4 | | 85,838 |
| Outstanding options written, at value (premiums received | | | | |
| $29,815)—See Statement of Options Written—Note 4 | | | | 22,344 |
| Payable for futures variation margin—Note 4 | | | | 20,876 |
| Payable for shares of Common Stock redeemed | | | | 1,515 |
| Accrued expenses | | | | 49,814 |
| | | | | 2,775,696 |
| |
| |
|
| Net Assets ($) | | | | 17,353,663 |
| |
| |
|
| Composition of Net Assets ($): | | | | |
| Paid-in capital | | | | 17,921,539 |
| Accumulated undistributed investment income—net | | | | 147,078 |
| Accumulated net realized gain (loss) on investments | | | | (136,106) |
| Accumulated net unrealized appreciation (depreciation) on investments, | | |
| foreign currency transactions and options transactions [including | | | | |
| ($47,545) net unrealized (depreciation) on financial futures] | | | | (578,848) |
| |
| |
|
| Net Assets ($) | | | | 17,353,663 |
| Net Asset Value Per Share | | | | | | |
| | | Class A | | Class C | | Class I |
| |
| |
| |
|
| Net Assets ($) | | 14,026,068 | | 2,725,976 | | 601,619 |
| Shares Outstanding | | 1,157,356 | | 225,572 | | 49,611 |
| |
| |
| |
|
| Net Asset Value Per Share ($) | | 12.12 | | 12.08 | | 12.13 |
See notes to financial statements.
22
STATEMENT OF OPERATIONS
Year Ended October 31, 2008 |
| Investment Income ($): | | |
| Income: | | |
| Interest | | 665,174 |
| Dividends; | | |
| Affiliated issuers | | 20,072 |
| Total Income | | 685,246 |
| Expenses: | | |
| Management fee—Note 3(a) | | 74,573 |
| Auditing fees | | 42,113 |
| Shareholder servicing costs—Note 3(c) | | 35,133 |
| Registration fees | | 33,835 |
| Custodian fees—Note 3(c) | | 25,554 |
| Distribution fees—Note 3(b) | | 10,685 |
| Prospectus and shareholders’ reports | | 7,919 |
| Directors’ fees and expenses—Note 3(d) | | 1,035 |
| Legal fees | | 477 |
| Loan commitment fees—Note 2 | | 80 |
| Miscellaneous | | 36,200 |
| Total Expenses | | 267,604 |
| Less—expense reimbursement from The Dreyfus | | |
| Corporation due to undertaking—Note 3(a) | | (136,260) |
| Less—reduction in fees due to earnings credits—Note 1(c) | | (691) |
| Net Expenses | | 130,653 |
| Investment Income—Net | | 554,593 |
| |
|
| Realized and Unrealized Gain (Loss) on Investments—Note 4 ($): | | |
| Net realized gain (loss) on investments and foreign currency transactions | | (35,530) |
| Net realized gain (loss) on options transactions | | 20,248 |
| Net realized gain (loss) on financial futures | | 189,612 |
| Net realized gain (loss) on forward currency exchange contracts | | (254,843) |
| Net Realized Gain (Loss) | | (80,513) |
| Net unrealized appreciation (depreciation) on investments, foreign | | |
| currency transactions and options transactions [including | | |
| ($55,167) net unrealized (depreciation) on financial futures] | | (597,632) |
| Net Realized and Unrealized Gain (Loss) on Investments | | (678,145) |
| Net (Decrease) in Net Assets Resulting from Operations | | (123,552) |
| |
| See notes to financial statements. | | |
The Fund 23
STATEMENT OF CHANGES IN NET ASSETS
| | | Year Ended October 31, |
| | |
|
| | | 2008 | | 2007a |
| |
| |
|
| Operations ($): | | | | |
| Investment income—net | | 554,593 | | 523,428 |
| Net realized gain (loss) on investments | | (80,513) | | (41,666) |
| Net unrealized appreciation | | | | |
| (depreciation) on investments | | (597,632) | | (74,456) |
| Net Increase (Decrease) in Net Assets | | | | |
| Resulting from Operations | | (123,552) | | 407,306 |
| |
| |
|
| Dividends to Shareholders from ($): | | | | |
| Investment income—net: | | | | |
| Class A Shares | | (469,586) | | (419,622) |
| Class C Shares | | (44,118) | | (38,774) |
| Class I Shares | | (27,499) | | (25,611) |
| Net realized gain on investments: | | | | |
| Class A Shares | | — | | (68,019) |
| Class C Shares | | — | | (7,649) |
| Class I Shares | | — | | (3,907) |
| Total Dividends | | (541,203) | | (563,582) |
| |
| |
|
| Capital Stock Transactions ($): | | | | |
| Net proceeds from shares sold: | | | | |
| Class A Shares | | 4,351,598 | | 655,488 |
| Class C Shares | | 2,103,219 | | 316,237 |
| Dividends reinvested: | | | | |
| Class A Shares | | 463,316 | | 484,809 |
| Class C Shares | | 24,140 | | 22,864 |
| Class I Shares | | 27,499 | | 29,517 |
| Cost of shares redeemed: | | | | |
| Class A Shares | | (753,563) | | (500,598) |
| Class C Shares | | (352,499) | | (265,428) |
| Increase (Decrease) in Net Assets | | | | |
| from Capital Stock Transactions | | 5,863,710 | | 742,889 |
| Total Increase (Decrease) in Net Assets | | 5,198,955 | | 586,613 |
| |
| |
|
| Net Assets ($): | | | | |
| Beginning of Period | | 12,154,708 | | 11,568,095 |
| End of Period | | 17,353,663 | | 12,154,708 |
| Undistributed investment income—net | | 147,078 | | 132,397 |
24
| | | Year Ended October 31, |
| | |
|
| | | 2008 | | 2007a |
| |
| |
|
| Capital Share Transactions: | | | | |
| Class A | | | | |
| Shares sold | | 347,091 | | 52,259 |
| Shares issued for dividends reinvested | | 36,791 | | 38,679 |
| Shares redeemed | | (59,754) | | (39,916) |
| Net Increase (Decrease) in Shares Outstanding | | 324,128 | | 51,022 |
| |
| |
|
| Class C | | | | |
| Shares sold | | 168,780 | | 25,205 |
| Shares issued for dividends reinvested | | 1,917 | | 1,825 |
| Shares redeemed | | (28,074) | | (21,237) |
| Net Increase (Decrease) in Shares Outstanding | | 142,623 | | 5,793 |
| |
| |
|
| Class I | | | | |
| Shares issued for dividends reinvested | | 2,183 | | 2,355 |
| a Effective June 1, 2007, Class R shares were redesignated as Class I shares. |
| See notes to financial statements. |
FINANCIAL HIGHLIGHTS
The following tables describe the performance for each share class for the fiscal periods indicated. All information (except portfolio turnover rate) reflects financial results for a single fund share.Total return shows how much your investment in the fund would have increased (or decreased) during each period, assuming you had reinvested all dividends and distributions.These figures have been derived from the fund’s financial statements.
| | | | | Year Ended October 31, |
| | |
| |
|
| Class A Shares | | 2008 | | 2007 | | 2006a |
| |
| |
| |
|
| Per Share Data ($): | | | | | | |
| Net asset value, beginning of period | | 12.62 | | 12.79 | | 12.50 |
| Investment Operations: | | | | | | |
| Investment income—netb | | .52 | | .56 | | .32 |
| Net realized and unrealized | | | | | | |
| gain (loss) on investments | | (.48) | | (.11) | | .16 |
| Total from Investment Operations | | .04 | | .45 | | .48 |
| Distributions: | | | | | | |
| Dividends from investment income—net | | (.54) | | (.53) | | (.19) |
| Dividends from net realized gain on investments | | — | | (.09) | | — |
| Total Distributions | | (.54) | | (.62) | | (.19) |
| Net asset value, end of period | | 12.12 | | 12.62 | | 12.79 |
| |
| |
| |
|
| Total Return (%)c | | .21 | | 3.57 | | 3.86d |
| |
| |
| |
|
| Ratios/Supplemental Data (%): | | | | | | |
| Ratio of total expenses to average net assets | | 1.90 | | 2.01 | | 3.32e |
| Ratio of net expenses to average net assets | | .90 | | .89 | | .88e |
| Ratio of net investment income | | | | | | |
| to average net assets | | 4.16 | | 4.45 | | 3.99e |
| Portfolio Turnover Ratef | | 120.92 | | 75.04 | | 104.30d |
| |
| |
| |
|
| Net Assets, end of period ($ x 1,000) | | 14,026 | | 10,512 | | 10,006 |
| a | From March 15, 2006 (commencement of operations) to October 31, 2006. |
| |
| b | Based on average shares outstanding at each month end. |
| |
| c | Exclusive of sales charge. |
| |
| d | Not annualized. |
| |
| e | Annualized. |
| |
| f | The portfolio turnover rates excluding mortgage dollar roll transactions for the periods ended October 31, 2008, October 31, 2007 and October 31, 2006, were 87.59%, 51.54% and 101.24%, respectively. |
| |
| See notes to financial statements. |
26
| | | | | Year Ended October 31, |
| | |
| |
|
| Class C Shares | | 2008 | | 2007 | | 2006a |
| |
| |
| |
|
| Per Share Data ($): | | | | | | |
| Net asset value, beginning of period | | 12.58 | | 12.77 | | 12.50 |
| Investment Operations: | | | | | | |
| Investment income—netb | | .41 | | .47 | | .25 |
| Net realized and unrealized | | | | | | |
| gain (loss) on investments | | (.47) | | (.13) | | .17 |
| Total from Investment Operations | | (.06) | | .34 | | .42 |
| Distributions: | | | | | | |
| Dividends from investment income—net | | (.44) | | (.44) | | (.15) |
| Dividends from net realized gain on investments | | — | | (.09) | | — |
| Total Distributions | | (.44) | | (.53) | | (.15) |
| Net asset value, end of period | | 12.08 | | 12.58 | | 12.77 |
| |
| |
| |
|
| Total Return (%)c | | (.55) | | 2.73 | | 3.41d |
| |
| |
| |
|
| Ratios/Supplemental Data (%): | | | | | | |
| Ratio of total expenses to average net assets | | 2.75 | | 2.79 | | 4.12e |
| Ratio of net expenses to average net assets | | 1.65 | | 1.64 | | 1.61e |
| Ratio of net investment income | | | | | | |
| to average net assets | | 3.40 | | 3.71 | | 3.28e |
| Portfolio Turnover Ratef | | 120.92 | | 75.04 | | 104.30d |
| |
| |
| |
|
| Net Assets, end of period ($ x 1,000) | | 2,726 | | 1,044 | | 985 |
| a | From March 15, 2006 (commencement of operations) to October 31, 2006. |
| |
| b | Based on average shares outstanding at each month end. |
| |
| c | Exclusive of sales charge. |
| |
| d | Not annualized. |
| |
| e | Annualized. |
| |
| f | The portfolio turnover rates excluding mortgage dollar roll transactions for the periods ended October 31, 2008, October 31, 2007 and October 31, 2006, were 87.59%, 51.54% and 101.24%, respectively. |
| |
| See notes to financial statements. |
The Fund 27
| FINANCIAL HIGHLIGHTS (continued) |
| | | | | Year Ended October 31, |
| | |
| |
|
| Class I Shares | | 2008 | | 2007a | | 2006b |
| |
| |
| |
|
| Per Share Data ($): | | | | | | |
| Net asset value, beginning of period | | 12.62 | | 12.80 | | 12.50 |
| Investment Operations: | | | | | | |
| Investment income—netc | | .56 | | .59 | | .33 |
| Net realized and unrealized | | | | | | |
| gain (loss) on investments | | (.48) | | (.12) | | .17 |
| Total from Investment Operations | | .08 | | .47 | | .50 |
| Distributions: | | | | | | |
| Dividends from investment income—net | | (.57) | | (.56) | | (.20) |
| Dividends from net realized gain on investments | | — | | (.09) | | — |
| Total Distributions | | (.57) | | (.65) | | (.20) |
| Net asset value, end of period | | 12.13 | | 12.62 | | 12.80 |
| |
| |
| |
|
| Total Return (%) | | .54 | | 3.75 | | 4.04d |
| |
| |
| |
|
| Ratios/Supplemental Data (%): | | | | | | |
| Ratio of total expenses to average net assets | | 1.64 | | 1.78 | | 3.08e |
| Ratio of net expenses to average net assets | | .65 | | .64 | | .63e |
| Ratio of net investment income | | | | | | |
| to average net assets | | 4.41 | | 4.70 | | 4.25e |
| Portfolio Turnover Ratef | | 120.92 | | 75.04 | | 104.30d |
| |
| |
| |
|
| Net Assets, end of period ($ x 1,000) | | 602 | | 599 | | 577 |
| a | Effective June 1, 2007, Class R shares were redesignated as Class I shares. |
| |
| b | From March 15, 2006 (commencement of operations) to October 31, 2006. |
| |
| c | Based on average shares outstanding at each month end. |
| |
| d | Not annualized. |
| |
| e | Annualized. |
| |
| f | The portfolio turnover rates excluding mortgage dollar roll transactions for the periods ended October 31, 2008, October 31, 2007 and October 31, 2006, were 87.59%, 51.54% and 101.24%, respectively. |
| |
| See notes to financial statements. |
28
NOTES TO FINANCIAL STATEMENTS
NOTE 1—Significant Accounting Policies:
Dreyfus Total Return Advantage Fund (the “fund”) is a separate diversified series of Advantage Funds, Inc. (the “Company”), which is registered under the Investment Company Act of 1940, as amended (the “Act”), as an open-end management investment company and operates as a series company currently offering twelve series, including the fund. The fund’s investment objective seeks to maximize total return through capital appreciation and income. The Dreyfus Corporation (the “Manager” or “Dreyfus”), a wholly-owned subsidiary of The Bank of New York Mellon Corporation (“BNY Mellon”), serves as the fund’s investment adviser.
At a meeting of the fund’s Board of Directors held on July 15, 2008, the Board approved, effective December 1, 2008, a proposal to change the name of the fund from “Dreyfus Premier Total Return Advantage Fund” to “Dreyfus Total Return Advantage Fund.”
Effective July 1, 2008, BNY Mellon has reorganized and consolidated a number of its banking and trust company subsidiaries. As a result of the reorganization, any services previously provided to the fund by Mellon Bank, N.A. or Mellon Trust of New England, N.A. are now provided by The Bank of New York, which has changed its name to The Bank of New York Mellon.
MBSC Securities Corporation (“the Distributor”), a wholly-owned subsidiary of the Manager, is the distributor of the fund’s shares. The fund is authorized to issue 300 million shares of $.001 par value Common Stock. The fund currently offers three classes of shares: Class A (100 million shares authorized), Class C (100 million shares authorized) and Class I (100 million shares authorized). Class A shares are subject to a sales charge imposed at the time of purchase. Class C shares are subject to a contingent deferred sales charge (“CDSC”) imposed on Class C shares redeemed within one year of purchase. Class I shares are sold at net asset value per share only to institutional investors. Other differences between the classes include the services offered to and the expenses borne by each class, the allocation of cer-
The Fund 29
| NOTES TO FINANCIAL STATEMENTS (continued) |
tain transfer agency costs and certain voting rights. Income, expenses (other than expenses attributable to a specific class), and realized and unrealized gains or losses on investments are allocated to each class of shares based on its relative net assets.
As of October 31, 2008, MBC Investments Corp., an indirect subsidiary of BNY Mellon, held 800,426 Class A, 43,728 Class C and 44,734 Class I shares of the fund.
The Company accounts separately for the assets, liabilities and operations of each series. Expenses directly attributable to each series are charged to that series’ operations; expenses which are applicable to all series are allocated among them on a pro rata basis.
The fund’s financial statements are prepared in accordance with U.S. generally accepted accounting principles, which may require the use of management estimates and assumptions. Actual results could differ from those estimates.
The fund enters into contracts that contain a variety of indemnifications. The fund’s maximum exposure under these arrangements is unknown.The fund does not anticipate recognizing any loss related to these arrangements.
(a) Portfolio valuation: Investments in securities excluding short-term investments (other than U.S. Treasury Bills), financial futures, options and forward currency exchange contracts are valued each business day by an independent pricing service (the “Service”) approved by the Board of Directors. Investments for which quoted bid prices are readily available and are representative of the bid side of the market in the judgment of the Service are valued at the mean between the quoted bid prices (as obtained by the Service from dealers in such securities) and asked prices (as calculated by the Service based upon its evaluation of the market for such securities). Other investments (which constitute a majority of the portfolio securities) are valued as determined by the Service, based on methods which include consideration of: yields or prices of securities of comparable quality, coupon,
30
maturity and type; indications as to values from dealers; and general market conditions. Restricted securities, as well as securities or other assets for which recent market quotations are not readily available, that are not valued by a pricing service approved by the Board of Directors, or are determined by the fund not to reflect accurately fair value, are valued at fair value as determined in good faith under the direction of the Board of Directors.The factors that may be considered when fair valuing a security include fundamental analytical data, the nature and duration of restrictions on disposition, an evaluation of the forces that influence the market in which the securities are purchased and sold and public trading in similar securities of the issuer or comparable issuers. Short-term investments, excluding U.S.Treasury Bills, are carried at amortized cost, which approximates value. Registered investment companies that are not traded on an exchange are valued at their net asset value. Financial futures and options, which are traded on an exchange, are valued at the last sales price on the securities exchange on which such securities are primarily traded or at the last sales price on the national securities market on each business day. Options traded over the counter are priced at the mean between the bid and asked price. Investments denominated in foreign currencies are translated to U.S. dollars at the prevailing rates of exchange. Forward currency exchange contracts are valued at the forward rate.
The Financial Accounting Standards Board (“FASB”) released Statement of Financial Accounting Standards No. 157 “Fair Value Measurements” (“FAS 157”). FAS 157 establishes an authoritative definition of fair value, sets out a framework for measuring fair value, and requires additional disclosures about fair-value measurements. The application of FAS 157 is required for fiscal years beginning after November 15, 2007 and interim periods within those fiscal years. Management does not believe that the application of this standard will have a material impact on the financial statements of the fund.
The Fund 31
| NOTES TO FINANCIAL STATEMENTS (continued) |
(b) Foreign currency transactions: The fund does not isolate that portion of the results of operations resulting from changes in foreign exchange rates on investments from the fluctuations arising from changes in the market prices of securities held. Such fluctuations are included with the net realized and unrealized gain or loss on investments.
Net realized foreign exchange gains or losses arise from sales and maturities of short-term securities, sales of foreign currencies, currency gains or losses realized on securities transactions and the difference between the amounts of dividends, interest and foreign withholding taxes recorded on the fund’s books and the U.S. dollar equivalent of the amounts actually received or paid. Net unrealized foreign exchange gains and losses arise from changes in the value of assets and liabilities other than investments in securities, resulting from changes in exchange rates. Such gains and losses are included with net realized and unrealized gain or loss on investments.
(c) Securities transactions and investment income: Securities transactions are recorded on a trade date basis. Realized gains and losses from securities transactions are recorded on the identified cost basis. Dividend income is recognized on the ex-dividend date and interest income, including, where applicable, accretion of discount and amortization of premium on investments is recognized on the accrual basis.
The fund has arrangements with the custodian and cash management banks whereby the fund may receive earnings credits when positive cash balances are maintained, which are used to offset custody and cash management fees. For financial reporting purposes, the fund includes net earnings credits as an expense offset in the Statement of Operations.
(d) Affiliated issuers: Investments in other investment companies advised by the Manager are defined as “affiliated” in the Act.
(e) Dividends to shareholders: It is the policy of the fund to declare and pay dividends from investment income-net, quarterly. Dividends from net realized capital gains, if any, are normally declared and paid annually, but the fund may make distributions on a more frequent basis
32
to comply with the distribution requirements of the Internal Revenue Code of 1986, as amended (the “Code”).To the extent that net realized capital gains can be offset by capital loss carryovers, it is the policy of the fund not to distribute such gains. Income and capital gain distributions are determined in accordance with income tax regulations, which may differ from U.S. generally accepted accounting principles.
On October 31, 2008, the Board of Directors declared a cash dividend of $.110, $.096 and $.117 per share from undistributed investment income-net for Class A, Class C and Class I shares, respectively, payable on November 3, 2008 (ex-dividend date), to shareholders of record as of the close of business on October 31, 2008.
(f) Federal income taxes: It is the policy of the fund to continue to qualify as a regulated investment company, if such qualification is in the best interests of its shareholders, by complying with the applicable provisions of the Code, and to make distributions of taxable income sufficient to relieve it from substantially all federal income and excise taxes.
The fund adopted FASB Interpretation No. 48 “Accounting for Uncertainty in Income Taxes” (“FIN 48”). FIN 48 provides guidance for how uncertain tax positions should be recognized, measured, presented and disclosed in the financial statements. FIN 48 requires the evaluation of tax positions taken or expected to be taken in the course of preparing the fund’s tax returns to determine whether the tax positions are “more-likely-than not” of being sustained by the applicable tax authority. Liability for tax positions not deemed to meet the more likely-than-not threshold would be recorded as a tax expense in the current year.The adoption of FIN 48 had no impact on the operations of the fund for the period ended October 31, 2008.
As of and during the period ended October 31, 2008, the fund did not have any liabilities for any unrecognized tax positions.The fund recognizes interest and penalties, if any, related to unrecognized tax positions as income tax expense in the Statement of Operations. During the period, the fund did not incur any interest or penalties.
The Fund 33
| NOTES TO FINANCIAL STATEMENTS (continued) |
Each of the tax years in the three-year period ended October 31, 2008 remains subject to examination by the Internal Revenue Service and state taxing authorities.
At October 31, 2008, the components of accumulated earnings on a tax basis were as follows: undistributed ordinary income $147,078, accumulated capital losses $154,047 and unrealized depreciation $560,907.
The accumulated capital loss carryover is available for federal income tax purposes to be applied against future net securities profits, if any, realized subsequent to October 31, 2008. If not applied, $59,164 of the carryover expires in fiscal 2015 and $94,883 expires in fiscal 2016.
The tax character of distributions paid to shareholders during the fiscal periods ended October 31, 2008 and October 31, 2007 were as follows: ordinary income $541,203 and $507,935 and long-term capital gains $0 and $55,647, respectively.
During the period ended October 31, 2008, as a result of permanent book to tax differences, primarily due to the tax treatment for amortization of premiums, paydown gains and losses on mortgage-backed securities and foreign currency gains and losses, the fund increased accumulated undistributed investment income-net by $1,291, decreased accumulated net realized gain (loss) on investments by $2,541 and increased paid-in capital by $1,250. Net assets and net asset value per share were not affected by this reclassification.
NOTE 2—Bank Lines of Credit:
Prior to October 15, 2008, the fund participated with other Dreyfus-managed funds in a $350 million redemption credit facility. Effective October 15, 2008, the fund participates with other Dreyfus-managed funds in a $145 million redemption credit facility (the “Facility”) to be utilized for temporary or emergency purposes, including the financing of redemptions. In connection therewith, the fund has agreed to pay commitment fees on its pro rata portion of the Facility. Interest is charged to the fund based on prevailing market rates in effect at the time of borrowing. During the period ended October 31, 2008, the fund did not borrow under either Facility.
34
NOTE 3—Management Fee and Other Transactions With Affiliates:
(a) Pursuant to a Management Agreement (“Agreement”) with the Manager, the management fee is computed at the annual rate of .55% of the value of the fund’s average daily net assets and is payable monthly. The Manager has undertaken from November 1, 2007 through March 1, 2010, that, if the fund’s aggregate expenses, exclusive of taxes, brokerage fees, Rule 12b-1 distribution plan fees, interest expense, commitment fees, shareholder services plan fees and extraordinary expenses, exceed an annual rate of .65% of the value of the fund’s average daily net assets, the fund may deduct from the payment to be made to the Manager under the Agreement, or the Manager will bear, such excess expense. The expense reimbursement, pursuant to the undertaking, amounted to $136,260 during the period ended October 31, 2008.
During the period ended October 31, 2008, the Distributor retained $61 from commissions earned on sales of the fund’s Class A shares.
(b) Under the Distribution Plan (the “Plan”) adopted pursuant to Rule 12b-1 under the Act, Class C shares pay the Distributor for distributing its shares at an annual rate of .75% of the value of the average daily net assets of Class C shares. During the period ended October 31, 2008, Class C shares were charged $10,685 pursuant to the Plan.
(c) Under the Shareholder Services Plan, Class A and Class C shares pay the Distributor at an annual rate of .25% of the value of their average daily net assets for the provision of certain services.The services provided may include personal services relating to shareholder accounts, such as answering shareholder inquiries regarding the fund and providing reports and other information, and services related to the maintenance of shareholder accounts.The Distributor may make payments to Service Agents (a securities dealer, financial institution or other industry professional) in respect of these services.The Distributor determines the amounts to be paid to Service Agents. During the period ended October 31, 2008, Class A and Class C shares were charged $28,791 and $3,562, respectively, pursuant to the Shareholder Services Plan.
The Fund 35
| NOTES TO FINANCIAL STATEMENTS (continued) |
The fund compensates DreyfusTransfer, Inc., a wholly-owned subsidiary of the Manager, under a transfer agency agreement for providing personnel and facilities to perform transfer agency services for the fund. During the period ended October 31, 2008, the fund was charged $1,533 pursuant to the transfer agency agreement.
The fund compensates The Bank of New York Mellon, a subsidiary of BNY Mellon and an affiliate of Dreyfus, under a cash management agreement for performing cash management services related to fund subscriptions and redemptions. During the period ended October 31, 2008, the fund was charged $95 pursuant to the cash management agreement.
The fund compensates The Bank of New York Mellon under a custody agreement for providing custodial services for the fund. During the period ended October 31, 2008, the fund was charged $25,554 pursuant to the custody agreement.
During the period ended October 31, 2008, the fund was charged $6,203 for services performed by the Chief Compliance Officer.
The components of “Due to The Dreyfus Corporation and affiliates” in the Statement of Assets and Liabilities consist of: management fees $7,887, Rule 12b-1 distribution plan fees $1,480, shareholder services plan fees $3,398, custodian fees $8,549, chief compliance officer fees $1,973 and transfer agency per account fees $320, which are offset against an expense reimbursement currently in effect in the amount of $21,914.
(d) Each Board member also serves as a Board member of other funds within the Dreyfus complex. Annual retainer fees and attendance fees are allocated to each fund based on net assets.
NOTE 4—Securities Transactions:
The aggregate amount of purchases and sales (including paydowns) of investment securities, excluding short-term securities, financial futures, options transactions and forward currency exchange contracts during the period ended October 31, 2008, amounted to $19,283,832 and
36
$15,628,615, respectively, of which $4,302,261 in purchases and $4,308,514 in sales were from mortgage dollar roll transactions.
A mortgage dollar roll transaction involves a sale by the fund of mortgage related securities that it holds with an agreement by the fund to repurchase similar securities at an agreed upon price and date. The securities purchased will bear the same interest rate as those sold, but generally will be collateralized by pools of mortgages with different prepayment histories than those securities sold.
The fund may invest in financial futures contracts in order to gain exposure to or protect against changes in the market.The fund is exposed to market risk as a result of changes in the value of the underlying financial instruments. Investments in financial futures require the fund to “mark to market” on a daily basis, which reflects the change in market value of the contracts at the close of each day’s trading. Accordingly, variation margin payments are received or made to reflect daily unrealized gains or losses.When the contracts are closed, the fund recognizes a realized gain or loss.These investments require initial margin deposits with a broker, which consist of cash or cash equivalents.The amount of these deposits is determined by the exchange or Board of Trade on which the contract is traded and is subject to change. Contracts open at October 31, 2008, are set forth in the Statement of Financial Futures.
The fund may purchase and write (sell) put and call options in order to gain exposure to or to protect against changes in the market. As a writer of call options, the fund receives a premium at the outset and then bears the market risk of unfavorable changes in the price of the financial instrument underlying the option. Generally, the fund would incur a gain, to the extent of the premium, if the price of the underlying financial instrument decreases between the date the option is written and the date on which the option is terminated. Generally, the fund would realize a loss, if the price of the financial instrument increases between those dates.
The Fund 37
| NOTES TO FINANCIAL STATEMENTS (continued) |
As a writer of put options, the fund receives a premium at the outset and then bears the market risk of unfavorable changes in the price of the financial instrument underlying the option. Generally, the fund would incur a gain, to the extent of the premium, if the price of the underlying financial instrument increases between the date the option is written and the date on which the option is terminated. Generally, the fund would realize a loss, if the price of the financial instrument decreases between those dates.
The following summarizes the fund’s call/put options written for the period ended October 31, 2008.
| | | Face Amount | | | | Options Terminated |
| | | | | | |
|
| | | Covered by | | Premiums | | | | Net Realized |
| Options Written: | | Contracts ($) | | Received ($) | | Cost ($) | | Gain ($) |
| |
| |
| |
| |
|
| Contracts outstanding | | | | | | | | |
| October 31, 2007 | | 4,000 | | 2,582 | | | | |
| Contracts written | | 196,000 | | 314,100 | | | | |
| Contracts terminated: | | | | | | | | |
| Contracts closed | | 180,000 | | 286,867 | | 266,619 | | 20,248 |
| Contracts Outstanding | | | | | | | | |
| October 31, 2008 | | 20,000 | | 29,815 | | | | |
The fund enters into forward currency exchange contracts to gain exposure to foreign currency, hedge its exposure against changes in exchange rates on its foreign portfolio holdings and to settle foreign currency transactions. When executing forward currency exchange contracts, the fund is obligated to buy or sell a foreign currency at a specified rate on a certain date in the future.With respect to sales of forward currency exchange contracts, the fund would incur a loss if the value of the contract increases between the date the forward contract is opened and the date the forward contract is closed.The fund realizes a gain if the value of the contract decreases between those dates. With respect to purchases of forward currency exchange contracts, the fund would incur a loss if the value of the contract decreases between the date the forward contract is opened and the date the forward contract is closed.The fund realizes a gain if the value of the contract increases between those dates.The fund is also exposed to credit risk associated with counterparty nonperformance on these forward currency
38
exchange contracts which is typically limited to the unrealized gain on each open contract.The following summarizes open forward currency exchange contracts at October 31, 2008:
| | | Foreign | | | | | | Unrealized |
| Forward Currency | | Currency | | | | | | Appreciation |
| Exchange Contracts | | Amounts | | Cost ($) | | Value ($) (Depreciation) ($) |
| |
| |
| |
|
| Purchases: | | | | | | | | |
| British Pound, | | | | | | | | |
| Expiring 12/17/2008 | | 36,300 | | 63,364 | | 58,259 | | (5,105) |
| British Pound, | | | | | | | | |
| Expiring 12/17/2008 | | 32,000 | | 56,202 | | 51,358 | | (4,844) |
| British Pound, | | | | | | | | |
| Expiring 12/17/2008 | | 3,245 | | 5,646 | | 5,208 | | (438) |
| British Pound, | | | | | | | | |
| Expiring 12/17/2008 | | 7,755 | | 13,481 | | 12,446 | | (1,035) |
| British Pound, | | | | | | | | |
| Expiring 12/17/2008 | | 9,000 | | 14,565 | | 14,444 | | (121) |
| Canadian Dollar, | | | | | | | | |
| Expiring 12/17/2008 | | 141,500 | | 112,159 | | 117,392 | | 5,233 |
| Canadian Dollar, | | | | | | | | |
| Expiring 12/17/2008 | | 95,200 | | 75,811 | | 78,980 | | 3,169 |
| Canadian Dollar, | | | | | | | | |
| Expiring 12/17/2008 | | 11,200 | | 9,063 | | 9,292 | | 229 |
| Canadian Dollar, | | | | | | | | |
| Expiring 12/17/2008 | | 20,800 | | 16,944 | | 17,256 | | 312 |
| Japanese Yen, | | | | | | | | |
| Expiring 12/17/2008 | | 3,895,299 | | 39,246 | | 39,628 | | 382 |
| Japanese Yen, | | | | | | | | |
| Expiring 12/17/2008 | | 3,966,000 | | 40,088 | | 40,347 | | 259 |
| Japanese Yen, | | | | | | | | |
| Expiring 12/17/2008 | | 5,030,000 | | 50,310 | | 51,172 | | 862 |
| Japanese Yen, | | | | | | | | |
| Expiring 12/17/2008 | | 991,500 | | 9,915 | | 10,087 | | 172 |
| Japanese Yen, | | | | | | | | |
| Expiring 12/17/2008 | | 1,163,360 | | 11,622 | | 11,835 | | 213 |
| Japanese Yen, | | | | | | | | |
| Expiring 12/17/2008 | | 489,140 | | 4,916 | | 4,976 | | 60 |
| Japanese Yen, | | | | | | | | |
| Expiring 12/17/2008 | | 1,497,125 | | 14,771 | | 15,231 | | 460 |
| Japanese Yen, | | | | | | | | |
| Expiring 12/17/2008 | | 3,577,875 | | 35,364 | | 36,399 | | 1,035 |
| Japanese Yen, | | | | | | | | |
| Expiring 12/17/2008 | | 2,319,000 | | 23,605 | | 23,592 | | (13) |
| Japanese Yen, | | | | | | | | |
| Expiring 12/17/2008 | | 2,515,500 | | 27,043 | | 25,591 | | (1,452) |
The Fund 39
| NOTES TO FINANCIAL STATEMENTS (continued) |
| | | Foreign | | | | | | Unrealized |
| Forward Currency | | Currency | | | | | | Appreciation |
| Exchange Contracts | | Amounts | | Cost ($) | | Value ($) (Depreciation) ($) |
| |
| |
| |
|
| Purchases (continued): | | | | | | | | |
| Japanese Yen, | | | | | | | | |
| Expiring 12/17/2008 | | 838,500 | | 9,018 | | 8,530 | | (488) |
| New Zealand Dollar, | | | | | | | | |
| Expiring 12/17/2008 | | 136,134 | | 90,173 | | 78,810 | | (11,363) |
| New Zealand Dollar, | | | | | | | | |
| Expiring 12/17/2008 | | 72,751 | | 48,218 | | 42,117 | | (6,101) |
| New Zealand Dollar, | | | �� | | | | | |
| Expiring 12/17/2008 | | 70,837 | | 46,996 | | 41,009 | | (5,987) |
| New Zealand Dollar, | | | | | | | | |
| Expiring 12/17/2008 | | 63,178 | | 41,564 | | 36,575 | | (4,989) |
| New Zealand Dollar, | | | | | | | | |
| Expiring 12/17/2008 | | 51,000 | | 32,099 | | 29,524 | | (2,575) |
| New Zealand Dollar, | | | | | | | | |
| Expiring 12/17/2008 | | 45,000 | | 27,270 | | 26,051 | | (1,219) |
| New Zealand Dollar, | | | | | | | | |
| Expiring 12/17/2008 | | 56,250 | | 30,259 | | 32,564 | | 2,305 |
| New Zealand Dollar, | | | | | | | | |
| Expiring 12/17/2008 | | 18,750 | | 10,087 | | 10,855 | | 768 |
| Norwegian Krone, | | | | | | | | |
| Expiring 12/17/2008 | | 240,000 | | 33,651 | | 35,509 | | 1,858 |
| Norwegian Krone, | | | | | | | | |
| Expiring 12/17/2008 | | 164,800 | | 23,518 | | 24,383 | | 865 |
| Norwegian Krone, | | | | | | | | |
| Expiring 12/17/2008 | | 171,000 | | 24,222 | | 25,300 | | 1,078 |
| Norwegian Krone, | | | | | | | | |
| Expiring 12/17/2008 | | 57,000 | | 8,077 | | 8,433 | | 356 |
| Swedish Krona, | | | | | | | | |
| Expiring 12/17/2008 | | 805,000 | | 118,525 | | 103,624 | | (14,901) |
| Swedish Krona, | | | | | | | | |
| Expiring 12/17/2008 | | 215,000 | | 31,036 | | 27,676 | | (3,360) |
| Swedish Krona, | | | | | | | | |
| Expiring 12/17/2008 | | 538,000 | | 74,361 | | 69,254 | | (5,107) |
| Swedish Krona, | | | | | | | | |
| Expiring 12/17/2008 | | 190,000 | | 26,812 | | 24,458 | | (2,354) |
| Swedish Krona, | | | | | | | | |
| Expiring 12/17/2008 | | 100,000 | | 14,158 | | 12,872 | | (1,286) |
| Swedish Krona, | | | | | | | | |
| Expiring 12/17/2008 | | 106,800 | | 15,152 | | 13,748 | | (1,404) |
| Swedish Krona, | | | | | | | | |
| Expiring 12/17/2008 | | 26,700 | | 3,776 | | 3,437 | | (339) |
| Swedish Krona, | | | | | | | | |
| Expiring 12/17/2008 | | 31,328 | | 4,429 | | 4,033 | | (396) |
| Swedish Krona, | | | | | | | | |
| Expiring 12/17/2008 | | 13,172 | | 1,872 | | 1,696 | | (176) |
40
| | | Foreign | | | | | | Unrealized |
| Forward Currency | | Currency | | | | | | Appreciation |
| Exchange Contracts | | Amounts | | Cost ($) | | Value ($) (Depreciation) ($) |
| |
| |
| |
|
| Purchases (continued): | | | | | | | | |
| Swedish Krona, | | | | | | | | |
| Expiring 12/17/2008 | | 181,000 | | 24,321 | | 23,299 | | (1,022) |
| Swedish Krona, | | | | | | | | |
| Expiring 12/17/2008 | | 476,000 | | 60,878 | | 61,273 | | 395 |
| Swedish Krona, | | | | | | | | |
| Expiring 12/17/2008 | | 476,000 | | 60,868 | | 61,273 | | 405 |
| Swedish Krona, | | | | | | | | |
| Expiring 12/17/2008 | | 402,000 | | 51,504 | | 51,748 | | 244 |
| Swedish Krona, | | | �� | | | | | |
| Expiring 12/17/2008 | | 268,000 | | 34,559 | | 34,498 | | (61) |
| Swiss Franc, | | | | | | | | |
| Expiring 12/17/2008 | | 40,300 | | 34,586 | | 34,778 | | 192 |
| Swiss Franc, | | | | | | | | |
| Expiring 12/17/2008 | | 65,500 | | 56,360 | | 56,526 | | 166 |
| Swiss Franc, | | | | | | | | |
| Expiring 12/17/2008 | | 110,950 | | 97,608 | | 95,749 | | (1,859) |
| Swiss Franc, | | | | | | | | |
| Expiring 12/17/2008 | | 206,050 | | 181,998 | | 177,819 | | (4,179) |
| Sales: | | | | Proceeds ($) | | | | |
| Australian Dollar, | | | | | | | | |
| Expiring 12/17/2008 | | 99,370 | | 66,611 | | 65,746 | | 865 |
| Australian Dollar, | | | | | | | | |
| Expiring 12/17/2008 | | 54,600 | | 36,758 | | 36,125 | | 633 |
| Australian Dollar, | | | | | | | | |
| Expiring 12/17/2008 | | 13,650 | | 9,559 | | 9,031 | | 528 |
| Australian Dollar, | | | | | | | | |
| Expiring 12/17/2008 | | 16,016 | | 10,925 | | 10,597 | | 328 |
| Australian Dollar, | | | | | | | | |
| Expiring 12/17/2008 | | 6,734 | | 4,532 | | 4,455 | | 77 |
| Australian Dollar, | | | | | | | | |
| Expiring 12/17/2008 | | 31,750 | | 21,996 | | 21,006 | | 990 |
| Australian Dollar, | | | | | | | | |
| Expiring 12/17/2008 | | 50,800 | | 35,519 | | 33,611 | | 1,908 |
| Australian Dollar, | | | | | | | | |
| Expiring 12/17/2008 | | 31,750 | | 22,296 | | 21,006 | | 1,290 |
| Australian Dollar, | | | | | | | | |
| Expiring 12/17/2008 | | 12,700 | | 9,147 | | 8,403 | | 744 |
| Australian Dollar, | | | | | | | | |
| Expiring 12/17/2008 | | 27,000 | | 18,004 | | 17,864 | | 140 |
| Euro, | | | | | | | | |
| Expiring 12/17/2008 | | 120,350 | | 154,400 | | 153,183 | | 1,217 |
| Euro, | | | | | | | | |
| Expiring 12/17/2008 | | 131,000 | | 168,230 | | 166,738 | | 1,492 |
The Fund 41
| NOTES TO FINANCIAL STATEMENTS (continued) |
| | | Foreign | | | | | | Unrealized |
| Forward Currency | | Currency | | | | | | Appreciation |
| Exchange Contracts | | Amounts | | Proceeds ($) | | Value ($) (Depreciation) ($) |
| |
| |
| |
|
| Sales (continued): | | | | | | | | |
| Euro, | | | | | | | | |
| Expiring 12/17/2008 | | 81,000 | | 103,895 | | 103,098 | | 797 |
| Euro, | | | | | | | | |
| Expiring 12/17/2008 | | 54,000 | | 69,160 | | 68,732 | | 428 |
| Euro, | | | | | | | | |
| Expiring 12/17/2008 | | 93,000 | | 115,590 | | 118,371 | | (2,781) |
| Euro, | | | | | | | | |
| Expiring 12/17/2008 | | 31,000 | | 38,574 | | 39,457 | | (883) |
| Euro, | | | | | | | | |
| Expiring 12/17/2008 | | 67,550 | | 87,179 | | 85,978 | | 1,201 |
| Euro, | | | | | | | | |
| Expiring 12/17/2008 | | 125,450 | | 161,025 | | 159,674 | | 1,351 |
| Total | | | | | | | | (50,831) |
At October 31, 2008, the cost of investments for federal income tax purposes was $18,481,297; accordingly, accumulated net unrealized depreciation on investments was $523,735, consisting of $54,709 gross unrealized appreciation and $578,444 gross unrealized depreciation.
In March 2008, the FASB released Statement of Financial Accounting Standards No. 161 “Disclosures about Derivative Instruments and Hedging Activities” (“FAS 161”). FAS 161 requires qualitative disclosures about objectives and strategies for using derivatives, quantitative disclosures about fair value amounts of gains and losses on derivative instruments and disclosures about credit-risk-related contingent features in derivative agreements.The application of FAS 161 is required for fiscal years and interim periods beginning after November 15, 2008. At this time, management is evaluating the implications of FAS 161 and its impact on the financial statements and the accompanying notes has not yet been determined.
42
REPORT OF INDEPENDENT REGISTERED
PUBLIC ACCOUNTING FIRM |
| | Shareholders and Board of Directors
Dreyfus Total Return Advantage Fund |
We have audited the accompanying statement of assets and liabilities, including the statements of investments, financial futures and options written, of Dreyfus Total Return Advantage Fund (formerly Dreyfus Premier Total Return Advantage Fund) (one of the series comprising Advantage Funds, Inc.) as of October 31, 2008, and the related statement of operations for the year then ended, the statement of changes in net assets for each of the two years in the period then ended and financial highlights for each of the periods indicated therein.These financial statements and financial highlights are the responsibility of the Fund’s management. Our responsibility is to express an opinion on these financial statements and financial highlights based on our audits.
We conducted our audits in accordance with the standards of the Public Company Accounting Oversight Board (United States).Those standards require that we plan and perform the audit to obtain reasonable assurance about whether the financial statements and financial highlights are free of material misstatement.We were not engaged to perform an audit of the Fund’s internal control over financial reporting. Our audits included consideration of internal control over financial reporting as a basis for designing audit procedures that are appropriate in the circumstances, but not for the purpose of expressing an opinion on the effectiveness of the Fund’s internal control over financial reporting. Accordingly, we express no such opinion.An audit also includes examining, on a test basis, evidence supporting the amounts and disclosures in the financial statements and financial highlights, assessing the accounting principles used and significant estimates made by management, and evaluating the overall financial statement presentation. Our procedures included confirmation of securities owned as of October 31, 2008 by correspondence with the custodian and others. We believe that our audits provide a reasonable basis for our opinion.
In our opinion, the financial statements and financial highlights referred to above present fairly, in all material respects, the financial position of Dreyfus Total Return Advantage Fund at October 31, 2008, the results of its operations for the year then ended, the changes in its net assets for each of the two years in the period then ended and the financial highlights for each of the indicated periods, in conformity with U.S. generally accepted accounting principles.
New York, New York
December 23, 2008 |
The Fund 43
IMPORTANT TAX INFORMATION (Unaudited)
For federal tax purposes the fund hereby designates 99.21% of ordinary income dividends paid during the fiscal year ended October 31, 2008 as qualifying “interest related dividends.”
44
BOARD MEMBERS INFORMATION (Unaudited)
The Fund 45
BOARD MEMBERS INFORMATION (Unaudited) (continued)
46

The Fund 47
OFFICERS OF THE FUND (Unaudited)

48
The Fund 49
For More Information

Save time. Save paper. View your next shareholder report online as soon as it’s available. Log into www.dreyfus.com and sign up for Dreyfus eCommunications. It’s simple and only takes a few minutes.
The views expressed in this report reflect those of the portfolio manager only through the end of the period covered and do not necessarily represent the views of Dreyfus or any other person in the Dreyfus organization. Any such views are subject to change at any time based upon market or other conditions and Dreyfus disclaims any responsibility to update such views.These views may not be relied on as investment advice and, because investment decisions for a Dreyfus fund are based on numerous factors, may not be relied on as an indication of trading intent on behalf of any Dreyfus fund.

| | Contents |
| |
| | THE FUND |
| |
| 2 | A Letter from the CEO |
| |
| 3 | Discussion of Fund Performance |
| |
| 6 | Fund Performance |
| |
| 8 | Understanding Your Fund’s Expenses |
| |
| 8 | Comparing Your Fund’s Expenses With Those of Other Funds |
| |
| 9 | Statement of Investments |
| |
| 46 | Statement of Financial Futures |
| |
| 47 | Statement of Assets and Liabilities |
| |
| 48 | Statement of Operations |
| |
| 49 | Statement of Changes in Net Assets |
| |
| 51 | Financial Highlights |
| |
| 55 | Notes to Financial Statements |
| |
| 69 | Report of Independent Registered Public Accounting Firm |
| |
| 70 | Important Tax Information |
| |
| 71 | Board Members Information |
| |
| 74 | Officers of the Fund |
| |
| | FOR MORE INFORMATION |
| |
| | Back Cover |
| |

A LETTER FROM THE CEO
Dear Shareholder: |
We present to you this annual report for Global Alpha Fund, covering the 12-month period from November 1, 2007, through October 31, 2008. These are difficult times for international investors. A credit crunch that began in the United States in 2007 has developed into a full-blown global financial crisis, recently resulting in the failure of several major financial institutions. Meanwhile, the global economic slowdown has gathered momentum, depressing investor sentiment, consumer confidence and business investment around the world. These factors undermined equity returns in most regions, including formerly high-flying emerging markets.
The depth and duration of the economic downturn will depend on how quickly the global financial system can be stabilized.We believe that government efforts in the United States and Europe meet several critical requirements for addressing today’s financial stresses, and we expect them to contribute to a more orderly deleveraging process. However, recuperation from the financial crisis is likely to take time. In the mean-time,we encourage you to keep in touch with your financial advisor and maintain a long-term and disciplined perspective to investing. Indeed, we already are seeing some positive signs, including a likely peak in global inflationary pressures, attractive valuations among fundamentally sound companies and a large pool of worldwide financial liquidity that could be deployed gradually as the economic cycle turns.
For information about how the fund performed during the reporting period, as well as market perspectives, we have provided a Discussion of Fund Performance given by the fund’s Portfolio Manager.
Thank you for your continued confidence and support.

Jonathan R. Baum
Chief Executive Officer
The Dreyfus Corporation
November 17, 2008 |
2

DISCUSSION OF FUND PERFORMANCE
For the period of November 1, 2007, through October 31, 2008, as provided by Helen Potter, Portfolio Manager
Fund and Market Performance Overview
For the 12-month period ended October 31, 2008, Global Alpha Fund’s Class A shares produced a total return of –38.52%, Class C shares returned –38.97%, Class I shares returned –38.29% and Class T shares returned –38.57% .1 In comparison, the fund’s benchmark, a hybrid index comprised of 60% Morgan Stanley Capital International World Index (half-hedged) and 40% Citigroup World Government Bond Index 1+ World Index (half-hedged), produced a total return of –24.70% for the reporting period.2 Separately, the Morgan Stanley Capital International World Index (half-hedged) returned –40.13%, and the Citigroup World Government Bond Index 1+ World Index (half-hedged) produced a 3.67% total return for the same period.
A global economic slowdown and intensifying financial crisis caused a “flight to quality” and a massive sell-off in international stock markets. International bond markets, while volatile, generally fared better than equities. The fund’s returns lagged its benchmark, primarily due to overweighted allocations to global stocks, the U.K. pound and the euro.
The Fund’s Investment Approach
The fund seeks total return through investments in securities and instruments that provide exposure to global stock, bond and currency markets. The strategy utilizes a proprietary,fundamentals-based quantitative model to construct and optimally integrate a diverse set of four alpha-generating signals: stock markets vs. bond markets within each country, country allocation among equity markets, country allocation among sovereign bond markets, and currency allocation. Our quantitative investment approach is designed to identify and exploit these relative misvaluations across and within major developed capital markets such as the United States, Canada, Japan,Australia and Western Europe.
The Fund 3
| DISCUSSION OF FUND PERFORMANCE (continued) |
Deteriorating Global Economy Pushed Stocks Lower
An ongoing credit crunch mushroomed into a global financial crisis late in the reporting period, sparking steep declines in international stock markets as challenging liquidity conditions, dampened consumer spending and fears of a deep and prolonged recession rattled financial markets. Even higher-quality stocks were subject to broad selling pressure in an environment where valuations and fundamental strengths appeared largely disconnected from share prices. Finally, skyrocketing commodities prices reversed course over the summer of 2008, relieving some pressure on consumers and businesses, but damaging resource-heavy economies. In global bond markets, lower-rated sovereign and corporate bonds suffered as risk-averse investors fled to the traditional safe havens of high-quality bonds in developed markets. In currency markets, the U.S. dollar gained value against the euro and the U.K. pound in the flight to quality.
Falling Equity Prices and European Currencies Weighed Heavily
Our investment approach requires that we first replicate the sector allocations of the fund’s benchmark before making active investment decisions outside of those parameters. Consequently, the poor performance of the benchmark in a deteriorating economic environment accounted for approximately two-thirds of the fund’s negative absolute returns during the reporting period. Our active investment decisions were responsible for another one-third of the fund’s losses, including its lagging performance relative to the benchmark.
The fund’s overweighted exposure to global stocks produced a particularly heavy drag on returns. Although our determination that global stocks were undervalued during the reporting period may have been correct by historical standards, deteriorating investor sentiment forced further declines in valuations. Relatively heavy exposure to the U.K. pound and the euro also hampered the fund’s results, as these countries’ previously high short-term interest rates were reduced by their central banks in efforts to stimulate lending.This development contributed to broad selling pressure on both currencies, as nervous investors flocked to the U.S.dollar,which historically has been considered a safer investment.
Some investment decisions produced positive results despite the poor market environment. Conviction in our belief that skyrocketing
4
commodity stocks would reverse course benefited the fund through an underweighted allocation to the currencies of commodities producers such as Australia, Canada and Norway, which dropped precipitously midway through the reporting period. In addition, unattractively low short-term interest rates weighed on the Canadian dollar. Finally, overweighted exposure to rising U.K. stocks provided a positive contribution to the fund’s performance.
Positioned to Benefit from a Return to Fundamentals
Although economic conditions worldwide appeared bleaker at the end of the reporting period than at the beginning, we have focused on three potential investment opportunities. First, recently sharp declines in equity markets have driven high-quality stocks to historically low prices. Because we focus on company fundamentals and hold a long-term view of investing, we believe the fund’s overweighted exposure to such companies may position it well for an eventual market recovery. Second, large variances in equity market valuations worldwide have enabled us to position the fund to potentially benefit from these valuations. Likewise, variations in the bond markets of different regions, due in large part to the financial crisis, also have expanded over the last few months, and we have made investments that we believe may benefit as those differences narrow toward historical norms.
November 17, 2008
| | | Investing in foreign companies involves special risks, including changes in currency rates, |
| | | political, economic and social instability, a lack of comprehensive company information, |
| | | differing auditing and legal standards, and less market liquidity. An investment in this fund |
| | | should be considered only as a supplement to an overall investment program. |
| 1 | | Total return includes reinvestment of dividends and any capital gains paid, and does not take into |
| | | consideration the maximum initial sales charges in the case of Class A or Class T shares, or the |
| | | applicable contingent deferred sales charge imposed on redemptions in the case of Class C shares. |
| | | Had these charges been reflected, returns would have been lower. Past performance is no guarantee |
| | | of future results. Share price, yield and investment return fluctuate such that upon redemption, |
| | | fund shares may be worth more or less than their original cost. |
| 2 | | SOURCES: Morgan Stanley Capital International and Citigroup – Reflects reinvestment of net |
| | | dividends and, where applicable, capital gain distributions.The Morgan Stanley Capital |
| | | International (MSCI) World Index is an unmanaged index of global stock market performance, |
| | | including the United States, Canada, Europe,Australia, New Zealand and the Far East.The |
| | | Citigroup World Government Bond Index includes the 22 government bond markets. |
The Fund 5

| † Source: FactSet |
| Past performance is not predictive of future performance. |
| The above graph compares a $10,000 investment made in Class A, Class C, Class I and Class T shares of Global |
| Alpha Fund on May 2, 2006 (inception date) to a $10,000 investment made on that date in each of the following: the |
| Morgan Stanley Capital International World Index (the “MSCI Index”) (half-hedged); the Citigroup World |
| Government Bond Index 1 + World Index (the “CWGB Index”) (half-hedged); and an unmanaged hybrid index |
| composed of 60% MSCI Index and 40% CWGB Index (the “Hybrid Index”) (half-hedged). Returns assume all |
| dividends and capital gain distributions are reinvested. |
| The fund invests primarily in instruments that provide exposure to global equity, bond and currency markets.The fund’s |
| performance shown in the line graph takes into account the maximum initial sales charge on Class A shares and Class T |
| shares and all other applicable fees and expenses on all classes.The MSCI Index (half-hedged) is an unmanaged index of |
| global stock market performance, including the United States, Canada,Australia, New Zealand and the Far East and |
| includes net dividends reinvested.The CWGB Index (half-hedged) is an unmanaged index that tracks the performance of |
| 22 government bond markets. Unlike a mutual fund, the indices are not subject to charges, fees and other expenses. |
| Investors cannot invest directly in any index. Further information relating to fund performance, including expense |
| reimbursements, if applicable, is contained in the Financial Highlights section of the prospectus and elsewhere in this report. |
6
| Average Annual Total Returns as of 10/31/08 | | | | | | |
| |
| | | Inception | | | | From |
| | | Date | | 1 Year | | Inception |
| |
| |
| |
|
| Class A shares | | | | | | |
| with maximum sales charge (5.75%) | | 5/2/06 | | (42.06)% | | (14.71)% |
| without sales charge | | 5/2/06 | | (38.52)% | | (12.67)% |
| Class C shares | | | | | | |
| with applicable redemption charge † | | 5/2/06 | | (39.57)% | | (13.32)% |
| without redemption | | 5/2/06 | | (38.97)% | | (13.32)% |
| Class I shares | | 5/2/06 | | (38.29)% | | (12.40)% |
| Class T shares | | | | | | |
| with applicable sales charge (4.5%) | | 5/2/06 | | (41.34)% | | (14.43)% |
| without sales charge | | 5/2/06 | | (38.57)% | | (12.84)% |
| Past performance is not predictive of future performance.The fund’s performance shown in the graph and table does not |
| reflect the deduction of taxes that a shareholder would pay on fund distributions or the redemption of fund shares. |
| † The maximum contingent deferred sales charge for Class C shares is 1% for shares redeemed within one year of the |
| date of purchase. |
The Fund 7
UNDERSTANDING YOUR FUND’S EXPENSES (Unaudited)
As a mutual fund investor, you pay ongoing expenses, such as management fees and other expenses. Using the information below, you can estimate how these expenses affect your investment and compare them with the expenses of other funds.You also may pay one-time transaction expenses, including sales charges (loads) and redemption fees, which are not shown in this section and would have resulted in higher total expenses. For more information, see your fund’s prospectus or talk to your financial adviser.
Review your fund’s expenses
The table below shows the expenses you would have paid on a $1,000 investment in Global Alpha Fund from May 1, 2008 to October 31, 2008. It also shows how much a $1,000 investment would be worth at the close of the period, assuming actual returns and expenses.
| Expenses and Value of a $1,000 Investment | | | | | | |
| assuming actual returns for the six months ended October 31, 2008 | | | | |
| | | Class A | | Class C | | Class I | | Class T |
| |
| |
| |
| |
|
| Expenses paid per $1,000† | | $ 6.93 | | $ 10.15 | | $ 5.34 | | $ 7.98 |
| Ending value (after expenses) | | $670.90 | | $668.50 | | $672.50 | | $670.40 |
COMPARING YOUR FUND’S EXPENSES WITH THOSE OF OTHER FUNDS (Unaudited)
Using the SEC’s method to compare expenses
The Securities and Exchange Commission (SEC) has established guidelines to help investors assess fund expenses. Per these guidelines, the table below shows your fund’s expenses based on a $1,000 investment, assuming a hypothetical 5% annualized return. You can use this information to compare the ongoing expenses (but not transaction expenses or total cost) of investing in the fund with those of other funds.All mutual fund shareholder reports will provide this information to help you make this comparison. Please note that you cannot use this information to estimate your actual ending account balance and expenses paid during the period.
Expenses and Value of a $1,000 Investment assuming a hypothetical 5% annualized return for the six months ended October 31, 2008
| | | Class A | | Class C | | Class I | | Class T |
| |
| |
| |
| |
|
| Expenses paid per $1,000† | | $ 8.36 | | $ 12.25 | | $ 6.44 | | $ 9.63 |
| Ending value (after expenses) | | $1,016.84 | | $1,012.97 | | $1,018.75 | | $1,015.58 |
| † Expenses are equal to the fund’s annualized expense ratio of 1.65% for Class A, 2.42% for Class C, 1.27% for |
| Class I and 1.90% for Class T, multiplied by the average account value over the period, multiplied by 184/366 (to |
| reflect the one-half year period). |
8
STATEMENT OF INVESTMENTS
October 31, 2008 |
| Common Stocks—67.3% | | Shares | | Value ($) |
| |
| |
|
| Austria—.1% | | | | |
| Andritz | | 211 | | 5,916 |
| Atrium European Real Estate | | 2,119 a | | 9,539 |
| Erste Group Bank | | 1,027 | | 27,010 |
| IMMOEAST | | 2,681 a | | 3,196 |
| IMMOFINANZ | | 1,978 a | | 2,182 |
| OMV | | 893 | | 28,298 |
| Raiffeisen International Bank Holding | | 293 | | 9,103 |
| Strabag | | 163 | | 3,154 |
| Telekom Austria | | 1,867 | | 22,728 |
| Verbund-Oesterreichische Elektrizitaetswirtschafts, Cl. A | | 417 | | 19,565 |
| Vienna Insurance Group | | 270 | | 7,190 |
| Voestalpine | | 623 | | 15,010 |
| Wienerberger | | 539 | | 8,817 |
| | | | | 161,708 |
| Belgium—.2% | | | | |
| Belgacom | | 915 | | 31,026 |
| Colruyt | | 90 | | 20,086 |
| Compagnie Nationale a Portefeuille | | 126 | | 6,733 |
| Delhaize Group | | 543 | | 30,210 |
| Dexia | | 2,865 | | 14,823 |
| Fortis | | 12,089 | | 13,643 |
| Fortis (Rights) | | 12,089 a | | 0 |
| Groupe Bruxelles Lambert | | 437 | | 31,644 |
| Groupe Bruxelles Lambert (Strip) | | 31 a | | 1 |
| InBev | | 999 | | 39,872 |
| KBC Ancora | | 100 | | 2,917 |
| KBC Groep | | 865 | | 36,745 |
| Mobistar | | 233 | | 15,349 |
| Solvay | | 321 | | 29,596 |
| UCB | | 546 | | 13,816 |
| Umicore | | 673 | | 11,913 |
| | | | | 298,374 |
| Bermuda—.6% | | | | |
| Accenture, Cl. A | | 3,139 | | 103,744 |
| ACE | | 1,765 | | 101,240 |
| Axis Capital Holdings | | 692 | | 19,708 |
The Fund 9
| STATEMENT OF INVESTMENTS (continued) |
| Common Stocks (continued) | | Shares | | Value ($) |
| |
| |
|
| Bermuda (continued) | | | | |
| Covidien | | 2,631 | | 116,527 |
| Everest Re Group | | 333 | | 24,875 |
| Ingersoll-Rand, Cl. A | | 1,678 | | 30,959 |
| Invesco | | 2,013 | | 30,014 |
| Marvell Technology Group | | 2,501 a | | 17,407 |
| Nabors Industries | | 1,453 a | | 20,894 |
| PartnerRe | | 323 | | 21,864 |
| RenaissanceRe Holdings | | 358 | | 16,432 |
| Tyco Electronics | | 2,629 | | 51,107 |
| Tyco International | | 2,625 | | 66,360 |
| Weatherford International | | 3,592 a | | 60,633 |
| XL Capital, Cl. A | | 1,778 | | 17,246 |
| | | | | 699,010 |
| Canada—.0% | | | | |
| Tim Hortons | | 1,023 | | 25,749 |
| Cayman Islands—.1% | | | | |
| Garmin | | 600 | | 13,470 |
| Seagate Technology | | 2,420 | | 16,383 |
| Transocean | | 1,694 a | | 139,467 |
| | | | | 169,320 |
| Denmark—.3% | | | | |
| AP Moller—Maersk, Cl. A | | 3 | | 17,368 |
| AP Moller—Maersk, Cl. B | | 6 | | 34,328 |
| Carlsberg, Cl. B | | 386 | | 15,117 |
| Coloplast, Cl. B | | 144 | | 10,421 |
| Danisco | | 268 | | 11,546 |
| Danske Bank | | 2,604 | | 38,133 |
| DSV | | 1,036 | | 12,349 |
| FLSmidth & Co. | | 288 | | 10,642 |
| Jyske Bank | | 273 a | | 8,042 |
| Novo Nordisk, Cl. B | | 2,481 | | 131,807 |
| Novozymes, Cl. B | | 250 | | 17,539 |
| Sydbank | | 453 | | 6,942 |
| Topdanmark | | 117 a | | 12,551 |
| TrygVesta | | 192 | | 11,475 |
10
| Common Stocks (continued) | | Shares | | Value ($) |
| |
| |
|
| Denmark (continued) | | | | |
| Vestas Wind Systems | | 1,002 a | | 40,693 |
| William Demant Holding | | 182 a | | 6,911 |
| | | | | 385,864 |
| Finland—.5% | | | | |
| Elisa | | 765 | | 11,418 |
| Fortum | | 2,400 | | 58,462 |
| Kesko, Cl. B | | 476 | | 11,046 |
| Kone, Cl. B | | 829 | | 18,333 |
| Metso | | 690 | | 9,065 |
| Neste Oil | | 694 | | 10,877 |
| Nokia | | 20,968 | | 323,849 |
| Nokian Renkaat | | 574 | | 7,439 |
| Orion, Cl. B | | 657 | | 9,589 |
| Outokumpu | | 802 | | 8,238 |
| Pohjola Bank, Cl. A | | 909 | | 12,034 |
| Rautaruukki | | 590 | | 9,539 |
| Sampo, Cl. A | | 2,343 | | 46,259 |
| Sanoma | | 642 | | 9,761 |
| Stora Enso, Cl. R | | 3,147 | | 28,972 |
| UPM-Kymmene | | 2,814 | | 39,465 |
| Wartsila | | 521 | | 13,055 |
| YIT | | 930 | | 5,743 |
| | | | | 633,144 |
| France—3.3% | | | | |
| Accor | | 1,004 | | 38,633 |
| ADP | | 153 | | 8,983 |
| Air France-KLM | | 694 | | 9,887 |
| Air Liquide | | 1,283 | | 109,499 |
| Alcatel-Lucent | | 11,908 a | | 30,351 |
| Alstom | | 1,087 | | 52,826 |
| Atos Origin | | 358 | | 8,217 |
| AXA | | 7,943 | | 149,571 |
| BNP Paribas | | 4,232 | | 300,519 |
| Bouygues | | 1,250 | | 52,593 |
| Bureau Veritas | | 209 | | 7,389 |
The Fund 11
| STATEMENT OF INVESTMENTS (continued) |
| Common Stocks (continued) | | Shares | | Value ($) |
| |
| |
|
| France (continued) | | | | |
| Cap Gemini | | 710 | | 22,571 |
| Carrefour | | 3,261 | | 136,128 |
| Casino Guichard Perrachon | | 224 | | 15,480 |
| Christian Dior | | 280 | | 16,769 |
| Cie de Saint-Gobain | | 1,442 | | 54,902 |
| Cie Generale d’Optique Essilor International | | 1,032 | | 45,881 |
| CNP Assurances | | 191 | | 15,254 |
| Compagnie Generale de Geophysique-Veritas | | 670 a | | 10,628 |
| Compagnie Generale des Etablissements Michelin, Cl. B | | 740 | | 37,642 |
| Credit Agricole | | 4,577 | | 65,207 |
| Dassault Systemes | | 330 | | 13,529 |
| Eiffage | | 192 | | 7,304 |
| Electricite de France | | 1,030 | | 61,256 |
| Eramet | | 27 | | 5,375 |
| Eurazeo | | 131 | | 7,791 |
| Eutelsat Communications | | 449 | | 9,548 |
| France Telecom | | 9,481 | | 236,842 |
| GDF SUEZ | | 5,781 | | 254,043 |
| Gecina | | 80 | | 5,510 |
| Groupe Danone | | 2,240 | | 123,389 |
| Hermes International | | 354 | | 45,338 |
| ICADE | | 101 | | 5,999 |
| Imerys | | 146 | | 6,572 |
| JC Decaux | | 342 | | 5,881 |
| Klepierre | | 356 | | 8,090 |
| L’Oreal | | 1,256 | | 93,992 |
| Lafarge | | 754 | | 49,063 |
| Lagardere | | 620 | | 24,372 |
| Legrand | | 487 | | 8,028 |
| LVMH Moet Hennessy Louis Vuitton | | 1,259 | | 82,801 |
| M6-Metropole Television | | 334 | | 5,209 |
| Natixis | | 5,033 | | 10,913 |
| Neopost | | 163 | | 13,518 |
| PagesJaunes Groupe | | 649 | | 6,098 |
| Pernod-Ricard | | 845 | | 54,411 |
| Peugeot | | 783 | | 20,647 |
| PPR | | 395 | | 24,844 |
12
| Common Stocks (continued) | | Shares | | Value ($) |
| |
| |
|
| France (continued) | | | | |
| Publicis Groupe | | 676 | | 15,130 |
| Renault | | 952 | | 28,803 |
| Safran | | 964 | | 12,102 |
| Sanofi-Aventis | | 5,404 | | 338,722 |
| Schneider Electric | | 1,134 | | 67,153 |
| Scor | | 892 | | 14,422 |
| Societe BIC | | 137 | | 7,168 |
| Societe Generale | | 2,396 | | 128,139 |
| Societe Television Francaise 1 | | 603 | | 7,639 |
| Sodexo | | 490 | | 23,307 |
| Suez Environnement | | 1,343 a | | 25,545 |
| Technip | | 524 | | 15,449 |
| Thales | | 459 | | 18,218 |
| Total | | 11,190 | | 607,524 |
| Unibail-Rodamco | | 420 | | 62,312 |
| Valeo | | 382 | | 6,583 |
| Vallourec | | 273 | | 30,118 |
| Veolia Environnement | | 1,935 | | 47,135 |
| Vinci | | 2,127 | | 75,493 |
| Vivendi | | 5,986 | | 154,886 |
| Wendel | | 142 | | 6,670 |
| Zodiac | | 214 | | 8,274 |
| | | | | 4,080,085 |
| Greece—.2% | | | | |
| Alpha Bank | | 2,054 | | 29,640 |
| Coca-Cola Hellenic Bottling | | 888 | | 12,274 |
| EFG Eurobank Ergasias | | 1,709 | | 18,334 |
| Hellenic Petroleum | | 883 | | 7,256 |
| Hellenic Telecommunications Organization | | 1,459 | | 20,425 |
| Marfin Investment Group | | 3,187 a | | 13,821 |
| National Bank of Greece | | 2,686 | | 58,243 |
| OPAP | | 1,208 | | 26,133 |
| Piraeus Bank | | 1,753 | | 22,007 |
| Public Power | | 565 | | 6,907 |
| Titan Cement | | 389 | | 6,561 |
| | | | | 221,601 |
The Fund 13
| STATEMENT OF INVESTMENTS (continued) |
| Common Stocks (continued) | | Shares | | Value ($) |
| |
| |
|
| Ireland—.1% | | | | |
| Allied Irish Banks | | 4,766 | | 23,177 |
| Anglo Irish Bank | | 4,074 | | 12,915 |
| Bank of Ireland | | 5,412 | | 15,784 |
| CRH | | 2,938 | | 64,079 |
| Elan | | 2,559 a | | 18,983 |
| Irish Life & Permanent | | 1,000 | | 3,424 |
| Kerry Group, Cl. A | | 925 | | 20,879 |
| | | | | 159,241 |
| Japan—12.7% | | | | |
| 77 Bank | | 4,000 | | 19,011 |
| Acom | | 9 | | 341 |
| Advantest | | 1,400 | | 20,544 |
| Aeon | | 5,900 | | 56,391 |
| Aiful | | 1,150 | | 5,478 |
| Aisin Seiki | | 1,800 | | 31,334 |
| Ajinomoto | | 6,000 | | 52,605 |
| All Nippon Airways | | 8,000 | | 30,594 |
| Alps Electric | | 2,300 | | 12,501 |
| Amada | | 3,000 | | 14,025 |
| Asahi Breweries | | 4,100 | | 68,487 |
| Asahi Glass | | 8,000 | | 51,333 |
| Ashai Kasei | | 9,000 | | 34,432 |
| Astellas Pharma | | 4,000 | | 163,793 |
| Bank of Kyoto | | 3,000 | | 31,464 |
| Bank of Yokohama | | 11,000 | | 52,889 |
| Benesse | | 800 | | 33,726 |
| Bridgestone | | 5,300 | | 92,004 |
| Brother Industries | | 1,500 | | 10,497 |
| Canon | | 8,600 | | 296,421 |
| Casio Computer | | 2,400 | | 15,665 |
| Central Japan Railway | | 13 | | 106,533 |
| Chiba Bank | | 8,000 | | 39,007 |
| Chubu Electric Power | | 5,700 | | 150,318 |
| Chugai Pharmaceutical | | 2,100 | | 29,781 |
| Chugoku Electric Power | | 1,200 | | 29,443 |
| Chuo Mitsui Trust Holdings | | 7,000 | | 27,579 |
| Citizen Holdings | | 3,800 | | 20,895 |
14
| Common Stocks (continued) | | Shares | | Value ($) |
| |
| |
|
| Japan (continued) | | | | |
| Credit Saison | | 1,900 | | 20,053 |
| CSK HOLDINGS | | 700 | | 5,847 |
| Dai Nippon Printing | | 6,000 | | 70,771 |
| Daicel Chemical Industries | | 3,000 | | 10,831 |
| Daido Steel | | 4,000 | | 12,604 |
| Daiichi Sankyo | | 5,800 | | 118,885 |
| Daikin Industries | | 2,200 | | 49,525 |
| Daito Trust Construction | | 800 | | 33,664 |
| Daiwa House Industry | | 4,000 | | 35,331 |
| Daiwa Securities Group | | 12,000 | | 66,761 |
| Denki Kagaku Kogyo | | 6,000 | | 13,539 |
| Denso | | 4,000 | | 79,120 |
| Dentsu | | 20 | | 32,713 |
| DIC | | 5,000 | | 8,014 |
| Dowa Holdings | | 3,000 | | 9,245 |
| East Japan Railway | | 27 | | 192,176 |
| Eisai | | 2,200 | | 72,437 |
| Electric Power Development | | 1,500 | | 44,559 |
| Elpida Memory | | 1,000 a | | 5,239 |
| FamilyMart | | 700 | | 28,002 |
| Fanuc | | 1,600 | | 108,771 |
| Fast Retailing | | 500 | | 52,770 |
| Fuji Electric Holdings | | 5,000 | | 7,454 |
| FUJIFILM Holdings | | 3,900 | | 86,515 |
| Fujitsu | | 16,000 | | 63,776 |
| Fukuoka Financial Group | | 8,000 | | 26,166 |
| Furukawa Electric | | 6,000 | | 17,996 |
| Gunma Bank | | 5,000 | | 25,903 |
| Hankyu Hashin Holdings | | 12,000 | | 56,763 |
| Haseko | | 10,500 | | 9,397 |
| Hirose Electric | | 300 | | 26,269 |
| Hitachi | | 29,000 | | 134,889 |
| Hitachi Construction Machinery | | 1,000 | | 11,444 |
| Hokkaido Electric Power | | 2,000 | | 45,535 |
| Hokuhoku Financial Group | | 12,000 | | 23,631 |
| Hokuriku Electric Power | | 1,100 | | 28,848 |
| Honda Motor | | 14,100 | | 350,754 |
The Fund 15
| STATEMENT OF INVESTMENTS (continued) |
| Common Stocks (continued) | | Shares | | Value ($) |
| |
| |
|
| Japan (continued) | | | | |
| HOYA | | 3,500 | | 64,983 |
| Ibiden | | 1,200 | | 23,050 |
| IHI | | 12,000 | | 14,874 |
| INPEX | | 7 | | 40,772 |
| Isetan Mitsukoshi Holdings | | 3,380 a | | 32,252 |
| Isuzu Motors | | 6,000 | | 10,474 |
| Itochu | | 13,000 | | 70,311 |
| J Front Retailing | | 4,200 | | 19,006 |
| Jafco | | 600 | | 16,600 |
| Japan Real Estate Investment | | 4 | | 35,590 |
| Japan Retail Fund Investment | | 4 | | 14,848 |
| Japan Steel Works | | 4,000 | | 28,227 |
| Japan Tobacco | | 37 | | 131,595 |
| JFE Holdings | | 4,300 | | 112,911 |
| JGC | | 2,000 | | 21,264 |
| Joyo Bank | | 7,000 | | 32,890 |
| JS Group | | 2,400 | | 31,997 |
| JSR | | 1,700 | | 19,752 |
| JTEKT | | 1,700 | | 13,119 |
| Kajima | | 8,000 | | 23,619 |
| Kaneka | | 3,000 | | 14,181 |
| Kansai Electric Power | | 6,700 | | 170,735 |
| Kao | | 4,000 | | 115,819 |
| Kawasaki Heavy Industries | | 13,000 | | 23,501 |
| Kawasaki Kisen Kaisha | | 5,000 | | 19,480 |
| KDDI | | 23 | | 137,634 |
| Keihin Electric Express Railway | | 5,000 | | 38,678 |
| Keio | | 7,000 | | 36,185 |
| Keyence | | 300 | | 58,028 |
| Kintetsu | | 17,000 | | 65,213 |
| Kirin Holdings | | 7,000 | | 76,747 |
| Kobe Steel | | 24,000 | | 38,786 |
| Komatsu | | 7,200 | | 78,308 |
| Konami | | 1,200 | | 21,955 |
| Konica Minolta Holdings | | 4,500 | | 29,341 |
| Kubota | | 9,000 | | 46,323 |
| Kuraray | | 3,000 | | 22,692 |
16
| Common Stocks (continued) | | Shares | | Value ($) |
| |
| |
|
| Japan (continued) | | | | |
| Kurita Water Industries | | 1,400 | | 31,810 |
| Kyocera | | 1,400 | | 81,918 |
| Kyowa Hakko Kirin | | 2,371 | | 19,659 |
| Kyushu Electric Power | | 3,500 | | 81,629 |
| Leopalace21 | | 1,300 | | 9,925 |
| Makita | | 1,200 | | 22,397 |
| Marubeni | | 14,000 | | 55,587 |
| Marui Group | | 2,600 | | 16,170 |
| Mazda Motor | | 6,000 | | 13,611 |
| Mediceo Paltac Holdings | | 1,800 | | 19,482 |
| Meiji Dairies | | 4,000 | | 18,542 |
| Minebea | | 4,000 | | 10,691 |
| Mitsubishi | | 11,200 | | 186,200 |
| Mitsubishi Chemical Holdings | | 10,000 | | 41,068 |
| Mitsubishi Electric | | 15,000 | | 92,597 |
| Mitsubishi Estate | | 10,000 | | 176,311 |
| Mitsubishi Gas Chemical | | 4,000 | | 15,047 |
| Mitsubishi Heavy Industries | | 27,000 | | 86,377 |
| Mitsubishi Materials | | 10,000 | | 23,067 |
| Mitsubishi Motors | | 27,000 a | | 37,202 |
| Mitsubishi Rayon | | 5,000 | | 10,933 |
| Mitsubishi Tanabe Pharma | | 2,000 | | 20,828 |
| Mitsubishi UFJ Financial Group | | 84,760 | | 522,800 |
| Mitsui & Co | | 14,000 | | 134,798 |
| Mitsui Chemicals | | 5,000 | | 17,719 |
| Mitsui Engineering & Shipbuilding | | 7,000 | | 9,708 |
| Mitsui Fudosan | | 7,000 | | 120,711 |
| Mitsui Mining & Smelting | | 6,000 | | 10,914 |
| Mitsui OSK Lines | | 10,000 | | 53,038 |
| Mitsui Sumitomo Insurance Group Holdings | | 3,300 | | 94,196 |
| Mizuho Financial Group | | 80 | | 191,912 |
| Murata Manufacturing | | 1,800 | | 62,482 |
| Namco Bandai Holdings | | 2,300 | | 24,045 |
| NEC | | 17,000 | | 51,168 |
| NGK Insulators | | 2,000 | | 21,211 |
| NGK Spark Plug | | 2,000 | | 19,096 |
| Nidec | | 1,000 | | 51,539 |
The Fund 17
| STATEMENT OF INVESTMENTS (continued) |
| Common Stocks (continued) | | Shares | | Value ($) |
| |
| |
|
| Japan (continued) | | | | |
| Nikon | | 3,000 | | 41,973 |
| Nintendo | | 800 | | 252,728 |
| Nippon Building Fund | | 5 | | 48,559 |
| Nippon Electric Glass | | 3,000 | | 18,469 |
| Nippon Express | | 8,000 | | 32,796 |
| Nippon Meat Packers | | 2,000 | | 27,788 |
| Nippon Mining Holdings | | 8,000 | | 24,814 |
| Nippon Oil | | 12,000 | | 49,765 |
| Nippon Paper Group | | 9 | | 24,094 |
| Nippon Sheet Glass | | 6,000 | | 19,535 |
| Nippon Steel | | 42,000 | | 140,585 |
| Nippon Telegraph & Telephone | | 42 | | 172,659 |
| Nippon Yusen | | 10,000 | | 48,016 |
| Nipponkoa Insurance | | 3,000 | | 18,425 |
| Nishi-Nippon City Bank | | 7,000 | | 15,166 |
| Nissan Chemical Industries | | 2,000 | | 16,113 |
| Nissan Motor | | 20,600 | | 107,927 |
| Nisshin Steel | | 8,000 | | 11,008 |
| NISSIN FOODS HOLDINGS | | 1,000 | | 28,742 |
| Nitto Denko | | 1,500 | | 33,048 |
| Nomura Holdings | | 14,700 | | 136,903 |
| Nomura Real Estate Office Fund | | 3 | | 17,124 |
| Nomura Research Institute | | 1,200 | | 19,553 |
| NSK | | 4,000 | | 16,723 |
| NTN | | 4,000 | | 14,920 |
| NTT Data | | 12 | | 39,405 |
| NTT DoCoMo | | 128 | | 203,410 |
| Obayashi | | 6,000 | | 29,183 |
| Odakyu Electric Railway | | 7,000 | | 51,307 |
| OJI Paper | | 7,000 | | 26,777 |
| OKUMA | | 2,000 | | 8,954 |
| Olympus | | 2,000 | | 38,269 |
| Omron | | 2,100 | | 29,835 |
| Ono Pharmaceutical | | 600 | | 26,887 |
| Oriental Land | | 700 | | 49,738 |
| ORIX | | 760 | | 80,792 |
| Osaka Gas | | 20,000 | | 71,868 |
18
| Common Stocks (continued) | | Shares | | Value ($) |
| |
| |
|
| Japan (continued) | | | | |
| Panasonic | | 16,000 | | 249,196 |
| Panasonic Electric Works | | 3,000 | | 25,906 |
| Promise | | 750 | | 13,358 |
| Rakuten | | 60 | | 29,743 |
| Resona Holdings | | 44 | | 45,444 |
| Ricoh | | 6,000 | | 63,926 |
| Rohm | | 900 | | 42,611 |
| Sankyo | | 600 | | 27,149 |
| Sanyo Electric | | 18,000 a | | 26,987 |
| Sapporo Hokuyo Holdings | | 4 | | 17,561 |
| SBI Holdings | | 86 | | 10,251 |
| Secom | | 2,000 | | 77,543 |
| Sega Sammy Holdings | | 2,100 | | 16,151 |
| Seiko Epson | | 1,300 | | 19,770 |
| Sekisui Chemical | | 4,000 | | 23,266 |
| Sekisui House | | 4,000 | | 40,618 |
| Seven & I Holdings | | 7,200 | | 201,981 |
| Sharp | | 9,000 | | 63,640 |
| Shikoku Electric Power | | 1,100 | | 32,282 |
| Shimamura | | 200 | | 13,881 |
| Shimizu | | 6,000 | | 29,971 |
| Shin-Etsu Chemical | | 3,300 | | 172,979 |
| Shinsei Bank | | 12,000 | | 18,264 |
| Shionogi & Co | | 3,000 | | 50,991 |
| Shiseido | | 3,000 | | 60,869 |
| Shizuoka Bank | | 6,000 | | 52,491 |
| Showa Denko | | 10,000 | | 15,008 |
| Showa Shell Sekiyu | | 2,900 | | 23,383 |
| SMC | | 500 | | 47,834 |
| Softbank | | 6,400 | | 62,572 |
| Sojitz | | 9,800 | | 16,780 |
| Sompo Japan Insurance | | 7,000 | | 49,925 |
| Sony | | 8,400 | | 192,491 |
| Sony Financial Holdings | | 5 | | 16,503 |
| Stanley Electric | | 1,600 | | 20,795 |
| SUMCO | | 1,100 | | 11,755 |
| Sumitomo | | 9,200 | | 82,637 |
The Fund 19
| STATEMENT OF INVESTMENTS (continued) |
| Common Stocks (continued) | | Shares | | Value ($) |
| |
| |
|
| Japan (continued) | | | | |
| Sumitomo Chemical | | 13,000 | | 39,469 |
| Sumitomo Electric Industries | | 6,000 | | 48,280 |
| Sumitomo Heavy Industries | | 5,000 | | 15,275 |
| Sumitomo Metal Industries | | 33,000 | | 87,852 |
| Sumitomo Metal Mining | | 5,000 | | 37,520 |
| Sumitomo Mitsui Financial Group | | 55 | | 223,657 |
| Sumitomo Realty & Development | | 3,000 | | 48,212 |
| Sumitomo Rubber Industries | | 2,400 | | 21,178 |
| Sumitomo Trust & Banking | | 12,000 | | 55,897 |
| Suruga Bank | | 2,000 | | 18,613 |
| Suzuken | | 900 | | 19,264 |
| Suzuki Motor | | 2,100 | | 30,468 |
| T & D Holdings | | 1,700 | | 65,514 |
| Taiheiyo Cement | | 9,000 | | 10,746 |
| Taisei | | 9,000 | | 20,584 |
| Taisho Pharmaceutical | | 2,000 | | 36,160 |
| Taiyo Nippon Sanso | | 4,000 | | 25,648 |
| Takashimaya | | 3,000 | | 23,455 |
| Takeda Pharmaceutical | | 6,600 | | 333,165 |
| Takefuji | | 1,330 | | 10,862 |
| TDK | | 1,100 | | 36,809 |
| Teijin | | 8,000 | | 20,629 |
| Terumo | | 1,600 | | 67,557 |
| THK | | 1,300 | | 17,722 |
| Tobu Railway | | 9,000 | | 46,124 |
| Tohoku Electric Power | | 4,000 | | 91,040 |
| Tokai Rika | | 800 | | 8,297 |
| Tokio Marine Holdings | | 5,600 | | 174,962 |
| Tokuyama | | 2,000 | | 10,042 |
| Tokyo Electric Power | | 10,400 | | 299,089 |
| Tokyo Electron | | 1,500 | | 49,670 |
| Tokyo Gas | | 21,000 | | 91,618 |
| Tokyo Tatemono | | 3,000 | | 12,279 |
| Tokyu | | 10,000 | | 39,193 |
| Tokyu Land | | 4,000 | | 11,202 |
| TonenGeneral Sekiyu | | 4,000 | | 33,846 |
20
| Common Stocks (continued) | | Shares | | Value ($) |
| |
| |
|
| Japan (continued) | | | | |
| Toppan Printing | | 5,000 | | 36,715 |
| Toray Industries | | 11,000 | | 51,063 |
| Toshiba | | 25,000 | | 90,250 |
| Tosoh | | 5,000 | | 10,147 |
| TOTO | | 3,000 | | 21,353 |
| Toyo Seikan Kaisha | | 1,800 | | 22,519 |
| Toyota Industries | | 1,500 | | 34,362 |
| Toyota Motor | | 22,900 | | 904,227 |
| Toyota Tsusho | | 2,200 | | 21,054 |
| Trend Micro | | 1,000 | | 24,794 |
| Ube Industries | | 10,000 | | 20,756 |
| UNICHARM | | 500 | | 35,738 |
| UNY | | 3,000 | | 23,587 |
| West Japan Railway | | 15 | | 66,532 |
| Yahoo! Japan | | 138 | | 45,251 |
| Yakult Honsha | | 1,100 | | 27,810 |
| Yamada Denki | | 740 | | 40,166 |
| Yamaha | | 1,900 | | 18,310 |
| Yamaha Motor | | 1,800 | | 19,800 |
| Yamato Holdings | | 4,000 | | 44,065 |
| Yaskawa Electric | | 3,000 | | 13,098 |
| Yokogawa Electric | | 2,500 | | 11,548 |
| | | | | 15,416,829 |
| Luxembourg—.1% | | | | |
| ArcelorMittal | | 4,513 | | 114,769 |
| Millicom International Cellular | | 337 | | 12,149 |
| Reinet Investments | | 332 a | | 3,407 |
| SES | | 1,553 | | 27,649 |
| | | | | 157,974 |
| Netherlands—.0% | | | | |
| European Aeronautic Defence and Space | | 1,673 | | 27,452 |
| STMicroelectronics | | 3,509 | | 28,455 |
| | | | | 55,907 |
| New Zealand—.0% | | | | |
| Auckland International Airport | | 7,010 | | 7,429 |
| Fletcher Building | | 3,585 | | 11,991 |
The Fund 21
| STATEMENT OF INVESTMENTS (continued) |
| Common Stocks (continued) | | Shares | | Value ($) |
| |
| |
|
| New Zealand (continued) | | | | |
| Sky City Entertainment Group | | 3,565 | | 6,800 |
| Telecom Corp of New Zealand | | 11,134 | | 15,372 |
| | | | | 41,592 |
| Norway—.2% | | | | |
| Acergy | | 1,055 | | 6,942 |
| Aker Solutions | | 890 | | 4,819 |
| DNB NOR | | 3,966 | | 22,681 |
| Frontline | | 113 | | 3,458 |
| Norsk Hydro | | 3,826 | | 15,913 |
| Orkla | | 4,487 | | 29,659 |
| Petroleum Geo-Services | | 925 a | | 4,555 |
| Renewable Energy | | 600 a | | 5,606 |
| SeaDrill | | 1,512 | | 14,374 |
| StatoilHydro | | 6,946 | | 134,954 |
| Storebrand | | 2,069 | | 4,825 |
| Telenor | | 4,546 | | 26,943 |
| Yara International | | 1,026 | | 21,222 |
| | | | | 295,951 |
| Panama—.0% | | | | |
| McDermott International | | 1,366 a | | 23,400 |
| Portugal—.1% | | | | |
| Banco BPI | | 2,091 | | 4,295 |
| Banco Comercial Portugues, Cl. R | | 12,702 | | 14,706 |
| Banco Espirito Santo | | 1,218 | | 11,584 |
| Brisa | | 1,623 | | 12,385 |
| Energias de Portugal | | 9,893 | | 33,695 |
| Portugal Telecom | | 3,609 | | 23,536 |
| Sonae | | 4,870 | | 2,964 |
| Zon Multimedia Servicos de Telecomunicacoes | | 933 | | 4,731 |
| | | | | 107,896 |
| Singapore—.4% | | | | |
| Ascendas Real Estate Investment Trust | | 6,000 | | 6,468 |
| CapitaCommercial Trust | | 9,000 | | 6,095 |
| CapitaLand | | 10,000 | | 19,739 |
| CapitaMall Trust | | 7,000 | | 9,160 |
| City Developments | | 3,000 | | 13,047 |
| ComfortDelgro | | 10,000 | | 8,165 |
22
| Common Stocks (continued) | | Shares | | Value ($) |
| |
| |
|
| Singapore (continued) | | | | |
| DBS Group Holdings | | 7,000 | | 53,556 |
| Flextronics International | | 4,691 a | | 19,608 |
| Fraser and Neave | | 4,000 | | 7,488 |
| Golden Agri-Resources | | 16,000 | | 2,080 |
| Keppel | | 7,000 | | 21,550 |
| Keppel Land | | 2,000 | | 2,552 |
| Noble Group | | 5,000 | | 3,610 |
| Oversea-Chinese Banking | | 14,000 | | 46,927 |
| SembCorp Industries | | 6,000 | | 10,113 |
| SembCorp Marine | | 3,000 | | 3,656 |
| Singapore Airlines | | 2,866 | | 21,609 |
| Singapore Exchange | | 5,000 | | 17,582 |
| Singapore Press Holdings | | 9,000 | | 19,557 |
| Singapore Technologies Engineering | | 8,000 | | 12,656 |
| Singapore Telecommunications | | 43,000 | | 72,306 |
| United Overseas Bank | | 7,000 | | 62,306 |
| Venture | | 2,000 | | 7,268 |
| Wilmar International | | 3,000 | | 5,067 |
| | | | | 452,165 |
| Sweden—.7% | | | | |
| Alfa Laval | | 2,055 | | 14,435 |
| Assa Abloy, Cl. B | | 1,689 | | 18,527 |
| Atlas Copco, Cl. A | | 3,634 | | 29,606 |
| Atlas Copco, Cl. B | | 2,112 | | 15,445 |
| Boliden | | 2,093 | | 4,968 |
| Electrolux, Ser. B | | 1,377 | | 12,322 |
| Getinge, Cl. B | | 975 | | 13,447 |
| Hennes & Mauritz, Cl. B | | 2,766 | | 97,944 |
| Holmen, Cl. B | | 391 | | 10,936 |
| Husqvarna, Cl. B | | 1,474 | | 10,070 |
| Investor, Cl. B | | 2,186 | | 32,112 |
| Lundin Petroleum | | 1,191 a | | 5,547 |
| Modern Times Group, Cl. B | | 280 | | 5,927 |
| Nordea Bank | | 11,256 | | 88,090 |
| Sandvik | | 5,457 | | 34,656 |
| Scania, Cl. B | | 1,733 | | 13,896 |
| Securitas, Cl. B | | 1,694 | | 15,974 |
The Fund 23
| STATEMENT OF INVESTMENTS (continued) |
| Common Stocks (continued) | | Shares | | Value ($) |
| |
| |
|
| Sweden (continued) | | | | |
| Skandinaviska Enskilda Banken, Cl. A | | 2,511 | | 23,920 |
| Skanska, Cl. B | | 2,036 | | 17,501 |
| SKF, Cl. B | | 2,086 | | 18,667 |
| Ssab Svenskt Stal, Ser. A | | 977 | | 9,683 |
| Ssab Svenskt Stal, Ser. B | | 264 | | 2,354 |
| Svenska Cellulosa, Cl. B | | 3,324 | | 24,201 |
| Svenska Handelsbanken, Cl. A | | 2,508 | | 44,887 |
| Swedbank, Cl. A | | 1,732 | | 13,833 |
| Swedish Match | | 1,627 | | 22,074 |
| Tele2, Cl. B | | 1,650 | | 13,866 |
| Telefonaktiebolaget LM Ericsson, Cl. B | | 16,043 | | 111,147 |
| TeliaSonera | | 12,150 | | 52,687 |
| Volvo, Cl. B | | 5,888 | | 30,065 |
| | | | | 808,787 |
| Switzerland—2.5% | | | | |
| ABB | | 10,237 a | | 131,024 |
| Actelion | | 455 a | | 23,762 |
| Adecco | | 572 | | 19,657 |
| Aryzta | | 368 a | | 12,917 |
| Baloise Holding | | 239 | | 12,614 |
| Compagnie Financiere Richemont | | 2,429 | | 50,699 |
| Credit Suisse Group | | 4,868 | | 180,958 |
| EFG International | | 239 | | 5,074 |
| Geberit | | 185 | | 19,006 |
| Givaudan | | 30 | | 20,265 |
| Holcim | | 981 | | 55,221 |
| Julius Baer Holding | | 987 | | 38,042 |
| Kuehne & Nagel International | | 251 | | 15,010 |
| Lindt & Spruengli | | 4 | | 8,534 |
| Logitech International | | 802 a | | 11,865 |
| Lonza Group | | 223 | | 18,328 |
| Nestle | | 18,289 | | 704,597 |
| Nobel Biocare Holding | | 556 | | 9,430 |
| Novartis | | 11,070 | | 553,476 |
| OC Oerlikon | | 32 a | | 2,446 |
| Pargesa Holding | | 126 | | 9,547 |
| Roche Holding | | 3,269 | | 494,807 |
24
| Common Stocks (continued) | | Shares | | Value ($) |
| |
| |
|
| Switzerland (continued) | | | | |
| Schindler Holding | | 237 | | 10,145 |
| SGS | | 22 | | 21,453 |
| Sonova Holding | | 220 | | 9,041 |
| Straumann Holding | | 36 | | 6,041 |
| Sulzer | | 127 | | 7,394 |
| Swatch Group | | 385 | | 29,377 |
| Swiss Life Holding | | 163 a | | 14,513 |
| Swiss Reinsurance | | 1,637 | | 66,935 |
| Swisscom | | 106 | | 32,035 |
| Syngenta | | 484 | | 89,503 |
| Synthes | | 276 | | 35,278 |
| UBS | | 13,676 a | | 226,558 |
| Zurich Financial Services | | 677 | | 135,046 |
| | | | | 3,080,598 |
| United Kingdom—6.9% | | | | |
| 3i Group | | 1,837 | | 16,028 |
| AMEC | | 1,492 | | 12,463 |
| Anglo American | | 6,342 | | 156,985 |
| Antofagasta | | 2,075 | | 12,723 |
| Associated British Foods | | 1,875 | | 21,070 |
| AstraZeneca | | 6,989 | | 296,991 |
| Aviva | | 12,704 | | 75,537 |
| BAE Systems | | 16,843 | | 94,909 |
| Balfour Beatty | | 2,627 | | 10,569 |
| Barclays | | 39,053 | | 112,885 |
| Berkeley Group Holdings | | 359 a | | 4,321 |
| BG Group | | 16,056 | | 236,854 |
| BHP Billiton | | 10,587 | | 180,125 |
| BP | | 90,730 | | 743,610 |
| British Airways | | 3,499 | | 7,694 |
| British American Tobacco | | 8,301 | | 228,005 |
| British Energy Group | | 4,915 | | 58,766 |
| British Land | | 2,452 | | 24,405 |
| British Sky Broadcasting | | 5,387 | | 32,945 |
| BT Group | | 36,935 | | 68,689 |
| Bunzl | | 1,463 | | 14,727 |
| Burberry Group | | 1,918 | | 8,522 |
The Fund 25
| STATEMENT OF INVESTMENTS (continued) |
| Common Stocks (continued) | | Shares | | Value ($) |
| |
| |
|
| United Kingdom (continued) | | | | |
| Cable & Wireless | | 11,743 | | 23,319 |
| Cadbury | | 6,451 | | 59,204 |
| Cairn Energy | | 629 a | | 16,302 |
| Capita Group | | 2,897 | | 29,864 |
| Carnival | | 783 | | 17,142 |
| Carphone Warehouse Group | | 2,411 | | 5,220 |
| Centrica | | 17,593 | | 86,557 |
| Cobham | | 5,125 | | 15,568 |
| Compass Group | | 8,797 | | 40,900 |
| Daily Mail & General Trust, Cl. A | | 1,664 | | 7,824 |
| Diageo | | 12,230 | | 187,923 |
| Drax Group | | 1,671 | | 15,538 |
| Enterprise Inns | | 2,815 | | 4,412 |
| Eurasian Natural Resources | | 1,694 | | 8,464 |
| Experian | | 4,824 | | 26,618 |
| Firstgroup | | 2,308 | | 15,224 |
| Friends Provident | | 10,440 | | 11,808 |
| G4S | | 6,075 | | 18,375 |
| GKN | | 3,959 | | 7,596 |
| GlaxoSmithKline | | 26,278 | | 508,228 |
| Hammerson | | 1,387 | | 15,911 |
| Hays | | 8,012 | | 8,835 |
| HBOS | | 25,760 | | 41,330 |
| Home Retail Group | | 4,327 | | 13,755 |
| HSBC Holdings | | 57,827 | | 711,964 |
| ICAP | | 2,490 | | 12,351 |
| IMI | | 1,811 | | 8,047 |
| Imperial Tobacco Group | | 4,864 | | 130,852 |
| Inchcape | | 2,452 | | 3,130 |
| Intercontinental Hotels Group | | 1,164 | | 9,902 |
| International Power | | 7,129 | | 25,514 |
| Invensys | | 3,542 a | | 8,836 |
| Investec | | 2,269 | | 8,615 |
| ITV | | 17,384 | | 8,356 |
| J Sainsbury | | 5,502 | | 25,114 |
| Johnson Matthey | | 1,030 | | 15,510 |
| Kazakhmys | | 1,077 | | 4,968 |
26
| Common Stocks (continued) | | Shares | | Value ($) |
| |
| |
|
| United Kingdom (continued) | | | | |
| Kingfisher | | 12,828 | | 23,629 |
| Ladbrokes | | 3,362 | | 8,569 |
| Land Securities Group | | 2,235 | | 39,398 |
| Legal & General Group | | 28,608 | | 32,957 |
| Liberty International | | 1,214 | | 13,476 |
| Lloyds TSB Group | | 28,538 | | 91,206 |
| Logica | | 6,425 | | 7,137 |
| London Stock Exchange Group | | 865 | | 7,806 |
| Lonmin | | 738 | | 13,677 |
| Man Group | | 8,181 | | 47,058 |
| Marks & Spencer Group | | 7,596 | | 26,878 |
| Meggitt | | 2,864 | | 6,282 |
| Mitchells & Butlers | | 2,120 | | 5,352 |
| Mondi | | 2,125 | | 7,708 |
| National Express Group | | 730 | | 6,723 |
| National Grid | | 11,944 | | 135,765 |
| Next | | 887 | | 15,106 |
| Old Mutual | | 23,657 | | 19,150 |
| Pearson | | 3,827 | | 37,595 |
| Persimmon | | 1,395 | | 6,762 |
| Prudential | | 11,902 | | 60,576 |
| Reckitt Benckiser Group | | 2,896 | | 122,127 |
| Reed Elsevier | | 5,228 | | 46,037 |
| Rentokil Initial | | 10,046 | | 7,304 |
| Rexam | | 3,510 | | 21,168 |
| Rio Tinto | | 4,791 | | 221,703 |
| Rolls-Royce Group | | 8,656 a | | 45,629 |
| Royal Bank of Scotland Group | | 79,530 | | 86,738 |
| Royal Dutch Shell, Cl. A | | 17,039 | | 467,195 |
| Royal Dutch Shell, Cl. B | | 13,153 | | 352,569 |
| RSA Insurance Group | | 15,379 | | 34,167 |
| SABMiller | | 4,313 | | 68,537 |
| Sage Group | | 6,269 | | 17,523 |
| Schroders | | 705 | | 9,010 |
| Scottish & Southern Energy | | 4,155 | | 81,501 |
| Segro | | 1,931 | | 8,752 |
| Serco Group | | 2,152 | | 12,848 |
The Fund 27
| STATEMENT OF INVESTMENTS (continued) |
| Common Stocks (continued) | | Shares | | Value ($) |
| |
| |
|
| United Kingdom (continued) | | | | |
| Severn Trent | | 1,129 | | 24,991 |
| Shire | | 2,647 | | 35,028 |
| Smith & Nephew | | 4,205 | | 38,659 |
| Smiths Group | | 1,861 | | 24,010 |
| Stagecoach Group | | 2,979 | | 8,905 |
| Standard Chartered | | 6,804 | | 111,584 |
| Standard Life | | 10,301 | | 39,737 |
| Tate & Lyle | | 2,042 | | 12,150 |
| Tesco | | 37,665 | | 206,549 |
| Thomas Cook Group | | 2,826 | | 7,671 |
| Thomson Reuters | | 894 | | 15,499 |
| Tomkins | | 5,034 | | 9,313 |
| Tui Travel | | 3,200 | | 9,741 |
| Tullow Oil | | 3,407 | | 28,845 |
| Unilever | | 6,218 | | 140,252 |
| United Business Media | | 1,310 | | 8,504 |
| United Utilities Group | | 3,215 | | 36,336 |
| Vedanta Resources | | 758 | | 10,410 |
| Vodafone Group | | 256,008 | | 492,649 |
| Whitbread | | 780 | | 11,261 |
| William Hill | | 2,005 | | 6,188 |
| Willis Group Holdings | | 842 | | 22,094 |
| WM Morrison Supermarkets | | 11,458 | | 48,829 |
| Wolseley | | 3,172 | | 17,323 |
| WPP Group | | 5,288 | | 32,040 |
| Xstrata | | 3,039 | | 51,803 |
| | | | | 8,243,888 |
| United States—38.3% | | | | |
| 3M | | 3,558 | | 228,779 |
| Abbott Laboratories | | 8,215 | | 453,057 |
| Abercrombie & Fitch, Cl. A | | 400 | | 11,584 |
| Activision Blizzard | | 3,426 a | | 42,688 |
| Adobe Systems | | 2,819 a | | 75,098 |
| Advance Auto Parts | | 548 | | 17,097 |
| Advanced Micro Devices | | 3,524 a | | 12,334 |
| AES | | 3,485 a | | 27,775 |
| Aetna | | 2,568 | | 63,866 |
28
| Common Stocks (continued) | | Shares | | Value ($) |
| |
| |
|
| United States (continued) | | | | |
| Affiliated Computer Services, Cl. A | | 524 a | | 21,484 |
| Aflac | | 2,522 | | 111,674 |
| AGCO | | 436 a | | 13,742 |
| Agilent Technologies | | 1,927 a | | 42,760 |
| Air Products & Chemicals | | 1,115 | | 64,815 |
| AK Steel Holding | | 649 | | 9,034 |
| Akamai Technologies | | 1,064 a | | 15,300 |
| Alcoa | | 4,318 | | 49,700 |
| Allegheny Energy | | 842 | | 25,386 |
| Allegheny Technologies | | 406 | | 10,775 |
| Allergan | | 1,615 | | 64,067 |
| Alliance Data Systems | | 463 a | | 23,224 |
| Alliant Energy | | 643 | | 18,891 |
| Allied Capital | | 1,230 | | 8,979 |
| Allstate | | 2,776 | | 73,258 |
| Alpha Natural Resources | | 432 a | | 15,452 |
| Altera | | 1,774 | | 30,779 |
| Altria Group | | 11,134 | | 213,661 |
| Amazon.com | | 1,661 a | | 95,075 |
| AMB Property | | 470 | | 11,294 |
| Ameren | | 1,085 | | 35,208 |
| American Capital | | 996 | | 13,993 |
| American Eagle Outfitters | | 1,109 | | 12,332 |
| American Electric Power | | 2,125 | | 69,338 |
| American Express | | 5,540 | | 152,350 |
| American International Group | | 12,026 | | 22,969 |
| American Tower, Cl. A | | 2,098 a | | 67,786 |
| Ameriprise Financial | | 1,154 | | 24,926 |
| AmerisourceBergen | | 936 | | 29,268 |
| Amgen | | 5,792 a | | 346,883 |
| Amphenol, Cl. A | | 887 | | 25,412 |
| Amylin Pharmaceuticals | | 787 a | | 8,035 |
| Anadarko Petroleum | | 2,483 | | 87,650 |
| Analog Devices | | 1,503 | | 32,104 |
| Anheuser-Busch | | 3,791 | | 235,155 |
| Annaly Capital Management | | 2,738 | | 38,058 |
| AON | | 1,420 | | 60,066 |
The Fund 29
| STATEMENT OF INVESTMENTS (continued) |
| Common Stocks (continued) | | Shares | | Value ($) |
| |
| |
|
| United States (continued) | | | | |
| Apache | | 1,772 | | 145,888 |
| Apartment Investment & Management, Cl. A | | 589 | | 8,617 |
| Apollo Group, Cl. A | | 750 a | | 52,132 |
| Apple | | 4,694 a | | 505,027 |
| Applied Biosystems | | 953 | | 29,381 |
| Applied Materials | | 7,177 | | 92,655 |
| Aqua America | | 747 | | 13,446 |
| Arch Coal | | 852 | | 18,241 |
| Archer-Daniels-Midland | | 3,062 | | 63,475 |
| Arrow Electronics | | 713 a | | 12,442 |
| Associated Banc-Corp | | 551 | | 12,155 |
| Assurant | | 556 | | 14,167 |
| AT & T | | 31,644 | | 847,110 |
| Autodesk | | 1,157 a | | 24,655 |
| Automatic Data Processing | | 2,750 | | 96,112 |
| AutoZone | | 251 a | | 31,949 |
| AvalonBay Communities | | 448 | | 31,817 |
| Avery Dennison | | 561 | | 19,646 |
| Avnet | | 710 a | | 11,885 |
| Avon Products | | 2,260 | | 56,116 |
| Baker Hughes | | 1,633 | | 57,073 |
| Ball | | 544 | | 18,605 |
| Bank of America | | 26,101 | | 630,861 |
| Barr Pharmaceuticals | | 597 a | | 38,363 |
| Baxter International | | 3,336 | | 201,794 |
| BB & T | | 2,896 | | 103,821 |
| Beckman Coulter | | 366 | | 18,271 |
| Becton, Dickinson & Co. | | 1,294 | | 89,804 |
| Bed Bath & Beyond | | 1,345 a | | 34,661 |
| Berkshire Hathaway, Cl. B | | 52 a | | 199,680 |
| Best Buy | | 1,851 | | 49,625 |
| Biogen Idec | | 1,536 a | | 65,357 |
| BJ Services | | 1,637 | | 21,035 |
| Black & Decker | | 321 | | 16,249 |
| BMC Software | | 1,113 a | | 28,737 |
| Boeing | | 3,795 | | 198,365 |
| BorgWarner | | 550 | | 12,359 |
30
| Common Stocks (continued) | | Shares | | Value ($) |
| |
| |
|
| United States (continued) | | | | |
| Boston Properties | | 632 | | 44,796 |
| Boston Scientific | | 7,131 a | | 64,393 |
| Bristol-Myers Squibb | | 10,523 | | 216,248 |
| Broadcom, Cl. A | | 2,315 a | | 39,540 |
| Brown-Forman, Cl. B | | 355 | | 16,117 |
| Bunge | | 630 | | 24,198 |
| Burlington Northern Santa Fe | | 1,832 | | 163,158 |
| C.H. Robinson Worldwide | | 887 | | 45,929 |
| C.R. Bard | | 523 | | 46,155 |
| CA | | 2,044 | | 36,383 |
| Cablevision Systems (NY Group), Cl. A | | 1,167 | | 20,691 |
| Cabot Oil & Gas | | 457 | | 12,828 |
| Cadence Design Systems | | 1,594 a | | 6,488 |
| Camden Property Trust | | 298 | | 10,046 |
| Cameron International | | 1,125 a | | 27,293 |
| Campbell Soup | | 1,221 | | 46,337 |
| Capital One Financial | | 1,988 | | 77,771 |
| Cardinal Health | | 1,891 | | 72,236 |
| Carmax | | 1,273 a | | 13,519 |
| Carnival | | 2,312 | | 58,725 |
| Caterpillar | | 3,269 | | 124,778 |
| CB Richard Ellis Group, Cl. A | | 780 a | | 5,468 |
| CBS, Cl. B | | 3,114 | | 30,237 |
| Celanese, Ser. A | | 873 | | 12,100 |
| Celgene | | 2,313 a | | 148,633 |
| CenterPoint Energy | | 1,828 | | 21,059 |
| Centex | | 516 | | 6,321 |
| Cephalon | | 337 a | | 24,170 |
| CF Industries Holdings | | 298 | | 19,129 |
| Charles River Laboratories International | | 398 a | | 14,260 |
| Charles Schwab | | 5,169 | | 98,831 |
| Chesapeake Energy | | 2,719 | | 59,736 |
| Chevron | | 11,017 | | 821,868 |
| Chubb | | 1,936 | | 100,324 |
| CIGNA | | 1,481 | | 24,140 |
| Cimarex Energy | | 487 | | 19,704 |
| Cincinnati Financial | | 742 | | 19,285 |
The Fund 31
| STATEMENT OF INVESTMENTS (continued) |
| Common Stocks (continued) | | Shares | | Value ($) |
| |
| |
|
| United States (continued) | | | | |
| Cintas | | 804 | | 19,055 |
| Cisco Systems | | 31,458 a | | 559,009 |
| Citigroup | | 27,949 | | 381,504 |
| Citrix Systems | | 885 a | | 22,806 |
| Cliffs Natural Resources | | 441 | | 11,903 |
| Clorox | | 795 | | 48,344 |
| CME Group | | 321 | | 90,570 |
| Coach | | 1,773 a | | 36,524 |
| Coca-Cola | | 11,131 | | 490,432 |
| Coca-Cola Enterprises | | 1,491 | | 14,985 |
| Cognizant Technology Solutions, Cl. A | | 1,728 a | | 33,178 |
| Colgate-Palmolive | | 2,699 | | 169,389 |
| Comcast, Cl. A | | 10,279 | | 161,997 |
| Comcast, Cl. A (Special) | | 4,849 | | 74,772 |
| Comerica | | 796 | | 21,962 |
| Computer Sciences | | 758 a | | 22,861 |
| ConAgra Foods | | 2,571 | | 44,787 |
| ConocoPhillips | | 7,802 | | 405,860 |
| Consol Energy | | 948 | | 29,758 |
| Consolidated Edison | | 1,440 | | 62,381 |
| Constellation Brands, Cl. A | | 1,113 a | | 13,957 |
| Constellation Energy Group | | 1,078 | | 26,098 |
| Cooper Industries, Cl. A | | 1,025 | | 31,723 |
| Corning | | 8,357 | | 90,506 |
| Costco Wholesale | | 2,300 | | 131,123 |
| Covance | | 375 a | | 18,750 |
| Coventry Health Care | | 833 a | | 10,987 |
| Crown Castle International | | 1,390 a | | 29,426 |
| CSX | | 2,147 | | 98,161 |
| Cummins | | 1,002 | | 25,902 |
| CVS Caremark | | 7,601 | | 232,971 |
| D.R. Horton | | 1,484 | | 10,952 |
| Danaher | | 1,350 | | 79,974 |
| Darden Restaurants | | 796 | | 17,647 |
| DaVita | | 581 a | | 32,972 |
| Dean Foods | | 714 a | | 15,608 |
| Deere & Co. | | 2,286 | | 88,148 |
32
| Common Stocks (continued) | | Shares | | Value ($) |
| |
| |
|
| United States (continued) | | | | |
| Dell | | 9,658 a | | 117,345 |
| Denbury Resources | | 1,447 a | | 18,391 |
| Dentsply International | | 816 | | 24,790 |
| Developers Diversified Realty | | 559 | | 7,362 |
| Devon Energy | | 2,253 | | 182,178 |
| Diamond Offshore Drilling | | 397 | | 35,254 |
| DIRECTV Group | | 3,641 a | | 79,701 |
| Discover Financial Services | | 2,218 | | 27,171 |
| Discovery Communications, Ser. A | | 912 a | | 12,440 |
| Discovery Communications, Ser. C | | 912 a | | 12,148 |
| DISH Network, Cl. A | | 1,014 a | | 15,960 |
| Dominion Resources | | 3,068 | | 111,307 |
| Domtar | | 2,653 a | | 6,579 |
| Dover | | 981 | | 31,166 |
| Dow Chemical | | 4,941 | | 131,776 |
| Dr. Pepper Snapple Group | | 1,447 a | | 33,136 |
| DST Systems | | 275 a | | 11,160 |
| DTE Energy | | 937 | | 33,076 |
| Duke Energy | | 6,709 | | 109,893 |
| Duke Realty | | 690 | | 9,736 |
| Dun & Bradstreet | | 333 | | 24,539 |
| Dynergy, Cl. A | | 3,343 a | | 12,169 |
| E.I. du Pont de Nemours & Co. | | 4,786 | | 153,152 |
| Eastman Chemical | | 405 | | 16,358 |
| Eastman Kodak | | 1,384 | | 12,705 |
| Eaton | | 823 | | 36,706 |
| eBay | | 5,936 a | | 90,643 |
| Ecolab | | 1,070 | | 39,868 |
| Edison International | | 1,636 | | 58,225 |
| El Paso | | 3,646 | | 35,366 |
| Electronic Arts | | 1,682 a | | 38,316 |
| Eli Lilly & Co. | | 5,442 | | 184,048 |
| Embarq | | 824 | | 24,720 |
| EMC | | 10,970 a | | 129,227 |
| Emerson Electric | | 4,147 | | 135,731 |
| Energen | | 311 | | 10,440 |
| Energizer Holdings | | 318 a | | 15,537 |
The Fund 33
| STATEMENT OF INVESTMENTS (continued) |
| Common Stocks (continued) | | Shares | | Value ($) |
| |
| |
|
| United States (continued) | | | | |
| ENSCO International | | 857 | | 32,575 |
| Entergy | | 1,015 | | 79,221 |
| EOG Resources | | 1,317 | | 106,572 |
| Equifax | | 695 | | 18,126 |
| Equitable Resources | | 603 | | 20,930 |
| Equity Residential | | 1,429 | | 49,915 |
| Estee Lauder, Cl. A | | 571 | | 20,579 |
| Exelon | | 3,487 | | 189,135 |
| Expedia | | 1,279 a | | 12,163 |
| Expeditors International Washington | | 1,267 | | 41,368 |
| Express Scripts | | 1,130 a | | 68,489 |
| Exterran Holdings | | 413 a | | 9,255 |
| Exxon Mobil | | 28,086 | | 2,081,734 |
| Family Dollar Stores | | 759 | | 20,425 |
| Fastenal | | 723 | | 29,108 |
| Federal National Mortgage Association | | 6,470 b | | 5,998 |
| Federal Realty Investment Trust | | 314 | | 19,239 |
| FedEx | | 1,563 | | 102,173 |
| Fidelity National Financial, Cl. A | | 1,023 | | 9,217 |
| Fidelity National Information Services | | 919 | | 13,868 |
| Fifth Third Bancorp | | 2,546 | | 27,624 |
| First American | | 368 | | 7,511 |
| First Solar | | 237 a | | 34,057 |
| FirstEnergy | | 1,617 | | 84,343 |
| Fiserv | | 850 a | | 28,356 |
| Flowserve | | 333 | | 18,954 |
| Fluor | | 924 | | 36,895 |
| FMC Technologies | | 772 a | | 27,012 |
| Ford Motor | | 9,989 a | | 21,876 |
| Forest City Enterprises, Cl. A | | 261 | | 3,103 |
| Forest Laboratories | | 1,583 a | | 36,773 |
| Forest Oil | | 403 a | | 11,772 |
| Fortune Brands | | 800 | | 30,512 |
| Foster Wheeler | | 870 a | | 23,838 |
| FPL Group | | 2,055 | | 97,078 |
| Franklin Resources | | 875 | | 59,500 |
| Freddie Mac | | 3,913 b | | 4,030 |
34
| Common Stocks (continued) | | Shares | | Value ($) |
| |
| |
|
| United States (continued) | | | | |
| Freeport-McMoRan Copper & Gold | | 2,032 | | 59,131 |
| GameStop, Cl. A | | 771 a | | 21,118 |
| Gannett | | 1,090 | | 11,990 |
| Gap | | 2,708 | | 35,042 |
| Genentech | | 2,514 a | | 208,511 |
| General Dynamics | | 1,797 | | 108,395 |
| General Electric | | 55,841 | | 1,089,458 |
| General Growth Properties | | 1,302 | | 5,390 |
| General Mills | | 1,778 | | 120,442 |
| General Motors | | 2,189 | | 12,652 |
| Genuine Parts | | 971 | | 38,209 |
| Genworth Financial, Cl. A | | 2,569 | | 12,434 |
| Genzyme | | 1,418 a | | 103,344 |
| Gilead Sciences | | 4,903 a | | 224,803 |
| Goldman Sachs Group | | 2,079 | | 192,308 |
| Goodrich | | 766 | | 28,005 |
| Goodyear Tire & Rubber | | 1,201 a | | 10,713 |
| Google, Cl. A | | 1,271 a | | 456,747 |
| H & R Block | | 1,869 | | 36,857 |
| H.J. Heinz | | 1,669 | | 73,136 |
| Halliburton | | 4,631 | | 91,647 |
| Hansen Natural | | 322 a | | 8,153 |
| Harley-Davidson | | 1,247 | | 30,527 |
| Harris | | 675 | | 24,266 |
| Harsco | | 495 | | 11,717 |
| Hartford Financial Services Group | | 1,666 | | 17,193 |
| Hasbro | | 677 | | 19,680 |
| HCP | | 1,440 | | 43,099 |
| Health Net | | 635 a | | 8,179 |
| Helmerich & Payne | | 502 | | 17,224 |
| Henry Schein | | 495 a | | 23,171 |
| Hershey | | 880 | | 32,771 |
| Hertz Global Holdings | | 1,100 a | | 7,909 |
| Hess | | 1,542 | | 92,844 |
| Hewlett-Packard | | 13,127 | | 502,502 |
| Hologic | | 1,564 a | | 19,143 |
| Home Depot | | 8,985 | | 211,956 |
The Fund 35
| STATEMENT OF INVESTMENTS (continued) |
| Common Stocks (continued) | | Shares | | Value ($) |
| |
| |
|
| United States (continued) | | | | |
| Honeywell International | | 3,740 | | 113,883 |
| Hormel Foods | | 355 | | 10,032 |
| Hospira | | 798 a | | 22,200 |
| Host Hotels & Resorts | | 2,944 | | 30,441 |
| Hudson City Bancorp | | 2,331 | | 43,846 |
| Humana | | 875 a | | 25,891 |
| Huntington Bancshares | | 1,745 | | 16,490 |
| Huntsman | | 637 | | 6,434 |
| Illinois Tool Works | | 2,216 | | 73,992 |
| IMS Health | | 944 | | 13,537 |
| Intel | | 30,496 | | 487,936 |
| IntercontinentalExchange | | 271 a | | 23,187 |
| International Business Machines | | 7,315 | | 680,076 |
| International Flavors & Fragrances | | 417 | | 13,294 |
| International Game Technology | | 1,536 | | 21,504 |
| International Paper | | 2,144 | | 36,920 |
| Interpublic Group of Cos. | | 2,211 a | | 11,475 |
| Intersil, Cl. A | | 730 | | 9,994 |
| Intuit | | 1,607 a | | 40,271 |
| Intuitive Surgical | | 225 a | | 38,878 |
| Invitrogen | | 545 a | | 15,691 |
| Iron Mountain | | 938 a | | 22,775 |
| ITT | | 910 | | 40,495 |
| J.C. Penney | | 1,246 | | 29,804 |
| Jacobs Engineering Group | | 732 a | | 26,667 |
| Janus Capital Group | | 764 | | 8,969 |
| JDS Uniphase | | 1,212 a | | 6,618 |
| Johnson & Johnson | | 15,012 | | 920,836 |
| Johnson Controls | | 3,144 | | 55,743 |
| Joy Global | | 642 | | 18,605 |
| JPMorgan Chase & Co. | | 19,621 | | 809,366 |
| Juniper Networks | | 2,772 a | | 51,947 |
| KBR | | 971 | | 14,410 |
| Kellogg | | 1,403 | | 70,739 |
| KeyCorp | | 2,842 | | 34,758 |
| Kimberly-Clark | | 2,221 | | 136,125 |
| Kimco Realty | | 1,318 | | 29,760 |
36
| Common Stocks (continued) | | Shares | | Value ($) |
| |
| |
|
| United States (continued) | | | | |
| KLA-Tencor | | 844 | | 19,623 |
| Kohl’s | | 1,552 a | | 54,522 |
| Kraft Foods, Cl. A | | 7,739 | | 225,514 |
| Kroger | | 3,324 | | 91,277 |
| L-3 Communications Holdings | | 648 | | 52,598 |
| Laboratory Corp. of America Holdings | | 654 a | | 40,214 |
| Lam Research | | 594 a | | 13,282 |
| Lamar Advertising, Cl. A | | 425 a | | 6,447 |
| Las Vegas Sands | | 551 a | | 7,819 |
| Legg Mason | | 690 | | 15,311 |
| Leggett & Platt | | 962 | | 16,700 |
| Lennar, Cl. A | | 532 | | 4,118 |
| Leucadia National | | 1,012 | | 27,162 |
| Level 3 Communications | | 8,752 a | | 9,190 |
| Lexmark International, Cl. A | | 547 a | | 14,129 |
| Liberty Global, Cl. A | | 1,009 a | | 16,638 |
| Liberty Global, Ser. C | | 745 a | | 12,039 |
| Liberty Media-Entertainment, Ser. A | | 2,604 a | | 41,924 |
| Liberty Media-Interactive, Cl. A | | 2,918 a | | 14,240 |
| Liberty Property Trust | | 477 | | 11,376 |
| Limited Brands | | 1,817 | | 21,768 |
| Lincoln National | | 1,369 | | 23,602 |
| Linear Technology | | 1,283 | | 29,098 |
| Lockheed Martin | | 1,830 | | 155,642 |
| Loews | | 1,729 | | 57,420 |
| Lorillard | | 919 | | 60,525 |
| Lowe’s Cos. | | 7,768 | | 168,566 |
| LSI | | 3,346 a | | 12,882 |
| M & T Bank | | 374 | | 30,331 |
| Macerich | | 349 | | 10,268 |
| Macy’s | | 2,494 | | 30,651 |
| Manitowoc | | 764 | | 7,518 |
| Manpower | | 411 | | 12,794 |
| Marathon Oil | | 3,758 | | 109,358 |
| Marriott International, Cl. A | | 1,462 | | 30,512 |
| Marsh & McLennan Cos. | | 2,709 | | 79,428 |
| Marshall & Ilsley | | 1,137 | | 20,500 |
The Fund 37
| STATEMENT OF INVESTMENTS (continued) |
| Common Stocks (continued) | | Shares | | Value ($) |
| |
| |
|
| United States (continued) | | | | |
| Martin Marietta Materials | | 242 | | 18,968 |
| Masco | | 2,121 | | 21,528 |
| MasterCard, Cl. A | | 387 | | 57,206 |
| Mattel | | 2,087 | | 31,347 |
| McAfee | | 926 a | | 30,141 |
| McCormick & Co. | | 672 | | 22,620 |
| McDonald’s | | 6,032 | | 349,434 |
| McGraw-Hill | | 1,694 | | 45,467 |
| McKesson | | 1,468 | | 54,008 |
| MDU Resources Group | | 854 | | 15,551 |
| MeadWestvaco | | 933 | | 13,090 |
| Medco Health Solutions | | 2,687 a | | 101,972 |
| Medtronic | | 5,974 | | 240,931 |
| MEMC Electronic Materials | | 1,142 a | | 20,990 |
| Merck & Co. | | 11,422 | | 353,511 |
| Merrill Lynch & Co. | | 8,278 | | 153,888 |
| MetLife | | 4,158 | | 138,129 |
| Metropcs Communications | | 966 a | | 13,273 |
| MGM MIRAGE | | 590 a | | 9,711 |
| Microchip Technology | | 1,087 | | 26,773 |
| Micron Technology | | 3,512 a | | 16,542 |
| Microsoft | | 44,651 | | 997,057 |
| Millipore | | 316 a | | 16,397 |
| Mirant | | 1,268 a | | 22,215 |
| Mohawk Industries | | 306 a | | 14,804 |
| Molson Coors Brewing, Cl. B | | 631 | | 23,574 |
| Monsanto | | 2,919 | | 259,733 |
| Monster Worldwide | | 520 a | | 7,405 |
| Moody’s | | 1,074 | | 27,494 |
| Morgan Stanley | | 5,285 | | 92,329 |
| Mosaic | | 819 | | 32,277 |
| Motorola | | 11,938 | | 64,107 |
| Murphy Oil | | 953 | | 48,260 |
| Nasdaq OMX Group | | 679 a | | 22,040 |
| National City | | 4,141 | | 11,181 |
| National Oilwell Varco | | 2,201 a | | 65,788 |
| National Semiconductor | | 1,287 | | 16,950 |
38
| Common Stocks (continued) | | Shares | | Value ($) |
| |
| |
|
| United States (continued) | | | | |
| Nationwide Financial Services, Cl. A | | 200 | | 9,462 |
| NetApp | | 2,036 a | | 27,547 |
| New York Community Bancorp | | 1,965 | | 30,772 |
| Newell Rubbermaid | | 1,529 | | 21,024 |
| Newfield Exploration | | 629 a | | 14,454 |
| Newmont Mining | | 2,313 | | 60,924 |
| News, Cl. A | | 9,646 | | 102,633 |
| News, Cl. B | | 2,494 | | 26,486 |
| NII Holdings | | 989 a | | 25,477 |
| NIKE, Cl. B | | 1,955 | | 112,667 |
| NiSource | | 1,607 | | 20,827 |
| Noble | | 1,419 | | 45,706 |
| Noble Energy | | 907 | | 47,001 |
| Nordstrom | | 928 | | 16,788 |
| Norfolk Southern | | 1,995 | | 119,580 |
| Northern Trust | | 1,048 | | 59,013 |
| Northrop Grumman | | 1,723 | | 80,791 |
| NRG Energy | | 1,114 a | | 25,901 |
| Nucor | | 1,656 | | 67,085 |
| NVIDIA | | 3,190 a | | 27,944 |
| NYSE Euronext | | 690 | | 20,824 |
| Occidental Petroleum | | 4,366 | | 242,488 |
| Office Depot | | 1,821 a | | 6,556 |
| Old Republic International | | 1,056 | | 9,726 |
| Omnicom Group | | 1,692 | | 49,982 |
| ONEOK | | 462 | | 14,738 |
| Oracle | | 21,936 a | | 401,209 |
| Owens-Illinois | | 823 a | | 18,830 |
| Paccar | | 1,834 | | 53,626 |
| Pactiv | | 673 a | | 15,856 |
| Pall | | 719 | | 18,989 |
| Parker Hannifin | | 872 | | 33,807 |
| Patterson Cos. | | 526 a | | 13,324 |
| Patterson-UTI Energy | | 904 | | 11,996 |
| Paychex | | 1,712 | | 48,860 |
| Peabody Energy | | 1,434 | | 49,487 |
| Pentair | | 544 | | 15,036 |
The Fund 39
| STATEMENT OF INVESTMENTS (continued) |
| Common Stocks (continued) | | Shares | | Value ($) |
| |
| |
|
| United States (continued) | | | | |
| People’s United Financial | | 1,907 | | 33,373 |
| Pepco Holdings | | 1,138 | | 23,500 |
| Pepsi Bottling Group | | 688 | | 15,907 |
| PepsiCo | | 8,445 | | 481,449 |
| PetroHawk Energy | | 1,341 a | | 25,412 |
| PetSmart | | 735 | | 14,472 |
| Pfizer | | 36,025 | | 638,003 |
| PG & E | | 1,919 | | 70,370 |
| Pharmaceutical Product Development | | 527 | | 16,326 |
| Philip Morris International | | 11,230 | | 488,168 |
| Pinnacle West Capital | | 520 | | 16,458 |
| Pioneer Natural Resources | | 707 | | 19,676 |
| Pitney Bowes | | 1,071 | | 26,539 |
| Plains Exploration & Production | | 657 a | | 18,527 |
| Plum Creek Timber | | 1,000 | | 37,280 |
| PNC Financial Services Group | | 1,835 | | 122,339 |
| Polo Ralph Lauren | | 340 | | 16,038 |
| PPG Industries | | 866 | | 42,936 |
| PPL | | 1,973 | | 64,754 |
| Praxair | | 1,661 | | 108,214 |
| Precision Castparts | | 735 | | 47,635 |
| Priceline.com | | 162 a | | 8,526 |
| Pride International | | 827 a | | 15,539 |
| Principal Financial Group | | 1,366 | | 25,940 |
| Procter & Gamble | | 16,263 | | 1,049,614 |
| Progress Energy | | 1,310 | | 51,575 |
| Progressive | | 3,395 | | 48,447 |
| ProLogis | | 1,382 | | 19,348 |
| Prudential Financial | | 2,305 | | 69,150 |
| Public Service Enterprise Group | | 2,693 | | 75,808 |
| Public Storage | | 670 | | 54,605 |
| Pulte Homes | | 1,127 | | 12,555 |
| QUALCOMM | | 8,613 | | 329,533 |
| Quest Diagnostics | | 957 | | 44,788 |
| Questar | | 1,043 | | 35,942 |
| Quicksilver Resources | | 707 a | | 7,402 |
| Qwest Communications International | | 7,787 | | 22,271 |
40
| Common Stocks (continued) | | Shares | | Value ($) |
| |
| |
|
| United States (continued) | | | | |
| R.R. Donnelley & Sons | | 1,238 | | 20,514 |
| Range Resources | | 891 | | 37,618 |
| Raytheon | | 2,244 | | 114,691 |
| Regency Centers | | 407 | | 16,060 |
| Regions Financial | | 3,471 | | 38,493 |
| Reliant Energy | | 1,627 a | | 8,542 |
| Republic Services | | 1,010 | | 23,937 |
| Reynolds American | | 933 | | 45,680 |
| Robert Half International | | 873 | | 16,474 |
| Rockwell Automation | | 833 | | 23,049 |
| Rockwell Collins | | 833 | | 31,013 |
| Rohm & Haas | | 671 | | 47,205 |
| Roper Industries | | 522 | | 23,673 |
| Ross Stores | | 795 | | 25,989 |
| Rowan | | 653 | | 11,845 |
| Royal Caribbean Cruises | | 627 | | 8,502 |
| Safeway | | 2,311 | | 49,155 |
| Salesforce.com | | 596 a | | 18,452 |
| SanDisk | | 1,082 a | | 9,619 |
| SandRidge Energy | | 434 | | 4,644 |
| Sara Lee | | 3,721 | | 41,601 |
| SCANA | | 647 | | 21,293 |
| Schering-Plough | | 8,611 | | 124,773 |
| Schlumberger | | 6,352 | | 328,081 |
| Scripps Networks Interactive, Cl. A | | 418 | | 11,871 |
| Sealed Air | | 935 | | 15,820 |
| Sears Holdings | | 415 a | | 23,962 |
| SEI Investments | | 782 | | 13,826 |
| Sempra Energy | | 1,257 | | 53,536 |
| Sherwin-Williams | | 594 | | 33,805 |
| Sigma-Aldrich | | 749 | | 32,851 |
| Simon Property Group | | 1,192 | | 79,900 |
| Sirius XM Radio | | 18,448 a | | 6,235 |
| SL Green Realty | | 277 | | 11,645 |
| SLM | | 2,777 a | | 29,631 |
| Smith International | | 1,156 | | 39,859 |
| Southern | | 4,074 | | 139,901 |
The Fund 41
| STATEMENT OF INVESTMENTS (continued) |
| Common Stocks (continued) | | Shares | | Value ($) |
| |
| |
|
| United States (continued) | | | | |
| Southwest Airlines | | 1,006 | | 11,851 |
| Southwestern Energy | | 1,803 a | | 64,223 |
| Sovereign Bancorp | | 2,913 a | | 8,448 |
| Spectra Energy | | 3,350 | | 64,756 |
| Sprint Nextel | | 14,706 | | 46,030 |
| SPX | | 302 | | 11,699 |
| St. Jude Medical | | 1,793 a | | 68,188 |
| Stanley Works | | 405 | | 13,260 |
| Staples | | 3,717 | | 72,221 |
| Starbucks | | 3,841 a | | 50,432 |
| Starwood Hotels & Resorts Worldwide | | 1,116 | | 25,155 |
| State Street | | 2,262 | | 98,058 |
| Steel Dynamics | | 720 | | 8,582 |
| Stryker | | 1,527 | | 81,633 |
| Sun Microsystems | | 4,714 a | | 21,684 |
| Sunoco | | 644 | | 19,642 |
| SunPower, Cl. A | | 213 a | | 8,320 |
| SunPower, Cl. B | | 252 a | | 7,462 |
| SunTrust Banks | | 1,764 | | 70,807 |
| SUPERVALU | | 1,048 | | 14,924 |
| Symantec | | 4,449 a | | 55,968 |
| Synopsys | | 831 a | | 15,191 |
| SYSCO | | 3,183 | | 83,395 |
| T. Rowe Price Group | | 1,304 | | 51,560 |
| Target | | 3,981 | | 159,718 |
| TD Ameritrade Holding | | 1,230 a | | 16,347 |
| Telephone & Data Systems | | 299 | | 8,028 |
| Teradata | | 839 a | | 12,912 |
| Terex | | 587 a | | 9,797 |
| Tesoro | | 927 | | 8,964 |
| Texas Instruments | | 7,025 | | 137,409 |
| Textron | | 1,288 | | 22,798 |
| Thermo Fisher Scientific | | 2,219 a | | 90,091 |
| Tiffany & Co. | | 692 | | 18,995 |
| Time Warner | | 19,029 | | 192,003 |
| Time Warner Cable, Cl. A | | 938 a | | 18,366 |
| TJX Cos. | | 2,246 | | 60,103 |
42
| Common Stocks (continued) | | Shares | | Value ($) |
| |
| |
|
| United States (continued) | | | | |
| Toll Brothers | | 688 a | | 15,907 |
| Torchmark | | 544 | | 22,723 |
| Total System Services | | 755 | | 10,374 |
| Travelers Cos. | | 3,208 | | 136,500 |
| Tyson Foods, Cl. A | | 1,824 | | 15,942 |
| U.S. Bancorp | | 9,260 | | 276,041 |
| UDR | | 640 | | 12,646 |
| Ultra Petroleum | | 794 a | | 36,961 |
| Union Pacific | | 2,632 | | 175,739 |
| United Parcel Service, Cl. B | | 3,646 | | 192,436 |
| United States Steel | | 612 | | 22,571 |
| United Technologies | | 4,918 | | 270,293 |
| UnitedHealth Group | | 6,523 | | 154,791 |
| Unum Group | | 1,801 | | 28,366 |
| Urban Outfitters | | 564 a | | 12,261 |
| UST | | 780 | | 52,720 |
| Valero Energy | | 2,799 | | 57,603 |
| Varian Medical Systems | | 651 a | | 29,627 |
| Ventas | | 795 | | 28,668 |
| VeriSign | | 958 a | | 20,310 |
| Verizon Communications | | 15,175 | | 450,242 |
| Vertex Pharmaceuticals | | 736 a | | 19,291 |
| VF | | 500 | | 27,550 |
| Viacom, Cl. B | | 2,890 a | | 58,436 |
| Virgin Media | | 1,855 | | 10,685 |
| Visa, Cl. A | | 2,378 | | 131,622 |
| VMware, Cl. A | | 204 a | | 6,324 |
| Vornado Realty Trust | | 731 | | 51,572 |
| Vulcan Materials | | 630 | | 34,196 |
| W.R. Berkley | | 713 | | 18,731 |
| W.W. Grainger | | 384 | | 30,171 |
| Wachovia | | 10,682 | | 68,472 |
| Wal-Mart Stores | | 12,630 | | 704,880 |
| Walgreen | | 5,261 | | 133,945 |
| Walt Disney | | 9,628 | | 249,365 |
| Washington Post, Cl. B | | 36 | | 15,365 |
| Waste Management | | 2,598 | | 81,136 |
The Fund 43
| STATEMENT OF INVESTMENTS (continued) |
| Common Stocks (continued) | | Shares | | Value ($) |
| |
| |
|
| United States (continued) | | | | |
| Waters | | 556 a | | 24,353 |
| WellPoint | | 2,792 a | | 108,525 |
| Wells Fargo & Co. | | 16,706 | | 568,839 |
| Western Digital | | 1,315 a | | 21,698 |
| Western Union | | 3,921 | | 59,834 |
| Weyerhaeuser | | 1,117 | | 42,692 |
| Whirlpool | | 419 | | 19,546 |
| White Mountains Insurance Group | | 38 | | 13,091 |
| Whole Foods Market | | 635 | | 6,807 |
| Williams | | 3,090 | | 64,797 |
| Williams-Sonoma | | 504 | | 4,173 |
| Windstream | | 2,456 | | 18,445 |
| Wisconsin Energy | | 689 | | 29,972 |
| Wyeth | | 7,091 | | 228,188 |
| Wyndham Worldwide | | 1,032 | | 8,452 |
| Wynn Resorts | | 314 | | 18,966 |
| Xcel Energy | | 2,488 | | 43,341 |
| Xerox | | 4,742 | | 38,031 |
| Xilinx | | 1,413 | | 26,027 |
| XTO Energy | | 2,916 | | 104,830 |
| Yahoo! | | 6,946 a | | 89,048 |
| Yum! Brands | | 2,508 | | 72,757 |
| Zimmer Holdings | | 1,225 a | | 56,877 |
| Zions Bancorporation | | 507 | | 19,322 |
| | | | | 46,613,861 |
| Total Common Stocks | | | | |
| (cost $123,390,500) | | | | 82,132,944 |
| |
| |
|
| | | Principal | | |
| Short-Term Investments—18.7% | | Amount ($) | | Value ($) |
| |
| |
|
| U.S. Government Agencies—8.2% | | | | |
| Federal Home Loan Mortgage Corp. | | | | |
| 2.43%, 11/17/08 | | 5,000,000 b | | 4,994,589 |
| Federal National Mortgage Association | | | | |
| 2.48%, 11/6/08 | | 5,000,000 b | | 4,998,278 |
| | | | | 9,992,867 |
44
| | | Principal | | |
| Short-Term Investments (continued) | | Amount ($) | | Value ($) |
| |
| |
|
| U.S. Treasury Bills—10.5% | | | | |
| 0.38%, 12/18/08 | | 2,950,000 c | | 2,948,439 |
| 0.58%, 11/28/08 | | 9,900,000 c | | 9,899,248 |
| | | | | 12,847,687 |
| Total Short-Term Investments | | | | |
| (cost $22,837,086) | | | | 22,840,554 |
| |
| |
|
| |
| Other Investment—18.3% | | Shares | | Value ($) |
| |
| |
|
| Registered Investment Company; | | | | |
| Dreyfus Institutional Preferred Plus Money Market Fund | | | | |
| (cost $22,348,000) | | 22,348,000 d | | 22,348,000 |
| |
| |
|
| |
| Total Investments (cost $168,575,586) | | 104.3% | | 127,321,498 |
| Liabilities, Less Cash and Receivables | | (4.3%) | | (5,280,901) |
| Net Assets | | 100.0% | | 122,040,597 |
| a Non-income producing security. |
| b On September 7, 2008, the Federal Housing Finance Agency (FHFA) placed Federal National Mortgage Association |
| and Federal Home Loan Mortgage Corporation into conservatorship with FHFA as the conservator.As such, the |
| FHFA will oversee the continuing affairs of these companies. |
| c All or partially held by a broker as collateral for open financial futures positions. |
| d Investment in affiliated money market mutual fund. |
| Portfolio Summary (Unaudited)† | | | | |
| |
| | | Value (%) | | | | Value (%) |
| |
| |
| |
|
| Short-Term/ | | | | Consumer Discretionary | | 6.7 |
| Money Market Investment | | 37.0 | | Energy | | 5.8 |
| Financial | | 11.5 | | Utilities | | 5.1 |
| Health Care | | 8.4 | | Materials | | 3.4 |
| Information Technology | | 8.2 | | Telecommunication Services | | 2.7 |
| Consumer Staples | | 7.8 | | | | |
| Industrial | | 7.7 | | | | 104.3 |
| |
| † Based on net assets. | | | | | | |
| See notes to financial statements. | | | | | | |
The Fund 45
STATEMENT OF FINANCIAL FUTURES
October 31, 2008
| | | | | | | | | Unrealized |
| | | | | Market Value | | | | Appreciation |
| | | | | Covered by | | | | (Depreciation) |
| | | Contracts | | Contracts ($) | | Expiration | | at 10/31/2008 ($) |
| |
| |
| |
| |
|
| Financial Futures Long | | | | | | | | |
| Amsterdam Exchanges Index | | 127 | | 8,583,584 | | November 2008 | | (27,564) |
| Canadian 10 Year Bond | | 14 | | 1,349,394 | | December 2008 | | (20,323) |
| FTSE 100 Index | | 101 | | 7,145,280 | | December 2008 | | (1,065,242) |
| Hang Seng Stock Index | | 52 | | 4,673,019 | | November 2008 | | 696,854 |
| IBEX 35 Index | | 50 | | 5,705,926 | | November 2008 | | (605,267) |
| S&P ASX 200 Index | | 92 | | 6,124,310 | | December 2008 | | (643,954) |
| S & P/MIB Index | | 52 | | 6,995,118 | | December 2008 | | (1,633,446) |
| S & P/Toronto Stock | | | | | | | | |
| Exchange 60 Index | | 47 | | 4,569,922 | | December 2008 | | (860,432) |
| U.S. Treasury 10 Year Notes | | 422 | | 47,718,971 | | December 2008 | | (660,421) |
| Financial Futures Short | | | | | | | | |
| Australian 10 Year Bond | | 115 | | (8,067,940) | | December 2008 | | (242,406) |
| CAC 40 10 Euro | | 12 | | (527,942) | | November 2008 | | (25,525) |
| Dax Index | | 50 | | (8,028,366) | | December 2008 | | 1,464,269 |
| Euro-Bund 10 Year | | 26 | | (3,822,143) | | December 2008 | | 28,440 |
| Japanese 10 Year Bond | | 7 | | (9,820,641) | | December 2008 | | (114,672) |
| Japanese 10 Year Mini Bond | | 12 | | (1,680,488) | | December 2008 | | 13,604 |
| S & P 500 Emini | | 250 | | (12,091,250) | | December 2008 | | 2,838,831 |
| Topix Index | | 166 | | (14,414,235) | | December 2008 | | 2,989,192 |
| 10 Year Long Gilt | | 28 | | (5,034,852) | | December 2008 | | 20,494 |
| | | | | | | | | 2,152,432 |
| |
| See notes to financial statements. | | | | | | | | |
46
STATEMENT OF ASSETS AND LIABILITIES
October 31, 2008
| | | | | | | Cost | | Value |
| |
| |
| |
| |
|
| Assets ($): | | | | | | | | |
| Investments in securities—See Statement of Investments | | | | |
| Unaffiliated issuers | | | | | | 146,227,586 | | 104,973,498 |
| Affiliated issuers | | | | | | 22,348,000 | | 22,348,000 |
| Cash denominated in foreign currencies | | | | 492,793 | | 451,657 |
| Receivable for investment securities sold | | | | | | 3,786,940 |
| Receivable for futures variation margin—Note 4 | | | | | | 1,129,190 |
| Unrealized appreciation on forward | | | | | | |
| currency exchange contracts—Note 4 | | | | | | 967,519 |
| Dividends and interest receivable | | | | | | | | 317,685 |
| Receivable for shares of Common Stock subscribed | | | | | | 199,904 |
| Prepaid expenses | | | | | | | | 34,220 |
| | | | | | | | | 134,208,613 |
| |
| |
| |
| |
|
| Liabilities ($): | | | | | | | | |
| Due to The Dreyfus Corporation and affiliates—Note 3(c) | | | | 226,988 |
| Cash overdraft due to Custodian | | | | | | | | 305,531 |
| Payable for investment securities purchased | | | | | | 7,737,289 |
| Unrealized depreciation on forward | | | | | | |
| currency exchange contracts—Note 4 | | | | | | 2,725,757 |
| Payable for shares of Common Stock redeemed | | | | | | 1,066,890 |
| Accrued expenses | | | | | | | | 105,561 |
| | | | | | | | | 12,168,016 |
| |
| |
| |
| |
|
| Net Assets ($) | | | | | | | | 122,040,597 |
| |
| |
| |
| |
|
| Composition of Net Assets ($): | | | | | | | | |
| Paid-in capital | | | | | | | | 227,274,033 |
| Accumulated undistributed investment income—net | | | | | | 4,142,140 |
| Accumulated net realized gain (loss) on investments | | | | | | (68,480,342) |
| Accumulated net unrealized appreciation (depreciation) on | | | | |
| investments, foreign currency transactions and options | | | | |
| transactions (including $2,152,432 net unrealized | | | | |
| appreciation on financial futures) | | | | | | (40,895,234) |
| |
| |
| |
|
| Net Assets ($) | | | | | | | | 122,040,597 |
| |
| |
| |
| |
|
| |
| |
| Net Asset Value Per Share | | | | | | | | |
| | | Class A | | Class C | | Class I | | Class T |
| |
| |
| |
| |
|
| Net Assets ($) | | 74,082,507 | | 26,706,343 | | 21,124,014 | | 127,733 |
| Shares Outstanding | | 8,732,696 | | 3,189,796 | | 2,479,335 | | 15,094 |
| |
| |
| |
| |
|
| Net Asset Value Per Share ($) | | 8.48 | | 8.37 | | 8.52 | | 8.46 |
See notes to financial statements.
The Fund 47
| STATEMENT OF OPERATIONS | | |
| Year Ended October 31, 2008 | | |
| |
|
| |
| |
| |
| |
| Investment Income ($): | | |
| Income: | | |
| Interest | | 3,993,057 |
| Cash dividends (net of $67,731 foreign taxes withheld at source): | | |
| Unaffiliated issuers | | 2,855,187 |
| Affiliated issuers | | 942,747 |
| Total Income | | 7,790,991 |
| Expenses: | | |
| Management fee—Note 3(a) | | 3,193,178 |
| Shareholder servicing costs—Note 3(c) | | 920,173 |
| Distribution fees—Note 3(b) | | 434,540 |
| Custodian fees—Note 3(c) | | 123,944 |
| Registration fees | | 82,783 |
| Prospectus and shareholders’ reports | | 80,633 |
| Professional fees | | 50,093 |
| Directors’ fees and expenses—Note 3(d) | | 17,546 |
| Loan commitment fees—Note 2 | | 3,362 |
| Miscellaneous | | 22,146 |
| Total Expenses | | 4,928,398 |
| Less—reduction in fees due to earnings credits—Note 1(c) | | (7,269) |
| Net Expenses | | 4,921,129 |
| Investment Income—Net | | 2,869,862 |
| |
|
| Realized and Unrealized Gain (Loss) on Investments—Note 4 ($): | | |
| Net realized gain (loss) on investments and foreign currency transactions | | (7,415,985) |
| Net realized gain (loss) on options transactions | | (10,547,824) |
| Net realized gain (loss) on financial futures | | (34,414,510) |
| Net realized gain (loss) on forward currency exchange contracts | | (15,274,682) |
| Net Realized Gain (Loss) | | (67,653,001) |
| Net unrealized appreciation (depreciation) on investments, foreign | | |
| currency transactions and options transactions [including ($565,009) | | |
| net unrealized (depreciation) on financial futures] | | (50,198,987) |
| Net Realized and Unrealized Gain (Loss) on Investments | | (117,851,988) |
| Net (Decrease) in Net Assets Resulting from Operations | | (114,982,126) |
| |
| See notes to financial statements. | | |
48
STATEMENT OF CHANGES IN NET ASSETS
| | | Year Ended October 31, |
| | |
|
| | | 2008 | | 2007a |
| |
| |
|
| Operations ($): | | | | |
| Investment income—net | | 2,869,862 | | 6,673,748 |
| Net realized gain (loss) on investments | | (67,653,001) | | 7,326,905 |
| Net unrealized appreciation | | | | |
| (depreciation) on investments | | (50,198,987) | | 8,035,990 |
| Net Increase (Decrease) in Net Assets | | | | |
| Resulting from Operations | | (114,982,126) | | 22,036,643 |
| |
| |
|
| Dividends to Shareholders from ($): | | | | |
| Investment income—net: | | | | |
| Class A Shares | | (4,956,583) | | (485,921) |
| Class C Shares | | (1,154,809) | | (53,687) |
| Class I Shares | | (1,322,029) | | (63,602) |
| Class T Shares | | (61,142) | | (11,569) |
| Net realized gain on investments: | | | | |
| Class A Shares | | (3,164,732) | | (1,191,979) |
| Class C Shares | | (996,907) | | (153,298) |
| Class I Shares | | (743,147) | | (146,892) |
| Class T Shares | | (43,650) | | (31,343) |
| Total Dividends | | (12,442,999) | | (2,138,291) |
| |
| |
|
| Capital Stock Transactions ($): | | | | |
| Net proceeds from shares sold: | | | | |
| Class A Shares | | 42,670,237 | | 300,359,829 |
| Class C Shares | | 9,555,407 | | 83,421,689 |
| Class I Shares | | 7,557,864 | | 57,909,486 |
| Class T Shares | | 358,239 | | 3,890,452 |
| Dividends reinvested: | | | | |
| Class A Shares | | 7,059,564 | | 1,512,242 |
| Class C Shares | | 1,084,715 | | 122,768 |
| Class I Shares | | 1,295,526 | | 186,213 |
| Class T Shares | | 104,679 | | 42,912 |
| Cost of shares redeemed: | | | | |
| Class A Shares | | (194,329,875) | | (64,694,169) |
| Class C Shares | | (42,873,923) | | (5,295,684) |
| Class I Shares | | (28,968,411) | | (5,952,741) |
| Class T Shares | | (3,225,890) | | (933,424) |
| Increase (Decrease) in Net Assets | | | | |
| from Capital Stock Transactions | | (199,711,868) | | 370,569,573 |
| Total Increase (Decrease) in Net Assets | | (327,136,993) | | 390,467,925 |
| |
| |
|
| Net Assets ($): | | | | |
| Beginning of Period | | 449,177,590 | | 58,709,665 |
| End of Period | | 122,040,597 | | 449,177,590 |
| Undistributed investment income—net | | 4,142,140 | | 6,328,900 |
The Fund 49
STATEMENT OF CHANGES IN NET ASSETS (continued)
| | | Year Ended October 31, |
| | |
|
| | | 2008 | | 2007a |
| |
| |
|
| Capital Share Transactions: | | | | |
| Class A | | | | |
| Shares sold | | 3,345,543 | | 21,915,964 |
| Shares issued for dividends reinvested | | 538,898 | | 112,018 |
| Shares redeemed | | (16,084,298) | | (4,664,433) |
| Net Increase (Decrease) in Shares Outstanding | | (12,199,857) | | 17,363,549 |
| |
| |
|
| Class C | | | | |
| Shares sold | | 745,966 | | 6,115,891 |
| Shares issued for dividends reinvested | | 83,314 | | 9,128 |
| Shares redeemed | | (3,643,679) | | (386,539) |
| Net Increase (Decrease) in Shares Outstanding | | (2,814,399) | | 5,738,480 |
| |
| |
|
| Class I | | | | |
| Shares sold | | 601,651 | | 4,218,296 |
| Shares issued for dividends reinvested | | 98,744 | | 13,774 |
| Shares redeemed | | (2,607,302) | | (427,753) |
| Net Increase (Decrease) in Shares Outstanding | | (1,906,907) | | 3,804,317 |
| |
| |
|
| Class T | | | | |
| Shares sold | | 26,835 | | 290,593 |
| Shares issued for dividends reinvested | | 7,997 | | 3,181 |
| Shares redeemed | | (267,559) | | (67,727) |
| Net Increase (Decrease) in Shares Outstanding | | (232,727) | | 226,047 |
| |
| a Effective June 1, 2007, Class R shares were redesignated as Class I shares. | | |
| See notes to financial statements. | | | | |
50
FINANCIAL HIGHLIGHTS
The following tables describe the performance for each share class for the fiscal periods indicated.All information (except portfolio turnover rate) reflects financial results for a single fund share.Total return shows how much your investment in the fund would have increased (or decreased) during each period, assuming you had reinvested all dividends and distributions.These figures have been derived from the fund’s financial statements.
| | | | | Year Ended October 31, |
| | |
| |
|
| Class A Shares | | 2008 | | 2007 | | 2006a |
| |
| |
| |
|
| Per Share Data ($): | | | | | | |
| Net asset value, beginning of period | | 14.25 | | 13.23 | | 12.50 |
| Investment Operations: | | | | | | |
| Investment income—netb | | .13 | | .32 | | .12 |
| Net realized and unrealized | | | | | | |
| gain (loss) on investments | | (5.47) | | .93 | | .61 |
| Total from Investment Operations | | (5.34) | | 1.25 | | .73 |
| Distributions: | | | | | | |
| Dividends from investment income—net | | (.26) | | (.07) | | — |
| Dividends from net realized gain on investments | | (.17) | | (.16) | | — |
| Total Distributions | | (.43) | | (.23) | | — |
| Net asset value, end of period | | 8.48 | | 14.25 | | 13.23 |
| |
| |
| |
|
| Total Return (%)c | | (38.52) | | 9.53 | | 5.84d |
| |
| |
| |
|
| Ratios/Supplemental Data (%): | | | | | | |
| Ratio of total expenses to average net assets | | 1.61 | | 1.52 | | 2.67e |
| Ratio of net expenses to average net assets | | 1.61f | | 1.44 | | 1.54e |
| Ratio of net investment income | | | | | | |
| to average net assets | | 1.09 | | 2.31 | | 2.09e |
| Portfolio Turnover Rate | | 24.53 | | 3.05 | | — |
| |
| |
| |
|
| Net Assets, end of period ($ x 1,000) | | 74,083 | | 298,284 | | 47,215 |
| a | | From May 2, 2006 (commencement of operations) to October 31, 2006. |
| b | | Based on average shares outstanding at each month end. |
| c | | Exclusive of sales charge. |
| d | | Not annualized. |
| e | | Annualized. |
| f | | Expense waivers and/or reimbursements amounted to less than .01%. |
| See notes to financial statements. |
The Fund 51
| | FINANCIAL HIGHLIGHTS (continued) |
| | | | | Year Ended October 31, | | |
| | |
| |
| |
|
| Class C Shares | | 2008 | | 2007 | | 2006a |
| |
| |
| |
|
| Per Share Data ($): | | | | | | |
| Net asset value, beginning of period | | 14.10 | | 13.18 | | 12.50 |
| Investment Operations: | | | | | | |
| Investment income—netb | | .04 | | .21 | | .08 |
| Net realized and unrealized | | | | | | |
| gain (loss) on investments | | (5.40) | | .93 | | .60 |
| Total from Investment Operations | | (5.36) | | 1.14 | | .68 |
| Distributions: | | | | | | |
| Dividends from investment income—net | | (.20) | | (.06) | | — |
| Dividends from net realized gain on investments | | (.17) | | (.16) | | — |
| Total Distributions | | (.37) | | (.22) | | — |
| Net asset value, end of period | | 8.37 | | 14.10 | | 13.18 |
| |
| |
| |
|
| Total Return (%)c | | (38.97) | | 8.80 | | 5.36d |
| |
| |
| |
|
| Ratios/Supplemental Data (%): | | | | | | |
| Ratio of total expenses to average net assets | | 2.35 | | 2.28 | | 3.49e |
| Ratio of net expenses to average net assets | | 2.35f | | 2.19 | | 2.29e |
| Ratio of net investment income | | | | | | |
| to average net assets | | .32 | | 1.53 | | 1.33e |
| Portfolio Turnover Rate | | 24.53 | | 3.05 | | — |
| |
| |
| |
|
| Net Assets, end of period ($ x 1,000) | | 26,706 | | 84,660 | | 3,501 |
| a | | From May 2, 2006 (commencement of operations) to October 31, 2006. |
| b | | Based on average shares outstanding at each month end. |
| c | | Exclusive of sales charge. |
| d | | Not annualized. |
| e | | Annualized. |
| f | | Expense waivers and/or reimbursements amounted to less than .01%. |
| See notes to financial statements. |
52
| | | | | Year Ended October 31, | | |
| | |
| |
| |
|
| Class I Shares | | 2008 | | 2007a | | 2006b |
| |
| |
| |
|
| Per Share Data ($): | | | | | | |
| Net asset value, beginning of period | | 14.30 | | 13.24 | | 12.50 |
| Investment Operations: | | | | | | |
| Investment income—netc | | .17 | | .36 | | .13 |
| Net realized and unrealized | | | | | | |
| gain (loss) on investments | | (5.48) | | .93 | | .61 |
| Total from Investment Operations | | (5.31) | | 1.29 | | .74 |
| Distributions: | | | | | | |
| Dividends from investment income—net | | (.30) | | (.07) | | — |
| Dividends from net realized gain on investments | | (.17) | | (.16) | | — |
| Total Distributions | | (.47) | | (.23) | | — |
| Net asset value, end of period | | 8.52 | | 14.30 | | 13.24 |
| |
| |
| |
|
| Total Return (%) | | (38.29) | | 9.86 | | 5.92d |
| |
| |
| |
|
| Ratios/Supplemental Data (%): | | | | | | |
| Ratio of total expenses to average net assets | | 1.26 | | 1.23 | | 2.51e |
| Ratio of net expenses to average net assets | | 1.26f | | 1.17 | | 1.27e |
| Ratio of net investment income | | | | | | |
| to average net assets | | 1.37 | | 2.58 | | 2.31e |
| Portfolio Turnover Rate | | 24.53 | | 3.05 | | — |
| |
| |
| |
|
| Net Assets, end of period ($ x 1,000) | | 21,124 | | 62,712 | | 7,705 |
| a | | Effective June 1, 2007, Class R shares were redesignated as Class I shares. |
| b | | From May 2, 2006 (commencement of operations) to October 31, 2006. |
| c | | Based on average shares outstanding at each month end. |
| d | | Not annualized. |
| e | | Annualized. |
| f | | Expense waivers and/or reimbursements amounted to less than .01%. |
| See notes to financial statements. |
The Fund 53
| | FINANCIAL HIGHLIGHTS (continued) |
| | | | | Year Ended October 31, | | |
| | |
| |
| |
|
| Class T Shares | | 2008 | | 2007 | | 2006a |
| |
| |
| |
|
| Per Share Data ($): | | | | | | |
| Net asset value, beginning of period | | 14.21 | | 13.22 | | 12.50 |
| Investment Operations: | | | | | | |
| Investment income—netb | | .12 | | .31 | | .12 |
| Net realized and unrealized | | | | | | |
| gain (loss) on investments | | (5.46) | | .90 | | .60 |
| Total from Investment Operations | | (5.34) | | 1.21 | | .72 |
| Distributions: | | | | | | |
| Dividends from investment income—net | | (.24) | | (.06) | | — |
| Dividends from net realized gain on investments | | (.17) | | (.16) | | — |
| Total Distributions | | (.41) | | (.22) | | — |
| Net asset value, end of period | | 8.46 | | 14.21 | | 13.22 |
| |
| |
| |
|
| Total Return (%)c | | (38.57) | | 9.26 | | 5.68d |
| |
| |
| |
|
| Ratios/Supplemental Data (%): | | | | | | |
| Ratio of total expenses to average net assets | | 1.79 | | 1.77 | | 3.10e |
| Ratio of net expenses to average net assets | | 1.79f | | 1.68 | | 1.85e |
| Ratio of net investment income | | | | | | |
| to average net assets | | .97 | | 2.12 | | 1.89e |
| Portfolio Turnover Rate | | 24.53 | | 3.05 | | — |
| |
| |
| |
|
| Net Assets, end of period ($ x 1,000) | | 128 | | 3,521 | | 288 |
| a | | From May 2, 2006 (commencement of operations) to October 31, 2006. |
| b | | Based on average shares outstanding at each month end. |
| c | | Exclusive of sales charge. |
| d | | Not annualized. |
| e | | Annualized. |
| f | | Expense waivers and/or reimbursements amounted to less than .01%. |
| See notes to financial statements. |
54
NOTES TO FINANCIAL STATEMENTS
NOTE 1—Significant Accounting Policies:
Global Alpha Fund (the “fund”) is a separate diversified series of Advantage Funds, Inc. (the “Company”), which is registered under the Investment Company Act of 1940, as amended (the “Act”), as an open-end management investment company and operates as a series company that offers twelve series, including the fund. The fund’s investment objective seeks total return by investing in instruments that provide investment exposure to global equity, bond and currency markets, and in fixed-income securities.The Dreyfus Corporation (the “Manager” or “Dreyfus”), a wholly-owned subsidiary of The Bank of New York Mellon Corporation (“BNY Mellon”), serves as the fund’s investment adviser. Mellon Capital Management Corporation (“Mellon Capital”), a subsidiary of BNY Mellon, serves as the fund’s sub-investment adviser.
Effective July 1, 2008, BNY Mellon has reorganized and consolidated a number of its banking and trust company subsidiaries. As a result of the reorganization, any services previously provided to the fund by Mellon Bank, N.A. or Mellon Trust of New England, N.A. are now provided by The Bank of New York, which has changed its name to The Bank of New York Mellon.
MBSC Securities Corporation (the “Distributor”), a wholly-owned subsidiary of Dreyfus, is the distributor of the fund’s shares.The fund is authorized to issue 400 million shares of $.001 par value Common Stock.The fund currently offers four classes of shares: Class A (100 million shares authorized), Class C (100 million shares authorized), Class I (100 million shares authorized) and Class T (100 million shares authorized). Class A and Class T shares are subject to a sales charge imposed at the time of purchase. Class C shares are subject to a contingent deferred sales charge (“CDSC”) imposed on Class C shares redeemed within one year of purchase. Class I shares are sold at net asset value per share only to institutional investors. Other differences between the classes include the services offered to and the expenses borne by each class, the allocation of certain transfer agency costs and certain voting
The Fund 55
| NOTES TO FINANCIAL STATEMENTS (continued) |
rights. Income, expenses (other than expenses attributable to a specific class) and realized and unrealized gains or losses on investments are allocated to each class of shares based on its relative net assets.
The Company accounts separately for the assets, liabilities and operations of each series. Expenses directly attributable to each series are charged to that series’ operations; expenses which are applicable to all series are allocated among them on a pro rata basis.
The fund’s financial statements are prepared in accordance with U.S. generally accepted accounting principles, which may require the use of management estimates and assumptions. Actual results could differ from those estimates.
The fund enters into contracts that contain a variety of indemnifications. The fund’s maximum exposure under these arrangements is unknown.The fund does not anticipate recognizing any loss related to these arrangements.
(a) Portfolio valuation: Investments in equity securities are valued at the last sales price on the securities exchange or national securities market on which such securities are primarily traded. Securities listed on the National Market System for which market quotations are available are valued at the official closing price or, if there is no official closing price that day, at the last sales price. Securities not listed on an exchange or the national securities market, or securities for which there were no transactions, are valued at the average of the most recent bid and asked prices, except for open short positions, where the asked price is used for valuation purposes. Bid price is used when no asked price is available. Registered investment companies that are not traded on an exchange are valued at their net asset value.When market quotations or official closing prices are not readily available, or are determined not to reflect accurately fair value, such as when the value of a security has been significantly affected by events after the close of the exchange or market on which the security is principally traded (for example, a foreign exchange or market), but before the fund calculates its net asset value, the fund may value these investments at fair value as determined
56
in accordance with the procedures approved by the Board of Directors. Fair valuing of securities may be determined with the assistance of a pricing service using calculations based on indices of domestic securities and other appropriate indicators, such as prices of relevant ADRs and futures contracts. For other securities that are fair valued by the Board of Directors, certain factors may be considered such as: fundamental analytical data, the nature and duration of restrictions on disposition, an evaluation of the forces that influence the market in which the securities are purchased and sold, and public trading in similar securities of the issuer or comparable issuers. Financial futures are valued at the last sales price.
Investments in debt securities excluding short-term investments (other than U.S.Treasury Bills), financial futures, options and forward currency exchange contracts are valued each business day by an independent pricing service (the “Service”) approved by the Board of Directors. Investments for which quoted bid prices are readily available and are representative of the bid side of the market in the judgment of the Service are valued at the mean between the quoted bid prices (as obtained by the Service from dealers in such securities) and asked prices (as calculated by the Service based upon its evaluation of the market for such securities). Other investments are valued as determined by the Service, based on methods which include consideration of: yields or prices of securities of comparable quality, coupon, maturity and type; indications as to values from dealers; and general market conditions. Restricted securities, as well as securities or other assets for which recent market quotations are not readily available, that are not valued by a pricing service approved by the Board of Directors, or are determined by the fund not to reflect accurately fair value, are valued at fair value as determined in good faith under the direction of the Board of Directors. The factors that may be considered when fair valuing a security include fundamental analytical data, the nature and duration of restrictions on disposition, an evaluation of the forces that influence the market in which the securities are purchased and sold and public trading in similar securities of the issuer or comparable issuers. Short-term investments,
The Fund 57
| NOTES TO FINANCIAL STATEMENTS (continued) |
excluding U.S.Treasury Bills, are carried at amortized cost, which approximates value. Financial futures and options, which are traded on an exchange, are valued at the last sales price on the securities exchange on which such securities are primarily traded or at the last sales price on the national securities market on each business day. Options traded over-the-counter are priced at the mean between the bid and asked price. Investments denominated in foreign currencies are translated to U.S. dollars at the prevailing rates of exchange. Forward currency exchange contracts are valued at the forward rate.
The Financial Accounting Standards Board (“FASB”) released Statement of Financial Accounting Standards No. 157 “Fair Value Measurements” (“FAS 157”). FAS 157 establishes an authoritative definition of fair value, sets out a framework for measuring fair value, and requires additional disclosures about fair-value measurements. The application of FAS 157 is required for fiscal years beginning after November 15, 2007 and interim periods within those fiscal years. Management does not believe that the application of this standard will have a material impact on the financial statements of the fund.
(b) Foreign currency transactions: The fund does not isolate that portion of the results of operations resulting from changes in foreign exchange rates on investments from the fluctuations arising from changes in the market prices of securities held. Such fluctuations are included with the net realized and unrealized gain or loss on investments.
Net realized foreign exchange gains or losses arise from sales and maturities of short-term securities, sales of foreign currencies, currency gains or losses realized on securities transactions and the difference between the amounts of dividends, interest and foreign withholding taxes recorded on the fund’s books and the U.S. dollar equivalent of the amounts actually received or paid. Net unrealized foreign exchange gains and losses arise from changes in the value of assets and liabilities other than investments in securities, resulting from changes in exchange rates. Such gains and losses are included with net realized and unrealized gain or loss on investments.
58
(c) Securities transactions and investment income: Securities transactions are recorded on a trade date basis. Realized gains and losses from securities transactions are recorded on the identified cost basis. Dividend income is recognized on the ex-dividend date and interest income, including, where applicable, accretion of discount and amortization of premium on investments, is recognized on the accrual basis.
The fund has arrangements with the custodian and cash management banks whereby the fund may receive earnings credits when positive cash balances are maintained, which are used to offset custody and cash management fees. For financial reporting purposes, the fund includes net earnings credits as an expense offset in the Statement of Operations.
Investing in foreign markets may involve special risks and considerations not typically associated with investing in the U.S. These risks include revaluation of currencies, high rates of inflation, repatriation restrictions on income and capital, and adverse political and economic developments. Moreover, securities issued in these markets may be less liquid, subject to government ownership controls and delayed settlements, and their prices may be more volatile than those of comparable securities in the U.S.
(d) Affiliated issuers: Investments in other investment companies advised by Dreyfus are defined as “affiliated” in the Act.
(e) Dividends to shareholders: Dividends are recorded on the ex-dividend date. Dividends from investment income-net and dividends from net realized capital gains, if any, are normally declared and paid annually, but the fund may make distributions on a more frequent basis to comply with the distribution requirements of the Internal Revenue Code of 1986, as amended (the “Code”).To the extent that net realized capital gains can be offset by capital loss carryovers, it is the policy of the fund not to distribute such gains. Income and capital gain distributions are determined in accordance with income tax regulations, which may differ from U.S. generally accepted accounting principles.
The Fund 59
| NOTES TO FINANCIAL STATEMENTS (continued) |
(f) Federal income taxes: It is the policy of the fund to continue to qualify as a regulated investment company, if such qualification is in the best interests of its shareholders, by complying with the applicable provisions of the Code, and to make distributions of taxable income sufficient to relieve it from substantially all federal income and excise taxes.
The fund adopted FASB Interpretation No. 48 “Accounting for Uncertainty in Income Taxes” (“FIN 48”). FIN 48 provides guidance for how uncertain tax positions should be recognized, measured, presented and disclosed in the financial statements. FIN 48 requires the evaluation of tax positions taken or expected to be taken in the course of preparing the fund’s tax returns to determine whether the tax positions are “more-likely-than not” of being sustained by the applicable tax authority. Liability for tax positions not deemed to meet the more likely-than-not threshold would be recorded as a tax expense in the current year.The adoption of FIN 48 had no impact on the operations of the fund for the period ended October 31, 2008.
As of and during the period ended October 31, 2008, the fund did not have any liabilities for any unrecognized tax positions. The fund recognizes interest and penalties, if any, related to unrecognized tax positions as income tax expense in the Statement of Operations. During the period, the fund did not incur any interest or penalties.
Each of the tax years in the three-year period ended October 31, 2008 remains subject to examination by the Internal Revenue Service and state taxing authorities.
At October 31, 2008, the components of accumulated earnings on a tax basis were as follows: undistributed ordinary income $4,139,956, accumulated capital losses $67,742,824 and unrealized depreciation $41,630,568.
The accumulated capital loss carryover is available for federal income tax purposes to be applied against future net securities profits, if any, realized subsequent to October 31, 2008. If not applied, the carryover expires in fiscal 2016.
60
The tax character of distributions paid to shareholders during the fiscal periods ended October 31, 2008 and October 31, 2007 were as follows: ordinary income $11,774,361 and $1,750,614 and long-term capital gains $668,638 and $387,677, respectively.
During the period ended October 31, 2008, as a result of permanent book to tax differences, primarily due to foreign currency transactions and real estate investment trusts, the fund increased accumulated undistributed investment income-net by $2,437,941 and decreased accumulated net realized gain (loss) on investments by the same amount. Net assets and net asset value per share were not affected by this reclassification.
NOTE 2—Bank Lines of Credit:
Prior to October 15, 2008, the fund participated with other Dreyfus-managed funds in a $350 million redemption credit facility. Effective October 15, 2008, the fund participates with other Dreyfus-managed funds in a $145 million redemption credit facility (the “Facility”) to be utilized for temporary or emergency purposes, including the financing of redemptions. In connection therewith, the fund has agreed to pay commitment fees on its pro rata portion of the Facility. Interest is charged to the fund based on prevailing market rates in effect at the time of borrowing. During the period ended October 31, 2008, the fund did not borrow under either Facility.
NOTE 3—Management Fee, Sub-Investment Advisory Fee and Other Transactions With Affiliates:
(a) Pursuant to a Management Agreement (“Agreement”) with Dreyfus, the management fee is computed at the annual rate of 1.10% of the value of the fund’s average daily net assets and is payable monthly.
Pursuant to a Sub-Investment Advisory Agreement between Dreyfus and Mellon Capital, Dreyfus pays Mellon Capital an annual fee of .65% of the value of the fund’s average daily net assets, payable monthly.
The Fund 61
| NOTES TO FINANCIAL STATEMENTS (continued) |
During the period ended October 31, 2008, the Distributor retained $18,593 from commissions earned on sales of the fund’s Class A shares and $75,462 from CDSCs on redemptions of the fund’s Class C shares.
(b) Under the Distribution Plan (the “Plan”) adopted pursuant to Rule 12b-1 under the Act, Class C and Class T shares pay the Distributor for distributing their shares at an annual rate of .75% and .25% of the value of their respective average daily net assets. During the period ended October 31, 2008, Class C and Class T shares were charged $430,642 and $3,898, respectively, pursuant to the Plan.
(c) Under the Shareholder Services Plan, Class A, Class C and Class T shares pay the Distributor at an annual rate of ..25% of the value of their average daily net assets for the provision of certain services.The services provided may include personal services relating to shareholder accounts, such as answering shareholder inquiries regarding the fund and providing reports and other information, and services related to the maintenance of shareholder accounts.The Distributor may make payments to Service Agents (a securities dealer, financial institution or other industry professional) in respect of these services.The Distributor determines the amounts to be paid to Service Agents. During the period ended October 31, 2008, Class A, Class C and Class T shares were charged $452,725, $143,547 and $3,898, respectively, pursuant to the Shareholder Services Plan.
The fund compensates Dreyfus Transfer, Inc., a wholly-owned subsidiary of Dreyfus, under a transfer agency agreement for providing personnel and facilities to perform transfer agency services for the fund. During the period ended October 31, 2008, the fund was charged $60,738 pursuant to the transfer agency agreement.
The fund compensates The Bank of New York Mellon, a subsidiary of BNY Mellon and an affiliate of Dreyfus, under a cash management agreement for performing cash management services related to fund subscriptions and redemptions. During the period ended October 31, 2008, the fund was charged $7,269 pursuant to the cash management agreement.
62
The fund compensates The Bank of NewYork Mellon under a custody agreement for providing custodial services for the fund. During the period ended October 31, 2008, the fund was charged $123,944 pursuant to the custody agreement.
During the period ended October 31, 2008, the fund was charged $6,203 for services performed by the Chief Compliance Officer.
The components of “Due to The Dreyfus Corporation and affiliates” in the Statement of Assets and Liabilities consist of: management fees $123,810, Rule 12b-1 distribution plan fees $18,371, shareholder services plan fees $23,199, custodian fees $45,235, chief compliance officer fees $1,973 and transfer agency per account fees $14,400.
(d) Each Board member also serves as a Board member of other funds within the Dreyfus complex. Annual retainer fees and attendance fees are allocated to each fund based on net assets.
NOTE 4—Securities Transactions:
The aggregate amount of purchases and sales of investment securities, excluding short-term securities, financial futures, options transactions and forward currency exchange contracts during the period ended October 31, 2008, amounted to $31,759,055 and $61,579,130, respectively.
The fund may invest in financial futures contracts in order to gain exposure to or protect against changes in the market. The fund is exposed to market risk as a result of changes in the value of the underlying financial instruments. Investments in financial futures require the fund to “mark to market” on a daily basis, which reflects the change in market value of the contracts at the close of each day’s trading.Accordingly, variation margin payments are received or made to reflect daily unrealized gains or losses. When the contracts are closed, the fund recognizes a realized gain or loss.These investments require initial margin deposits with a broker, which consist of cash or cash equivalents.The amount of these deposits is determined by the exchange or Board of Trade on which the contract is traded and is
The Fund 63
| NOTES TO FINANCIAL STATEMENTS (continued) |
subject to change. Contracts open at October 31, 2008, are set forth in the Statement of Financial Futures.
The fund may purchase and write (sell) put and call options in order to gain exposure to or to protect against changes in the market.
As a writer of call options, the fund receives a premium at the outset and then bears the market risk of unfavorable changes in the price of the financial instrument underlying the option. Generally, the fund would incur a gain, to the extent of the premium, if the price of the underlying financial instrument decreases between the date the option is written and the date on which the option is terminated. Generally, the fund would realize a loss, if the price of the financial instrument increases between those dates.
As a writer of put options, the fund receives a premium at the outset and then bears the market risk of unfavorable changes in the price of the financial instrument underlying the option. Generally, the fund would incur a gain, to the extent of the premium, if the price of the underlying financial instrument increases between the date the option is written and the date on which the option is terminated. Generally, the fund would realize a loss, if the price of the financial instrument decreases between those dates. The following summarizes the fund’s call/put options written for the period ended October 31, 2008.
| | | Face Amount | | | | Options Terminated |
| | | | | | |
|
| | | Covered by | | Premiums | | | | Net Realized |
| Options Written: | | Contracts ($) | | Received ($) | | Cost ($) | | Gain ($) |
| |
| |
| |
| |
|
| Contracts outstanding | | | | | | | | |
| October 31, 2007 | | — | | — | | | | |
| Contracts written | | 5,120 | | 1,571,191 | | | | |
| Contracts terminated: | | | | | | | | |
| Contracts closed | | 5,120 | | 1,571,191 | | 83,212 | | 1,487,979 |
| Contracts Outstanding | | | | | | | | |
| October 31, 2008 | | — | | — | | | | |
The fund enters into forward currency exchange contracts to gain exposure to foreign currency, hedge its exposure against changes in exchange rates on its foreign portfolio holdings and to settle foreign currency transactions. When executing forward currency exchange
64
contracts, the fund is obligated to buy or sell a foreign currency at a specified rate on a certain date in the future.With respect to sales of forward currency exchange contracts, the fund would incur a loss if the value of the contract increases between the date the forward contract is opened and the date the forward contract is closed.The fund realizes a gain if the value of the contract decreases between those dates. With respect to purchases of forward currency exchange contracts, the fund would incur a loss if the value of the contract decreases between the date the forward contract is opened and the date the forward contract is closed.The fund realizes a gain if the value of the contract increases between those dates.The fund is also exposed to credit risk associated with counterparty nonperformance on these forward currency exchange contracts which is typically limited to the unrealized gain on each open contract.The following summarizes open forward currency exchange contracts at October 31, 2008:
| | | Foreign | | | | | | Unrealized |
| Forward Currency | | Currency | | | | | | Appreciation |
| Exchange Contracts | | Amounts | | Cost ($) | | Value ($) (Depreciation) ($) |
| |
| |
| |
|
| Purchases: | | | | | | | | |
| Swiss Franc, | | | | | | | | |
| Expiring 12/17/2008 | | 452,402 | | 404,694 | | 390,418 | | (14,276) |
| Swiss Franc, | | | | | | | | |
| Expiring 12/17/2008 | | 862,400 | | 763,888 | | 744,242 | | (19,646) |
| Swiss Franc, | | | | | | | | |
| Expiring 12/17/2008 | | 1,509,200 | | 1,333,215 | | 1,302,424 | | (30,791) |
| Swiss Franc, | | | | | | | | |
| Expiring 12/17/2008 | | 300,400 | | 261,206 | | 259,242 | | (1,964) |
| Swiss Franc, | | | | | | | | |
| Expiring 12/17/2008 | | 2,703,600 | | 2,353,650 | | 2,333,179 | | (20,471) |
| Swiss Franc, | | | | | | | | |
| Expiring 12/17/2008 | | 895,750 | | 777,291 | | 773,023 | | (4,268) |
| Swiss Franc, | | | | | | | | |
| Expiring 12/17/2008 | | 3,002,000 | | 2,583,076 | | 2,590,695 | | 7,619 |
| Euro | | | | | | | | |
| Expiring 12/17/2008 | | 595,451 | | 840,664 | | 757,895 | | (82,769) |
| Euro | | | | | | | | |
| Expiring 12/17/2008 | | 5,178,315 | | 7,231,413 | | 6,591,002 | | (640,411) |
| Euro | | | | | | | | |
| Expiring 12/17/2008 | | 44,500 | | 59,634 | | 56,640 | | (2,994) |
| British Pound, | | | | | | | | |
| Expiring 12/17/2008 | | 184,173 | | 320,872 | | 295,585 | | (25,287) |
The Fund 65
| NOTES TO FINANCIAL STATEMENTS (continued) |
| | | Foreign | | | | | | Unrealized |
| Forward Currency | | Currency | | | | | | Appreciation |
| Exchange Contracts | | Amounts | | Cost ($) | | Value ($) (Depreciation) ($) |
| |
| |
| |
|
| Purchases (continued): | | | | | | | | |
| British Pound, | | | | | | | | |
| Expiring 12/17/2008 | | 385,875 | | 677,164 | | 619,303 | | (57,861) |
| British Pound, | | | | | | | | |
| Expiring 12/17/2008 | | 1,485,476 | | 2,605,644 | | 2,384,088 | | (221,556) |
| British Pound, | | | | | | | | |
| Expiring 12/17/2008 | | 1,806,426 | | 3,149,377 | | 2,899,191 | | (250,186) |
| Norwegian Krone, | | | | | | | | |
| Expiring 12/17/2008 | | 7,577,800 | | 1,075,001 | | 1,121,157 | | 46,156 |
| Norwegian Krone, | | | | | | | | |
| Expiring 12/17/2008 | | 4,825,000 | | 722,507 | | 713,873 | | (8,634) |
| New Zealand Dollar, | | | | | | | | |
| Expiring 12/17/2008 | | 1,196,210 | | 792,818 | | 692,504 | | (100,314) |
| New Zealand Dollar, | | | | | | | | |
| Expiring 12/17/2008 | | 1,318,012 | | 874,416 | | 763,017 | | (111,399) |
| New Zealand Dollar, | | | | | | | | |
| Expiring 12/17/2008 | | 4,468,544 | | 2,959,897 | | 2,586,906 | | (372,991) |
| New Zealand Dollar, | | | | | | | | |
| Expiring 12/17/2008 | | 2,891,702 | | 1,902,407 | | 1,674,049 | | (228,358) |
| Swedish Krona, | | | | | | | | |
| Expiring 12/17/2008 | | 2,653,830 | | 392,311 | | 341,616 | | (50,696) |
| Swedish Krona, | | | | | | | | |
| Expiring 12/17/2008 | | 1,771,414 | | 261,962 | | 228,026 | | (33,936) |
| Swedish Krona, | | | | | | | | |
| Expiring 12/17/2008 | | 21,369,606 | | 3,146,383 | | 2,750,813 | | (395,570) |
| Swedish Krona, | | | | | | | | |
| Expiring 12/17/2008 | | 9,968,400 | | 1,277,130 | | 1,283,187 | | 6,057 |
| Swedish Krona, | | | | | | | | |
| Expiring 12/17/2008 | | 6,645,600 | | 857,054 | | 855,458 | | (1,596) |
| Swedish Krona, | | | | | | | | |
| Expiring 12/17/2008 | | 14,636,000 | | 1,871,563 | | 1,884,026 | | 12,463 |
| Sales: | | | | Proceeds ($) | | | | |
| Australian Dollar, | | | | | | | | |
| Expiring 12/17/2008 | | 1,734,760 | | 1,383,358 | | 1,147,764 | | 235,594 |
| Australian Dollar, | | | | | | | | |
| Expiring 12/17/2008 | | 2,241,000 | | 1,503,487 | | 1,482,706 | | 20,781 |
| Australian Dollar, | | | | | | | | |
| Expiring 12/17/2008 | | 1,239,300 | | 865,899 | | 819,954 | | 45,945 |
| Australian Dollar, | | | | | | | | |
| Expiring 12/17/2008 | | 2,065,500 | | 1,408,881 | | 1,366,590 | | 42,291 |
| Australian Dollar, | | | | | | | | |
| Expiring 12/17/2008 | | 1,176,600 | | 841,992 | | 778,470 | | 63,522 |
66
| | | Foreign | | | | | | Unrealized |
| Forward Currency | | Currency | | | | | | Appreciation |
| Exchange Contracts | | Amounts | | Proceeds ($) | | Value ($) (Depreciation) ($) |
| |
| |
| |
|
| Sales (continued): | | | | | | | | |
| Australian Dollar, | | | | | | | | |
| Expiring 12/17/2008 | | 2,059,050 | | 1,440,923 | | 1,362,323 | | 78,600 |
| Australian Dollar, | | | | | | | | |
| Expiring 12/17/2008 | | 91,750 | | 63,050 | | 60,704 | | 2,346 |
| Australian Dollar, | | | | | | | | |
| Expiring 12/17/2008 | | 305,000 | | 189,969 | | 201,796 | | (11,827) |
| Canadian Dollar, | | | | | | | | |
| Expiring 12/17/2008 | | 3,859,260 | | 3,604,966 | | 3,201,734 | | 403,232 |
| Canadian Dollar, | | | | | | | | |
| Expiring 12/17/2008 | | 86,000 | | 71,057 | | 71,348 | | (291) |
| Canadian Dollar, | | | | | | | | |
| Expiring 12/17/2008 | | 313,000 | | 242,054 | | 259,672 | | (17,618) |
| Japanese Yen, | | | | | | | | |
| Expiring 12/17/2008 | | 28,746,505 | | 272,401 | | 292,448 | | (20,047) |
| Japanese Yen, | | | | | | | | |
| Expiring 12/17/2008 | | 33,054,000 | | 339,183 | | 336,270 | | 2,913 |
| Total | | | | | | | | (1,758,238) |
At October 31, 2008, the cost of investments for federal income tax purposes was $168,890,748; accordingly, accumulated net unrealized depreciation on investments was $41,569,250, consisting of $1,112,880 gross unrealized appreciation and $42,682,130 gross unrealized depreciation.
In March 2008, the FASB released Statement of Financial Accounting Standards No. 161 “Disclosures about Derivative Instruments and Hedging Activities” (“FAS 161”). FAS 161 requires qualitative disclosures about objectives and strategies for using derivatives, quantitative disclosures about fair value amounts of gains and losses on derivative instruments and disclosures about credit-risk-related contingent features in derivative agreements.The application of FAS 161 is required for fiscal years and interim periods beginning after November 15, 2008. At this time, management is evaluating the implications of FAS 161 and its impact on the financial statements and the accompanying notes has not yet been determined.
The Fund 67
| NOTES TO FINANCIAL STATEMENTS (continued) |
NOTE 5—Subsequent Event:
Effective on or about February 4, 2009 (the “Effective Date”), the fund will issue to each holder of its Class T shares, in exchange for said shares, Class A shares of the fund having an aggregate net asset value equal to the aggregate net asset value of the shareholder’s Class T shares.Thereafter, the fund will no longer offer Class T shares.
Effective on or about December 3, 2008, no investments for new accounts will be permitted in Class T of the fund, except that participants in certain group retirement plans will be able to open a new account in Class T of the fund, if the fund was established as an investment option under the plans before December 3, 2008. After the Effective Date, subsequent investments in the fund’s Class A shares made by holders of the fund’s Class T shares who received Class A shares of the fund in exchange for their Class T shares will be subject to the front-end sales load schedule currently in effect for Class T shares. Otherwise, all other Class A share attributes will be in effect.
68
REPORT OF INDEPENDENT REGISTERED PUBLIC ACCOUNTING FIRM
| | Shareholders and Board of Directors
Global Alpha Fund |
We have audited the accompanying statement of assets and liabilities, including the statements of investments and financial futures, of Global Alpha Fund (one of the series comprising Advantage Funds, Inc.) as of October 31, 2008, and the related statement of operations for the year then ended, the statement of changes in net assets for each of the two years in the period then ended and financial highlights for each of the periods indicated therein.These financial statements and financial highlights are the responsibility of the Fund’s management. Our responsibility is to express an opinion on these financial statements and financial highlights based on our audits.
We conducted our audits in accordance with the standards of the Public Company Accounting Oversight Board (United States).Those standards require that we plan and perform the audit to obtain reasonable assurance about whether the financial statements and financial highlights are free of material misstatement.We were not engaged to perform an audit of the Fund’s internal control over financial reporting. Our audits included consideration of internal control over financial reporting as a basis for designing audit procedures that are appropriate in the circumstances, but not for the purpose of expressing an opinion on the effectiveness of the Fund’s internal control over financial reporting.Accordingly, we express no such opinion. An audit also includes examining, on a test basis, evidence supporting the amounts and disclosures in the financial statements and financial highlights, assessing the accounting principles used and significant estimates made by management, and evaluating the overall financial statement presentation. Our procedures included confirmation of securities owned as of October 31, 2008 by correspondence with the custodian and others.We believe that our audits provide a reasonable basis for our opinion.
In our opinion, the financial statements and financial highlights referred to above present fairly, in all material respects, the financial position of Global Alpha Fund at October 31, 2008, the results of its operations for the year then ended, the changes in its net assets for each of the two years in the period then ended and the financial highlights for each of the indicated periods, in conformity with U.S. generally accepted accounting principles.
| New York, New York |
| December 23, 2008 |
The Fund 69
IMPORTANT TAX INFORMATION (Unaudited)
For federal tax purposes the fund hereby designates 9.16% of the ordinary dividends paid during the fiscal year ended October 31, 2008 as qualifying for the corporate dividends received deduction. Also certain dividends paid by the fund may be subject to a maximum tax rate of 15%, as provided for by the Jobs and GrowthTax Relief Reconciliation Act of 2003. Of the distributions paid during the fiscal year, $1,079,178 represents the maximum amount that may be considered qualified dividend income. Shareholders will receive notification in January 2009 of the percentage applicable to the preparation of their 2008 income tax returns.Also, the fund hereby designates 61.70% of ordinary income dividends paid during the fiscal year ended October 31, 2008 as qualifying “interest related dividends”. Also, the fund hereby designates $.0229 per share as a long-term capital gain distribution and $.1463 per share as a short-term capital gain distribution paid on December 28, 2007.
70
BOARD MEMBERS INFORMATION (Unaudited)

The Fund 71
BOARD MEMBERS INFORMATION (Unaudited) (continued)

72

The Fund 73
OFFICERS OF THE FUND (Unaudited)
74

The Fund 75
NOTES

The Registrant has adopted a code of ethics that applies to the Registrant's principal executive officer, principal financial officer, principal accounting officer or controller, or persons performing similar functions. There have been no amendments to, or waivers in connection with, the Code of Ethics during the period covered by this Report.
| Item 3. | | Audit Committee Financial Expert. |
The Registrant's Board has determined that David P. Feldman, a member of the Audit Committee of the Board, is an audit committee financial expert as defined by the Securities and Exchange Commission (the "SEC"). David P. Feldman is "independent" as defined by the SEC for purposes of audit committee financial expert determinations.
| Item 4. | | Principal Accountant Fees and Services. |
(a) Audit Fees. The aggregate fees billed for each of the last two fiscal years (the "Reporting Periods") for professional services rendered by the Registrant's principal accountant (the "Auditor") for the audit of the Registrant's annual financial statements or services that are normally provided by the Auditor in connection with the statutory and regulatory filings or engagements for the Reporting Periods, were $58,804 in 2007 and $90,668 in 2008.
(b) Audit-Related Fees. The aggregate fees billed in the Reporting Periods for assurance and related services by the Auditor that are reasonably related to the performance of the audit of the Registrant's financial statements and are not reported under paragraph (a) of this Item 4 were $10,244 in 2007 and $20,796 in 2008.
The aggregate fees billed in the Reporting Periods for non-audit assurance and related services by the Auditor to the Registrant's investment adviser (not including any sub-investment adviser whose role is primarily portfolio management and is subcontracted with or overseen by another investment adviser), and any entity controlling, controlled by or under common control with the investment adviser that provides ongoing services to the Registrant ("Service Affiliates"), that were reasonably related to the performance of the annual audit of the Service Affiliate, which required pre-approval by the Audit Committee were $0 in 2007 and $0 in 2008.
Note: For the second paragraph in each of (b) through (d) of this Item 4, certain of such services were not pre-approved prior to May 6, 2003, when such services were required to be pre-approved. On and after May 6, 2003, 100% of all services provided by the Auditor were pre-approved as required. For comparative purposes, the fees shown assume that all such services were pre-approved, including services that were not pre-approved prior to the compliance date of the pre-approval requirement.
(c) Tax Fees. The aggregate fees billed in the Reporting Periods for professional services rendered by the Auditor for tax compliance, tax advice, and tax planning ("Tax Services") were $8,792 in 2007 and $18,527 in 2008. These services consisted of: (i) review or preparation of U.S. federal, state, local and excise tax returns; (ii) U.S. federal, state and local tax planning, advice and assistance regarding statutory, regulatory or administrative developments; (iii) tax advice regarding tax qualification matters and/or treatment of various financial instruments held or proposed to be acquired or held. The aggregate fees billed in the Reporting Periods for Tax Services by the Auditor to Service Affiliates, which required pre-approval by the Audit Committee were $0 in 2007 and $0 in 2008.
(d) All Other Fees. The aggregate fees billed in the Reporting Periods for products and services provided by the Auditor, other than the services reported in paragraphs (a) through (c) of this Item, were $0 in 2007 and $160 in 2008. [These services consisted of a review of the Registrant's anti-money laundering program].
The aggregate fees billed in the Reporting Periods for Non-Audit Services by the Auditor to Service Affiliates, other than the services reported in paragraphs (b) through (c) of this Item, which required pre-approval by the Audit Committee, were $0 in 2007 and $0 in 2008.
Audit Committee Pre-Approval Policies and Procedures. The Registrant's Audit Committee has established policies and procedures (the "Policy") for pre-approval (within specified fee limits) of the Auditor's engagements for non-audit services to the Registrant and Service Affiliates without specific case-by-case consideration. Pre-approval considerations include whether the proposed services are compatible with maintaining the Auditor's independence. Pre-approvals pursuant to the Policy are considered annually.
Non-Audit Fees. The aggregate non-audit fees billed by the Auditor for services rendered to the Registrant, and rendered to Service Affiliates, for the Reporting Periods were $1,627,514 in 2007 and $7,879,835 in 2008.
Auditor Independence. The Registrant's Audit Committee has considered whether the provision of non-audit services that were rendered to Service Affiliates, which were not pre-approved (not requiring pre-approval), is compatible with maintaining the Auditor's independence.
| Item 5. | | Audit Committee of Listed Registrants. |
| | | Not applicable. [CLOSED-END FUNDS ONLY] |
| Item 6. | | Investments. |
| (a) | | Not applicable. |
| Item 7. | | Disclosure of Proxy Voting Policies and Procedures for Closed-End Management |
| | | Investment Companies. |
| | | Not applicable. [CLOSED-END FUNDS ONLY] |
| Item 8. | | Portfolio Managers of Closed-End Management Investment Companies. |
| | | Not applicable. [CLOSED-END FUNDS ONLY, beginning with reports for periods ended |
| | | on and after December 31, 2005] |
| Item 9. | | Purchases of Equity Securities by Closed-End Management Investment Companies and |
| | | Affiliated Purchasers. |
| | | Not applicable. [CLOSED-END FUNDS ONLY] |
| Item 10. | | Submission of Matters to a Vote of Security Holders. |
The Registrant has a Nominating Committee (the "Committee"), which is responsible for selecting and nominating persons for election or appointment by the Registrant's Board as Board members. The Committee has adopted a Nominating Committee Charter (the "Charter"). Pursuant to the Charter, the Committee will consider recommendations for nominees from shareholders submitted to the Secretary of the Registrant, c/o The Dreyfus Corporation Legal Department, 200 Park Avenue, 8th Floor East, New York,
New York 10166. A nomination submission must include information regarding the recommended nominee as specified in the Charter. This information includes all information relating to a recommended nominee that is required to be disclosed in solicitations or proxy statements for the election of Board members, as well as information sufficient to evaluate the factors to be considered by the Committee, including character and integrity, business and professional experience, and whether the person has the ability to apply sound and independent business judgment and would act in the interests of the Registrant and its shareholders. Nomination submissions are required to be accompanied by a written consent of the individual to stand for election if nominated by the Board and to serve if elected by the shareholders, and such additional information must be provided regarding the recommended nominee as reasonably requested by the Committee.
| Item 11. | | Controls and Procedures. |
(a) The Registrant's principal executive and principal financial officers have concluded, based on their evaluation of the Registrant's disclosure controls and procedures as of a date within 90 days of the filing date of this report, that the Registrant's disclosure controls and procedures are reasonably designed to ensure that information required to be disclosed by the Registrant on Form N-CSR is recorded, processed, summarized and reported within the required time periods and that information required to be disclosed by the Registrant in the reports that it files or submits on Form N-CSR is accumulated and communicated to the Registrant's management, including its principal executive and principal financial officers, as appropriate to allow timely decisions regarding required disclosure.
(b) There were no changes to the Registrant's internal control over financial reporting that occurred during the second fiscal quarter of the period covered by this report that have materially affected, or are reasonably likely to materially affect, the Registrant's internal control over financial reporting.
(a)(1) Code of ethics referred to in Item 2.
(a)(2) Certifications of principal executive and principal financial officers as required by Rule 30a-2(a) under the Investment Company Act of 1940.
(a)(3) Not applicable.
(b) Certification of principal executive and principal financial officers as required by Rule 30a-2(b) under the Investment Company Act of 1940.
Pursuant to the requirements of the Securities Exchange Act of 1934 and the Investment Company Act of 1940, the Registrant has duly caused this Report to be signed on its behalf by the undersigned, thereunto duly authorized.
Advantage Funds, Inc.
| By: | | /s/ J. David Officer |
| | | |
| | | J. David Officer, |
| | President |
| |
| Date: | | December 18, 2008 |
Pursuant to the requirements of the Securities Exchange Act of 1934 and the Investment Company Act of 1940, this Report has been signed below by the following persons on behalf of the Registrant and in the capacities and on the dates indicated.
| By: | | /s/ J. David Officer |
| | | |
| | | J. David Officer, |
| | President |
|
| Date: | | December 18, 2008 |
| By: | | /s/ James Windels |
| | | |
| | | James Windels, |
| | Treasurer |
| |
| Date: | | December 18, 2008 |
(a)(1) Code of ethics referred to in Item 2.
(a)(2) Certifications of principal executive and principal financial officers as required by Rule 30a-2(a) under the Investment Company Act of 1940. (EX-99.CERT)
(b) Certification of principal executive and principal financial officers as required by Rule 30a-2(b) under the Investment Company Act of 1940. (EX-99.906CERT)