UNITED STATES
SECURITIES AND EXCHANGE COMMISSION
Washington, D.C. 20549 |
CERTIFIED SHAREHOLDER REPORT OF REGISTERED MANAGEMENT
INVESTMENT COMPANIES |
| Investment Company Act file number | | 811- 7123 |
Advantage Funds, Inc.
(Exact name of Registrant as specified in charter) |
c/o The Dreyfus Corporation
200 Park Avenue
New York, New York 10166
(Address of principal executive offices) (Zip code) |
Michael A. Rosenberg, Esq.
200 Park Avenue
New York, New York 10166
(Name and address of agent for service) |
| Registrant's telephone number, including area code: | | (212) 922-6000 |
| Date of fiscal year end: | | 8/31 |
| Date of reporting period: | | 8/31/09 |
The following N-CSR relates only to the Registrant's series listed below and does not affect the other series of the Registrant, which have a different fiscal year end and, therefore, different N-CSR reporting requirements. A separate Form N-CSR will be filed for these series as appropriate.
| | Dreyfus Emerging Leaders Fund
Dreyfus International Value Fund
Dreyfus Midcap Value Fund
Dreyfus Small Company Value Fund
Dreyfus Strategic Value Fund
Dreyfus Structured Midcap Fund
Dreyfus Technology Growth Fund
|
| Item 1. | | Reports to Stockholders. |
Save time. Save paper. View your next shareholder report online as soon as it’s available. Log into www.dreyfus.com and sign up for Dreyfus eCommunications. It’s simple and only takes a few minutes.
The views expressed in this report reflect those of the portfolio manager only through the end of the period covered and do not necessarily represent the views of Dreyfus or any other person in the Dreyfus organization. Any such views are subject to change at any time based upon market or other conditions and Dreyfus disclaims any responsibility to update such views.These views may not be relied on as investment advice and, because investment decisions for a Dreyfus fund are based on numerous factors, may not be relied on as an indication of trading intent on behalf of any Dreyfus fund.
Not FDIC-Insured • Not Bank-Guaranteed • May Lose Value
| | Contents |
| |
| | THE FUND |
| |
| 2 | A Letter from the Chairman and CEO |
| |
| 3 | Discussion of Fund Performance |
| |
| 6 | Fund Performance |
| |
| 7 | Understanding Your Fund’s Expenses |
| |
| 7 | Comparing Your Fund’s Expenses With Those of Other Funds |
| |
| 8 | Statement of Investments |
| |
| 16 | Statement of Assets and Liabilities |
| |
| 17 | Statement of Operations |
| |
| 18 | Statement of Changes in Net Assets |
| |
| 19 | Financial Highlights |
| |
| 20 | Notes to Financial Statements |
| |
| 28 | Report of Independent Registered Public Accounting Firm |
| |
| 29 | Important Tax Information |
| |
| 30 | Information About the Review and Approval of the Fund’s Management Agreement |
| |
| 34 | Board Members Information |
| |
| 36 | Officers of the Fund |
| |
| | FOR MORE INFORMATION |
| |
| | Back Cover |
| |
Dreyfus
Emerging Leaders Fund |

A LETTER FROM THE CHAIRMAN AND CEO
Dear Shareholder:
We are pleased to present this annual report for Dreyfus Emerging Leaders Fund, covering the 12-month period from September 1, 2008, through August 31, 2009.
At long last, the current recession cycle appears to be winding down. After generally slumping since December 2007, we expect U.S. economic growth to pick up during the third quarter of 2009. Highly stimulative monetary and fiscal policies domestically and throughout the world, combined with the low cost of debt and equity capital compared to historical norms, already have sparked a rebound in industrial production as manufacturers replenish their depleted inventories. However, we continue to anticipate a slower-than-average recovery, with the unemployment rate likely to remain elevated over the next several quarters.
The U.S. stock market anticipated the economic upturn with a sustained market rally that began in early March 2009. Although the rebound initially was concentrated primarily among lower-quality stocks that had been severely punished in the downturn, it later broadened to include virtually all economic sectors and capitalization ranges. While we are encouraged by the market’s recent strength, we remain concerned that improving investor sentiment may have exceeded the revival of business fundamentals.Accordingly, we continue to believe that careful selectivity and risk management will be keys to success in the financial markets over the foreseeable future.As always, we urge you to speak with your financial adviser about the potential opportunities and obstacles in today’s investment environment.
For information about how the fund performed during the reporting period, as well as market perspectives, we have provided a Discussion of Fund Performance given by the Portfolio Managers.
Thank you for your continued confidence and support.

Jonathan R. Baum
Chairman and Chief Executive Officer
The Dreyfus Corporation
September 15, 2009 |
2

DISCUSSION OF FUND PERFORMANCE
For the period of September 1, 2008, through August 31, 2009, as provided by Oliver Buckley, Langton C. Garvin and Kristin Crawford, Portfolio Managers
Fund and Market Performance Overview
For the 12-month period ended August 31, 2009, Dreyfus Emerging Leaders Fund produced a total return of –29.73%.1 In comparison, the fund’s benchmark, the Russell 2000 Index (the “Index”), achieved a –21.29% total return for the same period.2
A severe recession and global banking crisis fueled steep declines in small-cap stock prices over the reporting period’s first half, but a sustained market rally over the spring and summer of 2009 offset a significant portion of earlier losses.The fund produced lower returns than its benchmark, primarily due to the ineffectiveness of the momentum and value factors considered by our investment process under extremely volatile market conditions.
The Fund’s Investment Approach
The fund seeks capital growth by investing at least 80% of its assets in companies we believe are emerging leaders: small companies characterized by new or innovative products, services or processes having the potential to enhance earnings growth. Our investment process is driven by computer models that identify and rank stocks based on fundamental momentum, relative value, future value, long-term growth and additional factors, such as technical factors. We attempt to maintain a neutral exposure to industry groups relative to the Index.Within each sector, we overweight the stocks ranked most attractive and underweight or avoid those ranked least attractive.
Equity Markets Plunged, Then Rebounded Sharply
Like other capitalization ranges, the small-cap stock market endured a year of extreme volatility. Just weeks after the start of the reporting period, massive losses among mortgage- and asset-backed securities led to the failure of several major financial institutions and for a time it
The Fund 3
| DISCUSSION OF FUND PERFORMANCE (continued) |
seemed as if a collapse of the worldwide banking system was not out of the question. Meanwhile, rising unemployment, plunging housing prices and depressed consumer confidence characterized what will likely be the longest and most severe economic downturn in the postwar period. These influences sparked a bear market that drove many stock market averages, including the fund’s benchmark, to multi-year lows. The decline was broad-based, affecting industry groups and individual stocks seemingly regardless of their underlying business fundamentals.
However, market sentiment suddenly began to improve in early March, as aggressive remedial measures adopted by government and monetary authorities seemed to gain traction. Additional evidence of economic stabilization later appeared, supporting a sustained market rally that lasted through the reporting period’s end. Lower-quality stocks that had been severely punished in the downturn led the market’s 2009 advance.
Stock Selection Process Produced Mixed Results
Our stock selection process is designed to select stocks with favorable earnings and price momentum and attractive valuations. Unfortunately, the momentum factors considered by our investment process proved relatively ineffective in the highly turbulent market environment.Valuation and other considerations of attractiveness (such as quality/sustainability metrics) helped to add value, as did a decision to establish a modest tilt away from highly leveraged companies during the credit crisis.However, the inconsistency of momentum variables caused the fund’s returns to lag its benchmark for the reporting period overall.
The fund’s relative performance was particularly weak in the energy resources and biotechnology industry groups. Some of the fund’s greater disappointments for the reporting period included Myriad Genetics, where lower revenue growth in the company’s molecular diagnostics business hurt its stock price. Medical devices research company Parexel International reported disappointing earnings as its large corporate customers cut spending in the recession. Callon Petroleum Co. also posted poor earnings, largely due to the effects of stubbornly low natural gas prices. In other market sectors, Puerto Rico bank Oriental Financial Group was hurt by nonperforming loans during the
4
financial crisis. Metals fabricator NCI Building Systems was burdened by a heavy debt load in a slumping construction market.
The fund also held its share of better performers, particularly in the consumer durables, electronic equipment and commercial services industry groups. Relatively strong performers during the reporting period included wireless equipment and software provider Starent Networks, which benefited from the rapid growth in demand for multimedia content over mobile phones. Construction equipment maker Astec Industries and heavy equipment seller Rush Enterprises held up better than market averages due to investors’ hopes that the U.S. government’s economic stimulus program would revive public works projects. In the financial services sector, asset manager Knight Capital Group and investment bank Greenhill & Co. won more business while their larger rivals suffered in the credit crisis.
Positioned for an Improved Environment
We have maintained our disciplined investment process, which seeks attractively valued small-cap companies with favorable momentum characteristics. Although market volatility has remained elevated, we have seen recent evidence that investors are focusing more closely on underlying fundamentals.We believe that our process will work more effectively if, as we expect, investors continue to return to rational decision-making under less onerous economic and market conditions.
September 15, 2009
| | | Please note, the position in any security highlighted with italicized typeface was sold during the |
| | | reporting period. |
| 1 | | Total return includes reinvestment of dividends and any capital gains paid. Past performance is no |
| | | guarantee of future results. Share price and investment return fluctuate such that upon redemption, |
| | | fund shares may be worth more or less than their original cost.The Dreyfus Corporation has |
| | | undertaken to absorb certain fund expenses pursuant to an agreement in effect through March 31, |
| | | 2010, at which time it may be extended, terminated or modified. |
| 2 | | SOURCE: LIPPER INC. — Reflects reinvestment of dividends and, where applicable, capital |
| | | gain distributions.The Russell 2000 Index is an unmanaged index of small-cap stock performance |
| | | and is composed of the 2,000 smallest companies in the Russell 3000 Index.The Russell 3000 |
| | | Index is composed of the 3,000 largest U.S. companies based on total market capitalization. |
The Fund 5
FUND PERFORMANCE
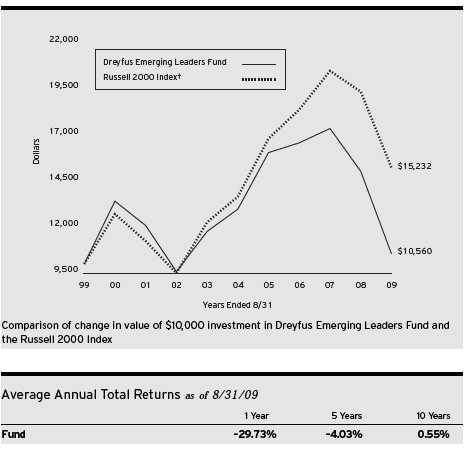
| † Source: Lipper Inc. |
| Past performance is not predictive of future performance.The fund’s performance shown in the graph and table does not |
| reflect the deduction of taxes that a shareholder would pay on fund distributions or the redemption of fund shares. |
| The above graph compares a $10,000 investment made in Dreyfus Emerging Leaders Fund on 8/31/99 to a |
| $10,000 investment made in the Russell 2000 Index (the “Index”) on that date. All dividends and capital gain |
| distributions are reinvested. |
| The fund’s performance shown in the line graph takes into account all applicable fees and expenses.The Russell 2000 |
| Index is an unmanaged index and is composed of the 2,000 smallest companies in the Russell 3000 Index.The |
| Russell 3000 Index is composed of 3,000 of the largest U.S. companies by market capitalization. Unlike a mutual |
| fund, the Index is not subject to charges, fees and other expenses. Investors cannot invest directly in any index. Further |
| information relating to fund performance, including expense reimbursements, if applicable, is contained in the Financial |
| Highlights section of the prospectus and elsewhere in this report. |
6
UNDERSTANDING YOUR FUND’S EXPENSES (Unaudited)
As a mutual fund investor, you pay ongoing expenses, such as management fees and other expenses. Using the information below, you can estimate how these expenses affect your investment and compare them with the expenses of other funds.You also may pay one-time transaction expenses, including sales charges (loads) and redemption fees, which are not shown in this section and would have resulted in higher total expenses. For more information, see your fund’s prospectus or talk to your financial adviser.
Review your fund’s expenses
The table below shows the expenses you would have paid on a $1,000 investment in Dreyfus Emerging Leaders Fund from March 1, 2009 to August 31, 2009. It also shows how much a $1,000 investment would be worth at the close of the period, assuming actual returns and expenses.
| Expenses and Value of a $1,000 Investment |
| assuming actual returns for the six months ended August 31, 2009 |
|
| |
| Expenses paid per $1,000† | | $8.87 |
| Ending value (after expenses) | | $1,395.10 |
| COMPARING YOUR FUND’S EXPENSES |
| WITH THOSE OF OTHER FUNDS (Unaudited) |
Using the SEC’s method to compare expenses
The Securities and Exchange Commission (SEC) has established guidelines to help investors assess fund expenses. Per these guidelines, the table below shows your fund’s expenses based on a $1,000 investment, assuming a hypothetical 5% annualized return. You can use this information to compare the ongoing expenses (but not transaction expenses or total cost) of investing in the fund with those of other funds.All mutual fund shareholder reports will provide this information to help you make this comparison. Please note that you cannot use this information to estimate your actual ending account balance and expenses paid during the period.
| Expenses and Value of a $1,000 Investment |
| assuming a hypothetical 5% annualized return for the six months ended August 31, 2009 |
|
| |
| Expenses paid per $1,000† | | $7.48 |
| Ending value (after expenses) | | $1,017.80 |
† Expenses are equal to the fund’s annualized expense ratio of 1.47%, multiplied by the average account value over the period, multiplied by 184/365 (to reflect the one-half year period).
The Fund 7
| STATEMENT OF INVESTMENTS |
| August 31, 2009 |
| Common Stocks—99.5% | | Shares | | Value ($) |
| |
| |
|
| Commercial & Professional Services—8.3% | | | | |
| Advent Software | | 4,900 a,b | | 189,581 |
| Anixter International | | 26,600 a,b | | 933,128 |
| ATC Technology | | 30,900 b | | 646,428 |
| Ennis | | 109,200 | | 1,488,396 |
| Kforce | | 23,500 b | | 263,200 |
| M & F Worldwide | | 26,900 b | | 527,778 |
| Nash Finch | | 24,100 a | | 654,074 |
| Rush Enterprises, Cl. A | | 61,199 b | | 857,398 |
| ScanSource | | 24,500 b | | 685,755 |
| School Specialty | | 57,500 a,b | | 1,310,425 |
| Stamps.com | | 26,700 b | | 230,154 |
| TeleTech Holdings | | 63,200 b | | 1,078,192 |
| VistaPrint | | 2,300 a,b | | 95,312 |
| World Fuel Services | | 18,600 a | | 835,884 |
| Wright Express | | 47,500 b | | 1,497,200 |
| | | | | 11,292,905 |
| Communications—3.0% | | | | |
| Cogent Communications Group | | 49,000 a,b | | 472,850 |
| iPCS | | 46,600 b | | 735,814 |
| NTELOS Holdings | | 26,300 | | 426,323 |
| Starent Networks | | 70,000 a,b | | 1,416,800 |
| USA Mobility | | 86,100 | | 1,096,053 |
| | | | | 4,147,840 |
| Consumer Durables—3.6% | | | | |
| Briggs & Stratton | | 27,700 a | | 488,628 |
| Cooper Tire & Rubber | | 9,600 a | | 137,088 |
| Fossil | | 43,500 b | | 1,104,030 |
| Fuel Systems Solutions | | 24,900 a,b | | 834,648 |
| M/I Homes | | 20,900 b | | 330,638 |
| Matthews International, Cl. A | | 13,500 | | 470,340 |
| Meritage Homes | | 18,700 a,b | | 419,067 |
| Polaris Industries | | 32,000 a | | 1,206,720 |
| | | | | 4,991,159 |
| Consumer Non-Durables—3.5% | | | | |
| Cal-Maine Foods | | 18,600 a | | 531,030 |
| Carter’s | | 13,900 b | | 349,724 |
8
| Common Stocks (continued) | | Shares | | Value ($) |
| |
| |
|
| Consumer Non-Durables (continued) | | | | |
| Central Garden & Pet, Cl. A | | 126,400 b | | 1,390,400 |
| Elizabeth Arden | | 105,200 b | | 1,083,560 |
| J & J Snack Foods | | 8,700 | | 380,190 |
| Jones Apparel Group | | 14,900 | | 232,291 |
| Oxford Industries | | 33,100 | | 463,400 |
| Steven Madden | | 12,100 b | | 389,983 |
| | | | | 4,820,578 |
| Consumer Services—3.9% | | | | |
| California Pizza Kitchen | | 25,300 b | | 355,718 |
| Cheesecake Factory | | 37,400 b | | 687,038 |
| Corinthian Colleges | | 16,600 a,b | | 318,222 |
| DineEquity | | 14,500 a | | 305,660 |
| Isle of Capri Casinos | | 20,100 a,b | | 205,623 |
| Marcus | | 20,300 | | 254,156 |
| P.F. Chang’s China Bistro | | 30,500 a,b | | 973,255 |
| Pinnacle Entertainment | | 48,700 b | | 456,806 |
| Pre-Paid Legal Services | | 34,100 b | | 1,563,144 |
| Ruby Tuesday | | 38,700 b | | 282,510 |
| | | | | 5,402,132 |
| Electronic Technology—10.2% | | | | |
| Acme Packet | | 89,800 b | | 732,768 |
| Arris Group | | 67,600 b | | 896,376 |
| Avocent | | 18,600 b | | 303,552 |
| Benchmark Electronics | | 66,500 b | | 1,090,600 |
| Cray | | 37,400 b | | 273,394 |
| Cubic | | 12,200 | | 433,344 |
| EMS Technologies | | 15,300 b | | 286,722 |
| Hexcel | | 65,100 b | | 708,288 |
| Imation | | 55,700 | | 479,020 |
| Intevac | | 76,800 b | | 897,024 |
| Loral Space and Communications | | 18,600 a,b | | 383,904 |
| Microsemi | | 45,600 b | | 643,416 |
| Novatel Wireless | | 20,700 a,b | | 199,755 |
| OmniVision Technologies | | 12,600 b | | 184,338 |
| Oplink Communications | | 29,500 b | | 409,460 |
| Silicon Graphics International | | 37,100 b | | 203,679 |
The Fund 9
| STATEMENT OF INVESTMENTS (continued) |
| Common Stocks (continued) | | Shares | | Value ($) |
| |
| |
|
| Electronic Technology (continued) | | | | |
| Skyworks Solutions | | 70,700 b | | 823,655 |
| Standard Microsystems | | 24,800 b | | 577,344 |
| Tessera Technologies | | 46,800 b | | 1,176,084 |
| TTM Technologies | | 66,600 a,b | | 673,992 |
| Volterra Semiconductor | | 106,500 b | | 1,886,115 |
| Zoran | | 62,000 b | | 685,100 |
| | | | | 13,947,930 |
| Energy Minerals—2.3% | | | | |
| Arena Resources | | 15,200 b | | 464,816 |
| Carrizo Oil & Gas | | 17,200 a,b | | 332,476 |
| Clayton Williams Energy | | 8,400 a,b | | 166,320 |
| GMX Resources | | 31,200 a,b | | 330,408 |
| Goodrich Petroleum | | 12,600 a,b | | 301,644 |
| McMoRan Exploration | | 41,700 a,b | | 347,778 |
| Stone Energy | | 95,900 b | | 1,223,684 |
| | | | | 3,167,126 |
| Finance—21.1% | | | | |
| American Physicians Capital | | 41,333 | | 1,233,377 |
| AmTrust Financial Services | | 99,600 | | 1,257,948 |
| Bank Mutual | | 110,400 | | 970,416 |
| BioMed Realty Trust | | 115,800 | | 1,560,984 |
| Calamos Asset Management, Cl. A | | 73,900 | | 833,592 |
| City Holding | | 44,100 | | 1,404,144 |
| Compass Diversified Holdings | | 90,900 | | 920,817 |
| CorVel | | 17,300 b | | 520,038 |
| Delphi Financial Group, Cl. A | | 49,200 | | 1,149,804 |
| Dollar Thrifty Automotive Group | | 28,700 a,b | | 569,408 |
| Extra Space Storage | | 185,300 a | | 1,834,470 |
| EZCORP, Cl. A | | 44,400 b | | 593,628 |
| First Midwest Bancorp | | 59,500 | | 610,470 |
| First Potomac Realty Trust | | 69,100 | | 738,679 |
| FirstMerit | | 24,666 | | 443,248 |
| Getty Realty | | 53,600 | | 1,264,424 |
| Horace Mann Educators | | 62,200 | | 761,950 |
| Inland Real Estate | | 60,800 a | | 509,504 |
10
| Common Stocks (continued) | | Shares | | Value ($) |
| |
| |
|
| Finance (continued) | | | | |
| Knight Capital Group, Cl. A | | 69,000 b | | 1,388,280 |
| National Health Investors | | 13,800 | | 456,780 |
| Nelnet, Cl. A | | 77,700 b | | 1,146,852 |
| Old National Bancorp | | 22,100 a | | 235,144 |
| Parkway Properties | | 18,600 | | 336,660 |
| Penson Worldwide | | 90,000 a,b | | 912,600 |
| PICO Holdings | | 10,200 b | | 337,926 |
| Platinum Underwriters Holdings | | 5,100 | | 184,875 |
| PMA Capital, Cl. A | | 59,100 b | | 325,641 |
| PS Business Parks | | 6,300 | | 333,459 |
| Signature Bank | | 48,000 b | | 1,457,280 |
| Sterling Bancshares | | 53,600 | | 426,120 |
| Stewart Information Services | | 25,000 | | 354,250 |
| Susquehanna Bancshares | | 108,200 a | | 631,888 |
| UMB Financial | | 17,200 | | 688,516 |
| Universal American | | 86,500 b | | 794,070 |
| Westamerica Bancorporation | | 23,300 a | | 1,198,319 |
| World Acceptance | | 21,600 a | | 562,248 |
| | | | | 28,947,809 |
| Health Care Technology—10.6% | | | | |
| Abaxis | | 33,800 a,b | | 899,080 |
| Align Technology | | 82,100 b | | 1,100,140 |
| Alkermes | | 43,900 b | | 397,295 |
| Alnylam Pharmaceuticals | | 34,200 a,b | | 763,344 |
| Cantel Medical | | 21,300 b | | 286,272 |
| Cynosure, Cl. A | | 26,000 b | | 284,700 |
| Immucor | | 26,000 b | | 470,340 |
| Invacare | | 46,000 | | 996,360 |
| Isis Pharmaceuticals | | 64,000 a,b | | 1,032,960 |
| Martek Biosciences | | 55,500 a,b | | 1,362,525 |
| Maxygen | | 39,400 b | | 278,952 |
| Medicis Pharmaceutical, Cl. A | | 27,800 | | 513,466 |
| Medivation | | 20,000 a | | 506,400 |
| Merit Medical Systems | | 43,900 b | | 792,395 |
| Momenta Pharmaceuticals | | 63,600 a,b | | 629,640 |
The Fund 11
| STATEMENT OF INVESTMENTS (continued) |
| Common Stocks (continued) | | Shares | | Value ($) |
| |
| |
|
| Health Care Technology (continued) | | | | |
| Myriad Genetics | | 24,500 b | | 748,965 |
| PDL BioPharma | | 31,500 | | 285,075 |
| Progenics Pharmaceuticals | | 47,400 a,b | | 249,798 |
| SonoSite | | 14,200 b | | 330,434 |
| STERIS | | 60,000 | | 1,741,200 |
| ViroPharma | | 107,900 a,b | | 863,200 |
| | | | | 14,532,541 |
| Industrial Services—2.2% | | | | |
| Bolt Technology | | 34,900 a,b | | 412,169 |
| Bristow Group | | 6,700 b | | 195,640 |
| Comfort Systems USA | | 50,100 | | 594,687 |
| EMCOR Group | | 25,000 b | | 579,250 |
| Gulf Island Fabrication | | 21,400 | | 320,358 |
| Michael Baker | | 16,200 b | | 542,376 |
| Tutor Perini | | 15,900 b | | 311,958 |
| | | | | 2,956,438 |
| Non-Energy Minerals—.5% | | | | |
| Haynes International | | 23,400 b | | 634,374 |
| Process Industries—3.4% | | | | |
| Darling International | | 26,600 b | | 186,466 |
| Glatfelter | | 115,900 | | 1,208,837 |
| Landec | | 106,400 b | | 650,104 |
| Minerals Technologies | | 34,900 | | 1,564,916 |
| OM Group | | 23,600 b | | 642,156 |
| Terra Industries | | 11,700 | | 363,987 |
| | | | | 4,616,466 |
| Producer Manufacturing—9.1% | | | | |
| AAON | | 18,800 a | | 392,544 |
| American Superconductor | | 26,700 a,b | | 862,677 |
| Ampco-Pittsburgh | | 10,500 | | 250,740 |
| Apogee Enterprises | | 53,100 | | 700,920 |
| Brady, Cl. A | | 15,700 | | 465,191 |
| Cascade | | 44,800 | | 1,141,504 |
| Chart Industries | | 49,500 b | | 923,670 |
| CIRCOR International | | 22,500 | | 580,725 |
| Columbus McKinnon | | 16,900 b | | 207,870 |
12
| Common Stocks (continued) | | Shares | | Value ($) |
| |
| |
|
| Producer Manufacturing (continued) | | | | |
| Comverge | | 48,600 b | | 541,404 |
| DXP Enterprises | | 30,400 b | | 322,544 |
| Encore Wire | | 11,000 a | | 260,480 |
| Energy Conversion Devices | | 42,600 a,b | | 476,694 |
| Graham | | 18,900 | | 257,418 |
| Insteel Industries | | 27,600 | | 315,192 |
| Kadant | | 13,900 b | | 161,657 |
| Knoll | | 161,100 | | 1,551,393 |
| L.B. Foster, Cl. A | | 20,200 b | | 602,364 |
| Powell Industries | | 19,100 b | | 722,362 |
| Tecumseh Products, Cl. A | | 72,300 b | | 654,315 |
| Tredegar | | 21,000 | | 314,580 |
| Woodward Governor | | 35,100 | | 736,749 |
| | | | | 12,442,993 |
| Retail Trade—5.1% | | | | |
| Cabela’s | | 13,300 a,b | | 213,465 |
| Collective Brands | | 20,500 a,b | | 324,720 |
| Dress Barn | | 65,400 a,b | | 1,061,442 |
| Genesco | | 29,600 a,b | | 648,240 |
| Insight Enterprises | | 23,200 b | | 266,104 |
| Jo-Ann Stores | | 26,300 b | | 718,516 |
| JoS. A. Bank Clothiers | | 36,100 a,b | | 1,588,761 |
| Lithia Motors, Cl. A | | 14,500 | | 185,745 |
| Pantry | | 70,400 b | | 1,066,560 |
| PriceSmart | | 18,600 a | | 330,150 |
| Regis | | 19,900 a | | 321,982 |
| Titan Machinery | | 23,600 a,b | | 284,380 |
| | | | | 7,010,065 |
| Technology Services—9.4% | | | | |
| CACI International, Cl. A | | 25,800 b | | 1,185,768 |
| Centene | | 29,900 b | | 517,569 |
| Chemed | | 35,500 a | | 1,545,670 |
| Earthlink | | 125,700 a | | 1,045,824 |
| Fair Isaac | | 34,600 | | 771,580 |
| HEALTHSOUTH | | 25,200 b | | 393,372 |
| j2 Global Communications | | 11,200 b | | 239,344 |
The Fund 13
| STATEMENT OF INVESTMENTS (continued) |
| Common Stocks (continued) | | Shares | | Value ($) |
| |
| |
|
| Technology Services (continued) | | | | |
| Jack Henry & Associates | | 21,700 | | 505,827 |
| Manhattan Associates | | 84,400 b | | 1,504,852 |
| NetScout Systems | | 67,400 b | | 772,404 |
| PAREXEL International | | 63,900 b | | 819,837 |
| PharMerica | | 48,900 a,b | | 980,445 |
| Shutterfly | | 16,500 b | | 238,590 |
| SRA International, Cl. A | | 52,100 b | | 1,035,227 |
| Sybase | | 20,100 a,b | | 700,485 |
| Vital Images | | 49,100 b | | 624,061 |
| | | | | 12,880,855 |
| Transportation—1.3% | | | | |
| Heartland Express | | 19,200 a | | 271,872 |
| Knightsbridge Tankers | | 42,600 | | 552,096 |
| Nordic American Tanker Shipping | | 21,400 a | | 637,078 |
| SkyWest | | 22,200 | | 342,990 |
| | | | | 1,804,036 |
| Utilities—2.0% | | | | |
| El Paso Electric | | 72,100 | | 1,221,374 |
| New Jersey Resources | | 6,000 | | 220,500 |
| Piedmont Natural Gas | | 25,800 a | | 619,716 |
| PNM Resources | | 51,800 | | 605,024 |
| | | | | 2,666,614 |
| Total Common Stocks | | | | |
| (cost $148,663,064) | | | | 136,261,861 |
| |
| Other Investment—.7% | | | | |
| |
| |
|
| Registered Investment Company; | | | | |
| Dreyfus Institutional Preferred | | | | |
| Plus Money Market Fund | | | | |
| (cost $970,000) | | 970,000 c | | 970,000 |
14
| Investment of Cash Collateral | | | | |
| for Securities Loaned—19.7% | | Shares | | Value ($) |
| |
| |
|
| Registered Investment Company; | | | | |
| Dreyfus Institutional Cash Advantage Fund | | | | |
| (cost $26,966,404) | | 26,966,404 c | | 26,966,404 |
| Total Investments (cost $176,599,468) | | 119.9% | | 164,198,265 |
| Liabilities, Less Cash and Receivables | | (19.9%) | | (27,244,025) |
| Net Assets | | 100.0% | | 136,954,240 |
a All or a portion of these securities are on loan. At August 31, 2009, the total market value of the fund’s securities on loan is $25,759,615 and the total market value of the collateral held by the fund is $26,966,404.
b Non-income producing security.
c Investment in affiliated money market mutual fund.
| Portfolio Summary (Unaudited)† | | | | |
| |
| | | Value (%) | | | | Value (%) |
| |
| |
| |
|
| Finance | | 21.1 | | Consumer Non-Durables | | 3.5 |
| Money Market Investments | | 20.4 | | Process Industries | | 3.4 |
| Health Care Technology | | 10.6 | | Communications | | 3.0 |
| Electronic Technology | | 10.2 | | Energy Minerals | | 2.3 |
| Technology Services | | 9.4 | | Industrial Services | | 2.2 |
| Producer Manufacturing | | 9.1 | | Utilities | | 2.0 |
| Commercial & Professional Services | | 8.3 | | Transportation | | 1.3 |
| Retail Trade | | 5.1 | | Non-Energy Minerals | | .5 |
| Consumer Services | | 3.9 | | | | |
| Consumer Durables | | 3.6 | | | | 119.9 |
| |
| † Based on net assets. | | | | | | |
| See notes to financial statements. | | | | | | |
The Fund 15
| STATEMENT OF ASSETS AND LIABILITIES |
| August 31, 2009 |
| | | Cost | | Value |
| |
| |
|
| Assets ($): | | | | |
| Investments in securities—See Statement of Investments (including | | | | |
| securities on loan, valued at $25,759,615)—Note 1(b): | | | | |
| Unaffiliated issuers | | 148,663,064 | | 136,261,861 |
| Affiliated issuers | | 27,936,404 | | 27,936,404 |
| Cash | | | | 50,096 |
| Dividends and interest receivable | | | | 94,190 |
| Receivable for shares of Common Stock subscribed | | | | 12,054 |
| Prepaid expenses | | | | 8,317 |
| | | | | 164,362,922 |
| Liabilities ($): | | | | |
| Due to The Dreyfus Corporation and affiliates—Note 3(b) | | | | 183,831 |
| Liability for securities on loan—Note 1(b) | | | | 26,966,404 |
| Payable for shares of Common Stock redeemed | | | | 134,245 |
| Accrued expenses | | | | 124,202 |
| | | | | 27,408,682 |
| Net Assets ($) | | | | 136,954,240 |
| Composition of Net Assets ($): | | | | |
| Paid-in capital | | | | 218,831,720 |
| Accumulated undistributed investment income—net | | | | 387,991 |
| Accumulated net realized gain (loss) on investments | | | | (69,864,268) |
| Accumulated net unrealized appreciation | | | | |
| (depreciation) on investments | | | | (12,401,203) |
| Net Assets ($) | | | | 136,954,240 |
| Shares Outstanding | | | | |
| (100 million shares of $.001par value Common Stock authorized) | | | | 9,279,067 |
| Net Asset Value, offering and redemption price per share ($) | | | | 14.76 |
| |
| See notes to financial statements. | | | | |
16
| STATEMENT OF OPERATIONS |
| Year Ended August 31, 2009 |
| Investment Income ($): | | |
| Income: | | |
| Cash dividends (net of $2,808 foreign taxes withheld at source): | | |
| Unaffiliated issuers | | 2,034,367 |
| Affiliated issuers | | 14,148 |
| Income from securities lending | | 437,587 |
| Total Income | | 2,486,102 |
| Expenses: | | |
| Management fee—Note 3(a) | | 1,268,837 |
| Shareholder servicing costs—Note 3(b) | | 610,451 |
| Prospectus and shareholders’ reports | | 164,632 |
| Professional fees | | 62,216 |
| Registration fees | | 21,316 |
| Custodian fees—Note 3(b) | | 16,862 |
| Directors’ fees and expenses—Note 3(c) | | 14,274 |
| Loan commitment fees—Note 2 | | 6,490 |
| Interest expense—Note 2 | | 539 |
| Miscellaneous | | 20,560 |
| Total Expenses | | 2,186,177 |
| Less—reduction in management fee | | |
| due to undertaking—Note 3(a) | | (148,069) |
| Less—reduction in fees due to earnings credits—Note 1(b) | | (17,036) |
| Net Expenses | | 2,021,072 |
| Investment Income—Net | | 465,030 |
| Realized and Unrealized Gain (Loss) on Investments—Note 4 ($): | | |
| Net realized gain (loss) on investments | | (69,962,208) |
| Net unrealized appreciation (depreciation) on investments | | (12,884,210) |
| Net Realized and Unrealized Gain (Loss) on Investments | | (82,846,418) |
| Net (Decrease) in Net Assets Resulting from Operations | | (82,381,388) |
| |
| See notes to financial statements. | | |
The Fund 17
STATEMENT OF CHANGES IN NET ASSETS
| | | Year Ended August 31, |
| | |
|
| | | 2009 | | 2008 |
| |
| |
|
| Operations ($): | | | | |
| Investment income—net | | 465,030 | | 997,589 |
| Net realized gain (loss) on investments | | (69,962,208) | | 35,381,617 |
| Net unrealized appreciation | | | | |
| (depreciation) on investments | | (12,884,210) | | (87,097,027) |
| Net Increase (Decrease) in Net Assets | | | | |
| Resulting from Operations | | (82,381,388) | | (50,717,821) |
| Dividends to Shareholders from ($): | | | | |
| Investment income—net | | (612,041) | | (11,349) |
| Net realized gain on investments | | (15,842,112) | | (62,419,183) |
| Total Dividends | | (16,454,153) | | (62,430,532) |
| Capital Stock Transactions ($): | | | | |
| Net proceeds from shares sold | | 12,489,327 | | 21,691,521 |
| Dividends reinvested | | 16,218,155 | | 61,671,999 |
| Cost of shares redeemed | | (54,297,061) | | (155,037,205) |
| Increase (Decrease) in Net Assets | | | | |
| from Capital Stock Transactions | | (25,589,579) | | (71,673,685) |
| Total Increase (Decrease) in Net Assets | | (124,425,120) | | (184,822,038) |
| Net Assets ($): | | | | |
| Beginning of Period | | 261,379,360 | | 446,201,398 |
| End of Period | | 136,954,240 | | 261,379,360 |
| Undistributed investment income—net | | 387,991 | | 898,512 |
| Capital Share Transactions (Shares): | | | | |
| Shares sold | | 870,738 | | 806,489 |
| Shares issued for dividends reinvested | | 1,326,097 | | 2,388,516 |
| Shares redeemed | | (3,722,956) | | (5,559,519) |
| Net Increase (Decrease) in Shares Outstanding | | (1,526,121) | | (2,364,514) |
| |
| See notes to financial statements. | | | | |
18
FINANCIAL HIGHLIGHTS
The following table describes the performance for the fiscal periods indicated. Total return shows how much your investment in the fund would have increased (or decreased) during each period, assuming you had reinvested all dividends and distributions.These figures have been derived from the fund’s financial statements.
| | | | | Year Ended August 31, | | |
| | |
| |
| |
|
| | | 2009 | | 2008 | | 2007 | | 2006 | | 2005 |
| |
| |
| |
| |
| |
|
| Per Share Data ($): | | | | | | | | | | |
| Net asset value, beginning of period | | 24.19 | | 33.88 | | 41.32 | | 46.64 | | 37.71 |
| Investment Operations: | | | | | | | | | | |
| Investment income (loss)—neta | | .05 | | .08 | | .04 | | (.07) | | (.05) |
| Net realized and unrealized | | | | | | | | | | |
| gain (loss) on investments | | (7.62) | | (4.27) | | 2.28 | | 1.71 | | 8.98 |
| Total from Investment Operations | | (7.57) | | (4.19) | | 2.32 | | 1.64 | | 8.93 |
| Distributions: | | | | | | | | | | |
| Dividends from investment income—net | | (.07) | | (.00)b | | — | | — | | — |
| Dividends from net realized | | | | | | | | | | |
| gain on investments | | (1.79) | | (5.50) | | (9.76) | | (6.96) | | — |
| Total Distributions | | (1.86) | | (5.50) | | (9.76) | | (6.96) | | — |
| Net asset value, end of period | | 14.76 | | 24.19 | | 33.88 | | 41.32 | | 46.64 |
| Total Return (%) | | (29.73) | | (13.39) | | 4.68 | | 3.31 | | 23.68 |
| Ratios/Supplemental Data (%): | | | | | | | | | | |
| Ratio of total expenses | | | | | | | | | | |
| to average net assets | | 1.55 | | 1.38 | | 1.33 | | 1.33 | | 1.33 |
| Ratio of net expenses | | | | | | | | | | |
| to average net assets | | 1.43 | | 1.37 | | 1.33 | | 1.15 | | 1.26 |
| Ratio of net investment income | | | | | | | | | | |
| (loss) to average net assets | | .33 | | .31 | | .11 | | (.15) | | (.12) |
| Portfolio Turnover Rate | | 54.47 | | 65.98 | | 67.66 | | 65.29 | | 42.07 |
| Net Assets, end of period ($ x 1,000) | | 136,954 | | 261,379 | | 446,201 | | 589,889 | | 772,010 |
| a | | Based on average shares outstanding at each month end. |
| b | | Amount represents less than $.01 per share. |
| See notes to financial statements. |
The Fund 19
NOTES TO FINANCIAL STATEMENTS
NOTE 1—Significant Accounting Policies:
Dreyfus Emerging Leaders Fund (the “fund”) is a separate diversified series of Advantage Funds, Inc. (the “Company”), which is registered under the Investment Company Act of 1940, as amended (the “Act”), as an open-end management investment company and operates as a series company that offers ten series, including the fund. The fund’s investment objective is capital growth.The Dreyfus Corporation (the “Manager” or “Dreyfus”), a wholly-owned subsidiary of The Bank of New York Mellon Corporation (“BNY Mellon”), serves as the fund’s investment adviser. MBSC Securities Corporation (the “Distributor”), a wholly-owned subsidiary of the Manager, is the distributor of the fund’s shares, which are sold to the public without a sales charge.
The Company accounts separately for the assets, liabilities and operations of each series. Expenses directly attributable to each series are charged to that series’ operations; expenses which are applicable to all series are allocated among them on a pro rata basis.
The fund’s financial statements are prepared in accordance with U.S. generally accepted accounting principles, which may require the use of management estimates and assumptions. Actual results could differ from those estimates.
The fund enters into contracts that contain a variety of indemnifications. The fund’s maximum exposure under these arrangements is unknown.The fund does not anticipate recognizing any loss related to these arrangements.
(a) Portfolio valuation: Investments in securities are valued at the last sales price on the securities exchange or national securities market on which such securities are primarily traded. Securities listed on the National Market System for which market quotations are available are valued at the official closing price or, if there is no official closing price that day, at the last sales price. Securities not listed on an exchange or the national securities market, or securities for which there were no transactions, are valued at the average of the most recent bid and asked prices, except for open short positions, where the asked price is used
20
for valuation purposes. Bid price is used when no asked price is available. Registered investment companies that are not traded on an exchange are valued at their net asset value.When market quotations or official closing prices are not readily available, or are determined not to reflect accurately fair value, such as when the value of a security has been significantly affected by events after the close of the exchange or market on which the security is principally traded (for example, a foreign exchange or market), but before the fund calculates its net asset value, the fund may value these investments at fair value as determined in accordance with the procedures approved by the Board of Directors. Fair valuing of securities may be determined with the assistance of a pricing service using calculations based on indices of domestic securities and other appropriate indicators, such as prices of relevant ADRs and futures contracts. For other securities that are fair valued by the Board of Directors, certain factors may be considered such as: fundamental analytical data, the nature and duration of restrictions on disposition, an evaluation of the forces that influence the market in which the securities are purchased and sold and public trading in similar securities of the issuer or comparable issuers. Financial futures are valued at the last sales price.
The fund adopted Statement of Financial Accounting Standards No. 157 “FairValue Measurements” (“FAS 157”). FAS 157 establishes an authoritative definition of fair value, sets out a framework for measuring fair value, and requires additional disclosures about fair value measurements.
Various inputs are used in determining the value of the fund’s investments relating to FAS 157.These inputs are summarized in the three broad levels listed below.
Level 1—quoted prices in active markets for identical investments.
Level 2—other significant observable inputs (including quoted prices for similar investments, interest rates, prepayment speeds, credit risk, etc.).
Level 3—significant unobservable inputs (including the fund’s own assumptions in determining the fair value of investments).
The Fund 21
| NOTES TO FINANCIAL STATEMENTS (continued) |
The inputs or methodology used for valuing securities are not necessarily an indication of the risk associated with investing in those securities.
The following is a summary of the inputs used as of August 31, 2009 in valuing the fund’s investments:
| | | | | Level 2—Other | | Level 3— | | |
| | | Level 1— | | Significant | | Significant | | |
| | | Quoted | | Observable | | Unobservable | | |
| | | Prices | | Inputs | | Inputs | | Total |
| |
| |
| |
| |
|
| Assets ($) | | | | | | | | |
| Investments in Securities: | | | | | | |
| Equity Securities— | | | | | | | | |
| Domestic | | 136,261,861 | | — | | — | | 136,261,861 |
| Mutual Funds | | 27,936,404 | | — | | — | | 27,936,404 |
| Other Financial | | | | | | | | |
| Instruments† | | — | | — | | — | | — |
| Liabilities ($) | | | | | | | | |
| Other Financial | | | | | | | | |
| Instruments† | | — | | — | | — | | — |
| † Other financial instruments include derivative instruments, such as futures, forward foreign currency |
| exchange contracts, swap contracts and options contracts. Amounts shown represent unrealized |
| appreciation (depreciation), or in the case of options, market value at period end. |
(b) Securities transactions and investment income: Securities transactions are recorded on a trade date basis. Realized gains and losses from securities transactions are recorded on the identified cost basis. Dividend income is recognized on the ex-dividend date and interest income, including, where applicable, accretion of discount and amortization of premium on investments is recognized on the accrual basis.
The fund has arrangements with the custodian and cash management bank whereby the fund may receive earnings credits when positive cash balances are maintained, which are used to offset custody and cash management fees. For financial reporting purposes, the fund includes net earnings credits as an expense offset in the Statement of Operations.
Pursuant to a securities lending agreement with The Bank of New York Mellon, a subsidiary of BNY Mellon and an affiliate of Dreyfus, the fund may lend securities to qualified institutions. It is the fund’s policy that, at origination, all loans are secured by collateral of at least
22
102% of the value of U.S. securities loaned and 105% of the value of foreign securities loaned. Collateral equivalent to at least 100% of the market value of securities on loan is maintained at all times. Collateral is either in the form of cash, which can be invested in certain money market mutual funds managed by the Manager, U.S Government and Agency securities or letters of credit.The fund is entitled to receive all income on securities loaned, in addition to income earned as a result of the lending transaction. Although each security loaned is fully collateralized, the fund bears the risk of delay in recovery of, or loss of rights in, the securities loaned should a borrower fail to return the securities in a timely manner. During the period ended August 31, 2009,The Bank of New York Mellon earned $145,862 from lending fund portfolio securities, pursuant to the securities lending agreement.
(c) Affiliated issuers: Investments in other investment companies advised by the Manager are defined as “affiliated” in the Act.
(d) Dividends to shareholders: Dividends are recorded on the ex-dividend date. Dividends from investment income-net and dividends from net realized capital gains are normally declared and paid annually, but the fund may make distributions on a more frequent basis to comply with the distribution requirements of the Internal Revenue Code of 1986, as amended (the “Code”).To the extent that net realized capital gains can be offset by capital loss carryovers, it is the policy of the fund not to distribute such gains. Income and capital gain distributions are determined in accordance with income tax regulations, which may differ from U.S. generally accepted accounting principles.
(e) Federal income taxes: It is the policy of the fund to continue to qualify as a regulated investment company, if such qualification is in the best interests of its shareholders, by complying with the applicable provisions of the Code, and to make distributions of taxable income sufficient to relieve it from substantially all federal income and excise taxes.
As of and during the period ended August 31, 2009, the fund did not have any liabilities for any uncertain tax positions.The fund recognizes interest and penalties, if any, related to uncertain tax positions as
The Fund 23
| NOTES TO FINANCIAL STATEMENTS (continued) |
income tax expense in the Statement of Operations. During the period, the fund did not incur any interest or penalties.
Each of the tax years in the four-year period ended August 31, 2009, remains subject to examination by the Internal Revenue Service and state taxing authorities.
At August 31, 2009, the components of accumulated earnings on a tax basis were as follows: undistributed ordinary income $250,356, accumulated capital losses $10,634,185 and unrealized depreciation $12,487,251. In addition, the fund had $59,006,400 of capital losses realized after October 31, 2008, which were deferred for tax purposes to the first day of the following fiscal year.
The accumulated capital loss carryover is available for federal income tax purposes to be applied against future net securities profits, if any, realized subsequent to August 31, 2009. If not applied, the carryover expires in fiscal 2017.
The tax character of distributions paid to shareholders during the fiscal periods ended August 31, 2009 and August 31, 2008 were as follows: ordinary income $634,630 and $11,349 and long-term capital gains $15,819,523 and $62,419,183, respectively.
During the period ended August 31, 2009, as a result of permanent book to tax differences, primarily due to the tax treatment for real estate investment trusts, dividend reclassification and treating a portion of the proceeds from redemptions as a distribution for tax purposes, the fund decreased accumulated undistributed investment income-net by $363,510, decreased accumulated net realized gain (loss) on investments by $6,064,705 and increased paid-in-capital by $6,428,215. Net assets and net asset value per share were not affected by this reclassification.
NOTE 2—Bank Lines of Credit:
Prior to October 15, 2008, the fund participated with other Dreyfus-managed funds in a $350 million redemption credit facility. Effective October 15, 2008, the fund participates with other Dreyfus-managed
24
funds in a $145 million unsecured credit facility led by Citibank, N.A. and a $300 million unsecured credit facility provided by The Bank of New York Mellon (each, a “Facility”), each to be utilized primarily for temporary or emergency purposes, including the financing of redemptions. In connection therewith, the fund has agreed to pay its pro rata portion of Facility fees for each Facility. Interest is charged to the fund based on rates determined pursuant to the terms of the respective Facility at the time of the borrowing.
The average amount of borrowings outstanding under the Facilities during the period ended August 31, 2009 was approximately $38,600 with a related weighted average annualized interest rate of 1.40%.
NOTE 3—Management Fee and Other Transactions with Affiliates:
(a) Pursuant to a management agreement with the Manager, the management fee is computed at the annual rate of .90% of the value of the fund’s average daily net assets and is payable monthly.
The Manager had undertaken until March 31, 2009 that, if the aggregate expenses of the fund (exclusive of shareholder servicing fees, taxes, brokerage commissions, interest on borrowings, commitment fees and extraordinary expenses) exceed 1.20% of the value of the fund’s average daily net assets, the fund may deduct from the payment to be made to the Manager under the management agreement, or the Manager will bear, such excess expense.The Manager has currently undertaken from April 1, 2009 until March 31, 2010 that, if the aggregate expenses of the fund, exclusive of certain expenses as described above exceed 1.15% of the value of the funds average daily net assets, the fund may deduct from the payments to be made to the Manager under the management agreement, or the Manager will bear such excess expense.The reduction in management fee, pursuant to the undertakings, amounted to $148,069 during the period ended August 31, 2009.
The Fund 25
| NOTES TO FINANCIAL STATEMENTS (continued) |
(b) Under the Shareholder Services Plan, the fund pays the Distributor at an annual rate of .25% of the value of the fund’s average daily net assets for the provision of certain services.The services provided may include personal services relating to shareholder accounts, such as answering shareholder inquiries regarding the fund and providing reports and other information, and services related to the maintenance of shareholder accounts.The Distributor may make payments to Service Agents (a securities dealer, financial institution or other industry professional) in respect of these services.The Distributor determines the amounts to be paid to Service Agents. During the period ended August 31, 2009, the fund was charged $352,455 pursuant to the Shareholder Services Plan.
The fund compensates Dreyfus Transfer, Inc., a wholly-owned subsidiary of the Manager, under a transfer agency agreement for providing personnel and facilities to perform transfer agency services for the fund. During the period ended August 31, 2009, the fund was charged $79,686 pursuant to the transfer agency agreement.
The fund compensates The Bank of New York Mellon under a cash management agreement for performing cash management services related to fund subscriptions and redemptions. During the period ended August 31, 2009, the fund was charged $13,543 pursuant to the cash management agreement.These fees were offset by earnings credits pursuant to the cash management agreement.
The fund also compensates The Bank of New York Mellon under a custody agreement for providing custodial services for the fund. During the period ended August 31, 2009, the fund was charged $16,862 pursuant to the custody agreement.
During the period ended August 31, 2009, the fund was charged $6,097 for services performed by the Chief Compliance Officer.
The components of “Due to The Dreyfus Corporation and affiliates” in the Statement of Assets and Liabilities consist of: management fees $126,697, shareholder services plan fees $29,380, custody fees $4,502, chief compliance officer fees $2,784 and transfer agency per account fees $20,468.
26
(c) Each Board member also serves as a Board member of other funds within the Dreyfus complex. Annual retainer fees and attendance fees are allocated to each fund based on net assets.
NOTE 4—Securities Transactions:
The aggregate amount of purchases and sales of investment securities, excluding short-term securities, during the period ended August 31, 2009, amounted to $79,966,397 and $116,815,725, respectively.
The fund adopted Statement of Financial Accounting Standards No. 161 “Disclosures about Derivative Instruments and Hedging Activities” (“FAS 161”). FAS 161 requires qualitative disclosures about objectives and strategies for using derivatives, quantitative disclosures about fair value amounts of gains and losses on derivative instruments and disclosures about credit-risk-related contingent features in derivative agreements. Since the fund held no derivatives during the period ended August 31, 2009, FAS 161 disclosures did not impact the notes to the financial statements.
At August 31, 2009, the cost of investments for federal income tax purposes was $176,685,516; accordingly, accumulated net unrealized depreciation on investments was $12,487,251, consisting of $15,858,271 gross unrealized appreciation and $28,345,522 gross unrealized depreciation.
NOTE 5—Subsequent Events Evaluation:
Dreyfus has evaluated the need for disclosures and/or adjustments resulting from subsequent events through October 26, 2009, the date the financial statements were issued. This evaluation did not result in any subsequent events that necessitated disclosures and/or adjustments, other than the renewal by the Board of the management agreement with the Manager on September 22, 2009 for a six-month period ending March 30, 2010.
The Fund 27
| REPORT OF INDEPENDENT REGISTERED |
| PUBLIC ACCOUNTING FIRM |
| | Shareholders and Board of Directors
Dreyfus Emerging Leaders Fund |
We have audited the accompanying statement of assets and liabilities, including the statement of investments, of Dreyfus Emerging Leaders Fund (one of the series comprising Advantage Funds, Inc.) as of August 31, 2009, and the related statement of operations for the year then ended, the statement of changes in net assets for each of the two years in the period then ended, and financial highlights for each of the years indicated therein.These financial statements and financial highlights are the responsibility of the Fund’s management. Our responsibility is to express an opinion on these financial statements and financial highlights based on our audits.
We conducted our audits in accordance with the standards of the Public Company Accounting Oversight Board (United States).Those standards require that we plan and perform the audit to obtain reasonable assurance about whether the financial statements and financial highlights are free of material misstatement. We were not engaged to perform an audit of the Fund’s internal control over financial reporting. Our audits included consideration of internal control over financial reporting as a basis for designing audit procedures that are appropriate in the circumstances, but not for the purpose of expressing an opinion on the effectiveness of the Fund’s internal control over financial reporting. Accordingly, we express no such opinion. An audit also includes examining, on a test basis, evidence supporting the amounts and disclosures in the financial statements and financial highlights, assessing the accounting principles used and significant estimates made by management, and evaluating the overall financial statement presentation. Our procedures included confirmation of securities owned as of August 31, 2009 by correspondence with the custodian and others.We believe that our audits provide a reasonable basis for our opinion.
In our opinion, the financial statements and financial highlights referred to above present fairly, in all material respects, the financial position of Dreyfus Emerging Leaders Fund at August 31, 2009, the results of its operations for the year then ended, the changes in its net assets for each of the two years in the period then ended, and the financial highlights for each of the indicated years, in conformity with U.S. generally accepted accounting principles.

| | New York, New York
October 26, 2009 |
28
IMPORTANT TAX INFORMATION (Unaudited)
For federal tax purposes, the fund hereby designates $1.7860 per share as a long-term capital gain distribution of the $1.8550 per share paid on December 15, 2008. Also the fund hereby designates 100% of the ordinary dividends paid during the fiscal year ended August 31, 2009 as qualifying for the corporate dividends received deduction.Also certain dividends paid by the fund may be subject to a maximum tax rate of 15%, as provided for by the Jobs and Growth Tax Relief Reconciliation Act of 2003. Of the distributions paid during the fiscal year, $418,977 represents the maximum amount that may be considered qualified dividend income. Shareholders will receive notification in early 2010 of the percentage applicable to the preparation of their 2009 income tax returns.
The Fund 29
| INFORMATION ABOUT THE REVIEW AND APPROVAL OF |
| THE FUND’S MANAGEMENT AGREEMENT (Unaudited) |
At a meeting of the fund’s Board held on March 3, 2009, the Board unanimously approved the continuation of the fund’s Management Agreement with Dreyfus for a six-month term ending September 30, 2009.The Board members, none of whom are “interested persons” (as defined in the Investment Company Act of 1940, as amended) of the fund were assisted in their review by independent legal counsel and met with counsel in executive session separate from representatives of Dreyfus. In approving the continuance of the Management Agreement, the Board considered all factors that they believed to be relevant, including, among other things, the factors discussed below.
Analysis of Nature, Extent and Quality of Services Provided to the Fund. The Board members received a presentation from representatives of Dreyfus regarding services provided to the fund and other funds in the Dreyfus fund complex, and discussed the nature, extent and quality of the services provided to the fund pursuant to its Management Agreement. Dreyfus’ representatives reviewed the fund’s distribution of accounts and the relationships Dreyfus has with various intermediaries and the different needs of each. Dreyfus’ representatives noted the various distribution channels for the fund as well as the diverse methods of distribution among other funds in the Dreyfus fund complex, and Dreyfus’ corresponding need for broad, deep, and diverse resources to be able to provide ongoing shareholder services to each distribution channel, including those of the fund. Dreyfus also provided the number of accounts investing in the fund, as well as the fund’s asset size.
The Board members also considered Dreyfus’ research and portfolio management capabilities and Dreyfus’ oversight of day-to-day fund operations, including fund accounting and administration and assistance in meeting legal and regulatory requirements. The Board members also considered Dreyfus’ extensive administrative, accounting and compliance infrastructure.The Board also considered Dreyfus’ brokerage policies and practices, the standards applied in seeking best execution and Dreyfus’ policies and practices regarding soft dollars.
30
Comparative Analysis of the Fund’s Performance and Management Fee and Expense Ratio. The Board members reviewed the fund’s performance and comparisons to a group of retail no-load small-cap core funds that are benchmarked against the Russell 2000 Index (the “Performance Group”) and to a larger universe of funds consisting of all retail and institutional small-cap core funds (the “Performance Universe”) selected and provided by Lipper, Inc., an independent provider of investment company data.The Board was provided with a description of the methodology Lipper used to select the Performance Group and Performance Universe, as well as the Expense Group and Expense Universe (discussed below). The Board members discussed the results of the comparisons and noted the fund’s average annual total return ranked in the fourth quartile of the Performance Group and Performance Universe for the various periods ended December 31, 2008. Dreyfus also provided a comparison of the fund’s calendar year total returns to the returns of the fund’s benchmark index.
The Board members also discussed the fund’s contractual and actual management fees and expense ratio and reviewed the range of management fees and expense ratios as compared to a comparable group of funds (the “Expense Group”) and a broader group of funds (the “Expense Universe”), each selected and provided by Lipper.The fund’s contractual and actual management fees were lower than the Expense Group medians and the fund’s actual management fee was equal to the Expense Universe median.The fund’s expense ratio was higher than the Expense Group and Expense Universe medians.After discussions with the Board members, representatives of Dreyfus agreed, until March 31, 2010, that if the aggregate expenses of a fund’s share class, exclusive of shareholder servicing fees and Rule 12b-1 fees, but including the management fee, exceed 1.15 of 1% of the value of the fund’s average daily net assets, the fund may deduct from the payment to be made to Dreyfus under the Management Agreement, or Dreyfus will bear, such excess expense.
The Fund 31
| INFORMATION ABOUT THE REVIEW AND APPROVAL OF THE |
| FUND’S MANAGEMENT AGREEMENT (Unaudited) (continued) |
Representatives of Dreyfus reviewed with the Board members the fees paid to Dreyfus or its affiliates by mutual funds and/or separate accounts managed by Dreyfus with similar investment objectives, policies and strategies as the fund (the “Similar Accounts”), and explained the nature of the Similar Accounts and the differences, from Dreyfus’ perspective, as applicable, in providing services to the Similar Accounts as compared to the fund. Dreyfus’ representatives also reviewed the costs associated with distribution through intermediaries.The Board analyzed differences in fees paid to Dreyfus and discussed the relationship of the advisory fees paid in light of the services provided. The Board members considered the relevance of the fee information provided for the Similar Accounts to evaluate the appropriateness and reasonableness of the fund’s management fees.The Board acknowledged that differences in fees paid by the Similar Accounts seemed to be consistent with the services provided.
Analysis of Profitability and Economies of Scale. Dreyfus’ representatives reviewed the dollar amount of expenses allocated and profit received by Dreyfus and the method used to determine such expenses and profit. The Board previously had been provided with information prepared by an independent consulting firm regarding Dreyfus’ approach to allocating costs to, and determining the profitability of, individual funds and the entire Dreyfus mutual fund complex.The Board also was informed that the methodology had also been reviewed by an independent registered public accounting firm which, like the consultant, found the methodology to be reasonable.The consulting firm also analyzed where any economies of scale might emerge in connection with the management of the fund. The Board members evaluated the profitability analysis in light of the relevant circumstances for the fund and the extent to which economies of scale would be realized if the fund grows and whether fee levels reflect these economies of scale for the benefit of fund investors. The Board members also considered potential benefits to Dreyfus from acting as investment adviser and noted the soft dollar arrangements with respect to trading the fund’s investments.
It was noted that the Board members should consider Dreyfus’ profitability with respect to the fund as part of their evaluation of whether the fees under the Management Agreement bear a reasonable relation-
32
ship to the mix of services provided by Dreyfus, including the nature, extent and quality of such services, and that a discussion of economies of scale is predicated on a fund having achieved a substantial size with increasing assets and that, if a fund’s assets had been static or decreasing, the possibility that Dreyfus may have realized any economies of scale would be less. It also was noted that the profitability percentage for managing the fund was within the range determined by appropriate court cases to be reasonable given the services rendered and generally superior service levels provided.
At the conclusion of these discussions, the Board agreed that it had been furnished with sufficient information to make an informed business decision with respect to continuation of the fund’s Management Agreement. Based on the discussions and considerations as described above, the Board made the following conclusions and determinations.
- The Board concluded that the nature, extent and quality of the ser- vices provided by Dreyfus are adequate and appropriate.
- The Board was concerned about the fund’s relative performance but was encouraged by the steps Dreyfus has taken to improve fund per- formance, including the continuation of the fund’s expense cap.
- The Board concluded that the fee paid by the fund to Dreyfus was reasonable in light of the considerations described above.
- The Board determined that the economies of scale which may accrue to Dreyfus and its affiliates in connection with the management of the fund had been adequately considered by Dreyfus in connection with the management fee rate charged to the fund and that, to the extent in the future it were determined that material economies of scale had not been shared with the fund, the Board would seek to have those economies of scale shared with the fund.
The Board members considered these conclusions and determinations, along with information received on a routine and regular basis throughout the year, and, without any one factor being dispositive, the Board determined that continuation of the fund’s Management Agreement was in the best interests of the fund and its shareholders.
The Fund 33
| BOARD MEMBERS INFORMATION (Unaudited) |
| |
| |
| |
| Joseph S. DiMartino (65) |
| Chairman of the Board (1995) |
| Principal Occupation During Past 5Years: |
| • Corporate Director and Trustee |
| Other Board Memberships and Affiliations: |
| • The Muscular Dystrophy Association, Director |
| • CBIZ (formerly, Century Business Services, Inc.), a provider of outsourcing functions for small |
| and medium size companies, Director |
| • The Newark Group, a provider of a national market of paper recovery facilities, paperboard |
| mills and paperboard converting plants, Director |
| • Sunair Services Corporation, a provider of certain outdoor-related services to homes and |
| businesses, Director |
| No. of Portfolios for which Board Member Serves: 166 |
| ——————— |
| Peggy C. Davis (66) |
| Board Member (2006) |
| Principal Occupation During Past 5Years: |
| • Shad Professor of Law, New York University School of Law (1983-present) |
| • Writer and teacher in the fields of evidence, constitutional theory, family law, social sciences |
| and the law, legal process and professional methodology and training |
| No. of Portfolios for which Board Member Serves: 53 |
| ——————— |
| David P. Feldman (69) |
| Board Member (1996) |
| Principal Occupation During Past 5Years: |
| • Corporate Director and Trustee |
| Other Board Memberships and Affiliations: |
| • BBH Mutual Funds Group (11 funds), Director |
| • The Jeffrey Company, a private investment company, Director |
| No. of Portfolios for which Board Member Serves: 46 |
| ——————— |
| James F. Henry (78) |
| Board Member (2006) |
| Principal Occupation During Past 5Years: |
| • Advisor to The Elaw Forum, a consultant on managing corporate legal costs |
| • Advisor to John Jay Homestead (the restored home of the first U.S. Chief Justice) |
| • Individual Trustee of several trusts |
| Other Board Memberships and Affiliations: |
| • Director, advisor and mediator involved in several non-profit organizations, primarily engaged |
| in domestic and international dispute resolution, and historic preservation |
| No. of Portfolios for which Board Member Serves: 31 |
34
| Ehud Houminer (69) |
| Board Member (1993) |
| Principal Occupation During Past 5Years: |
| • Executive-in-Residence at the Columbia Business School, Columbia University |
| |
| Other Board Memberships and Affiliations: |
| • Avnet Inc., an electronics distributor, Director |
| • International Advisory Board to the MBA Program School of Management, Ben Gurion |
| University, Chairman |
| |
| No. of Portfolios for which Board Member Serves: 58 |
| ——————— |
| Gloria Messinger (79) |
| Board Member (1993) |
| Principal Occupation During Past 5Years: |
| • Arbitrator for American Arbitration Association |
| • Arbitrator for FINRA (formerly, National Association of Securities Dealers, Inc.) |
| • Consultant in Intellectual Property |
| |
| Other Board Memberships and Affiliations: |
| • Theater for a New Audience, Inc., Director |
| • Brooklyn Philharmonic, Director |
| |
| No. of Portfolios for which Board Member Serves: 31 |
| ——————— |
| Dr. Martin Peretz (70) |
| Board Member (2006) |
| Principal Occupation During Past 5Years: |
| • Editor-in-Chief of The New Republic Magazine |
| • Director of TheStreet.com, a financial information service on the web |
| |
| Other Board Memberships and Affiliations: |
| • American Council of Trustees and Alumni, Director |
| • Pershing Square Capital Management, Advisor |
| • Montefiore Ventures, General Partner |
| • Harvard Center for Blood Research,Trustee |
| • Bard College,Trustee |
| • Board of Overseers of YIVO Institute for Jewish Research, Chairman |
| |
| No. of Portfolios for which Board Member Serves: 31 |
| ——————— |
| Once elected all Board Members serve for an indefinite term, but achieve Emeritus status upon reaching age 80.The |
| address of the Board Members and Officers is in c/o The Dreyfus Corporation, 200 Park Avenue, NewYork, NewYork |
| 10166. Additional information about the Board Members is available in the fund’s Statement of Additional Information |
| which can be obtained from Dreyfus free of charge by calling this toll free number: 1-800-554-4611. |
| John M. Fraser, Jr., Emeritus Board Member |
| Rosalind G. Jacobs, Emeritus Board Member |
| Dr. Paul A. Marks, Emeritus Board Member |
The Fund 35
OFFICERS OF THE FUND (Unaudited)
J. DAVID OFFICER, President since December 2006.
Chairman, President and Chief Executive Officer of Founders Asset Management LLC, an affiliate of the Manager, and an officer of 75 investment companies (comprised of 166 portfolios) managed by the Manager. Prior to June 2009, Mr. Officer was Chief Operating Officer,Vice Chairman and a director of the Manager, where he had been employed since April 1998. He is 61 years old.
PHILLIP N. MAISANO, Executive Vice President since July 2007.
Chief Investment Officer,Vice Chair and a director of the Manager, and an officer of 75 investment companies (comprised of 166 portfolios) managed by the Manager. Mr. Maisano also is an officer and/or Board member of certain other investment management subsidiaries of The Bank of New York Mellon Corporation, each of which is an affiliate of the Manager. He is 62 years old and has been an employee of the Manager since November 2006. Prior to joining the Manager, Mr. Maisano served as Chairman and Chief Executive Officer of EACM Advisors, an affiliate of the Manager, since August 2004, and served as Chief Executive Officer of Evaluation Associates, a leading institutional investment consulting firm, from 1988 until 2004.
MICHAEL A. ROSENBERG, Vice President and Secretary since August 2005.
Assistant General Counsel of BNY Mellon, and an officer of 76 investment companies (comprised of 187 portfolios) managed by the Manager. He is 49 years old and has been an employee of the Manager since October 1991.
JAMES BITETTO, Vice President and Assistant Secretary since August 2005.
Senior Counsel of BNY Mellon and Secretary of the Manager, and an officer of 76 investment companies (comprised of 187 portfolios) managed by the Manager. He is 43 years old and has been an employee of the Manager since December 1996.
JONI LACKS CHARATAN, Vice President and Assistant Secretary since August 2005.
Senior Counsel of BNY Mellon, and an officer of 76 investment companies (comprised of 187 portfolios) managed by the Manager. She is 53 years old and has been an employee of the Manager since October 1988.
JOSEPH M. CHIOFFI, Vice President and Assistant Secretary since August 2005.
Senior Counsel of BNY Mellon, and an officer of 76 investment companies (comprised of 187 portfolios) managed by the Manager. He is 47 years old and has been an employee of the Manager since June 2000.
JANETTE E. FARRAGHER, Vice President and Assistant Secretary since August 2005.
Assistant General Counsel of BNY Mellon, and an officer of 76 investment companies (comprised of 187 portfolios) managed by the Manager. She is 46 years old and has been an employee of the Manager since February 1984.
JOHN B. HAMMALIAN, Vice President and Assistant Secretary since August 2005.
Managing Counsel of BNY Mellon, and an officer of 76 investment companies (comprised of 187 portfolios) managed by the Manager. He is 46 years old and has been an employee of the Manager since February 1991.
ROBERT R. MULLERY, Vice President and Assistant Secretary since August 2005.
Managing Counsel of BNY Mellon, and an officer of 76 investment companies (comprised of 187 portfolios) managed by the Manager. He is 57 years old and has been an employee of the Manager since May 1986.
JEFF PRUSNOFSKY, Vice President and Assistant Secretary since August 2005.
Managing Counsel of BNY Mellon, and an officer of 76 investment companies (comprised of 187 portfolios) managed by the Manager. He is 44 years old and has been an employee of the Manager since October 1990.
36
JAMES WINDELS, Treasurer since November 2001.
Director – Mutual Fund Accounting of the Manager, and an officer of 76 investment companies (comprised of 187 portfolios) managed by the Manager. He is 49 years old and has been an employee of the Manager since April 1985.
RICHARD CASSARO, Assistant Treasurer since January 2008.
Senior Accounting Manager – Money Market and Municipal Bond Funds of the Manager, and an officer of 76 investment companies (comprised of 187 portfolios) managed by the Manager. He is 50 years old and has been an employee of the Manager since September 1982.
GAVIN C. REILLY, Assistant Treasurer since December 2005.
Tax Manager of the Investment Accounting and Support Department of the Manager, and an officer of 76 investment companies (comprised of 187 portfolios) managed by the Manager. He is 41 years old and has been an employee of the Manager since April 1991.
ROBERT ROBOL, Assistant Treasurer since August 2005.
Senior Accounting Manager – Fixed Income Funds of the Manager, and an officer of 76 investment companies (comprised of 187 portfolios) managed by the Manager. He is 45 years old and has been an employee of the Manager since October 1988.
ROBERT SALVIOLO, Assistant Treasurer since July 2007.
Senior Accounting Manager – Equity Funds of the Manager, and an officer of 76 investment companies (comprised of 187 portfolios) managed by the Manager. He is 42 years old and has been an employee of the Manager since June 1989.
ROBERT SVAGNA, Assistant Treasurer since December 2002.
Senior Accounting Manager – Equity Funds of the Manager, and an officer of 76 investment companies (comprised of 187 portfolios) managed by the Manager. He is 42 years old and has been an employee of the Manager since November 1990.
JOSEPH W. CONNOLLY, Chief Compliance Officer since October 2004.
Chief Compliance Officer of the Manager and The Dreyfus Family of Funds (76 investment companies, comprised of 187 portfolios). From November 2001 through March 2004, Mr. Connolly was first Vice-President, Mutual Fund Servicing for Mellon Global Securities Services. In that capacity, Mr. Connolly was responsible for managing Mellon’s Custody, Fund Accounting and Fund Administration services to third-party mutual fund clients. He is 52 years old and has served in various capacities with the Manager since 1980, including manager of the firm’s Fund Accounting Department from 1997 through October 2001.
WILLIAM GERMENIS, Anti-Money Laundering Compliance Officer since October 2002.
Vice President and Anti-Money Laundering Compliance Officer of the Distributor, and the Anti-Money Laundering Compliance Officer of 72 investment companies (comprised of 183 portfolios) managed by the Manager. He is 38 years old and has been an employee of the Distributor since October 1998.
The Fund 37

Save time. Save paper. View your next shareholder report online as soon as it s available. Log into www.dreyfus.com and sign up for Dreyfus eCommunications. It s simple and only takes a few minutes.
The views expressed in this report reflect those of the portfolio manager only through the end of the period covered and do not necessarily represent the views of Dreyfus or any other person in the Dreyfus organization. Any such views are subject to change at any time based upon market or other conditions and Dreyfus disclaims any responsibility to update such views.These views may not be relied on as investment advice and, because investment decisions for a Dreyfus fund are based on numerous factors, may not be relied on as an indication of trading intent on behalf of any Dreyfus fund.

| | Contents |
| |
| | THE FUND |
| |
| 2 | A Letter from the Chairman and CEO |
| |
| 3 | Discussion of Fund Performance |
| |
| 6 | Fund Performance |
| |
| 8 | Understanding Your Fund s Expenses |
| |
| 8 | Comparing Your Fund s Expenses With Those of Other Funds |
| |
| 9 | Statement of Investments |
| |
| 15 | Statement of Assets and Liabilities |
| |
| 16 | Statement of Operations |
| |
| 17 | Statement of Changes in Net Assets |
| |
| 20 | Financial Highlights |
| |
| 24 | Notes to Financial Statements |
| |
| 37 | Report of Independent Registered Public Accounting Firm |
| |
| 38 | Important Tax Information |
| |
| 39 | Information About the Review and Approval of the Fund s Management Agreement |
| |
| 43 | Board Members Information |
| |
| 46 | Officers of the Fund |
| |
| | FOR MORE INFORMATION |
| |
| | Back Cover |
| |
Dreyfus
International Value Fund |

A LETTER FROM THE CHAIRMAN AND CEO
Dear Shareholder:
We are pleased to present this annual report for Dreyfus International Value Fund, covering the 12-month period from September 1, 2008, through August 31, 2009.
At long last, the current U.S. recession cycle appears to be ending and many other worldwide economies are beginning to show signs of improvement.After generally slumping for more than a year, we expect economic growth to pick up in most major countries during the third quarter of 2009. Highly stimulative monetary and fiscal policies have so far been effective in the developed markets, while the low cost of debt and equity capital relative to historical norms have continued to support many emerging market Asian economies. However, we continue to anticipate a slower-than-average recovery in most developed markets, with the unemployment rate likely to remain elevated over the next several quarters.
The international stock markets anticipated the economic upturn with sustained market rallies that began in early March 2009. Although the rebound initially was concentrated primarily among lower-quality stocks that had been severely punished in the downturn, it later broadened to include virtually all regions, economic sectors and capitalization ranges. While we are encouraged by the market s recent strength, we remain concerned that improving investor sentiment may have exceeded the revival of business fundamentals in many cases.Accordingly, we continue to believe that careful selectivity and risk management will be keys to success in the global financial markets over the foreseeable future. As always, we urge you to speak with your financial adviser about the potential opportunities and obstacles in today s investment environment.
For information about how the fund performed during the reporting period, as well as market perspectives, we have provided a Discussion of Fund Performance given by the fund s Portfolio Manager.
Thank you for your continued confidence and support.

Jonathan R. Baum
Chairman and Chief Executive Officer
The Dreyfus Corporation
September 15, 2009 |
2

DISCUSSION OF FUND PERFORMANCE
For the period of September 1, 2008, through August 31, 2009, as provided by D. Kirk Henry, Senior Portfolio Manager
Fund and Market Performance Overview
For the 12-month period ended August 31, 2009, Dreyfus International Value Fund s Class A shares produced a total return of 5.97%, Class B shares returned 6.96%, Class C shares returned 6.71% and Class I shares returned 5.21%.1 In comparison, the fund s benchmark, the Morgan Stanley Capital International Europe, Australasia, Far East Index ( MSCI EAFE Index ), produced a total return of 14.95% for the same period.2
Stocks throughout the world fell sharply over the first half of an especially volatile reporting period as a global recession and banking crisis took their toll.However,international equity markets later rebounded substantially when credit markets and economic conditions stabilized, offsetting a significant portion of earlier losses.The fund produced higher returns than its benchmark, primarily due to the success of our security selection strategy in Japan, Germany, the United Kingdom and France.
The Fund s Investment Approach
The fund seeks long-term capital growth by ordinarily investing most of its assets in stocks of foreign issuers that we consider to be value companies. The fund normally invests in companies in at least 10 foreign countries and generally limits its investments in any single company to no more than 5% of its assets at the time of purchase.
The fund s investment approach is value-oriented and research-driven. When selecting stocks, we attempt to identify potential investments through extensive quantitative and fundamental research. Emphasizing individual stock selection over economic or industry trends, the fund focuses on three key factors: value, business fundamentals and business momentum.
The Fund 3
| DISCUSSION OF FUND PERFORMANCE (continued) |
Equity Markets Plunged, Then Rebounded Sharply
Just weeks after the start of the reporting period, the failures of several major financial institutions sparked a financial crisis that nearly led to the collapse of the worldwide banking system. Meanwhile, rising unemployment, declining housing markets and plunging consumer confidence produced the most severe global economic downturn since the 1930s. These influences fueled a bear market that drove many of the world s stock market averages to multi-year lows. The emerging markets were particularly hard-hit as investors engaged in a flight to quality toward traditional safe havens.
However, market sentiment began to improve in early 2009, when it became clearer that aggressive remedial actions by government and monetary authorities had helped repair the world s credit markets. Subsequently, evidence of global economic stabilization supported sustained market rallies through the reporting period s end. Just as the emerging markets fell more sharply than average in the downturn, they generally bounced back more robustly than developed markets in the rally.
Security Selections Boosted Relative Results
Our stock selection strategy proved effective across a variety of markets and industry groups. In Japan, the fund held stocks that already had encountered weakness earlier in 2008, and declined less severely than market averages in the downturn. Among them were apparel retailer Shimamura and home builder JS Group. A modestly overweighted position in Germany enabled the fund to participate more fully in the country s relative strength over the reporting period. German stocks producing positive absolute returns for the reporting period included automaker Bayerische Motoren Werke (BMW) and aerospace firm MTU Aero Engines. In addition, a number of strong performers in the United Kingdom and France helped the fund achieve above-average results in those markets.
The fund received strong contributions to performance from the materials sector, where Ciba Specialty Chemicals benefited from an acquisition offer and Mitsubishi Rayon bounced back as economic conditions stabilized.The traditionally defensive utilities sector also fared relatively
4
well, as Greek electricity producer PPC benefited from moderating oil prices. Among individual stocks, favorable timing in the purchases of Swiss pharmaceutical developer Roche and Greek beverage bottler Coca-Cola Hellenic helped support the fund s relative performance.
Disappointments included lagging results in Spain, where an underweighted position prevented the fund from participating in the market s relative strength.The fund held no exposure to the country s largest fixed-line and wireless telephone company,Telefónica, which gained value in the rally. Relatively light exposure to Spanish financial companies, which did not meet our investment criteria, also subtracted from relative performance when lower-quality stocks rebounded from beaten-down levels. A number of the fund s smaller financial holdings in Italy detracted from its relative results, including Banco Popolare and Unicredito.
Seeking Opportunities in Recovering Markets
Even in the wake of the sustained and robust market rally, we have continued to seek attractive values in international equity markets. Our bottom-up stock selection process has identified a number of potential opportunities in the technology and energy sectors, where companies appear to have cut costs during the downturn and may be poised for improved earnings in a recovery. Still, we expect the recovery to be muted and international stock markets to remain volatile,requiring careful selectivity in portfolio construction. In our judgment, our disciplined approach may be particularly well suited to such an environment.
September 15, 2009
| 1 | | Total return includes reinvestment of dividends and any capital gains paid, and does not take into |
| | | consideration the maximum initial sales charges in the case of Class A shares, or the applicable |
| | | contingent deferred sales charges imposed on redemptions in the case of Class B and Class C |
| | | shares. Had these charges been reflected, returns would have been lower. Past performance is no |
| | | guarantee of future results. Share price, yield and investment return fluctuate such that upon |
| | | redemption, fund shares may be worth more or less than their original cost. Investments in foreign |
| | | securities involve special risks. Please read the prospectus for further discussion of these risks. |
| 2 | | SOURCE: LIPPER INC. Reflects reinvestment of net dividends and, where applicable, |
| | | capital gain distributions.The Morgan Stanley Capital International Europe, Australasia, Far |
| | | East (MSCI EAFE) Index is an unmanaged index composed of a sample of companies |
| | | representative of the market structure of European and Pacific Basin countries.The Index does not |
| | | take into account fees and expenses to which the fund is subject. |
The Fund 5
FUND PERFORMANCE
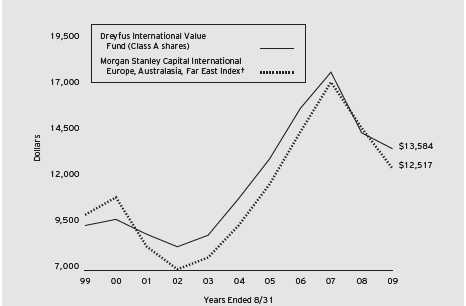
Comparison of change in value of $10,000 investment in Dreyfus International Value Fund Class A shares and the Morgan Stanley Capital International Europe, Australasia, Far East Index
| Source: Lipper Inc. |
| Past performance is not predictive of future performance. |
| The above graph compares a $10,000 investment made in Class A shares of Dreyfus International Value Fund on |
| 8/31/99 to a $10,000 investment made in the Morgan Stanley Capital International Europe, Australasia, Far East |
| Index (the Index ) on that date. All dividends and capital gain distributions are reinvested. Performance for Class B, |
| Class C and Class I shares will vary from the performance of Class A shares shown above due to differences in charges |
| and expenses. |
| The fund s performance shown in the line graph takes into account the maximum initial sales charge on Class A shares |
| and all other applicable fees and expenses.The Index is an unmanaged index composed of a sample of companies |
| representative of the market structure of European and Pacific Basin countries. Unlike a mutual fund, the Index is not |
| subject to charges, fees and other expenses. Investors cannot invest directly in any index. Further information relating to |
| fund performance, including expense reimbursements, if applicable, is contained in the Financial Highlights section of the |
| prospectus and elsewhere in this report. |
6
| Average Annual Total Returns as of 8/31/09 | | | | | | |
| |
| | | Inception | | | | | | |
| | | Date | | 1 Year | | 5 Years | | 10 Years |
| |
| |
| |
| |
|
| Class A shares | | | | | | | | |
| with maximum sales charge (5.75%) | | 9/29/95 | | 11.37% | | 3.30% | | 3.11% |
| without sales charge | | 9/29/95 | | 5.97% | | 4.52% | | 3.72% |
| Class B shares | | | | | | | | |
| with applicable redemption charge | | 11/15/02 | | 10.58% | | 3.44% | | 3.49% , |
| without redemption | | 11/15/02 | | 6.96% | | 3.66% | | 3.49% , |
| Class C shares | | | | | | | | |
| with applicable redemption charge | | 11/15/02 | | 7.61% | | 3.75% | | 3.22% |
| without redemption | | 11/15/02 | | 6.71% | | 3.75% | | 3.22% |
| Class I shares | | 11/15/02 | | 5.21% | | 5.00% | | 4.01% |
| Past performance is not predictive of future performance.The fund s performance shown in the graph and table does not |
| reflect the deduction of taxes that a shareholder would pay on fund distributions or the redemption of fund shares. |
| The maximum contingent deferred sales charge for Class B shares is 4%. After six years Class B shares convert to |
| Class A shares. |
| The maximum contingent deferred sales charge for Class C shares is 1% for shares redeemed within one year of |
| the date of purchase. |
| The total return performance figures presented for Class B, C and I shares of the fund represent the performance of |
| the fund s Class A shares for periods prior to November 15, 2002 (the inception date for Class B, C and I |
| shares), adjusted to reflect the applicable sales load for that class. |
| Assumes the conversion of Class B shares to Class A shares at the end of the sixth year following the date |
| of purchase. |
The Fund 7
UNDERSTANDING YOUR FUND S EXPENSES (Unaudited)
As a mutual fund investor, you pay ongoing expenses, such as management fees and other expenses. Using the information below, you can estimate how these expenses affect your investment and compare them with the expenses of other funds.You also may pay one-time transaction expenses, including sales charges (loads) and redemption fees, which are not shown in this section and would have resulted in higher total expenses. For more information, see your fund s prospectus or talk to your financial adviser.
Review your fund s expenses
The table below shows the expenses you would have paid on a $1,000 investment in Dreyfus International Value Fund from March 1, 2009 to August 31, 2009. It also shows how much a $1,000 investment would be worth at the close of the period, assuming actual returns and expenses.
| | Expenses and Value of a $1,000 Investment
assuming actual returns for the six months ended August 31, 2009 |
| | | Class A | | Class B | | Class C | | Class I |
| |
| |
| |
| |
|
| Expenses paid per $1,000 | | $ 12.00 | | $ 18.52 | | $ 17.01 | | $ 8.70 |
| Ending value (after expenses) | | $1,532.70 | | $1,524.80 | | $1,526.80 | | $1,537.00 |
| | COMPARING YOUR FUND S EXPENSES
WITH THOSE OF OTHER FUNDS (Unaudited) |
Using the SEC s method to compare expenses
The Securities and Exchange Commission (SEC) has established guidelines to help investors assess fund expenses. Per these guidelines, the table below shows your fund s expenses based on a $1,000 investment, assuming a hypothetical 5% annualized return. You can use this information to compare the ongoing expenses (but not transaction expenses or total cost) of investing in the fund with those of other funds.All mutual fund shareholder reports will provide this information to help you make this comparison. Please note that you cannot use this information to estimate your actual ending account balance and expenses paid during the period.
| | Expenses and Value of a $1,000 Investment
assuming a hypothetical 5% annualized return for the six months ended August 31, 2009 |
| | | Class A | | Class B | | Class C | | Class I |
| |
| |
| |
| |
|
| Expenses paid per $1,000 | | $ 9.55 | | $ 14.75 | | $ 13.54 | | $ 6.92 |
| Ending value (after expenses) | | $1,015.73 | | $1,010.54 | | $1,011.75 | | $1,018.35 |
| Expenses are equal to the fund s annualized expense ratio of 1.88% for Class A, 2.91% for Class B, 2.67% for |
| Class C and 1.36% for Class I, multiplied by the average account value over the period, multiplied by 184/365 (to |
| reflect the one-half year period). |
8
STATEMENT OF INVESTMENTS
August 31, 2009 |
| Common Stocks 96.4% | | Shares | | Value ($) |
| |
| |
|
| Australia 3.8% | | | | |
| Amcor | | 303,290 | | 1,479,088 |
| Amcor (Entitlement) | | 150,158 a,b | | 732,292 |
| BlueScope Steel | | 258,550 | | 624,986 |
| Incitec Pivot | | 535,290 | | 1,361,808 |
| Insurance Australia Group | | 432,147 | | 1,307,599 |
| National Australia Bank | | 112,800 | | 2,715,246 |
| Sonic Healthcare | | 28,470 | | 336,399 |
| | | | | 8,557,418 |
| Brazil .7% | | | | |
| Petroleo Brasileiro, ADR | | 20,640 | | 818,170 |
| Tele Norte Leste Participacoes, ADR | | 44,960 | | 716,662 |
| | | | | 1,534,832 |
| China .4% | | | | |
| PetroChina, ADR | | 7,581 | | 832,015 |
| Finland 2.4% | | | | |
| Nokia | | 291,300 | | 4,050,821 |
| UPM-Kymmene | | 112,013 | | 1,345,685 |
| | | | | 5,396,506 |
| France 11.8% | | | | |
| Cap Gemini | | 21,200 | | 1,025,444 |
| Carrefour | | 33,740 | | 1,588,712 |
| Credit Agricole | | 133,126 | | 2,465,791 |
| Danone | | 37,700 | | 2,050,006 |
| France Telecom | | 104,945 | | 2,668,986 |
| GDF Suez | | 59,265 | | 2,497,059 |
| Lagardere | | 29,270 | | 1,260,531 |
| Sanofi-Aventis | | 70,200 | | 4,762,256 |
| Societe Generale | | 20,640 | | 1,663,237 |
| Total | | 90,040 | | 5,159,416 |
| Vivendi | | 51,032 | | 1,453,688 |
| | | | | 26,595,126 |
| Germany 7.3% | | | | |
| Adidas | | 11,100 | | 522,903 |
| Allianz | | 8,700 | | 1,005,525 |
The Fund 9
| STATEMENT OF INVESTMENTS (continued) |
| Common Stocks (continued) | | Shares | | Value ($) |
| |
| |
|
| Germany (continued) | | | | |
| Bayer | | 36,330 | | 2,230,716 |
| Daimler | | 30,256 | | 1,367,623 |
| Deutsche Lufthansa | | 46,440 | | 745,660 |
| Deutsche Post | | 108,214 | | 1,867,069 |
| Deutsche Telekom | | 63,100 | | 839,024 |
| E.ON | | 74,640 | | 3,157,706 |
| Muenchener Rueckversicherungs | | 12,310 | | 1,835,894 |
| RWE | | 17,464 | | 1,617,362 |
| Siemens | | 13,660 | | 1,183,799 |
| | | | | 16,373,281 |
| Greece .8% | | | | |
| Coca-Cola Hellenic Bottling | | 21,220 | | 489,781 |
| Public Power | | 53,100 a | | 1,248,445 |
| | | | | 1,738,226 |
| Hong Kong 2.5% | | | | |
| BOC Hong Kong Holdings | | 1,307,100 | | 2,620,794 |
| China Mobile, ADR | | 19,960 | | 982,431 |
| Hutchison Whampoa | | 194,200 | | 1,365,585 |
| Johnson Electric Holdings | | 1,629,000 a | | 645,257 |
| | | | | 5,614,067 |
| Italy 3.2% | | | | |
| Banco Popolare | | 94,310 a | | 835,559 |
| ENI | | 52,545 | | 1,245,942 |
| Finmeccanica | | 138,036 | | 2,204,492 |
| Mediaset | | 60,050 | | 394,930 |
| Saras | | 313,600 | | 1,084,612 |
| Unipol Gruppo Finanziario | | 1,115,214 a | | 1,480,472 |
| | | | | 7,246,007 |
| Japan 22.6% | | | | |
| Aeon | | 142,190 | | 1,508,238 |
| Asahi Breweries | | 14,200 | | 246,917 |
| Astellas Pharma | | 34,200 | | 1,370,940 |
| Canon | | 27,452 | | 1,053,236 |
| Central Japan Railway | | 358 | | 2,420,011 |
| Chuo Mitsui Trust Holdings | | 561,200 | | 2,364,217 |
| Daiwa House Industry | | 132,600 | | 1,477,767 |
10
| Common Stocks (continued) | | Shares | | Value ($) |
| |
| |
|
| Japan (continued) | | | | |
| Dentsu | | 52,900 | | 1,219,457 |
| Isuzu Motors | | 245,000 | | 568,726 |
| JS Group | | 87,800 | | 1,555,018 |
| Kao | | 41,000 | | 1,039,871 |
| KDDI | | 408 | | 2,319,527 |
| Mediceo Paltac Holdings | | 35,800 | | 512,088 |
| Mitsubishi Chemical Holdings | | 280,000 | | 1,272,864 |
| Mitsubishi Electric | | 133,250 | | 990,962 |
| Mitsubishi UFJ Financial Group | | 470,600 | | 3,004,153 |
| Murata Manufacturing | | 43,070 | | 2,036,625 |
| NGK Spark Plug | | 134,300 | | 1,690,116 |
| Nintendo | | 4,270 | | 1,154,575 |
| Nippon Express | | 195,000 | | 871,789 |
| Nomura Holdings | | 207,700 | | 1,837,046 |
| Omron | | 17,300 | | 295,058 |
| Panasonic | | 99,400 | | 1,591,682 |
| Ricoh | | 52,800 | | 760,933 |
| Secom | | 24,600 | | 1,110,371 |
| Sekisui Chemical | | 67,600 | | 431,536 |
| Seven & I Holdings | | 101,000 | | 2,442,235 |
| Shin-Etsu Chemical | | 21,020 | | 1,242,450 |
| Sumitomo | | 83,500 | | 855,191 |
| Sumitomo Mitsui Financial Group | | 68,900 | | 2,969,253 |
| Takashimaya | | 90,790 | | 761,055 |
| Tokyo Electron | | 15,600 | | 848,318 |
| Tokyo Gas | | 694,220 | | 2,782,849 |
| Tokyo Steel Manufacturing | | 58,700 | | 772,783 |
| Toyota Motor | | 57,800 | | 2,478,474 |
| Yamaha Motor | | 78,600 | | 926,644 |
| | | | | 50,782,975 |
| Malaysia .6% | | | | |
| Malayan Banking | | 755,348 | | 1,396,370 |
| Mexico .5% | | | | |
| America Movil, ADR, Ser. L | | 24,030 | | 1,084,954 |
| Netherlands 2.1% | | | | |
| Aegon | | 79,285 a | | 597,076 |
The Fund 11
| STATEMENT OF INVESTMENTS (continued) |
| Common Stocks (continued) | | Shares | | Value ($) |
| |
| |
|
| Netherlands (continued) | | | | |
| Koninklijke Philips Electronics | | 44,450 | | 1,004,289 |
| Royal Dutch Shell, Cl. A | | 114,407 | | 3,174,510 |
| | | | | 4,775,875 |
| Russia .3% | | | | |
| Gazprom, ADR | | 31,490 | | 667,588 |
| Singapore 2.2% | | | | |
| DBS Group Holdings | | 418,255 | | 3,668,929 |
| Oversea-Chinese Banking | | 255,869 | | 1,374,389 |
| | | | | 5,043,318 |
| South Africa .5% | | | | |
| Nedbank Group | | 78,430 | | 1,162,109 |
| South Korea 2.7% | | | | |
| Hyundai Motor | | 16,386 | | 1,390,757 |
| KB Financial Group, ADR | | 24,654 a | | 1,005,143 |
| Korea Electric Power, ADR | | 54,804 a | | 676,829 |
| KT, ADR | | 78,840 | | 1,227,539 |
| Samsung Electronics | | 1,833 | | 1,131,590 |
| SK Telecom, ADR | | 46,110 | | 717,472 |
| | | | | 6,149,330 |
| Spain .7% | | | | |
| Banco Santander | | 22,680 | | 349,041 |
| Iberdrola | | 130,760 | | 1,210,984 |
| | | | | 1,560,025 |
| Sweden 1.1% | | | | |
| Investor, Cl. B | | 50,820 | | 945,943 |
| Sandvik | | 148,100 | | 1,491,725 |
| | | | | 2,437,668 |
| Switzerland 7.6% | | | | |
| Clariant | | 140,402 a | | 1,268,908 |
| Givaudan | | 1,385 | | 995,358 |
12
| Common Stocks (continued) | | Shares | | Value ($) |
| |
| |
|
| Switzerland (continued) | | | | |
| Nestle | | 91,760 | | 3,811,129 |
| Novartis | | 130,936 | | 6,068,882 |
| Roche Holding | | 16,610 | | 2,639,969 |
| UBS | | 118,468 a | | 2,186,103 |
| | | | | 16,970,349 |
| Taiwan .9% | | | | |
| Compal Electronics | | 1,124,107 | | 1,133,788 |
| United Microelectronics | | 2,011,000 a | | 824,769 |
| | | | | 1,958,557 |
| United Kingdom 21.7% | | | | |
| Anglo American | | 92,234 a | | 3,034,576 |
| BAE Systems | | 299,410 | | 1,521,738 |
| BP | | 731,547 | | 6,335,699 |
| Centrica | | 763,374 | | 3,130,446 |
| Friends Provident Group | | 2,017,042 | | 2,807,513 |
| GlaxoSmithKline | | 207,057 | | 4,055,050 |
| HSBC Holdings | | 494,809 | | 5,413,924 |
| Lonmin | | 27,770 a | | 660,491 |
| Reed Elsevier | | 145,030 | | 1,055,373 |
| Rexam | | 104,260 | | 454,028 |
| Royal Dutch Shell, Cl. A | | 102,514 | | 2,855,446 |
| Smith & Nephew | | 221,147 | | 1,886,484 |
| Tesco | | 374,639 | | 2,292,588 |
| Unilever | | 169,970 | | 4,648,601 |
| United Utilities Group | | 133,700 | | 985,550 |
| Vodafone Group | | 3,062,128 | | 6,620,063 |
| WPP | | 118,190 | | 999,556 |
| | | | | 48,757,126 |
| Total Common Stocks | | | | |
| (cost $229,699,227) | | | | 216,633,722 |
The Fund 13
| STATEMENT OF INVESTMENTS (continued) |
| Preferred Stocks 1.0% | | Shares | | Value ($) |
| |
| |
|
| Germany | | | | |
| Henkel & Co. | | | | |
| (cost $2,322,926) | | 55,720 | | 2,201,513 |
| |
| Other Investment 1.9% | | | | |
| |
| |
|
| Registered Investment Company; | | | | |
| Dreyfus Institutional Preferred Plus Money Market Fund | | | | |
| (cost $4,200,000) | | 4,200,000 c | | 4,200,000 |
| |
| Total Investments (cost $236,222,153) | | 99.3% | | 223,035,235 |
| Cash and Receivables (Net) | | .7% | | 1,687,636 |
| Net Assets | | 100.0% | | 224,722,871 |
| ADR American Depository Receipts |
| a Non-income producing security. |
| b Security restricted as to public resale. This security was acquired on 8/20/09 at a cost of $535,300. The |
| aggregated market value as of period end was $732,292, representing .3% of net assets. The price per share at |
| period end was $4.88. |
| c Investment in affiliated money market mutual fund. |
| Portfolio Summary (Unaudited) | | | | |
| |
| | | Value (%) | | | | Value (%) |
| |
| |
| |
|
| Financial | | 20.9 | | Utilities | | 7.7 |
| Health Care | | 10.6 | | Telecommunication Services | | 7.6 |
| Consumer Staples | | 10.0 | | Materials | | 6.8 |
| Energy | | 9.9 | | Information Technology | | 6.4 |
| Industrial | | 8.8 | | Money Market Investment | | 1.9 |
| Consumer Discretionary | | 8.7 | | | | 99.3 |
| |
| Based on net assets. | | | | | | |
| See notes to financial statements. | | | | | | |
14
STATEMENT OF ASSETS AND LIABILITIES
August 31, 2009 |
| | | | | | | Cost | | Value |
| |
| |
| |
| |
|
| Assets ($): | | | | | | | | |
| Investments in securities See Statement of Investments: | | | | |
| Unaffiliated issuers | | | | | | 232,022,153 | | 218,835,235 |
| Affiliated issuers | | | | | | 4,200,000 | | 4,200,000 |
| Cash | | | | | | | | 445,509 |
| Cash denominated in foreign currencies | | | | 1,127,003 | | 1,128,405 |
| Receivable for investment securities sold | | | | | | 1,957,981 |
| Dividends and interest receivable | | | | | | | | 1,001,012 |
| Receivable for shares of Common Stock subscribed | | | | | | 245,009 |
| Unrealized appreciation on forward foreign | | | | | | |
| currency exchange contracts Note 4 | | | | | | 3,023 |
| Prepaid expenses | | | | | | | | 11,686 |
| | | | | | | | | 227,827,860 |
| Liabilities ($): | | | | | | | | |
| Due to The Dreyfus Corporation and affiliates Note 3(c) | | | | | | 645,725 |
| Payable for investment securities purchased | | | | | | 1,856,925 |
| Payable for shares of Common Stock redeemed | | | | | | 347,583 |
| Unrealized depreciation on forward foreign | | | | | | |
| currency exchange contracts Note 4 | | | | | | 2,841 |
| Accrued expenses | | | | | | | | 251,915 |
| | | | | | | | | 3,104,989 |
| Net Assets ($) | | | | | | | | 224,722,871 |
| Composition of Net Assets ($): | | | | | | | | |
| Paid-in capital | | | | | | | | 338,947,954 |
| Accumulated undistributed investment income net | | | | | | 3,075,574 |
| Accumulated net realized gain (loss) on investments | | | | | | (104,111,634) |
| Accumulated net unrealized appreciation (depreciation) | | | | | | |
| on investments and foreign currency transactions | | | | | | (13,189,023) |
| Net Assets ($) | | | | | | | | 224,722,871 |
| |
| |
| |
| |
|
| |
| |
| Net Asset Value Per Share | | | | | | | | |
| | | Class A | | Class B | | Class C | | Class I |
| |
| |
| |
| |
|
| Net Assets ($) | | 159,260,477 | | 5,395,234 | | 18,607,174 | | 41,459,986 |
| Shares Outstanding | | 14,446,062 | | 500,415 | | 1,717,103 | | 3,763,216 |
| Net Asset Value Per Share ($) | | 11.02 | | 10.78 | | 10.84 | | 11.02 |
| |
| See notes to financial statements. | | | | | | | | |
The Fund 15
STATEMENT OF OPERATIONS
Year Ended August 31, 2009 |
| Investment Income ($): | | |
| Income: | | |
| Cash dividends (net of $539,286 foreign taxes withheld at source): | | |
| Unaffiliated issuers | | 6,440,834 |
| Affiliated issuers | | 14,930 |
| Interest | | 107 |
| Total Income | | 6,455,871 |
| Expenses: | | |
| Management fee Note 3(a) | | 1,849,191 |
| Shareholder servicing costs Note 3(c) | | 844,827 |
| Custodian fees Note 3(c) | | 394,572 |
| Distribution fees Note 3(b) | | 179,209 |
| Registration fees | | 59,970 |
| Professional fees | | 58,010 |
| Prospectus and shareholders reports | | 41,089 |
| Directors fees and expenses Note 3(d) | | 34,276 |
| Loan commitment fees Note 2 | | 5,630 |
| Interest expense Note 2 | | 1,576 |
| Miscellaneous | | 41,873 |
| Total Expenses | | 3,510,223 |
| Less reduction in fees due to earnings credits Note 1(c) | | (8,635) |
| Net Expenses | | 3,501,588 |
| Investment Income Net | | 2,954,283 |
| Realized and Unrealized Gain (Loss) on Investments Note 4 ($): | | |
| Net realized gain (loss) on investments and foreign currency transactions | | (97,129,675) |
| Net realized gain (loss) on financial futures | | 2,659,222 |
| Net realized gain (loss) on forward foreign currency exchange contracts | | (442,302) |
| Net Realized Gain (Loss) | | (94,912,755) |
| Net unrealized appreciation (depreciation) on investments | | |
| and forward foreign currency exchange transactions | | |
| (including $457 net unrealized appreciation on forward | | |
| foreign currency exchange contracts) | | 57,333,912 |
| Net Realized and Unrealized Gain (Loss) on Investments | | (37,578,843) |
| Net (Decrease) in Net Assets Resulting from Operations | | (34,624,560) |
| |
| See notes to financial statements. | | |
16
STATEMENT OF CHANGES IN NET ASSETS
| | | Year Ended August 31, |
| | |
|
| | | 2009a | | 2008 |
| |
| |
|
| Operations ($): | | | | |
| Investment income net | | 2,954,283 | | 8,309,329 |
| Net realized gain (loss) on investments | | (94,912,755) | | 17,326,250 |
| Net unrealized appreciation | | | | |
| (depreciation) on investments | | 57,333,912 | | (114,370,608) |
| Net Increase (Decrease) in Net Assets | | | | |
| Resulting from Operations | | (34,624,560) | | (88,735,029) |
| Dividends to Shareholders from ($): | | | | |
| Investment income net: | | | | |
| Class A Shares | | (6,500,886) | | (7,005,890) |
| Class B Shares | | (165,566) | | (142,023) |
| Class C Shares | | (559,247) | | (502,196) |
| Class I Shares | | (259,097) | | (1,649,168) |
| Class T Shares | | (46,703) | | (23,556) |
| Net realized gain on investments: | | | | |
| Class A Shares | | | | (106,558,708) |
| Class B Shares | | | | (4,457,897) |
| Class C Shares | | | | (14,223,107) |
| Class I Shares | | | | (18,597,486) |
| Class T Shares | | | | (520,552) |
| Total Dividends | | (7,531,499) | | (153,680,583) |
| Capital Stock Transactions ($): | | | | |
| Net proceeds from shares sold: | | | | |
| Class A Shares | | 29,371,795 | | 55,658,754 |
| Class B Shares | | 79,199 | | 1,098,181 |
| Class C Shares | | 676,887 | | 10,589,408 |
| Class I Shares | | 37,896,083 | | 21,175,546 |
| Class T Shares | | 148,528 | | 1,141,955 |
The Fund 17
STATEMENT OF CHANGES IN NET ASSETS (continued)
| | | Year Ended August 31, |
| | |
|
| | | 2009a | | 2008 |
| |
| |
|
| Capital Stock Transactions ($) (continued): | | | | |
| Dividends reinvested: | | | | |
| Class A Shares | | 5,315,940 | | 95,811,083 |
| Class B Shares | | 125,968 | | 3,475,694 |
| Class C Shares | | 218,409 | | 5,392,641 |
| Class I Shares | | 124,769 | | 20,101,809 |
| Class T Shares | | 16,208 | | 276,821 |
| Cost of shares redeemed: | | | | |
| Class A Shares | | (69,485,217) | | (243,981,997) |
| Class B Shares | | (2,694,367) | | (8,563,990) |
| Class C Shares | | (8,747,102) | | (27,476,042) |
| Class I Shares | | (37,540,583) | | (40,708,182) |
| Class T Shares | | (1,213,705) | | (914,992) |
| Increase (Decrease) in Net Assets from | | | | |
| Capital Stock Transactions | | (45,707,188) | | (106,923,311) |
| Total Increase (Decrease) in Net Assets | | (87,863,247) | | (349,338,923) |
| Net Assets ($): | | | | |
| Beginning of Period | | 312,586,118 | | 661,925,041 |
| End of Period | | 224,722,871 | | 312,586,118 |
| Undistributed investment income net | | 3,075,574 | | 8,360,397 |
18
| | | Year Ended August 31, |
| | |
|
| | | 2009a | | 2008 |
| |
| |
|
| Capital Share Transactions: | | | | |
| Class Ab,c | | | | |
| Shares sold | | 2,918,176 | | 3,464,720 |
| Shares issued for dividends reinvested | | 621,020 | | 6,169,481 |
| Shares redeemed | | (7,651,970) | | (15,747,598) |
| Net Increase (Decrease) in Shares Outstanding | | (4,112,774) | | (6,113,397) |
| Class Bb | | | | |
| Shares sold | | 5,565 | | 70,828 |
| Shares issued for dividends reinvested | | 14,842 | | 229,419 |
| Shares redeemed | | (301,897) | | (562,649) |
| Net Increase (Decrease) in Shares Outstanding | | (281,490) | | (262,402) |
| Class C | | | | |
| Shares sold | | 67,663 | | 681,789 |
| Shares issued for dividends reinvested | | 25,731 | | 354,546 |
| Shares redeemed | | (961,145) | | (1,771,329) |
| Net Increase (Decrease) in Shares Outstanding | | (867,751) | | (734,994) |
| Class I | | | | |
| Shares sold | | 4,235,894 | | 1,210,668 |
| Shares issued for dividends reinvested | | 14,644 | | 1,296,891 |
| Shares redeemed | | (3,936,055) | | (2,755,545) |
| Net Increase (Decrease) in Shares Outstanding | | 314,483 | | (247,986) |
| Class Tc | | | | |
| Shares sold | | 16,679 | | 79,249 |
| Shares issued for dividends reinvested | | 1,969 | | 18,504 |
| Shares redeemed | | (149,447) | | (68,375) |
| Net Increase (Decrease) in Shares Outstanding | | (130,799) | | 29,378 |
| a Effective as of the close of business on February 4, 2009, the fund no longer offers Class T shares. |
| b During the period ended August 31, 2009, 53,490 Class B shares representing $511,632 were automatically |
| converted to 52,263 Class A shares and during the period ended August 31, 2008, 84,168 Class B shares |
| representing $1,232,676 were automatically converted to 81,911 Class A shares. |
| c On the close of business on February 4, 2009, 70,519 Class T shares representing $554,283 were converted to |
| 67,678 Class A shares. |
| See notes to financial statements. |
The Fund 19
FINANCIAL HIGHLIGHTS
The following tables describe the performance for each share class for the fiscal periods indicated.All information (except portfolio turnover rate) reflects financial results for a single fund share.Total return shows how much your investment in the fund would have increased (or decreased) during each period, assuming you had reinvested all dividends and distributions.These figures have been derived from the fund s financial statements.
| | | | | Year Ended August 31, | | |
| | |
| |
| |
|
| Class A Shares | | 2009 | | 2008 | | 2007 | | 2006 | | 2005 |
| |
| |
| |
| |
| |
|
| Per Share Data ($): | | | | | | | | | | |
| Net asset value, beginning of period | | 12.30 | | 20.21 | | 20.91 | | 20.27 | | 17.10 |
| Investment Operations: | | | | | | | | | | |
| Investment income neta | | .15 | | .27 | | .23 | | .25 | | .20 |
| Net realized and unrealized | | | | | | | | | | |
| gain (loss) on investments | | (1.01) | | (2.93) | | 2.25 | | 3.62 | | 3.15 |
| Total from Investment Operations | | (.86) | | (2.66) | | 2.48 | | 3.87 | | 3.35 |
| Distributions: | | | | | | | | | | |
| Dividends from investment income net | | (.42) | | (.32) | | (.33) | | (.24) | | (.18) |
| Dividends from net realized | | | | | | | | | | |
| gain on investments | | | | (4.93) | | (2.85) | | (2.99) | | |
| Total Distributions | | (.42) | | (5.25) | | (3.18) | | (3.23) | | (.18) |
| Net asset value, end of period | | 11.02 | | 12.30 | | 20.21 | | 20.91 | | 20.27 |
| Total Return (%)b | | (5.97) | | (18.56) | | 12.47 | | 21.06 | | 19.65 |
| Ratios/Supplemental Data (%): | | | | | | | | | | |
| Ratio of total expenses | | | | | | | | | | |
| to average net assets | | 1.84 | | 1.57 | | 1.52 | | 1.55 | | 1.51 |
| Ratio of net expenses | | | | | | | | | | |
| to average net assets | | 1.84c | | 1.56 | | 1.52c | | 1.55 | | 1.51c |
| Ratio of net investment income | | | | | | | | | | |
| to average net assets | | 1.66 | | 1.71 | | 1.11 | | 1.23 | | 1.02 |
| Portfolio Turnover Rate | | 69.63 | | 46.96 | | 61.70 | | 48.74 | | 43.05 |
| Net Assets, end of period ($ x 1,000) | | 159,260 | | 228,308 | | 498,696 | | 657,525 | | 715,768 |
| a | | Based on average shares outstanding at each month end. |
| b | | Exclusive of sales charge. |
| c | | Expense waivers and/or reimbursements amounted to less than .01%. |
| See notes to financial statements. |
20
| | | | | Year Ended August 31, | | |
| | |
| |
| |
|
| Class B Shares | | 2009 | | 2008 | | 2007 | | 2006 | | 2005 |
| |
| |
| |
| |
| |
|
| Per Share Data ($): | | | | | | | | | | |
| Net asset value, beginning of period | | 11.93 | | 19.72 | | 20.46 | | 19.92 | | 16.86 |
| Investment Operations: | | | | | | | | | | |
| Investment income neta | | .06 | | .12 | | .07 | | .09 | | .06 |
| Net realized and unrealized | | | | | | | | | | |
| gain (loss) on investments | | (.96) | | (2.82) | | 2.21 | | 3.56 | | 3.09 |
| Total from Investment Operations | | (.90) | | (2.70) | | 2.28 | | 3.65 | | 3.15 |
| Distributions: | | | | | | | | | | |
| Dividends from investment income net | | (.25) | | (.16) | | (.17) | | (.12) | | (.09) |
| Dividends from net realized | | | | | | | | | | |
| gain on investments | | | | (4.93) | | (2.85) | | (2.99) | | |
| Total Distributions | | (.25) | | (5.09) | | (3.02) | | (3.11) | | (.09) |
| Net asset value, end of period | | 10.78 | | 11.93 | | 19.72 | | 20.46 | | 19.92 |
| Total Return (%)b | | (6.96) | | (19.20) | | 11.65 | | 20.15 | | 18.70 |
| Ratios/Supplemental Data (%): | | | | | | | | | | |
| Ratio of total expenses | | | | | | | | | | |
| to average net assets | | 2.81 | | 2.40 | | 2.27 | | 2.32 | | 2.32 |
| Ratio of net expenses | | | | | | | | | | |
| to average net assets | | 2.81c | | 2.39 | | 2.27c | | 2.32 | | 2.32c |
| Ratio of net investment income | | | | | | | | | | |
| to average net assets | | .69 | | .82 | | .35 | | .46 | | .30 |
| Portfolio Turnover Rate | | 69.63 | | 46.96 | | 61.70 | | 48.74 | | 43.05 |
| Net Assets, end of period ($ x 1,000) | | 5,395 | | 9,325 | | 20,597 | | 22,865 | | 21,101 |
| a | | Based on average shares outstanding at each month end. |
| b | | Exclusive of sales charge. |
| c | | Expense waivers and/or reimbursements amounted to less than .01%. |
| See notes to financial statements. |
The Fund 21
| FINANCIAL HIGHLIGHTS (continued) |
| | | | | Year Ended August 31, | | |
| | |
| |
| |
|
| Class C Shares | | 2009 | | 2008 | | 2007 | | 2006 | | 2005 |
| |
| |
| |
| |
| |
|
| Per Share Data ($): | | | | | | | | | | |
| Net asset value, beginning of period | | 11.98 | | 19.79 | | 20.52 | | 19.97 | | 16.90 |
| Investment Operations: | | | | | | | | | | |
| Investment income neta | | .08 | | .14 | | .08 | | .10 | | .07 |
| Net realized and unrealized | | | | | | | | | | |
| gain (loss) on investments | | (.96) | | (2.85) | | 2.21 | | 3.56 | | 3.10 |
| Total from Investment Operations | | (.88) | | (2.71) | | 2.29 | | 3.66 | | 3.17 |
| Distributions: | | | | | | | | | | |
| Dividends from investment income net | | (.26) | | (.17) | | (.17) | | (.12) | | (.10) |
| Dividends from net realized | | | | | | | | | | |
| gain on investments | | | | (4.93) | | (2.85) | | (2.99) | | |
| Total Distributions | | (.26) | | (5.10) | | (3.02) | | (3.11) | | (.10) |
| Net asset value, end of period | | 10.84 | | 11.98 | | 19.79 | | 20.52 | | 19.97 |
| Total Return (%)b | | (6.71) | | (19.16) | | 11.71 | | 20.14 | | 18.79 |
| Ratios/Supplemental Data (%): | | | | | | | | | | |
| Ratio of total expenses | | | | | | | | | | |
| to average net assets | | 2.63 | | 2.32 | | 2.22 | | 2.26 | | 2.26 |
| Ratio of net expenses | | | | | | | | | | |
| to average net assets | | 2.63c | | 2.32c | | 2.22c | | 2.26 | | 2.26c |
| Ratio of net investment income | | | | | | | | | | |
| to average net assets | | .87 | | .91 | | .40 | | .51 | | .35 |
| Portfolio Turnover Rate | | 69.63 | | 46.96 | | 61.70 | | 48.74 | | 43.05 |
| Net Assets, end of period ($ x 1,000) | | 18,607 | | 30,965 | | 65,715 | | 71,830 | | 73,348 |
| a | | Based on average shares outstanding at each month end. |
| b | | Exclusive of sales charge. |
| c | | Expense waivers and/or reimbursements amounted to less than .01%. |
| See notes to financial statements. |
22
| | | | | Year Ended August 31, | | |
| | |
| |
| |
|
| Class I Shares | | 2009 | | 2008 | | 2007a | | 2006 | | 2005 |
| |
| |
| |
| |
| |
|
| Per Share Data ($): | | | | | | | | | | |
| Net asset value, beginning of period | | 12.31 | | 20.27 | | 20.96 | | 20.33 | | 17.13 |
| Investment Operations: | | | | | | | | | | |
| Investment income netb | | .19 | | .34 | | .28 | | .32 | | .30 |
| Net realized and unrealized | | | | | | | | | | |
| gain (loss) on investments | | (.98) | | (2.93) | | 2.28 | | 3.63 | | 3.13 |
| Total from Investment Operations | | (.79) | | (2.59) | | 2.56 | | 3.95 | | 3.43 |
| Distributions: | | | | | | | | | | |
| Dividends from investment income net | | (.50) | | (.44) | | (.40) | | (.33) | | (.23) |
| Dividends from net realized | | | | | | | | | | |
| gain on investments | | | | (4.93) | | (2.85) | | (2.99) | | |
| Total Distributions | | (.50) | | (5.37) | | (3.25) | | (3.32) | | (.23) |
| Net asset value, end of period | | 11.02 | | 12.31 | | 20.27 | | 20.96 | | 20.33 |
| Total Return (%) | | (5.21) | | (18.25) | | 12.91 | | 21.45 | | 20.11 |
| Ratios/Supplemental Data (%): | | | | | | | | | | |
| Ratio of total expenses | | | | | | | | | | |
| to average net assets | | 1.37 | | 1.21 | | 1.15 | | 1.21 | | 1.13 |
| Ratio of net expenses | | | | | | | | | | |
| to average net assets | | 1.36 | | 1.20 | | 1.15c | | 1.21 | | 1.13c |
| Ratio of net investment income | | | | | | | | | | |
| to average net assets | | 2.09 | | 2.16 | | 1.36 | | 1.58 | | 1.56 |
| Portfolio Turnover Rate | | 69.63 | | 46.96 | | 61.70 | | 48.74 | | 43.05 |
| Net Assets, end of period ($ x 1,000) | | 41,460 | | 42,444 | | 74,932 | | 81,335 | | 72,470 |
| a | | Effective June 1, 2007, Class R shares were redesignated as Class I shares. |
| b | | Based on average shares outstanding at each month end. |
| c | | Expense waivers and/or reimbursements amounted to less than .01%. |
| See notes to financial statements. |
The Fund 23
NOTES TO FINANCIAL STATEMENTS
NOTE 1 Significant Accounting Policies:
Dreyfus International Value Fund (the fund ) is a separate diversified series of Advantage Funds, Inc. (the Company ), which is registered under the Investment Company Act of 1940, as amended (the Act ), as an open-end management investment company and operates as a series company that offers ten series, including the fund. The fund s investment objective is long-term capital growth. The Dreyfus Corporation (the Manager or Dreyfus ), a wholly-owned subsidiary of The Bank of New York Mellon Corporation ( BNY Mellon ), serves as the fund s investment adviser.
At a meeting of the fund s Board of Directors held on July 15, 2008, the Board approved, effective December 1, 2008, a proposal to change the name of the fund from Dreyfus Premier International Value Fund to Dreyfus International Value Fund .
MBSC Securities Corporation (the Distributor ), a wholly-owned subsidiary of the Manager, is the distributor of the fund s shares. The fund is authorized to issue 400 million shares of $.001 par value Common Stock.The fund currently offers four classes of shares: Class A (100 million shares authorized), Class B (100 million shares authorized), Class C (100 million shares authorized) and Class I (100 million shares authorized). Class A shares are subject to a sales charge imposed at the time of purchase. Class B shares are subject to a contingent deferred sales charge ( CDSC ) imposed on Class B share redemptions made within six years of purchase and automatically convert to Class A shares after six years.The fund does not offer Class B shares, except in connection with dividend reinvestment and permitted exchanges of Class B shares. Class C shares are subject to a CDSC on Class C shares redeemed within one year of purchase and Class I shares are sold at net asset value per share only to institutional investors. Other differences between the classes include the services offered to and the expenses borne by each class, the allocation of certain transfer agency costs and certain voting rights. Income, expenses (other than expenses
24
attributable to a specific class), and realized and unrealized gains or losses on investments are allocated to each class of shares based on its relative net assets.
Effective December 3, 2008, investments for new accounts were no longer permitted in Class T shares of the fund, except that participants in certain group retirement plans were able to open a new account in Class T shares of the fund, provided that the fund was established as an investment option under the plans before December 3, 2008. On February 4, 2009, the fund issued to each holder of its Class T shares, in exchange for said shares, Class A shares of the fund having an aggregate net asset value equal to the aggregate net asset value of the shareholder s Class T shares. Subsequent investments in the fund s Class A shares made by prior holders of the fund s Class T shares who received Class A shares of the fund in exchange for their Class T shares are subject to the front-end sales load schedule that was in effect for Class T shares at the time of the exchange. Otherwise, all other Class A share attributes will be in effect. Effective as of the close of business on February 4, 2009, the fund no longer offers Class T shares.
The Company accounts separately for the assets, liabilities and operations of each series. Expenses directly attributable to each series are charged to that series operations; expenses which are applicable to all series are allocated among them on a pro rata basis.
The fund s financial statements are prepared in accordance with U.S. generally accepted accounting principles, which may require the use of management estimates and assumptions. Actual results could differ from those estimates.
The fund enters into contracts that contain a variety of indemnifications. The fund s maximum exposure under these arrangements is unknown.The fund does not anticipate recognizing any loss related to these arrangements.
The Fund 25
| NOTES TO FINANCIAL STATEMENTS (continued) |
(a) Portfolio valuation: Investments in securities are valued at the last sales price on the securities exchange or national securities market on which such securities are primarily traded. Securities listed on the National Market System for which market quotations are available are valued at the official closing price or, if there is no official closing price that day, at the last sales price. Securities not listed on an exchange or the national securities market, or securities for which there were no transactions, are valued at the average of the most recent bid and asked prices, except for open short positions, where the asked price is used for valuation purposes. Bid price is used when no asked price is available. Registered investment companies that are not traded on an exchange are valued at their net asset value. When market quotations or official closing prices are not readily available, or are determined not to reflect accurately fair value, such as when the value of a security has been significantly affected by events after the close of the exchange or market on which the security is principally traded (for example, a foreign exchange or market),but before the fund calculates its net asset value,the fund may value these investments at fair value as determined in accordance with the procedures approved by the Board of Directors. Fair valuing of securities may be determined with the assistance of a pricing service using calculations based on indices of domestic securities and other appropriate indicators, such as prices of relevant ADRs and futures contracts. For other securities that are fair valued by the Board of Directors, certain factors may be considered such as: fundamental analytical data, the nature and duration of restrictions on disposition, an evaluation of the forces that influence the market in which the securities are purchased and sold, and public trading in similar securities of the issuer or comparable issuers. Financial futures are valued at the last sales price. Investments denominated in foreign currencies are translated to U.S. dollars at the prevailing rates of exchange. Forward foreign currency exchange contracts ( forward contracts ) are valued at the forward rate.
The fund adopted Statement of Financial Accounting Standards No. 157 FairValue Measurements ( FAS 157 ). FAS 157 establishes an authoritative definition of fair value, sets out a framework for measuring fair value, and requires additional disclosures about fair value measurements.
26
Various inputs are used in determining the value of the fund s investments relating to FAS 157.These inputs are summarized in the three broad levels listed below.
| | Level 1 quoted prices in active markets for identical investments.
Level 2 other significant observable inputs (including quoted
prices for similar investments, interest rates, prepayment speeds,
credit risk, etc.).
Level 3 significant unobservable inputs (including the fund s own
assumptions in determining the fair value of investments). |
The inputs or methodology used for valuing securities are not necessarily an indication of the risk associated with investing in those securities.
The following is a summary of the inputs used as of August 31, 2009 in valuing the fund s investments:
| | | | | Level 2 Other | | Level 3 | | |
| | | Level 1 | | Significant | | Significant | | |
| | | Quoted | | Observable | | Unobservable | | |
| | | Prices | | Inputs | | Inputs | | Total |
| |
| |
| |
| |
|
| Assets ($) | | | | | | | | |
| Investments in Securities: | | | | | | |
| Equity Securities | | | | | | | | |
| Foreign | | 218,835,235 | | | | | | 218,835,235 |
| Mutual Funds | | 4,200,000 | | | | | | 4,200,000 |
| Other Financial | | | | | | | | |
| Instruments | | | | 3,023 | | | | 3,023 |
| Liabilities ($) | | | | | | | | |
| Other Financial | | | | | | | | |
| Instruments | | | | (2,841) | | | | (2,841) |
| Other financial instruments include derivative instruments such as futures, forward foreign currency |
| exchange contracts, swap contracts and options contracts. Amounts shown represent unrealized |
| appreciation (depreciation), or in the case of options, market value at period end. |
(b) Foreign currency transactions: The fund does not isolate that portion of the results of operations resulting from changes in foreign exchange rates on investments from the fluctuations arising from changes in market prices of securities held. Such fluctuations are included with the net realized and unrealized gain or loss on investments.
The Fund 27
| NOTES TO FINANCIAL STATEMENTS (continued) |
Net realized foreign exchange gains or losses arise from sales of foreign currencies, currency gains or losses realized on securities transactions and the difference between the amounts of dividends, interest and foreign withholding taxes recorded on the fund s books and the U.S. dollar equivalent of the amounts actually received or paid. Net unrealized foreign exchange gains or losses arise from changes in the value of assets and liabilities other than investments, resulting from changes in exchange rates. Foreign currency gains and losses on investments are included with net realized and unrealized gain or loss on investments.
(c) Securities transactions and investment income: Securities transactions are recorded on a trade date basis. Realized gains and losses from securities transactions are recorded on the identified cost basis. Dividend income is recognized on the ex-dividend date and interest income, including, where applicable, accretion of discount and amortization of premium on investments, is recognized on the accrual basis.
The fund has arrangements with the custodian and cash management bank whereby the fund may receive earnings credits when positive cash balances are maintained, which are used to offset custody and cash management fees. For financial reporting purposes, the fund includes net earnings credits as an expense offset in the Statement of Operations.
Investing in foreign markets may involve special risks and considerations not typically associated with investing in the U.S. These risks include revaluation of currencies, high rates of inflation, repatriation restrictions on income and capital, and adverse political and economic developments. Moreover, securities issued in these markets may be less liquid, subject to government ownership controls and delayed settlements, and their prices may be more volatile than those of comparable securities in the U.S.
(d) Affiliated issuers: Investments in other investment companies advised by the Manager are defined as affiliated in the Act.
(e) Dividends to shareholders: Dividends are recorded on the ex-dividend date. Dividends from investment income-net and dividends from net realized capital gains, if any, are normally declared and paid
28
annually, but the fund may make distributions on a more frequent basis to comply with the distribution requirements of the Internal Revenue Code of 1986, as amended (the Code ).To the extent that net realized capital gains can be offset by capital loss carryovers, it is the policy of the fund not to distribute such gains. Income and capital gain distributions are determined in accordance with income tax regulations, which may differ from U.S. generally accepted accounting principles.
(f) Federal income taxes: It is the policy of the fund to continue to qualify as a regulated investment company, if such qualification is in the best interests of its shareholders, by complying with the applicable provisions of the Code, and to make distributions of taxable income sufficient to relieve it from substantially all federal income and excise taxes.
As of and during the period ended August 31, 2009, the fund did not have any liabilities for any uncertain tax positions.The fund recognizes interest and penalties, if any, related to uncertain tax positions as income tax expense in the Statement of Operations. During the period, the fund did not incur any interest or penalties.
Each of the tax years in the four-year period ended August 31, 2009 remains subject to examination by the Internal Revenue Service and state taxing authorities.
At August 31, 2009 the components of accumulated earnings on a tax basis were as follows: undistributed ordinary income $3,230,010, accumulated capital losses $45,539,199 and unrealized depreciation $25,365,097. In addition, the fund had $46,550,797 of capital losses realized after October 31, 2008, which were deferred for tax purposes to the first day of the following fiscal year.
The accumulated capital loss carryover of $41,327,161 is available to be applied against future net securities profits, if any, realized subsequent to August 31, 2009. If not applied, this carryover amount expires in fiscal 2017.
The fund also has an accumulated capital loss carryover of $4,212,038 available for federal income tax purposes to be applied against future net
The Fund 29
| NOTES TO FINANCIAL STATEMENTS (continued) |
securities profits, if any, realized subsequent to August 31, 2009.This amount can be utilized in subsequent years subject to an annual limitation due to the fund s merger with Bear Stearns International Equity Portfolio. If not applied, this capital loss carryover expires in fiscal 2010.The accumulated capital loss carryover reflected above represents a capital loss carryover from Bear Stearns International Equity Portfolio after limitations pursuant to Section 383 of the Code.
The tax character of distributions paid to shareholders during the fiscal periods ended August 31, 2009 and August 31, 2008, were as follows: ordinary income $7,531,499 and $46,115,311 and long-term capital gains $0 and $107,565,272, respectively.
During the period ended August 31, 2009, as a result of permanent book to tax differences, primarily due to the tax treatment for foreign exchange gains and losses and treating a portion of the proceeds from redemptions as a distribution for tax purposes, the fund decreased accumulated undistributed investment income-net by $707,607, decreased accumulated net realized gain (loss) on investments by $5,984,709 and increased paid-in capital by $6,692,316. Net assets and net asset value per share were not affected by this reclassification.
NOTE 2 Bank Lines of Credit:
Prior to October 15, 2008, the fund participated with other Dreyfus-managed funds in a $350 million redemption credit facility. Effective October 15, 2008, the fund participates with other Dreyfus-managed funds in a $145 million credit facility led by Citibank, N.A. and a $300 million credit facility provided by The Bank of New York Mellon (each, a Facility ), each to be utilized primarily for temporary or emergency purposes, including the financing of redemptions. In connection therewith, the fund has agreed to pay its pro rata portion of Facility fees for each Facility. Interest is charged to the fund based on rates determined pursuant to the terms of the respective Facility at the time of the borrowing.
30
The average amount of borrowings outstanding under the Facilities during the period ended August 31, 2009 was approximately $82,900 with a related weighted average annualized interest rate of 1.90%.
NOTE 3 Management Fee and Other Transactions with Affiliates:
(a) Pursuant to a management agreement with the Manager, the management fee is computed at the annual rate of 1% of the value of the fund s average daily net assets and is payable monthly.
During the period ended August 31, 2009, the Distributor retained $1,809 and $27 from commissions earned on sales of the fund s Class A and Class T shares, respectively and $26,814 and $3,718 from CDSCs on redemptions of the fund s Class B and Class C shares, respectively.
(b) Under the Distribution Plan (the Plan ) adopted pursuant to Rule 12b-1 under the Act, Class B and Class C shares pay and Class T shares paid the Distributor for distributing their shares at an annual rate of .75% of the value of the average daily net assets of Class B and Class C shares and .25% of the value of the average daily net assets of ClassT shares. During the period ended August 31, 2009, Class B, Class C and Class T shares were charged $41,894, $136,119 and $1,196, respectively, pursuant to the Plan.
(c) Under the Shareholder Services Plan, Class A, Class B and Class C shares pay and Class T shares paid the Distributor at an annual rate of .25% of the value of their average daily net assets for the provision of certain services. The services provided may include personal services relating to shareholder accounts, such as answering shareholder inquiries regarding the fund and providing reports and other information, and services related to the maintenance of shareholder accounts. The Distributor may make payments to Service Agents (a securities dealer, financial institution or industry professional) in respect of these services.The Distributor determines the amounts to be paid to Service
The Fund 31
| NOTES TO FINANCIAL STATEMENTS (continued) |
Agents. During the period ended August 31, 2009, Class A, Class B, Class C and Class T shares were charged $350,109, $13,965, $45,373 and $1,196, respectively, pursuant to the Shareholder Services Plan.
The fund compensates Dreyfus Transfer, Inc., a wholly-owned subsidiary of the Manager, under a transfer agency agreement for providing personnel and facilities to perform transfer agency services for the fund. During the period ended August 31, 2009, the fund was charged $105,524 pursuant to the transfer agency agreement.
The fund compensates The Bank of NewYork Mellon, a subsidiary of BNY Mellon and an affiliate of Dreyfus, under a cash management agreement for performing cash management services related to fund subscriptions and redemptions. During the period ended August 31, 2009, the fund was charged $8,382 pursuant to the cash management agreement.These fees were offset by earnings credits pursuant to the cash management agreement.
The fund also compensates The Bank of New York Mellon under a custody agreement for providing custodial services for the fund. During the period ended August 31, 2009, the fund was charged $394,572 pursuant to the custody agreement.
During the period ended August 31, 2009, the fund was charged $6,097 for services performed by the Chief Compliance Officer.
The components of Due to The Dreyfus Corporation and affiliates in the Statement of Assets and Liabilities consist of: management fees $180,704, Rule 12b-1 distribution plan fees $15,036, shareholder services plan fees $36,864, custodian fees $348,837, chief compliance officer fees $2,784 and transfer agency per account fees $61,500.
(d) Each Board member also serves as a Board member of other funds within the Dreyfus complex. Annual retainer fees and attendance fees are allocated to each fund based on net assets.
32
(e) A 2% redemption fee is charged and retained by the fund on certain shares redeemed within sixty days following the date of issuance subject to exceptions, including redemptions made through the use of the fund s exchange privilege. During the period ended August 31, 2009, redemption fees charged and retained by the fund amounted to $23,339.
NOTE 4 Securities Transactions:
The aggregate amount of purchases and sales of investment securities, excluding short-term securities, financial futures and forward contracts, during the period ended August 31, 2009, amounted to $129,306,333 and $175,019,369, respectively.
The fund adopted FASB Statement of Financial Accounting Standards No. 161 Disclosures about Derivative Instruments and Hedging Activities ( FAS 161 ), which changes the disclosure requirements for derivative instruments and hedging activities. Because investment companies value their derivatives at fair value and recognize changes in fair value through the Statement of Operations, they do not qualify for FAS 133 hedge accounting. Accordingly, even though a fund s investments in derivatives may represent economic hedges, they are considered to be non-hedge transactions for purposes of FAS 161 disclosure. FAS 161 requires qualitative disclosures about objectives and strategies for using derivatives, quantitative disclosures about fair value amounts of gains and losses on derivative instruments and disclosures about credit-risk-related contingent features in derivative agreements.The following tables show the fund s exposure to different types of market risk as it relates to the Statement of Assets and Liabilities and the Statement of Operations, respectively. All changes to accounting policies and disclosures have been made in accordance with FAS 161 and are incorporated for the current period as part of the disclosures within this Note.
The Fund 33
| | NOTES TO FINANCIAL STATEMENTS (continued) |
Fair value of derivative instruments as of August 31,2009 is shown below:
| | | | | Derivative | | Derivative |
| | | | | Assets ($) | | Liabilities ($) |
| |
| |
| |
|
| Foreign currency risk 1 | | 3,023 Foreign currency risk2 | | (2,841) |
| Gross fair value of | | | | |
| | | derivatives contracts | | 3,023 | | (2,841) |
| |
| Statement of Assets and Liabilities location: | | |
| 1 | | Unrealized appreciation on forward foreign currency exchange contracts. | | |
| 2 | | Unrealized depreciation on forward foreign currency exchange contracts. | | |
The effect of derivative instruments in the Statement of Operations for the period ended August 31, 2009 is shown below:
| | | Amount of realized gain or (loss) on derivatives recognized in income ($) |
| | |
|
| | | | | Foreign Currency | | |
| Underlying risk | | Futures3 | | Contracts4 | | Total |
| |
| |
| |
|
| Equity | | 2,659,222 | | | | 2,659,222 |
| Foreign currency | | | | (442,302) | | (442,302) |
| Total | | 2,659,222 | | (442,302) | | 2,216,920 |
| Change in unrealized appreciation or (depreciation) on derivatives recognized in income ($)5 |
|
| | | | | Foreign Currency | | |
| Underlying risk | | Futures | | Contracts | | Total |
| |
| |
| |
|
| Foreign currency | | | | 457 | | 457 |
| Total | | | | 457 | | 457 |
| Statement of Operations location: |
| 3 | | Net realized gain (loss) on financial futures. |
| 4 | | Net realized gain (loss) on forward foreign currency exchange contracts. |
| 5 | | Net unrealized appreciation (depreciation) on investments and forward foreign currency |
| | | exchange contracts. |
Futures Contracts: In the normal course of pursuing its investment objectives, the fund is exposed to market risk (including equity price risk, interest rate risk and foreign currency exchange risk) as a result of changes in value of underlying financial instruments. The fund may invest in financial futures contracts in order to manage its exposure to or protect against changes in the market. A futures contract represents a commitment for the future purchase or sale of an asset at a specified
34
date. Upon entering into such contracts, these investments require initial margin deposits with a broker, which consist of cash or cash equiv-alents.The amount of these deposits is determined by the exchange or Board of Trade on which the contract is traded and is subject to change. Accordingly, variation margin payments are received or made to reflect daily unrealized gains or losses, which are recorded in the Statement of Operations. Futures contracts are valued daily at the settlement price established by the Board of Trade or exchange upon which they are traded.When the contracts are closed, the fund recognizes a realized gain or loss.There is minimal counterparty credit risk to the fund with futures, since futures are exchange traded and the exchange s clearinghouse, as counterparty to all exchange traded futures, guarantees the futures against default.At August 31, 2009, there were no open financial futures contracts outstanding.
Forward Foreign Currency Exchange Contracts: The fund may enter into forward contracts in order to hedge its exposure to changes in foreign currency exchange rates on its foreign portfolio holdings, to settle foreign currency transactions or as a part of an investment strat-egy.When executing forward contracts, the fund is obligated to buy or sell a foreign currency at a specified rate on a certain date in the future. With respect to sales of forward contracts, the fund would incur a loss if the value of the contract increases between the date the forward contract is opened and the date the forward contract is closed. The fund realizes a gain if the value of the contract decreases between those dates.With respect to purchases of forward contracts, the fund would incur a loss if the value of the contract decreases between the date the forward contract is opened and the date the forward contract is closed. The fund realizes a gain if the value of the contract increases between those dates.The fund is also exposed to credit risk associated with counterparty nonperformance on these forward contracts, which
The Fund 35
| NOTES TO FINANCIAL STATEMENTS (continued) |
is typically limited to the unrealized gain on each open contract.The following summarizes open forward contracts at August 31, 2009:
| | | | | | | | | Unrealized |
| | | Foreign | | | | | | Appreciation |
| Forward Foreign Currency | | Currency | | | | | | (Depreciation) |
| Exchange Contracts | | Amounts | | Cost ($) | | Value ($) | | at 8/31/2009 (S) |
| |
| |
| |
| |
|
| Purchases: | | | | | | | | |
| Australian Dollar, | | | | | | | | |
| expiring 9/1/2009 | | 146,914 | | 124,392 | | 124,172 | | (220) |
| Japanese Yen, | | | | | | | | |
| expiring 9/1/2009 | | 38,598,946 | | 412,030 | | 414,820 | | 2,790 |
| Japanese Yen, | | | | | | | | |
| expiring 9/2/2009 | | 24,211,428 | | 260,366 | | 260,198 | | (168) |
| Sales: | | | | Proceeds ($) | | | | |
| British Pound, | | | | | | | | |
| expiring 9/2/2009 | | 435 | | 706 | | 708 | | (2) |
| Euro, expiring 9/1/2009 | | 55,554 | | 79,876 | | 79,643 | | 233 |
| Euro, expiring 9/2/2009 | | 352,047 | | 502,969 | | 504,698 | | (1,729) |
| Swiss Franc, | | | | | | | | |
| expiring 9/2/2009 | | 219,470 | | 206,540 | | 207,262 | | (722) |
| Gross Unrealized Appreciation | | | | | | 3,023 |
| Gross Unrealized Depreciation | | | | | | (2,841) |
At August 31, 2009, the cost of investments for federal income tax purposes was $248,398,227; accordingly, accumulated net unrealized depreciation on investments was $25,362,992, consisting of $16,478,866 gross unrealized appreciation and $41,841,858 gross unrealized depreciation.
NOTE 5 Subsequent Events Evaluation:
Dreyfus has evaluated the need for disclosures and/or adjustments resulting from subsequent events through October 26, 2009, the date the financial statements were issued. This evaluation did not result in any subsequent events that necessitated disclosures and/or adjustments.
36
REPORT OF INDEPENDENT REGISTERED
PUBLIC ACCOUNTING FIRM |
| | Shareholders and Board of Directors
Dreyfus International Value Fund |
We have audited the accompanying statement of assets and liabilities, including the statement of investments, of Dreyfus International Value Fund (formerly, Dreyfus Premier InternationalValue Fund) (one of the series comprising Advantage Funds, Inc.) as of August 31, 2009, and the related statement of operations for the year then ended, the statement of changes in net assets for each of the two years in the period then ended, and financial highlights for each of the years indicated therein. These financial statements and financial highlights are the responsibility of the Fund s management. Our responsibility is to express an opinion on these financial statements and financial highlights based on our audits.
We conducted our audits in accordance with the standards of the Public Company Accounting Oversight Board (United States).Those standards require that we plan and perform the audit to obtain reasonable assurance about whether the financial statements and financial highlights are free of material misstatement.We were not engaged to perform an audit of the Fund s internal control over financial reporting. Our audits included consideration of internal control over financial reporting as a basis for designing audit procedures that are appropriate in the circumstances, but not for the purpose of expressing an opinion on the effectiveness of the Fund s internal control over financial reporting. Accordingly, we express no such opinion. An audit also includes examining, on a test basis, evidence supporting the amounts and disclosures in the financial statements and financial highlights, assessing the accounting principles used and significant estimates made by management, and evaluating the overall financial statement presentation. Our procedures included confirmation of securities owned as of August 31, 2009 by correspondence with the custodian and others. We believe that our audits provide a reasonable basis for our opinion.
In our opinion, the financial statements and financial highlights referred to above present fairly, in all material respects, the financial position of Dreyfus International Value Fund at August 31, 2009, the results of its operations for the year then ended, the changes in its net assets for each of the two years in the period then ended, and the financial highlights for each of the indicated years, in conformity with U.S. generally accepted accounting principles.

New York, New York
October 26, 2009 |
The Fund 37
IMPORTANT TAX INFORMATION (Unaudited)
In accordance with federal tax law, the fund elects to provide each shareholder with their portion of the fund s foreign taxes paid and the income sourced from foreign countries. Accordingly, the Fund hereby makes the following designations regarding its fiscal year ended August 31, 2009:
Where required by federal tax law rules, shareholders will receive notification of their proportionate share of foreign taxes paid and foreign sourced income for the 2009 calendar year with Form 1099-DIV which will be mailed in early 2010.Also certain dividends paid by the Fund may be subject to a maximum tax rate of 15%, as provided for by the Jobs and Growth Tax Relief Reconciliation Act of 2003. Of the distributions paid during the fiscal year, $7,142 represents the maximum amount that may be considered qualified dividend income.
38
INFORMATION ABOUT THE REVIEW AND APPROVAL
OF THE FUND S MANAGEMENT AGREEMENT (Unaudited) |
At a meeting of the fund s Board held on March 3, 2009, the Board unanimously approved the continuation of the fund s Management Agreement with Dreyfus for a one-year term ending March 30, 2010. The Board members, none of whom are interested persons (as defined in the Investment Company Act of 1940, as amended) of the fund were assisted in their review by independent legal counsel and met with counsel in executive session separate from representatives of Dreyfus. In approving the continuance of the Management Agreement, the Board considered all factors that they believed to be relevant, including, among other things, the factors discussed below.
Analysis of Nature, Extent and Quality of Services Provided to the Fund. The Board members received a presentation from representatives of Dreyfus regarding services provided to the fund and other funds in the Dreyfus fund complex, and discussed the nature, extent and quality of the services provided to the fund pursuant to its Management Agreement. Dreyfus representatives reviewed the fund s distribution of accounts and the relationships Dreyfus has with various intermediaries and the different needs of each. Dreyfus representatives noted the various distribution channels for the fund as well as the diverse methods of distribution among other funds in the Dreyfus fund complex, and Dreyfus corresponding need for broad, deep, and diverse resources to be able to provide ongoing shareholder services to each distribution channel, including those of the fund. Dreyfus also provided the number of accounts investing in the fund, as well as the fund s asset size.
The Board members also considered Dreyfus research and portfolio management capabilities and Dreyfus oversight of day-to-day fund operations, including fund accounting and administration and assistance in meeting legal and regulatory requirements. The Board members also considered Dreyfus extensive administrative, accounting and compliance infrastructure.The Board also considered Dreyfus brokerage policies and practices, the standards applied in seeking best execution and Dreyfus policies and practices regarding soft dollars.
The Fund 39
INFORMATION ABOUT THE REVIEW AND APPROVAL OF
THE FUND S MANAGEMENT AGREEMENT (Unaudited) (continued)
Comparative Analysis of the Fund s Performance and Management Fee and Expense Ratio. The Board members reviewed the fund s performance and comparisons to a group of retail front-end load international multi-cap value funds that are benchmarked against the Morgan Stanley Capital International Europe,Australasia, Far East Index ( MSCI EAFE Index ) (the Performance Group ) and to a larger universe of funds consisting of all retail and institutional international multi-cap value funds (the Performance Universe ) selected and provided by Lipper, Inc., an independent provider of investment company data.The Board was provided with a description of the methodology Lipper used to select the Performance Group and Performance Universe, as well as the Expense Group and Expense Universe (discussed below). The Board members discussed the results of the comparisons and noted the fund s average annual total return ranked in the second quartile of the Performance Group and the first quartile of the Performance Universe for the one-year period ended December 31, 2008 and generally ranked in the second quartile of the Performance Group and Performance Universe for other periods ended December 31, 2008. Dreyfus also provided a comparison of the fund s calendar year total returns to the returns of the fund s benchmark index.
The Board members also discussed the fund s contractual and actual management fees and expense ratio and reviewed the range of management fees and expense ratios as compared to a comparable group of funds (the Expense Group ) and a broader group of funds (the Expense Universe ), each selected and provided by Lipper.The fund s contractual management fee was equal to the Expense Group median. The fund s actual management fee and expense ratio were slightly higher than the Expense Group and Expense Universe medians.
Representatives of Dreyfus reviewed with the Board members the fees paid to Dreyfus or its affiliates by mutual funds and/or separate accounts managed by Dreyfus with similar investment objectives, policies and strategies as the fund (the Similar Accounts ), and explained the nature of the Similar Accounts and the differences, from Dreyfus perspective, as applicable, in providing services to the Similar Accounts
40
as compared to the fund. Dreyfus representatives also reviewed the costs associated with distribution through intermediaries. The Board analyzed differences in fees paid to Dreyfus and discussed the relationship of the advisory fees paid in light of the services provided. The Board members considered the relevance of the fee information provided for the Similar Accounts to evaluate the appropriateness and reasonableness of the fund s management fees. The Board acknowledged that differences in fees paid by the Similar Accounts seemed to be consistent with the services provided.
Analysis of Profitability and Economies of Scale. Dreyfus representatives reviewed the dollar amount of expenses allocated and profit received by Dreyfus and the method used to determine such expenses and profit. The Board previously had been provided with information prepared by an independent consulting firm regarding Dreyfus approach to allocating costs to, and determining the profitability of, individual funds and the entire Dreyfus mutual fund complex.The Board also was informed that the methodology had also been reviewed by an independent registered public accounting firm which, like the consultant, found the methodology to be reasonable. The consulting firm also analyzed where any economies of scale might emerge in connection with the management of the fund.The Board members evaluated the profitability analysis in light of the relevant circumstances for the fund and the extent to which economies of scale would be realized if the fund grows and whether fee levels reflect these economies of scale for the benefit of fund investors.The Board members also considered potential benefits to Dreyfus from acting as investment adviser and noted the soft dollar arrangements with respect to trading the fund s investments.
It was noted that the Board members should consider Dreyfus profitability with respect to the fund as part of their evaluation of whether the fees under the Management Agreement bear a reasonable relationship to the mix of services provided by Dreyfus, including the nature, extent and quality of such services, and that a discussion of economies of scale is predicated on a fund having achieved a substantial size with
The Fund 41
INFORMATION ABOUT THE REVIEW AND APPROVAL OF
THE FUND S MANAGEMENT AGREEMENT (Unaudited) (continued) |
increasing assets and that, if a fund s assets had been static or decreasing, the possibility that Dreyfus may have realized any economies of scale would be less. It also was noted that the profitability percentage for managing the fund was within the range determined by appropriate court cases to be reasonable given the services rendered and generally superior service levels provided.
At the conclusion of these discussions, the Board agreed that it had been furnished with sufficient information to make an informed business decision with respect to continuation of the fund s Management Agreement. Based on the discussions and considerations as described above, the Board made the following conclusions and determinations.
- The Board concluded that the nature, extent and quality of the ser- vices provided by Dreyfus are adequate and appropriate.
- The Board was generally satisfied with the fund s relative performance.
- The Board concluded that the fee paid by the fund to Dreyfus was reasonable in light of the considerations described above.
- The Board determined that the economies of scale which may accrue to Dreyfus and its affiliates in connection with the management of the fund had been adequately considered by Dreyfus in connection with the management fee rate charged to the fund and that, to the extent in the future it were determined that material economies of scale had not been shared with the fund, the Board would seek to have those economies of scale shared with the fund.
The Board members considered these conclusions and determinations, along with information received on a routine and regular basis throughout the year, and, without any one factor being dispositive, the Board determined that continuation of the fund s Management Agreement was in the best interests of the fund and its shareholders.
42
BOARD MEMBERS INFORMATION (Unaudited)

The Fund 43
BOARD MEMBERS INFORMATION (Unaudited) (continued)

44
OFFICERS OF THE FUND (Unaudited)

46

The Fund 47
NOTES
For More Information
Telephone Call your financial representative or 1-800-554-4611
Mail The Dreyfus Family of Funds, 144 Glenn Curtiss Boulevard, Uniondale, NY 11556-0144
The fund files its complete schedule of portfolio holdings with the Securities and Exchange Commission ( SEC ) for the first and third quarters of each fiscal year on Form N-Q. The fund s Forms N-Q are available on the SEC s website at http://www.sec.gov and may be reviewed and copied at the SEC s Public Reference Room in Washington, DC. Information on the operation of the Public Reference Room may be obtained by calling 1-800-SEC-0330.
A description of the policies and procedures that the fund uses to determine how to vote proxies relating to portfolio securities, and information regarding how the fund voted these proxies for the most recent 12-month period ended June 30 is available at http://www.dreyfus.com and on the SEC s website at http://www.sec.gov. The description of the policies and procedures is also available without charge, upon request, by calling 1-800-645-6561.

Save time. Save paper. View your next shareholder report online as soon as it’s available. Log into www.dreyfus.com and sign up for Dreyfus eCommunications. It’s simple and only takes a few minutes.
The views expressed in this report reflect those of the portfolio manager only through the end of the period covered and do not necessarily represent the views of Dreyfus or any other person in the Dreyfus organization. Any such views are subject to change at any time based upon market or other conditions and Dreyfus disclaims any responsibility to update such views.These views may not be relied on as investment advice and, because investment decisions for a Dreyfus fund are based on numerous factors, may not be relied on as an indication of trading intent on behalf of any Dreyfus fund.
Not FDIC-Insured • Not Bank-Guaranteed • May Lose Value
| | Contents |
| |
| | THE FUND |
| |
| 2 | A Letter from the Chairman and CEO |
| |
| 3 | Discussion of Fund Performance |
| |
| 6 | Fund Performance |
| |
| 8 | Understanding Your Fund’s Expenses |
| |
| 8 | Comparing Your Fund’s Expenses With Those of Other Funds |
| |
| 9 | Statement of Investments |
| |
| 15 | Statement of Assets and Liabilities |
| |
| 16 | Statement of Operations |
| |
| 17 | Statement of Changes in Net Assets |
| |
| 19 | Financial Highlights |
| |
| 22 | Notes to Financial Statements |
| |
| 31 | Report of Independent Registered Public Accounting Firm |
| |
| 32 | Important Tax Information |
| |
| 33 | Information About the Review and Approval of the Fund’s Management Agreement |
| |
| 37 | Board Members Information |
| |
| 39 | Officers of the Fund |
| |
| | FOR MORE INFORMATION |
| |
| | Back Cover |
| |

A LETTER FROM THE CHAIRMAN AND CEO
Dear Shareholder:
We are pleased to present this annual report for Dreyfus Midcap Value Fund, covering the 12-month period from September 1, 2008, through August 31, 2009.
At long last, the current recession cycle appears to be winding down. After generally slumping since December 2007, we expect U.S. economic growth to pick up during the third quarter of 2009. Highly stimulative monetary and fiscal policies domestically and throughout the world, combined with the low cost of debt and equity capital compared to historical norms, already have sparked a rebound in industrial production as manufacturers replenish their depleted inventories. However, we continue to anticipate a slower-than-average recovery, with the unemployment rate likely to remain elevated over the next several quarters.
The U.S. stock market anticipated the economic upturn with a sustained market rally that began in early March 2009. Although the rebound initially was concentrated primarily among lower-quality stocks that had been severely punished in the downturn, it later broadened to include virtually all economic sectors and capitalization ranges. While we are encouraged by the market’s recent strength, we remain concerned that improving investor sentiment may have exceeded the revival of business fundamentals. Accordingly, we continue to believe that careful selectivity and risk management will be keys to success in the financial markets over the foreseeable future.As always, we urge you to speak with your financial adviser about the potential opportunities and obstacles in today’s investment environment.
For information about how the fund performed during the reporting period, as well as market perspectives, we have provided a Discussion of Fund Performance given by the fund’s Portfolio Managers.
Thank you for your continued confidence and support.

Jonathan R. Baum
Chairman & Chief Executive Officer
The Dreyfus Corporation
September 15, 2009 |
2

DISCUSSION OF FUND PERFORMANCE
For the reporting period of September 1, 2008, through August 31, 2009, as provided by David A. Daglio and Mark P. Dishop, Principal Portfolio Managers
Fund and Market Performance Overview
For the 12-month period ended August 31, 2009, Dreyfus Midcap Value Fund’s Class A shares produced a total return of –7.22%, Class C shares returned –7.98% and Class I shares returned –7.05%.1 In comparison, the fund’s benchmark, the Russell Midcap Value Index (the “Index”), produced a –20.00% total return for the same period.2
Despite a severe recession and banking crisis over much of the reporting period, stocks rallied in the spring and summer of 2009, offsetting a substantial portion of earlier losses.The fund fared relatively well in this turbulent environment, as our disciplined investment strategy produced individual stock selections that declined less than average in the downturn and outperformed market averages during the rally.
The Fund’s Investment Approach
The fund’s goal is to surpass the performance of the Index by investing in midcap companies, which we consider as having market capitalizations between $1 billion and $25 billion at the time of purchase.We identify potential investments through extensive quantitative and fundamental research.When selecting stocks, the fund will focus on individual stock selection, emphasizing three key factors: value, sound business fundamentals and business momentum. We typically sell a stock when we no longer consider it attractively valued, when it appears less likely to benefit from the current market and economic environment, when it shows deteriorating fundamentals or declining momentum or when its performance falls short of our expectations.
Equity Markets Plunged, Then Rebounded Sharply
The U.S. stock market endured a year of extreme volatility. Just weeks after the start of the reporting period, the failures of several major financial institutions nearly led to the collapse of the worldwide banking system. Meanwhile, rising unemployment, plunging housing prices and depressed consumer confidence exacerbated the longest and most
The Fund 3
| DISCUSSION OF FUND PERFORMANCE (continued) |
severe economic downturn since the 1930s.These influences fueled a bear market that drove stock market averages to multi-year lows.The decline was broad-based, affecting industry groups and individual stocks seemingly regardless of their underlying business fundamentals.
However, market sentiment suddenly began to improve in early March, as aggressive measures adopted by government and monetary authorities appeared to have averted a collapse of the banking system. Additional evidence of economic stabilization later appeared, sparking a sustained market rally that lasted through the reporting period’s end.
Disciplined Selection Process Fueled Fund Performance
Although the fund was affected by heightened market volatility, our disciplined security selection process was particularly well suited for the challenging investment environment. Our focus on mid-cycle earnings prospects allowed us to look beyond the difficulties of the next few quarters and identify companies well positioned for the return to more normal business conditions. By stressing our calculation of a company’s intrinsic value, we were able to identify and invest in some of the most compelling values in the marketplace and avoid the most overvalued. At the same time, our emphasis on understanding and accounting for hidden liabilities allowed the fund to avoid a number of financially weak value traps.
We have long maintained a cautious posture with regard to the financial sector, and that defensive stance paid off during the banking crisis. The fund particularly benefited from underweighted exposure to real estate investment trusts, insurance companies and commercial banks. In addition, positions in the sector, including Annaly Capital Management, a mortgage REIT, Jefferies Group, a midsize investment bank, and Capital One, a leading credit card company, provided excellent relative returns.
In the consumer discretionary sector, investors may have overreacted to concerns regarding deteriorating consumer spending trends. The fund received robust contributions to its relative performance from retailer Advance Auto Parts, which benefited as drivers attempted to extend the useful lives of their vehicles.We sold the stock when it reached our price target, reinvesting the proceeds in automotive safety equipment maker Autoliv, which appears poised for gains when car sales rebound.
4
An underweighted position in the industrials sector helped the fund avoid steep recession-related declines among manufacturers. Still, we found an attractive opportunity in engineering and construction firm McDermott International, where a substantial order backlog supported financial results during the downturn.
The greatest drag on the fund’s relative performance over the reporting period came from the health care sector. Drug developer Elan Corp. suffered when a promising treatment for Alzheimer’s disease produced poor results in clinical trials, prompting us to sell the stock. Prosthetics maker Zimmer Holdings also disappointed as patients deferred elective surgeries in the slumping economy.We anticipate the pent-up demand for knee and hip replacements will be released as uncertainty over health care reform dissipates.
Positioned for an Economic Recovery
Although economic weakness has persisted, a recovery appears to be in the making due in part to highly stimulative monetary and fiscal poli-cies.Therefore, we are optimistic regarding the long-term prospects for the U.S. economy and corporate earnings.We have found a number of companies meeting our investment criteria in the consumer discretionary, technology and industrial sectors.The utilities sector was an area of limited investment exposure but we believe valuations have become quite attractive and increased emphasis appears warranted.
September 15, 2009
| 1 | | Total return includes reinvestment of dividends and any capital gains paid. It includes the |
| | | maximum initial sales charges in the case of Class A shares, and the applicable contingent deferred |
| | | sales charges imposed on redemptions in the case of Class C shares. Past performance is no |
| | | guarantee of future results. Share price and investment return fluctuate such that upon redemption, |
| | | fund shares may be worth more or less than their original cost. |
| 2 | | SOURCE: LIPPER INC. — Reflects reinvestment of dividends and, where applicable, capital |
| | | gain distributions.The Russell Midcap Value Index is a widely accepted, unmanaged index of |
| | | medium-cap stock market performance and measures the performance of those Russell Midcap |
| | | companies with lower price-to-book ratios and lower forecasted growth values. |
The Fund 5
FUND PERFORMANCE
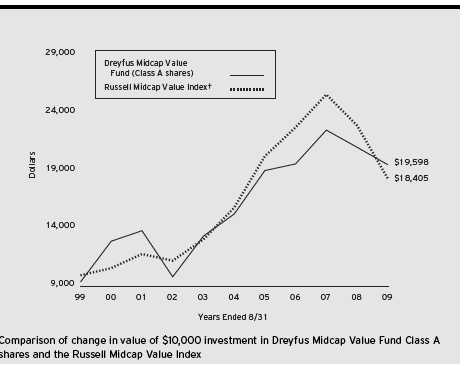
† Source: Lipper Inc.
Past performance is not predictive of future performance.
The above graph compares a $10,000 investment made in Class A shares of Dreyfus Midcap Value Fund on 8/31/99 to a $10,000 investment made in the Russell Midcap Value Index (the “Index”) on that date. All dividends and capital gain distributions are reinvested. Performance for Class C and Class I shares will vary from the performance of Class A shares shown above due to differences in charges and expenses.
The fund’s performance shown in the line graph takes into account the maximum initial sales charge on Class A shares and all other applicable fees and expenses.The Index is a widely accepted, unmanaged index of medium-cap stock market performance and measures the performance of those Russell Midcap companies with lower price-to-book ratios and lower forecasted growth values. Unlike a mutual fund, the Index is not subject to charges, fees and other expenses. Investors cannot invest directly in any index. Further information relating to fund performance, including expense reimbursements, if applicable, is contained in the Financial Highlights section of the prospectus and elsewhere in this report.
6
| Average Annual Total Returns as of 8/31/09 | | | | | | |
| |
| Inception |
| | | Date | | 1 Year | | 5 Years | | 10 Years |
| |
| |
| |
| |
|
| Class A shares | | | | | | | | |
| with maximum sales charge (5.75%) | | 9/29/05 | | –12.55% | | 3.82% | | 6.96% |
| without sales charge | | 9/29/05 | | –7.22% | | 5.05% | | 7.59% |
| Class C shares | | | | | | | | |
| with applicable redemption charge † | | 5/30/08 | | –8.90% | | 4.84%†† | | 7.48%†† |
| without redemption | | 5/30/08 | | –7.98% | | 4.84%†† | | 7.48%†† |
| Class I shares | | 5/30/08 | | –7.05% | | 5.09%†† | | 7.61%†† |
| Past performance is not predictive of future performance.The fund’s performance shown in the graph and table does not |
| reflect the deduction of taxes that a shareholder would pay on fund distributions or the redemption of fund shares. |
| † | | The maximum contingent deferred sales charge for Class C shares is 1% for shares redeemed within one year of the |
| | | date of purchase. |
| †† | | The total return performance figures presented for Class C and Class I shares of the fund reflect the performance of |
| | | the fund’s Class A shares for periods prior to 5/30/08 (the inception date for Class C and Class I shares), adjusted |
| | | to reflect the applicable sales load for that class. |
The Fund 7
UNDERSTANDING YOUR FUND’S EXPENSES (Unaudited)
As a mutual fund investor, you pay ongoing expenses, such as management fees and other expenses. Using the information below, you can estimate how these expenses affect your investment and compare them with the expenses of other funds.You also may pay one-time transaction expenses, including sales charges (loads) and redemption fees, which are not shown in this section and would have resulted in higher total expenses. For more information, see your fund’s prospectus or talk to your financial adviser.
Review your fund’s expenses
The table below shows the expenses you would have paid on a $1,000 investment in Dreyfus Midcap Value Fund from March 1, 2009 to August 31, 2009. It also shows how much a $1,000 investment would be worth at the close of the period, assuming actual returns and expenses.
| Expenses and Value of a $1,000 Investment | | | | |
| assuming actual returns for the six months ended August 31, 2009 | | |
| | | Class A | | Class C | | Class I |
| |
| |
| |
|
| Expenses paid per $1,000† | | $ 7.89 | | $ 12.31 | | $ 5.51 |
| Ending value (after expenses) | | $1,630.30 | | $1,624.70 | | $1,632.40 |
| COMPARING YOUR FUND’S EXPENSES |
| WITH THOSE OF OTHER FUNDS (Unaudited) |
Using the SEC’s method to compare expenses
The Securities and Exchange Commission (SEC) has established guidelines to help investors assess fund expenses. Per these guidelines, the table below shows your fund’s expenses based on a $1,000 investment, assuming a hypothetical 5% annualized return. You can use this information to compare the ongoing expenses (but not transaction expenses or total cost) of investing in the fund with those of other funds.All mutual fund shareholder reports will provide this information to help you make this comparison. Please note that you cannot use this information to estimate your actual ending account balance and expenses paid during the period.
| Expenses and Value of a $1,000 Investment | | | | |
| assuming a hypothetical 5% annualized return for the six months ended August 31, 2009 |
| | | Class A | | Class C | | Class I |
| |
| |
| |
|
| Expenses paid per $1,000† | | $ 6.06 | | $ 9.45 | | $ 4.23 |
| Ending value (after expenses) | | $1,019.21 | | $1,015.83 | | $1,021.02 |
† Expenses are equal to the fund's annualized expense ratio of 1.19% for Class A, 1.86% for Class C and .83% for Class I; multiplied by the average account value over the period, multiplied by 184/365 (to reflect the one-half year period).
8
| STATEMENT OF INVESTMENTS |
| August 31, 2009 |
| Common Stocks—98.8% | | Shares | | Value ($) |
| |
| |
|
| Consumer Discretionary—23.3% | | | | |
| Abercrombie & Fitch, Cl. A | | 251,550 a | | 8,122,550 |
| American Eagle Outfitters | | 598,670 | | 8,082,045 |
| Apollo Group, Cl. A | | 139,270 b | | 9,027,481 |
| Autoliv | | 862,290 a | | 27,653,640 |
| Brinker International | | 418,400 | | 6,091,904 |
| CBS, Cl. B | | 782,960 | | 8,103,636 |
| Central European Media Enterprises, Cl. A | | 13,220 a,b | | 379,811 |
| Coach | | 208,620 | | 5,901,860 |
| Darden Restaurants | | 270,880 a | | 8,920,078 |
| Federal Mogul | | 37,260 b | | 468,731 |
| Fortune Brands | | 17,840 | | 710,210 |
| Gannett | | 43,710 a | | 377,654 |
| Goodyear Tire & Rubber | | 462,600 b | | 7,628,274 |
| Harman International Industries | | 414,820 a | | 12,440,452 |
| Interpublic Group of Cos. | | 1,966,660 a,b | | 12,370,291 |
| ITT Educational Services | | 141,220 a,b | | 14,826,688 |
| Limited Brands | | 604,120 a | | 9,013,470 |
| Magna International, Cl. A | | 24,280 | | 1,109,839 |
| MGM MIRAGE | | 1,050,750 b | | 8,899,852 |
| Mohawk Industries | | 506,372 a,b | | 25,379,365 |
| Newell Rubbermaid | | 734,860 | | 10,229,251 |
| News, Cl. A | | 2,138,020 | | 22,919,574 |
| Nordstrom | | 171,670 a | | 4,813,627 |
| Snap-On | | 12,630 | | 471,352 |
| Stanley Works | | 8,530 a | | 349,133 |
| Staples | | 155,030 a | | 3,350,198 |
| Starwood Hotels & Resorts Worldwide | | 16,190 a | | 482,138 |
| Whirlpool | | 3,700 a | | 237,577 |
| Williams-Sonoma | | 291,000 a | | 5,566,830 |
| | | | | 223,927,511 |
| Consumer Staples—5.0% | | | | |
| Cadbury, ADR | | 139,896 | | 5,286,670 |
| Campbell Soup | | 34,320 | | 1,076,275 |
| Dr. Pepper Snapple Group | | 335,194 b | | 8,862,529 |
| Estee Lauder, Cl. A | | 411,070 a | | 14,736,860 |
The Fund 9
| STATEMENT OF INVESTMENTS (continued) |
| Common Stocks (continued) | | Shares | | Value ($) |
| |
| |
|
| Consumer Staples (continued) | | | | |
| Hershey | | 17,640 | | 692,017 |
| Kroger | | 378,730 | | 8,176,781 |
| Mead Johnson Nutrition, Cl. A | | 170,970 a | | 6,780,670 |
| Reynolds American | | 4,590 a | | 209,809 |
| Safeway | | 27,750 | | 528,638 |
| Sara Lee | | 73,930 | | 716,382 |
| Smithfield Foods | | 58,430 a,b | | 716,936 |
| SUPERVALU | | 47,710 | | 684,638 |
| | | | | 48,468,205 |
| Energy—4.5% | | | | |
| Arch Coal | | 68,010 a | | 1,177,933 |
| CNX Gas | | 4,000 a,b | | 113,160 |
| Continental Resources | | 212,088 a,b | | 7,486,706 |
| FMC Technologies | | 132,790 a,b | | 6,334,083 |
| Nabors Industries | | 26,780 b | | 473,470 |
| Noble | | 121,860 | | 4,268,756 |
| Patterson-UTI Energy | | 24,970 a | | 331,851 |
| Peabody Energy | | 10,000 | | 326,800 |
| Range Resources | | 198,790 a | | 9,615,472 |
| Southwestern Energy | | 341,320 b | | 12,581,055 |
| Tidewater | | 5,350 | | 230,960 |
| Ultra Petroleum | | 7,550 b | | 350,547 |
| | | | | 43,290,793 |
| Exchange Traded Funds—.7% | | | | |
| Midcap SPDR Trust Series 1 | | 60,160 a | | 7,154,829 |
| Financial—11.3% | | | | |
| ACE | | 169,280 | | 8,833,030 |
| Annaly Capital Management | | 250,790 | | 4,348,699 |
| Brandywine Realty Trust | | 36,870 | | 391,191 |
| CB Richard Ellis Group, Cl. A | | 2,313,612 a,b | | 27,393,166 |
| CNA Financial | | 54,220 a,b | | 1,326,763 |
| Comerica | | 66,520 | | 1,774,088 |
| Discover Financial Services | | 37,240 | | 512,050 |
10
| Common Stocks (continued) | | Shares | | Value ($) |
| |
| |
|
| Financial (continued) | | | | |
| Everest Re Group | | 10,530 | | 887,784 |
| Fifth Third Bancorp | | 33,990 | | 371,851 |
| First American | | 32,310 | | 1,018,411 |
| First Horizon National | | 679,575 a,b | | 9,092,714 |
| Hanover Insurance Group | | 234,900 | | 9,605,061 |
| Hartford Financial Services Group | | 48,230 | | 1,144,016 |
| HRPT Properties Trust | | 254,040 a | | 1,646,179 |
| Hudson City Bancorp | | 307,170 | | 4,030,070 |
| KeyCorp | | 71,120 | | 473,659 |
| Lincoln National | | 20,120 | | 507,829 |
| Mack-Cali Realty | | 42,200 a | | 1,351,666 |
| Marsh & McLennan Cos. | | 9,170 | | 215,862 |
| Moody’s | | 8,920 a | | 242,981 |
| Och-Ziff Capital Management Group, Cl. A | | 578,540 | | 5,773,829 |
| Parker Hannifin | | 14,290 | | 695,351 |
| PartnerRe | | 36,180 a | | 2,674,064 |
| Raymond James Financial | | 41,900 a | | 953,225 |
| Regions Financial | | 1,001,260 a | | 5,867,384 |
| Reinsurance Group of America | | 18,850 | | 811,493 |
| RenaissanceRe Holdings | | 115,930 a | | 6,312,389 |
| SunTrust Banks | | 413,720 | | 9,668,636 |
| Torchmark | | 11,510 | | 490,441 |
| | | | | 108,413,882 |
| Health Care—10.7% | | | | |
| Amedisys | | 2,995 a,b | | 133,397 |
| Forest Laboratories | | 169,370 b | | 4,957,460 |
| Genzyme | | 267,720 b | | 14,914,681 |
| Hospira | | 484,370 b | | 18,934,023 |
| King Pharmaceuticals | | 1,296,020 a,b | | 13,452,688 |
| Perrigo | | 361,290 a | | 10,665,281 |
| St. Jude Medical | | 289,410 b | | 11,153,861 |
| Zimmer Holdings | | 591,160 b | | 27,991,426 |
| | | | | 102,202,817 |
The Fund 11
| STATEMENT OF INVESTMENTS (continued) |
| Common Stocks (continued) | | Shares | | Value ($) |
| |
| |
|
| Industrial—12.5% | | | | |
| Actuant, Cl. A | | 1,030,320 | | 14,558,422 |
| Dun & Bradstreet | | 93,840 | | 6,854,074 |
| FedEx | | 98,370 | | 6,759,003 |
| Gardner Denver | | 7,540 b | | 244,824 |
| Heartland Express | | 545,590 a | | 7,725,554 |
| Kennametal | | 952,140 | | 20,994,687 |
| Lennox International | | 166,780 a | | 5,984,066 |
| Masco | | 1,762,930 a | | 25,527,226 |
| McDermott International | | 545,250 b | | 12,955,140 |
| MSC Industrial Direct, Cl. A | | 21,470 a | | 848,280 |
| Robert Half International | | 307,310 a | | 8,079,180 |
| Rockwell Automation | | 9,110 | | 381,254 |
| Roper Industries | | 12,900 | | 611,202 |
| Simpson Manufacturing | | 311,730 a | | 8,011,461 |
| | | | | 119,534,373 |
| Information Technology—16.2% | | | | |
| Applied Materials | | 17,430 | | 229,727 |
| Broadcom, Cl. A | | 197,280 a,b | | 5,612,616 |
| Brocade Communications Systems | | 1,363,440 b | | 9,857,671 |
| Cadence Design Systems | | 784,770 b | | 4,920,508 |
| Electronic Arts | | 494,470 a,b | | 9,009,243 |
| Lexmark International, Cl. A | | 107,780 a,b | | 2,030,575 |
| MasterCard, Cl. A | | 22,240 a | | 4,506,491 |
| Maxim Integrated Products | | 864,370 a | | 16,232,869 |
| Micros Systems | | 228,550 a,b | | 6,369,689 |
| Motorola | | 2,266,810 a | | 16,275,696 |
| Rovi | | 289,040 a,b | | 8,798,378 |
| Tyco Electronics | | 1,029,560 a | | 23,494,559 |
| Vishay Intertechnology | | 1,448,690 b | | 11,690,928 |
| Western Digital | | 383,020 b | | 13,129,926 |
| Western Union | | 1,103,300 | | 19,903,532 |
12
| Common Stocks (continued) | | Shares | | Value ($) |
| |
| |
|
| Information Technology (continued) | | | | |
| Yahoo! | | 235,190 b | | 3,436,126 |
| | | | | 155,498,534 |
| Materials—6.4% | | | | |
| Air Products & Chemicals | | 65,870 | | 4,942,226 |
| Albemarle | | 287,160 | | 9,255,167 |
| Cabot | | 278,340 | | 5,508,349 |
| Celanese, Ser. A | | 161,440 | | 4,111,877 |
| International Paper | | 1,184,099 | | 27,175,072 |
| Owens-Illinois | | 10,230 b | | 347,206 |
| Sealed Air | | 57,610 | | 1,089,405 |
| Timken | | 391,510 | | 8,264,776 |
| United States Steel | | 13,230 a | | 579,209 |
| | | | | 61,273,287 |
| Telecommunication Services—2.9% | | | | |
| Leap Wireless International | | 1,016,800 a,b | | 16,767,032 |
| Viacom, Cl. B | | 456,340 b | | 11,426,754 |
| | | | | 28,193,786 |
| Utilities—5.3% | | | | |
| Consolidated Edison | | 35,970 | | 1,445,634 |
| Dominion Resources | | 127,070 | | 4,203,476 |
| Great Plains Energy | | 1,565,003 | | 27,418,853 |
| Portland General Electric | | 915,154 | | 17,863,806 |
| | | | | 50,931,769 |
| Total Common Stocks | | | | |
| (cost $809,349,495) | | | | 948,889,786 |
| |
| Other Investment—1.4% | | | | |
| |
| |
|
| Registered Investment Company; | | | | |
| Dreyfus Institutional Preferred | | | | |
| Plus Money Market Fund | | | | |
| (cost $13,517,000) | | 13,517,000 c | | 13,517,000 |
The Fund 13
| | STATEMENT OF INVESTMENTS (continued) |
| Investment of Cash Collateral | | | | |
| for Securities Loaned—17.5% | | Shares | | Value ($) |
| |
| |
|
| Registered Investment Company; | | | | |
| Dreyfus Institutional Cash | | | | |
| Advantage Fund | | | | |
| (cost $167,866,849) | | 167,866,849 c | | 167,866,849 |
| |
| Total Investments (cost $990,733,344) | | 117.7% | | 1,130,273,635 |
| Liabilities, Less Cash and Receivables | | (17.7%) | | (170,384,221) |
| Net Assets | | 100.0% | | 959,889,414 |
| ADR—American Depository Receipts |
| a All or a portion of these securities are on loan. At August 31, 2009, the total market value of the fund’s securities on |
| loan is $160,094,982 and the total market value of the collateral held by the fund is $167,866,849. |
| b Non-income producing security. |
| c Investment in affiliated money market mutual fund. |
| Portfolio Summary (Unaudited)† | | | | |
| |
| | | Value (%) | | | | Value (%) |
| |
| |
| |
|
| Consumer Discretionary | | 23.3 | | Utilities | | 5.3 |
| Money Market Investments | | 18.9 | | Consumer Staples | | 5.0 |
| Information Technology | | 16.2 | | Energy | | 4.5 |
| Industrial | | 12.5 | | Telecommunication Services | | 2.9 |
| Financial | | 11.3 | | Exchange Traded Funds | | 0.7 |
| Health Care | | 10.7 | | | | |
| Materials | | 6.4 | | | | 117.7 |
| |
| † Based on net assets. | | | | | | |
| See notes to financial statements. | | | | | | |
14
| STATEMENT OF ASSETS AND LIABILITIES |
| August 31, 2009 |
| | | | | Cost | | Value |
| |
| |
| |
|
| Assets ($): | | | | | | |
| Investments in securities—See Statement of Investments (including | | | | |
| securities on loan, valued at $160,094,982 )—Note 1(b): | | | | |
| Unaffiliated issuers | | | | 809,349,495 | | 948,889,786 |
| Affiliated issuers | | | | 181,383,849 | | 181,383,849 |
| Cash | | | | | | 365,166 |
| Receivable for investment securities sold | | | | | | 18,100,679 |
| Receivable for shares of Common Stock subscribed | | | | 3,319,918 |
| Dividends and interest receivable | | | | | | 1,098,501 |
| Prepaid expenses | | | | | | 83,164 |
| | | | | | | 1,153,241,063 |
| Liabilities ($): | | | | | | |
| Due to The Dreyfus Corporation and affiliates—Note 3(c) | | | | 855,416 |
| Liability for securities on loan—Note 1(b) | | | | | | 167,866,849 |
| Payable for investment securities purchased | | | | | | 22,302,707 |
| Payable for shares of Common Stock redeemed | | | | | | 2,003,143 |
| Accrued expenses | | | | | | 323,534 |
| | | | | | | 193,351,649 |
| Net Assets ($) | | | | | | 959,889,414 |
| Composition of Net Assets ($): | | | | | | |
| Paid-in capital | | | | | | 1,062,623,815 |
| Accumulated undistributed investment income—net | | | | 2,887,063 |
| Accumulated net realized gain (loss) on investments | | | | (245,161,755) |
| Accumulated net unrealized appreciation | | | | | | |
| (depreciation) on investments | | | | | | 139,540,291 |
| Net Assets ($) | | | | | | 959,889,414 |
| |
| |
| |
|
| |
| |
| Net Asset Value Per Share | | | | | | |
| | | Class A | | Class C | | Class I |
| |
| |
| |
|
| Net Assets ($) | | 947,716,324 | | 1,397,867 | | 10,775,223 |
| Shares Outstanding | | 39,437,416 | | 58,942 | | 449,279 |
| Net Asset Value Per Share ($) | | 24.03 | | 23.72 | | 23.98 |
| |
| See notes to financial statements. | | | | | | |
The Fund 15
| STATEMENT OF OPERATIONS |
| Year Ended August 31, 2009 |
| Investment Income ($): | | |
| Income: | | |
| Cash dividends: | | |
| Unaffiliated issuers | | 9,934,772 |
| Affiliated issuers | | 46,142 |
| Income from securities lending | | 374,564 |
| Total Income | | 10,355,478 |
| Expenses: | | |
| Management fee—Note 3(a) | | 4,570,474 |
| Shareholder servicing costs—Note 3(c) | | 2,526,552 |
| Custodian fees—Note 3(c) | | 77,758 |
| Prospectus and shareholders’ reports | | 71,554 |
| Registration fees | | 68,626 |
| Professional fees | | 60,870 |
| Directors’ fees and expenses—Note 3(d) | | 48,252 |
| Loan commitment fees—Note 2 | | 3,050 |
| Interest expense—Note 2 | | 2,049 |
| Distribution fees—Note 3(b) | | 1,833 |
| Miscellaneous | | 30,769 |
| Total Expenses | | 7,461,787 |
| Less—reduction in fees due to earnings credits—Note 1(b) | | (23,698) |
| Net Expenses | | 7,438,089 |
| Investment Income—Net | | 2,917,389 |
| Realized and Unrealized Gain (Loss) on Investments—Note 4 ($): | | |
| Net realized gain (loss) on investments | | (168,989,589) |
| Net unrealized appreciation (depreciation) on investments | | 133,951,065 |
| Net Realized and Unrealized Gain (Loss) on Investments | | (35,038,524) |
| Net (Decrease) in Net Assets Resulting from Operations | | (32,121,135) |
| |
| See notes to financial statements. | | |
16
STATEMENT OF CHANGES IN NET ASSETS
| | | Year Ended August 31, |
| | |
|
| | | 2009a | | 2008b |
| |
| |
|
| Operations ($): | | | | |
| Investment income—net | | 2,917,389 | | 934,723 |
| Net realized gain (loss) on investments | | (168,989,589) | | (53,395,920) |
| Net unrealized appreciation | | | | |
| (depreciation) on investments | | 133,951,065 | | (5,514,426) |
| Net Increase (Decrease) in Net Assets | | | | |
| Resulting from Operations | | (32,121,135) | | (57,975,623) |
| Dividends to Shareholders from ($): | | | | |
| Investment income—net: | | | | |
| Class A Shares | | (916,357) | | (1,496,577) |
| Class C Shares | | (78) | | — |
| Class I Shares | | (34) | | — |
| Class T Shares | | (22) | | — |
| Net realized gain on investments: | | | | |
| Class A Shares | | — | | (163,126,927) |
| Total Dividends | | (916,491) | | (164,623,504) |
| Capital Stock Transactions ($): | | | | |
| Net proceeds from shares sold: | | | | |
| Class A Shares | | 349,657,112 | | 69,363,456 |
| Class C Shares | | 1,241,304 | | 26,336 |
| Class I Shares | | 9,752,702 | | 10,000 |
| Class T Shares | | — | | 10,000 |
| Dividends reinvested: | | | | |
| Class A Shares | | 904,908 | | 162,499,979 |
| Class C Shares | | 50 | | — |
| Cost of shares redeemed: | | | | |
| Class A Shares | | (145,556,481) | | (280,083,785) |
| Class T Shares | | (5,687) | | — |
| Increase (Decrease) in Net Assets | | | | |
| from Capital Stock Transactions | | 215,993,908 | | (48,174,014) |
| Total Increase (Decrease) in Net Assets | | 182,956,282 | | (270,773,141) |
| Net Assets ($): | | | | |
| Beginning of Period | | 776,933,132 | | 1,047,706,273 |
| End of Period | | 959,889,414 | | 776,933,132 |
| Undistributed investment income—net | | 2,887,063 | | 932,387 |
The Fund 17
STATEMENT OF CHANGES IN NET ASSETS (continued)
| | | Year Ended August 31, |
| | |
|
| | | 2009a | | 2008b |
| |
| |
|
| Capital Share Transactions: | | | | |
| Class Ac | | | | |
| Shares sold | | 17,216,252 | | 2,459,015 |
| Shares issued for dividends reinvested | | 54,578 | | 5,663,638 |
| Shares redeemed | | (7,770,541) | | (9,631,032) |
| Net Increase (Decrease) in Shares Outstanding | | 9,500,289 | | (1,508,379) |
| Class C | | | | |
| Shares sold | | 57,939 | | 1,000 |
| Shares issued for dividends reinvested | | 3 | | — |
| Net Increase (Decrease) in Shares Outstanding | | 57,942 | | 1,000 |
| Class I | | | | |
| Shares sold | | 448,924 | | 355 |
| Net Increase (Decrease) in Shares Outstanding | | 448,924 | | 355 |
| Class Tc | | | | |
| Shares sold | | — | | 355 |
| Shares redeemed | | (355) | | — |
| Net Increase (Decrease) in Shares Outstanding | | (355) | | 355 |
| a | | Effective as of the close of business on February 4, 2009, the fund no longer offers Class T shares. |
| b | | The fund commenced offering four classes of shares on May 30, 2008.The existing shares were redesignated Class A |
| | | shares and the fund added Class C, Class I and Class T shares. |
| c | | On the close of business on February 4, 2009, 355 Class T shares representing $5,687 were converted to 353 |
| | | Class A shares. |
| See notes to financial statements. |
18
FINANCIAL HIGHLIGHTS
The following tables describe the performance for each share class for the fiscal periods indicated.All information (except portfolio turnover rate) reflects financial results for a single fund share.Total return shows how much your investment in the fund would have increased (or decreased) during each period, assuming you had reinvested all dividends and distributions.These figures have been derived from the fund’s financial statements.
| | | | | Year Ended August 31, | | |
| | |
| |
| |
|
| Class A Shares | | 2009 | | 2008a | | 2007 | | 2006 | | 2005 |
| |
| |
| |
| |
| |
|
| Per Share Data ($): | | | | | | | | | | |
| Net asset value, beginning of period | | 25.95 | | 33.32 | | 31.62 | | 33.98 | | 27.25 |
| Investment Operations: | | | | | | | | | | |
| Investment income (loss)—netb | | .09 | | .03 | | .12 | | (.05) | | (.13) |
| Net realized and unrealized | | | | | | | | | | |
| gain (loss) on investments | | (1.98) | | (1.68) | | 4.52 | | 1.07 | | 6.86 |
| Total from Investment Operations | | (1.89) | | (1.65) | | 4.64 | | 1.02 | | 6.73 |
| Distributions: | | | | | | | | | | |
| Dividends from | | | | | | | | | | |
| investment income—net | | (.03) | | (.05) | | (.06) | | — | | — |
| Dividends from net realized | | | | | | | | | | |
| gain on investments | | — | | (5.67) | | (2.88) | | (3.38) | | — |
| Total Distributions | | (.03) | | (5.72) | | (2.94) | | (3.38) | | — |
| Net asset value, end of period | | 24.03 | | 25.95 | | 33.32 | | 31.62 | | 33.98 |
| Total Return (%)c | | (7.22) | | (6.59) | | 14.96 | | 2.97 | | 24.70 |
| Ratios/Supplemental Data (%): | | | | | | | | | | |
| Ratio of total expenses | | | | | | | | | | |
| to average net assets | | 1.23 | | 1.20 | | 1.18 | | 1.18 | | 1.16 |
| Ratio of net expenses | | | | | | | | | | |
| to average net assets | | 1.22 | | 1.20d | | 1.18 | | 1.18 | | 1.16 |
| Ratio of net investment income | | | | | | | | | | |
| (loss) to average net assets | | .48 | | .10 | | .35 | | (.15) | | (.42) |
| Portfolio Turnover Rate | | 170.88 | | 144.14 | | 165.55 | | 152.68 | | 128.55 |
| Net Assets, end of period | | | | | | | | | | |
| ($ x 1,000) | | 947,716 | | 776,889 | | 1,047,706 | | 1,130,512 | | 1,413,910 |
| a | | The fund commenced offering four classes of shares on May 30, 2008 and existing shares were redesignated |
| | | Class A shares. |
| b | | Based on average shares outstanding at each month end. |
| c | | Exclusive of sales charge. |
| d | | Expense waivers and/or reimbursements amounted to less than .01%. |
| See notes to financial statements. |
The Fund 19
| | FINANCIAL HIGHLIGHTS (continued) |
| | | Year Ended August 31, |
| | |
|
| Class C Shares | | 2009 | | 2008a |
| |
| |
|
| Per Share Data ($): | | | | |
| Net asset value, beginning of period | | 25.89 | | 28.17 |
| Investment Operations: | | | | |
| Investment (loss)—netb | | (.10) | | (.05) |
| Net realized and unrealized | | | | |
| gain (loss) on investments | | (1.99) | | (2.23) |
| Total from Investment Operations | | (2.09) | | (2.28) |
| Distributions: | | | | |
| Dividends from investment income—net | | (.08) | | — |
| Net asset value, end of period | | 23.72 | | 25.89 |
| Total Return (%)c | | (7.98) | | (8.55)d |
| Ratios/Supplemental Data (%): | | | | |
| Ratio of total expenses to average net assets | | 1.88 | | 2.07e |
| Ratio of net expenses to average net assets | | 1.88f | | 2.06e |
| Ratio of net investment (loss) to average net assets | | (.48) | | (.76)e |
| Portfolio Turnover Rate | | 170.88 | | 144.14 |
| Net Assets, end of period ($ x 1,000) | | 1,398 | | 26 |
| a | | From May 30, 2008 (commencement of initial offering) to August 31, 2008. |
| b | | Based on average shares outstanding at each month end. |
| c | | Exclusive of sales charge. |
| d | | Not annualized. |
| e | | Annualized. |
| f | | Expense waivers and/or reimbursements amounted to less than .01%. |
| See notes to financial statements. |
20
| | | Year Ended August 31, |
| | |
|
| Class I Shares | | 2009 | | 2008a |
| |
| |
|
| Per Share Data ($): | | | | |
| Net asset value, beginning of period | | 25.95 | | 28.17 |
| Investment Operations: | | | | |
| Investment income—netb | | .15 | | .00c |
| Net realized and unrealized | | | | |
| gain (loss) on investments | | (2.02) | | (2.22) |
| Total from Investment Operations | | (1.87) | | (2.22) |
| Distributions: | | | | |
| Dividends from investment income—net | | (.10) | | — |
| Net asset value, end of period | | 23.98 | | 25.95 |
| Total Return (%) | | (7.05) | | (8.37)d |
| Ratios/Supplemental Data (%): | | | | |
| Ratio of total expenses to average net assets | | .84 | | 1.17e |
| Ratio of net expenses to average net assets | | .83 | | 1.16e |
| Ratio of net investment income to average net assets | | .69 | | .06e |
| Portfolio Turnover Rate | | 170.88 | | 144.14 |
| Net Assets, end of period ($ x 1,000) | | 10,775 | | 9 |
| a | | From May 30, 2008 (commencement of initial offering) to August 31, 2008. |
| b | | Based on average shares outstanding at each month end. |
| c | | Amount represents less than $.01 per share. |
| d | | Not annualized. |
| e | | Annualized. |
| See notes to financial statements. |
The Fund 21
NOTES TO FINANCIAL STATEMENTS
NOTE 1—Significant Accounting Policies:
Dreyfus MidcapValue Fund (the “fund”) is a separate diversified series of Advantage Funds, Inc. (the “Company”), which is registered under the Investment Company Act of 1940, as amended (the “Act”), as an open-end management investment company and operates as a series company that offers ten series, including the fund. The fund’s investment objective is to surpass the performance of the Russell Midcap Value Index.The Dreyfus Corporation (the “Manager” or “Dreyfus”), a wholly-owned subsidiary of The Bank of New York Mellon Corporation (“BNY Mellon”), serves as the fund’s investment adviser.
At a meeting of the fund’s Board of Directors held on July 15, 2008, the Board approved, effective December 1, 2008, a proposal to change the name of the fund from “Dreyfus Premier Midcap Value Fund” to “Dreyfus Midcap Value Fund”.
MBSC Securities Corporation (the “Distributor”), a wholly-owned subsidiary of the Manager, is the distributor of the fund’s shares, which are sold without a sales charge. The fund is authorized to issue 475 million shares of $.001 par value Common Stock.The fund currently offers three classes of shares: Class A (225 million shares authorized), Class C (125 million shares authorized) and Class I (125 million shares authorized). Class A shares are subject to a sales charge imposed at the time of purchase. Class C shares are subject to a CDSC imposed on Class C shares redeemed within one year of purchase. Class I shares are sold at net asset value per share only to institutional investors. Other differences between the classes include the services offered to and the expenses borne by each class, the allocation of certain transfer agency costs and certain voting rights. Income, expenses (other than expenses attributable to a specific class), and realized and unrealized gains or losses on investments are allocated to each class of shares based on its relative net assets.
Effective December 3, 2008, investments for new accounts were no longer permitted in Class T shares of the fund, except that participants in certain group retirement plans were able to open a new account in
22
Class T shares of the fund, provided that the fund was established as an investment option under the plans before December 3, 2008. On February 4, 2009, the fund issued to each holder of its Class T shares, in exchange for said shares, Class A shares of the fund having an aggregate net asset value equal to the aggregate net asset value of the shareholder’s Class T shares. Subsequent investments in the fund’s Class A shares made by prior holders of the fund’s Class T shares who received Class A shares of the fund in exchange for their Class T shares are subject to the front-end sales load schedule that was in effect for Class T shares at the time of the exchange. Otherwise, all other Class A share attributes will be in effect. Effective as of the close of business on February 4, 2009, the fund no longer offers Class T shares.
The Company accounts separately for the assets, liabilities and operations of each series. Expenses directly attributable to each series are charged to that series’ operations; expenses which are applicable to all series are allocated among them on a pro rata basis.
The fund’s financial statements are prepared in accordance with U.S. generally accepted accounting principles, which may require the use of management estimates and assumptions. Actual results could differ from those estimates.
The fund enters into contracts that contain a variety of indemnifications. The fund’s maximum exposure under these arrangements is unknown.The fund does not anticipate recognizing any loss related to these arrangements.
(a) Portfolio valuation: Investments in securities are valued at the last sales price on the securities exchange or national securities market on which such securities are primarily traded. Securities listed on the National Market System for which market quotations are available are valued at the official closing price or, if there is no official closing price that day, at the last sales price. Securities not listed on an exchange or the national securities market, or securities for which there were no transactions, are valued at the average of the most recent bid and asked
The Fund 23
| NOTES TO FINANCIAL STATEMENTS (continued) |
prices, except for open short positions, where the asked price is used for valuation purposes. Bid price is used when no asked price is available. Registered investment companies that are not traded on an exchange are valued at their net asset value.When market quotations or official closing prices are not readily available, or are determined not to reflect accurately fair value, such as when the value of a security has been significantly affected by events after the close of the exchange or market on which the security is principally traded (for example, a foreign exchange or market), but before the fund calculates its net asset value, the fund may value these investments at fair value as determined in accordance with the procedures approved by the Board of Directors. Fair valuing of securities may be determined with the assistance of a pricing service using calculations based on indices of domestic securities and other appropriate indicators, such as prices of relevant ADRs and futures contracts. For other securities that are fair valued by the Board of Directors, certain factors may be considered such as: fundamental analytical data, the nature and duration of restrictions on disposition, an evaluation of the forces that influence the market in which the securities are purchased and sold, and public trading in similar securities of the issuer or comparable issuers. Financial futures are valued at the last sales price.
The fund adopted Statement of Financial Accounting Standards No. 157 “FairValue Measurements” (“FAS 157”). FAS 157 establishes an authoritative definition of fair value, sets out a framework for measuring fair value, and requires additional disclosures about fair value measurements.
Various inputs are used in determining the value of the fund’s investments relating to FAS 157.These inputs are summarized in the three broad levels listed below.
Level 1—quoted prices in active markets for identical investments.
Level 2—other significant observable inputs (including quoted prices for similar investments, interest rates, prepayment speeds, credit risk, etc.).
Level 3—significant unobservable inputs (including the fund’s own assumptions in determining the fair value of investments).
24
The inputs or methodology used for valuing securities are not necessarily an indication of the risk associated with investing in those securities.
The following is a summary of the inputs used as of August 31, 2009 in valuing the fund’s investments:
| | | | | Level 2—Other | | Level 3— | | |
| | | Level 1— | | Significant | | Significant | | |
| | | Quoted | | Observable | | Unobservable | | |
| | | Prices | | Inputs | | Inputs | | Total |
| |
| |
| |
| |
|
| Assets ($) | | | | | | | | |
| Investments in Securities: | | | | | | |
| Equity Securities— | | | | | | | | |
| Domestic | | 935,338,448 | | — | | — | | 935,338,448 |
| Equity Securities— | | | | | | | | |
| Foreign | | 6,396,509 | | — | | — | | 6,396,509 |
| Mutual Funds/ | | | | | | | | |
| Exchange | | | | | | | | |
| Traded Funds | | 188,538,678 | | — | | — | | 188,538,678 |
| Other Financial | | | | | | | | |
| Instruments† | | — | | — | | — | | — |
| Liabilities ($) | | | | | | | | |
| Other Financial | | | | | | | | |
| Instruments† | | — | | — | | — | | — |
| † Other financial instruments include derivative instruments such as futures, forward foreign currency |
| exchange contracts, swap contracts and options contracts. Amounts shown represent unrealized |
| appreciation (depreciation), or in the case of options, market value at period end. |
(b) Securities transactions and investment income: Securities transactions are recorded on a trade date basis. Realized gains and losses from securities transactions are recorded on the identified cost basis. Dividend income is recognized on the ex-dividend date and interest income, including, where applicable, accretion of discount and amortization of premium on investments, is recognized on the accrual basis.
The fund has arrangements with the custodian and cash management bank whereby the fund may receive earnings credits when positive cash balances are maintained, which are used to offset custody and cash management fees. For financial reporting purposes, the fund includes net earnings credits as an expense offset in the Statement of Operations.
The Fund 25
| NOTES TO FINANCIAL STATEMENTS (continued) |
Pursuant to a securities lending agreement with The Bank of New York Mellon, a subsidiary of BNY Mellon and an affiliate of Dreyfus, the fund may lend securities to qualified institutions. It is the fund’s policy that, at origination, all loans are secured by collateral of at least 102% of the value of U.S. securities loaned and 105% of the value of foreign securities loaned. Collateral equivalent to at least 100% of the market value of securities on loan is maintained at all times. Collateral is either in the form of cash, which can be invested in certain money market mutual funds managed by the Manager, U.S. Government and Agency securities or letters of credit.The fund is entitled to receive all income on securities loaned, in addition to income earned as a result of the lending transaction. Although each security loaned is fully collateralized, the fund bears the risk of delay in recovery of, or loss of rights in, the securities loaned should a borrower fail to return the securities in a timely manner. During the period ended August 31, 2009,The Bank of New York Mellon earned $160,527 from lending fund portfolio securities, pursuant to the securities lending agreement.
(c) Affiliated issuers: Investments in other investment companies advised by the Manager are defined as “affiliated” in the Act.
(d) Dividends to shareholders: Dividends are recorded on the ex-dividend date. Dividends from investment income-net and dividends from net realized capital gains, if any, are normally declared and paid annually, but the fund may make distributions on a more frequent basis to comply with the distribution requirements of the Internal Revenue Code of 1986, as amended (the “Code”).To the extent that net realized capital gains can be offset by capital loss carryovers, it is the policy of the fund not to distribute such gains. Income and capital gain distributions are determined in accordance with income tax regulations, which may differ from U.S. generally accepted accounting principles.
(e) Federal income taxes: It is the policy of the fund to continue to qualify as a regulated investment company, if such qualification is in the best interests of its shareholders, by complying with the applicable provisions of the Code, and to make distributions of taxable income sufficient to relieve it from substantially all federal income and excise taxes.
26
As of and during the period ended August 31, 2009, the fund did not have any liabilities for any uncertain tax positions.The fund recognizes interest and penalties, if any, related to uncertain tax positions as income tax expense in the Statement of Operations. During the period, the fund did not incur any interest or penalties.
Each of the tax years in the four-year period ended August 31, 2009 remains subject to examination by the Internal Revenue Service and state taxing authorities.
At August 31, 2009, the components of accumulated earnings on a tax basis were as follows: undistributed ordinary income $2,854,912, accumulated capital losses $125,702,650 and unrealized appreciation $104,373,862. In addition, the fund had $84,260,525 of capital losses realized after October 31, 2008, which were deferred for tax purposes to the first day of the following fiscal year.
The accumulated capital loss carryover is available to be applied against future net securities profits, if any, realized subsequent to August 31, 2009. If not applied, $4,395,586 of the carryover expires in fiscal 2016 and $121,307,064 expires in fiscal 2017.
The tax character of distributions paid to shareholders during the fiscal periods ended August 31, 2009 and August 31, 2008, were as follows: ordinary income $916,491 and $94,852,776 and long-term capital gains $0 and $69,770,728, respectively.
During the period ended August 31, 2009, as a result of permanent book to tax differences, primarily due to the tax treatment for real estate investment trusts, the fund decreased accumulated undistributed investment income-net by $46,222 and increased accumulated net realized gain (loss) on investments by the same amount.Net assets and net asset value per share were not affected by this reclassification.
NOTE 2—Bank Line of Credit:
The fund participates with other Dreyfus-managed funds in a $300 million unsecured line of credit provided by The Bank of New York Mellon (the “BNYM Facility”) primarily to be utilized for tempo-
The Fund 27
| NOTES TO FINANCIAL STATEMENTS (continued) |
rary or emergency purposes, including the financing of redemptions. The terms of the BNYM Facility limit the amount of individual fund borrowings. Interest is charged to the fund based on prevailing market rates in effect at the time of borrowing. In connection therewith, the fund has agreed to pay commitment fees on its pro rata portion of the BNYM Facility.
The average amount of borrowings outstanding under the BNYM Facility during the period ended August 31, 2009, was approximately $142,200, with a related weighted average annualized interest rate of 1.44%.
NOTE 3—Management Fee and Other Transactions With Affiliates:
(a) Pursuant to a management agreement with the Manager, the management fee is computed at the annual rate of .75% of the value of the fund’s average daily net assets and is payable monthly.
During the period ended August 31, 2009, the Distributor retained $7,521 from commissions earned on sales of the fund’s Class A shares and $158 from CDSCs on redemptions of the fund’s Class C shares.
(b) Under the Distribution Plan (the “Plan”) adopted pursuant to Rule 12b-1 under the Act, Class C shares pay and Class T shares paid the Distributor for distributing their shares at an annual rate of .75% of the value of their average daily net assets of Class C shares and .25% of the value of the average daily net assets of Class T shares. During the period ended August 31, 2009, Class C and Class T shares were charged $1,826 and $7, respectively, pursuant to the Plan.
(c) Under the Shareholder Services Plan (“Shareholder Services Plan”), Class A and Class C shares pay and Class T shares paid the Distributor at an annual rate of .25% of the value of their average daily net assets for the provision of certain services.The services provided may include personal services relating to shareholder accounts, such as answering shareholder inquiries regarding Class A, Class C and Class T shares and
28
providing reports and other information, and services related to the maintenance of shareholder accounts.The Distributor may make payments to Service Agents (a securities dealer, financial institution or other industry professional) in respect of these services.The Distributor determines the amounts to be paid to Service Agents. During the period ended August 31, 2009, Class A, Class C and Class T shares were charged $1,517,330, $609 and $7, respectively, pursuant to the Shareholder Services Plan.
The fund compensates Dreyfus Transfer, Inc., a wholly-owned subsidiary of the Manager, under a transfer agency agreement for providing personnel and facilities to perform transfer agency services for the fund. During the period ended August 31, 2009, the fund was charged $147,073 pursuant to the transfer agency agreement.
The fund compensates The Bank of New York Mellon under a cash management agreement for performing cash management services related to fund subscriptions and redemptions. During the period ended August 31, 2009, the fund was charged $23,698 pursuant to the cash management agreement.These fees were offset by earnings credits pursuant to the cash management agreement.
The fund also compensates The Bank of New York Mellon under a custody agreement for providing custodial services for the fund. During the period ended August 31, 2009, the fund was charged $77,758 pursuant to the custody agreement.
During the period ended August 31, 2009, the fund was charged $6,097 for services performed by the Chief Compliance Officer.
The components of “Due to The Dreyfus Corporation and affiliates” in the Statement of Assets and Liabilities consist of: management fees $590,237, Rule 12b-1 distribution plan fees $766, shareholder services plan fees $194,562, custodian fees $19,013, chief compliance officer fees $2,784 and transfer agency per account fees $48,054.
The Fund 29
| NOTES TO FINANCIAL STATEMENTS (continued) |
(d) Each Board member also serves as a Board member of other funds within the Dreyfus complex. Annual retainer fees and attendance fees are allocated to each fund based on net assets.
NOTE 4—Securities Transactions:
The aggregate amount of purchases and sales of investment securities, excluding short-term securities, during the period ended August 31, 2009, amounted to $1,282,942,265 and $1,069,212,165, respectively.
The fund adopted Statement of Financial Accounting Standards No. 161, “Disclosures about Derivative Instruments and Hedging Activities” (“FAS 161”). FAS 161 requires qualitative disclosures about objectives and strategies for using derivatives, quantitative disclosures about fair value amounts of gains and losses on derivative instruments, and disclosures about credit-risk-related contingent features in derivative agreements. Since the fund held no derivatives during the period ended August 31, 2009, FAS 161 disclosures did not impact the notes to the financial statements.
At August 31, 2009, the cost of investments for federal income tax purposes was $1,025,899,773; accordingly, accumulated net unrealized appreciation on investments was $104,373,862, consisting of $156,232,927 gross unrealized appreciation and $51,859,065 gross unrealized depreciation.
NOTE 5—Subsequent Events Evaluation:
Dreyfus has evaluated the need for disclosures and/or adjustments resulting from subsequent events through October 26, 2009, the date the financial statements were issued. This evaluation did not result in any subsequent events that necessitated disclosures and/or adjustments.
30
| REPORT OF INDEPENDENT REGISTERED |
| PUBLIC ACCOUNTING FIRM |
| | Shareholders and Board of Directors
Dreyfus Midcap Value Fund |
We have audited the accompanying statement of assets and liabilities, including the statement of investments, of Dreyfus Midcap Value Fund (formerly, Dreyfus Premier MidcapValue Fund) (one of the series comprising Advantage Funds, Inc.) as of August 31, 2009, and the related statement of operations for the year then ended, the statement of changes in net assets for each of the two years in the period then ended, and financial highlights for each of the periods indicated therein.These financial statements and financial highlights are the responsibility of the Fund’s management. Our responsibility is to express an opinion on these financial statements and financial highlights based on our audits.
We conducted our audits in accordance with the standards of the Public Company Accounting Oversight Board (United States).Those standards require that we plan and perform the audit to obtain reasonable assurance about whether the financial statements and financial highlights are free of material misstatement.We were not engaged to perform an audit of the Fund’s internal control over financial reporting. Our audits included consideration of internal control over financial reporting as a basis for designing audit procedures that are appropriate in the circumstances, but not for the purpose of expressing an opinion on the effectiveness of the Fund’s internal control over financial reporting. Accordingly, we express no such opinion.An audit also includes examining, on a test basis, evidence supporting the amounts and disclosures in the financial statements and financial highlights, assessing the accounting principles used and significant estimates made by management, and evaluating the overall financial statement presentation. Our procedures included confirmation of securities owned as of August 31, 2009 by correspondence with the custodian and others. We believe that our audits provide a reasonable basis for our opinion.
In our opinion, the financial statements and financial highlights referred to above present fairly, in all material respects, the financial position of Dreyfus Midcap Value Fund at August 31, 2009, the results of its operations for the year then ended, the changes in its net assets for each of the two years in the period then ended, and the financial highlights for each of the indicated periods, in conformity with U.S. generally accepted accounting principles.

New York, New York
October 26, 2009 |
The Fund 31
IMPORTANT TAX INFORMATION (Unaudited)
For federal tax purposes, the fund hereby designates 100% of the ordinary dividends paid during the fiscal year ended August 31, 2009 as qualifying for the corporate dividends received deduction. Also certain dividends paid by the fund may be subject to a maximum tax rate of 15%, as provided for by the Jobs and Growth Tax Relief Reconciliation Act of 2003. Of the distributions paid during the fiscal year, $16,992 represents the maximum amount that may be considered qualified dividend income. Shareholders will receive notification in early 2010 of the percentage applicable to the preparation of their 2009 income tax returns.
32
| INFORMATION ABOUT THE REVIEW AND APPROVAL |
| OF THE FUND’S MANAGEMENT AGREEMENT (Unaudited) |
At a meeting of the fund’s Board held on March 3, 2009, the Board unanimously approved the continuation of the fund’s Management Agreement with Dreyfus for a one-year term ending March 30, 2010. The Board members, none of whom are “interested persons” (as defined in the Investment Company Act of 1940, as amended) of the fund were assisted in their review by independent legal counsel and met with counsel in executive session separate from representatives of Dreyfus. In approving the continuance of the Management Agreement, the Board considered all factors that they believed to be relevant, including, among other things, the factors discussed below.
Analysis of Nature, Extent and Quality of Services Provided to the Fund. The Board members received a presentation from representatives of Dreyfus regarding services provided to the fund and other funds in the Dreyfus fund complex, and discussed the nature, extent and quality of the services provided to the fund pursuant to its Management Agreement. Dreyfus’ representatives reviewed the fund’s distribution of accounts and the relationships Dreyfus has with various intermediaries and the different needs of each. Dreyfus’ representatives noted the various distribution channels for the fund as well as the diverse methods of distribution among other funds in the Dreyfus fund complex, and Dreyfus’ corresponding need for broad, deep, and diverse resources to be able to provide ongoing shareholder services to each distribution channel, including those of the fund. Dreyfus also provided the number of accounts investing in the fund, as well as the fund’s asset size.
The Board members also considered Dreyfus’ research and portfolio management capabilities and Dreyfus’ oversight of day-to-day fund operations, including fund accounting and administration and assistance in meeting legal and regulatory requirements.The Board members also considered Dreyfus’ extensive administrative, accounting and compliance infrastructure.The Board also considered Dreyfus’ brokerage policies and practices, the standards applied in seeking best execution and Dreyfus’ policies and practices regarding soft dollars.
The Fund 33
| INFORMATION ABOUT THE REVIEW AND APPROVAL OF THE |
| FUND’S MANAGEMENT AGREEMENT (Unaudited) (continued) |
Comparative Analysis of the Fund’s Performance and Management Fee and Expense Ratio. The Board members reviewed the fund’s performance and comparisons to a group of retail no-load mid-cap value funds that are benchmarked against the Russell Midcap Value Index (the “Performance Group”) and to a larger universe of funds consisting of all retail and institutional mid-cap value funds (the “Performance Universe”) selected and provided by Lipper, Inc., an independent provider of investment company data.The Board was provided with a description of the methodology Lipper used to select the Performance Group and Performance Universe, as well as the Expense Group and Expense Universe (discussed below).The Board members discussed the results of the comparisons and noted the fund’s average annual total return ranked in the third quartile of the Performance Group and Performance Universe for the one-year period ended December 31, 2008 and in the second quartile of the Performance Group and Performance Universe for the two-year period ended December 31, 2008. For other periods the fund’s performance was variously above and below the Performance Group and Performance Universe medians. Dreyfus also provided a comparison of the fund’s calendar year total returns to the returns of the fund’s benchmark index.
The Board members also discussed the fund’s contractual and actual management fees and expense ratio and reviewed the range of management fees and expense ratios as compared to a comparable group of funds (the “Expense Group”) and a broader group of funds (the “Expense Universe”), each selected and provided by Lipper.The fund’s contractual and actual management fees and expense ratio were lower than the Expense Group medians and the fund’s actual management fee was lower than the Expense Universe median.The fund’s expense ratio was slightly higher than the Expense Universe median.
Representatives of Dreyfus noted that there were no similarly managed funds, separate accounts or wrap fee accounts managed by Dreyfus or its affiliates with similar investment objectives, policies and strategies as the fund.
34
Analysis of Profitability and Economies of Scale. Dreyfus’ representatives reviewed the dollar amount of expenses allocated and profit received by Dreyfus and the method used to determine such expenses and profit. The Board previously had been provided with information prepared by an independent consulting firm regarding Dreyfus’ approach to allocating costs to, and determining the profitability of, individual funds and the entire Dreyfus mutual fund complex.The Board also was informed that the methodology had also been reviewed by an independent registered public accounting firm which, like the consultant, found the methodology to be reasonable.The consulting firm also analyzed where any economies of scale might emerge in connection with the management of the fund.The Board members evaluated the profitability analysis in light of the relevant circumstances for the fund and the extent to which economies of scale would be realized if the fund grows and whether fee levels reflect these economies of scale for the benefit of fund investors. The Board members also considered potential benefits to Dreyfus from acting as investment adviser and noted the soft dollar arrangements with respect to trading the fund’s investments.
It was noted that the Board members should consider Dreyfus’ profitability with respect to the fund as part of their evaluation of whether the fees under the Management Agreement bear a reasonable relationship to the mix of services provided by Dreyfus, including the nature, extent and quality of such services, and that a discussion of economies of scale is predicated on a fund having achieved a substantial size with increasing assets and that, if a fund’s assets had been static or decreasing, the possibility that Dreyfus may have realized any economies of scale would be less. It also was noted that the profitability percentage for managing the fund was within the range determined by appropriate court cases to be reasonable given the services rendered and generally superior service levels provided.
At the conclusion of these discussions, the Board agreed that it had been furnished with sufficient information to make an informed busi-
The Fund 35
| INFORMATION ABOUT THE REVIEW AND APPROVAL OF THE |
| FUND’S MANAGEMENT AGREEMENT (Unaudited) (continued) |
ness decision with respect to continuation of the fund’s Management Agreement. Based on the discussions and considerations as described above, the Board made the following conclusions and determinations.
- The Board concluded that the nature, extent and quality of the ser- vices provided by Dreyfus are adequate and appropriate.
- The Board was generally satisfied with the fund’s relative performance.
- The Board concluded that the fee paid by the fund to Dreyfus was reasonable in light of the considerations described above.
- The Board determined that the economies of scale which may accrue to Dreyfus and its affiliates in connection with the management of the fund had been adequately considered by Dreyfus in connection with the management fee rate charged to the fund and that, to the extent in the future it were determined that material economies of scale had not been shared with the fund, the Board would seek to have those economies of scale shared with the fund.
The Board members considered these conclusions and determinations, along with information received on a routine and regular basis throughout the year, and, without any one factor being dispositive, the Board determined that continuation of the fund’s Management Agreement was in the best interests of the fund and its shareholders.
36
| BOARD MEMBERS INFORMATION (Unaudited) |
| |
| |
| |
| Joseph S. DiMartino (65) |
| Chairman of the Board (1995) |
| Principal Occupation During Past 5Years: |
| • Corporate Director and Trustee |
| Other Board Memberships and Affiliations: |
| • The Muscular Dystrophy Association, Director |
| • CBIZ (formerly, Century Business Services, Inc.), a provider of outsourcing functions for small |
| and medium size companies, Director |
| • The Newark Group, a provider of a national market of paper recovery facilities, paperboard |
| mills and paperboard converting plants, Director |
| • Sunair Services Corporation, a provider of certain outdoor-related services to homes and |
| businesses, Director |
| No. of Portfolios for which Board Member Serves: 166 |
| ——————— |
| Peggy C. Davis (66) |
| Board Member (2006) |
| Principal Occupation During Past 5Years: |
| • Shad Professor of Law, New York University School of Law (1983-present) |
| • Writer and teacher in the fields of evidence, constitutional theory, family law, social sciences |
| and the law, legal process and professional methodology and training |
| No. of Portfolios for which Board Member Serves: 53 |
| ——————— |
| David P. Feldman (69) |
| Board Member (1996) |
| Principal Occupation During Past 5Years: |
| • Corporate Director and Trustee |
| Other Board Memberships and Affiliations: |
| • BBH Mutual Funds Group (11 funds), Director |
| • The Jeffrey Company, a private investment company, Director |
| No. of Portfolios for which Board Member Serves: 46 |
| ——————— |
| James F. Henry (78) |
| Board Member (2006) |
| Principal Occupation During Past 5Years: |
| • Advisor to The Elaw Forum, a consultant on managing corporate legal costs |
| • Advisor to John Jay Homestead (the restored home of the first U.S. Chief Justice) |
| • Individual Trustee of several trusts |
| Other Board Memberships and Affiliations: |
| • Director, advisor and mediator involved in several non-profit organizations, primarily engaged |
| in domestic and international dispute resolution, and historic preservation |
| No. of Portfolios for which Board Member Serves: 31 |
The Fund 37
| BOARD MEMBERS INFORMATION (Unaudited) (continued) |
| |
| |
| |
| |
| Ehud Houminer (69) |
| Board Member (1993) |
| Principal Occupation During Past 5Years: |
| • Executive-in-Residence at the Columbia Business School, Columbia University |
| |
| Other Board Memberships and Affiliations: |
| • Avnet Inc., an electronics distributor, Director |
| • International Advisory Board to the MBA Program School of Management, Ben Gurion |
| University, Chairman |
| |
| No. of Portfolios for which Board Member Serves: 58 |
| ——————— |
| Gloria Messinger (79) |
| Board Member (1993) |
| Principal Occupation During Past 5Years: |
| • Arbitrator for American Arbitration Association |
| • Arbitrator for FINRA (formerly, National Association of Securities Dealers, Inc.) |
| • Consultant in Intellectual Property |
| |
| Other Board Memberships and Affiliations: |
| • Theater for a New Audience, Inc., Director |
| • Brooklyn Philharmonic, Director |
| |
| No. of Portfolios for which Board Member Serves: 31 |
| ——————— |
| Dr. Martin Peretz (70) |
| Board Member (2006) |
| Principal Occupation During Past 5Years: |
| • Editor-in-Chief of The New Republic Magazine |
| • Director of TheStreet.com, a financial information service on the web |
| |
| Other Board Memberships and Affiliations: |
| • American Council of Trustees and Alumni, Director |
| • Pershing Square Capital Management, Advisor |
| • Montefiore Ventures, General Partner |
| • Harvard Center for Blood Research,Trustee |
| • Bard College,Trustee |
| • Board of Overseers of YIVO Institute for Jewish Research, Chairman |
| |
| No. of Portfolios for which Board Member Serves: 31 |
| |
| ——————— |
| Once elected all Board Members serve for an indefinite term, but achieve Emeritus status upon reaching age 80.The |
| address of the Board Members and Officers is in c/o The Dreyfus Corporation, 200 Park Avenue, NewYork, NewYork |
| 10166. Additional information about the Board Members is available in the fund’s Statement of Additional Information |
| which can be obtained from Dreyfus free of charge by calling this toll free number: 1-800-554-4611. |
| John M. Fraser, Jr., Emeritus Board Member |
| Rosalind G. Jacobs, Emeritus Board Member |
| Dr. Paul A. Marks, Emeritus Board Member |
38
OFFICERS OF THE FUND (Unaudited)
J. DAVID OFFICER, President since December 2006.
Chairman, President and Chief Executive Officer of Founders Asset Management LLC, an affiliate of the Manager, and an officer of 75 investment companies (comprised of 166 portfolios) managed by the Manager. Prior to June 2009, Mr. Officer was Chief Operating Officer,Vice Chairman and a director of the Manager, where he had been employed since April 1998. He is 61 years old.
PHILLIP N. MAISANO, Executive Vice President since July 2007.
Chief Investment Officer,Vice Chair and a director of the Manager, and an officer of 75 investment companies (comprised of 166 portfolios) managed by the Manager. Mr. Maisano also is an officer and/or Board member of certain other investment management subsidiaries of The Bank of New York Mellon Corporation, each of which is an affiliate of the Manager. He is 62 years old and has been an employee of the Manager since November 2006. Prior to joining the Manager, Mr. Maisano served as Chairman and Chief Executive Officer of EACM Advisors, an affiliate of the Manager, since August 2004, and served as Chief Executive Officer of Evaluation Associates, a leading institutional investment consulting firm, from 1988 until 2004.
MICHAEL A. ROSENBERG, Vice President and Secretary since August 2005.
Assistant General Counsel of BNY Mellon, and an officer of 76 investment companies (comprised of 187 portfolios) managed by the Manager. He is 49 years old and has been an employee of the Manager since October 1991.
JAMES BITETTO, Vice President and Assistant Secretary since August 2005.
Senior Counsel of BNY Mellon and Secretary of the Manager, and an officer of 76 investment companies (comprised of 187 portfolios) managed by the Manager. He is 43 years old and has been an employee of the Manager since December 1996.
JONI LACKS CHARATAN, Vice President and Assistant Secretary since August 2005.
Senior Counsel of BNY Mellon, and an officer of 76 investment companies (comprised of 187 portfolios) managed by the Manager. She is 53 years old and has been an employee of the Manager since October 1988.
JOSEPH M. CHIOFFI, Vice President and Assistant Secretary since August 2005.
Senior Counsel of BNY Mellon, and an officer of 76 investment companies (comprised of 187 portfolios) managed by the Manager. He is 47 years old and has been an employee of the Manager since June 2000.
JANETTE E. FARRAGHER, Vice President and Assistant Secretary since August 2005.
Assistant General Counsel of BNY Mellon, and an officer of 76 investment companies (comprised of 187 portfolios) managed by the Manager. She is 46 years old and has been an employee of the Manager since February 1984.
JOHN B. HAMMALIAN, Vice President and Assistant Secretary since August 2005.
Managing Counsel of BNY Mellon, and an officer of 76 investment companies (comprised of 187 portfolios) managed by the Manager. He is 46 years old and has been an employee of the Manager since February 1991.
ROBERT R. MULLERY, Vice President and Assistant Secretary since August 2005.
Managing Counsel of BNY Mellon, and an officer of 76 investment companies (comprised of 187 portfolios) managed by the Manager. He is 57 years old and has been an employee of the Manager since May 1986.
JEFF PRUSNOFSKY, Vice President and Assistant Secretary since August 2005.
Managing Counsel of BNY Mellon, and an officer of 76 investment companies (comprised of 187 portfolios) managed by the Manager. He is 44 years old and has been an employee of the Manager since October 1990.
The Fund 39
OFFICERS OF THE FUND (Unaudited) (continued)
JAMES WINDELS, Treasurer since November 2001.
Director – Mutual Fund Accounting of the Manager, and an officer of 76 investment companies (comprised of 187 portfolios) managed by the Manager. He is 49 years old and has been an employee of the Manager since April 1985.
RICHARD CASSARO, Assistant Treasurer since January 2008.
Senior Accounting Manager – Money Market and Municipal Bond Funds of the Manager, and an officer of 76 investment companies (comprised of 187 portfolios) managed by the Manager. He is 50 years old and has been an employee of the Manager since September 1982.
GAVIN C. REILLY, Assistant Treasurer since December 2005.
Tax Manager of the Investment Accounting and Support Department of the Manager, and an officer of 76 investment companies (comprised of 187 portfolios) managed by the Manager. He is 41 years old and has been an employee of the Manager since April 1991.
ROBERT ROBOL, Assistant Treasurer since August 2005.
Senior Accounting Manager – Fixed Income Funds of the Manager, and an officer of 76 investment companies (comprised of 187 portfolios) managed by the Manager. He is 45 years old and has been an employee of the Manager since October 1988.
ROBERT SALVIOLO, Assistant Treasurer since July 2007.
Senior Accounting Manager – Equity Funds of the Manager, and an officer of 76 investment companies (comprised of 187 portfolios) managed by the Manager. He is 42 years old and has been an employee of the Manager since June 1989.
ROBERT SVAGNA, Assistant Treasurer since December 2002.
Senior Accounting Manager – Equity Funds of the Manager, and an officer of 76 investment companies (comprised of 187 portfolios) managed by the Manager. He is 42 years old and has been an employee of the Manager since November 1990.
JOSEPH W. CONNOLLY, Chief Compliance Officer since October 2004.
Chief Compliance Officer of the Manager and The Dreyfus Family of Funds (76 investment companies, comprised of 187 portfolios). From November 2001 through March 2004, Mr. Connolly was first Vice-President, Mutual Fund Servicing for Mellon Global Securities Services. In that capacity, Mr. Connolly was responsible for managing Mellon’s Custody, Fund Accounting and Fund Administration services to third-party mutual fund clients. He is 52 years old and has served in various capacities with the Manager since 1980, including manager of the firm’s Fund Accounting Department from 1997 through October 2001.
WILLIAM GERMENIS, Anti-Money Laundering Compliance Officer since October 2002.
Vice President and Anti-Money Laundering Compliance Officer of the Distributor, and the Anti-Money Laundering Compliance Officer of 72 investment companies (comprised of 183 portfolios) managed by the Manager. He is 38 years old and has been an employee of the Distributor since October 1998.
40

Save time. Save paper. View your next shareholder report online as soon as it’s available. Log into www.dreyfus.com and sign up for Dreyfus eCommunications. It’s simple and only takes a few minutes.
The views expressed in this report reflect those of the portfolio manager only through the end of the period covered and do not necessarily represent the views of Dreyfus or any other person in the Dreyfus organization. Any such views are subject to change at any time based upon market or other conditions and Dreyfus disclaims any responsibility to update such views.These views may not be relied on as investment advice and, because investment decisions for a Dreyfus fund are based on numerous factors, may not be relied on as an indication of trading intent on behalf of any Dreyfus fund.
Not FDIC-Insured • Not Bank-Guaranteed • May Lose Value
| | Contents |
| |
| | THE FUND |
| |
| 2 | A Letter from the Chairman and CEO |
| |
| 3 | Discussion of Fund Performance |
| |
| 6 | Fund Performance |
| |
| 7 | Understanding Your Fund’s Expenses |
| |
| 7 | Comparing Your Fund’s Expenses With Those of Other Funds |
| |
| 8 | Statement of Investments |
| |
| 12 | Statement of Assets and Liabilities |
| |
| 13 | Statement of Operations |
| |
| 14 | Statement of Changes in Net Assets |
| |
| 15 | Financial Highlights |
| |
| 16 | Notes to Financial Statements |
| |
| 24 | Report of Independent Registered Public Accounting Firm |
| |
| 25 | Important Tax Information |
| |
| 26 | Information About the Review and Approval of the Fund’s Management Agreement |
| |
| 30 | Board Members Information |
| |
| 32 | Officers of the Fund |
| |
| | FOR MORE INFORMATION |
| |
| | Back Cover |
| |
| Dreyfus |
| Small Company Value Fund |

A LETTER FROM THE CHAIRMAN AND CEO
Dear Shareholder:
We are pleased to present this annual report for Dreyfus Small Company Value Fund, covering the 12-month period from September 1, 2008, through August 31, 2009.
At long last, the current recession cycle appears to be winding down. After generally slumping since December 2007, we expect U.S. economic growth to pick up during the third quarter of 2009. Highly stimulative monetary and fiscal policies domestically and throughout the world, combined with the low cost of debt and equity capital compared to historical norms, already have sparked a rebound in industrial production as manufacturers replenish their depleted inventories. However, we continue to anticipate a slower-than-average recovery, with the unemployment rate likely to remain elevated over the next several quarters.
The U.S.stock market anticipated the economic upturn with a sustained market rally that began in early March 2009. Although the rebound initially was concentrated primarily among lower-quality stocks that had been severely punished in the downturn, it later broadened to include virtually all economic sectors and capitalization ranges. While we are encouraged by the market’s recent strength, we remain concerned that improving investor sentiment may have exceeded the revival of business fundamentals. Accordingly, we continue to believe that careful selectivity and risk management will be keys to success in the financial markets over the foreseeable future. As always, we urge you to speak with your financial adviser about the potential opportunities and obstacles in today’s investment environment.
For information about how the fund performed during the reporting period, as well as market perspectives, we have provided a Discussion of Fund Performance given by the fund’s Portfolio Managers.
Thank you for your continued confidence and support.

Jonathan R. Baum
Chairman & Chief Executive Officer
The Dreyfus Corporation
September 15, 2009 |
2

DISCUSSION OF FUND PERFORMANCE
For the reporting period of September 1, 2008, through August 31, 2009, as provided by David A. Daglio, Primary Portfolio Manager and Mark P. Dishop, Portfolio Manager
Fund and Market Performance Overview
We are pleased to report a positive return for your fund in this challenging market environment experienced in the past fiscal year.
For the 12-month period ended August 31, 2009, Dreyfus Small CompanyValue Fund produced a total return of 4.50%.1 In comparison, the fund’s benchmark, the Russell 2000 Value Index, produced a total return of –20.68% for the same period.2
Despite a severe recession and banking crisis over much of the reporting period, stocks rallied in the spring and summer of 2009, offsetting a substantial portion of losses incurred during the final months of 2008.The fund fared well in this turbulent environment, as our disciplined investment strategy produced individual stock selections that held up relatively well in the downturn and outperformed market averages in the rally.
The Fund’s Investment Approach
The fund seeks capital appreciation and normally invests at least 80% of its assets in the stocks of companies with market capitalizations within the range of companies in the Russell 2000Value Index at the time of purchase. Because the fund may continue to hold a security whose market capitalization increases or decreases, a substantial portion of the fund’s holdings can have market capitalizations outside the range of the Russell 2000 Value Index at any given time. The fund’s stock investments may include common stocks, preferred stocks and convertible securities of both U.S. and foreign issuers, including those purchased in initial public offerings (IPOs). Potential investments are identified through extensive quantitative and fundamental research, emphasizing three key factors: value, business health and business momentum.
The Fund 3
| DISCUSSION OF FUND PERFORMANCE (continued) |
Equity Markets Plunged, Then Rebounded Sharply
The U.S. stock market endured a year of extreme volatility. Just weeks after the start of the reporting period, the failures of several major financial institutions nearly led to the collapse of the worldwide banking system. Meanwhile, rising unemployment, plunging housing prices and depressed consumer confidence fueled the longest and most severe economic downturn since the 1930s.These influences sparked a bear market that drove small-cap stock market averages to multi-year lows. The decline was broad-based, affecting industry groups and individual stocks seemingly regardless of their underlying business fundamentals.
However, market sentiment suddenly began to improve in early March, as aggressive measures adopted by government and monetary authorities appeared to have averted a collapse of the banking system. Bargain hunters began to bid beaten-down stock prices higher, and evidence of economic stabilization supported a sustained market rally that lasted through the reporting period’s end.
Disciplined Selection Process Fueled Fund Performance
Although the fund was affected by heightened market volatility, our disciplined security selection process was particularly well suited for the challenging investment environment. Our focus on mid-cycle earnings prospects allowed us to look beyond the difficulties of the next few quarters and identify companies well positioned for the return to more normal business conditions. By stressing our calculation of a company’s intrinsic value, we were able to identify and invest in some of the most compelling values in the marketplace and avoid the most overvalued. At the same time, our emphasis on understanding and accounting for hidden liabilities allowed the fund to avoid a number of financially weak value traps.
Our approach proved particularly effective in the consumer discretionary sector, where investors may have overreacted to concerns regarding deteriorating consumer spending trends. For example, the fund received robust contributions to its relative performance from apparel retailer Citi Trends, electronic retailer Hhgregg, auto parts supplier ArvinMeritor and restaurant chains PF Chang’s China Bistro and Cheesecake Factory.
4
The technology sector also provided significant gains as we were able to purchase stocks of financially strong companies at depressed prices. These stocks fared well in the spring and summer of 2009 when technology producers began to replenish depleted inventories. Some of the fund’s stronger technology performers included chipmaker Cypress Semiconductor, memory specialist STEC and Rovi (formerly Macrovision), a provider of interactive program guides for television.
We have long maintained a cautious posture with regard to the financial sector, and that defensive stance paid off during the banking crisis.The fund particularly benefited from underweighted exposure to commercial banks and real estate investment trusts compared to the benchmark.
The only material drag on the fund’s relative performance over the reporting period came from the consumer staples sector, where several meat producers disappointed. Chief among them were pork producer Smithfield Foods, which experienced a longer than expected squeeze on operating margins. In addition, grocery chain The Great Atlantic & Pacific Tea Company suffered when same-store sales comparisons deteriorated. Both names are no longer held in the fund.
Positioned for an Economic Recovery
Although economic weakness has persisted, a recovery appears to be in the making due in part to highly stimulative monetary and fiscal policies, which are likely to remain in place for some time.Therefore, we are optimistic regarding the long-term prospects for the U.S. economy and corporate earnings.We have found a number of opportunities meeting our disciplined investment criteria in the consumer discretionary and technology sectors, but fewer in the energy sector, where natural gas supply exceeds demand.
September 15, 2009
| 1 | | Total return includes reinvestment of dividends and any capital gains paid. Past performance is no |
| | | guarantee of future results. Share price and investment return fluctuate such that upon redemption, |
| | | fund shares may be worth more or less than their original cost. |
| 2 | | SOURCE: LIPPER INC. — Reflects the reinvestment of dividends and, where applicable, |
| | | capital gain distributions.The Russell 2000 Value Index is an unmanaged index, which measures |
| | | the performance of those Russell 2000 companies with lower price-to-book ratios and lower |
| | | forecasted growth values. |
The Fund 5
FUND PERFORMANCE

| † Source: Lipper Inc. |
| Past performance is not predictive of future performance.The fund’s performance shown in the graph and table does not |
| reflect the deduction of taxes that a shareholder would pay on fund distributions or the redemption of fund shares. |
| The above graph compares a $10,000 investment made in Dreyfus Small Company Value Fund on 8/31/99 to a |
| $10,000 investment made in the Russell 2000 Value Index (the “Index” ) on that date. All dividends and capital gain |
| distributions are reinvested. |
| The fund’s performance shown in the line graph takes into account all applicable fees and expenses.The Index is an |
| unmanaged index of small-cap value stock performance. Unlike a mutual fund, the Index is not subject to charges, fees |
| and other expenses. Investors cannot invest directly in any index. Further information relating to fund performance, |
| including expense reimbursements, if applicable, is contained in the Financial Highlights section of the prospectus and |
| elsewhere in this report. |
6
UNDERSTANDING YOUR FUND’S EXPENSES (Unaudited)
As a mutual fund investor, you pay ongoing expenses, such as management fees and other expenses. Using the information below, you can estimate how these expenses affect your investment and compare them with the expenses of other funds.You also may pay one-time transaction expenses, including sales charges (loads) and redemption fees, which are not shown in this section and would have resulted in higher total expenses. For more information, see your fund’s prospectus or talk to your financial adviser.
Review your fund’s expenses
The table below shows the expenses you would have paid on a $1,000 investment in Dreyfus Small CompanyValue Fund from March 1, 2009 to August 31, 2009. It also shows how much a $1,000 investment would be worth at the close of the period, assuming actual returns and expenses.
| Expenses and Value of a $1,000 Investment |
| assuming actual returns for the six months ended August 31, 2009 |
|
| |
| Expenses paid per $1,000† | | $9.29 |
| Ending value (after expenses) | | $1,670.70 |
| COMPARING YOUR FUND’S EXPENSES |
| WITH THOSE OF OTHER FUNDS (Unaudited) |
Using the SEC’s method to compare expenses
The Securities and Exchange Commission (SEC) has established guidelines to help investors assess fund expenses. Per these guidelines, the table below shows your fund’s expenses based on a $1,000 investment, assuming a hypothetical 5% annualized return. You can use this information to compare the ongoing expenses (but not transaction expenses or total cost) of investing in the fund with those of other funds.All mutual fund shareholder reports will provide this information to help you make this comparison. Please note that you cannot use this information to estimate your actual ending account balance and expenses paid during the period.
| Expenses and Value of a $1,000 Investment |
| assuming a hypothetical 5% annualized return for the six months ended August 31, 2009 |
|
| |
| Expenses paid per $1,000† | | $7.02 |
| Ending value (after expenses) | | $1,018.25 |
† Expenses are equal to the fund’s annualized expense ratio of 1.38%, multiplied by the average account value over the period, multiplied by 184/365 (to reflect the one-half year period).
The Fund 7
| STATEMENT OF INVESTMENTS |
| August 31, 2009 |
| Common Stocks—99.0% | | Shares | | Value ($) |
| |
| |
|
| Consumer Discretionary—23.5% | | | | |
| Abercrombie & Fitch, Cl. A | | 29,800 a | | 962,242 |
| AFC Enterprises | | 413,285 b | | 3,430,265 |
| American Axle & Manufacturing Holdings | | 187,920 a | | 1,161,346 |
| AnnTaylor Stores | | 219,840 a,b | | 3,095,347 |
| ArvinMeritor | | 671,530 a | | 4,908,884 |
| Autoliv | | 39,440 | | 1,264,841 |
| Bebe Stores | | 237,060 | | 1,808,768 |
| CBS, Cl. B | | 97,360 | | 1,007,676 |
| Citi Trends | | 59,760 b | | 1,332,050 |
| Furniture Brands International | | 1,010,767 a | | 5,650,188 |
| Harman International Industries | | 41,180 | | 1,234,988 |
| Interpublic Group of Cos. | | 417,390 a,b | | 2,625,383 |
| ITT Educational Services | | 9,760 b | | 1,024,702 |
| Mohawk Industries | | 47,280 a,b | | 2,369,674 |
| OfficeMax | | 469,370 a | | 5,308,575 |
| Saks | | 635,710 a,b | | 3,877,831 |
| True Religion Apparel | | 148,000 a,b | | 3,349,240 |
| WABCO Holdings | | 107,660 | | 2,053,076 |
| Wet Seal, Cl. A | | 149,960 a,b | | 526,360 |
| | | | | 46,991,436 |
| Consumer Staples—3.1% | | | | |
| Nash Finch | | 75,830 | | 2,058,026 |
| Winn-Dixie Stores | | 306,124 a,b | | 4,215,327 |
| | | | | 6,273,353 |
| Energy—2.4% | | | | |
| Comstock Resources | | 80,690 b | | 2,850,778 |
| Rosetta Resources | | 162,560 b | | 1,919,834 |
| | | | | 4,770,612 |
| Exchange Traded Funds—1.6% | | | | |
| iShares Russell 2000 Index Fund | | 54,400 | | 3,111,680 |
| Financial—13.2% | | | | |
| CB Richard Ellis Group, Cl. A | | 93,660 b | | 1,108,934 |
| Chimera Investment | | 1,321,080 | | 5,020,104 |
| Cypress Sharpridge Investments | | 73,773 b | | 1,032,822 |
| Duff & Phelps, Cl. A | | 128,930 | | 2,196,967 |
| F.N.B | | 115,790 a | | 819,793 |
| FBR Capital Markets | | 734,356 a,b | | 3,972,866 |
8
| Common Stocks (continued) | | Shares | | Value ($) |
| |
| |
|
| Financial (continued) | | | | |
| First Cash Financial Services | | 94,679 b | | 1,779,018 |
| First Horizon National | | 156,402 a,b | | 2,092,659 |
| Glacier Bancorp | | 14,820 a | | 220,966 |
| Hanover Insurance Group | | 70,550 | | 2,884,790 |
| Pinnacle Financial Partners | | 95,450 a,b | | 1,438,431 |
| Portfolio Recovery Associates | | 36,030 a,b | | 1,582,438 |
| RenaissanceRe Holdings | | 7,850 | | 427,432 |
| Smithtown Bancorp | | 123,662 a | | 1,674,383 |
| | | | | 26,251,603 |
| Health Care—12.5% | | | | |
| Align Technology | | 141,760 a,b | | 1,899,584 |
| Amedisys | | 102,350 a,b | | 4,558,669 |
| Emergent Biosolutions | | 230,090 b | | 4,263,568 |
| Facet Biotech | | 470,350 b | | 4,722,314 |
| King Pharmaceuticals | | 169,530 b | | 1,759,721 |
| Medicines | | 293,490 b | | 2,236,394 |
| Pain Therapeutics | | 350,356 a,b | | 1,786,816 |
| Perrigo | | 71,190 | | 2,101,529 |
| Volcano | | 112,260 b | | 1,605,318 |
| | | | | 24,933,913 |
| Industrial—17.9% | | | | |
| Actuant, Cl. A | | 223,020 | | 3,151,273 |
| Altra Holdings | | 532,850 b | | 5,115,360 |
| American Woodmark | | 96,300 | | 1,933,704 |
| Con-way | | 65,610 | | 2,739,874 |
| Encore Wire | | 84,440 a | | 1,999,539 |
| FreightCar America | | 45,640 a | | 870,811 |
| Griffon | | 98,300 b | | 1,039,031 |
| Kaman | | 98,800 | | 2,048,124 |
| Kennametal | | 73,870 | | 1,628,833 |
| KHD Humboldt Wedag International | | 83,750 b | | 817,400 |
| Lennox International | | 35,770 | | 1,283,428 |
| Navigant Consulting | | 183,010 b | | 2,304,096 |
| Old Dominion Freight Line | | 47,610 a,b | | 1,703,486 |
| Quanex Building Products | | 203,510 | | 2,741,280 |
| Saia | | 100,750 b | | 1,783,275 |
| Sauer-Danfoss | | 257,340 | | 1,435,957 |
The Fund 9
| STATEMENT OF INVESTMENTS (continued) |
| Common Stocks (continued) | | Shares | | Value ($) |
| |
| |
|
| Industrial (continued) | | | | |
| Simpson Manufacturing | | 117,710 | | 3,025,147 |
| | | | | 35,620,618 |
| Information Technology—12.7% | | | | |
| Applied Micro Circuits | | 97,582 b | | 774,801 |
| Brocade Communications Systems | | 145,840 b | | 1,054,423 |
| Cadence Design Systems | | 288,780 b | | 1,810,651 |
| Electro Rent | | 171,587 | | 1,748,472 |
| Emulex | | 87,100 b | | 843,999 |
| Lattice Semiconductor | | 942,060 b | | 2,317,468 |
| Lawson Software | | 293,130 b | | 1,805,681 |
| Micros Systems | | 36,030 b | | 1,004,156 |
| Rovi | | 64,520 b | | 1,963,989 |
| ScanSource | | 94,180 b | | 2,636,098 |
| Take-Two Interactive Software | | 310,790 a,b | | 3,263,295 |
| Teradyne | | 161,250 a,b | | 1,330,312 |
| Vishay Intertechnology | | 503,520 b | | 4,063,406 |
| Websense | | 49,960 a,b | | 757,394 |
| | | | | 25,374,145 |
| Materials—5.6% | | | | |
| Cabot | | 192,670 | | 3,812,939 |
| Cytec Industries | | 78,540 | | 2,269,021 |
| Myers Industries | | 186,320 | | 1,909,780 |
| Temple-Inland | | 187,240 a | | 3,166,228 |
| | | | | 11,157,968 |
| Telecommunication Services—2.1% | | | | |
| Global Crossing | | 83,110 b | | 934,156 |
| iPCS | | 53,190 b | | 839,870 |
| NTELOS Holdings | | 149,270 | | 2,419,667 |
| | | | | 4,193,693 |
| Utilities—4.4% | | | | |
| Central Vermont Public Service | | 69,950 | | 1,280,085 |
| Great Plains Energy | | 146,774 | | 2,571,480 |
| Portland General Electric | | 248,980 | | 4,860,090 |
| | | | | 8,711,655 |
| Total Common Stocks | | | | |
| (cost $168,442,475) | | | | 197,390,676 |
10
| Other Investment—3.7% | | Shares | | Value ($) |
| |
| |
|
| Registered Investment Company; | | | | |
| Dreyfus Institutional Preferred | | | | |
| Plus Money Market Fund | | | | |
| (cost $7,441,000) | | 7,441,000 c | | 7,441,000 |
| |
| Investment of Cash Collateral | | | | |
| for Securities Loaned—16.8% | | | | |
| |
| |
|
| Registered Investment Company; | | | | |
| Dreyfus Institutional Cash Advantage Fund | | | | |
| (cost $33,428,898) | | 33,428,898 c | | 33,428,898 |
| |
| Total Investments (cost $209,312,373) | | 119.5% | | 238,260,574 |
| Liabilities, Less Cash and Receivables | | (19.5%) | | (38,862,034) |
| Net Assets | | 100.0% | | 199,398,540 |
| a All or a portion of these securities are on loan. At August 31, 2009, the total market value of the fund’s securities on |
| loan is $31,323,836 and the total market value of the collateral held by the fund is $33,428,898. |
| b Non-income producing security. |
| c Investment in affiliated money market mutual fund. |
| Portfolio Summary (Unaudited)† | | | | |
| |
| | | Value (%) | | | | Value (%) |
| |
| |
| |
|
| Consumer Discretionary | | 23.5 | | Utilities | | 4.4 |
| Money Market Investments | | 20.5 | | Consumer Staples | | 3.1 |
| Industrial | | 17.9 | | Energy | | 2.4 |
| Financial | | 13.2 | | Telecommunication Services | | 2.1 |
| Information Technology | | 12.7 | | Exchange Traded Funds | | 1.6 |
| Health Care | | 12.5 | | | | |
| Materials | | 5.6 | | | | 119.5 |
| |
| † Based on net assets. | | | | | | |
| See notes to financial statements. | | | | | | |
The Fund 11
| STATEMENT OF ASSETS AND LIABILITIES |
| August 31, 2009 |
| | | Cost | | Value |
| |
| |
|
| Assets ($): | | | | |
| Investments in securities—See Statement of Investments (including | | | | |
| securities on loan, valued at $31,323,836)—Note 1(b): | | | | |
| Unaffiliated issuers | | 168,442,475 | | 197,390,676 |
| Affiliated issuers | | 40,869,898 | | 40,869,898 |
| Cash | | | | 1,171,328 |
| Receivable for investment securities sold | | | | 5,833,111 |
| Receivable for shares of Common Stock subscribed | | | | 1,189,887 |
| Dividends and interest receivable | | | | 137,926 |
| Prepaid expenses | | | | 23,433 |
| | | | | 246,616,259 |
| Liabilities ($): | | | | |
| Due to The Dreyfus Corporation and affiliates—Note 3(b) | | | | 199,973 |
| Liability for securities on loan—Note 1(b) | | | | 33,428,898 |
| Payable for investment securities purchased | | | | 13,434,168 |
| Payable for shares of Common Stock redeemed | | | | 91,638 |
| Accrued expenses | | | | 63,042 |
| | | | | 47,217,719 |
| Net Assets ($) | | | | 199,398,540 |
| Composition of Net Assets ($): | | | | |
| Paid-in capital | | | | 195,461,118 |
| Accumulated net realized gain (loss) on investments | | | | (25,010,779) |
| Accumulated net unrealized appreciation | | | | |
| (depreciation) on investments | | | | 28,948,201 |
| Net Assets ($) | | | | 199,398,540 |
| Shares Outstanding | | | | |
| (100 million shares of $.001par value Common Stock authorized) | | | | 9,653,836 |
| Net Asset Value, offering and redemption price per share ($) | | | | 20.65 |
| |
| See notes to financial statements. | | | | |
12
| STATEMENT OF OPERATIONS |
| Year Ended August 31, 2009 |
| Investment Income ($): | | |
| Income: | | |
| Cash dividends (net of $21,925) foreign taxes withheld at source): | | |
| Unaffiliated issuers | | 1,156,986 |
| Affiliated issuers | | 7,011 |
| Income from securities lending | | 153,256 |
| Total Income | | 1,317,253 |
| Expenses: | | |
| Management fee—Note 3(a) | | 722,500 |
| Shareholder servicing costs—Note 3(b) | | 370,687 |
| Prospectus and shareholders’ reports | | 107,794 |
| Custodian fees—Note 3(b) | | 40,052 |
| Professional fees | | 38,379 |
| Registration fees | | 24,382 |
| Directors’ fees and expenses—Note 3(c) | | 8,616 |
| Loan commitment fees—Note 2 | | 211 |
| Interest expense—Note 2 | | 44 |
| Miscellaneous | | 19,258 |
| Total Expenses | | 1,331,923 |
| Less—reduction in fees due to | | |
| earnings credits—Note 1(b) | | (10,499) |
| Net Expenses | | 1,321,424 |
| Investment (Loss)—Net | | (4,171) |
| Realized and Unrealized Gain (Loss) on Investments—Note 4 ($): | | |
| Net realized gain (loss) on investments | | (12,122,264) |
| Net unrealized appreciation (depreciation) on investments | | 27,320,459 |
| Net Realized and Unrealized Gain (Loss) on Investments | | 15,198,195 |
| Net Increase in Net Assets Resulting from Operations | | 15,194,024 |
| |
| See notes to financial statements. | | |
The Fund 13
STATEMENT OF CHANGES IN NET ASSETS
| | | Year Ended August 31, |
| | |
|
| | | 2009 | | 2008 |
| |
| |
|
| Operations ($): | | | | |
| Investment income (loss)—net | | (4,171) | | 286,638 |
| Net realized gain (loss) on investments | | (12,122,264) | | (9,780,616) |
| Net unrealized appreciation | | | | |
| (depreciation) on investments | | 27,320,459 | | 2,291,750 |
| Net Increase (Decrease) in Net Assets | | | | |
| Resulting from Operations | | 15,194,024 | | (7,202,228) |
| Dividends to Shareholders from ($): | | | | |
| Investment income—net | | (782,003) | | (453,630) |
| Net realized gain on investments | | (587,748) | | (23,143,887) |
| Total Dividends | | (1,369,751) | | (23,597,517) |
| Capital Stock Transactions ($): | | | | |
| Net proceeds from shares sold | | 93,035,556 | | 3,674,414 |
| Dividends reinvested | | 1,334,388 | | 22,962,164 |
| Cost of shares redeemed | | (11,976,435) | | (15,350,707) |
| Increase (Decrease) in Net Assets | | | | |
| from Capital Stock Transactions | | 82,393,509 | | 11,285,871 |
| Total Increase (Decrease) in Net Assets | | 96,217,782 | | (19,513,874) |
| Net Assets ($): | | | | |
| Beginning of Period | | 103,180,758 | | 122,694,632 |
| End of Period | | 199,398,540 | | 103,180,758 |
| Undistributed investment income—net | | — | | 780,706 |
| Capital Share Transactions (Shares): | | | | |
| Shares sold | | 5,204,180 | | 171,598 |
| Shares issued for dividends reinvested | | 107,960 | | 1,100,246 |
| Shares redeemed | | (766,662) | | (696,284) |
| Net Increase (Decrease) in Shares Outstanding | | 4,545,478 | | 575,560 |
| |
| See notes to financial statements. | | | | |
14
FINANCIAL HIGHLIGHTS
The following table describes the performance for the fiscal periods indicated. Total return shows how much your investment in the fund would have increased (or decreased) during each period, assuming you had reinvested all dividends and distributions.These figures have been derived from the fund’s financial statements.
| | | | | Year Ended August 31, | | |
| | |
| |
| |
|
| | | 2009 | | 2008 | | 2007 | | 2006 | | 2005 |
| |
| |
| |
| |
| |
|
| Per Share Data ($): | | | | | | | | | | |
| Net asset value, beginning of period | | 20.20 | | 27.07 | | 23.12 | | 27.31 | | 20.42 |
| Investment Operations: | | | | | | | | | | |
| Investment income (loss)—neta | | (.00)b | | .06 | | .08 | | (.11) | | (.17) |
| Net realized and unrealized | | | | | | | | | | |
| gain (loss) on investments | | .73 | | (1.52) | | 4.90 | | (1.69) | | 7.06 |
| Total from Investment Operations | | .73 | | (1.46) | | 4.98 | | (1.80) | | 6.89 |
| Distributions: | | | | | | | | | | |
| Dividends from investment income—net | | (.16) | | (.10) | | — | | — | | — |
| Dividends from net realized | | | | | | | | | | |
| gain on investments | | (.12) | | (5.31) | | (1.03) | | (2.39) | | — |
| Total Distributions | | (.28) | | (5.41) | | (1.03) | | (2.39) | | — |
| Net asset value, end of period | | 20.65 | | 20.20 | | 27.07 | | 23.12 | | 27.31 |
| Total Return (%) | | 4.50 | | (6.04) | | 21.83 | | (7.37) | | 33.74 |
| Ratios/Supplemental Data (%): | | | | | | | | | | |
| Ratio of total expenses | | | | | | | | | | |
| to average net assets | | 1.38 | | 1.23 | | 1.21 | | 1.19 | | 1.18 |
| Ratio of net expenses | | | | | | | | | | |
| to average net assets | | 1.37 | | 1.23c | | 1.21 | | 1.19 | | 1.18 |
| Ratio of net investment income | | | | | | | | | | |
| (loss) to average net assets | | (.00)d | | .26 | | .29 | | (.45) | | (.70) |
| Portfolio Turnover Rate | | 194.30 | | 175.45 | | 165.75 | | 170.59 | | 107.07 |
| Net Assets, end of period ($ x 1,000) | | 199,399 | | 103,181 | | 122,695 | | 136,298 | | 183,429 |
| a | | Based on average shares outstanding at each month end. |
| b | | Amount represents less than $.01 per share. |
| c | | Expense waivers and/or reimbursements amounted to less than .01%. |
| d | | Amount represents less than $.01%. |
| See notes to financial statements. |
The Fund 15
NOTES TO FINANCIAL STATEMENTS
NOTE 1—Significant Accounting Policies:
Dreyfus Small CompanyValue Fund (the “fund”) is a separate diversified series of Advantage Funds, Inc. (the “Company”), which is registered under the Investment Company Act of 1940, as amended (the “Act”), as an open-end management investment company and operates as a series company that offers ten series, including the fund. The fund’s investment objective is capital appreciation. The Dreyfus Corporation (the “Manager” or “Dreyfus”), a wholly-owned subsidiary of The Bank of New York Mellon Corporation (“BNY Mellon”), serves as the fund’s investment adviser. MBSC Securities Corporation (the “Distributor”), a wholly-owned subsidiary of the Manager, is the distributor of the fund’s shares, which are sold to existing shareholders without a sales charge.
The Company accounts separately for the assets, liabilities and operations of each series. Expenses directly attributable to each series are charged to that series’ operations; expenses which are applicable to all series are allocated among them on a pro rata basis.
The fund’s financial statements are prepared in accordance with U.S. generally accepted accounting principles, which may require the use of management estimates and assumptions. Actual results could differ from those estimates.
The fund enters into contracts that contain a variety of indemnifications. The fund’s maximum exposure under these arrangements is unknown.The fund does not anticipate recognizing any loss related to these arrangements.
(a) Portfolio valuation: Investments in securities are valued at the last sales price on the securities exchange or national securities market on which such securities are primarily traded. Securities listed on the National Market System for which market quotations are available are
16
valued at the official closing price or, if there is no official closing price that day, at the last sales price. Securities not listed on an exchange or the national securities market, or securities for which there were no transactions, are valued at the average of the most recent bid and asked prices, except for open short positions, where the asked price is used for valuation purposes. Bid price is used when no asked price is available. Registered investment companies that are not traded on an exchange are valued at their net asset value.When market quotations or official closing prices are not readily available, or are determined not to reflect accurately fair value, such as when the value of a security has been significantly affected by events after the close of the exchange or market on which the security is principally traded (for example, a foreign exchange or market), but before the fund calculates its net asset value, the fund may value these investments at fair value as determined in accordance with the procedures approved by the Board of Directors. Fair valuing of securities may be determined with the assistance of a pricing service using calculations based on indices of domestic securities and other appropriate indicators, such as prices of relevant American Depository Receipts and futures contracts. For other securities that are fair valued by the Board of Directors, certain factors may be considered such as: fundamental analytical data, the nature and duration of restrictions on disposition, an evaluation of the forces that influence the market in which the securities are purchased and sold and public trading in similar securities of the issuer or comparable issuers. Financial futures are valued at the last sales price.
The fund adopted Statement of Financial Accounting Standards No. 157 “FairValue Measurements” (“FAS 157”). FAS 157 establishes an authoritative definition of fair value, sets out a framework for measuring fair value, and requires additional disclosures about fair value measurements.
The Fund 17
NOTES TO FINANCIAL STATEMENTS (continued)
Various inputs are used in determining the value of the fund’s investments relating to FAS 157.These inputs are summarized in the three broad levels listed below.
Level 1—quoted prices in active markets for identical investments.
Level 2—other significant observable inputs (including quoted prices for similar investments, interest rates, prepayment speeds, credit risk, etc.).
Level 3—significant unobservable inputs (including the fund’s own assumptions in determining the fair value of investments).
The inputs or methodology used for valuing securities are not necessarily an indication of the risk associated with investing in those securities.
The following is a summary of the inputs used as of August 31, 2009 in valuing the fund’s investments:
| | | | | Level 2—Other | | Level 3— | | |
| | | Level 1— | | Significant | | Significant | | |
| | | Quoted | | Observable | | Unobservable | | |
| | | Prices | | Inputs | | Inputs | | Total |
| |
| |
| |
| |
|
| Assets ($) | | | | | | | | |
| Investments in Securities: | | | | | | |
| Equity Securities— | | | | | | | | |
| Domestic | | 194,278,996 | | — | | — | | 194,278,996 |
| Mutual Funds/ | | | | | | | | |
| Exchange | | | | | | | | |
| Traded Funds | | 43,981,578 | | — | | — | | 43,981,578 |
| Other Financial | | | | | | | | |
| Instruments† | | — | | — | | — | | — |
| Liabilities ($) | | | | | | | | |
| Other Financial | | | | | | | | |
| Instruments† | | — | | — | | — | | — |
| |
| † Other financial instruments include derivative instruments, such as futures, forward foreign currency |
| exchange contracts, swap contracts and options contracts. Amounts shown represent unrealized |
| appreciation (depreciation), or in the case of options, market value at period end. | | |
(b) Securities transactions and investment income: Securities transactions are recorded on a trade date basis. Realized gains and losses from securities transactions are recorded on the identified cost basis. Dividend income is recognized on the ex-dividend date and interest
18
income, including, where applicable, accretion of discount and amortization of premium on investments, is recognized on the accrual basis.
The fund has arrangements with the custodian and cash management bank whereby the fund may receive earnings credits when positive cash balances are maintained, which are used to offset custody and cash management fees. For financial reporting purposes, the fund includes net earnings credits as an expense offset in the Statement of Operations.
Pursuant to a securities lending agreement with The Bank of New York Mellon, a subsidiary of BNY Mellon and an affiliate of Dreyfus, the fund may lend securities to qualified institutions. It is the fund’s policy that, at origination, all loans are secured by collateral of at least 102% of the value of U.S. securities loaned and 105% of the value of foreign securities loaned. Collateral equivalent to at least 100% of the market value of securities on loan is maintained at all times. Collateral is either in the form of cash, which can be invested in certain money market mutual funds managed by the Manager, U.S. Government and Agency securities or letters of credit.The fund is entitled to receive all income on securities loaned, in addition to income earned as a result of the lending transaction. Although each security loaned is fully collateralized, the fund bears the risk of delay in recovery of, or loss of rights in, the securities loaned should a borrower fail to return the securities in a timely manner. During the period ended August 31, 2009, The Bank of New York Mellon earned $65,681, from lending fund portfolio securities, pursuant to the securities lending agreement.
(c) Affiliated issuers: Investments in other investment companies advised by the Manager are defined as “affiliated” in the Act.
(d) Dividends to shareholders: Dividends are recorded on the ex-dividend date. Dividends from investment income-net and dividends from net realized capital gains, if any, are normally declared and paid annually, but the fund may make distributions on a more frequent basis to comply with the distribution requirements of the Internal Revenue Code of 1986, as amended (the “Code”).To the extent that net realized
The Fund 19
| NOTES TO FINANCIAL STATEMENTS (continued) |
capital gains can be offset by capital loss carryovers, it is the policy of the fund not to distribute such gains. Income and capital gain distributions are determined in accordance with income tax regulations, which may differ from U.S. generally accepted accounting principles.
(e) Federal income taxes: It is the policy of the fund to continue to qualify as a regulated investment company, if such qualification is in the best interests of its shareholders, by complying with the applicable provisions of the Code, and to make distributions of taxable income sufficient to relieve it from substantially all federal income and excise taxes.
As of and during the period ended August 31, 2009, the fund did not have any liabilities for any uncertain tax positions.The fund recognizes interest and penalties, if any, related to uncertain tax positions as income tax expense in the Statement of Operations. During the period, the fund did not incur any interest or penalties.
Each of the tax years in the four-year period ended August 31, 2009 remains subject to examination by the Internal Revenue Service and state taxing authorities.
At August 31, 2009, the components of accumulated earnings on a tax basis were as follows: accumulated capital losses $19,969,058 and unrealized appreciation $27,049,924. In addition, the fund had $3,143,444 of capital losses realized after October 31, 2008, which were deferred for tax purposes to the first day of the following fiscal year.
The accumulated capital loss carryover is available for federal income tax purposes to be applied against future net securities profits, if any, realized subsequent to August 31, 2009. If not applied, the carryover expires in fiscal 2017.
The tax character of distributions paid to shareholders during the fiscal periods ended August 31, 2009 and August 31, 2008 were as follows: ordinary income $1,369,751 and $17,062,863 and long-term capital gains $0 and $6,534,654, respectively.
20
During the period ended August 31, 2009, as a result of permanent book to tax differences, primarily due to the tax treatment for net operating losses, the fund increased accumulated undistributed investment income-net by $5,468, increased accumulated net realized gain (loss) on investments by $929 and decreased paid-in-capital by $6,397. Net assets and net asset value per share were not affected by this reclassification.
NOTE 2—Bank Line of Credit:
The fund participates with other Dreyfus-managed funds in a $300 million unsecured line of credit provided by The Bank of New York Mellon (the “BNYM Facility”) primarily to be utilized for temporary or emergency purposes including the financing of redemptions.The terms of the BNYM Facility limit the amount of individual fund borrowings. Interest is charged to the fund based on prevailing market rates in effect at the time of borrowing. In connection therewith, the fund has agreed to pay commitment fees on its pro rata portion of the BNYM Facility.
The average amount of borrowings outstanding under the BNYM Facility during the period ended August 31, 2009, was approximately $4,100, with a related weighted average annualized interest rate of 1.09%.
NOTE 3—Management Fee and Other Transactions with Affiliates:
(a) Pursuant to a management agreement with the Manager, the management fee is computed at the annual rate of .75% of the value of the fund’s average daily net assets and is payable monthly.
(b) Under the Shareholder Services Plan, the fund pays the Distributor at an annual rate of .25% of the value of the fund’s average daily net assets for the provision of certain services.The services provided may include personal services relating to shareholder accounts, such as answering shareholder inquiries regarding the fund and providing
The Fund 21
| NOTES TO FINANCIAL STATEMENTS (continued) |
reports and other information, and services related to the maintenance of shareholder accounts. The Distributor may make payments to Service Agents (a securities dealer, financial institution or other industry professional) in respect of these services. The Distributor determines the amounts to be paid to Service Agents. During the period ended August 31, 2009, the fund was charged $240,833 pursuant to the Shareholder Services Plan.
The fund compensates DreyfusTransfer, Inc., a wholly-owned subsidiary of the Manager, under a transfer agency agreement for providing personnel and facilities to perform transfer agency services for the fund. During the period ended August 31, 2009, the fund was charged $59,890 pursuant to the transfer agency agreement.
The fund compensates The Bank of New York Mellon under a cash management agreement for performing cash management services related to fund subscriptions and redemptions. During the period ended August 31, 2009, the fund was charged $10,293 pursuant to the cash management agreement.These fees were offset by earnings credits pursuant to the cash management agreement.
The fund also compensates The Bank of New York Mellon under a custody agreement for providing custodial services for the fund. During the period ended August 31, 2009, the fund was charged $40,052 pursuant to the custody agreement.
During the period ended August 31, 2009, the fund was charged $6,097 for services performed by the Chief Compliance Officer.
The components of “Due to The Dreyfus Corporation and affiliates” in the Statement of Assets and Liabilities consist of: management fees $118,119, shareholder services plan fees $39,373, custodian fees $18,939, chief compliance officer fees $2,784 and transfer agency per account fees $20,758.
22
(c) Each Board member also serves as a Board member of other funds within the Dreyfus complex. Annual retainer fees and attendance fees are allocated to each fund based on net assets.
NOTE 4—Securities Transactions:
The aggregate amount of purchases and sales of investment securities, excluding short-term securities, during the period ended August 31, 2009, amounted to $277,471,690 and $195,178,213, respectively.
The fund adopted Statement of Financial Accounting Standards No. 161 “Disclosures about Derivative Instruments and Hedging Activities” (“FAS 161”). FAS 161 requires qualitative disclosures about objectives and strategies for using derivatives, quantitative disclosures about fair value amounts of gains and losses on derivative instruments and disclosures about credit-risk-related contingent features in derivative agreements. Since the fund held no derivatives during the period ended August 31, 2009, FAS 161 disclosures did not impact the notes to the financial statements.
At August 31, 2009, the cost of investments for federal income tax purposes was $211,210,650; accordingly, accumulated net unrealized appreciation on investments was $27,049,924, consisting of $32,379,760 gross unrealized appreciation and $5,329,836 gross unrealized depreciation.
NOTE 5—Subsequent Events Evaluation:
Dreyfus has evaluated the need for disclosures and/or adjustments resulting from subsequent events through October 26, 2009, the date the financial statements were issued. This evaluation did not result in any subsequent events that necessitated disclosures and/or adjustments.
The Fund 23
| REPORT OF INDEPENDENT REGISTERED |
| PUBLIC ACCOUNTING FIRM |
| Shareholders and Board of Directors |
| Dreyfus Small Company Value Fund |
We have audited the accompanying statement of assets and liabilities, including the statement of investments,of Dreyfus Small CompanyValue Fund, (one of the series comprising Advantage Funds, Inc.) as of August 31, 2009, and the related statement of operations for the year then ended, the statement of changes in net assets for each of the two years in the period then ended, and financial highlights for each of the years indicated therein.These financial statements and financial highlights are the responsibility of the Fund’s management. Our responsibility is to express an opinion on these financial statements and financial highlights based on our audits.
We conducted our audits in accordance with the standards of the Public Company Accounting Oversight Board (United States).Those standards require that we plan and perform the audit to obtain reasonable assurance about whether the financial statements and financial highlights are free of material misstatement.We were not engaged to perform an audit of the Fund’s internal control over financial reporting. Our audits included consideration of internal control over financial reporting as a basis for designing audit procedures that are appropriate in the circumstances, but not for the purpose of expressing an opinion on the effectiveness of the Fund’s internal control over financial reporting. Accordingly, we express no such opinion.An audit also includes examining, on a test basis, evidence supporting the amounts and disclosures in the financial statements and financial highlights, assessing the accounting principles used and significant estimates made by management, and evaluating the overall financial statement presentation. Our procedures included confirmation of securities owned as of August 31, 2009 by correspondence with the custodian and others.We believe that our audits provide a reasonable basis for our opinion.
In our opinion, the financial statements and financial highlights referred to above present fairly, in all material respects, the financial position of Dreyfus Small CompanyValue Fund at August 31, 2009, the results of its operations for the year then ended, the changes in its net assets for each of the two years in the period then ended, and the financial highlights for each of the indicated years, in conformity with U.S. generally accepted accounting principles.

| | New York, New York
October 26, 2009 |
24
IMPORTANT TAX INFORMATION (Unaudited)
For federal tax purposes, the fund hereby designates $.1180 per share as a short-term capital gain distribution of the $.2750 per share paid on December 3, 2008. Also the fund hereby designates 36.17% of the ordinary dividends paid during the fiscal year ended August 31, 2009 as qualifying for the corporate dividends received deduction. Also certain dividends paid by the fund may be subject to a maximum tax rate of 15%, as provided for by the Jobs and Growth Tax Relief Reconciliation Act of 2003. Of the distributions paid during the fiscal year, $2,226 represents the maximum amount that may be considered qualified dividend income. Shareholders will receive notification in early 2010 of the percentage applicable to the preparation of their 2009 income tax returns.
The Fund 25
| INFORMATION ABOUT THE REVIEW AND APPROVAL |
| OF THE FUND’S MANAGEMENT AGREEMENT (Unaudited) |
At a meeting of the fund’s Board held on March 3, 2009, the Board unanimously approved the continuation of the fund’s Management Agreement with Dreyfus for a one-year term ending March 30, 2010. The Board members, none of whom are “interested persons” (as defined in the Investment Company Act of 1940, as amended) of the fund were assisted in their review by independent legal counsel and met with counsel in executive session separate from representatives of Dreyfus. In approving the continuance of the Management Agreement, the Board considered all factors that they believed to be relevant, including, among other things, the factors discussed below.
Analysis of Nature, Extent and Quality of Services Provided to the Fund. The Board members received a presentation from representatives of Dreyfus regarding services provided to the fund and other funds in the Dreyfus fund complex, and discussed the nature, extent and quality of the services provided to the fund pursuant to its Management Agreement. Dreyfus’ representatives reviewed the fund’s distribution of accounts and the relationships Dreyfus has with various intermediaries and the different needs of each. Dreyfus’ representatives noted the various distribution channels for the fund as well as the diverse methods of distribution among other funds in the Dreyfus fund complex, and Dreyfus’ corresponding need for broad, deep, and diverse resources to be able to provide ongoing shareholder services to each distribution channel, including those of the fund. Dreyfus also provided the number of accounts investing in the fund, as well as the fund’s asset size.
The Board members also considered Dreyfus’ research and portfolio management capabilities and Dreyfus’ oversight of day-to-day fund operations, including fund accounting and administration and assistance in meeting legal and regulatory requirements. The Board members also considered Dreyfus’ extensive administrative, accounting and compliance infrastructure.The Board also considered Dreyfus’ brokerage policies and practices, the standards applied in seeking best execution and Dreyfus’ policies and practices regarding soft dollars.
26
Comparative Analysis of the Fund’s Performance and Management Fee and Expense Ratio. The Board members reviewed the fund’s performance and comparisons to a group of retail no-load small-cap core funds that are benchmarked against the Russell 2000 Value Index (the “Performance Group”) and to a larger universe of funds consisting of all retail and institutional small-cap core funds (the “Performance Universe”) selected and provided by Lipper, Inc., an independent provider of investment company data.The Board was provided with a description of the methodology Lipper used to select the Performance Group and Performance Universe, as well as the Expense Group and Expense Universe (discussed below). The Board members discussed the results of the comparisons and noted the fund’s average annual total return ranked in the first quartile of the Performance Group and Performance Universe for the one- and two-year periods ended December 31, 2008 and generally ranked in the second quartile of the Performance Group and Performance Universe for the three-, four-, five- and ten year periods ended December 31, 2008. Dreyfus also provided a comparison of the fund’s calendar year total returns to the returns of the fund’s benchmark index.
The Board members also discussed the fund’s contractual and actual management fees and expense ratio and reviewed the range of management fees and expense ratios as compared to a comparable group of funds (the “Expense Group”) and a broader group of funds (the “Expense Universe”), each selected and provided by Lipper.The fund’s contractual and actual management fees were lower than the Expense Group medians, the fund’s actual management fee was lower than the Expense Universe median and the fund’s expense ratio was lower than the Expense Group and Expense Universe medians.
Representatives of Dreyfus reviewed with the Board members the fees paid to Dreyfus or its affiliates by mutual funds and/or separate accounts managed by Dreyfus with similar investment objectives, policies and
The Fund 27
| INFORMATION ABOUT THE REVIEW AND APPROVAL OF THE |
| FUND’S MANAGEMENT AGREEMENT (Unaudited) (continued) |
strategies as the fund (the “Similar Accounts”), and explained the nature of the Similar Accounts and the differences, from Dreyfus’ perspective, as applicable, in providing services to the Similar Accounts as compared to the fund. Dreyfus’ representatives also reviewed the costs associated with distribution through intermediaries.The Board analyzed differences in fees paid to Dreyfus and discussed the relationship of the advisory fees paid in light of the services provided. The Board members considered the relevance of the fee information provided for the Similar Accounts to evaluate the appropriateness and reasonableness of the fund’s management fees.The Board acknowledged that differences in fees paid by the Similar Accounts seemed to be consistent with the services provided.
Analysis of Profitability and Economies of Scale. Dreyfus’ representatives reviewed the dollar amount of expenses allocated and profit received by Dreyfus and the method used to determine such expenses and profit. The Board previously had been provided with information prepared by an independent consulting firm regarding Dreyfus’ approach to allocating costs to, and determining the profitability of, individual funds and the entire Dreyfus mutual fund complex.The Board also was informed that the methodology had also been reviewed by an independent registered public accounting firm which, like the consultant, found the methodology to be reasonable.The consulting firm also analyzed where any economies of scale might emerge in connection with the management of the fund.The Board members evaluated the profitability analysis in light of the relevant circumstances for the fund and the extent to which economies of scale would be realized if the fund grows and whether fee levels reflect these economies of scale for the benefit of fund investors. The Board members also considered potential benefits to Dreyfus from acting as investment adviser and noted the soft dollar arrangements with respect to trading the fund’s investments.
It was noted that the Board members should consider Dreyfus’ profitability with respect to the fund as part of their evaluation of whether the fees under the Management Agreement bear a reasonable relationship to the mix of services provided by Dreyfus, including the nature,
28
extent and quality of such services, and that a discussion of economies of scale is predicated on a fund having achieved a substantial size with increasing assets and that, if a fund’s assets had been static or decreasing, the possibility that Dreyfus may have realized any economies of scale would be less. It also was noted that the profitability percentage for managing the fund was within the range determined by appropriate court cases to be reasonable given the services rendered and generally superior service levels provided.
At the conclusion of these discussions, the Board agreed that it had been furnished with sufficient information to make an informed business decision with respect to continuation of the fund’s Management Agreement. Based on the discussions and considerations as described above, the Board made the following conclusions and determinations.
- The Board concluded that the nature, extent and quality of the ser- vices provided by Dreyfus are adequate and appropriate.
- The Board was satisfied with the fund’s relative performance.
- The Board concluded that the fee paid by the fund to Dreyfus was reasonable in light of the considerations described above.
- The Board determined that the economies of scale which may accrue to Dreyfus and its affiliates in connection with the management of the fund had been adequately considered by Dreyfus in connection with the management fee rate charged to the fund and that, to the extent in the future it were determined that material economies of scale had not been shared with the fund, the Board would seek to have those economies of scale shared with the fund.
The Board members considered these conclusions and determinations, along with information received on a routine and regular basis throughout the year, and, without any one factor being dispositive, the Board determined that continuation of the fund’s Management Agreement was in the best interests of the fund and its shareholders.
The Fund 29
| BOARD MEMBERS INFORMATION (Unaudited) |
| |
| |
| |
| Joseph S. DiMartino (65) |
| Chairman of the Board (1995) |
| Principal Occupation During Past 5Years: |
| • Corporate Director and Trustee |
| Other Board Memberships and Affiliations: |
| • The Muscular Dystrophy Association, Director |
| • CBIZ (formerly, Century Business Services, Inc.), a provider of outsourcing functions for small |
| and medium size companies, Director |
| • The Newark Group, a provider of a national market of paper recovery facilities, paperboard |
| mills and paperboard converting plants, Director |
| • Sunair Services Corporation, a provider of certain outdoor-related services to homes and |
| businesses, Director |
| No. of Portfolios for which Board Member Serves: 166 |
| ——————— |
| Peggy C. Davis (66) |
| Board Member (2006) |
| Principal Occupation During Past 5Years: |
| • Shad Professor of Law, New York University School of Law (1983-present) |
| • Writer and teacher in the fields of evidence, constitutional theory, family law, social sciences |
| and the law, legal process and professional methodology and training |
| No. of Portfolios for which Board Member Serves: 53 |
| ——————— |
| David P. Feldman (69) |
| Board Member (1996) |
| Principal Occupation During Past 5Years: |
| • Corporate Director and Trustee |
| Other Board Memberships and Affiliations: |
| • BBH Mutual Funds Group (11 funds), Director |
| • The Jeffrey Company, a private investment company, Director |
| No. of Portfolios for which Board Member Serves: 46 |
| ——————— |
| James F. Henry (78) |
| Board Member (2006) |
| Principal Occupation During Past 5Years: |
| • Advisor to The Elaw Forum, a consultant on managing corporate legal costs |
| • Advisor to John Jay Homestead (the restored home of the first U.S. Chief Justice) |
| • Individual Trustee of several trusts |
| Other Board Memberships and Affiliations: |
| • Director, advisor and mediator involved in several non-profit organizations, primarily engaged |
| in domestic and international dispute resolution, and historic preservation |
| No. of Portfolios for which Board Member Serves: 31 |
30
| Ehud Houminer (69) |
| Board Member (1993) |
| Principal Occupation During Past 5Years: |
| • Executive-in-Residence at the Columbia Business School, Columbia University |
| |
| Other Board Memberships and Affiliations: |
| • Avnet Inc., an electronics distributor, Director |
| • International Advisory Board to the MBA Program School of Management, Ben Gurion |
| University, Chairman |
| |
| No. of Portfolios for which Board Member Serves: 58 |
| ——————— |
| Gloria Messinger (79) |
| Board Member (1993) |
| Principal Occupation During Past 5Years: |
| • Arbitrator for American Arbitration Association |
| • Arbitrator for FINRA (formerly, National Association of Securities Dealers, Inc.) |
| • Consultant in Intellectual Property |
| |
| Other Board Memberships and Affiliations: |
| • Theater for a New Audience, Inc., Director |
| • Brooklyn Philharmonic, Director |
| |
| No. of Portfolios for which Board Member Serves: 31 |
| ——————— |
| Dr. Martin Peretz (70) |
| Board Member (2006) |
| Principal Occupation During Past 5Years: |
| • Editor-in-Chief of The New Republic Magazine |
| • Director of TheStreet.com, a financial information service on the web |
| |
| Other Board Memberships and Affiliations: |
| • American Council of Trustees and Alumni, Director |
| • Pershing Square Capital Management, Advisor |
| • Montefiore Ventures, General Partner |
| • Harvard Center for Blood Research,Trustee |
| • Bard College,Trustee |
| • Board of Overseers of YIVO Institute for Jewish Research, Chairman |
| |
| No. of Portfolios for which Board Member Serves: 31 |
| |
| ——————— |
| Once elected all Board Members serve for an indefinite term, but achieve Emeritus status upon reaching age 80.The |
| address of the Board Members and Officers is in c/o The Dreyfus Corporation, 200 Park Avenue, NewYork, NewYork |
| 10166. Additional information about the Board Members is available in the fund’s Statement of Additional Information |
| which can be obtained from Dreyfus free of charge by calling this toll free number: 1-800-554-4611. |
| John M. Fraser, Jr., Emeritus Board Member |
| Rosalind G. Jacobs, Emeritus Board Member |
| Dr. Paul A. Marks, Emeritus Board Member |
The Fund 31
OFFICERS OF THE FUND (Unaudited)
J. DAVID OFFICER, President since December 2006.
Chairman, President and Chief Executive Officer of Founders Asset Management LLC, an affiliate of the Manager, and an officer of 75 investment companies (comprised of 166 portfolios) managed by the Manager. Prior to June 2009, Mr. Officer was Chief Operating Officer,Vice Chairman and a director of the Manager, where he had been employed since April 1998. He is 61 years old.
PHILLIP N. MAISANO, Executive Vice President since July 2007.
Chief Investment Officer,Vice Chair and a director of the Manager, and an officer of 75 investment companies (comprised of 166 portfolios) managed by the Manager. Mr. Maisano also is an officer and/or Board member of certain other investment management subsidiaries of The Bank of New York Mellon Corporation, each of which is an affiliate of the Manager. He is 62 years old and has been an employee of the Manager since November 2006. Prior to joining the Manager, Mr. Maisano served as Chairman and Chief Executive Officer of EACM Advisors, an affiliate of the Manager, since August 2004, and served as Chief Executive Officer of Evaluation Associates, a leading institutional investment consulting firm, from 1988 until 2004.
MICHAEL A. ROSENBERG, Vice President and Secretary since August 2005.
Assistant General Counsel of BNY Mellon, and an officer of 76 investment companies (comprised of 187 portfolios) managed by the Manager. He is 49 years old and has been an employee of the Manager since October 1991.
JAMES BITETTO, Vice President and Assistant Secretary since August 2005.
Senior Counsel of BNY Mellon and Secretary of the Manager, and an officer of 76 investment companies (comprised of 187 portfolios) managed by the Manager. He is 43 years old and has been an employee of the Manager since December 1996.
JONI LACKS CHARATAN, Vice President and Assistant Secretary since August 2005.
Senior Counsel of BNY Mellon, and an officer of 76 investment companies (comprised of 187 portfolios) managed by the Manager. She is 53 years old and has been an employee of the Manager since October 1988.
JOSEPH M. CHIOFFI, Vice President and Assistant Secretary since August 2005.
Senior Counsel of BNY Mellon, and an officer of 76 investment companies (comprised of 187 portfolios) managed by the Manager. He is 47 years old and has been an employee of the Manager since June 2000.
JANETTE E. FARRAGHER, Vice President and Assistant Secretary since August 2005.
Assistant General Counsel of BNY Mellon, and an officer of 76 investment companies (comprised of 187 portfolios) managed by the Manager. She is 46 years old and has been an employee of the Manager since February 1984.
JOHN B. HAMMALIAN, Vice President and Assistant Secretary since August 2005.
Managing Counsel of BNY Mellon, and an officer of 76 investment companies (comprised of 187 portfolios) managed by the Manager. He is 46 years old and has been an employee of the Manager since February 1991.
ROBERT R. MULLERY, Vice President and Assistant Secretary since August 2005.
Managing Counsel of BNY Mellon, and an officer of 76 investment companies (comprised of 187 portfolios) managed by the Manager. He is 57 years old and has been an employee of the Manager since May 1986.
JEFF PRUSNOFSKY, Vice President and Assistant Secretary since August 2005.
Managing Counsel of BNY Mellon, and an officer of 76 investment companies (comprised of 187 portfolios) managed by the Manager. He is 44 years old and has been an employee of the Manager since October 1990.
32
JAMES WINDELS, Treasurer since November 2001.
Director – Mutual Fund Accounting of the Manager, and an officer of 76 investment companies (comprised of 187 portfolios) managed by the Manager. He is 49 years old and has been an employee of the Manager since April 1985.
RICHARD CASSARO, Assistant Treasurer since January 2008.
Senior Accounting Manager – Money Market and Municipal Bond Funds of the Manager, and an officer of 76 investment companies (comprised of 187 portfolios) managed by the Manager. He is 50 years old and has been an employee of the Manager since September 1982.
GAVIN C. REILLY, Assistant Treasurer since December 2005.
Tax Manager of the Investment Accounting and Support Department of the Manager, and an officer of 76 investment companies (comprised of 187 portfolios) managed by the Manager. He is 41 years old and has been an employee of the Manager since April 1991.
ROBERT ROBOL, Assistant Treasurer since August 2005.
Senior Accounting Manager – Fixed Income Funds of the Manager, and an officer of 76 investment companies (comprised of 187 portfolios) managed by the Manager. He is 45 years old and has been an employee of the Manager since October 1988.
ROBERT SALVIOLO, Assistant Treasurer since July 2007.
Senior Accounting Manager – Equity Funds of the Manager, and an officer of 76 investment companies (comprised of 187 portfolios) managed by the Manager. He is 42 years old and has been an employee of the Manager since June 1989.
ROBERT SVAGNA, Assistant Treasurer since December 2002.
Senior Accounting Manager – Equity Funds of the Manager, and an officer of 76 investment companies (comprised of 187 portfolios) managed by the Manager. He is 42 years old and has been an employee of the Manager since November 1990.
JOSEPH W. CONNOLLY, Chief Compliance Officer since October 2004.
Chief Compliance Officer of the Manager and The Dreyfus Family of Funds (76 investment companies, comprised of 187 portfolios). From November 2001 through March 2004, Mr. Connolly was first Vice-President, Mutual Fund Servicing for Mellon Global Securities Services. In that capacity, Mr. Connolly was responsible for managing Mellon’s Custody, Fund Accounting and Fund Administration services to third-party mutual fund clients. He is 52 years old and has served in various capacities with the Manager since 1980, including manager of the firm’s Fund Accounting Department from 1997 through October 2001.
WILLIAM GERMENIS, Anti-Money Laundering Compliance Officer since October 2002.
Vice President and Anti-Money Laundering Compliance Officer of the Distributor, and the Anti-Money Laundering Compliance Officer of 72 investment companies (comprised of 183 portfolios) managed by the Manager. He is 38 years old and has been an employee of the Distributor since October 1998.
The Fund 33

Save time. Save paper. View your next shareholder report online as soon as it’s available. Log into www.dreyfus.com and sign up for Dreyfus eCommunications. It’s simple and only takes a few minutes.
The views expressed in this report reflect those of the portfolio manager only through the end of the period covered and do not necessarily represent the views of Dreyfus or any other person in the Dreyfus organization. Any such views are subject to change at any time based upon market or other conditions and Dreyfus disclaims any responsibility to update such views.These views may not be relied on as investment advice and, because investment decisions for a Dreyfus fund are based on numerous factors, may not be relied on as an indication of trading intent on behalf of any Dreyfus fund.
Not FDIC-Insured • Not Bank-Guaranteed • May Lose Value
| | Contents |
| |
| | THE FUND |
| |
| 2 | A Letter from the Chairman and CEO |
| |
| 3 | Discussion of Fund Performance |
| |
| 6 | Fund Performance |
| |
| 8 | Understanding Your Fund’s Expenses |
| |
| 8 | Comparing Your Fund’s Expenses With Those of Other Funds |
| |
| 9 | Statement of Investments |
| |
| 13 | Statement of Assets and Liabilities |
| |
| 14 | Statement of Operations |
| |
| 15 | Statement of Changes in Net Assets |
| |
| 18 | Financial Highlights |
| |
| 22 | Notes to Financial Statements |
| |
| 33 | Report of Independent Registered Public Accounting Firm |
| |
| 34 | Important Tax Information |
| |
| 35 | Information About the Review and Approval of the Fund’s Management Agreement |
| |
| 39 | Board Members Information |
| |
| 41 | Officers of the Fund |
| |
| | FOR MORE INFORMATION |
| |
| | Back Cover |
| |
Dreyfus
Strategic Value Fund |

A LETTER FROM THE CHAIRMAN AND CEO
Dear Shareholder:
We are pleased to present this annual report for Dreyfus StrategicValue Fund, covering the 12-month period from September 1, 2008, through August 31, 2009.
At long last, the current recession cycle appears to be winding down. After generally slumping since December 2007, we expect U.S. economic growth to pick up during the third quarter of 2009. Highly stimulative monetary and fiscal policies domestically and throughout the world, combined with the low cost of debt and equity capital compared to historical norms, already have sparked a rebound in industrial production as manufacturers replenish their depleted inventories. However, we continue to anticipate a slower-than-average recovery, with the unemployment rate likely to remain elevated over the next several quarters.
The U.S. stock market anticipated the economic upturn with a sustained market rally that began in early March 2009. Although the rebound initially was concentrated primarily among lower-quality stocks that had been severely punished in the downturn, it later broadened to include virtually all economic sectors and capitalization ranges. While we are encouraged by the market’s recent strength, we remain concerned that improving investor sentiment may have exceeded the revival of business fundamentals. Accordingly, we continue to believe that careful selectivity and risk management will be keys to success in the financial markets over the foreseeable future.As always, we urge you to speak with your financial adviser about the potential opportunities and obstacles in today’s investment environment.
For information about how the fund performed during the reporting period, as well as market perspectives, we have provided a Discussion of Fund Performance given by the Portfolio Manager.
Thank you for your continued confidence and support.

Jonathan R. Baum
Chairman and Chief Executive Officer
The Dreyfus Corporation
September 15, 2009 |
2

DISCUSSION OF FUND PERFORMANCE
For the reporting period of September 1, 2008, through August 31, 2009, as provided by Brian Ferguson, Portfolio Manager
Fund and Market Performance Overview
For the 12-month period ended August 31, 2009, Dreyfus Strategic Value Fund’s Class A shares produced a total return of –16.14%, Class B shares produced a total return of –16.98%, Class C shares produced a total return of –16.83% and Class I shares produced a total return of –16.06%.1 The fund’s benchmark, the Russell 1000 Value Index, produced a total return of –20.27% for the same period.2
Despite a severe recession and banking crisis over much of the reporting period, stocks rallied over the spring and summer of 2009, offsetting a substantial portion of earlier losses. The fund fared relatively well in this turbulent environment, as our security selection strategy produced particularly strong relative results in the industrials, health care and financials sectors.
The Fund’s Investment Approach
The fund seeks capital appreciation.To pursue this goal, we invest at least 80% of the fund’s assets in stocks, including common stocks, preferred stocks and convertible securities.The fund may invest up to 30% of its assets in foreign issuers.When selecting stocks for the fund, we utilize a “bottom-up” approach in which we focus on individual stock selection rather than attempting to forecast market trends. Our investment approach is value-oriented and research-driven.When selecting stocks, we identify potential investments through extensive quantitative and fundamental research with a focus on value, sound business fundamentals and positive business momentum.
Equity Markets Plunged, Then Rebounded Sharply
The U.S. stock market endured a year of extreme volatility. Just weeks after the start of the reporting period, the failure of several major financial institutions nearly led to the collapse of the worldwide banking system. Meanwhile, rising unemployment, plunging housing prices
The Fund 3
| DISCUSSION OF FUND PERFORMANCE (continued) |
and depressed consumer confidence exacerbated the longest and most severe economic downturn since the 1930s.These influences fueled a bear market that drove stock market averages to multi-year lows.The decline was broad-based, affecting industry groups and individual stocks seemingly regardless of their underlying business fundamentals.
However, market sentiment suddenly began to improve in early March, as aggressive measures adopted by government and monetary authorities appeared to have averted a collapse of the banking system. Additional evidence of economic stabilization later appeared, sparking a sustained market rally that lasted through the reporting period’s end.
Stock Selection Strategy Drove Fund Performance
Although investor behavior during the downturn was motivated more by fear of losses than the strengths and weaknesses of individual companies, our value-oriented stock selection strategy proved relatively effective, helping the fund cushion market declines to a degree. Our process continued to work well during the rally over the spring and summer of 2009, when investors’ appetite for risk returned.The fund’s relative performance was especially robust in the industrials, health care and financials sectors.
In the economically sensitive industrials sector, an underweighted position in General Electric helped the fund avoid relative weakness in a major component of the benchmark. We had avoided General Electric due to credit-related problems affecting its financial unit and recession-related concerns in its industrial divisions, which historically have tended to do better later in the economic cycle.
Among health care companies, the fund received strong contributions to performance from drug developerWyeth, which received an acquisition offer from Pfizer in January 2009. We sold the fund’s position in Wyeth after its stock responded positively, and we redeployed those assets to less defensive stocks that participated more fully in the subsequent market rally.
In the battered financial services sector, we successfully avoided most of the credit crisis’s more severely damaged financial institutions in favor of healthier companies, such as Northern Trust and JPMorgan Chase & Co. However, as investors’ appetite for risk increased in 2009, we estab-
4
lished positions in some of the more beaten-down financial stocks, such as Bank of America and State Street.These opportunistic trades proved well-timed, as these stocks rebounded sharply after it was reported in the spring that major U.S. banks had passed government-ordered stress tests.
Disappointments during the reporting period included the energy sector, where an underweighted position in the traditionally defensive stock of ExxonMobil hindered relative performance during the downturn. In the utilities sector, our bias toward unregulated electricity producers, which are considered less defensive than their regulated counterparts, also dampened the fund’s relative results in the bear market. In addition, natural gas specialist Questar suffered when natural gas prices remained stubbornly low.
Positioned for an Economic Recovery
As of the reporting period’s end, the U.S. economy appears to be gaining strength gradually, and investors have been refocusing on fundamentals. In our judgment, these developments could lead to an investment environment that is especially well suited to our stock selection process. Despite the sustained market rally, we have continued to seek attractively valued opportunities in companies that appear poised to prosper during an economic rebound.We have found what we believe to be a number of potential opportunities meeting our value-oriented investment criteria in the technology, financials and health care sectors, but fewer in the telecommunications sector.
September 15, 2009
| | | Please note, the position in any security highlighted with italicized typeface was sold during the |
| | | reporting period. |
| 1 | | Total return includes reinvestment of dividends and any capital gains paid and does not take into |
| | | consideration the maximum initial sales charges in the case of Class A shares, or the applicable |
| | | contingent deferred sales charges imposed on redemptions in the case of Class B and Class C |
| | | shares. Had these charges been reflected, returns would have been lower. Past performance is no |
| | | guarantee of future results. Share price and investment return fluctuate such that upon redemption, |
| | | portfolio shares may be worth more or less than their original cost. |
| 2 | | SOURCE: LIPPER INC. — Reflects the reinvestment of net dividends and, where applicable, |
| | | capital gain distributions.The Russell 1000 Value Index is an unmanaged index which measures |
| | | the performance of those Russell 1000 companies with lower price-to-book ratios and lower |
| | | forecasted growth values. |
The Fund 5
FUND PERFORMANCE
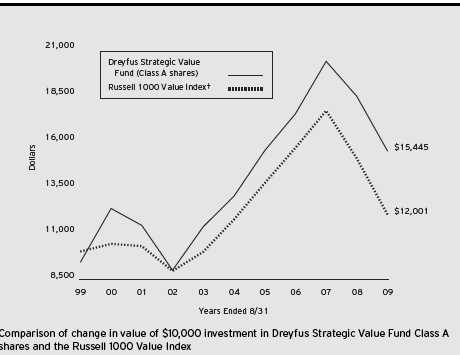
† Source: Lipper Inc.
Past performance is not predictive of future performance.
The above graph compares a $10,000 investment made in Class A shares of Dreyfus Strategic Value Fund on 8/31/99 to a $10,000 investment made in the Russell 1000 Value Index (the “Index”) on that date. Performance for Class B, Class C and Class I shares will vary from the performance of Class A shares shown above due to the differences in charges and expenses. All dividends and capital gain distributions are reinvested.
The fund’s performance shown in the line graph takes into account the maximum initial sales charge on Class A shares and all other applicable fees and expenses.The Index uses company price-to-book ratios and long-term growth rates to calculate a composite ranking, which is used to determine if a stock is “growth” or “value.” Unlike a mutual fund, the Index is not subject to charges, fees and other expenses. Investors cannot invest directly in any index. Further information relating to fund performance, including expense reimbursements, if applicable, is contained in the Financial Highlights section of the prospectus and elsewhere in this report.
6
| Average Annual Total Returns as of 8/31/09 | | | | | | |
| |
| | | Inception | | | | | | |
| | | Date | | 1 Year | | 5 Years | | 10 Years |
| |
| |
| |
| |
|
| Class A shares | | | | | | | | |
| with maximum sales charge (5.75%) | | 9/29/05 | | –20.95% | | 2.28% | | 4.44% |
| without sales charge | | 9/29/05 | | –16.14% | | 3.50% | | 5.06% |
| Class B shares | | | | | | | | |
| with applicable redemption charge † | | 5/31/01 | | –20.29% | | 2.32% | | 4.76%†††,†††† |
| without redemption | | 5/31/01 | | –16.98% | | 2.65% | | 4.76%†††,†††† |
| Class C shares | | | | | | | | |
| with applicable redemption charge †† | | 5/31/01 | | –17.66% | | 2.72% | | 4.45%††† |
| without redemption | | 5/31/01 | | –16.83% | | 2.72% | | 4.45%††† |
| Class I shares | | 5/31/01 | | –16.06% | | 3.68% | | 5.14%††† |
| Past performance is not predictive of future performance.The fund’s performance shown in the graph and table does not |
| reflect the deduction of taxes that a shareholder would pay on fund distributions or the redemption of fund shares. |
| † | | The maximum contingent deferred sales charge for Class B shares is 4%. After six years Class B shares convert to |
| | | Class A shares. |
| †† | | The maximum contingent deferred sales charge for Class C shares is 1% for shares redeemed within one year of |
| | | the date of purchase. |
| ††† | | The total return performance figures presented for Class B, C and I shares of the fund represent the performance of |
| | | the fund’s Class A shares for periods prior to May 31, 2001 (the inception date for Class B, C and I shares), |
| | | adjusted to reflect the applicable sales load for that class. |
| †††† | | Assumes the conversion of Class B shares to Class A shares at the end of the sixth year following the date |
| | | of purchase. |
The Fund 7
UNDERSTANDING YOUR FUND’S EXPENSES (Unaudited)
As a mutual fund investor, you pay ongoing expenses, such as management fees and other expenses. Using the information below, you can estimate how these expenses affect your investment and compare them with the expenses of other funds.You also may pay one-time transaction expenses, including sales charges (loads) and redemption fees, which are not shown in this section and would have resulted in higher total expenses. For more information, see your fund’s prospectus or talk to your financial adviser.
Review your fund’s expenses
The table below shows the expenses you would have paid on a $1,000 investment in Dreyfus Strategic Value Fund from March 1, 2009 to August 31, 2009. It also shows how much a $1,000 investment would be worth at the close of the period, assuming actual returns and expenses.
| Expenses and Value of a $1,000 Investment | | | | | | |
| assuming actual returns for the six months ended August 31, 2009 | | | | |
| | | Class A | | Class B | | Class C | | Class I |
| |
| |
| |
| |
|
| Expenses paid per $1,000† | | $ 8.02 | | $ 14.01 | | $ 12.61 | | $ 7.52 |
| Ending value (after expenses) | | $1,446.10 | | $1,438.70 | | $1,440.00 | | $1,446.70 |
| COMPARING YOUR FUND’S EXPENSES |
| WITH THOSE OF OTHER FUNDS (Unaudited) |
Using the SEC’s method to compare expenses
The Securities and Exchange Commission (SEC) has established guidelines to help investors assess fund expenses. Per these guidelines, the table below shows your fund’s expenses based on a $1,000 investment, assuming a hypothetical 5% annualized return. You can use this information to compare the ongoing expenses (but not transaction expenses or total cost) of investing in the fund with those of other funds.All mutual fund shareholder reports will provide this information to help you make this comparison. Please note that you cannot use this information to estimate your actual ending account balance and expenses paid during the period.
| Expenses and Value of a $1,000 Investment | | | | | | |
| assuming a hypothetical 5% annualized return for the six months ended August 31, 2009 |
| | | Class A | | Class B | | Class C | | Class I |
| |
| |
| |
| |
|
| Expenses paid per $1,000† | | $ 6.61 | | $ 11.57 | | $ 10.41 | | $ 6.21 |
| Ending value (after expenses) | | $1,018.65 | | $1,013.71 | | $1,014.87 | | $1,019.06 |
† Expenses are equal to the fund’s annualized expense ratio of 1.30% for Class A, 2.28% for Class B, 2.05% for Class C and 1.22% for Class I, multiplied by the average account value over the period, multiplied by 184/365 (to reflect the one-half year period).
8
| STATEMENT OF INVESTMENTS |
| August 31, 2009 |
| Common Stocks—99.9% | | Shares | | Value ($) |
| |
| |
|
| Consumer Discretionary—9.8% | | | | |
| Carnival | | 191,590 | | 5,604,007 |
| Home Depot | | 419,770 | | 11,455,523 |
| Interpublic Group of Cos. | | 677,248 a,b | | 4,259,890 |
| Johnson Controls | | 166,010 a | | 4,112,068 |
| Lowe’s Cos. | | 132,780 | | 2,854,770 |
| News, Cl. A | | 501,110 | | 5,371,899 |
| Nordstrom | | 138,670 a | | 3,888,307 |
| NVR | | 8,050 a,b | | 5,435,762 |
| Omnicom Group | | 219,520 | | 7,972,966 |
| Time Warner | | 262,730 | | 7,332,794 |
| | | | | 58,287,986 |
| Consumer Staples—9.3% | | | | |
| Coca-Cola Enterprises | | 370,300 | | 7,483,763 |
| CVS Caremark | | 448,890 | | 16,842,353 |
| Kellogg | | 123,920 a | | 5,835,393 |
| Kraft Foods, Cl. A | | 176,396 | | 5,000,827 |
| PepsiCo | | 195,120 | | 11,057,450 |
| Philip Morris International | | 61,550 | | 2,813,450 |
| Walgreen | | 174,420 | | 5,909,350 |
| | | | | 54,942,586 |
| Energy—16.2% | | | | |
| Cameron International | | 171,496 b | | 6,124,122 |
| Chevron | | 347,020 | | 24,270,579 |
| Devon Energy | | 161,700 | | 9,925,146 |
| EOG Resources | | 76,090 | | 5,478,480 |
| Hess | | 124,030 | | 6,274,678 |
| Marathon Oil | | 270,510 | | 8,350,644 |
| Occidental Petroleum | | 373,620 | | 27,311,622 |
| XTO Energy | | 210,705 | | 8,133,213 |
| | | | | 95,868,484 |
| Exchange Traded Funds—.8% | | | | |
| iShares Russell 1000 Value Index Fund | | 83,170 | | 4,467,892 |
| Financial—26.1% | | | | |
| American Express | | 91,400 | | 3,091,148 |
| Ameriprise Financial | | 153,600 | | 4,612,608 |
| AON | | 184,940 | | 7,723,094 |
| Bank of America | | 1,074,240 | | 18,895,882 |
The Fund 9
| STATEMENT OF INVESTMENTS (continued) |
| Common Stocks (continued) | | Shares | | Value ($) |
| |
| |
|
| Financial (continued) | | | | |
| Capital One Financial | | 51,120 a | | 1,906,265 |
| Citigroup | | 1,308,940 | | 6,544,700 |
| Fidelity National Financial, Cl. A | | 162,090 | | 2,434,592 |
| First American | | 52,400 | | 1,651,648 |
| Franklin Resources | | 46,540 a | | 4,343,578 |
| Goldman Sachs Group | | 86,130 | | 14,251,070 |
| JPMorgan Chase & Co. | | 687,908 | | 29,896,482 |
| Marsh & McLennan Cos. | | 147,740 | | 3,477,800 |
| MetLife | | 262,549 | | 9,913,848 |
| Moody’s | | 119,192 a | | 3,246,790 |
| Morgan Stanley | | 317,490 | | 9,194,510 |
| Prudential Financial | | 64,760 | | 3,275,561 |
| State Street | | 114,690 | | 6,018,931 |
| TD Ameritrade Holding | | 199,470 b | | 3,837,803 |
| Travelers Cos. | | 142,330 | | 7,176,279 |
| Wells Fargo & Co. | | 480,420 | | 13,221,158 |
| | | | | 154,713,747 |
| Health Care—11.3% | | | | |
| Aetna | | 107,390 | | 3,060,615 |
| AmerisourceBergen | | 400,600 a | | 8,536,786 |
| Amgen | | 107,290 b | | 6,409,505 |
| Boston Scientific | | 270,940 b | | 3,183,545 |
| DaVita | | 56,540 a,b | | 2,923,683 |
| Life Technologies | | 50,520 b | | 2,249,656 |
| McKesson | | 53,590 | | 3,047,127 |
| Merck & Co. | | 229,510 a | | 7,443,009 |
| Pfizer | | 1,134,940 | | 18,953,498 |
| St. Jude Medical | | 130,070 b | | 5,012,898 |
| WellPoint | | 66,640 b | | 3,521,924 |
| Zimmer Holdings | | 60,530 b | | 2,866,096 |
| | | | | 67,208,342 |
| Industrials—5.4% | | | | |
| Delta Air Lines | | 280,700 a,b | | 2,026,654 |
| Dover | | 113,860 | | 3,938,417 |
| Eaton | | 55,220 a | | 2,979,119 |
| Honeywell International | | 87,360 | | 3,211,354 |
10
| Common Stocks (continued) | | Shares | | Value ($) |
| |
| |
|
| Industrials (continued) | | | | |
| Norfolk Southern | | 62,340 | | 2,859,536 |
| Paccar | | 159,310 a | | 5,762,243 |
| Raytheon | | 58,570 a | | 2,763,333 |
| Union Pacific | | 145,870 a | | 8,724,485 |
| | | | | 32,265,141 |
| Information Technology—10.8% | | | | |
| Apple | | 18,030 b | | 3,032,826 |
| Cisco Systems | | 593,240 b | | 12,813,984 |
| EMC | | 193,920 b | | 3,083,328 |
| Hewlett-Packard | | 296,870 | | 13,326,494 |
| Intel | | 153,020 | | 3,109,366 |
| Microsoft | | 479,560 | | 11,821,154 |
| Sybase | | 87,370 a,b | | 3,044,845 |
| Symantec | | 161,880 b | | 2,447,626 |
| Texas Instruments | | 236,560 a | | 5,817,010 |
| Viacom, Cl. B | | 116,280 b | | 2,911,651 |
| Western Union | | 152,140 | | 2,744,606 |
| | | | | 64,152,890 |
| Materials—4.2% | | | | |
| Air Products & Chemicals | | 39,770 | | 2,983,943 |
| Celanese, Ser. A | | 111,200 | | 2,832,264 |
| Dow Chemical | | 136,820 a | | 2,912,898 |
| Freeport-McMoRan Copper & Gold | | 96,260 a | | 6,062,455 |
| International Paper | | 274,800 | | 6,306,660 |
| Newmont Mining | | 26,790 | | 1,076,690 |
| Packaging Corp. of America | | 144,547 a | | 2,942,977 |
| | | | | 25,117,887 |
| Utilities—6.0% | | | | |
| Entergy | | 128,800 | | 10,175,200 |
| Exelon | | 78,100 | | 3,906,562 |
| FPL Group | | 158,930 | | 8,928,687 |
| NRG Energy | | 199,960 a,b | | 5,368,926 |
| Questar | | 206,450 a | | 6,969,752 |
| | | | | 35,349,127 |
| Total Common Stocks | | | | |
| (cost $537,991,482) | | | | 592,374,082 |
The Fund 11
| STATEMENT OF INVESTMENTS (continued) |
| Investment of Cash Collateral | | | | |
| for Securities Loaned—7.8% | | Shares | | Value ($) |
| |
| |
|
| Registered Investment Company; | | | | |
| Dreyfus Institutional Cash Advantage Fund | | | | |
| (cost $46,370,507) | | 46,370,507 c | | 46,370,507 |
| Total Investments (cost $584,361,989) | | 107.7% | | 638,744,589 |
| Liabilities, Less Cash and Receivables | | (7.7%) | | (45,917,688) |
| Net Assets | | 100.0% | | 592,826,901 |
| a All or a portion of these securities are on loan. At August 31, 2009, the total market value of the fund’s securities on |
| loan is $44,623,370 and the total market value of the collateral held by the fund is $46,370,507. |
| b Non-income producing security. |
| c Investment in affiliated money market mutual fund. |
| Portfolio Summary (Unaudited)† | | | | |
| |
| | | Value (%) | | | | Value (%) |
| |
| |
| |
|
| Financial | | 26.1 | | Money Market Investment | | 7.8 |
| Energy | | 16.2 | | Utilities | | 6.0 |
| Health Care | | 11.3 | | Industrials | | 5.4 |
| Information Technology | | 10.8 | | Materials | | 4.2 |
| Consumer Discretionary | | 9.8 | | Exchange Traded Funds | | .8 |
| Consumer Staples | | 9.3 | | | | 107.7 |
| |
| † Based on net assets. | | | | | | |
| See notes to financial statements. | | | | | | |
12
| STATEMENT OF ASSETS AND LIABILITIES |
| August 31, 2009 |
| | | | | | | Cost | | Value |
| |
| |
| |
| |
|
| Assets ($): | | | | | | | | |
| Investments in securities—See Statement of Investments (including | | | | |
| securities on loan, valued at $44,623,370)—Note 1(b): | | | | |
| Unaffiliated issuers | | | | | | 537,991,482 | | 592,374,082 |
| Affiliated issuers | | | | | | 46,370,507 | | 46,370,507 |
| Cash | | | | | | | | 324,473 |
| Receivable for investment securities sold | | | | | | 9,471,658 |
| Dividends and interest receivable | | | | | | | | 1,183,327 |
| Receivable for shares of Common Stock subscribed | | | | | | 998,806 |
| Prepaid expenses | | | | | | | | 35,885 |
| | | | | | | | | 650,758,738 |
| Liabilities ($): | | | | | | | | |
| Due to The Dreyfus Corporation and affiliates—Note 3(c) | | | | | | 693,342 |
| Liability for securities on loan—Note 1(b) | | | | | | 46,370,507 |
| Payable for investment securities purchased | | | | | | 8,139,064 |
| Payable for shares of Common Stock redeemed | | | | | | 1,537,359 |
| Loan payable—Note 2 | | | | | | | | 925,000 |
| Interest payable—Note 2 | | | | | | | | 216 |
| Accrued expenses | | | | | | | | 266,349 |
| | | | | | | | | 57,931,837 |
| Net Assets ($) | | | | | | | | 592,826,901 |
| Composition of Net Assets ($): | | | | | | | | |
| Paid-in capital | | | | | | | | 718,451,293 |
| Accumulated undistributed investment income—net | | | | | | 2,728,283 |
| Accumulated net realized gain (loss) on investments | | | | | | (182,735,275) |
| Accumulated net unrealized appreciation | | | | | | |
| (depreciation) on investments | | | | | | | | 54,382,600 |
| Net Assets ($) | | | | | | | | 592,826,901 |
| |
| |
| |
| |
|
| |
| |
| Net Asset Value Per Share | | | | | | | | |
| | | Class A | | Class B | | Class C | | Class I |
| |
| |
| |
| |
|
| Net Assets ($) | | 505,408,577 | | 7,849,631 | | 43,592,970 | | 35,975,723 |
| Shares Outstanding | | 21,510,914 | | 348,377 | | 1,941,658 | | 1,532,130 |
| Net Asset Value Per Share ($) | | 23.50 | | 22.53 | | 22.45 | | 23.48 |
| |
| See notes to financial statements. | | | | | | | | |
The Fund 13
| STATEMENT OF OPERATIONS |
| Year Ended August 31, 2009 |
| Investment Income ($): | | |
| Income: | | |
| Cash dividends (net of $35,267 foreign taxes withheld at source): | | |
| Unaffiliated issuers | | 11,883,589 |
| Affiliated issuers | | 42,190 |
| Income from securities lending | | 184,789 |
| Total Income | | 12,110,568 |
| Expenses: | | |
| Management fee—Note 3(a) | | 3,849,475 |
| Shareholder servicing costs—Note 3(c) | | 2,261,803 |
| Distribution fees—Note 3(b) | | 372,370 |
| Registration fees | | 100,149 |
| Professional fees | | 62,136 |
| Custodian fees—Note 3(c) | | 58,817 |
| Prospectus and shareholders’ reports | | 51,708 |
| Directors’ fees and expenses—Note 3(d) | | 47,970 |
| Loan commitment fees—Note 2 | | 17,912 |
| Interest expense—Note 2 | | 558 |
| Miscellaneous | | 35,097 |
| Total Expenses | | 6,857,995 |
| Less—reduction in fees due to earnings credits—Note 1(b) | | (45,562) |
| Net Expenses | | 6,812,433 |
| Investment Income—Net | | 5,298,135 |
| Realized and Unrealized Gain (Loss) on Investments—Note 4 ($): | | |
| Net realized gain (loss) on investments | | (165,334,243) |
| Net realized gain (loss) on financial futures | | 2,240,972 |
| Net Realized Gain (Loss) | | (163,093,271) |
| Net unrealized appreciation (depreciation) on investments | | 44,695,796 |
| Net Realized and Unrealized Gain (Loss) on Investments | | (118,397,475) |
| Net (Decrease) in Net Assets Resulting from Operations | | (113,099,340) |
| |
| See notes to financial statements. | | |
14
STATEMENT OF CHANGES IN NET ASSETS
| | | Year Ended August 31, |
| | |
|
| | | 2009a | | 2008 |
| |
| |
|
| Operations ($): | | | | |
| Investment income—net | | 5,298,135 | | 4,635,366 |
| Net realized gain (loss) on investments | | (163,093,271) | | (2,882,344) |
| Net unrealized appreciation | | | | |
| (depreciation) on investments | | 44,695,796 | | (65,639,784) |
| Net Increase (Decrease) in Net Assets | | | | |
| Resulting from Operations | | (113,099,340) | | (63,886,762) |
| Dividends to Shareholders from ($): | | | | |
| Investment income—net: | | | | |
| Class A Shares | | (5,059,514) | | (4,059,835) |
| Class B Shares | | (30,917) | | — |
| Class C Shares | | (237,232) | | (95,573) |
| Class I Shares | | (485,620) | | (76,399) |
| Class T Shares | | (200,387) | | (66,346) |
| Net realized gain on investments: | | | | |
| Class A Shares | | — | | (27,262,631) |
| Class B Shares | | — | | (936,865) |
| Class C Shares | | — | | (2,055,141) |
| Class I Shares | | — | | (437,760) |
| Class T Shares | | — | | (554,467) |
| Total Dividends | | (6,013,670) | | (35,545,017) |
| Capital Stock Transactions ($): | | | | |
| Net proceeds from shares sold: | | | | |
| Class A Shares | | 195,731,957 | | 266,794,015 |
| Class B Shares | | 478,667 | | 2,779,578 |
| Class C Shares | | 10,035,003 | | 22,170,542 |
| Class I Shares | | 14,561,982 | | 43,404,104 |
| Class T Shares | | 1,714,969 | | 3,604,844 |
| Net assets received in connection with | | | | |
| reorganization | | — | | 82,231,594 |
The Fund 15
STATEMENT OF CHANGES IN NET ASSETS (continued)
| | | Year Ended August 31, |
| | |
|
| | | 2009a | | 2008 |
| |
| |
|
| Capital Stock Transactions ($) (continued): | | | | |
| Dividends reinvested: | | | | |
| Class A Shares | | 4,691,827 | | 29,377,509 |
| Class B Shares | | 28,004 | | 826,362 |
| Class C Shares | | 184,946 | | 1,651,475 |
| Class I Shares | | 470,691 | | 498,353 |
| Class T Shares | | 186,431 | | 602,273 |
| Cost of shares redeemed: | | | | |
| Class A Shares | | (139,790,809) | | (126,125,781) |
| Class B Shares | | (5,665,029) | | (7,621,773) |
| Class C Shares | | (10,277,550) | | (6,532,679) |
| Class I Shares | | (42,703,298) | | (4,727,098) |
| Class T Shares | | (18,349,014) | | (4,848,371) |
| Increase (Decrease) in Net Assets from | | | | |
| Capital Stock Transactions | | 11,298,777 | | 304,084,947 |
| Total Increase (Decrease) in Net Assets | | (107,814,233) | | 204,653,168 |
| Net Assets ($): | | | | |
| Beginning of Period | | 700,641,134 | | 495,987,966 |
| End of Period | | 592,826,901 | | 700,641,134 |
| Undistributed investment income—net | | 2,728,283 | | 3,443,818 |
16
| | | Year Ended August 31, |
| | |
|
| | | 2009a | | 2008 |
| |
| |
|
| Capital Share Transactions: | | | | |
| Class Ab,c | | | | |
| Shares sold | | 9,739,957 | | 8,458,306 |
| Shares issued in connection with reorganization | | — | | 374,960 |
| Shares issued for dividends reinvested | | 255,833 | | 935,005 |
| Shares redeemed | | (7,019,687) | | (4,155,997) |
| Net Increase (Decrease) in Shares Outstanding | | 2,976,103 | | 5,612,274 |
| Class Bb | | | | |
| Shares sold | | 23,866 | | 110,674 |
| Shares issued in connection with reorganization | | — | | 208,909 |
| Shares issued for dividends reinvested | | 1,580 | | 27,256 |
| Shares redeemed | | (282,304) | | (257,114) |
| Net Increase (Decrease) in Shares Outstanding | | (256,858) | | 89,725 |
| Class C | | | | |
| Shares sold | | 509,237 | | 805,986 |
| Shares issued in connection with reorganization | | — | | 382,456 |
| Shares issued for dividends reinvested | | 10,490 | | 54,649 |
| Shares redeemed | | (530,923) | | (223,742) |
| Net Increase (Decrease) in Shares Outstanding | | (11,196) | | 1,019,349 |
| Class I | | | | |
| Shares sold | | 724,225 | | 1,192,785 |
| Shares issued in connection with reorganization | | — | | 1,525,493 |
| Shares issued for dividends reinvested | | 25,693 | | 15,866 |
| Shares redeemed | | (2,014,948) | | (151,383) |
| Net Increase (Decrease) in Shares Outstanding | | (1,265,030) | | 2,582,761 |
| Class Tc | | | | |
| Shares sold | | 85,052 | | 339,892 |
| Shares issued in connection with reorganization | | — | | 447,210 |
| Shares issued for dividends reinvested | | 10,468 | | 19,708 |
| Shares redeemed | | (994,529) | | (165,433) |
| Net Increase (Decrease) in Shares Outstanding | | (899,009) | | 641,377 |
| a | | Effective as of the close of business on February 4, 2009, the fund no longer offers Class T shares. |
| b | | During the period ended August 31, 2009, 88,682 Class B shares representing $1,823,745 were automatically |
| | | converted to 85,257 Class A shares and during the period ended August 31, 2008, 115,340 Class B shares |
| | | representing $3,426,072 were automatically converted to 110,847 Class A shares. |
| c | | On the close of business on February 4, 2009, 755,477 Class T shares representing $13,439,931 were converted |
| | | to 732,821 Class A shares. |
| See notes to financial statements. |
The Fund 17
FINANCIAL HIGHLIGHTS
The following tables describe the performance for each share class for the fiscal periods indicated.All information (except portfolio turnover rate) reflects financial results for a single fund share.Total return shows how much your investment in the fund would have increased (or decreased) during each period, assuming you had reinvested all dividends and distributions.These figures have been derived from the fund’s financial statements.
| | | | | Year Ended August 31, | | |
| | |
| |
| |
|
| Class A Shares | | 2009 | | 2008 | | 2007 | | 2006 | | 2005 |
| |
| |
| |
| |
| |
|
| Per Share Data ($): | | | | | | | | | | |
| Net asset value, beginning of period | | 28.42 | | 33.56 | | 30.75 | | 29.48 | | 24.76 |
| Investment Operations: | | | | | | | | | | |
| Investment income—neta | | .22 | | .27 | | .31 | | .20 | | .15 |
| Net realized and unrealized | | | | | | | | | | |
| gain (loss) on investments | | (4.88) | | (3.21) | | 4.60 | | 3.42 | | 4.57 |
| Total from Investment Operations | | (4.66) | | (2.94) | | 4.91 | | 3.62 | | 4.72 |
| Distributions: | | | | | | | | | | |
| Dividends from investment income—net | | (.26) | | (.29) | | (.21) | | (.11) | | — |
| Dividends from net realized | | | | | | | | | | |
| gain on investments | | — | | (1.91) | | (1.89) | | (2.24) | | — |
| Total Distributions | | (.26) | | (2.20) | | (2.10) | | (2.35) | | — |
| Net asset value, end of period | | 23.50 | | 28.42 | | 33.56 | | 30.75 | | 29.48 |
| Total Return (%)b | | (16.14) | | (9.39) | | 16.32 | | 12.92 | | 18.97 |
| Ratios/Supplemental Data (%): | | | | | | | | | | |
| Ratio of total expenses | | | | | | | | | | |
| to average net assets | | 1.27 | | 1.16 | | 1.18 | | 1.20 | | 1.25 |
| Ratio of net expenses | | | | | | | | | | |
| to average net assets | | 1.26 | | 1.16c | | 1.18c | | 1.20 | | 1.25 |
| Ratio of net investment income | | | | | | | | | | |
| to average net assets | | 1.09 | | .88 | | .94 | | .69 | | .55 |
| Portfolio Turnover Rate | | 119.48 | | 107.46 | | 64.86 | | 72.24 | | 123.17 |
| Net Assets, end of period ($ x 1,000) | | 505,409 | | 526,723 | | 433,687 | | 242,377 | | 194,491 |
| a | | Based on average shares outstanding at each month end. |
| b | | Exclusive of sales charge. |
| c | | Expense waivers and/or reimbursements amounted to less than .01%. |
| See notes to financial statements. |
18
| | | | | Year Ended August 31, | | |
| | |
| |
| |
|
| Class B Shares | | 2009 | | 2008 | | 2007 | | 2006 | | 2005 |
| |
| |
| |
| |
| |
|
| Per Share Data ($): | | | | | | | | | | |
| Net asset value, beginning of period | | 27.23 | | 32.21 | | 29.62 | | 28.62 | | 24.21 |
| Investment Operations: | | | | | | | | | | |
| Investment income (loss)—neta | | .04 | | .02 | | .05 | | (.02) | | (.06) |
| Net realized and unrealized | | | | | | | | | | |
| gain (loss) on investments | | (4.68) | | (3.09) | | 4.43 | | 3.30 | | 4.47 |
| Total from Investment Operations | | (4.64) | | (3.07) | | 4.48 | | 3.28 | | 4.41 |
| Distributions: | | | | | | | | | | |
| Dividends from investment income—net | | (.06) | | — | | — | | (.04) | | — |
| Dividends from net realized | | | | | | | | | | |
| gain on investments | | — | | (1.91) | | (1.89) | | (2.24) | | — |
| Total Distributions | | (.06) | | (1.91) | | (1.89) | | (2.28) | | — |
| Net asset value, end of period | | 22.53 | | 27.23 | | 32.21 | | 29.62 | | 28.62 |
| Total Return (%)b | | (16.98) | | (10.12) | | 15.42 | | 12.06 | | 18.12 |
| Ratios/Supplemental Data (%): | | | | | | | | | | |
| Ratio of total expenses | | | | | | | | | | |
| to average net assets | | 2.24 | | 1.97 | | 1.96 | | 1.97 | | 2.04 |
| Ratio of net expenses | | | | | | | | | | |
| to average net assets | | 2.23 | | 1.97c | | 1.96c | | 1.97 | | 2.04 |
| Ratio of net investment income | | | | | | | | | | |
| (loss) to average net assets | | .18 | | .05 | | .16 | | (.08) | | (.23) |
| Portfolio Turnover Rate | | 119.48 | | 107.46 | | 64.86 | | 72.24 | | 123.17 |
| Net Assets, end of period ($ x 1,000) | | 7,850 | | 16,480 | | 16,606 | | 14,213 | | 11,685 |
| a | | Based on average shares outstanding at each month end. |
| b | | Exclusive of sales charge. |
| c | | Expense waivers and/or reimbursements amounted to less than .01%. |
| See notes to financial statements. |
The Fund 19
| | FINANCIAL HIGHLIGHTS (continued) |
| | | | | Year Ended August 31, | | |
| | |
| |
| |
|
| Class C Shares | | 2009 | | 2008 | | 2007 | | 2006 | | 2005 |
| |
| |
| |
| |
| |
|
| Per Share Data ($): | | | | | | | | | | |
| Net asset value, beginning of period | | 27.17 | | 32.22 | | 29.65 | | 28.64 | | 24.23 |
| Investment Operations: | | | | | | | | | | |
| Investment income (loss)—neta | | .07 | | .04 | | .05 | | (.01) | | (.05) |
| Net realized and unrealized | | | | | | | | | | |
| gain (loss) on investments | | (4.67) | | (3.09) | | 4.44 | | 3.32 | | 4.46 |
| Total from Investment Operations | | (4.60) | | (3.05) | | 4.49 | | 3.31 | | 4.41 |
| Distributions: | | | | | | | | | | |
| Dividends from investment income—net | | (.12) | | (.09) | | (.03) | | (.06) | | — |
| Dividends from net realized | | | | | | | | | | |
| gain on investments | | — | | (1.91) | | (1.89) | | (2.24) | | — |
| Total Distributions | | (.12) | | (2.00) | | (1.92) | | (2.30) | | — |
| Net asset value, end of period | | 22.45 | | 27.17 | | 32.22 | | 29.65 | | 28.64 |
| Total Return (%)b | | (16.83) | | (10.05) | | 15.45 | | 12.14 | | 18.10 |
| Ratios/Supplemental Data (%): | | | | | | | | | | |
| Ratio of total expenses | | | | | | | | | | |
| to average net assets | | 2.04 | | 1.92 | | 1.91 | | 1.91 | | 1.99 |
| Ratio of net expenses | | | | | | | | | | |
| to average net assets | | 2.03 | | 1.91 | | 1.91c | | 1.91 | | 1.99 |
| Ratio of net investment income | | | | | | | | | | |
| (loss) to average net assets | | .34 | | .13 | | .17 | | (.02) | | (.19) |
| Portfolio Turnover Rate | | 119.48 | | 107.46 | | 64.86 | | 72.24 | | 123.17 |
| Net Assets, end of period ($ x 1,000) | | 43,593 | | 53,065 | | 30,079 | | 21,669 | | 8,748 |
| a | | Based on average shares outstanding at each month end. |
| b | | Exclusive of sales charge. |
| c | | Expense waivers and/or reimbursements amounted to less than .01%. |
| See notes to financial statements. |
20
| | | | | Year Ended August 31, | | |
| | |
| |
| |
|
| Class I Shares | | 2009 | | 2008 | | 2007a | | 2006 | | 2005 |
| |
| |
| |
| |
| |
|
| Per Share Data ($): | | | | | | | | | | |
| Net asset value, beginning of period | | 28.45 | | 33.58 | | 30.78 | | 29.46 | | 24.71 |
| Investment Operations: | | | | | | | | | | |
| Investment income—netb | | .25 | | .24 | | .39 | | .30 | | .18 |
| Net realized and unrealized | | | | | | | | | | |
| gain (loss) on investments | | (4.91) | | (3.13) | | 4.59 | | 3.40 | | 4.57 |
| Total from Investment Operations | | (4.66) | | (2.89) | | 4.98 | | 3.70 | | 4.75 |
| Distributions: | | | | | | | | | | |
| Dividends from investment income—net | | (.31) | | (.33) | | (.29) | | (.14) | | — |
| Dividends from net realized | | | | | | | | | | |
| gain on investments | | — | | (1.91) | | (1.89) | | (2.24) | | — |
| Total Distributions | | (.31) | | (2.24) | | (2.18) | | (2.38) | | — |
| Net asset value, end of period | | 23.48 | | 28.45 | | 33.58 | | 30.78 | | 29.46 |
| Total Return (%) | | (16.06) | | (9.21) | | 16.57 | | 13.22 | | 19.13 |
| Ratios/Supplemental Data (%): | | | | | | | | | | |
| Ratio of total expenses | | | | | | | | | | |
| to average net assets | | 1.12 | | 1.11 | | 1.00 | | .92 | | 1.16 |
| Ratio of net expenses | | | | | | | | | | |
| to average net assets | | 1.11 | | 1.09 | | 1.00c | | .92 | | 1.16 |
| Ratio of net investment income | | | | | | | | | | |
| to average net assets | | 1.25 | | 1.02 | | 1.14 | | .98 | | .65 |
| Portfolio Turnover Rate | | 119.48 | | 107.46 | | 64.86 | | 72.24 | | 123.17 |
| Net Assets, end of period ($ x 1,000) | | 35,976 | | 79,567 | | 7,200 | | 1,826 | | 542 |
| a | | Effective June 1, 2007, Class R shares were redesignated as Class I shares. |
| b | | Based on average shares outstanding at each month end. |
| c | | Expense waivers and/or reimbursements amounted to less than .01%. |
| See notes to financial statements. |
The Fund 21
NOTES TO FINANCIAL STATEMENTS
NOTE 1—Significant Accounting Policies:
Dreyfus StrategicValue Fund (the “fund”) is a separate diversified series of Advantage Funds, Inc. (the “Company”), which is registered under the Investment Company Act of 1940, as amended (the “Act”), as an open-end management investment company and operates as a series company currently offering ten series, including the fund.The fund’s investment objective is capital appreciation.The Dreyfus Corporation (the “Manager” or “Dreyfus”), a wholly-owned subsidiary ofThe Bank of New York Mellon Corporation (“BNY Mellon”), serves as the fund’s investment adviser.
At a meeting of the fund’s Board of Directors held on July 15, 2008, the Board approved, effective December 1, 2008, a proposal to change the name of the fund from “Dreyfus Premier StrategicValue Fund” to “Dreyfus Strategic Value Fund.”
As of the close of business on August 27, 2008, pursuant to an Agreement and Plan of Reorganization previously approved by the fund’s Board of Directors, all of the assets, subject to the liabilities, of Dreyfus Premier Intrinsic Value Fund were transferred to the fund in exchange for corresponding class of shares of Common Stock of the fund of equal value. Shareholders of Class A, Class B, Class C, Class I and Class T shares of Dreyfus Premier IntrinsicValue Fund received Class A, Class B, Class C, Class I and Class T shares of the fund, respectively, in each case in an equal amount to the aggregate net asset value of their investment in Dreyfus Premier Intrinsic Value Fund at the time of the exchange.The net asset value of the fund’s shares on the close of business August 27, 2008, after the reorganization was $28.35 for Class A, $27.17 for Class B, $27.11 for Class C, $28.37 for Class I and $27.53 for Class T shares, and a total of 374,960 Class A shares, 208,909 Class B shares, 382,456 Class C shares, 1,525,493 Class I shares and 447,210 Class T shares, representing net assets of $82,231,594 (including $3,708,734 net unrealized depreciation on investments) were issued to Dreyfus Premier Intrinsic Value Fund’s shareholders in the exchange. The exchange was a tax-free event to Dreyfus Premier Intrinsic Value Fund shareholders.
22
MBSC Securities Corporation (the “Distributor”), a wholly-owned subsidiary of the Manager, is the distributor of the fund’s shares. The fund is authorized to issue 400 million shares of $.001 par value Common Stock.The fund currently offers four classes of shares: Class A (100 million shares authorized), Class B (100 million shares authorized), Class C (100 million shares authorized) and Class I (100 million shares authorized. Class A shares are subject to a sales charge imposed at the time of purchase. Class B shares are subject to a contingent deferred sales charge (“CDSC”) imposed on Class B share redemptions made within six years of purchase and automatically convert to Class A shares after six years.The fund does not offer Class B shares, except in connection with dividend reinvestment and permitted exchanges of Class B shares. Class C shares are subject to a CDSC imposed on Class C shares redeemed within one year of purchase and Class I shares are sold at net asset value per share only to institutional investors. Other differences between the classes include the services offered to and the expenses borne by each class, the allocation of certain transfer agency costs and certain voting rights. Income, expenses (other than expenses attributable to a specific class), and realized and unrealized gains or losses on investments are allocated to each class of shares based on its relative net assets.
Effective December 3, 2008, investments for new accounts were no longer permitted in ClassT of the fund, except that participants in certain group retirement plans were able to open a new account in Class T of the fund, provided that the fund was established as an investment option under the plans before December 3, 2008. On February 4, 2009, the fund issued to each holder of its Class T shares, in exchange for said shares, Class A shares of the fund having an aggregate net asset value equal to the aggregate net asset value of the shareholder’s Class T shares. Subsequent investments in the fund’s Class A shares made by prior holders of the fund’s Class T shares who received Class A shares of the fund in exchange for their Class T shares are subject to the front-end sales load schedule that was in effect for Class T shares at the
The Fund 23
| NOTES TO FINANCIAL STATEMENTS (continued) |
time of the exchange. Otherwise, all other Class A share attributes will be in effect. Effective as of the close of business on February 4, 2009, the fund no longer offers Class T shares.
The Company accounts separately for the assets, liabilities and operations of each series. Expenses directly attributable to each series are charged to that series’ operations; expenses which are applicable to all series are allocated among them on a pro rata basis.
The fund’s financial statements are prepared in accordance with U.S. generally accepted accounting principles, which may require the use of management estimates and assumptions. Actual results could differ from those estimates.
The fund enters into contracts that contain a variety of indemnifications. The fund’s maximum exposure under these arrangements is unknown.The fund does not anticipate recognizing any loss related to these arrangements.
(a) Portfolio valuation: Investments in securities are valued at the last sales price on the securities exchange or national securities market on which such securities are primarily traded. Securities listed on the National Market System for which market quotations are available are valued at the official closing price or, if there is no official closing price that day, at the last sales price. Securities not listed on an exchange or the national securities market, or securities for which there were no transactions, are valued at the average of the most recent bid and asked prices, except for open short positions, where the asked price is used for valuation purposes. Bid price is used when no asked price is available. Registered investment companies that are not traded on an exchange are valued at their net asset value.When market quotations or official closing prices are not readily available, or are determined not to reflect accurately fair value, such as when the value of a security has been significantly affected by events after the close of the exchange or
24
market on which the security is principally traded (for example, a foreign exchange or market),but before the fund calculates its net asset value, the fund may value these investments at fair value as determined in accordance with the procedures approved by the Board of Directors. Fair valuing of securities may be determined with the assistance of a pricing service using calculations based on indices of domestic securities and other appropriate indicators, such as prices of relevant American Depository Receipts and futures contracts. For other securities that are fair valued by the Board of Directors, certain factors may be considered such as: fundamental analytical data, the nature and duration of restrictions on disposition, an evaluation of the forces that influence the market in which the securities are purchased and sold, and public trading in similar securities of the issuer or comparable issuers. Financial futures are valued at the last sales price.
The fund adopted Statement of Financial Accounting Standards No. 157 “FairValue Measurements” (“FAS 157”). FAS 157 establishes an authoritative definition of fair value, sets out a framework for measuring fair value, and requires additional disclosures about fair value measurements.
Various inputs are used in determining the value of the fund’s investments relating to FAS 157.These inputs are summarized in the three broad levels listed below.
Level 1—quoted prices in active markets for identical investments.
Level 2—other significant observable inputs (including quoted prices for similar investments, interest rates, prepayment speeds, credit risk, etc.).
Level 3—significant unobservable inputs (including the fund’s own assumptions in determining the fair value of investments).
The inputs or methodology used for valuing securities are not necessarily an indication of the risk associated with investing in those securities.
The Fund 25
| NOTES TO FINANCIAL STATEMENTS (continued) |
The following is a summary of the inputs used as of August 31, 2009 in valuing the fund’s investments:
| | | | | Level 2—Other | | Level 3— | | |
| | | Level 1— | | Significant | | Significant | | |
| | | Quoted | | Observable | | Unobservable | | |
| | | Prices | | Inputs | | Inputs | | Total |
| |
| |
| |
| |
|
| Assets ($) | | | | | | | | |
| Investments in Securities: | | | | | | |
| Equity Securities— | | | | | | | | |
| Domestic | | 587,906,190 | | — | | — | | 587,906,190 |
| Mutual Funds/ | | | | | | | | |
| Exchange | | | | | | | | |
| Traded Funds | | 50,838,399 | | — | | — | | 50,838,399 |
| Other Financial | | | | | | | | |
| Instruments† | | — | | — | | — | | — |
| Liabilities ($) | | | | | | | | |
| Other Financial | | | | | | | | |
| Instruments† | | — | | — | | — | | — |
| |
| † Other financial instruments include derivative instruments, such as futures, forward foreign currency |
| exchange contracts, swap contracts and options contracts. Amounts shown represent unrealized |
| appreciation (depreciation), or in the case of options, market value at period end. | | |
(b) Securities transactions and investment income: Securities transactions are recorded on a trade date basis. Realized gains and losses from securities transactions are recorded on the identified cost basis. Dividend income is recognized on the ex-dividend date and interest income, including, where applicable, accretion of discount and amortization of premium on investments, is recognized on the accrual basis.
The fund has arrangements with the custodian and cash management bank whereby the fund may receive earnings credits when positive cash balances are maintained, which are used to offset custody and cash management fees. For financial reporting purposes, the fund includes net earnings credits as an expense offset in the Statement of Operations.
Pursuant to a securities lending agreement with The Bank of New York Mellon, a subsidiary of BNY Mellon and an affiliate of Dreyfus, the fund may lend securities to qualified institutions. It is the fund’s policy that, at origination, all loans are secured by collateral of at least 102% of the value of U.S. securities loaned and 105% of the value of foreign securities loaned. Collateral equivalent to at least 100% of the
26
market value of securities on loan is maintained at all times. Collateral is either in the form of cash, which can be invested in certain money market mutual funds managed by the Manager, U.S. Government and Agency securities or letters of credit.The fund is entitled to receive all income on securities loaned, in addition to income earned as a result of the lending transaction. Although each security loaned is fully collateralized, the fund bears the risk of delay in recovery of, or loss of rights in, the securities loaned should a borrower fail to return the securities in a timely manner. During the period ended August 31, 2009, The Bank of New York Mellon earned $79,195 from lending fund portfolio securities, pursuant to the securities lending agreement.
(c) Affiliated issuers: Investments in other investment companies advised by the Manager are defined as “affiliated” in the Act.
(d) Dividends to shareholders: Dividends are recorded on the ex-dividend date. Dividends from investment income-net and dividends from net realized capital gains, if any, are normally declared and paid annually, but the fund may make distributions on a more frequent basis to comply with the distribution requirements of the Internal Revenue Code of 1986, as amended (the “Code”).To the extent that net realized capital gains can be offset by capital loss carryovers, it is the policy of the fund not to distribute such gains. Income and capital gain distributions are determined in accordance with income tax regulations, which may differ from U.S. generally accepted accounting principles.
(e) Federal income taxes: It is the policy of the fund to continue to qualify as a regulated investment company, if such qualification is in the best interests of its shareholders, by complying with the applicable provisions of the Code, and to make distributions of taxable income sufficient to relieve it from substantially all federal income and excise taxes.
As of and during the period ended August 31, 2009, the fund did not have any liabilities for any uncertain tax positions.The fund recognizes interest and penalties, if any, related to uncertain tax positions as income tax expense in the Statement of Operations. During the period, the fund did not incur any interest or penalties.
The Fund 27
| NOTES TO FINANCIAL STATEMENTS (continued) |
Each of the tax years in the four-year period ended August 31, 2009 remains subject to examination by the Internal Revenue Service and state taxing authorities.
At August 31, 2009, the components of accumulated earnings on a tax basis were as follows: undistributed ordinary income $2,728,283, accumulated capital losses $71,582,296 and unrealized appreciation $44,749,891. In addition, the fund had $101,520,270 of capital losses realized after October 31, 2008, which were deferred for tax purposes to the first day of the following fiscal year.
The accumulated capital loss carryover of $63,747,977 is available for federal income tax purposes to be applied against future net securities profits, if any, realized subsequent to August 31, 2009. If not applied, the carryover expires in fiscal 2017.
As a result of the fund’s merger with Dreyfus Premier Intrinsic Value Fund, capital losses of $7,834,319 are available to offset future gains, if any. Based on certain provisions in the Code, the amount of losses which can be utilized in subsequent years is subject to an annual lim-itation.This acquired capital loss will expire in fiscal 2015.
The tax character of distributions paid to shareholders during the fiscal periods ended August 31, 2009 and August 31, 2008 were as follows: ordinary income $6,013,670 and $13,484,780 and long-term capital gains $0 and $22,060,237, respectively.
During the period ended August 31,2009,as a result of permanent book to tax differences, primarily due to the tax treatment for capital loss carryovers from the merger with Dreyfus Premier IntrinsicValue Fund, the fund decreased accumulated net realized gain (loss) on investments by $7,834,319 and increased paid-in capital by the same amount. Net assets and net asset value per share were not affected by this reclassification.
NOTE 2—Bank Lines of Credit:
Prior to October 15, 2008, the fund participated with other Dreyfus-managed funds in a $350 million redemption credit facility. Effective October 15, 2008, the fund participates with other Dreyfus-managed
28
funds in a $145 million unsecured credit facility led by Citibank, N.A. and a $300 million unsecured credit facility provided by The Bank of NewYork Mellon (each, a “Facility”), each to be utilized primarily for temporary or emergency purposes, including the financing of redemptions. In connection therewith, the fund has agreed to pay its pro rata portion of Facility fees for each Facility. Interest is charged to the fund based on rates determined pursuant to the terms of the respective Facility at the time of the borrowing.
The average amount of borrowings outstanding under the Facilities during the period ended August 31, 2009 was approximately $36,700 with a related weighted average annualized interest rate of 1.52%.
NOTE 3—Management Fee and Other Transactions with Affiliates:
(a) Pursuant to a management agreement with the Manager, the management fee is computed at the annual rate of .75% of the value of the fund’s average daily net assets and is payable monthly.
During the period ended August 31, 2009, the Distributor retained $42,773 from commissions earned on sales of the fund’s Class A shares, and $18,133 and $19,864 from CDSCs on redemptions of the fund’s Class B and Class C shares, respectively.
(b) Under the Distribution Plan (the “Plan”) adopted pursuant to Rule 12b-1 under the Act, Class B and Class C shares pay and Class T shares paid the Distributor for distributing their shares at an annual rate of .75% of the value of the average daily net assets of Class B and Class C shares and .25% of the value of the average daily net assets of ClassT shares. During the period ended August 31, 2009, Class B, Class C and Class T shares were charged $67,783, $286,059 and $18,528, respectively, pursuant to the Plan.
(c) Under the Shareholder Services Plan, Class A, Class B and Class C shares pay and Class T shares paid the Distributor at an annual rate of .25% of the value of their average daily net assets for the provision of
The Fund 29
| NOTES TO FINANCIAL STATEMENTS (continued) |
certain services. The services provided may include personal services relating to shareholder accounts, such as answering shareholder inquiries regarding the fund and providing reports and other information, and services related to the maintenance of shareholder accounts. The Distributor may make payments to Service Agents (a securities dealer, financial institution or industry professional) in respect of these services.The Distributor determines the amounts to be paid to Service Agents. During the period ended August 31, 2009, Class A, Class B, Class C and Class T shares were charged $1,054,833, $22,594, $95,353 and $18,528, respectively, pursuant to the Shareholder Services Plan.
The fund compensates Dreyfus Transfer, Inc., a wholly-owned subsidiary of the Manager, under a transfer agency agreement for providing personnel and facilities to perform transfer agency services for the fund. During the period ended August 31, 2009, the fund was charged $373,463 pursuant to the transfer agency agreement.
The fund compensates The Bank of New York Mellon under a cash management agreement for performing cash management services related to fund subscriptions and redemptions. During the period ended August 31, 2009, the fund was charged $45,562 pursuant to the cash management agreement.These fees were offset by earnings credits pursuant to the cash management agreement.
The fund also compensates The Bank of New York Mellon under a custody agreement for providing custodial services for the fund. During the period ended August 31, 2009, the fund was charged $58,817 pursuant to the custody agreement.
During the period ended August 31, 2009, the fund was charged $6,097 for services performed by the Chief Compliance Officer.
The components of “Due to The Dreyfus Corporation and affiliates” in the Statement of Assets and Liabilities consist of: management fees $374,444, Rule 12b-1 distribution plan fees $32,527, shareholder services plan fees $117,308, custodian fees $11,700, chief compliance officer fees $2,784 and transfer agency per account fees $154,579.
30
(d) Each Board member also serves as a Board member of other funds within the Dreyfus complex. Annual retainer fees and attendance fees are allocated to each fund based on net assets.
NOTE 4—Securities Transactions:
The aggregate amount of purchases and sales of investment securities, excluding short-term securities and financial futures, during the period ended August 31, 2009, amounted to $646,789,565 and $622,487,476, respectively.
The fund adopted Statement of Financial Accounting Standards No. 161 “Disclosures about Derivative Instruments and Hedging Activities” (“FAS 161”), which changes the disclosure requirements for derivative instruments and hedging activities. Because investment companies value their derivatives at fair value and recognize changes in fair value through the Statement of Operations, they do not qualify for FAS 133 hedge accounting. Accordingly, even though a fund’s investments in derivatives may represent economic hedges, they are considered to be non-hedge transactions for purposes of FAS 161 disclosure. FAS 161 requires qualitative disclosures about objectives and strategies for using derivatives, quantitative disclosures about fair value amounts of gains and losses on derivative instruments and disclosures about credit-risk-related contingent features in derivative agreements. All changes to accounting policies and disclosures have been made in accordance with FAS 161 and are incorporated for the current period as part of the disclosures within this Note.
Futures Contracts: In the normal course of pursuing its investment objectives, the fund is exposed to market risk (including equity price risk, interest rate risk and foreign currency exchange risk) as a result of changes in value of underlying financial instruments. The fund may invest in financial futures contracts in order to manage its exposure to or protect against changes in the market. A futures contract represents a commitment for the future purchase or a sale of an asset at a speci-
The Fund 31
| NOTES TO FINANCIAL STATEMENTS (continued) |
fied date. Upon entering into such contracts, these investments require initial margin deposits with a broker, which consist of cash or cash equivalents. The amount of these deposits is determined by the exchange or Board of Trade on which the contract is traded and is subject to change.Accordingly, variation margin payments are received or made to reflect daily unrealized gains or losses which are recorded in the Statement of Operations. Futures contracts are valued daily at the settlement price established by the Board of Trade or exchange upon which they are traded.When the contracts are closed, the fund recognizes a realized gain or loss.There is minimal counterparty credit risk to the fund with futures, since futures are exchange traded and the exchange’s clearinghouse, as counterparty to all exchange traded futures, guarantees the futures against default.At August 31, 2009, there were no open financial futures contracts outstanding.
At August 31, 2009, the cost of investments for federal income tax purposes was $593,994,698; accordingly, accumulated net unrealized appreciation on investments was $44,749,891, consisting of $73,514,628 gross unrealized appreciation and $28,764,737 gross unrealized depreciation.
NOTE 5—Subsequent Events Evaluation:
Dreyfus has evaluated the need for disclosures and/or adjustments resulting from subsequent events through October 26, 2009, the date the financial statements were issued. This evaluation did not result in any subsequent events that necessitated disclosures and/or adjustments.
32
| REPORT OF INDEPENDENT REGISTERED |
| PUBLIC ACCOUNTING FIRM |
| | Shareholders and Board of Directors
Dreyfus Strategic Value Fund |
We have audited the accompanying statement of assets and liabilities, including the statement of investments, of Dreyfus StrategicValue Fund (formerly, Dreyfus Premier StrategicValue Fund) (one of the series comprising Advantage Funds, Inc.) as of August 31, 2009, and the related statement of operations for the year then ended, the statement of changes in net assets for each of the two years in the period then ended, and financial highlights for each of the years indicated therein. These financial statements and financial highlights are the responsibility of the Fund’s management. Our responsibility is to express an opinion on these financial statements and financial highlights based on our audits.
We conducted our audits in accordance with the standards of the Public Company Accounting Oversight Board (United States).Those standards require that we plan and perform the audit to obtain reasonable assurance about whether the financial statements and financial highlights are free of material misstatement.We were not engaged to perform an audit of the Fund’s internal control over financial reporting. Our audits included consideration of internal control over financial reporting as a basis for designing audit procedures that are appropriate in the circumstances, but not for the purpose of expressing an opinion on the effectiveness of the Fund’s internal control over financial reporting. Accordingly, we express no such opinion. An audit also includes examining, on a test basis, evidence supporting the amounts and disclosures in the financial statements and financial highlights, assessing the accounting principles used and significant estimates made by management, and evaluating the overall financial statement presentation. Our procedures included confirmation of securities owned as of August 31, 2009 by correspondence with the custodian and others. We believe that our audits provide a reasonable basis for our opinion.
In our opinion, the financial statements and financial highlights referred to above present fairly, in all material respects, the financial position of Dreyfus StrategicValue Fund at August 31, 2009, the results of its operations for the year then ended, the changes in its net assets for each of the two years in the period then ended, and the financial highlights for each of the indicated years, in conformity with U.S. generally accepted accounting principles.

New York, New York
October 26, 2009 |
The Fund 33
IMPORTANT TAX INFORMATION (Unaudited)
For federal tax purposes, the fund hereby designates 100% of the ordinary dividends paid during the fiscal year ended August 31, 2009 as qualifying for the corporate dividends received deduction.Also certain dividends paid by the fund may be subject to a maximum tax rate of 15%, as provided for by the Jobs and Growth Tax Relief Reconciliation Act of 2003. Of the distributions paid during the fiscal year, $2,569,851 represents the maximum amount that may be considered qualified dividend income. Shareholders will receive notification in early 2010 of the percentage applicable to the preparation of their 2009 income tax returns.
34
| INFORMATION ABOUT THE REVIEW AND APPROVAL OF |
| THE FUND’S MANAGEMENT AGREEMENT (Unaudited) |
At a meeting of the fund’s Board held on March 3, 2009, the Board unanimously approved the continuation of the fund’s Management Agreement with Dreyfus for a one-year term ending March 30, 2010. The Board members, none of whom are “interested persons” (as defined in the Investment Company Act of 1940, as amended) of the fund were assisted in their review by independent legal counsel and met with counsel in executive session separate from representatives of Dreyfus. In approving the continuance of the Management Agreement, the Board considered all factors that they believed to be relevant, including, among other things, the factors discussed below.
Analysis of Nature, Extent and Quality of Services Provided to the Fund. The Board members received a presentation from representatives of Dreyfus regarding services provided to the fund and other funds in the Dreyfus fund complex, and discussed the nature, extent and quality of the services provided to the fund pursuant to its Management Agreement. Dreyfus’ representatives reviewed the fund’s distribution of accounts and the relationships Dreyfus has with various intermediaries and the different needs of each. Dreyfus’ representatives noted the various distribution channels for the fund as well as the diverse methods of distribution among other funds in the Dreyfus fund complex, and Dreyfus’ corresponding need for broad, deep, and diverse resources to be able to provide ongoing shareholder services to each distribution channel, including those of the fund. Dreyfus also provided the number of accounts investing in the fund, as well as the fund’s asset size.
The Board members also considered Dreyfus’ research and portfolio management capabilities and Dreyfus’ oversight of day-to-day fund operations, including fund accounting and administration and assistance in meeting legal and regulatory requirements.The Board members also considered Dreyfus’ extensive administrative, accounting and compliance infrastructure.The Board also considered Dreyfus’ brokerage policies and practices, the standards applied in seeking best execution and Dreyfus’ policies and practices regarding soft dollars.
The Fund 35
| INFORMATION ABOUT THE REVIEW AND APPROVAL OF THE |
| FUND’S MANAGEMENT AGREEMENT (Unaudited) (continued) |
Comparative Analysis of the Fund’s Performance and Management Fee and Expense Ratio. The Board members reviewed the fund’s performance and comparisons to a group of retail front-end load multi-cap value funds that are benchmarked against the Russell 1000 Value Index (the “Performance Group”) and to a larger universe of funds consisting of all retail and institutional multi-cap value funds (the “Performance Universe”) selected and provided by Lipper, Inc., an independent provider of investment company data.The Board was provided with a description of the methodology Lipper used to select the Performance Group and Performance Universe, as well as the Expense Group and Expense Universe (discussed below). The Board members discussed the results of the comparisons and noted the fund’s average annual total return ranked in the first quartile of the Performance Group and the second quartile of the Performance Universe for the one- and two-year periods ended December 31, 2008 and in the first quartile of the Performance Group and Performance Universe for the three-, four-, five- and ten-year periods ended December 31, 2008. Dreyfus also provided a comparison of the fund’s calendar year total returns to the returns of the fund’s benchmark index.
The Board members also discussed the fund’s contractual and actual management fees and expense ratio and reviewed the range of management fees and expense ratios as compared to a comparable group of funds (the “Expense Group”) and a broader group of funds (the “Expense Universe”), each selected and provided by Lipper.The fund’s contractual management fee was slightly higher than the Expense Group median and the fund’s actual management fee was higher than the Expense Group and Expense Universe medians. The fund’s expense ratio was equal to the Expense Group median and lower than the Expense Universe median.
Representatives of Dreyfus reviewed with the Board members the fees paid to Dreyfus or its affiliates by mutual funds and/or separate accounts managed by Dreyfus with similar investment objectives, policies and strategies as the fund (the “Similar Accounts”), and explained the nature of the Similar Accounts and the differences, from Dreyfus’
36
perspective, as applicable, in providing services to the Similar Accounts as compared to the fund. Dreyfus’ representatives also reviewed the costs associated with distribution through intermediaries. The Board analyzed differences in fees paid to Dreyfus and discussed the relationship of the advisory fees paid in light of the services provided. The Board members considered the relevance of the fee information provided for the Similar Accounts to evaluate the appropriateness and reasonableness of the fund’s management fees.The Board acknowledged that differences in fees paid by the Similar Accounts seemed to be consistent with the services provided.
Analysis of Profitability and Economies of Scale. Dreyfus’ representatives reviewed the dollar amount of expenses allocated and profit received by Dreyfus and the method used to determine such expenses and profit.The Board previously had been provided with information prepared by an independent consulting firm regarding Dreyfus’ approach to allocating costs to, and determining the profitability of, individual funds and the entire Dreyfus mutual fund complex. The Board also was informed that the methodology had also been reviewed by an independent registered public accounting firm which, like the consultant, found the methodology to be reasonable. The consulting firm also analyzed where any economies of scale might emerge in connection with the management of the fund. The Board members evaluated the profitability analysis in light of the relevant circumstances for the fund and the extent to which economies of scale would be realized if the fund grows and whether fee levels reflect these economies of scale for the benefit of fund investors.The Board members also considered potential benefits to Dreyfus from acting as investment adviser and noted the soft dollar arrangements with respect to trading the fund’s investments.
It was noted that the Board members should consider Dreyfus’ profitability with respect to the fund as part of their evaluation of whether the fees under the Management Agreement bear a reasonable relationship to the mix of services provided by Dreyfus, including the nature,
The Fund 37
| INFORMATION ABOUT THE REVIEW AND APPROVAL OF THE |
| FUND’S MANAGEMENT AGREEMENT (Unaudited) (continued) |
extent and quality of such services, and that a discussion of economies of scale is predicated on a fund having achieved a substantial size with increasing assets and that, if a fund’s assets had been static or decreasing, the possibility that Dreyfus may have realized any economies of scale would be less. It also was noted that the profitability percentage for managing the fund was within the range determined by appropriate court cases to be reasonable given the services rendered and generally superior service levels provided.
At the conclusion of these discussions, the Board agreed that it had been furnished with sufficient information to make an informed business decision with respect to continuation of the fund’s Management Agreement. Based on the discussions and considerations as described above, the Board made the following conclusions and determinations.
- The Board concluded that the nature, extent and quality of the ser- vices provided by Dreyfus are adequate and appropriate.
- The Board was satisfied with the fund’s relative performance.
- The Board concluded that the fee paid by the fund to Dreyfus was reasonable in light of the considerations described above.
- The Board determined that the economies of scale which may accrue to Dreyfus and its affiliates in connection with the manage- ment of the fund had been adequately considered by Dreyfus in connection with the management fee rate charged to the fund and that, to the extent in the future it were determined that material economies of scale had not been shared with the fund, the Board would seek to have those economies of scale shared with the fund.
The Board members considered these conclusions and determinations, along with information received on a routine and regular basis throughout the year, and, without any one factor being dispositive, the Board determined that continuation of the fund’s Management Agreement was in the best interests of the fund and its shareholders.
38
| BOARD MEMBERS INFORMATION (Unaudited) |
| |
| |
| |
| Joseph S. DiMartino (65) |
| Chairman of the Board (1995) |
| Principal Occupation During Past 5Years: |
| • Corporate Director and Trustee |
| Other Board Memberships and Affiliations: |
| • The Muscular Dystrophy Association, Director |
| • CBIZ (formerly, Century Business Services, Inc.), a provider of outsourcing functions for small |
| and medium size companies, Director |
| • The Newark Group, a provider of a national market of paper recovery facilities, paperboard |
| mills and paperboard converting plants, Director |
| • Sunair Services Corporation, a provider of certain outdoor-related services to homes and |
| businesses, Director |
| No. of Portfolios for which Board Member Serves: 166 |
| ——————— |
| Peggy C. Davis (66) |
| Board Member (2006) |
| Principal Occupation During Past 5Years: |
| • Shad Professor of Law, New York University School of Law (1983-present) |
| • Writer and teacher in the fields of evidence, constitutional theory, family law, social sciences |
| and the law, legal process and professional methodology and training |
| No. of Portfolios for which Board Member Serves: 53 |
| ——————— |
| David P. Feldman (69) |
| Board Member (1996) |
| Principal Occupation During Past 5Years: |
| • Corporate Director and Trustee |
| Other Board Memberships and Affiliations: |
| • BBH Mutual Funds Group (11 funds), Director |
| • The Jeffrey Company, a private investment company, Director |
| No. of Portfolios for which Board Member Serves: 46 |
| ——————— |
| James F. Henry (78) |
| Board Member (2006) |
| Principal Occupation During Past 5Years: |
| • Advisor to The Elaw Forum, a consultant on managing corporate legal costs |
| • Advisor to John Jay Homestead (the restored home of the first U.S. Chief Justice) |
| • Individual Trustee of several trusts |
| Other Board Memberships and Affiliations: |
| • Director, advisor and mediator involved in several non-profit organizations, primarily engaged |
| in domestic and international dispute resolution, and historic preservation |
| No. of Portfolios for which Board Member Serves: 31 |
The Fund 39
| BOARD MEMBERS INFORMATION (Unaudited) (continued) |
| |
| |
| |
| |
| Ehud Houminer (69) |
| Board Member (1993) |
| Principal Occupation During Past 5Years: |
| • Executive-in-Residence at the Columbia Business School, Columbia University |
| |
| Other Board Memberships and Affiliations: |
| • Avnet Inc., an electronics distributor, Director |
| • International Advisory Board to the MBA Program School of Management, Ben Gurion |
| University, Chairman |
| |
| No. of Portfolios for which Board Member Serves: 58 |
| ——————— |
| Gloria Messinger (79) |
| Board Member (1993) |
| Principal Occupation During Past 5Years: |
| • Arbitrator for American Arbitration Association |
| • Arbitrator for FINRA (formerly, National Association of Securities Dealers, Inc.) |
| • Consultant in Intellectual Property |
| |
| Other Board Memberships and Affiliations: |
| • Theater for a New Audience, Inc., Director |
| • Brooklyn Philharmonic, Director |
| |
| No. of Portfolios for which Board Member Serves: 31 |
| ——————— |
| Dr. Martin Peretz (70) |
| Board Member (2006) |
| Principal Occupation During Past 5Years: |
| • Editor-in-Chief of The New Republic Magazine |
| • Director of TheStreet.com, a financial information service on the web |
| |
| Other Board Memberships and Affiliations: |
| • American Council of Trustees and Alumni, Director |
| • Pershing Square Capital Management, Advisor |
| • Montefiore Ventures, General Partner |
| • Harvard Center for Blood Research,Trustee |
| • Bard College,Trustee |
| • Board of Overseers of YIVO Institute for Jewish Research, Chairman |
| |
| No. of Portfolios for which Board Member Serves: 31 |
| |
| ——————— |
| Once elected all Board Members serve for an indefinite term, but achieve Emeritus status upon reaching age 80.The |
| address of the Board Members and Officers is in c/o The Dreyfus Corporation, 200 Park Avenue, NewYork, NewYork |
| 10166. Additional information about the Board Members is available in the fund’s Statement of Additional Information |
| which can be obtained from Dreyfus free of charge by calling this toll free number: 1-800-554-4611. |
| John M. Fraser, Jr., Emeritus Board Member |
| Rosalind G. Jacobs, Emeritus Board Member |
| Dr. Paul A. Marks, Emeritus Board Member |
40
OFFICERS OF THE FUND (Unaudited)
J. DAVID OFFICER, President since December 2006.
Chairman, President and Chief Executive Officer of Founders Asset Management LLC, an affiliate of the Manager, and an officer of 75 investment companies (comprised of 166 portfolios) managed by the Manager. Prior to June 2009, Mr. Officer was Chief Operating Officer,Vice Chairman and a director of the Manager, where he had been employed since April 1998. He is 61 years old.
PHILLIP N. MAISANO, Executive Vice President since July 2007.
Chief Investment Officer,Vice Chair and a director of the Manager, and an officer of 75 investment companies (comprised of 166 portfolios) managed by the Manager. Mr. Maisano also is an officer and/or Board member of certain other investment management subsidiaries of The Bank of New York Mellon Corporation, each of which is an affiliate of the Manager. He is 62 years old and has been an employee of the Manager since November 2006. Prior to joining the Manager, Mr. Maisano served as Chairman and Chief Executive Officer of EACM Advisors, an affiliate of the Manager, since August 2004, and served as Chief Executive Officer of Evaluation Associates, a leading institutional investment consulting firm, from 1988 until 2004.
MICHAEL A. ROSENBERG, Vice President and Secretary since August 2005.
Assistant General Counsel of BNY Mellon, and an officer of 76 investment companies (comprised of 187 portfolios) managed by the Manager. He is 49 years old and has been an employee of the Manager since October 1991.
JAMES BITETTO, Vice President and Assistant Secretary since August 2005.
Senior Counsel of BNY Mellon and Secretary of the Manager, and an officer of 76 investment companies (comprised of 187 portfolios) managed by the Manager. He is 43 years old and has been an employee of the Manager since December 1996.
JONI LACKS CHARATAN, Vice President and Assistant Secretary since August 2005.
Senior Counsel of BNY Mellon, and an officer of 76 investment companies (comprised of 187 portfolios) managed by the Manager. She is 53 years old and has been an employee of the Manager since October 1988.
JOSEPH M. CHIOFFI, Vice President and Assistant Secretary since August 2005.
Senior Counsel of BNY Mellon, and an officer of 76 investment companies (comprised of 187 portfolios) managed by the Manager. He is 47 years old and has been an employee of the Manager since June 2000.
JANETTE E. FARRAGHER, Vice President and Assistant Secretary since August 2005.
Assistant General Counsel of BNY Mellon, and an officer of 76 investment companies (comprised of 187 portfolios) managed by the Manager. She is 46 years old and has been an employee of the Manager since February 1984.
JOHN B. HAMMALIAN, Vice President and Assistant Secretary since August 2005.
Managing Counsel of BNY Mellon, and an officer of 76 investment companies (comprised of 187 portfolios) managed by the Manager. He is 46 years old and has been an employee of the Manager since February 1991.
ROBERT R. MULLERY, Vice President and Assistant Secretary since August 2005.
Managing Counsel of BNY Mellon, and an officer of 76 investment companies (comprised of 187 portfolios) managed by the Manager. He is 57 years old and has been an employee of the Manager since May 1986.
JEFF PRUSNOFSKY, Vice President and Assistant Secretary since August 2005.
Managing Counsel of BNY Mellon, and an officer of 76 investment companies (comprised of 187 portfolios) managed by the Manager. He is 44 years old and has been an employee of the Manager since October 1990.
The Fund 41
OFFICERS OF THE FUND (Unaudited) (continued)
JAMES WINDELS, Treasurer since November 2001.
Director – Mutual Fund Accounting of the Manager, and an officer of 76 investment companies (comprised of 187 portfolios) managed by the Manager. He is 49 years old and has been an employee of the Manager since April 1985.
RICHARD CASSARO, Assistant Treasurer since January 2008.
Senior Accounting Manager – Money Market and Municipal Bond Funds of the Manager, and an officer of 76 investment companies (comprised of 187 portfolios) managed by the Manager. He is 50 years old and has been an employee of the Manager since September 1982.
GAVIN C. REILLY, Assistant Treasurer since December 2005.
Tax Manager of the Investment Accounting and Support Department of the Manager, and an officer of 76 investment companies (comprised of 187 portfolios) managed by the Manager. He is 41 years old and has been an employee of the Manager since April 1991.
ROBERT ROBOL, Assistant Treasurer since August 2005.
Senior Accounting Manager – Fixed Income Funds of the Manager, and an officer of 76 investment companies (comprised of 187 portfolios) managed by the Manager. He is 45 years old and has been an employee of the Manager since October 1988.
ROBERT SALVIOLO, Assistant Treasurer since July 2007.
Senior Accounting Manager – Equity Funds of the Manager, and an officer of 76 investment companies (comprised of 187 portfolios) managed by the Manager. He is 42 years old and has been an employee of the Manager since June 1989.
ROBERT SVAGNA, Assistant Treasurer since December 2002.
Senior Accounting Manager – Equity Funds of the Manager, and an officer of 76 investment companies (comprised of 187 portfolios) managed by the Manager. He is 42 years old and has been an employee of the Manager since November 1990.
JOSEPH W. CONNOLLY, Chief Compliance Officer since October 2004.
Chief Compliance Officer of the Manager and The Dreyfus Family of Funds (76 investment companies, comprised of 187 portfolios). From November 2001 through March 2004, Mr. Connolly was first Vice-President, Mutual Fund Servicing for Mellon Global Securities Services. In that capacity, Mr. Connolly was responsible for managing Mellon’s Custody, Fund Accounting and Fund Administration services to third-party mutual fund clients. He is 52 years old and has served in various capacities with the Manager since 1980, including manager of the firm’s Fund Accounting Department from 1997 through October 2001.
WILLIAM GERMENIS, Anti-Money Laundering Compliance Officer since October 2002.
Vice President and Anti-Money Laundering Compliance Officer of the Distributor, and the Anti-Money Laundering Compliance Officer of 72 investment companies (comprised of 183 portfolios) managed by the Manager. He is 38 years old and has been an employee of the Distributor since October 1998.
42
NOTES

Save time. Save paper. View your next shareholder report online as soon as it’s available. Log into www.dreyfus.com and sign up for Dreyfus eCommunications. It’s simple and only takes a few minutes.
The views expressed in this report reflect those of the portfolio manager only through the end of the period covered and do not necessarily represent the views of Dreyfus or any other person in the Dreyfus organization. Any such views are subject to change at any time based upon market or other conditions and Dreyfus disclaims any responsibility to update such views.These views may not be relied on as investment advice and, because investment decisions for a Dreyfus fund are based on numerous factors, may not be relied on as an indication of trading intent on behalf of any Dreyfus fund.

| | Contents |
| |
| | THE FUND |
| |
| 2 | A Letter from the Chairman and CEO |
| |
| 3 | Discussion of Fund Performance |
| |
| 6 | Fund Performance |
| |
| 8 | Understanding Your Fund’s Expenses |
| |
| 8 | Comparing Your Fund’s Expenses With Those of Other Funds |
| |
| 9 | Statement of Investments |
| |
| 16 | Statement of Assets and Liabilities |
| |
| 17 | Statement of Operations |
| |
| 18 | Statement of Changes in Net Assets |
| |
| 21 | Financial Highlights |
| |
| 25 | Notes to Financial Statements |
| |
| 35 | Report of Independent Registered Public Accounting Firm |
| |
| 36 | Important Tax Information |
| |
| 37 | Information About the Review and Approval of the Fund’s Management Agreement |
| |
| 41 | Board Members Information |
| |
| 43 | Officers of the Fund |
| |
| | FOR MORE INFORMATION |
| |
| | Back Cover |
| |
Dreyfus
Structured Midcap Fund |

A LETTER FROM THE CHAIRMAN AND CEO
Dear Shareholder:
We are pleased to present this annual report for Dreyfus Structured Midcap Fund, covering the 12-month period from September 1, 2008, through August 31, 2009.
At long last, the current recession cycle appears to be winding down. After generally slumping since December 2007, we expect U.S. economic growth to pick up during the third quarter of 2009. Highly stimulative monetary and fiscal policies domestically and throughout the world, combined with the low cost of debt and equity capital compared to historical norms, already have sparked a rebound in industrial production as manufacturers replenish their depleted inventories. However, we continue to anticipate a slower-than-average recovery, with the unemployment rate likely to remain elevated over the next several quarters.
The U.S. stock market anticipated the economic upturn with a sustained market rally that began in early March 2009. Although the rebound initially was concentrated primarily among lower-quality stocks that had been severely punished in the downturn, it later broadened to include virtually all economic sectors and capitalization ranges. While we are encouraged by the market’s recent strength, we remain concerned that improving investor sentiment may have exceeded the revival of business fundamentals. Accordingly, we continue to believe that careful selectivity and risk management will be keys to success in the financial markets over the foreseeable future.As always, we urge you to speak with your financial adviser about the potential opportunities and obstacles in today’s investment environment.
For information about how the fund performed during the reporting period, as well as market perspectives, we have provided a Discussion of Fund Performance given by the Portfolio Managers.
Thank you for your continued confidence and support.

Jonathan R. Baum
Chairman and Chief Executive Officer
The Dreyfus Corporation
September 15, 2009 |
2

DISCUSSION OF FUND PERFORMANCE
For the period of September 1, 2008, through August 31, 2009, as provided by Patrick Slattery, Oliver Buckley, and Michael F. Dunn, Portfolio Managers
Fund and Market Performance Overview
For the 12-month period ended August 31, 2009, Dreyfus Structured Midcap Fund’s Class A shares produced a total return of –23.02%, Class B shares returned –23.73%, Class C shares returned –23.60% and Class I shares returned –22.78%.1 In comparison, the fund’s benchmark index, the Standard & Poor’s MidCap 400 Index (“S&P 400 Index”), produced a total return of –18.17% for the same period.2
Despite a severe recession and banking crisis over much of the reporting period, a market rally over the spring and summer of 2009 offset a significant portion of earlier losses.The fund produced lower returns than its benchmark, primarily due to the ineffectiveness of the momentum factors considered by our investment process under extremely volatile market conditions.
The Fund’s Investment Approach
The fund seeks long-term capital growth.To pursue this goal, the fund invests at least 80% of its assets in the stocks of companies included in the S&P 400 Index or the Russell Midcap Index at the time of purchase.The fund’s stock investments may include common stocks, preferred stocks and convertible securities of U.S. and foreign issuers. We construct the portfolio through a “bottom-up” structured approach focusing on stock selection as opposed to making proactive decisions as to industry sector exposure.The approach seeks to identify undervalued securities through a quantitative process which ranks stocks based on fundamental momentum, relative value, future value, long-term growth and additional factors, such as technical factors.We attempt to maintain a neutral exposure to industry groups relative to the S&P 400 Index.
Equity Markets Plunged, Then Rebounded Sharply
The U.S. stock market endured a year of extreme volatility. Just weeks after the start of the reporting period, the failure of several major finan-
The Fund 3
| DISCUSSION OF FUND PERFORMANCE (continued) |
cial institutions made it seem that a collapse of the worldwide banking system was not out of the question. Meanwhile, rising unemployment, plunging housing prices and depressed consumer confidence fueled the longest and most severe economic downturn since the 1930s. These influences sparked a bear market that drove stock market averages to multi-year lows. The decline was broad-based, affecting industry groups and individual stocks seemingly regardless of their underlying business fundamentals.
Market sentiment suddenly began to improve in early March, as aggressive remedial measures adopted by government and monetary authorities seemed to gain traction. Evidence of economic stabilization appeared, supporting a market rally through the reporting period’s end. However, lower-quality stocks that had been severely punished in the downturn led the market’s 2009 advance.
Stock Selection Process Produced Mixed Results
Our stock selection process is designed to select stocks with favorable earnings and price momentum and attractive valuations. Unfortunately, the momentum factors considered by our investment process proved relatively ineffective in the highly turbulent market environment.Valuation and other considerations of attractiveness (such as quality/sustainability metrics) helped to add value, as did a decision to avoid overexposure to the most highly leveraged companies during the credit crisis. However, the inconsistency of momentum variables caused the fund’s returns to lag its benchmark for the reporting period overall.
The fund’s relative performance was particularly weak in the economically sensitive basic materials sector, where steelmaker AK Steel Holding and fertilizer producer CF Industries Holdings declined along with commodity prices during the downturn, prompting us to sell the fund’s positions. Commercial real estate firms ProLogis and Jones Lang Lasalle also suffered in the recession, leading to their elimination from the portfolio. Construction services provider Jacobs Engineering Group and industrial goods and services firm SPX declined after both companies lowered 2009 earnings forecasts. Among consumer discretionary com-panies,apparel retailer Urban Outfitters was hurt by consumers’renewed preference for less expensive goods and was sold during the reporting
4
period. Health care research firm Pharmaceutical Product Development declined due to cost cutting by its customers. Commercial bank SVB Financial Group suffered due to loan defaults,and we sold the stock after it rebounded somewhat in the summer.
The fund also held its share of better performers across a variety of market sectors during the reporting period. Restaurant chain Cheesecake Factory and discount retailers DollarTree and Family Dollar Stores benefited from greater cost-consciousness among consumers. Clothing retailer Aeropostale successfully attracted teens with a strong product mix. ITT Education Services climbed as newly unemployed workers sought retraining. Oil and gas producer Southwestern Energy announced that certain reserves exceeded production estimates, and we sold the stock after it rallied. Construction materials provider Carlisle Cos. reported better-than-expected earnings. Heavy equipment manufacturer Oshkosh gained value after winning a large military contract. Bottler PepsiAmericas received an acquisition offer from PepsiCo, boosting its stock price.
Seeking Attractively Valued, High-Quality Companies
As always, we have maintained our disciplined investment process, which seeks attractively valued, high-quality companies with favorable momentum characteristics.Although market volatility has remained elevated, we have seen recent evidence that investors are focusing more closely on underlying fundamentals. We believe that our process will work more effectively if, as we expect, investors continue to return to rational decision-making under less onerous economic and market conditions.
September 15, 2009
| 1 | Total return includes reinvestment of dividends and any capital gains paid, and does not take into consideration the maximum initial sales charges in the case of Class A shares, or the applicable contingent deferred sales charges imposed on redemptions in the case of Class B and Class C shares. Had these charges been reflected, returns would have been lower. Past performance is no guarantee of future results. Share price, yield and investment return fluctuate such that upon redemption, fund shares may be worth more or less than their original cost. |
| |
| 2 | SOURCE: LIPPER INC. — Reflects reinvestment of dividends and, where applicable, capital gain distributions.The Standard & Poor’s MidCap 400 Index is a widely accepted, unmanaged total return index measuring the performance of the midsize company segment of the U.S. market. |
| |
The Fund 5
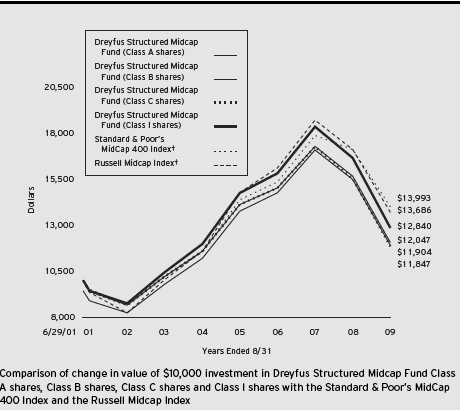
† Source: Lipper Inc.
Past performance is not predictive of future performance.
The above graph compares a $10,000 investment made in Class A, Class B, Class C and Class I shares of Dreyfus Structured Midcap Fund on 6/29/01 (inception date) to a $10,000 investment made in the Standard & Poor’s MidCap 400 Index (the “S&P 400 Index”) and the Russell Midcap Index on that date. All dividends and capital gain distributions are reinvested.
The fund’s performance shown in the line graph takes into account the maximum initial sales charge on Class A shares and all other applicable fees and expenses on all classes.The S&P 400 Index is a widely accepted, unmanaged total return index measuring the performance of the midsize company segment of the U.S. market.The Russell Midcap Index is a widely accepted, unmanaged index of medium-cap stock market performance. Unlike a mutual fund, the indices are not subject to charges, fees and other expenses. Investors cannot invest directly in any index. Further information relating to fund performance, including expense reimbursements, if applicable, is contained in the Financial Highlights section of the prospectus and elsewhere in this report.
6
| Average Annual Total Returns as of 8/31/09 | | | | | | |
| |
| | | Inception | | | | | | From |
| | | Date | | 1 Year | | 5 Years | | Inception |
| |
| |
| |
| |
|
| Class A shares | | | | | | | | |
| with maximum sales charge (5.75%) | | 6/29/01 | | –27.46% | | 0.06% | | 2.16% |
| without sales charge | | 6/29/01 | | –23.02% | | 1.25% | | 2.90% |
| Class B shares | | | | | | | | |
| with applicable redemption charge † | | 6/29/01 | | –26.78% | | 0.06% | | 2.31% |
| without redemption | | 6/29/01 | | –23.73% | | 0.41% | | 2.31% |
| Class C shares | | | | | | | | |
| with applicable redemption charge †† | | 6/29/01 | | –24.36% | | 0.47% | | 2.10% |
| without redemption | | 6/29/01 | | –23.60% | | 0.47% | | 2.10% |
| Class I shares | | 6/29/01 | | –22.78% | | 1.42% | | 3.11% |
Past performance is not predictive of future performance.The fund’s performance shown in the graph and table does not reflect the deduction of taxes that a shareholder would pay on fund distributions or the redemption of fund shares. Performance for Class B shares assumes the conversion of Class B shares to Class A shares at the end of the sixth year following the date of purchase.
| † | | The maximum contingent deferred sales charge for Class B shares is 4%. After six years Class B shares convert to |
| | | Class A shares. |
| †† | | The maximum contingent deferred sales charge for Class C shares is 1% for shares redeemed within one year of the |
| | | date of purchase. |
The Fund 7
UNDERSTANDING YOUR FUND’S EXPENSES (Unaudited)
As a mutual fund investor, you pay ongoing expenses, such as management fees and other expenses. Using the information below, you can estimate how these expenses affect your investment and compare them with the expenses of other funds.You also may pay one-time transaction expenses, including sales charges (loads) and redemption fees, which are not shown in this section and would have resulted in higher total expenses. For more information, see your fund’s prospectus or talk to your financial adviser.
Review your fund’s expenses
The table below shows the expenses you would have paid on a $1,000 investment in Dreyfus Structured Midcap Fund from March 1, 2009 to August 31, 2009. It also shows how much a $1,000 investment would be worth at the close of the period, assuming actual returns and expenses.
| | Expenses and Value of a $1,000 Investment
assuming actual returns for the six months ended August 31, 2009 |
| | | Class A | | Class B | | Class C | | Class I |
| |
| |
| |
| |
|
| Expenses paid per $1,000† | | $ 10.32 | | $ 14.94 | | $ 14.34 | | $ 7.62 |
| Ending value (after expenses) | | $1,436.70 | | $1,429.10 | | $1,430.80 | | $1,438.00 |
COMPARING YOUR FUND’S EXPENSES
WITH THOSE OF OTHER FUNDS (Unaudited) |
Using the SEC’s method to compare expenses
The Securities and Exchange Commission (SEC) has established guidelines to help investors assess fund expenses. Per these guidelines, the table below shows your fund’s expenses based on a $1,000 investment, assuming a hypothetical 5% annualized return. You can use this information to compare the ongoing expenses (but not transaction expenses or total cost) of investing in the fund with those of other funds.All mutual fund shareholder reports will provide this information to help you make this comparison. Please note that you cannot use this information to estimate your actual ending account balance and expenses paid during the period.
| | Expenses and Value of a $1,000 Investment
assuming a hypothetical 5% annualized return for the six months ended August 31, 2009 |
| | | Class A | | Class B | | Class C | | Class I |
| |
| |
| |
| |
|
| Expenses paid per $1,000† | | $ 8.54 | | $ 12.38 | | $ 11.88 | | $ 6.31 |
| Ending value (after expenses) | | $1,016.74 | | $1,012.91 | | $1,013.41 | | $1,018.95 |
| † Expenses are equal to the fund’s annualized expense ratio of 1.68% for Class A, 2.44% for Class B, 2.34% for |
| Class C and 1.24% for Class I, multiplied by the average account value over the period, multiplied by 184/365 (to |
| reflect the one-half year period). |
8
STATEMENT OF INVESTMENTS
August 31, 2009 |
| Common Stocks—99.3% | | Shares | | Value ($) |
| |
| |
|
| Commercial & Professional Services—6.3% | | | | |
| Advent Software | | 7,800 a,b | | 301,782 |
| Avnet | | 19,400 b | | 517,010 |
| Brink’s | | 24,800 | | 653,480 |
| Cintas | | 19,300 | | 529,592 |
| FactSet Research Systems | | 12,300 a | | 676,992 |
| Gartner | | 51,700 a,b | | 861,322 |
| Genuine Parts | | 15,800 | | 585,232 |
| Ingram Micro, Cl. A | | 27,600 b | | 462,576 |
| MPS Group | | 20,300 b | | 200,158 |
| Tech Data | | 43,300 b | | 1,649,730 |
| WESCO International | | 9,700 b | | 233,091 |
| | | | | 6,670,965 |
| Communications—.9% | | | | |
| Telephone & Data Systems | | 21,600 | | 569,592 |
| US Cellular | | 11,100 b | | 405,261 |
| | | | | 974,853 |
| Consumer Durables—2.4% | | | | |
| Callaway Golf | | 32,300 a | | 228,361 |
| Marvel Entertainment | | 20,200 b | | 977,074 |
| Pulte Homes | | 58,100 a | | 742,518 |
| Toll Brothers | | 26,700 b | | 607,158 |
| | | | | 2,555,111 |
| Consumer Non-Durables—4.3% | | | | |
| Dean Foods | | 17,900 b | | 324,706 |
| Hansen Natural | | 7,300 b | | 238,418 |
| Hormel Foods | | 17,000 | | 628,150 |
| Lancaster Colony | | 22,400 | | 1,125,824 |
| PepsiAmericas | | 7,600 | | 212,648 |
| Timberland, Cl. A | | 20,500 b | | 265,680 |
| Tyson Foods, Cl. A | | 20,000 | | 239,800 |
| Universal | | 23,100 a | | 851,928 |
| Warnaco Group | | 18,600 b | | 707,730 |
| | | | | 4,594,884 |
The Fund 9
| STATEMENT OF INVESTMENTS (continued) |
| Common Stocks (continued) | | Shares | | Value ($) |
| |
| |
|
| Consumer Services—5.0% | | | | |
| Apollo Group, Cl. A | | 4,700 b | | 304,654 |
| Boyd Gaming | | 23,000 b | | 236,440 |
| Brinker International | | 48,200 | | 701,792 |
| Cheesecake Factory | | 52,100 b | | 957,077 |
| International Speedway, Cl. A | | 9,400 | | 261,414 |
| ITT Educational Services | | 11,700 a,b | | 1,228,383 |
| Panera Bread, Cl. A | | 17,300 a,b | | 903,233 |
| Scholastic | | 12,000 a | | 292,320 |
| Strayer Education | | 2,100 a | | 443,310 |
| | | | | 5,328,623 |
| Electronic Technology—8.0% | | | | |
| Avocent | | 32,200 b | | 525,504 |
| CommScope | | 28,000 b | | 754,880 |
| Cypress Semiconductor | | 110,400 a,b | | 1,117,248 |
| F5 Networks | | 27,400 b | | 945,026 |
| Garmin | | 7,900 a | | 259,673 |
| Harris | | 13,300 | | 461,909 |
| Integrated Device Technology | | 91,700 b | | 626,311 |
| Intersil, Cl. A | | 49,300 | | 729,640 |
| L-3 Communications Holdings | | 11,500 | | 855,600 |
| Novellus Systems | | 13,000 b | | 249,080 |
| Semtech | | 10,400 b | | 190,008 |
| Synopsys | | 68,100 b | | 1,445,763 |
| Xilinx | | 17,800 | | 395,872 |
| | | | | 8,556,514 |
| Energy Minerals—3.9% | | | | |
| Comstock Resources | | 34,600 b | | 1,222,418 |
| Encore Acquisition | | 46,000 b | | 1,733,740 |
| Frontier Oil | | 62,300 | | 799,309 |
| Tesoro | | 27,600 a | | 388,608 |
| | | | | 4,144,075 |
10
| Common Stocks (continued) | | Shares | | Value ($) |
| |
| |
|
| Finance—19.0% | | | | |
| Alexandria Real Estate Equities | | 12,900 a | | 718,659 |
| American Financial Group | | 48,750 | | 1,250,437 |
| Ameriprise Financial | | 17,300 | | 519,519 |
| Annaly Capital Management | | 30,500 | | 528,870 |
| Camden Property Trust | | 16,100 | | 590,870 |
| Cincinnati Financial | | 15,600 | | 401,232 |
| FirstMerit | | 55,383 | | 995,224 |
| GATX | | 16,600 a | | 455,338 |
| HCC Insurance Holdings | | 39,900 | | 1,054,956 |
| Hospitality Properties Trust | | 55,000 | | 1,002,100 |
| Hudson City Bancorp | | 70,600 | | 926,272 |
| Liberty Property Trust | | 18,800 | | 616,076 |
| Macerich | | 17,400 a | | 498,684 |
| Nasdaq OMX Group | | 22,600 b | | 496,070 |
| New York Community Bancorp | | 44,800 | | 476,672 |
| NewAlliance Bancshares | | 98,800 | | 1,161,888 |
| Old Republic International | | 34,700 | | 413,277 |
| Potlatch | | 13,100 a | | 381,210 |
| Principal Financial Group | | 16,400 | | 465,760 |
| Raymond James Financial | | 61,700 a | | 1,403,675 |
| Regency Centers | | 17,000 a | | 570,350 |
| Reinsurance Group of America | | 13,500 | | 581,175 |
| Rent-A-Center | | 20,200 b | | 398,546 |
| StanCorp Financial Group | | 39,400 | | 1,491,290 |
| UDR | | 67,750 a | | 866,523 |
| Weingarten Realty Investors Trust | | 50,400 a | | 1,000,944 |
| Westamerica Bancorporation | | 18,800 a | | 966,884 |
| | | | | 20,232,501 |
| Health Care Technology—7.6% | | | | |
| Cooper | | 9,400 a | | 256,808 |
| Edwards Lifesciences | | 7,800 b | | 482,664 |
The Fund 11
| STATEMENT OF INVESTMENTS (continued) |
| Common Stocks (continued) | | Shares | | Value ($) |
| |
| |
|
| Health Care Technology (continued) | | | | |
| Endo Pharmaceuticals Holdings | | 45,400 b | | 1,024,678 |
| Gen-Probe | | 23,200 b | | 894,360 |
| OSI Pharmaceuticals | | 30,200 a,b | | 1,009,284 |
| Resmed | | 17,400 b | | 798,834 |
| Sepracor | | 38,000 b | | 689,700 |
| STERIS | | 32,900 | | 954,758 |
| Techne | | 9,900 | | 610,533 |
| Valeant Pharmaceuticals International | | 40,100 a,b | | 1,038,189 |
| Varian Medical Systems | | 7,500 a,b | | 323,025 |
| | | | | 8,082,833 |
| Industrial Services—4.5% | | | | |
| Cameron International | | 26,700 b | | 953,457 |
| Dycom Industries | | 87,000 b | | 976,140 |
| Granite Construction | | 20,400 a | | 654,840 |
| Jacobs Engineering Group | | 9,100 b | | 400,218 |
| KBR | | 17,600 | | 398,640 |
| Patterson-UTI Energy | | 48,400 | | 643,236 |
| SEACOR Holdings | | 5,300 b | | 403,489 |
| URS | | 8,400 b | | 363,132 |
| | | | | 4,793,152 |
| Non-Energy Minerals—2.1% | | | | |
| Reliance Steel & Aluminum | | 23,500 | | 868,090 |
| Titanium Metals | | 50,200 a | | 412,644 |
| Worthington Industries | | 72,000 a | | 948,240 |
| | | | | 2,228,974 |
| Process Industries—5.8% | | | | |
| Airgas | | 14,500 | | 674,250 |
| Cabot | | 17,000 | | 336,430 |
| Crown Holdings | | 27,800 b | | 690,274 |
| FMC | | 16,200 | | 772,740 |
| Minerals Technologies | | 27,200 | | 1,219,648 |
| Pactiv | | 23,100 b | | 574,035 |
| Scotts Miracle-Gro, Cl. A | | 19,500 | | 793,455 |
12
| Common Stocks (continued) | | Shares | | Value ($) |
| |
| |
|
| Process Industries (continued) | | | | |
| Temple-Inland | | 42,500 | | 718,675 |
| Terra Industries | | 14,100 | | 438,651 |
| | | | | 6,218,158 |
| Producer Manufacturing—8.6% | | | | |
| Bucyrus International | | 26,700 a | | 796,995 |
| Carlisle Cos. | | 34,800 | | 1,148,052 |
| Energizer Holdings | | 3,200 b | | 209,376 |
| Flowserve | | 5,400 | | 465,750 |
| Gardner Denver | | 10,100 b | | 327,947 |
| Gentex | | 29,900 | | 436,241 |
| Hubbell, Cl. B | | 34,000 | | 1,307,980 |
| Joy Global | | 23,700 a | | 920,745 |
| Oshkosh | | 38,700 | | 1,300,320 |
| Pitney Bowes | | 13,700 | | 306,195 |
| SPX | | 6,700 | | 373,056 |
| Teleflex | | 15,900 | | 720,270 |
| Timken | | 24,700 | | 521,417 |
| Wabtec | | 8,200 | | 307,090 |
| | | | | 9,141,434 |
| Retail Trade—7.3% | | | | |
| Advance Auto Parts | | 27,500 a | | 1,163,250 |
| Aeropostale | | 26,250 a,b | | 1,027,687 |
| Barnes & Noble | | 30,800 a | | 637,252 |
| BJ’s Wholesale Club | | 28,100 a,b | | 916,060 |
| Dollar Tree | | 27,000 b | | 1,348,380 |
| Family Dollar Stores | | 14,600 | | 442,088 |
| Foot Locker | | 78,300 | | 834,678 |
| IAC/InterActiveCorp | | 15,100 b | | 279,652 |
| PetSmart | | 32,100 | | 671,211 |
| Regis | | 15,100 a | | 244,318 |
| Sears Holdings | | 3,200 a,b | | 203,040 |
| | | | | 7,767,616 |
The Fund 13
| STATEMENT OF INVESTMENTS (continued) |
| Common Stocks (continued) | | Shares | | Value ($) |
| |
| |
|
| Technology Services—7.6% | | | | |
| Akamai Technologies | | 28,300 b | | 499,212 |
| Alliance Data Systems | | 15,500 a,b | | 861,180 |
| CA | | 28,400 | | 633,036 |
| Computer Sciences | | 24,000 b | | 1,172,400 |
| Fair Isaac | | 30,300 a | | 675,690 |
| Humana | | 26,300 b | | 938,910 |
| LifePoint Hospitals | | 36,400 a,b | | 914,732 |
| Omnicare | | 31,400 a | | 718,746 |
| Pharmaceutical Product Development | | 37,000 | | 744,070 |
| Sybase | | 26,400 b | | 920,040 |
| | | | | 8,078,016 |
| Transportation—.4% | | | | |
| Expeditors International Washington | | 13,400 | | 437,644 |
| Utilities—5.6% | | | | |
| AGL Resources | | 19,000 | | 638,210 |
| Alliant Energy | | 8,500 | | 223,890 |
| American Water Works | | 19,100 | | 383,910 |
| CMS Energy | | 22,500 a | | 301,725 |
| IDACORP | | 18,700 | | 532,576 |
| NV Energy | | 99,600 | | 1,201,176 |
| Southern Union | | 32,200 | | 638,848 |
| UGI | | 56,400 | | 1,438,764 |
| WGL Holdings | | 18,200 a | | 600,600 |
| | | | | 5,959,699 |
| Total Common Stocks | | | | |
| (cost $111,232,985) | | | | 105,765,052 |
| |
| Other Investment—.9% | | | | |
| |
| |
|
| Registered Investment Company; | | | | |
| Dreyfus Institutional Preferred | | | | |
| Plus Money Market Fund | | | | |
| (cost $963,000) | | 963,000 c | | 963,000 |
14
| Investment of Cash Collateral | | | | |
| for Securities Loaned—22.2% | | Shares | | Value ($) |
| |
| |
|
| Registered Investment Company; | | | | |
| Dreyfus Institutional Cash | | | | |
| Advantage Plus Fund | | | | |
| (cost $23,666,759) | | 23,666,759 c | | 23,666,759 |
| |
| Total Investments (cost $135,862,744) | | 122.4% | | 130,394,811 |
| Liabilities, Less Cash and Receivables | | (22.4%) | | (23,878,934) |
| Net Assets | | 100.0% | | 106,515,877 |
| a All or a portion of these securities are on loan. At August 31, 2009, the total market value of the fund’s securities on |
| loan is $22,710,375 and the total market value of the collateral held by the fund is $23,666,759. |
| b Non-income producing security. |
| c Investment in affiliated money market mutual fund. |
| Portfolio Summary (Unaudited)† | | | | |
| |
| | | Value (%) | | | | Value (%) |
| |
| |
| |
|
| Money Market Investments | | 23.1 | | Consumer Services | | 5.0 |
| Finance | | 19.0 | | Industrial Services | | 4.5 |
| Producer Manufacturing | | 8.6 | | Consumer Non-Durables | | 4.3 |
| Electronic Technology | | 8.0 | | Energy Minerals | | 3.9 |
| Health Care Technology | | 7.6 | | Consumer Durables | | 2.4 |
| Technology Services | | 7.6 | | Non-Energy Minerals | | 2.1 |
| Retail Trade | | 7.3 | | Communications | | 0.9 |
| Commercial & Professional Services | | 6.3 | | Transportation | | 0.4 |
| Process Industries | | 5.8 | | | | |
| Utilities | | 5.6 | | | | 122.4 |
| |
| † Based on net assets. | | | | | | |
| See notes to financial statements. | | | | | | |
The Fund 15
| | STATEMENT OF ASSETS AND LIABILITIES
August 31, 2009 |
| | | Cost | | Value |
| |
| |
|
| Assets ($): | | | | |
| Investments in securities—See Statement of Investments (including | | | | |
| securities on loan, valued at $22,710,375)—Note 1(b): | | | | |
| Unaffiliated issuers | | 111,232,985 | | 105,765,052 |
| Affiliated issuers | | 24,629,759 | | 24,629,759 |
| Cash | | | | 105,006 |
| Receivable for shares of Common Stock subscribed | | | | 124,337 |
| Dividends and interest receivable | | | | 114,066 |
| | | | | 130,738,220 |
| Liabilities ($): | | | | |
| Due to The Dreyfus Corporation and affiliates—Note 3(c) | | | | 136,039 |
| Liability for securities on loan—Note 1(b) | | | | 23,666,759 |
| Payable for shares of Common Stock redeemed | | | | 322,658 |
| Accrued expenses | | | | 96,887 |
| | | | | 24,222,343 |
| Net Assets ($) | | | | 106,515,877 |
| Composition of Net Assets ($): | | | | |
| Paid-in capital | | | | 163,814,126 |
| Accumulated undistributed investment income—net | | | | 216,468 |
| Accumulated net realized gain (loss) on investments | | | | (52,046,784) |
| Accumulated net unrealized appreciation | | | | |
| (depreciation) on investments | | | | (5,467,933) |
| Net Assets ($) | | | | 106,515,877 |
| Net Asset Value Per Share | | | | | | | | |
| | | Class A | | Class B | | Class C | | Class I |
| |
| |
| |
| |
|
| Net Assets ($) | | 46,779,975 | | 2,113,273 | | 11,498,833 | | 46,123,796 |
| Shares Outstanding | | 3,435,284 | | 165,171 | | 896,757 | | 3,343,750 |
| Net Asset Value Per Share ($) | | 13.62 | | 12.79 | | 12.82 | | 13.79 |
| |
| See notes to financial statements. | | | | | | | | |
16
STATEMENT OF OPERATIONS
Year Ended August 31, 2009 |
| Investment Income ($): | | |
| Income: | | |
| Cash dividends: | | |
| Unaffiliated issuers | | 2,226,623 |
| Affiliated issuers | | 7,076 |
| Income from securities lending | | 103,467 |
| Total Income | | 2,337,166 |
| Expenses: | | |
| Management fee—Note 3(a) | | 786,108 |
| Shareholder servicing costs—Note 3(c) | | 441,981 |
| Distribution fees—Note 3(b) | | 118,203 |
| Registration fees | | 90,701 |
| Professional fees | | 36,484 |
| Prospectus and shareholders’ reports | | 25,388 |
| Custodian fees—Note 3(c) | | 21,046 |
| Directors’ fees and expenses—Note 3(d) | | 9,956 |
| Loan commitment fees—Note 2 | | 328 |
| Interest expense—Note 2 | | 32 |
| Miscellaneous | | 30,185 |
| Total Expenses | | 1,560,412 |
| Less—reduction in fees due to | | |
| earnings credits—Note 1(b) | | (8,188) |
| Net Expenses | | 1,552,224 |
| Investment Income—Net | | 784,942 |
| Realized and Unrealized Gain (Loss) on Investments—Note 4 ($): | | |
| Net realized gain (loss) on investments | | (40,768,072) |
| Net unrealized appreciation (depreciation) on investments | | (2,211,689) |
| Net Realized and Unrealized Gain (Loss) on Investments | | (42,979,761) |
| Net (Decrease) in Net Assets Resulting from Operations | | (42,194,819) |
| |
| See notes to financial statements. | | |
The Fund 17
STATEMENT OF CHANGES IN NET ASSETS
| | | Year Ended August 31, |
| | |
|
| | | 2009a | | 2008 |
| |
| |
|
| Operations ($): | | | | |
| Investment income—net | | 784,942 | | 366,899 |
| Net realized gain (loss) on investments | | (40,768,072) | | (11,417,554) |
| Net unrealized appreciation | | | | |
| (depreciation) on investments | | (2,211,689) | | (7,174,853) |
| Net Increase (Decrease) in Net Assets | | | | |
| Resulting from Operations | | (42,194,819) | | (18,225,508) |
| Dividends to Shareholders from ($): | | | | |
| Investment income—net: | | | | |
| Class A Shares | | (253,493) | | — |
| Class I Shares | | (390,769) | | — |
| Class T Shares | | (33,878) | | — |
| Net realized gain on investments: | | | | |
| Class A Shares | | — | | (6,419,449) |
| Class B Shares | | — | | (341,383) |
| Class C Shares | | — | | (1,833,279) |
| Class I Shares | | — | | (1,721,761) |
| Class T Shares | | — | | (884,934) |
| Total Dividends | | (678,140) | | (11,200,806) |
| Capital Stock Transactions ($): | | | | |
| Net proceeds from shares sold: | | | | |
| Class A Shares | | 53,110,868 | | 25,179,750 |
| Class B Shares | | 13,248 | | 241,165 |
| Class C Shares | | 629,342 | | 4,648,528 |
| Class I Shares | | 9,165,836 | | 47,784,703 |
| Class T Shares | | 1,320,992 | | 5,125,879 |
18
| | | Year Ended August 31, |
| | |
|
| | | 2009a | | 2008 |
| |
| |
|
| Capital Stock Transactions ($) (continued): | | | | |
| Dividends reinvested: | | | | |
| Class A Shares | | 236,680 | | 6,017,415 |
| Class B Shares | | — | | 242,137 |
| Class C Shares | | — | | 927,089 |
| Class I Shares | | 390,769 | | 1,721,761 |
| Class T Shares | | 22,206 | | 732,431 |
| Cost of shares redeemed: | | | | |
| Class A Shares | | (51,488,675) | | (61,130,578) |
| Class B Shares | | (853,379) | | (1,372,745) |
| Class C Shares | | (5,623,019) | | (7,286,636) |
| Class I Shares | | (10,521,843) | | (12,361,811) |
| Class T Shares | | (9,355,140) | | (4,733,368) |
| Increase (Decrease) in Net Assets | | | | |
| from Capital Stock Transactions | | (12,952,115) | | 5,735,720 |
| Total Increase (Decrease) in Net Assets | | (55,825,074) | | (23,690,594) |
| Net Assets ($): | | | �� | |
| Beginning of Period | | 162,340,951 | | 186,031,545 |
| End of Period | | 106,515,877 | | 162,340,951 |
| Undistributed investment income—net | | 216,468 | | 301,089 |
The Fund 19
| STATEMENT OF CHANGES IN NET ASSETS (continued) |
| | | Year Ended August 31, |
| | |
|
| | | 2009a | | 2008 |
| |
| |
|
| Capital Share Transactions: | | | | |
| Class Ab,c | | | | |
| Shares sold | | 4,923,358 | | 1,305,073 |
| Shares issued for dividends reinvested | | 21,652 | | 314,554 |
| Shares redeemed | | (4,926,075) | | (3,303,396) |
| Net Increase (Decrease) in Shares Outstanding | | 18,935 | | (1,683,769) |
| Class Bb | | | | |
| Shares sold | | 1,156 | | 13,400 |
| Shares issued for dividends reinvested | | — | | 13,355 |
| Shares redeemed | | (76,340) | | (76,959) |
| Net Increase (Decrease) in Shares Outstanding | | (75,184) | | (50,204) |
| Class C | | | | |
| Shares sold | | 55,024 | | 252,307 |
| Shares issued for dividends reinvested | | — | | 51,137 |
| Shares redeemed | | (502,625) | | (411,276) |
| Net Increase (Decrease) in Shares Outstanding | | (447,601) | | (107,832) |
| Class I | | | | |
| Shares sold | | 758,746 | | 2,571,193 |
| Shares issued for dividends reinvested | | 35,396 | | 88,888 |
| Shares redeemed | | (871,331) | | (659,030) |
| Net Increase (Decrease) in Shares Outstanding | | (77,189) | | 2,001,051 |
| Class Tc | | | | |
| Shares sold | | 111,711 | | 274,013 |
| Shares issued for dividends reinvested | | 2,064 | | 38,856 |
| Shares redeemed | | (869,082) | | (255,401) |
| Net Increase (Decrease) in Shares Outstanding | | (755,307) | | 57,468 |
| a Effective as of the close of business on February 4, 2009, the fund no longer offers Class T shares. |
| b During the period ended August 31, 2009, 19,216 Class B shares representing $225,000 were automatically |
| converted to 18,084 Class A shares and during the period ended August 31, 2008, 15,447 Class B shares |
| representing $288,565 were automatically converted to 14,653 Class A shares. |
| c On the close of business on February 4, 2009, 483,824 Class T shares representing $5,138,211 were converted to |
| 476,643 Class A shares. |
| See notes to financial statements. |
20
FINANCIAL HIGHLIGHTS
The following tables describe the performance for each share class for the fiscal periods indicated.All information (except portfolio turnover rate) reflects financial results for a single fund share.Total return shows how much your investment in the fund would have increased (or decreased) during each period, assuming you had reinvested all dividends and distributions.These figures have been derived from the fund’s financial statements.
| | | | | Year Ended August 31, | | |
| | |
| |
| |
|
| Class A Shares | | 2009 | | 2008 | | 2007 | | 2006 | | 2005 |
| |
| |
| |
| |
| |
|
| Per Share Data ($): | | | | | | | | | | |
| Net asset value, beginning of period | | 17.80 | | 20.93 | | 18.57 | | 17.75 | | 14.74 |
| Investment Operations: | | | | | | | | | | |
| Investment income (loss)—neta | | .09 | | .06 | | .05 | | .02 | | (.02) |
| Net realized and unrealized | | | | | | | | | | |
| gain (loss) on investments | | (4.20) | | (1.93) | | 2.85 | | 1.25 | | 3.36 |
| Total from Investment Operations | | (4.11) | | (1.87) | | 2.90 | | 1.27 | | 3.34 |
| Distributions: | | | | | | | | | | |
| Dividends from investment income—net | | (.07) | | — | | — | | — | | — |
| Dividends from net realized | | | | | | | | | | |
| gain on investments | | — | | (1.26) | | (.54) | | (.45) | | (.33) |
| Total Distributions | | (.07) | | (1.26) | | (.54) | | (.45) | | (.33) |
| Net asset value, end of period | | 13.62 | | 17.80 | | 20.93 | | 18.57 | | 17.75 |
| Total Return (%)b | | (23.02) | | (9.37) | | 15.76 | | 7.23 | | 22.88 |
| Ratios/Supplemental Data (%): | | | | | | | | | | |
| Ratio of total expenses | | | | | | | | | | |
| to average net assets | | 1.52 | | 1.22 | | 1.22 | | 1.35 | | 1.71 |
| Ratio of net expenses | | | | | | | | | | |
| to average net assets | | 1.51 | | 1.22c | | 1.22c | | 1.34 | | 1.46 |
| Ratio of net investment income | | | | | | | | | | |
| (loss) to average net assets | | .74 | | .32 | | .26 | | .09 | | (.11) |
| Portfolio Turnover Rate | | 102.59 | | 88.40 | | 122.16 | | 119.22 | | 160.45 |
| Net Assets, end of period ($ x 1,000) | | 46,780 | | 60,795 | | 106,762 | | 37,056 | | 18,910 |
| a | | Based on average shares outstanding at each month end. |
| b | | Exclusive of sales charge. |
| c | | Expense waivers and/or reimbursements amounted to less than .01%. |
| See notes to financial statements. |
The Fund 21
| FINANCIAL HIGHLIGHTS (continued) |
| | | | | Year Ended August 31, | | |
| | |
| |
| |
|
| Class B Shares | | 2009 | | 2008 | | 2007 | | 2006 | | 2005 |
| |
| |
| |
| |
| |
|
| Per Share Data ($): | | | | | | | | | | |
| Net asset value, beginning of period | | 16.77 | | 19.96 | | 17.87 | | 17.23 | | 14.43 |
| Investment Operations: | | | | | | | | | | |
| Investment (loss)—neta | | (.01) | | (.09) | | (.12) | | (.13) | | (.15) |
| Net realized and unrealized | | | | | | | | | | |
| gain (loss) on investments | | (3.97) | | (1.84) | | 2.75 | | 1.22 | | 3.28 |
| Total from Investment Operations | | (3.98) | | (1.93) | | 2.63 | | 1.09 | | 3.13 |
| Distributions: | | | | | | | | | | |
| Dividends from net realized | | | | | | | | | | |
| gain on investments | | — | | (1.26) | | (.54) | | (.45) | | (.33) |
| Net asset value, end of period | | 12.79 | | 16.77 | | 19.96 | | 17.87 | | 17.23 |
| Total Return (%)b | | (23.73) | | (10.16) | | 14.91 | | 6.33 | | 21.90 |
| Ratios/Supplemental Data (%): | | | | | | | | | | |
| Ratio of total expenses | | | | | | | | | | |
| to average net assets | | 2.34 | | 2.07 | | 2.09 | | 2.20 | | 2.62 |
| Ratio of net expenses | | | | | | | | | | |
| to average net assets | | 2.34c | | 2.07c | | 2.08 | | 2.17 | | 2.30 |
| Ratio of net investment (loss) | | | | | | | | | | |
| to average net assets | | (.11) | | (.53) | | (.62) | | (.73) | | (.96) |
| Portfolio Turnover Rate | | 102.59 | | 88.40 | | 122.16 | | 119.22 | | 160.45 |
| Net Assets, end of period ($ x 1,000) | | 2,113 | | 4,030 | | 5,798 | | 5,646 | | 5,288 |
| a | | Based on average shares outstanding at each month end. |
| b | | Exclusive of sales charge. |
| c | | Expense waivers and/or reimbursements amounted to less than .01%. |
| See notes to financial statements. |
22
| | | | | Year Ended August 31, | | |
| | |
| |
| |
|
| Class C Shares | | 2009 | | 2008 | | 2007 | | 2006 | | 2005 |
| |
| |
| |
| |
| |
|
| Per Share Data ($): | | | | | | | | | | |
| Net asset value, beginning of period | | 16.78 | | 19.96 | | 17.86 | | 17.23 | | 14.42 |
| Investment Operations: | | | | | | | | | | |
| Investment income (loss)—neta | | .00b | | (.08) | | (.11) | | (.12) | | (.15) |
| Net realized and unrealized | | | | | | | | | | |
| gain (loss) on investments | | (3.96) | | (1.84) | | 2.75 | | 1.20 | | 3.29 |
| Total from Investment Operations | | (3.96) | | (1.92) | | 2.64 | | 1.08 | | 3.14 |
| Distributions: | | | | | | | | | | |
| Dividends from net realized | | | | | | | | | | |
| gain on investments | | — | | (1.26) | | (.54) | | (.45) | | (.33) |
| Net asset value, end of period | | 12.82 | | 16.78 | | 19.96 | | 17.86 | | 17.23 |
| Total Return (%)c | | (23.60) | | (10.10) | | 14.91 | | 6.39 | | 21.91 |
| Ratios/Supplemental Data (%): | | | | | | | | | | |
| Ratio of total expenses | | | | | | | | | | |
| to average net assets | | 2.23 | | 2.01 | | 2.01 | | 2.12 | | 2.45 |
| Ratio of net expenses | | | | | | | | | | |
| to average net assets | | 2.22 | | 2.00 | | 2.01d | | 2.12d | | 2.25 |
| Ratio of net investment income | | | | | | | | | | |
| (loss) to average net assets | | .01 | | (.46) | | (.55) | | (.68) | | (.90) |
| Portfolio Turnover Rate | | 102.59 | | 88.40 | | 122.16 | | 119.22 | | 160.45 |
| Net Assets, end of period ($ x 1,000) | | 11,499 | | 22,554 | | 28,984 | | 21,865 | | 13,395 |
| a | | Based on average shares outstanding at each month end. |
| b | | Amount represents less than $.01 per share. |
| c | | Exclusive of sales charge. |
| d | | Expense waivers and/or reimbursements amounted to less than .01%. |
| See notes to financial statements. |
The Fund 23
| FINANCIAL HIGHLIGHTS (continued) |
| | | | | Year Ended August 31, | | |
| | |
| |
| |
|
| Class I Shares | | 2009 | | 2008 | | 2007a | | 2006 | | 2005 |
| |
| |
| |
| |
| |
|
| Per Share Data ($): | | | | | | | | | | |
| Net asset value, beginning of period | | 18.05 | | 21.18 | | 18.75 | | 17.91 | | 14.85 |
| Investment Operations: | | | | | | | | | | |
| Investment income—netb | | .12 | | .10 | | .09 | | .04 | | .00c |
| Net realized and unrealized | | | | | | | | | | |
| gain (loss) on investments | | (4.26) | | (1.97) | | 2.88 | | 1.25 | | 3.39 |
| Total from Investment Operations | | (4.14) | | (1.87) | | 2.97 | | 1.29 | | 3.39 |
| Distributions: | | | | | | | | | | |
| Dividends from investment income—net | | (.12) | | — | | — | | — | | — |
| Dividends from net realized | | | | | | | | | | |
| gain on investments | | — | | (1.26) | | (.54) | | (.45) | | (.33) |
| Total Distributions | | (.12) | | (1.26) | | (.54) | | (.45) | | (.33) |
| Net asset value, end of period | | 13.79 | | 18.05 | | 21.18 | | 18.75 | | 17.91 |
| Total Return (%) | | (22.78) | | (9.25) | | 15.99 | | 7.28 | | 23.05 |
| Ratios/Supplemental Data (%): | | | | | | | | | | |
| Ratio of total expenses | | | | | | | | | | |
| to average net assets | | 1.18 | | 1.04 | | 1.13 | | 2.08 | | 1.73 |
| Ratio of net expenses | | | | | | | | | | |
| to average net assets | | 1.17 | | 1.03 | | 1.07 | | 1.21 | | 1.29 |
| Ratio of net investment income | | | | | | | | | | |
| to average net assets | | 1.01 | | .51 | | .41 | | .24 | | .05 |
| Portfolio Turnover Rate | | 102.59 | | 88.40 | | 122.16 | | 119.22 | | 160.45 |
| Net Assets, end of period ($ x 1,000) | | 46,124 | | 61,738 | | 30,071 | | 5,491 | | 2,068 |
| a | | Effective June 1, 2007, Class R shares were redesignated as Class I shares. |
| b | | Based on average shares outstanding at each month end. |
| c | | Amount represents less than $.01 per share. |
| See notes to financial statements. |
24
NOTES TO FINANCIAL STATEMENTS
NOTE 1—Significant Accounting Policies:
Dreyfus Structured Midcap Fund (the “fund”) is a separate diversified series of Advantage Funds, Inc. (the “Company”), which is registered under the Investment Company Act of 1940, as amended (the “Act”), as an open-end management investment company and operates as a series company that offers ten series, including the fund. The fund’s investment objective is long-term capital growth. The Dreyfus Corporation (the “Manager” or “Dreyfus”), a wholly-owned subsidiary of The Bank of New York Mellon Corporation (“BNY Mellon”), serves as the fund’s investment adviser. Mellon Capital Management Corporation (“Mellon Capital”), an affiliate of Dreyfus, serves as the fund’s sub-investment adviser. Franklin Portfolio Associates, LLC (“Franklin Portfolio”), the fund’s former sub-investment adviser, merged into Mellon Capital on January 1, 2009.
At a meeting of the fund’s Board of Directors held on July 15, 2008, the Board approved, effective December 1, 2008, a proposal to change the name of the fund from “Dreyfus Premier Structured Midcap Fund” to “Dreyfus Structured Midcap Fund”.
MBSC Securities Corporation (the “Distributor”), a wholly-owned subsidiary of the Manager, is the distributor of the fund’s shares. The fund is authorized to issue 400 million shares of $.001 par value Common Stock.The fund currently offers four classes of shares: Class A (100 million shares authorized), Class B (100 million shares authorized), Class C (100 million shares authorized) and Class I (100 million shares authorized). Class A shares are subject to a sales charge imposed at the time of purchase. Class B shares are subject to a contingent deferred sales charge (“CDSC”) imposed on Class B share redemptions made within six years of purchase and automatically convert to Class A shares after six years.The fund does not offer Class B shares except in connection with dividend reinvestment and permitted exchanges of Class B shares. Class C shares are subject to a CDSC imposed on
The Fund 25
| NOTES TO FINANCIAL STATEMENTS (continued) |
Class C shares redeemed within one year of purchase. Class I shares are sold at net asset value per share only to institutional investors. Other differences between the classes include the services offered to and the expenses borne by each class, the allocation of certain transfer agency costs and certain voting rights. Income, expenses (other than expenses attributable to a specific class), and realized and unrealized gains or losses on investments are allocated to each class of shares based on its relative net assets.
Effective December 3, 2008, investments for new accounts were no longer permitted in Class T shares of the fund, except that participants in certain group retirement plans were able to open a new account in Class T shares of the fund, provided that the fund was established as an investment option under the plans before December 3, 2008. On February 4, 2009, the fund issued to each holder of its Class T shares, in exchange for said shares, Class A shares of the fund having an aggregate net asset value equal to the aggregate net asset value of the shareholder’s Class T shares. Subsequent investments in the fund’s Class A shares made by prior holders of the fund’s Class T shares who received Class A shares of the fund in exchange for their Class T shares are subject to the front-end sales load schedule that was in effect for Class T shares at the time of the exchange. Otherwise, all other Class A share attributes will be in effect. Effective as of the close of business on February 4, 2009, the fund no longer offers Class T shares.
The Company accounts separately for the assets, liabilities and operations of each series. Expenses directly attributable to each series are charged to that series’ operations; expenses which are applicable to all series are allocated among them on a pro rata basis.
The fund’s financial statements are prepared in accordance with U.S. generally accepted accounting principles, which may require the use of management estimates and assumptions. Actual results could differ from those estimates.
26
The fund enters into contracts that contain a variety of indemnifications. The fund’s maximum exposure under these arrangements is unknown.The fund does not anticipate recognizing any loss related to these arrangements.
(a) Portfolio valuation: Investments in securities are valued at the last sales price on the securities exchange or national securities market on which such securities are primarily traded. Securities listed on the National Market System for which market quotations are available are valued at the official closing price or, if there is no official closing price that day, at the last sales price. Securities not listed on an exchange or the national securities market, or securities for which there were no transactions, are valued at the average of the most recent bid and asked prices, except for open short positions, where the asked price is used for valuation purposes. Bid price is used when no asked price is available. Registered investment companies that are not traded on an exchange are valued at their net asset value.When market quotations or official closing prices are not readily available, or are determined not to reflect accurately fair value, such as when the value of a security has been significantly affected by events after the close of the exchange or market on which the security is principally traded (for example, a foreign exchange or market), but before the fund calculates its net asset value, the fund may value these investments at fair value as determined in accordance with the procedures approved by the Board of Directors. Fair valuing of securities may be determined with the assistance of a pricing service using calculations based on indices of domestic securities and other appropriate indicators, such as prices of relevant ADRs and futures contracts. For other securities that are fair valued by the Board of Directors, certain factors may be considered such as: fundamental analytical data, the nature and duration of restrictions on disposition, an evaluation of the forces that influence the market in which the securities are purchased and sold, and pub-
The Fund 27
| NOTES TO FINANCIAL STATEMENTS (continued) |
lic trading in similar securities of the issuer or comparable issuers. Financial futures are valued at the last sales price.
The fund adopted Statement of Financial Accounting Standards No. 157 “FairValue Measurements” (“FAS 157”). FAS 157 establishes an authoritative definition of fair value, sets out a framework for measuring fair value, and requires additional disclosures about fair value measurements.
Various inputs are used in determining the value of the fund’s investments relating to FAS 157.These inputs are summarized in the three broad levels listed below.
| | Level 1—quoted prices in active markets for identical investments.
Level 2—other significant observable inputs (including quoted
prices for similar investments, interest rates, prepayment speeds,
credit risk, etc.).
Level 3—significant unobservable inputs (including the fund’s own
assumptions in determining the fair value of investments). |
The inputs or methodology used for valuing securities are not necessarily an indication of the risk associated with investing in those securities.
The following is a summary of the inputs used as of August 31, 2009 in valuing the fund’s investments:
| | | | | Level 2—Other | | Level 3— | | |
| | | Level 1— | | Significant | | Significant | | |
| | | Quoted | | Observable | | Unobservable | | |
| | | Prices | | Inputs | | Inputs | | Total |
| |
| |
| |
| |
|
| Assets ($) | | | | | | | | |
| Investments in Securities: | | | | | | |
| Equity Securities— | | | | | | | | |
| Domestic | | 105,765,052 | | — | | — | | 105,765,052 |
| Mutual Funds | | 24,629,759 | | — | | — | | 24,629,759 |
| Other Financial | | | | | | | | |
| Instruments† | | — | | — | | — | | — |
| Liabilities ($) | | | | | | | | |
| Other Financial | | | | | | | | |
| Instruments† | | — | | — | | — | | — |
| † Other financial instruments include derivative instruments, such as futures, forward foreign currency |
| exchange contracts, swap contracts and options contracts. Amounts shown represent unrealized |
| appreciation (depreciation), or in the case of options, market value at period end. |
28
(b) Securities transactions and investment income: Securities transactions are recorded on a trade date basis. Realized gains and losses from securities transactions are recorded on the identified cost basis. Dividend income is recognized on the ex-dividend date and interest income, including accretion of discount and amortization of premium on investments, is recognized on the accrual basis.
The fund has arrangements with the custodian and cash management bank whereby the fund may receive earnings credits when positive cash balances are maintained, which are used to offset custody and cash management fees. For financial reporting purposes, the fund includes net earnings credits as an expense offset in the Statement of Operations.
Pursuant to a securities lending agreement with The Bank of New York Mellon, a subsidiary of BNY Mellon and an affiliate of Dreyfus, the fund may lend securities to qualified institutions. It is the fund’s policy that, at origination, all loans are secured by collateral of at least 102% of the value of U.S. securities loaned and 105% of the value of foreign securities loaned. Collateral equivalent to at least 100% of the market value of securities on loan is maintained at all times. Collateral is either in the form of cash, which can be invested in certain money market mutual funds managed by Dreyfus, U.S Government and Agency securities or letters of credit.The fund is entitled to receive all income on securities loaned, in addition to income earned as a result of the lending transaction. Although each security loaned is fully collateralized, the fund bears the risk of delay in recovery of, or loss of rights in, the securities loaned should a borrower fail to return the securities in a timely manner. During the period ended August 31, 2009, The Bank of New York Mellon earned $44,343 from lending fund portfolio securities, pursuant to the securities lending agreement.
(c) Affiliated issuers: Investments in other investment companies advised by Dreyfus are defined as “affiliated” in the Act.
(d) Dividends to shareholders: Dividends are recorded on the ex-dividend date. Dividends from investment income-net and dividends from net realized capital gains are normally declared and paid annually,
The Fund 29
| NOTES TO FINANCIAL STATEMENTS (continued) |
but the fund may make distributions on a more frequent basis to comply with the distribution requirements of the Internal Revenue Code of 1986, as amended (the “Code”).To the extent that net realized capital gains can be offset by capital loss carryovers, it is the policy of the fund not to distribute such gains. Income and capital gain distributions are determined in accordance with income tax regulations, which may differ from U.S. generally accepted accounting principles.
(e) Federal income taxes: It is the policy of the fund to continue to qualify as a regulated investment company, if such qualification is in the best interests of its shareholders, by complying with the applicable provisions of the Code, and to make distributions of taxable income sufficient to relieve it from substantially all federal income and excise taxes.
As of and during the period ended August 31, 2009, the fund did not have any liabilities for any uncertain tax positions.The fund recognizes interest and penalties, if any, related to uncertain tax positions as income tax expense in the Statement of Operations. During the period, the fund did not incur any interest or penalties.
Each of the tax years in the four-year period ended August 31, 2009 remains subject to examination by the Internal Revenue Service and state taxing authorities.
At August 31, 2009, the components of accumulated earnings on a tax basis were as follows: undistributed ordinary income $136,836, accumulated capital losses $17,388,744 and unrealized depreciation $5,461,452. In addition, the fund had $34,584,889 of capital losses realized after October 31, 2008, which were deferred for tax purposes to the first day of the following fiscal year.
The accumulated capital loss carryover is available for federal income tax purposes to be applied against future net securities profits, if any, realized subsequent to August 31, 2009. If not applied, the carryover expires in fiscal 2017.
30
The tax character of distributions paid to shareholders during the fiscal periods ended August 31, 2009 and August 31, 2008 were as follows: ordinary income $678,140 and $6,535,645 and long-term capital gains $0 and $4,665,161, respectively.
During the period ended August 31, 2009, as a result of permanent book to tax differences, primarily due to the tax treatment for real estate investment trusts, the fund decreased accumulated undistributed investment income-net by $191,423 and increased accumulated net realized gain (loss) on investments by the same amount. Net assets and net asset value per share were not affected by this reclassification.
NOTE 2—Bank Line of Credit:
The fund participates with other Dreyfus-managed funds in a $300 million unsecured line of credit provided by The Bank of New York Mellon (the “BNYM Facility”) primarily to be utilized for temporary or emergency purposes, including the financing of redemptions. The terms of the BNYM Facility limit the amount of individual fund borrowings. Interest is charged to the fund based on prevailing market rates in effect at the time of borrowing. Effective October 15, 2008, in connection therewith, the fund has agreed to pay commitment fees on its pro rata portion of the BNYM Facility.
The average amount of borrowings outstanding under the BNYM Facility during the period ended August 31, 2009 was approximately $1,800, with a related weighted average annualized interest rate of 1.81%.
NOTE 3—Management Fee, Sub-Investment Advisory Fee and Other Transactions With Affiliates:
(a) Pursuant to a management agreement with Dreyfus, the management fee is computed at the annual rate of .75% of the value of the fund’s average daily net assets and is payable monthly.
The Fund 31
| NOTES TO FINANCIAL STATEMENTS (continued) |
Pursuant to a Sub-Investment Advisory Agreement between Dreyfus and Mellon Capital, the sub-investment advisory fee is payable monthly by Dreyfus, and is based upon the value of the fund’s average daily net assets, computed at the following annual rates:
| Average Net Assets | | |
| 0 up to $100 million | | .25% |
| $100 million up to $1 billion | | .20% |
| $1 billion up to $1.5 billion | | .16% |
| In excess of $1.5 billion | | .10% |
During the period ended August 31, 2009, the Distributor retained $2,297 from commissions earned on sales of the fund’s Class A shares and $6,921 and $5,834 from CDSCs on redemptions of the fund’s Class B and Class C shares, respectively.
(b) Under the Distribution Plan (the “Plan”) adopted pursuant to Rule 12b-1 under the Act, Class B and Class C shares pay and Class T shares paid the Distributor for distributing their shares at an annual rate of .75% of the value of the average daily net assets of Class B and Class C shares and .25% of the value of the average daily net assets of ClassT shares. During the period ended August 31, 2009, Class B, Class C and Class T shares were charged $16,855, $91,592 and $9,756, respectively, pursuant to the Plan.
(c) Under the Shareholder Services Plan, Class A, Class B and Class C shares pay and Class T shares paid the Distributor at an annual rate of .25% of the value of their average daily net assets for the provision of certain services. The services provided may include personal services relating to shareholder accounts, such as answering shareholder inquiries regarding the fund and providing reports and other information, and services related to the maintenance of shareholder accounts. The Distributor may make payments to Service Agents (a securities dealer, financial institution or industry professional) in respect of these services.The Distributor determines the amounts to be paid to Service
32
Agents. During the period ended August 31, 2009, Class A, Class B, Class C and Class T shares were charged $114,909, $5,618, $30,531 and $9,756, respectively, pursuant to the Shareholder Services Plan.
The fund compensates Dreyfus Transfer, Inc., a wholly-owned subsidiary of Dreyfus, under a transfer agency agreement for providing personnel and facilities to perform transfer agency services for the fund. During the period ended August 31, 2009, the fund was charged $93,875 pursuant to the transfer agency agreement.
The fund compensates The Bank of New York Mellon under a cash management agreement for performing cash management services related to fund subscriptions and redemptions. During the period ended August 31, 2009, the fund was charged $6,766 pursuant to the cash management agreement.These fees were offset by earnings credits pursuant to the cash management agreement.
The fund also compensates The Bank of New York Mellon under a custody agreement for providing custodial services for the fund. During the period ended August 31, 2009, the fund was charged $21,046 pursuant to the custody agreement.
During the period ended August 31, 2009, the fund was charged $6,097 for services performed by the Chief Compliance Officer.
The components of “Due to The Dreyfus Corporation and affiliates” in the Statement of Assets and Liabilities consist of: management fees $67,732, Rule 12b-1 distribution plan fees $8,758, shareholder services plan fees $12,792, custody fees $3,372, chief compliance officer fees $2,784 and transfer agency per account fees $40,601.
(d) Each Board member also serves as a Board member of other funds within the Dreyfus complex. Annual retainer fees and attendance fees are allocated to each fund based on net assets.
The Fund 33
| NOTES TO FINANCIAL STATEMENTS (continued) |
NOTE 4—Securities Transactions:
The aggregate amount of purchases and sales of investment securities, excluding short-term securities, during the period ended August 31, 2009, amounted to $109,110,914 and $121,004,700, respectively.
At August 31, 2009, the cost of investments for federal income tax purposes was $135,856,263; accordingly, accumulated net unrealized depreciation on investments was $5,461,452, consisting of $9,410,651 gross unrealized appreciation and $14,872,103 gross unrealized depreciation.
The fund adopted Statement of Financial Accounting Standards No. 161 “Disclosures about Derivative Instruments and Hedging Activities” (“FAS 161”). FAS 161 requires qualitative disclosures about objectives and strategies for using derivatives, quantitative disclosures about fair value amounts of gains and losses on derivative instruments and disclosures about credit-risk-related contingent features in derivative agreements. Since the fund held no derivatives during the period ended August 31, 2009, FAS 161 disclosures did not impact the notes to the financial statements.
NOTE 5—Subsequent Events Evaluation:
Dreyfus has evaluated the need for disclosures and/or adjustments resulting from subsequent events through October 26, 2009, the date the financial statements were issued. This evaluation did not result in any subsequent events that necessitated disclosures and/or adjustments.
34
REPORT OF INDEPENDENT REGISTERED
PUBLIC ACCOUNTING FIRM |
| | Shareholders and Board of Directors
Dreyfus Structured Midcap Fund |
We have audited the accompanying statement of assets and liabilities, including the statement of investments, of Dreyfus Structured Midcap Fund (formerly, Dreyfus Premier Structured Midcap Fund) (one of the series comprising Advantage Funds, Inc.) as of August 31, 2009, and the related statement of operations for the year then ended, the statement of changes in net assets for each of the two years in the period then ended and financial highlights for each of the years indicated therein. These financial statements and financial highlights are the responsibility of the Fund’s management. Our responsibility is to express an opinion on these financial statements and financial highlights based on our audits.
We conducted our audits in accordance with the standards of the Public Company Accounting Oversight Board (United States).Those standards require that we plan and perform the audit to obtain reasonable assurance about whether the financial statements and financial highlights are free of material misstatement.We were not engaged to perform an audit of the Fund’s internal control over financial reporting. Our audits included consideration of internal control over financial reporting as a basis for designing audit procedures that are appropriate in the circumstances, but not for the purpose of expressing an opinion on the effectiveness of the Fund’s internal control over financial reporting. Accordingly, we express no such opinion. An audit also includes examining, on a test basis, evidence supporting the amounts and disclosures in the financial statements and financial highlights, assessing the accounting principles used and significant estimates made by management, and evaluating the overall financial statement presentation. Our procedures included confirmation of securities owned as of August 31, 2009 by correspondence with the custodian and others.We believe that our audits provide a reasonable basis for our opinion.
In our opinion, the financial statements and financial highlights referred to above present fairly, in all material respects, the financial position of Dreyfus Structured Midcap Fund at August 31, 2009, the results of its operations for the year then ended, the changes in its net assets for each of the two years in the period then ended, and the financial highlights for each of the indicated years, in conformity with U.S. generally accepted accounting principles.

New York, New York
October 26, 2009 |
The Fund 35
IMPORTANT TAX INFORMATION (Unaudited)
For federal tax purposes, the fund hereby designates 100% of the ordinary dividends paid during the fiscal year ended August 31, 2009 as qualifying for the corporate dividends received deduction. Also certain dividends paid by the fund may be subject to a maximum tax rate of 15%, as provided for by the Jobs and Growth Tax Relief Reconciliation Act of 2003. Of the distributions paid during the fiscal year, $463,758 represents the maximum amount that may be considered qualified dividend income. Shareholders will receive notification in early 2010 of the percentage applicable to the preparation of their 2009 income tax returns.
36
INFORMATION ABOUT THE REVIEW AND APPROVAL
OF THE FUND’S MANAGEMENT AGREEMENT (Unaudited) |
At a meeting of the fund’s Board held on March 3, 2009, the Board unanimously approved the continuation of the fund’s Management Agreement with Dreyfus and the Sub-Investment Advisory Agreement between Dreyfus and Mellon Capital Management Corporation (“Mellon Capital”) (together, the “Agreements”) for a one-year term ending March 30, 2010.The Board members, none of whom are “interested persons” (as defined in the Investment Company Act of 1940, as amended) of the fund, were assisted in their review by independent legal counsel and met with counsel in executive session separate from representatives of Dreyfus. In approving the continuance of the Agreements, the Board considered all factors that they believed to be relevant, including, among other things, the factors discussed below.
Analysis of Nature, Extent and Quality of Services Provided to the Fund. The Board members received a presentation from representatives of Dreyfus regarding services provided to the fund and other funds in the Dreyfus fund complex, and discussed the nature, extent and quality of the services provided to the fund by Dreyfus and Mellon Capital pursuant to their Agreements. Dreyfus’ representatives reviewed the fund’s distribution of accounts and the relationships Dreyfus has with various intermediaries and the different needs of each. Dreyfus’ representatives noted the various distribution channels for the fund as well as the diverse methods of distribution among other funds in the Dreyfus fund complex, and Dreyfus’ corresponding need for broad, deep, and diverse resources to be able to provide ongoing shareholder services to each distribution channel, including those of the fund. Dreyfus also provided the number of accounts investing in the fund, as well as the fund’s asset size.
The Board members also considered Mellon Capital’s research and portfolio management capabilities and Dreyfus’ oversight of day-to-day fund operations, including fund accounting and administration and assistance in meeting legal and regulatory requirements.The Board members also considered Dreyfus’ extensive administrative, accounting and compliance infrastructure, as well as Dreyfus’ supervisory activities over Mellon Capital. The Board also considered Mellon Capital’s brokerage policies and practices, the standards applied in seeking best execution and Dreyfus’ and Mellon Capital’s policies and practices regarding soft dollars.
The Fund 37
INFORMATION ABOUT THE REVIEW AND APPROVAL OF THE
FUND’S MANAGEMENT AGREEMENT (Unaudited) (continued) |
Comparative Analysis of the Fund’s Performance and Management Fee and Expense Ratio. The Board members reviewed the fund’s performance and comparisons to a group of retail front-end load mid-cap core funds that are benchmarked against the S&P Midcap 400 Index (the “Performance Group”) and to a larger universe of funds, consisting of all retail and institutional mid-cap core funds (the “Performance Universe”) selected and provided by Lipper, Inc., an independent provider of investment company data.The Board was provided with a description of the methodology Lipper used to select the Performance Group and Performance Universe, as well as the Expense Group and Expense Universe (discussed below). The Board members discussed the results of the comparisons and noted the fund’s average annual total return ranked in the third quartile of the Performance Group and Performance Universe for the one-year period ended December 31, 2008. For other periods the fund’s performance was variously above and below the Performance Group and Performance Universe medians. Dreyfus also provided a comparison of the fund’s calendar year total returns to the returns of the fund’s benchmark index.
The Board members also discussed the fund’s contractual and actual management fees and expense ratio and reviewed the range of management fees and expense ratios as compared to a comparable group of funds (the “Expense Group”) and a broader group of funds (the “Expense Universe”), each selected and provided by Lipper.The fund’s contractual management fee was lower than the Expense Group median, the fund’s actual management fee was lower than the Expense Group median and equal to the Expense Universe median and the fund’s expense ratio was lower than the Expense Group and Expense Universe medians.
Representatives of Dreyfus reviewed with the Board members the fees paid to Dreyfus, Mellon Capital or their affiliates by mutual funds and/or separate accounts managed by Dreyfus with similar investment objectives, policies and strategies as the fund (the “Similar Accounts”), and explained the nature of the Similar Accounts and the differences, from Dreyfus’ or Mellon Capital’s perspective, as applicable, in providing services to the Similar Accounts as compared to the fund. Dreyfus’ representatives also reviewed the costs associated with distribution through intermediaries.
38
The Board analyzed differences in fees paid to Dreyfus and Mellon Capital and discussed the relationship of the advisory fees paid in light of the services provided.The Board members considered the relevance of the fee information provided for the Similar Accounts to evaluate the appropriateness and reasonableness of the fund’s management and sub-advisory fees.The Board acknowledged that differences in fees paid by the Similar Accounts seemed to be consistent with the services provided.
The Board also considered the fee to Mellon Capital in relation to the fee paid to Dreyfus and the respective services provided by Mellon Capital and Dreyfus.The Board also noted that Mellon Capital’s fee is paid by Dreyfus and not by the fund.
Analysis of Profitability and Economies of Scale. Dreyfus’ representatives reviewed the dollar amount of expenses allocated and profit received by Dreyfus and the method used to determine such expenses and profit.The Board previously had been provided with information prepared by an independent consulting firm regarding Dreyfus’ approach to allocating costs to, and determining the profitability of, individual funds and the entire Dreyfus mutual fund complex. The Board also was informed that the methodology had also been reviewed by an independent registered public accounting firm which, like the consultant, found the methodology to be reasonable. The consulting firm also analyzed where any economies of scale might emerge in connection with the management of the fund.The Board members evaluated the profitability analysis in light of the relevant circumstances for the fund and the extent to which economies of scale would be realized if the fund grows and whether fee levels reflect these economies of scale for the benefit of fund investors.The Board members also considered potential benefits to Dreyfus or Mellon Capital from acting as investment adviser and sub-investment adviser, respectively, and noted the soft dollar arrangements with respect to trading the fund’s investments.
It was noted that the Board members should consider Dreyfus’ profitability with respect to the fund as part of their evaluation of whether the fees under the Agreements bear a reasonable relationship to the mix of services provided by Dreyfus, including the nature, extent and quality
The Fund 39
INFORMATION ABOUT THE REVIEW AND APPROVAL OF THE
FUND’S MANAGEMENT AGREEMENT (Unaudited) (continued) |
of such services, and that a discussion of economies of scale is predicated on a fund having achieved a substantial size with increasing assets and that, if a fund’s assets had been static or decreasing, the possibility that Dreyfus may have realized any economies of scale would be less. Since Dreyfus, and not the fund, pays Mellon Capital pursuant to the Sub-Investment Advisory Agreement, the Board did not consider Mellon Capital’s profitability to be relevant to its deliberations. It also was noted that the profitability percentage for managing the fund was within the range determined by appropriate court cases to be reasonable given the services rendered and generally superior service levels provided.
At the conclusion of these discussions, the Board agreed that it had been furnished with sufficient information to make an informed business decision with respect to continuation of the fund’s Agreements. Based on the discussions and considerations as described above, the Board made the following conclusions and determinations.
- The Board concluded that the nature,extent and quality of the services provided by Dreyfus and Mellon Capital are adequate and appropriate.
- The Board was generally satisfied with the fund’s relative performance.
- The Board concluded that the fees paid to Dreyfus and Mellon Capital were reasonable in light of the considerations described above.
- The Board determined that the economies of scale which may accrue to Dreyfus and its affiliates in connection with the management of the fund had been adequately considered by Dreyfus in connection with the management fee rate charged to the fund and that, to the extent in the future it were determined that material economies of scale had not been shared with the fund, the Board would seek to have those economies of scale shared with the fund.
The Board members considered these conclusions and determinations, along with information received on a routine and regular basis throughout the year, and, without any one factor being dispositive, the Board determined that continuation of the fund’s Agreements was in the best interests of the fund and its shareholders.
40
BOARD MEMBERS INFORMATION (Unaudited)
| Joseph S. DiMartino (65) |
| Chairman of the Board (1995) |
| Principal Occupation During Past 5Years: |
| • Corporate Director and Trustee |
| Other Board Memberships and Affiliations: |
| • The Muscular Dystrophy Association, Director |
| • CBIZ (formerly, Century Business Services, Inc.), a provider of outsourcing functions for small |
| and medium size companies, Director |
| • The Newark Group, a provider of a national market of paper recovery facilities, paperboard |
| mills and paperboard converting plants, Director |
| • Sunair Services Corporation, a provider of certain outdoor-related services to homes and |
| businesses, Director |
| No. of Portfolios for which Board Member Serves: 166 |
| ——————— |
| Peggy C. Davis (66) |
| Board Member (2006) |
| Principal Occupation During Past 5Years: |
| • Shad Professor of Law, New York University School of Law (1983-present) |
| • Writer and teacher in the fields of evidence, constitutional theory, family law, social sciences |
| and the law, legal process and professional methodology and training |
| No. of Portfolios for which Board Member Serves: 53 |
| ——————— |
| David P. Feldman (69) |
| Board Member (1996) |
| Principal Occupation During Past 5Years: |
| • Corporate Director and Trustee |
| Other Board Memberships and Affiliations: |
| • BBH Mutual Funds Group (11 funds), Director |
| • The Jeffrey Company, a private investment company, Director |
| No. of Portfolios for which Board Member Serves: 46 |
| ——————— |
| James F. Henry (78) |
| Board Member (2006) |
| Principal Occupation During Past 5Years: |
| • Advisor to The Elaw Forum, a consultant on managing corporate legal costs |
| • Advisor to John Jay Homestead (the restored home of the first U.S. Chief Justice) |
| • Individual Trustee of several trusts |
| Other Board Memberships and Affiliations: |
| • Director, advisor and mediator involved in several non-profit organizations, primarily engaged |
| in domestic and international dispute resolution, and historic preservation |
| No. of Portfolios for which Board Member Serves: 31 |
The Fund 41
BOARD MEMBERS INFORMATION (Unaudited) (continued)
| Ehud Houminer (69) |
| Board Member (1993) |
| Principal Occupation During Past 5Years: |
| • Executive-in-Residence at the Columbia Business School, Columbia University |
| |
| Other Board Memberships and Affiliations: |
| • Avnet Inc., an electronics distributor, Director |
| • International Advisory Board to the MBA Program School of Management, Ben Gurion |
| University, Chairman |
| |
| No. of Portfolios for which Board Member Serves: 58 |
| ——————— |
| Gloria Messinger (79) |
| Board Member (1993) |
| Principal Occupation During Past 5Years: |
| • Arbitrator for American Arbitration Association |
| • Arbitrator for FINRA (formerly, National Association of Securities Dealers, Inc.) |
| • Consultant in Intellectual Property |
| |
| Other Board Memberships and Affiliations: |
| • Theater for a New Audience, Inc., Director |
| • Brooklyn Philharmonic, Director |
| |
| No. of Portfolios for which Board Member Serves: 31 |
| ——————— |
| Dr. Martin Peretz (70) |
| Board Member (2006) |
| Principal Occupation During Past 5Years: |
| • Editor-in-Chief of The New Republic Magazine |
| • Director of TheStreet.com, a financial information service on the web |
| |
| Other Board Memberships and Affiliations: |
| • American Council of Trustees and Alumni, Director |
| • Pershing Square Capital Management, Advisor |
| • Montefiore Ventures, General Partner |
| • Harvard Center for Blood Research,Trustee |
| • Bard College,Trustee |
| • Board of Overseers of YIVO Institute for Jewish Research, Chairman |
| |
| No. of Portfolios for which Board Member Serves: 31 |
| |
| ——————— |
| Once elected all Board Members serve for an indefinite term, but achieve Emeritus status upon reaching age 80.The |
| address of the Board Members and Officers is in c/o The Dreyfus Corporation, 200 Park Avenue, NewYork, NewYork |
| 10166. Additional information about the Board Members is available in the fund’s Statement of Additional Information |
| which can be obtained from Dreyfus free of charge by calling this toll free number: 1-800-554-4611. |
| John M. Fraser, Jr., Emeritus Board Member |
| Rosalind G. Jacobs, Emeritus Board Member |
| Dr. Paul A. Marks, Emeritus Board Member |
42
OFFICERS OF THE FUND (Unaudited)

The Fund 43
OFFICERS OF THE FUND (Unaudited) (continued)

44

Save time. Save paper. View your next shareholder report online as soon as it’s available. Log into www.dreyfus.com and sign up for Dreyfus eCommunications. It’s simple and only takes a few minutes.
The views expressed in this report reflect those of the portfolio manager only through the end of the period covered and do not necessarily represent the views of Dreyfus or any other person in the Dreyfus organization. Any such views are subject to change at any time based upon market or other conditions and Dreyfus disclaims any responsibility to update such views.These views may not be relied on as investment advice and, because investment decisions for a Dreyfus fund are based on numerous factors, may not be relied on as an indication of trading intent on behalf of any Dreyfus fund.
Not FDIC-Insured • Not Bank-Guaranteed • May Lose Value
| | Contents |
| |
| | THE FUND |
| |
| 2 | A Letter from the Chairman and CEO |
| |
| 3 | Discussion of Fund Performance |
| |
| 6 | Fund Performance |
| |
| 8 | Understanding Your Fund’s Expenses |
| |
| 8 | Comparing Your Fund’s Expenses With Those of Other Funds |
| |
| 9 | Statement of Investments |
| |
| 12 | Statement of Assets and Liabilities |
| |
| 13 | Statement of Operations |
| |
| 14 | Statement of Changes in Net Assets |
| |
| 16 | Financial Highlights |
| |
| 20 | Notes to Financial Statements |
| |
| 30 | Report of Independent Registered Public Accounting Firm |
| |
| 31 | Information About the Review and Approval of the Fund’s Management Agreement |
| |
| 35 | Board Members Information |
| |
| 37 | Officers of the Fund |
| |
| | FOR MORE INFORMATION |
| |
| | Back Cover |
| |
Dreyfus
Technology Growth Fund |

A LETTER FROM THE CHAIRMAN AND CEO
Dear Shareholder:
We are pleased to present this annual report for Dreyfus Technology Growth Fund, covering the 12-month period from September 1, 2008, through August 31, 2009.
At long last, the current recession cycle appears to be winding down. After generally slumping since December 2007, we expect U.S. economic growth to pick up during the third quarter of 2009. Highly stimulative monetary and fiscal policies domestically and throughout the world, combined with the low cost of debt and equity capital compared to historical norms, already have sparked a rebound in industrial production as manufacturers replenish their depleted inventories. However, we continue to anticipate a slower-than-average recovery, with the unemployment rate likely to remain elevated over the next several quarters.
The U.S.stock market anticipated the economic upturn with a sustained market rally that began in early March 2009. Although the rebound initially was concentrated primarily among lower-quality stocks that had been severely punished in the downturn, it later broadened to include virtually all economic sectors and capitalization ranges. While we are encouraged by the market’s recent strength, we remain concerned that improving investor sentiment may have exceeded the revival of business fundamentals. Accordingly, we continue to believe that careful selectivity and risk management will be keys to success in the financial markets over the foreseeable future. As always, we urge you to speak with your financial adviser about the potential opportunities and obstacles in today’s investment environment.
For information about how the fund performed during the reporting period, as well as market perspectives, we have provided a Discussion of Fund Performance given by the fund’s Portfolio Manager.
Thank you for your continued confidence and support.
Jonathan R. Baum
Chairman and Chief Executive Officer
The Dreyfus Corporation
September 15, 2009 |
2

DISCUSSION OF FUND PERFORMANCE
For the period of September 1, 2008, through August 31, 2009, as provided by Barry K. Mills, CFA, Portfolio Manager
Fund and Market Performance Overview
For the 12-month period ended August 31, 2009, Dreyfus Technology Growth Fund’s Class A shares produced a total return of –12.22%, Class B shares returned –13.38%, Class C shares returned –13.13% and Class I shares returned –11.71%.1 In comparison, the fund’s benchmarks, the Morgan Stanley High Technology 35 Index (“MS High Tech 35 Index”) and the Standard & Poor’s 500 Composite Stock Price Index (“S&P 500 Index”), produced total returns of –9.28% and –18.25%, respectively, over the same period.2,3
A severe recession and banking crisis sent technology stock prices sharply lower over the first half of the reporting period, but the market rallied in anticipation of an economic recovery over the second half, offsetting a substantial portion of earlier losses. The fund produced lower returns than the MS High Tech 35 Index but higher returns than the S&P 500 Index, as it participated in the sector’s relative strength to a significant degree but did not own some of the MS High Tech 35 Index’s stronger performing—and more speculative—components.
The Fund’s Investment Approach
The fund seeks capital appreciation by investing in growth companies of any size that we regard as leading producers or beneficiaries of technological innovation.The fund’s investment process centers on a multi-dimensional approach that looks for opportunities across emerging growth, cyclical or stable growth companies.The fund seeks companies that appear to have strong earnings momentum, positive earnings revisions, favorable growth, product or market cycles and/or favorable valuations.
Equity Markets Plunged, Then Rebounded Sharply
The U.S. stock market endured a year of extreme volatility. In the fall of 2008, the failures of several major financial institutions nearly led to the collapse of the global banking system. Meanwhile, rising unemploy-
The Fund 3
| DISCUSSION OF FUND PERFORMANCE (continued) |
ment, plunging housing prices and depressed consumer confidence exacerbated the most severe economic downturn since the 1930s. These influences fueled a bear market that drove stock market averages to multi-year lows. Technology stocks also were adversely affected by major cut-backs in corporate and consumer spending during the downturn.
However, market sentiment suddenly began to improve in early March 2009, as aggressive measures adopted by government and monetary authorities to repair the credit markets appeared to be working. Evidence of economic stabilization later appeared, fueling a sustained market rally that lasted through the reporting period’s end. The rebound was especially robust among smaller, more speculative stocks and economically sensitive industry groups, suggesting to us that bargain hunters were taking advantage of beaten-down stock prices rather than responding to improving fundamentals.
Security Selections Produced Mixed Relative Results
The fund produced modestly higher returns than the MS High Tech 35 Index during the bear market that prevailed over the first half of the reporting period, primarily due to a generally defensive investment posture. However, that cautious approach caused the fund to lag its benchmark slightly during the market rally over the reporting period’s second half, which initially was led by lower-quality stocks that did not meet our investment criteria. For example, we refrained from investing in Sun Microsystems due to its declining market share and lack of profitability. Nonetheless, Sun Microsystems posted an impressive gain when it was targeted for acquisition by enterprise software maker Oracle.
In addition, our stock selection strategy proved disappointing in the software and Internet retailing segments of the information technology sector. Security software developer Symantec declined due to a bloated cost structure and declining margins. Financial software maker Intuit fared relatively well during the downturn but lagged in the rally when it encountered sales pressures and investors turned to more speculative investments. Concur Technologies was hurt by reports questioning the veracity of its CEO’s credentials.We sold the fund’s positions in Symantec, Intuit and Concur Technologies soon after these issues came to light.
4
The fund received stronger contributions to relative performance from the telecommunications and semiconductors industry groups. Telecommunications equipment manufacturer Alcatel-Lucent gained value amid rising traffic on wireless networks and expectations of renewed spending by its corporate customers. Outsourcing giant Cognizant Technology Solutions maintained a strong growth rate. Telecommunications giant Verizon Communications also bolstered relative performance when it held up relatively well early in the reporting period. Finally, we did not own some of the technology sector’s weaker performers, such as computer maker Dell.
Positioned for Pent-Up Demand in a Recovery
We are optimistic that the recession is behind us and that enterprise spending is likely to increase as the economy stabilizes.We believe that pent-up demand will drive technology spending higher in an improving business environment. Indeed, we already have seen evidence of the early stages of recovery, including increased production by semiconductor manufacturers.Therefore, we have positioned the fund to participate in potential gains among leading technology companies that, in our judgment, have cut unnecessary costs and are well positioned for a recovery.
September 15, 2009
| | | The technology sector has been among the most volatile sectors of the stock market. |
| | | Technology companies involve greater risk because their revenue and/or earnings tend to be |
| | | less predictable and some companies may be experiencing significant losses. An investment |
| | | in the fund should be considered only as a supplement to a complete investment program. |
| | | Please note, the position in any security highlighted with italicized typeface was sold during the |
| | | reporting period. |
| 1 | | Total return includes reinvestment of dividends and any capital gains paid, and does not take into |
| | | consideration the maximum initial sales charges in the case of Class A shares, or the applicable |
| | | contingent deferred sales charges imposed on redemptions in the case of Class B and Class C |
| | | shares. Had these charges been reflected, returns would have been lower. Past performance is no |
| | | guarantee of future results. Share price, yield and investment return fluctuate such that upon |
| | | redemption, fund shares may be worth more or less than their original cost. |
| 2 | | SOURCE: BLOOMBERG L.P. — Reflects reinvestment of net dividends and, where |
| | | applicable, capital gain distributions.The Morgan Stanley High Technology 35 Index is an |
| | | unmanaged, equal dollar-weighted index of 35 stocks from the electronics-based subsectors.The |
| | | index does not take into account fees and expenses to which the fund is subject. |
| 3 | | SOURCE: LIPPER INC. — Reflects monthly reinvestment of dividends and, where |
| | | applicable, capital gain distributions.The Standard & Poor’s 500 Composite Stock Price Index is |
| | | a widely accepted, unmanaged index of U.S. stock market performance.The index does not take |
| | | into account fees and expenses to which the fund is subject. |
The Fund 5
FUND PERFORMANCE
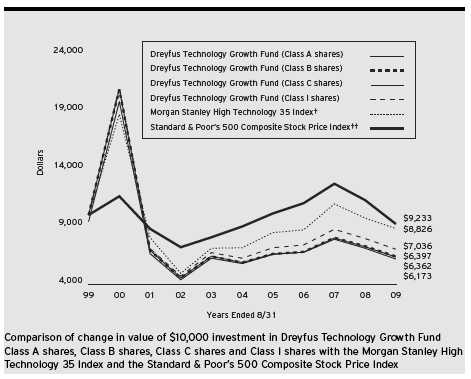
| † | | Source: Bloomberg L.P. |
| †† | | Source: Lipper Inc. |
| Past performance is not predictive of future performance. |
| The above graph compares a $10,000 investment made in Class A, Class B, Class C and Class I shares of Dreyfus |
| Technology Growth Fund on 8/31/99 to a $10,000 investment made in each of the Standard & Poor’s 500 |
| Composite Stock Price Index (the “S&P 500 Index”) and the Morgan Stanley High Technology 35 Index (the “MS |
| High Tech 35 Index”) on that date.All dividends and capital gain distributions are reinvested. |
| The fund’s performance shown in the line graph takes into account the maximum initial sales charge on Class A shares |
| and all other applicable fees and expenses on all classes.The S&P 500 Index is a widely accepted, unmanaged index of |
| U.S. stock market performance.The MS High Tech 35 Index reflects reinvestment of net dividends and, where applicable, |
| capital gain distributions.The MS High Tech 35 Index is an unmanaged, equal dollar-weighted index from the |
| electronics-based subsectors. Unlike a mutual fund, the indices are not subject to charges, fees and other expenses. Investors |
| cannot invest directly in any index. Further information relating to fund performance, including expense reimbursements, |
| if applicable, is contained in the Financial Highlights section of the prospectus and elsewhere in this report. |
6
| Average Annual Total Returns as of 8/31/09 | | | | | | |
| |
| | | 1 Year | | 5 Years | | 10 Years |
| |
| |
| |
|
| Class A shares | | | | | | |
| with maximum sales charge (5.75%) | | –17.25% | | 0.75% | | –4.42% |
| without sales charge | | –12.22% | | 1.95% | | –3.85% |
| Class B shares | | | | | | |
| with applicable redemption charge † | | –16.85% | | 0.45% | | –4.37% |
| without redemption | | –13.38% | | 0.84% | | –4.37% |
| Class C shares | | | | | | |
| with applicable redemption charge †† | | –14.00% | | 0.99% | | –4.71% |
| without redemption | | –13.13% | | 0.99% | | –4.71% |
| Class I shares | | –11.71% | | 2.37% | | –3.45% |
| Past performance is not predictive of future performance.The fund’s performance shown in the graph and table does not |
| reflect the deduction of taxes that a shareholder would pay on fund distributions or the redemption of fund shares. |
| Performance for Class B shares assumes the conversion of Class B shares to Class A shares at the end of the sixth year |
| following the date of purchase. |
| † | | The maximum contingent deferred sales charge for Class B shares is 4%.After six years Class B shares convert to |
| | | Class A shares. |
| †† | | The maximum contingent deferred sales charge for Class C shares is 1% for shares redeemed within one year of the |
| | | date of purchase. |
The Fund 7
UNDERSTANDING YOUR FUND’S EXPENSES (Unaudited)
As a mutual fund investor, you pay ongoing expenses, such as management fees and other expenses. Using the information below, you can estimate how these expenses affect your investment and compare them with the expenses of other funds.You also may pay one-time transaction expenses, including sales charges (loads) and redemption fees, which are not shown in this section and would have resulted in higher total expenses. For more information, see your fund’s prospectus or talk to your financial adviser.
Review your fund’s expenses
The table below shows the expenses you would have paid on a $1,000 investment in Dreyfus Technology Growth Fund from March 1, 2009 to August 31, 2009. It also shows how much a $1,000 investment would be worth at the close of the period, assuming actual returns and expenses.
| Expenses and Value of a $1,000 Investment | | | | | | |
| assuming actual returns for the six months ended August 31, 2009 | | | | |
| | | Class A | | Class B | | Class C | | Class I |
| |
| |
| |
| |
|
| Expenses paid per $1,000† | | $ 9.82 | | $ 17.89 | | $ 16.29 | | $ 6.91 |
| Ending value (after expenses) | | $1,465.50 | | $1,455.70 | | $1,457.80 | | $1,469.10 |
| COMPARING YOUR FUND’S EXPENSES |
| WITH THOSE OF OTHER FUNDS (Unaudited) |
Using the SEC’s method to compare expenses
The Securities and Exchange Commission (SEC) has established guidelines to help investors assess fund expenses. Per these guidelines, the table below shows your fund’s expenses based on a $1,000 investment, assuming a hypothetical 5% annualized return. You can use this information to compare the ongoing expenses (but not transaction expenses or total cost) of investing in the fund with those of other funds.All mutual fund shareholder reports will provide this information to help you make this comparison. Please note that you cannot use this information to estimate your actual ending account balance and expenses paid during the period.
| Expenses and Value of a $1,000 Investment | | | | | | |
| assuming a hypothetical 5% annualized return for the six months ended August 31, 2009 |
| | | Class A | | Class B | | Class C | | Class I |
| |
| |
| |
| |
|
| Expenses paid per $1,000† | | $ 8.03 | | $ 14.65 | | $ 13.34 | | $ 5.65 |
| Ending value (after expenses) | | $1,017.24 | | $1,010.64 | | $1,011.95 | | $1,019.61 |
† Expenses are equal to the fund’s annualized expense ratio of 1.58% for Class A, 2.89% for Class B, 2.63% for Class C and 1.11% for Class I, multiplied by the average account value over the period, multiplied by 184/365 (to reflect the one-half year period).
8
| STATEMENT OF INVESTMENTS |
| August 31, 2009 |
| Common Stocks—96.3% | | Shares | | Value ($) |
| |
| |
|
| Consumer Discretionary—1.7% | | | | |
| Amazon.com | | 51,470 a | | 4,178,849 |
| Information Technology—94.6% | | | | |
| Accenture, Cl. A | | 163,251 | | 5,387,283 |
| Amphenol, Cl. A | | 128,982 | | 4,509,211 |
| Analog Devices | | 305,776 | | 8,638,172 |
| Apple | | 71,218 a | | 11,979,580 |
| Autodesk | | 105,240 a | | 2,465,773 |
| BMC Software | | 99,301 a | | 3,540,081 |
| Broadcom, Cl. A | | 365,165 a,b | | 10,388,944 |
| Cavium Networks | | 142,855 a,b | | 2,901,385 |
| Cisco Systems | | 551,130 a | | 11,904,408 |
| Citrix Systems | | 74,430 a,b | | 2,655,662 |
| Cognizant Technology Solutions, Cl. A | | 252,277 a | | 8,799,422 |
| Computer Sciences | | 78,490 a | | 3,834,237 |
| Dell | | 93,440 a | | 1,479,155 |
| Dolby Laboratories, Cl. A | | 111,030 a,b | | 4,331,280 |
| Electronic Arts | | 123,218 a,b | | 2,245,032 |
| EMC | | 578,040 a | | 9,190,836 |
| Google, Cl. A | | 15,618 a | | 7,210,362 |
| Hewlett-Packard | | 165,840 | | 7,444,558 |
| Informatica | | 264,110 a | | 4,735,492 |
| JDS Uniphase | | 1,277,550 a | | 8,776,768 |
| Juniper Networks | | 369,848 a,b | | 8,532,393 |
| Lam Research | | 224,980 a,b | | 6,906,886 |
| Microsoft | | 445,016 | | 10,969,644 |
The Fund 9
| STATEMENT OF INVESTMENTS (continued) |
| Common Stocks (continued) | | Shares | | Value ($) |
| |
| |
|
| Information Technology (continued) | | | | |
| Motorola | | 1,573,240 | | 11,295,863 |
| NVIDIA | | 175,870 a | | 2,553,632 |
| Oracle | | 313,116 | | 6,847,847 |
| Paychex | | 143,050 b | | 4,046,885 |
| Quest Software | | 233,890 a | | 3,856,846 |
| Research In Motion | | 158,010 a | | 11,544,211 |
| Sybase | | 132,790 a | | 4,627,732 |
| Texas Instruments | | 439,450 | | 10,806,076 |
| Tyco Electronics | | 242,000 | | 5,522,440 |
| Visa, Cl. A | | 45,950 | | 3,267,045 |
| Western Digital | | 149,790 a | | 5,134,801 |
| Western Union | | 260,752 | | 4,703,966 |
| Yahoo! | | 417,700 a | | 6,102,597 |
| | | | | 229,136,505 |
| Total Common Stocks | | | | |
| (cost $205,980,778) | | | | 233,315,354 |
| |
| Limited Partnership Interests—.7% | | | | |
| |
| |
|
| Information Technology—.7% | | | | |
| Bluestream Ventures, LP | | — a,d | | 1,825,686 |
| Ingenex, LP | | — a,d | | 0 |
| Total Limited Partnership Interests | | | | |
| (cost $3,181,315) | | | | 1,825,686 |
| |
| Other Investment—2.8% | | | | |
| |
| |
|
| Registered Investment Company; | | | | |
| Dreyfus Institutional Preferred | | | | |
| Plus Money Market Fund | | | | |
| (cost $6,688,000) | | 6,688,000 c | | 6,688,000 |
10
| Investment of Cash Collateral for | | | | |
| Securities Loaned—7.9% | | Shares | | Value ($) |
| |
| |
|
| Registered Investment Company; | | | | |
| Dreyfus Institutional Cash Advantage Fund | | | | |
| (cost $19,134,740) | | 19,134,740 c | | 19,134,740 |
| Total Investments (cost $234,984,833) | | 107.7% | | 260,963,780 |
| Liabilities, Less Cash and Receivables | | (7.7%) | | (18,765,212) |
| Net Assets | | 100.0% | | 242,198,568 |
| a Non-income producing security. |
| b All or a portion of these securities are on loan.At August 31, 2009, the total market value of the fund’s securities on |
| loan is $18,363,835 and the total market value of the collateral held by the fund is $19,134,740. |
| c Investment in affiliated money market mutual fund. |
| d Securities restricted as to public resale. Investment in restricted securities with aggregated market value of $1,825,686 |
| representing .7% of net assets (see below). |
| Issuer | | Acquisition Date | | Cost ($) | | Net Assets (%) | | Valuation ($) |
| |
| |
| |
| |
|
| Bluestream | | | | | | | | |
Ventures, LP
4/30/2004-6/11/2008 | | 3,181,315 | | 0.7 | | 1,825,686 |
| Ingenex, LP | | 4/30/2004 | | 0 | | 0.0 | | 0 |
| |
| |
| |
| |
|
| |
| |
| Portfolio Summary (Unaudited)† | | | | | | |
| | | Value (%) | | | | | | Value (%) |
| |
| |
| |
| |
|
| Information Technology | | 95.3 | | Consumer Discretionary | | 1.7 |
| Money Market Investments | | 10.7 | | | | | | 107.7 |
| † Based on net assets. | | | | | | | | |
| See notes to financial statements. | | | | | | | | |
The Fund 11
| STATEMENT OF ASSETS AND LIABILITIES |
| August 31, 2009 |
| | | | | | | Cost | | Value |
| |
| |
| |
| |
|
| Assets ($): | | | | | | | | |
| Investments in securities—See Statement of Investments (including | | | | |
| securities on loan, valued at $18,363,835)—Note 1(c): | | | | |
| Unaffiliated issuers | | | | | | 209,162,093 | | 235,141,040 |
| Affiliated issuers | | | | | | 25,822,740 | | 25,822,740 |
| Cash | | | | | | | | 144,099 |
| Receivable for investment securities sold | | | | | | 2,490,856 |
| Receivable for shares of Common Stock subscribed | | | | | | 135,554 |
| Dividends and interest receivable | | | | | | | | 125,932 |
| Prepaid expenses | | | | | | | | 41,025 |
| | | | | | | | | 263,901,246 |
| Liabilities ($): | | | | | | | | |
| Due to The Dreyfus Corporation and affiliates—Note 3(c) | | | | | | 398,691 |
| Liability for securities on loan—Note 1(c) | | | | | | 19,134,740 |
| Payable for investment securities purchased | | | | | | 1,480,473 |
| Payable for shares of Common Stock redeemed | | | | | | 296,964 |
| Interest payable—Note 2 | | | | | | | | 9 |
| Accrued expenses | | | | | | | | 391,801 |
| | | | | | | | | 21,702,678 |
| Net Assets ($) | | | | | | | | 242,198,568 |
| Composition of Net Assets ($): | | | | | | | | |
| Paid-in capital | | | | | | | | 426,218,069 |
| Accumulated net realized gain (loss) on investments | | | | | | (209,998,448) |
| Accumulated net unrealized appreciation | | | | | | |
| (depreciation) on investments | | | | | | | | 25,978,947 |
| Net Assets ($) | | | | | | | | 242,198,568 |
| |
| |
| |
| |
|
| |
| |
| Net Asset Value Per Share | | | | | | | | |
| | | Class A | | Class B | | Class C | | Class I |
| |
| |
| |
| |
|
| Net Assets ($) | | 214,170,451 | | 4,023,603 | | 21,654,976 | | 2,349,538 |
| Shares Outstanding | | 9,901,970 | | 205,802 | | 1,098,773 | | 104,182 |
| Net Asset Value Per Share ($) | | 21.63 | | 19.55 | | 19.71 | | 22.55 |
| |
| See notes to financial statements. | | | | | | | | |
12
| STATEMENT OF OPERATIONS |
| Year Ended August 31, 2009 |
| Investment Income ($): | | |
| Income: | | |
| Cash dividends (net of $42,928 foreign taxes withheld at source): | | |
| Unaffiliated issuers | | 1,841,105 |
| Affiliated issuers | | 40,269 |
| Income from securities lending | | 118,473 |
| Total Income | | 1,999,847 |
| Expenses: | | |
| Management fee—Note 3(a) | | 1,585,051 |
| Shareholder servicing costs—Note 3(c) | | 1,833,548 |
| Distribution fees—Note 3(b) | | 182,716 |
| Prospectus and shareholders’ reports | | 75,087 |
| Registration fees | | 62,209 |
| Professional fees | | 34,631 |
| Custodian fees—Note 3(c) | | 22,496 |
| Directors’ fees and expenses—Note 3(d) | | 20,068 |
| Loan commitment fees—Note 2 | | 1,471 |
| Interest expense—Note 2 | | 1,195 |
| Miscellaneous | | 36,828 |
| Total Expenses | | 3,855,300 |
| Less—reduction in fees due to earnings credits—Note 1(c) | | (71,481) |
| Net Expenses | | 3,783,819 |
| Investment (Loss)—Net | | (1,783,972) |
| Realized and Unrealized Gain (Loss) on Investments—Note 4 ($): | | |
| Net realized gain (loss) on investments and foreign currency transactions | | (62,435,229) |
| Net unrealized appreciation (depreciation) on investments | | 22,878,405 |
| Net Realized and Unrealized Gain (Loss) on Investments | | (39,556,824) |
| Net (Decrease) in Net Assets Resulting from Operations | | (41,340,796) |
| |
| See notes to financial statements. | | |
The Fund 13
STATEMENT OF CHANGES IN NET ASSETS
| | | Year Ended August 31, |
| | |
|
| | | 2009a | | 2008 |
| |
| |
|
| Operations ($): | | | | |
| Investment (loss)—net | | (1,783,972) | | (2,526,032) |
| Net realized gain (loss) on investments | | (62,435,229) | | 69,841,195 |
| Net unrealized appreciation | | | | |
| (depreciation) on investments | | 22,878,405 | | (105,355,451) |
| Net Increase (Decrease) in Net Assets | | | | |
| Resulting from Operations | | (41,340,796) | | (38,040,288) |
| Capital Stock Transactions ($): | | | | |
| Net proceeds from shares sold: | | | | |
| Class A Shares | | 57,642,713 | | 62,812,457 |
| Class B Shares | | 47,191 | | 284,976 |
| Class C Shares | | 481,382 | | 1,334,302 |
| Class I Shares | | 690,834 | | 24,167,020 |
| Class T Shares | | 91,848 | | 344,622 |
| Cost of shares redeemed: | | | | |
| Class A Shares | | (68,621,752) | | (141,143,973) |
| Class B Shares | | (3,003,041) | | (8,538,873) |
| Class C Shares | | (3,681,020) | | (8,385,143) |
| Class I Shares | | (18,064,509) | | (5,158,695) |
| Class T Shares | | (1,413,218) | | (727,367) |
| Increase (Decrease) in Net Assets from | | | | |
| Capital Stock Transactions | | (35,829,572) | | (75,010,674) |
| Total Increase (Decrease) in Net Assets | | (77,170,368) | | (113,050,962) |
| Net Assets ($): | | | | |
| Beginning of Period | | 319,368,936 | | 432,419,898 |
| End of Period | | 242,198,568 | | 319,368,936 |
14
| | | Year Ended August 31, |
| | |
|
| | | 2009a | | 2008 |
| |
| |
|
| Capital Share Transactions: | | | | |
| Class Ab,c | | | | |
| Shares sold | | 3,195,372 | | 2,365,166 |
| Shares redeemed | | (3,741,056) | | (5,388,253) |
| Net Increase (Decrease) in Shares Outstanding | | (545,684) | | (3,023,087) |
| Class Bb | | | | |
| Shares sold | | 2,689 | | 11,543 |
| Shares redeemed | | (179,469) | | (349,850) |
| Net Increase (Decrease) in Shares Outstanding | | (176,780) | | (338,307) |
| Class C | | | | |
| Shares sold | | 27,730 | | 53,343 |
| Shares redeemed | | (226,392) | | (344,292) |
| Net Increase (Decrease) in Shares Outstanding | | (198,662) | | (290,949) |
| Class I | | | | |
| Shares sold | | 35,801 | | 853,264 |
| Shares redeemed | | (788,617) | | (190,605) |
| Net Increase (Decrease) in Shares Outstanding | | (752,816) | | 662,659 |
| Class Tc | | | | |
| Shares sold | | 4,966 | | 13,290 |
| Shares redeemed | | (91,517) | | (29,227) |
| Net Increase (Decrease) in Shares Outstanding | | (86,551) | | (15,937) |
| a | | Effective as of the close of business on February 4, 2009, the fund no longer offers Class T shares. |
| b | | During the period ended August 31, 2009, 90,653 Class B shares representing $1,524,394 were automatically |
| | | converted to 82,529 Class A shares and during the period ended August 31, 2008, 192,249 Class B shares |
| | | representing $4,701,382 were automatically converted to 176,880 Class A shares. |
| c | | On the close of business on February 4, 2009, 71,990 Class T shares representing $1,090,652 were converted to |
| | | 69,116 Class A shares. |
| See notes to financial statements. |
The Fund 15
FINANCIAL HIGHLIGHTS
The following tables describe the performance for each share class for the fiscal periods indicated.All information (except portfolio turnover rate) reflects financial results for a single fund share.Total return shows how much your investment in the fund would have increased (or decreased) during each period, assuming you had reinvested all dividends and distributions.These figures have been derived from the fund’s financial statements.
| | | | | Year Ended August 31, | | |
| | |
| |
| |
|
| Class A Shares | | 2009 | | 2008 | | 2007 | | 2006 | | 2005 |
| |
| |
| |
| |
| |
|
| Per Share Data ($): | | | | | | | | | | |
| Net asset value, beginning of period | | 24.63 | | 27.18 | | 23.03 | | 22.40 | | 19.64 |
| Investment Operations: | | | | | | | | | | |
| Investment (loss)—neta | | (.13) | | (.15) | | (.21) | | (.18) | | (.10) |
| Net realized and unrealized | | | | | | | | | | |
| gain (loss) on investments | | (2.87) | | (2.40) | | 4.36 | | .78 | | 2.86 |
| Total from Investment Operations | | (3.00) | | (2.55) | | 4.15 | | .60 | | 2.76 |
| Capital contribution by Manager | | — | | — | | — | | .03 | | — |
| Net asset value, end of period | | 21.63 | | 24.63 | | 27.18 | | 23.03 | | 22.40 |
| Total Return (%)b | | (12.22) | | (9.35) | | 18.02 | | 2.81c | | 14.05 |
| Ratios/Supplemental Data (%): | | | | | | | | | | |
| Ratio of total expenses | | | | | | | | | | |
| to average net assets | | 1.70 | | 1.52 | | 1.46 | | 1.38 | | 1.32 |
| Ratio of net expenses | | | | | | | | | | |
| to average net assets | | 1.67 | | 1.44 | | 1.42 | | 1.38d | | 1.32d |
| Ratio of net investment (loss) | | | | | | | | | | |
| to average net assets | | (.72) | | (.59) | | (.82) | | (.77) | | (.45) |
| Portfolio Turnover Rate | | 122.48 | | 126.37 | | 28.80 | | 48.26 | | 44.59 |
| Net Assets, end of period ($ x 1,000) | | 214,170 | | 257,360 | | 366,083 | | 391,530 | | 384,411 |
| a | | Based on average shares outstanding at each month end. |
| b | | Exclusive of sales charge. |
| c | | If capital contribution had not been made by the Manager, total return for the year ended August 31, 2006 would |
| | | have been 2.67%. |
| d | | Expense waivers and/or reimbursements amounted to less than .01%. |
| See notes to financial statements. |
16
| | | | | Year Ended August 31, | | |
| | |
| |
| |
|
| Class B Shares | | 2009 | | 2008 | | 2007 | | 2006 | | 2005 |
| |
| |
| |
| |
| |
|
| Per Share Data ($): | | | | | | | | | | |
| Net asset value, beginning of period | | 22.57 | | 25.10 | | 21.51 | | 21.17 | | 18.75 |
| Investment Operations: | | | | | | | | | | |
| Investment (loss)—net a | | (.33) | | (.34) | | (.43) | | (.41) | | (.29) |
| Net realized and unrealized | | | | | | | | | | |
| gain (loss) on investments | | (2.69) | | (2.19) | | 4.02 | | .72 | | 2.71 |
| Total from Investment Operations | | (3.02) | | (2.53) | | 3.59 | | .31 | | 2.42 |
| Capital contribution by Manager | | — | | — | | — | | .03 | | — |
| Net asset value, end of period | | 19.55 | | 22.57 | | 25.10 | | 21.51 | | 21.17 |
| Total Return (%)b | | (13.38) | | (10.08) | | 16.69 | | 1.61c | | 12.91 |
| Ratios/Supplemental Data (%): | | | | | | | | | | |
| Ratio of total expenses | | | | | | | | | | |
| to average net assets | | 3.03 | | 2.38 | | 2.51 | | 2.47 | | 2.29 |
| Ratio of net expenses | | | | | | | | | | |
| to average net assets | | 3.00 | | 2.30 | | 2.47 | | 2.47d | | 2.29d |
| Ratio of net investment (loss) | | | | | | | | | | |
| to average net assets | | (2.03) | | (1.46) | | (1.91) | | (1.92) | | (1.41) |
| Portfolio Turnover Rate | | 122.48 | | 126.37 | | 28.80 | | 48.26 | | 44.59 |
| Net Assets, end of period ($ x 1,000) | | 4,024 | | 8,634 | | 18,097 | | 45,652 | | 162,849 |
| a | | Based on average shares outstanding at each month end. |
| b | | Exclusive of sales charge. |
| c | | If capital contribution had not been made by the Manager, total return for the year ended August 31, 2006 would |
| | | have been 1.47%. |
| d | | Expense waivers and/or reimbursements amounted to less than .01%. |
| See notes to financial statements. |
The Fund 17
| | FINANCIAL HIGHLIGHTS (continued) |
| | | | | Year Ended August 31, | | |
| | |
| |
| |
|
| Class C Shares | | 2009 | | 2008 | | 2007 | | 2006 | | 2005 |
| |
| |
| |
| |
| |
|
| Per Share Data ($): | | | | | | | | | | |
| Net asset value, beginning of period | | 22.69 | | 25.24 | | 21.58 | | 21.19 | | 18.76 |
| Investment Operations: | | | | | | | | | | |
| Investment (loss)—neta | | (.29) | | (.34) | | (.40) | | (.38) | | (.29) |
| Net realized and unrealized | | | | | | | | | | |
| gain (loss) on investments | | (2.69) | | (2.21) | | 4.06 | | .74 | | 2.72 |
| Total from Investment Operations | | (2.98) | | (2.55) | | 3.66 | | .36 | | 2.43 |
| Capital contribution by Manager | | — | | — | | — | | .03 | | — |
| Net asset value, end of period | | 19.71 | | 22.69 | | 25.24 | | 21.58 | | 21.19 |
| Total Return (%)b | | (13.13) | | (10.10) | | 16.96 | | 1.84c | | 12.95 |
| Ratios/Supplemental Data (%): | | | | | | | | | | |
| Ratio of total expenses | | | | | | | | | | |
| to average net assets | | 2.76 | | 2.37 | | 2.32 | | 2.33 | | 2.28 |
| Ratio of net expenses | | | | | | | | | | |
| to average net assets | | 2.73 | | 2.28 | | 2.28 | | 2.33d | | 2.28d |
| Ratio of net investment (loss) | | | | | | | | | | |
| to average net assets | | (1.78) | | (1.43) | | (1.69) | | (1.73) | | (1.39) |
| Portfolio Turnover Rate | | 122.48 | | 126.37 | | 28.80 | | 48.26 | | 44.59 |
| Net Assets, end of period ($ x 1,000) | | 21,655 | | 29,434 | | 40,090 | | 50,656 | | 67,295 |
| a | | Based on average shares outstanding at each month end. |
| b | | Exclusive of sales charge. |
| c | | If capital contribution had not been made by the Manager, total return for the year ended August 31, 2006 would |
| | | have been 1.70%. |
| d | | Expense waivers and/or reimbursements amounted to less than .01%. |
| See notes to financial statements. |
18
| | | | | Year Ended August 31, | | |
| | |
| |
| |
|
| Class I Shares | | 2009 | | 2008 | | 2007a | | 2006 | | 2005 |
| |
| |
| |
| |
| |
|
| Per Share Data ($): | | | | | | | | | | |
| Net asset value, beginning of period | | 25.54 | | 28.08 | | 23.71 | | 22.97 | | 20.06 |
| Investment Operations: | | | | | | | | | | |
| Investment income (loss)—netb | | (.07) | | (.06) | | (.11) | | (.08) | | .00c |
| Net realized and unrealized | | | | | | | | | | |
| gain (loss) on investments | | (2.92) | | (2.48) | | 4.48 | | .79 | | 2.91 |
| Total from Investment Operations | | (2.99) | | (2.54) | | 4.37 | | .71 | | 2.91 |
| Capital contribution by Manager | | — | | — | | — | | .03 | | — |
| Net asset value, end of period | | 22.55 | | 25.54 | | 28.08 | | 23.71 | | 22.97 |
| Total Return (%) | | (11.71) | | (9.04) | | 18.43 | | 3.22d | | 14.51 |
| Ratios/Supplemental Data (%): | | | | | | | | | | |
| Ratio of total expenses | | | | | | | | | | |
| to average net assets | | 1.28 | | 1.24 | | 1.08 | | .82 | | .86 |
| Ratio of net expenses | | | | | | | | | | |
| to average net assets | | 1.24 | | 1.16 | | 1.04 | | .82e | | .86e |
| Ratio of net investment income | | | | | | | | | | |
| (loss) to average net assets | | (.39) | | (.22) | | (.44) | | (.36) | | .01 |
| Portfolio Turnover Rate | | 122.48 | | 126.37 | | 28.80 | | 48.26 | | 44.59 |
| Net Assets, end of period ($ x 1,000) | | 2,350 | | 21,889 | | 5,458 | | 4,612 | | 981,036 |
| a | | Effective June 1, 2007, Class R shares were redesignated as Class I shares. |
| b | | Based on average shares outstanding at each month end. |
| c | | Amount represents less than $.01 per share. |
| d | | If capital contribution had not been made by the Manager, total return for the year ended August 31, 2006 would |
| | | have been 3.08%. |
| e | | Expense waivers and/or reimbursements amounted to less than .01%. |
| See notes to financial statements. |
The Fund 19
NOTES TO FINANCIAL STATEMENTS
NOTE 1—Significant Accounting Policies:
Dreyfus Technology Growth Fund (the “fund”) is a separate diversified series of Advantage Funds, Inc. (the “Company”), which is registered under the Investment Company Act of 1940, as amended (the “Act”), as an open-end management investment company and operates as a series company that offers ten series, including the fund. The fund’s investment objective is capital appreciation.The Dreyfus Corporation (the “Manager” or “Dreyfus”), a wholly-owned subsidiary ofThe Bank of New York Mellon Corporation (“BNY Mellon”), serves as the fund’s investment adviser.
At a meeting of the fund’s Board of Directors held on July 15, 2008, the Board approved, effective December 1, 2008, a proposal to change the name of the fund from “Dreyfus Premier Technology Growth Fund” to “Dreyfus Technology Growth Fund.”
MBSC Securities Corporation (the “Distributor”), a wholly-owned subsidiary of the Manager, is the distributor of the fund’s shares. The fund is authorized to issue 400 million shares of $.001 par value Capital Stock.The fund currently offers four classes of shares: Class A (100 million shares authorized), Class B (100 million shares authorized), Class C (100 million shares authorized) and Class I (100 million shares authorized). Class A shares are subject to a sales charge imposed at the time of purchase. Class B shares are subject to a contingent deferred sales charge (“CDSC”) imposed on Class B share redemptions made within six years of purchase and automatically convert to Class A shares after six years. The fund does not offer Class B shares, except in connection with dividend reinvestment and permitted exchanges of Class B shares. Class C shares are subject to a CDSC imposed on Class C shares redeemed within one year of purchase. Class I shares are sold at net asset value per share only to institutional investors. Other differences between the classes include the services offered to and the expenses borne by each class, the allocation of certain transfer agency costs and certain voting rights. Income, expenses
20
(other than expenses attributable to a specific class), and realized and unrealized gains or losses on investments are allocated to each class of shares based on its relative net assets.
Effective December 3, 2008, investments for new accounts were no longer permitted in ClassT of the fund, except that participants in certain group retirement plans were able to open a new account in Class T of the fund, provided that the fund was established as an investment option under the plans before December 3, 2008. On February 4, 2009, the fund issued to each holder of its Class T shares, in exchange for said shares, Class A shares of the fund having an aggregate net asset value equal to the aggregate net asset value of the shareholder’s Class T shares. Subsequent investments in the fund’s Class A shares made by prior holders of the fund’s Class T shares who received Class A shares of the fund in exchange for their Class T shares are subject to the front-end sales load schedule that was in effect for Class T shares at the time of the exchange. Otherwise, all other Class A share attributes will be in effect. Effective as of the close of business on February 4, 2009, the fund no longer offers Class T shares.
The Company accounts separately for the assets, liabilities and operations of each series. Expenses directly attributable to each series are charged to that series’ operations; expenses which are applicable to all series are allocated among them on a pro rata basis.
The fund’s financial statements are prepared in accordance with U.S. generally accepted accounting principles, which may require the use of management estimates and assumptions. Actual results could differ from those estimates.
The fund enters into contracts that contain a variety of indemnifications. The fund’s maximum exposure under these arrangements is unknown.The fund does not anticipate recognizing any loss related to these arrangements.
The Fund 21
| NOTES TO FINANCIAL STATEMENTS (continued) |
(a) Portfolio valuation: Investments in securities are valued at the last sales price on the securities exchange or national securities market on which such securities are primarily traded. Securities listed on the National Market System for which market quotations are available are valued at the official closing price or, if there is no official closing price that day, at the last sales price. Securities not listed on an exchange or the national securities market, or securities for which there were no transactions, are valued at the average of the most recent bid and asked prices, except for open short positions, where the asked price is used for valuation purposes. Bid price is used when no asked price is available. Registered investment companies that are not traded on an exchange are valued at their net asset value. When market quotations or official closing prices are not readily available, or are determined not to reflect accurately fair value, such as when the value of a security has been significantly affected by events after the close of the exchange or market on which the security is principally traded (for example, a foreign exchange or market),but before the fund calculates its net asset value, the fund may value these investments at fair value as determined in accordance with the procedures approved by the Board of Directors. Fair valuing of securities may be determined with the assistance of a pricing service using calculations based on indices of domestic securities and other appropriate indicators, such as prices of relevant American Depository Receipts and futures contracts. For other securities that are fair valued by the Board of Directors, certain factors may be considered such as: fundamental analytical data, the nature and duration of restrictions on disposition, an evaluation of the forces that influence the market in which the securities are purchased and sold, and public trading in similar securities of the issuer or comparable issuers. Financial futures are valued at the last sales price. Investments denominated in foreign currencies are translated to U.S. dollars at the prevailing rates of exchange. Forward currency exchange contracts are valued at the forward rate.
The fund adopted Statement of Financial Accounting Standards No. 157 “FairValue Measurements” (“FAS 157”). FAS 157 establishes an authoritative definition of fair value, sets out a framework for measuring fair value, and requires additional disclosures about fair value measurements.
22
Various inputs are used in determining the value of the fund’s investments relating to FAS 157.These inputs are summarized in the three broad levels listed below.
Level 1—quoted prices in active markets for identical investments.
Level 2—other significant observable inputs (including quoted prices for similar investments, interest rates, prepayment speeds, credit risk, etc.).
Level 3—significant unobservable inputs (including the fund’s own assumptions in determining the fair value of investments).
The inputs or methodology used for valuing securities are not necessarily an indication of the risk associated with investing in those securities.
The following is a summary of the inputs used as of August 31, 2009 in valuing the fund’s investments:
| | | | | Level 2—Other | | Level 3— | | |
| | | Level 1— | | Significant | | Significant | | |
| | | Quoted | | Observable | | Unobservable | | |
| | | Prices | | Inputs | | Inputs | | Total |
| |
| |
| |
| |
|
| Assets ($) | | | | | | | | |
| Investments in Securities: | | | | | | |
| Equity Securities— | | | | | | | | |
| Domestic | | 221,771,143 | | — | | — | | 221,771,143 |
| Equity Securities— | | | | | | | | |
| Foreign | | 11,544,211 | | — | | — | | 11,544,211 |
| Mutual Funds | | 25,822,740 | | — | | — | | 25,822,740 |
| Limited Partnership | | | | | | | | |
| Interests | | — | | — | | 1,825,686 | | 1,825,686 |
| Other Financial | | | | | | | | |
| Instruments† | | — | | — | | — | | — |
| Liabilities ($) | | | | | | | | |
| Other Financial | | | | | | | | |
| Instruments† | | — | | — | | — | | — |
| |
| † Other financial instruments include derivative instruments, such as futures, forward foreign currency |
| exchange contracts, swap contracts and options contracts.Amounts shown represent unrealized |
| appreciation (depreciation), or in the case of options, market value at period end. | | |
The Fund 23
| NOTES TO FINANCIAL STATEMENTS (continued) |
The following is a reconciliation of Level 3 assets for which significant unobservable inputs were used to determine fair value:
| | | Investments in |
| | | Limited Partnership |
| | | Interests ($) |
| |
|
| Balance as of 8/31/2008 | | 2,994,118 |
| Realized gain (loss) | | 379,084 |
| Change in unrealized | | |
| appreciation (depreciation) | | (743,128) |
| Net purchases (sales) | | (804,388) |
| Transfers in and/or out of Level 3 | | — |
| Balance as of 8/31/2009 | | 1,825,686 |
(b) Foreign currency transactions: The fund does not isolate that portion of the results of operations resulting from changes in foreign exchange rates on investments from the fluctuations arising from changes in market prices of securities held. Such fluctuations are included with the net realized and unrealized gain or loss on investments.
Net realized foreign exchange gains or losses arise from sales of foreign currencies, currency gains or losses realized on securities transactions and the difference between the amounts of dividends, interest and foreign withholding taxes recorded on the fund’s books and the U.S. dollar equivalent of the amounts actually received or paid. Net unrealized foreign exchange gains and losses arise from changes in the value of assets and liabilities other than investments resulting from changes in exchange rates. Foreign currency gains and losses on investment are included with net realized and unrealized gain or loss on investments.
(c) Securities transactions and investment income: Securities transactions are recorded on a trade date basis. Realized gains and losses from securities transactions are recorded on the identified cost basis. Dividend income is recognized on the ex-dividend date and interest income, including, where applicable, accretion of discount and amortization of premium on investments is recognized on the accrual basis.
The fund has arrangements with the custodian and cash management bank whereby the fund may receive earnings credits when positive cash
24
balances are maintained, which are used to offset custody and cash management fees. For financial reporting purposes, the fund includes net earnings credits as an expense offset in the Statement of Operations.
Pursuant to a securities lending agreement with The Bank of New York Mellon, a subsidiary of BNY Mellon and an affiliate of Dreyfus, the fund may lend securities to qualified institutions. It is the fund’s policy that, at origination, all loans are secured by collateral of at least 102% of the value of U.S. securities loaned and 105% of the value of foreign securities loaned. Collateral equivalent to at least 100% of the market value of securities on loan is maintained at all times. Collateral is either in the form of cash, which can be invested in certain money market mutual funds managed by the Manager, U.S. Government and Agency securities or letters of credit.The fund is entitled to receive all income on securities loaned, in addition to income earned as a result of the lending transaction. Although each security loaned is fully collateralized, the fund bears the risk of delay in recovery of, or loss of rights in, the securities loaned should a borrower fail to return the securities in a timely manner. During the period ended August 31, 2009,The Bank of New York Mellon earned $39,491, from lending fund portfolio securities, pursuant to the securities lending agreement.
(d) Affiliated issuers: Investments in other investment companies advised by the Manager are defined as “affiliated” in the Act.
(e) Dividends to shareholders: Dividends are recorded on the ex-dividend date. Dividends from investment income-net and dividends from net realized capital gains, if any, are normally declared and paid annually, but the fund may make distributions on a more frequent basis to comply with the distribution requirements of the Internal Revenue Code of 1986, as amended (the “Code”).To the extent that net realized capital gains can be offset by capital loss carryovers, it is the policy of the fund not to distribute such gains. Income and capital gain distributions are determined in accordance with income tax regulations, which may differ from U.S. generally accepted accounting principles.
The Fund 25
| NOTES TO FINANCIAL STATEMENTS (continued) |
(f) Federal income taxes: It is the policy of the fund to continue to qualify as a regulated investment company, if such qualification is in the best interests of its shareholders, by complying with the applicable provisions of the Code, and to make distributions of taxable income sufficient to relieve it from substantially all federal income and excise taxes.
As of and during the period ended August 31, 2009, the fund did not have any liabilities for any uncertain tax positions.The fund recognizes interest and penalties, if any, related to uncertain tax positions as income tax expense in the Statement of Operations. During the period, the fund did not incur any interest or penalties.
Each of the tax years in the four-year period ended August 31, 2009 remains subject to examination by the Internal Revenue Service and state taxing authorities.
At August 31, 2009, the components of accumulated earnings on a tax basis were as follows: accumulated capital losses $161,365,309 and unrealized appreciation $22,631,105. In addition, the fund had $45,285,297 of capital losses realized after October 31, 2008, which were deferred for tax purposes to the first day of the following fiscal year.
The accumulated capital loss carryover is available for federal income tax purposes subject to annual limitations on the utilization pursuant to Section 382 of the Internal Revenue Code. If not applied, $72,980,095 of the carryover expires in fiscal 2011, $73,225,503 expires in fiscal 2012 and $15,159,711 expires in fiscal 2017.
During the period ended August 31, 2009, as a result of permanent book to tax differences, primarily due to the tax treatment for net operating losses, limited partnerships, foreign currency transactions and other permanent book to tax differences under the provisions of Section 382 of the Code, the fund increased accumulated undistributed investment income-net by $1,783,972, increased accumulated net realized gain (loss) on investments by $8,393,836 and decreased paid-in-capital by $10,177,808. Net assets and net asset value per share were not affected by this reclassification.
26
NOTE 2—Bank Line of Credit:
The fund participates with other Dreyfus-managed funds in a $300 million unsecured line of credit provided by The Bank of New York Mellon (the “BNYM Facility”) primarily to be utilized for temporary or emergency purposes including the financing of redemptions. The terms of the BNYM Facility limit the amount of individual fund borrowings. Interest is charged to the fund based on prevailing market rates in effect at the time of borrowing. In connection therewith, the fund has agreed to pay commitment fees on its pro rata portion of the BNYM Facility.
The average amount of borrowings outstanding under the BNYM Facility during the period ended August 31, 2009, was approximately $115,800, with a related weighted average annualized interest rate of 1.03%.
NOTE 3—Management Fee and Other Transactions With Affiliates:
(a) Pursuant to a management agreement with the Manager, the management fee is computed at the annual rate of .75% of the value of the fund’s average daily net assets and is payable monthly.
During the period ended August 31, 2009, the Distributor retained $9,647 from commissions earned on sales of the fund’s Class A shares and $9,521 and $676 from CDSCs on redemptions of the fund’s Class B and Class C shares, respectively.
(b) Under the Distribution Plan (the “Plan”) adopted pursuant to Rule 12b-1 under the Act, Class B and Class C shares pay and Class T shares paid the Distributor for distributing their shares at an annual rate of .75% of the value of the average daily net assets of Class B and Class C shares and .25% of the value of the average daily net assets of Class T shares. During the period ended August 31, 2009, Class B, Class C and Class T shares were charged $34,807, $146,453 and $1,456, respectively, pursuant to the Plan.
The Fund 27
| NOTES TO FINANCIAL STATEMENTS (continued) |
(c) Under the Shareholder Services Plan, Class A, Class B and Class C shares pay and Class T shares paid the Distributor at an annual rate of .25% of the value of their average daily net assets for the provision of certain services. The services provided may include personal services relating to shareholder accounts, such as answering shareholder inquiries regarding the fund and providing reports and other information, and services related to the maintenance of shareholder accounts. The Distributor may make payments to Service Agents (a securities dealer, financial institution or industry professional) in respect of these services.The Distributor determines the amounts to be paid to Service Agents. During the period ended August 31, 2009, Class A, Class B, Class C and Class T shares were charged $459,344, $11,602, $48,818 and $1,456, respectively, pursuant to the Shareholder Services Plan.
The fund compensates Dreyfus Transfer, Inc., a wholly-owned subsidiary of the Manager, under a transfer agency agreement for providing personnel and facilities to perform transfer agency services for the fund. During the period ended August 31, 2009, the fund was charged $498,347 pursuant to the transfer agency agreement.
The fund compensates The Bank of New York Mellon under a cash management agreement for performing cash management services related to fund subscriptions and redemptions. During the period ended August 31, 2009, the fund was charged $71,481 pursuant to the cash management agreement.These fees were offset by earnings credits pursuant to the cash management agreement.
The fund also compensates The Bank of New York Mellon under a custody agreement for providing custodial services for the fund. During the period ended August 31, 2009, the fund was charged $22,496 pursuant to the custody agreement.
During the period ended August 31, 2009, the fund was charged $6,097 for services performed by the Chief Compliance Officer.
The components of “Due to The Dreyfus Corporation and affiliates” in the Statement of Assets and Liabilities consist of: management fees
28
$153,707, Rule 12b-1 distribution plan fees $16,359, shareholder services plan fees $50,740, custodian fees $5,701, chief compliance officer fees $2,784 and transfer agency per account fees $169,400.
(d) Each Board member also serves as a Board member of other funds within the Dreyfus complex. Annual retainer fees and attendance fees are allocated to each fund based on net assets.
NOTE 4—Securities Transactions:
The aggregate amount of purchases and sales of investment securities, excluding short-term securities, during the period ended August 31, 2009, amounted to $262,438,488 and $292,197,623, respectively.
The fund adopted Statement of Financial Accounting Standards No. 161 “Disclosures about Derivative Instruments and Hedging Activities” (“FAS 161”). FAS 161 requires qualitative disclosures about objectives and strategies for using derivatives, quantitative disclosures about fair value amounts of gains and losses on derivative instruments and disclosures about credit-risk-related contingent features in derivative agreements. Since the fund held no derivatives during the period ended August 31, 2009, FAS 161 disclosures did not impact the notes to the financial statements.
At August 31, 2009, the cost of investments for federal income tax purposes was $238,332,675; accordingly, accumulated net unrealized appreciation on investments was $22,631,105, consisting of $29,297,806 gross unrealized appreciation and $6,666,701 gross unrealized depreciation.
NOTE 5—Subsequent Events Evaluation:
Dreyfus has evaluated the need for disclosures and/or adjustments resulting from subsequent events through October 26, 2009, the date the financial statements were issued. This evaluation did not result in any subsequent events that necessitated disclosures and/or adjustments.
The Fund 29
REPORT OF INDEPENDENT REGISTERED
PUBLIC ACCOUNTING FIRM Shareholders and Board of Directors
Dreyfus Technology Growth Fund |
We have audited the accompanying statement of assets and liabilities, including the statement of investments, of Dreyfus Technology Growth Fund (formerly, Dreyfus Premier Technology Growth Fund) (one of the series comprising Advantage Funds, Inc.) as of August 31, 2009, and the related statement of operations for the year then ended, the statement of changes in net assets for each of the two years in the period then ended, and financial highlights for each of the years indicated therein. These financial statements and financial highlights are the responsibility of the Fund’s management. Our responsibility is to express an opinion on these financial statements and financial highlights based on our audits.
We conducted our audits in accordance with the standards of the Public Company Accounting Oversight Board (United States).Those standards require that we plan and perform the audit to obtain reasonable assurance about whether the financial statements and financial highlights are free of material misstatement.We were not engaged to perform an audit of the Fund’s internal control over financial reporting. Our audits included consideration of internal control over financial reporting as a basis for designing audit procedures that are appropriate in the circumstances, but not for the purpose of expressing an opinion on the effectiveness of the Fund’s internal control over financial reporting. Accordingly, we express no such opinion.An audit also includes examining, on a test basis, evidence supporting the amounts and disclosures in the financial statements and financial highlights, assessing the accounting principles used and significant estimates made by management, and evaluating the overall financial statement presentation. Our procedures included confirmation of securities owned as of August 31, 2009 by correspondence with the custodian and others.We believe that our audits provide a reasonable basis for our opinion.
In our opinion, the financial statements and financial highlights referred to above present fairly, in all material respects, the financial position of Dreyfus Technology Growth Fund at August 31, 2009, the results of its operations for the year then ended, the changes in its net assets for each of the two years in the period then ended, and the financial highlights for each of the indicated years, in conformity with U.S. generally accepted accounting principles.

| | New York, New York
October 26, 2009 |
30
INFORMATION ABOUT THE REVIEW AND APPROVAL
OF THE FUND’S MANAGEMENT AGREEMENT (Unaudited) |
At a meeting of the fund’s Board held on March 3, 2009, the Board unanimously approved the continuation of the fund’s Management Agreement with Dreyfus for a one-year term ending March 30, 2010. The Board members, none of whom are “interested persons” (as defined in the Investment Company Act of 1940, as amended) of the fund were assisted in their review by independent legal counsel and met with counsel in executive session separate from representatives of Dreyfus. In approving the continuance of the Management Agreement, the Board considered all factors that they believed to be relevant, including, among other things, the factors discussed below.
Analysis of Nature, Extent and Quality of Services Provided to the Fund. The Board members received a presentation from representatives of Dreyfus regarding services provided to the fund and other funds in the Dreyfus fund complex, and discussed the nature, extent and quality of the services provided to the fund pursuant to its Management Agreement. Dreyfus’ representatives reviewed the fund’s distribution of accounts and the relationships Dreyfus has with various intermediaries and the different needs of each. Dreyfus’ representatives noted the various distribution channels for the fund as well as the diverse methods of distribution among other funds in the Dreyfus fund complex, and Dreyfus’ corresponding need for broad, deep, and diverse resources to be able to provide ongoing shareholder services to each distribution channel, including those of the fund. Dreyfus also provided the number of accounts investing in the fund, as well as the fund’s asset size.
The Board members also considered Dreyfus’ research and portfolio management capabilities and Dreyfus’ oversight of day-to-day fund operations, including fund accounting and administration and assistance in meeting legal and regulatory requirements. The Board members also considered Dreyfus’ extensive administrative, accounting and compliance infrastructure.The Board also considered Dreyfus’ brokerage policies and practices, the standards applied in seeking best execution and Dreyfus’ policies and practices regarding soft dollars.
The Fund 31
INFORMATION ABOUT THE REVIEW AND APPROVAL OF THE
FUND’S MANAGEMENT AGREEMENT (Unaudited) (continued)
Comparative Analysis of the Fund’s Performance and Management Fee and Expense Ratio. The Board members reviewed the fund’s performance and comparisons to a group of retail front-end load science and technology funds that are benchmarked against the Morgan Stanley High Technology 35 Index (“MS High Tech-35 Index”) and the Standard & Poor’s 500 Composite Stock Price Index (“S&P 500 Index”) (the “Performance Group”) and to a larger universe of funds consisting of all retail and institutional science and technology funds (the “Performance Universe”) selected and provided by Lipper, Inc., an independent provider of investment company data. The Board was provided with a description of the methodology Lipper used to select the Performance Group and Performance Universe, as well as the Expense Group and Expense Universe (discussed below).The Board members discussed the results of the comparisons and noted the fund’s average annual total return ranked in the second or third quartile of the Performance Group and Performance Universe for various periods ended December 31, 2008. Dreyfus also provided a comparison of the fund’s calendar year total returns to the returns of the fund’s benchmark index.
The Board members also discussed the fund’s contractual and actual management fees and expense ratio and reviewed the range of management fees and expense ratios as compared to a comparable group of funds (the “Expense Group”) and a broader group of funds (the “Expense Universe”), each selected and provided by Lipper.The fund’s contractual and actual management fees were equal to the Expense Group medians and the fund’s actual management fee was lower than the Expense Universe median.The fund’s expense ratio was equal to the Expense Group median and lower than the Expense Universe median.
Representatives of Dreyfus noted that there were no similarly managed funds, separate accounts or wrap fee accounts managed by Dreyfus or its affiliates with similar investment objectives, policies and strategies as the fund.
32
Analysis of Profitability and Economies of Scale. Dreyfus’ representatives reviewed the dollar amount of expenses allocated and profit received by Dreyfus and the method used to determine such expenses and profit.The Board previously had been provided with information prepared by an independent consulting firm regarding Dreyfus’ approach to allocating costs to, and determining the profitability of, individual funds and the entire Dreyfus mutual fund complex. The Board also was informed that the methodology had also been reviewed by an independent registered public accounting firm which, like the consultant, found the methodology to be reasonable. The consulting firm also analyzed where any economies of scale might emerge in connection with the management of the fund. The Board members evaluated the profitability analysis in light of the relevant circumstances for the fund and the extent to which economies of scale would be realized if the fund grows and whether fee levels reflect these economies of scale for the benefit of fund investors.The Board members also considered potential benefits to Dreyfus from acting as investment adviser and noted the soft dollar arrangements with respect to trading the fund’s investments.
It was noted that the Board members should consider Dreyfus’ profitability with respect to the fund as part of their evaluation of whether the fees under the Management Agreement bear a reasonable relationship to the mix of services provided by Dreyfus, including the nature, extent and quality of such services, and that a discussion of economies of scale is predicated on a fund having achieved a substantial size with increasing assets and that, if a fund’s assets had been static or decreasing, the possibility that Dreyfus may have realized any economies of scale would be less. It also was noted that the profitability percentage for managing the fund was within the range determined by appropriate court cases to be reasonable given the services rendered and generally superior service levels provided.
The Fund 33
INFORMATION ABOUT THE REVIEW AND APPROVAL OF THE
FUND’S MANAGEMENT AGREEMENT (Unaudited) (continued) |
At the conclusion of these discussions, the Board agreed that it had been furnished with sufficient information to make an informed business decision with respect to continuation of the fund’s Management Agreement. Based on the discussions and considerations as described above, the Board made the following conclusions and determinations.
- The Board concluded that the nature, extent and quality of the ser- vices provided by Dreyfus are adequate and appropriate.
- The Board was generally satisfied with the fund’s relative performance.
- The Board concluded that the fee paid by the fund to Dreyfus was reasonable in light of the considerations described above.
- The Board determined that the economies of scale which may accrue to Dreyfus and its affiliates in connection with the management of the fund had been adequately considered by Dreyfus in connection with the management fee rate charged to the fund and that, to the extent in the future it were determined that material economies of scale had not been shared with the fund, the Board would seek to have those economies of scale shared with the fund.
The Board members considered these conclusions and determinations, along with information received on a routine and regular basis throughout the year, and, without any one factor being dispositive, the Board determined that continuation of the fund’s Management Agreement was in the best interests of the fund and its shareholders.
34
| BOARD MEMBERS INFORMATION (Unaudited) |
| |
| |
| |
| Joseph S. DiMartino (65) |
| Chairman of the Board (1995) |
| Principal Occupation During Past 5Years: |
| • Corporate Director and Trustee |
| Other Board Memberships and Affiliations: |
| • The Muscular Dystrophy Association, Director |
| • CBIZ (formerly, Century Business Services, Inc.), a provider of outsourcing functions for small |
| and medium size companies, Director |
| • The Newark Group, a provider of a national market of paper recovery facilities, paperboard |
| mills and paperboard converting plants, Director |
| • Sunair Services Corporation, a provider of certain outdoor-related services to homes and |
| businesses, Director |
| No. of Portfolios for which Board Member Serves: 166 |
| ——————— |
| Peggy C. Davis (66) |
| Board Member (2006) |
| Principal Occupation During Past 5Years: |
| • Shad Professor of Law, New York University School of Law (1983-present) |
| • Writer and teacher in the fields of evidence, constitutional theory, family law, social sciences |
| and the law, legal process and professional methodology and training |
| No. of Portfolios for which Board Member Serves: 53 |
| ——————— |
| David P. Feldman (69) |
| Board Member (1996) |
| Principal Occupation During Past 5Years: |
| • Corporate Director and Trustee |
| Other Board Memberships and Affiliations: |
| • BBH Mutual Funds Group (11 funds), Director |
| • The Jeffrey Company, a private investment company, Director |
| No. of Portfolios for which Board Member Serves: 46 |
| ——————— |
| James F. Henry (78) |
| Board Member (2006) |
| Principal Occupation During Past 5Years: |
| • Advisor to The Elaw Forum, a consultant on managing corporate legal costs |
| • Advisor to John Jay Homestead (the restored home of the first U.S. Chief Justice) |
| • Individual Trustee of several trusts |
| Other Board Memberships and Affiliations: |
| • Director, advisor and mediator involved in several non-profit organizations, primarily engaged |
| in domestic and international dispute resolution, and historic preservation |
| No. of Portfolios for which Board Member Serves: 31 |
The Fund 35
| BOARD MEMBERS INFORMATION (Unaudited) (continued) |
| |
| |
| |
| |
| Ehud Houminer (69) |
| Board Member (1993) |
| Principal Occupation During Past 5Years: |
| • Executive-in-Residence at the Columbia Business School, Columbia University |
| |
| Other Board Memberships and Affiliations: |
| • Avnet Inc., an electronics distributor, Director |
| • International Advisory Board to the MBA Program School of Management, Ben Gurion |
| University, Chairman |
| |
| No. of Portfolios for which Board Member Serves: 58 |
| ——————— |
| Gloria Messinger (79) |
| Board Member (1993) |
| Principal Occupation During Past 5Years: |
| • Arbitrator for American Arbitration Association |
| • Arbitrator for FINRA (formerly, National Association of Securities Dealers, Inc.) |
| • Consultant in Intellectual Property |
| |
| Other Board Memberships and Affiliations: |
| • Theater for a New Audience, Inc., Director |
| • Brooklyn Philharmonic, Director |
| |
| No. of Portfolios for which Board Member Serves: 31 |
| ——————— |
| Dr. Martin Peretz (70) |
| Board Member (2006) |
| Principal Occupation During Past 5Years: |
| • Editor-in-Chief of The New Republic Magazine |
| • Director of TheStreet.com, a financial information service on the web |
| |
| Other Board Memberships and Affiliations: |
| • American Council of Trustees and Alumni, Director |
| • Pershing Square Capital Management, Advisor |
| • Montefiore Ventures, General Partner |
| • Harvard Center for Blood Research,Trustee |
| • Bard College,Trustee |
| • Board of Overseers of YIVO Institute for Jewish Research, Chairman |
| |
| No. of Portfolios for which Board Member Serves: 31 |
| |
| ——————— |
| Once elected all Board Members serve for an indefinite term, but achieve Emeritus status upon reaching age 80.The |
| address of the Board Members and Officers is in c/o The Dreyfus Corporation, 200 Park Avenue, NewYork, NewYork |
| 10166.Additional information about the Board Members is available in the fund’s Statement of Additional Information |
| which can be obtained from Dreyfus free of charge by calling this toll free number: 1-800-554-4611. |
| John M. Fraser, Jr., Emeritus Board Member |
| Rosalind G. Jacobs, Emeritus Board Member |
| Dr. Paul A. Marks, Emeritus Board Member |
36
OFFICERS OF THE FUND (Unaudited)
J. DAVID OFFICER, President since December 2006.
Chairman, President and Chief Executive Officer of Founders Asset Management LLC, an affiliate of the Manager, and an officer of 75 investment companies (comprised of 166 portfolios) managed by the Manager. Prior to June 2009, Mr. Officer was Chief Operating Officer,Vice Chairman and a director of the Manager, where he had been employed since April 1998. He is 61 years old.
PHILLIP N. MAISANO, Executive Vice President since July 2007.
Chief Investment Officer,Vice Chair and a director of the Manager, and an officer of 75 investment companies (comprised of 166 portfolios) managed by the Manager. Mr. Maisano also is an officer and/or Board member of certain other investment management subsidiaries of The Bank of New York Mellon Corporation, each of which is an affiliate of the Manager. He is 62 years old and has been an employee of the Manager since November 2006. Prior to joining the Manager, Mr. Maisano served as Chairman and Chief Executive Officer of EACM Advisors, an affiliate of the Manager, since August 2004, and served as Chief Executive Officer of Evaluation Associates, a leading institutional investment consulting firm, from 1988 until 2004.
MICHAEL A. ROSENBERG, Vice President and Secretary since August 2005.
Assistant General Counsel of BNY Mellon, and an officer of 76 investment companies (comprised of 187 portfolios) managed by the Manager. He is 49 years old and has been an employee of the Manager since October 1991.
JAMES BITETTO, Vice President and Assistant Secretary since August 2005.
Senior Counsel of BNY Mellon and Secretary of the Manager, and an officer of 76 investment companies (comprised of 187 portfolios) managed by the Manager. He is 43 years old and has been an employee of the Manager since December 1996.
JONI LACKS CHARATAN, Vice President and Assistant Secretary since August 2005.
Senior Counsel of BNY Mellon, and an officer of 76 investment companies (comprised of 187 portfolios) managed by the Manager. She is 53 years old and has been an employee of the Manager since October 1988.
JOSEPH M. CHIOFFI, Vice President and Assistant Secretary since August 2005.
Senior Counsel of BNY Mellon, and an officer of 76 investment companies (comprised of 187 portfolios) managed by the Manager. He is 47 years old and has been an employee of the Manager since June 2000.
JANETTE E. FARRAGHER, Vice President and Assistant Secretary since August 2005.
Assistant General Counsel of BNY Mellon, and an officer of 76 investment companies (comprised of 187 portfolios) managed by the Manager. She is 46 years old and has been an employee of the Manager since February 1984.
JOHN B. HAMMALIAN, Vice President and Assistant Secretary since August 2005.
Managing Counsel of BNY Mellon, and an officer of 76 investment companies (comprised of 187 portfolios) managed by the Manager. He is 46 years old and has been an employee of the Manager since February 1991.
ROBERT R. MULLERY, Vice President and Assistant Secretary since August 2005.
Managing Counsel of BNY Mellon, and an officer of 76 investment companies (comprised of 187 portfolios) managed by the Manager. He is 57 years old and has been an employee of the Manager since May 1986.
JEFF PRUSNOFSKY, Vice President and Assistant Secretary since August 2005.
Managing Counsel of BNY Mellon, and an officer of 76 investment companies (comprised of 187 portfolios) managed by the Manager. He is 44 years old and has been an employee of the Manager since October 1990.
The Fund 37
OFFICERS OF THE FUND (Unaudited) (continued)
JAMES WINDELS, Treasurer since November 2001.
Director – Mutual Fund Accounting of the Manager, and an officer of 76 investment companies (comprised of 187 portfolios) managed by the Manager. He is 49 years old and has been an employee of the Manager since April 1985.
RICHARD CASSARO, Assistant Treasurer since January 2008.
Senior Accounting Manager – Money Market and Municipal Bond Funds of the Manager, and an officer of 76 investment companies (comprised of 187 portfolios) managed by the Manager. He is 50 years old and has been an employee of the Manager since September 1982.
GAVIN C. REILLY, Assistant Treasurer since December 2005.
Tax Manager of the Investment Accounting and Support Department of the Manager, and an officer of 76 investment companies (comprised of 187 portfolios) managed by the Manager. He is 41 years old and has been an employee of the Manager since April 1991.
ROBERT ROBOL, Assistant Treasurer since August 2005.
Senior Accounting Manager – Fixed Income Funds of the Manager, and an officer of 76 investment companies (comprised of 187 portfolios) managed by the Manager. He is 45 years old and has been an employee of the Manager since October 1988.
ROBERT SALVIOLO, Assistant Treasurer since July 2007.
Senior Accounting Manager – Equity Funds of the Manager, and an officer of 76 investment companies (comprised of 187 portfolios) managed by the Manager. He is 42 years old and has been an employee of the Manager since June 1989.
ROBERT SVAGNA, Assistant Treasurer since December 2002.
Senior Accounting Manager – Equity Funds of the Manager, and an officer of 76 investment companies (comprised of 187 portfolios) managed by the Manager. He is 42 years old and has been an employee of the Manager since November 1990.
JOSEPH W. CONNOLLY, Chief Compliance Officer since October 2004.
Chief Compliance Officer of the Manager and The Dreyfus Family of Funds (76 investment companies, comprised of 187 portfolios). From November 2001 through March 2004, Mr. Connolly was first Vice-President, Mutual Fund Servicing for Mellon Global Securities Services. In that capacity, Mr. Connolly was responsible for managing Mellon’s Custody, Fund Accounting and Fund Administration services to third-party mutual fund clients. He is 52 years old and has served in various capacities with the Manager since 1980, including manager of the firm’s Fund Accounting Department from 1997 through October 2001.
WILLIAM GERMENIS, Anti-Money Laundering Compliance Officer since October 2002.
Vice President and Anti-Money Laundering Compliance Officer of the Distributor, and the Anti-Money Laundering Compliance Officer of 72 investment companies (comprised of 183 portfolios) managed by the Manager. He is 38 years old and has been an employee of the Distributor since October 1998.
38
NOTES

Item 2. Code of Ethics.
The Registrant has adopted a code of ethics that applies to the Registrant's principal executive officer, principal financial officer, principal accounting officer or controller, or persons performing similar functions. There have been no amendments to, or waivers in connection with, the Code of Ethics during the period covered by this Report.
Item 3. Audit Committee Financial Expert.
The Registrant's Board has determined that David P. Feldman, a member of the Audit Committee of the Board, is an audit committee financial expert as defined by the Securities and Exchange Commission (the "SEC"). David P. Feldman is "independent" as defined by the SEC for purposes of audit committee financial expert determinations.
Item 4. Principal Accountant Fees and Services.
(a) Audit Fees. The aggregate fees billed for each of the last two fiscal years (the "Reporting Periods") for professional services rendered by the Registrant's principal accountant (the "Auditor") for the audit of the Registrant's annual financial statements or services that are normally provided by the Auditor in connection with the statutory and regulatory filings or engagements for the Reporting Periods, were $262,004 in 2008 and $196,025 in 2009.
(b) Audit-Related Fees. The aggregate fees billed in the Reporting Periods for assurance and related services by the Auditor that are reasonably related to the performance of the audit of the Registrant's financial statements and are not reported under paragraph (a) of this Item 4 were $49,513 in 2008 and $42,208 in 2009.
The aggregate fees billed in the Reporting Periods for non-audit assurance and related services by the Auditor to the Registrant's investment adviser (not including any sub-investment adviser whose role is primarily portfolio management and is subcontracted with or overseen by another investment adviser), and any entity controlling, controlled by or under common control with the investment adviser that provides ongoing services to the Registrant ("Service Affiliates"), that were reasonably related to the performance of the annual audit of the Service Affiliate, which required pre-approval by the Audit Committee were $0 in 2008 and $0 in 2009.
(c) Tax Fees. The aggregate fees billed in the Reporting Periods for professional services rendered by the Auditor for tax compliance, tax advice, and tax planning ("Tax Services") were $33,138 in 2008 and $26,971 in 2009. These services consisted of: (i) review or preparation of U.S. federal, state, local and excise tax returns; (ii) U.S. federal, state and local tax planning, advice and assistance regarding statutory, regulatory or administrative developments; (iii) tax advice regarding tax qualification matters and/or treatment of various financial instruments held or proposed to be acquired or held. The aggregate fees billed in the Reporting Periods for Tax Services by the Auditor to Service Affiliates, which required pre-approval by the Audit Committee were $0 in 2008 and $0 in 2009.
(d) All Other Fees. The aggregate fees billed in the Reporting Periods for products and services provided by the Auditor, other than the services reported in paragraphs (a) through (c) of this Item, were $1,243 in 2008 and $493 in 2009. [These services consisted of a review of the Registrant's anti-money laundering program].
The aggregate fees billed in the Reporting Periods for Non-Audit Services by the Auditor to Service Affiliates, other than the services reported in paragraphs (b) through (c) of this Item, which required pre-approval by the Audit Committee, were $0 in 2008 and $0 in 2009.
Note: In each of (b) through (d) of this Item 4, 100% of all services provided by the Auditor were pre-approved as required.
Audit Committee Pre-Approval Policies and Procedures. The Registrant's Audit Committee has established policies and procedures (the "Policy") for pre-approval (within specified fee limits) of the Auditor's engagements for non-audit services to the Registrant and Service Affiliates without specific case-by-case consideration. Pre-approval considerations include whether the proposed services are compatible with maintaining the Auditor's independence. Pre-approvals pursuant to the Policy are considered annually.
Non-Audit Fees. The aggregate non-audit fees billed by the Auditor for services rendered to the Registrant, and rendered to Service Affiliates, for the Reporting Periods were $3,605,073 in 2008 and $24,372,300 in 2009.
Auditor Independence. The Registrant's Audit Committee has considered whether the provision of non-audit services that were rendered to Service Affiliates, which were not pre-approved (not requiring pre-approval), is compatible with maintaining the Auditor's independence.
| Item 5. | | Audit Committee of Listed Registrants. |
| | | Not applicable. [CLOSED-END FUNDS ONLY] |
| Item 6. | | Investments. |
| (a) | | Not applicable. |
| Item 7. | | Disclosure of Proxy Voting Policies and Procedures for Closed-End Management |
| | | Investment Companies. |
| | | Not applicable. [CLOSED-END FUNDS ONLY] |
| Item 8. | | Portfolio Managers of Closed-End Management Investment Companies. |
| | | Not applicable. [CLOSED-END FUNDS ONLY, beginning with reports for periods ended |
| | | on and after December 31, 2005] |
| Item 9. | | Purchases of Equity Securities by Closed-End Management Investment Companies and |
| | | Affiliated Purchasers. |
| | | Not applicable. [CLOSED-END FUNDS ONLY] |
| Item 10. | | Submission of Matters to a Vote of Security Holders. |
| There have been no material changes to the procedures applicable to Item 10. |
| |
| Item 11. | | Controls and Procedures. |
(a) The Registrant's principal executive and principal financial officers have concluded, based on their evaluation of the Registrant's disclosure controls and procedures as of a date within 90 days of the filing date of this report, that the Registrant's disclosure controls and procedures are reasonably designed to ensure that information required to be disclosed by the Registrant on Form N-CSR is recorded, processed, summarized and reported within the required time periods and that information required to be disclosed by the Registrant in the reports that it files or submits on Form N-CSR is accumulated and communicated to the Registrant's management, including its principal executive and principal financial officers, as appropriate to allow timely decisions regarding required disclosure.
(b) There were no changes to the Registrant's internal control over financial reporting that occurred during the second fiscal quarter of the period covered by this report that have materially affected, or are reasonably likely to materially affect, the Registrant's internal control over financial reporting.
Item 12. Exhibits.
(a)(1) Code of ethics referred to in Item 2.
(a)(2) Certifications of principal executive and principal financial officers as required by Rule 30a-2(a) under the Investment Company Act of 1940.
(a)(3) Not applicable.
(b) Certification of principal executive and principal financial officers as required by Rule 30a-2(b) under the Investment Company Act of 1940.
Pursuant to the requirements of the Securities Exchange Act of 1934 and the Investment Company Act of 1940, the Registrant has duly caused this Report to be signed on its behalf by the undersigned, thereunto duly authorized.
| Advantage Funds, Inc. |
| |
| By: | | /s/ J. David Officer |
| | |
|
| | | J. David Officer, |
| | President |
| |
| Date: | | October 28, 2009 |
Pursuant to the requirements of the Securities Exchange Act of 1934 and the Investment Company Act of 1940, this Report has been signed below by the following persons on behalf of the Registrant and in the capacities and on the dates indicated.
| By: | | /s/ J. David Officer |
| | |
|
| | | J. David Officer, |
| | President |
| |
| Date: | | October 28, 2009 |
| |
| By: | | /s/ James Windels |
| | |
|
| | | James Windels, |
| | Treasurer |
| |
| Date: | | October 28, 2009 |
(a)(1) Code of ethics referred to in Item 2.
(a)(2) Certifications of principal executive and principal financial officers as required by Rule 30a-2(a) under the Investment Company Act of 1940. (EX-99.CERT)
(b) Certification of principal executive and principal financial officers as required by Rule 30a-2(b) under the Investment Company Act of 1940. (EX-99.906CERT)