UNITED STATES
SECURITIES AND EXCHANGE COMMISSION
Washington, D.C. 20549
FORM N-CSR
CERTIFIED SHAREHOLDER REPORT OF REGISTERED MANAGEMENT
INVESTMENT COMPANIES
Investment Company Act file number | 811- 7123 |
| |
| Advantage Funds, Inc. | |
| (Exact name of Registrant as specified in charter) | |
| | |
| c/o The Dreyfus Corporation 200 Park Avenue New York, New York 10166 | |
| (Address of principal executive offices) (Zip code) | |
| | |
| Michael A. Rosenberg, Esq. 200 Park Avenue New York, New York 10166 | |
| (Name and address of agent for service) | |
|
Registrant's telephone number, including area code: | (212) 922-6000 |
| |
Date of fiscal year end: | 10/31 | |
Date of reporting period: | 10/31/2010 | |
| | | | | | |
ADVANTAGE FUNDS, INC.
- Dreyfus Global Absolute Return Fund
- Dreyfus Global Real Return Fund
- Dreyfus Total Return Advantage Fund
- Global Alpha Fund
FORM N-CSR
Item 1. Reports to Stockholders.
|
| Dreyfus |
| Global Absolute |
| Return Fund |
ANNUAL REPORT October 31, 2010

Save time. Save paper. View your next shareholder report online as soon as it’s available. Log into www.dreyfus.com and sign up for Dreyfus eCommunications. It’s simple and only takes a few minutes.
The views expressed in this report reflect those of the portfolio manager only through the end of the period covered and do not necessarily represent the views of Dreyfus or any other person in the Dreyfus organization. Any such views are subject to change at any time based upon market or other conditions and Dreyfus disclaims any responsibility to update such views.These views may not be relied on as investment advice and, because investment decisions for a Dreyfus fund are based on numerous factors, may not be relied on as an indication of trading intent on behalf of any Dreyfus fund.

| | Contents |
| | THE FUND |
| 2 | A Letter from the Chairman and CEO |
| 3 | Discussion of Fund Performance |
| 6 | Fund Performance |
| 8 | Understanding Your Fund’s Expenses |
| 8 | Comparing Your Fund’s Expenses With Those of Other Funds |
| 9 | Statement of Investments |
| 10 | Statement of Financial Futures |
| 11 | Statement of Assets and Liabilities |
| 12 | Statement of Operations |
| 13 | Statement of Changes in Net Assets |
| 15 | Financial Highlights |
| 18 | Notes to Financial Statements |
| 36 | Report of Independent Registered Public Accounting Firm |
| 37 | Board Members Information |
| 39 | Officers of the Fund |
| | FOR MORE INFORMATION |
| | Back Cover |
|
| Dreyfus |
| Global Absolute |
| Return Fund |
The Fund

A LETTER FROM THE CHAIRMAN AND CEO
Dear Shareholder:
We are pleased to present this annual report for Dreyfus Global Absolute Return Fund, covering the 12-month period from November 1, 2009, through October 31, 2010.
Although a double-dip recession has recently become an increasingly unlikely scenario in our view, persistent uncertainty regarding the breadth and strength of the U.S. and global economic recoveries led to bouts of heightened volatility for U.S. stocks during most of 2010.The spending power of the U.S. consumer, long an important catalyst for economic growth, has been diminished by concerns over job security and an inability to generate cash from home equity.The second major driver of sustainable growth, corporate investment, has been stunted to a similar extent by tight credit conditions. However, the recent announcement of additional quantitative easing (QE2) measures by the Federal Reserve Board, as well as improved fundamentals across many developing nations, have helped support moderate global economic growth.
Uncertainty will probably remain in the broader financial markets until we see more evidence of robust economic growth, but we remain optimistic regarding the prospects for equities. Many stocks of quality companies with healthy balance sheets, higher credit ratings and strong cash flows appear to be currently priced at a discount.With that, we strongly suggest that you meet with your financial advisor to discuss the potential opportunities which may exist in the global markets, as well as to evaluate your portfolio to help meet your individual investment needs and your future goals relative to your risk-tolerance level.
For information about how the fund performed during the reporting period, as well as general market perspectives, we provide a Discussion of Fund Performance on the pages that follow.
Thank you for your continued confidence and support.

Jonathan R. Baum
Chairman and Chief Executive Officer
The Dreyfus Corporation
November 15, 2010
2

DISCUSSION OF FUND PERFORMANCE
For the period of November 1, 2009, through October 31, 2010, as provided by Vassilis Dagioglu, James Stavena, Torrey Zaches and Joseph Miletich, Portfolio Managers
Fund and Market Performance Overview
For the 12-month period ended October 31, 2010, Dreyfus Global Absolute Return Fund’s Class A shares produced a total return of 6.89%, Class C shares returned 6.11% and Class I shares returned 7.20%.1 In comparison, the fund’s benchmark, the Citibank 30-Day Treasury Bill Index, produced a total return of 0.11% for the same period.2
Relative mispricing across global markets converged during the reporting period as a result of improved market liquidity and a recovering global economy.The fund produced higher returns than its benchmark, as it successfully adopted various equity, bond and currency positions that were designed to take fuller advantage of the global economic recovery and changes in relative valuations across asset classes and geographic regions.
The Fund’s Investment Approach
The fund seeks total return through investments in securities and instruments that provide exposure to global stock, bond and currency markets. For allocation among equity markets, the portfolio managers employ a bottom-up valuation approach using proprietary models to derive market level expected returns. For allocation among bond markets, the portfolio managers use proprietary models to identify temporary mispricings among the long-term government bond markets. The most relevant long-term bond yield within each country serves as the expected return for each bond market. Our quantitative investment approach is designed to identify and exploit relative misvaluations across and within major developed capital markets such as the United States, Japan and the larger Western European countries.
Global Economic Concerns Sparked Market Volatility
Although the reporting period began in the midst of an economic recovery that propelled many financial markets higher through the first quarter
The Fund 3
DISCUSSION OF FUND PERFORMANCE (continued)
of 2010, investor confidence was shaken in the spring by a sovereign debt crisis in Europe. Greece found itself unable to refinance a heavy debt load, leading to devaluation of the euro against most other major currencies. Meanwhile, inflation-fighting measures in China caused investors to worry that a major engine of global growth might be derailed. In the United States, mixed housing and employment data and a catastrophic oil spill in the Gulf of Mexico added to global and domestic economic uncertainty. As investor sentiment deteriorated during the spring and summer, global financial markets generally declined sharply.
However, investors’ fears at the time may have been overblown. Earnings among multinational companies generally continued to improve, and the U.S. and global economies remained on mildly upward trajectories through the fall. In addition, anticipation of a second round of quantitative easing of U.S. monetary policy helped support certain stocks, bonds and currencies in September and October, helping to erase the reporting period’s previous losses.
Stock, Bond and Currency Strategies Supported Fund Results
The fund proved to be well positioned in advance of the European sovereign debt crisis, enabling it to participate fully in the devaluation of the euro and rally in U.S. bonds as global investors sought traditional safe havens in the face of market instability and a potential economic downturn in Europe. Later in the reporting period, when the Federal Reserve Board announced the second round of quantitative easing in the United States, the fund further benefited from a short position in the U.S. dollar, which shed some of its value relative to other currencies, such as the Australian dollar. However, the fund received its strongest contributions to performance during the reporting period from global equity markets, where a bearish position in Japanese equities and a bullish position in the United Kingdom produced above-average results with below-average levels of volatility.
Although the fund encountered relatively few disappointments during the reporting period, its relative performance was undermined to a mild degree by short positions in the British pound and European equities. In particular, the fund suffered from its long exposure to the stock market of France.
4
Seeking Opportunities in Currency and Equity Markets
Despite the financial markets’ recent positive responses to signs of potential improvement in the global economy, we expect uncertainty to persist into 2011 as investors “wait and see” regarding the efficacy of current monetary stimulus efforts in the face of persistent headwinds.Therefore, the fund has adopted a generally market-neutral investment posture, without taking directional bets regarding the overall performance of global stock and bond markets.We see more opportunity for returns in the currency markets, where we anticipate further devaluation of the U.S. dollar against other major currencies. We also have identified valuation disparities across regional equity markets, as stock prices in the United Kingdom appear more attractive to us than they do in North American markets. In our judgment, these strategies position the fund to participate in global financial markets while effectively man aging the risks of heightened market volatility as economic conditions change.
November 15, 2010
| |
| | Investing in foreign companies involves special risks, including changes in currency rates, political, |
| | economic and social instability, a lack of comprehensive company information, differing auditing |
| | and legal standards, and less market liquidity. |
| | Equity securities are subject generally to market, market sector, market liquidity, issuer and |
| | investment style risks, among other factors, to varying degrees, all of which are more fully |
| | described in the fund’s prospectus. Bond securities are subject generally to interest rate, credit, |
| | liquidity, call, sector and market risks, to varying degrees, all of which are more fully described in |
| | the fund’s prospectus. |
| | Investments in foreign currencies are subject to the risk that those currencies will decline in value |
| | relative to the U.S. dollar, or, in the case of hedged positions, that the U.S. dollar will decline |
| | relative to the currency being hedged. |
| 1 | Total return includes reinvestment of dividends and any capital gains paid, and does not take |
| | into consideration the maximum initial sales charge in the case of Class A shares, or the |
| | applicable contingent deferred sales charge imposed on redemptions in the case of Class C shares. |
| | Had these charges been reflected, returns would have been lower. Past performance is no guarantee |
| | of future results. Share price, yield and investment return fluctuate such that upon redemption, |
| | fund shares may be worth more or less than their original cost. Return figures provided reflect |
| | the absorption of certain fund expenses by The Dreyfus Corporation pursuant to an agreement |
| | in effect until March 1, 2012. Had these expenses not been absorbed, the fund’s returns would |
| | have been lower. |
| 2 | SOURCE: FactSet – Citigroup 30-Day Treasury Bill Index is a market value-weighted index |
| | of public obligations of the U.S.Treasury with maturities of 30 days. Investors cannot invest |
| | directly in any index. |
The Fund 5
FUND PERFORMANCE
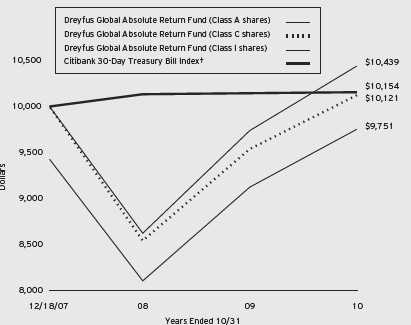
Comparison of change in value of $10,000 investment in Dreyfus Global Absolute Return Fund Class A shares, Class C shares and Class I shares and the Citibank 30-Day Treasury Bill Index
† Source: Bloomberg L.P.
Past performance is not predictive of future performance.
The above graph compares a $10,000 investment made in Class A, Class C and Class I shares of Dreyfus Global Absolute Return Fund on 12/18/07 (inception date) to a $10,000 investment made in the Citibank 30-Day Treasury Bill Index (the “Index”) on that date.All dividends and capital gain distributions are reinvested. For comparative purposes, the value of the Index on 12/31/07 is used as the beginning value on 12/18/07.
The fund’s performance shown in the line graph takes into account the maximum initial sales charge on Class A shares and all other applicable fees and expenses on all classes.The Index is a market value-weighted index of public obligations of the U.S.Treasury with maturities of 30 days. Unlike a mutual fund, the Index is not subject to charges, fees and other expenses. Investors cannot invest directly in any index. Further information relating to fund performance, including expense reimbursements, if applicable, is contained in the Financial Highlights section of the prospectus and elsewhere in this report.
6
| | | |
| Average Annual Total Returns as of 10/31/10 | | | |
| |
| | Inception | | From |
| | Date | 1 Year | Inception |
| Class A shares | | | |
| with maximum sales charge (5.75%) | 12/18/07 | 0.71% | –0.88% |
| without sales charge | 12/18/07 | 6.89% | 1.18% |
| Class C shares | | | |
| with applicable redemption charge † | 12/18/07 | 5.11% | 0.42% |
| without redemption | 12/18/07 | 6.11% | 0.42% |
| Class I shares | 12/18/07 | 7.20% | 1.51% |
| Citibank 30-Day Treasury Bill Index†† | 12/31/07 | 0.11% | 0.54% |
Past performance is not predictive of future performance.The fund’s performance shown in the graph and table does not reflect the deduction of taxes that a shareholder would pay on fund distributions or the redemption of fund shares.
| |
| † | The maximum contingent deferred sales charge for Class C shares is 1% for shares redeemed within one year of the |
| | date of purchase. |
| †† | For comparative purposes, the value of the Index as of 12/31/07 is used as the beginning value on 12/18/07. |
The Fund 7
UNDERSTANDING YOUR FUND’S EXPENSES (Unaudited)
As a mutual fund investor, you pay ongoing expenses, such as management fees and other expenses. Using the information below, you can estimate how these expenses affect your investment and compare them with the expenses of other funds.You also may pay one-time transaction expenses, including sales charges (loads) and redemption fees, which are not shown in this section and would have resulted in higher total expenses. For more information, see your fund’s prospectus or talk to your financial adviser.
Review your fund’s expenses
The table below shows the expenses you would have paid on a $1,000 investment in Dreyfus Global Absolute Return Fund from May 1, 2010 to October 31, 2010. It also shows how much a $1,000 investment would be worth at the close of the period, assuming actual returns and expenses.
Expenses and Value of a $1,000 Investment
assuming actual returns for the six months ended October 31, 2010
| | | |
| | Class A | Class C | Class I |
| Expenses paid per $1,000† | $ 7.79 | $ 11.66 | $ 6.50 |
| Ending value (after expenses) | $1,060.80 | $1,056.60 | $1,062.30 |
COMPARING YOUR FUND’S EXPENSES
WITH THOSE OF OTHER FUNDS (Unaudited)
Using the SEC’s method to compare expenses
The Securities and Exchange Commission (SEC) has established guidelines to help investors assess fund expenses. Per these guidelines, the table below shows your fund’s expenses based on a $1,000 investment, assuming a hypothetical 5% annualized return. You can use this information to compare the ongoing expenses (but not transaction expenses or total cost) of investing in the fund with those of other funds.All mutual fund shareholder reports will provide this information to help you make this comparison. Please note that you cannot use this information to estimate your actual ending account balance and expenses paid during the period.
Expenses and Value of a $1,000 Investment
assuming a hypothetical 5% annualized return for the six months ended October 31, 2010
| | | |
| | Class A | Class C | Class I |
| Expenses paid per $1,000† | $ 7.63 | $ 11.42 | $ 6.36 |
| Ending value (after expenses) | $1,017.64 | $1,013.86 | $1,018.90 |
|
| † Expenses are equal to the fund’s annualized expense ratio of 1.50% for Class A, 2.25% for Class C and 1.25% |
| for Class I , multiplied by the average account value over the period, multiplied by 184/365 (to reflect the one-half |
| year period). |
8
STATEMENT OF INVESTMENTS
October 31, 2010
| | | |
| | Principal | | |
| Short-Term Investments—71.0% | Amount ($) | | Value ($) |
| U.S. Treasury Bills: | | | |
| 0.12%, 11/26/10 | 660,000 | | 659,945 |
| 0.13%, 12/23/10 | 635,000 | a | 634,872 |
| 0.13%, 1/27/11 | 1,030,000 | | 1,029,733 |
| 0.14%, 12/16/10 | 2,100,000 | | 2,099,672 |
| 0.14%, 1/13/11 | 1,638,000 | | 1,637,667 |
| 0.15%, 11/4/10 | 400,000 | | 399,995 |
| 0.15%, 11/12/10 | 2,590,000 | | 2,589,920 |
| 0.15%, 11/18/10 | 600,000 | | 599,971 |
| Total Short-Term Investments | | | |
| (cost $9,651,505) | | | 9,651,775 |
| |
| | Face Amount | | |
| | Covered by | | |
| Options Purchased—3.8% | Contracts ($) | | Value ($) |
| Call Options; | | | |
| U.S. Treasury 10 Year Notes | | | |
| November 2010 @ $114 | | | |
| (cost $471,276) | 4,200,000 | b | 515,813 |
| |
| Other Investment—23.7% | Shares | | Value ($) |
| Registered Investment Company; | | | |
| Dreyfus Institutional Preferred | | | |
| Plus Money Market Fund | | | |
| (cost $3,225,000) | 3,225,000 | c | 3,225,000 |
| |
| Total Investments (cost $13,347,781) | 98.5% | | 13,392,588 |
| Cash and Receivables (Net) | 1.5% | | 198,920 |
| Net Assets | 100.0% | | 13,591,508 |
| |
| a | Held by a broker as collateral for open financial futures positions. |
| b | Non-income producing security. |
| c | Investment in affiliated money market mutual fund. |
| | | |
| Portfolio Summary (Unaudited)† | | |
| | Value (%) | | Value (%) |
| Short-Term/ | | Options Purchased | 3.8 |
| Money Market Investments | 94.7 | | 98.5 |
| † Based on net assets. | | | |
| See notes to financial statements. | | | |
The Fund 9
STATEMENT OF FINANCIAL FUTURES
October 31, 2010
| | | | |
| | | | | Unrealized |
| | | Market Value | | Appreciation |
| | | Covered by | | (Depreciation) |
| Contracts | Contracts ($) | Expiration | at 10/31/2010 ($) |
| Financial Futures Long | | | | |
| CAC 40 10 Euro | 12 | 636,209 | November 2010 | 2,720 |
| DAX | 1 | 230,010 | December 2010 | 12,923 |
| Euro-Bond | 12 | 2,155,390 | December 2010 | (11,409) |
| Euro-Bond Options | 23 | 472,160 | November 2010 | 99,904 |
| FTSE 100 | 29 | 2,624,730 | December 2010 | 55,842 |
| Japanese 10 Year Mini Bond | 9 | 1,600,335 | December 2010 | 4,346 |
| U.S. Treasury 10 Year Notes | 12 | 1,515,375 | December 2010 | (1,353) |
| Financial Futures Short | | | | |
| Long Gilt | 19 | (3,747,326) | December 2010 | 45,756 |
| Japanese 10 Year Bond | 1 | (1,777,778) | December 2010 | (26,453) |
| S & P 500 Emini | 34 | (2,005,490) | December 2010 | (109,881) |
| Gross Unrealized Appreciation | | | | 221,491 |
| Gross Unrealized Depreciation | | | | (149,096) |
| |
| See notes to financial statements. | | | | |
10
STATEMENT OF ASSETS AND LIABILITIES
October 31, 2010
| | | |
| | | Cost | Value |
| Assets ($): | | | |
| Investments in securities—See Statement of Investments: | | |
| Unaffiliated issuers | | 10,122,781 | 10,167,588 |
| Affiliated issuers | | 3,225,000 | 3,225,000 |
| Cash | | | 74,866 |
| Unrealized appreciation on forward foreign | | | |
| currency exchange contracts—Note 4 | | | 231,481 |
| Receivable for investment securities sold | | | 141,895 |
| Receivable for shares of Common Stock subscribed | | | 58,302 |
| Dividends and interest receivable | | | 444 |
| Prepaid expenses | | | 9,407 |
| | | | 13,908,983 |
| Liabilities ($): | | | |
| Due to The Dreyfus Corporation and affiliates—Note 3(c) | | 12,778 |
| Payable for investment securities purchased | | | 129,586 |
| Unrealized depreciation on forward foreign | | | |
| currency exchange contracts—Note 4 | | | 109,705 |
| Payable for futures variation margin—Note 4 | | | 25,888 |
| Accrued expenses | | | 39,518 |
| | | | 317,475 |
| Net Assets ($) | | | 13,591,508 |
| Composition of Net Assets ($): | | | |
| Paid-in capital | | | 12,686,852 |
| Accumulated net realized gain (loss) on investments | | | 668,697 |
| Accumulated net unrealized appreciation (depreciation) on investments, | |
| options transactions and foreign currency transactions (including | | |
| $72,395 net unrealized appreciation on financial futures) | | 235,959 |
| Net Assets ($) | | | 13,591,508 |
| |
| |
| Net Asset Value Per Share | | | |
| | Class A | Class C | Class I |
| Net Assets ($) | 7,995,129 | 1,242,719 | 4,353,660 |
| Shares Outstanding | 628,084 | 99,316 | 340,164 |
| Net Asset Value Per Share ($) | 12.73 | 12.51 | 12.80 |
| |
| See notes to financial statements. | | | |
The Fund 11
| |
| STATEMENT OF OPERATIONS | |
| Year Ended October 31, 2010 | |
| |
| |
| |
| |
| Investment Income ($): | |
| Income: | |
| Interest | 12,273 |
| Cash dividends; | |
| Affiliated issuers | 4,498 |
| Total Income | 16,771 |
| Expenses: | |
| Management fee—Note 3(a) | 148,181 |
| Auditing fees | 37,331 |
| Registration fees | 37,249 |
| Shareholder servicing costs—Note 3(c) | 35,304 |
| Distribution fees—Note 3(b) | 10,851 |
| Prospectus and shareholders’ reports | 9,846 |
| Custodian fees—Note 3(c) | 2,352 |
| Legal fees | 1,122 |
| Directors’ fees and expenses—Note 3(d) | 813 |
| Loan commitment fees—Note 2 | 313 |
| Miscellaneous | 10,570 |
| Total Expenses | 293,932 |
| Less—reduction in management fee due to undertaking—Note 3(a) | (88,267) |
| Less—reduction in fees due to earnings credits—Note 3(c) | (14) |
| Net Expenses | 205,651 |
| Investment (Loss)—Net | (188,880) |
| Realized and Unrealized Gain (Loss) on Investments—Note 4 ($): | |
| Net realized gain (loss) on investments and foreign currency transactions | (53,499) |
| Net realized gain (loss) on options transactions | 364,511 |
| Net realized gain (loss) on financial futures | 218,250 |
| Net realized gain (loss) on forward foreign currency exchange contracts | 552,542 |
| Net Realized Gain (Loss) | 1,081,804 |
| Net unrealized appreciation (depreciation) on | |
| investments and foreign currency transactions | (3,599) |
| Net unrealized appreciation (depreciation) on options transactions | 44,537 |
| Net unrealized appreciation (depreciation) on financial futures | 12,362 |
| Net unrealized appreciation (depreciation) on | |
| forward foreign currency exchange contracts | (2,214) |
| Net Unrealized Appreciation (Depreciation) | 51,086 |
| Net Realized and Unrealized Gain (Loss) on Investments | 1,132,890 |
| Net Increase in Net Assets Resulting from Operations | 944,010 |
| |
| See notes to financial statements. | |
12
STATEMENT OF CHANGES IN NET ASSETS
| | |
| | Year Ended October 31, |
| | 2010 | 2009a |
| Operations ($): | | |
| Investment (loss)—net | (188,880) | (152,401) |
| Net realized gain (loss) on investments | 1,081,804 | 1,027,496 |
| Net unrealized appreciation | | |
| (depreciation) on investments | 51,086 | 432,432 |
| Net Increase (Decrease) in Net Assets | | |
| Resulting from Operations | 944,010 | 1,307,527 |
| Dividends to Shareholders from ($): | | |
| Investment income—net: | | |
| Class A Shares | — | (84,905) |
| Class C Shares | — | (11,770) |
| Class I Shares | — | (59,541) |
| Class T Shares | — | (8,028) |
| Total Dividends | — | (164,244) |
| Capital Stock Transactions ($): | | |
| Net proceeds from shares sold: | | |
| Class A Shares | 3,509,994 | 6,479,947 |
| Class C Shares | 293,608 | 407,275 |
| Class I Shares | 3,588,104 | 1,402,557 |
| Class T Shares | — | 119 |
| Dividends reinvested: | | |
| Class A Shares | — | 16,538 |
| Class C Shares | — | 3,853 |
| Class I Shares | — | 11,442 |
| Class T Shares | — | 412 |
| Cost of shares redeemed: | | |
| Class A Shares | (5,059,714) | (3,024,381) |
| Class C Shares | (575,688) | (92,410) |
| Class I Shares | (1,168,350) | (3,753,216) |
| Class T Shares | — | (648,088) |
| Increase (Decrease) in Net Assets | | |
| from Capital Stock Transactions | 587,954 | 804,048 |
| Total Increase (Decrease) in Net Assets | 1,531,964 | 1,947,331 |
| Net Assets ($): | | |
| Beginning of Period | 12,059,544 | 10,112,213 |
| End of Period | 13,591,508 | 12,059,544 |
The Fund 13
STATEMENT OF CHANGES IN NET ASSETS (continued)
| | |
| | Year Ended October 31, |
| | 2010 | 2009a |
| Capital Share Transactions: | | |
| Class Ab | | |
| Shares sold | 289,548 | 588,765 |
| Shares issued for dividends reinvested | — | 1,523 |
| Shares redeemed | (409,873) | (272,603) |
| Net Increase (Decrease) in Shares Outstanding | (120,325) | 317,685 |
| Class C | | |
| Shares sold | 24,481 | 36,918 |
| Shares issued for dividends reinvested | — | 356 |
| Shares redeemed | (47,291) | (8,506) |
| Net Increase (Decrease) in Shares Outstanding | (22,810) | 28,768 |
| Class I | | |
| Shares sold | 292,013 | 126,472 |
| Shares issued for dividends reinvested | — | 1,055 |
| Shares redeemed | (94,870) | (341,811) |
| Net Increase (Decrease) in Shares Outstanding | 197,143 | (214,284) |
| Class Tb | | |
| Shares sold | — | 11 |
| Shares issued for dividends reinvested | — | 38 |
| Shares redeemed | — | (59,078) |
| Net Increase (Decrease) in Shares Outstanding | — | (59,029) |
|
| a Effective as of the close of business on February 4, 2009, the fund no longer offers Class T shares. |
| b On the close of business on February 4, 2009, 59,078 Class T shares representing $648,088 were converted to |
| 59,132 Class A shares. |
See notes to financial statements.
14
FINANCIAL HIGHLIGHTS
The following tables describe the performance for each share class for the fiscal periods indicated.All information (except portfolio turnover rate) reflects financial results for a single fund share.Total return shows how much your investment in the fund would have increased (or decreased) during each period, assuming you had reinvested all dividends and distributions.These figures have been derived from the fund’s financial statements.
| | | |
| | | Year Ended October 31, |
| Class A Shares | 2010 | 2009 | 2008a |
| Per Share Data ($): | | | |
| Net asset value, beginning of period | 11.91 | 10.75 | 12.50 |
| Investment Operations: | | | |
| Investment income (loss)—netb | (.17) | (.15) | .12 |
| Net realized and unrealized | | | |
| gain (loss) on investments | .99 | 1.48 | (1.87) |
| Total from Investment Operations | .82 | 1.33 | (1.75) |
| Distributions: | | | |
| Dividends from investment income—net | — | (.17) | — |
| Net asset value, end of period | 12.73 | 11.91 | 10.75 |
| Total Return (%)c | 6.89 | 12.52 | (14.00)d |
| Ratios/Supplemental Data (%): | | | |
| Ratio of total expenses to average net assets | 2.15 | 2.65 | 3.04e |
| Ratio of net expenses to average net assets | 1.50 | 1.50 | 1.48e |
| Ratio of net investment income | | | |
| (loss) to average net assets | (1.37) | (1.29) | 1.14e |
| Portfolio Turnover Rate | — | — | — |
| Net Assets, end of period ($ x 1,000) | 7,995 | 8,911 | 4,630 |
| |
| a | From December 18, 2007 (commencement of operations) to October 31, 2008. |
| b | Based on average shares outstanding at each month end. |
| c | Exclusive of sales charge. |
| d | Not annualized. |
| e | Annualized. |
See notes to financial statements.
The Fund 15
FINANCIAL HIGHLIGHTS (continued)
| | | |
| | | Year Ended October 31, |
| Class C Shares | 2010 | 2009 | 2008a |
| Per Share Data ($): | | | |
| Net asset value, beginning of period | 11.79 | 10.68 | 12.50 |
| Investment Operations: | | | |
| Investment income (loss)—netb | (.26) | (.22) | .03 |
| Net realized and unrealized | | | |
| gain (loss) on investments | .98 | 1.45 | (1.85) |
| Total from Investment Operations | .72 | 1.23 | (1.82) |
| Distributions: | | | |
| Dividends from investment income—net | — | (.12) | — |
| Net asset value, end of period | 12.51 | 11.79 | 10.68 |
| Total Return (%)c | 6.11 | 11.64 | (14.56)d |
| Ratios/Supplemental Data (%): | | | |
| Ratio of total expenses to average net assets | 2.96 | 3.32 | 4.00e |
| Ratio of net expenses to average net assets | 2.25 | 2.25 | 2.23e |
| Ratio of net investment income | | | |
| (loss) to average net assets | (2.13) | (2.03) | .35e |
| Portfolio Turnover Rate | — | — | — |
| Net Assets, end of period ($ x 1,000) | 1,243 | 1,440 | 997 |
| |
| a | From December 18, 2007 (commencement of operations) to October 31, 2008. |
| b | Based on average shares outstanding at each month end. |
| c | Exclusive of sales charge. |
| d | Not annualized. |
| e | Annualized. |
See notes to financial statements.
16
| | | |
| | | Year Ended October 31, |
| Class I Shares | 2010 | 2009 | 2008a |
| Per Share Data ($): | | | |
| Net asset value, beginning of period | 11.94 | 10.78 | 12.50 |
| Investment Operations: | | | |
| Investment income (loss)—netb | (.14) | (.11) | .09 |
| Net realized and unrealized | | | |
| gain (loss) on investments | 1.00 | 1.48 | (1.81) |
| Total from Investment Operations | .86 | 1.37 | (1.72) |
| Distributions: | | | |
| Dividends from investment income—net | — | (.21) | — |
| Net asset value, end of period | 12.80 | 11.94 | 10.78 |
| Total Return (%) | 7.20 | 12.91 | (13.76)c |
| Ratios/Supplemental Data (%): | | | |
| Ratio of total expenses to average net assets | 1.89 | 2.57 | 3.12d |
| Ratio of net expenses to average net assets | 1.25 | 1.25 | 1.23d |
| Ratio of net investment income | | | |
| (loss) to average net assets | (1.12) | (1.07) | 1.03d |
| Portfolio Turnover Rate | — | — | — |
| Net Assets, end of period ($ x 1,000) | 4,354 | 1,708 | 3,851 |
| |
| a | From December 18, 2007 (commencement of operations) to October 31, 2008. |
| b | Based on average shares outstanding at each month end. |
| c | Not annualized. |
| d | Annualized. |
See notes to financial statements.
The Fund 17
NOTES TO FINANCIAL STATEMENTS
NOTE 1—Significant Accounting Policies:
Dreyfus Global Absolute Return Fund (the “fund”) is a separate diversified series of Advantage Funds, Inc. (the “Company”), which is registered under the Investment Company Act of 1940, as amended (the “Act”), as an open-end management investment company and operates as a series company that offers eleven series, including the fund. The fund’s investment objective is to seek total return by investing in instruments that provide investment exposure to global equity, bond and currency markets, and in fixed-income securities. The Dreyfus Corporation (the “Manager” or “Dreyfus”), a wholly-owned subsidiary of The Bank of New York Mellon Corporation (“BNY Mellon”), serves as the fund’s investment adviser. Mellon Capital Management Corporation (“Mellon Capital”), a subsidiary of BNY Mellon, serves as the fund’s sub-investment adviser.
MBSC Securities Corporation (the “Distributor”), a wholly-owned subsidiary of Dreyfus, is the distributor of the fund’s shares.The fund is authorized to issue 100 million shares of $.001 par value Common Stock in each of the following classes of shares: Class A, Class C and Class I. Class A shares are subject to a sales charge imposed at the time of purchase. Class C shares are subject to a contingent deferred sales charge (“CDSC”) imposed on Class C shares redeemed within one year of purchase. Class I shares are sold at net asset value per share only to institutional investors. Other differences between the classes include the services offered to and the expenses borne by each class, the allocation of certain transfer agency costs and certain voting rights. Income, expenses (other than expenses attributable to a specific class), and realized and unrealized gains or losses on investments a re allocated to each class of shares based on its relative net assets.
As of October 31, 2010, MBC Investments Corp., an indirect subsidiary of BNY Mellon, held 224,025 Class A, 28,000 Class C and 28,000 Class I shares of the fund.
18
The Company accounts separately for the assets, liabilities and operations of each series. Expenses directly attributable to each series are charged to that series’ operations; expenses which are applicable to all series are allocated among them on a pro rata basis.
The Financial Accounting Standards Board (“FASB”) Accounting Standards Codification (“ASC”) is the exclusive reference of authoritative U.S. generally accepted accounting principles (“GAAP”) recognized by the FASB to be applied by nongovernmental entities. Rules and interpretive releases of the Securities and Exchange Commission (“SEC”) under authority of federal laws are also sources of authoritative GAAP for SEC registrants. The fund’s financial statements are prepared in accordance with GAAP, which may require the use of management estimates and assumptions.Actual results could differ from those estimates.
The Company enters into contracts that contain a variety of indemnifications.The fund’s maximum exposure under these arrangements is unknown.The fund does not anticipate recognizing any loss related to these arrangements.
(a) Portfolio valuation: Investments in equity securities are valued at the last sales price on the securities exchange or national securities market on which such securities are primarily traded. Securities listed on the National Market System for which market quotations are available are valued at the official closing price or, if there is no official closing price that day, at the last sales price. Securities not listed on an exchange or the national securities market, or securities for which there were no transactions, are valued at the average of the most recent bid and asked prices, except for open short positions, where the asked price is used for valuation purposes. Bid price is used when no asked price is available. Registered investment companies that are not traded on an exchange are valued at their net asset valu e.When market quotations or official closing prices are not readily available, or are determined not to reflect accu-
The Fund 19
NOTES TO FINANCIAL STATEMENTS (continued)
rately fair value, such as when the value of a security has been significantly affected by events after the close of the exchange or market on which the security is principally traded (for example, a foreign exchange or market), but before the fund calculates its net asset value, the fund may value these investments at fair value as determined in accordance with the procedures approved by the Board of Directors. Fair valuing of securities may be determined with the assistance of a pricing service using calculations based on indices of domestic securities and other appropriate indicators, such as prices of relevant American Depository Receipts and futures contracts. For other securities that are fair valued by the Board of Directors, certain factors may be considered such as: fundamental analytical data, the nature and duration of restrictions on disposition, an evaluation of the forces that influence the market in which the securities are purchased and sold, and public trading in similar securities of the issuer or comparable issuers.
Investments in debt securities excluding short-term investments (other than U.S.Treasury Bills), financial futures, options and forward foreign currency exchange contracts (“forward contracts”) are valued each business day by an independent pricing service (the “Service”) approved by the Board of Directors. Investments for which quoted bid prices are readily available and are representative of the bid side of the market in the judgment of the Service are valued at the mean between the quoted bid prices (as obtained by the Service from dealers in such securities) and asked prices (as calculated by the Service based upon its evaluation of the market for such securities). Other investments are valued as determined by the Service, based on methods which include consideration of: yields or prices of securities of comparable quality, coupon, maturity and type; indications as to values from dealers; a nd general market conditions. Restricted securities, as well as securities or other assets for which recent market quotations are not readily available, that are not valued by a pricing service approved by the Board of
20
Directors, or are determined by the fund not to reflect accurately fair value, are valued at fair value as determined in good faith under the direction of the Board of Directors.The factors that may be considered when fair valuing a security include fundamental analytical data, the nature and duration of restrictions on disposition, an evaluation of the forces that influence the market in which the securities are purchased and sold and public trading in similar securities of the issuer or comparable issuers. Short-term investments, excluding U.S.Treasury Bills, are carried at amortized cost, which approximates value. Financial futures and options, which are traded on an exchange, are valued at the last sales price on the securities exchange on which such securities are primarily traded or at the last sales price on the national securities market on each business day. Options traded over-the-counter are valued at t he mean between the bid and asked price. Investments denominated in foreign currencies are translated to U.S. dollars at the prevailing rates of exchange. Forward contracts are valued at the forward rate.
The fair value of a financial instrument is the amount that would be received to sell an asset or paid to transfer a liability in an orderly transaction between market participants at the measurement date (i.e. the exit price). GAAP establishes a fair value hierarchy that prioritizes the inputs of valuation techniques used to measure fair value.This hierarchy gives the highest priority to unadjusted quoted prices in active markets for identical assets or liabilities (Level 1 measurements) and the lowest priority to unobservable inputs (Level 3 measurements).
Additionally, GAAP provides guidance on determining whether the volume and activity in a market has decreased significantly and whether such a decrease in activity results in transactions that are not orderly. GAAP requires enhanced disclosures around valuation inputs and techniques used during annual and interim periods.
The Fund 21
NOTES TO FINANCIAL STATEMENTS (continued)
Various inputs are used in determining the value of the fund’s invest ments relating to fair value measurements.These inputs are summarized in the three broad levels listed below:
Level 1—unadjusted quoted prices in active markets for
identical investments.
Level 2—other significant observable inputs (including quoted
prices for similar investments, interest rates, prepayment speeds,
credit risk, etc.).
Level 3—significant unobservable inputs (including the fund’s
own assumptions in determining the fair value of investments).
The inputs or methodology used for valuing securities are not necessarily an indication of the risk associated with investing in those securities.
The following is a summary of the inputs used as of October 31, 2010 in valuing the fund’s investments:
| | | | |
| | | Level 2—Other | Level 3— | |
| | Level 1— | Significant | Significant | |
| | Unadjusted | Observable | Unobservable | |
| Quoted Prices | Inputs | Inputs | Total |
| Assets ($) | | | | |
| Investments in Securities: | | | |
| Mutual Funds | 3,225,000 | — | — | 3,225,000 |
| Options Purchased | 515,813 | — | — | 515,813 |
| U.S. Treasury | — | 9,651,775 | — | 9,651,775 |
| Other Financial | | | | |
| Instruments: | | | | |
| Forward Foreign | | | | |
| Exchange Contracts† | — | 231,481 | — | 231,481 |
| Futures† | 221,491 | — | — | 221,491 |
| Liabilities ($) | | | | |
| Other Financial | | | | |
| Instruments: | | | | |
| Forward Foreign | | | | |
| Exchange Contracts† | — | (109,705) | — | (109,705) |
| Futures† | (149,096) | — | — | (149,096) |
| |
| † | Amount shown represents unrealized appreciation (depreciation) at period end. |
22
In January 2010, FASB issued Accounting Standards Update (“ASU”) No. 2010-06 “Improving Disclosures about Fair Value Measurements”. The portions of ASU No. 2010-06 which require reporting entities to prepare new disclosures surrounding amounts and reasons for significant transfers in and out of Level 1 and Level 2 fair value measurements as well as inputs and valuation techniques used to measure fair value for both recurring and nonrecurring fair value measurements that fall in either Level 2 or Level 3 have been adopted by the fund. No significant transfers between Level 1 or Level 2 fair value measurements occurred at October 31, 2010. The remaining portion of ASU No. 2010-06 requires reporting entities to make new disclosures about information on purchases, sales, issuances and settlements on a gross basis in the reconciliation of activity in Level 3 fair value measurements.These new and rev ised disclosures are required to be implemented for fiscal years beginning after December 15, 2010. Management is currently evaluating the impact that the adoption of this remaining portion of ASU No. 2010-06 may have on the fund’s financial statement disclosures.
(b) Foreign currency transactions: The fund does not isolate that portion of the results of operations resulting from changes in foreign exchange rates on investments from the fluctuations arising from changes in the market prices of securities held. Such fluctuations are included with the net realized and unrealized gain or loss on investments.
Net realized foreign exchange gains or losses arise from sales of foreign currencies, currency gains or losses realized on securities transactions between trade and settlement date and the difference between the amounts of dividends, interest and foreign withholding taxes recorded on the fund’s books and the U.S. dollar equivalent of the amounts actually received or paid. Net unrealized foreign exchange gains and losses arise from changes in the value of assets and liabilities other than investments resulting from changes in exchange rates. Foreign currency gains and losses on investments are included with net realized and unrealized gain or loss on investments.
The Fund 23
NOTES TO FINANCIAL STATEMENTS (continued)
(c) Securities transactions and investment income: Securities transactions are recorded on a trade date basis. Realized gains and losses from securities transactions are recorded on the identified cost basis. Dividend income is recognized on the ex-dividend date and interest income, including, where applicable, accretion of discount and amortization of premium on investments, is recognized on the accrual basis.
(d) Affiliated issuers: Investments in other investment companies advised by Dreyfus are defined as “affiliated” in the Act.
The fund may invest in shares of certain affiliated investment companies also advised or managed by Dreyfus. Investments in affiliated investment companies for the period ended October 31, 2010 were as follows:
| | | | | |
| Affiliated | | | | | |
| Investment | Value | | | Value | Net |
| Company | 10/31/2009 ($) | Purchases ($) | Sales ($) | 10/31/2010 ($) | Assets (%) |
| Dreyfus | | | | | |
| Institutional | | | | | |
| Preferred | | | | | |
| Plus Money | | | | | |
| Market Fund | 2,434,000 | 10,713,000 | 9,922,000 | 3,225,000 | 23.7 |
(e) Dividends to shareholders: Dividends are recorded on the ex-dividend date. Dividends from investment income-net and dividends from net realized capital gains, if any, are normally declared and paid annually, but the fund may make distributions on a more frequent basis to comply with the distribution requirements of the Internal Revenue Code of 1986, as amended (the “Code”).To the extent that net realized capital gains can be offset by capital loss carryovers, it is the policy of the fund not to distribute such gains. Income and capital gain distributions are determined in accordance with income tax regulations, which may differ from GAAP.
(f) Federal income taxes: It is the policy of the fund to continue to qualify as a regulated investment company, if such qualification is in the best interests of its shareholders, by complying with the applicable provisions of the Code, and to make distributions of taxable income sufficient to relieve it from substantially all federal income and excise taxes.
24
As of and during the period ended October 31, 2010, the fund did not have any liabilities for any uncertain tax positions.The fund recognizes interest and penalties, if any, related to uncertain tax positions as income tax expense in the Statement of Operations. During the period, the fund did not incur any interest or penalties.
Each of the tax years in the three-year period ended October 31, 2010 remains subject to examination by the Internal Revenue Service and state taxing authorities.
At October 31, 2010, the components of accumulated earnings on a tax basis were as follows: undistributed ordinary income $91,843, undistributed capital gains $731,240 and unrealized appreciation $81,573.
The tax character of distributions paid to shareholders during the fiscal periods ended October 31, 2010 and October 31, 2009 were as follows: ordinary income $0 and $164,244, respectively.
During the period ended October 31, 2010, as a result of permanent book to tax differences, primarily due to the tax treatment for foreign currency gains and losses and net operating losses, the fund increased accumulated undistributed investment income-net by $188,880 and decreased accumulated net realized gain (loss) on investments by the same amount. Net assets and net asset value per share were not affected by this reclassification.
NOTE 2—Bank Lines of Credit:
The fund participates with other Dreyfus-managed funds in a $225 million unsecured credit facility led by Citibank, N.A. and a $300 million unsecured credit facility provided by The Bank of New York Mellon, a subsidiary of BNY Mellon and an affiliate of Dreyfus (each, a “Facility”), each to be utilized primarily for temporary or emergency purposes, including the financing of redemptions. In connection therewith, the fund has agreed to pay its pro rata portion of commitment fees for each Facility. Interest is charged to the fund based on rates
The Fund 25
NOTES TO FINANCIAL STATEMENTS (continued)
determined pursuant to the terms of the respective Facility at the time of borrowing. During the period ended October 31, 2010, the fund did not borrow under the Facilities.
NOTE 3—Management Fee, Sub-Investment Advisory Fee and Other Transactions With Affiliates:
(a) Pursuant to a management agreement with Dreyfus, the management fee is computed at the annual rate of 1.10% of the value of the fund’s average daily net assets and is payable monthly. Dreyfus has agreed, to waive receipt of its fees and/or assume the expenses of the fund, until March 1, 2012, so that the expenses of none of the classes, (exclusive of taxes, brokerage fees, Rule 12b-1 distribution plan fees, interest on borrowings, shareholder services plan fees, commitment fees and extraordinary expenses) exceed an annual rate of 1.25% of the value of the average daily net assets of their class. The reduction in management fee, pursuant to the undertaking, amounted to $88,267 during the period ended October 31, 2010.
Pursuant to a Sub-Investment Advisory Agreement between Dreyfus and Mellon Capital, Dreyfus pays Mellon Capital an annual fee of .65% of the value of the fund’s average daily net assets, payable monthly.
During the period ended October 31, 2010, the Distributor retained $1,613 from commissions earned on sales of the fund’s Class A shares.
(b) Under the Distribution Plan (the “Plan”) adopted pursuant to Rule 12b-1 under the Act, Class C shares pay the Distributor for distributing its shares at an annual rate of .75% of the value of the average daily net assets of Class C shares. During the period ended October 31, 2010, Class C shares were charged $10,851 pursuant to the Plan.
(c) Under the Shareholder Services Plan, Class A and Class C shares pay the Distributor at an annual rate of .25% of the value of their average daily net assets for the provision of certain services.The services provided may include personal services relating to shareholder accounts, such as
26
answering shareholder inquiries regarding the fund and providing reports and other information, and services related to the maintenance of shareholder accounts.The Distributor may make payments to Service Agents (a securities dealer, financial institution or other industry professional) in respect of these services. The Distributor determines the amounts to be paid to Service Agents. During the period ended October 31, 2010, Class A and Class C shares were charged $23,083 and $3,617, respectively, pursuant to the Shareholder Services Plan.
The fund compensates Dreyfus Transfer, Inc., a wholly-owned subsidiary of Dreyfus, under a transfer agency agreement for providing personnel and facilities to perform transfer agency services for the fund. During the period ended October 31, 2010, the fund was charged $1,459 pursuant to the transfer agency agreement, which is included in Shareholder servicing costs in the Statement of Operations.
The fund has arrangements with the custodian and cash management bank whereby the fund may receive earnings credits when positive cash balances are maintained, which are used to offset custody and cash management fees. For financial reporting purposes, the fund includes net earnings credits as an expense offset in the Statement of Operations.
The fund compensates The Bank of New York Mellon under a cash management agreement for performing cash management services related to fund subscriptions and redemptions. During the period ended October 31, 2010, the fund was charged $220 pursuant to the cash management agreement which is included in Shareholder servicing costs in the Statement of Operations.These fees were partially offset by earnings credits of $14.
The fund also compensates The Bank of New York Mellon under a custody agreement for providing custodial services for the fund. During the period ended October 31, 2010, the fund was charged $2,352 pursuant to the custody agreement.
The Fund 27
NOTES TO FINANCIAL STATEMENTS (continued)
During the period ended October 31, 2010, the fund was charged $6,114 for services performed by the Chief Compliance Officer.
The components of “Due to The Dreyfus Corporation and affiliates” in the Statement of Assets and Liabilities consist of: management fees $12,132, Rule 12b-1 distribution plan fees $785, shareholder services plan fees $1,958, custodian fees $527, chief compliance officer fees $2,248 and transfer agency per account fees $351, which are offset against an expense reimbursement currently in effect in the amount of $5,223.
(d) Each Board member also serves as a Board member of other funds within the Dreyfus complex. Annual retainer fees and attendance fees are allocated to each fund based on net assets.
NOTE 4—Securities Transactions:
During the period ended October 31, 2010, there were no purchases and sales of investment securities, excluding short-term securities, financial futures, options transactions and forward contracts.
The provisions of ASC Topic 815 “Derivatives and Hedging” require qualitative disclosures about objectives and strategies for using derivatives, quantitative disclosures about fair value amounts of gains and losses on derivative instruments and disclosures about credit-risk-related contingent features in derivative agreements. The disclosure requirements distinguish between derivatives, which are accounted for as “hedges” and those that do not qualify for hedge accounting. Because investment companies value their derivatives at fair value and recognize changes in fair value through the Statement of Operations, they do not qualify for such accounting. Accordingly, even though a fund’s investments in derivatives may represent economic hedges, they are considered to be non-hedge transactions for purposes of this disclosure. The following tables show the fund’s exposure to different types of market risk as it relates to the Statement of Assets and Liabilities and the Statement of Operations, respectively.
28
Fair value of derivative instruments as of October 31, 2010 is shown below:
| | | |
| | Derivative | | Derivative |
| | Assets ($) | | Liabilities ($) |
| Equity risk1 | 71,485 | Equity risk1 | (109,881) |
| Interest rate risk1,2 | 194,543 | Interest rate risk1 | (39,215) |
| Foreign exchange risk3 | 231,481 | Foreign exchange risk4 | (109,705) |
| Gross fair value of | | | |
| derivative contracts | 497,509 | | (258,801) |
| |
| Statement of Assets and Liabilities location: |
| 1 | Includes cumulative appreciation (depreciation) on futures contracts as reported in the Statement of |
| | Financial Futures, but only the unpaid variation margin is reported in the Statement of Assets |
| | and Liabilities. |
| 2 | Options purchased are included in investments in securities of unaffiliated issuers. |
| 3 | Unrealized appreciation on forward foreign currency exchange contracts. |
| 4 | Unrealized depreciation on forward foreign currency exchange contracts. |
The effect of derivative instruments in the Statement of Operations during the period ended October 31, 2010 is shown below:
| | | | |
| | Amount of realized gain or (loss) on derivatives recognized in income ($) |
| | | | Forward | |
| Underlying risk | Futures5 | Options6 | Contracts7 | Total |
| Equity | 364,882 | — | — | 364,882 |
| Interest rate | (146,632) | 364,511 | — | 217,879 |
| Foreign exchange | — | — | 552,542 | 552,542 |
| Total | 218,250 | 364,511 | 552,542 | 1,135,303 |
| | | | |
| Change in unrealized appreciation or (depreciation) on derivatives recognized in income ($) |
| | | | Forward | |
| Underlying risk | Futures8 | Options9 | Contracts10 | Total |
| Equity | (10,958) | — | — | (10,958) |
| Interest rate | 23,320 | 44,537 | — | 67,857 |
| Foreign exchange | — | — | (2,214) | (2,214) |
| Total | 12,362 | 44,537 | (2,214) | 54,685 |
| |
| Statement of Operations location: |
| 5 | Net realized gain (loss) on financial futures. |
| 6 | Net realized gain (loss) on options transactions. |
| 7 | Net realized gain (loss) on forward foreign currency exchange contracts. |
| 8 | Net unrealized appreciation (depreciation) on financial futures. |
| 9 | Net unrealized appreciation (depreciation) on options transactions. |
| 10 | Net unrealized appreciation (depreciation) on forward foreign currency exchange contracts. |
The Fund 29
NOTES TO FINANCIAL STATEMENTS (continued)
The following summarizes the average market value of derivatives outstanding during the period ended October 31, 2010:
| |
| | Value ($) |
| Equity futures contracts | 5,555,083 |
| Interest rate futures contracts | 15,303,236 |
| Interest rate options contracts | 250,974 |
| Forward contracts | 10,744,332 |
Futures Contracts: In the normal course of pursuing its investment objective, the fund is exposed to market risk, including equity price risk and interest rate risk as a result of changes in value of underlying financial instruments.The fund invests in financial futures contracts in order to manage its exposure to or protect against changes in the market. A futures contract represents a commitment for the future purchase or a sale of an asset at a specified date. Upon entering into such contracts, these investments require initial margin deposits with a broker, which consist of cash or cash equivalents. The amount of these deposits is determined by the exchange or Board of Trade on which the contract is traded and is subject to change. Accordingly, variation margin payments are received or made to reflect daily unrealized ga ins or losses which are recorded in the Statement of Operations. Futures contracts are valued daily at the last sales price established by the Board of Trade or exchange upon which they are traded.When the contracts are closed, the fund recognizes a realized gain or loss.There is minimal counterparty credit risk to the fund with futures since futures are exchange traded, and the exchange’s clearinghouse guarantees the futures against default. Contracts open at October 31, 2010 are set forth in the Statement of Financial Futures.
Options: The fund purchases and writes (sells) put and call options to hedge against changes in interest rates or as a substitute for an invest-ment.The fund is subject to interest rate risk in the course of pursuing its investment objectives through its investments in options contracts.A call option gives the purchaser of the option the right (but not the obligation) to buy, and obligates the writer to sell, the underlying secu-
30
rity or securities at the exercise price at any time during the option period, or at a specified date. Conversely, a put option gives the purchaser of the option the right (but not the obligation) to sell, and obligates the writer to buy the underlying security or securities at the exercise price at any time during the option period, or at a specified date.
As a writer of call options, the fund receives a premium at the outset and then bears the market risk of unfavorable changes in the price of the financial instrument underlying the option. Generally, the fund realizes a gain, to the extent of the premium, if the price of the underlying financial instrument decreases between the date the option is written and the date on which the option is terminated. Generally, the fund incurs a loss, if the price of the financial instrument increases between those dates.
As a writer of put options, the fund receives a premium at the outset and then bears the market risk of unfavorable changes in the price of the financial instrument underlying the option. Generally, the fund realizes a gain, to the extent of the premium, if the price of the underlying financial instrument increases between the date the option is written and the date on which the option is terminated. Generally, the fund incurs a loss, if the price of the financial instrument decreases between those dates.
As a writer of an option, the fund has no control over whether the underlying securities may be sold (called) or purchased (put) and as a result bears the market risk of an unfavorable change in the price of the security underlying the written option.There is a risk of loss from a change in value of such options which may exceed the related premiums received. One risk of holding a put or a call option is that if the option is not sold or exercised prior to its expiration, it becomes worthless. However, this risk is limited to the premium paid by the fund. Upon the expiration or closing of the option transaction, a gain or loss is reported in the Statement of Operations.
The Fund 31
NOTES TO FINANCIAL STATEMENTS (continued)
Forward Foreign Currency Exchange Contracts: The fund enters into forward contracts in order to hedge its exposure to changes in foreign currency exchange rates on its foreign portfolio holdings, to settle foreign currency transactions or as a part of its investment strategy. When executing forward contracts, the fund is obligated to buy or sell a foreign currency at a specified rate on a certain date in the future. With respect to sales of forward contracts, the fund incurs a loss if the value of the contract increases between the date the forward contract is opened and the date the forward contract is closed.The fund realizes a gain if the value of the contract decreases between those dates.With respect to purchases of forward contracts, the fund incurs a loss if the value of the contract decreases between the date the for ward contract is opened and the date the forward contract is closed.The fund realizes a gain if the value of the contract increases between those dates. Any realized gain or loss which occurred during the period is reflected in the Statement of Operations.The fund is exposed to foreign currency risk as a result of changes in value of underlying financial instruments. The fund is also exposed to credit risk associated with counterparty nonperformance on these forward contracts, which is typically limited to the unrealized gain on each open contract.The following summarizes open forward contracts at October 31, 2010:
| | | | |
| | Foreign | | | Unrealized |
| Forward Foreign Currency | Currency | | | Appreciation |
| Exchange Contracts | Amounts | Cost ($) | Value ($) (Depreciation) ($) |
| Purchases: | | | | |
| Australian Dollar, | | | | |
| Expiring 12/15/2010 | 1,035,989 | 941,227 | 1,008,885 | 67,658 |
| Australian Dollar, | | | | |
| Expiring 12/15/2010 | 420,875 | 389,667 | 409,864 | 20,197 |
| Australian Dollar, | | | | |
| Expiring 12/15/2010 | 197,862 | 187,983 | 192,686 | 4,703 |
| British Pound, | | | | |
| Expiring 12/15/2010 | 46,831 | 73,393 | 75,011 | 1,618 |
| British Pound, | | | | |
| Expiring 12/15/2010 | 145,400 | 230,023 | 232,895 | 2,872 |
| British Pound, | | | | |
| Expiring 12/15/2010 | 17,600 | 27,847 | 28,191 | 344 |
| British Pound, | | | | |
| Expiring 12/15/2010 | 70,400 | 111,358 | 112,763 | 1,405 |
32
| | | | |
| | Foreign | | | Unrealized |
| Forward Foreign Currency | Currency | | | Appreciation |
| Exchange Contracts | Amounts | Cost ($) | Value ($) (Depreciation) ($) |
| Purchases (continued): | | | | |
| Canadian Dollar, | | | | |
| Expiring 12/15/2010 | 37,263 | 36,135 | 36,494 | 359 |
| Canadian Dollar, | | | | |
| Expiring 12/15/2010 | 120,625 | 117,184 | 118,135 | 951 |
| Canadian Dollar, | | | | |
| Expiring 12/15/2010 | 113,689 | 110,546 | 111,342 | 796 |
| Canadian Dollar, | | | | |
| Expiring 12/15/2010 | 10,296 | 10,011 | 10,083 | 72 |
| Canadian Dollar, | | | | |
| Expiring 12/15/2010 | 110,015 | 106,973 | 107,744 | 771 |
| Euro, | | | | |
| Expiring 12/15/2010 | 152,753 | 208,298 | 212,475 | 4,177 |
| Euro, | | | | |
| Expiring 12/15/2010 | 37,600 | 51,262 | 52,301 | 1,039 |
| Euro, | | | | |
| Expiring 12/15/2010 | 94,000 | 128,190 | 130,751 | 2,561 |
| Euro, | | | | |
| Expiring 12/15/2010 | 95,800 | 131,634 | 133,255 | 1,621 |
| Euro, | | | | |
| Expiring 12/15/2010 | 383,200 | 526,538 | 533,020 | 6,482 |
| Euro, | | | | |
| Expiring 12/15/2010 | 26,900 | 37,191 | 37,417 | 226 |
| Euro, | | | | |
| Expiring 12/15/2010 | 4,000 | 5,582 | 5,564 | (18) |
| Euro, | | | | |
| Expiring 12/15/2010 | 347,594 | 485,234 | 483,494 | (1,740) |
| Japanese Yen, | | | | |
| Expiring 12/15/2010 | 129,019,539 | 1,539,456 | 1,604,051 | 64,595 |
| Japanese Yen, | | | | |
| Expiring 12/15/2010 | 6,705,100 | 81,988 | 83,362 | 1,374 |
| Swiss Franc, | | | | |
| Expiring 12/15/2010 | 1,512,158 | 1,498,536 | 1,537,273 | 38,737 |
| Swiss Franc, | | | | |
| Expiring 12/15/2010 | 21,300 | 21,132 | 21,653 | 521 |
| Sales: | | Proceeds ($) | | |
| Australian Dollar, | | | | |
| Expiring 12/15/2010 | 142,049 | 138,261 | 138,332 | (71) |
| Australian Dollar, | | | | |
| Expiring 12/15/2010 | 99,000 | 96,768 | 96,410 | 358 |
| Australian Dollar, | | | | |
| Expiring 12/15/2010 | 246,000 | 238,055 | 239,564 | (1,509) |
| Australian Dollar, | | | | |
| Expiring 12/15/2010 | 98,400 | 95,149 | 95,826 | (677) |
The Fund 33
NOTES TO FINANCIAL STATEMENTS (continued)
| | | | |
| | Foreign | | | Unrealized |
| Forward Foreign Currency | Currency | | | Appreciation |
| Exchange Contracts | Amounts | Proceeds ($) | Value ($) (Depreciation) ($) |
| Sales (continued): | | | | |
| Australian Dollar, | | | | |
| Expiring 12/15/2010 | 49,200 | 47,467 | 47,913 | (446) |
| British Pound, | | | | |
| Expiring 12/15/2010 | 584 | 905 | 935 | (30) |
| British Pound, | | | | |
| Expiring 12/15/2010 | 991,600 | 1,529,364 | 1,588,297 | (58,933) |
| British Pound, | | | | |
| Expiring 12/15/2010 | 134,000 | 209,224 | 214,634 | (5,410) |
| British Pound, | | | | |
| Expiring 12/15/2010 | 84,350 | 133,144 | 135,107 | (1,963) |
| British Pound, | | | | |
| Expiring 12/15/2010 | 24,600 | 38,622 | 39,403 | (781) |
| British Pound, | | | | |
| Expiring 12/15/2010 | 339,150 | 537,039 | 543,234 | (6,195) |
| Euro, | | | | |
| Expiring 12/15/2010 | 80,922 | 112,299 | 112,560 | (261) |
| Japanese Yen, | | | | |
| Expiring 12/15/2010 | 2,421,950 | 28,920 | 30,111 | (1,191) |
| Japanese Yen, | | | | |
| Expiring 12/15/2010 | 22,810,338 | 267,131 | 283,592 | (16,461) |
| Japanese Yen, | | | | |
| Expiring 12/15/2010 | 630,201 | 7,473 | 7,835 | (362) |
| Japanese Yen, | | | | |
| Expiring 12/15/2010 | 6,733,832 | 79,904 | 83,719 | (3,815) |
| Japanese Yen, | | | | |
| Expiring 12/15/2010 | 20,564,000 | 251,526 | 255,665 | (4,139) |
| Japanese Yen, | | | | |
| Expiring 12/15/2010 | 2,478,000 | 30,348 | 30,818 | (470) |
| Japanese Yen, | | | | |
| Expiring 12/15/2010 | 4,957,600 | 60,673 | 61,636 | (963) |
| Japanese Yen, | | | | |
| Expiring 12/15/2010 | 12,394,000 | 151,795 | 154,090 | (2,295) |
| Swiss Franc, | | | | |
| Expiring 12/15/2010 | 475,300 | 481,219 | 483,194 | (1,975) |
| Swiss Franc, | | | | |
| Expiring 12/15/2010 | 110,773 | 112,748 | 112,613 | 135 |
34
| | | | |
| | Foreign | | | Unrealized |
| Forward Foreign Currency | Currency | | | Appreciation |
| Exchange Contracts | Amounts | Proceeds ($) | Value ($) (Depreciation) ($) |
| Sales (continued): | | | | |
| Swiss Franc, | | | | |
| Expiring 12/15/2010 | 52,150 | 53,439 | 53,016 | 423 |
| Swiss Franc, | | | | |
| Expiring 12/15/2010 | 36,900 | 37,642 | 37,513 | 129 |
| Swiss Franc, | | | | |
| Expiring 12/15/2010 | 162,450 | 169,263 | 165,148 | 4,115 |
| Swiss Franc, | | | | |
| Expiring 12/15/2010 | 101,844 | 106,446 | 103,535 | 2,911 |
| Swiss Franc, | | | | |
| Expiring 12/15/2010 | 312,000 | 317,513 | 317,182 | 331 |
| Gross Unrealized Appreciation | | | 231,481 |
| Gross Unrealized Depreciation | | | (109,705) |
At October 31, 2010, the cost of investments for federal income tax purposes was $13,347,781; accordingly, accumulated net unrealized appreciation on investments was $44,807, consisting of $44,818 gross unrealized appreciation and $11 gross unrealized depreciation.
The Fund 35
REPORT OF INDEPENDENT REGISTERED
PUBLIC ACCOUNTING FIRM
Shareholders and Board of Directors
Dreyfus Global Absolute Return Fund
We have audited the accompanying statement of assets and liabilities, including the statements of investments and financial futures, of Dreyfus Global Absolute Return Fund (one of the series comprising Advantage Funds, Inc.) as of October 31, 2010, and the related statement of operations for the year then ended, the statement of changes in net assets for each of the two years in the period then ended and financial highlights for each of the periods indicated therein.These financial statements and financial highlights are the responsibility of the Fund’s management. Our responsibility is to express an opinion on these financial statements and financial highlights based on our audits.
We conducted our audits in accordance with the standards of the Public Company Accounting Oversight Board (United States).Those standards require that we plan and perform the audit to obtain reasonable assurance about whether the financial statements and financial highlights are free of material misstatement.We were not engaged to perform an audit of the Fund’s internal control over financial reporting. Our audits included consideration of internal control over financial reporting as a basis for designing audit procedures that are appropriate in the circumstances, but not for the purpose of expressing an opinion on the effectiveness of the Fund’s internal control over financial reporting. Accordingly, we express no such opinion.An audit also includes examining, on a test basis, evidence supporting the amounts and disclosures in the financial statements and financial highlights, assessing the accounting p rinciples used and significant estimates made by management, and evaluating the overall financial statement presentation. Our procedures included confirmation of securities owned as of October 31, 2010 by correspondence with the custodian and others. We believe that our audits provide a reasonable basis for our opinion.
In our opinion, the financial statements and financial highlights referred to above present fairly, in all material respects, the financial position of Dreyfus Global Absolute Return Fund at October 31, 2010, the results of its operations for the year then ended, the changes in its net assets for each of the two years in the period then ended and the financial highlights for each of the indicated periods, in conformity with U.S. generally accepted accounting principles.

New York, New York
December 28, 2010
36
BOARD MEMBERS INFORMATION (Unaudited)

The Fund 37
BOARD MEMBERS INFORMATION (Unaudited) (continued)
38
OFFICERS OF THE FUND (Unaudited)
BRADLEY J. SKAPYAK, President since
January 2010.
Chief Operating Officer and a director of the Manager since June 2009. From April 2003 to June 2009, Mr. Skapyak was the head of the Investment Accounting and Support Department of the Manager. He is an officer of 76 investment companies (comprised of 170 portfolios) managed by the Manager. He is 51 years old and has been an employee of the Manager since February 1988.
PHILLIP N. MAISANO, Executive Vice
President since July 2007.
Chief Investment Officer,Vice Chair and a director of the Manager, and an officer of 76 investment companies (comprised of 170 portfolios) managed by the Manager.
Mr. Maisano also is an officer and/or Board member of certain other investment management subsidiaries of The Bank of New York Mellon Corporation, each of which is an affiliate of the Manager. He is 63 years old and has been an employee of the Manager since November 2006. Prior to joining the Manager, Mr. Maisano served as Chairman and Chief Executive Officer of EACM Advisors, an affiliate of the Manager, since August 2004.
MICHAEL A. ROSENBERG, Vice President
and Secretary since August 2005.
Assistant General Counsel of BNY Mellon, and an officer of 77 investment companies (comprised of 195 portfolios) managed by the Manager. He is 50 years old and has been an employee of the Manager since October 1991.
KIESHA ASTWOOD, Vice President and
Assistant Secretary since January 2010.
Counsel of BNY Mellon, and an officer of 77 investment companies (comprised of 195 portfolios) managed by the Manager. She is 37 years old and has been an employee of the Manager since July 1995.
JAMES BITETTO, Vice President and
Assistant Secretary since August 2005.
Senior Counsel of BNY Mellon and Secretary of the Manager, and an officer of 77 investment companies (comprised of 195 portfolios) managed by the Manager. He is 44 years old and has been an employee of the Manager since December 1996.
JONI LACKS CHARATAN, Vice President
and Assistant Secretary since
August 2005.
Senior Counsel of BNY Mellon, and an officer of 77 investment companies (comprised of 195 portfolios) managed by the Manager. She is 54 years old and has been an employee of the Manager since October 1988.
JOSEPH M. CHIOFFI, Vice President and
Assistant Secretary since August 2005.
Senior Counsel of BNY Mellon, and an officer of 77 investment companies (comprised of 195 portfolios) managed by the Manager. He is 48 years old and has been an employee of the Manager since June 2000.
KATHLEEN DENICHOLAS, Vice President
and Assistant Secretary since
January 2010.
Senior Counsel of BNY Mellon, and an officer of 77 investment companies (comprised of 195 portfolios) managed by the Manager. She is 36 years old and has been an employee of the Manager since February 2001.
JANETTE E. FARRAGHER, Vice President
and Assistant Secretary since
August 2005.
Assistant General Counsel of BNY Mellon, and an officer of 77 investment companies (comprised of 195 portfolios) managed by the Manager. She is 47 years old and has been an employee of the Manager since February 1984.
The Fund 39
OFFICERS OF THE FUND (Unaudited) (continued)
JOHN B. HAMMALIAN, Vice President and
Assistant Secretary since August 2005.
Managing Counsel of BNY Mellon, and an officer of 77 investment companies (comprised of 195 portfolios) managed by the Manager. He is 47 years old and has been an employee of the Manager since February 1991.
M. CRISTINA MEISER, Vice President and
Assistant Secretary since January 2010.
Senior Counsel of BNY Mellon, and an officer of 77 investment companies (comprised of 195 portfolios) managed by the Manager. She is 40 years old and has been an employee of the Manager since August 2001.
ROBERT R. MULLERY, Vice President and
Assistant Secretary since August 2005.
Managing Counsel of BNY Mellon, and an officer of 77 investment companies (comprised of 195 portfolios) managed by the Manager. He is 58 years old and has been an employee of the Manager since May 1986.
JEFF PRUSNOFSKY, Vice President and
Assistant Secretary since August 2005.
Managing Counsel of BNY Mellon, and an officer of 77 investment companies (comprised of 195 portfolios) managed by the Manager. He is 45 years old and has been an employee of the Manager since October 1990.
JAMES WINDELS, Treasurer since
November 2001.
Director – Mutual Fund Accounting of the Manager, and an officer of 77 investment companies (comprised of 195 portfolios) managed by the Manager. He is 52 years old and has been an employee of the Manager since April 1985.
RICHARD CASSARO, Assistant Treasurer
since January 2008.
Senior Accounting Manager – Money Market and Municipal Bond Funds of the Manager, and an officer of 77 investment companies (comprised of 195 portfolios) managed by the Manager. He is 51 years old and has been an employee of the Manager since September 1982.
GAVIN C. REILLY, Assistant Treasurer
since December 2005.
Tax Manager of the Investment Accounting and Support Department of the Manager, and an officer of 77 investment companies (comprised of 195 portfolios) managed by the Manager. He is 42 years old and has been an employee of the Manager since April 1991.
ROBERT ROBOL, Assistant Treasurer
since August 2005.
Senior Accounting Manager – Fixed Income Funds of the Manager, and an officer of 77 investment companies (comprised of 195 portfolios) managed by the Manager. He is 46 years old and has been an employee of the Manager since October 1988.
ROBERT SALVIOLO, Assistant Treasurer
since July 2007.
Senior Accounting Manager – Equity Funds of the Manager, and an officer of 77 investment companies (comprised of 195 portfolios) managed by the Manager. He is 43 years old and has been an employee of the Manager since June 1989.
40
ROBERT SVAGNA, Assistant Treasurer
since December 2002.
Senior Accounting Manager – Equity Funds of the Manager, and an officer of 77 investment companies (comprised of 195 portfolios) managed by the Manager. He is 43 years old and has been an employee of the Manager since November 1990.
JOSEPH W. CONNOLLY, Chief Compliance
Officer since October 2004.
Chief Compliance Officer of the Manager and The Dreyfus Family of Funds (77 investment companies, comprised of 195 portfolios). From November 2001 through March 2004, Mr. Connolly was first Vice-President, Mutual Fund Servicing for Mellon Global Securities Services. In that capacity, Mr. Connolly was responsible for managing Mellon’s Custody, Fund Accounting and Fund Administration services to third-party mutual fund clients.
He is 53 years old and has served in various capacities with the Manager since 1980, including manager of the firm’s Fund Accounting Department from 1997 through October 2001.
NATALIA GRIBAS, Anti-Money Laundering
Compliance Officer since July 2010.
Anti-Money Laundering Compliance Officer of the Distributor, and the Anti-Money Laundering Compliance Officer of 73 investment companies (comprised of 191 portfolios) managed by the Manager. She is 40 years old and has been an employee of the Distributor since September 2008.
The Fund 41
For More Information
Telephone Call your financial representative or 1-800-554-4611
Mail The Dreyfus Family of Funds, 144 Glenn Curtiss Boulevard, Uniondale, NY 11556-0144
The fund files its complete schedule of portfolio holdings with the Securities and Exchange Commission (“SEC”) for the first and third quarters of each fiscal year on Form N-Q. The fund’s Forms N-Q are available on the SEC’s website at http://www.sec.gov and may be reviewed and copied at the SEC’s Public Reference Room in Washington, DC. Information on the operation of the Public Reference Room may be obtained by calling 1-800-SEC-0330.
A description of the policies and procedures that the fund uses to determine how to vote proxies relating to portfolio securities, and information regarding how the fund voted these proxies for the most recent 12-month period ended June 30 is available at http://www.dreyfus.com and on the SEC’s website at http://www.sec.gov. The description of the policies and procedures is also available without charge, upon request, by calling 1-800-645-6561.

|
| Dreyfus |
| Global Real |
| Return Fund |
ANNUAL REPORT October 31, 2010

Save time. Save paper. View your next shareholder report online as soon as it’s available. Log into www.dreyfus.com and sign up for Dreyfus eCommunications. It’s simple and only takes a few minutes.
The views expressed in this report reflect those of the portfolio manager only through the end of the period covered and do not necessarily represent the views of Dreyfus or any other person in the Dreyfus organization. Any such views are subject to change at any time based upon market or other conditions and Dreyfus disclaims any responsibility to update such views.These views may not be relied on as investment advice and, because investment decisions for a Dreyfus fund are based on numerous factors, may not be relied on as an indication of trading intent on behalf of any Dreyfus fund.

| | Contents |
| | THE FUND |
| 2 | A Letter from the Chairman and CEO |
| 3 | Discussion of Fund Performance |
| 6 | Understanding Your Fund’s Expenses |
| 6 | Comparing Your Fund’s Expenses With Those of Other Funds |
| 7 | Statement of Investments |
| 12 | Statement of Options Written |
| 13 | Statement of Assets and Liabilities |
| 14 | Statement of Operations |
| 15 | Statement of Changes in Net Assets |
| 16 | Financial Highlights |
| 17 | Notes to Financial Statements |
| 33 | Report of Independent Registered Public Accounting Firm |
| 34 | Information About the Review and Approval of the Fund’s Management Agreement |
| 38 | Board Members Information |
| 40 | Officers of the Fund |
| | FOR MORE INFORMATION |
| | Back Cover |
|
| Dreyfus |
| Global Real |
| Return Fund |
The Fund

A LETTER FROM THE CHAIRMAN AND CEO
Dear Shareholder:
We are pleased to present this annual report for Dreyfus Global Real Return Fund, covering the period from the fund’s inception on May 12, 2010, through October 31, 2010.
Although a double-dip recession has recently become an increasingly unlikely scenario in our analysis, persistent uncertainty regarding the breadth and strength of the U.S. and global economic recoveries led to bouts of heightened volatility in some of the international bond market’s riskier sectors over the past year. However, on average, emerging markets and sovereign debt have generally outperformed bonds from many developed markets, largely due to the relative underlying fundamental strength of these sovereign entities and solid demand from investors seeking higher levels of income in a low interest-rate environment.
Uncertainty will probably remain in the broader financial markets until we see more robust global economic growth, but record low short-term interest rates in many developed markets such as the U.S., improving corporate balance sheets, and investors’ global search for income could continue to support prices of higher yielding sovereign and corporate bonds, especially if today’s economic concerns prove to be overstated.With that, we strongly suggest that you meet with your financial advisor to discuss the potential opportunities which may exist in the global investment universe, as well as to evaluate your portfolio to help meet your individual investment needs and your future goals relative to your risk-tolerance level.
For information about how the fund performed during the reporting period, as well as general market perspectives, we provide a Discussion of Fund Performance on the pages that follow.
Thank you for your continued confidence and support.

Jonathan R. Baum
Chairman and Chief Executive Officer
The Dreyfus Corporation
November 15, 2010
2

DISCUSSION OF FUND PERFORMANCE
For the period of May 12, 2010, through October 31, 2010, as provided by Suzanne Hutchins and James Harries, Portfolio Managers of Newton Capital Management Limited, Sub-Investment Adviser
Fund and Market Performance Overview
For the period between the fund’s inception on May 12, 2010, and the end of its annual reporting period on October 31, 2010, Dreyfus Global Real Return Fund’s Class A shares produced a total return of 7.52%, Class C shares returned 7.20% and Class I shares returned 7.68%.1 In comparison, the fund’s performance baseline benchmark, the U.S.$ 1-Month London Interbank Offered Rate (LIBOR), and its broad-based securities market index, the Citibank 30-Day Treasury Bill Index, produced total returns of .15% and 0.08%, respectively, for the same period.2 Despite bouts of market volatility, a recovering global economy lifted most stock and bond prices over the reporting period, while low interest rates continued to limit returns from cash. The fund produced higher returns than its target objective, primarily due to its exposure to individual equities with specific characteristics and higher yielding bonds.
The Fund’s Investment Approach
To pursue its goal, the fund uses an actively-managed multi-asset strategy to produce absolute or real returns with less volatility than major equity markets over a complete market cycle, typically a period of five years.The fund is not managed to a benchmark index. Rather than managing to track a benchmark index, the fund seeks to provide returns that are largely independent of market moves.
The fund allocates its investments among global equities, bonds and cash, and, generally to a lesser extent, other asset classes, including real estate, commodities, currencies and alternative or non-traditional asset classes and strategies.The fund obtains investment exposure to these asset classes by investing in securities and through derivative instruments.
The fund’s portfolio managers combine a top-down approach, emphasizing economic trends and current investment themes on a global basis, with bottom-up security selection based on fundamental research to allocate the fund’s investments among and within asset classes. In choosing investments, the portfolio managers consider: key trends in global economic variables, such as gross domestic product, inflation and interest rates; investment themes, such as changing demographics, the impact of new technologies and the globalization of industries and brands; relative valuations of equity securities, bonds and cash; long-term trends in currency movements; and company fundamentals.Within markets and sectors determined to be attractive in absolute terms, the fund’s portfolio managers seek what are believed to be attractively priced companies that possess a sustainable competitive advantage in their market or s ector and invest in such companies across their capital structures.
The Fund 3
DISCUSSION OF FUND PERFORMANCE (continued)
Markets Advanced in a Slow-Growth Economy
The fund began operations as the global economy emerged from the financial crisis. Robust economic growth in the emerging markets helped support global manufacturing activity, fueling improved confidence among businesses, consumers and investors worldwide. Specifically, it was the unconventional approach of quantitative easing in the developed economies that drove financial assets higher. However, investor sentiment in the developed markets soon deteriorated owing to the sovereign debt crisis in Europe. In addition, an appreciating yen hurt exports in Japan, and high unemployment levels weighed on the United States.
The market viewed these concerns as temporary, and with improving corporate earnings with some signs of gradual economic improvement in developed markets combined with further stimulative programs from certain central banks, markets headed higher in the reporting period. Consequently, equities generally produced higher returns than bonds during the reporting period, and cash provided relatively meager returns in a low interest-rate environment.
Multi-Asset Approach Boosted Fund’s Results
In addition to participating in the real return from equities, bonds and commodities, the fund’s results benefited during the reporting period from a security selection strategy rooted in our “All Change” investment theme, which postulates that consumer consumption can no longer be supported by elevated debt levels.The result of the world’s move to a new financial paradigm has seen the start of a huge deleveraging cycle both at the government, corporate and consumer level while interest rates (in the US) have been anchored at historic lows.Through greater government interference especially through regulation of the financial sector and harsh austerity measures, lending growth and the ability to spend has added to the pressures of the developed economies. As a result, our security selection strategy has focused on companies that we believe will remain relatively insulated from these forces. For example, the fund’s equity holdings have emphasized large, traditionally defensive health care and telecommunications companies that have a track record of generating revenues and decent cash flow in all economic environments while supported by healthy balance sheets and cheap valuations. These stocks provided the reporting period’s strongest contribution to the fund’s total return.
Among bonds, we focused on corporate asset-backed securities with credit ratings toward the lower end of the investment-grade range.This strategy enabled us to capture higher levels of income compared to government securities or higher rated corporate debt, while extensive credit analysis helped the fund avoid credit pitfalls.We also found income-oriented opportunities in the convertible bond market.These fixed-income securities helped bolster the fund’s results during the reporting period.
Finally, we employed cash, inflation-protected bonds, gold and gold equities to dampen volatility and protect loss of capital. Gold-related
4
investments generally added value to the fund’s results while cash was a negligible source of income. We also used derivatives, including put options on the S&P 500 and certain currency hedges, to help provide insurance and protect the U.S. dollar return to our underlying investors.
Managing Risks in Unsettled Markets
We expect the subpar global economic recovery to persist, with generally sluggish growth in developed markets and more robust expansion in emerging markets.As of the reporting period’s end, equities seem poised to advance in response to new economic stimulus programs. Since these efforts could also cause an acceleration of inflation, we have increased the inflation protection in the fund by investing in gold ETFs (Exchange Traded Funds) and other commodities including agriculture and index linked Treasuries. Over the longer term, we believe that the “All Change” investment theme will continue to prevail, potentially sparking heightened volatility.
November 15, 2010
| |
| | Equity funds are subject generally to market, market sector, market liquidity, issuer and investment |
| | style risks, among other factors, to varying degrees, all of which are more fully described in the |
| | prospectus of the fund and that of each underlying fund. |
| | The fund’s performance will be influenced by political, social and economic factors affecting |
| | investments in foreign companies. Special risks associated with such companies include exposure to |
| | currency fluctuations, less liquidity, less developed or less efficient trading markets, lack of |
| | comprehensive company information, political instability and differing auditing and legal standards. |
| | Because the fund seeks to provide exposure to alternative or non-traditional (i.e., satellite) asset |
| | categories or investment strategies, the fund’s performance will be linked to the performance of these |
| | highly volatile asset categories and strategies.Accordingly, investors should consider purchasing |
| | shares of the fund only as part of an overall diversified portfolio and should be willing to assume |
| | the risks of potentially significant fluctuations in the value of fund shares. |
| | The fund may, but is not required to, use derivative instruments, such as options, futures and options |
| | on futures, forward contracts and other credit derivatives.A small investment in derivatives could have |
| | a potentially large impact on the fund’s performance.The use of derivatives involves risks different |
| | from, or possibly greater than, the risks associated with investing directly in the underlying assets. |
| 1 | Total return includes reinvestment of dividends and any capital gains paid, and does not take into |
| | consideration the maximum initial sales charge in the case of Class A shares, or the applicable |
| | contingent deferred sales charge imposed on redemptions in the case of Class C shares. Had these |
| | charges been reflected, returns would have been lower. Dreyfus has contractually agreed, until May |
| | 1, 2011, to waive receipt of its fees and/or assume the direct expenses of the fund so that the |
| | expenses of none of the classes (excluding the fund's Rule 12b-1 fees, shareholder services fees, |
| | taxes, interest, brokerage commissions, commitment fees on borrowings and extraordinary expenses) |
| | exceed 1.25% of the fund’s average daily net assets. Past performance is no guarantee of future |
| | results. Share price and investment return fluctuate such that upon redemption, fund shares may be |
| | worth more or less than their original cost. |
| 2 | SOURCE: FactSet – Citigroup 30-Day Treasury Bill Index is a market value-weighted index |
| | of public obligations of the U.S.Treasury with maturities of 30 days. Investors cannot invest |
| | directly in any index. |
| | London Interbank Offered Rate ( LIBOR ).The rate of interest at which banks borrow funds, in |
| | marketable size, from other banks in the London interbank market. LIBOR, is the most widely |
| | used benchmark or reference rate for short term interest rates, and is an international rate.The |
| | London Interbank Offered Rate is fixed each morning at 11 a.m. London time, by the British |
| | Bankers’ Association (BBA).The rate is an average derived from 16 quotations provided by |
| | banks determined by the British Bankers’ Association, the four highest and lowest are then |
| | eliminated and an average of the remaining eight is calculated to arrive at the fix, Eurodollar |
| | Libor is calculated on an ACT/360 day count basis and settlement is for 2 days hence. |
| | For comparative purposes, the value of the Index on 04/30/10 is used as the beginning value. |
The Fund 5
UNDERSTANDING YOUR FUND’S EXPENSES (Unaudited)
As a mutual fund investor, you pay ongoing expenses, such as management fees and other expenses. Using the information below, you can estimate how these expenses affect your investment and compare them with the expenses of other funds.You also may pay one-time transaction expenses, including sales charges (loads) and redemption fees, which are not shown in this section and would have resulted in higher total expenses. For more information, see your fund’s prospectus or talk to your financial adviser.
Review your fund’s expenses
The table below shows the expenses you would have paid on a $1,000 investment in Dreyfus Global Real Return Fund from May 12, 2010 (commencement of operations) to October 31, 2010. It also shows how much a $1,000 investment would be worth at the close of the period, assuming actual returns and expenses.
Expenses and Value of a $1,000 Investment
assuming actual returns for the six months ended October 31, 2010
| | | |
| | Class A | Class C | Class I |
| Expenses paid per $1,000† | $ 7.38 | $ 11.05 | $ 6.15 |
| Ending value (after expenses) | $1,075.20 | $1,072.00 | $1,076.80 |
COMPARING YOUR FUND’S EXPENSES
WITH THOSE OF OTHER FUNDS (Unaudited)
Using the SEC’s method to compare expenses
The Securities and Exchange Commission (SEC) has established guidelines to help investors assess fund expenses. Per these guidelines, the table below shows your fund’s expenses based on a $1,000 investment, assuming a hypothetical 5% annualized return. You can use this information to compare the ongoing expenses (but not transaction expenses or total cost) of investing in the fund with those of other funds.All mutual fund shareholder reports will provide this information to help you make this comparison. Please note that you cannot use this information to estimate your actual ending account balance and expenses paid during the period.
Expenses and Value of a $1,000 Investment
assuming a hypothetical 5% annualized return for the six months ended October 31, 2010
| | | |
| | Class A | Class C | Class I |
| Expenses paid per $1,000††† | $ 7.63 | $ 11.42 | $ 6.36 |
| Ending value (after expenses) | $1,017.64 | $1,013.86 | $1,018.90 |
| |
| † | Expenses are equal to the fund’s annualized expense ratio of 1.50% for Class A, 2.25% for Class C and 1.25% |
| | for Class I, multiplied by the average account value over the period, multiplied by 173/365 (to reflect the actual days |
| | in the period). |
| †† | Please note that while Class A, Class C and Class I shares commenced operations on May 12, 2010, the |
| | hypothetical expenses paid during the period reflect projected activity for the full six month period for purposes of |
| | comparability.This projection assumes that annualized expense ratios were in effect during the period May 1, 2010 |
| | to October 31, 2010. |
| ††† Expenses are equal to the fund’s annualized expense ratio of 1.50% for Class A, 2.25% for Class C and 1.25% |
| | for Class I, multiplied by the average account value over the period, multiplied by 184/365 (to reflect the one-half |
| | year period). |
6
STATEMENT OF INVESTMENTS
October 31, 2010
| | |
| Common Stocks—69.4% | Shares | Value ($) |
| Australia—2.8% | | |
| Newcrest Mining | 3,960 | 155,005 |
| Brazil—2.1% | | |
| Petroleo Brasileiro, ADR | 2,181 | 68,025 |
| Tele Norte Leste Participacoes, ADR | 3,100 | 47,554 |
| | | 115,579 |
| Canada—3.1% | | |
| Barrick Gold | 1,960 | 94,256 |
| Yamana Gold | 6,750 | 74,257 |
| | | 168,513 |
| France—1.0% | | |
| Thales | 1,400 | 57,082 |
| Germany—4.6% | | |
| Bayer | 1,685 | 125,749 |
| Deutsche Telekom | 8,650 | 125,327 |
| | | 251,076 |
| Japan—.7% | | |
| Nomura Holdings | 7,000 | 36,361 |
| Netherlands—3.1% | | |
| Koninklijke KPN | 3,480 | 58,122 |
| Reed Elsevier | 4,000 | 52,120 |
| Royal Dutch Shell, Cl. A | 1,856 | 59,155 |
| | | 169,397 |
| Norway—.9% | | |
| Statoil | 2,185 | 47,717 |
| Peru—1.3% | | |
| Cia de Minas Buenaventura, ADR | 1,350 | 71,604 |
| Poland—1.2% | | |
| Telekomunikacja Polska | 10,475 | 66,703 |
| South Africa—1.7% | | |
| MTN Group | 5,130 | 92,274 |
| South Korea—.4% | | |
| LG Uplus | 3,450 | 22,382 |
| Sweden—1.2% | | |
| TeliaSonera | 7,800 | 65,101 |
The Fund 7
STATEMENT OF INVESTMENTS (continued)
| | |
| Common Stocks (continued) | Shares | Value ($) |
| Switzerland—6.3% | | |
| Actelion | 690 a | 34,435 |
| Novartis | 1,501 | 87,020 |
| Roche Holding | 800 | 117,474 |
| Syngenta | 215 | 59,472 |
| Zurich Financial Services | 205 | 50,185 |
| | | 348,586 |
| Thailand—1.2% | | |
| Advanced Info Service | 22,000 | 66,044 |
| United Kingdom—13.1% | | |
| BAE Systems | 8,350 | 46,120 |
| BP | 8,860 | 60,450 |
| Centrica | 10,750 | 57,223 |
| GlaxoSmithKline | 4,770 | 93,324 |
| RSA Insurance Group | 25,115 | 52,719 |
| RWC Global Convertibles Fund | 95 | 109,028 |
| Scottish & Southern Energy | 3,270 | 60,414 |
| Smith & Nephew | 6,060 | 53,310 |
| Vodafone Group | 68,430 | 186,240 |
| | | 718,828 |
| United States—24.7% | | |
| AT&T | 3,615 | 103,028 |
| Chevron | 1,000 | 82,610 |
| Coca-Cola | 925 | 56,721 |
| iShares Nasdaq Biotechnology Index Fund | 490 | 43,757 |
| Kroger | 3,731 | 82,082 |
| Medtronic | 1,382 | 48,660 |
| Merck & Co. | 2,136 | 77,494 |
| Newmont Mining | 1,059 | 64,461 |
| PDL BioPharma | 8,000 | 41,840 |
| Pfizer | 4,570 | 79,518 |
| PowerShares DB Agriculture Fund | 5,720 a | 169,941 |
| PowerShares DB Gold Fund | 4,270 a | 205,302 |
| Raytheon | 890 | 41,011 |
| Reynolds American | 900 | 58,410 |
| Sprint Nextel | 13,764 a | 56,708 |
8
| | | | | |
| Common Stocks (continued) | | | | Shares | Value ($) |
| United States (continued) | | | | | |
| Wal-Mart Stores | | | | 1,536 | 83,205 |
| Wisconsin Energy | | | | 1,000 | 59,540 |
| | | | | | 1,354,288 |
| Total Common Stocks | | | | | |
| (cost $3,328,247) | | | | | 3,806,540 |
| |
| | | Coupon | Maturity | Principal | |
| Bonds and Notes—20.7% | | Rate (%) | Date | Amount ($)b | Value ($) |
| Germany—1.6% | | | | | |
| Fresenius Finance Jersey, | | | | | |
| Sr. Unscd. Bonds , Ser. FME | EUR | 5.63 | 8/14/11 | 50,000 | 86,988 |
| Netherlands—.6% | | | | | |
| Cable & Wireless | | | | | |
| International Finance, | | | | | |
| Gtd. Bonds | GBP | 8.63 | 3/25/19 | 20,000 | 33,489 |
| Norway—4.7% | | | | | |
| Norwegian Government, | | | | | |
| Bonds | NOK | 3.75 | 5/25/21 | 530,000 | 93,669 |
| Norwegian Government, | | | | | |
| Bonds, Ser. 473 | NOK | 4.50 | 5/22/19 | 868,000 | 163,647 |
| | | | | | 257,316 |
| Spain—1.3% | | | | | |
| Campofrio Food, | | | | | |
| Gtd. Notes | EUR | 8.25 | 10/31/16 | 50,000 | 73,591 |
| United Kingdom—6.1% | | | | | |
| BP Capital Markets, | | | | | |
| Gtd. Notes | | 5.25 | 11/7/13 | 56,000 | 61,298 |
| BP Capital Markets, | | | | | |
| Gtd. Notes | GBP | 5.75 | 11/8/10 | 50,000 | 80,266 |
| Bupa Finance, | | | | | |
| Sr. Unscd. Notes | GBP | 7.50 | 7/4/16 | 50,000 | 92,112 |
| Co-Operative Bank, | | | | | |
| Sub. Notes | GBP | 5.63 | 11/16/21 | 50,000 | 74,983 |
| Prudential, | | | | | |
| Jr. Sub. Notes | | 11.75 | 12/23/14 | 22,000 | 26,183 |
| | | | | | 334,842 |
The Fund 9
STATEMENT OF INVESTMENTS (continued)
| | | | |
| | Coupon | Maturity | Principal | |
| Bonds and Notes (continued) | Rate (%) | Date | Amount ($)b | Value ($) |
| United States—6.1% | | | | |
| Altria Group, | | | | |
| Gtd. Notes | 10.20 | 2/6/39 | 18,000 | 26,546 |
| Cemex Finance, | | | | |
| Sr. Scd. Bonds | 9.50 | 12/14/16 | 100,000 | 101,625 |
| Consol Energy, | | | | |
| Gtd. Notes | 8.00 | 4/1/17 | 25,000 | 27,125 |
| Nextel Communications, | | | | |
| Gtd. Notes, Ser. D | 7.38 | 8/1/15 | 25,000 | 25,219 |
| U.S. Treasury Inflation | | | | |
| Protected Securities, | | | | |
| Notes | 1.88 | 7/15/13 | 71,785 d | 76,838 |
| U.S. Treasury Inflation | | | | |
| Protected Securities, | | | | |
| Notes | 2.50 | 1/15/29 | 61,001 d | 75,237 |
| | | | | 332,590 |
| Venezuela—.3% | | | | |
| Petroleos De Venezuela, | | | | |
| Sr. Unscd. Bonds, Ser. 2011 | 0.00 | 7/10/11 | 20,000 e | 18,850 |
| Total Bonds and Notes | | | | |
| (cost $1,018,906) | | | | 1,137,666 |
| | | | Face Amount | |
| | | | Covered by | |
| Options Purchased—.5% | | | Contracts ($) | Value ($) |
| Call Options—.0% | | | | |
| U.S. Treasury 30 Year Bonds, | | | | |
| December 2010 @ $137 | | | 400,000 a | 1,375 |
| Put Options—.5% | | | | |
| Australian Dollar, | | | | |
| December 2010 @ $88 | | | 200,000 a | 260 |
| Australian Dollar, | | | | |
| December 2010 @ $89 | | | 100,000 a | 180 |
| Australian Dollar, | | | | |
| December 2010 @ $93.5 | | | 400,000 a | 2,680 |
| |
| | | | Number of | |
| | | | Contracts | |
| CBOE SPX Volatility Index | | | | |
| December 2010 @ $27.5 | | | 2 a | 1,000 |
| S&P 500 Index, | | | | |
| December 2010 @ $1,100 | | | 8 a | 9,040 |
10
| | |
| | Number of | |
| Options Purchased (continued) | Contracts | Value ($) |
| Put Options (continued) | | |
| S&P 500 Index, | | |
| March 2011 @ $1,050 | 6 a | 15,420 |
| | | 28,580 |
| Total Options Purchased | | |
| (cost $71,792) | | 29,955 |
| |
| Other Investment—12.8% | Shares | Value ($) |
| Registered Investment Company; | | |
| Dreyfus Institutional Preferred | | |
| Plus Money Market Fund | | |
| (cost $700,000) | 700,000 f | 700,000 |
| Total Investments (cost $5,118,945) | 103.4% | 5,674,161 |
| Liabilities, Less Cash and Receivables | (3.4%) | (186,338) |
| Net Assets | 100.0% | 5,487,823 |
ADR—American Depository Receipts
|
| a Non-income producing security. |
| b Principal amount stated in U.S. Dollars unless otherwise noted. |
| EUR—Euro |
| GBP— British Pound |
| NOK—Norwegian Krone |
| c Variable rate security—interest rate subject to periodic change. |
| d Principal amount for accrual purposes is periodically adjusted based on changes in the Consumer Price Index. |
| e Security issued with a zero coupon. Income is recognized through the accretion of discount. |
| f Investment in affiliated money market mutual fund. |
| | | |
| Portfolio Summary (Unaudited)† | | |
| |
| | Value (%) | | Value (%) |
| Telecommunications | 17.3 | Consumer Staples | 3.9 |
| Materials | 13.6 | Utilities | 3.2 |
| Health Care | 13.1 | U.S. Government Securities | 2.8 |
| Money Market Investment | 12.8 | Industrial | 2.6 |
| Oil & Gas | 8.7 | Mutual Fund | 2.0 |
| Exchange Traded Funds | 7.6 | Energy | .5 |
| Financial | 6.1 | Options Purchased | .5 |
| Foreign/Governmental | 4.7 | | |
| Consumer Discretionary | 4.0 | | 103.4 |
| |
| † Based on net assets. | | | |
| See notes to financial statements. | | | |
The Fund 11
| | |
| STATEMENT OF OPTIONS WRITTEN | | |
| October 31, 2010 | | |
| |
| |
| |
| | Number of | |
| | Contracts | Value ($) |
| Call Options: | | |
| S&P 500 Index, | | |
| December 2010 @ $1,250 | 7 | (4,410) |
| S&P 500 Index, | | |
| December 2010 @ $1,235 | 4 | (4,040) |
| Put Options: | | |
| S&P 500 Index, | | |
| December 2010 @ $1,040 | 8 | (4,080) |
| S&P 500 Index, | | |
| March 2011 @ $1,000 | 6 | (10,800) |
| (Premiums received $46,910) | | (23,330) |
| |
| See notes to financial statements. | | |
12
STATEMENT OF ASSETS AND LIABILITIES
October 31, 2010
| | | |
| | | Cost | Value |
| Assets ($): | | | |
| Investments in securities—See Statement of Investments: | | |
| Unaffiliated issuers | | 4,418,945 | 4,974,161 |
| Affiliated issuers | | 700,000 | 700,000 |
| Due from broker | | | 141,933 |
| Cash denominated in foreign currencies | | 2,763 | 2,837 |
| Dividends and interest receivable | | | 32,372 |
| Unrealized appreciation on forward foreign | | | |
| currency exchange contracts—Note 4 | | | 17,087 |
| Other assets | | | 66,703 |
| | | | 5,935,093 |
| Liabilities ($): | | | |
| Due to The Dreyfus Corporation and affiliates—Note 3(c) | | 27,404 |
| Cash overdraft due to custodian | | | 76,667 |
| Unrealized depreciation on forward foreign | | | |
| currency exchange contracts—Note 4 | | | 200,799 |
| Outstanding options written, at value (premiums received | | |
| $46,910)—See Statement of Options Written—Note 4 | | 23,330 |
| Accrued expenses and other liabilities | | | 119,070 |
| | | | 447,270 |
| Net Assets ($) | | | 5,487,823 |
| Composition of Net Assets ($): | | | |
| Paid-in capital | | | 4,908,028 |
| Accumulated undistributed investment income—net | | | 182,675 |
| Accumulated net realized gain (loss) on investments | | | 988 |
| Accumulated net unrealized appreciation (depreciation) on investments, | |
| options transactions and foreign currency transactions | | 396,132 |
| Net Assets ($) | | | 5,487,823 |
| |
| |
| Net Asset Value Per Share | | | |
| | Class A | Class C | Class I |
| Net Assets ($) | 3,339,919 | 1,071,420 | 1,076,484 |
| Shares Outstanding | 248,511 | 80,000 | 80,000 |
| Net Asset Value Per Share ($) | 13.44 | 13.39 | 13.46 |
| |
| See notes to financial statements. | | | |
The Fund 13
STATEMENT OF OPERATIONS
From May 12, 2010 (commencement of operations) to October 31, 2010
| |
| Investment Income ($): | |
| Income: | |
| Cash dividends (net of $2,386 foreign taxes withheld at source): | |
| Unaffiliated issuers | 43,824 |
| Affiliated issuers | 924 |
| Interest | 14,697 |
| Total Income | 59,445 |
| Expenses: | |
| Management fee—Note 3(a) | 21,980 |
| Legal fees | 40,318 |
| Auditing fees | 35,210 |
| Registration fees | 25,399 |
| Custodian fees—Note 3(c) | 7,807 |
| Shareholder servicing costs—Note 3(c) | 5,536 |
| Distribution fees—Note 3(b) | 3,643 |
| Prospectus and shareholders’ reports | 850 |
| Directors’ fees and expenses—Note 3(d) | 506 |
| Miscellaneous | 6,304 |
| Total Expenses | 147,553 |
| Less—expense reimbursement from The Dreyfus | |
| Corporation due to undertaking—Note 3(a) | (108,638) |
| Net Expenses | 38,915 |
| Investment Income—Net | 20,530 |
| Realized and Unrealized Gain (Loss) on Investments—Note 4 ($): | |
| Net realized gain (loss) on investments and foreign currency transactions | 49,474 |
| Net realized gain (loss) on options transactions | (42,785) |
| Net realized gain (loss) on forward foreign currency exchange contracts | (48,401) |
| Net Realized Gain (Loss) | (41,712) |
| Net unrealized appreciation (depreciation) on | |
| investments and foreign currency transactions | 598,101 |
| Net unrealized appreciation (depreciation) on options transactions | (18,257) |
| Net unrealized appreciation (depreciation) on | |
| forward foreign currency exchange contracts | (183,712) |
| Net Unrealized Appreciation (Depreciation) | 396,132 |
| Net Realized and Unrealized Gain (Loss) on Investments | 354,420 |
| Net Increase in Net Assets Resulting from Operations | 374,950 |
| |
| See notes to financial statements. | |
14
STATEMENT OF CHANGES IN NET ASSETS
From May 12, 2010 (commencement of operations) to October 31, 2010
| |
| Operations ($): | |
| Investment income—net | 20,530 |
| Net realized gain (loss) on investments | (41,712) |
| Net unrealized appreciation (depreciation) on investments | 396,132 |
| Net Increase (Decrease) in Net Assets | |
| Resulting from Operations | 374,950 |
| Capital Stock Transactions ($): | |
| Net proceeds from shares sold: | |
| Class A Shares | 3,112,873 |
| Class C Shares | 1,000,000 |
| Class I Shares | 1,000,000 |
| Increase (Decrease) in Net Assets | |
| from Capital Stock Transactions | 5,112,873 |
| Total Increase (Decrease) in Net Assets | 5,487,823 |
| Net Assets ($): | |
| Beginning of Period | — |
| End of Period | 5,487,823 |
| Undistributed investment income—net | 182,675 |
| Capital Share Transactions (Shares): | |
| Class A | |
| Shares sold | 248,511 |
| Class C | |
| Shares sold | 80,000 |
| Class I | |
| Shares sold | 80,000 |
| |
| See notes to financial statements. | |
The Fund 15
FINANCIAL HIGHLIGHTS
The following table describes the performance for each share class for the period from May 12, 2010 (commencement of operations) to October 31, 2010.All information (except portfolio turnover rate) reflects financial results for a single fund share.Total return shows how much your investment in the fund would have increased (or decreased) during the period, assuming you had reinvested all dividends and distrib-utions.These figures have been derived from the fund’s financial statements.
| | | |
| | Class A | Class C | Class I |
| | Shares | Shares | Shares |
| Per Share Data ($): | | | |
| Net asset value, beginning of period | 12.50 | 12.50 | 12.50 |
| Investment Operations: | | | |
| Investment income—neta | .06 | .01 | .07 |
| Net realized and unrealized | | | |
| gain (loss) on investments | .88 | .88 | .89 |
| Total from Investment Operations | .94 | .89 | .96 |
| Net asset value, end of period | 13.44 | 13.39 | 13.46 |
| Total Return (%)b | 7.52c | 7.20c | 7.68 |
| Ratios/Supplemental Data (%): | | | |
| Ratio of total expenses to average net assetsd | 5.96 | 6.75 | 5.75 |
| Ratio of net expenses to average net assetsd | 1.50 | 2.25 | 1.25 |
| Ratio of net investment income | | | |
| to average net assetsd | .94 | .20 | 1.19 |
| Portfolio Turnover Rateb | 49.61 | 49.61 | 49.61 |
| Net Assets, end of period ($ x 1,000) | 3,340 | 1,071 | 1,076 |
| |
| a | Based on average shares outstanding at each month end. |
| b | Not annualized. |
| c | Exclusive of sales charge. |
| d | Annualized. |
See notes to financial statements.
16
NOTES TO FINANCIAL STATEMENTS
NOTE 1—Significant Accounting Policies:
Dreyfus Global Real Return Fund (the “fund”) is a separate diversified series of Advantage Funds, Inc. (the “Company”), which is registered under the Investment Company Act of 1940, as amended (the “Act”), as an open-end management investment company and operates as a series company that offers eleven series, including the fund, which commenced operations on May 12, 2010.The fund’s investment objective is to seek total return (consisting of capital appreciation and income).The Dreyfus Corporation (the “Manager” or “Dreyfus”), a wholly-owned subsidiary of The Bank of New York Mellon Corporation (“BNY Mellon”), serves as the fund’s investment adviser. Newton Capital Management Limited (“Newton”) serves as the fund’s sub-investment adviser. Newton is a wholly-owned subsidiary of BNY Mellon and an affiliate of Dreyfus.
MBSC Securities Corporation (the “Distributor”), a wholly-owned subsidiary of Dreyfus, is the distributor of the fund’s shares.The fund is authorized to issue 100 million shares of $.001 par value Common Stock in each of the following classes of shares: Class A, Class C and Class I. Class A shares are subject to a sales charge imposed at the time of purchase. Class C shares are subject to a contingent deferred sales charge (“CDSC”) imposed on Class C shares redeemed within one year of purchase. Class I shares are sold at net asset value per share only to institutional investors. Other differences between the classes include the services offered to and the expenses borne by each class, the allocation of certain transfer agency costs and certain voting rights. Income, expenses (other than expenses attributable to a specific class) and realized and unrealized gains or losses on investments ar e allocated to each class of shares based on its relative net assets.
As of October 31, 2010, MBC Investments Corp., an indirect subsidiary of BNY Mellon, held 240,000 Class A, 80,000 Class C and 80,000 Class I shares of the fund.
TheFund 17
NOTES TO FINANCIAL STATEMENTS (continued)
The Company accounts separately for the assets, liabilities and operations of each series. Expenses directly attributable to each series are charged to that series’ operations; expenses which are applicable to all series are allocated among them on a pro rata basis.
The Financial Accounting Standards Board (“FASB”) Accounting Standards Codification (“ASC”) is the exclusive reference of authoritative U.S. generally accepted accounting principles (“GAAP”) recognized by the FASB to be applied by nongovernmental entities. Rules and interpretive releases of the Securities and Exchange Commission (“SEC”) under authority of federal laws are also sources of authoritative GAAP for SEC registrants. The fund’s financial statements are prepared in accordance with GAAP, which may require the use of management estimates and assumptions.Actual results could differ from those estimates.
The Company enters into contracts that contain a variety of indemnifications.The fund’s maximum exposure under these arrangements is unknown.The fund does not anticipate recognizing any loss related to these arrangements.
(a) Portfolio valuation: Investments in equity securities are valued at the last sales price on the securities exchange or national securities market on which such securities are primarily traded. Securities listed on the National Market System for which market quotations are available are valued at the official closing price or, if there is no official closing price that day, at the last sales price. Securities not listed on an exchange or the national securities market, or securities for which there were no transactions, are valued at the average of the most recent bid and asked prices, except for open short positions, where the asked price is used for valuation purposes. Bid price is used when no asked price is available. Registered investment companies that are not traded on an exchange are valued at their net asset valu e.When market quotations or official closing prices are not readily available, or are determined not to reflect accurately fair value, such as when the value of a security has been significantly affected by events after the close of the exchange or market on which the security is principally traded (for example, a foreign exchange
18
or market), but before the fund calculates its net asset value, the fund may value these investments at fair value as determined in accordance with the procedures approved by the Board of Directors. Fair valuing of securities may be determined with the assistance of a pricing service using calculations based on indices of domestic securities and other appropriate indicators, such as prices of relevant ADRs and futures contracts. For other securities that are fair valued by the Board of Directors, certain factors may be considered such as: fundamental analytical data, the nature and duration of restrictions on disposition, an evaluation of the forces that influence the market in which the securities are purchased and sold, and public trading in similar securities of the issuer or comparable issuers. Financial futures and options, which are traded on an exchange, are valued at the last sales price on the securities exchange on which such securities are primarily traded or at the last sales price on the national securities market on each business day. Options traded over-the-counter are valued at the mean between the bid and asked price. Investments denominated in foreign currencies are translated to U.S. dollars at the prevailing rates of exchange. Forward foreign currency exchange contracts (“forward contracts”) are valued at the forward rate.
Investments in debt securities excluding short-term investments (other than U.S.Treasury Bills), are valued each business day by an independent pricing service (the “Service”) approved by the Board of Directors. Investments for which quoted bid prices are readily available and are representative of the bid side of the market in the judgment of the Service are valued at the mean between the quoted bid prices (as obtained by the Service from dealers in such securities) and asked prices (as calculated by the Service based upon its evaluation of the market for such securities). Other debt securities are valued as determined by the Service, based on methods which include consideration of: yields or prices of securities of comparable quality, coupon, maturity and type; indications as to values from dealers; and general market conditions. Restricted securities, as well as securities or other assets for which re cent market quotations are not readily available, that are not valued by
The Fund19
NOTES TO FINANCIAL STATEMENTS (continued)
a pricing service approved by the Board of Directors, or are determined by the fund not to reflect accurately fair value, are valued at fair value as determined in good faith under the direction of the Board of Directors.The factors that may be considered when fair valuing a security include fundamental analytical data, the nature and duration of restrictions on disposition, an evaluation of the forces that influence the market in which the securities are purchased and sold and public trading in similar securities of the issuer or comparable issuers. Short-term investments, excluding U.S.Treasury Bills, are carried at amortized cost, which approximates value.
The fair value of a financial instrument is the amount that would be received to sell an asset or paid to transfer a liability in an orderly transaction between market participants at the measurement date (i.e. the exit price). GAAP establishes a fair value hierarchy that prioritizes the inputs of valuation techniques used to measure fair value.This hierarchy gives the highest priority to unadjusted quoted prices in active markets for identical assets or liabilities (Level 1 measurements) and the lowest priority to unobservable inputs (Level 3 measurements).
Additionally, GAAP provides guidance on determining whether the volume and activity in a market has decreased significantly and whether such a decrease in activity results in transactions that are not orderly. GAAP requires enhanced disclosures around valuation inputs and techniques used during annual and interim periods.
Various inputs are used in determining the value of the fund’s investments relating to fair value measurements.These inputs are summarized in the three broad levels listed below:
Level 1—unadjusted quoted prices in active markets for
identical investments.
Level 2—other significant observable inputs (including quoted
prices for similar investments, interest rates, prepayment speeds,
credit risk, etc.).
Level 3—significant unobservable inputs (including the fund’s
own assumptions in determining the fair value of investments).
20
The inputs or methodology used for valuing securities are not necessarily an indication of the risk associated with investing in those securities.
The following is a summary of the inputs used as of October 31, 2010 in valuing the fund’s investments:
| | | | |
| | | Level 2—Other | Level 3— | |
| | Level 1— | Significant | Significant | |
| | Unadjusted | Observable | Unobservable | |
| | Quoted Prices | Inputs | Inputs | Total |
| Assets ($) | | | | |
| Investments in Securities: | | | |
| Corporate Bonds† | — | 728,275 | — | 728,275 |
| Equity Securities— | | | | |
| Domestic† | 935,288 | — | — | 935,288 |
| Equity Securities— | | | | |
| Foreign† | 2,343,224 | — | — | 2,343,224 |
| Foreign Government | — | 257,316 | — | 257,316 |
| Mutual Funds/ | | | | |
| Exchange Traded | | | | |
| Funds | 1,228,028 | — | — | 1,228,028 |
| U.S. Treasury | — | 152,075 | — | 152,075 |
| Other Financial | | | | |
| Instruments: | | | | |
| Forward Foreign | | | | |
| Currency Exchange | | | | |
| Contracts†† | — | 17,087 | — | 17,087 |
| Options Purchased | 29,955 | — | — | 29,955 |
| Liabilities ($) | | | | |
| Other Financial | | | | |
| Instruments: | | | | |
| Forward Foreign | | | | |
| Currency Exchange | | | | |
| Contracts†† | — | (200,799) | — | (200,799) |
| Options Written | (23,330) | — | — | (23,330) |
| |
| † | See Statement of Investments for country and industry classification. |
| †† | Amount shown represents unrealized appreciation (depreciation) at period end. |
In January 2010, FASB issued Accounting Standards Update (“ASU”) No. 2010-06 “Improving Disclosures about FairValue Measurements”. The portions of ASU No. 2010-06 which require reporting entities to
The Fund 21
NOTES TO FINANCIAL STATEMENTS (continued)
prepare new disclosures surrounding amounts and reasons for significant transfers in and out of Level 1 and Level 2 fair value measurements as well as inputs and valuation techniques used to measure fair value for both recurring and nonrecurring fair value measurements that fall in either Level 2 or Level 3 have been adopted by the fund. No significant transfers between Level 1 or Level 2 fair value measurements occurred at October 31, 2010. The remaining portion of ASU No. 2010-06 requires reporting entities to make new disclosures about information on purchases, sales, issuances and settlements on a gross basis in the reconciliation of activity in Level 3 fair value measurements. These new and revised disclosures are required to be implemented for fiscal years beginning after December 15, 2010. Management is currently evaluating the impact that the adoption of this remaining portion of ASU No. 2010-06 may have o n the fund’s financial statement disclosures.
(b) Foreign currency transactions: The fund does not isolate that portion of the results of operations resulting from changes in foreign exchange rates on investments from the fluctuations arising from changes in the market prices of securities held. Such fluctuations are included with the net realized and unrealized gain or loss on investments.
Net realized foreign exchange gains or losses arise from sales of foreign currencies, currency gains or losses realized on securities transactions between trade date and settlement date and the difference between the amounts of dividends, interest and foreign withholding taxes recorded on the fund’s books and the U.S. dollar equivalent of the amounts actually received or paid. Net unrealized foreign exchange gains or losses arise from changes in the value of assets and liabilities other than investments resulting from changes in exchange rates. Foreign currency gains and losses on investments are included with net realized and unrealized gain or loss on investments.
(c) Securities transactions and investment income: Securities transactions are recorded on a trade date basis. Realized gains and losses from securities transactions are recorded on the identified cost basis.
22
Dividend income is recognized on the ex-dividend date and interest income, including, where applicable, accretion of discount and amortization of premium on investments, is recognized on the accrual basis.
Investing in foreign markets may involve special risks and considerations not typically associated with investing in the U.S. These risks include revaluation of currencies, high rates of inflation, repatriation restrictions on income and capital, and adverse political and economic developments. Moreover, securities issued in these markets may be less liquid, subject to government ownership controls and delayed settlements, and their prices may be more volatile than those of comparable securities in the U.S.
(d) Affiliated issuers: Investments in other investment companies advised by Dreyfus are defined as “affiliated” in the Act.
The fund may invest in shares of certain affiliated investment companies also advised or managed by Dreyfus. Investments in affiliated investment companies for the period ended October 31, 2010 were as follows:
| | | | | |
| Affiliated | | | | | |
| Investment | Value | | | Value | Net |
| Company | 5/12/2010 ($) | Purchases ($) | Sales ($) | 10/31/2010 ($) | Assets (%) |
| Dreyfus | | | | | |
| Institutional | | | | | |
| Preferred | | | | | |
| Plus Money | | | | | |
| Market Fund | — | 6,610,000 | 5,910,000 | 700,000 | 12.8 |
(e) Dividends to shareholders: Dividends are recorded on the ex-dividend date. Dividends from investment income-net and dividends from net realized capital gains, if any, are normally declared and paid annually, but the fund may make distributions on a more frequent basis to comply with the distribution requirements of the Internal Revenue Code of 1986, as amended (the “Code”).To the extent that net realized capital gains can be offset by capital loss carryovers, it is the policy of the fund not to distribute such gains. Income and capital gain distributions are determined in accordance with income tax regulations, which may differ from GAAP.
The Fund 23
NOTES TO FINANCIAL STATEMENTS (continued)
(f) Federal income taxes: It is the policy of the fund to qualify as a regulated investment company, if such qualification is in the best interests of its shareholders, by complying with the applicable provisions of the Code, and to make distributions of taxable income sufficient to relieve it from substantially all federal income and excise taxes.
As of and during the period ended October 31, 2010, the fund did not have any liabilities for any uncertain tax positions.The fund recognizes interest and penalties, if any, related to uncertain tax positions as income tax expense in the Statement of Operations. During the period, the fund did not incur any interest or penalties.
The tax year for the period ended October 31, 2010 remains subject to examination by the Internal Revenue Service and state taxing authorities.
At October 31, 2010, the components of accumulated earnings on tax basis were as follows: accumulated capital losses $11,437 and unrealized appreciation $591,232.
The accumulated capital loss carryover is available for federal income tax purposes to be applied against future net securities profits, if any, realized subsequent to October 31, 2010. If not applied, the carryover expires in fiscal 2018.
During the period ended October 31, 2010, as a result of permanent book to tax differences, primarily due to the tax treatment for net operating losses, foreign currency gains and losses and fund start-up costs, the fund increased accumulated undistributed investment income-net by $162,145, increased accumulated net realized gain (loss) on investments by $42,700 and decreased paid-in capital by $204,845. Net assets and net asset value per share were not affected by this reclassification.
NOTE 2—Bank Lines of Credit:
The fund participates with other Dreyfus-managed funds in a $225 million unsecured credit facility led by Citibank, N.A. and a $300 million unsecured credit facility provided by The Bank of New York
24
Mellon, a subsidiary of BNY Mellon and an affiliate of Dreyfus (each, a “Facility”), each to be utilized primarily for temporary or emergency purposes, including the financing of redemptions. In connection therewith, the fund has agreed to pay its pro rata portion of commitment fees for each Facility. Interest is charged to the fund based on rates determined pursuant to the terms of the respective Facility at the time of borrowing. During the period ended on October 31, 2010, the fund did not borrow under the Facilities.
NOTE 3—Management Fee, Sub-Investment Advisory Fee and Other Transactions with Affiliates:
(a) Pursuant to a management agreement with Dreyfus, the management fee is computed at the annual rate of .90% of the value of the fund’s average daily net assets and is payable monthly. Dreyfus has contractually agreed, until May 1, 2011, to waive receipt of its fees and/or assume certain expenses of the fund so that the fund’s annual operating expenses (excluding Rule 12b-1 fees, shareholder services fees, taxes, interest fees, brokerage commissions, commitment fees on borrowings and extraordinary expenses) do not exceed 1.25% of the value of the fund’s average daily net assets. The expense reimbursement, pursuant to the undertaking, amounted to $108,638 during the period ended October 31, 2010.
Pursuant to a Sub-Investment Advisory Agreement between Dreyfus and Newton, Dreyfus pays Newton an annual fee of .43% of the value of the fund’s average daily net assets, payable monthly.
(b) Under the Distribution Plan (the “Plan”) adopted pursuant to Rule 12b-1 under the Act, Class C shares pay the Distributor for distributing its shares at an annual rate of .75% of the value of the average daily net assets of Class C shares. During the period ended October 31, 2010, Class C shares were charged $3,643 pursuant to the Plan.
(c) Under the Shareholder Services Plan, Class A and Class C shares pay the Distributor at an annual rate of .25% of the value of their average
The Fund 25
NOTES TO FINANCIAL STATEMENTS (continued)
daily net assets for the provision of certain services.The services provided may include personal services relating to shareholder accounts, such as answering shareholder inquiries regarding the fund and providing reports and other information, and services related to the maintenance of shareholder accounts.The Distributor may make payments to Service Agents (a securities dealer, financial institution or other industry professional) in respect of these services. The Distributor determines the amounts to be paid to Service Agents. During the period ended October 31, 2010, Class A and Class C shares were charged $3,674 and $1,214, respectively, pursuant to the Shareholder Services Plan.
The fund compensates Dreyfus Transfer, Inc., a wholly-owned subsidiary of Dreyfus, under a transfer agency agreement for providing personnel and facilities to perform transfer agency services for the fund. During the period ended October 31, 2010, the fund was charged $38 pursuant to the transfer agency agreement, which is included in Shareholder servicing costs in the Statement of Operations.
The fund has arrangements with the custodian and cash management bank whereby the fund may receive earnings credits when positive cash balances are maintained, which are used to offset custody and cash management fees. For financial reporting purposes, the fund includes net earnings credits as an expense offset in the Statement of Operations.
The fund compensates The Bank of New York Mellon under a cash management agreement for performing cash management services related to fund subscriptions and redemptions. During the period ended October 31, 2010, the fund was charged $5 pursuant to the cash management agreement, which is included in Shareholder servicing costs in the Statement of Operations.
The fund also compensates The Bank of New York Mellon under a custody agreement for providing custodial services for the fund. During the period ended October 31, 2010, the fund was charged $7,807 pursuant to the custody agreement.
26
During the period ended October 31, 2010, the fund was charged $448 for services performed by the Chief Compliance Officer.
The components of “Due to The Dreyfus Corporation and affiliates” in the Statement of Assets and Liabilities consist of: management fees $20,253, Rule 12b-1 distribution plan fees $680, shareholder services plan fees $926, custodian fees $5,086, chief compliance officer fees $448 and transfer agency per account fees $11.
(d) Each Board member also serves as a Board member of other funds within the Dreyfus complex. Annual retainer fees and attendance fees are allocated to each fund based on net assets.
NOTE 4—Securities Transactions:
The aggregate amount of purchases and sales of investment securities, excluding short-term securities, financial futures, options transactions and forward contracts during the period ended October 31, 2010, amounted to $6,500,699 and $2,197,879, respectively.
The provisions of ASC Topic 815 “Derivatives and Hedging” require qualitative disclosures about objectives and strategies for using derivatives, quantitative disclosures about fair value amounts of gains and losses on derivative instruments and disclosures about credit-risk-related contingent features in derivative agreements. The disclosure requirements distinguish between derivatives, which are accounted for as “hedges” and those that do not qualify for hedge accounting. Because investment companies value their derivatives at fair value and recognize changes in fair value through the Statement of Operations, they do not qualify for such accounting. Accordingly, even though a fund’s investments in derivatives may represent economic hedges, they are considered to be non-hedge transactions for purposes of this disclosure. The following tables show the fund’s exposure to different types of market risk as it relates to the Statement of Assets and Liabilities and the Statement of Operations, respectively.
The Fund 27
NOTES TO FINANCIAL STATEMENTS (continued)
Fair value of derivative instruments as of October 31, 2010 is shown below:
| | | |
| | Derivative | | Derivative |
| | Assets ($) | | Liabilities ($) |
| Equity risk1 | 25,460 | Equity risk2 | (23,330) |
| Interest rate risk1 | 1,375 | | |
| Foreign exchange risk1,3 | 20,207 | Foreign exchange risk4 | (200,799) |
| Gross fair value of | | | |
| derivatives contracts | 47,042 | | (224,129) |
| |
| Statement of Assets and Liabilities location: |
| 1 | Options purchased are included in investments in securities of unaffiliated issuers. |
| 2 | Outstanding options written, at value. |
| 3 | Unrealized appreciation on forward foreign currency exchange contracts. |
| 4 | Unrealized depreciation on forward foreign currency exchange contracts. |
The effect of derivative instruments in the Statement of Operations during the period ended October 31, 2010 is shown below:
| | | |
| | Amount of realized gain or (loss) on derivatives recognized in income ($) |
| | | Forward | |
| Underlying risk | Options5 | Contracts6 | Total |
| Equity | (28,238) | — | (28,238) |
| Foreign exchange | (14,547) | (48,401) | (62,948) |
| Total | (42,785) | (48,401) | (91,186) |
| | | |
| Change in unrealized appreciation or (depreciation) on derivatives recognized in income ($) |
| | | Forward | |
| Underlying risk | Options7 | Contracts8 | Total |
| Equity | (8,029) | — | (8,029) |
| Interest | (3,465) | — | (3,465) |
| Foreign exchange | (6,763) | (183,712) | (190,475) |
| Total | (18,257) | (183,712) | (201,969) |
| |
| Statement of Operations location: |
| 5 | Net realized gain (loss) on options transactions. |
| 6 | Net realized gain (loss) on forward foreign currency exchange contracts. |
| 7 | Net unrealized appreciation (depreciation) on options transactions. |
| 8 | Net unrealized appreciation (depreciation) on forward foreign currency exchange contracts. |
28
The following summarizes the average market value of derivatives outstanding during the period ended October 31, 2010:
| |
| | Value ($) |
| Equity options | 65,483 |
| Interest rate options | 1,275 |
| Currency options | 3,337 |
| Forward contracts | 2,457,326 |
Options: The fund purchases and writes (sells) put and call options to hedge against changes in interest rates, the values of equities and foreign currencies or as a substitute for an investment. The fund is subject to interest rate risk, market risk and currency risk in the course of pursuing its investment objectives through its investments in options contracts.A call option gives the purchaser of the option the right (but not the obligation) to buy, and obligates the writer to sell, the underlying security or securities at the exercise price at any time during the option period, or at a specified date. Conversely, a put option gives the purchaser of the option the right (but not the obligation) to sell, and obligates the writer to buy the underlying security or securities at the exercise price at any time during the optio n period, or at a specified date.
As a writer of call options, the fund receives a premium at the outset and then bears the market risk of unfavorable changes in the price of the financial instrument underlying the option. Generally, the fund realizes a gain, to the extent of the premium, if the price of the underlying financial instrument decreases between the date the option is written and the date on which the option is terminated. Generally, the fund incurs a loss, if the price of the financial instrument increases between those dates.
As a writer of put options, the fund receives a premium at the outset and then bears the market risk of unfavorable changes in the price of the
The Fund 29
NOTES TO FINANCIAL STATEMENTS (continued)
financial instrument underlying the option. Generally, the fund realizes a gain, to the extent of the premium, if the price of the underlying financial instrument increases between the date the option is written and the date on which the option is terminated. Generally, the fund incurs a loss, if the price of the financial instrument decreases between those dates.
As a writer of an option, the fund has no control over whether the underlying securities may be sold (called) or purchased (put) and as a result bears the market risk of an unfavorable change in the price of the security underlying the written option.There is a risk of loss from a change in value of such options which may exceed the related premiums received. One risk of holding a put or a call option is that if the option is not sold or exercised prior to its expiration, it becomes worthless. However, this risk is limited to the premium paid by the fund. Upon the expiration or closing of the option transaction, a gain or loss is reported in the Statement of Operations.
The following summarizes the fund’s call/put options written for the period ended October 31, 2010:
| | | | |
| | | | Options Terminated |
| | Number of | Premiums | | Net Realized |
| Options Written: | Contracts | Received ($) | Cost ($) | Gain ($) |
| Contracts outstanding | | | | |
| May 12, 2010 | — | — | | |
| Contracts written | 43 | 89,417 | | |
| Contracts terminated: | | | | |
| Contracts closed | 8 | 28,333 | 14,523 | 13,810 |
| Contracts expired | 10 | 14,174 | — | 14,174 |
| Total contracts terminated | 18 | 42,507 | 14,523 | 27,984 |
| Contracts outstanding | | | | |
| October 31, 2010 | 25 | 46,910 | | |
Forward Foreign Currency Exchange Contracts: The fund enters into forward contracts in order to hedge its exposure to changes in foreign currency exchange rates on its foreign portfolio holdings, to settle foreign currency transactions or as a part of its investment strategy. When executing forward contracts, the fund is obligated to buy or sell
30
a foreign currency at a specified rate on a certain date in the future. With respect to sales of forward contracts, the fund incurs a loss if the value of the contract increases between the date the forward contract is opened and the date the forward contract is closed.The fund realizes a gain if the value of the contract decreases between those dates.With respect to purchases of forward contracts, the fund incurs a loss if the value of the contract decreases between the date the forward contract is opened and the date the forward contract is closed.The fund realizes a gain if the value of the contract increases between those dates. Any realized gain or loss which occurred during the period is reflected in the Statement of Operations.The fund is exposed to foreign currency risk as a result of changes in value of underlying financial instruments. The fund is also exposed to credit risk associated with counterparty nonperformance on these forward contracts, which is typically limited to the unrealized gain on each open contract.The following summarizes open forward contracts at October 31, 2010:
| | | | |
| | Foreign | | | Unrealized |
| Forward Foreign Currency | Currency | | | Appreciation |
| Exchange Contracts | Amounts | Cost ($) | Value ($) (Depreciation) ($) |
| Purchases: | | | | |
| British Pound, | | | | |
| Expiring 11/12/2010 | 17,000 | 26,754 | 27,237 | 483 |
| Canadian Dollar, | | | | |
| Expiring 3/15/2011 | 82,998 | 80,000 | 81,094 | 1,094 |
| Chinese Renminbi, | | | | |
| Expiring 1/14/2011 | 1,519,000 | 225,104 | 228,401 | 3,297 |
| Chinese Renminbi, | | | | |
| Expiring 1/14/2011 | 174,000 | 25,755 | 26,163 | 408 |
| Chinese Renminbi, | | | | |
| Expiring 1/14/2011 | 100,000 | 15,076 | 15,036 | (40) |
| Euro, | | | | |
| Expiring 3/15/2011 | 61,000 | 83,110 | 84,726 | 1,616 |
| Singapore Dollar, | | | | |
| Expiring 3/15/2011 | 106,102 | 80,000 | 81,982 | 1,982 |
| South African Rand, | | | | |
| Expiring 12/15/2010 | 430,000 | 60,822 | 60,934 | 112 |
The Fund 31
NOTES TO FINANCIAL STATEMENTS (continued)
| | | | |
| | Foreign | | | Unrealized |
| Forward Foreign Currency | Currency | | | Appreciation |
| Exchange Contracts | Amounts | Proceeds ($) | Value ($) (Depreciation) ($) |
| Sales: | | | | |
| Australian Dollar, | | | | |
| Expiring 11/2/2010 | 792 | 773 | 776 | (3) |
| Australian Dollar, | | | | |
| Expiring 12/15/2010 | 118,000 | 97,793 | 114,913 | (17,120) |
| Australian Dollar, | | | | |
| Expiring 12/15/2010 | 175,000 | 146,292 | 170,422 | (24,130) |
| British Pound, | | | | |
| Expiring 11/12/2010 | 73,000 | 106,344 | 116,960 | (10,616) |
| British Pound, | | | | |
| Expiring 11/12/2010 | 271,000 | 396,233 | 434,195 | (37,962) |
| British Pound, | | | | |
| Expiring 11/12/2010 | 98,000 | 148,472 | 157,015 | (8,543) |
| British Pound, | | | | |
| Expiring 11/12/2010 | 115,000 | 179,634 | 184,252 | (4,618) |
| Euro, | | | | |
| Expiring 3/15/2011 | 566,000 | 719,879 | 786,144 | (66,265) |
| Japanese Yen, | | | | |
| Expiring 4/15/2011 | 2,909,000 | 35,355 | 36,219 | (864) |
| Norwegian Krone, | | | | |
| Expiring 2/15/2011 | 1,789,000 | 296,866 | 303,703 | (6,837) |
| Polish Zloty, | | | | |
| Expiring 1/14/2011 | 145,000 | 44,026 | 50,584 | (6,558) |
| South African Rand, | | | | |
| Expiring 12/15/2010 | 853,000 | 108,952 | 120,876 | (11,924) |
| South African Rand, | | | | |
| Expiring 12/15/2010 | 376,000 | 49,923 | 53,282 | (3,359) |
| South Korean Won, | | | | |
| Expiring 1/14/2011 | 27,391,000 | 22,305 | 24,265 | (1,960) |
| Swiss Franc, | | | | |
| Expiring 4/15/2011 | 293,000 | 306,235 | 298,140 | 8,095 |
| Gross Unrealized Appreciation | | | 17,087 |
| Gross Unrealized Depreciation | | | (200,799) |
At October 31, 2010, the cost of investments for federal income tax purposes was $5,120,837; accordingly, accumulated net unrealized appreciation on investments was $553,324, consisting of $575,469 gross unrealized appreciation and $22,145 gross unrealized depreciation.
32
REPORT OF INDEPENDENT REGISTERED
PUBLIC ACCOUNTING FIRM
Shareholders and Board of Directors
Dreyfus Global Real Return Fund
We have audited the accompanying statement of assets and liabilities, including the statements of investments and options written, of Dreyfus Global Real Return Fund (one of the series comprising Advantage Funds, Inc.) as of October 31, 2010, and the related statements of operations and changes in net assets and financial highlights for the period from May 12, 2010 (commencement of operations) to October 31, 2010. These financial statements and financial highlights are the responsibility of the Fund’s management. Our responsibility is to express an opinion on these financial statements and financial highlights based on our audit.
We conducted our audit in accordance with the standards of the Public Company Accounting Oversight Board (United States).Those standards require that we plan and perform the audit to obtain reasonable assurance about whether the financial statements and financial highlights are free of material misstatement.We were not engaged to perform an audit of the Fund’s internal control over financial reporting. Our audit included consideration of internal control over financial reporting as a basis for designing audit procedures that are appropriate in the circumstances, but not for the purpose of expressing an opinion on the effectiveness of the Fund’s internal control over financial reporting. Accordingly, we express no such opinion.An audit also includes examining, on a test basis, evidence supporting the amounts and disclosures in the financial statements and financial highlights, assessing the accounting pri nciples used and significant estimates made by management, and evaluating the overall financial statement presentation. Our procedures included confirmation of securities owned as of October 31, 2010 by correspondence with the custodian and others.We believe that our audit provides a reasonable basis for our opinion.
In our opinion, the financial statements and financial highlights referred to above present fairly, in all material respects, the financial position of Dreyfus Global Real Return Fund at October 31, 2010, and the results of its operations, the changes in its net assets and the financial highlights for the period from May 12, 2010 to October 31, 2010, in conformity with U.S. generally accepted accounting principles.

New York, New York
December 28, 2010
The Fund 33
INFORMATION ABOUT THE REVIEW AND APPROVAL
OF THE FUND’S MANAGEMENT AGREEMENT (Unaudited)
At a meeting of the fund’s Board held on March 2, 2010, the Board unanimously approved the fund’s Management Agreement, pursuant to which Dreyfus (the “Manager”) will provide the fund with investment management services, and the Sub-Investment Advisory Agreement between the Manager and Newton Capital Management Limited (the “Sub-Adviser”) (together, the “Agreements”), pursuant to which the Sub-Adviser will provide day-to-day management of the Fund’s portfolio.The Board members, none of whom are “interested persons” (as defined in the Investment Company Act of 1940, as amended) of the fund, were assisted in their review by independent legal counsel and met with counsel in executive session separate from representatives of the Manager and Sub-Adviser. In approving the Agreements, the Board considered all factors that it believed to be relevant, including, among other things, the factors discussed below.
Analysis of Nature, Extent and Quality of Services Provided to the Fund. The Board members received a presentation from representatives of the Manager regarding services provided to other funds in the Dreyfus fund complex, and discussed the nature, extent and quality of the services to be provided by the Manager and Sub-Adviser pursuant to their Agreements.The Manager’s representatives reviewed the relationships the Manager has with various intermediaries and the different needs of each. The Manager’s representatives noted the diverse methods of distribution among other funds in the Dreyfus fund complex, and the Manager’s corresponding need for broad, deep and diverse resources to be able to provide ongoing shareholder services to each distribution channel.
The Board members also considered the Sub-Adviser’s research and portfolio management capabilities and the Manager’s oversight of day-to-day fund operations, including fund accounting and administration and assistance in meeting legal and regulatory requirements.The Board members also considered the Manager’s extensive administrative, accounting and compliance infrastructure, as well as the Manager’s supervisory activities over the Sub-Adviser.The Board also considered
34
the Manager’s and Sub-Adviser’s brokerage policies and practices, the standards applied in seeking best execution and the Manager’s and Sub-Adviser’s policies and practices regarding soft dollars.
Comparative Analysis of the Fund’s Performance and Management Fee and Expense Ratio.As the fund had not yet commenced operations, the Board members were not able to review the fund’s performance.The Board discussed with representatives of the Manager the investment strategies to be employed in the management of the fund’s assets.The Board members noted the Manager’s and Sub-Adviser’s reputation and experience relevant to managing the fund.
The Board members reviewed the fund’s management fee and anticipated expense ratio and reviewed the management fees and expense ratios of funds in the Lipper Global Flexible Portfolio Funds category (the “Category”) and the average and median management fee ranges in the Category, as well as management fees and expense ratios of funds managed by the Manager, the Sub-Adviser or their affiliates in the Category (the “Expense Group”). The Board members noted that the fund’s contractual management fee was within the average and median management fee ranges for the funds in the Category and was lower than the management fees for the applicable funds in the Expense Group.The fund’s estimated expense ratio (as limited through at least May 1, 2011 by agreement with the Manager and excluding Rule 12b-1 fees, shareholder services fees and certain other expenses) was lower than the average and median expense ratios of the funds in the Category.
Representatives of the Manager reviewed with the Board members the fees paid by other accounts managed by the Manager, the Sub-Adviser or their affiliates with similar investment objectives, policies and strategies as the fund (the “Similar Accounts”), and explained the nature of the Similar Accounts and the differences, from the Manager’s and Sub-Adviser’s perspective, as applicable, in providing services to
The Fund 35
INFORMATION ABOUT THE REVIEW AND APPROVAL OF THE
FUND’S MANAGEMENT AGREEMENT (Unaudited) (continued)
the Similar Accounts as compared to the fund. The Board members considered the relevance of the fee information provided for the Similar Accounts to evaluate the appropriateness and reasonableness of the fund’s management and sub-investment advisory fees.
Analysis of Profitability and Economies of Scale. As the fund had not yet commenced operations, the Manager’s representatives were not able to review the dollar amount of expenses allocated and profit received by the Manager, or any economies of scale.The Board members considered potential benefits to the Manager and Sub-Adviser from acting as investment adviser and sub-investment adviser, respectively, and noted the possibility of soft dollar arrangements with respect to trading the fund’s portfolio.The Board members noted the uncertainty of the estimated asset levels and discussed the renewal requirements for advisory agreements and their ability to review the management fee and related profitability and any economies of scale annually after an initial term of the Agreements.
At the conclusion of these discussions, the Board agreed that it had been furnished with sufficient information to make an informed business decision with respect to approving the Agreements. Based on the discussions and considerations as described above, the Board made the following conclusions and determinations.
The Board concluded that the nature, extent and quality of the services to be provided by the Manager and Sub-Adviser are adequate and appropriate, especially considering the Manager’s and Sub-Adviser’s experience and reputation with respect to its investment approach and its experience and reputation with respect to investing in similar funds.
The Board concluded that, since the fund had not yet commenced operations, its performance could not be measured and was not a factor. The Board considered the Manager’s and Sub-Adviser’s experience and reputation.
36
The Board concluded that the fees to be paid to the Manager were reasonable, in light of the services to be provided, comparative expense and advisory fee information, and benefits anticipated to be derived by the Manager and Sub-Adviser from their relationship with the fund, and that the fee to be paid by the Manager to the Sub-Adviser was reasonable and appropriate.
The Board determined that because the fund had not commenced operations, economies of scale were not a factor, but, to the extent that material economies of scale are not shared with the fund in the future, the Board would seek to do so in connection with future renewals.
The Board members considered these conclusions and determinations, and, without any one factor being dispositive, the Board determined that approval of the Agreements was in the best interests of the fund and its shareholders.
The Fund 37
BOARD MEMBERS INFORMATION (Unaudited)

38
Once elected all Board Members serve for an indefinite term, but achieve Emeritus status upon reaching age 80.The address of the Board Members and Officers is in c/o The Dreyfus Corporation, 200 Park Avenue, NewYork, NewYork 10166.Additional information about the Board Members is available in the fund’s Statement of Additional Information which can be obtained from Dreyfus free of charge by calling this toll free number: 1-800-554-4611.
Dr. Paul A. Marks, Emeritus Board Member
Gloria Messinger, Emeritus Board Member
OFFICERS OF THE FUND (Unaudited)
BRADLEY J. SKAPYAK, President since
January 2010.
Chief Operating Officer and a director of the Manager since June 2009. From April 2003 to June 2009, Mr. Skapyak was the head of the Investment Accounting and Support Department of the Manager. He is an officer of 76 investment companies (comprised of 170 portfolios) managed by the Manager. He is 51 years old and has been an employee of the Manager since February 1988.
PHILLIP N. MAISANO, Executive Vice
President since July 2007.
Chief Investment Officer,Vice Chair and a director of the Manager, and an officer of 76 investment companies (comprised of 170 portfolios) managed by the Manager. Mr. Maisano also is an officer and/or Board member of certain other investment management subsidiaries of The Bank of New York Mellon Corporation, each of which is an affiliate of the Manager. He is 63 years old and has been an employee of the Manager since November 2006. Prior to joining the Manager, Mr. Maisano served as Chairman and Chief Executive Officer of EACM Advisors, an affiliate of the Manager, since August 2004.
MICHAEL A. ROSENBERG, Vice President
and Secretary since August 2005.
Assistant General Counsel of BNY Mellon, and an officer of 77 investment companies (comprised of 195 portfolios) managed by the Manager. He is 50 years old and has been an employee of the Manager since October 1991.
KIESHA ASTWOOD, Vice President and
Assistant Secretary since January 2010.
Counsel of BNY Mellon, and an officer of 77 investment companies (comprised of 195 portfolios) managed by the Manager. She is 37 years old and has been an employee of the Manager since July 1995.
JAMES BITETTO, Vice President and
Assistant Secretary since August 2005.
Senior Counsel of BNY Mellon and Secretary of the Manager, and an officer of 77 investment companies (comprised of 195 portfolios) managed by the Manager. He is 44 years old and has been an employee of the Manager since December 1996.
JONI LACKS CHARATAN, Vice President
and Assistant Secretary since
August 2005.
Senior Counsel of BNY Mellon, and an officer of 77 investment companies (comprised of 195 portfolios) managed by the Manager. She is 54 years old and has been an employee of the Manager since October 1988.
JOSEPH M. CHIOFFI, Vice President and
Assistant Secretary since August 2005.
Senior Counsel of BNY Mellon, and an officer of 77 investment companies (comprised of 195 portfolios) managed by the Manager. He is 48 years old and has been an employee of the Manager since June 2000.
KATHLEEN DENICHOLAS, Vice President
and Assistant Secretary since
January 2010.
Senior Counsel of BNY Mellon, and an officer of 77 investment companies (comprised of 195 portfolios) managed by the Manager. She is 36 years old and has been an employee of the Manager since February 2001.
JANETTE E. FARRAGHER, Vice President
and Assistant Secretary since
August 2005.
Assistant General Counsel of BNY Mellon, and an officer of 77 investment companies (comprised of 195 portfolios) managed by the Manager. She is 47 years old and has been an employee of the Manager since February 1984.
40
JOHN B. HAMMALIAN, Vice President and
Assistant Secretary since August 2005.
Managing Counsel of BNY Mellon, and an officer of 77 investment companies (comprised of 195 portfolios) managed by the Manager. He is 47 years old and has been an employee of the Manager since February 1991.
M. CRISTINA MEISER, Vice President and
Assistant Secretary since January 2010.
Senior Counsel of BNY Mellon, and an officer of 77 investment companies (comprised of 195 portfolios) managed by the Manager. She is 40 years old and has been an employee of the Manager since August 2001.
ROBERT R. MULLERY, Vice President and
Assistant Secretary since August 2005.
Managing Counsel of BNY Mellon, and an officer of 77 investment companies (comprised of 195 portfolios) managed by the Manager. He is 58 years old and has been an employee of the Manager since May 1986.
JEFF PRUSNOFSKY, Vice President and
Assistant Secretary since August 2005.
Managing Counsel of BNY Mellon, and an officer of 77 investment companies (comprised of 195 portfolios) managed by the Manager. He is 45 years old and has been an employee of the Manager since October 1990.
JAMES WINDELS, Treasurer since
November 2001.
Director – Mutual Fund Accounting of the Manager, and an officer of 77 investment companies (comprised of 195 portfolios) managed by the Manager. He is 52 years old and has been an employee of the Manager since April 1985.
RICHARD CASSARO, Assistant Treasurer
since January 2008.
Senior Accounting Manager – Money Market and Municipal Bond Funds of the Manager, and an officer of 77 investment companies (comprised of 195 portfolios) managed by the Manager. He is 51 years old and has been an employee of the Manager since September 1982.
GAVIN C. REILLY, Assistant Treasurer
since December 2005.
Tax Manager of the Investment Accounting and Support Department of the Manager, and an officer of 77 investment companies (comprised of 195 portfolios) managed by the Manager. He is 42 years old and has been an employee of the Manager since April 1991.
ROBERT ROBOL, Assistant Treasurer
since August 2005.
Senior Accounting Manager – Fixed Income Funds of the Manager, and an officer of 77 investment companies (comprised of 195 portfolios) managed by the Manager. He is 46 years old and has been an employee of the Manager since October 1988.
ROBERT SALVIOLO, Assistant Treasurer
since July 2007.
Senior Accounting Manager – Equity Funds of the Manager, and an officer of 77 investment companies (comprised of 195 portfolios) managed by the Manager. He is 43 years old and has been an employee of the Manager since June 1989.
The Fund 41
OFFICERS OF THE FUND (Unaudited) (continued)
ROBERT SVAGNA, Assistant Treasurer
since December 2002.
Senior Accounting Manager – Equity Funds of the Manager, and an officer of 77 investment companies (comprised of 195 portfolios) managed by the Manager. He is 43 years old and has been an employee of the Manager since November 1990.
JOSEPH W. CONNOLLY, Chief Compliance
Officer since October 2004.
Chief Compliance Officer of the Manager and The Dreyfus Family of Funds (77 investment companies, comprised of 195 portfolios). From November 2001 through March 2004, Mr. Connolly was first Vice-President, Mutual Fund Servicing for Mellon Global Securities Services. In that capacity, Mr. Connolly was responsible for managing Mellon’s Custody, Fund Accounting and Fund Administration services to third-party mutual fund clients. He is 53 years old and has served in various capacities with the Manager since 1980, including manager of the firm’s Fund Accounting Department from 1997 through
NATALIA GRIBAS, Anti-Money Laundering
Compliance Officer since July 2010.
Anti-Money Laundering Compliance Officer of the Distributor, and the Anti-Money Laundering Compliance Officer of 73 investment companies (comprised of 191 portfolios) managed by the Manager. She is 40 years old and has been an employee of the Distributor since September 2008.
42
For More Information
Telephone Call your financial representative or 1-800-554-4611
Mail The Dreyfus Family of Funds, 144 Glenn Curtiss Boulevard, Uniondale, NY 11556-0144
The fund files its complete schedule of portfolio holdings with the Securities and Exchange Commission (“SEC”) for the first and third quarters of each fiscal year on Form N-Q. The fund’s Forms N-Q are available on the SEC’s website at http://www.sec.gov and may be reviewed and copied at the SEC’s Public Reference Room in Washington, DC. Information on the operation of the Public Reference Room may be obtained by calling 1-800-SEC-0330.
A description of the policies and procedures that the fund uses to determine how to vote proxies relating to portfolio securities is available at http://www.dreyfus.com and on the SEC’s website at http://www.sec.gov. The description of the policies and procedures is also available without charge, upon request, by calling 1-800-645-6561.

|
| Dreyfus |
| Total Return |
| Advantage Fund |
ANNUAL REPORT October 31, 2010

Save time. Save paper. View your next shareholder report online as soon as it’s available. Log into www.dreyfus.com and sign up for Dreyfus eCommunications. It’s simple and only takes a few minutes.
The views expressed in this report reflect those of the portfolio manager only through the end of the period covered and do not necessarily represent the views of Dreyfus or any other person in the Dreyfus organization. Any such views are subject to change at any time based upon market or other conditions and Dreyfus disclaims any responsibility to update such views.These views may not be relied on as investment advice and, because investment decisions for a Dreyfus fund are based on numerous factors, may not be relied on as an indication of trading intent on behalf of any Dreyfus fund.

| | Contents |
| | THE FUND |
| 2 | A Letter from the Chairman and CEO |
| 3 | Discussion of Fund Performance |
| 6 | Fund Performance |
| 8 | Understanding Your Fund’s Expenses |
| 8 | Comparing Your Fund’s Expenses With Those of Other Funds |
| 9 | Statement of Investments |
| 28 | Statement of Financial Futures |
| 29 | Statement of Securities Sold Short |
| 30 | Statement of Assets and Liabilities |
| 31 | Statement of Operations |
| 32 | Statement of Changes in Net Assets |
| 34 | Financial Highlights |
| 37 | Notes to Financial Statements |
| 55 | Report of Independent Registered Public Accounting Firm |
| 56 | Important Tax Information |
| 57 | Information About the Review and Approval of the Fund’s Management Agreement |
| 59 | Board Members Information |
| 61 | Officers of the Fund |
| | FOR MORE INFORMATION |
| | Back Cover |
|
| Dreyfus |
| Total Return |
| Advantage Fund |
The Fund

A LETTER FROM THE CHAIRMAN AND CEO
Dear Shareholder:
We are pleased to present this annual report for Dreyfus Total Return Advantage Fund, covering the 12-month period from November 1, 2009, through October 31, 2010.
Although a double-dip recession has recently become an increasingly unlikely scenario in our analysis, persistent uncertainty regarding the breadth and strength of the U.S. economic recovery has led to bouts of heightened volatility throughout many areas of the U.S. bond market during the past year. Higher yielding market sectors, such as corporate debt and commercial mortgages, as well as bonds from international debt markets have fared relatively well as investors seek competitive levels of income in a low interest-rate environment.
Uncertainty will probably remain in the broader financial markets until we see more robust economic growth, but we expect generally favorable influences in the bond market to persist for some time to come. Record low short-term interest rates, improving corporate balance sheets, and investors’ global search for income could continue to support prices of higher yielding bonds, especially if today’s economic concerns prove to be overstated.With that, we strongly suggest that you meet with your financial advisor to discuss the potential opportunities which may exist in the global investment universe, as well as to evaluate your portfolio to help meet your individual investment needs and your future goals relative to your risk-tolerance level.
For information about how the fund performed during the reporting period, as well as general market perspectives, we provide a Discussion of Fund Performance on the pages that follow.
Thank you for your continued confidence and support.

Jonathan R. Baum
Chairman and Chief Executive Officer
The Dreyfus Corporation
November 15, 2010
2

DISCUSSION OF FUND PERFORMANCE
For the period of November 1, 2009, through October 31, 2010, as provided by David Kwan and Lowell Bennett, Portfolio Managers
Fund and Market Performance Overview
For the 12-month period ended October 31, 2010, Dreyfus Total Return Advantage Fund’s Class A shares achieved a total return of 8.74%, Class C shares returned 7.96% and Class I shares returned 9.00%.1 In comparison, the fund’s benchmark, the Barclays Capital U.S.Aggregate Index (the “Index”), produced a total return of 8.01% for the same period.2
The U.S. and global bond markets generally rallied amid heightened volatility as investors reacted to each new release of economic data. Performance was particularly strong among U.S. bonds later in the reporting period, when investors anticipated a new round of quantitative easing from the Federal Reserve Board (the “Fed”).The fund’s Class A and Class I shares produced higher returns than its benchmark, as our core U.S. bond strategy kept pace with the benchmark and our tactical exposures to global currencies and bonds provided additional return.
The Fund’s Investment Approach
The fund seeks to maximize total return from capital appreciation and income.To pursue its goal, the fund normally invests primarily in fixed income securities and other instruments that provide exposure to fixed income, including those that provide exposure to currency markets.
We employ an active core bond strategy, focused on the U.S. investment grade markets, which typically accounts for the bulk of the fund’s returns. We also look to the developed global bond and currency markets for opportunities to add value based on relative value while managing for risk.The fund typically will invest in bonds rated investment grade or the unrated equivalent, but we may invest up to 30% of assets in securities rated below investment grade at the time of purchase and up to 30% of its assets in emerging markets, though we have not done so in the past and do not anticipate doing so at this time.
The Fund 3
DISCUSSION OF FUND PERFORMANCE (continued)
Monetary Stimulus Boosted Bond Markets
The U.S. and global economies continued to recover from recession over the reporting period, but the pace of the expansion remained slower than historical averages. In addition, in the spring of 2010, investors responded cautiously to new economic concerns stemming primarily from a sovereign debt crisis in Europe.
Bonds encountered heightened volatility in this market environment. Higher yielding market sectors were buoyed early in the reporting period by expectations that conditions would improve for businesses and the U.S. housing market.These hopes were dashed for a time over the spring and summer of 2010, when renewed global instability kindled fears of a double-dip recession and sparked a “flight to quality” from higher yielding market sectors to traditional safe havens. Optimism returned in the fall, when it became clearer that a double-dip recession was unlikely and investors looked forward to the Fed’s purchase of $600 billion of U.S.Treasury securities. Consequently, bonds generally ended the reporting period with substantially positive total returns.
Interest Rates Strategies and Global Allocations Boosted Fund Returns
The fund received positive contributions to relative performance from its core bond strategy, which comprised the majority of the fund’s assets and generated the bulk of the returns. Results were particularly strong from tactical shifts in our interest rate strategy, in which we added value through a focus on bonds in the intermediate-term range, where the positive effects of falling interest rates were especially pronounced.The benefits of our interest-rate strategy were balanced to a degree by lagging results from our core sector allocation and security selection strategies, as bonds with relatively high credit ratings and short durations lagged lower quality, longer term securities.
Our global bond and currency strategies (implemented with futures and forwards respectively) also benefited the fund’s overall performance, with overweighted exposure to the U.S. bond market helping to cushion the brunt of weakness stemming from the European sovereign debt crisis. Finally, our currency strategy added value due to an underweighted position in the weakening U.S. dollar and a corresponding emphasis on the stronger Japanese yen. Later in the reporting period, overweighted positions in the Australian dollar and Swedish krona also fared well.
4
Uncertain Global Environment Ahead
Although we expect the economic recovery to persist, we are aware that there remains considerable uncertainty in the U.S. and global markets, and considerable uncertainty in the fiscal and monetary responses to economic conditions. In this environment we have reduced our risk appetite.Therefore, the fund ended the reporting period with a shorter duration than the benchmark, reflecting an emphasis on shorter-term maturities over longer-term bonds. Our core U.S bond positions include a focus on higher yielding shorter duration spread market sectors versus an underweight to U.S.Treasury securities. From a global allocation standpoint, we have maintained overweighted exposure to the U.S. bond market and underweighted positions in the United Kingdom and German bond markets. In global currencies we have recently placed a mild emphasis on the euro over the U.S. dollar and British pound.
November 15, 2010
| |
| | Bond funds are subject generally to interest rate, credit, liquidity and market risks, to varying |
| | degrees, all of which are more fully described in the fund’s prospectus. Generally, all other factors |
| | being equal, bond prices are inversely related to interest-rate changes, and rate increases can cause |
| | price declines. |
| | Foreign bonds are subject to special risks including exposure to currency fluctuations, changing |
| | political and economic conditions and potentially less liquidity. |
| | Investments in foreign currencies are subject to the risk that those currencies will decline in value |
| | relative to the U.S. dollar, or, in the case of hedged positions, that the U.S. dollar will decline |
| | relative to the currency being hedged. Currency rates in foreign countries may fluctuate significantly |
| | over short periods of time.A decline in the value of foreign currencies relative to the U.S. dollar |
| | will reduce the value of securities held by the fund and denominated in those currencies. |
| 1 | Total return includes reinvestment of dividends and any capital gains paid and does not take into |
| | consideration the maximum initial sales charge in the case of Class A shares or the applicable |
| | contingent deferred sales charge imposed on redemptions in the case of Class C shares. Had these |
| | charges been reflected, returns would have been lower. Class I shares are not subject to any initial |
| | or deferred sales charge. Past performance is no guarantee of future results. Share price and |
| | investment return fluctuate such that upon redemption, fund shares may be worth more or less |
| | than their original cost. Return figures provided reflect the absorption of certain fund expenses by |
| | The Dreyfus Corporation pursuant to an agreement in effect through March 1, 2012, at which |
| | time it may be extended, modified or terminated. Had these expenses not been absorbed, the |
| | fund’s returns would have been lower. |
| 2 | SOURCE: LIPPER INC. — Reflects reinvestment of dividends and, where applicable, capital |
| | gain distributions.The Barclays Capital U.S.Aggregate Index is a widely accepted, unmanaged |
| | total return index of corporate, U.S. government and U.S. government agency debt instruments, |
| | mortgage-backed securities and asset-backed securities with an average maturity of 1-10 years. |
| | Index returns do not reflect fees and expenses associated with operating a mutual fund. Investors |
| | cannot invest directly in any index. |
The Fund 5
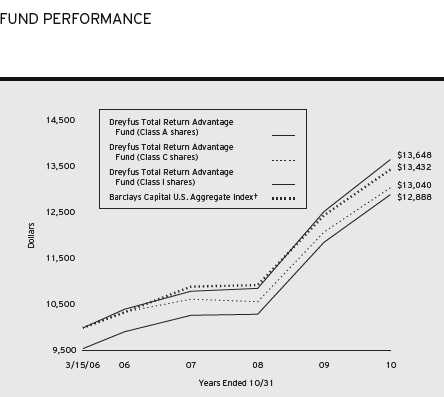
Comparison of change in value of $10,000 investment in Dreyfus Total Return Advantage Fund Class A shares, Class C shares and Class I shares and the Barclays Capital U.S. Aggregate Index
† Source: Lipper Inc.
Past performance is not predictive of future performance.
The above graph compares a $10,000 investment made in Class A, Class C and Class I shares of Dreyfus Total Return Advantage Fund on 3/15/06 (inception date) to a $10,000 investment made in the Barclays Capital U.S. Aggregate Index (the “Index”) on that date. For comparative purposes, the value of the Index on 2/28/06 is used as the beginning value on 3/15/06.All dividends and capital gain distributions are reinvested.
The fund invests primarily in fixed-income securities and instruments that provide investment exposure to fixed-income markets.The fund’s performance shown in the line graph takes into account the maximum initial sales charge on Class A shares and all other applicable fees and expenses on all classes.The Index is a widely accepted, unmanaged total return index of corporate, U.S. government and U.S. government agency debt instruments, mortgage-backed securities and asset-backed securities with an average maturity of 1-10 years. Unlike a mutual fund, the Index is not subject to charges, fees and other expenses. Investors cannot invest directly in any index. Further information relating to fund performance, including expense reimbursements, if applicable, is contained in the Financial Highlights section of the prospectus and elsewhere in this report.
6
| | | |
| Average Annual Total Returns as of 10/31/10 | | | |
| |
| | Inception | | From |
| | Date | 1 Year | Inception |
| Class A shares | | | |
| with maximum sales charge (4.5%) | 3/15/06 | 3.84% | 5.63% |
| without sales charge | 3/15/06 | 8.74% | 6.69% |
| Class C shares | | | |
| with applicable redemption charge † | 3/15/06 | 6.96% | 5.90% |
| without redemption | 3/15/06 | 7.96% | 5.90% |
| Class I shares | 3/15/06 | 9.00% | 6.95% |
| Barclays Capital U.S. Aggregate Index†† | 2/28/06 | 8.01% | 6.53% |
Past performance is not predictive of future performance.The fund’s performance shown in the graph and table does not reflect the deduction of taxes that a shareholder would pay on fund distributions or the redemption of fund shares.
| |
| † | The maximum contingent deferred sales charge for Class C shares is 1% for shares redeemed within one year of the |
| | date of purchase. |
| †† | For comparative purposes, the value of the Index as of 2/28/06 is used as the beginning value on 3/15/06. |
The Fund 7
UNDERSTANDING YOUR FUND’S EXPENSES (Unaudited)
As a mutual fund investor, you pay ongoing expenses, such as management fees and other expenses. Using the information below, you can estimate how these expenses affect your investment and compare them with the expenses of other funds.You also may pay one-time transaction expenses, including sales charges (loads) and redemption fees, which are not shown in this section and would have resulted in higher total expenses. For more information, see your fund’s prospectus or talk to your financial adviser.
Review your fund’s expenses
The table below shows the expenses you would have paid on a $1,000 investment in Dreyfus Total Return Advantage Fund from May 1, 2010 to October 31, 2010. It also shows how much a $1,000 investment would be worth at the close of the period, assuming actual returns and expenses.
Expenses and Value of a $1,000 Investment
assuming actual returns for the six months ended October 31, 2010
| | | |
| | Class A | Class C | Class I |
| Expenses paid per $1,000† | $ 4.41 | $ 8.29 | $ 3.12 |
| Ending value (after expenses) | $1,059.90 | $1,056.00 | $1,060.60 |
COMPARING YOUR FUND’S EXPENSES
WITH THOSE OF OTHER FUNDS (Unaudited)
Using the SEC’s method to compare expenses
The Securities and Exchange Commission (SEC) has established guidelines to help investors assess fund expenses. Per these guidelines, the table below shows your fund’s expenses based on a $1,000 investment, assuming a hypothetical 5% annualized return. You can use this information to compare the ongoing expenses (but not transaction expenses or total cost) of investing in the fund with those of other funds.All mutual fund shareholder reports will provide this information to help you make this comparison. Please note that you cannot use this information to estimate your actual ending account balance and expenses paid during the period.
Expenses and Value of a $1,000 Investment
assuming a hypothetical 5% annualized return for the six months ended October 31, 2010
| | | |
| | Class A | Class C | Class I |
| Expenses paid per $1,000† | $ 4.33 | $ 8.13 | $ 3.06 |
| Ending value (after expenses) | $1,020.92 | $1,017.14 | $1,022.18 |
|
| † Expenses are equal to the fund’s annualized expense ratio of .85% for Class A, 1.60% for Class C and .60% |
| for Class I, multiplied by the average account value over the period, multiplied by 184/365 (to reflect the one-half |
| year period). |
8
STATEMENT OF INVESTMENTS
October 31, 2010
| | | | | |
| | Coupon | Maturity | Principal | | |
| Bonds and Notes—111.0% | Rate (%) | Date | Amount ($) | | Value ($) |
| Aerospace & Defense—.2% | | | | | |
| Boeing, | | | | | |
| Sr. Unscd. Notes | 3.75 | 11/20/16 | 75,000 | | 82,591 |
| United Technologies, | | | | | |
| Sr. Unscd. Notes | 6.13 | 7/15/38 | 35,000 | | 41,267 |
| | | | | | 123,858 |
| Agriculture—.4% | | | | | |
| Altria Group, | | | | | |
| Gtd. Notes | 8.50 | 11/10/13 | 88,000 | | 106,159 |
| Altria Group, | | | | | |
| Gtd. Notes | 9.95 | 11/10/38 | 50,000 | | 72,246 |
| Reynolds American, | | | | | |
| Gtd. Notes | 7.63 | 6/1/16 | 75,000 | | 88,389 |
| | | | | | 266,794 |
| Asset—Backed Certificates—.8% | | | | | |
| SLM Student Loan Trust, | | | | | |
| Ser. 2007-2, Cl. A2 | 0.29 | 7/25/17 | 266,100 | a | 264,776 |
| SLM Student Loan Trust, | | | | | |
| Ser. 2003-7, Cl. A4 | 0.49 | 3/15/19 | 262,661 | a | 262,584 |
| | | | | | 527,360 |
| Asset-Backed Ctfs./ | | | | | |
| Auto Receivables—.5% | | | | | |
| Americredit Automobile Receivables | | | | | |
| Trust, Ser. 2007-CM, Cl. A4A | 5.55 | 4/7/14 | 49,446 | | 51,496 |
| Americredit Automobile Receivables | | | | | |
| Trust, Ser. 2007-DF, Cl. A4A | 5.56 | 6/6/14 | 58,005 | | 61,053 |
| Nissan Auto Receivables Owner | | | | | |
| Trust, Ser. 2007-B, Cl. A4 | 5.16 | 3/17/14 | 188,868 | | 194,379 |
| | | | | | 306,928 |
| Asset-Backed Ctfs./Credit Cards—3.4% | | | | |
| Bank One Issuance Trust, | | | | | |
| Ser. 2004-A7, Cl. A7 | 0.38 | 5/15/14 | 226,000 | a | 225,927 |
| Capital One Multi-Asset Execution | | | | | |
| Trust, Ser. 2004-A7, Cl. A7 | 0.53 | 6/16/14 | 761,000 | a | 758,920 |
| Capital One Multi-Asset Execution | | | | | |
| Trust, Ser. 2006-A10, Cl. A10 | 5.15 | 6/16/14 | 80,000 | | 82,889 |
| Chase Issuance Trust, | | | | | |
| Ser. 2005-A13, Cl. A13 | 0.30 | 2/15/13 | 300,000 | a | 299,983 |
| Chase Issuance Trust, | | | | | |
| Ser. 2006-A1, Cl. A | 0.30 | 4/15/13 | 250,000 | a | 249,966 |
The Fund 9
STATEMENT OF INVESTMENTS (continued)
| | | | | |
| | Coupon | Maturity | Principal | | |
| Bonds and Notes (continued) | Rate (%) | Date | Amount ($) | | Value ($) |
| Asset-Backed Ctfs./ | | | | | |
| Credit Cards (continued) | | | | | |
| Chase Issuance Trust, | | | | | |
| Ser. 2007-A10, Cl. A10 | 0.30 | 6/16/14 | 114,000 | a | 113,741 |
| Discover Card Master Trust I, | | | | | |
| Ser. 2006-2, Cl. A2 | 0.29 | 1/16/14 | 318,000 | a | 317,675 |
| MBNA Credit Card Master Note | | | | | |
| Trust, Ser. 2002-A3, Cl. A3 | 0.50 | 9/15/14 | 200,000 | a | 200,047 |
| | | | | | 2,249,148 |
| Asset-Backed Ctfs./ | | | | | |
| Home Equity Loans—.1% | | | | | |
| Residential Asset Mortgage | | | | | |
| Products, Ser. 2003-RZ4, Cl. A7 | 4.79 | 6/25/33 | 62,495 | a | 62,229 |
| Automotive—.3% | | | | | |
| Daimler Finance North America, | | | | | |
| Gtd. Notes | 8.50 | 1/18/31 | 45,000 | | 60,430 |
| Johnson Controls, | | | | | |
| Sr. Unscd. Notes | 5.50 | 1/15/16 | 100,000 | | 113,672 |
| | | | | | 174,102 |
| Banks—10.5% | | | | | |
| Asian Development Bank, | | | | | |
| Sr. Unscd. Notes | 2.75 | 5/21/14 | 65,000 | | 69,361 |
| Bank of America, | | | | | |
| Sr. Unscd. Notes, Ser. L | 5.65 | 5/1/18 | 40,000 | | 42,164 |
| Bank of America, | | | | | |
| Sr. Unscd. Notes | 5.75 | 12/1/17 | 40,000 | | 42,456 |
| Bank of America, | | | | | |
| Sub. Notes | 7.25 | 10/15/25 | 65,000 | | 71,959 |
| Bank of Nova Scotia, | | | | | |
| Sr. Unscd. Notes | 2.38 | 12/17/13 | 400,000 | | 417,140 |
| Barclays Bank, | | | | | |
| Sr. Unscd. Notes | 3.90 | 4/7/15 | 250,000 | | 268,161 |
| Barclays Bank, | | | | | |
| Sr. Unscd. Notes | 5.20 | 7/10/14 | 370,000 | | 412,634 |
| BB&T, | | | | | |
| Sub. Notes | 6.50 | 8/1/11 | 100,000 | | 104,282 |
| Capital One Financial, | | | | | |
| Sr. Unscd. Notes | 7.38 | 5/23/14 | 125,000 | | 146,204 |
| China Development Bank, | | | | | |
| Sr. Unscd. Notes | 4.75 | 10/8/14 | 25,000 | | 27,326 |
10
| | | | |
| | Coupon | Maturity | Principal | |
| Bonds and Notes (continued) | Rate (%) | Date | Amount ($) | Value ($) |
| Banks (continued) | | | | |
| Citigroup, | | | | |
| Sub. Notes | 5.00 | 9/15/14 | 30,000 | 31,470 |
| Citigroup, | | | | |
| Sr. Unscd. Notes | 5.13 | 5/5/14 | 50,000 | 53,926 |
| Citigroup, | | | | |
| Sub. Notes | 5.50 | 2/15/17 | 65,000 | 68,734 |
| Citigroup, | | | | |
| Sr. Unscd. Notes | 6.00 | 12/13/13 | 400,000 | 442,754 |
| Citigroup, | | | | |
| Sr. Unscd. Notes | 6.00 | 8/15/17 | 50,000 | 55,202 |
| Citigroup, | | | | |
| Sr. Unscd. Notes | 6.13 | 11/21/17 | 75,000 | 83,598 |
| Citigroup, | | | | |
| Sr. Unscd. Notes | 6.88 | 3/5/38 | 26,000 | 28,941 |
| Comerica Bank, | | | | |
| Sub. Notes | 5.75 | 11/21/16 | 15,000 | 16,932 |
| Corp. Andina de Fomento, | �� | | | |
| Sr. Unscd. Notes | 5.20 | 5/21/13 | 125,000 | 135,389 |
| Credit Suisse New York, | | | | |
| Sr. Unscd. Notes | 3.50 | 3/23/15 | 150,000 | 158,950 |
| Deutsche Bank AG London, | | | | |
| Sr. Unscd. Notes | 3.45 | 3/30/15 | 350,000 | 371,963 |
| Deutsche Bank AG London, | | | | |
| Sr. Unscd. Notes | 5.38 | 10/12/12 | 50,000 | 54,436 |
| Deutsche Bank AG London, | | | | |
| Sr. Unscd. Notes | 6.00 | 9/1/17 | 10,000 | 11,680 |
| European Investment Bank, | | | | |
| Notes | 2.00 | 2/10/12 | 150,000 | 153,068 |
| European Investment Bank, | | | | |
| Sr. Unscd. Notes | 3.00 | 4/8/14 | 150,000 | 160,838 |
| European Investment Bank, | | | | |
| Sr. Unscd. Bonds | 5.13 | 5/30/17 | 140,000 | 165,927 |
| Export-Import Bank of Korea, | | | | |
| Sr. Unscd. Notes | 8.13 | 1/21/14 | 90,000 | 105,970 |
| Fifth Third Bancorp, | | | | |
| Sr. Unscd. Notes | 6.25 | 5/1/13 | 30,000 | 33,066 |
| Goldman Sachs Group, | | | | |
| Sr. Unscd. Notes | 5.25 | 10/15/13 | 275,000 | 300,953 |
The Fund 11
STATEMENT OF INVESTMENTS (continued)
| | | | |
| | Coupon | Maturity | Principal | |
| Bonds and Notes (continued) | Rate (%) | Date | Amount ($) | Value ($) |
| Banks (continued) | | | | |
| Goldman Sachs Group, | | | | |
| Sr. Unscd. Notes | 5.95 | 1/18/18 | 26,000 | 28,936 |
| Goldman Sachs Group, | | | | |
| Sr. Unscd. Notes | 6.15 | 4/1/18 | 65,000 | 72,894 |
| Goldman Sachs Group, | | | | |
| Sub. Notes | 6.75 | 10/1/37 | 60,000 | 63,112 |
| Goldman Sachs Group, | | | | |
| Sr. Unscd. Notes | 7.50 | 2/15/19 | 100,000 | 120,567 |
| HSBC Bank USA, | | | | |
| Sub. Notes | 4.63 | 4/1/14 | 100,000 | 107,305 |
| HSBC Holdings, | | | | |
| Sub. Notes | 5.25 | 12/12/12 | 50,000 | 53,611 |
| JPMorgan Chase & Co., | | | | |
| Sr. Unscd. Notes | 3.70 | 1/20/15 | 300,000 | 317,546 |
| JPMorgan Chase & Co., | | | | |
| Sr. Unscd. Notes | 6.00 | 1/15/18 | 35,000 | 40,011 |
| JPMorgan Chase & Co., | | | | |
| Sr. Unscd. Notes | 6.30 | 4/23/19 | 50,000 | 58,449 |
| JPMorgan Chase & Co., | | | | |
| Sr. Unscd. Notes | 6.40 | 5/15/38 | 25,000 | 28,542 |
| Korea Development Bank, | | | | |
| Sr. Unscd. Notes | 8.00 | 1/23/14 | 100,000 | 117,815 |
| Landesbank | | | | |
| Baden-Wuerttemberg, | | | | |
| Sub. Notes | 6.35 | 4/1/12 | 215,000 | 231,117 |
| Landwirtschaftliche Rentenbank, | | | | |
| Gov’t. Gtd. Notes | 4.13 | 7/15/13 | 25,000 | 27,224 |
| Morgan Stanley, | | | | |
| Sr. Unscd. Notes | 4.10 | 1/26/15 | 175,000 | 181,519 |
| Morgan Stanley, | | | | |
| Sr. Unscd. Notes | 4.20 | 11/20/14 | 150,000 | 156,089 |
| Morgan Stanley, | | | | |
| Sub. Notes | 4.75 | 4/1/14 | 85,000 | 88,810 |
| Morgan Stanley, | | | | |
| Sr. Unscd. Notes | 5.30 | 3/1/13 | 50,000 | 53,993 |
| Morgan Stanley, | | | | |
| Sr. Unscd. Notes | 6.00 | 4/28/15 | 150,000 | 166,896 |
| Morgan Stanley, | | | | |
| Sr. Unscd. Notes | 6.63 | 4/1/18 | 75,000 | 84,367 |
12
| | | | |
| | Coupon | Maturity | Principal | |
| Bonds and Notes (continued) | Rate (%) | Date | Amount ($) | Value ($) |
| Banks (continued) | | | | |
| National City Bank, | | | | |
| Sub. Notes | 6.20 | 12/15/11 | 100,000 | 105,689 |
| PNC Funding, | | | | |
| Bank Gtd. Notes | 5.63 | 2/1/17 | 15,000 | 16,462 |
| Royal Bank of Scotland Group, | | | | |
| Sr. Unscd. Notes | 6.40 | 10/21/19 | 100,000 | 109,267 |
| Sovereign Bank, | | | | |
| Sub. Notes | 8.75 | 5/30/18 | 50,000 | 58,888 |
| Suntrust Banks, | | | | |
| Sr. Unscd. Notes | 6.00 | 9/11/17 | 50,000 | 53,893 |
| UBS AG/Stamford, | | | | |
| Sr. Unscd. Notes | 4.88 | 8/4/20 | 50,000 | 53,712 |
| Wachovia, | | | | |
| Sub. Notes | 5.63 | 10/15/16 | 25,000 | 27,901 |
| Wells Fargo & Co., | | | | |
| Sr. Unscd. Notes | 5.25 | 10/23/12 | 20,000 | 21,646 |
| Wells Fargo & Co., | | | | |
| Sr. Unscd. Notes | 5.30 | 8/26/11 | 30,000 | 31,168 |
| Wells Fargo & Co., | | | | |
| Sr. Unscd. Notes | 5.38 | 2/7/35 | 25,000 | 25,397 |
| Wells Fargo & Co., | | | | |
| Sr. Unscd. Notes | 5.63 | 12/11/17 | 55,000 | 62,266 |
| Wells Fargo Capital X, | | | | |
| Gtd. Cap. Secs. | 5.95 | 12/1/86 | 20,000 a | 18,732 |
| Westpac Banking, | | | | |
| Sr. Unscd. Notes | 4.20 | 2/27/15 | 350,000 | 380,368 |
| | | | | 6,999,676 |
| Building & Construction—.2% | | | | |
| CRH America, | | | | |
| Gtd. Notes | 6.00 | 9/30/16 | 100,000 | 112,524 |
| Chemicals-Fibers & Diversified—.5% | | | | |
| Dow Chemical, | | | | |
| Sr. Unscd. Notes | 5.90 | 2/15/15 | 100,000 | 112,792 |
| E.I. Du Pont De Nemours, | | | | |
| Sr. Unscd. Notes | 6.00 | 7/15/18 | 100,000 | 119,969 |
| Rohm and Haas, | | | | |
| Sr. Unscd. Notes | 6.00 | 9/15/17 | 75,000 | 84,006 |
| | | | | 316,767 |
The Fund 13
STATEMENT OF INVESTMENTS (continued)
| | | | | |
| | Coupon | Maturity | Principal | | |
| Bonds and Notes (continued) | Rate (%) | Date | Amount ($) | | Value ($) |
| Commercial Mortgage | | | | | |
| Pass-Through Ctfs.—6.5% | | | | | |
| Banc of America Commercial | | | | | |
| Mortgage, Ser. 2005-1, Cl. A4 | 5.06 | 11/10/42 | 200,000 | a | 211,414 |
| Bear Stearns Commercial Mortgage | | | | | |
| Securities, Ser. 2007-PW16, Cl. A4 | 5.72 | 6/11/40 | 250,000 | a | 271,229 |
| Bear Stearns Commercial Mortgage | | | | | |
| Securities, Ser. 2002-TOP6, Cl. A2 | 6.46 | 10/15/36 | 473,745 | | 498,595 |
| Credit Suisse Mortgage Capital | | | | | |
| Certificates, Ser. 2007-C1, Cl. A3 | 5.38 | 2/15/40 | 250,000 | | 252,543 |
| Credit Suisse Mortgage Capital | | | | | |
| Certificates, Ser. 2006-C3, Cl. A3 | 5.83 | 6/15/38 | 100,000 | a | 109,946 |
| GE Capital Commercial Mortgage, | | | | | |
| Ser. 2005-C3, Cl. AAB | 4.94 | 7/10/45 | 196,510 | | 208,234 |
| GS Mortgage Securities Corporation | | | | | |
| II, Ser. 2004-GG2, Cl. A3 | 4.60 | 8/10/38 | 51,479 | | 51,910 |
| GS Mortgage Securities Corporation | | | | | |
| II, Ser. 2005-GG4, Cl. A4 | 4.76 | 7/10/39 | 450,000 | | 470,636 |
| JP Morgan Chase Commercial | | | | | |
| Mortgage Securities, | | | | | |
| Ser. 2003-CB7, Cl. A4 | 4.88 | 1/12/38 | 350,000 | | 376,068 |
| JP Morgan Chase Commercial | | | | | |
| Mortgage Securities, | | | | | |
| Ser. 2005-LDP3, Cl. A4A | 4.94 | 8/15/42 | 102,000 | a | 110,302 |
| LB-UBS Commercial Mortgage Trust, | | | | | |
| Ser. 2004-C7, Cl. A1A | 4.48 | 10/15/29 | 355,010 | | 368,070 |
| Merrill Lynch/Countrywide | | | | | |
| Commercial Mortgage Trust, | | | | | |
| Ser. 2007-5, Cl. A3 | 5.36 | 8/12/48 | 100,000 | | 103,655 |
| Merrill Lynch/Countrywide | | | | | |
| Commercial Mortgage Trust, | | | | | |
| Ser. 2006-2, Cl. A4 | 5.91 | 6/12/46 | 100,000 | a | 111,838 |
| Morgan Stanley Capital I, | | | | | |
| Ser. 2003-IQ4, Cl. A2 | 4.07 | 5/15/40 | 350,000 | | 365,816 |
| Morgan Stanley Capital I, | | | | | |
| Ser. 2006-T21, Cl. A3 | 5.19 | 10/12/52 | 110,000 | a | 116,164 |
| Morgan Stanley Capital I, | | | | | |
| Ser. 2005-HQ7, Cl. A2 | 5.21 | 11/14/42 | 400,000 | a | 415,313 |
| Morgan Stanley Capital I, | | | | | |
| Ser. 2006-HQ8, Cl. AJ | 5.47 | 3/12/44 | 65,000 | a | 55,897 |
14
| | | | |
| | Coupon | Maturity | Principal | |
| Bonds and Notes (continued) | Rate (%) | Date | Amount ($) | Value ($) |
| Commercial Mortgage | | | | |
| Pass-Through Ctfs. (continued) | | | | |
| Morgan Stanley Dean Witter Capital | | | | |
| I, Ser. 2003-HQ2, Cl. A1 | 4.18 | 3/12/35 | 81,094 | 83,833 |
| Wachovia Bank Commercial Mortgage | | | | |
| Trust, Ser. 2005-C16, Cl. A2 | 4.38 | 10/15/41 | 17,926 | 18,412 |
| Wachovia Bank Commercial Mortgage | | | | |
| Trust, Ser. 2003-C8, Cl. A3 | 4.45 | 11/15/35 | 150,000 | 155,173 |
| | | | | 4,355,048 |
| Consumer Discretionary—.2% | | | | |
| Kimberly-Clark, | | | | |
| Sr. Unscd. Notes | 6.13 | 8/1/17 | 100,000 | 121,673 |
| Diversified Financial Services—3.2% | | | | |
| American Express Credit, | | | | |
| Sr. Unscd. Notes | 5.13 | 8/25/14 | 135,000 | 149,155 |
| American Express Credit, | | | | |
| Sr. Unscd. Notes, Ser. C | 7.30 | 8/20/13 | 250,000 | 286,069 |
| Ameriprise Financial, | | | | |
| Sr. Unscd. Notes | 5.65�� | 11/15/15 | 15,000 | 17,151 |
| Bear Stearns, | | | | |
| Sr. Unscd. Notes | 5.70 | 11/15/14 | 100,000 | 114,037 |
| Bear Stearns, | | | | |
| Sr. Unscd. Notes | 6.40 | 10/2/17 | 10,000 | 11,679 |
| Blackrock, | | | | |
| Sr. Unscd. Notes | 6.25 | 9/15/17 | 10,000 | 11,803 |
| Capital One Capital V, | | | | |
| Gtd. Notes | 10.25 | 8/15/39 | 20,000 | 21,825 |
| Caterpillar Financial Services, | | | | |
| Sr. Unscd. Notes | 6.13 | 2/17/14 | 400,000 | 461,848 |
| Caterpillar Financial Services, | | | | |
| Sr. Unscd. Notes | 7.15 | 2/15/19 | 100,000 | 128,699 |
| Credit Suisse USA, | | | | |
| Bank Gtd. Notes | 4.88 | 1/15/15 | 50,000 | 55,707 |
| Credit Suisse USA, | | | | |
| Bank Gtd. Notes | 6.13 | 11/15/11 | 110,000 | 116,133 |
| Credit Suisse USA, | | | | |
| Bank Gtd. Notes | 6.50 | 1/15/12 | 100,000 | 106,842 |
| General Electric Capital, | | | | |
| Sr. Unscd. Notes | 5.63 | 5/1/18 | 65,000 | 72,750 |
The Fund 15
STATEMENT OF INVESTMENTS (continued)
| | | | |
| | Coupon | Maturity | Principal | |
| Bonds and Notes (continued) | Rate (%) | Date | Amount ($) | Value ($) |
| Diversified Financial | | | | |
| Services (continued) | | | | |
| General Electric Capital, | | | | |
| Sr. Unscd. Notes | 5.88 | 1/14/38 | 105,000 | 107,148 |
| General Electric Capital, | | | | |
| Sr. Unscd. Notes | 6.88 | 1/10/39 | 50,000 | 57,681 |
| HSBC Finance, | | | | |
| Sr. Unscd. Notes | 5.25 | 4/15/15 | 50,000 | 54,988 |
| MBNA, | | | | |
| Sr. Unscd. Notes | 5.00 | 6/15/15 | 50,000 | 53,112 |
| Merrill Lynch & Co., | | | | |
| Sr. Unscd. Notes | 6.40 | 8/28/17 | 20,000 | 21,821 |
| Merrill Lynch & Co., | | | | |
| Notes | 6.88 | 4/25/18 | 100,000 | 112,402 |
| Simon Property Group, | | | | |
| Sr. Unscd. Notes | 10.35 | 4/1/19 | 100,000 | 141,576 |
| | | | | 2,102,426 |
| Diversified Metals & Mining—.7% | | | | |
| Alcoa, | | | | |
| Sr. Unscd. Notes | 5.55 | 2/1/17 | 29,000 | 30,807 |
| BHP Billiton Finance USA, | | | | |
| Gtd. Bonds | 5.00 | 12/15/10 | 75,000 | 75,398 |
| BHP Billiton Finance USA, | | | | |
| Gtd. Notes | 5.50 | 4/1/14 | 150,000 | 170,000 |
| Newmont Mining, | | | | |
| Gtd. Notes | 5.13 | 10/1/19 | 100,000 | 113,615 |
| Vale Overseas, | | | | |
| Gtd. Notes | 6.25 | 1/23/17 | 35,000 | 40,544 |
| Vale Overseas, | | | | |
| Gtd. Notes | 6.88 | 11/21/36 | 50,000 | 57,101 |
| | | | | 487,465 |
| Electric Utilities—2.1% | | | | |
| Ameren Energy Generating, | | | | |
| Sr. Unscd. Notes, Ser. H | 7.00 | 4/15/18 | 25,000 | 26,043 |
| Consolidated Edison of NY, | | | | |
| Sr. Unscd. Debs., Ser. 05-C | 5.38 | 12/15/15 | 20,000 | 23,451 |
| Constellation Energy Group, | | | | |
| Sr. Unscd. Notes | 7.60 | 4/1/32 | 50,000 | 60,448 |
16
| | | | |
| | Coupon | Maturity | Principal | |
| Bonds and Notes (continued) | Rate (%) | Date | Amount ($) | Value ($) |
| Electric Utilities (continued) | | | | |
| Dominion Resources, | | | | |
| Sr. Unscd. Notes, Ser. F | 5.25 | 8/1/33 | 48,000 | 54,963 |
| Dominion Resources, | | | | |
| Sr. Unscd. Notes, Ser. B | 5.95 | 6/15/35 | 50,000 | 55,008 |
| DTE Energy, | | | | |
| Sr. Unscd. Notes | 7.05 | 6/1/11 | 75,000 | 77,713 |
| Duke Energy Carolinas, | | | | |
| Sr. Unscd. Notes | 6.25 | 1/15/12 | 50,000 | 53,364 |
| Duke Energy, | | | | |
| Sr. Unscd. Notes | 6.30 | 2/1/14 | 100,000 | 114,707 |
| Enersis, | | | | |
| Sr. Unscd. Notes | 7.40 | 12/1/16 | 75,000 | 88,228 |
| Exelon, | | | | |
| Sr. Unscd. Notes | 4.90 | 6/15/15 | 50,000 | 55,138 |
| FirstEnergy, | | | | |
| Sr. Unscd. Notes, Ser. C | 7.38 | 11/15/31 | 50,000 | 53,942 |
| FPL Group Capital, | | | | |
| Gtd. Debs. | 7.88 | 12/15/15 | 100,000 | 125,241 |
| Hydro-Quebec, | | | | |
| Gov't. Gtd. Debs., Ser. HY | 8.40 | 1/15/22 | 60,000 | 86,771 |
| Indiana Michigan Power, | | | | |
| Sr. Unscd. Notes | 7.00 | 3/15/19 | 50,000 | 61,216 |
| Nevada Power, | | | | |
| Mortgage Notes | 7.13 | 3/15/19 | 50,000 | 61,861 |
| Pacific Gas & Electric, | | | | |
| Sr. Unscd. Bonds | 6.05 | 3/1/34 | 50,000 | 56,271 |
| Progress Energy, | | | | |
| Sr. Unscd. Notes | 7.10 | 3/1/11 | 150,000 | 153,129 |
| SCANA, | | | | |
| Sr. Unscd. Notes | 6.88 | 5/15/11 | 50,000 | 51,584 |
| Southern California Edison, | | | | |
| First Mortgage Bonds, Ser. 05-A | 5.00 | 1/15/16 | 35,000 | 40,390 |
| Southern Power, | | | | |
| Sr. Unscd. Notes, Ser. D | 4.88 | 7/15/15 | 50,000 | 56,472 |
| SouthWestern Public Service, | | | | |
| Sr. Unscd. Notes, Ser. G | 8.75 | 12/1/18 | 50,000 | 64,299 |
| | | | | 1,420,239 |
The Fund 17
STATEMENT OF INVESTMENTS (continued)
| | | | |
| | Coupon | Maturity | Principal | |
| Bonds and Notes (continued) | Rate (%) | Date | Amount ($) | Value ($) |
| Food & Beverages—1.2% | | | | |
| Anheuser-Busch InBev Worldwide, | | | | |
| Gtd. Notes | 4.13 | 1/15/15 | 100,000 | 108,622 |
| Bottling Group, | | | | |
| Gtd. Notes | 6.95 | 3/15/14 | 100,000 | 118,832 |
| Coca-Cola Enterprises, | | | | |
| Sr. Unscd. Debs. | 8.50 | 2/1/22 | 50,000 | 70,743 |
| Coca-Cola, | | | | |
| Sr. Unscd. Notes | 5.35 | 11/15/17 | 100,000 | 117,592 |
| General Mills, | | | | |
| Sr. Unscd. Notes | 6.00 | 2/15/12 | 90,000 | 96,006 |
| H.J. Heinz, | | | | |
| Gtd. Notes | 6.63 | 7/15/11 | 50,000 a | 52,044 |
| Kellogg, | | | | |
| Sr. Unscd. Notes | 5.13 | 12/3/12 | 100,000 | 108,598 |
| Kraft Foods, | | | | |
| Sr. Unscd. Notes | 6.13 | 2/1/18 | 100,000 | 117,978 |
| PepsiCo, | | | | |
| Sr. Unscd. Notes | 5.15 | 5/15/12 | 25,000 | 26,669 |
| | | | | 817,084 |
| Foreign/Governmental—2.1% | | | | |
| Federal Republic of Brazil, | | | | |
| Sr. Unscd. Bonds | 6.00 | 1/17/17 | 100,000 | 118,549 |
| Federal Republic of Brazil, | | | | |
| Unscd. Bonds | 10.13 | 5/15/27 | 75,000 | 123,938 |
| KFW, | | | | |
| Gov't. Gtd. Bonds | 4.00 | 1/27/20 | 200,000 | 221,824 |
| Oesterreichische Kontrollbank, | | | | |
| Gov't. Gtd. Bonds | 4.75 | 10/16/12 | 250,000 | 269,943 |
| Province of Manitoba Canada, | | | | |
| Sr. Unscd. Debs., Ser. FH | 4.90 | 12/6/16 | 5,000 | 5,783 |
| Province of Ontario Canada, | | | | |
| Sr. Unscd. Bonds | 4.40 | 4/14/20 | 160,000 | 176,382 |
| Province of Quebec Canada, | | | | |
| Unscd. Debs., Ser. PD | 7.50 | 9/15/29 | 50,000 | 69,550 |
| Republic of Chile, | | | | |
| Sr. Unscd. Bonds | 7.13 | 1/11/12 | 110,000 | 118,018 |
| Republic of Italy, | | | | |
| Sr. Unscd. Notes | 5.38 | 6/15/33 | 50,000 | 50,739 |
18
| | | | |
| | Coupon | Maturity | Principal | |
| Bonds and Notes (continued) | Rate (%) | Date | Amount ($) | Value ($) |
| Foreign/Governmental (continued) | | | | |
| Republic of Italy, | | | | |
| Sr. Unscd. Notes | 6.88 | 9/27/23 | 50,000 | 60,596 |
| Republic of Peru, | | | | |
| Sr. Unscd. Bonds | 8.75 | 11/21/33 | 36,000 | 55,188 |
| United Mexican States, | | | | |
| Notes | 5.95 | 3/19/19 | 56,000 | 66,668 |
| United Mexican States, | | | | |
| Sr. Unscd. Notes | 6.63 | 3/3/15 | 50,000 | 59,275 |
| | | | | 1,396,453 |
| Health Care—1.7% | | | | |
| Abbott Laboratories, | | | | |
| Sr. Unscd. Notes | 6.15 | 11/30/37 | 50,000 | 58,852 |
| Aetna, | | | | |
| Sr. Unscd. Notes | 6.00 | 6/15/16 | 15,000 | 17,730 |
| Astrazeneca, | | | | |
| Sr. Unscd. Notes | 5.40 | 6/1/14 | 25,000 | 28,546 |
| Astrazeneca, | | | | |
| Sr. Unscd. Notes | 5.90 | 9/15/17 | 10,000 | 11,987 |
| Astrazeneca, | | | | |
| Sr. Unscd. Notes | 6.45 | 9/15/37 | 30,000 | 36,737 |
| Bristol-Myers Squibb, | | | | |
| Sr. Unscd. Notes | 5.88 | 11/15/36 | 40,000 | 45,541 |
| GlaxoSmithKline Capital, | | | | |
| Gtd. Bonds | 5.65 | 5/15/18 | 100,000 | 118,607 |
| Merck & Co., | | | | |
| Sr. Unscd. Notes | 4.38 | 2/15/13 | 100,000 | 107,814 |
| Merck & Co., | | | | |
| Gtd. Notes | 6.50 | 12/1/33 | 50,000 a | 62,006 |
| Pfizer, | | | | |
| Sr. Unscd. Notes | 7.20 | 3/15/39 | 50,000 | 66,622 |
| Teva Pharmaceutical Finance, | | | | |
| Gtd. Notes | 3.00 | 6/15/15 | 350,000 | 367,775 |
| UnitedHealth Group, | | | | |
| Sr. Unscd. Notes | 5.25 | 3/15/11 | 20,000 | 20,320 |
| UnitedHealth Group, | | | | |
| Sr. Unscd. Notes | 5.38 | 3/15/16 | 26,000 | 29,776 |
| Wyeth, | | | | |
| Gtd. Notes | 5.50 | 2/1/14 | 100,000 | 113,831 |
The Fund 19
STATEMENT OF INVESTMENTS (continued)
| | | | |
| | Coupon | Maturity | Principal | |
| Bonds and Notes (continued) | Rate (%) | Date | Amount ($) | Value ($) |
| Health Care (continued) | | | | |
| Wyeth, | | | | |
| Gtd. Notes | 6.95 | 3/15/11 | 50,000 a | 51,218 |
| | | | | 1,137,362 |
| Industrial—.4% | | | | |
| Deere & Co. | | | | |
| Sr. Unscd. Notes | 4.38 | 10/16/19 | 120,000 | 132,126 |
| Honeywell International, | | | | |
| Sr. Unscd. Notes | 5.00 | 2/15/19 | 100,000 | 114,687 |
| Waste Management, | | | | |
| Gtd. Notes | 4.75 | 6/30/20 | 50,000 | 53,871 |
| | | | | 300,684 |
| Media—1.8% | | | | |
| Comcast Cable Holdings, | | | | |
| Gtd. Notes | 9.80 | 2/1/12 | 25,000 | 27,623 |
| Comcast, | | | | |
| Gtd. Notes | 5.45 | 11/15/10 | 50,000 | 50,084 |
| Comcast, | | | | |
| Gtd. Notes | 6.30 | 11/15/17 | 30,000 | 35,630 |
| Comcast, | | | | |
| Gtd. Notes | 6.45 | 3/15/37 | 50,000 | 55,138 |
| Comcast, | | | | |
| Gtd. Notes | 6.95 | 8/15/37 | 20,000 | 23,343 |
| DIRECTV Holdings, | | | | |
| Gtd. Notes | 3.55 | 3/15/15 | 145,000 | 152,443 |
| DIRECTV Holdings, | | | | |
| Gtd. Notes | 4.75 | 10/1/14 | 200,000 | 219,742 |
| Discovery Communications, | | | | |
| Gtd. Notes | 3.70 | 6/1/15 | 140,000 | 149,885 |
| Grupo Televisa, | | | | |
| Sr. Unscd. Notes | 6.63 | 3/18/25 | 10,000 | 11,181 |
| News America, | | | | |
| Gtd. Notes | 6.15 | 3/1/37 | 110,000 | 116,153 |
| Time Warner Cable, | | | | |
| Gtd. Debs. | 6.75 | 6/15/39 | 110,000 | 126,506 |
| Time Warner, | | | | |
| Gtd. Debs. | 6.10 | 7/15/40 | 75,000 | 80,140 |
| Time Warner, | | | | |
| Gtd. Notes | 7.63 | 4/15/31 | 20,000 | 24,414 |
20
| | | | |
| | Coupon | Maturity | Principal | |
| Bonds and Notes (continued) | Rate (%) | Date | Amount ($) | Value ($) |
| Media (continued) | | | | |
| Viacom, | | | | |
| Sr. Unscd. Notes | 6.25 | 4/30/16 | 100,000 | 118,528 |
| | | | | 1,190,810 |
| Municipal Bonds—.1% | | | | |
| California, | | | | |
| GO (Various Purpose) | 5.45 | 4/1/15 | 20,000 | 21,504 |
| California, | | | | |
| GO (Build America Bonds) | 7.30 | 10/1/39 | 50,000 | 51,175 |
| California, | | | | |
| GO (Build America Bonds) | | | | |
| (Various Purpose) | 7.55 | 4/1/39 | 20,000 | 20,915 |
| | | | | 93,594 |
| Oil & Gas—2.0% | | | | |
| Anadarko Petroleum, | | | | |
| Sr. Unscd. Notes | 5.95 | 9/15/16 | 100,000 | 109,501 |
| ConocoPhillips, | | | | |
| Gtd. Notes | 6.50 | 2/1/39 | 50,000 | 61,584 |
| Devon Financing, | | | | |
| Gtd. Notes | 6.88 | 9/30/11 | 35,000 | 36,898 |
| Encana, | | | | |
| Sr. Unscd. Notes | 6.50 | 2/1/38 | 25,000 | 28,537 |
| Enterprise Products Operating, | | | | |
| Gtd. Notes, Ser. G | 5.60 | 10/15/14 | 50,000 | 56,524 |
| Hess, | | | | |
| Sr. Unscd. Notes | 8.13 | 2/15/19 | 75,000 | 99,083 |
| KeySpan, | | | | |
| Sr. Unscd. Notes | 7.63 | 11/15/10 | 50,000 | 50,094 |
| Nabors Industries, | | | | |
| Gtd. Notes | 9.25 | 1/15/19 | 75,000 | 96,599 |
| Nexen, | | | | |
| Sr. Unscd. Notes | 6.40 | 5/15/37 | 25,000 | 27,408 |
| Pemex Project | | | | |
| Funding Master | | | | |
| Trust, Gtd. Notes | 5.75 | 3/1/18 | 35,000 | 39,469 |
| Petrobras International Finance, | | | | |
| Gtd. Notes | 5.88 | 3/1/18 | 25,000 | 28,085 |
| Sempra Energy, | | | | |
| Sr. Unscd. Notes | 6.15 | 6/15/18 | 50,000 | 59,234 |
The Fund 21
STATEMENT OF INVESTMENTS (continued)
| | | | |
| | Coupon | Maturity | Principal | |
| Bonds and Notes (continued) | Rate (%) | Date | Amount ($) | Value ($) |
| Oil & Gas (continued) | | | | |
| Shell International Finance, | | | | |
| Gtd. Notes | 6.38 | 12/15/38 | 50,000 | 61,259 |
| Suncor Energy, | | | | |
| Sr. Unscd. Notes | 6.50 | 6/15/38 | 25,000 | 28,326 |
| Total Capital, | | | | |
| Gtd. Notes | 3.00 | 6/24/15 | 400,000 | 421,515 |
| Transocean, | | | | |
| Sr. Unscd. Notes | 6.00 | 3/15/18 | 90,000 | 97,681 |
| XTO Energy, | | | | |
| Sr. Unscd. Notes | 5.90 | 8/1/12 | 20,000 | 21,862 |
| | | | | 1,323,659 |
| Paper & Paper Related—.2% | | | | |
| International Paper, | | | | |
| Sr. Unscd. Notes | 7.95 | 6/15/18 | 100,000 | 122,453 |
| Pipelines—.7% | | | | |
| El Paso Natural Gas, | | | | |
| Sr. Unscd. Notes | 5.95 | 4/15/17 | 35,000 | 38,471 |
| Energy Transfer Partners, | | | | |
| Sr. Unscd. Notes | 5.95 | 2/1/15 | 100,000 | 111,775 |
| Kinder Morgan Energy Partners, | | | | |
| Sr. Unscd. Notes | 5.80 | 3/15/35 | 60,000 | 58,656 |
| Oneok, | | | | |
| Sr. Unscd. Notes | 6.00 | 6/15/35 | 45,000 | 44,870 |
| Trans-Canada Pipelines, | | | | |
| Sr. Unscd. Notes | 7.63 | 1/15/39 | 50,000 | 65,638 |
| Williams Partners, | | | | |
| Sr. Unscd. Notes | 3.80 | 2/15/15 | 150,000 | 158,954 |
| | | | | 478,364 |
| Property & Casualty | | | | |
| Insurance—.8% | | | | |
| Ace INA Holdings, | | | | |
| Gtd. Notes | 5.88 | 6/15/14 | 15,000 | 17,139 |
| Aflac, | | | | |
| Sr. Unscd. Notes | 8.50 | 5/15/19 | 50,000 | 64,120 |
| Allstate, | | | | |
| Sr. Unscd. Notes | 5.55 | 5/9/35 | 50,000 | 51,249 |
| American International Group, | | | | |
| Sr. Unscd. Notes | 5.05 | 10/1/15 | 50,000 | 52,575 |
| Berkshire Hathaway Finance, | | | | |
| Gtd. Notes | 5.40 | 5/15/18 | 50,000 | 57,049 |
22
| | | | |
| | Coupon | Maturity | Principal | |
| Bonds and Notes (continued) | Rate (%) | Date | Amount ($) | Value ($) |
| Property & Casualty | | | | |
| Insurance (continued) | | | | |
| Chubb, | | | | |
| Sr. Unscd. Notes | 6.00 | 5/11/37 | 50,000 | 55,681 |
| MetLife, | | | | |
| Sr. Unscd. Notes | 5.70 | 6/15/35 | 50,000 | 52,349 |
| MetLife, | | | | |
| Sr. Unscd. Notes | 6.75 | 6/1/16 | 50,000 | 59,992 |
| Progressive, | | | | |
| Sr. Unscd. Notes | 6.25 | 12/1/32 | 16,000 | 16,771 |
| Prudential Financial, | | | | |
| Sr. Unscd. Notes | 5.70 | 12/14/36 | 50,000 | 49,494 |
| Travelers, | | | | |
| Sr. Unscd. Notes | 5.80 | 5/15/18 | 20,000 | 23,077 |
| | | | | 499,496 |
| Retail—1.0% | | | | |
| CVS Caremark, | | | | |
| Sr. Unscd. Notes | 5.75 | 8/15/11 | 85,000 | 88,318 |
| CVS Caremark, | | | | |
| Sr. Unscd. Notes | 5.75 | 6/1/17 | 100,000 | 115,518 |
| Home Depot, | | | | |
| Sr. Unscd. Notes | 5.40 | 3/1/16 | 100,000 | 114,842 |
| McDonald's, | | | | |
| Sr. Unscd. Notes | 5.35 | 3/1/18 | 75,000 | 87,998 |
| Target, | | | | |
| Sr. Unscd. Notes | 6.50 | 10/15/37 | 50,000 | 59,082 |
| Wal-Mart Stores, | | | | |
| Sr. Unscd. Notes | 3.63 | 7/8/20 | 210,000 | 215,023 |
| | | | | 680,781 |
| Technology—.8% | | | | |
| Fiserv, | | | | |
| Gtd. Notes | 6.13 | 11/20/12 | 130,000 | 141,755 |
| HP Enterprise Services, | | | | |
| Sr. Unscd. Notes, Ser. B | 6.00 | 8/1/13 | 100,000 a | 113,628 |
| International Business Machines, | | | | |
| Sr. Unscd. Notes | 4.95 | 3/22/11 | 50,000 | 50,865 |
| International Business Machines, | | | | |
| Sr. Unscd. Notes | 5.70 | 9/14/17 | 100,000 | 119,632 |
| Oracle, | | | | |
| Sr. Unscd. Notes | 5.75 | 4/15/18 | 100,000 | 118,836 |
| | | | | 544,716 |
The Fund 23
STATEMENT OF INVESTMENTS (continued)
| | | | | |
| | Coupon | Maturity | Principal | | |
| Bonds and Notes (continued) | Rate (%) | Date | Amount ($) | | Value ($) |
| Telecommunications—2.5% | | | | | |
| America Movil, | | | | | |
| Gtd. Notes | 6.38 | 3/1/35 | 10,000 | | 11,350 |
| AT&T, | | | | | |
| Sr. Unscd. Notes | 5.35 | 9/1/40 | 170,000 | b | 167,445 |
| AT&T, | | | | | |
| Gtd. Notes | 8.00 | 11/15/31 | 6,000 | a | 7,836 |
| British Telecommunications, | | | | | |
| Sr. Unscd. Notes | 9.38 | 12/15/10 | 65,000 | a | 65,674 |
| Cisco Systems, | | | | | |
| Sr. Unscd. Notes | 5.90 | 2/15/39 | 50,000 | | 56,399 |
| Deutsche | | | | | |
| Telekom International | | | | | |
| Finance, Gtd. Bonds | 9.25 | 6/1/32 | 20,000 | | 29,003 |
| France Telecom, | | | | | |
| Sr. Unscd. Notes | 2.13 | 9/16/15 | 350,000 | | 355,163 |
| Motorola, | | | | | |
| Sr. Unscd. Notes | 7.63 | 11/15/10 | 50,000 | | 50,122 |
| New Cingular | | | | | |
| Wireless Services, | | | | | |
| Sr. Unscd. Notes | 7.88 | 3/1/11 | 25,000 | | 25,616 |
| New Cingular Wireless Services, | | | | | |
| Gtd. Notes | 8.13 | 5/1/12 | 25,000 | | 27,710 |
| Telecom Italia Capital, | | | | | |
| Gtd. Notes | 5.25 | 11/15/13 | 100,000 | | 108,816 |
| Telefonica Emisiones, | | | | | |
| Gtd. Notes | 3.73 | 4/27/15 | 350,000 | | 370,010 |
| Verizon Communications, | | | | | |
| Sr. Unscd. Notes | 6.40 | 2/15/38 | 50,000 | | 56,918 |
| Verizon Global Funding, | | | | | |
| Sr. Unscd. Notes, | 4.38 | 6/1/13 | 25,000 | | 27,156 |
| Verizon New York, | | | | | |
| Sr. Unscd. Notes, Ser. A | 6.88 | 4/1/12 | 50,000 | | 53,948 |
| Vodafone Group, | | | | | |
| Sr. Unscd. Notes | 5.75 | 3/15/16 | 150,000 | | 174,525 |
| Vodafone Group, | | | | | |
| Sr. Unscd. Bonds | 6.15 | 2/27/37 | 50,000 | | 57,142 |
| | | | | | 1,644,833 |
24
| | | | | |
| | Coupon | Maturity | Principal | | |
| Bonds and Notes (continued) | Rate (%) | Date | Amount ($) | | Value ($) |
| Transportation—.6% | | | | | |
| Burlington Northern Santa Fe, | | | | | |
| Sr. Unscd. Notes | 5.75 | 3/15/18 | 75,000 | | 87,136 |
| Burlington Northern Santa Fe, | | | | | |
| Sr. Unscd. Notes | 7.13 | 12/15/10 | 20,000 | | 20,156 |
| Burlington Northern Santa Fe, | | | | | |
| Sr. Unscd. Debs. | 7.95 | 8/15/30 | 50,000 | | 65,559 |
| CSX, | | | | | |
| Sr. Unscd. Notes | 6.75 | 3/15/11 | 20,000 | | 20,422 |
| Norfolk Southern, | | | | | |
| Sr. Unscd. Notes | 6.75 | 2/15/11 | 50,000 | | 50,807 |
| Norfolk Southern, | | | | | |
| Sr. Unscd. Bonds | 7.90 | 5/15/97 | 50,000 | | 63,893 |
| Union Pacific, | | | | | |
| Sr. Unscd. Bonds | 5.45 | 1/31/13 | 20,000 | | 21,865 |
| Union Pacific, | | | | | |
| Sr. Unscd. Notes | 6.65 | 1/15/11 | 50,000 | | 50,607 |
| | | | | | 380,445 |
| U.S. Government Agencies—3.2% | | | | | |
| Federal Home Loan Mortgage Corp., | | | | | |
| Notes, 2.88%, 2/9/15 | | | 2,000,000 | c | 2,146,574 |
| U.S. Government Agencies/ | | | | | |
| Mortgage-Backed—40.0% | | | | | |
| 4.50%, 12/1/19 | | | 409,382 | c | 436,267 |
| 4.97%, 6/1/38 | | | 211,623 | a,c | 225,125 |
| 5.00%, 11/1/19—7/1/35 | | | 580,566 | c | 622,530 |
| 5.50%, 12/1/27—5/1/37 | | | 2,007,064 | c | 2,156,810 |
| 5.63%, 2/1/37 | | | 31,578 | a,c | 33,869 |
| 5.68%, 2/1/37 | | | 36,452 | a,c | 38,699 |
| 5.88%, 1/1/37 | | | 35,618 | a,c | 37,805 |
| 6.00%, 10/1/19—9/1/34 | | | 145,314 | c | 159,047 |
| 6.50%, 8/1/12—8/1/32 | | | 542,633 | c | 610,410 |
| 7.00%, 1/1/36 | | | 95,244 | c | 107,031 |
| Federal National Mortgage Association: | | | | | |
| 3.50% | | | 630,000 | c,d | 652,148 |
| 4.00% | | | 420,000 | c,d | 435,775 |
| 4.50% | | | 4,240,000 | c,d | 4,470,983 |
| 5.00% | | | 3,940,000 | c,d | 4,188,692 |
The Fund 25
STATEMENT OF INVESTMENTS (continued)
| | | |
| | Principal | | |
| Bonds and Notes (continued) | Amount ($) | | Value ($) |
| U.S. Government Agencies/ | | | |
| Mortgage-Backed (continued) | | | |
| Federal National Mortgage Association (continued): | | | |
| 5.50% | 770,000 | c,d | 826,788 |
| 340,000 | c,d | 369,166 |
| 2.88%, 12/1/34 | 88,478 | a,c | 92,256 |
| 4.00%, 4/1/19 | 287,718 | c | 305,630 |
| 4.50%, 6/1/29—10/1/40 | 814,265 | c | 857,355 |
| 5.00%, 9/1/29—10/1/33 | 461,904 | c | 492,827 |
| 5.50%, 7/1/17—2/1/37 | 1,408,336 | c | 1,526,866 |
| 5.52%, 10/1/37 | 55,445 | a,c | 58,916 |
| 5.59%, 4/1/37 | 35,610 | a,c | 38,096 |
| 5.76%, 9/1/38 | 159,265 | a,c | 170,527 |
| 6.00%, 11/1/16—1/1/36 | 1,605,717 | c | 1,772,956 |
| 6.50%, 7/1/33—8/1/38 | 436,648 | c | 485,513 |
| 7.00%, 4/1/32 | 50,566 | c | 58,023 |
| Government National Mortgage Association I: | | | |
| 4.00% | 380,000 | d | 395,081 |
| 4.50% | 2,030,000 | d | 2,153,704 |
| 5.50% | 220,000 | d | 238,700 |
| 5.00%, 11/15/35—5/15/39 | 2,061,492 | | 2,219,833 |
| 5.50%, 2/15/33—4/15/38 | 347,661 | | 378,798 |
| | | | 26,616,226 |
| U.S. Government Securities—21.3% | | | |
| U.S. Treasury Bonds: | | | |
| 4.75%, 2/15/37 | 1,400,000 | | 1,592,063 |
| 6.25%, 5/15/30 | 295,000 | | 403,920 |
| U.S. Treasury Notes: | | | |
| 2.25%, 1/31/15 | 6,000,000 | | 6,329,064 |
| 2.38%, 10/31/14 | 5,500,000 | | 5,831,293 |
| 4.88%, 7/31/11 | 40,000 | | 41,395 |
| | | | 14,197,735 |
| Total Bonds and Notes | | | |
| (cost $70,277,266) | | | 73,197,506 |
| |
| |
| Short-Term Investments—.3% | | | |
| U.S. Treasury Bills; | | | |
| 0.13%, 12/23/10 | | | |
| (cost $189,964) | 190,000 e | 189,962 |
26
| | |
| Other Investment—7.2% | Shares | Value ($) |
| Registered Investment Company; | | |
| Dreyfus Institutional Preferred | | |
| Plus Money Market Fund | | |
| (cost $4,821,000) | 4,821,000 f | 4,821,000 |
| |
| Total Investments (cost $75,288,230) | 117.5% | 78,208,468 |
| Liabilities, Less Cash and Receivables | (17.5%) | (11,619,618) |
| Net Assets | 100.0% | 66,588,850 |
GO—General Obligation
|
| a Variable rate security—interest rate subject to periodic change. |
| b Securities exempt from registration under Rule 144A of the Securities Act of 1933.These securities may be resold in |
| transactions exempt from registration, normally to qualified institutional buyers.At October 31, 2010, these |
| securities had a market value of $167,445 or .3% of net assets. |
| c The Federal Housing Finance Agency (“FHFA”) placed Federal Home Loan Mortgage Corporation and Federal |
| National Mortgage Association into conservatorship with FHFA as the conservator.As such, the FHFA oversees the |
| continuing affairs of these companies. |
| d Purchased on a forward commitment basis. |
| e Held by a broker as collateral for open financial futures positions. |
| f Investment in affiliated money market mutual fund. |
| | | |
| Portfolio Summary (Unaudited)† | | |
| |
| Value (%) | | Value (%) |
| U.S. Government & Agencies | 64.5 | Foreign/Governmental | 2.1 |
| Corporate Bonds | 32.0 | Municipal Bonds | .1 |
| Asset/Mortgage-Backed | 11.3 | | |
| Short-Term/Money Market Investments | 7.5 | | 117.5 |
| |
| † Based on net assets. | | | |
| See notes to financial statements. | | | |
The Fund 27
STATEMENT OF FINANCIAL FUTURES
October 31, 2010
| | | | |
| | | | | Unrealized |
| | | Market Value | | Appreciation |
| | | Covered by | | (Depreciation) |
| | Contracts | Contracts ($) | Expiration | at 10/31/2010 ($) |
| Financial Futures Long | | | | |
| Australian 10 Year Bonds | 31 | 3,219,027 | December 2010 | (29,017) |
| Euro-Bond | 1 | 179,616 | December 2010 | (1,716) |
| Euro Dollar | 12 | 2,990,250 | December 2010 | 8,443 |
| Euro Dollar | 6 | 1,494,525 | March 2011 | 7,034 |
| Euro Dollar | 6 | 1,494,000 | June 2011 | 8,121 |
| Euro Dollar | 6 | 1,493,100 | September 2011 | 9,434 |
| Euro Dollar | 6 | 1,491,975 | December 2011 | 11,384 |
| Euro Dollar | 6 | 1,490,700 | March 2012 | 13,034 |
| Euro Dollar | 6 | 1,489,125 | June 2012 | 14,759 |
| U.S. Treasury 2 Year Notes | 24 | 5,279,625 | December 2010 | 1,981 |
| U.S. Treasury 5 Year Notes | 5 | 607,891 | December 2010 | 6,442 |
| U.S. Treasury 10 Year Notes | 71 | 8,965,969 | December 2010 | 66,393 |
| U.S. Treasury 30 Year Bonds | 24 | 3,142,500 | December 2010 | (59,019) |
| Financial Futures Short | | | | |
| Australian 3 Year Bonds | 11 | (1,110,636) | December 2010 | (254) |
| Canadian 10 Year Bonds | 8 | (993,789) | December 2010 | (17,298) |
| Euro-Bond | 13 | (2,335,006) | December 2010 | 39,966 |
| Euro-Schatz | 1 | (151,255) | December 2010 | 19 |
| Long Gilt | 14 | (2,761,188) | December 2010 | 28,210 |
| U.S. Treasury 5 year Notes | 82 | (9,969,406) | December 2010 | (37,164) |
| U.S. Treasury 10 year Notes | 42 | (5,303,813) | December 2010 | (25,729) |
| Gross Unrealized Appreciation | | | | 215,220 |
| Gross Unrealized Depreciation | | | | (170,197) |
See notes to financial statements.
28
| | |
| STATEMENT OF SECURITIES SOLD SHORT | | |
| October 31, 2010 | | |
| |
| |
| |
| |
| | Principal | |
| Bonds and Notes | Amount ($) | Value ($) |
| Federal National Mortgage Association: | | |
| 3.50% | 1,950,000 a,b | 1,963,711 |
| 5.50% | 140,000 a,b | 151,703 |
| 6.00% | 240,000 a,b | 260,137 |
| 6.50% | 470,000 a,b | 518,689 |
| Government National Mortgage Association : | | |
| 5.00% | 830,000 b | 891,342 |
| 6.00% | 420,000 b | 460,950 |
| Total Securities Sold Short | | |
| (Proceeds $4,241,126) | | 4,246,532 |
|
| a The Federal Housing Finance Agency (“FHFA”) placed Federal National Mortgage Association and Federal Home |
| Loan Mortgage Corporation into conservatorship with FHFA as the conservator.As such, the FHFA oversees the |
| continuing affairs of these companies. |
| b Sold on a delayed delivery basis. |
See notes to financial statements.
The Fund 29
STATEMENT OF ASSETS AND LIABILITIES
October 31, 2010
| | | |
| | | Cost | Value |
| Assets ($): | | | |
| Investments in securities—See Statement of Investments: | | |
| Unaffiliated issuers | | 70,467,230 | 73,387,468 |
| Affiliated issuers | | 4,821,000 | 4,821,000 |
| Cash | | | 233,916 |
| Cash on initial margin—Note 4 | | | 1,128,567 |
| Receivable from broker for proceeds on securities sold short | | 4,241,126 |
| Receivable for investment securities sold | | | 3,175,165 |
| Dividends and interest receivable | | | 530,767 |
| Unrealized appreciation on forward foreign | | | |
| currency exchange contracts—Note 4 | | | 381,513 |
| Receivable for shares of Common Stock subscribed | | | 263,576 |
| | | | 88,163,098 |
| Liabilities ($): | | | |
| Due to The Dreyfus Corporation and affiliates—Note 3(c) | | 37,039 |
| Payable for open mortgage-backed dollar rolls—Note 4 | | 9,083,015 |
| Payable for investment securities purchased | | | 7,785,885 |
| Securities sold short, at value (proceeds | | | |
| $4,241,126)—See Statement of Securities Sold Short | | 4,246,532 |
| Unrealized depreciation on forward foreign | | | |
| currency exchange contracts—Note 4 | | | 277,080 |
| Payable for shares of Common Stock redeemed | | | 72,736 |
| Payable for futures variation margin—Note 4 | | | 18,908 |
| Accrued expenses | | | 53,053 |
| | | | 21,574,248 |
| Net Assets ($) | | | 66,588,850 |
| Composition of Net Assets ($): | | | |
| Paid-in capital | | | 61,314,267 |
| Accumulated undistributed investment income—net | | | 623,329 |
| Accumulated net realized gain (loss) on investments | | | 1,581,914 |
| Accumulated net unrealized appreciation (depreciation) on investments, | |
| foreign currency transactions and securities sold short (including | | |
| $45,023 net unrealized appreciation on financial futures) | | 3,069,340 |
| Net Assets ($) | | | 66,588,850 |
| |
| |
| |
| Net Asset Value Per Share | | | |
| | Class A | Class C | Class I |
| Net Assets ($) | 48,236,094 | 10,916,040 | 7,436,716 |
| Shares Outstanding | 3,423,608 | 778,622 | 527,214 |
| Net Asset Value Per Share ($) | 14.09 | 14.02 | 14.11 |
| |
| See notes to financial statements. | | | |
30
| |
| STATEMENT OF OPERATIONS | |
| Year Ended October 31, 2010 | |
| |
| |
| |
| |
| Investment Income ($): | |
| Income: | |
| Interest | 2,106,097 |
| Dividends; | |
| Affiliated issuers | 11,002 |
| Total Income | 2,117,099 |
| Expenses: | |
| Management fee—Note 3(a) | 319,851 |
| Shareholder servicing costs—Note 3(c) | 186,705 |
| Distribution fees—Note 3(b) | 75,026 |
| Registration fees | 56,665 |
| Professional fees | 37,640 |
| Prospectus and shareholders' reports | 21,157 |
| Custodian fees—Note 3(c) | 19,590 |
| Loan commitment fees—Note 2 | 871 |
| Miscellaneous | 42,600 |
| Total Expenses | 760,105 |
| Less—reduction in management fee due to undertaking—Note 3(a) | (165,184) |
| Less—reduction in fees due to earnings credits—Note 3(c) | (63) |
| Net Expenses | 594,858 |
| Investment Income—Net | 1,522,241 |
| Realized and Unrealized Gain (Loss) on Investments—Note 4 ($): | |
| Net realized gain (loss) on investments and foreign currency transactions: | |
| Long transactions | 1,346,679 |
| Short sale transactions | (448,874) |
| Net realized gain (loss) on financial futures | 872,379 |
| Net realized gain (loss) on forward foreign | |
| currency exchange contracts | 470,751 |
| Net Realized Gain (Loss) | 2,240,935 |
| Net unrealized appreciation (depreciation) on | |
| investments and foreign currency transactions | 1,493,223 |
| Net unrealized appreciation (depreciation) on financial futures | (74,430) |
| Net unrealized appreciation (depreciation) on | |
| forward foreign currency exchange contracts | 46,581 |
| Net unrealized appreciation (depreciation) on securities sold short | (62,589) |
| Net Unrealized Appreciation (Depreciation) | 1,402,785 |
| Net Realized and Unrealized Gain (Loss) on Investments | 3,643,720 |
| Net Increase in Net Assets Resulting from Operations | 5,165,961 |
See notes to financial statements.
The Fund 31
STATEMENT OF CHANGES IN NET ASSETS
| | |
| | Year Ended October 31, |
| | 2010 | 2009 |
| Operations ($): | | |
| Investment income—net | 1,522,241 | 905,396 |
| Net realized gain (loss) on investments | 2,240,935 | 900,558 |
| Net unrealized appreciation | | |
| (depreciation) on investments | 1,402,785 | 2,245,403 |
| Net Increase (Decrease) in Net Assets | | |
| Resulting from Operations | 5,165,961 | 4,051,357 |
| Dividends to Shareholders from ($): | | |
| Investment income—net: | | |
| Class A Shares | (1,363,911) | (577,992) |
| Class C Shares | (227,909) | (81,570) |
| Class I Shares | (162,710) | (22,042) |
| Net realized gain on investments: | | |
| Class A Shares | (695,283) | — |
| Class C Shares | (153,314) | — |
| Class I Shares | (90,128) | — |
| Total Dividends | (2,693,255) | (681,604) |
| Capital Stock Transactions ($): | | |
| Net proceeds from shares sold: | | |
| Class A Shares | 30,872,674 | 35,110,709 |
| Class C Shares | 9,355,826 | 6,345,254 |
| Class I Shares | 9,055,449 | 1,280,370 |
| Dividends reinvested: | | |
| Class A Shares | 1,975,470 | 530,469 |
| Class C Shares | 279,604 | 38,540 |
| Class I Shares | 147,179 | 21,855 |
| Cost of shares redeemed: | | |
| Class A Shares | (31,435,932) | (7,378,938) |
| Class C Shares | (6,383,709) | (2,366,851) |
| Class I Shares | (3,952,794) | (102,447) |
| Increase (Decrease) in Net Assets | | |
| from Capital Stock Transactions | 9,913,767 | 33,478,961 |
| Total Increase (Decrease) in Net Assets | 12,386,473 | 36,848,714 |
| Net Assets ($): | | |
| Beginning of Period | 54,202,377 | 17,353,663 |
| End of Period | 66,588,850 | 54,202,377 |
| Undistributed investment income—net | 623,329 | 502,380 |
32
| | |
| | Year Ended October 31, |
| | 2010 | 2009 |
| Capital Share Transactions: | | |
| Class A | | |
| Shares sold | 2,265,276 | 2,679,081 |
| Shares issued for dividends reinvested | 148,626 | 41,507 |
| Shares redeemed | (2,304,265) | (563,973) |
| Net Increase (Decrease) in Shares Outstanding | 109,637 | 2,156,615 |
| Class C | | |
| Shares sold | 694,307 | 488,329 |
| Shares issued for dividends reinvested | 21,152 | 3,029 |
| Shares redeemed | (472,901) | (180,866) |
| Net Increase (Decrease) in Shares Outstanding | 242,558 | 310,492 |
| Class I | | |
| Shares sold | 667,352 | 96,039 |
| Shares issued for dividends reinvested | 11,026 | 1,716 |
| Shares redeemed | (290,861) | (7,669) |
| Net Increase (Decrease) in Shares Outstanding | 387,517 | 90,086 |
| |
| See notes to financial statements. | | |
The Fund 33
FINANCIAL HIGHLIGHTS
The following tables describe the performance for each share class for the fiscal periods indicated.All information (except portfolio turnover rate) reflects financial results for a single fund share.Total return shows how much your investment in the fund would have increased (or decreased) during each period, assuming you had reinvested all dividends and distributions.These figures have been derived from the fund’s financial statements.
| | | | | |
| | | Year Ended October 31, | |
| Class A Shares | 2010 | 2009 | 2008 | 2007 | 2006a |
| Per Share Data ($): | | | | | |
| Net asset value, beginning of period | 13.59 | 12.12 | 12.62 | 12.79 | 12.50 |
| Investment Operations: | | | | | |
| Investment income—netb | .35 | .37 | .52 | .56 | .32 |
| Net realized and unrealized | | | | | |
| gain (loss) on investments | .78 | 1.44 | (.48) | (.11) | .16 |
| Total from Investment Operations | 1.13 | 1.81 | .04 | .45 | .48 |
| Distributions: | | | | | |
| Dividends from investment income—net | (.41) | (.34) | (.54) | (.53) | (.19) |
| Dividends from net realized | | | | | |
| gain on investments | (.22) | — | — | (.09) | — |
| Total Distributions | (.63) | (.34) | (.54) | (.62) | (.19) |
| Net asset value, end of period | 14.09 | 13.59 | 12.12 | 12.62 | 12.79 |
| Total Return (%)c | 8.74 | 15.15 | .21 | 3.57 | 3.86d |
| Ratios/Supplemental Data (%): | | | | | |
| Ratio of total expenses | | | | | |
| to average net assets | 1.14 | 1.40 | 1.90 | 2.01 | 3.32e |
| Ratio of net expenses | | | | | |
| to average net assets | .87 | .90 | .90 | .89 | .88e |
| Ratio of net investment income | | | | | |
| to average net assets | 2.58 | 2.87 | 4.16 | 4.45 | 3.99e |
| Portfolio Turnover Ratef | 350.15 | 377.79 | 120.92 | 75.04 | 104.30d |
| Net Assets, end of period ($ x 1,000) | 48,236 | 45,046 | 14,026 | 10,512 | 10,006 |
|
| a From March 15, 2006 (commencement of operations) to October 31, 2006. |
| b Based on average shares outstanding at each month end. |
| c Exclusive of sales charge. |
| d Not annualized. |
| e Annualized. |
| f The portfolio turnover rates excluding mortgage dollar roll transactions for the periods ended October 31, 2010, |
| 2009, 2008, 2007 and 2006, were 182.13%, 211.99%, 87.59%, 51.54% and 101.24%, respectively. |
See notes to financial statements.
34
| | | | | |
| | | Year Ended October 31, | |
| Class C Shares | 2010 | 2009 | 2008 | 2007 | 2006a |
| Per Share Data ($): | | | | | |
| Net asset value, beginning of period | 13.53 | 12.08 | 12.58 | 12.77 | 12.50 |
| Investment Operations: | | | | | |
| Investment income—netb | .25 | .27 | .41 | .47 | .25 |
| Net realized and unrealized | | | | | |
| gain (loss) on investments | .78 | 1.44 | (.47) | (.13) | .17 |
| Total from Investment Operations | 1.03 | 1.71 | (.06) | .34 | .42 |
| Distributions: | | | | | |
| Dividends from investment income—net | (.32) | (.26) | (.44) | (.44) | (.15) |
| Dividends from net realized | | | | | |
| gain on investments | (.22) | — | — | (.09) | — |
| Total Distributions | (.54) | (.26) | (.44) | (.53) | (.15) |
| Net asset value, end of period | 14.02 | 13.53 | 12.08 | 12.58 | 12.77 |
| Total Return (%)c | 7.96 | 14.32 | (.55) | 2.73 | 3.41d |
| Ratios/Supplemental Data (%): | | | | | |
| Ratio of total expenses | | | | | |
| to average net assets | 1.93 | 2.20 | 2.75 | 2.79 | 4.12e |
| Ratio of net expenses | | | | | |
| to average net assets | 1.62 | 1.65 | 1.65 | 1.64 | 1.61e |
| Ratio of net investment income | | | | | |
| to average net assets | 1.81 | 2.11 | 3.40 | 3.71 | 3.28e |
| Portfolio Turnover Ratef | 350.15 | 377.79 | 120.92 | 75.04 | 104.30d |
| Net Assets, end of period ($ x 1,000) | 10,916 | 7,256 | 2,726 | 1,044 | 985 |
|
| a From March 15, 2006 (commencement of operations) to October 31, 2006. |
| b Based on average shares outstanding at each month end. |
| c Exclusive of sales charge. |
| d Not annualized. |
| e Annualized. |
| f The portfolio turnover rates excluding mortgage dollar roll transactions for the periods ended October 31, 2010, |
| 2009, 2008, 2007 and 2006, were 182.13%, 211.99%, 87.59%, 51.54% and 101.24%, respectively. |
See notes to financial statements.
The Fund 35
FINANCIAL HIGHLIGHTS (continued)
| | | | | |
| | | Year Ended October 31, | |
| Class I Shares | 2010 | 2009 | 2008 | 2007a | 2006b |
| Per Share Data ($): | | | | | |
| Net asset value, beginning of period | 13.61 | 12.13 | 12.62 | 12.80 | 12.50 |
| Investment Operations: | | | | | |
| Investment income—netc | .40 | .40 | .56 | .59 | .33 |
| Net realized and unrealized | | | | | |
| gain (loss) on investments | .77 | 1.44 | (.48) | (.12) | .17 |
| Total from Investment Operations | 1.17 | 1.84 | .08 | .47 | .50 |
| Distributions: | | | | | |
| Dividends from investment income—net | (.45) | (.36) | (.57) | (.56) | (.20) |
| Dividends from net realized | | | | | |
| gain on investments | (.22) | — | — | (.09) | — |
| Total Distributions | (.67) | (.36) | (.57) | (.65) | (.20) |
| Net asset value, end of period | 14.11 | 13.61 | 12.13 | 12.62 | 12.80 |
| Total Return (%) | 9.00 | 15.38 | .54 | 3.75 | 4.04d |
| Ratios/Supplemental Data (%): | | | | | |
| Ratio of total expenses | | | | | |
| to average net assets | .86 | 1.13 | 1.64 | 1.78 | 3.08e |
| Ratio of net expenses | | | | | |
| to average net assets | .62 | .65 | .65 | .64 | .63e |
| Ratio of net investment income | | | | | |
| to average net assets | 2.85 | 3.12 | 4.41 | 4.70 | 4.25e |
| Portfolio Turnover Ratef | 350.15 | 377.79 | 120.92 | 75.04 | 104.30d |
| Net Assets, end of period ($ x 1,000) | 7,437 | 1,901 | 602 | 599 | 577 |
|
| a Effective June 1, 2007, Class R shares were redesignated as Class I shares. |
| b From March 15, 2006 (commencement of operations) to October 31, 2006. |
| c Based on average shares outstanding at each month end. |
| d Not annualized. |
| e Annualized. |
| f The portfolio turnover rates excluding mortgage dollar roll transactions for the periods ended October 31, 2010, |
| 2009, 2008, 2007 and 2006, were 182.13%, 211.99%, 87.59%, 51.54% and 101.24%, respectively. |
See notes to financial statements.
36
NOTES TO FINANCIAL STATEMENTS
NOTE 1—Significant Accounting Policies:
Dreyfus Total Return Advantage Fund (the “fund”) is a separate diversified series of Advantage Funds, Inc. (the “Company”), which is registered under the Investment Company Act of 1940, as amended (the “Act”), as an open-end management investment company and operates as a series company currently offering eleven series, including the fund. The fund’s investment objective is to maximize total return through capital appreciation and income.The Dreyfus Corporation (the “Manager” or “Dreyfus”), a wholly-owned subsidiary ofThe Bank of NewYork Mellon Corporation (“BNY Mellon”), serves as the fund’s investment adviser.
MBSC Securities Corporation (the “Distributor”), a wholly-owned subsidiary of the Manager, is the distributor of the fund’s shares.The fund is authorized to issue 100 million shares of $.001 par value Common Stock in each of the following classes of shares: Class A, Class C and Class I. Class A shares are subject to a sales charge imposed at the time of purchase. Class C shares are subject to a contingent deferred sales charge (“CDSC”) imposed on Class C shares redeemed within one year of purchase. Class I shares are sold at net asset value per share only to institutional investors. Other differences between the classes include the services offered to and the expenses borne by each class, the allocation of certain transfer agency costs and certain voting rights. Income, expenses (other than expenses attributable to a specific class), and realized and unrealized gains or losses on investmen ts are allocated to each class of shares based on its relative net assets.
The Company accounts separately for the assets, liabilities and operations of each series. Expenses directly attributable to each series are charged to that series’ operations; expenses which are applicable to all series are allocated among them on a pro rata basis.
The Fund 37
NOTES TO FINANCIAL STATEMENTS (continued)
The Financial Accounting Standards Board (“FASB”) Accounting Standards Codification (“ASC”) is the exclusive reference of authoritative U.S. generally accepted accounting principles (“GAAP”) recognized by the FASB to be applied by nongovernmental entities. Rules and interpretive releases of the Securities and Exchange Commission (“SEC”) under authority of federal laws are also sources of authoritative GAAP for SEC registrants. The fund’s financial statements are prepared in accordance with GAAP, which may require the use of management estimates and assumptions.Actual results could differ from those estimates.
The Company enters into contracts that contain a variety of indemnifications.The fund’s maximum exposure under these arrangements is unknown.The fund does not anticipate recognizing any loss related to these arrangements.
(a) Portfolio valuation: Investments in securities excluding short-term investments (other than U.S.Treasury Bills), financial futures and forward foreign currency exchange contracts (“forward contracts”) are valued each business day by an independent pricing service (the “Service”) approved by the Board of Directors. Investments for which quoted bid prices are readily available and are representative of the bid side of the market in the judgment of the Service are valued at the mean between the quoted bid prices (as obtained by the Service from dealers in such securities) and asked prices (as calculated by the Service based upon its evaluation of the market for such securities). Other investments (which constitute a majority of the portfolio securities) are valued as determined by the Service, based on m ethods which include consideration of: yields or prices of securities of comparable quality, coupon, maturity and type; indications as to values from dealers; and general market conditions. Restricted securities, as well as securities or other assets for which recent market quotations are not readily available, that are not valued by a pricing service approved by
38
the Board of Directors, or are determined by the fund not to reflect accurately fair value, are valued at fair value as determined in good faith under the direction of the Board of Directors. The factors that may be considered when fair valuing a security include fundamental analytical data, the nature and duration of restrictions on disposition, an evaluation of the forces that influence the market in which the securities are purchased and sold and public trading in similar securities of the issuer or comparable issuers. Short-term investments, excluding U.S.Treasury Bills, are carried at amortized cost, which approximates value. Registered investment companies that are not traded on an exchange are valued at their net asset value. Financial futures which are traded on an exchange, are valued at the last sales price on the securities exchange on which such securities are primarily traded or at the last sales pric e on the national securities market on each business day. Investments denominated in foreign currencies are translated to U.S. dollars at the prevailing rates of exchange. Forward contracts are valued at the forward rate.
The fair value of a financial instrument is the amount that would be received to sell an asset or paid to transfer a liability in an orderly transaction between market participants at the measurement date (i.e. the exit price). GAAP establishes a fair value hierarchy that prioritizes the inputs of valuation techniques used to measure fair value.This hierarchy gives the highest priority to unadjusted quoted prices in active markets for identical assets or liabilities (Level 1 measurements) and the lowest priority to unobservable inputs (Level 3 measurements).
Additionally, GAAP provides guidance on determining whether the volume and activity in a market has decreased significantly and whether such a decrease in activity results in transactions that are not orderly. GAAP requires enhanced disclosures around valuation inputs and techniques used during annual and interim periods.
The Fund 39
NOTES TO FINANCIAL STATEMENTS (continued)
Various inputs are used in determining the value of the fund’s investments relating to fair value measurements.These inputs are summarized in the three broad levels listed below:
Level 1—unadjusted quoted prices in active markets for
identical investments.
Level 2—other significant observable inputs (including quoted
prices for similar investments, interest rates, prepayment speeds,
credit risk, etc.).
Level 3—significant unobservable inputs (including the fund’s
own assumptions in determining the fair value of investments).
The inputs or methodology used for valuing securities are not necessarily an indication of the risk associated with investing in those securities
The following is a summary of the inputs used as of October 31, 2010 in valuing the fund’s investments:
| | | | |
| | | Level 2—Other | Level 3— | |
| | Level 1— | Significant | Significant | |
| | Unadjusted | Observable | Unobservable | |
| | Quoted Prices | Inputs | Inputs | Total |
| Assets ($) | | | | |
| Investments in Securities: | | | |
| Asset-Backed | — | 3,145,665 | — | 3,145,665 |
| Commercial | | | | |
| Mortgage-Backed | — | 4,355,048 | — | 4,355,048 |
| Corporate Bonds† | — | 21,246,211 | — | 21,246,211 |
| Foreign Government | — | 1,396,453 | — | 1,396,453 |
| Municipal Bonds | — | 93,594 | — | 93,594 |
| Mutual Funds | 4,821,000 | — | — | 4,821,000 |
| U.S. Government | | | | |
| Agencies/ | | | | |
| Mortgage-Backed | — | 28,762,800 | — | 28,762,800 |
| U.S. Treasury | — | 14,387,697 | — | 14,387,697 |
| Other Financial | | | | |
| Instruments: | | | | |
| Forward Foreign | | | | |
| Currency Exchange | | | | |
| Contracts†† | — | 381,513 | — | 381,513 |
| Futures†† | 215,220 | — | — | 215,220 |
40
| | | | |
| | | Level 2—Other | Level 3— | |
| | Level 1— | Significant | Significant | |
| | Unadjusted | Observable | Unobservable | |
| | Quoted Prices | Inputs | Inputs | Total |
| Liabilities ($) | | | | |
| Other Financial | | | | |
| Instruments: | | | | |
| Forward Foreign | | | | |
| Currency Exchange | | | | |
| Contracts†† | — | (277,080) | — | (277,080) |
| Futures†† | (170,197) | — | — | (170,197) |
| Securities Sold Short: | | | | |
| U.S. Government | | | | |
| Agencies/ | | | | |
| Mortgage-Backed | — | (4,246,532) | — | (4,246,532) |
| |
| † | See Statement of Investments for industry classification. |
| †† | Amount shown represents unrealized appreciation (depreciation) at period end. |
In January 2010, FASB issued Accounting Standards Update (“ASU”) No. 2010-06 “Improving Disclosures about FairValue Measurements”. The portions of ASU No. 2010-06 which require reporting entities to prepare new disclosures surrounding amounts and reasons for significant transfers in and out of Level 1 and Level 2 fair value measurements as well as inputs and valuation techniques used to measure fair value for both recurring and nonrecurring fair value measurements that fall in either Level 2 or Level 3 have been adopted by the fund. No significant transfers between Level 1 or Level 2 fair value measurements occurred at October 31, 2010. The remaining portion of ASU No. 2010-06 requires reporting entities to make new disclosures about information on purchases, sales, issuances and settlements on a gross basis in the reconciliation of activity in Level 3 fair value measurements. These new and rev ised disclosures are required to be implemented for fiscal years beginning after December 15, 2010. Management is currently evaluating the impact that the adoption of this remaining portion of ASU No. 2010-06 may have on the fund’s financial statement disclosures.
The Fund 41
NOTES TO FINANCIAL STATEMENTS (continued)
(b) Foreign currency transactions: The fund does not isolate that portion of the results of operations resulting from changes in foreign exchange rates on investments from the fluctuations arising from changes in the market prices of securities held. Such fluctuations are included with the net realized and unrealized gain or loss on investments.
Net realized foreign exchange gains or losses arise from sales of foreign currencies, currency gains or losses realized on securities transactions between trade and settlement dates and the difference between the amounts of dividends, interest and foreign withholding taxes recorded on the fund’s books and the U.S. dollar equivalent of the amounts actually received or paid. Net unrealized foreign exchange gains or losses arise from changes in the value of assets and liabilities other than investments resulting from changes in exchange rates. Foreign currency gains and losses on investments are included with net realized and unrealized gain or loss on investments.
(c) Securities transactions and investment income: Securities transactions are recorded on a trade date basis. Realized gains and losses from securities transactions are recorded on the identified cost basis. Dividend income is recognized on the ex-dividend date and interest income, including, where applicable, accretion of discount and amortization of premium on investments, is recognized on the accrual basis.
(d) Affiliated issuers: Investments in other investment companies advised by Dreyfus are defined as “affiliated” in the Act.
The fund may invest in shares of certain affiliated investment companies also advised or managed by Dreyfus. Investments in affiliated investment companies for the period ended October 31, 2010 were as follows:
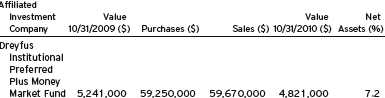
42
(e) Dividends to shareholders: Dividends are recorded on the ex-dividend date. Dividends from investment income-net are declared and paid quarterly. Dividends from net realized capital gains, if any, are normally declared and paid annually, but the fund may make distributions on a more frequent basis to comply with the distribution requirements of the Internal Revenue Code of 1986, as amended (the “Code”).To the extent that net realized capital gains can be offset by capital loss carryovers, it is the policy of the fund not to distribute such gains. Income and capital gain distributions are determined in accordance with income tax regulations, which may differ from GAAP.
On October 29, 2010, the Board of Directors declared a cash dividend of $.100, $.072 and $.108 per share, from undistributed investment income-net for Class A, Class C and Class I shares, respectively, payable on November 1, 2010 (ex-dividend date), to shareholders of record as of the close of business on October 29, 2010.
(f) Federal income taxes: It is the policy of the fund to continue to qualify as a regulated investment company, if such qualification is in the best interests of its shareholders, by complying with the applicable provisions of the Code, and to make distributions of taxable income sufficient to relieve it from substantially all federal income and excise taxes.
As of and during the period ended October 31, 2010, the fund did not have any liabilities for any uncertain tax positions.The fund recognizes interest and penalties, if any, related to uncertain tax positions as income tax expense in the Statement of Operations. During the period, the fund did not incur any interest or penalties.
Each of the tax years in the four-year period ended October 31, 2010 remains subject to examination by the Internal Revenue Service and state taxing authorities.
At October 31, 2010, the components of accumulated earnings on a tax basis were as follows: undistributed ordinary income $1,898,917, undistributed capital gains $1,234,937 and unrealized appreciation $2,140,729.
The Fund 43
NOTES TO FINANCIAL STATEMENTS (continued)
The tax character of distributions paid to shareholders during the fiscal periods ended October 31, 2010 and October 31, 2009 were as follows: ordinary income $2,137,160 and $681,604 and long-term capital gains $556,095 and $0, respectively.
During the period ended October 31, 2010, as a result of permanent book to tax differences, primarily due to the tax treatment for amortization of premiums, paydown gains and losses on mortgage-backed securities and foreign currency gains and losses, the fund increased accumulated undistributed investment income-net by $353,238 and decreased accumulated net realized gain (loss) on investments by the same amount. Net assets and net asset value per share were not affected by this reclassification.
NOTE 2—Bank Lines of Credit:
The fund participates with other Dreyfus-managed funds in a $225 million unsecured credit facility led by Citibank, N.A. and a $300 million unsecured credit facility provided by The Bank of New York Mellon, a subsidiary of BNY Mellon and an affiliate of Dreyfus (each, a “Facility”), each to be utilized primarily for temporary or emergency purposes, including the financing of redemptions. In connection therewith, the fund has agreed to pay its pro rata portion of commitment fees for each Facility. Interest is charged to the fund based on rates determined pursuant to the terms of the respective Facility at the time of borrowing. During the period ended October 31, 2010, the fund did not borrow under the Facilities.
NOTE 3—Management Fee and Other Transactions With Affiliates:
(a) Pursuant to a management agreement (“Agreement”) with the Manager, the management fee is computed at the annual rate of .45% of the value of the fund’s average daily net assets and is payable monthly. Prior to August 1, 2010, the management fee was computed at the annual rate of .55%.The Manager has undertaken from August 1, 2010 through March 1, 2012, that, if the fund’s aggregate expenses, exclusive
44
of taxes, brokerage fees, Rule 12b-1 distribution plan fees, interest expense, commitment fees on borrowings, shareholder services plan fees and extraordinary expenses, exceed an annual rate of .55% of the value of the fund’s average daily net assets, the fund may deduct from the payment to be made to the Manager under the Agreement, or the Manager will bear, such excess expense. The Manager had undertaken from November 1, 2009 through July 31, 2010, that, if the aggregate expenses of the fund (exclusive of expenses as described above) exceeded .65% of the value of the fund's average daily net assets, the fund could deduct from the payment to be made to the Manager under the Management Agreement, or the Manager would have borne such excess expense.The reduction in management fee, pursuant to the undertakings, amounted to $165,184 during the period ended October 31, 2010.
During the period ended October 31, 2010, the Distributor retained $13,533 from commissions earned on sales of the fund’s Class A shares and $6,764 from CDSCs on redemptions of the fund’s Class C shares.
(b) Under the Distribution Plan (the “Plan”) adopted pursuant to Rule 12b-1 under the Act, Class C shares pay the Distributor for distributing its shares at an annual rate of .75% of the value of the average daily net assets of Class C shares. During the period ended October 31, 2010, Class C shares were charged $75,026 pursuant to the Plan.
(c) Under the Shareholder Services Plan, Class A and Class C shares pay the Distributor at an annual rate of .25% of the value of their average daily net assets for the provision of certain services.The services provided may include personal services relating to shareholder accounts, such as answering shareholder inquiries regarding the fund and providing reports and other information, and services related to the maintenance of shareholder accounts.The Distributor may make payments to Service Agents (a securities dealer, financial institution or other industry professional) in respect of these services.The Distributor determines the amounts to be paid to Service Agents. During the period ended October 31, 2010, Class A and Class C shares were charged $112,837 and $25,010, respectively, pursuant to the Shareholder Services Pl an.
The Fund 45
NOTES TO FINANCIAL STATEMENTS (continued)
The fund compensates Dreyfus Transfer, Inc., a wholly-owned subsidiary of the Manager, under a transfer agency agreement for providing personnel and facilities to perform transfer agency services for the fund. During the period ended October 31, 2010, the fund was charged $3,616 pursuant to the transfer agency agreement, which is included in Shareholder servicing costs in the Statement of Operations.
The fund has arrangements with the custodian and cash management bank whereby the fund may receive earnings credits when positive cash balances are maintained, which are used to offset custody and cash management fees. For financial reporting purposes, the fund includes net earnings credits as an expense offset in the Statement of Operations.
The fund compensates The Bank of New York Mellon under a cash management agreement for performing cash management services related to fund subscriptions and redemptions. During the period ended October 31, 2010, the fund was charged $1,041 pursuant to the cash management agreement, which is included in Shareholder servicing costs in the Statement of Operations.These fees were partially offset by earnings credits of $63.
The fund also compensates The Bank of New York Mellon under a custody agreement for providing custodial services for the fund. During the period ended October 31, 2010, the fund was charged $19,590 pursuant to the custody agreement.
During the period ended October 31, 2010, the fund was charged $6,114 for services performed by the Chief Compliance Officer.
The components of “Due toThe Dreyfus Corporation and affiliates” in the Statement of Assets and Liabilities consist of: management fees $24,967, Rule 12b-1 distribution plan fees $6,867, shareholder services plan fees $12,374, custodian fees $2,985, chief compliance officer fees $2,248 and transfer agency per account fees $1,649, which are offset against an expense reimbursement currently in effect in the amount of $14,051.
46
(d) Each Board member also serves as a Board member of other funds within the Dreyfus complex. Annual retainer fees and attendance fees are allocated to each fund based on net assets.
NOTE 4—Securities Transactions:
The following summarizes the aggregate amount of purchases and sales (including paydowns) of investment securities and securities sold short, excluding short-term securities, financial futures and forward contracts during the period ended October 31, 2010, of which $109,875,734 in purchases and $110,159,564 in sales were from mortgage dollar roll transactions:
| | |
| | Purchases ($) | Sales ($) |
| Long transactions | 246,867,816 | 229,575,448 |
| Short sale transactions | 159,820,267 | 161,119,549 |
| Total | 406,688,083 | 390,694,997 |
Short Sales: The fund is engaged in short-selling which obligates the fund to replace the security borrowed by purchasing the security at current market value.The fund incurs a loss if the price of the security increases between the date of the short sale and the date on which the fund replaces the borrowed security.The fund realizes a gain if the price of the security declines between those dates. Until the fund replaces the borrowed security, the fund will maintain daily a segregated account with a broker or custodian of permissible liquid assets sufficient to cover its short positions. Securities sold short at October 31, 2010 and their related market values and proceeds, are set forth in the Statement of Securities Sold Short.
Mortgage Dollar Rolls: A mortgage dollar roll transaction involves a sale by the fund of mortgage related securities that it holds with an agreement by the fund to repurchase similar securities at an agreed upon price and date.The securities purchased will bear the same interest rate as those sold, but generally will be collateralized by pools of mortgages with different prepayment histories than those securities sold.
The Fund 47
NOTES TO FINANCIAL STATEMENTS (continued)
The provisions of ASC Topic 815 “Derivatives and Hedging” require qualitative disclosures about objectives and strategies for using derivatives, quantitative disclosures about fair value amounts of gains and losses on derivative instruments and disclosures about credit-risk-related contingent features in derivative agreements. The disclosure requirements distinguish between derivatives, which are accounted for as “hedges” and those that do not qualify for hedge accounting. Because investment companies value their derivatives at fair value and recognize changes in fair value through the Statement of Operations, they do not qualify for such accounting. Accordingly, even though a fund’s investments in derivatives may represent economic hedges, they are considered to be non-hedge transactions for purposes of this disclosure. The following tables show the fund’s exposure to different types of market risk as it relates to the Statement of Assets and Liabilities and the Statement of Operations, respectively.
Fair value of derivative instruments as of October 31, 2010 is shown below:
| | | |
| | Derivative | | Derivative |
| | Assets ($) | | Liabilities ($) |
| Interest rate risk1 | 215,220 | Interest rate risk1 | (170,197) |
| Foreign exchange risk2 | 381,513 | Foreign exchange risk3 | (277,080) |
| Gross fair value of | | | |
| derivatives contracts | 596,733 | | (447,277) |
| |
| Statement of Assets and Liabilities location: |
| 1 | Includes cumulative appreciation/(depreciation) on futures contracts as reported in the Statement of |
| | Financial Futures, but only the unpaid variation margin is reported in the Statement of Assets |
| | and Liabilities. |
| 2 | Unrealized appreciation on forward foreign currency exchange contracts. |
| 3 | Unrealized depreciation on forward foreign currency exchange contracts. |
The effect of derivative instruments in the Statement of Operations during the period ended October 31, 2010 is shown below:
| | | |
| | Amount of realized gain or (loss) on derivatives recognized in income ($) |
| | | Forward | |
| Underlying risk | Futures4 | Contracts5 | Total |
| Interest rate | 872,379 | — | 872,379 |
| Foreign exchange | — | 470,751 | 470,751 |
| Total | 872,379 | 470,751 | 1,343,130 |
48
| | | |
| Change in unrealized appreciation or (depreciation) on derivatives recognized in income ($) |
| | | Forward | |
| Underlying risk | Futures6 | Contracts7 | Total |
| Interest rate | (74,430) | — | (74,430) |
| Foreign exchange | — | 46,581 | 46,581 |
| Total | (74,430) | 46,581 | (27,849) |
| |
| Statement of Operations location: |
| 4 | Net realized gain (loss) on financial futures. |
| 5 | Net realized gain (loss) on forward foreign currency exchange contracts. |
| 6 | Net unrealized appreciation (depreciation) on financial futures. |
| 7 | Net unrealized appreciation (depreciation) on forward foreign currency exchange contracts. |
The following summarizes the average market value of derivatives outstanding during the period ended October 31, 2010:
| |
| | Value ($) |
| Interest rate futures contracts | 43,612,392 |
| Forward contracts | 11,970,729 |
Futures Contracts: In the normal course of pursuing its investment objective, the fund is exposed to market risk, including interest rate risk and foreign currency risk as a result of changes in value of underlying financial instruments. The fund invests in financial futures contracts in order to manage its exposure to or protect against changes in the market.A futures contract represents a commitment for the future purchase or a sale of an asset at a specified date. Upon entering into such contracts, these investments require initial margin deposits with a broker, which consist of cash or cash equivalents.The amount of these deposits is determined by the exchange or Board of Trade on which the contract is traded and is subject to change. Accordingly, variation margin payments are received or made to reflect daily unrealized gains or losses which are recorded in the Statement of Operations. Futures contracts are valued daily at the last sales price established by the Board of Trade or exchange upon which they are traded.When the contracts are closed, the fund recognizes a realized gain or loss.There is minimal counterparty credit risk to the fund with futures since futures are
The Fund 49
NOTES TO FINANCIAL STATEMENTS (continued)
exchange traded, and the exchange’s clearinghouse guarantees the futures against default. Contracts open at October 31, 2010 are set forth in the Statement of Financial Futures.
Forward Foreign Currency Exchange Contracts: The fund enters into forward contracts in order to hedge its exposure to changes in foreign currency exchange rates on its foreign portfolio holdings, to settle foreign currency transactions or as a part of its investment strategy. When executing forward contracts, the fund is obligated to buy or sell a foreign currency at a specified rate on a certain date in the future. With respect to sales of forward contracts, the fund incurs a loss if the value of the contract increases between the date the forward contract is opened and the date the forward contract is closed.The fund realizes a gain if the value of the contract decreases between those dates.With respect to purchases of forward contracts, the fund incurs a loss if the value of the contract decreases between the date the for ward contract is opened and the date the forward contract is closed.The fund realizes a gain if the value of the contract increases between those dates. Any realized gain or loss which occurred during the period is reflected in the Statement of Operations.The fund is exposed to foreign currency risk as a result of changes in value of underlying financial instruments. The fund is also exposed to credit risk associated with counterparty nonperformance on these forward contracts, which is typically limited to the unrealized gain on each open contract.The following summarizes open forward contracts at October 31, 2010:
| | | | |
| | Foreign | | | Unrealized |
| Forward Foreign Currency | Currency | | | Appreciation |
| Exchange Contracts | Amounts | Cost ($) | Value ($) (Depreciation) ($) |
| Purchases: | | | | |
| Australian Dollar, | | | | |
| Expiring 12/15/2010 | 158,445 | 142,545 | 154,300 | 11,755 |
| Australian Dollar, | | | | |
| Expiring 12/15/2010 | 115,067 | 104,542 | 112,057 | 7,515 |
| Australian Dollar, | | | | |
| Expiring 12/15/2010 | 267,150 | 246,630 | 260,161 | 13,531 |
| Australian Dollar, | | | | |
| Expiring 12/15/2010 | 113,025 | 104,644 | 110,068 | 5,424 |
50
| | | | |
| | Foreign | | | Unrealized |
| Forward Foreign Currency | Currency | | | Appreciation |
| Exchange Contracts | Amounts | Cost ($) | Value ($) (Depreciation) ($) |
| Purchases (continued): | | | | |
| Australian Dollar, | | | | |
| Expiring 12/15/2010 | 186,931 | 177,597 | 182,040 | 4,443 |
| Australian Dollar, | | | | |
| Expiring 12/15/2010 | 131,129 | 124,457 | 127,698 | 3,241 |
| Australian Dollar, | | | | |
| Expiring 12/15/2010 | 68,000 | 67,158 | 66,221 | (937) |
| Canadian Dollar, | | | | |
| Expiring 12/15/2010 | 277,253 | 268,963 | 271,530 | 2,567 |
| Canadian Dollar, | | | | |
| Expiring 12/15/2010 | 68,505 | 66,637 | 67,091 | 454 |
| Canadian Dollar, | | | | |
| Expiring 12/15/2010 | 70,655 | 68,702 | 69,197 | 495 |
| Canadian Dollar, | | | | |
| Expiring 12/15/2010 | 110,200 | 108,623 | 107,925 | (698) |
| Euro, | | | | |
| Expiring 12/15/2010 | 181,002 | 232,318 | 251,769 | 19,451 |
| Euro, | | | | |
| Expiring 12/15/2010 | 322,798 | 423,779 | 449,003 | 25,224 |
| Euro, | | | | |
| Expiring 12/15/2010 | 328,900 | 448,498 | 457,491 | 8,993 |
| Euro, | | | | |
| Expiring 12/15/2010 | 117,800 | 160,602 | 163,857 | 3,255 |
| Euro, | | | | |
| Expiring 12/15/2010 | 294,500 | 401,618 | 409,641 | 8,023 |
| Euro, | | | | |
| Expiring 12/15/2010 | 485,600 | 667,242 | 675,457 | 8,215 |
| Euro, | | | | |
| Expiring 12/15/2010 | 121,400 | 166,810 | 168,864 | 2,054 |
| Euro, | | | | |
| Expiring 12/15/2010 | 40,650 | 56,201 | 56,543 | 342 |
| Euro, | | | | |
| Expiring 12/15/2010 | 50,000 | 69,770 | 69,549 | (221) |
| Euro, | | | | |
| Expiring 12/15/2010 | 280,488 | 391,555 | 390,151 | (1,404) |
| Japanese Yen, | | | | |
| Expiring 12/15/2010 | 145,299,396 | 1,733,707 1,806,453 | 72,746 |
| New Zealand Dollar, | | | | |
| Expiring 12/15/2010 | 248,375 | 177,268 | 188,600 | 11,332 |
| New Zealand Dollar, | | | | |
| Expiring 12/15/2010 | 378,736 | 271,709 | 287,587 | 15,878 |
| Swedish Krona, | | | | |
| Expiring 12/15/2010 | 4,703,518 | 642,259 | 703,086 | 60,827 |
The Fund 51
NOTES TO FINANCIAL STATEMENTS (continued)
| | | | |
| | Foreign | | | Unrealized |
| Forward Foreign Currency | Currency | | | Appreciation |
| Exchange Contracts | Amounts | Cost ($) | Value ($) (Depreciation) ($) |
| Purchases (continued): | | | | |
| Swedish Krona, | | | | |
| Expiring 12/15/2010 | 4,775,231 | 651,722 | 713,806 | 62,084 |
| Swiss Franc, | | | | |
| Expiring 12/15/2010 | 1,126,156 | 1,116,593 | 1,144,860 | 28,267 |
| Swiss Franc, | | | | |
| Expiring 12/15/2010 | 28,885 | 29,389 | 29,364 | (25) |
| Sales: | | Proceeds ($) | | |
| Australian Dollar, | | | | |
| Expiring 12/15/2010 | 26,858 | 26,142 | 26,155 | (13) |
| Australian Dollar, | | | | |
| Expiring 12/15/2010 | 49,700 | 48,580 | 48,400 | 180 |
| Australian Dollar, | | | | |
| Expiring 12/15/2010 | 104,400 | 101,028 | 101,668 | (640) |
| Australian Dollar, | | | | |
| Expiring 12/15/2010 | 34,800 | 33,574 | 33,890 | (316) |
| Australian Dollar, | | | | |
| Expiring 12/15/2010 | 69,600 | 67,300 | 67,779 | (479) |
| British Pound, | | | | |
| Expiring 12/15/2010 | 195,677 | 299,676 | 313,426 | (13,750) |
| British Pound, | | | | |
| Expiring 12/15/2010 | 304,200 | 468,285 | 487,253 | (18,968) |
| British Pound, | | | | |
| Expiring 12/15/2010 | 82,745 | 127,619 | 132,537 | (4,918) |
| British Pound, | | | | |
| Expiring 12/15/2010 | 157,000 | 245,136 | 251,475 | (6,339) |
| British Pound, | | | | |
| Expiring 12/15/2010 | 71,400 | 112,703 | 114,365 | (1,662) |
| British Pound, | | | | |
| Expiring 12/15/2010 | 54,000 | 84,780 | 86,495 | (1,715) |
| British Pound, | | | | |
| Expiring 12/15/2010 | 247,950 | 392,625 | 397,154 | (4,529) |
| British Pound, | | | | |
| Expiring 12/15/2010 | 11,675 | 18,482 | 18,700 | (218) |
| British Pound, | | | | |
| Expiring 12/15/2010 | 85,000 | 135,807 | 136,149 | (342) |
| Canadian Dollar, | | | | |
| Expiring 12/15/2010 | 97,151 | 95,124 | 95,146 | (22) |
| Canadian Dollar, | | | | |
| Expiring 12/15/2010 | 45,900 | 44,496 | 44,953 | (457) |
| Canadian Dollar, | | | | |
| Expiring 12/15/2010 | 61,200 | 59,375 | 59,937 | (562) |
| Euro, | | | | |
| Expiring 12/15/2010 | 1,289,012 | 1,641,460 | 1,792,981 | (151,521) |
52
| | | | |
| | Foreign | | | Unrealized |
| Forward Foreign Currency | Currency | | | Appreciation |
| Exchange Contracts | Amounts | Proceeds ($) | Value ($) (Depreciation) ($) |
| Sales (continued): | | | | |
| Euro, | | | | |
| Expiring 12/15/2010 | 165,432 | 222,900 | 230,111 | (7,211) |
| Japanese Yen, | | | | |
| Expiring 12/15/2010 | 19,263,400 | 229,558 | 239,494 | (9,936) |
| Japanese Yen, | | | | |
| Expiring 12/15/2010 | 2,222,700 | 26,541 | 27,634 | (1,093) |
| Japanese Yen, | | | | |
| Expiring 12/15/2010 | 2,360,973 | 27,649 | 29,353 | (1,704) |
| Japanese Yen, | | | | |
| Expiring 12/15/2010 | 9,591,026 | 112,544 | 119,241 | (6,697) |
| Japanese Yen, | | | | |
| Expiring 12/15/2010 | 3,360,565 | 39,877 | 41,781 | (1,904) |
| Japanese Yen, | | | | |
| Expiring 12/15/2010 | 1,143,285 | 13,557 | 14,214 | (657) |
| Japanese Yen, | | | | |
| Expiring 12/15/2010 | 8,855,678 | 105,019 | 110,099 | (5,080) |
| Japanese Yen, | | | | |
| Expiring 12/15/2010 | 22,327,000 | 273,089 | 277,583 | (4,494) |
| Japanese Yen, | | | | |
| Expiring 12/15/2010 | 5,693,200 | 69,956 | 70,781 | (825) |
| Japanese Yen, | | | | |
| Expiring 12/15/2010 | 2,846,600 | 34,851 | 35,391 | (540) |
| Japanese Yen, | | | | |
| Expiring 12/15/2010 | 8,539,800 | 104,591 | 106,172 | (1,581) |
| Japanese Yen, | | | | |
| Expiring 12/15/2010 | 5,693,200 | 69,675 | 70,781 | (1,106) |
| New Zealand Dollar, | | | | |
| Expiring 12/15/2010 | 77,550 | 56,508 | 58,886 | (2,378) |
| New Zealand Dollar, | | | | |
| Expiring 12/15/2010 | 91,097 | 66,466 | 69,173 | (2,707) |
| Norwegian Krone, | | | | |
| Expiring 12/15/2010 | 72,225 | 11,753 | 12,301 | (548) |
| Norwegian Krone, | | | | |
| Expiring 12/15/2010 | 625,950 | 101,719 | 106,614 | (4,895) |
| Norwegian Krone, | | | | |
| Expiring 12/15/2010 | 649,697 | 106,916 | 110,659 | (3,743) |
| Norwegian Krone, | | | | |
| Expiring 12/15/2010 | 478,251 | 80,812 | 81,458 | (646) |
| Norwegian Krone, | | | | |
| Expiring 12/15/2010 | 61,743 | 10,439 | 10,516 | (77) |
| Norwegian Krone, | | | | |
| Expiring 12/15/2010 | 181,487 | 30,670 | 30,912 | (242) |
The Fund 53
NOTES TO FINANCIAL STATEMENTS (continued)
| | | | |
| | Foreign | | | Unrealized |
| Forward Foreign Currency | Currency | | | Appreciation |
| Exchange Contracts | Amounts | Proceeds ($) | Value ($) (Depreciation) ($) |
| Sales (continued): | | | | |
| Norwegian Krone, | | | | |
| Expiring 12/15/2010 | 465,115 | 78,702 | 79,220 | (518) |
| Norwegian Krone, | | | | |
| Expiring 12/15/2010 | 429,800 | 73,018 | 73,205 | (187) |
| Norwegian Krone, | | | | |
| Expiring 12/15/2010 | 798,200 | 136,192 | 135,952 | 240 |
| Swedish Krona, | | | | |
| Expiring 12/15/2010 | 1,830,479 | 273,038 | 273,622 | (584) |
| Swedish Krona, | | | | |
| Expiring 12/15/2010 | 1,586,400 | 235,805 | 237,136 | (1,331) |
| Swiss Franc, | | | | |
| Expiring 12/15/2010 | 51,825 | 51,708 | 52,686 | (978) |
| Swiss Franc, | | | | |
| Expiring 12/15/2010 | 107,941 | 107,593 | 109,734 | (2,141) |
| Swiss Franc, | | | | |
| Expiring 12/15/2010 | 176,000 | 175,459 | 178,923 | (3,464) |
| Swiss Franc, | | | | |
| Expiring 12/15/2010 | 52,150 | 53,439 | 53,016 | 423 |
| Swiss Franc, | | | | |
| Expiring 12/15/2010 | 114,000 | 116,292 | 115,893 | 399 |
| Swiss Franc, | | | | |
| Expiring 12/15/2010 | 63,650 | 66,319 | 64,707 | 1,612 |
| Swiss Franc, | | | | |
| Expiring 12/15/2010 | 64,206 | 67,107 | 65,272 | 1,835 |
| Swiss Franc, | | | | |
| Expiring 12/15/2010 | 93,290 | 95,298 | 94,839 | 459 |
| Swiss Franc, | | | | |
| Expiring 12/15/2010 | 234,400 | 238,542 | 238,293 | 249 |
| Swiss Franc, | | | | |
| Expiring 12/15/2010 | 29,300 | 29,710 | 29,787 | (77) |
| Gross Unrealized | | | | |
| Appreciation | | | | 381,513 |
| Gross Unrealized | | | | |
| Depreciation | | | | (277,080) |
At October 31, 2010, the cost of investments for federal income tax purposes was $75,474,339; accordingly, accumulated net unrealized appreciation on investments was $2,734,129, consisting of $2,958,901 gross unrealized appreciation and $224,772 gross unrealized depreciation.
54
REPORT OF INDEPENDENT REGISTERED
PUBLIC ACCOUNTING FIRM
Shareholders and Board of Directors
Dreyfus Total Return Advantage Fund
We have audited the accompanying statement of assets and liabilities, including the statements of investments, financial futures and securities sold short, of Dreyfus Total Return Advantage Fund (one of the series comprising Advantage Funds, Inc.) as of October 31, 2010, and the related statement of operations for the year then ended, the statement of changes in net assets for each of the two years in the period then ended and financial highlights for each of the periods indicated therein.These financial statements and financial highlights are the responsibility of the Fund’s management. Our responsibility is to express an opinion on these financial statements and financial highlights based on our audits.
We conducted our audits in accordance with the standards of the Public Company Accounting Oversight Board (United States).Those standards require that we plan and perform the audit to obtain reasonable assurance about whether the financial statements and financial highlights are free of material misstatement.We were not engaged to perform an audit of the Fund’s internal control over financial reporting. Our audits included consideration of internal control over financial reporting as a basis for designing audit procedures that are appropriate in the circumstances, but not for the purpose of expressing an opinion on the effectiveness of the Fund’s internal control over financial reporting. Accordingly, we express no such opinion.An audit also includes examining, on a test basis, evidence supporting the amounts and disclosures in the financial statements and financial highlights, assessing the accounting p rinciples used and significant estimates made by management, and evaluating the overall financial statement presentation. Our procedures included confirmation of securities owned as of October 31, 2010 by correspondence with the custodian and others. We believe that our audits provide a reasonable basis for our opinion.
In our opinion, the financial statements and financial highlights referred to above present fairly, in all material respects, the financial position of DreyfusTotal Return Advantage Fund at October 31, 2010, the results of its operations for the year then ended, the changes in its net assets for each of the two years in the period then ended and the financial highlights for each of the indicated periods, in conformity with U.S. generally accepted accounting principles.

New York, New York
December 28, 2010
The Fund 55
IMPORTANT TAX INFORMATION (Unaudited)
For federal tax purposes the fund hereby designates 98.62% of ordinary income dividends paid during the fiscal year ended October 31, 2010 as qualifying interest related dividends. Also, the fund hereby designates $.0911 per share as a short-term capital gain distribution paid and also designates $.1324 per share as a long-term capital gain distribution paid on December 28, 2009.
56
INFORMATION ABOUT THE REVIEW AND APPROVAL
OF THE FUND’S MANAGEMENT AGREEMENT (Unaudited)
At a meeting of the fund’s Board held on June 29, 2010, the Board unanimously approved an amendment, effective August 1, 2010, of the fund’s Management Agreement (“Agreement”) with Dreyfus. The Board members, none of whom are “interested persons” (as defined in the Investment Company Act of 1940, as amended) of the fund, were assisted in their review by independent legal counsel. In approving the amendment of the Agreement, the Board considered all factors that it believed to be relevant, including, among other things, the factors discussed below. Since the Board had renewed the Agreement at a meeting held on March 2, 2010 (the “March Meeting”) for a one-year term ending March 30, 2011, and, other than as discussed below, there had been no material changes in the information presented, the Board addressed many of the relevant considerations by reference to its considerations and determinations at the March Meeting.
Analysis of Nature, Extent and Quality of Services Provided to the Fund.The nature, extent and quality of services provided to the fund by Dreyfus had been considered at the March Meeting, and Dreyfus confirmed that there had been no material changes in this information. Dreyfus representatives stated, and the Board considered, Dreyfus would continue to provide the day-to-day management of the fund’s investments in accordance with the fund’s investment objective, policies and limitations as set forth in the fund’s prospectus and statement of additional information; the proposed amendment to the Agreement would not have any adverse impact on the scope or quality of the services provided to the fund by Dreyfus; and the proposed amendment also would not result in any change to the investment management of the fund.
Comparative Analysis of the Fund’s Performance, Management Fee and Expense Ratio.The Board considered the fund’s performance, management fee and expense ratio at the March Meeting.The Board did not consider the period of time since the March Meeting to be an adequate period of time for reconsideration of performance in connection with approving the amendment to the Agreement. The Board also considered that the amendment would lower the management fees paid by
The Fund 57
INFORMATION ABOUT THE REVIEW AND APPROVAL OF THE
FUND’S MANAGEMENT AGREEMENT (Unaudited) (continued)
the fund and that the proposed expense limitation would lower the fund’s expense ratio at least through March 1, 2011. As a result, the Board did not reconsider comparative fee and expense information, including fees paid to Dreyfus by mutual funds and/or separate accounts with similar investment objectives, policies and strategies as the fund, which had been considered at the March Meeting.
Analysis of Profitability and Economies of Scale.The Board had considered profitability, economies of scale and potential benefits to Dreyfus from acting as investment adviser at the March Meeting.As a result, the Board did not reconsider economies of scale and potential benefits, which would not change under the amendment from those considered at the March Meeting in a manner that would require reconsideration.
At the conclusion of these discussions, the Board agreed that it had been furnished with sufficient information to make an informed business decision with respect to amendment of the fund’s Agreement. Based on the discussions and considerations as described above, the Board made the following conclusions and determinations.
The Board concluded that the nature, extent and quality of the ser- vices provided by Dreyfus continued to be adequate and appropriate.
The Board concluded that the fee payable by the fund to Dreyfus continued to be reasonable.
The Board members considered these conclusions and determinations and, in light of the conclusions and determinations at the March Meeting and without any one factor being dispositive, the Board determined that amendment of the fund’s Agreement was in the best interests of the fund and its shareholders.
58
BOARD MEMBERS INFORMATION (Unaudited)
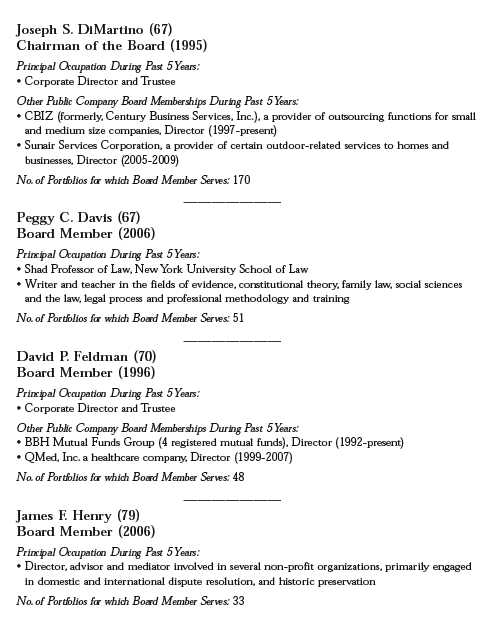
The Fund 59
BOARD MEMBERS INFORMATION (Unaudited) (continued)
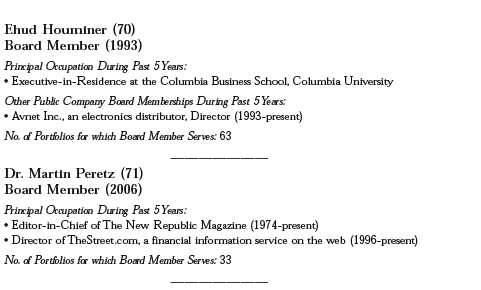
Once elected all Board Members serve for an indefinite term, but achieve Emeritus status upon reaching age 80.The address of the Board Members and Officers is in c/o The Dreyfus Corporation, 200 Park Avenue, NewYork, NewYork 10166.Additional information about the Board Members is available in the fund’s Statement of Additional Information which can be obtained from Dreyfus free of charge by calling this toll free number: 1-800-554-4611.
Dr. Paul A. Marks, Emeritus Board Member
Gloria Messinger, Emeritus Board Member
60
OFFICERS OF THE FUND (Unaudited)
BRADLEY J. SKAPYAK, President since
January 2010.
Chief Operating Officer and a director of the Manager since June 2009. From April 2003 to June 2009, Mr. Skapyak was the head of the Investment Accounting and Support Department of the Manager. He is an officer of 76 investment companies (comprised of 170 portfolios) managed by the Manager. He is 51 years old and has been an employee of the Manager since February 1988.
PHILLIP N. MAISANO, Executive Vice
President since July 2007.
Chief Investment Officer,Vice Chair and a director of the Manager, and an officer of 76 investment companies (comprised of 170 portfolios) managed by the Manager. Mr. Maisano also is an officer and/or Board member of certain other investment management subsidiaries of The Bank of New York Mellon Corporation, each of which is an affiliate of the Manager. He is 63 years old and has been an employee of the Manager since November 2006. Prior to joining the Manager, Mr. Maisano served as Chairman and Chief Executive Officer of EACM Advisors, an affiliate of the Manager, since August 2004.
MICHAEL A. ROSENBERG, Vice President
and Secretary since August 2005.
Assistant General Counsel of BNY Mellon, and an officer of 77 investment companies (comprised of 195 portfolios) managed by the Manager. He is 50 years old and has been an employee of the Manager since October 1991.
KIESHA ASTWOOD, Vice President and
Assistant Secretary since January 2010.
Counsel of BNY Mellon, and an officer of 77 investment companies (comprised of 195 portfolios) managed by the Manager. She is 37 years old and has been an employee of the Manager since July 1995.
JAMES BITETTO, Vice President and
Assistant Secretary since August 2005.
Senior Counsel of BNY Mellon and Secretary of the Manager, and an officer of 77 investment companies (comprised of 195 portfolios) managed by the Manager. He is 44 years old and has been an employee of the Manager since December 1996.
JONI LACKS CHARATAN, Vice President
and Assistant Secretary since
August 2005.
Senior Counsel of BNY Mellon, and an officer of 77 investment companies (comprised of 195 portfolios) managed by the Manager. She is 54 years old and has been an employee of the Manager since October 1988.
JOSEPH M. CHIOFFI, Vice President and
Assistant Secretary since August 2005.
Senior Counsel of BNY Mellon, and an officer of 77 investment companies (comprised of 195 portfolios) managed by the Manager. He is 48 years old and has been an employee of the Manager since June 2000.
KATHLEEN DENICHOLAS, Vice President
and Assistant Secretary since
January 2010.
Senior Counsel of BNY Mellon, and an officer of 77 investment companies (comprised of 195 portfolios) managed by the Manager. She is 36 years old and has been an employee of the Manager since February 2001.
JANETTE E. FARRAGHER, Vice President
and Assistant Secretary since
August 2005.
Assistant General Counsel of BNY Mellon, and an officer of 77 investment companies (comprised of 195 portfolios) managed by the Manager. She is 47 years old and has been an employee of the Manager since February 1984.
The Fund 61
OFFICERS OF THE FUND (Unaudited) (continued)
JOHN B. HAMMALIAN, Vice President and
Assistant Secretary since August 2005.
Managing Counsel of BNY Mellon, and an officer of 77 investment companies (comprised of 195 portfolios) managed by the Manager. He is 47 years old and has been an employee of the Manager since February 1991.
M. CRISTINA MEISER, Vice President and
Assistant Secretary since January 2010.
Senior Counsel of BNY Mellon, and an officer of 77 investment companies (comprised of 195 portfolios) managed by the Manager. She is 40 years old and has been an employee of the Manager since August 2001.
ROBERT R. MULLERY, Vice President and
Assistant Secretary since August 2005.
Managing Counsel of BNY Mellon, and an officer of 77 investment companies (comprised of 195 portfolios) managed by the Manager. He is 58 years old and has been an employee of the Manager since May 1986.
JEFF PRUSNOFSKY, Vice President and
Assistant Secretary since August 2005.
Managing Counsel of BNY Mellon, and an officer of 77 investment companies (comprised of 195 portfolios) managed by the Manager. He is 45 years old and has been an employee of the Manager since October 1990.
JAMES WINDELS, Treasurer since
November 2001.
Director – Mutual Fund Accounting of the Manager, and an officer of 77 investment companies (comprised of 195 portfolios) managed by the Manager. He is 52 years old and has been an employee of the Manager since April 1985.
RICHARD CASSARO, Assistant Treasurer
since January 2008.
Senior Accounting Manager – Money Market and Municipal Bond Funds of the Manager, and an officer of 77 investment companies (comprised of 195 portfolios) managed by the Manager. He is 51 years old and has been an employee of the Manager since September 1982.
GAVIN C. REILLY, Assistant Treasurer
since December 2005.
Tax Manager of the Investment Accounting and Support Department of the Manager, and an officer of 77 investment companies (comprised of 195 portfolios) managed by the Manager. He is 42 years old and has been an employee of the Manager since April 1991.
ROBERT ROBOL, Assistant Treasurer
since August 2005.
Senior Accounting Manager – Fixed Income Funds of the Manager, and an officer of 77 investment companies (comprised of 195 portfolios) managed by the Manager. He is 46 years old and has been an employee of the Manager since October 1988.
ROBERT SALVIOLO, Assistant Treasurer
since July 2007.
Senior Accounting Manager – Equity Funds of the Manager, and an officer of 77 investment companies (comprised of 195 portfolios) managed by the Manager. He is 43 years old and has been an employee of the Manager since June 1989.
62
ROBERT SVAGNA, Assistant Treasurer
since December 2002.
Senior Accounting Manager – Equity Funds of the Manager, and an officer of 77 investment companies (comprised of 195 portfolios) managed by the Manager. He is 43 years old and has been an employee of the Manager since November 1990.
JOSEPH W. CONNOLLY, Chief Compliance
Officer since October 2004.
Chief Compliance Officer of the Manager and The Dreyfus Family of Funds (77 investment companies, comprised of 195 portfolios). From November 2001 through March 2004, Mr. Connolly was first Vice-President, Mutual Fund Servicing for Mellon Global Securities Services. In that capacity, Mr. Connolly was responsible for managing Mellon’s Custody, Fund Accounting and Fund Administration services to third-party mutual fund clients. He is 53 years old and has served in various capacities with the Manager since 1980, including manager of the firm’s Fund Accounting Department from 1997 through October 2001.
NATALIA GRIBAS, Anti-Money Laundering
Compliance Officer since July 2010.
Anti-Money Laundering Compliance Officer of the Distributor, and the Anti-Money Laundering Compliance Officer of 73 investment companies (comprised of 191 portfolios) managed by the Manager. She is 40 years old and has been an employee of the Distributor since September 2008.
The Fund 63
For More Information
Telephone Call your financial representative or 1-800-554-4611
Mail The Dreyfus Family of Funds, 144 Glenn Curtiss Boulevard, Uniondale, NY 11556-0144
The fund files its complete schedule of portfolio holdings with the Securities and Exchange Commission (“SEC”) for the first and third quarters of each fiscal year on Form N-Q. The fund’s Forms N-Q are available on the SEC’s website at http://www.sec.gov and may be reviewed and copied at the SEC’s Public Reference Room in Washington, DC. Information on the operation of the Public Reference Room may be obtained by calling 1-800-SEC-0330.
A description of the policies and procedures that the fund uses to determine how to vote proxies relating to portfolio securities, and information regarding how the fund voted these proxies for the most recent 12-month period ended June 30 is available at http://www.dreyfus.com and on the SEC’s website at http://www.sec.gov. The description of the policies and procedures is also available without charge, upon request, by calling 1-800-645-6561.

Global Alpha Fund
ANNUAL REPORT October 31, 2010

Save time. Save paper. View your next shareholder report online as soon as it’s available. Log into www.dreyfus.com and sign up for Dreyfus eCommunications. It’s simple and only takes a few minutes.
The views expressed in this report reflect those of the portfolio manager only through the end of the period covered and do not necessarily represent the views of Dreyfus or any other person in the Dreyfus organization. Any such views are subject to change at any time based upon market or other conditions and Dreyfus disclaims any responsibility to update such views.These views may not be relied on as investment advice and, because investment decisions for a Dreyfus fund are based on numerous factors, may not be relied on as an indication of trading intent on behalf of any Dreyfus fund.

| | Contents |
| | THE FUND |
| 2 | A Letter from the Chairman and CEO |
| 3 | Discussion of Fund Performance |
| 6 | Fund Performance |
| 8 | Understanding Your Fund’s Expenses |
| 8 | Comparing Your Fund’s Expenses With Those of Other Funds |
| 9 | Statement of Investments |
| 52 | Statement of Financial Futures |
| 53 | Statement of Assets and Liabilities |
| 54 | Statement of Operations |
| 55 | Statement of Changes in Net Assets |
| 57 | Financial Highlights |
| 60 | Notes to Financial Statements |
| 86 | Report of Independent Registered Public Accounting Firm |
| 87 | Board Members Information |
| 89 | Officers of the Fund |
| | FOR MORE INFORMATION |
| | Back Cover |
Global Alpha Fund
The Fund

A LETTER FROM THE CHAIRMAN AND CEO
Dear Shareholder:
We are pleased to present this annual report for Global Alpha Fund, covering the 12-month period from November 1, 2009, through October 31, 2010.
Although a double-dip recession has recently become an increasingly unlikely scenario in our view, persistent uncertainty regarding the breadth and strength of the U.S. and global economic recoveries led to bouts of heightened volatility for U.S. stocks during most of 2010.The spending power of the U.S. consumer, long an important catalyst for economic growth, has been diminished by concerns over job security and an inability to generate cash from home equity.The second major driver of sustainable growth, corporate investment, has been stunted to a similar extent by tight credit conditions. However, the recent announcement of additional quantitative easing (QE2) measures by the Federal Reserve Board, as well as improved fundamentals across many developing nations, have helped support moderate global economic growth.
Uncertainty will probably remain in the broader financial markets until we see more evidence of robust economic growth, but we remain optimistic regarding the prospects for equities. Many stocks of quality companies with healthy balance sheets, higher credit ratings and strong cash flows appear to be currently priced at a discount.With that, we strongly suggest that you meet with your financial advisor to discuss the potential opportunities which may exist in the global markets, as well as to evaluate your portfolio to help meet your individual investment needs and your future goals relative to your risk-tolerance level.
For information about how the fund performed during the reporting period, as well as general market perspectives, we provide a Discussion of Fund Performance on the pages that follow.
Thank you for your continued confidence and support.
Jonathan R. Baum
Chairman and Chief Executive Officer
The Dreyfus Corporation
November 15, 2010
2

DISCUSSION OF FUND PERFORMANCE
For the period of November 1, 2009, through October 31, 2010, as provided by Vassilis Dagioglu, James Stavena, Torrey Zaches and Joseph Miletich, Portfolio Managers
Fund and Market Performance Overview
For the 12-month period ended October 31, 2010, Global Alpha Fund’s Class A shares produced a total return of 14.13%, Class C shares returned 13.22% and Class I shares returned 14.51%.1 In comparison, the fund’s benchmark, a hybrid index comprised of 60% Morgan Stanley Capital International World Index (half-hedged) and 40% Citigroup World Government Bond Index 1+ World Index (half-hedged), produced a total return of 10.11% for the same period.2 Separately, the Morgan Stanley Capital International World Index (half-hedged) produced a total return of 12.35%, and the Citigroup World Governm ent Bond Index 1+ World Index (half-hedged) produced a 5.82% total return for the same period.
Relative mispricing across global markets converged during the reporting period as a result of improved market liquidity and a recovering global economy.The fund produced higher returns than its benchmark, as it successfully adopted various equity, bond and currency positions that were designed to take fuller advantage of the economic recovery and changes in relative valuations across geographic regions.
The Fund’s Investment Approach
The fund seeks total return through investments in securities and instruments that provide investment exposure to global stock, bond and currency markets and fixed-income securities. For allocation among equity markets, the portfolio managers employ a bottom-up valuation approach using proprietary models to derive market level expected returns. For allocation among bond markets, the portfolio managers use proprietary models to identify temporary mispricings among the long-term government bond markets. The most relevant long-term bond yield within each country serves as the expected return for each bond market. Our quantitative investment approach is designed to identify and exploit relative misvaluations across and
The Fund 3
DISCUSSION OF FUND PERFORMANCE (continued)
within major developed capital markets such as the United States, Canada, Japan,Australia and many Western European countries.
Economic Concerns Sparked Market Volatility
Although the reporting period began in the midst of an economic recovery that propelled many financial markets higher through the first quarter of 2010, investor confidence was shaken in the spring by a sovereign debt crisis in Europe. Greece found itself unable to refinance a heavy debt load, leading to devaluation of the euro against most other major currencies. Meanwhile, in the United States, mixed housing and employment data and a catastrophic oil spill in the Gulf of Mexico added to global economic uncertainty. As investor sentiment deteriorated during the spring and summer, global financial markets generally declined sharply.
However, investors’ fears at the time may have been overblown. Earnings for multinational companies generally continued to improve, and the U.S. and global economies remained on mildly upward trajectories through the fall. In addition, anticipation of a second round of quantitative easing of U.S. monetary policy helped support certain stocks, bonds and currencies in September and October.
Stock, Bond and Currency Strategies Supported Fund Results
The fund proved to be well positioned in advance of the European sovereign debt crisis, enabling it to participate fully in the devaluation of the euro and rally in U.S. bonds as global investors sought traditional safe havens. Later in the reporting period, when the Federal Reserve Board announced the second round of quantitative easing in the United States, the fund further benefited from a short position in the U.S. dollar, which shed some of its value relative to other currencies, such as the Australian dollar, Canadian dollar and Norwegian krona. However, the fund received its strongest contributions to performance during the reporting period from global equity markets, where a bearish position in Japanese equities and a bullish position in the United Kingdom produced above-average results with below-average levels of volatility.
Although the fund encountered relatively few disappointments during the reporting period, its relative performance was undermined to a mild degree by short positions in the British pound and European equities. More specifically, the fund suffered from its long exposure to the stock markets of France, Spain and the Netherlands.
4
Seeking Opportunities in Currency and Equity Markets
Despite the financial markets’ recent positive responses to signs of potential improvement in the global economy, we expect uncertainty to persist into 2011 as investors “wait and see” regarding the efficacy of current monetary stimulus efforts in the face of persistent headwinds. Therefore, the fund has adopted a generally market-neutral investment posture, without taking directional bets regarding the overall performance of global stock and bond markets.We see more opportunity for returns in the currency markets, where we anticipate further devaluation of the U.S. dollar. We also have identified valuation disparities across regional equity markets, as stock prices in the United Kingdom appear more attractive to us than they do in North American markets. In our judgment, these strategies position the fund to participate in global financial markets while effectively managing the risks of heightened market volatility as economic conditions change.
November 15, 2010
| |
| | Investing in foreign companies involves special risks, including changes in currency rates, political, |
| | economic and social instability, a lack of comprehensive company information, differing auditing |
| | and legal standards, and less market liquidity. |
| | Equity securities are subject generally to market, market sector, market liquidity, issuer and |
| | investment style risks, among other factors, to varying degrees, all of which are more fully described in |
| | the fund’s prospectus. Bond securities are subject generally to interest rate, credit, liquidity, call, sector |
| | and market risks, to varying degrees, all of which are more fully described in the fund’s prospectus. |
| | Investments in foreign currencies are subject to the risk that those currencies will decline in value |
| | relative to the U.S. dollar, or, in the case of hedged positions, that the U.S. dollar will decline |
| | relative to the currency being hedged. |
| 1 | Total return includes reinvestment of dividends and any capital gains paid, and does not take into |
| | consideration the maximum initial sales charge in the case of Class A shares, or the applicable |
| | contingent deferred sales charge imposed on redemptions in the case of Class C shares. Had these |
| | charges been reflected, returns would have been lower. Past performance is no guarantee of future |
| | results. Share price, yield and investment return fluctuate such that upon redemption, fund shares |
| | may be worth more or less than their original cost. |
| 2 | SOURCES: FactSet – Reflects reinvestment of net dividends and, where applicable, capital gain |
| | distributions.The Morgan Stanley Capital International (MSCI) World Index is an unmanaged |
| | index of global stock market performance, including the United States, Canada, Europe,Australia, |
| | New Zealand and the Far East.The Citigroup World Government Bond Index is a market- |
| | capitalization weighted index which includes select designated government bond markets of |
| | developed countries. Investors cannot invest directly in any index. |
The Fund 5
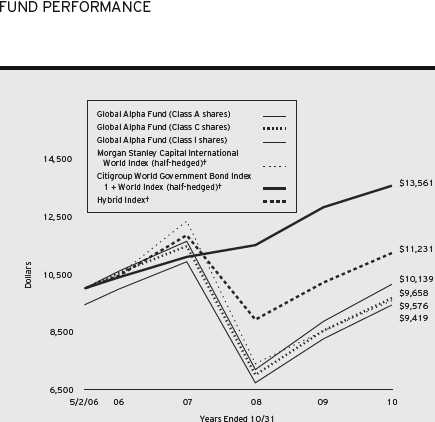
Comparison of change in value of $10,000 investment in Global Alpha Fund Class A shares, Class C shares and Class I shares with the Morgan Stanley Capital International World Index (half-hedged), the Citigroup World Government Bond Index 1 + World Index (half-hedged) and the Hybrid Index
† Source: FactSet
Past performance is not predictive of future performance.
The above graph compares a $10,000 investment made in Class A, Class C and Class I shares of Global Alpha Fund on May 2, 2006 (inception date) to a $10,000 investment made on that date in each of the following: the Morgan Stanley Capital International World Index (the “MSCI Index”) (half-hedged); the Citigroup World Government Bond Index 1 + World Index (the “CWGB Index”) (half-hedged); and an unmanaged hybrid index composed of 60% MSCI Index and 40% CWGB Index (the “Hybrid Index”) (half-hedged). Returns assume all dividends and capital gain distributions are reinvested.
The fund invests primarily in instruments that provide exposure to global equity, bond and currency markets.The fund’s performance shown in the line graph takes into account the maximum initial sales charge on Class A shares and all other applicable fees and expenses on all classes.The MSCI Index (half-hedged) is an unmanaged index of global stock market performance, including the United States, Canada,Australia, New Zealand and the Far East and includes net dividends reinvested.The CWGB Index (half-hedged) is an unmanaged index that tracks the performance of 22 government bond markets. Unlike a mutual fund, the indices are not subject to charges, fees and other expenses. Investors cannot invest directly in any index. Further information relating to fund performance, including expense reimbursements, if applicable, is contained in the Financial Highlights section of the prospectus and elsewhere in t his report.
6
| | | |
| Average Annual Total Returns as of 10/31/10 | | | |
| |
| | Inception | | From |
| | Date | 1 Year | Inception |
| Class A shares | | | |
| with maximum sales charge (5.75%) | 5/2/06 | 7.56% | –1.32% |
| without sales charge | 5/2/06 | 14.13% | –0.02% |
| Class C shares | | | |
| with applicable redemption charge † | 5/2/06 | 12.22% | –0.77% |
| without redemption | 5/2/06 | 13.22% | –0.77% |
| Class I shares | 5/2/06 | 14.51% | 0.31% |
| Morgan Stanley Capital International | | | |
| World Index (half-hedged)†† | 4/30/06 | 12.35% | –0.96% |
| Citigroup World Government Bond | | | |
| Index 1 + World Index (half-hedged)†† | 4/30/06 | 5.82% | 7.00% |
| Hybrid Index†† | 4/30/06 | 10.11% | 2.61% |
| |
| Past performance is not predictive of future performance.The fund’s performance shown in the graph and table does not |
| reflect the deduction of taxes that a shareholder would pay on fund distributions or the redemption of fund shares. |
| † | The maximum contingent deferred sales charge for Class C shares is 1% for shares redeemed within one year of the |
| | date of purchase. |
| †† | For comparative purposes, the value of the Index as of 4/30/06 is used as the beginning value on 5/2/06. |
The Fund 7
UNDERSTANDING YOUR FUND’S EXPENSES (Unaudited)
As a mutual fund investor, you pay ongoing expenses, such as management fees and other expenses. Using the information below, you can estimate how these expenses affect your investment and compare them with the expenses of other funds.You also may pay one-time transaction expenses, including sales charges (loads) and redemption fees, which are not shown in this section and would have resulted in higher total expenses. For more information, see your fund’s prospectus or talk to your financial adviser.
Review your fund’s expenses
The table below shows the expenses you would have paid on a $1,000 investment in Global Alpha Fund from May 1, 2010 to October 31, 2010. It also shows how much a $1,000 investment would be worth at the close of the period, assuming actual returns and expenses.
Expenses and Value of a $1,000 Investment
assuming actual returns for the six months ended October 31, 2010
| | | |
| | Class A | Class C | Class I |
| Expenses paid per $1,000† | $ 10.63 | $ 14.57 | $ 8.59 |
| Ending value (after expenses) | $1,076.60 | $1,071.60 | $1,078.20 |
COMPARING YOUR FUND’S EXPENSES
WITH THOSE OF OTHER FUNDS (Unaudited)
Using the SEC’s method to compare expenses
The Securities and Exchange Commission (SEC) has established guidelines to help investors assess fund expenses. Per these guidelines, the table below shows your fund’s expenses based on a $1,000 investment, assuming a hypothetical 5% annualized return. You can use this information to compare the ongoing expenses (but not transaction expenses or total cost) of investing in the fund with those of other funds.All mutual fund shareholder reports will provide this information to help you make this comparison. Please note that you cannot use this information to estimate your actual ending account balance and expenses paid during the period.
Expenses and Value of a $1,000 Investment
assuming a hypothetical 5% annualized return for the six months ended October 31, 2010
| | | |
| | Class A | Class C | Class I |
| Expenses paid per $1,000† | $ 10.31 | $ 14.14 | $ 8.34 |
| Ending value (after expenses) | $1,014.97 | $1,011.14 | $1,016.94 |
|
| † Expenses are equal to the fund’s annualized expense ratio of 2.03% for Class A, 2.79% for Class C and 1.64% |
| for Class I, multiplied by the average account value over the period, multiplied by 184/365 (to reflect the one-half |
| year period). |
8
STATEMENT OF INVESTMENTS
October 31, 2010
| | | |
| Common Stocks—58.0% | Shares | | Value ($) |
| Australia—2.3% | | | |
| AGL Energy | 776 | | 12,239 |
| Alumina | 4,253 | | 8,463 |
| Amcor | 1,623 | | 10,691 |
| AMP | 3,297 | | 17,257 |
| Asciano Group | 5,000 a | 7,670 |
| ASX | 302 | | 10,982 |
| Australia & New Zealand Banking Group | 4,137 | | 100,607 |
| AXA Asia Pacific Holdings | 1,952 | | 10,409 |
| Bendigo and Adelaide Bank | 679 | | 6,023 |
| BHP Billiton | 5,485 | | 225,379 |
| BlueScope Steel | 3,664 | | 7,165 |
| Boral | 1,114 | | 4,794 |
| Brambles | 2,254 | | 14,074 |
| CFS Retail Property Trust | 2,267 | | 4,133 |
| Coca-Cola Amatil | 754 | | 8,994 |
| Cochlear | 74 | | 5,151 |
| Commonwealth Bank of Australia | 2,534 | | 121,459 |
| Computershare | 633 | | 6,279 |
| Crown | 793 | | 6,475 |
| CSL | 922 | | 29,670 |
| Dexus Property Group | 10,980 | | 8,933 |
| Fairfax Media | 3,972 | | 5,645 |
| Fortescue Metals Group | 1,686 | a | 10,329 |
| Foster’s Group | 3,711 | | 21,243 |
| Goodman Group | 11,621 | | 7,176 |
| GPT Group | 2,824 | | 7,723 |
| Incitec Pivot | 2,270 | | 8,277 |
| Insurance Australia Group | 3,514 | | 13,089 |
| Intoll Group | 6,011 | | 8,867 |
| James Hardie Industries-CDI | 813 | a | 4,295 |
| Leighton Holdings | 197 | | 7,087 |
| Lend Lease Group | 956 | | 6,756 |
| Macquarie Group | 570 | | 20,225 |
| Metcash | 1,382 | | 5,920 |
| Mirvac Group | 4,593 | | 5,830 |
The Fund 9
STATEMENT OF INVESTMENTS (continued)
| | |
| Common Stocks (continued) | Shares | Value ($) |
| Australia (continued) | | |
| National Australia Bank | 3,461 | 86,372 |
| Newcrest Mining | 1,226 | 48,021 |
| OneSteel | 2,718 | 7,193 |
| Orica | 588 | 14,513 |
| Origin Energy | 1,439 | 22,483 |
| OZ Minerals | 7,338 | 11,257 |
| Paladin Energy | 1,333 a | 5,357 |
| Qantas Airways | 1,470 a | 4,092 |
| QBE Insurance Group | 1,687 | 28,409 |
| Rio Tinto | 717 | 58,115 |
| Santos | 1,336 | 16,526 |
| Sims Metal Management | 204 | 3,285 |
| Sonic Healthcare | 650 | 6,938 |
| Stockland | 4,005 | 14,800 |
| Suncorp-Metway | 2,037 | 18,369 |
| TABCORP Holdings | 1,233 | 8,919 |
| Tatts Group | 1,524 | 3,735 |
| Telstra | 7,187 | 18,809 |
| Toll Holdings | 1,206 | 7,329 |
| Transurban Group | 1,655 | 8,500 |
| Wesfarmers | 1,658 | 53,858 |
| Wesfarmers-PPS | 190 | 6,218 |
| Westfield Group | 3,596 | 43,637 |
| Westpac Banking | 4,861 | 108,160 |
| Woodside Petroleum | 897 | 38,247 |
| Woolworths | 2,048 | 56,911 |
| WorleyParsons | 374 | 8,413 |
| | | 1,467,775 |
| Austria—.1% | | |
| Erste Group Bank | 335 | 15,100 |
| IMMOFINANZ | 1,396 a | 5,491 |
| OMV | 234 | 8,731 |
| Raiffeisen Bank International | 116 | 6,530 |
| Telekom Austria | 603 | 9,219 |
| Verbund | 172 | 6,865 |
10
| | | |
| Common Stocks (continued) | Shares | | Value ($) |
| Austria (continued) | | | |
| Vienna Insurance Group | 90 | | 4,834 |
| Voestalpine | 207 | | 8,195 |
| | | | 64,965 |
| Belgium—.3% | | | |
| Ageas | 3,624 | | 11,127 |
| Anheuser-Busch InBev | 1,200 | | 75,113 |
| Anheuser-Busch InBev (STRIP) | 1,224 | a | 5 |
| Belgacom | 249 | | 9,756 |
| Cia Nationale e Portefeuille | 78 | | 4,153 |
| Colruyt | 135 | | 7,595 |
| Delhaize Group | 180 | | 12,557 |
| Dexia | 957 | a | 4,255 |
| Groupe Bruxelles Lambert | 132 | | 11,674 |
| Groupe Bruxelles Lambert (STRIP) | 31 | a | 0 |
| KBC Groep | 268 | a | 11,642 |
| Mobistar | 79 | | 5,222 |
| Solvay | 91 | | 9,624 |
| UCB | 179 | | 6,934 |
| Umicore | 206 | | 9,683 |
| | | | 179,340 |
| China—.0% | | | |
| Sands China | 3,600 | | 7,848 |
| Denmark—.3% | | | |
| AP Moller—Maersk, Cl. A | 1 | | 8,394 |
| AP Moller—Maersk, Cl. B | 2 | | 17,335 |
| Carlsberg, Cl. B | 180 | | 19,662 |
| Coloplast, Cl. B | 47 | | 5,813 |
| Danske Bank | 813 | a | 21,595 |
| DSV | 488 | | 9,988 |
| Novo Nordisk, Cl. B | 714 | | 75,063 |
| Novozymes, Cl. B | 81 | | 10,780 |
| Tryg | 63 | | 3,171 |
| Vestas Wind Systems | 325 | a | 10,359 |
| William Demant Holding | 49 | a | 3,669 |
| | | | 185,829 |
The Fund 11
STATEMENT OF INVESTMENTS (continued)
| | |
| Common Stocks (continued) | Shares | Value ($) |
| Finland—.3% | | |
| Elisa | 324 | 6,922 |
| Fortum | 749 | 21,206 |
| Kesko, Cl. B | 161 | 7,971 |
| Kone, Cl. B | 244 | 13,057 |
| Metso | 231 | 10,939 |
| Neste Oil | 180 | 2,982 |
| Nokia | 6,157 | 66,407 |
| Nokian Renkaat | 166 | 5,745 |
| Orion, Cl. B | 239 | 5,072 |
| Outokumpu | 185 | 3,320 |
| Pohjola Bank | 426 | 5,385 |
| Rautaruukki | 107 | 2,122 |
| Sampo, Cl. A | 754 | 21,096 |
| Sanoma | 219 | 4,928 |
| Stora Enso, Cl. R | 1,052 | 10,440 |
| UPM-Kymmene | 808 | 13,420 |
| Wartsila | 152 | 10,648 |
| | | 211,660 |
| France—2.7% | | |
| Accor | 237 | 9,706 |
| Aeroports de Paris | 60 | 5,090 |
| Air France | 288 a | 5,250 |
| Air Liquide | 434 | 56,063 |
| Alcatel-Lucent | 3,600 a | 12,619 |
| Alstom | 320 | 16,127 |
| Atos Origin | 112 a | 5,172 |
| AXA | 2,777 | 50,485 |
| BioMerieux | 15 | 1,441 |
| BNP Paribas | 1,556 | 113,648 |
| Bouygues | 373 | 16,416 |
| Bureau Veritas | 111 | 8,192 |
| Cap Gemini | 262 | 13,348 |
| Carrefour | 986 | 53,145 |
| Casino Guichard Perrachon | 98 | 9,194 |
| Christian Dior | 98 | 14,159 |
| Cie de St-Gobain | 620 | 28,920 |
12
| | |
| Common Stocks (continued) | Shares | Value ($) |
| France (continued) | | |
| Cie Generale d’Optique Essilor International | 319 | 21,273 |
| Cie Generale de Geophysique-Veritas | 212 a | 4,936 |
| Cie Generale des Etablissements Michelin, Cl. B | 313 | 24,862 |
| CNP Assurances | 276 | 5,501 |
| Credit Agricole | 1,494 | 24,451 |
| Danone | 912 | 57,643 |
| Dassault Systemes | 114 | 8,732 |
| Edenred | 237 a | 4,958 |
| EDF | 380 | 17,390 |
| Eiffage | 95 | 4,687 |
| Eramet | 10 | 3,462 |
| Eurazeo | 71 | 5,388 |
| Eutelsat Communications | 173 | 6,489 |
| France Telecom | 3,036 | 72,853 |
| GDF Suez | 2,037 | 81,199 |
| Gecina | 42 | 5,090 |
| Groupe Eurotunnel | 786 | 7,801 |
| Hermes International | 81 | 17,163 |
| ICADE | 48 | 5,270 |
| Iliad | 42 | 4,723 |
| Imerys | 52 | 3,099 |
| Ipsen | 26 | 914 |
| JC Decaux | 159 a | 4,651 |
| Klepierre | 157 | 6,099 |
| L’Oreal | 390 | 45,728 |
| Lafarge | 317 | 18,091 |
| Lagardere | 214 | 9,115 |
| Legrand | 161 | 6,207 |
| LVMH Moet Hennessy Louis Vuitton | 399 | 62,444 |
| Metropole Television | 98 | 2,390 |
| Natixis | 1,498 a | 9,176 |
| Neopost | 74 | 6,139 |
| PagesJaunes Groupe | 318 | 3,492 |
| Pernod-Ricard | 329 | 29,133 |
| Peugeot | 316 a | 12,561 |
| PPR | 127 | 20,794 |
The Fund 13
STATEMENT OF INVESTMENTS (continued)
| | |
| Common Stocks (continued) | Shares | Value ($) |
| France (continued) | | |
| Publicis Groupe | 208 | 10,347 |
| Renault | 306 a | 16,980 |
| Safran | 286 | 9,055 |
| Sanofi-Aventis | 1,732 | 120,798 |
| Schneider Electric | 390 | 55,290 |
| SCOR | 300 | 7,368 |
| Societe BIC | 49 | 4,342 |
| Societe Generale | 1,027 | 61,415 |
| Societe Television Francaise 1 | 223 | 3,634 |
| Sodexo | 168 | 10,919 |
| Suez Environnement | 394 | 7,691 |
| Technip | 170 | 14,269 |
| Thales | 168 | 6,840 |
| Total | 3,480 | 188,854 |
| Unibail-Rodamco | 147 a | 30,586 |
| Vallourec | 190 | 19,692 |
| Veolia Environnement | 578 | 16,955 |
| Vinci | 718 | 38,301 |
| Vivendi | 2,005 | 57,114 |
| | | 1,723,329 |
| Germany—2.1% | | |
| Adidas | 356 | 23,191 |
| Allianz | 750 | 93,859 |
| BASF | 1,516 | 110,158 |
| Bayer | 1,367 | 101,877 |
| Bayerische Motoren Werke | 553 | 39,591 |
| Beiersdorf | 161 | 10,475 |
| Celesio | 112 | 2,667 |
| Commerzbank | 1,297 a | 11,672 |
| Continental | 69 a | 5,986 |
| Daimler | 1,497 a | 98,686 |
| Deutsche Bank | 1,461 | 84,109 |
| Deutsche Boerse | 321 | 22,558 |
| Deutsche Lufthansa | 309 a | 6,603 |
| Deutsche Post | 1,407 | 26,205 |
| Deutsche Postbank | 101 a | 3,512 |
14
| | | |
| Common Stocks (continued) | Shares | | Value ($) |
| Germany (continued) | | | |
| Deutsche Telekom | 4,687 | | 67,815 |
| E.ON | 2,952 | | 92,317 |
| Fresenius Medical Care & Co. | 350 | | 22,265 |
| GEA Group | 268 | | 6,999 |
| Hannover Rueckversicherung | 81 | | 4,092 |
| HeidelbergCement | 234 | | 12,224 |
| Henkel & Co. | 177 | | 8,779 |
| Hochtief | 76 | | 6,576 |
| Infineon Technologies | 1,786 | a | 14,040 |
| K+S | 274 | | 19,045 |
| Linde | 249 | | 35,802 |
| MAN | 177 | | 19,435 |
| Merck | 106 | | 8,818 |
| Metro | 187 | | 13,089 |
| Muenchener Rueckversicherungs | 325 | | 50,750 |
| RWE | 692 | | 49,533 |
| Salzgitter | 53 | | 3,800 |
| SAP | 1,419 | | 73,901 |
| Siemens | 1,359 | | 155,038 |
| Suedzucker | 90 | | 2,127 |
| ThyssenKrupp | 561 | | 20,616 |
| Volkswagen | 50 | | 6,558 |
| Wacker Chemie | 21 | | 4,327 |
| | | | 1,339,095 |
| Greece—.1% | | | |
| Alpha Bank | 911 | a | 6,027 |
| Bank of Cyprus Public | 1,162 | | 5,410 |
| Coca-Cola Hellenic Bottling | 333 | | 8,609 |
| EFG Eurobank Ergasias | 769 | a | 4,756 |
| Hellenic Telecommunications Organization | 542 | | 4,332 |
| National Bank of Greece | 1,091 | a | 11,934 |
| OPAP | 436 | | 8,211 |
| Piraeus Bank | 700 | a | 3,639 |
| Public Power | 232 | | 3,886 |
| | | | 56,804 |
The Fund 15
STATEMENT OF INVESTMENTS (continued)
| | |
| Common Stocks (continued) | Shares | Value ($) |
| Hong Kong—.7% | | |
| Bank of East Asia | 2,540 | 10,845 |
| BOC Hong Kong Holdings | 7,000 | 21,942 |
| Cathay Pacific Airways | 2,000 | 5,379 |
| Cheung Kong Holdings | 2,000 | 30,443 |
| Cheung Kong Infrastructure Holdings | 1,000 | 4,179 |
| CLP Holdings | 3,000 | 24,380 |
| Esprit Holdings | 2,162 | 11,643 |
| Hang Lung Group | 1,000 | 6,637 |
| Hang Lung Properties | 4,000 | 19,581 |
| Hang Seng Bank | 1,300 | 19,016 |
| Henderson Land Development | 2,000 | 14,202 |
| Hong Kong & China Gas | 7,700 | 18,554 |
| Hong Kong Exchanges & Clearing | 1,700 | 37,411 |
| HongKong Electric Holdings | 2,500 | 15,882 |
| Hopewell Holdings | 1,000 | 3,147 |
| Hutchison Whampoa | 4,000 | 39,421 |
| Kerry Properties | 1,500 | 8,320 |
| Li & Fung | 4,000 | 21,129 |
| Link REIT | 4,500 | 13,873 |
| MTR | 2,000 | 7,611 |
| New World Development | 4,000 | 7,894 |
| Shangri-La Asia | 2,000 | 4,499 |
| Sino Land | 4,000 | 8,348 |
| Sun Hung Kai Properties | 2,000 | 34,261 |
| Swire Pacific, Cl. A | 1,500 | 21,284 |
| Wharf Holdings | 2,000 | 13,132 |
| Wheelock & Co. | 2,000 | 7,004 |
| Wynn Macau | 2,000 | 4,422 |
| Yue Yuen Industrial Holdings | 1,000 | 3,586 |
| | | 438,025 |
| Ireland—.1% | | |
| Anglo Irish Bank | 3,069 a,b | 4 |
| CRH | 1,125 | 19,240 |
| Elan | 1,004 a | 5,652 |
| Governor & Co. of the Bank of Ireland | 4,768 a | 3,532 |
| Kerry Group, Cl. A | 260 | 9,522 |
| | | 37,950 |
16
| | |
| Common Stocks (continued) | Shares | Value ($) |
| Israel—.2% | | |
| Bank Hapoalim | 1,335 a | 6,055 |
| Bank Leumi Le-Israel | 1,666 a | 7,671 |
| Bezeq Israeli Telecommunication | 2,373 | 6,292 |
| Israel Chemicals | 635 | 9,711 |
| Teva Pharmaceutical Industries | 1,510 | 78,626 |
| | | 108,355 |
| Italy—.8% | | |
| A2A | 1,653 | 2,690 |
| Assicurazioni Generali | 1,925 | 42,140 |
| Atlantia | 443 | 10,110 |
| Banca Carige | 966 | 2,336 |
| Banca Monte dei Paschi di Siena | 3,821 a | 5,369 |
| Banca Popolare di Milano Scarl | 969 | 4,522 |
| Banco Popolare | 1,288 | 6,915 |
| Enel | 10,792 | 61,536 |
| ENI | 4,283 | 96,378 |
| Fiat | 1,272 | 21,498 |
| Finmeccanica | 723 | 10,079 |
| Intesa Sanpaolo | 12,569 | 44,154 |
| Intesa Sanpaolo-RSP | 2,248 | 6,152 |
| Luxottica Group | 184 | 5,429 |
| Mediaset | 1,052 | 7,749 |
| Mediobanca | 844 a | 8,734 |
| Parmalat | 3,170 | 8,706 |
| Prysmian | 249 | 4,821 |
| Saipem | 447 | 19,838 |
| Snam Rete Gas | 2,540 | 13,742 |
| Telecom Italia | 16,204 | 24,819 |
| Telecom Italia-RSP | 9,545 | 11,675 |
| Terna Rete Elettrica Nazionale | 2,144 | 9,878 |
| UniCredit | 25,285 | 65,824 |
| Unione di Banche Italiane | 912 | 9,615 |
| | | 504,709 |
| Japan—5.6% | | |
| 77 Bank | 1,000 | 4,718 |
| Acom | 9 | 103 |
| Advantest | 300 | 5,702 |
The Fund 17
STATEMENT OF INVESTMENTS (continued)
| | | |
| Common Stocks (continued) | Shares | | Value ($) |
| Japan (continued) | | | |
| Aeon | 1,100 | | 12,946 |
| Aisin Seiki | 300 | | 9,412 |
| Ajinomoto | 1,000 | | 9,534 |
| All Nippon Airways | 2,000 | a | 7,573 |
| Amada | 1,000 | | 6,580 |
| Asahi Breweries | 700 | | 14,122 |
| Asahi Glass | 2,000 | | 19,193 |
| Asahi Kasei | 2,000 | | 11,744 |
| Astellas Pharma | 700 | | 26,019 |
| Bank of Kyoto | 1,000 | | 8,939 |
| Bank of Yokohama | 2,000 | | 9,832 |
| Benesse Holdings | 100 | | 4,798 |
| Bridgestone | 1,000 | | 17,914 |
| Brother Industries | 400 | | 5,105 |
| Canon | 1,800 | | 83,128 |
| Casio Computer | 600 | | 4,216 |
| Central Japan Railway | 2 | | 15,121 |
| Chiba Bank | 1,000 | | 6,170 |
| Chubu Electric Power | 1,100 | | 27,804 |
| Chugai Pharmaceutical | 400 | | 6,997 |
| Chugoku Electric Power | 500 | | 10,081 |
| Chuo Mitsui Trust Holdings | 2,000 | | 7,225 |
| Citizen Holdings | 400 | | 2,299 |
| Cosmo Oil | 1,000 | | 2,694 |
| Credit Saison | 400 | | 5,691 |
| Dai Nippon Printing | 1,000 | | 12,613 |
| Dai-ichi Life Insurance | 13 | | 15,752 |
| Daicel Chemical Industries | 1,000 | | 6,952 |
| Daido Steel | 1,000 | | 5,090 |
| Daiichi Sankyo | 1,200 | | 25,400 |
| Daikin Industries | 400 | | 13,909 |
| Daito Trust Construction | 100 | | 6,034 |
| Daiwa House Industry | 1,000 | | 10,788 |
| Daiwa Securities Group | 3,000 | | 12,216 |
| Denki Kagaku Kogyo | 1,000 | | 4,395 |
| Denso | 800 | | 24,879 |
18
| | | |
| Common Stocks (continued) | Shares | | Value ($) |
| Japan (continued) | | | |
| Dentsu | 300 | | 7,069 |
| Dowa Holdings | 1,000 | | 6,071 |
| East Japan Railway | 600 | | 37,058 |
| Eisai | 400 | | 13,746 |
| Electric Power Development | 200 | | 5,922 |
| Elpida Memory | 300 | a | 3,073 |
| FamilyMart | 200 | | 7,091 |
| Fanuc | 300 | | 43,389 |
| Fast Retailing | 100 | | 13,073 |
| Fuji Electric Holdings | 2,000 | | 4,767 |
| Fuji Heavy Industries | 1,000 | | 6,915 |
| FUJIFILM Holdings | 800 | | 26,667 |
| Fujitsu | 3,000 | | 20,484 |
| Fukuoka Financial Group | 1,000 | | 3,886 |
| Furukawa Electric | 1,000 | | 3,724 |
| GS Yuasa | 1,000 | | 6,667 |
| Gunma Bank | 1,000 | | 5,016 |
| Hachijuni Bank | 1,000 | | 5,140 |
| Hamamatsu Photonics | 100 | | 3,230 |
| Hankyu Hashin Holdings | 2,000 | | 9,584 |
| Hirose Electric | 100 | | 10,056 |
| Hiroshima Bank | 1,000 | | 4,084 |
| Hisamitsu Pharmaceutical | 100 | | 4,097 |
| Hitachi | 7,000 | | 31,633 |
| Hitachi Construction Machinery | 200 | | 4,248 |
| Hokkaido Electric Power | 300 | | 6,305 |
| Hokuhoku Financial Group | 3,000 | | 5,549 |
| Hokuriku Electric Power | 300 | | 7,274 |
| Honda Motor | 2,700 | | 98,447 |
| Hoya | 700 | | 16,355 |
| Ibiden | 200 | | 4,921 |
| IHI | 4,000 | | 7,598 |
| INPEX | 3 | | 15,587 |
| Isetan Mitsukoshi Holdings | 680 | | 7,496 |
| Isuzu Motors | 2,000 | | 7,697 |
| ITOCHU | 2,400 | | 21,035 |
The Fund 19
STATEMENT OF INVESTMENTS (continued)
| | |
| Common Stocks (continued) | Shares | Value ($) |
| Japan (continued) | | |
| J Front Retailing | 1,200 | 6,153 |
| Jafco | 100 | 2,088 |
| Japan Real Estate Investment | 1 | 9,621 |
| Japan Retail Fund Investment | 4 | 6,242 |
| Japan Steel Works | 1,000 | 9,522 |
| Japan Tobacco | 7 | 21,752 |
| JFE Holdings | 800 | 24,948 |
| Joyo Bank | 1,000 | 4,345 |
| JS Group | 400 | 7,866 |
| JSR | 300 | 5,188 |
| JTEKT | 300 | 3,009 |
| Jupiter Telecommunications | 3 | 3,244 |
| JX Holdings | 3,640 | 21,375 |
| Kajima | 2,000 | 4,693 |
| Kaneka | 1,000 | 6,183 |
| Kansai Electric Power | 1,200 | 30,361 |
| Kao | 900 | 22,827 |
| Kawasaki Heavy Industries | 2,000 | 5,512 |
| Kawasaki Kisen Kaisha | 2,000 | 7,796 |
| KDDI | 5 | 26,909 |
| Keikyu Corp | 1,000 | 9,448 |
| Keio | 1,000 | 6,989 |
| Keyence | 110 | 27,244 |
| Kintetsu | 3,000 | 9,497 |
| Kirin Holdings | 1,000 | 13,706 |
| Kobe Steel | 4,000 | 8,790 |
| Komatsu | 1,500 | 36,723 |
| Konami | 300 | 5,281 |
| Konica Minolta Holdings | 1,000 | 9,683 |
| Kubota | 2,000 | 17,778 |
| Kuraray | 500 | 7,157 |
| Kurita Water Industries | 200 | 5,194 |
| Kyocera | 300 | 29,907 |
| Kyowa Hakko Kirin | 371 | 3,629 |
| Kyushu Electric Power | 600 | 14,205 |
| Lawson | 100 | 4,544 |
20
| | |
| Common Stocks (continued) | Shares | Value ($) |
| Japan (continued) | | |
| Makita | 200 | 7,027 |
| Marubeni | 3,000 | 18,845 |
| Marui Group | 600 | 4,715 |
| Mazda Motor | 3,000 | 7,635 |
| Medipal Holdings | 500 | 5,835 |
| MEIJI Holdings | 117 | 5,396 |
| Minebea | 1,000 | 5,487 |
| Mitsubishi | 2,100 | 50,447 |
| Mitsubishi Chemical Holdings | 2,000 | 10,304 |
| Mitsubishi Electric | 3,000 | 28,119 |
| Mitsubishi Estate | 2,000 | 35,009 |
| Mitsubishi Gas Chemical | 1,000 | 6,183 |
| Mitsubishi Heavy Industries | 5,000 | 18,187 |
| Mitsubishi Materials | 2,000 a | 6,257 |
| Mitsubishi Motors | 6,000 a | 7,151 |
| Mitsubishi UFJ Financial Group | 20,660 | 96,183 |
| Mitsui & Co. | 2,800 | 43,973 |
| Mitsui Chemicals | 2,000 | 5,860 |
| Mitsui Engineering & Shipbuilding | 2,000 | 4,519 |
| Mitsui Fudosan | 1,000 | 18,883 |
| Mitsui Mining & Smelting | 2,000 | 6,083 |
| Mitsui OSK Lines | 2,000 | 12,812 |
| Mizuho Financial Group | 31,600 | 45,899 |
| MS&AD Insurance Group Holdings | 890 | 21,358 |
| Murata Manufacturing | 300 | 16,853 |
| Namco Bandai Holdings | 500 | 4,606 |
| NEC | 4,000 | 11,124 |
| Nidec | 200 | 19,764 |
| Nikon | 500 | 9,435 |
| Nintendo | 200 | 51,769 |
| Nippon Building Fund | 1 | 9,783 |
| Nippon Electric Glass | 1,000 | 12,874 |
| Nippon Express | 2,000 | 7,945 |
| Nippon Paper Group | 200 | 5,080 |
| Nippon Sheet Glass | 1,000 | 2,197 |
| Nippon Steel | 8,000 | 25,127 |
The Fund 21
STATEMENT OF INVESTMENTS (continued)
| | |
| Common Stocks (continued) | Shares | Value ($) |
| Japan (continued) | | |
| Nippon Telegraph & Telephone | 900 | 40,838 |
| Nippon Yusen | 3,000 | 12,626 |
| Nishi-Nippon City Bank | 2,000 | 5,462 |
| Nissan Motor | 4,100 | 36,139 |
| Nisshin Seifun Group | 500 | 6,183 |
| Nisshin Steel | 2,000 | 3,600 |
| Nissin Foods Holdings | 100 | 3,620 |
| Nitori Holdings | 50 | 4,395 |
| Nitto Denko | 300 | 11,210 |
| NKSJ Holdings | 1,900 a | 13,044 |
| Nomura Holdings | 6,000 | 31,136 |
| Nomura Real Estate Office Fund | 1 | 6,139 |
| Nomura Research Institute | 200 | 3,767 |
| NSK | 1,000 | 7,573 |
| NTN | 1,000 | 4,531 |
| NTT Data | 2 | 6,140 |
| NTT DoCoMo | 25 | 42,055 |
| Obayashi | 1,000 | 4,072 |
| Odakyu Electric Railway | 1,000 | 9,212 |
| OJI Paper | 1,000 | 4,618 |
| Olympus | 300 | 7,858 |
| Omron | 400 | 9,276 |
| Ono Pharmaceutical | 100 | 4,246 |
| Oriental Land | 100 | 9,683 |
| ORIX | 160 | 14,580 |
| Osaka Gas | 3,000 | 11,322 |
| Panasonic | 3,200 | 46,997 |
| Rakuten | 11 | 8,467 |
| Resona Holdings | 800 | 6,376 |
| Ricoh | 1,000 | 13,979 |
| Rohm | 200 | 12,464 |
| Sankyo | 100 | 5,326 |
| Santen Pharmaceutical | 100 | 3,449 |
| Sapporo Hokuyo Holdings | 700 | 2,885 |
| SBI Holdings | 44 | 5,375 |
| Secom | 300 | 13,613 |
22
| | |
| Common Stocks (continued) | Shares | Value ($) |
| Japan (continued) | | |
| Sega Sammy Holdings | 300 | 4,894 |
| Seiko Epson | 300 | 4,778 |
| Sekisui Chemical | 1,000 | 6,356 |
| Sekisui House | 1,000 | 9,398 |
| Seven & I Holdings | 1,300 | 30,228 |
| Seven Bank | 1 | 1,799 |
| Sharp | 2,000 | 19,739 |
| Shikoku Electric Power | 300 | 8,868 |
| Shimano | 100 | 4,991 |
| Shimizu | 1,000 | 3,861 |
| Shin-Etsu Chemical | 700 | 35,413 |
| Shinsei Bank | 4,000 a | 3,178 |
| Shionogi & Co. | 500 | 8,703 |
| Shiseido | 600 | 12,529 |
| Shizuoka Bank | 1,000 | 8,566 |
| Showa Denko | 3,000 | 5,475 |
| Showa Shell Sekiyu | 500 | 4,202 |
| SMC | 100 | 15,270 |
| Softbank | 1,300 | 41,800 |
| Sojitz | 2,900 | 5,328 |
| Sony | 1,600 | 53,433 |
| Sony Financial Holdings | 1 | 3,476 |
| Stanley Electric | 300 | 5,032 |
| SUMCO | 200 a | 3,096 |
| Sumitomo | 1,800 | 22,793 |
| Sumitomo Chemical | 2,000 | 8,715 |
| Sumitomo Electric Industries | 1,300 | 16,575 |
| Sumitomo Heavy Industries | 1,000 | 5,686 |
| Sumitomo Metal Industries | 6,000 | 13,929 |
| Sumitomo Metal Mining | 1,000 | 15,866 |
| Sumitomo Mitsui Financial Group | 2,100 | 62,883 |
| Sumitomo Realty & Development | 1,000 | 21,775 |
| Sumitomo Rubber Industries | 600 | 6,458 |
| Sumitomo Trust & Banking | 2,000 | 10,950 |
| Suzuken | 100 | 3,142 |
| Suzuki Motor | 600 | 14,622 |
The Fund 23
STATEMENT OF INVESTMENTS (continued)
| | |
| Common Stocks (continued) | Shares | Value ($) |
| Japan (continued) | | |
| T&D Holdings | 450 | 9,212 |
| Taiheiyo Cement | 3,000 a | 3,240 |
| Taisei | 3,000 | 6,406 |
| Takashimaya | 1,000 | 7,523 |
| Takeda Pharmaceutical | 1,200 | 56,164 |
| TDK | 200 | 11,409 |
| Teijin | 2,000 | 7,399 |
| Terumo | 300 | 15,214 |
| THK | 200 | 3,844 |
| Tobu Railway | 1,000 | 5,611 |
| Toho | 200 | 3,084 |
| Toho Gas | 1,000 | 5,276 |
| Tohoku Electric Power | 700 | 15,703 |
| Tokio Marine Holdings | 1,200 | 33,788 |
| Tokuyama | 1,000 | 5,475 |
| Tokyo Electric Power | 2,300 | 54,966 |
| Tokyo Electron | 300 | 16,927 |
| Tokyo Gas | 4,000 | 18,821 |
| Tokyo Tatemono | 1,000 | 4,035 |
| Tokyu | 2,000 | 8,939 |
| Tokyu Land | 1,000 | 4,556 |
| Toppan Printing | 1,000 | 8,045 |
| Toray Industries | 2,000 | 11,570 |
| Toshiba | 7,000 | 35,022 |
| Tosoh | 1,000 | 2,669 |
| TOTO | 1,000 | 6,629 |
| Toyo Seikan Kaisha | 300 | 5,114 |
| Toyota Industries | 300 | 8,454 |
| Toyota Motor | 4,500 | 159,721 |
| Toyota Tsusho | 400 | 6,202 |
| Trend Micro | 100 | 2,828 |
| Tsumura & Co. | 100 | 3,074 |
| Ube Industries | 2,000 | 4,891 |
| UNICHARM | 300 | 11,453 |
| UNY | 300 | 2,499 |
| Ushio | 200 | 3,330 |
24
| | |
| Common Stocks (continued) | Shares | Value ($) |
| Japan (continued) | | |
| West Japan Railway | 3 | 11,128 |
| Yahoo! Japan | 24 | 8,390 |
| Yakult Honsha | 200 | 5,842 |
| Yamada Denki | 140 | 9,090 |
| Yamaha | 400 | 4,901 |
| Yamaha Motor | 400 a | 6,138 |
| Yamato Holdings | 700 | 8,812 |
| Yokogawa Electric | 400 | 2,627 |
| | | 3,618,859 |
| Luxembourg—.1% | | |
| ArcelorMittal | 1,405 | 45,100 |
| Millicom International Cellular, SDR | 122 | 11,482 |
| SES | 506 | 12,951 |
| Tenaris | 794 | 16,465 |
| | | 85,998 |
| Netherlands—.8% | | |
| Aegon | 2,593 a | 16,413 |
| Akzo Nobel | 369 | 21,879 |
| ASML Holding | 696 | 22,936 |
| Corio | 58 | 4,255 |
| European Aeronautic Defence and Space | 727 a | 19,082 |
| Fugro | 121 | 8,548 |
| Heineken | 410 | 20,754 |
| Heineken Holding | 149 | 6,407 |
| ING Groep | 5,969 a | 63,632 |
| Koninklijke Ahold | 1,922 | 26,527 |
| Koninklijke Boskalis Westminster | 92 | 3,721 |
| Koninklijke DSM | 277 | 14,792 |
| Koninklijke KPN | 2,861 | 47,718 |
| Koninklijke Philips Electronics | 1,588 | 47,961 |
| Koninklijke Vopak | 82 | 4,096 |
| QIAGEN | 398 a | 7,532 |
| Randstad Holding | 180 a | 8,556 |
| Reed Elsevier | 1,224 | 15,927 |
| SBM Offshore | 365 | 7,437 |
| STMicroelectronics | 1,054 | 9,206 |
The Fund 25
STATEMENT OF INVESTMENTS (continued)
| | |
| Common Stocks (continued) | Shares | Value ($) |
| Netherlands (continued) | | |
| TNT | 628 | 16,671 |
| Unilever | 2,702 | 80,011 |
| Wolters Kluwer | 545 | 12,381 |
| | | 486,442 |
| New Zealand—.0% | | |
| Auckland International Airport | 3,880 | 6,232 |
| Contact Energy | 460 a | 2,058 |
| Fletcher Building | 1,409 | 8,847 |
| Sky City Entertainment Group | 1,940 | 4,481 |
| Telecom Corporation of New Zealand | 4,764 | 7,469 |
| | | 29,087 |
| Norway—.2% | | |
| DnB NOR | 1,506 | 20,560 |
| Norsk Hydro | 1,213 | 7,386 |
| Orkla | 1,204 | 11,592 |
| Renewable Energy | 600 a | 2,078 |
| SeaDrill | 439 | 13,224 |
| Statoil | 1,835 | 39,853 |
| Telenor | 1,391 | 22,309 |
| Yara International | 337 | 17,625 |
| | | 134,627 |
| Portugal—.1% | | |
| Banco Comercial Portugues, Cl. R | 5,445 | 4,949 |
| Banco Espirito Santo | 905 | 4,491 |
| Brisa Auto-Estradas de Portugal | 388 | 2,934 |
| Cimpor-Cimentos de Portugal | 565 | 3,919 |
| Energias de Portugal | 3,114 | 11,898 |
| Galp Energia, Cl. B | 218 | 4,200 |
| Jeronimo Martins | 521 | 7,806 |
| Portugal Telecom | 936 | 13,491 |
| | | 53,688 |
| Singapore—.5% | | |
| Ascendas Real Estate Investment Trust | 4,400 | 7,003 |
| CapitaLand | 4,500 | 13,525 |
| CapitaMall Trust | 4,000 | 6,119 |
| City Developments | 1,000 | 9,828 |
26
| | |
| Common Stocks (continued) | Shares | Value ($) |
| Singapore (continued) | | |
| ComfortDelgro | 5,000 | 5,718 |
| Cosco Singapore | 4,000 | 5,749 |
| DBS Group Holdings | 3,500 | 37,589 |
| Flextronics International | 1,406 a | 10,067 |
| Fraser and Neave | 2,000 | 9,643 |
| Genting Singapore | 9,000 a | 15,090 |
| Golden Agri-Resources | 12,640 | 6,348 |
| Keppel | 2,000 | 15,422 |
| Noble Group | 4,636 | 6,663 |
| Oversea-Chinese Banking | 4,000 | 27,846 |
| SembCorp Industries | 2,000 | 7,077 |
| SembCorp Marine | 1,000 | 3,554 |
| Singapore Airlines | 866 | 10,585 |
| Singapore Exchange | 1,000 | 6,799 |
| Singapore Press Holdings | 3,000 | 9,619 |
| Singapore Technologies Engineering | 2,000 | 5,115 |
| Singapore Telecommunications | 13,000 | 31,037 |
| United Overseas Bank | 2,000 | 28,804 |
| UOL Group | 1,000 | 3,516 |
| Wilmar International | 3,000 | 14,835 |
| | | 297,551 |
| Spain—1.0% | | |
| Abertis Infraestructuras | 481 | 9,487 |
| Acciona | 39 | 3,426 |
| Acerinox | 192 | 3,144 |
| ACS Actividades de Construccion y Servicios | 261 | 13,680 |
| Banco Bilbao Vizcaya Argentaria | 5,850 | 76,837 |
| Banco de Sabadell | 1,518 | 7,374 |
| Banco de Valencia | 282 | 1,587 |
| Banco Popular Espanol | 1,624 | 10,489 |
| Banco Santander | 13,564 | 174,027 |
| Bankinter | 353 | 2,349 |
| Criteria Caixacorp | 1,132 | 6,383 |
| EDP Renovaveis | 522 a | 3,025 |
| Enagas | 243 | 5,348 |
| Ferrovial | 725 | 8,255 |
The Fund 27
STATEMENT OF INVESTMENTS (continued)
| | |
| Common Stocks (continued) | Shares | Value ($) |
| Spain (continued) | | |
| Gamesa Corp Tecnologica | 471 a | 3,273 |
| Gas Natural | 419 | 6,126 |
| Grifols | 170 | 2,749 |
| Iberdrola | 6,242 | 52,575 |
| Iberdrola Renovables | 1,587 | 5,358 |
| Inditex | 354 | 29,526 |
| Indra Sistemas | 130 | 2,541 |
| Mapfre | 1,575 | 5,219 |
| Red Electrica | 170 | 8,529 |
| Repsol | 1,251 | 34,645 |
| Telefonica | 6,719 | 181,171 |
| Zardoya Otis | 178 | 2,961 |
| | | 660,084 |
| Sweden—.8% | | |
| Alfa Laval | 650 | 11,226 |
| Assa Abloy, Cl. B | 485 | 12,384 |
| Atlas Copco, Cl. A | 1,102 | 22,945 |
| Atlas Copco, Cl. B | 708 | 13,453 |
| Boliden | 378 | 6,393 |
| Electrolux, Ser. B | 407 | 9,834 |
| Getinge, Cl. B | 363 | 7,661 |
| Hennes & Mauritz, Cl. B | 1,672 | 58,703 |
| Hexagon, Cl. B | 267 | 5,412 |
| Holmen, Cl. B | 75 | 2,373 |
| Husqvarna, Cl. B | 673 | 4,715 |
| Investor, Cl. B | 757 | 15,479 |
| Kinnevik Investment, Cl. B | 358 | 7,363 |
| Modern Times Group, Cl. B | 68 | 4,859 |
| Nordea Bank | 5,276 | 57,877 |
| Ratos, Cl. B | 167 | 5,933 |
| Sandvik | 1,605 | 24,106 |
| Scania, Cl. B | 520 | 11,013 |
| Securitas, Cl. B | 706 | 7,692 |
| Skandinaviska Enskilda Banken, Cl. A | 2,519 | 19,443 |
| Skanska, Cl. B | 641 | 12,218 |
| SKF, Cl. B | 609 | 15,668 |
28
| | | |
| Common Stocks (continued) | Shares | | Value ($) |
| Sweden (continued) | | | |
| SSAB, Cl. A | 326 | | 4,554 |
| SSAB, Cl. B | 118 | | 1,455 |
| Svenska Cellulosa, Cl. B | 897 | | 13,860 |
| Svenska Handelsbanken, Cl. A | 788 | | 25,668 |
| Swedbank, Cl. A | 1,143 | a | 15,897 |
| Swedbank, Cl. A | 1,143 | a | 15,897 |
| Swedish Match | 411 | | 11,445 |
| Tele2, Cl. B | 581 | | 12,738 |
| Telefonaktiebolaget LM Ericsson, Cl. B | 4,931 | | 53,982 |
| TeliaSonera | 3,638 | | 30,250 |
| Volvo, Cl. B | 1,726 | a | 23,285 |
| | | | 529,884 |
| Switzerland—2.1% | | | |
| ABB | 3,619 | a | 74,993 |
| Actelion | 178 | a | 8,888 |
| Adecco | 193 | | 10,793 |
| Aryzta | 202 | | 8,965 |
| Baloise Holding | 91 | | 8,415 |
| Cie Financiere Richemont, Cl. A | 848 | | 42,318 |
| Credit Suisse Group | 1,850 | | 76,464 |
| GAM Holding | 528 | a | 8,348 |
| Geberit | 60 | | 11,500 |
| Givaudan | 12 | | 12,372 |
| Holcim | 398 | | 24,827 |
| Julius Baer Group | 371 | | 15,670 |
| Kuehne & Nagel International | 100 | | 12,374 |
| Lindt & Spruengli-PC | 1 | | 2,718 |
| Logitech International | 438 | a | 8,310 |
| Lonza Group | 82 | | 7,183 |
| Nestle | 5,666 | | 310,521 |
| Nobel Biocare Holding | 224 | | 3,706 |
| Novartis | 3,450 | | 200,125 |
| Pargesa Holding-BR | 64 | | 5,079 |
| Roche Holding | 1,158 | | 170,138 |
| Schindler Holding-PC | 85 | | 9,118 |
| SGS | 9 | | 14,413 |
| Sika-BR | 2 | | 3,965 |
The Fund 29
STATEMENT OF INVESTMENTS (continued)
| | |
| Common Stocks (continued) | Shares | Value ($) |
| Switzerland (continued) | | |
| Sonova Holding | 71 | 8,230 |
| Straumann Holding | 19 | 3,980 |
| Swatch Group | 75 | 5,216 |
| Swatch Group-BR | 52 | 19,885 |
| Swiss Life Holding | 58 a | 7,106 |
| Swiss Reinsurance | 559 | 26,884 |
| Swisscom | 42 | 17,556 |
| Syngenta | 162 | 44,836 |
| Synthes | 96 | 11,459 |
| UBS | 5,853 a | 99,147 |
| Zurich Financial Services | 241 | 59,031 |
| | | 1,354,533 |
| United Kingdom—5.9% | | |
| 3i Group | 1,736 | 8,315 |
| Admiral Group | 331 | 8,626 |
| Aggreko | 348 | 8,763 |
| AMEC | 595 | 10,331 |
| Anglo American | 2,155 | 100,192 |
| Antofagasta | 731 | 15,450 |
| ARM Holdings | 1,789 | 10,391 |
| Associated British Foods | 591 | 9,893 |
| AstraZeneca | 2,379 | 119,032 |
| Autonomy | 380 a | 8,882 |
| Aviva | 4,422 | 28,145 |
| Babcock International Group | 490 | 4,544 |
| BAE Systems | 5,983 | 32,973 |
| Balfour Beatty | 1,187 | 5,251 |
| Barclays | 18,711 | 82,147 |
| BG Group | 5,525 | 107,369 |
| BHP Billiton | 3,621 | 128,145 |
| BP | 30,667 | 208,771 |
| British Airways | 1,166 a | 5,046 |
| British American Tobacco | 3,302 | 125,646 |
| British Land | 1,615 | 13,156 |
| British Sky Broadcasting Group | 2,036 | 22,998 |
| BT Group | 12,747 | 31,324 |
30
| | |
| Common Stocks (continued) | Shares | Value ($) |
| United Kingdom (continued) | | |
| Bunzl | 499 | 5,896 |
| Burberry Group | 776 | 12,642 |
| Cable & Wireless Worldwide | 5,272 | 5,917 |
| Cairn Energy | 2,223 a | 13,715 |
| Capita Group | 963 | 11,801 |
| Capital Shopping Centres Group | 773 | 4,751 |
| Carnival | 288 | 12,386 |
| Centrica | 8,718 | 46,303 |
| Cobham | 2,046 | 7,576 |
| Compass Group | 2,944 | 24,076 |
| Diageo | 4,135 | 76,159 |
| Eurasian Natural Resources | 384 | 5,344 |
| Experian | 1,561 | 18,106 |
| Firstgroup | 674 | 4,395 |
| Fresnillo | 246 | 4,916 |
| G4S | 2,575 | 10,774 |
| GlaxoSmithKline | 8,536 | 166,634 |
| Hammerson | 1,232 | 8,255 |
| Home Retail Group | 1,661 | 5,816 |
| HSBC Holdings | 28,452 | 295,269 |
| ICAP | 931 | 6,790 |
| Imperial Tobacco Group | 1,679 | 53,661 |
| Inmarsat | 794 | 8,277 |
| Intercontinental Hotels Group | 460 | 8,877 |
| International Power | 2,339 | 15,605 |
| Intertek Group | 233 | 6,910 |
| Invensys | 1,440 | 6,635 |
| Investec | 662 | 5,273 |
| ITV | 5,158 a | 5,628 |
| J Sainsbury | 1,741 | 10,836 |
| Johnson Matthey | 385 | 11,781 |
| Kazakhmys | 315 | 6,628 |
| Kingfisher | 3,680 | 13,991 |
| Land Securities Group | 1,172 | 12,686 |
| Legal & General Group | 9,111 | 14,625 |
| Lloyds Banking Group | 65,850 a | 72,581 |
The Fund 31
STATEMENT OF INVESTMENTS (continued)
| | | |
| Common Stocks (continued) | Shares | | Value ($) |
| United Kingdom (continued) | | | |
| London Stock Exchange Group | 302 | | 3,544 |
| Lonmin | 237 | a | 6,627 |
| Man Group | 2,633 | | 10,979 |
| Marks & Spencer Group | 2,386 | | 16,304 |
| National Grid | 5,569 | | 52,532 |
| Next | 320 | | 11,690 |
| Old Mutual | 8,474 | | 17,599 |
| Pearson | 1,338 | | 20,419 |
| Petrofac | 403 | | 9,426 |
| Prudential | 4,279 | | 43,134 |
| Randgold Resources | 137 | | 12,759 |
| Reckitt Benckiser Group | 992 | | 55,368 |
| Reed Elsevier | 1,977 | | 16,910 |
| Resolution | 3,228 | | 13,516 |
| Rexam | 1,726 | | 8,767 |
| Rio Tinto | 2,333 | | 150,543 |
| Rolls-Royce Group | 2,955 | a | 30,591 |
| Royal Bank of Scotland Group | 28,023 | a | 19,987 |
| Royal Dutch Shell, Cl. A | 5,834 | | 188,973 |
| Royal Dutch Shell, Cl. B | 4,428 | | 141,483 |
| RSA Insurance Group | 6,348 | | 13,295 |
| SABMiller | 1,563 | | 50,566 |
| Sage Group | 2,356 | | 10,148 |
| Schroders | 205 | | 5,175 |
| Scottish & Southern Energy | 1,469 | | 27,080 |
| Segro | 1,292 | | 6,123 |
| Serco Group | 873 | | 8,570 |
| Severn Trent | 444 | | 9,903 |
| Shire | 867 | | 20,390 |
| Smith & Nephew | 1,429 | | 12,543 |
| Smiths Group | 590 | | 11,244 |
| Standard Chartered | 3,313 | | 95,634 |
| Standard Life | 4,201 | | 15,247 |
| Tesco | 12,994 | | 88,677 |
| Thomas Cook Group | 1,084 | | 3,135 |
| Tui Travel | 1,371 | | 4,627 |
32
| | |
| Common Stocks (continued) | Shares | Value ($) |
| United Kingdom (continued) | | |
| Tullow Oil | 1,447 | 27,415 |
| Unilever | 2,124 | 61,091 |
| United Utilities Group | 1,206 | 11,781 |
| Vedanta Resources | 192 | 6,370 |
| Virgin Media | 563 | 14,317 |
| Vodafone Group | 86,597 | 235,159 |
| Whitbread | 332 | 8,992 |
| Willis Group Holdings | 338 | 10,749 |
| WM Morrison Supermarkets | 3,454 | 16,224 |
| Wolseley | 426 a | 11,326 |
| WPP | 2,060 | 23,911 |
| Xstrata | 3,315 | 64,104 |
| | | 3,801,852 |
| United States—30.9% | | |
| 3M | 1,193 | 100,474 |
| Abbott Laboratories | 2,742 | 140,719 |
| Abercrombie & Fitch, Cl. A | 160 | 6,858 |
| Accenture, Cl. A | 1,146 | 51,238 |
| ACE | 625 | 37,138 |
| Activision Blizzard | 1,022 | 11,722 |
| Adobe Systems | 917 a | 25,814 |
| Advance Auto Parts | 156 | 10,137 |
| Advanced Micro Devices | 1,129 a | 8,276 |
| AES | 1,220 a | 14,567 |
| Aetna | 801 | 23,918 |
| Aflac | 823 | 45,998 |
| AGCO | 156 a | 6,625 |
| Agilent Technologies | 607 a | 21,124 |
| Air Products & Chemicals | 390 | 33,138 |
| Airgas | 137 | 9,718 |
| Akamai Technologies | 324 a | 16,741 |
| Alcoa | 1,746 | 22,925 |
| Allegheny Energy | 325 | 7,540 |
| Allegheny Technologies | 153 | 8,062 |
| Allergan | 533 | 38,595 |
The Fund 33
STATEMENT OF INVESTMENTS (continued)
| | | |
| Common Stocks (continued) | Shares | | Value ($) |
| United States (continued) | | | |
| Alliance Data Systems | 107 | a | 6,497 |
| Alliant Energy | 201 | | 7,343 |
| Allstate | 916 | | 27,929 |
| Alpha Natural Resources | 230 | a | 10,389 |
| Altera | 522 | | 16,292 |
| Altria Group | 3,667 | | 93,215 |
| Amazon.com | 628 | a | 103,708 |
| AMB Property | 252 | c | 7,104 |
| Ameren | 406 | | 11,766 |
| American Eagle Outfitters | 315 | | 5,043 |
| American Electric Power | 886 | | 33,172 |
| American Express | 1,903 | | 78,898 |
| American International Group | 244 | a | 10,251 |
| American Tower, Cl. A | 734 | a | 37,882 |
| American Water Works | 288 | | 6,878 |
| Ameriprise Financial | 463 | | 23,933 |
| AmerisourceBergen | 526 | | 17,263 |
| AMETEK | 176 | | 9,513 |
| Amgen | 1,756 | a | 100,426 |
| Amphenol, Cl. A | 312 | | 15,641 |
| Anadarko Petroleum | 889 | | 54,736 |
| Analog Devices | 532 | | 17,913 |
| Annaly Capital Management | 1,073 | c | 19,003 |
| AON | 477 | | 18,961 |
| Apache | 637 | | 64,350 |
| Apollo Group, Cl. A | 252 | a | 9,445 |
| Apple | 1,619 | a | 487,109 |
| Applied Materials | 2,477 | | 30,616 |
| Arch Capital Group | 86 | a | 7,430 |
| Arch Coal | 283 | | 6,959 |
| Archer-Daniels-Midland | 1,128 | | 37,585 |
| Arrow Electronics | 221 | a | 6,544 |
| Assurant | 223 | | 8,818 |
| AT&T | 10,508 | | 299,478 |
| Autodesk | 395 | a | 14,291 |
| Automatic Data Processing | 885 | | 39,312 |
34
| | |
| Common Stocks (continued) | Shares | Value ($) |
| United States (continued) | | |
| AutoNation | 159 a | 3,692 |
| AutoZone | 52 a | 12,357 |
| AvalonBay Communities | 137 c | 14,565 |
| Avery Dennison | 191 | 6,943 |
| Avnet | 304 a | 9,053 |
| Avon Products | 784 | 23,873 |
| Axis Capital Holdings | 202 | 6,870 |
| Baker Hughes | 774 | 35,860 |
| Ball | 146 | 9,397 |
| Bank of America | 17,833 | 204,010 |
| Baxter International | 1,091 | 55,532 |
| BB&T | 1,211 | 28,350 |
| Beckman Coulter | 138 | 7,347 |
| Becton Dickinson & Co. | 413 | 31,190 |
| Bed Bath & Beyond | 483 a | 21,204 |
| Berkshire Hathaway, Cl. B | 1,460 a | 116,158 |
| Best Buy | 636 | 27,335 |
| Biogen Idec | 498 a | 31,230 |
| BlackRock | 59 | 10,089 |
| BMC Software | 334 a | 15,184 |
| Boeing | 1,201 | 84,839 |
| BorgWarner | 191 a | 10,717 |
| Boston Properties | 255 c | 21,979 |
| Boston Scientific | 2,691 a | 17,169 |
| Bristol-Myers Squibb | 3,020 | 81,238 |
| Broadcom, Cl. A | 799 | 32,551 |
| Brown-Forman, Cl. B | 160 | 9,730 |
| Bucyrus International | 127 | 8,656 |
| Bunge | 255 | 15,318 |
| C.H. Robinson Worldwide | 311 | 21,919 |
| C.R. Bard | 164 | 13,632 |
| CA | 762 | 17,686 |
| Cablevision Systems (NY Group), Cl. A | 423 | 11,311 |
| Cabot Oil & Gas | 209 | 6,057 |
| Calpine | 686 a | 8,575 |
| Cameron International | 463 a | 20,256 |
The Fund 35
STATEMENT OF INVESTMENTS (continued)
| | |
| Common Stocks (continued) | Shares | Value ($) |
| United States (continued) | | |
| Campbell Soup | 378 | 13,703 |
| Capital One Financial | 802 | 29,891 |
| Cardinal Health | 649 | 22,514 |
| CareFusion | 363 a | 8,763 |
| Carmax | 367 a | 11,373 |
| Carnival | 786 | 33,932 |
| Caterpillar | 1,101 | 86,539 |
| CBS, Cl. B | 1,125 | 19,046 |
| Celanese, Ser. A | 289 | 10,303 |
| Celgene | 807 a | 50,091 |
| CenterPoint Energy | 708 | 11,724 |
| CenturyLink | 553 | 22,883 |
| Cephalon | 140 a | 9,302 |
| Cerner | 119 a | 10,452 |
| CF Industries Holdings | 121 | 14,826 |
| Charles River Laboratories International | 116 a | 3,801 |
| Charles Schwab | 1,859 | 28,629 |
| Chesapeake Energy | 1,132 | 24,564 |
| Chevron | 3,572 | 295,083 |
| Chubb | 605 | 35,102 |
| Church & Dwight | 132 | 8,692 |
| CIGNA | 503 | 17,701 |
| Cimarex Energy | 155 | 11,896 |
| Cincinnati Financial | 311 | 9,156 |
| Cintas | 277 | 7,609 |
| Cisco Systems | 10,126 a | 231,177 |
| CIT Group | 324 a | 14,039 |
| Citigroup | 43,743 a | 182,408 |
| Citrix Systems | 333 a | 21,335 |
| Cliffs Natural Resources | 261 | 17,017 |
| Clorox | 267 | 17,769 |
| CME Group | 119 | 34,468 |
| Coach | 571 | 28,550 |
| Coca-Cola | 3,689 | 226,209 |
| Coca-Cola Enterprises | 520 | 12,485 |
| Cognizant Technology Solutions, Cl. A | 529 a | 34,486 |
36
| | |
| Common Stocks (continued) | Shares | Value ($) |
| United States (continued) | | |
| Colgate-Palmolive | 870 | 67,094 |
| Comcast, Cl. A | 3,667 | 75,467 |
| Comcast, Cl. A (Special) | 1,334 | 25,786 |
| Comerica | 306 | 10,949 |
| Computer Sciences | 290 | 14,225 |
| ConAgra Foods | 823 | 18,509 |
| ConocoPhillips | 2,509 | 149,035 |
| Consol Energy | 385 | 14,153 |
| Consolidated Edison | 493 | 24,512 |
| Constellation Brands, Cl. A | 362 a | 7,142 |
| Constellation Energy Group | 338 | 10,221 |
| Cooper Industries | 304 | 15,936 |
| Corning | 2,739 | 50,069 |
| Costco Wholesale | 772 | 48,458 |
| Covance | 119 a | 5,592 |
| Coventry Health Care | 297 a | 6,956 |
| Covidien | 879 | 35,046 |
| Cree | 170 a | 8,719 |
| Crown Castle International | 544 a | 23,457 |
| Crown Holdings | 306 a | 9,850 |
| CSX | 684 | 42,032 |
| Cummins | 353 | 31,099 |
| CVS Caremark | 2,452 | 73,854 |
| D.R. Horton | 490 | 5,116 |
| Danaher | 964 | 41,799 |
| Darden Restaurants | 263 | 12,022 |
| DaVita | 177 a | 12,700 |
| Dean Foods | 332 a | 3,453 |
| Deere & Co. | 743 | 57,062 |
| Dell | 3,092 a | 44,463 |
| Delta Air Lines | 279 a | 3,875 |
| Denbury Resources | 597 a | 10,161 |
| Dentsply International | 229 | 7,188 |
| Devon Energy | 749 | 48,700 |
| DeVry | 129 | 6,174 |
| Diamond Offshore Drilling | 124 | 8,204 |
The Fund 37
STATEMENT OF INVESTMENTS (continued)
| | |
| Common Stocks (continued) | Shares | Value ($) |
| United States (continued) | | |
| DIRECTV, Cl. A | 1,613 a | 70,101 |
| Discover Financial Services | 1,067 | 18,833 |
| Discovery Communications, Cl. A | 270 a | 12,045 |
| Discovery Communications, Cl. C | 282 a | 10,959 |
| DISH Network, Cl. A | 340 | 6,752 |
| Dolby Laboratories, Cl. A | 89 a | 5,490 |
| Dollar General | 109 | 3,073 |
| Dollar Tree | 258 a | 13,238 |
| Dominion Resources | 1,054 | 45,807 |
| Dover | 340 | 18,054 |
| Dow Chemical | 2,069 | 63,787 |
| Dr. Pepper Snapple Group | 462 | 16,886 |
| DTE Energy | 299 | 13,981 |
| Duke Energy | 2,296 | 41,810 |
| Duke Realty | 396 c | 4,938 |
| Dun & Bradstreet | 102 | 7,590 |
| E.I. du Pont de Nemours & Co. | 1,636 | 77,350 |
| Eastman Chemical | 118 | 9,271 |
| Eaton | 282 | 25,050 |
| Eaton Vance | 238 | 6,847 |
| eBay | 2,045 a | 60,961 |
| Ecolab | 424 | 20,912 |
| Edison International | 552 | 20,369 |
| Edwards Lifesciences | 214 a | 13,677 |
| El Paso | 1,278 | 16,946 |
| Electronic Arts | 563 a | 8,924 |
| Eli Lilly & Co. | 1,877 | 66,070 |
| EMC | 3,617 a | 75,993 |
| Emerson Electric | 1,362 | 74,774 |
| Energen | 116 | 5,178 |
| Energizer Holdings | 129 a | 9,647 |
| Entergy | 339 | 25,266 |
| EOG Resources | 444 | 42,500 |
| EQT | 254 | 9,510 |
| Equifax | 253 | 8,382 |
| Equity Residential | 504 c | 24,510 |
38
| | |
| Common Stocks (continued) | Shares | Value ($) |
| United States (continued) | | |
| Estee Lauder, Cl. A | 194 | 13,807 |
| Everest Re Group | 102 | 8,597 |
| Exelon | 1,159 | 47,310 |
| Expedia | 324 | 9,380 |
| Expeditors International of Washington | 386 | 19,053 |
| Express Scripts | 918 a | 44,541 |
| Exxon Mobil | 9,085 | 603,880 |
| F5 Networks | 137 a | 16,125 |
| Family Dollar Stores | 252 | 11,635 |
| Fastenal | 250 | 12,870 |
| Federal Realty Investment Trust | 119 c | 9,756 |
| FedEx | 523 | 45,878 |
| Fidelity National Financial, Cl. A | 408 | 5,463 |
| Fidelity National Information Services | 578 | 15,664 |
| Fifth Third Bancorp | 1,393 | 17,496 |
| First Solar | 95 a | 13,080 |
| FirstEnergy | 560 | 20,339 |
| Fiserv | 293 a | 15,974 |
| FLIR Systems | 304 a | 8,463 |
| Flowserve | 97 | 9,700 |
| Fluor | 309 | 14,891 |
| FMC | 130 | 9,503 |
| FMC Technologies | 232 a | 16,727 |
| Ford Motor | 5,310 a | 75,030 |
| Forest Laboratories | 556 a | 18,376 |
| Fortune Brands | 258 | 13,945 |
| Foster Wheeler | 254 a | 5,949 |
| Franklin Resources | 281 | 32,231 |
| Freeport-McMoRan Copper & Gold | 769 | 72,809 |
| Frontier Communications | 1,670 | 14,663 |
| GameStop, Cl. A | 315 a | 6,193 |
| Gap | 887 | 16,862 |
| Garmin | 202 | 6,634 |
| General Dynamics | 576 | 39,237 |
| General Electric | 18,986 | 304,156 |
| General Mills | 1,158 | 43,471 |
The Fund 39
STATEMENT OF INVESTMENTS (continued)
| | |
| Common Stocks (continued) | Shares | Value ($) |
| United States (continued) | | |
| Genuine Parts | 272 | 13,018 |
| Genworth Financial, Cl. A | 798 a | 9,049 |
| Genzyme | 463 a | 33,396 |
| Gilead Sciences | 1,634 a | 64,821 |
| Goldman Sachs Group | 864 | 139,061 |
| Goodrich | 226 | 18,548 |
| Goodyear Tire & Rubber | 433 a | 4,425 |
| Google, Cl. A | 437 a | 267,877 |
| H & R Block | 635 | 7,487 |
| H.J. Heinz | 566 | 27,796 |
| Halliburton | 1,587 | 50,562 |
| Hansen Natural | 131 a | 6,709 |
| Harley-Davidson | 396 | 12,149 |
| Harris | 226 | 10,213 |
| Harsco | 144 | 3,338 |
| Hartford Financial Services Group | 694 | 16,642 |
| Hasbro | 240 | 11,100 |
| HCP | 509 c | 18,329 |
| Health Care REIT | 231 c | 11,804 |
| Helmerich & Payne | 172 | 7,358 |
| Henry Schein | 182 a | 10,219 |
| Hershey | 270 | 13,362 |
| Hess | 515 | 32,460 |
| Hewlett-Packard | 4,162 | 175,054 |
| Hologic | 515 a | 8,250 |
| Home Depot | 3,001 | 92,671 |
| Honeywell International | 1,283 | 60,442 |
| Hormel Foods | 137 | 6,291 |
| Hospira | 294 a | 17,487 |
| Host Hotels & Resorts | 1,122 c | 17,829 |
| Hudson City Bancorp | 833 | 9,704 |
| Human Genome Sciences | 315 a | 8,467 |
| Humana | 310 a | 18,070 |
| IHS, Cl. A | 90 a | 6,502 |
| Illinois Tool Works | 748 | 34,184 |
| Illumina | 205 a | 11,134 |
40
| | |
| Common Stocks (continued) | Shares | Value ($) |
| United States (continued) | | |
| Ingersoll-Rand | 558 | 21,935 |
| Integrys Energy Group | 130 | 6,915 |
| Intel | 9,884 | 198,372 |
| IntercontinentalExchange | 123 a | 14,129 |
| International Business Machines | 2,298 | 329,993 |
| International Flavors & Fragrances | 127 | 6,370 |
| International Game Technology | 508 | 7,920 |
| International Paper | 734 | 18,556 |
| Interpublic Group of Cos. | 828 a | 8,570 |
| Intuit | 566 a | 27,168 |
| Intuitive Surgical | 69 a | 18,144 |
| Invesco | 755 | 17,365 |
| Iron Mountain | 299 | 6,515 |
| ITT | 319 | 15,054 |
| ITT Educational Services | 59 a | 3,807 |
| J.C. Penney | 357 | 11,131 |
| J.M. Smucker | 216 | 13,884 |
| Jacobs Engineering Group | 213 a | 8,224 |
| JB Hunt Transport Services | 158 | 5,682 |
| Jefferies Group | 165 | 3,948 |
| Johnson & Johnson | 4,905 | 312,301 |
| Johnson Controls | 1,177 | 41,336 |
| Joy Global | 176 | 12,487 |
| JPMorgan Chase & Co. | 7,074 | 266,195 |
| Juniper Networks | 962 a | 31,159 |
| KBR | 301 | 7,645 |
| Kellogg | 476 | 23,924 |
| KeyCorp | 1,511 | 12,375 |
| Kimberly-Clark | 731 | 46,302 |
| Kimco Realty | 726 c | 12,509 |
| Kinder Morgan Management | 151 a | 9,290 |
| KLA-Tencor | 293 | 10,466 |
| Kohl’s | 538 a | 27,546 |
| Kraft Foods, Cl. A | 3,077 | 99,295 |
| Kroger | 1,108 | 24,376 |
| L-3 Communications Holdings | 215 | 15,521 |
The Fund 41
STATEMENT OF INVESTMENTS (continued)
| | |
| Common Stocks (continued) | Shares | Value ($) |
| United States (continued) | | |
| Laboratory Corp. of America Holdings | 180 a | 14,638 |
| Lam Research | 255 a | 11,676 |
| Las Vegas Sands | 584 a | 26,794 |
| Legg Mason | 319 | 9,899 |
| Leggett & Platt | 272 | 5,543 |
| Lender Processing Services | 182 | 5,249 |
| Leucadia National | 341 a | 8,668 |
| Level 3 Communications | 2,769 a | 2,680 |
| Liberty Global, Cl. A | 247 a | 9,334 |
| Liberty Global, Ser. C | 203 a | 7,347 |
| Liberty Media-Interactive, Cl. A | 1,084 a | 16,000 |
| Liberty Property Trust | 187 c | 6,257 |
| Life Technologies | 323 a | 16,208 |
| Limited Brands | 515 | 15,136 |
| Lincoln National | 551 | 13,488 |
| Linear Technology | 380 | 12,247 |
| Lockheed Martin | 580 | 41,348 |
| Loews | 615 | 24,280 |
| Lorillard | 287 | 24,493 |
| Lowe’s | 2,576 | 54,946 |
| LSI | 1,233 a | 6,461 |
| Lubrizol | 130 | 13,324 |
| M & T Bank | 135 | 10,091 |
| Macerich | 218 c | 9,725 |
| Macy’s | 731 | 17,281 |
| Manpower | 158 | 8,647 |
| Marathon Oil | 1,242 | 44,178 |
| Marriott International, Cl. A | 497 | 18,414 |
| Marsh & McLennan | 943 | 23,556 |
| Marshall & Ilsley | 712 | 4,208 |
| Martin Marietta Materials | 71 | 5,714 |
| Marvell Technology Group | 960 a | 18,538 |
| Masco | 590 | 6,289 |
| MasterCard, Cl. A | 174 | 41,770 |
| Mattel | 655 | 15,281 |
| Maxim Integrated Products | 527 | 11,415 |
42
| | | |
| Common Stocks (continued) | Shares | | Value ($) |
| United States (continued) | | | |
| McAfee | 269 | a | 12,724 |
| McCormick & Co. | 225 | | 9,950 |
| McDonald’s | 1,901 | | 147,841 |
| McGraw-Hill | 562 | | 21,159 |
| McKesson | 494 | | 32,594 |
| MDU Resources Group | 351 | | 6,995 |
| Mead Johnson Nutrition | 384 | | 22,587 |
| MeadWestvaco | 345 | | 8,877 |
| Medco Health Solutions | 816 | a | 42,864 |
| Medtronic | 1,948 | | 68,589 |
| MEMC Electronic Materials | 445 | a | 5,705 |
| Merck & Co. | 5,541 | | 201,027 |
| MetLife | 1,582 | | 63,802 |
| Metropcs Communications | 331 | a | 3,446 |
| MGM Resorts International | 436 | a | 4,765 |
| Microchip Technology | 368 | | 11,842 |
| Micron Technology | 1,509 | a | 12,479 |
| Microsoft | 14,031 | | 373,786 |
| Mohawk Industries | 104 | a | 5,963 |
| Molson Coors Brewing, Cl. B | 276 | | 13,035 |
| Monsanto | 986 | | 58,588 |
| Moody’s | 358 | | 9,687 |
| Morgan Stanley | 2,232 | | 55,510 |
| Mosaic | 287 | | 20,997 |
| Motorola | 4,265 | a | 34,760 |
| Murphy Oil | 334 | | 21,763 |
| Mylan | 530 | a | 10,770 |
| Nabors Industries | 516 | a | 10,785 |
| Nasdaq OMX Group | 219 | a | 4,603 |
| National Oilwell Varco | 731 | | 39,299 |
| National Semiconductor | 419 | | 5,740 |
| NetApp | 621 | a | 33,068 |
| Netflix | 75 | a | 13,013 |
| New York Community Bancorp | 658 | | 11,140 |
| Newell Rubbermaid | 529 | | 9,337 |
| Newfield Exploration | 231 | a | 13,772 |
The Fund 43
STATEMENT OF INVESTMENTS (continued)
| | |
| Common Stocks (continued) | Shares | Value ($) |
| United States (continued) | | |
| Newmont Mining | 866 | 52,713 |
| News, Cl. A | 3,199 | 46,258 |
| News, Cl. B | 788 | 12,671 |
| NextEra Energy | 727 | 40,014 |
| NII Holdings | 289 a | 12,083 |
| NIKE, Cl. B | 664 | 54,076 |
| NiSource | 516 | 8,932 |
| Noble | 481 a | 16,609 |
| Noble Energy | 311 | 25,340 |
| Nordstrom | 305 | 11,746 |
| Norfolk Southern | 649 | 39,907 |
| Northeast Utilities | 332 | 10,385 |
| Northern Trust | 406 | 20,150 |
| Northrop Grumman | 529 | 33,438 |
| NRG Energy | 457 a | 9,099 |
| NSTAR | 202 | 8,425 |
| Nuance Communications | 393 a | 6,174 |
| Nucor | 564 | 21,556 |
| NVIDIA | 1,009 a | 12,138 |
| NYSE Euronext | 455 | 13,941 |
| O’Reilly Automotive | 237 a | 13,865 |
| Occidental Petroleum | 1,434 | 112,755 |
| Old Republic International | 426 | 5,623 |
| Omnicare | 202 | 4,872 |
| Omnicom Group | 557 | 24,486 |
| ONEOK | 201 | 10,014 |
| Oracle | 7,130 | 209,622 |
| Owens-Illinois | 292 a | 8,185 |
| Paccar | 606 | 31,064 |
| Pactiv | 242 a | 8,030 |
| Pall | 237 | 10,113 |
| Parker Hannifin | 296 | 22,659 |
| PartnerRe | 125 | 9,915 |
| Patterson | 139 | 3,843 |
| Paychex | 563 | 15,595 |
44
| | |
| Common Stocks (continued) | Shares | Value ($) |
| United States (continued) | | |
| Peabody Energy | 479 | 25,339 |
| Pentair | 186 | 6,088 |
| People’s United Financial | 715 | 8,802 |
| Pepco Holdings | 419 | 8,070 |
| PepsiCo | 2,877 | 187,868 |
| Perrigo | 134 | 8,828 |
| PetroHawk Energy | 577 a | 9,815 |
| PetSmart | 229 | 8,571 |
| Pfizer | 14,338 | 249,481 |
| PG & E | 665 | 31,800 |
| Pharmaceutical Product Development | 185 | 4,775 |
| Philip Morris International | 3,324 | 194,454 |
| Pinnacle West Capital | 192 | 7,903 |
| Pioneer Natural Resources | 200 | 13,960 |
| Pitney Bowes | 342 | 7,503 |
| Plains Exploration & Production | 227 a | 6,326 |
| Plum Creek Timber | 278 c | 10,242 |
| PNC Financial Services Group | 933 | 50,289 |
| Polo Ralph Lauren | 107 | 10,366 |
| PPG Industries | 304 | 23,317 |
| PPL | 815 | 21,924 |
| Praxair | 538 | 49,141 |
| Precision Castparts | 260 | 35,511 |
| Priceline.com | 79 a | 29,768 |
| Pride International | 284 a | 8,611 |
| Principal Financial Group | 567 | 15,218 |
| Procter & Gamble | 5,139 | 326,686 |
| Progress Energy | 499 | 22,455 |
| Progressive | 1,145 | 24,228 |
| ProLogis | 906 c | 12,367 |
| Prudential Financial | 814 | 42,800 |
| Public Service Enterprise Group | 908 | 29,374 |
| Public Storage | 252 c | 25,003 |
| Pulte Group | 591 a | 4,639 |
| QEP Resources | 318 | 10,504 |
The Fund 45
STATEMENT OF INVESTMENTS (continued)
| | | |
| Common Stocks (continued) | Shares | | Value ($) |
| United States (continued) | | | |
| QUALCOMM | 2,967 | | 133,901 |
| Quanta Services | 378 | a | 7,431 |
| Quest Diagnostics | 291 | | 14,300 |
| Qwest Communications International | 2,754 | | 18,176 |
| R.R. Donnelley & Sons | 415 | | 7,657 |
| Ralcorp Holdings | 107 | a | 6,640 |
| Range Resources | 286 | | 10,694 |
| Rayonier | 146 | c | 7,621 |
| Raytheon | 691 | | 31,841 |
| Red Hat | 323 | a | 13,650 |
| Regency Centers | 138 | c | 5,821 |
| Regions Financial | 2,243 | | 14,131 |
| RenaissanceRe Holdings | 95 | | 5,725 |
| Republic Services | 678 | | 20,211 |
| Reynolds American | 322 | | 20,898 |
| Robert Half International | 274 | | 7,428 |
| Rockwell Automation | 252 | | 15,717 |
| Rockwell Collins | 288 | | 17,427 |
| Roper Industries | 183 | | 12,706 |
| Ross Stores | 216 | | 12,742 |
| Rowan | 178 | a | 5,856 |
| Royal Caribbean Cruises | 221 | a | 8,738 |
| Safeway | 725 | | 16,603 |
| SAIC | 706 | a | 10,971 |
| Salesforce.com | 203 | a | 23,562 |
| SanDisk | 405 | a | 15,220 |
| Sara Lee | 1,207 | | 17,296 |
| SBA Communications, Cl. A | 191 | a | 7,499 |
| SCANA | 233 | | 9,516 |
| Schlumberger | 2,437 | | 170,322 |
| Scripps Networks Interactive, Cl. A | 179 | | 9,109 |
| Seagate Technology | 914 | a | 13,390 |
| Sealed Air | 291 | | 6,737 |
| Sears Holdings | 80 | a | 5,758 |
46
| | |
| Common Stocks (continued) | Shares | Value ($) |
| United States (continued) | | |
| SEI Investments | 221 | 4,895 |
| Sempra Energy | 418 | 22,355 |
| Sherwin-Williams | 175 | 12,770 |
| Sigma-Aldrich | 208 | 13,191 |
| Simon Property Group | 510 c | 48,970 |
| SLM | 821 a | 9,770 |
| Southern | 1,485 | 56,237 |
| Southwest Airlines | 263 | 3,619 |
| Southwestern Energy | 619 a | 20,953 |
| Spectra Energy | 1,160 | 27,573 |
| Sprint Nextel | 5,370 a | 22,124 |
| SPX | 89 | 5,968 |
| St. Jude Medical | 599 a | 22,942 |
| Stanley Black & Decker | 269 | 16,670 |
| Staples | 1,265 | 25,895 |
| Starbucks | 1,303 | 37,109 |
| Starwood Hotels & Resorts Worldwide | 322 c | 17,433 |
| State Street | 873 | 36,456 |
| Stericycle | 162 a | 11,622 |
| Stryker | 536 | 26,527 |
| Sunoco | 198 | 7,419 |
| SunTrust Banks | 895 | 22,393 |
| SUPERVALU | 362 | 3,906 |
| Symantec | 1,511 a | 24,448 |
| Synopsys | 266 a | 6,804 |
| SYSCO | 1,038 | 30,579 |
| T. Rowe Price Group | 479 | 26,474 |
| Target | 1,246 | 64,717 |
| TD Ameritrade Holding | 489 | 8,357 |
| Telephone & Data Systems | 80 | 2,786 |
| Teradata | 281 a | 11,060 |
| Texas Instruments | 2,193 | 64,847 |
| Textron | 542 | 11,284 |
| TFS Financial | 198 | 1,733 |
The Fund 47
STATEMENT OF INVESTMENTS (continued)
| | |
| Common Stocks (continued) | Shares | Value ($) |
| United States (continued) | | |
| Thermo Fisher Scientific | 718 a | 36,920 |
| Tiffany & Co. | 212 | 11,236 |
| Time Warner | 2,032 | 66,060 |
| Time Warner Cable | 634 | 36,690 |
| TJX | 735 | 33,729 |
| Toll Brothers | 239 a | 4,288 |
| Torchmark | 166 | 9,508 |
| Total System Services | 300 | 4,683 |
| Transatlantic Holdings | 93 | 4,892 |
| Transocean | 598 a | 37,889 |
| Travelers | 903 | 49,846 |
| Tyco Electronics | 807 | 25,566 |
| Tyco International | 903 | 34,567 |
| Tyson Foods, Cl. A | 547 | 8,506 |
| U.S. Bancorp | 3,373 | 81,559 |
| Ultra Petroleum | 276 a | 11,357 |
| Union Pacific | 890 | 78,035 |
| United Continential Holdings | 87 a | 2,526 |
| United Parcel Service, Cl. B | 1,282 | 86,330 |
| United States Steel | 255 | 10,911 |
| United Technologies | 1,572 | 117,538 |
| UnitedHealth Group | 2,044 | 73,686 |
| Unum Group | 602 | 13,497 |
| Urban Outfitters | 254 a | 7,816 |
| URS | 153 a | 5,956 |
| Valero Energy | 1,039 | 18,650 |
| Validus Holdings | 173 | 4,906 |
| Varian Medical Systems | 215 a | 13,592 |
| Ventas | 285 c | 15,265 |
| VeriSign | 349 a | 12,128 |
| Verisk Analytics, Cl. A | 161 | 4,799 |
| Verizon Communications | 5,010 | 162,675 |
| Vertex Pharmaceuticals | 331 a | 12,687 |
| VF | 157 | 13,069 |
48
| | |
| Common Stocks (continued) | Shares | Value ($) |
| United States (continued) | | |
| Viacom, Cl. B | 1,020 | 39,362 |
| Visa, Cl. A | 874 | 68,321 |
| VMware, Cl. A | 115 a | 8,793 |
| Vornado Realty Trust | 296 c | 25,867 |
| Vulcan Materials | 217 | 7,923 |
| W.R. Berkley | 221 | 6,082 |
| W.W. Grainger | 111 | 13,767 |
| Wal-Mart Stores | 3,652 | 197,829 |
| Walgreen | 1,788 | 60,577 |
| Walt Disney | 3,298 | 119,091 |
| Warner Chilcott, Cl. A | 230 | 5,529 |
| Washington Post, Cl. B | 10 | 4,022 |
| Waste Management | 835 | 29,826 |
| Waters | 161 a | 11,935 |
| Watson Pharmaceuticals | 186 a | 8,677 |
| Weatherford International | 1,332 a | 22,391 |
| WellPoint | 779 a | 42,331 |
| Wells Fargo & Co. | 8,796 | 229,400 |
| Western Digital | 414 a | 13,256 |
| Western Union | 1,286 | 22,634 |
| Weyerhaeuser | 1,481 c | 24,022 |
| Whirlpool | 129 | 9,782 |
| White Mountains Insurance Group | 14 | 4,469 |
| Whole Foods Market | 283 a | 11,249 |
| Williams | 1,045 | 22,488 |
| Windstream | 881 | 11,153 |
| Wisconsin Energy | 200 | 11,908 |
| Wynn Resorts | 130 | 13,932 |
| Xcel Energy | 840 | 20,042 |
| Xerox | 2,395 | 28,022 |
| Xilinx | 501 | 13,432 |
| XL Group | 594 | 12,563 |
| Yahoo! | 2,332 a | 38,501 |
| Yum! Brands | 822 | 40,738 |
The Fund 49
| | |
| STATEMENT OF INVESTMENTS (continued) | | |
| |
| |
| |
| |
| Common Stocks (continued) | Shares | Value ($) |
| United States (continued) | | |
| Zimmer Holdings | 381 a | 18,075 |
| | | 19,879,712 |
| Total Common Stocks | | |
| (cost $41,743,629) | | 37,258,001 |
| |
| Preferred Stocks—.1% | | |
| Germany | | |
| Fresenius | 132 | 11,817 |
| Henkel & Co. | 327 | 19,261 |
| Porsche Automobil Holding | 161 | 8,238 |
| RWE | 68 | 4,600 |
| Volkswagen | 264 | 39,629 |
| Total Preferred Stocks | | |
| (cost $50,202) | | 83,545 |
| | Number of | |
| Rights—.0% | Rights | Value ($) |
| United Kingdom | | |
| Standard Chartered—NPR | | |
| (cost $0) | 414 a | 3,478 |
| | Principal | |
| Short-Term Investments—19.7% | Amount ($) | Value ($) |
| U.S. Treasury Bills: | | |
| 0.13%, 12/23/10 | 1,780,000 d | 1,779,640 |
| 0.13%, 1/13/11 | 3,350,000 | 3,349,320 |
| 0.13%, 1/27/11 | 1,500,000 | 1,499,612 |
| 0.14%, 12/9/10 | 2,500,000 | 2,499,710 |
| 0.14%, 12/30/10 | 1,270,000 | 1,269,730 |
| 0.15%, 11/12/10 | 2,260,000 | 2,259,896 |
| Total Short-Term Investments | | |
| (cost $12,657,528) | | 12,657,908 |
| | Face Amount | |
| | Covered by | |
| Options Purchased—2.5% | Contracts ($) | Value ($) |
| Call Options; | | |
| U.S. Treasury 10 Year Notes, | | |
| November 2010 @ $114 | | |
| (cost $1,458,711) | 13,000,000 a | 1,596,563 |
50
| | |
| Other Investment—18.1% | Shares | Value ($) |
| Registered Investment Company; | | |
| Dreyfus Institutional Preferred | | |
| Plus Money Market Fund | | |
| (cost $11,610,000) | 11,610,000 e | 11,610,000 |
| |
| Total Investments (cost $67,520,070) | 98.4% | 63,209,495 |
| Cash and Receivables (Net) | 1.6% | 1,030,430 |
| Net Assets | 100.0% | 64,239,925 |
|
| BR—Bearer Certificate |
| CDI—Chess Depository Interest |
| NPR—Nill Paid Rights |
| PC—Participation Certificate |
| PPS—Price Protected Shares |
| REIT—Real Estate Investment Trust |
| RSP—Risparmio (Savings) Shares |
| SDR—Swedish Depository Receipts |
| STRIP—Separate Trading of Registered Interest and Principal of Securities |
| a Non-income producing security. |
| b The valuation of this security has been determined in good faith by management under the direction of the Board of |
| Directors.At October 31, 2010, the value of this security amounted to $4 or less than .01% of net assets. |
| c Investment in real estate investment trust. |
| d Held by a broker as collateral for open financial futures, forward foreign currency exchange contracts, and options positions |
| e Investment in affiliated money market mutual fund. |
| | | |
| Portfolio Summary (Unaudited)† | | |
| |
| | Value (%) | | Value (%) |
| Short-Term/ | | Health Care | 5.8 |
| Money Market Investments | 37.8 | Energy | 4.8 |
| Financial | 11.0 | Materials | 3.9 |
| Information Technology | 7.4 | Utilities | 3.8 |
| Industrial | 6.5 | Telecommunication Services | 2.6 |
| Consumer Discretionary | 6.3 | Options Purchased | 2.5 |
| Consumer Staples | 6.0 | | 98.4 |
| |
| † Based on net assets. | | | |
| See notes to financial statements. | | | |
The Fund 51
STATEMENT OF FINANCIAL FUTURES
October 31, 2010
| | | | |
| | | | | Unrealized |
| | | Market Value | | Appreciation |
| | | Covered by | | (Depreciation) |
| | Contracts | Contracts ($) | Expiration | at 10/31/2010 ($) |
| Financial Futures Long | | | | |
| Amsterdam Exchanges Index | 24 | 2,243,954 | November 2010 | (33,377) |
| Australian 10 Year Bond | 63 | 6,541,893 | December 2010 | (67,073) |
| CAC 40 10 Euro | 21 | 1,113,367 | November 2010 | 7,679 |
| DAX | 1 | 230,010 | December 2010 | 12,923 |
| FTSE 100 | 82 | 7,421,651 | December 2010 | 167,698 |
| FTSE/MIB Index | 4 | 594,374 | December 2010 | 17,690 |
| IBEX 35 Index | 2 | 297,854 | November 2010 | (2,294) |
| Japanese 10 Year Mini Bond | 46 | 8,179,491 | December 2010 | 47,470 |
| TOPIX | 17 | 1,701,055 | December 2010 | (54,841) |
| U.S. Treasury 10 Year Notes | 48 | 6,061,500 | December 2010 | (10,559) |
| Financial Futures Short | | | | |
| Canadian 10 Year Bond | 13 | (1,614,908) | December 2010 | (27,895) |
| Euro-Bond | 7 | (1,257,311) | December 2010 | 23,609 |
| Hang Seng | 18 | (2,667,041) | November 2010 | 73,951 |
| Long Gilt | 40 | (7,889,107) | December 2010 | 76,820 |
| S&P ASX 200 Index | 17 | (1,935,870) | December 2010 | 11,839 |
| S & P 500 E-mini | 66 | (3,893,010) | December 2010 | (175,401) |
| S & P/Toronto Stock | | | | |
| Exchange 60 Index | 17 | (2,428,381) | December 2010 | (48,316) |
| Gross Unrealized Appreciation | | | | 439,679 |
| Gross Unrealized Depreciation | | | | (419,756) |
| |
| See notes to financial statements. | | | | |
52
STATEMENT OF ASSETS AND LIABILITIES
October 31, 2010
| | | |
| | | Cost | Value |
| Assets ($): | | | |
| Investments in securities—See Statement of Investments: | | |
| Unaffiliated issuers | | 55,910,070 | 51,599,495 |
| Affiliated issuers | | 11,610,000 | 11,610,000 |
| Cash | | | 150,064 |
| Cash denominated in foreign currencies | | 424,522 | 440,183 |
| Unrealized appreciation on forward foreign | | | |
| currency exchange contracts—Note 4 | | | 2,553,113 |
| Receivable for shares of Common Stock subscribed | | | 456,511 |
| Dividends and interest receivable | | | 98,718 |
| Prepaid expenses | | | 9,458 |
| | | | 66,917,542 |
| Liabilities ($): | | | |
| Due to The Dreyfus Corporation and affiliates—Note 3(c) | | 84,762 |
| Unrealized depreciation on forward foreign | | | |
| currency exchange contracts—Note 4 | | | 2,240,892 |
| Payable for shares of Common Stock redeemed | | | 187,761 |
| Payable for futures variation margin—Note 4 | | | 94,889 |
| Accrued expenses | | | 69,313 |
| | | | 2,677,617 |
| Net Assets ($) | | | 64,239,925 |
| Composition of Net Assets ($): | | | |
| Paid-in capital | | | 150,681,053 |
| Accumulated distributions in excess of investment income—net | | (47,951) |
| Accumulated net realized gain (loss) on investments | | | (82,436,622) |
| Accumulated net unrealized appreciation (depreciation) on investments, | |
| options transactions and foreign currency transactions (including | | |
| $19,923 net unrealized appreciation on financial futures) | | (3,956,555) |
| Net Assets ($) | | | 64,239,925 |
| |
| |
| Net Asset Value Per Share | | | |
| | Class A | Class C | Class I |
| Net Assets ($) | 24,095,887 | 12,599,596 | 27,544,442 |
| Shares Outstanding | 2,116,149 | 1,122,907 | 2,406,951 |
| Net Asset Value Per Share ($) | 11.39 | 11.22 | 11.44 |
| |
| See notes to financial statements. | | | |
The Fund 53
| |
| STATEMENT OF OPERATIONS | |
| Year Ended October 31, 2010 | |
| |
| |
| |
| |
| Investment Income ($): | |
| Income: | |
| Cash dividends (net of $41,781 foreign taxes withheld at source): | |
| Unaffiliated issuers | 910,198 |
| Affiliated issuers | 17,366 |
| Interest | 12,886 |
| Total Income | 940,450 |
| Expenses: | |
| Management fee—Note 3(a) | 696,838 |
| Shareholder servicing costs—Note 3(c) | 209,961 |
| Distribution fees—Note 3(b) | 109,143 |
| Custodian fees—Note 3(c) | 100,539 |
| Professional fees | 57,058 |
| Registration fees | 46,964 |
| Prospectus and shareholders’ reports | 29,368 |
| Directors’ fees and expenses—Note 3(d) | 4,712 |
| Loan commitment fees—Note 2 | 1,272 |
| Miscellaneous | 73,130 |
| Total Expenses | 1,328,985 |
| Less—reduction in fees due to earnings credits—Note 3(c) | (131) |
| Net Expenses | 1,328,854 |
| Investment (Loss)—Net | (388,404) |
| Realized and Unrealized Gain (Loss) on Investments—Note 4 ($): | |
| Net realized gain (loss) on investments and foreign currency transactions | (771,250) |
| Net realized gain (loss) on options transactions | 453,355 |
| Net realized gain (loss) on financial futures | 2,644,826 |
| Net realized gain (loss) on forward foreign currency exchange contracts | 1,846,489 |
| Net Realized Gain (Loss) | 4,173,420 |
| Net unrealized appreciation (depreciation) on | |
| investments and foreign currency transactions | 4,747,437 |
| Net unrealized appreciation (depreciation) on options transactions | 80,016 |
| Net unrealized appreciation (depreciation) on financial futures | (103,377) |
| Net unrealized appreciation (depreciation) on | |
| forward foreign currency exchange contracts | 111,764 |
| Net Unrealized Appreciation (Depreciation) | 4,835,840 |
| Net Realized and Unrealized Gain (Loss) on Investments | 9,009,260 |
| Net Increase in Net Assets Resulting from Operations | 8,620,856 |
| |
| See notes to financial statements. | |
54
STATEMENT OF CHANGES IN NET ASSETS
| | |
| | Year Ended October 31, |
| | 2010 | 2009a |
| Operations ($): | | |
| Investment (loss)—net | (388,404) | (205,829) |
| Net realized gain (loss) on investments | 4,173,420 | (18,278,826) |
| Net unrealized appreciation | | |
| (depreciation) on investments | 4,835,840 | 32,102,839 |
| Net Increase (Decrease) in Net Assets | | |
| Resulting from Operations | 8,620,856 | 13,618,184 |
| Dividends to Shareholders from ($): | | |
| Investment income—net: | | |
| Class A Shares | — | (2,642,752) |
| Class C Shares | — | (673,036) |
| Class I Shares | — | (827,785) |
| Total Dividends | — | (4,143,573) |
| Capital Stock Transactions ($): | | |
| Net proceeds from shares sold: | | |
| Class A Shares | 1,486,128 | 3,279,282 |
| Class C Shares | 214,262 | 622,890 |
| Class I Shares | 14,351,275 | 2,740,880 |
| Dividends reinvested: | | |
| Class A Shares | — | 2,345,416 |
| Class C Shares | — | 391,057 |
| Class I Shares | — | 454,669 |
| Cost of shares redeemed: | | |
| Class A Shares | (17,799,249) | (47,500,085) |
| Class C Shares | (6,885,019) | (12,833,466) |
| Class I Shares | (7,619,255) | (9,021,965) |
| Class T Shares | — | (122,959) |
| Increase (Decrease) in Net Assets | | |
| from Capital Stock Transactions | (16,251,858) | (59,644,281) |
| Total Increase (Decrease) in Net Assets | (7,631,002) | (50,169,670) |
| Net Assets ($): | | |
| Beginning of Period | 71,870,927 | 122,040,597 |
| End of Period | 64,239,925 | 71,870,927 |
| Accumulated distributions in excess | | |
| of investment income—net | (47,951) | (40,589) |
The Fund 55
STATEMENT OF CHANGES IN NET ASSETS (continued)
| | |
| | Year Ended October 31, |
| | 2010 | 2009a |
| Capital Share Transactions: | | |
| Class Ab | | |
| Shares sold | 141,992 | 398,236 |
| Shares issued for dividends reinvested | — | 284,638 |
| Shares redeemed | (1,700,282) | (5,741,131) |
| Net Increase (Decrease) in Shares Outstanding | (1,558,290) | (5,058,257) |
| Class C | | |
| Shares sold | 20,674 | 73,472 |
| Shares issued for dividends reinvested | — | 47,549 |
| Shares redeemed | (664,898) | (1,543,686) |
| Net Increase (Decrease) in Shares Outstanding | (644,224) | (1,422,665) |
| Class I | | |
| Shares sold | 1,364,272 | 334,439 |
| Shares issued for dividends reinvested | — | 55,313 |
| Shares redeemed | (728,702) | (1,097,706) |
| Net Increase (Decrease) in Shares Outstanding | 635,570 | (707,954) |
| Class Tb | | |
| Shares redeemed | — | (15,094) |
|
| a Effective as of the close of business on February 4, 2009, the fund no longer offers Class T shares. |
| b On the close of business on February 4, 2009, 13,233 Class T shares representing $107,984 were converted to |
| 13,738 Class A shares. |
See notes to financial statements.
56
FINANCIAL HIGHLIGHTS
The following tables describe the performance for each share class for the fiscal periods indicated.All information (except portfolio turnover rate) reflects financial results for a single fund share.Total return shows how much your investment in the fund would have increased (or decreased) during each period, assuming you had reinvested all dividends and distributions.These figures have been derived from the fund’s financial statements.
| | | | | |
| | | Year Ended October 31, | |
| Class A Shares | 2010 | 2009 | 2008 | 2007 | 2006a |
| Per Share Data ($): | | | | | |
| Net asset value, beginning of period | 9.98 | 8.48 | 14.25 | 13.23 | 12.50 |
| Investment Operations: | | | | | |
| Investment income (loss)—netb | (.06) | (.01) | .13 | .32 | .12 |
| Net realized and unrealized | | | | | |
| gain (loss) on investments | 1.47 | 1.87 | (5.47) | .93 | .61 |
| Total from Investment Operations | 1.41 | 1.86 | (5.34) | 1.25 | .73 |
| Distributions: | | | | | |
| Dividends from investment income—net | — | (.36) | (.26) | (.07) | — |
| Dividends from net realized | | | | | |
| gain on investments | — | — | (.17) | (.16) | — |
| Total Distributions | — | (.36) | (.43) | (.23) | — |
| Net asset value, end of period | 11.39 | 9.98 | 8.48 | 14.25 | 13.23 |
| Total Return (%)c | 14.13 | 22.83 | (38.52) | 9.53 | 5.84d |
| Ratios/Supplemental Data (%): | | | | | |
| Ratio of total expenses | | | | | |
| to average net assets | 2.06 | 1.98 | 1.61 | 1.52 | 2.67e |
| Ratio of net expenses | | | | | |
| to average net assets | 2.06f | 1.97 | 1.61f | 1.44 | 1.54e |
| Ratio of net investment income | | | | | |
| (loss) to average net assets | (.54) | (.14) | 1.09 | 2.31 | 2.09e |
| Portfolio Turnover Rate | 2.91 | 14.88 | 24.53 | 3.05 | — |
| Net Assets, end of period ($ x 1,000) | 24,096 | 36,670 | 74,083 | 298,284 | 47,215 |
| a | From May 2, 2006 (commencement of operations) to October 31, 2006. |
| b | Based on average shares outstanding at each month end. |
| c | Exclusive of sales charge. |
| d | Not annualized. |
| e | Annualized. |
| f | Expense waivers and/or reimbursements amounted to less than .01%. |
See notes to financial statements.
The Fund 57
FINANCIAL HIGHLIGHTS (continued)
| | | | | |
| | | Year Ended October 31, | |
| Class C Shares | 2010 | 2009 | 2008 | 2007 | 2006a |
| Per Share Data ($): | | | | | |
| Net asset value, beginning of period | 9.91 | 8.37 | 14.10 | 13.18 | 12.50 |
| Investment Operations: | | | | | |
| Investment income (loss)—netb | (.15) | (.07) | .04 | .21 | .08 |
| Net realized and unrealized | | | | | |
| gain (loss) on investments | 1.46 | 1.86 | (5.40) | .93 | .60 |
| Total from Investment Operations | 1.31 | 1.79 | (5.36) | 1.14 | .68 |
| Distributions: | | | | | |
| Dividends from investment income—net | — | (.25) | (.20) | (.06) | — |
| Dividends from net realized | | | | | |
| gain on investments | — | — | (.17) | (.16) | — |
| Total Distributions | — | (.25) | (.37) | (.22) | — |
| Net asset value, end of period | 11.22 | 9.91 | 8.37 | 14.10 | 13.18 |
| Total Return (%)c | 13.22 | 21.94 | (38.97) | 8.80 | 5.36d |
| Ratios/Supplemental Data (%): | | | | | |
| Ratio of total expenses | | | | | |
| to average net assets | 2.81 | 2.73 | 2.35 | 2.28 | 3.49e |
| Ratio of net expenses | | | | | |
| to average net assets | 2.81f | 2.72 | 2.35f | 2.19 | 2.29e |
| Ratio of net investment income | | | | | |
| (loss) to average net assets | (1.43) | (.89) | .32 | 1.53 | 1.33e |
| Portfolio Turnover Rate | 2.91 | 14.88 | 24.53 | 3.05 | — |
| Net Assets, end of period ($ x 1,000) | 12,600 | 17,510 | 26,706 | 84,660 | 3,501 |
| a | From May 2, 2006 (commencement of operations) to October 31, 2006. |
| b | Based on average shares outstanding at each month end. |
| c | Exclusive of sales charge. |
| d | Not annualized. |
| e | Annualized. |
| f | Expense waivers and/or reimbursements amounted to less than .01%. |
See notes to financial statements.
58
| | | | | |
| | | Year Ended October 31, | |
| Class I Shares | 2010 | 2009 | 2008 | 2007a | 2006b |
| Per Share Data ($): | | | | | |
| Net asset value, beginning of period | 9.99 | 8.52 | 14.30 | 13.24 | 12.50 |
| Investment Operations: | | | | | |
| Investment income (loss)—netc | (.01) | .02 | .17 | .36 | .13 |
| Net realized and unrealized | | | | | |
| gain (loss) on investments | 1.46 | 1.87 | (5.48) | .93 | .61 |
| Total from Investment Operations | 1.45 | 1.89 | (5.31) | 1.29 | .74 |
| Distributions: | | | | | |
| Dividends from investment income—net | — | (.42) | (.30) | (.07) | — |
| Dividends from net realized | | | | | |
| gain on investments | — | — | (.17) | (.16) | — |
| Total Distributions | — | (.42) | (.47) | (.23) | — |
| Net asset value, end of period | 11.44 | 9.99 | 8.52 | 14.30 | 13.24 |
| Total Return (%) | 14.51 | 23.29 | (38.29) | 9.86 | 5.92d |
| Ratios/Supplemental Data (%): | | | | | |
| Ratio of total expenses | | | | | |
| to average net assets | 1.64 | 1.60 | 1.26 | 1.23 | 2.51e |
| Ratio of net expenses | | | | | |
| to average net assets | 1.64f | 1.59 | 1.26f | 1.17 | 1.27e |
| Ratio of net investment income | | | | | |
| (loss) to average net assets | (.12) | .23 | 1.37 | 2.58 | 2.31e |
| Portfolio Turnover Rate | 2.91 | 14.88 | 24.53 | 3.05 | — |
| Net Assets, end of period ($ x 1,000) | 27,544 | 17,691 | 21,124 | 62,712 | 7,705 |
| a | Effective June 1, 2007, Class R shares were redesignated as Class I shares. |
| b | From May 2, 2006 (commencement of operations) to October 31, 2006. |
| c | Based on average shares outstanding at each month end. |
| d | Not annualized. |
| e | Annualized. |
| f | Expense waivers and/or reimbursements amounted to less than .01%. |
See notes to financial statements.
The Fund 59
NOTES TO FINANCIAL STATEMENTS
NOTE 1—Significant Accounting Policies:
Global Alpha Fund (the “fund”) is a separate non-diversified series of Advantage Funds, Inc. (the “Company”), which is registered under the Investment Company Act of 1940, as amended (the “Act”), as an open-end management investment company and operates as a series company that offers eleven series, including the fund. The fund’s investment objective is to seek total return by investing in instruments that provide investment exposure to global equity, bond and currency markets, and in fixed income securities. The Dreyfus Corporation (the “Manager” or “Dreyfus”), a wholly-owned subsidiary of The Bank of New York Mellon Corporation (“BNY Mellon”), serves as the fund’s investment adviser. Mellon Capital Management Corporation (“Mellon Capital”), a subsidiary of BNY Mellon, serves as the fund’s sub-investment adviser.
MBSC Securities Corporation (the “Distributor”), a wholly-owned subsidiary of Dreyfus, is the distributor of the fund’s shares.The fund is authorized to issue 100 million shares of $.001 par value Common Stock in each of the following classes of shares: Class A, Class C and Class I. Class A shares are subject to a sales charge imposed at the time of purchase. Class C shares are subject to a contingent deferred sales charge (“CDSC”) imposed on Class C shares redeemed within one year of purchase. Class I shares are sold at net asset value per share only to institutional investors. Other differences between the classes include the services offered to and the expenses borne by each class, the allocation of certain transfer agency costs and certain voting rights. Income, expenses (other than expenses attributable to a specific class) and realized and unrealized gains or losses on investments ar e allocated to each class of shares based on its relative net assets.
The Company accounts separately for the assets, liabilities and operations of each series. Expenses directly attributable to each series are charged to that series’ operations; expenses which are applicable to all series are allocated among them on a pro rata basis.
60
The Financial Accounting Standards Board (“FASB”) Accounting Standards Codification (“ASC”) is the exclusive reference of authoritative U.S. generally accepted accounting principles (“GAAP”) recognized by the FASB to be applied by nongovernmental entities. Rules and interpretive releases of the Securities and Exchange Commission (“SEC”) under authority of federal laws are also sources of authoritative GAAP for SEC registrants. The fund’s financial statements are prepared in accordance with GAAP, which may require the use of management estimates and assumptions.Actual results could differ from those estimates.
The Company enters into contracts that contain a variety of indemnifications.The fund’s maximum exposure under these arrangements is unknown.The fund does not anticipate recognizing any loss related to these arrangements.
(a) Portfolio valuation: Investments in equity securities are valued at the last sales price on the securities exchange or national securities market on which such securities are primarily traded. Securities listed on the National Market System for which market quotations are available are valued at the official closing price or, if there is no official closing price that day, at the last sales price. Securities not listed on an exchange or the national securities market, or securities for which there were no transactions, are valued at the average of the most recent bid and asked prices, except for open short positions, where the asked price is used for valuation purposes. Bid price is used when no asked price is available. U.S.Treasury Bills are valued by an independent pricing service approved by the Board of Directors. R egistered investment companies that are not traded on an exchange are valued at their net asset value.When market quotations or official closing prices are not readily available, or are determined not to reflect accurately fair value, such as when the value of a security has been significantly affected by events after the close of the exchange or market on which the security is principally traded (for example, a foreign exchange or market), but
The Fund 61
NOTES TO FINANCIAL STATEMENTS (continued)
before the fund calculates its net asset value, the fund may value these investments at fair value as determined in accordance with the procedures approved by the Board of Directors. Fair valuing of securities may be determined with the assistance of a pricing service using calculations based on indices of domestic securities and other appropriate indicators, such as prices of relevant American Depository Receipts and futures contracts. For other securities that are fair valued by the Board of Directors, certain factors may be considered such as: fundamental analytical data, the nature and duration of restrictions on disposition, an evaluation of the forces that influence the market in which the securities are purchased and sold, and public trading in similar securities of the issuer or comparable issuers.
Investments in debt securities excluding short-term investments (other than U.S.Treasury Bills), financial futures, options and forward foreign currency exchange contracts (“forward contracts”) are valued each business day by an independent pricing service (the “Service”) approved by the Board of Directors. Investments for which quoted bid prices are readily available and are representative of the bid side of the market in the judgment of the Service are valued at the mean between the quoted bid prices (as obtained by the Service from dealers in such securities) and asked prices (as calculated by the Service based upon its evaluation of the market for such securities). Other investments are valued as determined by the Service, based on methods which include consideration of: yields or prices of securities of comparable quality, coupon, maturity and type; indications as to values from dealers; a nd general market conditions. Restricted securities, as well as securities or other assets for which recent market quotations are not readily available, that are not valued by a pricing service approved by the Board of Directors, or are determined by the fund not to reflect accurately fair value, are valued at fair value as determined in good faith under the direction of the Board of Directors.The factors that may be considered when fair valuing a security include fundamental analytical data, the nature and duration of restrictions on disposition, an evaluation of the forces that influence the market in which the securities are purchased and sold and public trading in similar securities of the issuer or compa-
62
rable issuers. Short-term investments, excluding U.S.Treasury Bills, are carried at amortized cost, which approximates value. Financial futures and options, which are traded on an exchange, are valued at the last sales price on the securities exchange on which such securities are primarily traded or at the last sales price on the national securities market on each business day. Options traded over-the-counter are priced at the mean between the bid and asked price. Investments denominated in foreign currencies are translated to U.S. dollars at the prevailing rates of exchange. Forward contracts are valued at the forward rate.
The fair value of a financial instrument is the amount that would be received to sell an asset or paid to transfer a liability in an orderly transaction between market participants at the measurement date (i.e. the exit price). GAAP establishes a fair value hierarchy that prioritizes the inputs of valuation techniques used to measure fair value.This hierarchy gives the highest priority to unadjusted quoted prices in active markets for identical assets or liabilities (Level 1 measurements) and the lowest priority to unobservable inputs (Level 3 measurements).
Additionally, GAAP provides guidance on determining whether the volume and activity in a market has decreased significantly and whether such a decrease in activity results in transactions that are not orderly. GAAP requires enhanced disclosures around valuation inputs and techniques used during annual and interim periods.
Various inputs are used in determining the value of the fund’s investments relating to fair value measurements.These inputs are summarized in the three broad levels listed below:
Level 1—unadjusted quoted prices in active markets for
identical investments.
Level 2—other significant observable inputs (including quoted
prices for similar investments, interest rates, prepayment speeds,
credit risk, etc.).
Level 3—significant unobservable inputs (including the fund’s
own assumptions in determining the fair value of investments).
The Fund 63
NOTES TO FINANCIAL STATEMENTS (continued)
The inputs or methodology used for valuing securities are not necessarily an indication of the risk associated with investing in those securities.
The following is a summary of the inputs used as of October 31, 2010 in valuing the fund’s investments:
| | | | |
| | | Level 2—Other | Level 3— | |
| | Level 1— | Significant | Significant | |
| | Unadjusted | Observable | Unobservable | |
| | Quoted Prices | Inputs | Inputs | Total |
| Assets ($) | | | | |
| Investments in Securities: | | | |
| Equity Securities— | | | | |
| Domestic† | 19,879,712 | — | — | 19,879,712 |
| Equity Securities— | | | | |
| Foreign† | 17,461,830 | — | 4 | 17,461,834 |
| Mutual Funds | 11,610,000 | — | — | 11,610,000 |
| U.S. Treasury | — | 12,657,908 | — | 12,657,908 |
| Other Financial | | | | |
| Instruments: | | | | |
| Forward Foreign | | | | |
| Currency Exchange | | | | |
| Contracts†† | — | 2,553,113 | — | 2,553,113 |
| Futures†† | 439,679 | — | — | 439,679 |
| Options Purchased | 1,596,563 | — | — | 1,596,563 |
| Rights† | 3,478 | — | — | 3,478 |
| Liabilities ($) | | | | |
| Other Financial | | | | |
| Instruments: | | | | |
| Forward Foreign | | | | |
| Currency Exchange | | | | |
| Contracts†† | — | (2,240,892) | — | (2,240,892) |
| Futures†† | (419,756) | — | — | (419,756) |
| |
| † | See Statement of Investments for country and industry classification. |
| †† | Amount shown represents unrealized appreciation (depreciation) at period end. |
64
The following is a reconciliation of Level 3 assets for which significant unobservable inputs were used to determine fair value:
| |
| | Equity Securities— |
| | Foreign ($) |
| Balance as of 10/31/2009 | — |
| Realized gain (loss) | — |
| Change in unrealized | |
| appreciation (depreciation) | (579) |
| Net purchases (sales) | — |
| Transfers in and/or out of Level 3 | 583 |
| Balance as of 10/31/2010 | 4 |
| The amount of total gains (losses) for | |
| the period included in earnings | |
| attributable to the change in | |
| unrealized gains (losses) relating | |
| to investments still held at 10/31/2010 | (1,715) |
In January 2010, FASB issued Accounting Standards Update (“ASU”) No. 2010-06 “Improving Disclosures about FairValue Measurements”. The portions of ASU No. 2010-06 which require reporting entities to prepare new disclosures surrounding amounts and reasons for significant transfers in and out of Level 1 and Level 2 fair value measurements as well as inputs and valuation techniques used to measure fair value for both recurring and nonrecurring fair value measurements that fall in either Level 2 or Level 3 have been adopted by the fund. No significant transfers between Level 1 or Level 2 fair value measurements occurred at October 31, 2010. The remaining portion of ASU No. 2010-06 requires reporting entities to make new disclosures about information on purchases, sales, issuances and settlements on a gross basis in the reconciliation of activity in Level 3 fair value measurements. These new
The Fund 65
NOTES TO FINANCIAL STATEMENTS (continued)
and revised disclosures are required to be implemented for fiscal years beginning after December 15, 2010. Management is currently evaluating the impact that the adoption of this remaining portion of ASU No. 2010-06 may have on the fund’s financial statement disclosures.
(b) Foreign currency transactions: The fund does not isolate that portion of the results of operations resulting from changes in foreign exchange rates on investments from the fluctuations arising from changes in the market prices of securities held. Such fluctuations are included with the net realized and unrealized gain or loss on investments.
Net realized foreign exchange gains or losses arise from sales of foreign currencies, currency gains or losses realized on securities transactions between trade date and settlement date and the difference between the amounts of dividends, interest and foreign withholding taxes recorded on the fund’s books and the U.S. dollar equivalent of the amounts actually received or paid. Net unrealized foreign exchange gains or losses arise from changes in the value of assets and liabilities other than investments resulting from changes in exchange rates. Foreign currency gains and losses on investments are included with net realized and unrealized gain or loss on investments.
(c) Securities transactions and investment income: Securities transactions are recorded on a trade date basis. Realized gains and losses from securities transactions are recorded on the identified cost basis. Dividend income is recognized on the ex-dividend date and interest income, including, where applicable, accretion of discount and amortization of premium on investments, is recognized on the accrual basis.
Investing in foreign markets may involve special risks and considerations not typically associated with investing in the U.S. These risks include revaluation of currencies, high rates of inflation, repatriation restrictions on income and capital, and adverse political and economic developments. Moreover, securities issued in these markets may be less liquid, subject to government ownership controls and delayed settlements, and their prices may be more volatile than those of comparable securities in the U.S.
66
(d) Affiliated issuers: Investments in other investment companies advised by Dreyfus are defined as “affiliated” in the Act.
The fund may invest in shares of certain affiliated investment companies also advised or managed by Dreyfus. Investments in affiliated investment companies for the period ended October 31, 2010 were as follows:
| | | | | |
| Affiliated | | | | | |
| Investment | Value | | | Value | Net |
| Company | 10/31/2009 ($) | Purchases ($) | Sales ($) | 10/31/2010 ($) | Assets (%) |
| Dreyfus | | | | | |
| Institutional | | | | | |
| Preferred | | | | | |
| Plus Money | | | | | |
| Market Fund | 8,258,000 | 57,339,000 | 53,987,000 | 11,610,000 | 18.1 |
(e) Dividends to shareholders: Dividends are recorded on the ex-dividend date. Dividends from investment income-net and dividends from net realized capital gains, if any, are normally declared and paid annually, but the fund may make distributions on a more frequent basis to comply with the distribution requirements of the Internal Revenue Code of 1986, as amended (the “Code”).To the extent that net realized capital gains can be offset by capital loss carryovers, it is the policy of the fund not to distribute such gains. Income and capital gain distributions are determined in accordance with income tax regulations, which may differ from GAAP.
(f) Federal income taxes: It is the policy of the fund to continue to qualify as a regulated investment company, if such qualification is in the best interests of its shareholders, by complying with the applicable provisions of the Code, and to make distributions of taxable income sufficient to relieve it from substantially all federal income and excise taxes.
As of and during the period ended October 31, 2010, the fund did not have any liabilities for any uncertain tax positions.The fund recognizes interest and penalties, if any, related to uncertain tax positions as income tax expense in the Statement of Operations. During the period, the fund did not incur any interest or penalties.
The Fund 67
NOTES TO FINANCIAL STATEMENTS (continued)
Each of the tax years in the four-year period ended October 31, 2010 remains subject to examination by the Internal Revenue Service and state taxing authorities.
At October 31, 2010, the components of accumulated earnings on a tax basis were as follows: accumulated capital losses $81,845,484 and unrealized depreciation $4,595,644.
The accumulated capital loss carryover is available for federal income tax purposes to be applied against future net securities profits, if any, realized subsequent to October 31, 2010. If not applied, $63,509,031 of the carryover expires in fiscal 2016 and $18,336,453 expires in fiscal 2017.
The tax character of distributions paid to shareholders during the fiscal periods ended October 31, 2010 and October 31, 2009 were as follows: ordinary income $0 and $4,143,573, respectively.
During the period ended October 31, 2010, as a result of permanent book to tax differences, primarily due to the tax treatment for foreign currency transactions, passive foreign investment companies, net operating losses and real estate investment trusts, the fund increased accumulated undistributed investment income-net by $381,042, decreased accumulated net realized gain (loss) on investments by $14,058 and decreased paid-in capital by $366,984. Net assets and net asset value per share were not affected by this reclassification.
NOTE 2—Bank Lines of Credit:
The fund participates with other Dreyfus-managed funds in a $225 million unsecured credit facility led by Citibank, N.A. and a $300 million unsecured credit facility provided by The Bank of New York Mellon, a subsidiary of BNY Mellon and an affiliate of Dreyfus (each, a “Facility”), each to be utilized primarily for temporary or emergency purposes, including the financing of redemptions. In connection therewith, the fund has agreed to pay its pro rata portion of commitment fees for each Facility. Interest is charged to the fund based on rates determined pursuant to the terms of the respective Facility at the time of borrowing. During the period ended October 31, 2010, the fund did not borrow under the Facilities.
68
NOTE 3—Management Fee, Sub-Investment Advisory Fee and Other Transactions With Affiliates:
(a) Pursuant to a management agreement with Dreyfus, the management fee is computed at the annual rate of 1.10% of the value of the fund’s average daily net assets and is payable monthly.
Pursuant to a sub-investment advisory agreement between Dreyfus and Mellon Capital, Dreyfus pays Mellon Capital an annual fee of .65% of the value of the fund’s average daily net assets and is payable monthly.
During the period ended October 31, 2010, the Distributor retained $1,909 from commissions earned on sales of the fund’s Class A shares and $1,104 from CDSCs on redemptions of the fund’s Class C shares.
(b) Under the Distribution Plan (the “Plan”) adopted pursuant to Rule 12b-1 under the Act, Class C shares pay the Distributor for distributing its shares at an annual rate of .75% of the value of the average daily net assets of Class C shares. During the period ended October 31, 2010, Class C shares were charged $109,143 pursuant to the Plan.
(c) Under the Shareholder Services Plan, Class A and Class C shares pay the Distributor at an annual rate of .25% of the value of their average daily net assets for the provision of certain services.The services provided may include personal services relating to shareholder accounts, such as answering shareholder inquiries regarding the fund and providing reports and other information, and services related to the maintenance of shareholder accounts.The Distributor may make payments to Service Agents (a securities dealer, financial institution or other industry professional) in respect of these services. The Distributor determines the amounts to be paid to Service Agents. During the period ended October 31, 2010, Class A and Class C shares were charged $72,230 and $36,381, respectively, pursuant to the Shareholder Services Pl an.
The fund compensates Dreyfus Transfer, Inc., a wholly-owned subsidiary of Dreyfus, under a transfer agency agreement for providing personnel and facilities to perform transfer agency services for the fund. During the period ended October 31, 2010, the fund was charged
The Fund 69
NOTES TO FINANCIAL STATEMENTS (continued)
$17,608 pursuant to the transfer agency agreement, which is included in Shareholder servicing costs in the Statement of Operations.
The fund has arrangements with the custodian and cash management bank whereby the fund may receive earnings credits when positive cash balances are maintained, which are used to offset custody and cash management fees. For financial reporting purposes, the fund includes net earnings credits as an expense offset in the Statement of Operations.
The fund compensates The Bank of New York Mellon under a cash management agreement for performing cash management services related to fund subscriptions and redemptions. During the period ended October 31, 2010, the fund was charged $1,775 pursuant to the cash management agreement, which is included in Shareholder servicing costs in the Statement of Operations.These fees were partially offset by earnings credits of $101.
The fund also compensates The Bank of New York Mellon under a custody agreement for providing custodial services for the fund. During the period ended October 31, 2010, the fund was charged $100,539 pursuant to the custody agreement.
During the period ended October 31, 2010, the fund was charged $6,114 for services performed by the Chief Compliance Officer.
The components of “Due to The Dreyfus Corporation and affiliates” in the Statement of Assets and Liabilities consist of: management fees $60,074, Rule 12b-1 distribution plan fees $8,189, shareholder services plan fees $7,941, custodian fees $4,410, chief compliance officer fees $2,248 and transfer agency per account fees $1,900.
(d) Each Board member also serves as a Board member of other funds within the Dreyfus complex. Annual retainer fees and attendance fees are allocated to each fund based on net assets.
NOTE 4—Securities Transactions:
The aggregate amount of purchases and sales of investment securities, excluding short-term securities, financial futures, options transactions
70
and forward contracts, during the period ended October 31, 2010, amounted to $1,083,471 and $10,684,418, respectively.
The provisions of ASC Topic 815 “Derivatives and Hedging” require qualitative disclosures about objectives and strategies for using derivatives, quantitative disclosures about fair value amounts of gains and losses on derivative instruments and disclosures about credit-risk-related contingent features in derivative agreements. The disclosure requirements distinguish between derivatives, which are accounted for as “hedges” and those that do not qualify for hedge accounting. Because investment companies value their derivatives at fair value and recognize changes in fair value through the Statement of Operations, they do not qualify for such accounting. Accordingly, even though a fund’s investments in derivatives may represent economic hedges, they are considered to be non-hedge transactions for purposes of this disclosure. The following tables show the fund’s exposure to different types of market risk as it relates to the Statement of Assets and Liabilities and the Statement of Operations, respectively.
Fair value of derivative instruments as of October 31, 2010 is shown below:
| | | |
| | Derivative | | Derivative |
| | Assets ($) | | Liabilities ($) |
| Equity risk1 | 291,780 | Equity risk1 | (314,229) |
| Interest rate risk1,2 | 1,744,462 | Interest rate risk1 | (105,527) |
| Foreign exchange risk3 | 2,553,113 | Foreign exchange risk4 | (2,240,892) |
| Gross fair value of | | | |
| derivative contracts | 4,589,355 | | (2,660,648) |
Statement of Assets and Liabilities location:
| |
| 1 | Includes cumulative appreciation (depreciation) on futures contracts as reported in the Statement of |
| | Financial Futures, but only the unpaid variation margin is reported in the Statement of Assets |
| | and Liabilities. |
| 2 | Options purchased are included in investments in securities of unaffiliated issuers. |
| 3 | Unrealized appreciation on forward foreign currency exchange contracts. |
| 4 | Unrealized depreciation on forward foreign currency exchange contracts. |
The Fund 71
NOTES TO FINANCIAL STATEMENTS (continued)
The effect of derivative instruments in the Statement of Operations during the period ended October 31, 2010 is shown below:
| | | | |
| | Amount of realized gain or (loss) on derivatives recognized in income ($) |
| | | | Forward | |
| Underlying risk | Futures5 | Options6 | Contracts7 | Total |
| Equity | 453,934 | — | — | 453,934 |
| Interest rate | 2,190,892 | 453,355 | — | 2,644,247 |
| Foreign exchange | — | — | 1,846,489 | 1,846,489 |
| Total | 2,644,826 | 453,355 | 1,846,489 | 4,944,670 |
| | | | |
| Change in unrealized appreciation or (depreciation) on derivatives recognized in income ($) |
| | | | Forward | |
| Underlying risk | Futures8 | Options9 | Contracts10 | Total |
| Equity | 74,295 | — | — | 74,295 |
| Interest rate | (177,672) | 80,016 | — | (97,656) |
| Foreign exchange | — | — | 111,764 | 111,764 |
| Total | (103,377) | 80,016 | 111,764 | 88,403 |
| |
| Statement of Operations location: |
| 5 | Net realized gain (loss) on financial futures. |
| 6 | Net realized gain (loss) on options transactions. |
| 7 | Net realized gain (loss) on forward foreign currency exchange contracts. |
| 8 | Net unrealized appreciation (depreciation) on financial futures. |
| 9 | Net unrealized appreciation (depreciation) on options transactions. |
| 10 Net unrealized appreciation (depreciation) on forward foreign currency exchange contracts. |
The following summarizes the average market value of derivatives outstanding during the period ended October 31, 2010:
| |
| | Value ($) |
| Equity futures contracts | 20,631,965 |
| Interest rate futures contracts | 45,749,756 |
| Interest rate options contracts | 509,454 |
| Forward contracts | 79,777,835 |
Futures Contracts: In the normal course of pursuing its investment objective, the fund is exposed to market risk, including equity price risk and interest rate risk as a result of changes in value of underlying financial instruments.The fund invests in financial futures contracts in order to manage its exposure to or protect against changes in the market. A futures contract represents a commitment for the future purchase or a
72
sale of an asset at a specified date. Upon entering into such contracts, these investments require initial margin deposits with a broker, which consist of cash or cash equivalents. The amount of these deposits is determined by the exchange or Board of Trade on which the contract is traded and is subject to change. Accordingly, variation margin payments are received or made to reflect daily unrealized gains or losses which are recorded in the Statement of Operations. Futures contracts are valued daily at the last sales price established by the Board of Trade or exchange upon which they are traded. When the contracts are closed, the fund recognizes a realized gain or loss. There is minimal counterparty credit risk to the fund with futures since futures are exchange traded, and the exchange’s clearinghouse guarantees the futures against default. Contracts open at October 31, 2010 are set forth in the Statement o f Financial Futures.
Options: The fund purchases and writes (sells) put and call options to hedge against changes in interest rates or as a substitute for an invest-ment.The fund is subject to interest rate risk in the course of pursuing its investment objectives through its investments in options contracts.A call option gives the purchaser of the option the right (but not the obligation) to buy, and obligates the writer to sell, the underlying security or securities at the exercise price at any time during the option period, or at a specified date. Conversely, a put option gives the purchaser of the option the right (but not the obligation) to sell, and obligates the writer to buy the underlying security or securities at the exercise price at any time during the option period, or at a specified date.
As a writer of call options, the fund receives a premium at the outset and then bears the market risk of unfavorable changes in the price of the financial instrument underlying the option. Generally, the fund realizes a gain, to the extent of the premium, if the price of the underlying financial instrument decreases between the date the option is written and the date on which the option is terminated. Generally, the fund incurs a loss, if the price of the financial instrument increases between those dates.
The Fund 73
NOTES TO FINANCIAL STATEMENTS (continued)
As a writer of put options, the fund receives a premium at the outset and then bears the market risk of unfavorable changes in the price of the financial instrument underlying the option. Generally, the fund realizes a gain, to the extent of the premium, if the price of the underlying financial instrument increases between the date the option is written and the date on which the option is terminated. Generally, the fund incurs a loss, if the price of the financial instrument decreases between those dates.
As a writer of an option, the fund has no control over whether the underlying securities may be sold (called) or purchased (put) and as a result bears the market risk of an unfavorable change in the price of the security underlying the written option.There is a risk of loss from a change in value of such options which may exceed the related premiums received. One risk of holding a put or a call option is that if the option is not sold or exercised prior to its expiration, it becomes worthless. However, this risk is limited to the premium paid by the fund. Upon the expiration or closing of the option transaction, a gain or loss is reported in the Statement of Operations.
Forward Foreign Currency Exchange Contracts: The fund enters into forward contracts in order to hedge its exposure to changes in foreign currency exchange rates on its foreign portfolio holdings, to settle foreign currency transactions or as a part of its investment strategy. When executing forward contracts, the fund is obligated to buy or sell a foreign currency at a specified rate on a certain date in the future. With respect to sales of forward contracts, the fund incurs a loss if the value of the contract increases between the date the forward contract is opened and the date the forward contract is closed.The fund realizes a gain if the value of the contract decreases between those dates.With respect to purchases of forward contracts, the fund incurs a loss if the value of the contract decreases between the date the for ward contract is opened and the date the forward contract is closed.The fund realizes a gain if the value of the contract increases between those dates. Any realized gain or loss which occurred during the period is reflected in the Statement of Operations.The fund is exposed to foreign currency risk as a result of changes in value of underlying financial instruments.
74
The fund is also exposed to credit risk associated with counterparty nonperformance on these forward contracts, which is typically limited to the unrealized gain on each open contract.The following summarizes open forward contracts at October 31, 2010:
| | | | |
| | Foreign | | | Unrealized |
| Forward Foreign Currency | Currency | | | Appreciation |
| Exchange Contracts | Amounts | Cost ($) | Value ($) (Depreciation) ($) |
| Purchases: | | | | |
| Australian Dollar, | | | | |
| Expiring 12/15/2010 | 3,393,554 | 3,083,146 | 3,304,772 | 221,626 |
| Australian Dollar, | | | | |
| Expiring 12/15/2010 | 139,200 | 128,412 | 135,558 | 7,146 |
| Australian Dollar, | | | | |
| Expiring 12/15/2010 | 904,800 | 835,004 | 881,129 | 46,125 |
| Australian Dollar, | | | | |
| Expiring 12/15/2010 | 104,400 | 96,565 | 101,669 | 5,104 |
| Australian Dollar, | | | | |
| Expiring 12/15/2010 | 243,600 | 225,537 | 237,227 | 11,690 |
| Australian Dollar, | | | | |
| Expiring 12/15/2010 | 68,970 | 65,490 | 67,166 | 1,676 |
| Australian Dollar, | | | | |
| Expiring 12/15/2010 | 736,960 | 699,400 | 717,679 | 18,279 |
| Australian Dollar, | | | | |
| Expiring 12/15/2010 | 761,570 | 723,544 | 741,646 | 18,102 |
| Australian Dollar, | | | | |
| Expiring 12/15/2010 | 114,000 | 112,210 | 111,017 | (1,193) |
| British Pound, | | | | |
| Expiring 12/15/2010 | 258,465 | 408,861 | 413,997 | 5,136 |
| British Pound, | | | | |
| Expiring 12/15/2010 | 267,096 | 422,205 | 427,821 | 5,616 |
| British Pound, | | | | |
| Expiring 12/15/2010 | 24,189 | 38,242 | 38,745 | 503 |
| British Pound, | | | | |
| Expiring 12/15/2010 | 408,000 | 645,893 | 653,515 | 7,622 |
| British Pound, | | | | |
| Expiring 12/15/2010 | 167,600 | 264,067 | 268,454 | 4,387 |
| British Pound, | | | | |
| Expiring 12/15/2010 | 167,600 | 264,050 | 268,453 | 4,403 |
| British Pound, | | | | |
| Expiring 12/15/2010 | 83,800 | 132,100 | 134,227 | 2,127 |
| British Pound, | | | | |
| Expiring 12/15/2010 | 257,899 | 404,178 | 413,090 | 8,912 |
| British Pound, | | | | |
| Expiring 12/15/2010 | 902,070 | 1,412,498 | 1,444,892 | 32,394 |
The Fund 75
NOTES TO FINANCIAL STATEMENTS (continued)
| | | | |
| | Foreign | | | Unrealized |
| Forward Foreign Currency | Currency | | | Appreciation |
| Exchange Contracts | Amounts | Cost ($) | Value ($) (Depreciation) ($) |
| Purchases (continued): | | | | |
| British Pound, | | | | |
| Expiring 12/15/2010 | 520,425 | 815,870 | 833,592 | 17,722 |
| British Pound, | | | | |
| Expiring 12/15/2010 | 501,364 | 795,218 | 803,061 | 7,843 |
| British Pound, | | | | |
| Expiring 12/15/2010 | 496,400 | 785,305 | 795,110 | 9,805 |
| British Pound, | | | | |
| Expiring 12/15/2010 | 171,258 | 271,616 | 274,313 | 2,697 |
| British Pound, | | | | |
| Expiring 12/15/2010 | 1,312,978 | 2,078,969 | 2,103,065 | 24,096 |
| British Pound, | | | | |
| Expiring 12/15/2010 | 92,100 | 145,887 | 147,521 | 1,634 |
| British Pound, | | | | |
| Expiring 12/15/2010 | 153,500 | 242,806 | 245,869 | 3,063 |
| British Pound, | | | | |
| Expiring 12/15/2010 | 61,400 | 97,147 | 98,348 | 1,201 |
| Canadian Dollar, | | | | |
| Expiring 12/15/2010 | 1,460,559 | 1,406,412 | 1,430,412 | 24,000 |
| Canadian Dollar, | | | | |
| Expiring 12/15/2010 | 1,231,913 | 1,185,295 | 1,206,485 | 21,190 |
| Canadian Dollar, | | | | |
| Expiring 12/15/2010 | 187,900 | 182,128 | 184,021 | 1,893 |
| Canadian Dollar, | | | | |
| Expiring 12/15/2010 | 1,221,350 | 1,184,397 | 1,196,140 | 11,743 |
| Canadian Dollar, | | | | |
| Expiring 12/15/2010 | 328,825 | 319,446 | 322,038 | 2,592 |
| Canadian Dollar, | | | | |
| Expiring 12/15/2010 | 140,925 | 136,657 | 138,016 | 1,359 |
| Canadian Dollar, | | | | |
| Expiring 12/15/2010 | 394,632 | 383,724 | 386,486 | 2,762 |
| Canadian Dollar, | | | | |
| Expiring 12/15/2010 | 381,879 | 371,322 | 373,997 | 2,675 |
| Canadian Dollar, | | | | |
| Expiring 12/15/2010 | 35,739 | 34,752 | 35,001 | 249 |
| Canadian Dollar, | | | | |
| Expiring 12/15/2010 | 21,900 | 21,602 | 21,448 | (154) |
| Canadian Dollar, | | | | |
| Expiring 12/15/2010 | 87,600 | 86,083 | 85,792 | (291) |
| Canadian Dollar, | | | | |
| Expiring 12/15/2010 | 131,400 | 129,355 | 128,688 | (667) |
| Canadian Dollar, | | | | |
| Expiring 12/15/2010 | 197,100 | 194,280 | 193,032 | (1,248) |
| Canadian Dollar, | | | | |
| Expiring 12/15/2010 | 197,000 | 196,278 | 192,934 | (3,344) |
76
| | | | |
| | Foreign | | | Unrealized |
| Forward Foreign Currency | Currency | | | Appreciation |
| Exchange Contracts | Amounts | Cost ($) | Value ($) (Depreciation) ($) |
| Purchases (continued): | | | | |
| Euro, | | | | |
| Expiring 12/15/2010 | 135,800 | 173,920 | 188,894 | 14,974 |
| Euro, | | | | |
| Expiring 12/15/2010 | 237,650 | 305,756 | 330,565 | 24,809 |
| Euro, | | | | |
| Expiring 12/15/2010 | 101,850 | 130,978 | 141,670 | 10,692 |
| Euro, | | | | |
| Expiring 12/15/2010 | 882,700 | 1,131,895 | 1,227,812 | 95,917 |
| Euro, | | | | |
| Expiring 12/15/2010 | 1,035,648 | 1,347,124 | 1,440,558 | 93,434 |
| Euro, | | | | |
| Expiring 12/15/2010 | 452,352 | 588,233 | 629,209 | 40,976 |
| Euro, | | | | |
| Expiring 12/15/2010 | 480,637 | 631,036 | 668,553 | 37,517 |
| Euro, | | | | |
| Expiring 12/15/2010 | 328,080 | 430,713 | 456,350 | 25,637 |
| Euro, | | | | |
| Expiring 12/15/2010 | 558,283 | 732,970 | 776,557 | 43,587 |
| Euro, | | | | |
| Expiring 12/15/2010 | 442,400 | 603,270 | 615,366 | 12,096 |
| Euro, | | | | |
| Expiring 12/15/2010 | 995,400 | 1,355,832 | 1,384,574 | 28,742 |
| Euro, | | | | |
| Expiring 12/15/2010 | 774,200 | 1,052,670 | 1,076,891 | 24,221 |
| Euro, | | | | |
| Expiring 12/15/2010 | 1,299,500 | 1,772,167 | 1,807,569 | 35,402 |
| Euro, | | | | |
| Expiring 12/15/2010 | 779,700 | 1,059,858 | 1,084,542 | 24,684 |
| Euro, | | | | |
| Expiring 12/15/2010 | 519,800 | 708,669 | 723,027 | 14,358 |
| Euro, | | | | |
| Expiring 12/15/2010 | 421,000 | 578,478 | 585,600 | 7,122 |
| Euro, | | | | |
| Expiring 12/15/2010 | 1,684,000 | 2,313,910 | 2,342,398 | 28,488 |
| Euro, | | | | |
| Expiring 12/15/2010 | 707,700 | 978,292 | 984,391 | 6,099 |
| Euro, | | | | |
| Expiring 12/15/2010 | 117,950 | 163,074 | 164,065 | 991 |
| Euro, | | | | |
| Expiring 12/15/2010 | 1,061,550 | 1,469,071 | 1,476,587 | 7,516 |
| Euro, | | | | |
| Expiring 12/15/2010 | 471,800 | 651,435 | 656,261 | 4,826 |
| Euro, | | | | |
| Expiring 12/15/2010 | 465,000 | 648,861 | 646,802 | (2,059) |
The Fund 77
NOTES TO FINANCIAL STATEMENTS (continued)
| | | | |
| | Foreign | | | Unrealized |
| Forward Foreign Currency | Currency | | | Appreciation |
| Exchange Contracts | Amounts | Cost ($) | Value ($) (Depreciation) ($) |
| Purchases (continued): | | | | |
| Euro, | | | | |
| Expiring 12/15/2010 | 220,752 | 308,506 | 307,060 | (1,446) |
| Euro, | | | | |
| Expiring 12/15/2010 | 210,240 | 293,970 | 292,438 | (1,532) |
| Euro, | | | | |
| Expiring 12/15/2010 | 655,248 | 914,712 | 911,432 | (3,280) |
| Euro, | | | | |
| Expiring 12/15/2010 | 665,760 | 929,506 | 926,054 | (3,452) |
| Japanese Yen, | | | | |
| Expiring 12/15/2010 | 826,702,103 | 9,864,180 10,278,080 | 413,900 |
| New Zealand Dollar, | | | | |
| Expiring 12/15/2010 | 2,969,698 | 2,130,491 | 2,254,995 | 124,504 |
| Norwegian Krone, | | | | |
| Expiring 12/15/2010 | 4,013,550 | 646,846 | 683,603 | 36,757 |
| Swedish Krona, | | | | |
| Expiring 12/15/2010 | 28,809,472 | 3,931,906 | 4,306,465 | 374,559 |
| Swedish Krona, | | | | |
| Expiring 12/15/2010 | 15,512,794 | 2,129,299 | 2,318,866 | 189,567 |
| Swedish Krona, | | | | |
| Expiring 12/15/2010 | 850,853 | 124,626 | 127,186 | 2,560 |
| Swedish Krona, | | | | |
| Expiring 12/15/2010 | 879,268 | 128,812 | 131,434 | 2,622 |
| Swedish Krona, | | | | |
| Expiring 12/15/2010 | 79,629 | 11,663 | 11,903 | 240 |
| Swiss Franc, | | | | |
| Expiring 12/15/2010 | 7,648,184 | 7,579,288 | 7,775,210 | 195,922 |
| Swiss Franc, | | | | |
| Expiring 12/15/2010 | 108,550 | 107,367 | 110,353 | 2,986 |
| Swiss Franc, | | | | |
| Expiring 12/15/2010 | 16,700 | 16,487 | 16,977 | 490 |
| Swiss Franc, | | | | |
| Expiring 12/15/2010 | 12,525 | 12,426 | 12,733 | 307 |
| Swiss Franc, | | | | |
| Expiring 12/15/2010 | 29,225 | 29,014 | 29,710 | 696 |
| Swiss Franc, | | | | |
| Expiring 12/15/2010 | 279,849 | 284,838 | 284,497 | (341) |
| Swiss Franc, | | | | |
| Expiring 12/15/2010 | 270,807 | 275,404 | 275,305 | (99) |
| Swiss Franc, | | | | |
| Expiring 12/15/2010 | 25,344 | 25,742 | 25,765 | 23 |
78
| | | | |
| | Foreign | | | Unrealized |
| Forward Foreign Currency | Currency | | | Appreciation |
| Exchange Contracts | Amounts | Proceeds ($) | Value ($) (Depreciation) ($) |
| Sales: | | | | |
| Australian Dollar, | | | | |
| Expiring 12/15/2010 | 152,400 | 148,613 | 148,413 | 200 |
| Australian Dollar, | | | | |
| Expiring 12/15/2010 | 101,600 | 98,875 | 98,942 | (67) |
| Australian Dollar, | | | | |
| Expiring 12/15/2010 | 25,400 | 24,775 | 24,736 | 39 |
| Australian Dollar, | | | | |
| Expiring 12/15/2010 | 228,600 | 223,063 | 222,619 | 444 |
| Australian Dollar, | | | | |
| Expiring 12/15/2010 | 656,500 | 635,297 | 639,325 | (4,028) |
| Australian Dollar, | | | | |
| Expiring 12/15/2010 | 273,200 | 267,408 | 266,052 | 1,356 |
| Australian Dollar, | | | | |
| Expiring 12/15/2010 | 273,200 | 267,791 | 266,053 | 1,738 |
| Australian Dollar, | | | | |
| Expiring 12/15/2010 | 136,600 | 133,828 | 133,026 | 802 |
| Australian Dollar, | | | | |
| Expiring 12/15/2010 | 398,970 | 388,031 | 388,532 | (501) |
| Australian Dollar, | | | | |
| Expiring 12/15/2010 | 114,064 | 111,023 | 111,080 | (57) |
| Australian Dollar, | | | | |
| Expiring 12/15/2010 | 230,175 | 224,267 | 224,153 | 114 |
| Australian Dollar, | | | | |
| Expiring 12/15/2010 | 261,800 | 255,899 | 254,951 | 948 |
| Australian Dollar, | | | | |
| Expiring 12/15/2010 | 264,418 | 259,284 | 257,500 | 1,784 |
| Australian Dollar, | | | | |
| Expiring 12/15/2010 | 90,321 | 88,420 | 87,958 | 462 |
| Australian Dollar, | | | | |
| Expiring 12/15/2010 | 692,461 | 677,612 | 674,345 | 3,267 |
| Australian Dollar, | | | | |
| Expiring 12/15/2010 | 131,300 | 126,842 | 127,865 | (1,023) |
| Australian Dollar, | | | | |
| Expiring 12/15/2010 | 262,600 | 253,924 | 255,730 | (1,806) |
| Australian Dollar, | | | | |
| Expiring 12/15/2010 | 262,600 | 253,687 | 255,729 | (2,042) |
| British Pound, | | | | |
| Expiring 12/15/2010 | 1,212,824 | 1,854,359 | 1,942,643 | (88,284) |
| British Pound, | | | | |
| Expiring 12/15/2010 | 3,926,264 | 6,085,886 | 6,288,902 | (203,016) |
The Fund 79
NOTES TO FINANCIAL STATEMENTS (continued)
| | | | |
| | Foreign | | | Unrealized |
| Forward Foreign Currency | Currency | | | Appreciation |
| Exchange Contracts | Amounts | Proceeds ($) | Value ($) (Depreciation) ($) |
| Sales (continued): | | | | |
| British Pound, | | | | |
| Expiring 12/15/2010 | 179,800 | 276,692 | 287,995 | (11,303) |
| British Pound, | | | | |
| Expiring 12/15/2010 | 1,168,700 | 1,798,746 | 1,871,968 | (73,222) |
| British Pound, | | | | |
| Expiring 12/15/2010 | 134,850 | 207,897 | 215,996 | (8,099) |
| British Pound, | | | | |
| Expiring 12/15/2010 | 314,650 | 485,291 | 503,991 | (18,700) |
| British Pound, | | | | |
| Expiring 12/15/2010 | 265,872 | 415,192 | 425,861 | (10,669) |
| British Pound, | | | | |
| Expiring 12/15/2010 | 116,128 | 181,319 | 186,008 | (4,689) |
| British Pound, | | | | |
| Expiring 12/15/2010 | 347,900 | 549,152 | 557,250 | (8,098) |
| British Pound, | | | | |
| Expiring 12/15/2010 | 198,800 | 313,502 | 318,428 | (4,926) |
| British Pound, | | | | |
| Expiring 12/15/2010 | 447,300 | 706,139 | 716,464 | (10,325) |
| British Pound, | | | | |
| Expiring 12/15/2010 | 136,000 | 214,152 | 217,838 | (3,686) |
| British Pound, | | | | |
| Expiring 12/15/2010 | 340,000 | 534,205 | 544,596 | (10,391) |
| British Pound, | | | | |
| Expiring 12/15/2010 | 204,000 | 320,280 | 326,758 | (6,478) |
| British Pound, | | | | |
| Expiring 12/15/2010 | 121,600 | 192,270 | 194,773 | (2,503) |
| British Pound, | | | | |
| Expiring 12/15/2010 | 486,400 | 769,081 | 779,092 | (10,011) |
| British Pound, | | | | |
| Expiring 12/15/2010 | 186,600 | 295,427 | 298,887 | (3,460) |
| British Pound, | | | | |
| Expiring 12/15/2010 | 419,850 | 664,827 | 672,496 | (7,669) |
| British Pound, | | | | |
| Expiring 12/15/2010 | 279,900 | 442,872 | 448,331 | (5,459) |
| British Pound, | | | | |
| Expiring 12/15/2010 | 46,650 | 73,771 | 74,721 | (950) |
| Canadian Dollar, | | | | |
| Expiring 12/15/2010 | 131,000 | 127,973 | 128,296 | (323) |
| Canadian Dollar, | | | | |
| Expiring 12/15/2010 | 524,000 | 511,892 | 513,184 | (1,292) |
| Canadian Dollar, | | | | |
| Expiring 12/15/2010 | 821,600 | 804,402 | 804,642 | (240) |
| Canadian Dollar, | | | | |
| Expiring 12/15/2010 | 410,800 | 402,229 | 402,321 | (92) |
80
| | | | |
| | Foreign | | | Unrealized |
| Forward Foreign Currency | Currency | | | Appreciation |
| Exchange Contracts | Amounts | Proceeds ($) | Value ($) (Depreciation) ($) |
| Sales (continued): | | | | |
| Canadian Dollar, | | | | |
| Expiring 12/15/2010 | 821,600 | 803,847 | 804,641 | (794) |
| Canadian Dollar, | | | | |
| Expiring 12/15/2010 | 200,400 | 194,423 | 196,263 | (1,840) |
| Canadian Dollar, | | | | |
| Expiring 12/15/2010 | 501,000 | 486,705 | 490,659 | (3,954) |
| Canadian Dollar, | | | | |
| Expiring 12/15/2010 | 300,600 | 291,403 | 294,395 | (2,992) |
| Euro, | | | | |
| Expiring 12/15/2010 | 5,115,838 | 6,500,644 | 7,115,991 | (615,347) |
| Euro, | | | | |
| Expiring 12/15/2010 | 4,767,761 | 6,076,797 | 6,631,826 | (555,029) |
| Euro, | | | | |
| Expiring 12/15/2010 | 147,457 | 187,776 | 205,109 | (17,333) |
| Euro, | | | | |
| Expiring 12/15/2010 | 792,908 | 1,068,350 | 1,102,914 | (34,564) |
| Euro, | | | | |
| Expiring 12/15/2010 | 71,808 | 96,688 | 99,883 | (3,195) |
| Euro, | | | | |
| Expiring 12/15/2010 | 767,284 | 1,033,789 | 1,067,271 | (33,482) |
| Euro, | | | | |
| Expiring 12/15/2010 | 31,050 | 43,090 | 43,190 | (100) |
| Euro, | | | | |
| Expiring 12/15/2010 | 238,050 | 330,056 | 331,121 | (1,065) |
| Euro, | | | | |
| Expiring 12/15/2010 | 90,000 | 124,437 | 125,188 | (751) |
| Euro, | | | | |
| Expiring 12/15/2010 | 90,900 | 126,424 | 126,440 | (16) |
| Japanese Yen, | | | | |
| Expiring 12/15/2010 | 62,056,800 | 739,599 | 771,529 | (31,930) |
| Japanese Yen, | | | | |
| Expiring 12/15/2010 | 9,547,200 | 113,649 | 118,697 | (5,048) |
| Japanese Yen, | | | | |
| Expiring 12/15/2010 | 16,707,600 | 199,565 | 207,719 | (8,154) |
| Japanese Yen, | | | | |
| Expiring 12/15/2010 | 7,160,400 | 85,502 | 89,022 | (3,520) |
| Japanese Yen, | | | | |
| Expiring 12/15/2010 | 69,124,724 | 809,518 | 859,402 | (49,884) |
| Japanese Yen, | | | | |
| Expiring 12/15/2010 | 91,355,590 | 1,070,919 | 1,135,790 | (64,871) |
| Japanese Yen, | | | | |
| Expiring 12/15/2010 | 37,414,686 | 437,331 | 465,163 | (27,832) |
| Japanese Yen, | | | | |
| Expiring 12/15/2010 | 26,049,733 | 309,477 | 323,867 | (14,390) |
The Fund 81
NOTES TO FINANCIAL STATEMENTS (continued)
| | | | |
| | Foreign | | | Unrealized |
| Forward Foreign Currency | Currency | | | Appreciation |
| Exchange Contracts | Amounts | Proceeds ($) | Value ($) (Depreciation) ($) |
| Sales (continued): | | | | |
| Japanese Yen, | | | | |
| Expiring 12/15/2010 | 25,207,880 | 299,120 | 313,400 | (14,280) |
| Japanese Yen, | | | | |
| Expiring 12/15/2010 | 2,359,137 | 27,973 | 29,330 | (1,357) |
| Japanese Yen, | | | | |
| Expiring 12/15/2010 | 28,823,000 | 352,545 | 358,346 | (5,801) |
| Japanese Yen, | | | | |
| Expiring 12/15/2010 | 20,012,800 | 245,571 | 248,812 | (3,241) |
| Japanese Yen, | | | | |
| Expiring 12/15/2010 | 20,012,800 | 244,925 | 248,812 | (3,887) |
| Japanese Yen, | | | | |
| Expiring 12/15/2010 | 10,006,400 | 122,508 | 124,406 | (1,898) |
| Japanese Yen, | | | | |
| Expiring 12/15/2010 | 50,032,000 | 612,766 | 622,029 | (9,263) |
| New Zealand Dollar, | | | | |
| Expiring 12/15/2010 | 90,900 | 65,984 | 69,023 | (3,039) |
| New Zealand Dollar, | | | | |
| Expiring 12/15/2010 | 590,850 | 428,934 | 448,653 | (19,719) |
| New Zealand Dollar, | | | | |
| Expiring 12/15/2010 | 68,175 | 49,622 | 51,768 | (2,146) |
| New Zealand Dollar, | | | | |
| Expiring 12/15/2010 | 159,075 | 115,913 | 120,791 | (4,878) |
| New Zealand Dollar, | | | | |
| Expiring 12/15/2010 | 240,482 | 175,164 | 182,606 | (7,442) |
| New Zealand Dollar, | | | | |
| Expiring 12/15/2010 | 22,506 | 16,392 | 17,090 | (698) |
| New Zealand Dollar, | | | | |
| Expiring 12/15/2010 | 248,512 | 181,319 | 188,703 | (7,384) |
| Norwegian Krone, | | | | |
| Expiring 12/15/2010 | 337,000 | 54,678 | 57,399 | (2,721) |
| Norwegian Krone, | | | | |
| Expiring 12/15/2010 | 2,190,500 | 355,373 | 373,094 | (17,721) |
| Norwegian Krone, | | | | |
| Expiring 12/15/2010 | 589,750 | 95,970 | 100,448 | (4,478) |
| Norwegian Krone, | | | | |
| Expiring 12/15/2010 | 252,750 | 41,130 | 43,049 | (1,919) |
| Norwegian Krone, | | | | |
| Expiring 12/15/2010 | 1,292,472 | 211,420 | 220,139 | (8,719) |
| Norwegian Krone, | | | | |
| Expiring 12/15/2010 | 564,528 | 92,288 | 96,153 | (3,865) |
| Norwegian Krone, | | | | |
| Expiring 12/15/2010 | 1,355,418 | 223,733 | 230,860 | (7,127) |
| Norwegian Krone, | | | | |
| Expiring 12/15/2010 | 1,574,382 | 259,489 | 268,155 | (8,666) |
82
| | | | |
| | Foreign | | | Unrealized |
| Forward Foreign Currency | Currency | | | Appreciation |
| Exchange Contracts | Amounts | Proceeds ($) | Value ($) (Depreciation) ($) |
| Sales (continued): | | | | |
| Norwegian Krone, | | | | |
| Expiring 12/15/2010 | 925,200 | 152,254 | 157,584 | (5,330) |
| Norwegian Krone, | | | | |
| Expiring 12/15/2010 | 2,647,278 | 447,944 | 450,895 | (2,951) |
| Norwegian Krone, | | | | |
| Expiring 12/15/2010 | 239,745 | 40,534 | 40,834 | (300) |
| Norwegian Krone, | | | | |
| Expiring 12/15/2010 | 2,561,727 | 432,909 | 436,323 | (3,414) |
| Norwegian Krone, | | | | |
| Expiring 12/15/2010 | 1,718,100 | 292,303 | 292,633 | (330) |
| Norwegian Krone, | | | | |
| Expiring 12/15/2010 | 763,600 | 130,288 | 130,059 | 229 |
| Norwegian Krone, | | | | |
| Expiring 12/15/2010 | 1,336,300 | 227,021 | 227,604 | (583) |
| Swedish Krona, | | | | |
| Expiring 12/15/2010 | 2,398,000 | 338,185 | 358,455 | (20,270) |
| Swedish Krona, | | | | |
| Expiring 12/15/2010 | 982,722 | 140,873 | 146,898 | (6,025) |
| Swedish Krona, | | | | |
| Expiring 12/15/2010 | 670,800 | 95,948 | 100,272 | (4,324) |
| Swedish Krona, | | | | |
| Expiring 12/15/2010 | 1,141,478 | 163,334 | 170,629 | (7,295) |
| Swedish Krona, | | | | |
| Expiring 12/15/2010 | 859,400 | 127,586 | 128,464 | (878) |
| Swedish Krona, | | | | |
| Expiring 12/15/2010 | 3,437,600 | 510,344 | 513,856 | (3,512) |
| Swedish Krona, | | | | |
| Expiring 12/15/2010 | 1,767,200 | 263,464 | 264,162 | (698) |
| Swedish Krona, | | | | |
| Expiring 12/15/2010 | 2,650,800 | 395,598 | 396,244 | (646) |
| Swedish Krona, | | | | |
| Expiring 12/15/2010 | 3,976,200 | 593,097 | 594,366 | (1,269) |
| Swedish Krona, | | | | |
| Expiring 12/15/2010 | 441,800 | 65,740 | 66,041 | (301) |
| Swedish Krona, | | | | |
| Expiring 12/15/2010 | 3,509,386 | 520,410 | 524,586 | (4,176) |
| Swedish Krona, | | | | |
| Expiring 12/15/2010 | 457,746 | 68,040 | 68,424 | (384) |
| Swedish Krona, | | | | |
| Expiring 12/15/2010 | 1,340,068 | 200,239 | 200,314 | (75) |
| Swedish Krona, | | | | |
| Expiring 12/15/2010 | 1,326,800 | 196,691 | 198,331 | (1,640) |
| Swedish Krona, | | | | |
| Expiring 12/15/2010 | 855,200 | 126,828 | 127,836 | (1,008) |
The Fund 83
NOTES TO FINANCIAL STATEMENTS (continued)
| | | | |
| | Foreign | | | Unrealized |
| Forward Foreign Currency | Currency | | | Appreciation |
| Exchange Contracts | Amounts | Proceeds ($) | Value ($) (Depreciation) ($) |
| Sales (continued): | | | | |
| Swedish Krona, | | | | |
| Expiring 12/15/2010 | 2,565,600 | 378,279 | 383,508 | (5,229) |
| Swedish Krona, | | | | |
| Expiring 12/15/2010 | 855,200 | 126,279 | 127,836 | (1,557) |
| Swiss Franc, | | | | |
| Expiring 12/15/2010 | 209,760 | 209,287 | 213,244 | (3,957) |
| Swiss Franc, | | | | |
| Expiring 12/15/2010 | 480,240 | 478,616 | 488,216 | (9,600) |
| Swiss Franc, | | | | |
| Expiring 12/15/2010 | 307,117 | 305,659 | 312,218 | (6,559) |
| Swiss Franc, | | | | |
| Expiring 12/15/2010 | 180,480 | 179,482 | 183,477 | (3,995) |
| Swiss Franc, | | | | |
| Expiring 12/15/2010 | 264,403 | 263,550 | 268,794 | (5,244) |
| Swiss Franc, | | | | |
| Expiring 12/15/2010 | 340,650 | 349,309 | 346,307 | 3,002 |
| Swiss Franc, | | | | |
| Expiring 12/15/2010 | 264,950 | 271,500 | 269,351 | 2,149 |
| Swiss Franc, | | | | |
| Expiring 12/15/2010 | 151,400 | 154,966 | 153,915 | 1,051 |
| Swiss Franc, | | | | |
| Expiring 12/15/2010 | 390,300 | 398,147 | 396,782 | 1,365 |
| Swiss Franc, | | | | |
| Expiring 12/15/2010 | 260,200 | 266,291 | 264,522 | 1,769 |
| Swiss Franc, | | | | |
| Expiring 12/15/2010 | 650,500 | 663,146 | 661,304 | 1,842 |
| Swiss Franc, | | | | |
| Expiring 12/15/2010 | 499,200 | 511,156 | 507,491 | 3,665 |
| Swiss Franc, | | | | |
| Expiring 12/15/2010 | 124,800 | 127,789 | 126,873 | 916 |
| Swiss Franc, | | | | |
| Expiring 12/15/2010 | 205,632 | 215,077 | 209,047 | 6,030 |
| Swiss Franc, | | | | |
| Expiring 12/15/2010 | 195,840 | 204,691 | 199,093 | 5,598 |
| Swiss Franc, | | | | |
| Expiring 12/15/2010 | 610,368 | 638,567 | 620,505 | 18,062 |
| Swiss Franc, | | | | |
| Expiring 12/15/2010 | 620,160 | 650,053 | 630,460 | 19,593 |
84
| | | | |
| | Foreign | | | Unrealized |
| Forward Foreign Currency | Currency | | | Appreciation |
| Exchange Contracts | Amounts | Proceeds ($) | Value ($) (Depreciation) ($) |
| Sales (continued): | | | | |
| Swiss Franc, | | | | |
| Expiring 12/15/2010 | 991,770 | 1,012,871 | 1,008,242 | 4,629 |
| Swiss Franc, | | | | |
| Expiring 12/15/2010 | 283,544 | 289,647 | 288,253 | 1,394 |
| Swiss Franc, | | | | |
| Expiring 12/15/2010 | 572,175 | 584,840 | 581,678 | 3,162 |
| Swiss Franc, | | | | |
| Expiring 12/15/2010 | 187,254 | 192,098 | 190,364 | 1,734 |
| Swiss Franc, | | | | |
| Expiring 12/15/2010 | 185,400 | 187,992 | 188,479 | (487) |
| Swiss Franc, | | | | |
| Expiring 12/15/2010 | 63,963 | 65,093 | 65,025 | 68 |
| Swiss Franc, | | | | |
| Expiring 12/15/2010 | 490,383 | 499,636 | 498,528 | 1,108 |
| Gross Unrealized Appreciation | | | 2,553,113 |
| Gross Unrealized Depreciation | | | | (2,240,892) |
At October 31, 2010, the cost of investments for federal income tax purposes was $67,655,828; accordingly, accumulated net unrealized depreciation on investments was $4,446,333, consisting of $4,868,599 gross unrealized appreciation and $9,314,932 gross unrealized depreciation.
The Fund 85
REPORT OF INDEPENDENT REGISTERED
PUBLIC ACCOUNTING FIRM
Shareholders and Board of Directors
Global Alpha Fund
We have audited the accompanying statement of assets and liabilities, including the statements of investments and financial futures, of Global Alpha Fund (one of the series comprising Advantage Funds, Inc.) as of October 31, 2010, and the related statement of operations for the year then ended, the statement of changes in net assets for each of the two years in the period then ended and financial highlights for each of the periods indicated therein. These financial statements and financial highlights are the responsibility of the Fund’s management. Our responsibility is to express an opinion on these financial statements and financial highlights based on our audits.
We conducted our audits in accordance with the standards of the Public Company Accounting Oversight Board (United States).Those standards require that we plan and perform the audit to obtain reasonable assurance about whether the financial statements and financial highlights are free of material misstatement.We were not engaged to perform an audit of the Fund’s internal control over financial reporting. Our audits included consideration of internal control over financial reporting as a basis for designing audit procedures that are appropriate in the circumstances, but not for the purpose of expressing an opinion on the effectiveness of the Fund’s internal control over financial reporting. Accordingly, we express no such opinion.An audit also includes examining, on a test basis, evidence supporting the amounts and disclosures in the financial statements and financial highlights, assessing the accounting p rinciples used and significant estimates made by management, and evaluating the overall financial statement presentation. Our procedures included confirmation of securities owned as of October 31, 2010 by correspondence with the custodian and others. We believe that our audits provide a reasonable basis for our opinion.
In our opinion, the financial statements and financial highlights referred to above present fairly, in all material respects, the financial position of Global Alpha Fund at October 31, 2010, the results of its operations for the year then ended, the changes in its net assets for each of the two years in the period then ended and the financial highlights for each of the indicated periods, in conformity with U.S. generally accepted accounting principles.
New York, New York
December 28, 2010
86
BOARD MEMBERS INFORMATION (Unaudited)
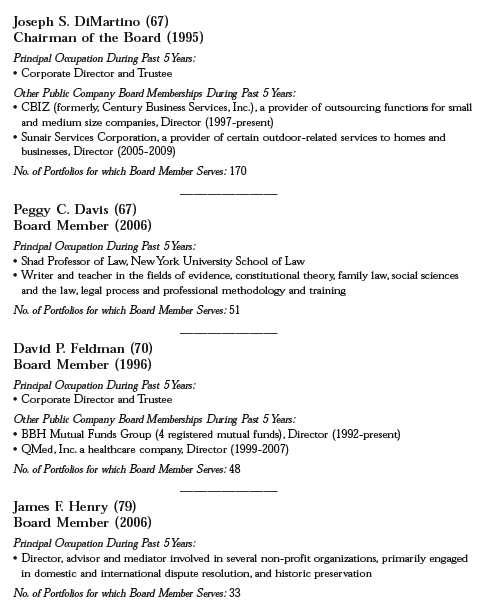
The Fund 87
BOARD MEMBERS INFORMATION (Unaudited) (continued)
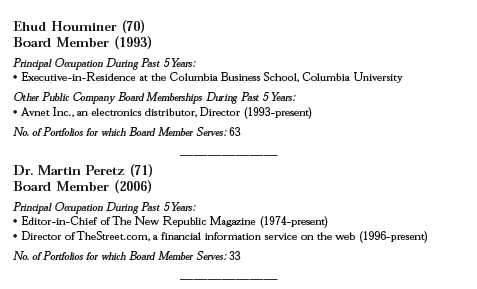
Once elected all Board Members serve for an indefinite term, but achieve Emeritus status upon reaching age 80.The address of the Board Members and Officers is in c/o The Dreyfus Corporation, 200 Park Avenue, NewYork, NewYork 10166.Additional information about the Board Members is available in the fund’s Statement of Additional Information which can be obtained from Dreyfus free of charge by calling this toll free number: 1-800-554-4611.
Dr. Paul A. Marks, Emeritus Board Member
Gloria Messinger, Emeritus Board Member
88
OFFICERS OF THE FUND (Unaudited)
BRADLEY J. SKAPYAK, President since
January 2010.
Chief Operating Officer and a director of the Manager since June 2009. From April 2003 to June 2009, Mr. Skapyak was the head of the Investment Accounting and Support Department of the Manager. He is an officer of 76 investment companies (comprised of 170 portfolios) managed by the Manager. He is 51 years old and has been an employee of the Manager since February 1988.
PHILLIP N. MAISANO, Executive Vice
President since July 2007.
Chief Investment Officer,Vice Chair and a director of the Manager, and an officer of 76 investment companies (comprised of 170 portfolios) managed by the Manager. Mr. Maisano also is an officer and/or Board member of certain other investment management subsidiaries of The Bank of New York Mellon Corporation, each of which is an affiliate of the Manager. He is 63 years old and has been an employee of the Manager since November 2006. Prior to joining the Manager, Mr. Maisano served as Chairman and Chief Executive Officer of EACM Advisors, an affiliate of the Manager, since August 2004.
MICHAEL A. ROSENBERG, Vice President
and Secretary since August 2005.
Assistant General Counsel of BNY Mellon, and an officer of 77 investment companies (comprised of 195 portfolios) managed by the Manager. He is 50 years old and has been an employee of the Manager since October 1991.
KIESHA ASTWOOD, Vice President and
Assistant Secretary since January 2010.
JAMES BITETTO, Vice President and
Assistant Secretary since August 2005.
Senior Counsel of BNY Mellon and Secretary of the Manager, and an officer of 77 investment companies (comprised of 195 portfolios) managed by the Manager. He is 44 years old and has been an employee of the Manager since December 1996.
JONI LACKS CHARATAN, Vice President
and Assistant Secretary since
August 2005.
Senior Counsel of BNY Mellon, and an officer of 77 investment companies (comprised of 195 portfolios) managed by the Manager. She is 54 years old and has been an employee of the Manager since October 1988.
JOSEPH M. CHIOFFI, Vice President and
Assistant Secretary since August 2005.
Senior Counsel of BNY Mellon, and an officer of 77 investment companies (comprised of 195 portfolios) managed by the Manager. He is 48 years old and has been an employee of the Manager since June 2000.
KATHLEEN DENICHOLAS, Vice President
and Assistant Secretary since
January 2010.
Senior Counsel of BNY Mellon, and an officer of 77 investment companies (comprised of 195 portfolios) managed by the Manager. She is 36 years old and has been an employee of the Manager since February 2001.
JANETTE E. FARRAGHER, Vice President
and Assistant Secretary since
August 2005.
Assistant General Counsel of BNY Mellon, and an officer of 77 investment companies (comprised of 195 portfolios) managed by the Manager. She is 47 years old and has been an employee of the Manager since February 1984.
The Fund 89
OFFICERS OF THE FUND (Unaudited) (continued)
JOHN B. HAMMALIAN, Vice President and
Assistant Secretary since August 2005.
Managing Counsel of BNY Mellon, and an officer of 77 investment companies (comprised of 195 portfolios) managed by the Manager. He is 47 years old and has been an employee of the Manager since February 1991.
M. CRISTINA MEISER, Vice President and
Assistant Secretary since January 2010.
Senior Counsel of BNY Mellon, and an officer of 77 investment companies (comprised of 195 portfolios) managed by the Manager. She is 40 years old and has been an employee of the Manager since August 2001.
ROBERT R. MULLERY, Vice President and
Assistant Secretary since August 2005.
Managing Counsel of BNY Mellon, and an officer of 77 investment companies (comprised of 195 portfolios) managed by the Manager. He is 58 years old and has been an employee of the Manager since May 1986.
JEFF PRUSNOFSKY, Vice President and
Assistant Secretary since August 2005.
Managing Counsel of BNY Mellon, and an officer of 77 investment companies (comprised of 195 portfolios) managed by the Manager. He is 45 years old and has been an employee of the Manager since October 1990.
JAMES WINDELS, Treasurer since
November 2001.
Director – Mutual Fund Accounting of the Manager, and an officer of 77 investment companies (comprised of 195 portfolios) managed by the Manager. He is 52 years old and has been an employee of the Manager since April 1985.
RICHARD CASSARO, Assistant Treasurer
since January 2008.
Senior Accounting Manager – Money Market and Municipal Bond Funds of the Manager, and an officer of 77 investment companies (comprised of 195 portfolios) managed by the Manager. He is 51 years old and has been an employee of the Manager since September 1982.
GAVIN C. REILLY, Assistant Treasurer
since December 2005.
Tax Manager of the Investment Accounting and Support Department of the Manager, and an officer of 77 investment companies (comprised of 195 portfolios) managed by the Manager. He is 42 years old and has been an employee of the Manager since April 1991.
ROBERT ROBOL, Assistant Treasurer
since August 2005.
Senior Accounting Manager – Fixed Income Funds of the Manager, and an officer of 77 investment companies (comprised of 195 portfolios) managed by the Manager. He is 46 years old and has been an employee of the Manager since October 1988.
ROBERT SALVIOLO, Assistant Treasurer
since July 2007.
Senior Accounting Manager – Equity Funds of the Manager, and an officer of 77 investment companies (comprised of 195 portfolios) managed by the Manager. He is 43 years old and has been an employee of the Manager since June 1989.
90
ROBERT SVAGNA, Assistant Treasurer
since December 2002.
Senior Accounting Manager – Equity Funds of the Manager, and an officer of 77 investment companies (comprised of 195 portfolios) managed by the Manager. He is 43 years old and has been an employee of the Manager since November 1990.
JOSEPH W. CONNOLLY, Chief Compliance Officer since October 2004.
Chief Compliance Officer of the Manager and The Dreyfus Family of Funds (77 investment companies, comprised of 195 portfolios). From November 2001 through March 2004, Mr. Connolly was first Vice-President, Mutual Fund Servicing for Mellon Global Securities Services. In that capacity, Mr. Connolly was responsible for managing Mellon’s Custody, Fund Accounting and Fund Administration services to third-party mutual fund clients. He is 53 years old and has served in various capacities with the Manager since 1980, including manager of the firm’s Fund Accounting Department from 1997 through October 2001.
NATALIA GRIBAS, Anti-Money Laundering
Compliance Officer since July 2010.
Anti-Money Laundering Compliance Officer of the Distributor, and the Anti-Money Laundering Compliance Officer of 73 investment companies (comprised of 191 portfolios) managed by the Manager. She is 40 years old and has been an employee of the Distributor since September 2008.
The Fund 91
For More Information
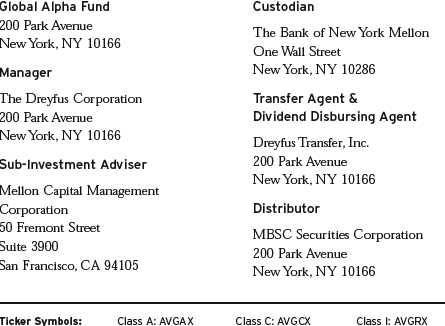
Telephone Call your financial representative or 1-800-554-4611
Mail The Dreyfus Family of Funds, 144 Glenn Curtiss Boulevard, Uniondale, NY 11556-0144
The fund files its complete schedule of portfolio holdings with the Securities and Exchange Commission (“SEC”) for the first and third quarters of each fiscal year on Form N-Q. The fund’s Forms N-Q are available on the SEC’s website at http://www.sec.gov and may be reviewed and copied at the SEC’s Public Reference Room in Washington, DC. Information on the operation of the Public Reference Room may be obtained by calling 1-800-SEC-0330.
A description of the policies and procedures that the fund uses to determine how to vote proxies relating to portfolio securities, and information regarding how the fund voted these proxies for the most recent 12-month period ended June 30 is available at http://www.dreyfus.com and on the SEC’s website at http://www.sec.gov. The description of the policies and procedures is also available without charge, upon request, by calling 1-800-645-6561.

Item 2. Code of Ethics.
The Registrant has adopted a code of ethics that applies to the Registrant's principal executive officer, principal financial officer, principal accounting officer or controller, or persons performing similar functions. There have been no amendments to, or waivers in connection with, the Code of Ethics during the period covered by this Report.
Item 3. Audit Committee Financial Expert.
The Registrant's Board has determined that David P. Feldman, a member of the Audit Committee of the Board, is an audit committee financial expert as defined by the Securities and Exchange Commission (the "SEC"). David P. Feldman is "independent" as defined by the SEC for purposes of audit committee financial expert determinations.
Item 4. Principal Accountant Fees and Services.
(a) Audit Fees. The aggregate fees billed for each of the last two fiscal years (the "Reporting Periods") for professional services rendered by the Registrant's principal accountant (the "Auditor") for the audit of the Registrant's annual financial statements or services that are normally provided by the Auditor in connection with the statutory and regulatory filings or engagements for the Reporting Periods, were $88,390 in 2009 and $115,000 in 2010.
(b) Audit-Related Fees. The aggregate fees billed in the Reporting Periods for assurance and related services by the Auditor that are reasonably related to the performance of the audit of the Registrant's financial statements and are not reported under paragraph (a) of this Item 4 were $ 15,828 in 2009 and $16,146 in 2010. These services consisted of one or more of the following: (i) agreed upon procedures related to compliance with Internal Revenue Code section 817(h), (ii) security counts required by Rule 17f-2 under the Investment Company Act of 1940, as amended, (iii) advisory services as to the accounting or disclosure treatment of Registrant transactions or events and (iv) advisory services to the accounting or disclosure treatment of the actual or potential impact to the Registrant of final or proposed rules, standards or interpretations by the Securities and Exchange Commission, the Financial Accounting Standards Boards or other regulatory or standard-setting bodies.
The aggregate fees billed in the Reporting Periods for non-audit assurance and related services by the Auditor to the Registrant's investment adviser (not including any sub-investment adviser whose role is primarily portfolio management and is subcontracted with or overseen by another investment adviser), and any entity controlling, controlled by or under common control with the investment adviser that provides ongoing services to the Registrant ("Service Affiliates"), that were reasonably related to the performance of the annual audit of the Service Affiliate, which required pre-approval by the Audit Committee were $-0- in 2009 and $-0- in 2010.
(c) Tax Fees. The aggregate fees billed in the Reporting Periods for professional services rendered by the Auditor for tax compliance, tax advice, and tax planning ("Tax Services") were $ 23,611 in 2009 and $16,143 in 2010. These services consisted of: (i) review or preparation of U.S. federal, state, local and excise tax returns; (ii) U.S. federal, state and local tax planning, advice and assistance regarding statutory, regulatory or administrative developments; (iii) tax advice regarding tax qualification matters and/or treatment of various financial instruments held or proposed to be acquired or held, and (iv) determination of Passive Foreign Investment Companies. The aggregate fees billed in the Reporting Periods for Tax Services by the Auditor to Service Affiliates, which required pre-approval by the Audit Committee were $-0- in 2009 and $-0- in 2010.
(d) All Other Fees. The aggregate fees billed in the Reporting Periods for products and services provided by the Auditor, other than the services reported in paragraphs (a) through (c) of this Item, were $40 in 2009 and $44 in 2010. These services consisted of a review of the Registrant's anti-money laundering program.
The aggregate fees billed in the Reporting Periods for Non-Audit Services by the Auditor to Service Affiliates, other than the services reported in paragraphs (b) through (c) of this Item, which required pre-approval by the Audit Committee, were $-0- in 2009 and $-0- in 2010.
(e)(1) Audit Committee Pre-Approval Policies and Procedures. The Registrant's Audit Committee has established policies and procedures (the "Policy") for pre-approval (within specified fee limits) of the Auditor's engagements for non-audit services to the Registrant and Service Affiliates without specific case-by-case consideration. The pre-approved services in the Policy can include pre-approved audit services, pre-approved audit-related services, pre-approved tax services and pre-approved all other services. Pre-approval considerations include whether the proposed services are compatible with maintaining the Auditor's independence. Pre-approvals pursuant to the Policy are considered annually.
(e)(2) Note: None of the services described in paragraphs (b) through (d) of this Item 4 were approved by the Audit Committee pursuant to paragraph (c)(7)(i)(C) of Rule 2-01 of Regulation S-X.
(f) None of the hours expended on the principal accountant's engagement to audit the registrant's financial statements for the most recent fiscal year were attributed to work performed by persons other than the principal account's full-time, permanent employees.
Non-Audit Fees. The aggregate non-audit fees billed by the Auditor for services rendered to the Registrant, and rendered to Service Affiliates, for the Reporting Periods were $25,383,429 in 2009 and $31,544,905 in 2010.
Auditor Independence. The Registrant's Audit Committee has considered whether the provision of non-audit services that were rendered to Service Affiliates, which were not pre-approved (not requiring pre-approval), is compatible with maintaining the Auditor's independence.
Item 5. Audit Committee of Listed Registrants.
Not applicable. [CLOSED-END FUNDS ONLY]
Item 6. Investments.
(a) Not applicable.
Item 7. Disclosure of Proxy Voting Policies and Procedures for Closed-End Management Investment Companies.
Not applicable. [CLOSED-END FUNDS ONLY]
Item 8. Portfolio Managers of Closed-End Management Investment Companies.
Not applicable. [CLOSED-END FUNDS ONLY, beginning with reports for periods ended on and after December 31, 2005]
Item 9. Purchases of Equity Securities by Closed-End Management Investment Companies and Affiliated Purchasers.
Not applicable. [CLOSED-END FUNDS ONLY]
Item 10. Submission of Matters to a Vote of Security Holders.
There have been no material changes to the procedures applicable to Item 10.
Item 11. Controls and Procedures.
(a) The Registrant's principal executive and principal financial officers have concluded, based on their evaluation of the Registrant's disclosure controls and procedures as of a date within 90 days of the filing date of this report, that the Registrant's disclosure controls and procedures are reasonably designed to ensure that information required to be disclosed by the Registrant on Form N-CSR is recorded, processed, summarized and reported within the required time periods and that information required to be disclosed by the Registrant in the reports that it files or submits on Form N-CSR is accumulated and communicated to the Registrant's management, including its principal executive and principal financial officers, as appropriate to allow timely decisions regarding required disclosure.
(b) There were no changes to the Registrant's internal control over financial reporting that occurred during the second fiscal quarter of the period covered by this report that have materially affected, or are reasonably likely to materially affect, the Registrant's internal control over financial reporting.
Item 12. Exhibits.
(a)(1) Code of ethics referred to in Item 2.
(a)(2) Certifications of principal executive and principal financial officers as required by Rule 30a-2(a) under the Investment Company Act of 1940.
(a)(3) Not applicable.
(b) Certification of principal executive and principal financial officers as required by Rule 30a-2(b) under the Investment Company Act of 1940.
SIGNATURES
Pursuant to the requirements of the Securities Exchange Act of 1934 and the Investment Company Act of 1940, the Registrant has duly caused this Report to be signed on its behalf by the undersigned, thereunto duly authorized.
Advantage Funds, Inc. By: /s/ Bradley J. Skapyak |
Bradley J. Skapyak, President |
Date: | December 23, 2010 |
|
Pursuant to the requirements of the Securities Exchange Act of 1934 and the Investment Company Act of 1940, this Report has been signed below by the following persons on behalf of the Registrant and in the capacities and on the dates indicated. |
|
By: /s/ Bradley J. Skapyak |
Bradley J. Skapyak, President |
Date: | December 23, 2010 |
|
By: /s/ James Windels |
James Windels, Treasurer |
Date: | December 23, 2010 |
|
EXHIBIT INDEX
(a)(1) Code of ethics referred to in Item 2.
(a)(2) Certifications of principal executive and principal financial officers as required by Rule 30a-2(a) under the Investment Company Act of 1940. (EX-99.CERT)
(b) Certification of principal executive and principal financial officers as required by Rule 30a-2(b) under the Investment Company Act of 1940. (EX-99.906CERT)