UNITED STATES
SECURITIES AND EXCHANGE COMMISSION
Washington, D.C. 20549
FORM N-CSR
CERTIFIED SHAREHOLDER REPORT OF REGISTERED MANAGEMENT
INVESTMENT COMPANIES
Investment Company Act file number | 811-7123 |
| |
| ADVANTAGE FUNDS, INC. | |
| | |
| | |
| c/o The Dreyfus Corporation 200 Park Avenue New York, New York 10166 | |
| | |
| | |
| Janette Farragher, Esq. 200 Park Avenue New York, New York 10166 | |
| | |
|
Registrant's telephone number, including area code: | (212) 922-6000 |
| |
Date of fiscal year end: | 10/31 | |
Date of reporting period: | 10/31/11 | |
| | | | | | | |
Advantage Funds, Inc.
-Dreyfus Global Absolute Return Fund
-Dreyfus Global Dynamic Bond Fund
-Dreyfus Global Real Return Fund
-Dreyfus Total Emerging Markets Fund
-Dreyfus Total Return Advantage Fund
-Global Alpha Fund
FORM N-CSR
Item 1. Reports to Stockholders.
Dreyfus
Global Absolute
Return Fund
ANNUAL REPORT October 31, 2011

Save time. Save paper. View your next shareholder report online as soon as it’s available. Log into www.dreyfus.com and sign up for Dreyfus eCommunications. It’s simple and only takes a few minutes.
The views expressed in this report reflect those of the portfolio manager only through the end of the period covered and do not necessarily represent the views of Dreyfus or any other person in the Dreyfus organization. Any such views are subject to change at any time based upon market or other conditions and Dreyfus disclaims any responsibility to update such views.These views may not be relied on as investment advice and, because investment decisions for a Dreyfus fund are based on numerous factors, may not be relied on as an indication of trading intent on behalf of any Dreyfus fund.

| | Contents |
| | THE FUND |
| 2 | A Letter from the Chairman and CEO |
| 3 | Discussion of Fund Performance |
| 6 | Fund Performance |
| 8 | Understanding Your Fund’s Expenses |
| 8 | Comparing Your Fund’s Expenses With Those of Other Funds |
| 9 | Statement of Investments |
| 11 | Statement of Financial Futures |
| 12 | Statement of Options Written |
| 13 | Statement of Assets and Liabilities |
| 14 | Statement of Operations |
| 15 | Statement of Changes in Net Assets |
| 17 | Financial Highlights |
| 20 | Notes to Financial Statements |
| 48 | Report of Independent Registered Public Accounting Firm |
| 49 | Important Tax Information |
| 50 | Board Members Information |
| 52 | Officers of the Fund |
| | FOR MORE INFORMATION |
| | Back Cover |
|
| Dreyfus |
| Global Absolute |
| Return Fund |
The Fund

A LETTER FROM THE CHAIRMAN AND CEO
Dear Shareholder:
We present to you this annual report for Dreyfus Global Absolute Return Fund, covering the 12-month period from November 1, 2010, through October 31, 2011. For information about how the fund performed during the reporting period, as well as general market perspectives, we provide a Discussion of Fund Performance on the pages that follow.
Investors were encouraged by expectations of a more robust economic recovery during the final months of 2010, but sentiment deteriorated in 2011 due to disappointing global economic data, rising commodity prices, an escalating sovereign debt crisis in Europe and a contentious debate regarding taxes, spending and borrowing in the United States. International stocks proved sensitive to these macroeconomic developments, often regardless of underlying company fundamentals, and most international equity market indices ended the reporting period with mildly negative absolute returns.
The global economic outlook currently remains clouded by market turbulence and political infighting, but we believe that a continued subpar global expansion is more likely than a return to recession. Although Europe continues to struggle with a debt crisis, inflationary pressures appear to be waning in most countries as energy prices recently have retreated from their highs. In Asia, China seems to have averted an economic contraction after implementing measures to dampen inflationary pressures. In the United States, moderately low core inflation and an accommodative monetary policy could help support near-trend growth despite ongoing deleveraging activity in the private sector.To assess the potential impact of these and other developments on your investments, we encourage you, as always, to speak with your financial advisor.
Thank you for your continued confidence and support.

Jonathan R. Baum
Chairman and Chief Executive Officer
The Dreyfus Corporation
November 15, 2011
2

DISCUSSION OF FUND PERFORMANCE
For the period of November 1, 2010, through October 31, 2011, as provided by Vassilis Dagioglu, James Stavena, Torrey Zaches and Joseph Miletich, Portfolio Managers
Fund and Market Performance Overview
For the 12-month period ended October 31, 2011, Dreyfus Global Absolute Return Fund’s Class A shares produced a total return of 0.66%, Class C shares returned 0.00% and Class I shares returned 0.90%.1 In comparison, the fund’s benchmark, the Citigroup 30-Day Treasury Bill Index, produced a total return of 0.07% for the same period.2
Global financial markets generally rallied into the first quarter of 2011 as an economic recovery gained traction, but renewed macroeconomic concerns later caused riskier assets to give back many of their previous gains.The fund generally produced higher returns than its benchmark, primarily due to positive results from three of the four alpha sources considered by our quantitative investment approach.
The Fund’s Investment Approach
The fund seeks total return through investments in securities and instruments that provide exposure to global stock, bond and currency markets. For allocation among equity markets, the portfolio managers employ a bottom-up valuation approach using proprietary models to derive market level expected returns. For allocation among bond markets, the portfolio managers use proprietary models to identify temporary mispricings among the long-term government bond markets.The most relevant long-term bond yield within each country serves as the expected return for each bond market. Our quantitative investment approach is designed to identify and exploit relative misvaluations across and within major developed capital markets such as the United States, Japan and the larger Western European countries.
Shifting Sentiment Sparked Heightened Market Volatility
Gains in employment, consumer spending and corporate earnings supported stocks and higher yielding bonds over the first several months of the reporting period. However, the rallies were interrupted in February when political unrest in the Middle East led to sharply rising crude oil prices, and again in March when natural and nuclear disasters in Japan
The Fund 3
DISCUSSION OF FUND PERFORMANCE (continued)
disrupted the global industrial supply chain. Nonetheless, markets proved resilient, and most financial assets rebounded quickly from these unexpected shocks.
Investor sentiment began to deteriorate in earnest in late April when Greece appeared headed for default and pressures mounted on the banking systems of other European nations. In addition, U.S. economic data proved more disappointing than expected, and investors reacted cautiously to a contentious debate regarding U.S. government spending and borrowing. Financial markets suffered bouts of heightened volatility when newly risk-averse investors shifted their focus from relatively speculative markets to regions that historically have held up well under uncertain economic conditions. The flight to quality also lifted currencies that traditionally have been considered safe havens, including the U.S. dollar and Japanese yen. Market volatility was particularly severe in August and September, after a major credit-rating agency downgraded its assessment of long-term U.S. government debt. In contrast, markets rebounded strongly in October when some macroeconomic worries seemed to ease.
Quantitative Models Supported Relative Performance
The fund’s quantitative investment process proved relatively effective in this turbulent environment, as three of the four alpha sources we consider contributed positively to relative performance. Only the model designed to determine allocations between stocks and bonds produced a shortfall, primarily due to overweighted exposure to stocks during the third quarter of 2011. However, the addition of several stock, bond and currency markets to our investment process midway through the reporting period resulted in a less overweighted position in stocks overall, helping to cushion the impact of equity market declines.
Models guiding equity and bond market selections produced stronger results.Among stocks, the fund benefited later in the reporting period from overweighted exposure to Germany and short positions in Hong Kong and Japan. In the global bond market, positive results from a long position in U.S.Treasury securities were offset by a less successful short position in the German Bund.
The fund’s currency component produced mixed results, as the benefits of a short position in the Swiss franc and long exposure to the Norwegian krone were balanced by losses stemming from short positions in the Swedish krona and Canadian dollar.
4
Seeking Opportunities in Uncertain Markets
Despite ongoing headwinds, we believe the economic expansion is likely to persist. Indeed, until October, financial markets seemed to react more to macroeconomic developments than to their underlying fundamental strengths and weaknesses. Consequently, while our models have continued to signal greater opportunities among stocks than bonds, we have limited the fund’s allocations to global equities in order to manage risks in an uncertain market environment.
Our market selection models have identified what we believe to be attractive relative values among equities in Germany and the Netherlands, but stock markets in Asia appear less attractive to us. Sovereign bonds in the United States and Germany seem to offer good value, while U.K. gilts appear vulnerable to inflationary pressures. The fund also ended the reporting period with short positions in the euro and U.S. dollar, and long exposure to the Japanese yen and the Swedish krona.
November 15, 2011
| |
| | Investing in foreign companies involves special risks, including changes in currency rates, |
| | political, economic and social instability, a lack of comprehensive company information, |
| | differing auditing and legal standards, and less market liquidity. |
| | Equity securities are subject generally to market, market sector, market liquidity, issuer and |
| | investment style risks, among other factors, to varying degrees, all of which are more fully described |
| | in the fund’s prospectus. Bond securities are subject generally to interest rate, credit, liquidity, call, |
| | sector and market risks, to varying degrees, all of which are more fully described in the fund’s |
| | prospectus. |
| | Investments in foreign currencies are subject to the risk that those currencies will decline in value |
| | relative to the U.S. dollar, or, in the case of hedged positions, that the U.S. dollar will decline |
| | relative to the currency being hedged. |
| 1 | Total return includes reinvestment of dividends and any capital gains paid, and does not take into |
| | consideration the maximum initial sales charge in the case of Class A shares, or the applicable |
| | contingent deferred sales charge imposed on redemptions in the case of Class C shares. Had these |
| | charges been reflected, returns would have been lower. Past performance is no guarantee of future |
| | results. Share price, yield and investment return fluctuate such that upon redemption, fund shares |
| | may be worth more or less than their original cost. Return figures provided reflect the absorption |
| | of certain fund expenses by The Dreyfus Corporation pursuant to an agreement in effect until |
| | March 1, 2013. Had these expenses not been absorbed, the fund’s returns would have been lower. |
| 2 | SOURCE: BLOOMBERG L.P. – Citigroup 30-Day Treasury Bill Index is a market value- |
| | weighted index of public obligations of the U.S.Treasury with maturities of 30 days. Investors |
| | cannot invest directly in any index. |
The Fund 5
FUND PERFORMANCE
|
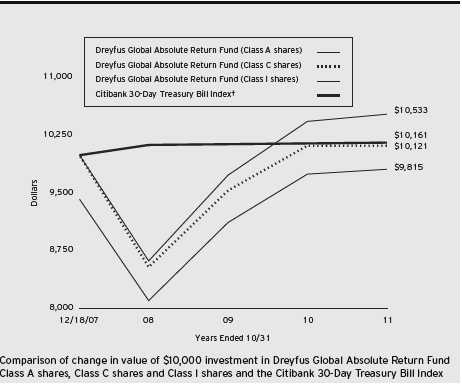
| † Source: Bloomberg L.P. |
| Past performance is not predictive of future performance. |
| The above graph compares a $10,000 investment made in Class A, Class C and Class I shares of Dreyfus Global |
| Absolute Return Fund on 12/18/07 (inception date) to a $10,000 investment made in the Citibank 30-Day Treasury |
| Bill Index (the “Index”) on that date.All dividends and capital gain distributions are reinvested. |
| The fund’s performance shown in the line graph above takes into account the maximum initial sales charge on Class A |
| shares and all other applicable fees and expenses on all classes.The Index is a market value-weighted index of public |
| obligations of the U.S.Treasury with maturities of 30 days. Unlike a mutual fund, the Index is not subject to charges, |
| fees and other expenses. Investors cannot invest directly in any index. Further information relating to fund performance, |
| including expense reimbursements, if applicable, is contained in the Financial Highlights section of the prospectus and |
| elsewhere in this report. |
6
| | | | | |
| Average Annual Total Returns as of 10/31/11 | | | | | |
| |
| | Inception | | | From | |
| | Date | 1 | Year | Inception | |
| Class A shares | | | | | |
| with maximum sales charge (5.75%) | 12/18/07 | –5.15 | % | –0.48 | % |
| without sales charge | 12/18/07 | 0.66 | % | 1.05 | % |
| Class C shares | | | | | |
| with applicable redemption charge † | 12/18/07 | –0.95 | % | 0.31 | % |
| without redemption | 12/18/07 | 0.00 | % | 0.31 | % |
| Class I shares | 12/18/07 | 0.90 | % | 1.35 | % |
| Citibank 30-Day Treasury Bill Index | 12/31/07 | 0.07 | % | 0.42 | %†† |
Past performance is not predictive of future performance.The fund’s performance shown in the graph and table does not reflect the deduction of taxes that a shareholder would pay on fund distributions or the redemption of fund shares.
| |
| † | The maximum contingent deferred sales charge for Class C shares is 1% for shares redeemed within one year of the |
| | date of purchase. |
| †† | For comparative purposes, the value of the Index as of 12/31/07 is used as the beginning value on 12/18/07. |
The Fund 7
UNDERSTANDING YOUR FUND’S EXPENSES (Unaudited)
As a mutual fund investor, you pay ongoing expenses, such as management fees and other expenses. Using the information below, you can estimate how these expenses affect your investment and compare them with the expenses of other funds.You also may pay one-time transaction expenses, including sales charges (loads) and redemption fees, which are not shown in this section and would have resulted in higher total expenses. For more information, see your fund’s prospectus or talk to your financial adviser.
Review your fund’s expenses
The table below shows the expenses you would have paid on a $1,000 investment in Dreyfus Global Absolute Return Fund from May 1, 2011 to October 31, 2011. It also shows how much a $1,000 investment would be worth at the close of the period, assuming actual returns and expenses.
Expenses and Value of a $1,000 Investment
assuming actual returns for the six months ended October 31, 2011
| | | | | | |
| | | Class A | | Class C | | Class I |
| Expenses paid per $1,000† | | $7.50 | | $11.22 | | $6.25 |
| Ending value (after expenses) | | $982.90 | | $979.20 | | $983.80 |
COMPARING YOUR FUND’S EXPENSES
WITH THOSE OF OTHER FUNDS (Unaudited)
Using the SEC’s method to compare expenses
The Securities and Exchange Commission (SEC) has established guidelines to help investors assess fund expenses. Per these guidelines, the table below shows your fund’s expenses based on a $1,000 investment, assuming a hypothetical 5% annualized return. You can use this information to compare the ongoing expenses (but not transaction expenses or total cost) of investing in the fund with those of other funds.All mutual fund shareholder reports will provide this information to help you make this comparison. Please note that you cannot use this information to estimate your actual ending account balance and expenses paid during the period.
Expenses and Value of a $1,000 Investment
assuming a hypothetical 5% annualized return for the six months ended October 31, 2011
| | | | | | |
| | | Class A | | Class C | | Class I |
| Expenses paid per $1,000† | | $7.63 | | $11.42 | | $6.36 |
| Ending value (after expenses) | | $1,017.64 | | $1,013.86 | | $1,018.90 |
|
| † Expenses are equal to the fund’s annualized expense ratio of 1.50% for Class A, 2.25% for Class C and 1.25% |
| for Class I , multiplied by the average account value over the period, multiplied by 184/365 (to reflect the one-half |
| year period). |
8
STATEMENT OF INVESTMENTS
October 31, 2011
| | | | |
| | | Face Amount | | |
| | | Covered by | | |
| | Options Purchased—5.9% | Contracts ($) | | Value ($) |
| | Call Options—5.9% | | | |
| | U.S. Treasury 10 Year Note Futures, | | | |
| | November 2011 @ $109 | 7,100,000 | a | 1,424,438 |
| |
| | | Number of | | |
| | | Contracts | | Value ($) |
| | Put Options—.0% | | | |
| | Swiss Market Index Futures, | | | |
| | December 2011 @ CHF 5,405 | 50 | a | 3,818 |
| | Swiss Market Index Futures, | | | |
| | December 2011 @ CHF 5,694 | 40 | a | 6,702 |
| | | | | 10,520 |
| | Total Options Purchased | | | |
| | (cost $1,449,410) | | | 1,434,958 |
| |
| | | Principal | | |
| Short-Term Investments—76.6% | Amount ($) | | Value ($) |
| | U.S. Treasury Bills: | | | |
| | 0.00%, 11/25/11 | 660,000 | | 659,990 |
| | 0.01%, 12/1/11 | 4,100,000 | | 4,099,967 |
| | 0.02%, 11/17/11 | 3,000,000 | | 2,999,985 |
| | 0.02%, 1/12/12 | 3,638,000 | | 3,637,909 |
| | 0.02%, 3/22/12 | 1,520,000 | b | 1,519,806 |
| | 0.03%, 1/19/12 | 5,620,000 | | 5,619,847 |
| | Total Short-Term Investments | | | |
| | (cost $18,537,364) | | | 18,537,504 |
The Fund 9
STATEMENT OF INVESTMENTS (continued)
| | | | |
| Other Investment—19.2% | Shares | | Value ($) | |
| Registered Investment Company; | | | | |
| Dreyfus Institutional Preferred | | | | |
| Plus Money Market Fund | | | | |
| (cost $4,649,373) | 4,649,373 | c | 4,649,373 | |
| |
| Total Investments (cost $24,636,147) | 101.7 | % | 24,621,835 | |
| Liabilities, Less Cash and Receivables | (1.7 | %) | (420,016 | ) |
| Net Assets | 100.0 | % | 24,201,819 | |
| |
| CHF—Swiss Franc |
| a | Non-income producing security. |
| b | Held by a broker as collateral for open financial futures positions. |
| c | Investment in affiliated money market mutual fund. |
| | | |
| Portfolio Summary (Unaudited)† | | |
| | Value (%) | | Value (%) |
| Short-Term/ | | Options Purchased | 5.9 |
| Money Market Investments | 95.8 | | 101.7 |
|
| † Based on net assets. |
| See notes to financial statements. |
10
STATEMENT OF FINANCIAL FUTURES
October 31, 2011
| | | | | | |
| | | | | | Unrealized | |
| | | Market Value | | | Appreciation | |
| | | Covered by | | | (Depreciation) | |
| | Contracts | Contracts ($) | | Expiration | at 10/31/2011 | ($) |
| Financial Futures Long | | | | | | |
| Amsterdam Exchange Index | 26 | 2,220,490 | | November 2011 | 55,017 | |
| Australian 10 Year Bond | 11 | 1,302,789 | | December 2011 | (38,513 | ) |
| Canadian 10 Year | 9 | 1,189,821 | | December 2011 | (14,303 | ) |
| DAX | 13 | 2,797,824 | | December 2011 | 243,832 | |
| Euro-Bond | 4 | 755,813 | | December 2011 | 1,140 | |
| Euro-Bond Options | 31 | 539,619 | | December 2011 | 82,032 | |
| Standard & Poor’s 500 E-mini | 25 | 1,561,625 | | December 2011 | 30,870 | |
| S&P ASX 200 Index | 8 | 909,023 | | December 2011 | 54,521 | |
| Financial Futures Short | | | | | | |
| FTSE 100 | 8 | (715,176 | ) | December 2011 | (15,056 | ) |
| Hang Seng | 8 | (1,019,189 | ) | November 2011 | (53,424 | ) |
| Japanese 10 Year Mini Bond | 25 | (4,559,154 | ) | December 2011 | 1,248 | |
| Long Gilt | 72 | (14,915,066 | ) | December 2011 | 84,253 | |
| S&P/Toronto Stock | | | | | | |
| Exchange 60 IX | 6 | (841,722 | ) | December 2011 | (7,208 | ) |
| Topix Index | 23 | (2,238,794 | ) | December 2011 | (45,914 | ) |
| U.S. Treasury 10 Year Notes | 6 | (774,375 | ) | December 2011 | (335 | ) |
| Gross Unrealized Appreciation | | | | | 552,913 | |
| Gross Unrealized Depreciation | | | | | (174,753 | ) |
| |
| See notes to financial statements. | | | | | | |
The Fund 11
| | | | |
| STATEMENT OF OPTIONS WRITTEN | | | | |
| October 31, 2011 | | | | |
| |
| |
| |
| | Number of | | | |
| | Contracts ($) | | Value ($) | |
| Call Options: | | | | |
| Swiss Market Index Futures, | | | | |
| December 2011 @ CHF 5,405 | 50 | a | (22,370 | ) |
| Swiss Market Index Futures, | | | | |
| December 2011 @ CHF 5,694 | 40 | a | (8,312 | ) |
| (premiums received $29,121) | | | (30,682 | ) |
|
| CHF—Swiss Franc |
| a Non-income producing security. |
| See notes to financial statements. |
12
STATEMENT OF ASSETS AND LIABILITIES
October 31, 2011
| | |
| | Cost | Value |
| Assets ($): | | |
| Investments in securities—See Statement of Investments: | | |
| Unaffiliated issuers | 19,986,774 | 19,972,462 |
| Affiliated issuers | 4,649,373 | 4,649,373 |
| Cash | | 41,651 |
| Unrealized appreciation on forward foreign | | |
| currency exchange contracts—Note 4 | | 1,506,015 |
| Receivable for shares of Common Stock subscribed | | 4,000 |
| Dividends receivable | | 176 |
| Prepaid expenses | | 22,592 |
| | | 26,196,269 |
| Liabilities ($): | | |
| Due to The Dreyfus Corporation and affiliates—Note 3(c) | | 21,631 |
| Unrealized depreciation on forward foreign | | |
| currency exchange contracts—Note 4 | | 1,685,939 |
| Payable for futures variation margin—Note 4 | | 189,859 |
| Outstanding options written, at value (premiums received | | |
| $29,121)—See Statement of Options Written—Note 4 | | 30,682 |
| Payable for shares of Common Stock redeemed | | 11,010 |
| Accrued expenses | | 55,329 |
| | | 1,994,450 |
| Net Assets ($) | | 24,201,819 |
| Composition of Net Assets ($): | | |
| Paid-in capital | | 23,989,967 |
| Accumulated net realized gain (loss) on investments | | 27,945 |
| Accumulated net unrealized appreciation (depreciation) | | |
| on investments, options transactions and foreign | | |
| currency transactions (including $378,160 net | | |
| unrealized appreciation on financial futures) | | 183,907 |
| Net Assets ($) | | 24,201,819 |
| | | |
| Net Asset Value Per Share | | | |
| | Class A | Class C | Class I |
| Net Assets ($) | 6,498,303 | 1,197,064 | 16,506,452 |
| Shares Outstanding | 537,313 | 101,574 | 1,353,709 |
| Net Asset Value Per Share ($) | 12.09 | 11.79 | 12.19 |
See notes to financial statements.
The Fund 13
| | |
| STATEMENT OF OPERATIONS | | |
| Year Ended October 31, 2011 | | |
| |
| |
| |
| |
| Investment Income ($): | | |
| Income: | | |
| Interest | 11,213 | |
| Cash dividends: | | |
| Affiliated issuers | 4,282 | |
| Total Income | 15,495 | |
| Expenses: | | |
| Management fee—Note 3(a) | 219,531 | |
| Auditing fees | 46,794 | |
| Shareholder servicing costs—Note 3(c) | 46,287 | |
| Registration fees | 34,882 | |
| Prospectus and shareholders’ reports | 12,499 | |
| Distribution fees—Note 3(b) | 10,371 | |
| Custodian fees—Note 3(c) | 2,979 | |
| Directors’ fees and expenses—Note 3(d) | 1,844 | |
| Legal fees | 925 | |
| Loan commitment fees—Note 2 | 192 | |
| Miscellaneous | 14,810 | |
| Total Expenses | 391,114 | |
| Less—reduction in management fee due to undertaking—Note 3(a) | (106,389 | ) |
| Less—reduction in fees due to earnings credits—Note 3(c) | (14 | ) |
| Net Expenses | 284,711 | |
| Investment (Loss)—Net | (269,216 | ) |
| Realized and Unrealized Gain (Loss) on Investments—Note 4 ($): | | |
| Net realized gain (loss) on investments and foreign currency transactions | 69,956 | |
| Net realized gain (loss) on options transactions | 971,209 | |
| Net realized gain (loss) on financial futures | (1,059,947 | ) |
| Net realized gain (loss) on forward foreign currency exchange contracts | 271,073 | |
| Net Realized Gain (Loss) | 252,291 | |
| Net unrealized appreciation (depreciation) on | | |
| investments and foreign currency transactions | 4,433 | |
| Net unrealized appreciation (depreciation) on options transactions | (60,550 | ) |
| Net unrealized appreciation (depreciation) on financial futures | 305,765 | |
| Net unrealized appreciation (depreciation) on | | |
| forward foreign currency exchange contracts | (301,700 | ) |
| Net Unrealized Appreciation (Depreciation) | (52,052 | ) |
| Net Realized and Unrealized Gain (Loss) on Investments | 200,239 | |
| Net (Decrease) in Net Assets Resulting from Operations | (68,977 | ) |
| |
| See notes to financial statements. | | |
14
STATEMENT OF CHANGES IN NET ASSETS
| | | | |
| | Year Ended October 31, | |
| | 2011 | | 2010 | |
| Operations ($): | | | | |
| Investment (loss)—net | (269,216 | ) | (188,880 | ) |
| Net realized gain (loss) on investments | 252,291 | | 1,081,804 | |
| Net unrealized appreciation | | | | |
| (depreciation) on investments | (52,052 | ) | 51,086 | |
| Net Increase (Decrease) in Net Assets | | | | |
| Resulting from Operations | (68,977 | ) | 944,010 | |
| Dividends to Shareholders from ($): | | | | |
| Net realized gain on investments: | | | | |
| Class A Shares | (453,969 | ) | — | |
| Class C Shares | (75,261 | ) | — | |
| Class I Shares | (293,950 | ) | — | |
| Total Dividends | (823,180 | ) | — | |
| Capital Stock Transactions ($): | | | | |
| Net proceeds from shares sold: | | | | |
| Class A Shares | 7,877,793 | | 3,509,994 | |
| Class C Shares | 670,211 | | 293,608 | |
| Class I Shares | 18,498,422 | | 3,588,104 | |
| Dividends reinvested: | | | | |
| Class A Shares | 273,731 | | — | |
| Class C Shares | 43,293 | | — | |
| Class I Shares | 212,881 | | — | |
| Cost of shares redeemed: | | | | |
| Class A Shares | (9,145,162 | ) | (5,059,714 | ) |
| Class C Shares | (678,711 | ) | (575,688 | ) |
| Class I Shares | (6,249,990 | ) | (1,168,350 | ) |
| Increase (Decrease) in Net Assets | | | | |
| from Capital Stock Transactions | 11,502,468 | | 587,954 | |
| Total Increase (Decrease) in Net Assets | 10,610,311 | | 1,531,964 | |
| Net Assets ($): | | | | |
| Beginning of Period | 13,591,508 | | 12,059,544 | |
| End of Period | 24,201,819 | | 13,591,508 | |
The Fund 15
STATEMENT OF CHANGES IN NET ASSETS (continued)
| | | | |
| | Year Ended October 31, | |
| | 2011 | | 2010 | |
| Capital Share Transactions: | | | | |
| Class A | | | | |
| Shares sold | 649,060 | | 289,548 | |
| Shares issued for dividends reinvested | 22,623 | | — | |
| Shares redeemed | (762,454 | ) | (409,873 | ) |
| Net Increase (Decrease) in Shares Outstanding | (90,771 | ) | (120,325 | ) |
| Class C | | | | |
| Shares sold | 56,150 | | 24,481 | |
| Shares issued for dividends reinvested | 3,647 | | — | |
| Shares redeemed | (57,539 | ) | (47,291 | ) |
| Net Increase (Decrease) in Shares Outstanding | 2,258 | | (22,810 | ) |
| Class I | | | | |
| Shares sold | 1,514,572 | | 292,013 | |
| Shares issued for dividends reinvested | 17,478 | | — | |
| Shares redeemed | (518,505 | ) | (94,870 | ) |
| Net Increase (Decrease) in Shares Outstanding | 1,013,545 | | 197,143 | |
| |
| See notes to financial statements. | | | | |
16
FINANCIAL HIGHLIGHTS
The following tables describe the performance for each share class for the fiscal periods indicated.All information (except portfolio turnover rate) reflects financial results for a single fund share.Total return shows how much your investment in the fund would have increased (or decreased) during each period, assuming you had reinvested all dividends and distributions.These figures have been derived from the fund’s financial statements.
| | | | | | | | |
| | | | Year Ended October 31, | | | |
| Class A Shares | 2011 | | 2010 | | 2009 | | 2008 | a |
| Per Share Data ($): | | | | | | | | |
| Net asset value, beginning of period | 12.73 | | 11.91 | | 10.75 | | 12.50 | |
| Investment Operations: | | | | | | | | |
| Investment income (loss)—netb | (.17 | ) | (.17 | ) | (.15 | ) | .12 | |
| Net realized and unrealized | | | | | | | | |
| gain (loss) on investments | .25 | | .99 | | 1.48 | | (1.87 | ) |
| Total from Investment Operations | .08 | | .82 | | 1.33 | | (1.75 | ) |
| Distributions: | | | | | | | | |
| Dividends from investment income—net | — | | — | | (.17 | ) | — | |
| Dividends from net realized | | | | | | | | |
| gain on investments | (.72 | ) | — | | — | | — | |
| Total Distributions | (.72 | ) | — | | (.17 | ) | — | |
| Net asset value, end of period | 12.09 | | 12.73 | | 11.91 | | 10.75 | |
| Total Return (%)c | .66 | | 6.89 | | 12.52 | | (14.00 | )d |
| Ratios/Supplemental Data (%): | | | | | | | | |
| Ratio of total expenses to average net assets | 2.06 | | 2.15 | | 2.65 | | 3.04 | e |
| Ratio of net expenses to average net assets | 1.50 | | 1.50 | | 1.50 | | 1.48 | e |
| Ratio of net investment income | | | | | | | | |
| (loss) to average net assets | (1.41 | ) | (1.37 | ) | (1.29 | ) | 1.14 | e |
| Portfolio Turnover Rate | — | | — | | — | | — | |
| Net Assets, end of period ($ x 1,000) | 6,498 | | 7,995 | | 8,911 | | 4,630 | |
| |
| a | From December 18, 2007 (commencement of operations) to October 31, 2008. |
| b | Based on average shares outstanding at each month end. |
| c | Exclusive of sales charge. |
| d | Not annualized. |
| e | Annualized. |
See notes to financial statements.
The Fund 17
FINANCIAL HIGHLIGHTS (continued)
| | | | | | | | |
| | | | Year Ended October 31, | | | |
| Class C Shares | 2011 | | 2010 | | 2009 | | 2008 | a |
| Per Share Data ($): | | | | | | | | |
| Net asset value, beginning of period | 12.51 | | 11.79 | | 10.68 | | 12.50 | |
| Investment Operations: | | | | | | | | |
| Investment income (loss)—netb | (.26 | ) | (.26 | ) | (.22 | ) | .03 | |
| Net realized and unrealized | | | | | | | | |
| gain (loss) on investments | .26 | | .98 | | 1.45 | | (1.85 | ) |
| Total from Investment Operations | — | | .72 | | 1.23 | | (1.82 | ) |
| Distributions: | | | | | | | | |
| Dividends from investment income—net | — | | — | | (.12 | ) | — | |
| Dividends from net realized | | | | | | | | |
| gain on investments | (.72 | ) | — | | — | | — | |
| Total Distributions | (.72 | ) | — | | (.12 | ) | — | |
| Net asset value, end of period | 11.79 | | 12.51 | | 11.79 | | 10.68 | |
| Total Return (%)c | .00 | d | 6.11 | | 11.64 | | (14.56 | )e |
| Ratios/Supplemental Data (%): | | | | | | | | |
| Ratio of total expenses to average net assets | 2.82 | | 2.96 | | 3.32 | | 4.00 | f |
| Ratio of net expenses to average net assets | 2.25 | | 2.25 | | 2.25 | | 2.23 | f |
| Ratio of net investment income | | | | | | | | |
| (loss) to average net assets | (2.16 | ) | (2.13 | ) | (2.03 | ) | .35 | f |
| Portfolio Turnover Rate | — | | — | | — | | — | |
| Net Assets, end of period ($ x 1,000) | 1,197 | | 1,243 | | 1,440 | | 997 | |
| |
| a | From December 18, 2007 (commencement of operations) to October 31, 2008. |
| b | Based on average shares outstanding at each month end. |
| c | Exclusive of sales charge. |
| d | Amount represents less than .01%. |
| e | Not annualized. |
| f | Annualized. |
See notes to financial statements.
18
| | | | | | | | |
| | | | Year Ended October 31, | | | |
| Class I Shares | 2011 | | 2010 | | 2009 | | 2008 | a |
| Per Share Data ($): | | | | | | | | |
| Net asset value, beginning of period | 12.80 | | 11.94 | | 10.78 | | 12.50 | |
| Investment Operations: | | | | | | | | |
| Investment income (loss)—netb | (.14 | ) | (.14 | ) | (.11 | ) | .09 | |
| Net realized and unrealized | | | | | | | | |
| gain (loss) on investments | .25 | | 1.00 | | 1.48 | | (1.81 | ) |
| Total from Investment Operations | .11 | | .86 | | 1.37 | | (1.72 | ) |
| Distributions: | | | | | | | | |
| Dividends from investment income—net | — | | — | | (.21 | ) | — | |
| Dividends from net realized | | | | | | | | |
| gain on investments | (.72 | ) | — | | — | | — | |
| Total Distributions | (.72 | ) | — | | (.21 | ) | — | |
| Net asset value, end of period | 12.19 | | 12.80 | | 11.94 | | 10.78 | |
| Total Return (%) | .90 | | 7.20 | | 12.91 | | (13.76 | )c |
| Ratios/Supplemental Data (%): | | | | | | | | |
| Ratio of total expenses to average net assets | 1.76 | | 1.89 | | 2.57 | | 3.12 | d |
| Ratio of net expenses to average net assets | 1.25 | | 1.25 | | 1.25 | | 1.23 | d |
| Ratio of net investment income | | | | | | | | |
| (loss) to average net assets | (1.18 | ) | (1.12 | ) | (1.07 | ) | 1.03 | d |
| Portfolio Turnover Rate | — | | — | | — | | — | |
| Net Assets, end of period ($ x 1,000) | 16,506 | | 4,354 | | 1,708 | | 3,851 | |
| |
| a | From December 18, 2007 (commencement of operations) to October 31, 2008. |
| b | Based on average shares outstanding at each month end. |
| c | Not annualized. |
| d | Annualized. |
See notes to financial statements.
The Fund 19
NOTES TO FINANCIAL STATEMENTS
NOTE 1—Significant Accounting Policies:
Dreyfus Global Absolute Return Fund (the “fund”) is a separate non-diversified series of Advantage Funds, Inc. (the “Company”), which is registered under the Investment Company Act of 1940, as amended (the “Act”), as an open-end management investment company and operates as a series company that offers twelve series, including the fund. The fund’s investment objective is to seek total return by investing in instruments that provide investment exposure to global equity, bond and currency markets, and in fixed-income securities. The Dreyfus Corporation (the “Manager” or “Dreyfus”), a wholly-owned subsidiary ofThe Bank of NewYork Mellon Corporation (“BNY Mellon”), serves as the fund’s investment adviser. Mellon Capital Management Corporation (“Mellon Capital”), a subsidiary of BNY Mellon, serves as the fund’s sub-investment adviser.
MBSC Securities Corporation (the “Distributor”), a wholly-owned subsidiary of Dreyfus, is the distributor of the fund’s shares.The fund is authorized to issue 400 million shares of $.001 par value Common Stock.The fund currently offers three classes of shares: Class A (200 million shares authorized), Class C (100 million shares authorized) and Class I (100 million shares authorized). Class A shares are subject to a sales charge imposed at the time of purchase. Class C shares are subject to a contingent deferred sales charge (“CDSC”) imposed on Class C shares redeemed within one year of purchase. Class I shares are sold at net asset value per share only to institutional investors. Other differences between the classes include the services offered to and the expenses borne by each class, the allocation of certain transfer agency costs and certain voting rights. Income, expenses (other than expenses attributable to a specific class), and realized and unrealized gains or losses on investments are allocated to each class of shares based on its relative net assets.
The Company accounts separately for the assets, liabilities and operations of each series. Expenses directly attributable to each series are
20
charged to that series’ operations; expenses which are applicable to all series are allocated among them on a pro rata basis.
The Financial Accounting Standards Board (“FASB”) Accounting Standards Codification (“ASC”) is the exclusive reference of authoritative U.S. generally accepted accounting principles (“GAAP”) recognized by the FASB to be applied by nongovernmental entities. Rules and interpretive releases of the Securities and Exchange Commission (“SEC”) under authority of federal laws are also sources of authoritative GAAP for SEC registrants. The fund’s financial statements are prepared in accordance with GAAP, which may require the use of management estimates and assumptions.Actual results could differ from those estimates.
The Company enters into contracts that contain a variety of indemnifications.The fund’s maximum exposure under these arrangements is unknown.The fund does not anticipate recognizing any loss related to these arrangements.
(a) Portfolio valuation: The fair value of a financial instrument is the amount that would be received to sell an asset or paid to transfer a liability in an orderly transaction between market participants at the measurement date (i.e. the exit price). GAAP establishes a fair value hierarchy that prioritizes the inputs of valuation techniques used to measure fair value.This hierarchy gives the highest priority to unadjusted quoted prices in active markets for identical assets or liabilities (Level 1 measurements) and the lowest priority to unobservable inputs (Level 3 measurements).
Additionally, GAAP provides guidance on determining whether the volume and activity in a market has decreased significantly and whether such a decrease in activity results in transactions that are not orderly. GAAP requires enhanced disclosures around valuation inputs and techniques used during annual and interim periods.
The Fund 21
NOTES TO FINANCIAL STATEMENTS (continued)
Various inputs are used in determining the value of the fund’s investments relating to fair value measurements.These inputs are summarized in the three broad levels listed below:
Level 1—unadjusted quoted prices in active markets for identical investments.
Level 2—other significant observable inputs (including quoted prices for similar investments, interest rates, prepayment speeds, credit risk, etc.).
Level 3—significant unobservable inputs (including the fund’s own assumptions in determining the fair value of investments).
The inputs or methodology used for valuing securities are not necessarily an indication of the risk associated with investing in those securities.
Changes in valuation techniques may result in transfers in or out of an assigned level within the disclosure hierarchy. Valuation techniques used to value the fund’s investments are as follows:
Investments in equity securities are valued at the last sales price on the securities exchange or national securities market on which such securities are primarily traded. Securities listed on the National Market System for which market quotations are available are valued at the official closing price or, if there is no official closing price that day, at the last sales price. Securities not listed on an exchange or the national securities market, or securities for which there were no transactions, are valued at the average of the most recent bid and asked prices, except for open short positions, where the asked price is used for valuation purposes. Bid price is used when no asked price is available. Registered investment companies that are not traded on an exchange are valued at their net asset value.All preceding securities are categorized within Level 1 of the fair value hierarchy.
Investments in debt securities excluding short-term investments (other than U.S.Treasury Bills), financial futures, options and forward foreign currency exchange contracts (“forward contracts”) are valued each business day by an independent pricing service (the “Service”) approved by the Board of Directors. Investments for which quoted bid
22
prices are readily available and are representative of the bid side of the market in the judgment of the Service are valued at the mean between the quoted bid prices (as obtained by the Service from dealers in such securities) and asked prices (as calculated by the Service based upon its evaluation of the market for such securities). Other investments are valued as determined by the Service, based on methods which include consideration of: yields or prices of securities of comparable quality, coupon, maturity and type; indications as to values from dealers; and general market conditions. These securities are generally categorized within Level 2 of the fair value hierarchy.
U.S. Treasury Bills are valued at the mean price between quoted bid prices and asked prices by an independent pricing service approved by the Board of Directors. These securities are generally categorized within Level 2 of the fair value hierarchy
Fair valuing of securities may be determined with the assistance of a pricing service using calculations based on indices of domestic securities and other appropriate indicators, such as prices of relevant American Depository Receipts and futures contracts. Utilizing these techniques may result in transfers between Level 1 and Level 2 of the fair value hierarchy.
When market quotations or official closing prices are not readily available, or are determined not to reflect accurately fair value, such as when the value of a security has been significantly affected by events after the close of the exchange or market on which the security is principally traded (for example, a foreign exchange or market), but before the fund calculates its net asset value, the fund may value these investments at fair value as determined in accordance with the procedures approved by the Board of Directors. Certain factors may be considered when fair valuing investments such as: fundamental analytical data, the nature and duration of restrictions on disposition, an evaluation of the forces that influence the market in which the securities are purchased and sold, and public trading in similar securities of the issuer or comparable issuers.These securities are either categorized as Level 2 or 3 depending on the relevant inputs used.
The Fund 23
NOTES TO FINANCIAL STATEMENTS (continued)
For restricted securities where observable inputs are limited, assumptions about market activity and risk are used and are categorized within Level 3 of the fair value hierarchy.
Financial futures and options, which are traded on an exchange, are valued at the last sales price on the securities exchange on which such securities are primarily traded or at the last sales price on the national securities market on each business day. These securities are generally categorized within Level 1 of the fair value hierarchy. Options traded over-the-counter are valued at the mean between the bid and asked price.These securities are generally categorized within Level 2 of the fair value hierarchy. Investments denominated in foreign currencies are translated to U.S. dollars at the prevailing rates of exchange. Forward contracts are valued at the forward rate.These securities are generally categorized within Level 2 of the fair value hierarchy.
The following is a summary of the inputs used as of October 31, 2011 in valuing the fund’s investments:
| | | | | | | |
| | | | Level 2—Other | | Level 3— | | |
| | Level 1— | | Significant | | Significant | | |
| | Unadjusted | | Observable | | Unobservable | | |
| | Quoted Prices | | Inputs | | Inputs | Total | |
| Assets ($) | | | | | | | |
| Investments in Securities: | | | | | | |
| Mutual Funds | 4,649,373 | | — | | — | 4,649,373 | |
| U.S. Treasury | — | | 18,537,504 | | — | 18,537,504 | |
| Other Financial | | | | | | | |
| Instruments: | | | | | | | |
| Forward Foreign | | | | | | | |
| Currency Exchange | | | | | | | |
| Contracts† | — | | 1,506,015 | | — | 1,506,015 | |
| Futures† | 552,913 | | — | | — | 552,913 | |
| Options Purchased | 1,424,438 | | 10,520 | | — | 1,434,958 | |
| Liabilities ($) | | | | | | | |
| Other Financial | | | | | | | |
| Instruments: | | | | | | | |
| Forward Foreign | | | | | | | |
| Currency Exchange | | | | | | | |
| Contracts† | — | | (1,685,939 | ) | — | (1,685,939 | ) |
| Futures† | (174,753 | ) | — | | — | (174,753 | ) |
| Options Written | — | | (30,682 | ) | — | (30,682 | ) |
† Amount shown represents unrealized appreciation (depreciation) at period end.
24
In May 2011, FASB issued Accounting Standards Update (“ASU”) No. 2011-04 “Amendments to Achieve Common FairValue Measurement and Disclosure Requirements in GAAP and International Financial Reporting Standards (“IFRS”)” (“ASU 2011-04”). ASU 2011-04 includes common requirements for measurement of and disclosure about fair value between GAAP and IFRS. ASU 2011-04 will require reporting entities to disclose the following information for fair value measurements categorized within Level 3 of the fair value hierarchy: quantitative information about the unobservable inputs used in the fair value measurement, the valuation processes used by the reporting entity and a narrative description of the sensitivity of the fair value measurement to changes in unobservable inputs and the interrelationships between those unobservable inputs. In addition, ASU 2011-04 will require reporting entities to make disclosures about amounts and reasons for all transfers in and out of Level 1 and Level 2 fair value mea-surements.The new and revised disclosures are effective for interim and annual reporting periods beginning after December 15, 2011. At this time, management is evaluating the implications of ASU 2011-04 and its impact on the financial statements.
(b) Foreign currency transactions: The fund does not isolate that portion of the results of operations resulting from changes in foreign exchange rates on investments from the fluctuations arising from changes in the market prices of securities held. Such fluctuations are included with the net realized and unrealized gain or loss on investments.
Net realized foreign exchange gains or losses arise from sales of foreign currencies, currency gains or losses realized on securities transactions between trade and settlement date and the difference between the amounts of dividends, interest and foreign withholding taxes recorded on the fund’s books and the U.S. dollar equivalent of the amounts actually received or paid. Net unrealized foreign exchange gains and losses arise from changes in the value of assets and liabilities other than investments resulting from changes in exchange rates. Foreign currency gains and losses on investments are included with net realized and unrealized gain or loss on investments.
The Fund 25
NOTES TO FINANCIAL STATEMENTS (continued)
(c) Securities transactions and investment income: Securities transactions are recorded on a trade date basis. Realized gains and losses from securities transactions are recorded on the identified cost basis. Dividend income is recognized on the ex-dividend date and interest income, including, where applicable, accretion of discount and amortization of premium on investments, is recognized on the accrual basis.
(d) Affiliated issuers: Investments in other investment companies advised by Dreyfus are defined as “affiliated” in the Act.
The fund may invest in shares of certain affiliated investment companies also advised or managed by Dreyfus. Investments in affiliated investment companies for the period ended October 31, 2011 were as follows:
| | | | | | | |
| Affiliated | | | | | | | |
| Investment | Value | | | | Value | | Net |
| Company | 10/31/2010 | ($) | Purchases ($) | Sales ($) | 10/31/2011 | ($) | Assets (%) |
| Dreyfus | | | | | | | |
| Institutional | | | | | | | |
| Preferred | | | | | | | |
| Plus Money | | | | | | | |
| Market Fund | 3,225,000 | | 28,459,510 | 27,035,137 | 4,649,373 | | 19.2 |
(e) Dividends to shareholders: Dividends are recorded on the ex-dividend date. Dividends from investment income-net and dividends from net realized capital gains, if any, are normally declared and paid annually, but the fund may make distributions on a more frequent basis to comply with the distribution requirements of the Internal Revenue Code of 1986, as amended (the “Code”).To the extent that net realized capital gains can be offset by capital loss carryovers, it is the policy of the fund not to distribute such gains. Income and capital gain distributions are determined in accordance with income tax regulations, which may differ from GAAP.
(f) Federal income taxes: It is the policy of the fund to continue to qualify as a regulated investment company, if such qualification is in the best interests of its shareholders, by complying with the applicable provisions of the Code, and to make distributions of taxable income sufficient to relieve it from substantially all federal income and excise taxes.
26
As of and during the period ended October 31, 2011, the fund did not have any liabilities for any uncertain tax positions.The fund recognizes interest and penalties, if any, related to uncertain tax positions as income tax expense in the Statement of Operations. During the period, the fund did not incur any interest or penalties.
Each of the tax years in the four-year period ended October 31, 2011 remains subject to examination by the Internal Revenue Service and state taxing authorities.
At October 31, 2011, the components of accumulated earnings on a tax basis were as follows: accumulated capital losses $51,801 and unrealized appreciation $263,653.
The accumulated capital loss carryover is available for federal income tax purposes to be applied against future net securities profits, if any, realized subsequent to October 31, 2011. If not applied, the carryover expires in fiscal 2019.
Under the recently enacted Regulated Investment Company Modernization Act of 2010 (the “2010 Act”), the fund will be permitted to carry forward capital losses incurred in taxable years beginning after December 22, 2010 (“post-enactment losses”) for an unlimited period. However, the 2010 Act requires post-enactment losses to be utilized before the utilization of losses incurred in taxable years prior to the effective date of the 2010 Act. As a result of this ordering rule, capital loss carryovers related to taxable years beginning prior to the effective date of the 2010 Act may be more likely to expire unused.
The tax character of distributions paid to shareholders during the fiscal periods ended October 31, 2011 and October 31, 2010 were as follows: ordinary income $91,906 and $0 and long-term capital gains $731,274 and $0, respectively.
During the period ended October 31, 2011, as a result of permanent book to tax differences, primarily due to the tax treatment for foreign currency gains and losses and net operating losses, the fund increased
The Fund 27
NOTES TO FINANCIAL STATEMENTS (continued)
accumulated undistributed investment income-net by $269,216, decreased accumulated net realized gain (loss) on investments by $69,863 and decreased paid-in capital by $199,353. Net assets and net asset value per share were not affected by this reclassification.
NOTE 2—Bank Lines of Credit:
The fund participates with other Dreyfus-managed funds in a $225 million unsecured credit facility led by Citibank, N.A. and a $300 million unsecured credit facility provided by The Bank of New York Mellon, a subsidiary of BNY Mellon and an affiliate of Dreyfus (each, a “Facility”), each to be utilized primarily for temporary or emergency purposes, including the financing of redemptions. In connection therewith, the fund has agreed to pay its pro rata portion of commitment fees for each Facility. Interest is charged to the fund based on rates determined pursuant to the terms of the respective Facility at the time of borrowing. During the period ended October 31, 2011, the fund did not borrow under the Facilities.
NOTE 3—Management Fee, Sub-Investment Advisory Fee and Other Transactions With Affiliates:
(a) Pursuant to a management agreement with Dreyfus, the management fee is computed at the annual rate of 1.10% of the value of the fund’s average daily net assets and is payable monthly. Dreyfus has contractually agreed, until March 1, 2013, to waive receipt of its fees and/or assume the expenses of the fund, so that the direct expenses of none of the classes (exclusive of taxes, brokerage commissions, Rule 12b-1 fees, interest expense, shareholder services fees, commitment fees on borrowings and extraordinary expenses) exceed 1.25% of the value of the funds average daily net assets.The reduction in management fee, pursuant to the undertaking, amounted to $106,389 during the period ended October 31, 2011.
Pursuant to a Sub-Investment Advisory Agreement between Dreyfus and Mellon Capital, Dreyfus pays Mellon Capital an annual fee of .65% of the value of the fund’s average daily net assets, payable monthly.
28
During the period ended October 31, 2011, the Distributor retained $2,887 from commissions earned on sales of the fund’s Class A shares and $219 from CDSCs on redemptions of the fund’s Class C shares.
(b) Under the Distribution Plan (the “Plan”) adopted pursuant to Rule 12b-1 under the Act, Class C shares pay the Distributor for distributing its shares at an annual rate of .75% of the value of the average daily net assets of Class C shares. During the period ended October 31, 2011, Class C shares were charged $10,371 pursuant to the Plan.
(c) Under the Shareholder Services Plan, Class A and Class C shares pay the Distributor at an annual rate of .25% of the value of their average daily net assets for the provision of certain services.The services provided may include personal services relating to shareholder accounts, such as answering shareholder inquiries regarding the fund and providing reports and other information, and services related to the maintenance of shareholder accounts.The Distributor may make payments to Service Agents (a securities dealer, financial institution or other industry professional) in respect of these services.The Distributor determines the amounts to be paid to Service Agents. During the period ended October 31, 2011, Class A and Class C shares were charged $21,224 and $3,457, respectively, pursuant to the Shareholder Services Plan.
The fund compensates Dreyfus Transfer, Inc., a wholly-owned subsidiary of Dreyfus, under a transfer agency agreement for providing personnel and facilities to perform transfer agency services for the fund. During the period ended October 31, 2011, the fund was charged $4,862 pursuant to the transfer agency agreement, which is included in Shareholder servicing costs in the Statement of Operations.
The fund has arrangements with the custodian and cash management bank whereby the fund may receive earnings credits when positive cash balances are maintained, which are used to offset custody and cash man-
The Fund 29
NOTES TO FINANCIAL STATEMENTS (continued)
agement fees. For financial reporting purposes, the fund includes net earnings credits as an expense offset in the Statement of Operations.
The fund compensates The Bank of New York Mellon under cash management agreements for performing cash management services related to fund subscriptions and redemptions. During the period ended October 31, 2011, the fund was charged $399 pursuant to the cash management agreements which is included in Shareholder servicing costs in the Statement of Operations.These fees were partially offset by earnings credits of $14.
The fund also compensates The Bank of New York Mellon under a custody agreement for providing custodial services for the fund. During the period ended October 31, 2011, the fund was charged $2,979 pursuant to the custody agreement.
During the period ended October 31, 2011, the fund was charged $6,751 for services performed by the Chief Compliance Officer.
The components of “Due toThe Dreyfus Corporation and affiliates” in the Statement of Assets and Liabilities consist of: management fees $21,368, Rule 12b-1 distribution plan fees $802, shareholder services plan fees $1,609, custodian fees $1,645, chief compliance officer fees $4,246 and transfer agency per account fees $1,085, which are offset against an expense reimbursement currently in effect in the amount of $9,124.
(d) Each Board member also serves as a Board member of other funds within the Dreyfus complex. Annual retainer fees and attendance fees are allocated to each fund based on net assets.
NOTE 4—Securities Transactions:
During the period ended October 31, 2011, there were no purchases and sales of investment securities, excluding short-term securities, financial futures, options transactions and forward contracts.
The following tables show the fund’s exposure to different types of market risk as it relates to the statement of Assets and Liabilities and the Statement of Operations, respectively.
30
Fair value of derivative instruments as of October 31, 2011 is shown below:
| | | | |
| | Derivative | | Derivative | |
| | Assets ($) | | Liabilities ($) | |
| Equity risk1,2 | 394,760 | Equity risk1,3 | (152,284 | ) |
| Interest rate risk1,2 | 1,593,111 | Interest rate risk1 | (53,151 | ) |
| Foreign exchange risk4 | 1,506,015 | Foreign exchange risk5 | (1,685,939 | ) |
| Gross fair value of | | | | |
| derivatives contracts | 3,493,886 | | (1,891,374 | ) |
Statement of Assets and Liabilities location:
| |
| 1 | Includes cumulative appreciation/depreciation on futures contracts as reported in the Statement of |
| | Financial Futures, but only the unpaid variation margin is reported in the Statement of Assets |
| | and Liabilities. |
| 2 | Options purchased are included in Investments in securities of Unaffiliated issuers at market value. |
| 3 | Outstanding options written, at value. |
| 4 | Unrealized appreciation on forward foreign currency exchange contracts. |
| 5 | Unrealized depreciation on forward foreign currency exchange contracts. |
The effect of derivative instruments in the Statement of Operations during the period ended October 31, 2011 is shown below:
| | | | | | |
| | Amount of realized gain or (loss) on derivatives recognized in income ($) | |
| | | | | Forward | | |
| Underlying risk | Futures6 | | Options7 | Contracts8 | Total | |
| Equity | (298,876 | ) | 24,679 | — | (274,197 | ) |
| Interest rate | (761,071 | ) | 946,530 | — | 185,459 | |
| Foreign exchange | — | | — | 271,073 | 271,073 | |
| Total | (1,059,947 | ) | 971,209 | 271,073 | 182,335 | |
| | | | | | | |
| Change in unrealized appreciation or (depreciation) on derivatives recognized in income ($) | |
| | | | | Forward | | | |
| Underlying risk | Futures9 | Options10 | | Contracts11 | | Total | |
| Equity | 301,034 | (20,161 | ) | — | | 280,873 | |
| Interest rate | 4,731 | (40,389 | ) | — | | (35,658 | ) |
| Foreign exchange | — | — | | (301,700 | ) | (301,700 | ) |
| Total | 305,765 | (60,550 | ) | (301,700 | ) | (56,485 | ) |
Statement of Operations location:
| |
| 6 | Net realized gain (loss) on financial futures. |
| 7 | Net realized gain (loss) on options transactions. |
| 8 | Net realized gain (loss) on forward foreign currency exchange contracts. |
| 9 | Net unrealized appreciation (depreciation) on financial futures. |
| 10 Net unrealized appreciation (depreciation) on options transactions. |
| 11 Net unrealized appreciation (depreciation) on forward foreign currency exchange contracts. |
The Fund 31
NOTES TO FINANCIAL STATEMENTS (continued)
Futures Contracts: In the normal course of pursuing its investment objective, the fund is exposed to market risk, including equity price risk and interest rate risk as a result of changes in value of underlying financial instruments.The fund invests in financial futures contracts in order to manage its exposure to or protect against changes in the market. A futures contract represents a commitment for the future purchase or a sale of an asset at a specified date. Upon entering into such contracts, these investments require initial margin deposits with a broker, which consist of cash or cash equivalents. The amount of these deposits is determined by the exchange or Board of Trade on which the contract is traded and is subject to change. Accordingly, variation margin payments are received or made to reflect daily unrealized gains or losses which are recorded in the Statement of Operations. Futures contracts are valued daily at the last sales price established by the Board of Trade or exchange upon which they are traded. When the contracts are closed, the fund recognizes a realized gain or loss. There is minimal counterparty credit risk to the fund with futures since futures are exchange traded, and the exchange’s clearinghouse guarantees the futures against default. Contracts open at October 31, 2011 are set forth in the Statement of Financial Futures.
Options: The fund purchases and writes (sells) put and call options to hedge against changes in interest rates and the value of equities or as a substitute for an investment.The fund is subject to interest rate risk and equity risk in the course of pursuing its investment objectives through its investments in options contracts. A call option gives the purchaser of the option the right (but not the obligation) to buy, and obligates the writer to sell, the underlying security or securities at the exercise price at any time during the option period, or at a specified date. Conversely, a put option gives the purchaser of the option the right (but not the obligation) to sell, and obligates the writer to buy the underlying security or securities at the exercise price at any time during the option period, or at a specified date.
As a writer of call options, the fund receives a premium at the outset and then bears the market risk of unfavorable changes in the price of the
32
financial instrument underlying the option. Generally, the fund realizes a gain, to the extent of the premium, if the price of the underlying financial instrument decreases between the date the option is written and the date on which the option is terminated. Generally, the fund incurs a loss, if the price of the financial instrument increases between those dates.
As a writer of put options, the fund receives a premium at the outset and then bears the market risk of unfavorable changes in the price of the financial instrument underlying the option. Generally, the fund realizes a gain, to the extent of the premium, if the price of the underlying financial instrument increases between the date the option is written and the date on which the option is terminated. Generally, the fund incurs a loss, if the price of the financial instrument decreases between those dates.
As a writer of an option, the fund has no control over whether the underlying securities may be sold (call) or purchased (put) and as a result bears the market risk of an unfavorable change in the price of the security underlying the written option.There is a risk of loss from a change in value of such options which may exceed the related premiums received. One risk of holding a put or a call option is that if the option is not sold or exercised prior to its expiration, it becomes worthless. However, this risk is limited to the premium paid by the fund. Upon the expiration or closing of the option transaction, a gain or loss is reported in the Statement of Operations.
The following summarizes the fund’s call/put options written during the period ended October 31, 2011:
| | | | |
| | | | Options Terminated |
| | Number of | Premiums | | Net Realized |
| Options Written: | Contracts | Received ($) | Cost ($) | Gain ($) |
| Contracts outstanding | | | | |
| October 31, 2010 | — | — | | |
| Contracts written | 140 | 36,959 | | |
| Contracts terminated: | | | | |
| Contracts closed | 50 | 7,838 | — | 7,838 |
| Contracts Outstanding | | | | |
| October 31, 2011 | 90 | 29,121 | | |
The Fund 33
NOTES TO FINANCIAL STATEMENTS (continued)
Forward Foreign Currency Exchange Contracts: The fund enters into forward contracts in order to hedge its exposure to changes in foreign currency exchange rates on its foreign portfolio holdings, to settle foreign currency transactions or as a part of its investment strategy. When executing forward contracts, the fund is obligated to buy or sell a foreign currency at a specified rate on a certain date in the future. With respect to sales of forward contracts, the fund incurs a loss if the value of the contract increases between the date the forward contract is opened and the date the forward contract is closed.The fund realizes a gain if the value of the contract decreases between those dates. With respect to purchases of forward contracts, the fund incurs a loss if the value of the contract decreases between the date the forward contract is opened and the date the forward contract is closed.The fund realizes a gain if the value of the contract increases between those dates. Any realized gain or loss which occurred during the period is reflected in the Statement of Operations.The fund is exposed to foreign currency risk as a result of changes in value of underlying financial instruments. The fund is also exposed to credit risk associated with counterparty nonperformance on these forward contracts, which is typically limited to the unrealized gain on each open contract.The following summarizes open forward contracts at October 31, 2011:
| | | | |
| | Foreign | | | Unrealized |
| Forward Foreign Currency | Currency | | | Appreciation |
| Exchange Contracts | Amounts | Cost ($) | Value ($) (Depreciation) ($) |
| Purchases: | | | | |
| Australian Dollar, | | | | |
| Expiring 12/21/2011 | 849,000 | 862,0745 | 889,128 | 27,053 |
| Australian Dollar, | | | | |
| Expiring 12/21/2011 | 566,000 | 576,763 | 592,752 | 15,989 |
| Australian Dollar, | | | | |
| Expiring 12/21/2011 | 42,000 | 42,378 | 43,985 | 1,607 |
| Australian Dollar, | | | | |
| Expiring 12/21/2011 | 1,368 | 1,329 | 1,432 | 103 |
| Australian Dollar, | | | | |
| Expiring 12/21/2011 | 519,840 | 502,628 | 544,410 | 41,782 |
| Australian Dollar, | | | | |
| Expiring 12/21/2011 | 162,792 | 157,308 | 170,486 | 13,178 |
| Australian Dollar, | | | | |
| Expiring 12/21/2011 | 1,157,500 | 1,122,948 | 1,212,209 | 89,261 |
34
| | | | |
| | Foreign | | | Unrealized |
| Forward Foreign Currency | Currency | | | Appreciation |
| Exchange Contracts | Amounts | Cost ($) | Value ($) (Depreciation) ($) |
| Purchases (continued): | | | | |
| Australian Dollar, | | | | |
| Expiring 12/21/2011 | 1,157,500 | 1,118,492 | 1,212,209 | 93,717 |
| Australian Dollar, | | | | |
| Expiring 12/21/2011 | 77,100 | 76,121 | 80,744 | 4,623 |
| Australian Dollar, | | | | |
| Expiring 12/21/2011 | 179,900 | 176,881 | 188,403 | 11,522 |
| Australian Dollar, | | | | |
| Expiring 12/21/2011 | 57,800 | 55,594 | 60,531 | 4,937 |
| Australian Dollar, | | | | |
| Expiring 12/21/2011 | 231,200 | 222,157 | 242,127 | 19,970 |
| Australian Dollar, | | | | |
| Expiring 12/21/2011 | 161,160 | 156,688 | 168,777 | 12,089 |
| Australian Dollar, | | | | |
| Expiring 12/21/2011 | 191,450 | 189,554 | 200,498 | 10,944 |
| Australian Dollar, | | | | |
| Expiring 12/21/2011 | 54,700 | 54,235 | 57,285 | 3,050 |
| Australian Dollar, | | | | |
| Expiring 12/21/2011 | 656,000 | 663,097 | 687,005 | 23,908 |
| Australian Dollar, | | | | |
| Expiring 12/21/2011 | 146,400 | 148,169 | 153,319 | 5,150 |
| Australian Dollar, | | | | |
| Expiring 12/21/2011 | 97,600 | 98,628 | 102,213 | 3,585 |
| Australian Dollar, | | | | |
| Expiring 12/21/2011 | 1,019,150 | 1,043,575 | 1,067,320 | 23,745 |
| Australian Dollar, | | | | |
| Expiring 12/21/2011 | 179,850 | 184,308 | 188,350 | 4,042 |
| British Pound, | | | | |
| Expiring 12/21/2011 | 762,907 | 1,205,705 | 1,226,004 | 20,299 |
| British Pound, | | | | |
| Expiring 12/21/2011 | 1,679,750 | 2,645,303 | 2,699,386 | 54,083 |
| British Pound, | | | | |
| Expiring 12/21/2011 | 282,400 | 443,711 | 453,821 | 10,110 |
| British Pound, | | | | |
| Expiring 12/21/2011 | 423,600 | 665,813 | 680,732 | 14,919 |
| British Pound, | | | | |
| Expiring 12/21/2011 | 469,500 | 726,307 | 754,494 | 28,187 |
| British Pound, | | | | |
| Expiring 12/21/2011 | 469,500 | 725,743 | 754,494 | 28,751 |
| British Pound, | | | | |
| Expiring 12/21/2011 | 274,770 | 429,185 | 441,560 | 12,375 |
| British Pound, | | | | |
| Expiring 12/21/2011 | 393,120 | 607,973 | 631,750 | 23,777 |
The Fund 35
NOTES TO FINANCIAL STATEMENTS (continued)
| | | | | |
| | Foreign | | | Unrealized | |
| Forward Foreign Currency | Currency | | | Appreciation | |
| Exchange Contracts | Amounts | Cost ($) | Value ($) (Depreciation) ($) | |
| Purchases (continued): | | | | | |
| British Pound, | | | | | |
| Expiring 12/21/2011 | 236,600 | 365,691 | 380,220 | 14,529 | |
| British Pound, | | | | | |
| Expiring 12/21/2011 | 98,280 | 151,945 | 157,937 | 5,992 | |
| British Pound, | | | | | |
| Expiring 12/21/2011 | 52,380 | 80,561 | 84,175 | 3,614 | |
| British Pound, | | | | | |
| Expiring 12/21/2011 | 90,210 | 138,821 | 144,969 | 6,148 | |
| British Pound, | | | | | |
| Expiring 12/21/2011 | 148,410 | 228,505 | 238,497 | 9,992 | |
| British Pound, | | | | | |
| Expiring 12/21/2011 | 296,000 | 455,026 | 475,677 | 20,651 | |
| British Pound, | | | | | |
| Expiring 12/21/2011 | 74,000 | 113,854 | 118,919 | 5,065 | |
| British Pound, | | | | | |
| Expiring 12/21/2011 | 684,000 | 1,078,852 | 1,099,199 | 20,347 | |
| British Pound, | | | | | |
| Expiring 12/21/2011 | 915,000 | 1,434,848 | 1,470,420 | 35,572 | |
| British Pound, | | | | | |
| Expiring 12/21/2011 | 121,000 | 189,802 | 194,449 | 4,647 | |
| British Pound, | | | | | |
| Expiring 12/21/2011 | 209,000 | 328,085 | 335,866 | 7,781 | |
| British Pound, | | | | | |
| Expiring 12/21/2011 | 110,000 | 172,916 | 176,771 | 3,855 | |
| British Pound, | | | | | |
| Expiring 12/21/2011 | 110,000 | 173,279 | 176,771 | 3,492 | |
| Canadian Dollar, | | | | | |
| Expiring 12/21/2011 | 1,808,000 | 1,829,181 | 1,811,692 | (17,489 | ) |
| Canadian Dollar, | | | | | |
| Expiring 12/21/2011 | 955,663 | 969,360 | 957,615 | (11,745 | ) |
| Canadian Dollar, | | | | | |
| Expiring 12/21/2011 | 1,481,430 | 1,509,507 | 1,484,455 | (25,052 | ) |
| Canadian Dollar, | | | | | |
| Expiring 12/21/2011 | 597,770 | 607,093 | 598,991 | (8,102 | ) |
| Canadian Dollar, | | | | | |
| Expiring 12/21/2011 | 94,000 | 93,938 | 94,191 | 253 | |
| Canadian Dollar, | | | | | |
| Expiring 12/21/2011 | 652,800 | 640,610 | 654,133 | 13,523 | |
| Canadian Dollar, | | | | | |
| Expiring 12/21/2011 | 210,200 | 205,038 | 210,629 | 5,591 | |
| Canadian Dollar, | | | | | |
| Expiring 12/21/2011 | 1,523,200 | 1,491,417 | 1,526,310 | 34,893 | |
| Canadian Dollar, | | | | | |
| Expiring 12/21/2011 | 591,090 | 569,991 | 592,297 | 22,306 | |
36
| | | | | |
| | Foreign | | | Unrealized | |
| Forward Foreign Currency | Currency | | | Appreciation | |
| Exchange Contracts | Amounts | Cost ($) | Value ($) (Depreciation) ($) | |
| Purchases (continued): | | | | | |
| Canadian Dollar, | | | | | |
| Expiring 12/21/2011 | 592,000 | 574,617 | 593,208 | 18,591 | |
| Canadian Dollar, | | | | | |
| Expiring 12/21/2011 | 942,000 | 918,415 | 943,924 | 25,509 | |
| Canadian Dollar, | | | | | |
| Expiring 12/21/2011 | 232,180 | 227,529 | 232,654 | 5,125 | |
| Canadian Dollar, | | | | | |
| Expiring 12/21/2011 | 122,200 | 119,542 | 122,449 | 2,907 | |
| Canadian Dollar, | | | | | |
| Expiring 12/21/2011 | 134,420 | 131,485 | 134,694 | 3,209 | |
| Canadian Dollar, | | | | | |
| Expiring 12/21/2011 | 122,200 | 119,985 | 122,449 | 2,464 | |
| Euro, | | | | | |
| Expiring 12/21/2011 | 452,795 | 628,388 | 626,271 | (2,117 | ) |
| Euro, | | | | | |
| Expiring 12/21/2011 | 648,660 | 893,964 | 897,177 | 3,213 | |
| Euro, | | | | | |
| Expiring 12/21/2011 | 261,740 | 360,573 | 362,019 | 1,446 | |
| Euro, | | | | | |
| Expiring 12/21/2011 | 57,500 | 77,458 | 79,529 | 2,071 | |
| Euro, | | | | | |
| Expiring 12/21/2011 | 57,500 | 77,590 | 79,529 | 1,939 | |
| Euro, | | | | | |
| Expiring 12/21/2011 | 306,300 | 417,440 | 423,651 | 6,211 | |
| Euro, | | | | | |
| Expiring 12/21/2011 | 714,700 | 972,035 | 988,518 | 16,483 | |
| Euro, | | | | | |
| Expiring 12/21/2011 | 390,015 | 530,253 | 539,439 | 9,186 | |
| Euro, | | | | | |
| Expiring 12/21/2011 | 572,985 | 777,959 | 792,509 | 14,550 | |
| Euro, | | | | | |
| Expiring 12/21/2011 | 33,000 | 44,209 | 45,643 | 1,434 | |
| Euro, | | | | | |
| Expiring 12/21/2011 | 132,000 | 176,764 | 182,572 | 5,808 | |
| Euro, | | | | | |
| Expiring 12/21/2011 | 345,780 | 465,011 | 478,256 | 13,245 | |
| Euro, | | | | | |
| Expiring 12/21/2011 | 403,000 | 550,147 | 557,399 | 7,252 | |
| Euro, | | | | | |
| Expiring 12/21/2011 | 770,000 | 1,063,408 | 1,065,005 | 1,597 | |
| Euro, | | | | | |
| Expiring 12/21/2011 | 420,000 | 578,762 | 580,912 | 2,150 | |
The Fund 37
NOTES TO FINANCIAL STATEMENTS (continued)
| | | | | |
| | Foreign | | | Unrealized | |
| Forward Foreign Currency | Currency | | | Appreciation | |
| Exchange Contracts | Amounts | Cost ($) | Value ($) (Depreciation) ($) | |
| Purchases (continued): | | | | | |
| Euro, | | | | | |
| Expiring 12/21/2011 | 280,000 | 385,735 | 387,275 | 1,540 | |
| Euro, | | | | | |
| Expiring 12/21/2011 | 28,800 | 39,429 | 39,833 | 404 | |
| Euro, | | | | | |
| Expiring 12/21/2011 | 54,720 | 74,852 | 75,684 | 832 | |
| Euro, | | | | | |
| Expiring 12/21/2011 | 31,680 | 43,319 | 43,817 | 498 | |
| Euro, | | | | | |
| Expiring 12/21/2011 | 28,800 | 39,542 | 39,834 | 292 | |
| Euro, | | | | | |
| Expiring 12/21/2011 | 305,860 | 433,281 | 423,042 | (10,239 | ) |
| Euro, | | | | | |
| Expiring 12/21/2011 | 67,140 | 95,067 | 92,862 | (2,205 | ) |
| Japanese Yen, | | | | | |
| Expiring 12/21/2011 | 58,052,404 | 756,215 | 743,319 | (12,896 | ) |
| Japanese Yen, | | | | | |
| Expiring 12/21/2011 | 86,102,685 | 1,124,158 | 1,102,483 | (21,675 | ) |
| Japanese Yen, | | | | | |
| Expiring 12/21/2011 | 84,397,683 | 1,102,704 | 1,080,652 | (22,052 | ) |
| Japanese Yen, | | | | | |
| Expiring 12/21/2011 | 19,504,277 | 254,794 | 249,738 | (5,056 | ) |
| Japanese Yen, | | | | | |
| Expiring 12/21/2011 | 63,743,100 | 830,691 | 816,185 | (14,506 | ) |
| Japanese Yen, | | | | | |
| Expiring 12/21/2011 | 25,720,900 | 334,958 | 329,338 | (5,620 | ) |
| Japanese Yen, | | | | | |
| Expiring 12/21/2011 | 21,630,000 | 283,285 | 276,957 | (6,328 | ) |
| Japanese Yen, | | | | | |
| Expiring 12/21/2011 | 32,445,000 | 425,313 | 415,435 | (9,878 | ) |
| Japanese Yen, | | | | | |
| Expiring 12/21/2011 | 80,843,000 | 1,056,013 | 1,035,137 | (20,876 | ) |
| Japanese Yen, | | | | | |
| Expiring 12/21/2011 | 34,647,000 | 452,492 | 443,630 | (8,862 | ) |
| Japanese Yen, | | | | | |
| Expiring 12/21/2011 | 49,574,330 | 643,636 | 634,764 | (8,872 | ) |
| Japanese Yen, | | | | | |
| Expiring 12/21/2011 | 34,583,610 | 451,042 | 442,818 | (8,224 | ) |
| Japanese Yen, | | | | | |
| Expiring 12/21/2011 | 114,635,000 | 1,496,286 | 1,467,820 | (28,466 | ) |
| Japanese Yen, | | | | | |
| Expiring 12/21/2011 | 49,487,600 | 642,946 | 633,653 | (9,293 | ) |
| Japanese Yen, | | | | | |
| Expiring 12/21/2011 | 74,231,400 | 963,649 | 950,480 | (13,169 | ) |
38
| | | | | |
| | Foreign | | | Unrealized | |
| Forward Foreign Currency | Currency | | | Appreciation | |
| Exchange Contracts | Amounts | Cost ($) | Value ($) (Depreciation) ($) | |
| Purchases (continued): | | | | | |
| Japanese Yen, | | | | | |
| Expiring 12/21/2011 | 7,644,600 | 99,114 | 97,883 | (1,231 | ) |
| Japanese Yen, | | | | | |
| Expiring 12/21/2011 | 43,319,400 | 561,066 | 554,674 | (6,392 | ) |
| Japanese Yen, | | | | | |
| Expiring 12/21/2011 | 43,906,000 | 572,595 | 562,185 | (10,410 | ) |
| Japanese Yen, | | | | | |
| Expiring 12/21/2011 | 10,768,000 | 140,263 | 137,877 | (2,386 | ) |
| Japanese Yen, | | | | | |
| Expiring 12/21/2011 | 6,163,600 | 80,233 | 78,920 | (1,313 | ) |
| Japanese Yen, | | | | | |
| Expiring 12/21/2011 | 6,779,960 | 88,342 | 86,812 | (1,530 | ) |
| Japanese Yen, | | | | | |
| Expiring 12/21/2011 | 11,710,840 | 152,306 | 149,949 | (2,357 | ) |
| Japanese Yen, | | | | | |
| Expiring 12/21/2011 | 6,163,600 | 80,223 | 78,920 | (1,303 | ) |
| Japanese Yen, | | | | | |
| Expiring 12/21/2011 | 32,587,000 | 430,197 | 417,253 | (12,944 | ) |
| Japanese Yen, | | | | | |
| Expiring 12/21/2011 | 13,219,220 | 174,683 | 169,262 | (5,421 | ) |
| Japanese Yen, | | | | | |
| Expiring 12/21/2011 | 2,901,780 | 38,358 | 37,155 | (1,203 | ) |
| New Zealand Dollar, | | | | | |
| Expiring 12/21/2011 | 1,620,450 | 1,321,898 | 1,305,717 | (16,181 | ) |
| New Zealand Dollar, | | | | | |
| Expiring 12/21/2011 | 189,570 | 144,522 | 152,750 | 8,228 | |
| New Zealand Dollar, | | | | | |
| Expiring 12/21/2011 | 429,000 | 334,276 | 345,677 | 11,401 | |
| New Zealand Dollar, | | | | | |
| Expiring 12/21/2011 | 12,000 | 9,437 | 9,669 | 232 | |
| New Zealand Dollar, | | | | | |
| Expiring 12/21/2011 | 244,800 | 195,866 | 197,253 | 1,387 | |
| New Zealand Dollar, | | | | | |
| Expiring 12/21/2011 | 43,200 | 34,594 | 34,809 | 215 | |
| New Zealand Dollar, | | | | | |
| Expiring 12/21/2011 | 164,000 | 129,675 | 132,147 | 2,472 | |
| New Zealand Dollar, | | | | | |
| Expiring 12/21/2011 | 842,960 | 690,766 | 679,236 | (11,530 | ) |
| New Zealand Dollar, | | | | | |
| Expiring 12/21/2011 | 185,040 | 151,836 | 149,100 | (2,736 | ) |
| Norwegian Krone, | | | | | |
| Expiring 12/21/2011 | 2,916,532 | 522,002 | 522,330 | 328 | |
| Norwegian Krone, | | | | | |
| Expiring 12/21/2011 | 1,572,630 | 280,716 | 281,646 | 930 | |
The Fund 39
NOTES TO FINANCIAL STATEMENTS (continued)
| | | | |
| | Foreign | | | Unrealized |
| Forward Foreign Currency | Currency | | | Appreciation |
| Exchange Contracts | Amounts | Cost ($) | Value ($) (Depreciation) ($) |
| Purchases (continued): | | | | |
| Norwegian Krone, | | | | |
| Expiring 12/21/2011 | 634,570 | 112,996 | 113,646 | 650 |
| Norwegian Krone, | | | | |
| Expiring 12/21/2011 | 2,605,200 | 459,480 | 466,572 | 7,092 |
| Norwegian Krone, | | | | |
| Expiring 12/21/2011 | 3,907,800 | 690,289 | 699,858 | 9,569 |
| Norwegian Krone, | | | | |
| Expiring 12/21/2011 | 1,127,480 | 192,451 | 201,923 | 9,472 |
| Norwegian Krone, | | | | |
| Expiring 12/21/2011 | 1,021,020 | 175,312 | 182,857 | 7,545 |
| Norwegian Krone, | | | | |
| Expiring 12/21/2011 | 599,000 | 104,848 | 107,276 | 2,428 |
| Norwegian Krone, | | | | |
| Expiring 12/21/2011 | 2,096,500 | 367,546 | 375,468 | 7,922 |
| Norwegian Krone, | | | | |
| Expiring 12/21/2011 | 3,021,000 | 530,000 | 541,039 | 11,039 |
| Norwegian Krone, | | | | |
| Expiring 12/21/2011 | 3,677,000 | 647,165 | 658,524 | 11,359 |
| Norwegian Krone, | | | | |
| Expiring 12/21/2011 | 431,700 | 77,207 | 77,314 | 107 |
| Norwegian Krone, | | | | |
| Expiring 12/21/2011 | 2,446,300 | 437,417 | 438,114 | 697 |
| Norwegian Krone, | | | | |
| Expiring 12/21/2011 | 1,836,000 | 325,695 | 328,814 | 3,119 |
| Swedish Krona, | | | | |
| Expiring 12/21/2011 | 3,557,149 | 532,694 | 544,278 | 11,584 |
| Swedish Krona, | | | | |
| Expiring 12/21/2011 | 12,271,201 | 1,825,691 | 1,877,613 | 51,922 |
| Swedish Krona, | | | | |
| Expiring 12/21/2011 | 4,842,775 | 733,320 | 740,991 | 7,671 |
| Swedish Krona, | | | | |
| Expiring 12/21/2011 | 854,680 | 128,106 | 130,774 | 2,668 |
| Swedish Krona, | | | | |
| Expiring 12/21/2011 | 2,118,120 | 318,543 | 324,093 | 5,550 |
| Swedish Krona, | | | | |
| Expiring 12/21/2011 | 917,200 | 137,908 | 140,340 | 2,432 |
| Swedish Krona, | | | | |
| Expiring 12/21/2011 | 1,375,800 | 206,660 | 210,510 | 3,850 |
| Swedish Krona, | | | | |
| Expiring 12/21/2011 | 992,400 | 147,012 | 151,846 | 4,834 |
| Swedish Krona, | | | | |
| Expiring 12/21/2011 | 2,315,600 | 341,987 | 354,309 | 12,322 |
| Swedish Krona, | | | | |
| Expiring 12/21/2011 | 6,275,690 | 916,765 | 960,241 | 43,476 |
40
| | | | | |
| | Foreign | | | Unrealized | |
| Forward Foreign Currency | Currency | | | Appreciation | |
| Exchange Contracts | Amounts | Cost ($) | Value ($) (Depreciation) ($) | |
| Purchases (continued): | | | | | |
| Swedish Krona, | | | | | |
| Expiring 12/21/2011 | 1,770,660 | 256,468 | 270,928 | 14,460 | |
| Swedish Krona, | | | | | |
| Expiring 12/21/2011 | 1,065,675 | 154,447 | 163,058 | 8,611 | |
| Swedish Krona, | | | | | |
| Expiring 12/21/2011 | 442,665 | 64,004 | 67,732 | 3,728 | |
| Swedish Krona, | | | | | |
| Expiring 12/21/2011 | 432,800 | 63,076 | 66,222 | 3,146 | |
| Swedish Krona, | | | | | |
| Expiring 12/21/2011 | 1,731,200 | 251,873 | 264,890 | 13,017 | |
| Swedish Krona, | | | | | |
| Expiring 12/21/2011 | 2,639,760 | 388,242 | 403,909 | 15,667 | |
| Swedish Krona, | | | | | |
| Expiring 12/21/2011 | 1,088,150 | 163,268 | 166,497 | 3,229 | |
| Swedish Krona, | | | | | |
| Expiring 12/21/2011 | 310,900 | 46,622 | 47,571 | 949 | |
| Swedish Krona, | | | | | |
| Expiring 12/21/2011 | 2,134,000 | 335,957 | 326,523 | (9,434 | ) |
| Swiss Franc, | | | | | |
| Expiring 12/21/2011 | 500,189 | 572,298 | 570,333 | (1,965 | ) |
| Swiss Franc, | | | | | |
| Expiring 12/21/2011 | 21,850 | 24,747 | 24,914 | 167 | |
| Swiss Franc, | | | | | |
| Expiring 12/21/2011 | 124,800 | 139,889 | 142,301 | 2,412 | |
| Swiss Franc, | | | | | |
| Expiring 12/21/2011 | 291,200 | 325,384 | 332,036 | 6,652 | |
| Swiss Franc, | | | | | |
| Expiring 12/21/2011 | 363,520 | 402,488 | 414,498 | 12,010 | |
| Sales: | | Proceeds ($) | | | |
| Australian Dollar, | | | | | |
| Expiring 12/21/2011 | 1,181,000 | 1,203,711 | 1,236,820 | (33,109 | ) |
| Australian Dollar, | | | | | |
| Expiring 12/21/2011 | 1,207,318 | 1,220,501 | 1,264,381 | (43,880 | ) |
| Australian Dollar, | | | | | |
| Expiring 12/21/2011 | 1,082,446 | 1,105,447 | 1,133,607 | (28,160 | ) |
| Australian Dollar, | | | | | |
| Expiring 12/21/2011 | 95,450 | 97,921 | 99,961 | (2,040 | ) |
| Australian Dollar, | | | | | |
| Expiring 12/21/2011 | 236,550 | 242,345 | 247,730 | (5,385 | ) |
| Australian Dollar, | | | | | |
| Expiring 12/21/2011 | 132,300 | 123,821 | 138,553 | (14,732 | ) |
| Australian Dollar, | | | | | |
| Expiring 12/21/2011 | 227,850 | 213,274 | 238,619 | (25,345 | ) |
The Fund 41
NOTES TO FINANCIAL STATEMENTS (continued)
| | | | | |
| | Foreign | | | Unrealized | |
| Forward Foreign Currency | Currency | | | Appreciation | |
| Exchange Contracts | Amounts | Proceeds ($) | Value ($) (Depreciation) ($) | |
| Sales (continued): | | | | | |
| Australian Dollar, | | | | | |
| Expiring 12/21/2011 | 374,850 | 350,604 | 392,567 | (41,963 | ) |
| Australian Dollar, | | | | | |
| Expiring 12/21/2011 | 279,000 | 283,190 | 292,186 | (8,996 | ) |
| British Pound, | | | | | |
| Expiring 12/21/2011 | 347,320 | 548,474 | 558,149 | (9,675 | ) |
| British Pound, | | | | | |
| Expiring 12/21/2011 | 268,870 | 424,287 | 432,079 | (7,792 | ) |
| British Pound, | | | | | |
| Expiring 12/21/2011 | 666,330 | 1,051,122 | 1,070,803 | (19,681 | ) |
| British Pound, | | | | | |
| Expiring 12/21/2011 | 188,000 | 293,177 | 302,119 | (8,942 | ) |
| British Pound, | | | | | |
| Expiring 12/21/2011 | 894,400 | 1,373,513 | 1,437,315 | (63,802 | ) |
| British Pound, | | | | | |
| Expiring 12/21/2011 | 52,200 | 81,243 | 83,886 | (2,643 | ) |
| British Pound, | | | | | |
| Expiring 12/21/2011 | 694,400 | 1,084,194 | 1,115,912 | (31,718 | ) |
| British Pound, | | | | | |
| Expiring 12/21/2011 | 297,600 | 466,805 | 478,248 | (11,443 | ) |
| British Pound, | | | | | |
| Expiring 12/21/2011 | 338,580 | 529,592 | 544,104 | (14,512 | ) |
| British Pound, | | | | | |
| Expiring 12/21/2011 | 497,420 | 775,428 | 799,362 | (23,934 | ) |
| British Pound, | | | | | |
| Expiring 12/21/2011 | 130,560 | 203,343 | 209,812 | (6,469 | ) |
| British Pound, | | | | | |
| Expiring 12/21/2011 | 130,000 | 203,585 | 208,912 | (5,327 | ) |
| British Pound, | | | | | |
| Expiring 12/21/2011 | 455,000 | 712,540 | 731,193 | (18,653 | ) |
| British Pound, | | | | | |
| Expiring 12/21/2011 | 1,140,000 | 1,776,177 | 1,831,999 | (55,822 | ) |
| British Pound, | | | | | |
| Expiring 12/21/2011 | 1,091,000 | 1,718,815 | 1,753,255 | (34,440 | ) |
| British Pound, | | | | | |
| Expiring 12/21/2011 | 187,000 | 293,489 | 300,512 | (7,023 | ) |
| British Pound, | | | | | |
| Expiring 12/21/2011 | 94,350 | 149,114 | 151,622 | (2,508 | ) |
| British Pound, | | | | | |
| Expiring 12/21/2011 | 16,650 | 26,312 | 26,757 | (445 | ) |
| British Pound, | | | | | |
| Expiring 12/21/2011 | 502,660 | 810,132 | 807,783 | 2,349 | |
| British Pound, | | | | | |
| Expiring 12/21/2011 | 110,340 | 177,802 | 177,318 | 484 | |
42
| | | | | |
| | Foreign | | | Unrealized | |
| Forward Foreign Currency | Currency | | | Appreciation | |
| Exchange Contracts | Amounts | Proceeds ($) | Value ($) (Depreciation) ($) | |
| Sales (continued): | | | | | |
| Canadian Dollar | | | | | |
| Expiring 12/21/2011 | 325,415 | 327,603 | 326,080 | 1,523 | |
| Canadian Dollar | | | | | |
| Expiring 12/21/2011 | 288,600 | 290,091 | 289,189 | 902 | |
| Canadian Dollar | | | | | |
| Expiring 12/21/2011 | 192,400 | 193,542 | 192,793 | 749 | |
| Canadian Dollar | | | | | |
| Expiring 12/21/2011 | 2,091,000 | 2,024,058 | 2,095,270 | (71,212 | ) |
| Canadian Dollar | | | | | |
| Expiring 12/21/2011 | 1,271,500 | 1,236,302 | 1,274,096 | (37,794 | ) |
| Canadian Dollar | | | | | |
| Expiring 12/21/2011 | 1,271,500 | 1,230,595 | 1,274,097 | (43,502 | ) |
| Canadian Dollar | | | | | |
| Expiring 12/21/2011 | 511,910 | 491,644 | 512,955 | (21,311 | ) |
| Canadian Dollar | | | | | |
| Expiring 12/21/2011 | 193,860 | 184,573 | 194,255 | (9,682 | ) |
| Canadian Dollar | | | | | |
| Expiring 12/21/2011 | 116,675 | 111,230 | 116,913 | (5,683 | ) |
| Canadian Dollar | | | | | |
| Expiring 12/21/2011 | 48,465 | 46,027 | 48,564 | (2,537 | ) |
| Canadian Dollar | | | | | |
| Expiring 12/21/2011 | 185,640 | 174,465 | 186,019 | (11,554 | ) |
| Canadian Dollar | | | | | |
| Expiring 12/21/2011 | 42,800 | 40,540 | 42,887 | (2,347 | ) |
| Canadian Dollar | | | | | |
| Expiring 12/21/2011 | 385,200 | 364,641 | 385,986 | (21,345 | ) |
| Canadian Dollar | | | | | |
| Expiring 12/21/2011 | 112,840 | 106,149 | 113,070 | (6,921 | ) |
| Canadian Dollar | | | | | |
| Expiring 12/21/2011 | 65,520 | 61,658 | 65,653 | (3,995 | ) |
| Canadian Dollar | | | | | |
| Expiring 12/21/2011 | 423,300 | 416,687 | 424,164 | (7,477 | ) |
| Canadian Dollar | | | | | |
| Expiring 12/21/2011 | 74,700 | 73,625 | 74,852 | (1,227 | ) |
| Canadian Dollar | | | | | |
| Expiring 12/21/2011 | 240,000 | 235,546 | 240,490 | (4,944 | ) |
| Euro, | | | | | |
| Expiring 12/21/2011 | 1,466,108 | 2,011,427 | 2,027,809 | (16,382 | ) |
| Euro, | | | | | |
| Expiring 12/21/2011 | 3,529,146 | 4,834,259 | 4,881,246 | (46,987 | ) |
| Euro, | | | | | |
| Expiring 12/21/2011 | 349,200 | 478,474 | 482,987 | (4,513 | ) |
| Euro, | | | | | |
| Expiring 12/21/2011 | 523,800 | 715,521 | 724,480 | (8,959 | ) |
The Fund 43
NOTES TO FINANCIAL STATEMENTS (continued)
| | | | | |
| | Foreign | | | Unrealized | |
| Forward Foreign Currency | Currency | | | Appreciation | |
| Exchange Contracts | Amounts | Proceeds ($) | Value ($) (Depreciation) ($) | |
| Sales (continued): | | | | | |
| Euro, | | | | | |
| Expiring 12/21/2011 | 828,000 | 1,132,911 | 1,145,227 | (12,316 | ) |
| Euro, | | | | | |
| Expiring 12/21/2011 | 1,020,000 | 1,371,255 | 1,410,786 | (39,531 | ) |
| Euro, | | | | | |
| Expiring 12/21/2011 | 854,840 | 1,149,007 | 1,182,349 | (33,342 | ) |
| Euro, | | | | | |
| Expiring 12/21/2011 | 144,300 | 191,308 | 199,584 | (8,276 | ) |
| Euro, | | | | | |
| Expiring 12/21/2011 | 59,940 | 79,359 | 82,904 | (3,545 | ) |
| Euro, | | | | | |
| Expiring 12/21/2011 | 239,760 | 318,151 | 331,617 | (13,466 | ) |
| Euro, | | | | | |
| Expiring 12/21/2011 | 36,300 | 50,298 | 50,207 | 91 | |
| Euro, | | | | | |
| Expiring 12/21/2011 | 205,700 | 284,863 | 284,508 | 355 | |
| Euro, | | | | | |
| Expiring 12/21/2011 | 656,000 | 902,308 | 907,329 | (5,021 | ) |
| Euro, | | | | | |
| Expiring 12/21/2011 | 545,000 | 747,854 | 753,802 | (5,948 | ) |
| Euro, | | | | | |
| Expiring 12/21/2011 | 204,000 | 289,529 | 282,157 | 7,372 | |
| Japanese Yen, | | | | | |
| Expiring 12/21/2011 | 11,330,000 | 148,414 | 145,072 | 3,342 | |
| Japanese Yen, | | | | | |
| Expiring 12/21/2011 | 106,678,000 | 1,398,716 | 1,365,936 | 32,780 | |
| Japanese Yen, | | | | | |
| Expiring 12/21/2011 | 112,576,500 | 1,475,635 | 1,441,462 | 34,173 | |
| Japanese Yen, | | | | | |
| Expiring 12/21/2011 | 112,576,500 | 1,468,019 | 1,441,462 | 26,557 | |
| Japanese Yen, | | | | | |
| Expiring 12/21/2011 | 8,351,910 | 109,118 | 106,940 | 2,178 | |
| Japanese Yen, | | | | | |
| Expiring 12/21/2011 | 20,106,450 | 262,446 | 257,448 | 4,998 | |
| Japanese Yen, | | | | | |
| Expiring 12/21/2011 | 33,407,640 | 436,330 | 427,761 | 8,569 | |
| Japanese Yen, | | | | | |
| Expiring 12/21/2011 | 34,005,270 | 443,762 | 435,413 | 8,349 | |
| Japanese Yen, | | | | | |
| Expiring 12/21/2011 | 41,828,400 | 546,184 | 535,583 | 10,601 | |
| Japanese Yen, | | | | | |
| Expiring 12/21/2011 | 4,647,600 | 60,668 | 59,509 | 1,159 | |
| Japanese Yen, | | | | | |
| Expiring 12/21/2011 | 20,669,870 | 269,258 | 264,663 | 4,595 | |
44
| | | | | |
| | Foreign | | | Unrealized | |
| Forward Foreign Currency | Currency | | | Appreciation | |
| Exchange Contracts | Amounts | Proceeds ($) | Value ($) (Depreciation) ($) | |
| Sales (continued): | | | | | |
| Japanese Yen, | | | | | |
| Expiring 12/21/2011 | 12,001,860 | 156,355 | 153,675 | 2,680 | |
| New Zealand Dollar, | | | | | |
| Expiring 12/21/2011 | 354,245 | 289,761 | 285,441 | 4,320 | |
| New Zealand Dollar, | | | | | |
| Expiring 12/21/2011 | 586,530 | 482,855 | 472,611 | 10,244 | |
| New Zealand Dollar, | | | | | |
| Expiring 12/21/2011 | 236,670 | 195,214 | 190,703 | 4,511 | |
| New Zealand Dollar, | | | | | |
| Expiring 12/21/2011 | 436,400 | 357,544 | 351,640 | 5,904 | |
| New Zealand Dollar, | | | | | |
| Expiring 12/21/2011 | 654,600 | 534,867 | 527,460 | 7,407 | |
| New Zealand Dollar, | | | | | |
| Expiring 12/21/2011 | 599,500 | 461,746 | 483,061 | (21,315 | ) |
| New Zealand Dollar, | | | | | |
| Expiring 12/21/2011 | 599,500 | 464,558 | 483,061 | (18,503 | ) |
| New Zealand Dollar, | | | | | |
| Expiring 12/21/2011 | 312,300 | 246,163 | 251,643 | (5,480 | ) |
| New Zealand Dollar, | | | | | |
| Expiring 12/21/2011 | 728,700 | 571,934 | 587,167 | (15,233 | ) |
| New Zealand Dollar, | | | | | |
| Expiring 12/21/2011 | 120,960 | 91,289 | 97,466 | (6,177 | ) |
| New Zealand Dollar, | | | | | |
| Expiring 12/21/2011 | 72,800 | 55,041 | 58,660 | (3,619 | ) |
| New Zealand Dollar, | | | | | |
| Expiring 12/21/2011 | 30,240 | 22,661 | 24,366 | (1,705 | ) |
| New Zealand Dollar, | | | | | |
| Expiring 12/21/2011 | 498,400 | 380,239 | 401,598 | (21,359 | ) |
| New Zealand Dollar, | | | | | |
| Expiring 12/21/2011 | 124,600 | 95,024 | 100,399 | (5,375 | ) |
| New Zealand Dollar, | | | | | |
| Expiring 12/21/2011 | 491,130 | 377,305 | 395,740 | (18,435 | ) |
| New Zealand Dollar, | | | | | |
| Expiring 12/21/2011 | 40,600 | 31,946 | 32,714 | (768 | ) |
| New Zealand Dollar, | | | | | |
| Expiring 12/21/2011 | 77,140 | 60,691 | 62,157 | (1,466 | ) |
| New Zealand Dollar, | | | | | |
| Expiring 12/21/2011 | 44,660 | 35,081 | 35,986 | (905 | ) |
| New Zealand Dollar, | | | | | |
| Expiring 12/21/2011 | 40,600 | 32,091 | 32,714 | (623 | ) |
| Norwegian Krone, | | | | | |
| Expiring 12/21/2011 | 15,074,275 | 2,644,377 | 2,699,693 | (55,316 | ) |
| Norwegian Krone, | | | | | |
| Expiring 12/21/2011 | 2,203,200 | 383,566 | 394,577 | (11,011 | ) |
The Fund 45
NOTES TO FINANCIAL STATEMENTS (continued)
| | | | | |
| | Foreign | | | Unrealized | |
| Forward Foreign Currency | Currency | | | Appreciation | |
| Exchange Contracts | Amounts | Proceeds ($) | Value ($) (Depreciation) ($) | |
| Sales (continued): | | | | | |
| Norwegian Krone, | | | | | |
| Expiring 12/21/2011 | 5,140,800 | 889,334 | 920,680 | (31,346 | ) |
| Norwegian Krone, | | | | | |
| Expiring 12/21/2011 | 549,400 | 97,058 | 98,393 | (1,335 | ) |
| Norwegian Krone, | | | | | |
| Expiring 12/21/2011 | 604,340 | 106,867 | 108,232 | (1,365 | ) |
| Norwegian Krone, | | | | | |
| Expiring 12/21/2011 | 1,043,860 | 184,915 | 186,947 | (2,032 | ) |
| Norwegian Krone, | | | | | |
| Expiring 12/21/2011 | 549,400 | 97,395 | 98,393 | (998 | ) |
| Norwegian Krone, | | | | | |
| Expiring 12/21/2011 | 1,051,240 | 193,294 | 188,269 | 5,025 | |
| Norwegian Krone, | | | | | |
| Expiring 12/21/2011 | 230,760 | 42,385 | 41,327 | 1,058 | |
| Swedish Krona, | | | | | |
| Expiring 12/21/2011 | 3,550,500 | 515,888 | 543,261 | (27,373 | ) |
| Swedish Krona, | | | | | |
| Expiring 12/21/2011 | 3,550,500 | 510,489 | 543,261 | (32,772 | ) |
| Swedish Krona, | | | | | |
| Expiring 12/21/2011 | 6,103,000 | 909,308 | 933,818 | (24,510 | ) |
| Swedish Krona, | | | | | |
| Expiring 12/21/2011 | 650,400 | 98,259 | 99,517 | (1,258 | ) |
| Swedish Krona, | | | | | |
| Expiring 12/21/2011 | 3,685,600 | 557,705 | 563,932 | (6,227 | ) |
| Swedish Krona, | | | | | |
| Expiring 12/21/2011 | 3,754,780 | 588,197 | 574,518 | 13,679 | |
| Swedish Krona, | | | | | |
| Expiring 12/21/2011 | 824,220 | 128,915 | 126,113 | 2,802 | |
| Swiss Franc, | | | | | |
| Expiring 12/21/2011 | 98,016 | 113,002 | 111,761 | 1,241 | |
| Swiss Franc, | | | | | |
| Expiring 12/21/2011 | 35,420 | 40,572 | 40,387 | 185 | |
| Swiss Franc, | | | | | |
| Expiring 12/21/2011 | 87,780 | 100,410 | 100,089 | 321 | |
| Swiss Franc, | | | | | |
| Expiring 12/21/2011 | 52,500 | 58,124 | 59,862 | (1,738 | ) |
| Swiss Franc, | | | | | |
| Expiring 12/21/2011 | 52,500 | 58,059 | 59,862 | (1,803 | ) |
| Swiss Franc, | | | | | |
| Expiring 12/21/2011 | 158,100 | 171,765 | 180,271 | (8,506 | ) |
46
| | | | | |
| | Foreign | | | Unrealized | |
| Forward Foreign Currency | Currency | | | Appreciation | |
| Exchange Contracts | Amounts | Proceeds ($) | Value ($) (Depreciation) ($) | |
| Sales (continued): | | | | | |
| Swiss Franc, | | | | | |
| Expiring 12/21/2011 | 251,000 | 277,974 | 286,199 | (8,225 | ) |
| Swiss Franc, | | | | | |
| Expiring 12/21/2011 | 212,500 | 238,002 | 242,300 | (4,298 | ) |
| Swiss Franc, | | | | | |
| Expiring 12/21/2011 | 37,500 | 42,009 | 42,758 | (749 | ) |
| Swiss Franc, | | | | | |
| Expiring 12/21/2011 | 69,540 | 77,429 | 79,292 | (1,863 | ) |
| Swiss Franc, | | | | | |
| Expiring 12/21/2011 | 36,600 | 40,744 | 41,732 | (988 | ) |
| Swiss Franc, | | | | | |
| Expiring 12/21/2011 | 40,260 | 44,820 | 45,905 | (1,085 | ) |
| Swiss Franc, | | | | | |
| Expiring 12/21/2011 | 36,600 | 40,868 | 41,732 | (864 | ) |
| Gross Unrealized | | | | | |
| Appreciation | | | | 1,506,015 | |
| Gross Unrealized | | | | | |
| Depreciation | | | | (1,685,939 | ) |
The following summarizes the average market value of derivatives outstanding during the period ended October 31, 2011:
| |
| | Average Market Value ($) |
| Equity futures contracts | 9,636,901 |
| Interest rate futures contracts | 17,740,725 |
| Equity options contracts | 8,905 |
| Interest rate options contracts | 1,181,066 |
| Forward contracts | 49,991,473 |
At October 31, 2011, the cost of investments for federal income tax purposes was $24,636,147; accordingly, accumulated net unrealized depreciation on investments was $14,312, consisting of $4,365 gross unrealized appreciation and $18,677 gross unrealized depreciation.
The Fund 47
REPORT OF INDEPENDENT REGISTERED
PUBLIC ACCOUNTING FIRM
Shareholders and Board of Directors
Dreyfus Global Absolute Return Fund
We have audited the accompanying statement of assets and liabilities, including the statements of investments, financial futures and options written, of Dreyfus Global Absolute Return Fund (one of the series comprising Advantage Funds, Inc.) as of October 31, 2011, and the related statement of operations for the year then ended, the statement of changes in net assets for each of the two years in the period then ended and financial highlights for each of the periods indicated therein.These financial statements and financial highlights are the responsibility of the Fund’s management. Our responsibility is to express an opinion on these financial statements and financial highlights based on our audits.
We conducted our audits in accordance with the standards of the Public Company Accounting Oversight Board (United States).Those standards require that we plan and perform the audit to obtain reasonable assurance about whether the financial statements and financial highlights are free of material misstatement.We were not engaged to perform an audit of the Fund’s internal control over financial reporting. Our audits included consideration of internal control over financial reporting as a basis for designing audit procedures that are appropriate in the circumstances, but not for the purpose of expressing an opinion on the effectiveness of the Fund’s internal control over financial reporting. Accordingly, we express no such opinion.An audit also includes examining, on a test basis, evidence supporting the amounts and disclosures in the financial statements and financial highlights, assessing the accounting principles used and significant estimates made by management, and evaluating the overall financial statement presentation. Our procedures included confirmation of securities owned as of October 31, 2011 by correspondence with the custodian and others.We believe that our audits provide a reasonable basis for our opinion.
In our opinion, the financial statements and financial highlights referred to above present fairly, in all material respects, the financial position of Dreyfus Global Absolute Return Fund at October 31, 2011, the results of its operations for the year then ended, the changes in its net assets for each of the two years in the period then ended and the financial highlights for each of the indicated periods, in conformity with U.S. generally accepted accounting principles.

New York, New York
December 29, 2011
48
IMPORTANT TAX INFORMATION (Unaudited)
For federal tax purposes the fund hereby designates 71.97% of ordinary income dividends paid during the fiscal year ended October 31, 2011 as qualifying “interest related dividends.” Also for state individual income tax purposes, the fund hereby designates 72.95% of the ordinary income dividends paid during its fiscal year ended October 31, 2011 as attributable to interest income from direct obligations of the United States. Such dividends are currently exempt from taxation for individual income tax purposes in most states, including New York, California and the District of Columbia. Also, the fund hereby designates $.0809 per share as a short-term capital gain distribution paid and also designates $.6437 per share as a long-term capital gain distribution paid on December 27, 2010.
The Fund 49
BOARD MEMBERS INFORMATION (Unaudited)
|
| Joseph S. DiMartino (68) |
| Chairman of the Board (1995) |
| Principal Occupation During Past 5Years: |
| • Corporate Director and Trustee |
| Other Public Company Board Memberships During Past 5Years: |
| • CBIZ (formerly, Century Business Services, Inc.), a provider of outsourcing functions for small |
| and medium size companies, Director (1997-present) |
| • Sunair Services Corporation, a provider of certain outdoor-related services to homes and |
| businesses, Director (2005-2009) |
| • The Newark Group, a provider of a national market of paper recovery facilities, paperboard |
| mills and paperboard converting plants, Director (2000-2010) |
| No. of Portfolios for which Board Member Serves: 167 |
| ——————— |
| Peggy C. Davis (68) |
| Board Member (2006) |
| Principal Occupation During Past 5Years: |
| • Shad Professor of Law, New York University School of Law |
| • Writer and teacher in the fields of evidence, constitutional theory, family law, social sciences |
| and the law, legal process and professional methodology and training |
| No. of Portfolios for which Board Member Serves: 53 |
| ——————— |
| David P. Feldman (71) |
| Board Member (1996) |
| Principal Occupation During Past 5Years: |
| • Corporate Director and Trustee |
| Other Public Company Board Memberships During Past 5Years: |
| • BBH Mutual Funds Group (4 registered mutual funds), Director (1992-present) |
| • QMed, Inc. a healthcare company, Director (1999-2007) |
| No. of Portfolios for which Board Member Serves: 50 |
50
|
| Ehud Houminer (71) |
| Board Member (1993) |
| Principal Occupation During Past 5Years: |
| • Executive-in-Residence at the Columbia Business School, ColumbiaUniversity (1992-present) |
| Other Public Company Board Memberships During Past 5Years: |
| • Avnet Inc., an electronics distributor, Director (1993-present) |
| No. of Portfolios for which Board Member Serves: 64 |
| ——————— |
| Dr. Martin Peretz (72) |
| Board Member (2006) |
| Principal Occupation During Past 5Years: |
| • Editor-in-Chief Emeritus of The New Republic Magazine (2010-present) (previously, |
| Editor-in-Chief, 1974-2010) |
| • Director of TheStreet.com, a financial information service on the web (1996-present) |
| No. of Portfolios for which Board Member Serves: 35 |
| ——————— |
| Once elected all Board Members serve for an indefinite term, but achieve Emeritus status upon reaching age 80.The |
| address of the Board Members and Officers is in c/o The Dreyfus Corporation, 200 Park Avenue, NewYork, NewYork |
| 10166.Additional information about the Board Members is available in the fund’s Statement of Additional Information |
| which can be obtained from Dreyfus free of charge by calling this toll free number: 1-800-DREYFUS. |
| James F. Henry, Emeritus Board Member |
| Dr. Paul A. Marks, Emeritus Board Member |
| Gloria Messinger, Emeritus Board Member |
The Fund 51
OFFICERS OF THE FUND (Unaudited)

52
The Fund 53
OFFICERS OF THE FUND (Unaudited) (continued)

54
|
| Dreyfus |
| Global Dynamic |
| Bond Fund |
ANNUAL REPORT October 31, 2011

Save time. Save paper. View your next shareholder report online as soon as it’s available. Log into www.dreyfus.com and sign up for Dreyfus eCommunications. It’s simple and only takes a few minutes.
The views expressed in this report reflect those of the portfolio manager only through the end of the period covered and do not necessarily represent the views of Dreyfus or any other person in the Dreyfus organization. Any such views are subject to change at any time based upon market or other conditions and Dreyfus disclaims any responsibility to update such views.These views may not be relied on as investment advice and, because investment decisions for a Dreyfus fund are based on numerous factors, may not be relied on as an indication of trading intent on behalf of any Dreyfus fund.

| | Contents |
| | THE FUND |
| 2 | A Letter from the Chairman and CEO |
| 3 | Discussion of Fund Performance |
| 6 | Fund Performance |
| 8 | Understanding Your Fund’s Expenses |
| 8 | Comparing Your Fund’s Expenses With Those of Other Funds |
| 9 | Statement of Investments |
| 16 | Statement of Assets and Liabilities |
| 17 | Statement of Operations |
| 18 | Statement of Changes in Net Assets |
| 20 | Financial Highlights |
| 21 | Notes to Financial Statements |
| 40 | Report of Independent Registered Public Accounting Firm |
| 41 | Board Members Information |
| 43 | Officers of the Fund |
| | FOR MORE INFORMATION |
| | Back Cover |
|
| Dreyfus |
| Global Dynamic |
| Bond Fund |
The Fund

A LETTER FROM THE CHAIRMAN AND CEO
Dear Shareholder:
We are pleased to present this report for Dreyfus Global Dynamic Bond Fund, covering from the fund’s inception on March 25, 2011, through October 31, 2011. For information about how the fund performed during the reporting period, as well as general market perspectives, we provide a Discussion of Fund Performance on the pages that follow.
Investors were encouraged by expectations of a more robust economic recovery during the final months of 2010, but sentiment deteriorated sharply in 2011 due to disappointing global economic data, rising commodity prices, an escalating sovereign debt crisis in Europe and a contentious debate regarding taxes, spending and borrowing in the United States. International bond markets proved sensitive to these macroeconomic developments, as increasingly risk-averse investors flocked to traditional “safe havens,” such as U.S.Treasury securities and other high-quality developed nation sovereign debt. In contrast, bonds in emerging markets generally suffered, seemingly regardless of underlying credit fundamentals.
The economic outlook currently remains clouded by market turbulence and political infighting, but we believe that a continued subpar global expansion is more likely than a return to recession. Although Europe continues to struggle with a debt crisis, inflationary pressures appear to be waning in most countries as energy prices recently have retreated from their highs. In the United States, moderately low core inflation and an accommodative monetary policy could help support near-trend growth despite ongoing deleveraging activity in the private sector, potentially supporting a renewed rally among corporate-backed bonds.To assess the impact of these and other developments on your investments, we encourage you, as always, to speak with your financial advisor.
Thank you for your continued confidence and support.

Jonathan R. Baum
Chairman and Chief Executive Officer
The Dreyfus Corporation
November 15, 2011
2

DISCUSSION OF FUND PERFORMANCE
For the period from the fund’s inception on March 25, 2011, through October 31, 2011, as provided by Paul Brain, Howard Cunningham and Jonathan Day, Portfolio Managers of Newton Capital Management Limited, Sub-Investment Adviser
Fund and Market Performance Overview
For the period between the fund’s inception on March 25, 2011, and the end of its fiscal year on October 31, 2011, Dreyfus Global Dynamic Bond Fund’s Class A shares produced a total return of 0.89%, Class C shares returned 0.38% and Class I shares returned 1.03%.1 In comparison, the fund’s performance baseline benchmark, the U.S. $ 1-Month London Interbank Offered Rate (LIBOR), and its broad-based securities market index, the Citibank 30-Day Treasury Bill Index, produced total returns of 0.13% and 0.03%, respectively, from March 31, 2011, through October 31, 2011.2,3
Higher yielding bonds generally rallied into the first quarter of 2011 as a global economic recovery gained traction, but renewed macroeconomic concerns later caused more volatile assets to give back their previous gains while some sovereign bonds gained value.The fund generally produced a positive return in absolute terms, and a superior performance versus the baseline and broad-based benchmarks, primarily due to an emphasis on traditional safe havens among sovereign bonds.
The Fund’s Investment Approach
The fund seeks total return consisting of income and capital appreciation. To pursue its goal, the fund normally invests at least 80% of its net assets, plus any borrowings for investment purposes, in bonds and other instruments that provide investment exposure to global bond markets, including developed and emerging capital markets. We employ a dynamic, unconstrained approach in allocating the fund’s assets among government bonds, emerging market sovereign debt, investment grade and high yield corporate instruments and currencies. We combine a top-down approach, emphasizing global economic trends and current investment themes, with bottom-up security selection based on fundamental research to allocate the fund’s investments. In choosing investments, we consider key trends in global economic variables; investment themes; relative valuations of debt securities and cash; long-term trends in currency movements; and company fundamentals.
The Fund 3
DISCUSSION OF FUND PERFORMANCE (continued)
Shifting Sentiment Sparked Heightened Market Volatility
An economic recovery in most global markets had supported corporate and emerging market government bonds through much of the first half of 2011, while ‘core’ sovereign bonds generally declined in value. However, investor sentiment began to deteriorate in May when Greece appeared headed for default and pressures mounted on the banking systems of other European nations. In addition, U.S. economic data proved more disappointing than expected, and China imposed tighter monetary policies in an effort to fight inflationary pressures.
Consequently, newly risk-averse investors shifted their focus from relatively speculative markets and assets to sovereign bonds from nations that historically have been considered safe havens during uncertain economic conditions.The flight to quality also lifted currencies in traditional safe havens, including the U.S. dollar and Japanese yen, while many European and emerging-market currencies struggled. Market volatility was particularly severe in August and September, amid investors’ fears of deteriorating global growth, and the absence of a resolution to the euro-zone’s debt crisis.The resulting flight to quality benefited U.S.Treasury securities ironically after a major credit-rating agency downgraded its assessment of long-term U.S. government securities. In October, riskier securities rebounded strongly and sovereign bonds moderated when some macroeconomic worries seemed to ease.
Cautious Approach in a Turbulent Market Environment
The rally among sub-investment grade securities supported the fund’s performance in the weeks after its launch, as did underweighted exposure to the U.S. dollar in favor of those currencies of faster-growing nations, including the Mexican peso, Swedish krona and South Korean won.Yet, we recognized the risks developing in the global economy, and we maintained a higher-than-usual cash position and generally light exposure to riskier debt securities.
As the debt crisis in Europe intensified, we reduced the fund’s holdings of high yield corporate bonds and established a more defensive investment posture through sovereign bonds from traditional safe haven issuers, such as German Bunds, U.S. Treasuries and U.K. Gilts. These positions fared well as the likelihood of rising interest rates waned.We also shifted our focus in currency markets, reducing exposure to commodity-linked currencies, such as the Mexican peso, and increasing the fund’s position in the strengthening Japanese yen.We also increased the fund’s exposure to the U.S. dollar, reduced its positions in the Canadian dollar and Norwegian krone, and maintained a short position in the euro.We employed futures contracts to manage the risk of interest-rate rises earlier in the reporting period, but these were sold as the macro economic outlook deteriorated.
4
We locked in profits in certain sovereign bonds in October as economic fears moderated, redeploying those assets to investment grade corporate bonds and emerging-market sovereign securities that had reached more attractive valuations.
Staying Defensive in Uncertain Markets
As of the reporting period’s end, the fund generally remained defensively positioned with an emphasis on sovereign bonds in the United States, United Kingdom and the core of Europe.We also held bonds in markets where we expect interest rates to fall, such as Norway, New Zealand, Canada and certain emerging markets. Corporate bond positions focused primarily on non-financial companies with strong balance sheets and attractive bond yields relative to government securities. In our judgment, these are prudent strategies until market volatility subsides and the global economy’s direction becomes clearer.
November 15, 2011
| |
| | Bond funds are subject generally to interest rate, credit, liquidity and market risks, to varying degrees, |
| | all of which are more fully described in the fund’s prospectus. Generally, all other factors being equal, |
| | bond prices are inversely related to interest-rate changes, and rate increases can cause price declines. |
| | High yield bonds are subject to increased credit risk and are considered speculative in terms of the |
| | issuer’s perceived ability to continue making interest payments on a timely basis and to repay |
| | principal upon maturity. |
| | Foreign bonds are subject to special risks including exposure to currency fluctuations, changing |
| | political and economic conditions and potentially less liquidity. |
| | Investments in foreign currencies are subject to the risk that those currencies will decline in value |
| | relative to the U.S. dollar, or, in the case of hedged positions, that the U.S. dollar will decline |
| | relative to the currency being hedged. Currency rates in foreign countries may fluctuate significantly |
| | over short periods of time.A decline in the value of foreign currencies relative to the U.S. dollar |
| | will reduce the value of securities held by the fund and denominated in those currencies. The use |
| | of leverage may magnify the fund’s gains or losses. For derivatives with a leveraging component, |
| | adverse changes in the value or level of the underlying asset can result in a loss that is much |
| | greater than the original investment in the derivative. |
| 1 | Total return includes reinvestment of dividends and any capital gains paid and does not take into |
| | consideration the maximum initial sales charge in the case of Class A shares or the applicable |
| | contingent deferred sales charge imposed on redemptions in the case of Class C shares. Had these |
| | charges been reflected, returns would have been lower. Class I shares are not subject to any initial |
| | or deferred sales charge. Past performance is no guarantee of future results. Share price and |
| | investment return fluctuate such that upon redemption, fund shares may be worth more or less |
| | than their original cost. Return figures for Class A, Class C and Class I shares reflect the |
| | absorption of certain fund expenses by The Dreyfus Corporation pursuant to an agreement in |
| | effect through March 1, 2013, at which time it may be extended, terminated or modified. Had |
| | these expenses not been absorbed, the returns for Class A, C and I shares would have been lower. |
| 2 | SOURCE: LIPPER INC. – Reflects reinvestment of dividends and, where applicable, capital |
| | gain distributions.The Citigroup 30-Day Treasury Bill Index is a market value-weighted index of |
| | public obligations of the U.S.Treasury with maturities of 30 days. Investors cannot invest directly |
| | in any index. For comparative purposes, the value of the Index as of 3/31/11 is used as the |
| | beginning value on 3/25/11. |
| 3 | SOURCE: BLOOMBERG – London Interbank Offered Rate (LIBOR).The rate of interest |
| | at which banks borrow funds, in marketable size, from other banks in the London interbank |
| | market. LIBOR is the most widely used benchmark or reference rate for short term interest rates, |
| | and is an international rate.The London Interbank Offered Rate is fixed each morning at 11 |
| | a.m. London time, by the British Bankers’ Association (BBA).The rate is an average derived |
| | from 16 quotations provided by banks determined by the British Bankers’ Association, the four |
| | highest and lowest are then eliminated and an average of the remaining eight is calculated to arrive |
| | at the fix, Eurodollar Libor is calculated on an ACT/360 day count basis and settlement is for |
| | two days hence. For comparative purposes, the value of the Index as of 3/31/11 is used as the |
| | beginning value on 3/25/11. |
The Fund 5
FUND PERFORMANCE
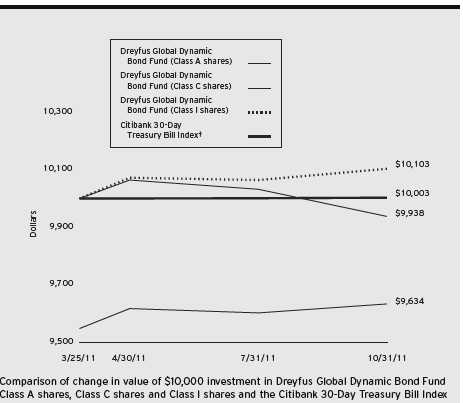
† Source: Bloomberg L.P.
Past performance is not predictive of future performance.
The above graph compares a $10,000 investment made in each of the Class A, Class C and Class I shares of Dreyfus Global Dynamic Bond Fund on 3/25/11 (inception date) to a $10,000 investment made in the Citibank 30-day Treasury Bill Index (the “Index”) on that date.All dividends and capital gain distributions are reinvested.
The fund’s performance shown in the line graph above takes into account the maximum initial sales charge on Class A shares, the applicable contingent deferred sales charge on Class C shares and all other applicable fees and expenses on all classes.The Index is a market value-weighted index of public obligations of the U.S.Treasury with maturities of 30 days. Unlike a mutual fund, the Index is not subject to charges, fees and other expenses. Investors cannot invest directly in any index.These factors can contribute to the Index potentially outperforming the fund. Further information relating to fund expenses, including expense reimbursements, if applicable, is contained in the Expense section of the prospectus and elsewhere in this report.
6
| | | |
| Actual Aggregate Total Returns as of 10/31/11 | | | |
| |
| | Inception | From | |
| | Date | Inception | |
| Class A shares | | | |
| with maximum sales charge (4.5%) | 3/25/11 | –3.66 | % |
| without sales charge | 3/25/11 | 0.89 | % |
| Class C shares | | | |
| with applicable redemption charge † | 3/25/11 | –0.62 | % |
| without redemption | 3/25/11 | 0.38 | % |
| Class I shares | 3/25/11 | 1.03 | % |
| Citibank 30-Day Treasury Bill Index | 3/31/11 | 0.03 | %†† |
Past performance is not predictive of future performance.The fund’s performance shown in the graph and table does not reflect the deduction of taxes that a shareholder would pay on fund distributions or the redemption of fund shares.
| |
| † | The maximum contingent deferred sales charge for Class C shares is 1% for shares redeemed within one year of the |
| | date of purchase. |
| †† | For comparative purposes, the value of the Index as of 3/31/11 is used as the beginning value on 3/25/11. |
The Fund 7
UNDERSTANDING YOUR FUND’S EXPENSES (Unaudited)
As a mutual fund investor, you pay ongoing expenses, such as management fees and other expenses. Using the information below, you can estimate how these expenses affect your investment and compare them with the expenses of other funds.You also may pay one-time transaction expenses, including sales charges (loads) and redemption fees, which are not shown in this section and would have resulted in higher total expenses. For more information, see your fund’s prospectus or talk to your financial adviser.
Review your fund’s expenses
The table below shows the expenses you would have paid on a $1,000 investment in Dreyfus Global Dynamic Bond Fund from May 1, 2011 to October 31, 2011. It also shows how much a $1,000 investment would be worth at the close of the period, assuming actual returns and expenses.
Expenses and Value of a $1,000 Investment
assuming actual returns for the six months ended October 31, 2011
| | | | | | |
| | | Class A | | Class C | | Class I |
| Expenses paid per $1,000† | | $5.55 | | $9.31 | | $4.29 |
| Ending value (after expenses) | | $1,001.70 | | $997.40 | | $1,003.10 |
COMPARING YOUR FUND’S EXPENSES
WITH THOSE OF OTHER FUNDS (Unaudited)
Using the SEC’s method to compare expenses
The Securities and Exchange Commission (SEC) has established guidelines to help investors assess fund expenses. Per these guidelines, the table below shows your fund’s expenses based on a $1,000 investment, assuming a hypothetical 5% annualized return. You can use this information to compare the ongoing expenses (but not transaction expenses or total cost) of investing in the fund with those of other funds.All mutual fund shareholder reports will provide this information to help you make this comparison. Please note that you cannot use this information to estimate your actual ending account balance and expenses paid during the period.
Expenses and Value of a $1,000 Investment
assuming a hypothetical 5% annualized return for the six months ended October 31, 2011
| | | | | | |
| | | Class A | | Class C | | Class I |
| Expenses paid per $1,000† | | $5.60 | | $9.40 | | $4.33 |
| Ending value (after expenses) | | $1,019.66 | | $1,015.88 | | $1,020.92 |
|
| † Expenses are equal to the fund’s annualized expense ratio of 1.10% for Class A, 1.85% for Class C and .85% |
| for Class I, multiplied by the average account value over the period, multiplied by 184/365 (to reflect the one-half |
| year period). |
8
STATEMENT OF INVESTMENTS
October 31, 2011
| | | | | | |
| | | Coupon | Maturity | Principal | |
| Bonds and Notes—85.5% | | Rate (%) | Date | Amount ($)a | Value ($) |
| Agricultural—3.0% | | | | | | |
| Altria Group, | | | | | | |
| Gtd. Notes | | 9.95 | 11/10/38 | 56,000 | | 85,340 |
| BAT International Finance, | | | | | | |
| Gtd. Notes | | 8.13 | 11/15/13 | 72,000 | | 81,221 |
| China Green Holdings, | | | | | | |
| Gtd. Bonds | CNY | 3.00 | 4/12/13 | 200,000 | | 16,498 |
| Imperial Tobacco Finance, | | | | | | |
| Gtd. Notes | GBP | 8.13 | 3/15/24 | 50,000 | | 102,730 |
| | | | | | | 285,789 |
| Auto Parts & Equipment—.7% | | | | | | |
| Conti-Gummi Finance, | | | | | | |
| Gtd. Bonds | EUR | 7.13 | 10/15/18 | 50,000 | | 69,358 |
| Banks—9.5% | | | | | | |
| Allied Irish Banks, | | | | | | |
| Gtd. Notes | EUR | 3.25 | 2/4/13 | 50,000 | | 61,424 |
| Bank Nederlandse Gemeenten, | | | | | | |
| Sr. Unscd. Notes | | 0.40 | 5/3/13 | 100,000 | b | 100,052 |
| Bank of England Euro Note, | | | | | | |
| Bonds | | 1.38 | 3/7/14 | 95,000 | | 96,508 |
| BNP Paribas | | | | | | |
| Jr. Sub. Bonds | GBP | 5.95 | 4/29/49 | 50,000 | b | 57,482 |
| Co-Operative Bank, | | | | | | |
| Sub. Notes | GBP | 5.75 | 12/2/24 | 50,000 | b | 59,105 |
| Duesseldorfer | | | | | | |
| Hypothekenbank, | | | | | | |
| Gtd. Bonds | EUR | 1.88 | 12/13/13 | 100,000 | | 139,559 |
| Intesa Sanpaolo, | | | | | | |
| Sub. Notes | GBP | 5.50 | 12/19/16 | 50,000 | b | 76,597 |
| Royal Bank of Scotland, | | | | | | |
| Sr. Unscd. Notes | AUD | 6.82 | 3/10/14 | 100,000 | b | 101,046 |
| Suncorp-Metway, | | | | | | |
| Gtd. Notes | GBP | 4.00 | 1/16/14 | 85,000 | | 145,418 |
| US Bank, | | | | | | |
| Sub. Notes | EUR | 4.38 | 2/28/17 | 50,000 | b | 64,688 |
| | | | | | | 901,879 |
| Building Materials—.6% | | | | | | |
| Cemex Finance, | | | | | | |
| Sr. Scd. Notes | EUR | 9.63 | 12/14/17 | 50,000 | | 57,769 |
The Fund 9
STATEMENT OF INVESTMENTS (continued)
| | | | | | |
| | | Coupon | Maturity | Principal | | |
| Bonds and Notes (continued) | Rate (%) | Date | Amount ($)a | Value ($) |
| Chemicals—.6% | | | | | | |
| Ineos Group Holdings, | | | | | | |
| Gtd. Notes | EUR | 7.88 | 2/15/16 | 50,000 | | 56,040 |
| Diversified Financial | | | | | | |
| Services—9.9% | | | | | | |
| Arsenal Securities, | | | | | | |
| Scd. Bonds, Ser. A1 | GBP | 5.14 | 9/1/29 | 42,195 | | 64,366 |
| Carlsberg Finance, | | | | | | |
| Gtd. Notes | GBP | 6.63 | 12/12/11 | 48,000 | | 77,559 |
| Experian Finance, | | | | | | |
| Gtd. Notes | GBP | 5.63 | 12/12/13 | 20,000 | | 34,275 |
| F&C Commercial | | | | | | |
| Property Finance, | | | | | | |
| Sr. Scd. Notes | GBP | 5.23 | 6/30/17 | 50,000 | b | 82,709 |
| Hutchison Ports Finance, | | | | | | |
| Gtd. Bonds | GBP | 6.75 | 12/7/15 | 30,000 | | 55,249 |
| ICAP Group Holdings, | | | | | | |
| Sr. Unscd. Notes | EUR | 7.50 | 7/28/14 | 50,000 | | 71,344 |
| John Lewis, | | | | | | |
| Sr. Unscd. Bonds | GBP | 6.13 | 1/21/25 | 50,000 | | 84,591 |
| John Lewis, | | | | | | |
| Sr. Notes | GBP | 6.38 | 1/30/12 | 60,000 | | 97,499 |
| Juneau Investments, | | | | | | |
| Sr. Scd. Notes | GBP | 5.90 | 2/22/21 | 30,000 | | 42,148 |
| Reed Elsevier Investments, | | | | | | |
| Gtd | GBP | 7.00 | 12/11/17 | 50,000 | | 95,298 |
| Sceptre Funding No. 1, | | | | | | |
| Sr. Scd. Bonds | GBP | 5.25 | 2/9/27 | 47,798 | | 83,707 |
| SLM Student Loans, | | | | | | |
| Asset-Backed Notes | GBP | 5.15 | 12/15/39 | 100,000 | | 152,282 |
| | | | | | | 941,027 |
| Electric Utilities—1.6% | | | | | | |
| EDF, | | | | | | |
| Sr. Unscd. Notes | | 4.60 | 1/27/20 | 70,000 | | 74,689 |
| SSE, | | | | | | |
| Sub. Notes | GBP | 5.45 | 10/29/49 | 50,000 | b | 78,787 |
| | | | | | | 153,476 |
10
| | | | | | |
| | | Coupon | Maturity | Principal | |
| Bonds and Notes (continued) | Rate (%) | Date | Amount ($)a | Value ($) |
| Entertainment—1.1% | | | | | | |
| Lottomatica, | | | | | | |
| Jr. Sub. Bonds | EUR | 8.25 | 3/31/66 | 50,000 | b | 61,229 |
| Travelport, | | | | | | |
| Gtd. Notes | | 9.88 | 9/1/14 | 60,000 | | 42,300 |
| | | | | | | 103,529 |
| Food & Beverages—2.3% | | | | | | |
| British Sugar, | | | | | | |
| Gtd. Debs | GBP | 10.75 | 7/2/13 | 31,000 | | 55,250 |
| Campofrio Food Group, | | | | | | |
| Gtd. Notes | EUR | 8.25 | 10/31/16 | 50,000 | | 71,261 |
| CEDC Finance Corp. | | | | | | |
| International, | | | | | | |
| Sr. Scd. Notes | EUR | 8.88 | 12/1/16 | 50,000 | | 51,543 |
| Tate & Lyle | | | | | | |
| International Finance, | | | | | | |
| Gtd. Notes | GBP | 6.50 | 6/28/12 | 25,000 | | 41,261 |
| | | | | | | 219,315 |
| Foreign/Governmental—34.2% | | | | | | |
| Argentina Government, | | | | | | |
| Bonds, Ser. VII | | 7.00 | 9/12/13 | 50,000 | | 49,125 |
| Brazilian Government, | | | | | | |
| Sr. Unscd. Bonds | | 7.13 | 1/20/37 | 140,000 | | 187,950 |
| Bulgarian Government, | | | | | | |
| Sr. Unscd. Bonds | | 8.25 | 1/15/15 | 20,000 | | 22,820 |
| Canada Housing Trust No. 1, | | | | | | |
| Govt. Gtd. Bonds | CAD | 3.80 | 6/15/21 | 85,000 | c | 92,400 |
| Canadian Government, | | | | | | |
| Bonds | CAD | 2.00 | 6/1/16 | 330,000 | | 338,413 |
| Croatian Government, | | | | | | |
| Sr. Unscd. Notes | | 6.63 | 7/14/20 | 100,000 | | 99,125 |
| Czech Republic | | | | | | |
| Government, Bonds, | | | | | | |
| Ser. 51 | CZK | 4.00 | 4/11/17 | 4,660,000 | | 278,172 |
| European Bank for | | | | | | |
| Reconstruction & | | | | | | |
| Development, Notes | NOK | 4.00 | 5/11/17 | 180,000 | | 33,518 |
The Fund 11
STATEMENT OF INVESTMENTS (continued)
| | | | | | |
| | | Coupon | Maturity | Principal | | |
| Bonds and Notes (continued) | Rate (%) | Date | Amount ($)a | | Value ($) |
| Foreign/Governmental | | | | | | |
| (continued) | | | | | | |
| Icelandic Government, | | | | | | |
| Sr. Notes | EUR | 3.75 | 12/1/11 | 50,000 | | 69,695 |
| Indonesian Government, | | | | | | |
| Sr. Unscd. Bonds | | 6.63 | 2/17/37 | 100,000 | | 121,750 |
| Malaysian Government, | | | | | | |
| Bonds, Ser. 111 | MYR | 4.16 | 7/15/21 | 280,000 | | 94,397 |
| Mexican Government, | | | | | | |
| Bonds, Ser. M10 | MXN | 7.75 | 12/14/17 | 700,000 | | 59,232 |
| Mexican Government, | | | | | | |
| Bonds, Ser. M10 | MXN | 8.50 | 12/13/18 | 1,840,000 | | 161,121 |
| New South Wales Treasury, | | | | | | |
| Gtd. Bonds, Ser. CIB1 | AUD | 2.75 | 11/20/25 | 170,000 | d | 202,729 |
| New Zealand Government, | | | | | | |
| Sr. Unscd. Bonds, Ser. 1217 | NZD | 6.00 | 12/15/17 | 265,000 | | 236,648 |
| New Zealand Government, | | | | | | |
| Sr. Unscd. Bonds, Ser. 413 | NZD | 6.50 | 4/15/13 | 255,000 | | 217,087 |
| Norwegian Government, | | | | | | |
| Bonds, Ser 473 | NOK | 4.50 | 5/22/19 | 554,000 | | 112,505 |
| Polish Government, | | | | | | |
| Bonds, Ser. 0922 | PLN | 5.75 | 9/23/22 | 660,000 | | 208,415 |
| Romanian Government , | | | | | | |
| Sr. Unscd. Bonds | EUR | 5.00 | 3/18/15 | 30,000 | | 41,096 |
| South African Government, | | | | | | |
| Bonds, Ser. R203 | ZAR | 8.25 | 9/15/17 | 1,570,000 | | 206,731 |
| Sri Lankan Government, | | | | | | |
| Notes | | 7.40 | 1/22/15 | 100,000 | | 109,250 |
| United Kingdom Gilt, | | | | | | |
| Bonds | GBP | 1.25 | 11/22/17 | 107,000 | e | 240,417 |
| Venezuelan Government, | | | | | | |
| Sr. Unscd. Notes | | 10.75 | 9/19/13 | 50,000 | | 50,125 |
| | | | | | | 3,232,721 |
| Health Care—.7% | | | | | | |
| Catalent Pharma Solutions, | | | | | | |
| Gtd. Notes | EUR | 9.75 | 4/15/17 | 50,000 | | 65,034 |
12
| | | | | | |
| | | Coupon | Maturity | Principal | |
| Bonds and Notes (continued) | Rate (%) | Date | Amount ($)a | Value ($) |
| Industrial—.7% | | | | | | |
| BAA Funding, | | | | | | |
| Sr. Scd. Bonds | EUR | 4.60 | 2/15/18 | 50,000 | | 69,216 |
| Insurance—.8% | | | | | | |
| Prudential, | | | | | | |
| Jr. Sub. Notes | | 11.75 | 12/29/49 | 65,000 | b | 72,842 |
| Media—1.5% | | | | | | |
| Unitymedia NRW, | | | | | | |
| Sr. Scd. Notes | EUR | 8.13 | 12/1/17 | 50,000 | | 72,298 |
| Ziggo Bond, | | | | | | |
| Sr. Scd. Notes | EUR | 8.00 | 5/15/18 | 50,000 | | 70,742 |
| | | | | | | 143,040 |
| Mining—1.0% | | | | | | |
| Anglo American Capital, | | | | | | |
| Gtd. Notes | GBP | 6.88 | 5/1/18 | 50,000 | | 91,407 |
| Oil & Gas—1.5% | | | | | | |
| BP Capital Markets, | | | | | | |
| Gtd. Notes | EUR | 4.50 | 11/8/12 | 50,000 | | 71,131 |
| Petrobras | | | | | | |
| International Finance, | | | | | | |
| Gtd. Notes | | 7.88 | 3/15/19 | 60,000 | | 72,652 |
| | | | | | | 143,783 |
| Packaging & | | | | | | |
| Containers—.7% | | | | | | |
| Ardagh Glass Finance, | | | | | | |
| Gtd. Bonds | EUR | 7.13 | 6/15/17 | 50,000 | | 63,477 |
| Real Estate—.9% | | | | | | |
| Tesco Property Finance 3, | | | | | | |
| Mortgage Backed Bonds | GBP | 5.74 | 4/13/40 | 49,852 | | 85,128 |
| Retail—1.3% | | | | | | |
| Edcon Proprietary, | | | | | | |
| Sr. Scd. Notes | EUR | 4.78 | 6/15/14 | 50,000 | b | 59,153 |
| Enterprise Inns, | | | | | | |
| Sr. Scd. Bonds | GBP | 6.50 | 12/6/18 | 50,000 | | 58,489 |
| | | | | | | 117,642 |
The Fund 13
STATEMENT OF INVESTMENTS (continued)
| | | | | | |
| | | Coupon | Maturity | Principal | | |
| Bonds and Notes (continued) | Rate (%) | Date | Amount ($)a | | Value ($) |
| Telecommunications—4.8% | | | | | | |
| British Telecommunications, | | | | | | |
| Sr. Unscd. Notes | EUR | 5.25 | 1/22/13 | 100,000 | b | 143,620 |
| Cable & Wireless | | | | | | |
| Communications, | | | | | | |
| Sr. Unscd. Bonds | GBP | 8.75 | 8/6/12 | 20,000 | | 32,882 |
| Cable & Wireless International | | | | | | |
| Fin, Gtd. Bonds | GBP | 8.63 | 3/25/19 | 40,000 | | 59,492 |
| Clearwire Communications, | | | | | | |
| Sr. Scd. Notes | | 12.00 | 12/1/15 | 65,000 | | 55,900 |
| Satmex Escrow, | | | | | | |
| Sr. Scd. Notes | | 9.50 | 5/15/17 | 16,000 | | 16,480 |
| Telefonica Emisiones, | | | | | | |
| Gtd. Notes | | 5.13 | 4/27/20 | 75,000 | | 74,663 |
| Wind Acquisition Finance, | | | | | | |
| Gtd. Notes | EUR | 11.75 | 7/15/17 | 50,000 | | 69,185 |
| | | | | | | 452,222 |
| U.S. Government | | | | | | |
| Securities—8.1% | | | | | | |
| U.S. Treasury Bonds | | | | | | |
| 4.75%, 2/15/41 | | | | 423,000 | | 549,966 |
| U.S. Treasury Notes | | | | | | |
| 0.38%, 6/30/13 | | | | 220,000 | | 220,567 |
| | | | | | | 770,533 |
| Total Bonds and Notes | | | | | | |
| (cost $8,152,539) | | | | | | 8,095,227 |
| |
| Common Stocks—3.6% | | | | Shares | | Value ($) |
| Exchange Traded Funds | | | | | | |
| iShares iBoxx High Yield | | | | | | |
| Corporate Bond Fund | | | | | | |
| (cost $349,836) | | | | 3,800 | | 339,264 |
14
| | | |
| Other Investment—4.4% | Shares | | Value ($) |
| Registered Investment Company; | | | |
| Dreyfus Institutional Preferred | | | |
| Plus Money Market Fund | | | |
| (cost $416,749) | 416,749 | f | 416,749 |
| |
| Total Investments (cost $8,919,124) | 93.5 | % | 8,851,240 |
| Cash and Receivables (Net) | 6.5 | % | 611,642 |
| Net Assets | 100.0 | % | 9,462,882 |
|
| a Principal amount stated in U.S. Dollars unless otherwise noted. |
| AUD—Australian Dollar |
| CAD—Canadian Dollar |
| CNY—ChineseYuan Renminbi |
| CZK—Czech Republic Koruna |
| EUR—Euro |
| GBP—British Pound |
| MXN—Mexican New Peso |
| MYR—Malaysian Ringgit |
| NOK—Norwegian Krone |
| NZD—New Zealand Dollar |
| PLN—Polish Zloty |
| ZAR—South African Rand |
| b Variable rate security—interest rate subject to periodic change. |
| c Securities exempt from registration under Rule 144A of the Securities Act of 1933.These securities may be resold in |
| transactions exempt from registration, normally to qualified institutional buyers.At October 31, 2011, these securities |
| were valued at $92,400 or 1.0% of net assets. |
| d Principal amount for accrual purposes is periodically adjusted based on changes in the Australian Consumer Price Index. |
| e Principal amount for accrual purposes is periodically adjusted based on changes in the British Consumer Price Index. |
| f Investment in affiliated money market mutual fund. |
| | | |
| Portfolio Summary (Unaudited)† | | |
| |
| | Value (%) | | Value (%) |
| Corporate Bonds | 43.2 | Money Market Investments | 4.4 |
| Foreign/Governmental | 34.2 | Common Stocks | 3.6 |
| U.S. Government & Agencies | 8.1 | | 93.5 |
| |
| † Based on net assets. | | | |
| See notes to financial statements. | | | |
The Fund 15
STATEMENT OF ASSETS AND LIABILITIES
October 31, 2011
| | | |
| | Cost | Value | |
| Assets ($): | | | |
| Investments in securities—See Statement of Investments: | | | |
| Unaffiliated issuers | 8,502,375 | 8,434,491 | |
| Affiliated issuers | 416,749 | 416,749 | |
| Cash denominated in foreign currencies | 316,147 | 320,730 | |
| Unrealized appreciation on forward foreign | | | |
| currency exchange contracts—Note 4 | | 231,677 | |
| Receivable for investment securities sold | | 165,030 | |
| Interest and dividends receivable | | 158,352 | |
| Prepaid expenses | | 38,256 | |
| | | 9,765,285 | |
| Liabilities ($): | | | |
| Due to The Dreyfus Corporation and affiliates—Note 3(c) | | 13,066 | |
| Payable for investment securities purchased | | 162,499 | |
| Unrealized depreciation on forward foreign | | | |
| currency exchange contracts—Note 4 | | 79,892 | |
| Accrued expenses | | 46,946 | |
| | | 302,403 | |
| Net Assets ($) | | 9,462,882 | |
| Composition of Net Assets ($): | | | |
| Paid-in capital | | 9,390,756 | |
| Accumulated undistributed investment income—net | | 44,674 | |
| Accumulated net realized gain (loss) on investments | | (59,697 | ) |
| Accumulated net unrealized appreciation (depreciation) | | | |
| on investments and foreign currency transactions | | 87,149 | |
| Net Assets ($) | | 9,462,882 | |
| | | |
| Net Asset Value Per Share | | | |
| | Class A | Class C | Class I |
| Net Assets ($) | 535,574 | 541,634 | 8,385,674 |
| Shares Outstanding | 42,583 | 43,179 | 666,300 |
| Net Asset Value Per Share ($) | 12.58 | 12.54 | 12.59 |
See notes to financial statements.
16
STATEMENT OF OPERATIONS
From March 25, 2011 (commencement of operations) to October 31, 2011
| | |
| Investment Income ($): | | |
| Income: | | |
| Interest | 130,290 | |
| Dividends; | | |
| Unaffiliated issuers | 16,605 | |
| Affiliated issuers | 1,072 | |
| Total Income | 147,967 | |
| Expenses: | | |
| Management fee—Note 3(a) | 27,939 | |
| Auditing fees | 46,963 | |
| Legal fees | 38,553 | |
| Registration fees | 37,400 | |
| Custodian fees—Note 3(c) | 11,161 | |
| Prospectus and shareholders’ reports | 3,303 | |
| Distribution fees—Note 3(b) | 2,433 | |
| Shareholder servicing costs—Note 3(c) | 2,037 | |
| Directors’ fees and expenses—Note 3(d) | 1,025 | |
| Loan commitment fees—Note 2 | 19 | |
| Miscellaneous | 11,235 | |
| Total Expenses | 182,068 | |
| Less—expense reimbursement from The Dreyfus | | |
| Corporation due to undertaking—Note 3(a) | (138,446 | ) |
| Net Expenses | 43,622 | |
| Investment Income—Net | 104,345 | |
| Realized and Unrealized Gain (Loss) on Investments—Note 4 ($): | | |
| Net realized gain (loss) on investments and foreign currency transactions | (100,201 | ) |
| Net realized gain (loss) on options transactions | (3,991 | ) |
| Net realized gain (loss) on financial futures | (44,313 | ) |
| Net realized gain (loss) on forward foreign currency exchange contracts | 43,114 | |
| Net Realized Gain (Loss) | (105,391 | ) |
| Net unrealized appreciation (depreciation) | | |
| on investments and foreign currency transactions | (64,636 | ) |
| Net unrealized appreciation (depreciation) | | |
| on forward foreign currency exchange contracts | 151,785 | |
| Net Unrealized Appreciation (Depreciation) | 87,149 | |
| Net Realized and Unrealized Gain (Loss) on Investments | (18,242 | ) |
| Net Increase in Net Assets Resulting from Operations | 86,103 | |
See notes to financial statements.
The Fund 17
STATEMENT OF CHANGES IN NET ASSETS
From March 25, 2011 (commencement of operations) to October 31, 2011
| | |
| Operations ($): | | |
| Investment income—net | 104,345 | |
| Net realized gain (loss) on investments | (105,391 | ) |
| Net unrealized appreciation (depreciation) on investments | 87,149 | |
| Net Increase (Decrease) in Net Assets | | |
| Resulting from Operations | 86,103 | |
| Dividends to Shareholders from ($): | | |
| Investment income—net: | | |
| Class A Shares | (1,287 | ) |
| Class C Shares | (302 | ) |
| Class I Shares | (18,798 | ) |
| Total Dividends | (20,387 | ) |
| Capital Stock Transactions ($): | | |
| Net proceeds from shares sold: | | |
| Class A Shares | 533,469 | |
| Class C Shares | 563,287 | |
| Class I Shares | 8,325,000 | |
| Dividends reinvested: | | |
| Class A Shares | 47 | |
| Class C Shares | 22 | |
| Class I Shares | 78 | |
| Cost of shares redeemed: | | |
| Class A Shares | (1,297 | ) |
| Class C Shares | (23,440 | ) |
| Increase (Decrease) in Net Assets | | |
| from Capital Stock Transactions | 9,397,166 | |
| Total Increase (Decrease) in Net Assets | 9,462,882 | |
| Net Assets ($): | | |
| Beginning of Period | — | |
| End of Period | 9,462,882 | |
| Undistributed investment income—net | 44,674 | |
18
| | |
| Capital Share Transactions: | | |
| Class A | | |
| Shares sold | 42,683 | |
| Shares issued for dividends reinvested | 4 | |
| Shares redeemed | (104 | ) |
| Net Increase (Decrease) in Shares Outstanding | 42,583 | |
| Class C | | |
| Shares sold | 45,049 | |
| Shares issued for dividends reinvested | 2 | |
| Shares redeemed | (1,872 | ) |
| Net Increase (Decrease) in Shares Outstanding | 43,179 | |
| Class I | | |
| Shares sold | 666,294 | |
| Shares issued for dividends reinvested | 6 | |
| Net Increase (Decrease) in Shares Outstanding | 666,300 | |
| |
| See notes to financial statements. | | |
The Fund 19
FINANCIAL HIGHLIGHTS
The following table describes the performance for each share class for the period from March 25, 2011 (commencement of operations) to October 31, 2011.All information (except portfolio turnover rate) reflects financial results for a single fund share.Total return shows how much your investment in the fund would have increased (or decreased) during each period, assuming you had reinvested all dividends and distributions.These figures have been derived from the fund’s financial statements.
| | | | | | |
| | Class A | | Class C | | Class I | |
| | Shares | | Shares | | Shares | |
| Per Share Data ($): | | | | | | |
| Net asset value, beginning of period | 12.50 | | 12.50 | | 12.50 | |
| Investment Operations: | | | | | | |
| Investment income—neta | .15 | | .10 | | .18 | |
| Net realized and unrealized | | | | | | |
| gain (loss) on investments | (.04 | ) | (.05 | ) | (.05 | ) |
| Total from Investment Operations | .11 | | .05 | | .13 | |
| Distributions: | | | | | | |
| Dividends from investment income—net | (.03 | ) | (.01 | ) | (.04 | ) |
| Net asset value, end of period | 12.58 | | 12.54 | | 12.59 | |
| Total Return (%)b | .89 | c | .38 | c | 1.03 | |
| Ratios/Supplemental Data (%): | | | | | | |
| Ratio of total expenses to average net assetsd | 4.26 | | 4.98 | | 3.80 | |
| Ratio of net expenses to average net assetsd | 1.10 | | 1.85 | | .85 | |
| Ratio of net investment income | | | | | | |
| to average net assetsd | 2.04 | | 1.30 | | 2.33 | |
| Portfolio Turnover Rateb | 127.38 | | 127.38 | | 127.38 | |
| Net Assets, end of period ($ x 1,000) | 536 | | 542 | | 8,386 | |
| |
| a | Based on average shares outstanding at each month end. |
| b | Not annualized. |
| c | Exclusive of sales charge. |
| d | Annualized. |
See notes to financial statements.
20
NOTES TO FINANCIAL STATEMENTS
NOTE 1—Significant Accounting Policies:
Dreyfus Global Dynamic Bond Fund (the “fund”) is a separate non-diversified series of Advantage Funds, Inc. (the “Company”), which is registered under the Investment Company Act of 1940, as amended (the “Act”), as an open-end management investment company and operates as a series company currently offering twelve series, including the fund, which commenced operations on March 25, 2011.The fund’s investment objective seeks total return (consisting of income and capital appreciation).The Dreyfus Corporation (the “Manager” or “Dreyfus”), a wholly-owned subsidiary of The Bank of New York Mellon Corporation (“BNY Mellon”), serves as the fund’s investment adviser. Newton Capital Management Limited (“Newton”), an affiliate of Dreyfus, serves as the fund’s sub-investment adviser.
MBSC Securities Corporation (the “Distributor”), a wholly-owned subsidiary of Dreyfus, is the distributor of the fund’s shares.The fund is authorized to issue 100 million shares of $.001 par value Common Stock in each of the following classes of shares: Class A, Class C and Class I. Class A shares are subject to a sales charge imposed at the time of purchase. Class C shares are subject to a contingent deferred sales charge (“CDSC”) imposed on Class C shares redeemed within one year of purchase. Class I shares are sold at net asset value per share only to institutional investors. Other differences between the classes include the services offered to and the expenses borne by each class, the allocation of certain transfer agency costs and certain voting rights. Income, expenses (other than expenses attributable to a specific class) and realized and unrealized gains or losses on investments are allocated to each class of shares based on its relative net assets.
As of October 31, 2011, MBC Investment Corp., an indirect subsidiary of BNY Mellon, held 40,000 Class A, 40,000 Class C and 480,000 Class I shares of the fund.
The Fund 21
NOTES TO FINANCIAL STATEMENTS (continued)
The Company accounts separately for the assets, liabilities and operations of each series. Expenses directly attributable to each series are charged to that series’ operations; expenses which are applicable to all series are allocated among them on a pro rata basis.
The Financial Accounting Standards Board (“FASB”) Accounting Standards Codification (“ASC”) is the exclusive reference of authoritative U.S. generally accepted accounting principles (“GAAP”) recognized by the FASB to be applied by nongovernmental entities. Rules and interpretive releases of the Securities and Exchange Commission (“SEC”) under authority of federal laws are also sources of authoritative GAAP for SEC registrants. The fund’s financial statements are prepared in accordance with GAAP, which may require the use of management estimates and assumptions.Actual results could differ from those estimates.
The Company enters into contracts that contain a variety of indemnifications.The fund’s maximum exposure under these arrangements is unknown.The fund does not anticipate recognizing any loss related to these arrangements.
(a) Portfolio valuation: The fair value of a financial instrument is the amount that would be received to sell an asset or paid to transfer a liability in an orderly transaction between market participants at the measurement date (i.e. the exit price). GAAP establishes a fair value hierarchy that prioritizes the inputs of valuation techniques used to measure fair value.This hierarchy gives the highest priority to unadjusted quoted prices in active markets for identical assets or liabilities (Level 1 measurements) and the lowest priority to unobservable inputs (Level 3 measurements).
Additionally, GAAP provides guidance on determining whether the volume and activity in a market has decreased significantly and whether such a decrease in activity results in transactions that are not orderly. GAAP requires enhanced disclosures around valuation inputs and techniques used during annual and interim periods.
22
Various inputs are used in determining the value of the fund’s investments relating to fair value measurements.These inputs are summarized in the three broad levels listed below:
Level 1—unadjusted quoted prices in active markets for identical investments.
Level 2—other significant observable inputs (including quoted prices for similar investments, interest rates, prepayment speeds, credit risk, etc.).
Level 3—significant unobservable inputs (including the fund’s own assumptions in determining the fair value of investments).
The inputs or methodology used for valuing securities are not necessarily an indication of the risk associated with investing in those securities.
Changes in valuation techniques may result in transfers in or out of an assigned level within the disclosure hierarchy. Valuation techniques used to value the fund’s investments are as follows:
Investments in equity securities are valued at the last sales price on the securities exchange or national securities market on which such securities are primarily traded. Securities listed on the National Market System for which market quotations are available are valued at the official closing price or, if there is no official closing price that day, at the last sales price. Securities not listed on an exchange or the national securities market, or securities for which there were no transactions, are valued at the average of the most recent bid and asked prices, except for open short positions, where the asked price is used for valuation purposes. Bid price is used when no asked price is available. Registered investment companies that are not traded on an exchange are valued at their net asset value. All preceding securities are categorized within Level 1 of the fair value hierarchy.
The Fund 23
NOTES TO FINANCIAL STATEMENTS (continued)
Investments in debt securities excluding short-term investments (other than U.S.Treasury Bills), financial futures, options, and forward foreign currency exchange contracts (“forward contracts”) are valued each business day by an independent pricing service (the “Service”) approved by the Board of Directors. Investments for which quoted bid prices are readily available and are representative of the bid side of the market in the judgment of the Service are valued at the mean between the quoted bid prices (as obtained by the Service from dealers in such securities) and asked prices (as calculated by the Service based upon its evaluation of the market for such securities). Other investments are valued as determined by the Service, based on methods which include consideration of: yields or prices of securities of comparable quality, coupon, maturity and type; indications as to values from dealers; and general market conditions. These securities are generally categorized within Level 2 of the fair value hierarchy.
Fair valuing of securities may be determined with the assistance of a pricing service using calculations based on indices of domestic securities and other appropriate indicators, such as prices of relevant American Depository Receipts and futures contracts. Utilizing these techniques may result in transfers between Level 1 and Level 2 of the fair value hierarchy.
When market quotations or official closing prices are not readily available, or are determined not to reflect accurately fair value, such as when the value of a security has been significantly affected by events after the close of the exchange or market on which the security is principally traded (for example, a foreign exchange or market), but before the fund calculates its net asset value, the fund may value these investments at fair value as determined in accordance with the procedures approved by the Board of Directors. Certain factors may be considered when fair valuing investments such as: fundamental analytical data, the nature and duration of restrictions on disposition, an evaluation of the forces that influence the market in which the securities are purchased and sold, and public trading in similar securities of the issuer or comparable issuers. These securities are either categorized as Level 2 or 3 depending on the relevant inputs used.
24
For restricted securities where observable inputs are limited, assumptions about market activity and risk are used and are categorized within Level 3 of the fair value hierarchy.
Financial futures and options, which are traded on an exchange, are valued at the last sales price on the securities exchange on which such securities are primarily traded or at the last sales price on the national securities market on each business day. These securities are generally categorized within Level 1 of the fair value hierarchy. Options traded over-the-counter are valued at the mean between the bid and asked price.These securities are generally categorized within Level 2 of the fair value hierarchy. Investments denominated in foreign currencies are translated to U.S. dollars at the prevailing rates of exchange. Forward contracts are valued at the forward rate.These securities are generally categorized within Level 2 of the fair value hierarchy.
The following is a summary of the inputs used as of October 31, 2011 in valuing the fund’s investments:
| | | | | | |
| | | Level 2—Other | | Level 3— | | |
| | Level 1— | Significant | | Significant | | |
| | Unadjusted | Observable | | Unobservable | | |
| | Quoted Prices | Inputs | | Inputs | Total | |
| Assets ($) | | | | | | |
| Investments in Securities: | | | | | | |
| Corporate Bonds† | — | 4,091,973 | | — | 4,091,973 | |
| Foreign Government | — | 3,232,721 | | — | 3,232,721 | |
| Mutual Funds/Exchange | | | | | | |
| Traded Funds | 756,013 | — | | — | 756,013 | |
| U.S. Treasury | — | 770,533 | | — | 770,533 | |
| Other Financial | | | | | | |
| Instruments: | | | | | | |
| Forward Foreign Currency | | | | | | |
| Exchange Contracts†† | — | 231,677 | | — | 231,677 | |
| Liabilities ($) | | | | | | |
| Other Financial | | | | | | |
| Instruments: | | | | | | |
| Forward Foreign Currency | | | | | | |
| Exchange Contracts†† | — | (79,892 | ) | — | (79,892 | ) |
| |
| † | See Statement of Investments for additional detailed categorizations. |
| †† | Amount shown represents unrealized appreciation (depreciation) at period end. |
The Fund 25
NOTES TO FINANCIAL STATEMENTS (continued)
In May 2011, FASB issued Accounting Standards Update (“ASU”) No. 2011-04 “Amendments to Achieve Common FairValue Measurement and Disclosure Requirements in GAAP and International Financial Reporting Standards (“IFRS”)” (“ASU 2011-04”). ASU 2011-04 includes common requirements for measurement of and disclosure about fair value between GAAP and IFRS. ASU 2011-04 will require reporting entities to disclose the following information for fair value measurements categorized within Level 3 of the fair value hierarchy: quantitative information about the unobservable inputs used in the fair value measurement, the valuation processes used by the reporting entity and a narrative description of the sensitivity of the fair value measurement to changes in unobservable inputs and the interrelationships between those unobservable inputs. In addition, ASU 2011-04 will require reporting entities to make disclosures about amounts and reasons for all transfers in and out of Level 1 and Level 2 fair value mea-surements.The new and revised disclosures are effective for interim and annual reporting periods beginning after December 15, 2011. At this time, management is evaluating the implications of ASU 2011-04 and its impact on the financial statements.
(b) Foreign currency transactions: The fund does not isolate that portion of the results of operations resulting from changes in foreign exchange rates on investments from the fluctuations arising from changes in the market prices of securities held. Such fluctuations are included with the net realized and unrealized gain or loss on investments.
Net realized foreign exchange gains or losses arise from sales of foreign currencies, currency gains or losses realized on securities transactions between trade and settlement date and the difference between the amounts of dividends, interest and foreign withholding taxes recorded on the fund’s books and the U.S. dollar equivalent of the amounts actually received or paid. Net unrealized foreign exchange gains and losses arise from changes in the value of assets and liabilities other than investments resulting from changes in exchange rates. Foreign currency gains and losses on investments are included with net realized and unrealized gain or loss on investments.
26
(c) Securities transactions and investment income: Securities transactions are recorded on a trade date basis. Realized gains and losses from securities transactions are recorded on the identified cost basis. Interest income, including, where applicable, accretion of discount and amortization of premium on investments, is recognized on the accrual basis.
Investing in foreign markets may involve special risks and considerations not typically associated with investing in the U.S. These risks include revaluation of currencies, high rates of inflation, repatriation restrictions on income and capital, and adverse political and economic developments. Moreover, securities issued in these markets may be less liquid, subject to government ownership controls and delayed settlements, and their prices may be more volatile than those of comparable securities in the U.S.
(d) Affiliated issuers: Investments in other investment companies advised by Dreyfus are defined as “affiliated” in the Act.
The fund may invest in shares of certain affiliated investment companies also advised or managed by Dreyfus. Investments in affiliated investment companies for the period ended October 31, 2011 were as follows:
| | | | | | | |
| Affiliated | | | | | | | |
| Investment | Value | | | | Value | | Net |
| Company | 3/25/2011 | ($) | Purchases ($) | Sales ($) | 10/31/2011 | ($) | Assets (%) |
| Dreyfus | | | | | | | |
| Institutional | | | | | | | |
| Preferred | | | | | | | |
| Plus Money | | | | | | | |
| Market Fund | — | | 13,207,716 | 12,790,967 | 416,749 | | 4.4 |
(e) Dividends to shareholders: Dividends are recorded on the ex-dividend date. Dividends from investment income-net are declared and paid quarterly. Dividends from net realized capital gains, if any, are normally declared and paid annually, but the fund may make distributions on a more frequent basis to comply with the distribution requirements of the Internal Revenue Code of 1986, as amended (the “Code”).To the extent that net realized capital gains can be offset by capital loss carryovers, it is the policy of the fund not to distribute such gains.
The Fund 27
NOTES TO FINANCIAL STATEMENTS (continued)
Income and capital gain distributions are determined in accordance with income tax regulations, which may differ from GAAP.
(f) Federal income taxes: It is the policy of the fund to continue to qualify as a regulated investment company, if such qualification is in the best interests of its shareholders, by complying with the applicable provisions of the Code, and to make distributions of taxable income sufficient to relieve it from substantially all federal income and excise taxes.
As of and during the period ended October 31, 2011, the fund did not have any liabilities for any uncertain tax positions.The fund recognizes interest and penalties, if any, related to uncertain tax positions as income tax expense in the Statement of Operations. During the period, the fund did not incur any interest or penalties.
The tax year for the period ended October 31, 2011 remains subject to examination by the Internal Revenue Service and state taxing authorities.
At October 31, 2011, the components of accumulated earnings on a tax basis were as follows: undistributed ordinary income $199,335, undistributed capital gains $1,461 and unrealized depreciation $128,670.
During the period ended October 31, 2011, as a result of permanent book to tax differences, primarily due to the tax treatment for foreign currency gains and losses, amortization of premiums and fund start-up costs, the fund decreased accumulated undistributed investment income-net by $39,284, increased accumulated net realized gain (loss) on investments by $45,694 and decreased paid-in capital by $6,410. Net assets and net asset value per share were not affected by this reclassification.
NOTE 2—Bank Lines of Credit:
The fund participates with other Dreyfus-managed funds in a $225 million unsecured credit facility led by Citibank, N.A. and a $300 million unsecured credit facility provided by The Bank of New York Mellon, a subsidiary of BNY Mellon and an affiliate of Dreyfus, (each, a “Facility”), each to be utilized primarily for temporary or emergency purposes, including the financing of redemptions. In connection therewith, the fund has agreed to pay its pro rata portion of commitment
28
fees for each Facility. Interest is charged to the fund based on rates determined pursuant to the terms of the respective Facility at the time of borrowing. During the period ended on October 31, 2011, the fund did not borrow under the Facilities.
NOTE 3—Investment Management Fee and Other Transactions With Affiliates:
(a) Pursuant to a management agreement with Dreyfus, the management fee is computed at the annual rate of .60% of the value of the fund’s average daily net assets and is payable monthly.
Dreyfus has contractually agreed, until March 1, 2013, to waive receipt of its fees and/or assume the expenses of the fund so that the direct expenses of none of the classes (excluding Rule 12b-1 fees, shareholder services fees, taxes, interest expense, brokerage commissions, commitment fees on borrowings and extraordinary expenses) exceed .85% of the value of the fund’s average daily net assets. The expense reimbursement, pursuant to the undertaking, amounted to $138,446 during the period ended October 31, 2011.
Pursuant to a sub-investment advisory agreement between Dreyfus and Newton, Dreyfus pays Newton a monthly fee at an annual rate of .29% of the value of the fund’s average daily net assets.
(b) Under the Distribution Plan (the “Plan”) adopted pursuant to Rule 12b-1 under the Act, Class C shares pay the Distributor for distributing its shares at an annual rate of .75% of the value of the average daily net assets of Class C shares. During the period ended October 31, 2011, Class C shares were charged $2,433 pursuant to the Plan.
(c) Under the Shareholder Services Plan, Class A and Class C shares pay the Distributor at an annual rate of .25% of the value of their average daily net assets for the provision of certain services.The services provided may include personal services relating to shareholder accounts, such as answering shareholder inquiries regarding the fund and providing reports and other information, and services related to the maintenance
The Fund 29
NOTES TO FINANCIAL STATEMENTS (continued)
of shareholder accounts.The Distributor may make payments to Service Agents (a securities dealer, financial institution or other industry professional) in respect of these services. The Distributor determines the amounts to be paid to Service Agents. During the period ended October 31, 2011, Class A and Class C shares were charged $779 and $811, respectively, pursuant to the Shareholder Services Plan.
The fund compensates Dreyfus Transfer, Inc., a wholly-owned subsidiary of Dreyfus, under a transfer agency agreement for providing personnel and facilities to perform transfer agency services for the fund. During the period ended October 31, 2011, the fund was charged $330 pursuant to the transfer agency agreement, which is included in Shareholder servicing costs in the Statement of Operations.
The fund has arrangements with the custodian and cash management bank whereby the fund may receive earnings credits when positive cash balances are maintained, which are used to offset custody and cash management fees. For financial reporting purposes, the fund includes net earnings credits as an expense offset in the Statement of Operations.
The fund compensates The Bank of New York Mellon under cash management agreements for performing cash management services related to fund subscriptions and redemptions. During the period ended October 31, 2011, the fund was charged $14 pursuant to the cash management agreements, which is included in Shareholder servicing costs in the Statement of Operations.
The fund also compensates The Bank of New York Mellon under a custody agreement for providing custodial services for the fund. During the period ended October 31, 2011, the fund was charged $11,161 pursuant to the custody agreement.
During the period ended October 31, 2011, the fund was charged $3,478 for services performed by the Chief Compliance Officer.
The components of “Due toThe Dreyfus Corporation and affiliates” in the Statement of Assets and Liabilities consist of: management fees $4,767, Rule 12b-1 distribution plan fees $341, shareholder services plan
30
fees $226, custodian fees $8,531, chief compliance officer fees $4,246 and transfer agency per account fees $180, which are offset against an expense reimbursement currently in effect in the amount of $5,225.
(d) Each Board member also serves as a Board member of other funds within the Dreyfus complex. Annual retainer fees and attendance fees are allocated to each fund based on net assets.
NOTE 4—Securities Transactions:
The aggregate amount of purchases and sales (including paydowns) of investment securities, excluding short-term securities, financial futures, options and forward contracts, during the period ended October 31, 2011, amounted to $15,708,100 and $7,118,938, respectively.
The following tables show the fund’s exposure to different types of market risk as it relates to the Statement of Assets and Liabilities and the Statement of Operations, respectively.
Fair value of derivative instruments as of October 31, 2011 is shown below:
| | | | |
| | Derivative | | Derivative | |
| | Assets ($) | | Liabilities ($) | |
| Foreign exchange risk1 | 231,677 | Foreign exchange risk2 | (79,892 | ) |
Statement of Assets and Liabilities location:
| |
| 1 | Unrealized appreciation on forward foreign currency exchange contracts. |
| 2 | Unrealized depreciation on forward foreign currency exchange contracts. |
The effect of derivative instruments in the Statement of Operations during the period ended October 31, 2011 is shown below:
| | | | | | | |
| | Amount of realized gain or (loss) on derivatives recognized in income ($) | |
| | | | | | Forward | | |
| Underlying risk | Futures3 | | Options4 | | Contracts5 | Total | |
| Interest rate | (44,313 | ) | (3,991 | ) | — | (48,304 | ) |
| Foreign exchange | — | | — | | 43,114 | 43,114 | |
| Total | (44,313 | ) | (3,991 | ) | 43,114 | (5,190 | ) |
The Fund 31
NOTES TO FINANCIAL STATEMENTS (continued)
| |
| Change in unrealized appreciation or (depreciation) on derivatives recognized in income ($) |
| | Forward |
| Underlying risk | Contracts6 |
| Foreign exchange | 151,785 |
Statement of Operations location:
| |
| 3 | Net realized gain (loss) on financial futures. |
| 4 | Net realized gain (loss) on options transactions. |
| 5 | Net realized gain (loss) on forward foreign currency exchange contracts. |
| 6 | Net unrealized appreciation (depreciation) on forward foreign currency exchange contracts. |
Futures Contracts: In the normal course of pursuing its investment objective, the fund is exposed to market risk, including interest rate risk, as a result of changes in value of underlying financial instruments.The fund invests in financial futures contracts in order to manage its exposure to or protect against changes in the market. A futures contract represents a commitment for the future purchase or a sale of an asset at a specified date. Upon entering into such contracts, these investments require initial margin deposits with a broker, which consist of cash or cash equivalents. The amount of these deposits is determined by the exchange or Board of Trade on which the contract is traded and is subject to change. Accordingly, variation margin payments are received or made to reflect daily unrealized gains or losses which are recorded in the Statement of Operations. Futures contracts are valued daily at the last sales price established by the Board of Trade or exchange upon which they are traded. When the contracts are closed, the fund recognizes a realized gain or loss. There is minimal counterparty credit risk to the fund with futures since futures are exchange traded, and the exchange’s clearinghouse guarantees the futures against default. At October 31, 2011, there were no financial futures contracts outstanding.
Options: The fund purchases and writes (sells) put and call options to hedge against changes in interest rates, or as a substitute for an invest-ment.The fund is subject to interest rate risk in the course of pursuing its investment objectives through its investments in options contracts.A call option gives the purchaser of the option the right (but not the obligation) to buy, and obligates the writer to sell, the underlying security or securities at the exercise price at any time during the option period, or
32
at a specified date. Conversely, a put option gives the purchaser of the option the right (but not the obligation) to sell, and obligates the writer to buy the underlying security or securities at the exercise price at any time during the option period, or at a specified date.
As a writer of call options, the fund receives a premium at the outset and then bears the market risk of unfavorable changes in the price of the financial instrument underlying the option. Generally, the fund realizes a gain, to the extent of the premium, if the price of the underlying financial instrument decreases between the date the option is written and the date on which the option is terminated. Generally, the fund incurs a loss, if the price of the financial instrument increases between those dates.
As a writer of put options, the fund receives a premium at the outset and then bears the market risk of unfavorable changes in the price of the financial instrument underlying the option. Generally, the fund realizes a gain, to the extent of the premium, if the price of the underlying financial instrument increases between the date the option is written and the date on which the option is terminated. Generally, the fund incurs a loss, if the price of the financial instrument decreases between those dates.
As a writer of an option, the fund has no control over whether the underlying securities may be sold (call) or purchased (put) and as a result bears the market risk of an unfavorable change in the price of the security underlying the written option.There is a risk of loss from a change in value of such options which may exceed the related premiums received. One risk of holding a put or a call option is that if the option is not sold or exercised prior to its expiration, it becomes worthless. However, this risk is limited to the premium paid by the fund. Upon the expiration or closing of the option transaction, a gain or loss is reported in the Statement of Operations.
Forward Foreign Currency Exchange Contracts: The fund enters into forward contracts in order to hedge its exposure to changes in foreign currency exchange rates on its foreign portfolio holdings, to settle foreign currency transactions or as a part of its investment strategy.
The Fund 33
NOTES TO FINANCIAL STATEMENTS (continued)
When executing forward contracts, the fund is obligated to buy or sell a foreign currency at a specified rate on a certain date in the future. With respect to sales of forward contracts, the fund incurs a loss if the value of the contract increases between the date the forward contract is opened and the date the forward contract is closed.The fund realizes a gain if the value of the contract decreases between those dates. With respect to purchases of forward contracts, the fund incurs a loss if the value of the contract decreases between the date the forward contract is opened and the date the forward contract is closed.The fund realizes a gain if the value of the contract increases between those dates. Any realized gain or loss which occurred during the period is reflected in the Statement of Operations.The fund is exposed to foreign currency risk as a result of changes in value of underlying financial instruments. The fund is also exposed to credit risk associated with counterparty nonperformance on these forward contracts, which is typically limited to the unrealized gain on each open contract.The following summarizes open forward contracts at October 31, 2011:
| | | | | |
| | Foreign | | | Unrealized | |
| Forward Foreign Currency | Currency | | | Appreciation | |
| Exchange Contracts | Amounts | Cost ($) | Value ($) (Depreciation) ($) | |
| Purchases: | | | | | |
| Canadian Dollar, | | | | | |
| Expiring 11/18/2011 | 47,000 | 47,349 | 47,134 | (215 | ) |
| Canadian Dollar, | | | | | |
| Expiring 11/18/2011 | 94,000 | 94,527 | 94,268 | (259 | ) |
| Chinese Yuan Renminbi, | | | | | |
| Expiring 11/18/2011 | 2,290,000 | 357,116 | 360,353 | 3,237 | |
| Chinese Yuan Renminbi, | | | | | |
| Expiring 11/18/2011 | 60,000 | 9,420 | 9,441 | 21 | |
| Chinese Yuan Renminbi, | | | | | |
| Expiring 11/18/2011 | 830,000 | 130,081 | 130,608 | 527 | |
| Euro, | | | | | |
| Expiring 11/18/2011 | 18,000 | 25,493 | 24,902 | (591 | ) |
| Euro, | | | | | |
| Expiring 11/18/2011 | 16,000 | 22,441 | 22,135 | (306 | ) |
| Euro, | | | | | |
| Expiring 11/18/2011 | 20,000 | 27,396 | 27,668 | 272 | |
| Euro, | | | | | |
| Expiring 11/18/2011 | 170,000 | 240,791 | 235,186 | (5,605 | ) |
| Japanese Yen, | | | | | |
| Expiring 11/18/2011 | 10,963,190 | 141,732 | 140,275 | (1,457 | ) |
34
| | | | | |
| | Foreign | | | Unrealized | |
| Forward Foreign Currency | Currency | | | Appreciation | |
| Exchange Contracts | Amounts | Cost ($) | Value ($) (Depreciation) ($) | |
| Purchases (continued): | | | | | |
| Japanese Yen, | | | | | |
| Expiring 11/18/2011 | 10,990,000 | 142,207 | 140,618 | (1,589 | ) |
| Japanese Yen, | | | | | |
| Expiring 11/18/2011 | 13,610,000 | 177,248 | 174,141 | (3,107 | ) |
| Japanese Yen, | | | | | |
| Expiring 11/18/2011 | 770,000 | 9,983 | 9,852 | (131 | ) |
| Malaysian Ringgit, | | | | | |
| Expiring 11/18/2011 | 430,000 | 144,562 | 140,004 | (4,558 | ) |
| Mexican New Peso, | | | | | |
| Expiring 11/18/2011 | 915,000 | 72,654 | 68,538 | (4,116 | ) |
| New Zealand Dollar, | | | | | |
| Expiring 11/18/2011 | 30,000 | 24,604 | 24,231 | (373 | ) |
| Norwegian Krone, | | | | | |
| Expiring 11/18/2011 | 715,000 | 131,681 | 128,270 | (3,411 | ) |
| Norwegian Krone, | | | | | |
| Expiring 11/18/2011 | 580,000 | 105,059 | 104,051 | (1,008 | ) |
| Norwegian Krone, | | | | | |
| Expiring 11/18/2011 | 80,000 | 14,857 | 14,351 | (506 | ) |
| Norwegian Krone, | | | | | |
| Expiring 11/18/2011 | 1,070,000 | 189,026 | 191,957 | 2,931 | |
| Norwegian Krone, | | | | | |
| Expiring 11/18/2011 | 560,000 | 98,790 | 100,463 | 1,673 | |
| Polish Zloty, | | | | | |
| Expiring 11/18/2011 | 220,000 | 66,598 | 69,022 | 2,424 | |
| Polish Zloty, | | | | | |
| Expiring 11/18/2011 | 290,000 | 93,393 | 90,984 | (2,409 | ) |
| Singapore Dollar, | | | | | |
| Expiring 11/18/2011 | 240,000 | 186,699 | 191,264 | 4,565 | |
| South African Rand, | | | | | |
| Expiring 11/18/2011 | 492,000 | 63,654 | 61,833 | (1,821 | ) |
| Swedish Krona, | | | | | |
| Expiring 11/18/2011 | 680,600 | 106,553 | 104,326 | (2,227 | ) |
| Sales: | | Proceeds ($) | | | |
| Australian Dollar, | | | | | |
| Expiring 11/18/2011 | 113,000 | 121,032 | 118,829 | 2,203 | |
| Australian Dollar, | | | | | |
| Expiring 11/18/2011 | 75,000 | 76,654 | 78,869 | (2,215 | ) |
| Australian Dollar, | | | | | |
| Expiring 11/18/2011 | 96,000 | 94,518 | 100,952 | (6,434 | ) |
| British Pound, | | | | | |
| Expiring 11/18/2011 | 800,000 | 1,300,104 | 1,286,086 | 14,018 | |
| British Pound, | | | | | |
| Expiring 11/18/2011 | 32,000 | 52,177 | 51,443 | 734 | |
The Fund 35
NOTES TO FINANCIAL STATEMENTS (continued)
| | | | | |
| | Foreign | | | Unrealized | |
| Forward Foreign Currency | Currency | | | Appreciation | |
| Exchange Contracts | Amounts | Proceeds ($) | Value ($) (Depreciation) ($) | |
| Sales (continued): | | | | | |
| British Pound, | | | | | |
| Expiring 11/18/2011 | 21,000 | 34,245 | 33,759 | 486 | |
| British Pound, | | | | | |
| Expiring 11/18/2011 | 55,000 | 89,492 | 88,418 | 1,074 | |
| British Pound, | | | | | |
| Expiring 11/18/2011 | 9,000 | 14,511 | 14,468 | 43 | |
| British Pound, | | | | | |
| Expiring 11/18/2011 | 55,000 | 89,092 | 88,418 | 674 | |
| British Pound, | | | | | |
| Expiring 11/18/2011 | 26,000 | 43,056 | 41,797 | 1,259 | |
| British Pound, | | | | | |
| Expiring 11/18/2011 | 10,000 | 16,268 | 16,076 | 192 | |
| British Pound, | | | | | |
| Expiring 11/18/2011 | 16,000 | 25,498 | 25,722 | (224 | ) |
| British Pound, | | | | | |
| Expiring 11/18/2011 | 13,000 | 20,529 | 20,899 | (370 | ) |
| British Pound, | | | | | |
| Expiring 11/18/2011 | 53,000 | 83,508 | 85,203 | (1,695 | ) |
| British Pound, | | | | | |
| Expiring 11/18/2011 | 49,000 | 75,269 | 78,773 | (3,504 | ) |
| British Pound, | | | | | |
| Expiring 11/18/2011 | 51,000 | 79,789 | 81,988 | (2,199 | ) |
| British Pound, | | | | | |
| Expiring 11/18/2011 | 38,000 | 59,682 | 61,088 | (1,406 | ) |
| British Pound, | | | | | |
| Expiring 11/18/2011 | 10,000 | 15,573 | 16,076 | (503 | ) |
| British Pound, | | | | | |
| Expiring 11/18/2011 | 33,000 | 51,211 | 53,051 | (1,840 | ) |
| British Pound, | | | | | |
| Expiring 11/18/2011 | 17,000 | 26,797 | 27,329 | (532 | ) |
| British Pound, | | | | | |
| Expiring 11/18/2011 | 10,000 | 15,678 | 16,075 | (397 | ) |
| Canadian Dollar, | | | | | |
| Expiring 11/2/2011 | 93,718 | 94,280 | 94,024 | 256 | |
| Canadian Dollar, | | | | | |
| Expiring 11/18/2011 | 320,000 | 333,395 | 320,913 | 12,482 | |
| Canadian Dollar, | | | | | |
| Expiring 11/18/2011 | 71,000 | 71,936 | 71,202 | 734 | |
| Canadian Dollar, | | | | | |
| Expiring 11/18/2011 | 10,000 | 10,213 | 10,028 | 185 | |
| Canadian Dollar, | | | | | |
| Expiring 11/18/2011 | 125,000 | 125,826 | 125,356 | 470 | |
| Canadian Dollar, | | | | | |
| Expiring 11/18/2011 | 22,000 | 22,118 | 22,063 | 55 | |
36
| | | | | |
| | Foreign | | | Unrealized | |
| Forward Foreign Currency | Currency | | | Appreciation | |
| Exchange Contracts | Amounts | Proceeds ($) | Value ($) (Depreciation) ($) | |
| Sales (continued): | | | | | |
| Canadian Dollar, | | | | | |
| Expiring 11/18/2011 | 27,000 | 26,254 | 27,077 | (823 | ) |
| Chinese Yuan Renminbi, | | | | | |
| Expiring 11/18/2011 | 1,810,000 | 283,122 | 284,820 | (1,698 | ) |
| Czech Republic Koruna, | | | | | |
| Expiring 11/18/2011 | 3,113,000 | 181,965 | 173,209 | 8,756 | |
| Czech Republic Koruna, | | | | | |
| Expiring 11/18/2011 | 450,000 | 26,539 | 25,038 | 1,501 | |
| Czech Republic Koruna, | | | | | |
| Expiring 11/18/2011 | 180,000 | 10,343 | 10,015 | 328 | |
| Czech Republic Koruna, | | | | | |
| Expiring 11/18/2011 | 1,361,000 | 78,277 | 75,727 | 2,550 | |
| Euro, | | | | | |
| Expiring 11/18/2011 | 10,000 | 14,216 | 13,834 | 382 | |
| Euro, | | | | | |
| Expiring 11/18/2011 | 1,023,000 | 1,448,564 | 1,415,267 | 33,297 | |
| Euro, | | | | | |
| Expiring 11/18/2011 | 30,000 | 42,854 | 41,503 | 1,351 | |
| Euro, | | | | | |
| Expiring 11/18/2011 | 30,000 | 43,228 | 41,503 | 1,725 | |
| Euro, | | | | | |
| Expiring 11/18/2011 | 110,000 | 158,391 | 152,179 | 6,212 | |
| Euro, | | | | | |
| Expiring 11/18/2011 | 38,000 | 53,126 | 52,571 | 555 | |
| Euro, | | | | | |
| Expiring 11/18/2011 | 43,000 | 58,530 | 59,488 | (958 | ) |
| Euro, | | | | | |
| Expiring 11/18/2011 | 47,000 | 64,391 | 65,022 | (631 | ) |
| Euro, | | | | | |
| Expiring 11/18/2011 | 79,000 | 106,304 | 109,292 | (2,988 | ) |
| Euro, | | | | | |
| Expiring 11/18/2011 | 24,000 | 32,351 | 33,203 | (852 | ) |
| Euro, | | | | | |
| Expiring 11/18/2011 | 54,000 | 73,731 | 74,706 | (975 | ) |
| Japanese Yen, | | | | | |
| Expiring 11/18/2011 | 21,953,190 | 284,808 | 280,893 | 3,915 | |
| Malaysian Ringgit, | | | | | |
| Expiring 11/18/2011 | 430,000 | 141,062 | 140,004 | 1,058 | |
| Mexican New Peso, | | | | | |
| Expiring 11/18/2011 | 2,455,000 | 206,060 | 183,894 | 22,166 | |
| Mexican New Peso, | | | | | |
| Expiring 11/18/2011 | 1,288,000 | 102,614 | 96,478 | 6,136 | |
The Fund 37
NOTES TO FINANCIAL STATEMENTS (continued)
| | | | | |
| | Foreign | | | Unrealized | |
| Forward Foreign Currency | Currency | | | Appreciation | |
| Exchange Contracts | Amounts | Proceeds ($) | Value ($) (Depreciation) ($) | |
| Sales (continued): | | | | | |
| New Zealand Dollar, | | | | | |
| Expiring 11/1/2011 | 29,989 | 24,625 | 24,253 | 372 | |
| New Zealand Dollar, | | | | | |
| Expiring 11/18/2011 | 396,000 | 342,559 | 319,850 | 22,709 | |
| New Zealand Dollar, | | | | | |
| Expiring 11/18/2011 | 45,000 | 36,827 | 36,346 | 481 | |
| New Zealand Dollar, | | | | | |
| Expiring 11/18/2011 | 112,000 | 87,231 | 90,462 | (3,231 | ) |
| New Zealand Dollar, | | | | | |
| Expiring 11/18/2011 | 33,000 | 25,579 | 26,654 | (1,075 | ) |
| Norwegian Krone, | | | | | |
| Expiring 11/18/2011 | 510,000 | 93,909 | 91,493 | 2,416 | |
| Norwegian Krone, | | | | | |
| Expiring 11/18/2011 | 36,000 | 6,537 | 6,458 | 79 | |
| Norwegian Krone, | | | | | |
| Expiring 11/18/2011 | 450,000 | 78,962 | 80,729 | (1,767 | ) |
| Norwegian Krone, | | | | | |
| Expiring 11/18/2011 | 176,000 | 30,566 | 31,574 | (1,008 | ) |
| Norwegian Krone, | | | | | |
| Expiring 11/18/2011 | 1,070,000 | 183,079 | 191,957 | (8,878 | ) |
| Norwegian Krone, | | | | | |
| Expiring 11/18/2011 | 790,000 | 145,829 | 141,725 | 4,104 | |
| Polish Zloty, | | | | | |
| Expiring 11/18/2011 | 410,000 | 143,487 | 128,633 | 14,854 | |
| Polish Zloty, | | | | | |
| Expiring 11/18/2011 | 236,000 | 77,635 | 74,042 | 3,593 | |
| Polish Zloty, | | | | | |
| Expiring 11/18/2011 | 222,000 | 72,576 | 69,650 | 2,926 | |
| South African Rand, | | | | | |
| Expiring 11/1/2011 | 492,246 | 63,850 | 62,031 | 1,819 | |
| South African Rand, | | | | | |
| Expiring 11/18/2011 | 1,434,000 | 209,263 | 180,219 | 29,044 | |
| South African Rand, | | | | | |
| Expiring 11/18/2011 | 62,000 | 8,636 | 7,791 | 845 | |
| South African Rand, | | | | | |
| Expiring 11/18/2011 | 575,000 | 79,569 | 72,263 | 7,306 | |
| Swedish Krona, | | | | | |
| Expiring 11/18/2011 | 680,600 | 105,008 | 104,326 | 682 | |
| Gross Unrealized | | | | | |
| Appreciation | | | | 231,677 | |
| Gross Unrealized | | | | | |
| Depreciation | | | | (79,892 | ) |
38
The following summarizes the average market value of derivatives outstanding during the period ended October 31, 2011:
| |
| | Average Market Value ($) |
| Interest rate futures contracts | 336,973 |
| Interest rate options contracts | 752 |
| Forward contracts | 4,726,564 |
At October 31, 2011, the cost of investments for federal income tax purposes was $8,941,785; accordingly, accumulated net unrealized depreciation on investments was $90,545, consisting of $170,050 gross unrealized appreciation and $260,595 gross unrealized depreciation.
The Fund 39
REPORT OF INDEPENDENT REGISTERED
PUBLIC ACCOUNTING FIRM
Shareholders and Board of Directors
Dreyfus Global Dynamic Bond Fund
We have audited the accompanying statement of assets and liabilities, including the statement of investments, of Dreyfus Global Dynamic Bond Fund (one of the series comprising Advantage Funds, Inc.) as of October 31, 2011, and the related statements of operations and changes in net assets and financial highlights for the period from March 25, 2011 (commencement of operations) to October 31, 2011. These financial statements and financial highlights are the responsibility of the Fund’s management. Our responsibility is to express an opinion on these financial statements and financial highlights based on our audit.
We conducted our audit in accordance with the standards of the Public Company Accounting Oversight Board (United States).Those standards require that we plan and perform the audit to obtain reasonable assurance about whether the financial statements and financial highlights are free of material misstatement.We were not engaged to perform an audit of the Fund’s internal control over financial reporting. Our audit included consideration of internal control over financial reporting as a basis for designing audit procedures that are appropriate in the circumstances, but not for the purpose of expressing an opinion on the effectiveness of the Fund’s internal control over financial reporting. Accordingly, we express no such opinion.An audit also includes examining, on a test basis, evidence supporting the amounts and disclosures in the financial statements and financial highlights, assessing the accounting principles used and significant estimates made by management, and evaluating the overall financial statement presentation. Our procedures included confirmation of securities owned as of October 31, 2011 by correspondence with the custodian and others.We believe that our audit provides a reasonable basis for our opinion.
In our opinion, the financial statements and financial highlights referred to above present fairly, in all material respects, the financial position of Dreyfus Global Dynamic Bond Fund at October 31, 2011, and the results of its operations, the changes in its net assets and the financial highlights for the period from March 25, 2011 to October 31, 2011, in conformity with U.S. generally accepted accounting principles.

New York, New York
December 29, 2011
40
BOARD MEMBERS INFORMATION (Unaudited)
|
| Joseph S. DiMartino (68) |
| Chairman of the Board (1995) |
| Principal Occupation During Past 5Years: |
| • Corporate Director and Trustee |
| Other Public Company Board Memberships During Past 5Years: |
| • CBIZ (formerly, Century Business Services, Inc.), a provider of outsourcing functions for small |
| and medium size companies, Director (1997-present) |
| • Sunair Services Corporation, a provider of certain outdoor-related services to homes and |
| businesses, Director (2005-2009) |
| • The Newark Group, a provider of a national market of paper recovery facilities, paperboard |
| mills and paperboard converting plants, Director (2000-2010) |
| No. of Portfolios for which Board Member Serves: 167 |
| ——————— |
| Peggy C. Davis (68) |
| Board Member (2006) |
| Principal Occupation During Past 5Years: |
| • Shad Professor of Law, New York University School of Law |
| • Writer and teacher in the fields of evidence, constitutional theory, family law, social sciences |
| and the law, legal process and professional methodology and training |
| No. of Portfolios for which Board Member Serves: 53 |
| ——————— |
| David P. Feldman (71) |
| Board Member (1996) |
| Principal Occupation During Past 5Years: |
| • Corporate Director and Trustee |
| Other Public Company Board Memberships During Past 5Years: |
| • BBH Mutual Funds Group (4 registered mutual funds), Director (1992-present) |
| • QMed, Inc. a healthcare company, Director (1999-2007) |
| No. of Portfolios for which Board Member Serves: 50 |
The Fund 41
BOARD MEMBERS INFORMATION (Unaudited) (continued)
|
| Ehud Houminer (71) |
| Board Member (1993) |
| Principal Occupation During Past 5Years: |
| • Executive-in-Residence at the Columbia Business School, Columbia University (1992-present) |
| Other Public Company Board Memberships During Past 5Years: |
| • Avnet Inc., an electronics distributor, Director (1993-present) |
| No. of Portfolios for which Board Member Serves: 64 |
| ——————— |
| Dr. Martin Peretz (72) |
| Board Member (2006) |
| Principal Occupation During Past 5Years: |
| • Editor-in-Chief Emeritus of The New Republic Magazine (2010-present) (previously, |
| Editor-in-Chief, 1974-2010) |
| • Director of TheStreet.com, a financial information service on the web (1996-present) |
| No. of Portfolios for which Board Member Serves: 35 |
| ——————— |
| Once elected all Board Members serve for an indefinite term, but achieve Emeritus status upon reaching age 80.The |
| address of the Board Members and Officers is in c/o The Dreyfus Corporation, 200 Park Avenue, NewYork, NewYork |
| 10166.Additional information about the Board Members is available in the fund’s Statement of Additional Information |
| which can be obtained from Dreyfus free of charge by calling this toll free number: 1-800-DREYFUS. |
| James F. Henry, Emeritus Board Member |
| Dr. Paul A. Marks, Emeritus Board Member |
| Gloria Messinger, Emeritus Board Member |
42
OFFICERS OF THE FUND (Unaudited)

The Fund 43
OFFICERS OF THE FUND (Unaudited) (continued)

44
The Fund 45
Dreyfus
Global Real
Return Fund
ANNUAL REPORT October 31, 2011

Save time. Save paper. View your next shareholder report online as soon as it’s available. Log into www.dreyfus.com and sign up for Dreyfus eCommunications. It’s simple and only takes a few minutes.
The views expressed in this report reflect those of the portfolio manager only through the end of the period covered and do not necessarily represent the views of Dreyfus or any other person in the Dreyfus organization. Any such views are subject to change at any time based upon market or other conditions and Dreyfus disclaims any responsibility to update such views.These views may not be relied on as investment advice and, because investment decisions for a Dreyfus fund are based on numerous factors, may not be relied on as an indication of trading intent on behalf of any Dreyfus fund.

| | Contents |
| | THE FUND |
| 2 | A Letter from the Chairman and CEO |
| 3 | Discussion of Fund Performance |
| 6 | Fund Performance |
| 8 | Understanding Your Fund’s Expenses |
| 8 | Comparing Your Fund’s Expenses With Those of Other Funds |
| 9 | Statement of Investments |
| 16 | Statement of Options Written |
| 17 | Statement of Assets and Liabilities |
| 18 | Statement of Operations |
| 19 | Statement of Changes in Net Assets |
| 20 | Financial Highlights |
| 23 | Notes to Financial Statements |
| 41 | Report of Independent Registered Public Accounting Firm |
| 42 | Important Tax Information |
| 43 | Board Members Information |
| 45 | Officers of the Fund |
| | FOR MORE INFORMATION |
| | Back Cover |
|
| Dreyfus |
| Global Real |
| Return Fund |
The Fund

A LETTER FROM THE CHAIRMAN AND CEO
Dear Shareholder:
We present to you this annual report for Dreyfus Global Real Return Fund, covering the 12-month period from November 1, 2010, through October 31, 2011. For information about how the fund performed during the reporting period, as well as general market perspectives, we provide a Discussion of Fund Performance on the pages that follow.
Investors were encouraged by expectations of a more robust economic recovery during the final months of 2010, but sentiment deteriorated in 2011 due to disappointing global economic data, rising commodity prices, an escalating sovereign debt crisis in Europe and a contentious debate regarding taxes, spending and borrowing in the United States. International stocks proved sensitive to these macroeconomic developments, often regardless of underlying company fundamentals, and most international equity market indices ended the reporting period with mildly negative absolute returns.
The global economic outlook currently remains clouded by market turbulence and political infighting, but we believe that a continued subpar global expansion is more likely than a return to recession. Although Europe continues to struggle with a debt crisis, inflationary pressures appear to be waning in most countries as energy prices recently have retreated from their highs. In Asia, China seems to have averted an economic contraction after implementing measures to dampen inflationary pressures. In the United States, moderately low core inflation and an accommodative monetary policy could help support near-trend growth despite ongoing deleveraging activity in the private sector. To assess the potential impact of these and other developments on your investments, we encourage you, as always, to speak with your financial advisor.
Thank you for your continued confidence and support.

Jonathan R. Baum
Chairman and Chief Executive Officer
The Dreyfus Corporation
November 15, 2011
2

DISCUSSION OF FUND PERFORMANCE
For the period of November 1, 2010, through October 31, 2011, as provided by Suzanne Hutchins (Lead) and James Harries (Alternate), Portfolio Managers of Newton Capital Management Limited, Sub-Investment Adviser
Market and Fund Performance Overview
For the one-year period ended October 31, 2011, Dreyfus Global Real Return Fund’s Class A shares produced a total return of 0.52%, Class C shares returned –0.22% and Class I shares returned 0.74%.1 In comparison, the fund’s performance baseline benchmark, the U.S. $ 1-Month London Interbank Offered Rate (LIBOR), and its broad-based securities market index, the Citibank 30-Day Treasury Bill Index, produced total returns of 0.24% and 0.07%, respectively, for the same period.2,3
Global markets proved volatile amid shifting investor perceptions of relative risks.The fund’s Class A and Class I shares produced a positive return with much lower volatility than many risk assets, primarily due to above-average results from the security selection in certain companies and their equity or debt and other instruments including specific bonds and commodities.
The Fund’s Investment Approach
To pursue its goal, the fund uses an actively-managed multi-asset strategy to produce absolute or real returns with less volatility than major equity markets over a complete market cycle, typically a period of five years.The fund is not managed relative to an index. Rather than managing to track a benchmark index, the fund seeks to provide a total return with emphasis on capital preservation.
The fund is unconstrained in its approach and invests in a core of return-seeking assets, including global equities, bonds and cash, and, to a lesser extent, other asset types, including commodities, currencies and alternative or non-traditional asset classes and strategies. Derivatives may be used for capital preservation and risk reduction to protect the core of return-seeking assets to enable the portfolio to meet its investment objective. The fund does not borrow nor will it short individual securities.
The real return team combines a top-down approach, emphasizing economic trends and current long-term investment themes on a global basis, with bottom-up security selection based on fundamental research to allocate the fund’s investments among and within asset classes. In choosing investments, the portfolio managers consider: key trends in global economic variables, such as gross domestic product, inflation and interest rates; investment themes, such as changing demographics, the
The Fund 3
DISCUSSION OF FUND PERFORMANCE (continued)
impact of new technologies and the globalization of industries and brands; relative valuations of equity securities, bonds and cash; long-term trends in currency movements; and company fundamentals. Within markets and sectors, they seek what are believed to be attractively priced companies that possess a sustainable competitive advantage in their market or sector and look to invest in such companies anywhere across their capital structures. It is identifying the right security characteristics that is relevant to the investing environment that is key to investment approach. Income and income generation in a low return world is currently emphasized.
Economic Developments Shook Global Markets
The reporting period began on a positive note with markets driven higher by encouraging economic data. However, global investor sentiment began to deteriorate in late April when pressures mounted on the banking systems of several European nations and Greece moved closer to default on its sovereign debt. Sentiment was further undermined by disappointing U.S. economic data and inflation-fighting measures in the emerging markets.
Caution intensified in August and September, when a major credit-rating agency downgraded its assessment of long-term U.S. government debt. Risk-averse investors shifted their focus away from stocks, most commodities and high yield bonds toward U.S. government bonds and the U.S. dollar. However, riskier assets generally rebounded in October as macroeconomic concerns eased.
Adopting a Cautious Investment Posture
We responded to mounting risks by shifting assets into areas we considered less vulnerable to volatility. We trimmed the fund’s overall stock exposure, reducing or eliminating financial holdings that were hurt by low interest rates and exposure to European debt, such as Royal Sun Alliance, Zurich Financial Services and Nomura Holdings; and emerging market positions, such as Adaro Energy and Advance Info Service.We also decreased the fund’s high yield bond exposure, and we substantially increased the fund’s cash holdings and allocated more assets to active protection strategies, such as index and currency options. These steps enabled us to reduce the fund’s volatility to roughly one-third that of the market at a time of heightened uncertainty.
Stocks modestly enhanced returns in this environment, as did Norwegian bonds and U.S. dollar-denominated bonds. Gold and agricultural commodities added value as well, and cash positions produced slightly positive absolute returns while cushioning volatility. However, the fund’s strategy of hedging back into U.S. dollars, the base liability of investors, was undermined by the relative strength of the euro.
4
Defensively Positioned Amid Economic Uncertainty
We have positioned the fund very defensively and have a significant level of protection around the return-seeking core. Equity holdings emphasize dividend-paying stocks in traditionally defensive industries, such as telecommunications, health care, oil and gas and tobacco. We have reduced high yield bond exposure and specifically only hold the corporate debt of those companies that is asset-backed or well financed by cash flow.There is also a small position in convertible bonds.We have increased the fund’s inflation protection through greater exposure to physical gold and attractively valued gold mining stocks. We believe these are prudent strategies in today’s volatile market environment.
November 15, 2011
| |
| | Equity funds are subject generally to market, market sector, market liquidity, issuer and investment |
| | style risks, among other factors, to varying degrees, all of which are more fully described in the |
| | prospectus of the fund and that of each underlying fund. |
| | The fund’s performance will be influenced by political, social and economic factors affecting |
| | investments in foreign companies. Special risks associated with such companies include exposure to |
| | currency fluctuations, less liquidity, less developed or less efficient trading markets, lack of |
| | comprehensive company information, political instability and differing auditing and legal standards. |
| | Because the fund seeks to provide exposure to alternative or non-traditional (i.e., satellite) asset |
| | categories or investment strategies, the fund’s performance will be linked to the performance of these |
| | highly volatile asset categories and strategies.Accordingly, investors should consider purchasing |
| | shares of the fund only as part of an overall diversified portfolio and should be willing to assume |
| | the risks of potentially significant fluctuations in the value of fund shares. |
| | The fund may, but is not required to, use derivative instruments, such as options, futures and options |
| | on futures, forward contracts and other credit derivatives.A small investment in derivatives could have |
| | a potentially large impact on the fund’s performance.The use of derivatives involves risks different |
| | from, or possibly greater than, the risks associated with investing directly in the underlying assets. |
| 1 | Total return includes reinvestment of dividends and any capital gains paid, and does not take into |
| | consideration the maximum initial sales charge in the case of Class A shares, or the applicable |
| | contingent deferred sales charge imposed on redemptions in the case of Class C shares. Had these |
| | charges been reflected, returns would have been lower. Return figures provided reflect the absorption |
| | of certain fund expenses by The Dreyfus Corporation pursuant to an agreement in effect through |
| | March 1, 2013, at which time it may be extended, modified or terminated. Had these expenses |
| | not been absorbed, the fund’s returns would have been lower. Past performance is no guarantee of |
| | future results. Share price and investment return fluctuate such that upon redemption, fund shares |
| | may be worth more or less than their original cost. |
| 2 | SOURCE: FACTSET – Citigroup 30-Day Treasury Bill Index is a market value-weighted |
| | index of public obligations of the U.S.Treasury with maturities of 30 days. Investors cannot invest |
| | directly in any index. |
| 3 | SOURCE: BLOOMBERG – London Interbank Offered Rate (LIBOR).The rate of interest at |
| | which banks borrow funds, in marketable size, from other banks in the London interbank market. |
| | LIBOR is the most widely used benchmark or reference rate for short term interest rates, and is an |
| | international rate.The London Interbank Offered Rate is fixed each morning at 11 a.m. London |
| | time, by the British Bankers’ Association (BBA).The rate is an average derived from 16 quotations |
| | provided by banks determined by the British Bankers’ Association, the four highest and lowest are |
| | then eliminated and an average of the remaining eight is calculated to arrive at the fix, Eurodollar |
| | Libor is calculated on an ACT/360 day count basis and settlement is for two days hence. |
The Fund 5
FUND PERFORMANCE

|
| † Source: Bloomberg L.P. |
| Past performance is not predictive of future performance. |
| The above graph compares a $10,000 investment made in each of the Class A, Class C and Class I shares of Dreyfus |
| Global Real Return Fund on 5/12/10 (inception date) to a $10,000 investment made in the Citibank 30-Day |
| Treasury Bill Index and the U.S.$ 1-Month London Interbank Offered Rate (LIBOR) Index on that date.All |
| dividends and capital gain distributions are reinvested. |
| The fund’s performance shown in the line graph above takes into account the maximum initial sales charge on Class A |
| shares and all other applicable fees and expenses on all classes.The Citibank 30-Day Treasury Bill Index is a market |
| value-weighted index of public obligations of the U.S.Treasury with maturities of 30 days.The LIBOR is the rate of |
| interest at which banks borrow funds, in marketable size, from other banks in the London interbank market.The LIBOR |
| is the most widely used benchmark or reference rate for short term interest rates, and is an international rate.The LIBOR |
| is fixed each morning at 11 a.m. London time by the British Bankers’ Association (BBA).The rate is an average |
| derived from 16 quotations provided by banks determined by the British Bankers’ Association; the four highest and |
| lowest are then eliminated and an average of the remaining eight is calculated to arrive at the fix. Eurodollar LIBOR is |
| calculated on an ACT/360 day count basis and settlement is for two days hence. Unlike a mutual fund, the indices are |
| not subject to charges, fees and other expenses. Investors cannot invest directly in any index. Further information relating |
| to fund performance, including expense reimbursements, if applicable, is contained in the Financial Highlights section of |
| the prospectus and elsewhere in this report. |
6
| | | | | |
| Average Annual Total Returns as of 10/31/11 | | | | | |
| |
| | Inception | | | From | |
| | Date | 1 | Year | Inception | |
| Class A shares | | | | | |
| with maximum sales charge (5.75%) | 5/12/10 | –5.26 | % | 1.89 | % |
| without sales charge | 5/12/10 | 0.52 | % | 8.08 | % |
| Class C shares | | | | | |
| with applicable redemption charge † | 5/12/10 | –1.22 | % | 6.96 | % |
| without redemption | 5/12/10 | –0.22 | % | 6.96 | % |
| Class I shares | 5/12/10 | 0.74 | % | 8.48 | % |
| U.S. $1-Month London Interbank | | | | | |
| Offered Rate (LIBOR) Index | 4/30/10 | 0.24 | % | 0.26 | %†† |
| Citibank 30-Day Treasury Bill Index | 4/30/10 | 0.07 | % | 0.10 | %†† |
Past performance is not predictive of future performance.The fund’s performance shown in the graph and table does not reflect the deduction of taxes that a shareholder would pay on fund distributions or the redemption of fund shares.
| |
| † | The maximum contingent deferred sales charge for Class C shares is 1% for shares redeemed within one year of the |
| | date of purchase. |
| †† | For comparative purposes, the value of the Index as of 4/30/10 is used as the beginning value on 5/12/10. |
The Fund 7
UNDERSTANDING YOUR FUND’S EXPENSES (Unaudited)
As a mutual fund investor, you pay ongoing expenses, such as management fees and other expenses. Using the information below, you can estimate how these expenses affect your investment and compare them with the expenses of other funds.You also may pay one-time transaction expenses, including sales charges (loads) and redemption fees, which are not shown in this section and would have resulted in higher total expenses. For more information, see your fund’s prospectus or talk to your financial adviser.
Review your fund’s expenses
The table below shows the expenses you would have paid on a $1,000 investment in Dreyfus Global Real Return Fund from May 1, 2011 to October 31, 2011. It also shows how much a $1,000 investment would be worth at the close of the period, assuming actual returns and expenses.
Expenses and Value of a $1,000 Investment
assuming actual returns for the six months ended October 31, 2011
| | | | | | |
| | | Class A | | Class C | | Class I |
| Expenses paid per $1,000† | | $7.38 | | $11.05 | | $6.15 |
| Ending value (after expenses) | | $952.10 | | $948.90 | | $952.90 |
COMPARING YOUR FUND’S EXPENSES
WITH THOSE OF OTHER FUNDS (Unaudited)
Using the SEC’s method to compare expenses
The Securities and Exchange Commission (SEC) has established guidelines to help investors assess fund expenses. Per these guidelines, the table below shows your fund’s expenses based on a $1,000 investment, assuming a hypothetical 5% annualized return. You can use this information to compare the ongoing expenses (but not transaction expenses or total cost) of investing in the fund with those of other funds.All mutual fund shareholder reports will provide this information to help you make this comparison. Please note that you cannot use this information to estimate your actual ending account balance and expenses paid during the period.
Expenses and Value of a $1,000 Investment
assuming a hypothetical 5% annualized return for the six months ended October 31, 2011
| | | | | | |
| | | Class A | | Class C | | Class I |
| Expenses paid per $1,000† | | $7.63 | | $11.42 | | $6.36 |
| Ending value (after expenses) | | $1,017.64 | | $1,013.86 | | $1,018.90 |
|
| † Expenses are equal to the fund’s annualized expense ratio of 1.50% for Class A, 2.25% for Class C and 1.25% |
| for Class I,multiplied by the average account value over the period, multiplied by 184/365 (to reflect the one-half |
| year period). |
8
STATEMENT OF INVESTMENTS
October 31, 2011
| | |
| Common Stocks—55.5% | Shares | Value ($) |
| Australia—2.6% | | |
| Newcrest Mining | 20,033 | 705,701 |
| Brazil—1.6% | | |
| Petroleo Brasileiro, ADR | 14,660 | 370,751 |
| Tele Norte Leste Participacoes, ADR | 7,180 | 77,903 |
| | | 448,654 |
| Canada—3.9% | | |
| Barrick Gold | 11,404 | 564,498 |
| Yamana Gold | 32,917 | 491,402 |
| | | 1,055,900 |
| Denmark—1.0% | | |
| TDC | 32,203 | 266,063 |
| France—2.7% | | |
| Sanofi | 3,276 | 235,535 |
| Total | 9,557 | 500,066 |
| | | 735,601 |
| Germany—4.0% | | |
| Bayer | 11,317 | 724,949 |
| Deutsche Telekom | 28,551 | 363,218 |
| | | 1,088,167 |
| Hong Kong—1.0% | | |
| China Mobile | 28,000 | 266,830 |
| Italy—.8% | | |
| ENI | 10,239 | 226,542 |
| Japan—2.2% | | |
| Asahi Group Holdings | 12,500 | 256,433 |
| INPEX | 53 | 348,689 |
| | | 605,122 |
| Netherlands—1.6% | | |
| Koninklijke KPN | 18,798 | 246,998 |
| Reed Elsevier | 15,615 | 192,557 |
| | | 439,555 |
| Norway—1.1% | | |
| Statoil | 11,400 | 290,880 |
| Peru—.5% | | |
| Cia de Minas Buenaventura, ADR | 3,046 | 124,673 |
The Fund 9
STATEMENT OF INVESTMENTS (continued)
| | | |
| Common Stocks (continued) | Shares | | Value ($) |
| Poland—.8% | | | |
| Telekomunikacja Polska | 40,974 | | 217,710 |
| South Africa—1.0% | | | |
| MTN Group | 14,968 | | 261,277 |
| Switzerland—4.3% | | | |
| Novartis | 6,769 | | 382,559 |
| Roche Holding | 3,538 | | 583,218 |
| Syngenta | 751 | b | 229,715 |
| | | | 1,195,492 |
| United Kingdom—14.6% | | | |
| BAE Systems | 58,777 | | 261,408 |
| BP | 73,467 | | 544,568 |
| British American Tobacco | 6,009 | | 276,764 |
| Cable & Wireless Communications | 54,064 | | 31,503 |
| Centrica | 86,291 | | 411,663 |
| GlaxoSmithKline | 22,501 | | 506,510 |
| NB Global Floating Rate Income Fund | 167,361 | | 167,305 |
| RSA Insurance Group | 32,153 | | 57,748 |
| RWC Global Convertibles Fund | 383 | b | 440,408 |
| SSE | 12,689 | | 274,211 |
| Severn Trent | 11,249 | | 274,203 |
| Smith & Nephew | 25,598 | | 234,812 |
| Tesco | 60,296 | | 389,496 |
| Vodafone Group | 45,642 | | 126,851 |
| | | | 3,997,450 |
| United States—11.8% | | | |
| Annaly Capital Management | 16,058 | c | 270,577 |
| Medtronic | 8,053 | | 279,761 |
| Merck & Co. | 5,908 | | 203,826 |
| Newmont Mining | 4,381 | | 292,782 |
| PDL BioPharma | 13,136 | | 79,735 |
| PowerShares DB Gold Fund | 20,072 | b | 1,206,528 |
| Reynolds American | 14,464 | | 559,467 |
| Sprint Nextel | 41,603 | b | 106,920 |
| Wisconsin Energy | 7,553 | | 244,944 |
| | | | 3,244,540 |
| Total Common Stocks | | | |
| (cost $14,850,937) | | | 15,170,157 |
10
| | | | | | |
| | | Coupon | Maturity | Principal | |
| Bonds and Notes—26.2% | | Rate (%) | Date | Amount ($)a | Value ($) |
| Australia—.2% | | | | | | |
| Santos Finance, | | | | | | |
| Gtd. Notes | EUR | 8.25 | 9/22/70 | 50,000 | d | 64,429 |
| Brazil—.2% | | | | | | |
| Petrobras International Finance, | | | | | | |
| Gtd. Notes | | 7.88 | 3/15/19 | 40,000 | | 48,435 |
| Cayman Islands—.2% | | | | | | |
| Offshore Group Investments, | | | | | | |
| Sr. Scd. Notes | | 11.50 | 8/1/15 | 50,000 | | 54,750 |
| France—.3% | | | | | | |
| Rexel, | | | | | | |
| Gtd. Notes | EUR | 8.25 | 12/15/16 | 65,000 | | 95,337 |
| Germany—.5% | | | | | | |
| HeidelbergCement Finance, | | | | | | |
| Gtd. Bonds | EUR | 7.50 | 4/3/20 | 50,000 | | 69,617 |
| Unitymedia Hessen, | | | | | | |
| Sr. Scd. Notes | EUR | 8.13 | 12/1/17 | 50,000 | | 72,298 |
| | | | | | | 141,915 |
| Ireland—.5% | | | | | | |
| Ardagh Glass Finance, | | | | | | |
| Gtd. Bonds | EUR | 7.13 | 6/15/17 | 50,000 | | 63,477 |
| Smurfit Kappa Acquisitions, | | | | | | |
| Sr. Scd. Bonds | EUR | 7.25 | 11/15/17 | 50,000 | | 71,261 |
| | | | | | | 134,738 |
| Italy—.3% | | | | | | |
| Lottomatica, | | | | | | |
| Jr. Sub. Bonds | EUR | 8.25 | 3/31/66 | 65,000 | d | 79,597 |
| Luxembourg—.2% | | | | | | |
| Lecta, | | | | | | |
| Scd. Notes | EUR | 4.16 | 2/15/14 | 50,000 | d | 65,726 |
| Netherlands—1.3% | | | | | | |
| Cable & Wireless | | | | | | |
| International Finance, | | | | | | |
| Gtd. Bonds | GBP | 8.63 | 3/25/19 | 50,000 | | 74,365 |
| Conti-Gummi Finance, | | | | | | |
| Sr. Scd. Notes | EUR | 7.50 | 9/15/17 | 50,000 | | 71,001 |
| OI European Group, | | | | | | |
| Gtd. Notes | EUR | 6.75 | 9/15/20 | 50,000 | | 68,666 |
| UPC Holding, | | | | | | |
| Sr. Scd. Notes | EUR | 8.38 | 8/15/20 | 50,000 | | 68,493 |
The Fund 11
STATEMENT OF INVESTMENTS (continued)
| | | | | | |
| | | Coupon | Maturity | Principal | | |
| Bonds and Notes (continued) | Rate (%) | Date | Amount ($)a | Value ($) |
| Netherlands (continued) | | | | | | |
| Ziggo Bond Co, | | | | | | |
| Sr. Scd. Notes | EUR | 8.00 | 5/15/18 | 50,000 | | 70,742 |
| | | | | | | 353,267 |
| Norway—4.9% | | | | | | |
| Norwegian Government, | | | | | | |
| Bonds, Ser. 474 | NOK | 3.75 | 5/25/21 | 916,000 | | 178,704 |
| Norwegian Government, | | | | | | |
| Bonds, Ser. 473 | NOK | 4.50 | 5/22/19 | 5,673,000 | | 1,152,058 |
| | | | | | | 1,330,762 |
| South Africa—.2% | | | | | | |
| Edcon Proprietary, | | | | | | |
| Sr. Scd. Notes | EUR | 4.78 | 6/15/14 | 50,000 | d | 59,153 |
| Spain—.3% | | | | | | |
| Campofrio Food Group, | | | | | | |
| Gtd. Notes | EUR | 8.25 | 10/31/16 | 50,000 | | 71,261 |
| United Kingdom—2.6% | | | | | | |
| Anglian Water | | | | | | |
| Services Financing, | | | | | | |
| Sr. Scd. Notes, Ser. A8 | GBP | 3.67 | 7/30/24 | 5,000 | | 13,098 |
| BG Energy Capital, | | | | | | |
| Gtd. Notes | GBP | 5.13 | 12/7/17 | 50,000 | | 89,944 |
| BUPA Finance, | | | | | | |
| Sr. Unscd. Notes | GBP | 7.50 | 7/4/16 | 50,000 | | 88,818 |
| Co-Operative Bank, | | | | | | |
| Sub. Notes | GBP | 5.63 | 11/16/21 | 100,000 | d | 129,543 |
| Dwr Cymru Financing, | | | | | | |
| Bonds | GBP | 1.86 | 3/31/48 | 50,000 | e | 89,247 |
| Ineos Finance, | | | | | | |
| Sr. Scd. Notes | EUR | 9.25 | 5/15/15 | 50,000 | | 69,877 |
| International | | | | | | |
| Personal Finance, | | | | | | |
| Sr. Unscd. Notes | EUR | 11.50 | 8/6/15 | 65,000 | | 82,745 |
| ISS Financing, | | | | | | |
| Scd. Bonds | EUR | 11.00 | 6/15/14 | 50,000 | | 72,817 |
12
| | | | | | |
| | | Coupon | Maturity | Principal | | |
| Bonds and Notes (continued) | Rate (%) | Date | Amount ($)a | Value ($) |
| United Kingdom (continued) | | | | | | |
| National Grid | | | | | | |
| Electricity Transmission, | | | | | | |
| Sr. Unscd. Bonds | GBP | 2.98 | 7/8/18 | 10,000 | | 25,683 |
| Prudential, | | | | | | |
| Jr. Sub. Notes | | 11.75 | 12/29/49 | 44,000 | d | 49,309 |
| | | | | | | 711,081 |
| United States—14.3% | | | | | | |
| Catalent Pharma Solutions, | | | | | | |
| Gtd. Notes | EUR | 9.75 | 4/15/17 | 50,000 | | 65,034 |
| CEDC Finance Corp. | | | | | | |
| International, | | | | | | |
| Sr. Scd. Notes | | 9.13 | 12/1/16 | 100,000 | | 72,500 |
| Cemex Finance, | | | | | | |
| Sr. Scd. Bonds | | 9.50 | 12/14/16 | 100,000 | | 88,380 |
| Clearwire Communications, | | | | | | |
| Sr. Scd. Notes | | 12.00 | 12/1/15 | 100,000 | | 86,000 |
| Nextel Communications, | | | | | | |
| Gtd. Notes, Ser. E | | 6.88 | 10/31/13 | 34,000 | | 33,745 |
| Nextel Communications, | | | | | | |
| Gtd. Notes, Ser. D | | 7.38 | 8/1/15 | 80,000 | | 76,800 |
| U.S. Treasury Inflation | | | | | | |
| Protected Securities, Notes | | 2.50 | 1/15/29 | 511,714 | f | 670,825 |
| U.S. Treasury Notes | | 0.75 | 11/30/11 | 2,749,800 | | 2,751,733 |
| US Bank, | | | | | | |
| Sub. Notes | EUR | 4.38 | 2/28/17 | 50,000 | d | 64,688 |
| | | | | | | 3,909,705 |
| Venezuela—.2% | | | | | | |
| Petroleos De Venezuela, | | | | | | |
| Gtd. Notes | | 8.00 | 11/17/13 | 11,250 | g | 10,378 |
| Petroleos De Venezuela, | | | | | | |
| Gtd. Notes | | 8.00 | 11/17/13 | 55,000 | | 50,738 |
| | | | | | | 61,116 |
| Total Bonds And Notes | | | | | | |
| (cost $7,093,493) | | | | | | 7,181,272 |
The Fund 13
STATEMENT OF INVESTMENTS (continued)
| | | |
| | Number of | | |
| Options Purchased—.3% | Contracts ($) | | Value ($) |
| Put Options | | | |
| Euro Futures, | | | |
| December 2011 @ $1.28 | 9 | b | 3,937 |
| Australian Dollar Futures, | | | |
| December 2011 @ $100 | 5 | b | 4,650 |
| FTSE 100 Index Futures, | | | |
| November 2011 @ GBP 5,100 | 44 | b | 13,315 |
| S&P 500 Index Futures, | | | |
| November 2011 @ $1,110 | 6 | b | 2,160 |
| S&P 500 Index Futures, | | | |
| December 2011 @ $1,150 | 26 | b | 44,200 |
| Total Options | | | |
| (cost $227,440) | | | 68,262 |
14
| | | | |
| | | Principal | | |
| Short-Term Investments—9.9% | Amount ($) | | Value ($) |
| | U.S. Treasury Bills; | | | |
| | 0.16%, 3/8/12 | | | |
| | (cost $2,710,703) | 2,711,000 | | 2,710,783 |
| | Total Investments (cost $24,882,573) | 91.9 | % | 25,130,474 |
| | Cash and Receivables (Net) | 8.1 | % | 2,221,120 |
| | Net Assets | 100.0 | % | 27,351,594 |
ADR—American Depository Receipts
GBP—British Pound
|
| a Principal amount stated in U.S. Dollars unless otherwise noted. |
| EUR—Euro |
| GBP—British Pound |
| NOK—Norwegian Krone |
| b Non-income producing security. |
| c Investment in real estate investment trust. |
| d Variable rate security—interest rate subject to periodic change. |
| e Principal amount for accrual purposes is periodically adjusted based on changes in the British Consumer Price Index. |
| f Principal amount for accrual purposes is periodically adjusted based on changes in the U.S. Consumer Price Index. |
| g Security exempt from registration under Rule 144A of the Securities Act of 1933.This security may be resold in |
| transactions exempt from registration, normally to qualified institutional buyers.At October 31, 2011, this security |
| was valued at $10,378 or .04% of net assets. |
| | | |
| Portfolio Summary (Unaudited)† | | |
| |
| | Value (%) | | Value (%) |
| Materials | 12.8 | Utilities | 4.5 |
| U.S. Government Securities | 12.5 | Exchange Traded Funds | 4.4 |
| Short-Term Investments | 9.9 | Mutual Funds: Foreign | 2.2 |
| Health Care | 9.4 | Industrial | 1.0 |
| Telecommunications | 8.4 | Consumer Discretionary | .8 |
| Energy | 8.1 | Oil & Gas | .8 |
| Consumer Staples | 6.4 | Information Technology | .6 |
| Foreign/Governmental | 4.9 | Options Purchased | .3 |
| Financial | 4.9 | | 91.9 |
| |
| † Based on net assets. | | | |
| See notes to financial statements. | | | |
The Fund 15
| | | | |
| STATEMENT OF OPTIONS WRITTEN | | | | |
| October 31, 2011 | | | | |
| |
| |
| |
| | Number of | | | |
| | Contracts | | Value ($) | |
| Call Options: | | | | |
| FTSE 100 Futures, | | | | |
| November 2011 @ GBP 5,650 | 40 | a | (35,320 | ) |
| FTSE 100 Futures, | | | | |
| November 2011 @ GBP 5,700 | 6 | a | (3,639 | ) |
| FTSE 100 Futures, | | | | |
| November 2011 @ GBP 5,750 | 7 | a | (2,665 | ) |
| S&P 500 Index Futures, | | | | |
| November 2011 @ $1,230 | 8 | a | (36,800 | ) |
| S&P 500 Index Futures, | | | | |
| December 2011 @ $1,300 | 17 | a | (30,600 | ) |
| S&P 500 Index Futures, | | | | |
| December 2011 @ $1,320 | 6 | a | (8,400 | ) |
| Put Options: | | | | |
| FTSE 100 Futures, | | | | |
| November 2011 @ GBP 4,800 | 44 | a | (4,902 | ) |
| S&P 500 Index Futures, | | | | |
| November 2011 @ $1,050 | 6 | a | (1,170 | ) |
| S&P 500 Index Futures, | | | | |
| December 2011 @ $1,080 | 26 | a | (24,310 | ) |
| (premiums received $201,111) | | | (147,806 | ) |
| |
| GBP—British Pound | | | | |
| a Non-income producing security. | | | | |
| See notes to financial statements. | | | | |
16
STATEMENT OF ASSETS AND LIABILITIES
October 31, 2011
| | |
| | Cost | Value |
| Assets ($): | | |
| Investments in securities—See Statement of Investments | 24,882,573 | 25,130,474 |
| Cash | | 3,310,324 |
| Cash denominated in foreign currencies | 9,488 | 9,239 |
| Unrealized appreciation on forward foreign | | |
| currency exchange contracts—Note 4 | | 169,310 |
| Dividends and interest receivable | | 128,969 |
| Receivable for investment securities sold | | 117,121 |
| Receivable for shares of Common Stock subscribed | | 5,500 |
| Prepaid expenses | | 10,923 |
| | | 28,881,860 |
| Liabilities ($): | | |
| Due to The Dreyfus Corporation and affiliates—Note 3(c) | | 15,945 |
| Bank loan payable—Note 2 | | 1,100,000 |
| Outstanding options written, at value (premiums received | | |
| $201,111)—See Statement of Options Written—Note 4 | | 147,806 |
| Unrealized depreciation on forward foreign | | |
| currency exchange contracts—Note 4 | | 122,436 |
| Payable for investment securities purchased | | 64,250 |
| Payable for shares of Common Stock redeemed | | 17,384 |
| Interest payable—Note 2 | | 36 |
| Accrued expenses | | 62,409 |
| | | 1,530,266 |
| Net Assets ($) | | 27,351,594 |
| Composition of Net Assets ($): | | |
| Paid-in capital | | 26,753,305 |
| Accumulated undistributed investment income—net | | 35,066 |
| Accumulated net realized gain (loss) on investments | | 215,097 |
| Accumulated net unrealized appreciation (depreciation) on | | |
| investments, options transactions and foreign currency transactions | 348,126 |
| Net Assets ($) | | 27,351,594 |
| | | |
| Net Asset Value Per Share | | | |
| | Class A | Class C | Class I |
| Net Assets ($) | 5,116,841 | 1,190,487 | 21,044,266 |
| Shares Outstanding | 378,741 | 89,070 | 1,551,746 |
| Net Asset Value Per Share ($) | 13.51 | 13.37 | 13.56 |
| |
| See notes to financial statements. | | | |
The Fund 17
| | |
| STATEMENT OF OPERATIONS | | |
| Year Ended October 31, 2011 | | |
| |
| |
| |
| |
| Investment Income ($): | | |
| Income: | | |
| Cash dividends (net of $13,206 foreign taxes withheld at source): | | |
| Unaffiliated issuers | 213,572 | |
| Affiliated issuers | 1,188 | |
| Interest | 94,599 | |
| Total Income | 309,359 | |
| Expenses: | | |
| Management fee—Note 3(a) | 98,295 | |
| Registration fees | 59,484 | |
| Auditing fees | 57,135 | |
| Legal fees | 44,970 | |
| Shareholder servicing costs—Note 3(c) | 15,642 | |
| Custodian fees—Note 3(c) | 14,646 | |
| Prospectus and shareholders’ reports | 11,701 | |
| Distribution fees—Note 3(b) | 8,407 | |
| Directors’ fees and expenses—Note 3(d) | 321 | |
| Loan commitment fees—Note 2 | 262 | |
| Interest expense—Note 2 | 36 | |
| Miscellaneous | 16,532 | |
| Total Expenses | 327,431 | |
| Less—expense reimbursement from The Dreyfus | | |
| Corporation due to undertaking—Note 3(a) | (169,247 | ) |
| Less—reduction in fees due to earnings credits—Note 3(c) | (5 | ) |
| Net Expenses | 158,179 | |
| Investment Income—Net | 151,180 | |
| Realized and Unrealized Gain (Loss) on Investments—Note 4 ($): | | |
| Net realized gain (loss) on investments and foreign currency transactions | 260,819 | |
| Net realized gain (loss) on options transactions | (2,082 | ) |
| Net realized gain (loss) on forward foreign currency exchange contracts | (343,417 | ) |
| Net Realized Gain (Loss) | (84,680 | ) |
| Net unrealized appreciation (depreciation) on | | |
| investments and foreign currency transactions | (190,976 | ) |
| Net unrealized appreciation (depreciation) on options transactions | (87,616 | ) |
| Net unrealized appreciation (depreciation) on | | |
| forward foreign currency exchange contracts | 230,586 | |
| Net Unrealized Appreciation (Depreciation) | (48,006 | ) |
| Net Realized and Unrealized Gain (Loss) on Investments | (132,686 | ) |
| Net Increase in Net Assets Resulting from Operations | 18,494 | |
| |
| See notes to financial statements. | | |
18
STATEMENT OF CHANGES IN NET ASSETS
| | | | |
| | Year Ended October 31, | |
| | 2011 | | 2010 | a |
| Operations ($): | | | | |
| Investment income—net | 151,180 | | 20,530 | |
| Net realized gain (loss) on investments | (84,680 | ) | (41,712 | ) |
| Net unrealized appreciation | | | | |
| (depreciation) on investments | (48,006 | ) | 396,132 | |
| Net Increase (Decrease) in Net Assets | | | | |
| Resulting from Operations | 18,494 | | 374,950 | |
| Capital Stock Transactions ($): | | | | |
| Net proceeds from shares sold: | | | | |
| Class A Shares | 2,125,479 | | 3,112,873 | |
| Class C Shares | 123,078 | | 1,000,000 | |
| Class I Shares | 21,104,956 | | 1,000,000 | |
| Cost of shares redeemed: | | | | |
| Class A Shares | (346,366 | ) | — | |
| Class I Shares | (1,161,870 | ) | — | |
| Increase (Decrease) in Net Assets | | | | |
| from Capital Stock Transactions | 21,845,277 | | 5,112,873 | |
| Total Increase (Decrease) in Net Assets | 21,863,771 | | 5,487,823 | |
| Net Assets ($): | | | | |
| Beginning of Period | 5,487,823 | | — | |
| End of Period | 27,351,594 | | 5,487,823 | |
| Undistributed investment income—net | 35,066 | | 182,675 | |
| Capital Share Transactions (Shares): | | | | |
| Class A | | | | |
| Shares sold | 155,976 | | 248,511 | |
| Shares redeemed | (25,746 | ) | — | |
| Net Increase (Decrease) in Shares Outstanding | 130,230 | | 248,511 | |
| Class C | | | | |
| Shares sold | 9,070 | | 80,000 | |
| Class I | | | | |
| Shares sold | 1,558,088 | | 80,000 | |
| Shares redeemed | (86,342 | ) | — | |
| Net Increase (Decrease) in Shares Outstanding | 1,471,746 | | 80,000 | |
| |
| a From May 12, 2010 (commencement of operations) to October 31, 2010. | | | |
| See notes to financial statements. | | | | |
The Fund 19
FINANCIAL HIGHLIGHTS
The following tables describe the performance for each share class for the fiscal periods indicated.All information (except portfolio turnover rate) reflects financial results for a single fund share.Total return shows how much your investment in the fund would have increased (or decreased) during each period, assuming you had reinvested all dividends and distributions.These figures have been derived from the fund’s financial statements.
| | | | |
| | Year Ended October 31, | |
| Class A Shares | 2011 | | 2010 | a |
| Per Share Data ($): | | | | |
| Net asset value, beginning of period | 13.44 | | 12.50 | |
| Investment Operations: | | | | |
| Investment income—netb | .20 | | .06 | |
| Net realized and unrealized | | | | |
| gain (loss) on investments | (.13 | ) | .88 | |
| Total from Investment Operations | .07 | | .94 | |
| Net asset value, end of period | 13.51 | | 13.44 | |
| Total Return (%)c | .52 | | 7.52 | d |
| Ratios/Supplemental Data (%): | | | | |
| Ratio of total expenses to average net assets | 3.53 | | 5.96 | e |
| Ratio of net expenses to average net assets | 1.50 | | 1.50 | e |
| Ratio of net investment income | | | | |
| to average net assets | 1.46 | | .94 | e |
| Portfolio Turnover Rate | 42.97 | | 49.61 | d |
| Net Assets, end of period ($ x 1,000) | 5,117 | | 3,340 | |
| |
| a | From May 12, 2010 (commencement of operations) to October 31, 2010. |
| b | Based on average shares outstanding at each month end. |
| c | Exclusive of sales charge. |
| d | Not annualized. |
| e | Annualized. |
See notes to financial statements.
20
| | | | |
| | Year Ended October 31, | |
| Class C Shares | 2011 | | 2010 | a |
| Per Share Data ($): | | | | |
| Net asset value, beginning of period | 13.39 | | 12.50 | |
| Investment Operations: | | | | |
| Investment income—netb | .10 | | .01 | |
| Net realized and unrealized | | | | |
| gain (loss) on investments | (.12 | ) | .88 | |
| Total from Investment Operations | (.02 | ) | .89 | |
| Net asset value, end of period | 13.37 | | 13.39 | |
| Total Return (%)c | (.22 | ) | 7.20 | d |
| Ratios/Supplemental Data (%): | | | | |
| Ratio of total expenses to average net assets | 4.37 | | 6.75 | e |
| Ratio of net expenses to average net assets | 2.25 | | 2.25 | e |
| Ratio of net investment income | | | | |
| to average net assets | .75 | | .20 | e |
| Portfolio Turnover Rate | 42.97 | | 49.61 | d |
| Net Assets, end of period ($ x 1,000) | 1,190 | | 1,071 | |
| |
| a | From May 12, 2010 (commencement of operations) to October 31, 2010. |
| b | Based on average shares outstanding at each month end. |
| c | Exclusive of sales charge. |
| d | Not annualized. |
| e | Annualized. |
See notes to financial statements.
The Fund 21
FINANCIAL HIGHLIGHTS (continued)
| | | | |
| | Year Ended October 31, | |
| Class I Shares | 2011 | | 2010 | a |
| Per Share Data ($): | | | | |
| Net asset value, beginning of period | 13.46 | | 12.50 | |
| Investment Operations: | | | | |
| Investment income—netb | .18 | | .07 | |
| Net realized and unrealized | | | | |
| gain (loss) on investments | (.08 | ) | .89 | |
| Total from Investment Operations | .10 | | .96 | |
| Net asset value, end of period | 13.56 | | 13.46 | |
| Total Return (%) | .74 | | 7.68 | c |
| Ratios/Supplemental Data (%): | | | | |
| Ratio of total expenses to average net assets | 2.33 | | 5.75 | d |
| Ratio of net expenses to average net assets | 1.25 | | 1.25 | d |
| Ratio of net investment income | | | | |
| to average net assets | 1.46 | | 1.19 | d |
| Portfolio Turnover Rate | 42.97 | | 49.61 | c |
| Net Assets, end of period ($ x 1,000) | 21,044 | | 1,076 | |
| |
| a | From May 12, 2010 (commencement of operations) to October 31, 2010. |
| b | Based on average shares outstanding at each month end. |
| c | Not annualized. |
| d | Annualized. |
See notes to financial statements.
22
NOTES TO FINANCIAL STATEMENTS
NOTE 1—Significant Accounting Policies:
Dreyfus Global Real Return Fund (the “fund”) is a separate non-diversified series of Advantage Funds, Inc. (the “Company”), which is registered under the Investment Company Act of 1940, as amended (the “Act”), as an open-end management investment company and operates as a series company that offers twelve series, including the fund.The fund’s investment objective is to seek total return (consisting of capital appreciation and income). The Dreyfus Corporation (the “Manager” or “Dreyfus”), a wholly-owned subsidiary of The Bank of NewYork Mellon Corporation (“BNY Mellon”), serves as the fund’s investment adviser. Newton Capital Management Limited (“Newton”) serves as the fund’s sub-investment adviser. Newton is a wholly-owned subsidiary of BNY Mellon and an affiliate of Dreyfus.
MBSC Securities Corporation (the “Distributor”), a wholly-owned subsidiary of Dreyfus, is the distributor of the fund’s shares.The fund is authorized to issue 100 million shares of $.001 par value Common Stock in each of the following classes of shares: Class A, Class C and Class I. Class A shares are subject to a sales charge imposed at the time of purchase. Class C shares are subject to a contingent deferred sales charge (“CDSC”) imposed on Class C shares redeemed within one year of purchase. Class I shares are sold at net asset value per share only to institutional investors. Other differences between the classes include the services offered to and the expenses borne by each class, the allocation of certain transfer agency costs and certain voting rights. Income, expenses (other than expenses attributable to a specific class) and realized and unrealized gains or losses on investments are allocated to each class of shares based on its relative net assets.
As of October 31, 2011, MBC Investments Corp., an indirect subsidiary of BNY Mellon, held 240,000 Class A, 80,000 Class C and 80,000 Class I shares of the fund.
The Fund 23
NOTES TO FINANCIAL STATEMENTS (continued)
The Company accounts separately for the assets, liabilities and operations of each series. Expenses directly attributable to each series are charged to that series’ operations; expenses which are applicable to all series are allocated among them on a pro rata basis.
The Financial Accounting Standards Board (“FASB”) Accounting Standards Codification (“ASC”) is the exclusive reference of authoritative U.S. generally accepted accounting principles (“GAAP”) recognized by the FASB to be applied by nongovernmental entities. Rules and interpretive releases of the Securities and Exchange Commission (“SEC”) under authority of federal laws are also sources of authoritative GAAP for SEC registrants. The fund’s financial statements are prepared in accordance with GAAP, which may require the use of management estimates and assumptions.Actual results could differ from those estimates.
The Company enters into contracts that contain a variety of indemnifications.The fund’s maximum exposure under these arrangements is unknown.The fund does not anticipate recognizing any loss related to these arrangements.
(a) Portfolio valuation: The fair value of a financial instrument is the amount that would be received to sell an asset or paid to transfer a liability in an orderly transaction between market participants at the measurement date (i.e. the exit price). GAAP establishes a fair value hierarchy that prioritizes the inputs of valuation techniques used to measure fair value.This hierarchy gives the highest priority to unadjusted quoted prices in active markets for identical assets or liabilities (Level 1 measurements) and the lowest priority to unobservable inputs (Level 3 measurements).
Additionally, GAAP provides guidance on determining whether the volume and activity in a market has decreased significantly and whether such a decrease in activity results in transactions that are not orderly. GAAP requires enhanced disclosures around valuation inputs and techniques used during annual and interim periods.
24
Various inputs are used in determining the value of the fund’s investments relating to fair value measurements.These inputs are summarized in the three broad levels listed below:
Level 1—unadjusted quoted prices in active markets for identical investments.
Level 2—other significant observable inputs (including quoted prices for similar investments, interest rates, prepayment speeds, credit risk, etc.).
Level 3—significant unobservable inputs (including the fund’s own assumptions in determining the fair value of investments).
The inputs or methodology used for valuing securities are not necessarily an indication of the risk associated with investing in those securities.
Changes in valuation techniques may result in transfers in or out of an assigned level within the disclosure hierarchy. Valuation techniques used to value the fund’s investments are as follows:
Investments in equity securities are valued at the last sales price on the securities exchange or national securities market on which such securities are primarily traded. Securities listed on the National Market System for which market quotations are available are valued at the official closing price or, if there is no official closing price that day, at the last sales price. Securities not listed on an exchange or the national securities market, or securities for which there were no transactions, are valued at the average of the most recent bid and asked prices, except for open short positions, where the asked price is used for valuation purposes. Bid price is used when no asked price is available. Registered investment companies that are not traded on an exchange are valued at their net asset value. All preceding securities are categorized within Level 1 of the fair value hierarchy.
Investments in debt securities excluding short-term investments (other than U.S.Treasury Bills), options and forward foreign currency
The Fund 25
NOTES TO FINANCIAL STATEMENTS (continued)
exchange contracts (“forward contracts”) are valued each business day by an independent pricing service (the “Service”) approved by the Board of Directors. Investments for which quoted bid prices are readily available and are representative of the bid side of the market in the judgment of the Service are valued at the mean between the quoted bid prices (as obtained by the Service from dealers in such securities) and asked prices (as calculated by the Service based upon its evaluation of the market for such securities). Other investments are valued as determined by the Service, based on methods which include consideration of: yields or prices of securities of comparable quality, coupon, maturity and type; indications as to values from dealers; and general market conditions. These securities are generally categorized within Level 2 of the fair value hierarchy.
U.S. Treasury Bills are valued at the mean price between quoted bid prices and asked prices by an independent pricing service approved by the Board of Directors. These securities are generally categorized within Level 2 of the fair value hierarchy.
Fair valuing of securities may be determined with the assistance of a pricing service using calculations based on indices of domestic securities and other appropriate indicators, such as prices of relevant ADRs and futures contracts. Utilizing these techniques may result in transfers between Level 1 and Level 2 of the fair value hierarchy.
When market quotations or official closing prices are not readily available, or are determined not to reflect accurately fair value, such as when the value of a security has been significantly affected by events after the close of the exchange or market on which the security is principally traded (for example, a foreign exchange or market), but before the fund calculates its net asset value, the fund may value these investments at fair value as determined in accordance with the procedures approved by the Board of Directors. Certain factors may be considered when fair valuing investments such as: fundamental analytical data, the nature and duration of restrictions on disposition, an evaluation of the forces that influence the market in which the securities are purchased and sold, and
26
public trading in similar securities of the issuer or comparable issuers. These securities are either categorized as Level 2 or 3 depending on the relevant inputs used.
For restricted securities where observable inputs are limited, assumptions about market activity and risk are used and are categorized within Level 3 of the fair value hierarchy.
Options, which are traded on an exchange, are valued at the last sales price on the securities exchange on which such securities are primarily traded or at the last sales price on the national securities market on each business day. These securities are generally categorized within Level 1 of the fair value hierarchy. Options traded over-the-counter are valued at the mean between the bid and asked price.These securities are generally categorized within Level 2 of the fair value hierarchy. Investments denominated in foreign currencies are translated to U.S. dollars at the prevailing rates of exchange. Forward contracts are valued at the forward rate. These securities are generally categorized within Level 2 of the fair value hierarchy.
The following is a summary of the inputs used as of October 31, 2011 in valuing the fund’s investments:
| | | | | |
| | | Level 2—Other | | Level 3— | |
| | Level 1— | Significant | | Significant | |
| | Unadjusted | Observable | | Unobservable | |
| | Quoted Prices | Inputs | | Inputs | Total |
| Assets ($) | | | | | |
| Investments in Securities: | | | | |
| Corporate Bonds† | — | 2,427,952 | | — | 2,427,952 |
| Equity Securities— | | | | | |
| Domestic† | 2,038,012 | — | | — | 2,038,012 |
| Equity Securities— | | | | | |
| Foreign† | 9,740,251 | 1,577,653 | †† | — | 11,317,904 |
| Foreign Government | — | 1,330,762 | | — | 1,330,762 |
| Mutual Funds/Exchange | | | | | |
| Traded Funds | 1,814,241 | — | | — | 1,814,241 |
| U.S. Treasury | — | 6,133,341 | | — | 6,133,341 |
The Fund 27
NOTES TO FINANCIAL STATEMENTS (continued)
| | | | | | | |
| | | | Level 2—Other | | Level 3— | | |
| | Level 1— | | Significant | | Significant | | |
| | Unadjusted | | Observable | | Unobservable | | |
| | Quoted Prices | | Inputs | | Inputs | Total | |
| Assets ($) (continued) | | | | | | | |
| Other Financial | | | | | | | |
| Instruments: | | | | | | | |
| Forward Foreign | | | | | | | |
| Currency Exchange | | | | | | | |
| Contracts††† | — | | 169,310 | | — | 169,310 | |
| Options Purchased | 59,675 | | 8,587 | | — | 68,262 | |
| Liabilities ($) | | | | | | | |
| Other Financial | | | | | | | |
| Instruments: | | | | | | | |
| Forward Foreign | | | | | | | |
| Currency Exchange | | | | | | | |
| Contracts††† | — | | (122,436 | ) | — | (122,436 | ) |
| Options Written | (147,806 | ) | — | | — | (147,806 | ) |
| |
| † | See Statement of Investments for additional detailed categorizations. |
| †† | Securities classified as Level 2 at period end as the values were determined pursuant to the fund’s |
| | fair valuation procedures. |
| ††† Amount shown represents unrealized appreciation (depreciation) at period end. |
In May 2011, FASB issued Accounting Standards Update (“ASU”) No. 2011-04 “Amendments to Achieve Common FairValue Measurement and Disclosure Requirements in GAAP and International Financial Reporting Standards (“IFRS”)” (“ASU 2011-04”). ASU 2011-04 includes common requirements for measurement of and disclosure about fair value between GAAP and IFRS. ASU 2011-04 will require reporting entities to disclose the following information for fair value measurements categorized within Level 3 of the fair value hierarchy: quantitative information about the unobservable inputs used in the fair value measurement, the valuation processes used by the reporting entity and a narrative description of the sensitivity of the fair value measurement to changes in unobservable inputs and the interrelationships between those unobservable inputs. In addition, ASU 2011-04 will require reporting entities to make disclosures about amounts and reasons for all transfers in and out of Level 1 and Level 2 fair value mea-surements.The new and revised disclosures are effective for interim and
28
annual reporting periods beginning after December 15, 2011. At this time, management is evaluating the implications of ASU 2011-04 and its impact on the financial statements.
(b) Foreign currency transactions: The fund does not isolate that portion of the results of operations resulting from changes in foreign exchange rates on investments from the fluctuations arising from changes in the market prices of securities held. Such fluctuations are included with the net realized and unrealized gain or loss on investments.
Net realized foreign exchange gains or losses arise from sales of foreign currencies, currency gains or losses realized on securities transactions between trade date and settlement date, and the difference between the amounts of dividends, interest and foreign withholding taxes recorded on the fund’s books and the U.S. dollar equivalent of the amounts actually received or paid. Net unrealized foreign exchange gains or losses arise from changes in the value of assets and liabilities other than investments resulting from changes in exchange rates. Foreign currency gains and losses on investments are included with net realized and unrealized gain or loss on investments.
(c) Securities transactions and investment income: Securities transactions are recorded on a trade date basis. Realized gains and losses from securities transactions are recorded on the identified cost basis. Dividend income is recognized on the ex-dividend date and interest income, including, where applicable, accretion of discount and amortization of premium on investments, is recognized on the accrual basis.
Investing in foreign markets may involve special risks and considerations not typically associated with investing in the U.S. These risks include revaluation of currencies, high rates of inflation, repatriation restrictions on income and capital, and adverse political and economic developments. Moreover, securities issued in these markets may be less liquid, subject to government ownership controls and delayed settlements, and their prices may be more volatile than those of comparable securities in the U.S.
The Fund 29
NOTES TO FINANCIAL STATEMENTS (continued)
(d) Affiliated issuers: Investments in other investment companies advised by Dreyfus are defined as “affiliated” in the Act.
The fund may invest in shares of certain affiliated investment companies also advised or managed by Dreyfus. Investments in affiliated investment companies for the period ended October 31, 2011 were as follows:
| | | | | | | |
| Affiliated | | | | | | | |
| Investment | Value | | | | Value | | Net |
| Company | 10/31/2010 | ($) | Purchases ($) | Sales ($) | 10/31/2011 | ($) | Assets (%) |
| Dreyfus | | | | | | | |
| Institutional | | | | | | | |
| Preferred | | | | | | | |
| Plus Money | | | | | | | |
| Market Fund | 700,000 | | 24,768,000 | 25,468,000 | — | | — |
(e) Dividends to shareholders: Dividends are recorded on the ex-dividend date. Dividends from investment income-net and dividends from net realized capital gains, if any, are normally declared and paid annually, but the fund may make distributions on a more frequent basis to comply with the distribution requirements of the Internal Revenue Code of 1986, as amended (the “Code”).To the extent that net realized capital gains can be offset by capital loss carryovers, it is the policy of the fund not to distribute such gains. Income and capital gain distributions are determined in accordance with income tax regulations, which may differ from GAAP.
(f) Federal income taxes: It is the policy of the fund to continue to qualify as a regulated investment company, if such qualification is in the best interests of its shareholders, by complying with the applicable provisions of the Code, and to make distributions of taxable income sufficient to relieve it from substantially all federal income and excise taxes.
As of and during the period ended October 31, 2011, the fund did not have any liabilities for any uncertain tax positions.The fund recognizes interest and penalties, if any, related to uncertain tax positions as income tax expense in the Statement of Operations. During the period, the fund did not incur any interest or penalties.
Each of the tax years in the two-year period ended October 31, 2011 remains subject to examination by the Internal Revenue Service and state taxing authorities.
30
At October 31, 2011, the components of accumulated earnings on tax basis were as follows: undistributed ordinary income $202,855, undistributed capital gains $53,899 and unrealized appreciation $341,535.
During the period ended October 31, 2011, as a result of permanent book to tax differences, primarily due to the tax treatment for foreign currency gains and losses and real estate investment trusts, the fund decreased accumulated undistributed investment income-net by $298,789 and increased accumulated net realized gain (loss) on investments by the same amount. Net assets and net asset value per share were not affected by this reclassification.
NOTE 2—Bank Lines of Credit:
The fund participates with other Dreyfus-managed funds in a $225 million unsecured credit facility led by Citibank, N.A. and a $300 million unsecured credit facility provided by The Bank of NewYork Mellon, a subsidiary of BNY Mellon and an affiliate of Dreyfus (each, a “Facility”), each to be utilized primarily for temporary or emergency purposes, including the financing of redemptions. In connection therewith, the fund has agreed to pay its pro rata portion of commitment fees for each Facility. Interest is charged to the fund based on rates determined pursuant to the terms of the respective Facility at the time of borrowing.
The average amount of borrowings outstanding under the Facilities during the period ended October 31, 2011, was approximately $3,000 with a related weighted average annualized interest rate of 1.18%.
NOTE 3—Management Fee, Sub-Investment Advisory Fee and Other Transactions With Affiliates:
(a) Pursuant to a management agreement with Dreyfus, the management fee is computed at the annual rate of .90% of the value of the fund’s average daily net assets and is payable monthly. Dreyfus has contractually agreed, until March 1, 2013, to waive receipt of its fees and/or assume the direct expenses of the fund so that the expenses of none of the classes (excluding Rule 12b-1 fees, shareholder services fees, taxes, interest expense, brokerage commissions, commitment fees on borrowings and
The Fund 31
NOTES TO FINANCIAL STATEMENTS (continued)
extraordinary expenses) exceed 1.25% of the value of the fund’s average daily net assets.The expense reimbursement, pursuant to the undertaking, amounted to $169,247 during the period ended October 31, 2011.
Pursuant to a Sub-Investment Advisory Agreement between Dreyfus and Newton, Dreyfus pays Newton an annual fee of .43% of the value of the fund’s average daily net assets, payable monthly.
During the period ended October 31, 2011, the Distributor retained $4,010 from commissions earned on sales of the fund’s Class A shares.
(b) Under the Distribution Plan (the “Plan”) adopted pursuant to Rule 12b-1 under the Act, Class C shares pay the Distributor for distributing its shares at an annual rate of .75% of the value of the average daily net assets of Class C shares. During the period ended October 31, 2011, Class C shares were charged $8,407 pursuant to the Plan.
(c) Under the Shareholder Services Plan, Class A and Class C shares pay the Distributor at an annual rate of .25% of the value of their average daily net assets for the provision of certain services.The services provided may include personal services relating to shareholder accounts, such as answering shareholder inquiries regarding the fund and providing reports and other information, and services related to the maintenance of shareholder accounts.The Distributor may make payments to Service Agents (a securities dealer, financial institution or other industry professional) in respect of these services.The Distributor determines the amounts to be paid to Service Agents. During the period ended October 31, 2011, Class A and Class C shares were charged $10,405 and $2,802, respectively, pursuant to the Shareholder Services Plan.
The fund compensates Dreyfus Transfer, Inc., a wholly-owned subsidiary of Dreyfus, under a transfer agency agreement for providing personnel and facilities to perform transfer agency services for the fund. During the period ended October 31, 2011, the fund was charged $1,305 pursuant to the transfer agency agreement, which is included in Shareholder servicing costs in the Statement of Operations.
The fund has arrangements with the custodian and cash management bank whereby the fund may receive earnings credits when positive cash
32
balances are maintained, which are used to offset custody and cash management fees. For financial reporting purposes, the fund includes net earnings credits as an expense offset in the Statement of Operations.
The fund compensates The Bank of New York Mellon under a cash management agreement for performing cash management services related to fund subscriptions and redemptions. During the period ended October 31, 2011, the fund was charged $213 pursuant to the cash management agreement, which is included in Shareholder servicing costs in the Statement of Operations.These fees were partially offset by earnings credits of $5.
The fund also compensates The Bank of New York Mellon under a custody agreement for providing custodial services for the fund. During the period ended October 31, 2011, the fund was charged $14,646 pursuant to the custody agreement.
During the period ended October 31, 2011, the fund was charged $6,751 for services performed by the Chief Compliance Officer.
The components of “Due to The Dreyfus Corporation and affiliates” in the Statement of Assets and Liabilities consist of: management fees $20,665, Rule 12b-1 distribution plan fees $750, shareholder services plan fees $1,293, custodian fees $6,103, chief compliance officer fees $4,246 and transfer agency per account fees $280, which are offset against an expense reimbursement currently in effect in the amount of $17,392.
(d) Each Board member also serves as a Board member of other funds within the Dreyfus complex. Annual retainer fees and attendance fees are allocated to each fund based on net assets.
NOTE 4—Securities Transactions:
The aggregate amount of purchases and sales of investment securities, excluding short-term securities, options transactions and forward contracts during the period ended October 31, 2011, amounted to $21,515,938 and $4,120,879, respectively.
The Fund 33
NOTES TO FINANCIAL STATEMENTS (continued)
The following tables show the fund’s exposure to different types of market risk as it relates to the Statement of Assets and Liabilities and the Statement of Operations, respectively.
Fair value of derivative instruments as of October 31, 2011 is shown below:
| | | | |
| | Derivative | | Derivative | |
| | Assets ($) | | Liabilities ($) | |
| Equity risk1 | 59,675 | Equity risk2 | (147,806 | ) |
| Foreign exchange risk1,3 | 177,897 | Foreign exchange risk4 | (122,436 | ) |
| Gross fair value of | | | | |
| derivative contracts | 237,572 | | (270,242 | ) |
| |
| Statement of Assets and Liabilities location: |
| 1 | Options purchased are included in Investments in securities at market value. |
| 2 | Outstanding options written, at value. |
| 3 | Unrealized appreciation on forward foreign currency exchange contracts. |
| 4 | Unrealized depreciation on forward foreign currency exchange contracts. |
The effect of derivative instruments in the Statement of Operations during the period ended October 31, 2011 is shown below:
| | | | | | |
| | Amount of realized gain or (loss) on derivatives recognized in income ($) | |
| | | | Forward | | | |
| Underlying risk | Options5 | | Contracts6 | | Total | |
| Equity | 15,891 | | — | | 15,891 | |
| Foreign exchange | (31,284 | ) | (343,417 | ) | (374,701 | ) |
| Interest rate | 13,311 | | — | | 13,311 | |
| Total | (2,082 | ) | (343,417 | ) | (345,499 | ) |
| | | | | |
| Change in unrealized appreciation or (depreciation) on derivatives recognized in income ($) | |
| | | | Forward | | |
| Underlying risk | Options7 | | Contracts8 | Total | |
| Equity | (75,245 | ) | — | (75,245 | ) |
| Interest rate | 3,465 | | — | 3,465 | |
| Foreign exchange | (15,836 | ) | 230,586 | 214,750 | |
| Total | (87,616 | ) | 230,586 | 142,970 | |
Statement of Operations location:
| |
| 5 | Net realized gain (loss) on options transactions. |
| 6 | Net realized gain (loss) on forward foreign currency exchange contracts. |
| 7 | Net unrealized appreciation (depreciation) on options transactions. |
| 8 | Net unrealized appreciation (depreciation) on forward foreign currency exchange contracts. |
34
Options: The fund purchases and writes (sells) put and call options to hedge against changes in interest rates, the values of equities and foreign currencies, or as a substitute for an investment. The fund is subject to interest rate risk, market risk and currency risk in the course of pursuing its investment objectives through its investments in options contracts.A call option gives the purchaser of the option the right (but not the obligation) to buy, and obligates the writer to sell, the underlying security or securities at the exercise price at any time during the option period, or at a specified date. Conversely, a put option gives the purchaser of the option the right (but not the obligation) to sell, and obligates the writer to buy the underlying security or securities at the exercise price at any time during the option period, or at a specified date.
As a writer of call options, the fund receives a premium at the outset and then bears the market risk of unfavorable changes in the price of the financial instrument underlying the option. Generally, the fund realizes a gain, to the extent of the premium, if the price of the underlying financial instrument decreases between the date the option is written and the date on which the option is terminated. Generally, the fund incurs a loss, if the price of the financial instrument increases between those dates.
As a writer of put options, the fund receives a premium at the outset and then bears the market risk of unfavorable changes in the price of the financial instrument underlying the option. Generally, the fund realizes a gain, to the extent of the premium, if the price of the underlying financial instrument increases between the date the option is written and the date on which the option is terminated. Generally, the fund incurs a loss, if the price of the financial instrument decreases between those dates.
As a writer of an option, the fund has no control over whether the underlying securities may be sold (call) or purchased (put) and as a result bears the market risk of an unfavorable change in the price of the security underlying the written option.There is a risk of loss from a change in value of such options which may exceed the related premiums received. One risk of holding a put or a call option is that if the
The Fund 35
NOTES TO FINANCIAL STATEMENTS (continued)
option is not sold or exercised prior to its expiration, it becomes worthless. However, this risk is limited to the premium paid by the fund. Upon the expiration or closing of the option transaction, a gain or loss is reported in the Statement of Operations.
The following summarizes the fund’s call/put options written during the period ended October 31, 2011:
| | | | |
| | | | Options Terminated |
| | Number of | Premiums | | Net Realized |
| Options Written: | Contracts | Received ($) | Cost ($) | Gain ($) |
| Contracts outstanding | | | | |
| October 31, 2010 | 25 | 46,910 | | |
| Contracts written | 438 | 450,424 | | |
| Contracts terminated: | | | | |
| Contracts closed | 181 | 217,437 | 107,774 | 109,663 |
| Contracts expired | 122 | 78,786 | — | 78,786 |
| Total contracts | | | | |
| terminated | 303 | 296,223 | 107,774 | 188,449 |
| Contracts outstanding | | | | |
| October 31, 2011 | 160 | 201,111 | | |
Forward Foreign Currency Exchange Contracts: The fund enters into forward contracts in order to hedge its exposure to changes in foreign currency exchange rates on its foreign portfolio holdings, to settle foreign currency transactions or as a part of its investment strategy. When executing forward contracts, the fund is obligated to buy or sell a foreign currency at a specified rate on a certain date in the future. With respect to sales of forward contracts, the fund incurs a loss if the value of the contract increases between the date the forward contract is opened and the date the forward contract is closed.The fund realizes a gain if the value of the contract decreases between those dates.With respect to purchases of forward contracts, the fund incurs a loss if the value of the contract decreases between the date the forward contract is opened and the date the forward contract is closed.The fund realizes a gain if the value of the contract increases between those dates. Any realized gain or loss which occurred during the period is reflected in the Statement of Operations.The fund is exposed to foreign currency risk as a result of changes in value of underlying financial instruments.
36
The fund is also exposed to credit risk associated with counterparty nonperformance on these forward contracts, which is typically limited to the unrealized gain on each open contract.The following summarizes open forward contracts at October 31, 2011:
| | | | | |
| | Foreign | | | Unrealized | |
| Forward Foreign Currency | Currency | | | Appreciation | |
| Exchange Contracts | Amounts | Cost ($) | Value ($) (Depreciation) ($) | |
| Purchases: | | | | | |
| British Pound, | | | | | |
| Expiring 11/16/2011 | 131,000 | 203,002 | 210,600 | 7,598 | |
| Canadian Dollar, | | | | | |
| Expiring 3/15/2012 | 35,023 | 35,473 | 35,033 | (440 | ) |
| Chinese Yuan Renminbi, | | | | | |
| Expiring 1/13/2012 | 3,301,500 | 513,205 | 519,806 | 6,601 | |
| Chinese Yuan Renminbi, | | | | | |
| Expiring 1/13/2012 | 660,000 | 102,828 | 103,914 | 1,086 | |
| Chinese Yuan Renminbi, | | | | | |
| Expiring 1/13/2012 | 3,860,000 | 608,113 | 607,740 | (373 | ) |
| Chinese Yuan Renminbi, | | | | | |
| Expiring 1/13/2012 | 783,000 | 122,708 | 123,280 | 572 | |
| Euro, | | | | | |
| Expiring 3/15/2012 | 71,000 | 96,584 | 98,186 | 1,602 | |
| Singapore Dollar, | | | | | |
| Expiring 2/15/2012 | 284,000 | 233,730 | 226,413 | (7,317 | ) |
| Singapore Dollar, | | | | | |
| Expiring 2/15/2012 | 297,000 | 247,095 | 236,777 | (10,318 | ) |
| South African Rand, | | | | | |
| Expiring 11/1/2011 | 312,638 | 39,264 | 39,397 | 133 | |
| South Korean Won, | | | | | |
| Expiring 1/13/2012 | 27,391,000 | 25,106 | 24,588 | (518 | ) |
| Sales: | | Proceeds ($) | | | |
| Australian Dollar, | | | | | |
| Expiring 12/15/2011 | 185,000 | 193,170 | 193,891 | (721 | ) |
| Australian Dollar, | | | | | |
| Expiring 12/15/2011 | 49,000 | 52,134 | 51,355 | 779 | |
| Australian Dollar, | | | | | |
| Expiring 12/15/2011 | 89,000 | 89,321 | 93,277 | (3,956 | ) |
| Australian Dollar, | | | | | |
| Expiring 12/15/2011 | 103,000 | 106,721 | 107,950 | (1,229 | ) |
| Australian Dollar, | | | | | |
| Expiring 12/15/2011 | 77,000 | 78,367 | 80,701 | (2,334 | ) |
| Australian Dollar, | | | | | |
| Expiring 12/15/2011 | 286,000 | 288,588 | 299,745 | (11,157 | ) |
| Australian Dollar, | | | | | |
| Expiring 12/15/2011 | 500,000 | 488,109 | 524,031 | (35,922 | ) |
The Fund 37
NOTES TO FINANCIAL STATEMENTS (continued)
| | | | | |
| | Foreign | | | Unrealized | |
| Forward Foreign Currency | Currency | | | Appreciation | |
| Exchange Contracts | Amounts | Proceeds ($) | Value ($) (Depreciation) ($) | |
| Sales (continued): | | | | | |
| British Pound, | | | | | |
| Expiring 11/1/2011 | 8,503 | 13,678 | 13,673 | 5 | |
| British Pound, | | | | | |
| Expiring 11/1/2011 | 11,375 | 18,216 | 18,289 | (73 | ) |
| British Pound, | | | | | |
| Expiring 11/2/2011 | 64,338 | 103,108 | 103,448 | (340 | ) |
| British Pound, | | | | | |
| Expiring 11/16/2011 | 856,950 | 1,402,014 | 1,377,664 | 24,350 | |
| British Pound, | | | | | |
| Expiring 11/16/2011 | 18,423 | 30,059 | 29,617 | 442 | |
| British Pound, | | | | | |
| Expiring 11/16/2011 | 24,000 | 38,624 | 38,583 | 41 | |
| British Pound, | | | | | |
| Expiring 11/16/2011 | 37,900 | 61,152 | 60,929 | 223 | |
| British Pound, | | | | | |
| Expiring 11/16/2011 | 96,000 | 152,831 | 154,333 | (1,502 | ) |
| British Pound, | | | | | |
| Expiring 11/16/2011 | 206,000 | 334,900 | 331,173 | 3,727 | |
| British Pound, | | | | | |
| Expiring 11/16/2011 | 58,000 | 94,324 | 93,243 | 1,081 | |
| British Pound, | | | | | |
| Expiring 11/16/2011 | 13,000 | 21,065 | 20,899 | 166 | |
| British Pound, | | | | | |
| Expiring 11/16/2011 | 53,000 | 87,526 | 85,204 | 2,322 | |
| British Pound, | | | | | |
| Expiring 11/16/2011 | 330,000 | 538,339 | 530,520 | 7,819 | |
| British Pound, | | | | | |
| Expiring 11/16/2011 | 54,000 | 87,875 | 86,812 | 1,063 | |
| British Pound, | | | | | |
| Expiring 11/16/2011 | 93,000 | 150,553 | 149,510 | 1,043 | |
| British Pound, | | | | | |
| Expiring 11/16/2011 | 267,000 | 432,229 | 429,239 | 2,990 | |
| British Pound, | | | | | |
| Expiring 11/16/2011 | 58,000 | 93,445 | 93,242 | 203 | |
| British Pound, | | | | | |
| Expiring 11/16/2011 | 72,000 | 113,821 | 115,750 | (1,929 | ) |
| British Pound, | | | | | |
| Expiring 11/16/2011 | 152,500 | 239,588 | 245,164 | (5,576 | ) |
| British Pound, | | | | | |
| Expiring 11/16/2011 | 128,000 | 200,802 | 205,777 | (4,975 | ) |
| British Pound, | | | | | |
| Expiring 11/16/2011 | 257,000 | 409,286 | 413,162 | (3,876 | ) |
| British Pound, | | | | | |
| Expiring 11/16/2011 | 50,000 | 79,609 | 80,382 | (773 | ) |
| Canadian Dollar, | | | | | |
| Expiring 3/15/2012 | 470,677 | 474,065 | 470,811 | 3,254 | |
38
| | | | | |
| | Foreign | | | Unrealized | |
| Forward Foreign Currency | Currency | | | Appreciation | |
| Exchange Contracts | Amounts | Proceeds ($) | Value ($) (Depreciation) ($) | |
| Sales (continued): | | | | | |
| Canadian Dollar, | | | | | |
| Expiring 3/15/2012 | 24,000 | 23,951 | 24,006 | (55 | ) |
| Chinese Yuan Renminbi, | | | | | |
| Expiring 1/13/2012 | 8,604,500 | 1,343,823 | 1,354,740 | (10,917 | ) |
| Danish Krone, | | | | | |
| Expiring 1/13/2012 | 1,258,000 | 229,795 | 233,781 | (3,986 | ) |
| Danish Krone, | | | | | |
| Expiring 1/13/2012 | 218,000 | 40,771 | 40,512 | 259 | |
| Euro, | | | | | |
| Expiring 3/15/2012 | 2,614,850 | 3,673,551 | 3,616,090 | 57,461 | |
| Euro, | | | | | |
| Expiring 3/15/2012 | 51,000 | 70,605 | 70,528 | 77 | |
| Euro, | | | | | |
| Expiring 3/15/2012 | 111,500 | 152,089 | 154,194 | (2,105 | ) |
| Euro, | | | | | |
| Expiring 3/15/2012 | 407,000 | 556,855 | 562,842 | (5,987 | ) |
| Euro, | | | | | |
| Expiring 3/15/2012 | 120,000 | 161,734 | 165,948 | (4,214 | ) |
| Euro, | | | | | |
| Expiring 3/15/2012 | 14,000 | 19,497 | 19,361 | 136 | |
| Japanese Yen, | | | | | |
| Expiring 4/13/2012 | 39,463,000 | 516,481 | 506,493 | 9,988 | |
| Norwegian Krone, | | | | | |
| Expiring 2/15/2012 | 879,600 | 160,438 | 157,091 | 3,347 | |
| Norwegian Krone, | | | | | |
| Expiring 2/15/2012 | 2,848,000 | 512,583 | 508,636 | 3,947 | |
| Norwegian Krone, | | | | | |
| Expiring 2/15/2012 | 1,260,700 | 231,837 | 225,153 | 6,684 | |
| Norwegian Krone, | | | | | |
| Expiring 2/15/2012 | 372,000 | 64,991 | 66,437 | (1,446 | ) |
| Polish Zloty, | | | | | |
| Expiring 4/13/2012 | 596,000 | 184,097 | 184,494 | (397 | ) |
| South African Rand, | | | | | |
| Expiring 12/15/2011 | 809,600 | 116,796 | 101,329 | 15,467 | |
| South African Rand, | | | | | |
| Expiring 12/15/2011 | 51,000 | 7,361 | 6,383 | 978 | |
| South African Rand, | | | | | |
| Expiring 12/15/2011 | 263,500 | 35,963 | 32,979 | 2,984 | |
| South Korean Won, | | | | | |
| Expiring 1/13/2012 | 27,391,000 | 25,470 | 24,588 | 882 | |
| Gross Unrealized | | | | | |
| Appreciation | | | | 169,310 | |
| Gross Unrealized | | | | | |
| Depreciation | | | | (122,436 | ) |
The Fund 39
NOTES TO FINANCIAL STATEMENTS (continued)
The following summarizes the average market value of derivatives outstanding during the period ended October 31, 2011:
| |
| | Average Market Value ($) |
| Equity options contracts | 62,011 |
| Interest rate options contracts | 1,600 |
| Foreign currency options contracts | 5,887 |
| Forward contracts | 5,711,149 |
At October 31, 2011, the cost of investments for federal income tax purposes was $24,896,268; accordingly, accumulated net unrealized appreciation on investments was $234,206, consisting of $854,021 gross unrealized appreciation and $619,815 gross unrealized depreciation.
40
REPORT OF INDEPENDENT REGISTERED
PUBLIC ACCOUNTING FIRM
Shareholders and Board of Directors
Dreyfus Global Real Return Fund
We have audited the accompanying statement of assets and liabilities, including the statements of investments and options written, of Dreyfus Global Real Return Fund (one of the series comprising Advantage Funds, Inc.) as of October 31, 2011, and the related statement of operations for the year then ended and the statement of changes in net assets and financial highlights for the year then ended and for the period from May 12, 2010 (commencement of operations) to October 31, 2010. These financial statements and financial highlights are the responsibility of the Fund’s management. Our responsibility is to express an opinion on these financial statements and financial highlights based on our audits.
We conducted our audits in accordance with the standards of the Public Company Accounting Oversight Board (United States).Those standards require that we plan and perform the audit to obtain reasonable assurance about whether the financial statements and financial highlights are free of material misstatement.We were not engaged to perform an audit of the Fund’s internal control over financial reporting. Our audits included consideration of internal control over financial reporting as a basis for designing audit procedures that are appropriate in the circumstances, but not for the purpose of expressing an opinion on the effectiveness of the Fund’s internal control over financial reporting. Accordingly, we express no such opinion.An audit also includes examining, on a test basis, evidence supporting the amounts and disclosures in the financial statements and financial highlights, assessing the accounting principles used and significant estimates made by management, and evaluating the overall financial statement presentation. Our procedures included confirmation of securities owned as of October 31, 2011 by correspondence with the custodian and others.We believe that our audits provide a reasonable basis for our opinion.
In our opinion, the financial statements and financial highlights referred to above present fairly, in all material respects, the financial position of Dreyfus Global Real Return Fund at October 31, 2011, the results of its operations for the year then ended, and the changes in its net assets and the financial highlights for the year then ended and for the period from May 12, 2010 to October 31, 2010, in conformity with U.S. generally accepted accounting principles.

New York, New York
December 29, 2011
The Fund 41
IMPORTANT TAX INFORMATION (Unaudited)
In accordance with federal tax law, the fund elects to provide each shareholder with their portion of the fund’s foreign taxes paid and the income sourced from foreign countries. Accordingly, the fund hereby makes the following designations regarding its fiscal year ended October 31, 2011:
—the total amount of taxes paid to foreign countries was $12,965
—the total amount of income sourced from foreign countries was $276,900.
Where required by federal tax law rules, shareholders will receive notification of their proportionate share of foreign taxes paid and foreign sourced income for the 2011 calendar year with Form 1099-DIV which will be mailed in early 2012.
42
BOARD MEMBERS INFORMATION (Unaudited)
|
| Joseph S. DiMartino (68) |
| Chairman of the Board (1995) |
| Principal Occupation During Past 5Years: |
| • Corporate Director and Trustee |
| Other Public Company Board Memberships During Past 5Years: |
| • CBIZ (formerly, Century Business Services, Inc.), a provider of outsourcing functions for small |
| and medium size companies, Director (1997-present) |
| • Sunair Services Corporation, a provider of certain outdoor-related services to homes and |
| businesses, Director (2005-2009) |
| • The Newark Group, a provider of a national market of paper recovery facilities, paperboard |
| mills and paperboard converting plants, Director (2000-2010) |
| No. of Portfolios for which Board Member Serves: 167 |
| ——————— |
| Peggy C. Davis (68) |
| Board Member (2006) |
| Principal Occupation During Past 5Years: |
| • Shad Professor of Law, New York University School of Law |
| • Writer and teacher in the fields of evidence, constitutional theory, family law, social sciences |
| and the law, legal process and professional methodology and training |
| No. of Portfolios for which Board Member Serves: 53 |
| ——————— |
| David P. Feldman (71) |
| Board Member (1996) |
| Principal Occupation During Past 5Years: |
| • Corporate Director and Trustee |
| Other Public Company Board Memberships During Past 5Years: |
| • BBH Mutual Funds Group (4 registered mutual funds), Director (1992-present) |
| • QMed, Inc. a healthcare company, Director (1999-2007) |
| No. of Portfolios for which Board Member Serves: 50 |
The Fund 43
BOARD MEMBERS INFORMATION (Unaudited) (continued)
|
| Ehud Houminer (71) |
| Board Member (1993) |
| Principal Occupation During Past 5Years: |
| • Executive-in-Residence at the Columbia Business School, Columbia University (1992-present) |
| Other Public Company Board Memberships During Past 5Years: |
| • Avnet Inc., an electronics distributor, Director (1993-present) |
| No. of Portfolios for which Board Member Serves: 64 |
| ——————— |
| Dr. Martin Peretz (72) |
| Board Member (2006) |
| Principal Occupation During Past 5Years: |
| • Editor-in-Chief Emeritus of The New Republic Magazine (2010-present) (previously, |
| Editor-in-Chief, 1974-2010) |
| • Director of TheStreet.com, a financial information service on the web (1996-present) |
| No. of Portfolios for which Board Member Serves: 35 |
| ——————— |
| Once elected all Board Members serve for an indefinite term, but achieve Emeritus status upon reaching age 80.The |
| address of the Board Members and Officers is in c/o The Dreyfus Corporation, 200 Park Avenue, NewYork, NewYork |
| 10166.Additional information about the Board Members is available in the fund’s Statement of Additional Information |
| which can be obtained from Dreyfus free of charge by calling this toll free number: 1-800-DREYFUS. |
| James F. Henry, Emeritus Board Member |
| Dr. Paul A. Marks, Emeritus Board Member |
| Gloria Messinger, Emeritus Board Member |
44
OFFICERS OF THE FUND (Unaudited)

The Fund 45
OFFICERS OF THE FUND (Unaudited) (continued)

46
The Fund 47
Dreyfus
Total Emerging
Markets Fund
ANNUAL REPORT October 31, 2011

Save time. Save paper. View your next shareholder report online as soon as it’s available. Log into www.dreyfus.com and sign up for Dreyfus eCommunications. It’s simple and only takes a few minutes.
The views expressed in this report reflect those of the portfolio manager only through the end of the period covered and do not necessarily represent the views of Dreyfus or any other person in the Dreyfus organization. Any such views are subject to change at any time based upon market or other conditions and Dreyfus disclaims any responsibility to update such views.These views may not be relied on as investment advice and, because investment decisions for a Dreyfus fund are based on numerous factors, may not be relied on as an indication of trading intent on behalf of any Dreyfus fund.
| | Contents |
| | THE FUND |
| 2 | A Letter from the Chairman and CEO |
| 3 | Discussion of Fund Performance |
| 6 | Fund Performance |
| 8 | Understanding Your Fund’s Expenses |
| 8 | Comparing Your Fund’s Expenses With Those of Other Funds |
| 9 | Statement of Investments |
| 15 | Statement of Assets and Liabilities |
| 16 | Statement of Operations |
| 17 | Statement of Changes in Net Assets |
| 18 | Financial Highlights |
| 19 | Notes to Financial Statements |
| 32 | Report of Independent Registered Public Accounting Firm |
| 33 | Board Members Information |
| 35 | Officers of the Fund |
| | FOR MORE INFORMATION |
| | Back Cover |
|
| Dreyfus |
| Total Emerging |
| Markets Fund |
The Fund

A LETTER FROM THE CHAIRMAN AND CEO
Dear Shareholder:
We present to you this annual report for Dreyfus Total Emerging Markets Fund, covering the period from the fund’s inception on March 25, 2011, through October 31, 2011. For information about how the fund performed during the reporting period, as well as general market perspectives, we provide a Discussion of Fund Performance on the pages that follow.
Investors were encouraged by expectations of a more robust economic recovery during the final months of 2010, but sentiment deteriorated in 2011 due to disappointing global economic data, rising commodity prices, an escalating sovereign debt crisis in Europe and a contentious debate regarding taxes, spending and borrowing in the United States. International stocks proved sensitive to these macroeconomic developments, often regardless of underlying company fundamentals, and most international equity market indices ended the reporting period with mildly negative absolute returns.
The global economic outlook currently remains clouded by market turbulence and political infighting, but we believe that a continued sub-par global expansion is more likely than a return to recession.Although Europe continues to struggle with a debt crisis, inflationary pressures appear to be waning in most countries as energy prices recently have retreated from their highs. In Asia, China seems to have averted an economic contraction after implementing measures to dampen inflationary pressures. In the United States, moderately low core inflation and an accommodative monetary policy could help support near-trend growth despite ongoing deleveraging activity in the private sector.To assess the potential impact of these and other developments on your investments, we encourage you, as always, to speak with your financial advisor.
Thank you for your continued confidence and support.

Jonathan R. Baum
Chairman and Chief Executive Officer
The Dreyfus Corporation
November 15, 2011
2

DISCUSSION OF FUND PERFORMANCE
For the period from the fund’s inception on March 25, 2011 through October 31, 2011, as provided by Sean P. Fitzgibbon and Alexander Kozhemiakin, Portfolio Managers
Fund and Market Performance Overview
For the period from the fund’s inception on March 25, 2011, through October 31, 2011, DreyfusTotal Emerging Markets Fund’s Class A shares produced a total return of –8.96%, Class C shares returned –9.36% and Class I shares returned –8.80%.1 In comparison, the Morgan Stanley Capital International Emerging Markets Index (“MSCI EM Index”), the fund’s benchmark, returned –13.31% for the same period.2 A hybrid index comprised of 50% MSCI EM Index, 25% JPMorgan EMBI Global and 25% JPMorgan GBI-EM Global Diversified Composite returned –5.16% from 3/31/11 through 10/31/11.3,4
Intensifying concerns among global investors regarding the impact of financial instability in Europe, weaker-than-expected recovery in the United States and slowing growth in China undermined the performance of riskier assets during the reporting period, while traditional safe havens among sovereign bonds rallied. The fund outperformed its benchmark, largely due to the effectiveness of its multi-asset investment approach in reducing volatility, as U.S. dollar-denominated fixed-income holdings cushioned the impact of equity declines.
The Fund’s Investment Approach
The fund seeks to maximize total return.To pursue its goal, the fund normally invests at least 80% of its assets in equities, bonds and currencies issued by, or economically tied to, emerging markets.We base asset and country allocation decisions on our global macro-economic view and top-down country-specific outlooks, along with our bottom-up valuation assessments of individual securities. Equity investments rely on in-depth fundamental analysis supported by proprietary quantitative models. Bond and currency investments rely on in-depth fundamental analysis. By constructing a portfolio that is liquid and diversified from an asset class and country perspective, we seek to reduce volatility and country concentration risk.
Global Economic Concerns Derailed Emerging Markets
Global investor sentiment began to deteriorate in late April when pressures mounted on the banking systems of several European nations and Greece moved closer to default on its sovereign debt. Investor sentiment was further undermined by disappointing U.S. economic data
The Fund 3
DISCUSSION OF FUND PERFORMANCE (continued)
and signs that rapid economic growth in emerging Asian and South American markets was slowing. Global financial markets suffered bouts of heightened volatility as investors became increasingly risk averse, shifting their focus to perceived safe havens, such as U.S. government bonds. Volatility proved especially severe in August and September, with stocks suffering sharp declines after a major credit-rating agency downgraded its assessment of long-term U.S. government debt. Nevertheless, U.S. government bonds and the U.S. dollar continued to be regarded as a refuge for investors at the expense of many emerging market securities and currencies. In contrast, riskier assets in global markets rebounded broadly in October when some macroeconomic worries seemed to ease.
Responding to a Changing Global Environment
Throughout the reporting period, we evaluated the more than two dozen countries under our purview, deciding in each case whether to invest the fund’s assets in stocks, local currency-denominated bonds, U.S. dollar-denominated bonds, any combination of these or none at all. For example, the fund avoided exposure to Mexican stocks during the reporting period while increasing exposure to the Mexican peso though investments in local currency-denominated bonds, a position that reflected our positive assessment of Mexican currency fundamentals. Since its inception, the fund has constructed a portfolio providing broad diversification across the emerging markets, with holdings in 26 countries.
The flexibility of our investment approach enabled us to adjust the fund’s exposure on a country-by-country and instrument-by-instrument basis. Asset allocations ranged from approximately 40% stocks and 60% bonds at inception to roughly 60% stocks and 40% bonds at the end of the reporting period. Fixed income allocations, particularly U.S. dollar-denominated bonds, proved primarily responsible for the fund’s relatively strong performance compared to its benchmark. U.S. dollar-denominated positions included overweighted exposure to Indonesia, Kazakhstan and Ukraine, while local currency-denominated bond positions included overweighted exposure to Mexico and underweighted exposure to South Africa.
On a more negative note, broad-based declines in equity prices accounted for most of the fund’s negative absolute returns. Equity investments included overweighted positions in China, South Korea, Russia and Brazil, and underweighted positions in Taiwan, South Africa and Mexico. As the global market correction progressed, we also took advantage of more attractive equity valuations to increase the fund’s exposure to Brazil. Finally, currency positions included overweighted exposure to the Korean won, Chilean peso, Mexican peso and Malaysian ringgit, and underweighted exposure to the Hungarian forint, Colombian peso and South African rand.
4
A Constructive View of Global Economic Recovery
As of the reporting period’s end, global financial markets faced a variety of challenges, including the European debt crisis, subpar U.S. economic growth and inflation-fighting measures in China. However, we believe that business fundamentals remain sound in many regions and sectors, and that the market’s risks have led to increasingly attractive equity valuations. The fund’s current 60% allocation to equities reflects our constructive view of prospects for continued global economic recovery in coming months, along with our balanced perspective on the market’s risks and opportunities.
We would like to remind our shareholders, particularly newer investors, that this fund has a high risk/return profile and is appropriate only for shareholders willing to accept the greater risks associated with investing in emerging markets. Because of its focus on emerging markets, this fund can be extremely volatile and should only represent a small portion of a long-term investor’s well-diversified portfolio.
November 15, 2011
| |
| | Equity funds are subject generally to market, market sector, market liquidity, issuer and investment |
| | style risks, among other factors, to varying degrees, all of which are more fully described in the |
| | fund’s prospectus. |
| | Bond funds are subject generally to interest rate, credit, liquidity and market risks, to varying degrees, |
| | all of which are more fully described in the fund’s prospectus. Generally, all other factors being equal, |
| | bond prices are inversely related to interest rate changes, and rate increases can cause price declines. |
| | Emerging markets tend to be more volatile than the markets of more mature economies and |
| | generally have less diverse and less mature economic structures and less stable political systems than |
| | those of developed countries. |
| | Investing internationally involves special risks, including changes in currency exchange rates, |
| | political, economic and social instability, a lack of comprehensive company information, differing |
| | auditing and legal standards and less market liquidity.These risks generally are greater with |
| | emerging market countries than with more economically and politically established foreign countries. |
| 1 | Total return includes reinvestment of dividends and any capital gains paid and does not take into |
| | consideration the maximum initial sales charge in the case of Class A shares, or the applicable |
| | contingent deferred sales charges imposed on redemptions in the case of Class C shares. Had these |
| | charges been reflected, returns would have been lower. Past performance is no guarantee of future |
| | results. Share price, yield and investment return fluctuate such that upon redemption, fund shares |
| | may be worth more or less than their original cost. Return figures provided reflect the absorption |
| | of certain fund expenses by The Dreyfus Corporation pursuant to an agreement in effect until |
| | March 1, 2013, at which time it may be extended, terminated or modified. Had these expenses |
| | not been absorbed, the fund’s returns would have been lower. |
| 2 | SOURCE: LIPPER INC. — Reflects reinvestment of dividends and, where applicable, capital |
| | gain distributions.The Morgan Stanley Capital International Emerging Markets (MSCI EM) |
| | Index is a market capitalization-weighted index composed of companies representative of the |
| | market structure of select designated emerging market countries in Europe, Latin America and the |
| | Pacific Basin. Investors cannot invest directly in any index. For comparative purposes, the value of |
| | the Index as of 3/31/11 is used as the beginning value on 3/25/11. |
| 3 | SOURCE: FACTSET — Reflects reinvestment of dividends and, where applicable capital gain |
| | distributions. JP Morgan GBI-EM Global Diversified Index consists of regularly traded, liquid |
| | fixed-rate, domestic currency government bonds, to which international investors can gain exposure. |
| | Investors cannot invest directly in any index. For comparative purposes, the value of the Index as |
| | of 3/31/11 is used as the beginning value on 3/25/11. |
| 4 | SOURCE: FACTSET — Reflects reinvestment of dividends and, where applicable capital gain |
| | distributions. JP Morgan EMBI Global Index tracks total regturns for U.S. dollar denominated |
| | debt instruments issued by emerging market sovereign and quasi-sovereign entities: Brady Bonds, |
| | loans and Eurobonds. Investors cannot invest directly in any index. For comparative purposes, the |
| | value of the Index as of 3/31/11 is used as the beginning value on 3/25/11. |
The Fund 5
FUND PERFORMANCE
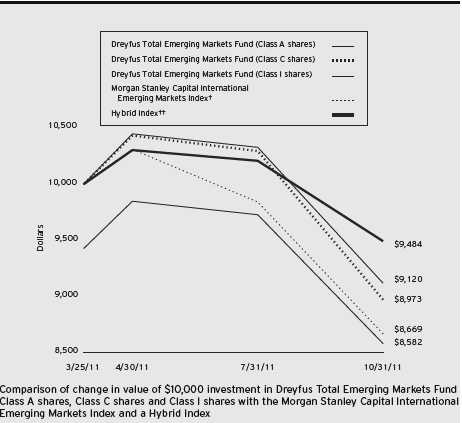
| |
| † | Source: Lipper Inc. – MSCI EM Index |
| †† | Source: Lipper Inc. – MSCI EM Index and FactSet – JP Morgan GBI-EM Global Diversified Index and JP |
| | Morgan EMBI Global Index |
Past performance is not predictive of future performance.
The above graph compares a $10,000 investment made in each of the Class A, Class C and Class I shares of Dreyfus Total Emerging Markets Fund on 3/25/11 (inception date) to a $10,000 investment made in the Morgan Stanley Capital International Emerging Markets Index (the “MSCI EM Index”) as well as to a Hybrid Index reflecting the fund’s asset allocation baseline percentages (“Baseline”) as described below on 3/31/11.All dividends and capital gain distributions are reinvested.
The fund’s performance shown in the line graph above takes into account the maximum initial sales charge on Class A shares, the applicable contingent deferred sales charge on Class C shares and all other applicable fees and expenses on all classes.The MSCI EM Index is a market capitalization-weighted index composed of companies representative of the market structure of 21 emerging market countries in Europe, Latin America and the Pacific Basin.The Index excludes closed markets and those shares in otherwise free markets that are not purchasable by foreigners.The Index includes net dividends reinvested.The Hybrid Index has been prepared by the fund for purposes of more accurate comparison to the fund’s overall portfolio composition.We have combined the performance of unmanaged indices reflecting the Baseline percentage which consists of the MSCI EM Index (50%). JP Morgan GBI-EM Global Diversified Index consists of regularly traded, liquid fixed-rate, domestic currency government bonds to which international investors can gain exposure (25%). JP Morgan EMBI Global Index tracks total returns for U.S. dollar-denominated debt instruments issued by emerging market sovereign and quasi-sovereign entities: Brady bonds, loans and Eurobonds (25%). Unlike a mutual fund, the indices are not subject to charges, fees and other expenses. Investors cannot invest directly in any index.These factors can contribute to the Index potentially outperforming the fund. Further information relating to fund expenses, including expense reimbursements, if applicable, is contained in the Expenses section of the prospectus and elsewhere in this report.
6
| | | |
| Actual Aggregate Total Returns as of 10/31/11 | | | |
| |
| | Inception | From | |
| | Date | Inception | |
| Class A shares | | | |
| with maximum sales charge (5.75%) | 3/25/11 | –14.18 | % |
| without sales charge | 3/25/11 | –8.96 | % |
| Class C shares | | | |
| with applicable redemption charge † | 3/25/11 | –10.27 | % |
| without redemption | 3/25/11 | –9.36 | % |
| Class I shares | 3/25/11 | –8.80 | % |
| Morgan Stanley Capital International | | | |
| Emerging Markets Index | 3/31/11 | –13.31 | %†† |
| Hybrid Index | 3/31/11 | –5.16 | %†† |
Past performance is not predictive of future performance.The fund’s performance shown in the graph and table does not reflect the deduction of taxes that a shareholder would pay on fund distributions or the redemption of fund shares.
| |
| † | The maximum contingent deferred sales charge for Class C shares is 1% for shares redeemed within one year of the |
| | date of purchase. |
| †† | For comparative purposes, the value of the Index as of 3/31/11 is used as the beginning value on 3/25/11. |
The Fund 7
UNDERSTANDING YOUR FUND’S EXPENSES (Unaudited)
As a mutual fund investor, you pay ongoing expenses, such as management fees and other expenses. Using the information below, you can estimate how these expenses affect your investment and compare them with the expenses of other funds.You also may pay one-time transaction expenses, including sales charges (loads) and redemption fees, which are not shown in this section and would have resulted in higher total expenses. For more information, see your fund’s prospectus or talk to your financial adviser.
Review your fund’s expenses
The table below shows the expenses you would have paid on a $1,000 investment in DreyfusTotal Emerging Markets Fund from May 1, 2011 to October 31, 2011. It also shows how much a $1,000 investment would be worth at the close of the period, assuming actual returns and expenses.
Expenses and Value of a $1,000 Investment
assuming actual returns for the six months ended October 31, 2011
| | | | | | |
| | | Class A | | Class C | | Class I |
| Expenses paid per $1,000† | | $7.78 | | $11.31 | | $6.61 |
| Ending value (after expenses) | | $871.40 | | $868.90 | | $872.90 |
COMPARING YOUR FUND’S EXPENSES
WITH THOSE OF OTHER FUNDS (Unaudited)
Using the SEC’s method to compare expenses
The Securities and Exchange Commission (SEC) has established guidelines to help investors assess fund expenses. Per these guidelines, the table below shows your fund’s expenses based on a $1,000 investment, assuming a hypothetical 5% annualized return. You can use this information to compare the ongoing expenses (but not transaction expenses or total cost) of investing in the fund with those of other funds.All mutual fund shareholder reports will provide this information to help you make this comparison. Please note that you cannot use this information to estimate your actual ending account balance and expenses paid during the period.
Expenses and Value of a $1,000 Investment
assuming a hypothetical 5% annualized return for the six months ended October 31, 2011
| | | | | | |
| | | Class A | | Class C | | Class I |
| Expenses paid per $1,000† | | $8.39 | | $12.18 | | $7.12 |
| Ending value (after expenses) | | $1,016.89 | | $1,013.11 | | $1,018.15 |
|
| † Expenses are equal to the fund’s annualized expense ratio of 1.65% for Class A, 2.40% for Class C and |
| 1.40% for Class I, multiplied by the average account value over the period, multiplied by 184/365 (to reflect |
| the one-half year period). |
8
STATEMENT OF INVESTMENTS
October 31, 2011
| | | | | | |
| | | Coupon | Maturity | Principal | | |
| Bonds and Notes—36.7% | | Rate (%) | Date | Amount ($)a | | Value ($) |
| Argentina—1.2% | | | | | | |
| Argentine Government, | | | | | | |
| Sr. Unscd. Bonds, Ser. X | | 7.00 | 4/17/17 | 680,000 | | 561,000 |
| Argentine Government, | | | | | | |
| Sr. Unscd. Notes, Ser. 1 | | 8.75 | 6/2/17 | 85,000 | | 80,113 |
| | | | | | | 641,113 |
| Colombia—1.7% | | | | | | |
| Ecopetrol, | | | | | | |
| Sr. Unscd. Notes | | 7.63 | 7/23/19 | 385,000 | | 463,155 |
| Colombian Government, | | | | | | |
| Sr. Unscd. Bonds | COP | 9.85 | 6/28/27 | 604,000,000 | | 458,415 |
| | | | | | | 921,570 |
| Dominican Republic—.8% | | | | | | |
| Dominican Republic Government, | | | | | | |
| Sr. Unscd. Bonds | | 7.50 | 5/6/21 | 435,000 | | 454,793 |
| Georgia—.8% | | | | | | |
| Georgian Government, | | | | | | |
| Bonds | | 6.88 | 4/12/21 | 440,000 | | 453,200 |
| Indonesia—2.2% | | | | | | |
| Indonesian Government, | | | | | | |
| Sr. Unscd. Bonds, Ser. FR56 | IDR | 8.38 | 9/15/26 | 2,399,000,000 | | 311,815 |
| Indonesian Government, | | | | | | |
| Sr. Unscd. Notes | | 4.88 | 5/5/21 | 830,000 | | 894,325 |
| | | | | | | 1,206,140 |
| Kazakhstan—1.2% | | | | | | |
| Development | | | | | | |
| Bank of Kazakhstan, | | | | | | |
| Sr. Unscd. Notes | | 5.50 | 12/20/15 | 175,000 | b | 183,750 |
| KazMunayGas National, | | | | | | |
| Sr. Unscd. Bonds | | 6.38 | 4/9/21 | 430,000 | | 459,025 |
| | | | | | | 642,775 |
| Malaysia—4.8% | | | | | | |
| Malaysian Government, | | | | | | |
| Sr. Unscd. Bonds, | | | | | | |
| Ser. 0509 | MYR | 3.21 | 5/31/13 | 2,220,000 | | 726,693 |
| Malaysian Government, | | | | | | |
| Bonds, Ser. 0211 | MYR | 3.43 | 8/15/14 | 5,635,000 | | 1,850,370 |
| | | | | | | 2,577,063 |
The Fund 9
STATEMENT OF INVESTMENTS (continued)
| | | | | | |
| | | Coupon | Maturity | Principal | | |
| Bonds and Notes (continued) | Rate (%) | Date | Amount ($)a | | Value ($) |
| Mexico—7.7% | | | | | | |
| Mexican Government, | | | | | | |
| Bonds, Ser. M | MXN | 6.00 | 6/18/15 | 27,000,000 | | 2,109,379 |
| Mexican Government, | | | | | | |
| Bonds, Ser. M | MXN | 7.00 | 6/19/14 | 7,470,000 | | 595,413 |
| Mexican Government, | | | | | | |
| Bonds, Ser. M 20 | MXN | 8.50 | 5/31/29 | 2,320,000 | | 199,324 |
| Mexican Government, | | | | | | |
| Bonds, Ser. M 30 | MXN | 10.00 | 11/20/36 | 3,150,000 | | 303,697 |
| Mexican Government, | | | | | | |
| Bonds, Ser. M 30 | MXN | 8.50 | 11/18/38 | 2,035,000 | | 171,031 |
| Petroleos Mexicanos, | | | | | | |
| Gtd. Notes | | 5.50 | 1/21/21 | 665,000 | | 716,538 |
| Petroleos Mexicanos, | | | | | | |
| Gtd. Notes | | 6.50 | 6/2/41 | 50,000 | | 54,125 |
| | | | | | | 4,149,507 |
| Peru—.5% | | | | | | |
| Peruvian Government, | | | | | | |
| Sr. Unscd. Bonds | PEN | 6.90 | 8/12/37 | 80,000 | | 31,402 |
| Peruvian Government, | | | | | | |
| Sr. Unscd. Bonds | PEN | 6.95 | 8/12/31 | 635,000 | | 250,875 |
| | | | | | | 282,277 |
| Philippines—.3% | | | | | | |
| Philippine Government, | | | | | | |
| Sr. Unscd. Notes | PHP | 4.95 | 1/15/21 | 8,000,000 | | 181,063 |
| Poland—2.1% | | | | | | |
| Polish Government, | | | | | | |
| Bonds, Ser. 1013 | PLN | 5.00 | 10/24/13 | 3,545,000 | | 1,125,471 |
| Russia—2.2% | | | | | | |
| Russian Government, | | | | | | |
| Sr. Unscd. Bonds | | 7.50 | 3/31/30 | 701,400 | c | 832,913 |
| Russian Government, | | | | | | |
| Sr. Unscd. Bonds | RUB | 7.85 | 3/10/18 | 10,000,000 | | 340,565 |
| | | | | | | 1,173,478 |
| South Africa—2.3% | | | | | | |
| South African Government, | | | | | | |
| Bonds, Ser. R213 | ZAR | 7.00 | 2/28/31 | 500,000 | | 52,681 |
| South African Government, | | | | | | |
| Sr. Unscd. Bonds, Ser. R207 | ZAR | 7.25 | 1/15/20 | 2,085,000 | | 251,840 |
10
| | | | | |
| | | Coupon | Maturity | Principal | |
| Bonds and Notes (continued) | Rate (%) | Date | Amount ($)a | Value ($) |
| South Africa (continued) | | | | | |
| South African Government, | | | | | |
| Bonds, Ser. R209 | ZAR | 6.25 | 3/31/36 | 8,040,000 | 761,498 |
| South African Government, | | | | | |
| Bonds, Ser. R204 | ZAR | 8.00 | 12/21/18 | 650,000 | 83,840 |
| South African Government, | | | | | |
| Bonds, Ser. R186 | ZAR | 10.50 | 12/21/26 | 700,000 | 105,121 |
| | | | | | 1,254,980 |
| Sri Lanka—.8% | | | | | |
| Sri Lanka Government, | | | | | |
| Sr. Unscd. Notes | | 6.25 | 10/4/20 | 440,000 | 449,900 |
| Thailand—1.0% | | | | | |
| Thai Government, | | | | | |
| Sr. Unscd. Bonds | THB | 4.25 | 3/13/13 | 15,900,000 | 523,431 |
| Turkey—2.1% | | | | | |
| Turkish Government, | | | | | |
| Bonds | TRY | 10.00 | 4/10/13 | 885,000 | 500,703 |
| Turkish Government, | | | | | |
| Bonds | TRY | 11.00 | 8/6/14 | 1,100,000 | 645,979 |
| | | | | | 1,146,682 |
| Ukraine—1.0% | | | | | |
| NAK Naftogaz Ukraine, | | | | | |
| Govt. Gtd. Notes | | 9.50 | 9/30/14 | 515,000 | 512,425 |
| United Kingdom—.5% | | | | | |
| Ukreximbank | | | | | |
| Via Biz Finance, | | | | | |
| Sr. Unscd. Bonds | | 8.38 | 4/27/15 | 280,000 | 264,600 |
| Uruguay—.7% | | | | | |
| Uruguayan Government, | | | | | |
| Unscd. Notes | | 8.00 | 11/18/22 | 270,000 | 359,100 |
| Venezuela—2.8% | | | | | |
| Petroleos de Venezuela, | | | | | |
| Gtd. Notes | | 8.50 | 11/2/17 | 820,000 | 596,550 |
| Venezuelan Government, | | | | | |
| Sr. Unscd. Notes | | 12.75 | 8/23/22 | 1,025,000 | 907,125 |
| | | | | | 1,503,675 |
| Total Bonds and Notes | | | | | |
| (cost $20,613,839) | | | | | 19,823,243 |
The Fund 11
STATEMENT OF INVESTMENTS (continued)
| | | |
| Common Stocks—48.7% | Shares | | Value ($) |
| Brazil—7.3% | | | |
| Banco Bradesco, ADR | 35,590 | | 647,738 |
| Cia de Bebidas das Americas, ADR | 13,700 | | 461,964 |
| Fleury | 43,600 | | 549,809 |
| Obrascon Huarte Lain Brasil | 26,900 | | 900,140 |
| Rossi Residencial | 57,600 | | 364,015 |
| Tim Participacoes, ADR | 38,264 | | 996,394 |
| | | | 3,920,060 |
| Chile—3.2% | | | |
| Cencosud | 150,160 | | 959,283 |
| ENTEL | 39,050 | | 773,110 |
| | | | 1,732,393 |
| China—6.6% | | | |
| China Petroleum & Chemical, Cl. H | 580,000 | | 549,872 |
| Focus Media Holding, ADR | 31,690 | d | 861,334 |
| Great Wall Motor, Cl. H | 437,500 | | 585,819 |
| Tencent Holdings | 47,800 | | 1,094,858 |
| WuXi PharmaTech, ADR | 38,310 | d | 476,193 |
| | | | 3,568,076 |
| Colombia—.6% | | | |
| Bancolombia, ADR | 5,060 | | 315,643 |
| Hong Kong—4.2% | | | |
| China Agri-Industries Holdings | 1,735,000 | | 1,353,240 |
| China Vanadium | | | |
| Titano-Magnetite Mining | 2,903,000 | | 581,558 |
| Lonking Holdings | 807,000 | | 310,847 |
| | | | 2,245,645 |
| Indonesia—2.4% | | | |
| Bank Rakyat | | | |
| Indonesia Persero | 946,500 | | 707,070 |
| Indofood Sukses Makmur | 1,051,500 | | 615,187 |
| | | | 1,322,257 |
| Malaysia—2.3% | | | |
| Genting | 351,500 | | 1,224,968 |
12
| | | | |
| Common Stocks (continued) | Shares | | | Value ($) |
| Peru—1.3% | | | | |
| Credicorp | 6,420 | | | 698,368 |
| Russia—5.8% | | | | |
| Gazprom, ADR | 96,280 | | | 1,123,588 |
| Lukoil, ADR | 9,610 | | | 559,302 |
| Mobile Telesystems, ADR | 33,330 | | | 476,286 |
| Rosneft Oil, GDR | 92,650 | b | | 659,205 |
| Sberbank of Russia, ADR | 31,320 | d | | 338,119 |
| | | | | 3,156,500 |
| South Korea—10.8% | | | | |
| DGB Financial Group | 86,210 | d | | 1,071,659 |
| Hyundai Mobis | 3,765 | | | 1,086,337 |
| KT&G | 23,917 | | | 1,500,877 |
| Samsung Electronics | 2,515 | | | 2,181,604 |
| | | | | 5,840,477 |
| Taiwan—1.8% | | | | |
| Fubon Financial Holding | 801,713 | | | 941,888 |
| Thailand—1.7% | | | | |
| Asian Property Development | 2,976,000 | | | 435,271 |
| PTT Global Chemical | 236,446 | d | | 503,650 |
| | | | | 938,921 |
| United States—.7% | | | | |
| Market Vector India Small-Cap Index ETF | 30,150 | d | | 394,663 |
| Total Common Stocks | | | | |
| (cost $29,287,921) | | | | 26,299,859 |
| |
| Preferred Stocks—6.5% | | | | |
| Brazil—6.5% | | | | |
| Banco do Estado do Rio Grande do Sul | 62,000 | | | 653,639 |
| Cia Paranaense de Energia, Cl. B | 37,600 | | | 752,285 |
| Vale, Cl. A | 88,300 | | | 2,098,401 |
| Total Preferred Stocks | | | | |
| (cost $3,953,400) | | | | 3,504,325 |
The Fund 13
STATEMENT OF INVESTMENTS (continued)
| | | |
| Other Investment—5.7% | Shares | | Value ($) |
| Registered Investment Company; | | | |
| Dreyfus Institutional Preferred | | | |
| Plus Money Market Fund | | | |
| (cost $3,111,098) | 3,111,098 | e | 3,111,098 |
| |
| Total Investments (cost $56,966,258) | 97.6 | % | 52,738,525 |
| Cash and Receivables (Net) | 2.4 | % | 1,284,569 |
| Net Assets | 100.0 | % | 54,023,094 |
ADR—American Depository Receipts
GDR—Global Depository Receipts
|
| a Principal amount stated in U.S. Dollars unless otherwise noted. |
| COP—Colombian Peso |
| IDR—Indonesian Rupiah |
| MYR—Malaysian Ringgit |
| MXN—Mexican New Peso |
| PEN—Peruvian New Sol |
| PHP—Philippines Peso |
| PLN— Polish Zloty |
| RUB—Russian Ruble |
| THB—Thai Baht |
| TRY—Turkish Lira |
| ZAR—South African Rand |
| b Securities exempt from registration under Rule 144A of the Securities Act of 1933.These securities may be resold in |
| transactions exempt from registration, normally to qualified institutional buyers.At October 31, 2011, these securities |
| were valued at $842,955 or 1.6% of net assets. |
| c Variable rate security—interest rate subject to periodic change. |
| d Non-income producing security. |
| e Investment in affiliated money market mutual fund. |
| | | |
| Portfolio Summary (Unaudited)† | | |
| |
| | Value (%) | | Value (%) |
| Foreign/Governmental | 30.7 | Industrial | 4.6 |
| Financial | 11.3 | Energy | 3.3 |
| Consumer Discretionary | 11.3 | Telecommunications | 2.7 |
| Information Technology | 7.5 | Utilities | 2.1 |
| Corporate Bonds | 6.0 | Health Care | 1.0 |
| Materials | 5.9 | Exchange Traded Funds | .7 |
| Money Market Investment | 5.7 | | |
| Consumer Staples | 4.8 | | 97.6 |
| |
| † Based on net assets. | | | |
| See notes to financial statements. | | | |
14
STATEMENT OF ASSETS AND LIABILITIES
October 31, 2011
| | | |
| | Cost | Value | |
| Assets ($): | | | |
| Investments in securities—See Statement of Investments: | | | |
| Unaffiliated issuers | 53,855,160 | 49,627,427 | |
| Affiliated issuers | 3,111,098 | 3,111,098 | |
| Cash | | 1,580,250 | |
| Cash denominated in foreign currencies | 186,152 | 187,355 | |
| Receivable for investment securities sold | | 873,680 | |
| Dividends and interest receivable | | 358,780 | |
| Unrealized appreciation on forward foreign | | | |
| currency exchange contracts—Note 4 | | 56,398 | |
| Receivable for shares of Common Stock subscribed | | 2,087 | |
| Prepaid expenses | | 39,389 | |
| | | 55,836,464 | |
| Liabilities ($): | | | |
| Due to The Dreyfus Corporation and affiliates—Note 3(c) | | 56,213 | |
| Payable for investment securities purchased | | 1,628,368 | |
| Unrealized depreciation on forward foreign | | | |
| currency exchange contracts—Note 4 | | 73,235 | |
| Accrued expenses | | 55,554 | |
| | | 1,813,370 | |
| Net Assets ($) | | 54,023,094 | |
| Composition of Net Assets ($): | | | |
| Paid-in capital | | 59,800,531 | |
| Accumulated undistributed investment income—net | | 782,286 | |
| Accumulated net realized gain (loss) on investments | | (2,289,689 | ) |
| Accumulated net unrealized appreciation (depreciation) | | | |
| on investments and foreign currency transactions | | (4,270,034 | ) |
| Net Assets ($) | | 54,023,094 | |
| | | |
| Net Asset Value Per Share | | | |
| | Class A | Class C | Class I |
| Net Assets ($) | 678,179 | 524,102 | 52,820,813 |
| Shares Outstanding | 59,590 | 46,261 | 4,634,564 |
| Net Asset Value Per Share ($) | 11.38 | 11.33 | 11.40 |
See notes to financial statements.
The Fund 15
STATEMENT OF OPERATIONS
From March 25, 2011 (commencement of operations) to October 31, 2011
| | |
| Investment Income ($): | | |
| Income: | | |
| Interest | 482,469 | |
| Cash dividends (net of $35,528 foreign taxes withheld at source): | | |
| Unaffiliated issuers | 240,235 | |
| Affiliated issuers | 1,148 | |
| Total Income | 723,852 | |
| Expenses: | | |
| Management fee—Note 3(a) | 183,510 | |
| Auditing fees | 52,975 | |
| Legal fees | 42,216 | |
| Registration fees | 41,952 | |
| Custodian fees—Note 3(c) | 13,424 | |
| Prospectus and shareholders’ reports | 2,963 | |
| Distribution fees—Note 3(b) | 2,289 | |
| Shareholder servicing costs—Note 3(c) | 2,197 | |
| Directors’ fees and expenses—Note 3(d) | 776 | |
| Loan commitment fees—Note 2 | 97 | |
| Miscellaneous | 9,003 | |
| Total Expenses | 351,402 | |
| Less—reduction in management fee due to undertaking—Note 3(a) | (90,407 | ) |
| Less—reduction in fees due to earnings credits—Note 3(c) | (1 | ) |
| Net Expenses | 260,994 | |
| Investment Income—Net | 462,858 | |
| Realized and Unrealized Gain (Loss) on Investments—Note 4 ($): | | |
| Net realized gain (loss) on investments and foreign currency transactions | (1,967,884 | ) |
| Net realized gain (loss) on forward foreign currency exchange contracts | (15,648 | ) |
| Net Realized Gain (Loss) | (1,983,532 | ) |
| Net unrealized appreciation (depreciation) on | | |
| investments and foreign currency transactions | (4,253,197 | ) |
| Net unrealized appreciation (depreciation) on | | |
| forward foreign currency exchange contracts | (16,837 | ) |
| Net Unrealized Appreciation (Depreciation) | (4,270,034 | ) |
| Net Realized and Unrealized Gain (Loss) on Investments | (6,253,566 | ) |
| Net (Decrease) in Net Assets Resulting from Operations | (5,790,708 | ) |
| |
| See notes to financial statements. | | |
16
STATEMENT OF CHANGES IN NET ASSETS
From March 25, 2011 (commencement of operations) to October 31, 2011
| | |
| Operations ($): | | |
| Investment income—net | 462,858 | |
| Net realized gain (loss) on investments | (1,983,532 | ) |
| Net unrealized appreciation | | |
| (depreciation) on investments | (4,270,034 | ) |
| Net Increase (Decrease) in Net Assets | | |
| Resulting from Operations | (5,790,708 | ) |
| Capital Stock Transactions ($): | | |
| Net proceeds from shares sold: | | |
| Class A Shares | 837,618 | |
| Class C Shares | 572,076 | |
| Class I Shares | 58,486,900 | |
| Cost of shares redeemed: | | |
| Class A Shares | (82,792 | ) |
| Increase (Decrease) in Net Assets | | |
| from Capital Stock Transactions | 59,813,802 | |
| Total Increase (Decrease) in Net Assets | 54,023,094 | |
| Net Assets ($): | | |
| Beginning of Period | — | |
| End of Period | 54,023,094 | |
| Undistributed investment income—net | 782,286 | |
| Capital Share Transactions (Shares): | | |
| Class A | | |
| Shares sold | 66,548 | |
| Shares redeemed | (6,958 | ) |
| Net Increase (Decrease) in Shares Outstanding | 59,590 | |
| Class C | | |
| Shares sold | 46,261 | |
| Class I | | |
| Shares sold | 4,634,564 | |
| |
| See notes to financial statements. | | |
The Fund 17
FINANCIAL HIGHLIGHTS
The following table describes the performance for each share class for the period from March 25, 2011 (commencement of operations) to October 31, 2011.All information (except portfolio turnover rate) reflects financial results for a single fund share.Total return shows how much your investment in the fund would have increased (or decreased) during each period, assuming you had reinvested all dividends and distributions.These figures have been derived from the fund’s financial statements.
| | | | | | |
| | Class A | | Class C | | Class I | |
| | Shares | | Shares | | Shares | |
| Per Share Data ($): | | | | | | |
| Net asset value, beginning of period | 12.50 | | 12.50 | | 12.50 | |
| Investment Operations: | | | | | | |
| Investment income—neta | .18 | | .13 | | .19 | |
| Net realized and unrealized | | | | | | |
| gain (loss) on investments | (1.30 | ) | (1.30 | ) | (1.29 | ) |
| Total from Investment Operations | (1.12 | ) | (1.17 | ) | (1.10 | ) |
| Net asset value, end of period | 11.38 | | 11.33 | | 11.40 | |
| Total Return (%)b | (8.96 | )c | (9.36 | )c | (8.80 | ) |
| Ratios/Supplemental Data (%): | | | | | | |
| Ratio of total expenses to average net assetsd | 2.60 | | 3.38 | | 1.88 | |
| Ratio of net expenses to average net assetsd | 1.65 | | 2.40 | | 1.40 | |
| Ratio of net investment income | | | | | | |
| to average net assetsd | 2.44 | | 1.76 | | 2.54 | |
| Portfolio Turnover Rateb | 52.76 | | 52.76 | | 52.76 | |
| Net Assets, end of period ($ x 1,000) | 678 | | 524 | | 52,821 | |
| |
| a | Based on average shares outstanding at each month end. |
| b | Not annualized. |
| c | Exclusive of sales charge. |
| d | Annualized. |
See notes to financial statements.
18
NOTES TO FINANCIAL STATEMENTS
NOTE 1—Significant Accounting Policies:
Dreyfus Total Emerging Markets Fund (the “fund”) is a separate non-diversified series of Advantage Funds, Inc. (the “Company”), which is registered under the Investment Company Act of 1940, as amended (the “Act”), as an open-end management investment company and operates as a series company currently offering twelve series, including the fund, which commenced operations on March 25, 2011. The fund’s investment objective seeks to maximize total return.The Dreyfus Corporation (the “Manager” or “Dreyfus”), a wholly-owned subsidiary of The Bank of NewYork Mellon Corporation (“BNY Mellon”), serves as the fund’s investment adviser.
MBSC Securities Corporation (the “Distributor”), a wholly-owned subsidiary of the Manager, is the distributor of the fund’s shares.The fund is authorized to issue 100 million shares of $.001 par value Common Stock in each of the following classes of shares: Class A, Class C and Class I. Class A shares are subject to a sales charge imposed at the time of purchase. Class C shares are subject to a contingent deferred sales charge (“CDSC”) imposed on Class C shares redeemed within one year of purchase. Class I shares are sold at net asset value per share only to institutional investors. Other differences between the classes include the services offered to and the expenses borne by each class, the allocation of certain transfer agency costs and certain voting rights. Income, expenses (other than expenses attributable to a specific class), and realized and unrealized gains or losses on investments are allocated to each class of shares based on its relative net assets.
As of October 31, 2011, MBC Investment Corp., an indirect subsidiary of BNY Mellon, held 40,000 Class A, 40,000 Class C and 1,120,000 Class I shares of the fund.
The Fund 19
NOTES TO FINANCIAL STATEMENTS (continued)
The Company accounts separately for the assets, liabilities and operations of each series. Expenses directly attributable to each series are charged to that series’ operations; expenses which are applicable to all series are allocated among them on a pro rata basis.
The Financial Accounting Standards Board (“FASB”) Accounting Standards Codification (“ASC”) is the exclusive reference of authoritative U.S. generally accepted accounting principles (“GAAP”) recognized by the FASB to be applied by nongovernmental entities. Rules and interpretive releases of the Securities and Exchange Commission (“SEC”) under authority of federal laws are also sources of authoritative GAAP for SEC registrants. The fund’s financial statements are prepared in accordance with GAAP, which may require the use of management estimates and assumptions.Actual results could differ from those estimates.
The Company enters into contracts that contain a variety of indemnifications.The fund’s maximum exposure under these arrangements is unknown.The fund does not anticipate recognizing any loss related to these arrangements.
(a) Portfolio valuation: The fair value of a financial instrument is the amount that would be received to sell an asset or paid to transfer a liability in an orderly transaction between market participants at the measurement date (i.e. the exit price). GAAP establishes a fair value hierarchy that prioritizes the inputs of valuation techniques used to measure fair value.This hierarchy gives the highest priority to unadjusted quoted prices in active markets for identical assets or liabilities (Level 1 measurements) and the lowest priority to unobservable inputs (Level 3 measurements).
Additionally, GAAP provides guidance on determining whether the volume and activity in a market has decreased significantly and whether such a decrease in activity results in transactions that are not orderly. GAAP requires enhanced disclosures around valuation inputs and techniques used during annual and interim periods.
20
Various inputs are used in determining the value of the fund’s investments relating to fair value measurements.These inputs are summarized in the three broad levels listed below:
Level 1—unadjusted quoted prices in active markets for identical investments.
Level 2—other significant observable inputs (including quoted prices for similar investments, interest rates, prepayment speeds, credit risk, etc.).
Level 3—significant unobservable inputs (including the fund’s own assumptions in determining the fair value of investments).
The inputs or methodology used for valuing securities are not necessarily an indication of the risk associated with investing in those securities.
Changes in valuation techniques may result in transfers in or out of an assigned level within the disclosure hierarchy. Valuation techniques used to value the fund’s investments are as follows:
Investments in equity securities are valued at the last sales price on the securities exchange or national securities market on which such securities are primarily traded. Securities listed on the National Market System for which market quotations are available are valued at the official closing price or, if there is no official closing price that day, at the last sales price. Securities not listed on an exchange or the national securities market, or securities for which there were no transactions, are valued at the average of the most recent bid and asked prices, except for open short positions, where the asked price is used for valuation purposes. Bid price is used when no asked price is available. Registered investment companies that are not traded on an exchange are valued at their net asset value. All preceding securities are categorized within Level 1 of the fair value hierarchy.
Investments in debt securities excluding short-term investments (other than U.S.Treasury Bills) and forward foreign currency exchange contracts
The Fund 21
NOTES TO FINANCIAL STATEMENTS (continued)
(“forward contracts”) are valued each business day by an independent pricing service (the “Service”) approved by the Board of Directors. Investments for which quoted bid prices are readily available and are representative of the bid side of the market in the judgment of the Service are valued at the mean between the quoted bid prices (as obtained by the Service from dealers in such securities) and asked prices (as calculated by the Service based upon its evaluation of the market for such securities). Other investments are valued as determined by the Service, based on methods which include consideration of: yields or prices of securities of comparable quality, coupon, maturity and type; indications as to values from dealers; and general market conditions.These securities are generally categorized within Level 2 of the fair value hierarchy.
Fair valuing of securities may be determined with the assistance of a pricing service using calculations based on indices of domestic securities and other appropriate indicators, such as prices of relevant ADRs and futures contracts. Utilizing these techniques may result in transfers between Level 1 and Level 2 of the fair value hierarchy.
When market quotations or official closing prices are not readily available, or are determined not to reflect accurately fair value, such as when the value of a security has been significantly affected by events after the close of the exchange or market on which the security is principally traded (for example, a foreign exchange or market), but before the fund calculates its net asset value, the fund may value these investments at fair value as determined in accordance with the procedures approved by the Board of Directors. Certain factors may be considered when fair valuing investments such as: fundamental analytical data, the nature and duration of restrictions on disposition, an evaluation of the forces that influence the market in which the securities are purchased and sold, and public trading in similar securities of the issuer or comparable issuers. These securities are either categorized as Level 2 or Level 3 depending on the relevant inputs used.
For restricted securities where observable inputs are limited, assumptions about market activity and risk are used and are categorized within Level 3 of the fair value hierarchy.
22
Investments denominated in foreign currencies are translated to U.S. dollars at the prevailing rates of exchange. Forward contracts are valued at the forward rate. These securities are generally categorized within Level 2 of the fair value hierarchy.
The following is a summary of the inputs used as of October 31, 2011 in valuing the fund’s investments:
| | | | | | |
| | | Level 2—Other | | Level 3— | | |
| | Level 1— | Significant | | Significant | | |
| | Unadjusted | Observable | | Unobservable | | |
| | Quoted Prices | Inputs | | Inputs | Total | |
| Assets ($) | | | | | | |
| Investments in Securities: | | | | | |
| Corporate Bonds† | — | 3,250,168 | | — | 3,250,168 | |
| Equity Securities— | | | | | | |
| Foreign† | 14,664,816 | 14,744,705 | †† | — | 29,409,521 | |
| Foreign Government | — | 16,573,075 | | — | 16,573,075 | |
| Mutual Funds/ | | | | | | |
| Exchange Traded | | | | | | |
| Funds | 3,505,761 | — | | — | 3,505,761 | |
| Other Financial | | | | | | |
| Instruments: | | | | | | |
| Forward Foreign | | | | | | |
| Currency Exchange | | | | | | |
| Contracts††† | — | 56,398 | | — | 56,398 | |
| Liabilities ($) | | | | | | |
| Other Financial | | | | | | |
| Instruments: | | | | | | |
| Forward Foreign | | | | | | |
| Currency Exchange | | | | | | |
| Contracts††† | — | (73,235 | ) | — | (73,235 | ) |
| |
| † | See Statement of Investments for additional detailed categorizations. |
| †† | Securities classified as Level 2 at period end as the values were determined pursuant to the |
| | fund's fair valuation procedures. |
| ††† | Amount shown represents unrealized appreciation (depreciation) at period end. |
In May 2011, FASB issued Accounting Standards Update (“ASU”) No. 2011-04 “Amendments to Achieve Common Fair Value Measurement and Disclosure Requirements in GAAP and International Financial Reporting Standards (“IFRS”)” (“ASU 2011-04”). ASU 2011-04 includes common requirements for measurement of and disclosure
The Fund 23
NOTES TO FINANCIAL STATEMENTS (continued)
about fair value between GAAP and IFRS. ASU 2011-04 will require reporting entities to disclose the following information for fair value measurements categorized within Level 3 of the fair value hierarchy: quantitative information about the unobservable inputs used in the fair value measurement, the valuation processes used by the reporting entity and a narrative description of the sensitivity of the fair value measurement to changes in unobservable inputs and the interrelationships between those unobservable inputs. In addition, ASU 2011-04 will require reporting entities to make disclosures about amounts and reasons for all transfers in and out of Level 1 and Level 2 fair value measurements. The new and revised disclosures are effective for interim and annual reporting periods beginning after December 15, 2011. At this time, management is evaluating the implications of ASU 2011-04 and its impact on the financial statements.
(b) Foreign currency transactions: The fund does not isolate that portion of the results of operations resulting from changes in foreign exchange rates on investments from the fluctuations arising from changes in the market prices of securities held. Such fluctuations are included with the net realized and unrealized gain or loss on investments.
Net realized foreign exchange gains or losses arise from sales of foreign currencies, currency gains or losses realized on securities transactions between trade and settlement date, and the difference between the amounts of dividends, interest and foreign withholding taxes recorded on the fund’s books and the U.S. dollar equivalent of the amounts actually received or paid. Net unrealized foreign exchange gains and losses arise from changes in the value of assets and liabilities other than investments resulting from changes in exchange rates. Foreign currency gains and losses on investments are included with net realized and unrealized gain or loss on investments.
(c) Securities transactions and investment income: Securities transactions are recorded on a trade date basis. Realized gains and losses from securities transactions are recorded on the identified cost basis. Dividend income is recognized on the ex-dividend date and interest
24
income, including, where applicable, accretion of discount and amortization of premium on investments, is recognized on the accrual basis.
Investing in foreign markets may involve special risks and considerations not typically associated with investing in the U.S. These risks include revaluation of currencies, high rates of inflation, repatriation restrictions on income and capital, and adverse political and economic developments. Moreover, securities issued in these markets may be less liquid, subject to government ownership controls and delayed settlements, and their prices may be more volatile than those of comparable securities in the U.S.
(d) Affiliated issuers: Investments in other investment companies advised by Dreyfus are defined as “affiliated” in the Act.
The fund may invest in shares of certain affiliated investment companies also advised or managed by Dreyfus. Investments in affiliated investment companies for the period ended October 31, 2011 were as follows:
| | | | | | | |
| Affiliated | | | | | | | |
| Investment | Value | | | | Value | | Net |
| Company | 3/25/2011 | ($) | Purchases ($) | Sales ($) | 10/31/2011 | ($) | Assets (%) |
| Dreyfus | | | | | | | |
| Institutional | | | | | | | |
| Preferred | | | | | | | |
| Plus Money | | | | | | | |
| Market Fund | — | | 66,925,854 | 63,814,756 | 3,111,098 | | 5.7 |
(e) Dividends to shareholders: Dividends are recorded on the ex-dividend date. Dividends from investment income-net and dividends from net realized capital gains, if any, are normally declared and paid annually, but the fund may make distributions on a more frequent basis to comply with the distribution requirements of the Internal Revenue Code of 1986, as amended (the “Code”).To the extent that net realized capital gains can be offset by capital loss carryovers, it is the policy of the fund not to distribute such gains. Income and capital gain distributions are determined in accordance with income tax regulations, which may differ from GAAP.
The Fund 25
NOTES TO FINANCIAL STATEMENTS (continued)
(f) Federal income taxes: It is the policy of the fund to continue to qualify as a regulated investment company, if such qualification is in the best interests of its shareholders, by complying with the applicable provisions of the Code, and to make distributions of taxable income sufficient to relieve it from substantially all federal income and excise taxes.
As of and during the period ended October 31, 2011, the fund did not have any liabilities for any uncertain tax positions.The fund recognizes interest and penalties, if any, related to uncertain tax positions as income tax expense in the Statement of Operations. During the period, the fund did not incur any interest or penalties.
The tax year for the period ended October 31, 2011 remains subject to examination by the Internal Revenue Service and state taxing authorities.
At October 31, 2011, the components of accumulated earnings on a tax basis were as follows: undistributed ordinary income $772,968, accumulated capital losses $2,245,845 and unrealized depreciation $4,304,560.
Under the recently enacted Regulated Investment Company Modernization Act of 2010 (the “2010 Act”), the fund will be permitted to carry forward capital losses incurred in taxable years beginning after December 22, 2010 for an unlimited period.
During the period ended October 31, 2011, as a result of permanent book to tax differences, primarily due to the tax treatment for fund start-up costs and foreign currency gains and losses, the fund increased accumulated undistributed investment income-net by $319,428, decreased accumulated net realized gain (loss) on investments by $306,157 and decreased paid-in capital by $13,271. Net assets and net asset value per share were not affected by this reclassification.
NOTE 2—Bank Lines of Credit:
The fund participates with other Dreyfus-managed funds in a $225 million unsecured credit facility led by Citibank, N.A. and a $300 million unsecured credit facility provided by The Bank of New York Mellon, a subsidiary of BNY Mellon and an affiliate of Dreyfus, (each,
26
a “Facility”), each to be utilized primarily for temporary or emergency purposes, including the financing of redemptions. In connection therewith, the fund has agreed to pay its pro rata portion of commitment fees for each Facility. Interest is charged to the fund based on rates determined pursuant to the terms of the respective Facility at the time of borrowing. During the period ended October 31, 2011, the fund did not borrow under the Facilities.
NOTE 3—Management Fee and Other Transactions With Affiliates:
(a) Pursuant to a management agreement with the Manager, the management fee is computed at the annual rate of 1% of the value of the fund’s average daily net assets and is payable monthly.The Manager has contractually agreed, until March 1, 2013, to waive receipt of its fees and/or assume the expenses of the fund so that the direct expenses of none of the classes (excluding Rule 12b-1 fees, shareholder services plan fees, taxes, interest expense, commitment fees on borrowings, brokerage commissions and extraordinary expenses) exceed 1.40% of the value of the fund’s average daily net assets. The reduction in management fee, pursuant to the undertaking, amounted to $90,407 during the period ended October 31, 2011.
During the period ended October 31, 2011, the Distributor retained $2,628 from commissions earned on sales of the fund’s Class A shares.
(b) Under the Distribution Plan (the “Plan”) adopted pursuant to Rule 12b-1 under the Act, Class C shares pay the Distributor for distributing its shares at an annual rate of .75% of the value of the average daily net assets of Class C shares. During the period ended October 31, 2011, Class C shares were charged $2,289 pursuant to the Plan.
(c) Under the Shareholder Services Plan, Class A and Class C shares pay the Distributor at an annual rate of .25% of the value of their average daily net assets for the provision of certain services.The services provided
The Fund 27
NOTES TO FINANCIAL STATEMENTS (continued)
may include personal services relating to shareholder accounts, such as answering shareholder inquiries regarding the fund and providing reports and other information, and services related to the maintenance of shareholder accounts.The Distributor may make payments to Service Agents (a securities dealer, financial institution or other industry professional) in respect of these services.The Distributor determines the amounts to be paid to Service Agents. During the period ended October 31, 2011, Class A and Class C shares were charged $932 and $763, respectively, pursuant to the Shareholder Services Plan.
The fund compensates Dreyfus Transfer, Inc., a wholly-owned subsidiary of the Manager, under a transfer agency agreement for providing personnel and facilities to perform transfer agency services for the fund. During the period ended October 31, 2011, the fund was charged $376 pursuant to the transfer agency agreement, which is included in Shareholder servicing costs in the Statement of Operations.
The fund has arrangements with the custodian and cash management bank whereby the fund may receive earnings credits when positive cash balances are maintained, which are used to offset custody and cash management fees. For financial reporting purposes, the fund includes net earnings credits as an expense offset in the Statement of Operations.
The fund compensates The Bank of New York Mellon under cash management agreements for performing cash management services related to fund subscriptions and redemptions. During the period ended October 31, 2011, the fund was charged $19 pursuant to the cash management agreements, which is included in Shareholder servicing costs in the Statement of Operations.These fees were partially offset by earnings credits of $1.
The fund also compensates The Bank of New York Mellon under a custody agreement for providing custodial services for the fund. During the period ended October 31, 2011, the fund was charged $13,424 pursuant to the custody agreement.
During the period ended October 31, 2011, the fund was charged $3,687 for services performed by the Chief Compliance Officer.
28
The components of “Due to The Dreyfus Corporation and affiliates” in the Statement of Assets and Liabilities consist of: management fees $45,931, Rule 12b-1 distribution plan fees $299, shareholder services plan fees $235, custodian fees $7,500, chief compliance officer fees $2,098 and transfer agency per account fees $150.
(d) Each Board member also serves as a Board member of other funds within the Dreyfus complex. Annual retainer fees and attendance fees are allocated to each fund based on net assets.
(e) A 2% redemption fee is charged and retained by the fund on certain shares redeemed within sixty days following the date of issuance, subject to exceptions, including redemptions made through the use of the fund’s exchange privilege.
NOTE 4—Securities Transactions:
The aggregate amount of purchases and sales (including paydowns) of investment securities, excluding short-term securities and forward contracts, during the period ended October 31, 2011, amounted to $70,881,869 and $14,670,269, respectively.
Forward Foreign Currency Exchange Contracts: The fund enters into forward contracts in order to hedge its exposure to changes in foreign currency exchange rates on its foreign portfolio holdings, to settle foreign currency transactions or as a part of its investment strategy. When executing forward contracts, the fund is obligated to buy or sell a foreign currency at a specified rate on a certain date in the future. With respect to sales of forward contracts, the fund incurs a loss if the value of the contract increases between the date the forward contract is opened and the date the forward contract is closed.The fund realizes a gain if the value of the contract decreases between those dates. With respect to purchases of forward contracts, the fund incurs a loss if the value of the contract decreases between the date the forward contract is opened and the date the forward contract is closed.The fund realizes a gain if the value of the contract increases between those dates. Any realized gain or loss which occurred during the period is reflected in
The Fund 29
NOTES TO FINANCIAL STATEMENTS (continued)
the Statement of Operations.The fund is exposed to foreign currency risk as a result of changes in value of underlying financial instruments. The fund is also exposed to credit risk associated with counterparty nonperformance on these forward contracts, which is typically limited to the unrealized gain on each open contract.The following summarizes open forward contracts at October 31, 2011:
| | | | | |
| | Foreign | | | Unrealized | |
| Forward Foreign Currency | Currency | | | Appreciation | |
| Exchange Contracts | Amounts | Cost ($) | Value ($) (Depreciation) ($) | |
| Purchases: | | | | | |
| Brazilian Real, | | | | | |
| Expiring 11/30/2011 | 110,000 | 61,398 | 63,566 | 2,168 | |
| Brazilian Real, | | | | | |
| Expiring 11/30/2011 | 560,000 | 312,569 | 323,605 | 11,036 | |
| Chilean Peso, | | | | | |
| Expiring 11/30/2011 | 164,650,000 | 321,079 | 334,893 | 13,814 | |
| Chilean Peso, | | | | | |
| Expiring 11/30/2011 | 152,730,000 | 297,834 | 310,647 | 12,813 | |
| Indonesian Rupiah, | | | | | |
| Expiring 1/18/2012 | 528,260,000 | 61,028 | 59,164 | (1,864 | ) |
| Polish Zloty, | | | | | |
| Expiring 11/30/2011 | 640,000 | 200,830 | 200,502 | (328 | ) |
| Russian Ruble, | | | | | |
| Expiring 12/15/2011 | 8,600,000 | 278,677 | 281,258 | 2,581 | |
| Russian Ruble, | | | | | |
| Expiring 12/15/2011 | 6,000,000 | 193,798 | 196,227 | 2,429 | |
| Turkish Lira, | | | | | |
| Expiring 11/30/2011 | 150,000 | 80,252 | 84,254 | 4,002 | |
| Sales: | | Proceeds ($) | | | |
| Colombian Peso, | | | | | |
| Expiring 11/30/2011 | 263,530,000 | 138,154 | 141,189 | (3,035 | ) |
| Colombian Peso, | | | | | |
| Expiring | | | | | |
| 12/22/2011 | 1,183,210,000 | 617,864 | 633,545 | (15,681 | ) |
| Euro, | | | | | |
| Expiring 11/1/2011 | 231,033 | 327,235 | 319,680 | 7,555 | |
| Euro, | | | | | |
| Expiring 11/30/2011 | 225,000 | 308,423 | 311,242 | (2,819 | ) |
| Malaysian Ringgit, | | | | | |
| Expiring 11/30/2011 | 2,210,000 | 708,299 | 719,073 | (10,774 | ) |
| Malaysian Ringgit, | | | | | |
| Expiring 11/30/2011 | 1,270,000 | 407,032 | 413,223 | (6,191 | ) |
| Mexican New Peso, | | | | | |
| Expiring 11/30/2011 | 600,000 | 44,551 | 44,888 | (337 | ) |
30
| | | | | |
| | Foreign | | | Unrealized | |
| Forward Foreign Currency | Currency | | | Appreciation | |
| Exchange Contracts | Amounts | Proceeds ($) | Value ($) (Depreciation) ($) | |
| Sales (continued): | | | | | |
| Peruvian New Sol, | | | | | |
| Expiring 11/30/2011 | 2,280,000 | 832,876 | 839,809 | (6,933 | ) |
| Peruvian New Sol, | | | | | |
| Expiring 11/30/2011 | 560,000 | 204,566 | 206,269 | (1,703 | ) |
| Peruvian New Sol, | | | | | |
| Expiring 12/22/2011 | 550,000 | 194,552 | 202,290 | (7,738 | ) |
| Philippines Peso, | | | | | |
| Expiring 11/29/2011 | 8,660,000 | 200,207 | 202,752 | (2,545 | ) |
| Philippines Peso, | | | | | |
| Expiring 12/22/2011 | 3,560,000 | 80,652 | 83,268 | (2,616 | ) |
| South Korean Won, | | | | | |
| Expiring 11/1/2011 | 59,310,219 | 53,394 | 53,519 | (125 | ) |
| Russian Ruble, | | | | | |
| Expiring 11/30/2011 | 8,100,000 | 259,345 | 265,728 | (6,383 | ) |
| Thai Baht, | | | | | |
| Expiring 11/30/2011 | 3,010,000 | 97,065 | 97,632 | (567 | ) |
| South African Rand, | | | | | |
| Expiring 11/30/2011 | 2,630,000 | 326,347 | 329,943 | (3,596 | ) |
| Gross Unrealized | | | | | |
| Appreciation | | | | 56,398 | |
| Gross Unrealized | | | | | |
| Depreciation | | | | (73,235 | ) |
The following summarizes the average market value of derivatives outstanding during the period ended October 31, 2011:
| |
| | Average Market Value ($) |
| Forward contracts | 3,417,555 |
At October 31, 2011, the cost of investments for federal income tax purposes was $56,992,884; accordingly, accumulated net unrealized depreciation on investments was $4,254,359, consisting of $548,597 gross unrealized appreciation and $4,802,956 gross unrealized depreciation.
The Fund 31
REPORT OF INDEPENDENT REGISTERED
PUBLIC ACCOUNTING FIRM
Shareholders and Board of Directors
Dreyfus Total Emerging Markets Fund
We have audited the accompanying statement of assets and liabilities, including the statement of investments, of Dreyfus Total Emerging Markets Fund (one of the series comprising Advantage Funds, Inc.) as of October 31, 2011, and the related statements of operations and changes in net assets and financial highlights for the period from March 25, 2011 (commencement of operations) to October 31, 2011. These financial statements and financial highlights are the responsibility of the Fund’s management. Our responsibility is to express an opinion on these financial statements and financial highlights based on our audit.
We conducted our audit in accordance with the standards of the Public Company Accounting Oversight Board (United States).Those standards require that we plan and perform the audit to obtain reasonable assurance about whether the financial statements and financial highlights are free of material misstatement.We were not engaged to perform an audit of the Fund’s internal control over financial reporting. Our audit included consideration of internal control over financial reporting as a basis for designing audit procedures that are appropriate in the circumstances, but not for the purpose of expressing an opinion on the effectiveness of the Fund’s internal control over financial reporting. Accordingly, we express no such opinion.An audit also includes examining, on a test basis, evidence supporting the amounts and disclosures in the financial statements and financial highlights, assessing the accounting principles used and significant estimates made by management, and evaluating the overall financial statement presentation. Our procedures included confirmation of securities owned as of October 31, 2011 by correspondence with the custodian and others.We believe that our audit provides a reasonable basis for our opinion.
In our opinion, the financial statements and financial highlights referred to above present fairly, in all material respects, the financial position of Dreyfus Total Emerging Markets Fund at October 31, 2011, and the results of its operations, the changes in its net assets and the financial highlights for the period from March 25, 2011 to October 31, 2011, in conformity with U.S. generally accepted accounting principles.

New York, New York
December 29, 2011
32
BOARD MEMBERS INFORMATION (Unaudited)
|
| Joseph S. DiMartino (68) |
| Chairman of the Board (1995) |
| Principal Occupation During Past 5Years: |
| • Corporate Director and Trustee |
| Other Public Company Board Memberships During Past 5Years: |
| • CBIZ (formerly, Century Business Services, Inc.), a provider of outsourcing functions for small |
| and medium size companies, Director (1997-present) |
| • Sunair Services Corporation, a provider of certain outdoor-related services to homes and |
| businesses, Director (2005-2009) |
| • The Newark Group, a provider of a national market of paper recovery facilities, paperboard |
| mills and paperboard converting plants, Director (2000-2010) |
| No. of Portfolios for which Board Member Serves: 167 |
| ——————— |
| Peggy C. Davis (68) |
| Board Member (2006) |
| Principal Occupation During Past 5Years: |
| • Shad Professor of Law, New York University School of Law |
| • Writer and teacher in the fields of evidence, constitutional theory, family law, social sciences |
| and the law, legal process and professional methodology and training |
| No. of Portfolios for which Board Member Serves: 53 |
| ——————— |
| David P. Feldman (71) |
| Board Member (1996) |
| Principal Occupation During Past 5Years: |
| • Corporate Director and Trustee |
| Other Public Company Board Memberships During Past 5Years: |
| • BBH Mutual Funds Group (4 registered mutual funds), Director (1992-present) |
| • QMed, Inc. a healthcare company, Director (1999-2007) |
| No. of Portfolios for which Board Member Serves: 50 |
The Fund 33
BOARD MEMBERS INFORMATION (Unaudited) (continued)
|
| Ehud Houminer (71) |
| Board Member (1993) |
| Principal Occupation During Past 5Years: |
| • Executive-in-Residence at the Columbia Business School, Columbia University (1992-present) |
| Other Public Company Board Memberships During Past 5Years: |
| • Avnet Inc., an electronics distributor, Director (1993-present) |
| No. of Portfolios for which Board Member Serves: 64 |
| ——————— |
| Dr. Martin Peretz (72) |
| Board Member (2006) |
| Principal Occupation During Past 5Years: |
| • Editor-in-Chief Emeritus of The New Republic Magazine (2010-present) (previously, |
| Editor-in-Chief, 1974-2010) |
| • Director of TheStreet.com, a financial information service on the web (1996-present) |
| No. of Portfolios for which Board Member Serves: 35 |
| ——————— |
| Once elected all Board Members serve for an indefinite term, but achieve Emeritus status upon reaching age 80.The |
| address of the Board Members and Officers is in c/o The Dreyfus Corporation, 200 Park Avenue, NewYork, NewYork |
| 10166.Additional information about the Board Members is available in the fund’s Statement of Additional Information |
| which can be obtained from Dreyfus free of charge by calling this toll free number: 1-800-DREYFUS. |
| James F. Henry, Emeritus Board Member |
| Dr. Paul A. Marks, Emeritus Board Member |
| Gloria Messinger, Emeritus Board Member |
34
OFFICERS OF THE FUND (Unaudited)
The Fund 35
OFFICERS OF THE FUND (Unaudited) (continued)
36
The Fund 37
Dreyfus
Total Return
Advantage Fund
ANNUAL REPORT October 31, 2011

Save time. Save paper. View your next shareholder report online as soon as it’s available. Log into www.dreyfus.com and sign up for Dreyfus eCommunications. It’s simple and only takes a few minutes.
The views expressed in this report reflect those of the portfolio manager only through the end of the period covered and do not necessarily represent the views of Dreyfus or any other person in the Dreyfus organization. Any such views are subject to change at any time based upon market or other conditions and Dreyfus disclaims any responsibility to update such views.These views may not be relied on as investment advice and, because investment decisions for a Dreyfus fund are based on numerous factors, may not be relied on as an indication of trading intent on behalf of any Dreyfus fund.
| | Contents |
| | THE FUND |
| 2 | A Letter from the Chairman and CEO |
| 3 | Discussion of Fund Performance |
| 6 | Fund Performance |
| 8 | Understanding Your Fund’s Expenses |
| 8 | Comparing Your Fund’s Expenses With Those of Other Funds |
| 9 | Statement of Investments |
| 27 | Statement of Financial Futures |
| 28 | Statement of Securities Sold Short |
| 29 | Statement of Assets and Liabilities |
| 30 | Statement of Operations |
| 31 | Statement of Changes in Net Assets |
| 33 | Financial Highlights |
| 36 | Notes to Financial Statements |
| 63 | Report of Independent Registered Public Accounting Firm |
| 64 | Important Tax Information |
| 65 | Board Members Information |
| 67 | Officers of the Fund |
| | FOR MORE INFORMATION |
| | Back Cover |
|
| Dreyfus |
| Total Return |
| Advantage Fund |
The Fund

A LETTER FROM THE CHAIRMAN AND CEO
Dear Shareholder:
We are pleased to present this annual report for Dreyfus Total Return Advantage Fund, covering the 12-month period from November 1, 2010, through October 31, 2011. For information about how the fund performed during the reporting period, as well as general market perspectives, we provide a Discussion of Fund Performance on the pages that follow.
Investors were encouraged by expectations of a more robust economic recovery during the final months of 2010, but sentiment deteriorated sharply in 2011 due to disappointing global economic data, rising commodity prices, an escalating sovereign debt crisis in Europe and a contentious debate regarding taxes, spending and borrowing in the United States. International bond markets proved sensitive to these macroeconomic developments, as increasingly risk-averse investors flocked to traditional “safe havens,” such as U.S.Treasury securities and other high-quality developed nation sovereign debt. In contrast, bonds in emerging markets generally suffered, seemingly regardless of underlying credit fundamentals.
The economic outlook currently remains clouded by market turbulence and political infighting, but we believe that a continued subpar global expansion is more likely than a return to recession. Although Europe continues to struggle with a debt crisis, inflationary pressures appear to be waning in most countries as energy prices recently have retreated from their highs. In the United States, moderately low core inflation and an accommodative monetary policy could help support near-trend growth despite ongoing deleveraging activity in the private sector, potentially supporting a renewed rally among corporate-backed bonds. To assess the impact of these and other developments on your investments, we encourage you, as always, to speak with your financial advisor.
Thank you for your continued confidence and support.

Jonathan R. Baum
Chairman and Chief Executive Officer
The Dreyfus Corporation
November 15, 2011
2

DISCUSSION OF FUND PERFORMANCE
For the period of November 1, 2010, through October 31, 2011, as provided by David Kwan and Lowell Bennett, Portfolio Managers
Fund and Market Performance Overview
For the 12-month period ended October 31, 2011, Dreyfus Total Return Advantage Fund’s Class A shares achieved a total return of 4.06%, Class C shares returned 3.25% and Class I shares returned 4.38%.1 In comparison, the fund’s benchmark, the Barclays Capital U.S. Aggregate Bond Index (the “Index”), produced a total return of 5.00% for the same period.2
Global fixed-income and currency markets proved volatile during the reporting period amid shifting investor perceptions of relative risks. The fund produced lower returns than its benchmark, primarily due to overweighted exposure to corporate- and mortgage-backed bonds later in the reporting period.
The Fund’s Investment Approach
The fund seeks to maximize total return from capital appreciation and income.To pursue its goal, the fund normally invests primarily in fixed income securities and other instruments that provide exposure to fixed income, including those that provide exposure to currency markets.
We employ an active core bond strategy to focus the fund’s investments on the U.S. fixed-income market. We also employ global bond and currency strategies to provide the fund with exposure to foreign and U.S. fixed-income and currency markets.
Shifting Sentiment Sparked Heightened Market Volatility
Positive economic momentum supported riskier assets, such as corporate bonds, early in the reporting period. However, their advance was interrupted in February 2011, when political unrest in the Middle East led to sharply rising energy prices, and again in March, when natural and nuclear disasters in Japan disrupted the global industrial supply chain. Nonetheless, most financial assets rebounded quickly from these unexpected shocks.
The Fund 3
DISCUSSION OF FUND PERFORMANCE (continued)
Investor sentiment began to deteriorate in earnest in late April when pressures mounted on the banking systems of several European nations. In addition, investors reacted cautiously to disappointing economic data in the United States and a contentious political debate regarding government spending and borrowing. Fixed-income and currency markets suffered bouts of heightened volatility when newly risk-averse investors shifted their focus to traditionally defensive investments, such as U.S.Treasury securities.Volatility was especially severe in August and September, after a major credit-rating agency downgraded its assessment of long-term U.S. government debt. In contrast, riskier assets rebounded and traditional safe havens declined in October when some macroeconomic worries seemed to ease.
Higher Yielding Bonds Weighed on Fund Performance
The fund’s core bond portfolio participated to a substantial degree in the rally among U.S. government securities over the reporting period’s second half. However, overweighted exposure to higher yielding bonds, including investment-grade corporate securities and mortgage-backed securities, prevented the fund from participating more fully in the benefits of falling long-term interest rates.
The fund achieved better results from its global bond allocation strategy, where overweighted exposure to U.S. treasury bonds helped boost the fund’s participation in the flight to quality.The fund also benefited from an overweighted position in Germany and underweighted exposure to bonds in the United Kingdom.The fund’s currency strategy had a more mildly positive impact on the fund’s relative performance. Good results stemming from underweighted exposure to the U.S. dollar and an overweighted position in the Australian dollar were balanced by shortfalls stemming from changing tactical positions in the struggling euro.
Maintaining Caution in Turbulent Markets
We currently expect the global and U.S. economic recoveries to persist, but a number of headwinds could keep growth at subpar levels. As a result, interest rates appear likely to remain near historical lows for some time. Moreover, in the wake of the summertime flight to quality, traditional safe havens in fixed-income markets currently seem richly valued compared to historical norms.
4
Therefore, in the fund’s bond core portfolio, we have maintained an emphasis on higher yielding market sectors in order to capture more generous levels of income. To manage risks, we have established a relatively short duration posture in the core portfolio, with an emphasis on maturities in the five-year range.The fund’s global allocation strategy ended the reporting period with an overweighted position in the U.S. and German bond markets and relatively light exposure to the United Kingdom, reflecting a more troublesome inflation outlook in the latter country. Finally, our currency strategy ended the reporting period with an emphasis on the Japanese yen and Swedish krona, as well as underweighted exposure to the U.S. dollar and euro. In our judgment, these are prudent strategies given our relative value assessments of the global bond and currency markets.
November 15, 2011
| |
| | Bond funds are subject generally to interest rate, credit, liquidity and market risks, to varying |
| | degrees, all of which are more fully described in the fund’s prospectus. Generally, all other factors |
| | being equal, bond prices are inversely related to interest-rate changes, and rate increases can cause |
| | price declines. |
| | Foreign bonds are subject to special risks including exposure to currency fluctuations, changing |
| | political and economic conditions and potentially less liquidity. |
| | Investments in foreign currencies are subject to the risk that those currencies will decline in value |
| | relative to the U.S. dollar, or, in the case of hedged positions, that the U.S. dollar will decline |
| | relative to the currency being hedged. Currency rates in foreign countries may fluctuate significantly |
| | over short periods of time.A decline in the value of foreign currencies relative to the U.S. dollar |
| | will reduce the value of securities held by the fund and denominated in those currencies. |
| 1 | Total return includes reinvestment of dividends and any capital gains paid and does not take into |
| | consideration the maximum initial sales charge in the case of Class A shares or the applicable |
| | contingent deferred sales charge imposed on redemptions in the case of Class C shares. Had these |
| | charges been reflected, returns would have been lower. Class I shares are not subject to any initial |
| | or deferred sales charge. Past performance is no guarantee of future results. Share price and |
| | investment return fluctuate such that upon redemption, fund shares may be worth more or less |
| | than their original cost. Return figures provided reflect the absorption of certain fund expenses by |
| | The Dreyfus Corporation pursuant to an agreement in effect through March 1, 2013, at which |
| | time it may be extended, modified or terminated. Had these expenses not been absorbed, the |
| | fund’s returns would have been lower. |
| 2 | SOURCE: LIPPER INC. — Reflects reinvestment of dividends and, where applicable, capital |
| | gain distributions.The Barclays Capital U.S.Aggregate Bond Index is a widely accepted, |
| | unmanaged total return index of corporate, U.S. government and U.S. government agency debt |
| | instruments, mortgage-backed securities and asset-backed securities with an average maturity of |
| | 1-10 years. Index returns do not reflect fees and expenses associated with operating a mutual |
| | fund. Investors cannot invest directly in any index. |
The Fund 5
FUND PERFORMANCE

|
| † Source: Lipper Inc. |
| Past performance is not predictive of future performance. |
| The above graph compares a $10,000 investment made in Class A, Class C and Class I shares of Dreyfus Total |
| Return Advantage Fund on 3/15/06 (inception date) to a $10,000 investment made in the Barclays Capital U.S. |
| Aggregate Bond Index (the “Index”) on that date.All dividends and capital gain distributions are reinvested. |
| The fund invests primarily in fixed-income securities and instruments that provide investment exposure to fixed-income |
| markets.The fund’s performance shown in the line graph above takes into account the maximum initial sales charge on |
| Class A shares and all other applicable fees and expenses on all classes.The Index is a widely accepted, unmanaged total |
| return index of corporate, U.S. government and U.S. government agency debt instruments, mortgage-backed securities and |
| asset-backed securities with an average maturity of 1-10 years. Unlike a mutual fund, the Index is not subject to charges, |
| fees and other expenses. Investors cannot invest directly in any index. Further information relating to fund performance, |
| including expense reimbursements, if applicable, is contained in the Financial Highlights section of the prospectus and |
| elsewhere in this report. |
6
| | | | | | | |
| Average Annual Total Returns as of 10/31/11 | | | | | | |
| |
| | Inception | | | | | From | |
| | Date | 1 | Year | 5 Years | | Inception | |
| Class A shares | | | | | | | |
| with maximum sales charge (4.5%) | 3/15/06 | –0.60 | % | 5.25 | % | 5.35 | % |
| without sales charge | 3/15/06 | 4.06 | % | 6.22 | % | 6.22 | % |
| Class C shares | | | | | | | |
| with applicable redemption charge † | 3/15/06 | 2.28 | % | 5.42 | % | 5.42 | % |
| without redemption | 3/15/06 | 3.25 | % | 5.42 | % | 5.42 | % |
| Class I shares | 3/15/06 | 4.38 | % | 6.49 | % | 6.49 | % |
| Barclays Capital | | | | | | | |
| U.S. Aggregate Bond Index | 2/28/06 | 5.00 | % | 6.41 | % | 6.26 | %†† |
Past performance is not predictive of future performance.The fund’s performance shown in the graph and table does not reflect the deduction of taxes that a shareholder would pay on fund distributions or the redemption of fund shares.
| |
| † | The maximum contingent deferred sales charge for Class C shares is 1% for shares redeemed within one year of the |
| | date of purchase. |
| †† | For comparative purposes, the value of the Index as of 2/28/06 is used as the beginning value on 3/15/06. |
The Fund 7
UNDERSTANDING YOUR FUND’S EXPENSES (Unaudited)
As a mutual fund investor, you pay ongoing expenses, such as management fees and other expenses. Using the information below, you can estimate how these expenses affect your investment and compare them with the expenses of other funds.You also may pay one-time transaction expenses, including sales charges (loads) and redemption fees, which are not shown in this section and would have resulted in higher total expenses. For more information, see your fund’s prospectus or talk to your financial adviser.
Review your fund’s expenses
The table below shows the expenses you would have paid on a $1,000 investment in DreyfusTotal Return Advantage Fund from May 1, 2011 to October 31, 2011. It also shows how much a $1,000 investment would be worth at the close of the period, assuming actual returns and expenses.
Expenses and Value of a $1,000 Investment
assuming actual returns for the six months ended October 31, 2011
| | | | | | |
| | | Class A | | Class C | | Class I |
| Expenses paid per $1,000† | | $4.11 | | $7.94 | | $2.83 |
| Ending value (after expenses) | | $1,038.00 | | $1,033.40 | | $1,039.30 |
COMPARING YOUR FUND’S EXPENSES
WITH THOSE OF OTHER FUNDS (Unaudited)
Using the SEC’s method to compare expenses
The Securities and Exchange Commission (SEC) has established guidelines to help investors assess fund expenses. Per these guidelines, the table below shows your fund’s expenses based on a $1,000 investment, assuming a hypothetical 5% annualized return. You can use this information to compare the ongoing expenses (but not transaction expenses or total cost) of investing in the fund with those of other funds.All mutual fund shareholder reports will provide this information to help you make this comparison. Please note that you cannot use this information to estimate your actual ending account balance and expenses paid during the period.
Expenses and Value of a $1,000 Investment
assuming a hypothetical 5% annualized return for the six months ended October 31, 2011
| | | | | | |
| | | Class A | | Class C | | Class I |
| Expenses paid per $1,000† | | $4.08 | | $7.88 | | $2.80 |
| Ending value (after expenses) | | $1,021.17 | | $1,017.39 | | $1,022.43 |
|
| † Expenses are equal to the fund’s annualized expense ratio of .80% for Class A, 1.55% for Class C and .55% |
| for Class I, multiplied by the average account value over the period, multiplied by 184/365 (to reflect the |
| one-half year period). |
8
STATEMENT OF INVESTMENTS
October 31, 2011
| | | | | |
| | Coupon | Maturity | Principal | | |
| Bonds and Notes—95.8% | Rate (%) | Date | Amount ($) | | Value ($) |
| Aerospace & Defense—.2% | | | | | |
| Boeing, | | | | | |
| Sr. Unscd. Notes | 3.75 | 11/20/16 | 75,000 | | 82,539 |
| United Technologies, | | | | | |
| Sr. Unscd. Notes | 6.13 | 7/15/38 | 35,000 | | 43,118 |
| | | | | | 125,657 |
| Agriculture—.4% | | | | | |
| Altria Group, | | | | | |
| Gtd. Notes | 8.50 | 11/10/13 | 88,000 | | 100,708 |
| Altria Group, | | | | | |
| Gtd. Notes | 9.95 | 11/10/38 | 50,000 | | 76,196 |
| Reynolds American, | | | | | |
| Gtd. Notes | 7.63 | 6/1/16 | 75,000 | | 89,430 |
| | | | | | 266,334 |
| Asset—Backed Certificates—.4% | | | | | |
| SLM Student Loan Trust, | | | | | |
| Ser. 2007-2, Cl. A2 | 0.42 | 7/25/17 | 204,597 | a | 202,814 |
| SLM Student Loan Trust, | | | | | |
| Ser. 2003-7, Cl. A4 | 0.55 | 3/15/19 | 77,712 | a | 77,693 |
| | | | | | 280,507 |
| Asset-Backed Ctfs./ | | | | | |
| Auto Receivables—.2% | | | | | |
| Americredit Automobile Receivables | | | | | |
| Trust, Ser. 2007-CM, Cl. A4A | 5.55 | 4/7/14 | 25,995 | | 26,404 |
| Americredit Automobile Receivables | | | | | |
| Trust, Ser. 2007-DF, Cl. A4A | 5.56 | 6/6/14 | 31,474 | | 32,267 |
| Nissan Auto Receivables Owner | | | | | |
| Trust, Ser. 2007-B, Cl. A4 | 5.16 | 3/17/14 | 55,336 | | 55,433 |
| | | | | | 114,104 |
| Asset-Backed Ctfs./Credit Cards—.4% | | | | | |
| Chase Issuance Trust, | | | | | |
| Ser. 2007-A10, Cl. A10 | 0.28 | 6/16/14 | 114,000 | a | 113,942 |
| MBNA Credit Card Master Note | | | | | |
| Trust, Ser. 2002-A3, Cl. A3 | 0.48 | 9/15/14 | 200,000 | a | 200,162 |
| | | | | | 314,104 |
The Fund 9
STATEMENT OF INVESTMENTS (continued)
| | | | |
| | Coupon | Maturity | Principal | |
| Bonds and Notes (continued) | Rate (%) | Date | Amount ($) | Value ($) |
| Automotive—.2% | | | | |
| Daimler Finance North America, | | | | |
| Gtd. Notes | 8.50 | 1/18/31 | 45,000 | 64,608 |
| Johnson Controls, | | | | |
| Sr. Unscd. Notes | 5.50 | 1/15/16 | 100,000 | 112,035 |
| | | | | 176,643 |
| Banks—3.8% | | | | |
| Bank of America, | | | | |
| Sr. Unscd. Notes, Ser. L | 5.65 | 5/1/18 | 40,000 | 40,107 |
| Bank of America, | | | | |
| Sr. Unscd. Notes | 5.75 | 12/1/17 | 40,000 | 39,866 |
| Bank of America, | | | | |
| Sub. Notes | 7.25 | 10/15/25 | 65,000 | 64,435 |
| Barclays Bank, | | | | |
| Sr. Unscd. Notes | 5.20 | 7/10/14 | 120,000 | 126,785 |
| Capital One Capital V, | | | | |
| Gtd. Notes | 10.25 | 8/15/39 | 20,000 | 20,825 |
| Capital One Financial, | | | | |
| Sr. Unscd. Notes | 2.13 | 7/15/14 | 50,000 | 49,964 |
| Capital One Financial, | | | | |
| Sr. Unscd. Notes | 7.38 | 5/23/14 | 75,000 | 83,992 |
| China Development Bank, | | | | |
| Sr. Unscd. Notes | 4.75 | 10/8/14 | 25,000 | 26,805 |
| Citigroup, | | | | |
| Sub. Notes | 5.00 | 9/15/14 | 30,000 | 30,590 |
| Citigroup, | | | | |
| Sub. Notes | 5.50 | 2/15/17 | 65,000 | 66,684 |
| Citigroup, | | | | |
| Sr. Unscd. Notes | 6.00 | 8/15/17 | 50,000 | 54,481 |
| Citigroup, | | | | |
| Sr. Unscd. Notes | 6.13 | 11/21/17 | 75,000 | 82,704 |
| Citigroup, | | | | |
| Sr. Unscd. Notes | 6.88 | 3/5/38 | 26,000 | 32,137 |
| Comerica Bank, | | | | |
| Sub. Notes | 5.75 | 11/21/16 | 15,000 | 16,619 |
| Credit Suisse/New York, | | | | |
| Sr. Unscd. Notes | 3.50 | 3/23/15 | 50,000 | 50,904 |
| Deutsche Bank AG London, | | | | |
| Sr. Unscd. Notes | 5.38 | 10/12/12 | 50,000 | 51,691 |
10
| | | | |
| | Coupon | Maturity | Principal | |
| Bonds and Notes (continued) | Rate (%) | Date | Amount ($) | Value ($) |
| Banks (continued) | | | | |
| Deutsche Bank AG London, | | | | |
| Sr. Unscd. Notes | 6.00 | 9/1/17 | 10,000 | 11,355 |
| Export-Import Bank of Korea, | | | | |
| Sr. Unscd. Notes | 4.38 | 9/15/21 | 250,000 | 251,238 |
| Export-Import Bank of Korea, | | | | |
| Sr. Unscd. Notes | 8.13 | 1/21/14 | 90,000 | 100,445 |
| Fifth Third Bancorp, | | | | |
| Sr. Unscd. Notes | 6.25 | 5/1/13 | 30,000 | 31,837 |
| Goldman Sachs Group, | | | | |
| Sr. Unscd. Notes | 5.25 | 10/15/13 | 100,000 | 104,254 |
| Goldman Sachs Group, | | | | |
| Sub. Notes | 6.75 | 10/1/37 | 160,000 | 154,198 |
| HSBC Bank USA, | | | | |
| Sub. Notes | 4.63 | 4/1/14 | 100,000 | 103,615 |
| HSBC Holdings, | | | | |
| Sub. Notes | 5.25 | 12/12/12 | 50,000 | 51,653 |
| JPMorgan Chase & Co., | | | | |
| Sr. Unscd. Notes | 3.70 | 1/20/15 | 125,000 | 130,329 |
| JPMorgan Chase & Co., | | | | |
| Sr. Unscd. Notes | 6.00 | 1/15/18 | 35,000 | 39,215 |
| JPMorgan Chase & Co., | | | | |
| Sr. Unscd. Notes | 6.30 | 4/23/19 | 50,000 | 56,742 |
| JPMorgan Chase & Co., | | | | |
| Sr. Unscd. Notes | 6.40 | 5/15/38 | 25,000 | 30,212 |
| Korea Development Bank, | | | | |
| Sr. Unscd. Notes | 8.00 | 1/23/14 | 100,000 | 111,631 |
| Landwirtschaftliche Rentenbank, | | | | |
| Gtd. Notes | 1.88 | 9/17/18 | 100,000 | 98,317 |
| Landwirtschaftliche Rentenbank, | | | | |
| Govt. Gtd. Notes | 4.13 | 7/15/13 | 25,000 | 26,477 |
| Morgan Stanley, | | | | |
| Sr. Unscd. Notes | 6.00 | 4/28/15 | 150,000 | 158,213 |
| Morgan Stanley, | | | | |
| Sr. Unscd. Notes | 6.63 | 4/1/18 | 75,000 | 78,269 |
| PNC Funding, | | | | |
| Bank Gtd. Notes | 2.70 | 9/19/16 | 100,000 | 101,328 |
| PNC Funding, | | | | |
| Bank Gtd. Notes | 5.63 | 2/1/17 | 15,000 | 16,473 |
The Fund 11
STATEMENT OF INVESTMENTS (continued)
| | | | | |
| | Coupon | Maturity | Principal | | |
| Bonds and Notes (continued) | Rate (%) | Date | Amount ($) | | Value ($) |
| Banks (continued) | | | | | |
| Royal Bank of Scotland, | | | | | |
| Gtd. Notes, Ser. 2 | 3.40 | 8/23/13 | 50,000 | | 49,707 |
| Sovereign Bank, | | | | | |
| Sub. Notes | 8.75 | 5/30/18 | 50,000 | | 57,080 |
| UBS AG/Stamford, | | | | | |
| Sr. Unscd. Notes | 4.88 | 8/4/20 | 50,000 | | 51,450 |
| Wachovia, | | | | | |
| Sub. Notes | 5.63 | 10/15/16 | 25,000 | | 27,235 |
| Wells Fargo & Co., | | | | | |
| Sr. Unscd. Notes | 5.25 | 10/23/12 | 20,000 | | 20,782 |
| Wells Fargo & Co., | | | | | |
| Sr. Unscd. Notes | 5.38 | 2/7/35 | 25,000 | | 26,904 |
| Wells Fargo & Co., | | | | | |
| Sr. Unscd. Notes | 5.63 | 12/11/17 | 55,000 | | 63,413 |
| Wells Fargo Capital X, | | | | | |
| Gtd. Cap. Secs. | 5.95 | 12/1/86 | 20,000 | | 20,409 |
| | | | | | 2,811,370 |
| Building & Construction—.2% | | | | | |
| CRH America, | | | | | |
| Gtd. Notes | 6.00 | 9/30/16 | 100,000 | | 107,469 |
| Chemicals-Fibers & Diversified—.4% | | | | | |
| Dow Chemical, | | | | | |
| Sr. Unscd. Notes | 5.90 | 2/15/15 | 100,000 | | 111,368 |
| E.I. Du Pont De Nemours & Co., | | | | | |
| Sr. Unscd. Notes | 6.00 | 7/15/18 | 100,000 | | 122,501 |
| Rohm and Haas, | | | | | |
| Sr. Unscd. Notes | 6.00 | 9/15/17 | 75,000 | | 85,353 |
| | | | | | 319,222 |
| Commercial Mortgage | | | | | |
| Pass-Through Ctfs.—3.3% | | | | | |
| Banc of America Commercial | | | | | |
| Mortgage, Ser. 2005-1, Cl. A4 | 5.23 | 11/10/42 | 200,000 | a | 207,405 |
| Bear Stearns Commercial Mortgage | | | | | |
| Securities, Ser. 2002-TOP6, Cl. A2 | 6.46 | 10/15/36 | 213,472 | | 215,111 |
| Credit Suisse Mortgage Capital | | | | | |
| Certificates, Ser. 2007-C1, Cl. A3 | 5.38 | 2/15/40 | 250,000 | | 258,021 |
| Credit Suisse Mortgage Capital | | | | | |
| Certificates, Ser. 2006-C3, Cl. A3 | 5.82 | 6/15/38 | 100,000 | a | 109,520 |
12
| | | | | |
| | Coupon | Maturity | Principal | | |
| Bonds and Notes (continued) | Rate (%) | Date | Amount ($) | | Value ($) |
| Commercial Mortgage | | | | | |
| Pass-Through Ctfs. (continued) | | | | | |
| JP Morgan Chase Commercial | | | | | |
| Mortgage Securities, | | | | | |
| Ser. 2003-CB7, Cl. A4 | 4.88 | 1/12/38 | 343,070 | a | 362,233 |
| JP Morgan Chase Commercial | | | | | |
| Mortgage Securities, | | | | | |
| Ser. 2005-LDP3, Cl. A4A | 4.94 | 8/15/42 | 102,000 | a | 112,765 |
| LB-UBS Commercial Mortgage Trust, | | | | | |
| Ser. 2004-C7, Cl. A1A | 4.48 | 10/15/29 | 194,424 | | 201,352 |
| Merrill Lynch/Countrywide | | | | | |
| Commercial Mortgage Trust, | | | | | |
| Ser. 2007-5, Cl. A3 | 5.36 | 8/12/48 | 100,000 | | 103,433 |
| Merrill Lynch/Countrywide | | | | | |
| Commercial Mortgage Trust, | | | | | |
| Ser. 2006-2, Cl. A4 | 5.90 | 6/12/46 | 100,000 | a | 113,585 |
| Morgan Stanley Capital I, | | | | | |
| Ser. 2003-IQ4, Cl. A2 | 4.07 | 5/15/40 | 329,645 | | 340,586 |
| Morgan Stanley Capital I, | | | | | |
| Ser. 2006-T21, Cl. A3 | 5.19 | 10/12/52 | 110,000 | a | 112,136 |
| Morgan Stanley Capital I, | | | | | |
| Ser. 2006-HQ8, Cl. AJ | 5.50 | 3/12/44 | 65,000 | a | 50,709 |
| Morgan Stanley Dean Witter Capital | | | | | |
| I, Ser. 2003-HQ2, Cl. A1 | 4.18 | 3/12/35 | 68,784 | | 69,711 |
| Wachovia Bank Commercial Mortgage | | | | | |
| Trust, Ser. 2005-C16, Cl. A2 | 4.38 | 10/15/41 | 17,623 | | 17,638 |
| Wachovia Bank Commercial Mortgage | | | | | |
| Trust, Ser. 2003-C8, Cl. A3 | 4.45 | 11/15/35 | 127,194 | | 127,695 |
| | | | | | 2,401,900 |
| Computers—.1% | | | | | |
| Hewlett-Packard, | | | | | |
| Sr. Unscd. Notes | 2.35 | 3/15/15 | 100,000 | | 102,002 |
| Consumer Discretionary—.2% | | | | | |
| Kimberly-Clark, | | | | | |
| Sr. Unscd. Notes | 6.13 | 8/1/17 | 100,000 | | 121,158 |
| Diversified Financial | | | | | |
| Services—2.3% | | | | | |
| American Express Credit, | | | | | |
| Sr. Unscd. Notes | 2.80 | 9/19/16 | 275,000 | | 279,586 |
The Fund 13
STATEMENT OF INVESTMENTS (continued)
| | | | |
| | Coupon | Maturity | Principal | |
| Bonds and Notes (continued) | Rate (%) | Date | Amount ($) | Value ($) |
| Diversified Financial | | | | |
| Services (continued) | | | | |
| American Express Credit, | | | | |
| Sr. Unscd. Notes | 5.13 | 8/25/14 | 135,000 | 146,813 |
| American Express Credit, | | | | |
| Sr. Unscd. Notes, Ser. C | 7.30 | 8/20/13 | 50,000 | 54,759 |
| Ameriprise Financial, | | | | |
| Sr. Unscd. Notes | 5.65 | 11/15/15 | 15,000 | 16,977 |
| Bear Stearns, | | | | |
| Sr. Unscd. Notes | 5.70 | 11/15/14 | 100,000 | 109,469 |
| Bear Stearns, | | | | |
| Sr. Unscd. Notes | 6.40 | 10/2/17 | 10,000 | 11,557 |
| Blackrock, | | | | |
| Sr. Unscd. Notes | 6.25 | 9/15/17 | 10,000 | 11,587 |
| Caterpillar Financial Services, | | | | |
| Sr. Unscd. Notes | 7.15 | 2/15/19 | 100,000 | 128,020 |
| Credit Suisse USA, | | | | |
| Bank Gtd. Notes | 4.88 | 1/15/15 | 50,000 | 52,627 |
| General Electric Capital, | | | | |
| Sr. Unscd. Notes | 2.10 | 1/7/14 | 100,000 | 101,190 |
| General Electric Capital, | | | | |
| Sr. Unscd. Notes | 5.63 | 5/1/18 | 65,000 | 71,967 |
| General Electric Capital, | | | | |
| Sr. Unscd. Notes | 5.88 | 1/14/38 | 105,000 | 113,083 |
| General Electric Capital, | | | | |
| Sr. Unscd. Notes | 6.88 | 1/10/39 | 50,000 | 60,640 |
| HSBC Finance, | | | | |
| Sr. Unscd Note | 6.68 | 1/15/21 | 55,000 | 56,036 |
| John Deere Capital, | | | | |
| Sr. Unscd. Notes | 2.25 | 6/7/16 | 50,000 | 51,244 |
| JPMorgan Chase & Co., | | | | |
| Sr. Unscd. Notes | 5.38 | 10/1/12 | 100,000 | 104,294 |
| MBNA, | | | | |
| Sr. Unscd. Notes | 5.00 | 6/15/15 | 50,000 | 49,292 |
| Merrill Lynch & Co., | | | | |
| Sr. Unscd. Notes | 6.40 | 8/28/17 | 20,000 | 20,303 |
| Merrill Lynch & Co., | | | | |
| Notes | 6.88 | 4/25/18 | 100,000 | 102,858 |
| Simon Property Group, | | | | |
| Sr. Unscd. Notes | 10.35 | 4/1/19 | 100,000 | 136,135 |
| | | | | 1,678,437 |
14
| | | | |
| | Coupon | Maturity | Principal | |
| Bonds and Notes (continued) | Rate (%) | Date | Amount ($) | Value ($) |
| Diversified Metals & Mining—.8% | | | | |
| Alcoa, | | | | |
| Sr. Unscd. Notes | 5.55 | 2/1/17 | 29,000 | 30,635 |
| BHP Billiton Finance USA, | | | | |
| Gtd. Notes | 5.50 | 4/1/14 | 150,000 | 166,488 |
| Newmont Mining, | | | | |
| Gtd. Notes | 5.13 | 10/1/19 | 100,000 | 110,777 |
| Rio Tinto Finance USA, | | | | |
| Gtd. Notes | 3.75 | 9/20/21 | 175,000 | 182,189 |
| Vale Overseas, | | | | |
| Gtd. Notes | 6.25 | 1/23/17 | 35,000 | 39,331 |
| Vale Overseas, | | | | |
| Gtd. Notes | 6.88 | 11/21/36 | 50,000 | 57,315 |
| | | | | 586,735 |
| Electric Utilities—1.8% | | | | |
| Consolidated Edison of NY, | | | | |
| Sr. Unscd. Debs., Ser. 05-C | 5.38 | 12/15/15 | 20,000 | 22,923 |
| Constellation Energy Group, | | | | |
| Sr. Unscd. Notes | 7.60 | 4/1/32 | 50,000 | 60,302 |
| Dominion Resources, | | | | |
| Sr. Unscd. Notes, Ser. F | 5.25 | 8/1/33 | 48,000 | 53,443 |
| Dominion Resources, | | | | |
| Sr. Unscd. Notes, Ser. B | 5.95 | 6/15/35 | 50,000 | 60,016 |
| Duke Energy, | | | | |
| Sr. Unscd. Notes | 6.30 | 2/1/14 | 100,000 | 110,688 |
| Exelon, | | | | |
| Sr. Unscd. Notes | 4.90 | 6/15/15 | 50,000 | 54,513 |
| FirstEnergy, | | | | |
| Sr. Unscd. Notes, Ser. C | 7.38 | 11/15/31 | 50,000 | 63,027 |
| Hydro-Quebec, | | | | |
| Gov’t. Gtd. Debs., Ser. I0 | 8.05 | 7/7/24 | 150,000 | 221,931 |
| Hydro-Quebec, | | | | |
| Gov’t. Gtd. Debs., Ser. HY | 8.40 | 1/15/22 | 60,000 | 86,639 |
| Indiana Michigan Power, | | | | |
| Sr. Unscd. Notes | 7.00 | 3/15/19 | 50,000 | 60,912 |
| Nevada Power, | | | | |
| Mortgage Notes | 7.13 | 3/15/19 | 50,000 | 62,229 |
| NextEra Energy | | | | |
| Capital Holdings, | | | | |
| Gtd. Debs | 7.88 | 12/15/15 | 100,000 | 119,663 |
The Fund 15
STATEMENT OF INVESTMENTS (continued)
| | | | | |
| | Coupon | Maturity | Principal | | |
| Bonds and Notes (continued) | Rate (%) | Date | Amount ($) | | Value ($) |
| Electric Utilities (continued) | | | | | |
| Pacific Gas & Electric, | | | | | |
| Sr. Unscd. Bonds | 6.05 | 3/1/34 | 50,000 | | 61,602 |
| Progress Energy Carolina, | | | | | |
| First Mortgage Bonds | 3.00 | 9/15/21 | 100,000 | | 101,280 |
| Southern California Edison, | | | | | |
| First Mortgage Bonds, Ser. 05-A | 5.00 | 1/15/16 | 35,000 | | 39,685 |
| Southern Power, | | | | | |
| Sr. Unscd. Notes, Ser. D | 4.88 | 7/15/15 | 50,000 | | 54,848 |
| SouthWestern Public Service, | | | | | |
| Sr. Unscd. Notes, Ser. G | 8.75 | 12/1/18 | 50,000 | | 67,638 |
| | | | | | 1,301,339 |
| Food & Beverages—.9% | | | | | |
| Anheuser-Busch InBev Worldwide, | | | | | |
| Gtd. Notes | 4.13 | 1/15/15 | 100,000 | | 109,039 |
| Bottling Group, | | | | | |
| Gtd. Notes | 6.95 | 3/15/14 | 100,000 | | 113,648 |
| Coca-Cola, | | | | | |
| Sr. Notes | 3.30 | 9/1/21 | 100,000 | b | 103,829 |
| HJ Heinz, | | | | | |
| Sr. Unscd. Notes | 3.13 | 9/12/21 | 100,000 | | 98,784 |
| Kraft Foods, | | | | | |
| Sr. Unscd. Notes | 6.13 | 2/1/18 | 100,000 | | 118,106 |
| Pepsico, | | | | | |
| Sr. Unscd. Notes | 4.65 | 2/15/13 | 100,000 | | 105,147 |
| | | | | | 648,553 |
| Foreign/Governmental—3.4% | | | | | |
| Asian Development Bank, | | | | | |
| Sr. Notes | 2.50 | 3/15/16 | 150,000 | | 159,027 |
| Asian Development Bank, | | | | | |
| Sr. Unscd. Notes | 2.75 | 5/21/14 | 65,000 | | 68,557 |
| Brazilian Government, | | | | | |
| Sr. Unscd. Bonds | 6.00 | 1/17/17 | 100,000 | | 116,750 |
| Brazilian Government, | | | | | |
| Unscd. Bonds | 10.13 | 5/15/27 | 75,000 | | 121,500 |
| Canadian Government, | | | | | |
| Sr. Unscd. Notes | 2.38 | 9/10/14 | 100,000 | | 105,185 |
| Corp Andina de Fomento, | | | | | |
| Sr. Unscd. Notes | 5.20 | 5/21/13 | 125,000 | | 131,773 |
16
| | | | |
| | Coupon | Maturity | Principal | |
| Bonds and Notes (continued) | Rate (%) | Date | Amount ($) | Value ($) |
| Foreign/Governmental (continued) | | | | |
| Council of Europe Development | | | | |
| Bank, Sr. Unscd. Note | 1.25 | 9/22/16 | 100,000 | 99,172 |
| European Investment Bank, | | | | |
| Sr. Unscd. Notes | 1.13 | 8/15/14 | 50,000 | 50,526 |
| European Investment Bank, | | | | |
| Sr. Unsub. Notes | 1.25 | 10/14/16 | 100,000 | 99,498 |
| European Investment Bank, | | | | |
| Sr. Unscd. Notes | 3.00 | 4/8/14 | 150,000 | 158,143 |
| European Investment Bank, | | | | |
| Sr. Unscd. Bonds | 5.13 | 5/30/17 | 140,000 | 166,178 |
| Italian Government, | | | | |
| Sr. Unscd. Notes | 5.38 | 6/15/33 | 50,000 | 43,737 |
| Italian Government, | | | | |
| Sr. Unscd. Notes | 6.88 | 9/27/23 | 50,000 | 50,044 |
| KFW, | | | | |
| Gov’t Gtd. Notes | 2.75 | 9/8/20 | 200,000 | 206,192 |
| KFW, | | | | |
| Gov’t Gtd. Notes | 4.88 | 1/17/17 | 100,000 | 116,620 |
| Mexican Government, | | | | |
| Sr. Unscd. Notes | 5.63 | 1/15/17 | 100,000 | 114,500 |
| Mexican Government, | | | | |
| Sr. Unscd. Notes | 5.95 | 3/19/19 | 56,000 | 65,884 |
| Mexican Government, | | | | |
| Sr. Unscd. Notes | 6.63 | 3/3/15 | 50,000 | 57,125 |
| Peruvian Government, | | | | |
| Sr. Unscd. Bonds | 8.75 | 11/21/33 | 36,000 | 54,270 |
| Province of Manitoba Canada, | | | | |
| Sr. Unscd. Debs., Ser. FH | 4.90 | 12/6/16 | 5,000 | 5,792 |
| Province of | | | | |
| New Brunswick Canada, | | | | |
| Sr. Unscd. Bonds | 2.75 | 6/15/18 | 50,000 | 51,606 |
| Province of Ontario Canada, | | | | |
| Sr. Unscd. Bonds | 4.40 | 4/14/20 | 160,000 | 180,034 |
| Province of Quebec Canada, | | | | |
| Debs., Ser. NJ | 7.50 | 7/15/23 | 150,000 | 212,526 |
| Province of Quebec Canada, | | | | |
| Unscd. Debs., Ser. PD | 7.50 | 9/15/29 | 50,000 | 76,345 |
| | | | | 2,510,984 |
The Fund 17
STATEMENT OF INVESTMENTS (continued)
| | | | | |
| | Coupon | Maturity | Principal | | |
| Bonds and Notes (continued) | Rate (%) | Date | Amount ($) | | Value ($) |
| Health Care—1.8% | | | | | |
| Abbott Laboratories, | | | | | |
| Sr. Unscd. Notes | 6.15 | 11/30/37 | 50,000 | | 64,081 |
| Aetna, | | | | | |
| Sr. Unscd. Notes | 6.00 | 6/15/16 | 15,000 | | 17,357 |
| Amgen, | | | | | |
| Sr. Unscd. Notes | 5.65 | 6/15/42 | 75,000 | | 91,030 |
| Astrazeneca, | | | | | |
| Sr. Unscd. Notes | 5.40 | 6/1/14 | 25,000 | | 27,872 |
| Astrazeneca, | | | | | |
| Sr. Unscd. Notes | 5.90 | 9/15/17 | 10,000 | | 12,145 |
| Astrazeneca, | | | | | |
| Sr. Unscd. Notes | 6.45 | 9/15/37 | 30,000 | | 40,608 |
| Bristol-Myers Squibb, | | | | | |
| Sr. Unscd. Notes | 5.88 | 11/15/36 | 18,000 | | 22,951 |
| GlaxoSmithKline Capital, | | | | | |
| Gtd. Bonds | 5.65 | 5/15/18 | 100,000 | | 120,012 |
| Merck & Co., | | | | | |
| Sr. Unscd. Notes | 4.38 | 2/15/13 | 100,000 | | 104,967 |
| Merck & Co., | | | | | |
| Gtd. Notes | 6.50 | 12/1/33 | 50,000 | a | 68,612 |
| Pfizer, | | | | | |
| Sr. Unscd. Notes | 7.20 | 3/15/39 | 50,000 | | 74,956 |
| Teva Pharmaceutical Finance, | | | | | |
| Gtd. Notes | 3.00 | 6/15/15 | 350,000 | | 367,338 |
| Thermo Fisher Scientific, | | | | | |
| Sr. Unscd. Notes | 3.60 | 8/15/21 | 150,000 | | 155,640 |
| UnitedHealth Group, | | | | | |
| Sr. Unscd. Notes | 5.38 | 3/15/16 | 26,000 | | 30,010 |
| WellPoint, | | | | | |
| Sr. Unscd. Notes | 2.38 | 2/15/17 | 25,000 | | 24,803 |
| Wyeth, | | | | | |
| Gtd. Notes | 5.50 | 2/1/14 | 100,000 | | 110,334 |
| | | | | | 1,332,716 |
| Industrial—.3% | | | | | |
| Danaher, | | | | | |
| Sr. Notes | 1.30 | 6/23/14 | 50,000 | | 50,596 |
| Deere & Co. | | | | | |
| Sr. Unscd. Notes | 4.38 | 10/16/19 | 120,000 | | 135,673 |
18
| | | | |
| | Coupon | Maturity | Principal | |
| Bonds and Notes (continued) | Rate (%) | Date | Amount ($) | Value ($) |
| Industrial (continued) | | | | |
| Waste Management, | | | | |
| Gtd. Notes | 4.75 | 6/30/20 | 50,000 | 54,632 |
| | | | | 240,901 |
| Media—1.1% | | | | |
| Comcast, | | | | |
| Gtd. Notes | 6.30 | 11/15/17 | 30,000 | 35,490 |
| Comcast, | | | | |
| Gtd. Notes | 6.45 | 3/15/37 | 50,000 | 59,978 |
| Comcast, | | | | |
| Gtd. Notes | 6.95 | 8/15/37 | 20,000 | 25,286 |
| DIRECTV Holdings, | | | | |
| Gtd. Notes | 3.55 | 3/15/15 | 145,000 | 152,159 |
| Discovery | | | | |
| Communications, | | | | |
| Gtd. Notes | 3.70 | 6/1/15 | 140,000 | 147,903 |
| Grupo Televisa, | | | | |
| Sr. Unscd. Notes | 6.63 | 3/18/25 | 10,000 | 10,900 |
| News America, | | | | |
| Gtd. Notes | 6.15 | 3/1/37 | 110,000 | 121,208 |
| Time Warner Cable, | | | | |
| Gtd. Debs | 6.75 | 6/15/39 | 110,000 | 134,167 |
| Time Warner, | | | | |
| Gtd. Debs | 6.10 | 7/15/40 | 75,000 | 86,911 |
| Time Warner, | | | | |
| Gtd. Notes | 7.63 | 4/15/31 | 20,000 | 25,785 |
| | | | | 799,787 |
| Municipal Bonds—.1% | | | | |
| California, | | | | |
| GO (Various Purpose) | 5.45 | 4/1/15 | 20,000 | 22,069 |
| California, | | | | |
| GO (Build America Bonds) | 7.30 | 10/1/39 | 50,000 | 58,974 |
| California, | | | | |
| GO (Build America Bonds) | 7.55 | 4/1/39 | 20,000 | 24,392 |
| | | | | 105,435 |
| Office Equipment—.2% | | | | |
| Xerox, | | | | |
| Sr. Unscd. Notes | 4.25 | 2/15/15 | 130,000 | 137,187 |
The Fund 19
STATEMENT OF INVESTMENTS (continued)
| | | | | |
| | Coupon | Maturity | Principal | | |
| Bonds and Notes (continued) | Rate (%) | Date | Amount ($) | | Value ($) |
| Oil & Gas—1.9% | | | | | |
| Anadarko Petroleum, | | | | | |
| Sr. Unscd. Notes | 5.95 | 9/15/16 | 100,000 | | 115,045 |
| Baker Hughes, | | | | | |
| Sr. Unscd. Notes | 3.20 | 8/15/21 | 150,000 | b | 154,451 |
| ConocoPhillips, | | | | | |
| Gtd. Notes | 6.50 | 2/1/39 | 50,000 | | 68,594 |
| Encana, | | | | | |
| Sr. Unscd. Notes | 6.50 | 2/1/38 | 25,000 | | 30,420 |
| Hess, | | | | | |
| Sr. Unscd. Notes | 8.13 | 2/15/19 | 75,000 | | 96,678 |
| Nexen, | | | | | |
| Sr. Unscd. Notes | 6.40 | 5/15/37 | 25,000 | | 26,964 |
| Pemex Project Funding Master | | | | | |
| Trust, Gtd. Notes | 5.75 | 3/1/18 | 35,000 | | 38,850 |
| Petrobras International Finance, | | | | | |
| Gtd. Notes | 5.88 | 3/1/18 | 25,000 | | 27,000 |
| Petrobras International Finance, | | | | | |
| Gtd. Notes | 6.88 | 1/20/40 | 100,000 | | 116,896 |
| Sempra Energy, | | | | | |
| Sr. Unscd. Notes | 6.15 | 6/15/18 | 50,000 | | 58,894 |
| Shell International Finance, | | | | | |
| Gtd. Notes | 6.38 | 12/15/38 | 50,000 | | 68,859 |
| Suncor Energy, | | | | | |
| Sr. Unscd. Notes | 6.50 | 6/15/38 | 25,000 | | 31,102 |
| Total Capital, | | | | | |
| Gtd. Notes | 3.00 | 6/24/15 | 400,000 | | 424,767 |
| Transocean, | | | | | |
| Gtd. Notes | 6.00 | 3/15/18 | 90,000 | | 95,808 |
| | | | | | 1,354,328 |
| Paper & Paper Related—.2% | | | | | |
| International Paper, | | | | | |
| Sr. Unscd. Notes | 7.95 | 6/15/18 | 100,000 | | 120,181 |
| Pipelines—.7% | | | | | |
| El Paso Natural Gas, | | | | | |
| Sr. Unscd. Notes | 5.95 | 4/15/17 | 35,000 | | 39,102 |
| Energy Transfer Partners, | | | | | |
| Sr. Unscd. Notes | 5.95 | 2/1/15 | 100,000 | | 108,453 |
| Enterprise Products Operating, | | | | | |
| Gtd. Notes, Ser. G | 5.60 | 10/15/14 | 50,000 | | 55,158 |
20
| | | | |
| | Coupon | Maturity | Principal | |
| Bonds and Notes (continued) | Rate (%) | Date | Amount ($) | Value ($) |
| Pipelines (continued) | | | | |
| Kinder Morgan | | | | |
| Energy Partners, | | | | |
| Sr. Unscd. Notes | 5.80 | 3/15/35 | 60,000 | 63,111 |
| Oneok, | | | | |
| Sr. Unscd. Notes | 6.00 | 6/15/35 | 45,000 | 50,481 |
| TransCanada Pipelines, | | | | |
| Sr. Unscd. Notes | 7.63 | 1/15/39 | 50,000 | 71,758 |
| Williams Partners, | | | | |
| Sr. Unscd. Notes | 3.80 | 2/15/15 | 150,000 | 157,388 |
| | | | | 545,451 |
| Property & Casualty | | | | |
| Insurance—1.3% | | | | |
| Ace INA Holdings, | | | | |
| Gtd. Notes | 5.88 | 6/15/14 | 15,000 | 16,599 |
| Aflac, | | | | |
| Sr. Unscd. Notes | 8.50 | 5/15/19 | 50,000 | 62,767 |
| Allstate, | | | | |
| Sr. Unscd. Notes | 5.55 | 5/9/35 | 50,000 | 54,759 |
| American International Group, | | | | |
| Sr. Unscd. Notes | 5.05 | 10/1/15 | 50,000 | 49,873 |
| Berkshire Hathaway Finance, | | | | |
| Gtd. Notes | 5.40 | 5/15/18 | 50,000 | 57,230 |
| Berkshire Hathaway, | | | | |
| Sr. Unscd. Notes | 2.20 | 8/15/16 | 100,000 | 101,893 |
| Chubb, | | | | |
| Sr. Unscd. Notes | 6.00 | 5/11/37 | 50,000 | 60,143 |
| MetLife, | | | | |
| Sr. Unscd. Notes | 5.70 | 6/15/35 | 50,000 | 57,428 |
| MetLife, | | | | |
| Sr. Unscd. Notes | 6.75 | 6/1/16 | 300,000 | 349,522 |
| MetLife, | | | | |
| Jr. Sub. Debs | 10.75 | 8/1/69 | 50,000 | 66,166 |
| Progressive, | | | | |
| Sr. Unscd. Notes | 6.25 | 12/1/32 | 16,000 | 19,040 |
| Prudential Financial, | | | | |
| Sr. Unscd. Notes | 5.70 | 12/14/36 | 50,000 | 52,785 |
| Travelers, | | | | |
| Sr. Unscd. Notes | 5.80 | 5/15/18 | 20,000 | 23,300 |
| | | | | 971,505 |
The Fund 21
STATEMENT OF INVESTMENTS (continued)
| | | | | |
| | Coupon | Maturity | Principal | | |
| Bonds and Notes (continued) | Rate (%) | Date | Amount ($) | | Value ($) |
| Retail—.9% | | | | | |
| CVS Caremark, | | | | | |
| Sr. Unscd. Notes | 5.75 | 6/1/17 | 100,000 | | 116,906 |
| Home Depot, | | | | | |
| Sr. Unscd. Notes | 5.40 | 3/1/16 | 100,000 | | 114,226 |
| McDonald’s, | | | | | |
| Sr. Unscd. Notes | 5.35 | 3/1/18 | 75,000 | | 89,616 |
| Target, | | | | | |
| Sr. Unscd. Notes | 6.50 | 10/15/37 | 50,000 | | 66,564 |
| Wal-Mart Stores, | | | | | |
| Sr. Unscd. Notes | 3.63 | 7/8/20 | 10,000 | | 10,727 |
| Wal-Mart Stores, | | | | | |
| Sr. Notes | 5.00 | 10/25/40 | 225,000 | | 256,817 |
| | | | | | 654,856 |
| Technology—.5% | | | | | |
| HP Enterprise Services, | | | | | |
| Sr. Unscd. Notes, Ser. B | 6.00 | 8/1/13 | 100,000 | a | 107,921 |
| International Business Machines, | | | | | |
| Sr. Unscd. Notes | 5.70 | 9/14/17 | 100,000 | | 121,392 |
| Oracle, | | | | | |
| Sr. Unscd. Notes | 5.75 | 4/15/18 | 100,000 | | 120,105 |
| | | | | | 349,418 |
| Telecommunications—2.0% | | | | | |
| America Movil SAB de CV, | | | | | |
| Gtd. Notes | 6.38 | 3/1/35 | 10,000 | | 12,010 |
| AT&T, | | | | | |
| Sr. Unscd. Notes | 5.35 | 9/1/40 | 170,000 | | 186,310 |
| AT&T, | | | | | |
| Sr. Unscd. Notes | 5.55 | 8/15/41 | 100,000 | | 113,265 |
| AT&T, | | | | | |
| Gtd. Notes | 8.00 | 11/15/31 | 6,000 | a | 8,575 |
| Centurylink, | | | | | |
| Sr. Unscd. Notes | 6.45 | 6/15/21 | 100,000 | | 100,346 |
| Cisco Systems, | | | | | |
| Sr. Unscd. Notes | 5.90 | 2/15/39 | 50,000 | | 62,716 |
| Deutsche Telekom International | | | | | |
| Finance, Gtd. Bonds | 9.25 | 6/1/32 | 20,000 | | 30,139 |
| France Telecom, | | | | | |
| Sr. Unscd. Notes | 2.13 | 9/16/15 | 200,000 | | 201,408 |
22
| | | | | |
| | Coupon | Maturity | Principal | | |
| Bonds and Notes (continued) | Rate (%) | Date | Amount ($) | | Value ($) |
| Telecommunications (continued) | | | | | |
| Telecom Italia Capital, | | | | | |
| Gtd. Notes | 5.25 | 11/15/13 | 100,000 | | 100,597 |
| Telefonica Emisiones, | | | | | |
| Gtd. Notes | 3.73 | 4/27/15 | 350,000 | | 347,110 |
| Verizon Communications, | | | | | |
| Sr. Unscd. Notes | 6.40 | 2/15/38 | 50,000 | | 62,782 |
| Verizon Global Funding, | | | | | |
| Sr. Unscd. Notes | 4.38 | 6/1/13 | 25,000 | | 26,343 |
| Vodafone Group, | | | | | |
| Sr. Unscd. Notes | 5.75 | 3/15/16 | 150,000 | | 174,189 |
| Vodafone Group, | | | | | |
| Sr. Unscd. Bonds | 6.15 | 2/27/37 | 50,000 | | 63,221 |
| | | | | | 1,489,011 |
| Transportation—.3% | | | | | |
| Burlington Northern Santa Fe, | | | | | |
| Sr. Unscd. Debs | 7.95 | 8/15/30 | 50,000 | | 71,021 |
| Burlington Northern Sante Fe, | | | | | |
| Sr. Unscd. Notes | 5.75 | 3/15/18 | 75,000 | | 87,200 |
| Norfolk Southern, | | | | | |
| Sr. Unscd. Bonds | 4.84 | 10/1/41 | 66,000 | b | 70,128 |
| Union Pacific, | | | | | |
| Sr. Unscd. Notes | 4.16 | 7/15/22 | 9,000 | b | 9,543 |
| Union Pacific, | | | | | |
| Sr. Unscd. Bonds | 5.45 | 1/31/13 | 9,000 | | 9,507 |
| | | | | | 247,399 |
| U.S. Government Agencies—7.2% | | | | | |
| Federal Home Loan Banks, | | | | | |
| Bonds | 5.50 | 7/15/36 | 100,000 | | 117,940 |
| Federal Home Loan Mortgage Corp., | | | | | |
| Notes | 2.88 | 2/9/15 | 500,000 | c | 533,228 |
| Federal Home Loan Mortgage Corp., | | | | | |
| Notes | 3.75 | 3/27/19 | 144,000 | c | 162,095 |
| Federal Home Loan Mortgage Corp., | | | | | |
| Notes | 5.05 | 1/26/15 | 1,700,000 | c | 1,921,473 |
| Federal Home Loan Mortgage Corp., | | | | | |
| Notes | 6.25 | 7/15/32 | 100,000 | c | 140,406 |
| Federal National Mortgage | | | | | |
| Association, Notes | 4.75 | 2/21/13 | 1,700,000 | c | 1,798,119 |
The Fund 23
STATEMENT OF INVESTMENTS (continued)
| | | | | | | |
| | | Coupon | Maturity | Principal | | | |
| Bonds and Notes (continued) | | Rate (%) | Date | Amount ($) | | | Value ($) |
| U.S. Government Agencies (continued) | | | | | | | |
| Federal National Mortgage | | | | | | | |
| Association, Bonds | | 5.00 | 5/11/17 | 425,000 | c | | 503,425 |
| Federal National Mortgage | | | | | | | |
| Association, Bonds | | 6.25 | 5/15/29 | 100,000 | c | | 136,693 |
| | | | | | | | 5,313,379 |
| U.S. Government Agencies/ | | | | | | | |
| Mortgage-Backed—43.5% | | | | | | | |
| Federal Home Loan Mortgage Corp.: | | | | | | | |
| 4.50%, 12/1/19—8/1/25 | | | | 487,496 | c | | 520,289 |
| 4.99%, 6/1/38 | | | | 129,066 | a,c | | 137,640 |
| 5.00%, 11/1/19—7/1/35 | | | | 426,342 | c | | 460,787 |
| 5.50%, 12/1/27—9/1/38 | | | | 1,882,035 | c | | 2,036,784 |
| 5.63%, 2/1/37 | | | | 26,042 | a,c | | 28,126 |
| 5.73%, 2/1/37 | | | | 25,063 | a,c | | 26,566 |
| 5.92%, 1/1/37 | | | | 21,843 | a,c | | 23,017 |
| 6.00%, 10/1/19—9/1/34 | | | | 99,104 | c | | 108,377 |
| 6.50%, 8/1/12—8/1/32 | | | | 414,545 | c | | 468,285 |
| 7.00%, 1/1/36 | | | | 75,709 | c | | 87,417 |
| Federal National Mortgage Association: | | | | | | | |
| 3.50% | | | | 2,510,000 | c,d | | 2,606,853 |
| 4.00% | | | | 4,340,000 | c,d | | 4,539,505 |
| 4.50% | | | | 4,520,000 | c,d | | 4,794,853 |
| 5.00% | | | | 3,098,000 | c,d | | 3,332,597 |
| 6.00% | | | | 440,000 | c,d | | 482,213 |
| 2.38%, 12/1/34 | | | | 78,485 | a,c | | 82,288 |
| 4.00%, 4/1/19 | | | | 233,950 | c | | 250,236 |
| 4.50%, 6/1/29—10/1/40 | | | | 1,246,172 | c | | 1,319,901 |
| 5.00%, 9/1/29—8/1/40 | | | | 1,507,276 | c | | 1,623,979 |
| 5.50%, 7/1/17—4/1/38 | | | | 1,535,245 | c | | 1,671,849 |
| 5.52%, 10/1/37 | | | | 45,223 | a,c | | 48,203 |
| 5.57%, 4/1/37 | | | | 31,388 | a,c | | 33,815 |
| 5.74%, 9/1/38 | | | | 135,869 | a,c | | 145,867 |
| 6.00%, 11/1/16—1/1/36 | | | | 1,139,972 | c | | 1,260,181 |
24
| | | | |
| | | Principal | | |
| Bonds and Notes (continued) | | Amount ($) | | Value ($) |
| U.S. Government Agencies/ | | | | |
| Mortgage-Backed (continued) | | | | |
| Federal National Mortgage Association (continued): | | | | |
| 6.50%, 7/1/33—8/1/38 | | 317,385 | c | 352,741 |
| 7.00%, 4/1/32 | | 41,158 | c | 47,475 |
| Government National | | | | |
| Mortgage Association I: | | | | |
| 4.00% | | 750,000 | d | 800,156 |
| 4.50% | | 1,690,000 | d | 1,837,347 |
| 5.50% | | 190,000 | d | 210,900 |
| 6.00% | | 280,000 | d | 312,856 |
| 6.50% | | 120,000 | d | 134,934 |
| 5.00%, 11/15/35—5/15/39 | | 1,636,540 | | 1,803,506 |
| 5.50%, 2/15/33—4/15/38 | | 288,888 | | 322,169 |
| | | | | 31,911,712 |
| U.S. Government Securities—14.8% | | | | |
| U.S. Treasury Bonds: | | | | |
| 3.88%, 8/15/40 | | 1,350,000 | | 1,522,969 |
| 4.75%, 2/15/37 | | 1,400,000 | | 1,801,625 |
| 7.88%, 2/15/21 | | 2,550,000 | | 3,816,633 |
| U.S. Treasury Notes; | | | | |
| 2.38%, 10/31/14 | | 3,500,000 | | 3,702,073 |
| | | | | 10,843,300 |
| Total Bonds and Notes | | | | |
| (cost $67,523,000) | | | | 70,283,084 |
| | | | |
| Short-Term Investments—.2% | | | |
| | U.S. Treasury Bills: | | | |
| | 0.00%, 3/8/12 | 55,000 | e | 54,996 |
| | 0.01%, 3/22/12 | 110,000 | e | 109,986 |
| | Total Short-Term Investments | | | |
| | (cost $164,993) | | | 164,982 |
The Fund 25
STATEMENT OF INVESTMENTS (continued)
| | | | |
| Other Investment—27.4% | Shares | | Value ($) | |
| Registered Investment Company; | | | | |
| Dreyfus Institutional Preferred | | | | |
| Plus Money Market Fund | | | | |
| (cost $20,068,547) | 20,068,547 | f | 20,068,547 | |
| |
| Total Investments (cost $87,756,540) | 123.4 | % | 90,516,613 | |
| Liabilities, Less Cash and Receivables | (23.4 | %) | (17,159,774 | ) |
| Net Assets | 100.0 | % | 73,356,839 | |
GO General Obligation
|
| a Variable rate security—interest rate subject to periodic change. |
| b Securities exempt from registration under Rule 144A of the Securities Act of 1933.These securities may be resold in |
| transactions exempt from registration, normally to qualified institutional buyers.At October 31, 2011, these securities |
| were valued at $337,951 or .5% of net assets. |
| c The Federal Housing Finance Agency (“FHFA”) placed Federal Home Loan Mortgage Corporation and Federal |
| National Mortgage Association into conservatorship with FHFA as the conservator.As such, the FHFA oversees the |
| continuing affairs of these companies. |
| d Purchased on a forward commitment basis. |
| e Held by a broker as collateral for open financial futures positions. |
| f Investment in affiliated money market mutual fund. |
| | | |
| Portfolio Summary (Unaudited)† | | |
| |
| | Value (%) | | Value (%) |
| U.S. Government & Agencies | 65.5 | Asset/Mortgage-Backed | 4.3 |
| Short-Term/ | | Foreign/Governmental | 3.4 |
| Money Market Investments | 27.6 | Municipal Bonds | .1 |
| Corporate Bonds | 22.5 | | 123.4 |
| |
| † Based on net assets. | | | |
| See notes to financial statements. | | | |
26
STATEMENT OF FINANCIAL FUTURES
October 31, 2011
| | | | | | |
| | | | | | Unrealized | |
| | | Market Value | | | Appreciation | |
| | | Covered by | | | (Depreciation) | |
| | Contracts | Contracts ($) | | Expiration | at 10/31/2011 | ($) |
| Financial Futures Long | | | | | | |
| Australian 10 Year Bonds | 39 | 4,618,981 | | December 2011 | (139,208 | ) |
| Canadian 10 Year Bonds | 7 | 925,417 | | December 2011 | (11,075 | ) |
| Euro-Bond | 26 | 4,912,781 | | December 2011 | 48,727 | |
| Euro-Schatz | 24 | 3,672,055 | | December 2011 | 2,004 | |
| U.S. Treasury 2 Year Notes | 36 | 7,930,125 | | December 2011 | (6,263 | ) |
| U.S. Treasury 5 Year Notes | 39 | 4,781,766 | | December 2011 | (12,925 | ) |
| U.S. Treasury 10 Year Notes | 44 | 5,678,750 | | December 2011 | (12,772 | ) |
| U.S. Treasury 30 Year Bonds | 7 | 973,219 | | December 2011 | (21,515 | ) |
| Financial Futures Short | | | | | | |
| Australian 3 Year Bonds | 33 | (3,707,408 | ) | December 2011 | 38,622 | |
| Euro-Bobl | 24 | (4,095,348 | ) | December 2011 | (28,340 | ) |
| Japanese 10 Year Mini Bond | 12 | (2,188,394 | ) | December 2011 | 7,777 | |
| Long Gilt | 46 | (9,529,070 | ) | December 2011 | 56,198 | |
| U.S. Treasury 5 Year Notes | 49 | (6,007,860 | ) | December 2011 | (843 | ) |
| U.S. Treasury 10 Year Notes | 28 | (4,646,250 | ) | December 2011 | 23,457 | |
| Gross Unrealized Appreciation | | | | | 176,785 | |
| Gross Unrealized Depreciation | | | | | (232,941 | ) |
See notes to financial statements.
The Fund 27
STATEMENT OF SECURITIES SOLD SHORT
October 31, 2011
| | | | | |
| | | Principal | | | |
| Bonds and Notes | | Amount ($) | | | Value ($) |
| Federal National Mortgage Association: | | | | | |
| 5.50% | | 420,000 | a,b | | 455,459 |
| 6.00% | | 240,000 | a,b | | 259,987 |
| 6.50% | | 270,000 | a,b | | 297,591 |
| Government National Mortgage Association: | | | | | |
| 5.00% | | 520,000 | a,b | | 571,513 |
| Total Securities Sold Short | | | | | |
| (proceeds $1,579,720) | | | | | 1,584,550 |
|
| a The FHFA placed Federal National Mortgage Association and Federal Home Loan Mortgage Corporation into |
| conservatorship with FHFA as the conservator.As such, the FHFA oversees the continuing affairs of these companies. |
| b Sold on a delayed delivery basis. |
See notes to financial statements.
28
STATEMENT OF ASSETS AND LIABILITIES
October 31, 2011
| | | |
| | Cost | Value | |
| Assets ($): | | | |
| Investments in securities—See Statement of Investments: | | | |
| Unaffiliated issuers | 67,687,993 | 70,448,066 | |
| Affiliated issuers | 20,068,547 | 20,068,547 | |
| Cash | | 651,787 | |
| Cash on initial margin—Note 4 | | 950,909 | |
| Receivable from broker for proceeds on securities sold short | | 1,579,720 | |
| Unrealized appreciation on forward foreign | | | |
| currency exchange contracts—Note 4 | | 988,345 | |
| Receivable for investment securities sold | | 690,471 | |
| Dividends and interest receivable | | 452,333 | |
| Receivable for shares of Common Stock subscribed | | 48,091 | |
| Prepaid expenses | | 16,976 | |
| | | 95,895,245 | |
| Liabilities ($): | | | |
| Due to The Dreyfus Corporation and affiliates—Note 3(c) | | 41,266 | |
| Payable for open mortgage—backed dollar rolls—Note 4 | | 18,561,932 | |
| Securities Sold Short, at value (proceeds $1,579,720)— | | | |
| See Statement of Securities Sold Short—Note 4 | | 1,584,550 | |
| Payable for investment securities purchased | | 1,097,476 | |
| Unrealized depreciation on forward foreign | | | |
| currency exchange contracts—Note 4 | | 1,081,103 | |
| Payable for shares of Common Stock redeemed | | 54,800 | |
| Payable for futures variation margin—Note 4 | | 46,067 | |
| Accrued expenses | | 71,212 | |
| | | 22,538,406 | |
| Net Assets ($) | | 73,356,839 | |
| Composition of Net Assets ($): | | | |
| Paid-in capital | | 70,359,565 | |
| Accumulated undistributed investment income—net | | 559,926 | |
| Accumulated net realized gain (loss) on investments | | (169,593 | ) |
| Accumulated net unrealized appreciation (depreciation) on investments, | | |
| foreign currency transactions and securities sold short | | | |
| [including ($56,156) net unrealized (depreciation) on financial futures] | 2,606,941 | |
| Net Assets ($) | | 73,356,839 | |
| | | |
| Net Asset Value Per Share | | | |
| | Class A | Class C | Class I |
| Net Assets ($) | 49,440,501 | 8,237,079 | 15,679,259 |
| Shares Outstanding | 3,627,150 | 607,687 | 1,148,816 |
| Net Asset Value Per Share ($) | 13.63 | 13.55 | 13.65 |
See notes to financial statements.
The Fund 29
STATEMENT OF OPERATIONS
Year Ended October 31, 2011
| | |
| Investment Income ($): | | |
| Income: | | |
| Interest | 1,844,891 | |
| Dividends; | | |
| Affiliated issuers | 7,703 | |
| Total Income | 1,852,594 | |
| Expenses: | | |
| Management fee—Note 3(a) | 279,430 | |
| Shareholder servicing costs—Note 3(c) | 180,161 | |
| Distribution fees—Note 3(b) | 61,930 | |
| Auditing fees | 45,756 | |
| Registration fees | 28,234 | |
| Prospectus and shareholders’ reports | 25,994 | |
| Custodian fees—Note 3(c) | 15,129 | |
| Directors’ fees and expenses—Note 3(d) | 3,518 | |
| Legal fees | 2,280 | |
| Loan commitment fees—Note 2 | 1,117 | |
| Miscellaneous | 67,292 | |
| Total Expenses | 710,841 | |
| Less—reduction in management fee due to undertaking—Note 3(a) | (175,758 | ) |
| Less—reduction in fees due to earnings credits—Note 3(c) | (36 | ) |
| Net Expenses | 535,047 | |
| Investment Income—Net | 1,317,547 | |
| Realized and Unrealized Gain (Loss) on Investments—Note 4 ($): | | |
| Net realized gain (loss) on investments and foreign currency transactions: | | |
| Long transactions | 1,084,741 | |
| Short sale transactions | (33,042 | ) |
| Net realized gain (loss) on financial futures | (40,123 | ) |
| Net realized gain (loss) on forward foreign currency exchange contracts | 255,794 | |
| Net Realized Gain (Loss) | 1,267,370 | |
| Net unrealized appreciation (depreciation) on | | |
| investments and foreign currency transactions | (164,605 | ) |
| Net unrealized appreciation (depreciation) on financial futures | (101,179 | ) |
| Net unrealized appreciation (depreciation) on | | |
| forward foreign currency exchange contracts | (197,191 | ) |
| Net unrealized appreciation (depreciation) on securities sold short | 576 | |
| Net Unrealized Appreciation (Depreciation) | (462,399 | ) |
| Net Realized and Unrealized Gain (Loss) on Investments | 804,971 | |
| Net Increase in Net Assets Resulting from Operations | 2,122,518 | |
| |
| See notes to financial statements. | | |
30
STATEMENT OF CHANGES IN NET ASSETS
| | | | |
| | Year Ended October 31, | |
| | 2011 | | 2010 | |
| Operations ($): | | | | |
| Investment income—net | 1,317,547 | | 1,522,241 | |
| Net realized gain (loss) on investments | 1,267,370 | | 2,240,935 | |
| Net unrealized appreciation | | | | |
| (depreciation) on investments | (462,399 | ) | 1,402,785 | |
| Net Increase (Decrease) in Net Assets | | | | |
| Resulting from Operations | 2,122,518 | | 5,165,961 | |
| Dividends to Shareholders from ($): | | | | |
| Investment income—net: | | | | |
| Class A Shares | (1,372,828 | ) | (1,363,911 | ) |
| Class C Shares | (213,881 | ) | (227,909 | ) |
| Class I Shares | (301,960 | ) | (162,710 | ) |
| Net realized gain on investments: | | | | |
| Class A Shares | (1,833,450 | ) | (695,283 | ) |
| Class C Shares | (371,291 | ) | (153,314 | ) |
| Class I Shares | (306,422 | ) | (90,128 | ) |
| Total Dividends | (4,399,832 | ) | (2,693,255 | ) |
| Capital Stock Transactions ($): | | | | |
| Net proceeds from shares sold: | | | | |
| Class A Shares | 30,113,633 | | 30,872,674 | |
| Class C Shares | 2,395,055 | | 9,355,826 | |
| Class I Shares | 10,734,150 | | 9,055,449 | |
| Dividends reinvested: | | | | |
| Class A Shares | 3,049,428 | | 1,975,470 | |
| Class C Shares | 434,980 | | 279,604 | |
| Class I Shares | 487,169 | | 147,179 | |
| Cost of shares redeemed: | | | | |
| Class A Shares | (30,216,195 | ) | (31,435,932 | ) |
| Class C Shares | (5,108,021 | ) | (6,383,709 | ) |
| Class I Shares | (2,844,896 | ) | (3,952,794 | ) |
| Increase (Decrease) in Net Assets | | | | |
| from Capital Stock Transactions | 9,045,303 | | 9,913,767 | |
| Total Increase (Decrease) in Net Assets | 6,767,989 | | 12,386,473 | |
| Net Assets ($): | | | | |
| Beginning of Period | 66,588,850 | | 54,202,377 | |
| End of Period | 73,356,839 | | 66,588,850 | |
| Undistributed investment income—net | 559,926 | | 623,329 | |
The Fund 31
STATEMENT OF CHANGES IN NET ASSETS (continued)
| | | | |
| | Year Ended October 31, | |
| | 2011 | | 2010 | |
| Capital Share Transactions: | | | | |
| Class A | | | | |
| Shares sold | 2,222,398 | | 2,265,276 | |
| Shares issued for dividends reinvested | 231,618 | | 148,626 | |
| Shares redeemed | (2,250,474 | ) | (2,304,265 | ) |
| Net Increase (Decrease) in Shares Outstanding | 203,542 | | 109,637 | |
| Class C | | | | |
| Shares sold | 178,227 | | 694,307 | |
| Shares issued for dividends reinvested | 33,218 | | 21,152 | |
| Shares redeemed | (382,380 | ) | (472,901 | ) |
| Net Increase (Decrease) in Shares Outstanding | (170,935 | ) | 242,558 | |
| Class I | | | | |
| Shares sold | 796,161 | | 667,352 | |
| Shares issued for dividends reinvested | 36,928 | | 11,026 | |
| Shares redeemed | (211,487 | ) | (290,861 | ) |
| Net Increase (Decrease) in Shares Outstanding | 621,602 | | 387,517 | |
| |
| See notes to financial statements. | | | | |
32
FINANCIAL HIGHLIGHTS
The following tables describe the performance for each share class for the fiscal periods indicated.All information (except portfolio turnover rate) reflects financial results for a single fund share.Total return shows how much your investment in the fund would have increased (or decreased) during each period, assuming you had reinvested all dividends and distributions.These figures have been derived from the fund’s financial statements.
| | | | | | | | | | |
| | | | Year Ended October 31, | | | |
| Class A Shares | 2011 | | 2010 | | 2009 | | 2008 | | 2007 | |
| Per Share Data ($): | | | | | | | | | | |
| Net asset value, beginning of period | 14.09 | | 13.59 | | 12.12 | | 12.62 | | 12.79 | |
| Investment Operations: | | | | | | | | | | |
| Investment income—neta | .29 | | .35 | | .37 | | .52 | | .56 | |
| Net realized and unrealized | | | | | | | | | | |
| gain (loss) on investments | .23 | | .78 | | 1.44 | | (.48 | ) | (.11 | ) |
| Total from Investment Operations | .52 | | 1.13 | | 1.81 | | .04 | | .45 | |
| Distributions: | | | | | | | | | | |
| Dividends from | | | | | | | | | | |
| investment income—net | (.43 | ) | (.41 | ) | (.34 | ) | (.54 | ) | (.53 | ) |
| Dividends from net realized | | | | | | | | | | |
| gain on investments | (.55 | ) | (.22 | ) | — | | — | | (.09 | ) |
| Total Distributions | (.98 | ) | (.63 | ) | (.34 | ) | (.54 | ) | (.62 | ) |
| Net asset value, end of period | 13.63 | | 14.09 | | 13.59 | | 12.12 | | 12.62 | |
| Total Return (%)b | 4.06 | | 8.74 | | 15.15 | | .21 | | 3.57 | |
| Ratios/Supplemental Data (%): | | | | | | | | | | |
| Ratio of total expenses | | | | | | | | | | |
| to average net assets | 1.09 | | 1.14 | | 1.40 | | 1.90 | | 2.01 | |
| Ratio of net expenses | | | | | | | | | | |
| to average net assets | .80 | | .87 | | .90 | | .90 | | .89 | |
| Ratio of net investment income | | | | | | | | | | |
| to average net assets | 2.18 | | 2.58 | | 2.87 | | 4.16 | | 4.45 | |
| Portfolio Turnover Ratec | 351.58 | | 350.15 | | 377.79 | | 120.92 | | 75.04 | |
| Net Assets, end of period ($ x 1,000) | 49,441 | | 48,236 | | 45,046 | | 14,026 | | 10,512 | |
|
| a Based on average shares outstanding at each month end. |
| b Exclusive of sales charge. |
| c The portfolio turnover rates excluding mortgage dollar roll transactions for the periods ended October 31, 2011, |
| 2010, 2009, 2008 and 2007, were 111.10%, 182.13%, 211.99%, 87.59% and 51.54%, respectively. |
See notes to financial statements.
The Fund 33
FINANCIAL HIGHLIGHTS (continued)
| | | | | | | | | | |
| | | | Year Ended October 31, | | | |
| Class C Shares | 2011 | | 2010 | | 2009 | | 2008 | | 2007 | |
| Per Share Data ($): | | | | | | | | | | |
| Net asset value, beginning of period | 14.02 | | 13.53 | | 12.08 | | 12.58 | | 12.77 | |
| Investment Operations: | | | | | | | | | | |
| Investment income—neta | .19 | | .25 | | .27 | | .41 | | .47 | |
| Net realized and unrealized | | | | | | | | | | |
| gain (loss) on investments | .22 | | .78 | | 1.44 | | (.47 | ) | (.13 | ) |
| Total from Investment Operations | .41 | | 1.03 | | 1.71 | | (.06 | ) | .34 | |
| Distributions: | | | | | | | | | | |
| Dividends from investment income—net | (.33 | ) | (.32 | ) | (.26 | ) | (.44 | ) | (.44 | ) |
| Dividends from net realized | | | | | | | | | | |
| gain on investments | (.55 | ) | (.22 | ) | — | | — | | (.09 | ) |
| Total Distributions | (.88 | ) | (.54 | ) | (.26 | ) | (.44 | ) | (.53 | ) |
| Net asset value, end of period | 13.55 | | 14.02 | | 13.53 | | 12.08 | | 12.58 | |
| Total Return (%)b | 3.25 | | 7.96 | | 14.32 | | (.55 | ) | 2.73 | |
| Ratios/Supplemental Data (%): | | | | | | | | | | |
| Ratio of total expenses | | | | | | | | | | |
| to average net assets | 1.85 | | 1.93 | | 2.20 | | 2.75 | | 2.79 | |
| Ratio of net expenses | | | | | | | | | | |
| to average net assets | 1.55 | | 1.62 | | 1.65 | | 1.65 | | 1.64 | |
| Ratio of net investment income | | | | | | | | | | |
| to average net assets | 1.44 | | 1.81 | | 2.11 | | 3.40 | | 3.71 | |
| Portfolio Turnover Ratec | 351.58 | | 350.15 | | 377.79 | | 120.92 | | 75.04 | |
| Net Assets, end of period ($ x 1,000) | 8,237 | | 10,916 | | 7,256 | | 2,726 | | 1,044 | |
|
| a Based on average shares outstanding at each month end. |
| b Exclusive of sales charge. |
| c The portfolio turnover rates excluding mortgage dollar roll transactions for the periods ended October 31, 2011, |
| 2010, 2009, 2008 and 2007, were 111.10%, 182.13%, 211.99%, 87.59% and 51.54%, respectively. |
See notes to financial statements.
34
| | | | | | | | | | |
| | | | Year Ended October 31, | | | |
| Class I Shares | 2011 | | 2010 | | 2009 | | 2008 | | 2007 | a |
| Per Share Data ($): | | | | | | | | | | |
| Net asset value, beginning of period | 14.11 | | 13.61 | | 12.13 | | 12.62 | | 12.80 | |
| Investment Operations: | | | | | | | | | | |
| Investment income—netb | .32 | | .40 | | .40 | | .56 | | .59 | |
| Net realized and unrealized | | | | | | | | | | |
| gain (loss) on investments | .23 | | .77 | | 1.44 | | (.48 | ) | (.12 | ) |
| Total from Investment Operations | .55 | | 1.17 | | 1.84 | | .08 | | .47 | |
| Distributions: | | | | | | | | | | |
| Dividends from investment income—net | (.46 | ) | (.45 | ) | (.36 | ) | (.57 | ) | (.56 | ) |
| Dividends from net realized | | | | | | | | | | |
| gain on investments | (.55 | ) | (.22 | ) | — | | — | | (.09 | ) |
| Total Distributions | (1.01 | ) | (.67 | ) | (.36 | ) | (.57 | ) | (.65 | ) |
| Net asset value, end of period | 13.65 | | 14.11 | | 13.61 | | 12.13 | | 12.62 | |
| Total Return (%) | 4.38 | | 9.00 | | 15.38 | | .54 | | 3.75 | |
| Ratios/Supplemental Data (%): | | | | | | | | | | |
| Ratio of total expenses | | | | | | | | | | |
| to average net assets | .80 | | .86 | | 1.13 | | 1.64 | | 1.78 | |
| Ratio of net expenses | | | | | | | | | | |
| to average net assets | .55 | | .62 | | .65 | | .65 | | .64 | |
| Ratio of net investment income | | | | | | | | | | |
| to average net assets | 2.41 | | 2.85 | | 3.12 | | 4.41 | | 4.70 | |
| Portfolio Turnover Ratec | 351.58 | | 350.15 | | 377.79 | | 120.92 | | 75.04 | |
| Net Assets, end of period ($ x 1,000) | 15,679 | | 7,437 | | 1,901 | | 602 | | 599 | |
|
| a Effective June 1, 2007, Class R shares were redesignated as Class I shares. |
| b Based on average shares outstanding at each month end. |
| c The portfolio turnover rates excluding mortgage dollar roll transactions for the periods ended October 31, 2011, |
| 2010, 2009, 2008 and 2007, were 111.10%, 182.13%, 211.99%, 87.59% and 51.54%, respectively. |
See notes to financial statements.
The Fund 35
NOTES TO FINANCIAL STATEMENTS
NOTE 1—Significant Accounting Policies:
Dreyfus Total Return Advantage Fund (the “fund”) is a separate non-diversified series of Advantage Funds, Inc. (the “Company”), which is registered under the Investment Company Act of 1940, as amended (the “Act”), as an open-end management investment company and operates as a series company currently offering twelve series, including the fund. The fund’s investment objective is to seek maximize total return through capital appreciation and income.The Dreyfus Corporation (the “Manager” or “Dreyfus”), a wholly-owned subsidiary of The Bank of New York Mellon Corporation (“BNY Mellon”), serves as the fund’s investment adviser.
MBSC Securities Corporation (the “Distributor”), a wholly-owned subsidiary of the Manager, is the distributor of the fund’s shares.The fund is authorized to issue 100 million shares of $.001 par value Common Stock in each of the following classes of shares: Class A, Class C and Class I. Class A shares are subject to a sales charge imposed at the time of purchase. Class C shares are subject to a contingent deferred sales charge (“CDSC”) imposed on Class C shares redeemed within one year of purchase. Class I shares are sold at net asset value per share only to institutional investors. Other differences between the classes include the services offered to and the expenses borne by each class, the allocation of certain transfer agency costs and certain voting rights. Income, expenses (other than expenses attributable to a specific class), and realized and unrealized gains or losses on investments are allocated to each class of shares based on its relative net assets.
The Company accounts separately for the assets, liabilities and operations of each series. Expenses directly attributable to each series are charged to that series’ operations; expenses which are applicable to all series are allocated among them on a pro rata basis.
36
The Financial Accounting Standards Board (“FASB”) Accounting Standards Codification (“ASC”) is the exclusive reference of authoritative U.S. generally accepted accounting principles (“GAAP”) recognized by the FASB to be applied by nongovernmental entities. Rules and interpretive releases of the Securities and Exchange Commission (“SEC”) under authority of federal laws are also sources of authoritative GAAP for SEC registrants. The fund’s financial statements are prepared in accordance with GAAP, which may require the use of management estimates and assumptions.Actual results could differ from those estimates.
The Company enters into contracts that contain a variety of indemnifications.The fund’s maximum exposure under these arrangements is unknown.The fund does not anticipate recognizing any loss related to these arrangements.
(a) Portfolio valuation: The fair value of a financial instrument is the amount that would be received to sell an asset or paid to transfer a liability in an orderly transaction between market participants at the measurement date (i.e. the exit price). GAAP establishes a fair value hierarchy that prioritizes the inputs of valuation techniques used to measure fair value.This hierarchy gives the highest priority to unadjusted quoted prices in active markets for identical assets or liabilities (Level 1 measurements) and the lowest priority to unobservable inputs (Level 3 measurements).
Additionally, GAAP provides guidance on determining whether the volume and activity in a market has decreased significantly and whether such a decrease in activity results in transactions that are not orderly. GAAP requires enhanced disclosures around valuation inputs and techniques used during annual and interim periods.
The Fund 37
NOTES TO FINANCIAL STATEMENTS (continued)
Various inputs are used in determining the value of the fund’s investments relating to fair value measurements.These inputs are summarized in the three broad levels listed below:
Level 1—unadjusted quoted prices in active markets for identical investments.
Level 2—other significant observable inputs (including quoted prices for similar investments, interest rates, prepayment speeds, credit risk, etc.).
Level 3—significant unobservable inputs (including the fund’s own assumptions in determining the fair value of investments).
The inputs or methodology used for valuing securities are not necessarily an indication of the risk associated with investing in those securities.
Changes in valuation techniques may result in transfers in or out of an assigned level within the disclosure hierarchy. Valuation techniques used to value the fund’s investments are as follows:
Registered investment companies that are not traded on an exchange are valued at their net asset value and are categorized within Level 1 of the fair value hierarchy.
Investments in securities excluding short-term investments (other than U.S. Treasury Bills), financial futures and forward foreign currency exchange contracts (“forward contracts”) are valued each business day by an independent pricing service (the “Service”) approved by the Board of Directors. Investments for which quoted bid prices are readily available and are representative of the bid side of the market in the judgment of the Service are valued at the mean between the quoted bid prices (as obtained by the Service from dealers in such securities) and asked prices (as calculated by the Service based upon its evaluation of the market for such securities). Other investments (which constitute a majority of the portfolio securities) are valued as determined by the Service, based on methods which include consideration of: yields or prices of securities of comparable quality, coupon, maturity and type; indications as to values
38
from dealers; and general market conditions.These securities are generally categorized within Level 2 of the fair value hierarchy.
U.S. Treasury Bills are valued at the mean price between quoted bid prices and asked prices by an independent pricing service approved by the Board of Directors. These securities are generally categorized within Level 2 of the fair value hierarchy.
When market quotations or official closing prices are not readily available, or are determined not to reflect accurately fair value, such as when the value of a security has been significantly affected by events after the close of the exchange or market on which the security is principally traded (for example, a foreign exchange or market), but before the fund calculates its net asset value, the fund may value these investments at fair value as determined in accordance with the procedures approved by the Board of Directors. Certain factors may be considered when fair valuing investments such as: fundamental analytical data, the nature and duration of restrictions on disposition, an evaluation of the forces that influence the market in which the securities are purchased and sold, and public trading in similar securities of the issuer or comparable issuers. These securities are either categorized as Level 2 or 3 depending on the relevant inputs used.
For restricted securities where observable inputs are limited, assumptions about market activity and risk are used and are categorized within Level 3 of the fair value hierarchy.
Financial futures, which are traded on an exchange, are valued at the last sales price on the securities exchange on which such securities are primarily traded or at the last sales price on the national securities market on each business day.These securities are generally categorized within Level 1 of the fair value hierarchy. Investments denominated in foreign currencies are translated to U.S. dollars at the prevailing rates of exchange. Forward contracts are valued at the forward rate.These securities are generally categorized within Level 2 of the fair value hierarchy.
The Fund 39
NOTES TO FINANCIAL STATEMENTS (continued)
The following is a summary of the inputs used as of October 31, 2011 in valuing the fund’s investments:
| | | | | | | |
| | | | Level 2—Other | | Level 3— | | |
| | Level 1— | | Significant | | Significant | | |
| | Unadjusted | | Observable | | Unobservable | | |
| | Quoted Prices | | Inputs | | Inputs | Total | |
| Assets ($) | | | | | | | |
| Investments in Securities: | | | | | | |
| Asset-Backed | — | | 708,715 | | — | 708,715 | |
| Commercial | | | | | | | |
| Mortgage-Backed | — | | 2,401,900 | | — | 2,401,900 | |
| Corporate Bonds† | — | | 16,487,659 | | — | 16,487,659 | |
| Foreign Government | — | | 2,510,984 | | — | 2,510,984 | |
| Municipal Bonds | — | | 105,435 | | — | 105,435 | |
| Mutual Funds | 20,068,547 | | — | | — | 20,068,547 | |
| U.S. Government | | | | | | | |
| Agencies/ | | | | | | | |
| Mortgage-Backed | — | | 37,225,091 | | — | 37,225,091 | |
| U.S. Treasury | — | | 11,008,282 | | — | 11,008,282 | |
| Other Financial | | | | | | | |
| Instruments: | | | | | | | |
| Forward Foreign | | | | | | | |
| Currency Exchange | | | | | | | |
| Contracts†† | — | | 988,345 | | — | 988,345 | |
| Futures†† | 176,785 | | — | | — | 176,785 | |
| Liabilities ($) | | | | | | | |
| Other Financial | | | | | | | |
| Instruments: | | | | | | | |
| Forward Foreign | | | | | | | |
| Currency Exchange | | | | | | | |
| Contracts†† | — | | (1,081,103 | ) | — | (1,081,103 | ) |
| Futures†† | (232,941 | ) | — | | — | (232,941 | ) |
| Securities Sold Short:††† | | | | | | |
| U.S. Government | | | | | | | |
| Agencies/ | | | | | | | |
| Mortgage-Backed | — | | (1,584,550 | ) | — | (1,584,550 | ) |
| |
| † | See Statement of Investments for additional detailed categorizations. |
| †† | Amount shown represents unrealized appreciation (depreciation) at period end. |
| ††† See Statement of Securities Sold Short for additional detailed categorizations |
In May 2011, FASB issued Accounting Standards Update (“ASU”) No. 2011-04 “Amendments to Achieve Common FairValue Measurement and Disclosure Requirements in GAAP and International Financial
40
Reporting Standards (“IFRS”)” (“ASU 2011-04”). ASU 2011-04 includes common requirements for measurement of and disclosure about fair value between GAAP and IFRS. ASU 2011-04 will require reporting entities to disclose the following information for fair value measurements categorized within Level 3 of the fair value hierarchy: quantitative information about the unobservable inputs used in the fair value measurement, the valuation processes used by the reporting entity and a narrative description of the sensitivity of the fair value measurement to changes in unobservable inputs and the interrelationships between those unobservable inputs. In addition, ASU 2011-04 will require reporting entities to make disclosures about amounts and reasons for all transfers in and out of Level 1 and Level 2 fair value measurements. The new and revised disclosures are effective for interim and annual reporting periods beginning after December 15, 2011. At this time, management is evaluating the implications of ASU 2011-04 and its impact on the financial statements.
(b) Foreign currency transactions: The fund does not isolate that portion of the results of operations resulting from changes in foreign exchange rates on investments from the fluctuations arising from changes in the market prices of securities held. Such fluctuations are included with the net realized and unrealized gain or loss on investments.
Net realized foreign exchange gains or losses arise from sales of foreign currencies, currency gains or losses realized on securities transactions between trade and settlement date and the difference between the amounts of dividends, interest and foreign withholding taxes recorded on the fund’s books and the U.S. dollar equivalent of the amounts actually received or paid. Net unrealized foreign exchange gains or losses arise from changes in the value of assets and liabilities other than investments resulting from changes in exchange rates. Foreign currency gains and losses on investments are included with net realized and unrealized gain or loss on investments.
(c) Securities transactions and investment income: Securities transactions are recorded on a trade date basis. Realized gains and losses
The Fund 41
NOTES TO FINANCIAL STATEMENTS (continued)
from securities transactions are recorded on the identified cost basis. Dividend income is recognized on the ex-dividend date and interest income, including, where applicable, accretion of discount and amortization of premium on investments, is recognized on the accrual basis.
(d) Affiliated issuers: Investments in other investment companies advised by Dreyfus are defined as “affiliated” in the Act.
The fund may invest in shares of certain affiliated investment companies also advised or managed by Dreyfus. Investments in affiliated investment companies for the period ended October 31, 2011 were as follows:
| | | | | | | |
| Affiliated | | | | | | | |
| Investment | Value | | | | Value | | Net |
| Company | 10/31/2010 | ($) | Purchases ($) | Sales ($) | 10/31/2011 | ($) | Assets (%) |
| Dreyfus | | | | | | | |
| Institutional | | | | | | | |
| Preferred | | | | | | | |
| Plus Money | | | | | | | |
| Market Fund | 4,821,000 | | 47,260,447 | 32,012,900 | 20,068,547 | | 27.4 |
(e) Dividends to shareholders: Dividends are recorded on the ex-dividend date. Dividends from investment income-net are declared and paid quarterly. Dividends from net realized capital gains, if any, are normally declared and paid annually, but the fund may make distributions on a more frequent basis to comply with the distribution requirements of the Internal Revenue Code of 1986, as amended (the “Code”).To the extent that net realized capital gains can be offset by capital loss carryovers, it is the policy of the fund not to distribute such gains. Income and capital gain distributions are determined in accordance with income tax regulations, which may differ from GAAP.
On October 31, 2011 the Board of Directors declared a cash dividend of $.080, $.056 and $.088 per share, from undistributed investment income-net for Class A, Class C and Class I shares, respectively, payable on November 1, 2011 (ex-dividend date), to shareholders of record as of the close of business on October 31, 2011.
(f) Federal income taxes: It is the policy of the fund to continue to qualify as a regulated investment company, if such qualification is in the best interests of its shareholders, by complying with the applicable pro-
42
visions of the Code, and to make distributions of taxable income sufficient to relieve it from substantially all federal income and excise taxes.
As of and during the period ended October 31, 2011, the fund did not have any liabilities for any uncertain tax positions.The fund recognizes interest and penalties, if any, related to uncertain tax positions as income tax expense in the Statement of Operations. During the period, the fund did not incur any interest or penalties.
Each of the tax years in the four-year period ended October 31, 2011 remains subject to examination by the Internal Revenue Service and state taxing authorities.
At October 31, 2011, the components of accumulated earnings on a tax basis were as follows: undistributed ordinary income $559,926, undistributed capital gains $347,867 and unrealized appreciation $2,089,481.
The tax character of distributions paid to shareholders during the fiscal periods ended October 31, 2011 and October 31, 2010 were as follows: ordinary income $3,164,257 and $2,137,160 and long-term capital gains $1,235,575 and $556,095, respectively.
During the period ended October 31, 2011, as a result of permanent book to tax differences, primarily due to the tax treatment for amortization of premiums, paydown gains and losses on mortgage-backed securities and foreign currency gains and losses, the fund increased accumulated undistributed investment income-net by $507,719, decreased accumulated net realized gain (loss) on investments by $507,714 and decreased paid-in capital by $5. Net assets and net asset value per share were not affected by this reclassification.
(g) New Accounting Pronouncement: In April 2011, FASB issued ASU No. 2011-03 “Transfers and Servicing (Topic 860) Reconsideration of Effective Control for Repurchase Agreements (“ASU 2011-03”) which relates to the accounting for repurchase agreements and similar agreements including mortgage dollar rolls, that both entitle and obligate a transferor to repurchase or redeem financial assets before their matu-rity.ASU 2011-03 modifies the criteria for determining effective control
The Fund 43
NOTES TO FINANCIAL STATEMENTS (continued)
of transferred assets and as a result certain agreements may now be accounted for as secured borrowings.ASU 2011-03 is effective prospectively for new transfers and existing transactions that are modified in the first interim or annual period beginning on or after December 15, 2011. Management is currently evaluating the implications of this change and its impact on the financial statements.
NOTE 2—Bank Lines of Credit:
The fund participates with other Dreyfus-managed funds in a $225 million unsecured credit facility led by Citibank, N.A. and a $300 million unsecured credit facility provided by The Bank of New York Mellon, a subsidiary of BNY Mellon and an affiliate of Dreyfus (each, a “Facility”), each to be utilized primarily for temporary or emergency purposes, including the financing of redemptions. In connection therewith, the fund has agreed to pay its pro rata portion of commitment fees for each Facility. Interest is charged to the fund based on rates determined pursuant to the terms of the respective Facility at the time of borrowing. During the period ended October 31, 2011, the fund did not borrow under the Facilities.
NOTE 3—Management Fee and Other Transactions With Affiliates:
(a) Pursuant to a management agreement (“Agreement”) with the Manager, the management fee is computed at the annual rate of .45% of the value of the fund’s average daily net assets and is payable monthly. The Manager has undertaken from November 1, 2010 through March 1, 2013, that, if the fund’s aggregate expenses (exclusive of taxes, brokerage fees, Rule 12b-1 distribution plan fees, interest expense, commitment fees on borrowings, shareholder services plan fees and extraordinary expenses) exceed an annual rate of .55% of the value of the fund’s average daily net assets, the fund may deduct from the payment to be made to the Manager under the Agreement, or the Manager will bear such excess expense.The reduction in management fee, pursuant to the undertaking, amounted to $175,758 during the period ended October 31, 2011.
44
During the period ended October 31, 2011, the Distributor retained $2,764 from commissions earned on sales of the fund’s Class A shares and $5,768 from CDSCs on redemptions of the fund’s Class C shares.
(b) Under the Distribution Plan (the “Plan”) adopted pursuant to Rule 12b-1 under the Act, Class C shares pay the Distributor for distributing its shares at an annual rate of .75% of the value of the average daily net assets of Class C shares. During the period ended October 31, 2011, Class C shares were charged $61,930 pursuant to the Plan.
(c) Under the Shareholder Services Plan, Class A and Class C shares pay the Distributor at an annual rate of .25% of the value of their average daily net assets for the provision of certain services.The services provided may include personal services relating to shareholder accounts, such as answering shareholder inquiries regarding the fund and providing reports and other information, and services related to the maintenance of shareholder accounts.The Distributor may make payments to Service Agents (a securities dealer, financial institution or other industry professional) in respect of these services. The Distributor determines the amounts to be paid to Service Agents. During the period ended October 31, 2011, Class A and Class C shares were charged $109,832 and $20,643, respectively, pursuant to the Shareholder Services Plan.
The fund compensates Dreyfus Transfer, Inc., a wholly-owned subsidiary of the Manager, under a transfer agency agreement for providing personnel and facilities to perform transfer agency services for the fund. During the period ended October 31, 2011, the fund was charged $9,258 pursuant to the transfer agency agreement, which is included in Shareholder servicing costs in the Statement of Operations.
The fund has arrangements with the custodian and cash management bank whereby the fund may receive earnings credits when positive cash balances are maintained, which are used to offset custody and cash management fees. For financial reporting purposes, the fund includes net earnings credits as an expense offset in the Statement of Operations.
The fund compensates The Bank of New York Mellon under cash management agreements for performing cash management services
The Fund 45
NOTES TO FINANCIAL STATEMENTS (continued)
related to fund subscriptions and redemptions. During the period ended October 31, 2011, the fund was charged $872 pursuant to the cash management agreements, which is included in Shareholder servicing costs in the Statement of Operations.These fees were partially offset by earnings credits of $36.
The fund also compensates The Bank of New York Mellon under a custody agreement for providing custodial services for the fund. During the period ended October 31, 2011, the fund was charged $15,129 pursuant to the custody agreement.
During the period ended October 31, 2011, the fund was charged $6,751 for services performed by the Chief Compliance Officer.
The components of “Due to The Dreyfus Corporation and affiliates” in the Statement of Assets and Liabilities consist of: management fees $28,537, Rule 12b-1 distribution plan fees $5,194, shareholder services plan fees $12,714, custodian fees $5,715, chief compliance officer fees $4,246 and transfer agency per account fees $1,863, which are offset against an expense reimbursement currently in effect in the amount of $17,003.
(d) Each Board member also serves as a Board member of other funds within the Dreyfus complex. Annual retainer fees and attendance fees are allocated to each fund based on net assets.
NOTE 4—Securities Transactions:
The following summarizes the aggregate amount of purchases and sales (including paydowns) of investment securities and securities sold short, excluding short-term securities, financial futures and forward contracts, during the period ended October 31, 2011, of which $162,854,402 in purchases and $163,230,445 in sales were from mortgage dollar roll transactions:
| | |
| | Purchases ($) | Sales ($) |
| Long transactions | 238,093,010 | 242,132,564 |
| Short sale transactions | 67,482,973 | 64,788,525 |
| Total | 305,575,983 | 306,921,089 |
46
Short Sales: The fund is engaged in short-selling which obligates the fund to replace the security borrowed by purchasing the security at current market value.The fund incurs a loss if the price of the security increases between the date of the short sale and the date on which the fund replaces the borrowed security.The fund realizes a gain if the price of the security declines between those dates. Until the fund replaces the borrowed security, the fund will maintain daily a segregated account with a broker or custodian of permissible liquid assets sufficient to cover its short positions. Securities Sold Short at October 31, 2011 and their related market values and proceeds, are set forth in the Statement of Securities Sold Short.
Mortgage Dollar Rolls: A mortgage dollar roll transaction involves a sale by the fund of mortgage related securities that it holds with an agreement by the fund to repurchase similar securities at an agreed upon price and date.The securities purchased will bear the same interest rate as those sold, but generally will be collateralized by pools of mortgages with different prepayment histories than those securities sold.
The following tables show the fund’s exposure to different types of market risk as it relates to the statement of Assets and Liabilities and the Statement of Operations, respectively.
Fair value of derivative instruments as of October 31, 2011 is shown below:
| | | | |
| | Derivative | | Derivative | |
| | Assets ($) | | Liabilities ($) | |
| Interest rate risk1 | 176,785 | Interest rate risk1 | (232,941 | ) |
| Foreign exchange risk2 | 988,345 | Foreign exchange risk3 | (1,081,103 | ) |
| Gross fair value of | | | | |
| derivatives contracts | 1,165,130 | | (1,314,044 | ) |
Statement of Assets and Liabilities location:
| |
| 1 | Includes cumulative appreciation (depreciation) on futures contracts as reported in the Statement of |
| | Financial Futures, but only the unpaid variation margin is reported in the Statement of Assets |
| | and Liabilities. |
| 2 | Unrealized appreciation on forward foreign currency exchange contracts. |
| 3 | Unrealized depreciation on forward foreign currency exchange contracts. |
The Fund 47
NOTES TO FINANCIAL STATEMENTS (continued)
The effect of derivative instruments in the Statement of Operations during the period ended October 31, 2011 is shown below:
| | | | | |
| | Amount of realized gain or (loss) on derivatives recognized in income ($) | |
| | | | Forward | | |
| Underlying risk | Futures4 | | Contracts5 | Total | |
| Interest rate | (40,123 | ) | — | (40,123 | ) |
| Foreign exchange | — | | 255,794 | 255,794 | |
| Total | (40,123 | ) | 255,794 | 215,671 | |
| | | | | | |
| Change in unrealized appreciation or (depreciation) on derivatives recognized in income ($) | |
| | | | Forward | | | |
| Underlying risk | Futures6 | | Contracts7 | | Total | |
| Interest rate | (101,179 | ) | — | | (101,179 | ) |
| Foreign exchange | — | | (197,191 | ) | (197,191 | ) |
| Total | (101,179 | ) | (197,191 | ) | (298,370 | ) |
| |
| Statement of Operations location: |
| 4 | Net realized gain (loss) on financial futures. |
| 5 | Net realized gain (loss) on forward foreign currency exchange contracts. |
| 6 | Net unrealized appreciation (depreciation) on financial futures. |
| 7 | Net unrealized appreciation (depreciation) on forward foreign currency exchange contracts. |
Futures Contracts: In the normal course of pursuing its investment objective, the fund is exposed to market risk, including interest rate risk, as a result of changes in value of underlying financial instruments.The fund invests in financial futures contracts in order to manage its exposure to or protect against changes in the market.A futures contract represents a commitment for the future purchase or a sale of an asset at a specified date. Upon entering into such contracts, these investments require initial margin deposits with a broker, which consist of cash or cash equivalents. The amount of these deposits is determined by the exchange or Board of Trade on which the contract is traded and is subject to change. Accordingly, variation margin payments are received or made to reflect daily unrealized gains or losses which are recorded in the Statement of Operations. Futures contracts are valued daily at the last sales price established by the Board of Trade or exchange upon which they are traded. When the contracts are closed, the fund recognizes a realized gain or loss.There is minimal counterparty credit risk to the fund with futures since futures are exchange traded, and the exchange’s clearinghouse guarantees the futures against default. Contracts open at October 31, 2011 are set forth in the Statement of Financial Futures.
48
Forward Foreign Currency Exchange Contracts: The fund enters into forward contracts in order to hedge its exposure to changes in foreign currency exchange rates on its foreign portfolio holdings, to settle foreign currency transactions or as a part of its investment strategy. When executing forward contracts, the fund is obligated to buy or sell a foreign currency at a specified rate on a certain date in the future. With respect to sales of forward contracts, the fund incurs a loss if the value of the contract increases between the date the forward contract is opened and the date the forward contract is closed.The fund realizes a gain if the value of the contract decreases between those dates.With respect to purchases of forward contracts, the fund incurs a loss if the value of the contract decreases between the date the forward contract is opened and the date the forward contract is closed.The fund realizes a gain if the value of the contract increases between those dates. Any realized gain or loss which occurred during the period is reflected in the Statement of Operations.The fund is exposed to foreign currency risk as a result of changes in value of underlying financial instruments. The fund is also exposed to credit risk associated with counterparty nonperformance on these forward contracts, which is typically limited to the unrealized gain on each open contract.The following summarizes open forward contracts at October 31, 2011:
| | | | |
| | Foreign | | | Unrealized |
| Forward Foreign Currency | Currency | | | Appreciation |
| Exchange Contracts | Amounts | Cost ($) | Value ($) (Depreciation) ($) |
| Purchases: | | | | |
| Australian Dollar, | | | | |
| Expiring 12/21/2011 | 74,500 | 75,917 | 78,022 | 2,105 |
| Australian Dollar, | | | | |
| Expiring 12/21/2011 | 298,000 | 303,667 | 312,085 | 8,418 |
| Australian Dollar, | | | | |
| Expiring 12/21/2011 | 372,500 | 378,237 | 390,106 | 11,869 |
| Australian Dollar, | | | | |
| Expiring 12/21/2011 | 76,000 | 76,684 | 79,592 | 2,908 |
| Australian Dollar, | | | | |
| Expiring 12/21/2011 | 942 | 916 | 986 | 70 |
| Australian Dollar, | | | | |
| Expiring 12/21/2011 | 112,098 | 108,322 | 117,396 | 9,074 |
| Australian Dollar, | | | | |
| Expiring 12/21/2011 | 357,960 | 346,108 | 374,879 | 28,771 |
The Fund 49
NOTES TO FINANCIAL STATEMENTS (continued)
| | | | |
| | Foreign | | | Unrealized |
| Forward Foreign Currency | Currency | | | Appreciation |
| Exchange Contracts | Amounts | Cost ($) | Value ($) (Depreciation) ($) |
| Purchases (continued): | | | | |
| Australian Dollar, | | | | |
| Expiring 12/21/2011 | 657,500 | 637,874 | 688,577 | 50,703 |
| Australian Dollar, | | | | |
| Expiring 12/21/2011 | 657,500 | 635,342 | 688,576 | 53,234 |
| Australian Dollar, | | | | |
| Expiring 12/21/2011 | 53,700 | 53,018 | 56,238 | 3,220 |
| Australian Dollar, | | | | |
| Expiring 12/21/2011 | 125,300 | 123,198 | 131,222 | 8,024 |
| Australian Dollar, | | | | |
| Expiring 12/21/2011 | 49,600 | 47,708 | 51,944 | 4,236 |
| Australian Dollar, | | | | |
| Expiring 12/21/2011 | 198,400 | 190,641 | 207,777 | 17,136 |
| Australian Dollar, | | | | |
| Expiring 12/21/2011 | 150,960 | 146,772 | 158,095 | 11,323 |
| Australian Dollar, | | | | |
| Expiring 12/21/2011 | 154,700 | 153,168 | 162,012 | 8,844 |
| Australian Dollar, | | | | |
| Expiring 12/21/2011 | 44,200 | 43,825 | 46,289 | 2,464 |
| Australian Dollar, | | | | |
| Expiring 12/21/2011 | 455,000 | 459,923 | 476,505 | 16,582 |
| Australian Dollar, | | | | |
| Expiring 12/21/2011 | 125,400 | 126,915 | 131,327 | 4,412 |
| Australian Dollar, | | | | |
| Expiring 12/21/2011 | 83,600 | 84,481 | 87,551 | 3,070 |
| Australian Dollar, | | | | |
| Expiring 12/21/2011 | 126,450 | 129,585 | 132,426 | 2,841 |
| Australian Dollar, | | | | |
| Expiring 12/21/2011 | 716,550 | 733,723 | 750,418 | 16,695 |
| British Pound, | | | | |
| Expiring 12/21/2011 | 403,371 | 637,492 | 648,224 | 10,732 |
| British Pound, | | | | |
| Expiring 12/21/2011 | 856,832 | 1,349,356 | 1,376,944 | 27,588 |
| British Pound, | | | | |
| Expiring 12/21/2011 | 225,000 | 353,654 | 361,578 | 7,924 |
| British Pound, | | | | |
| Expiring 12/21/2011 | 45,000 | 70,704 | 72,315 | 1,611 |
| British Pound, | | | | |
| Expiring 12/21/2011 | 180,000 | 282,820 | 289,263 | 6,443 |
| British Pound, | | | | |
| Expiring 12/21/2011 | 312,500 | 483,431 | 502,192 | 18,761 |
| British Pound, | | | | |
| Expiring 12/21/2011 | 312,500 | 483,056 | 502,192 | 19,136 |
| British Pound, | | | | |
| Expiring 12/21/2011 | 59,000 | 91,783 | 94,814 | 3,031 |
50
| | | | | |
| | Foreign | | | Unrealized | |
| Forward Foreign Currency | Currency | | | Appreciation | |
| Exchange Contracts | Amounts | Cost ($) | Value ($) (Depreciation) ($) | |
| Purchases (continued): | | | | | |
| British Pound, | | | | | |
| Expiring 12/21/2011 | 173,240 | 270,598 | 278,400 | 7,802 | |
| British Pound, | | | | | |
| Expiring 12/21/2011 | 251,640 | 389,170 | 404,389 | 15,219 | |
| British Pound, | | | | | |
| Expiring 12/21/2011 | 151,450 | 234,083 | 243,383 | 9,300 | |
| British Pound, | | | | | |
| Expiring 12/21/2011 | 62,910 | 97,262 | 101,097 | 3,835 | |
| British Pound, | | | | | |
| Expiring 12/21/2011 | 108,120 | 166,471 | 173,750 | 7,279 | |
| British Pound, | | | | | |
| Expiring 12/21/2011 | 38,160 | 58,691 | 61,323 | 2,632 | |
| British Pound, | | | | | |
| Expiring 12/21/2011 | 65,720 | 101,134 | 105,613 | 4,479 | |
| British Pound, | | | | | |
| Expiring 12/21/2011 | 50,400 | 77,544 | 80,993 | 3,449 | |
| British Pound, | | | | | |
| Expiring 12/21/2011 | 201,600 | 309,910 | 323,975 | 14,065 | |
| British Pound, | | | | | |
| Expiring 12/21/2011 | 481,000 | 758,667 | 772,975 | 14,308 | |
| British Pound, | | | | | |
| Expiring 12/21/2011 | 630,000 | 987,928 | 1,012,420 | 24,492 | |
| British Pound, | | | | | |
| Expiring 12/21/2011 | 35,460 | 55,742 | 56,984 | 1,242 | |
| British Pound, | | | | | |
| Expiring 12/21/2011 | 78,800 | 124,131 | 126,632 | 2,501 | |
| British Pound, | | | | | |
| Expiring 12/21/2011 | 130,020 | 203,931 | 208,944 | 5,013 | |
| British Pound, | | | | | |
| Expiring 12/21/2011 | 149,720 | 235,029 | 240,603 | 5,574 | |
| Canadian Dollar, | | | | | |
| Expiring 12/21/2011 | 1,037,000 | 1,049,149 | 1,039,118 | (10,031 | ) |
| Canadian Dollar, | | | | | |
| Expiring 12/21/2011 | 550,279 | 558,166 | 551,402 | (6,764 | ) |
| Canadian Dollar, | | | | | |
| Expiring 12/21/2011 | 341,550 | 346,877 | 342,247 | (4,630 | ) |
| Canadian Dollar, | | | | | |
| Expiring 12/21/2011 | 846,450 | 862,492 | 848,179 | (14,313 | ) |
| Canadian Dollar, | | | | | |
| Expiring 12/21/2011 | 131,800 | 128,564 | 132,069 | 3,505 | |
| Canadian Dollar, | | | | | |
| Expiring 12/21/2011 | 963,200 | 943,103 | 965,167 | 22,064 | |
The Fund 51
NOTES TO FINANCIAL STATEMENTS (continued)
| | | | | |
| | Foreign | | | Unrealized | |
| Forward Foreign Currency | Currency | | | Appreciation | |
| Exchange Contracts | Amounts | Cost ($) | Value ($) (Depreciation) ($) | |
| Purchases (continued): | | | | | |
| Canadian Dollar, | | | | | |
| Expiring 12/21/2011 | 412,800 | 405,092 | 413,643 | 8,551 | |
| Canadian Dollar, | | | | | |
| Expiring 12/21/2011 | 411,060 | 396,387 | 411,899 | 15,512 | |
| Canadian Dollar, | | | | | |
| Expiring 12/21/2011 | 415,000 | 402,815 | 415,847 | 13,032 | |
| Canadian Dollar, | | | | | |
| Expiring 12/21/2011 | 636,000 | 620,076 | 637,299 | 17,223 | |
| Canadian Dollar, | | | | | |
| Expiring 12/21/2011 | 89,200 | 87,584 | 89,382 | 1,798 | |
| Canadian Dollar, | | | | | |
| Expiring 12/21/2011 | 147,180 | 143,805 | 147,481 | 3,676 | |
| Canadian Dollar, | | | | | |
| Expiring 12/21/2011 | 169,480 | 166,086 | 169,826 | 3,740 | |
| Canadian Dollar, | | | | | |
| Expiring 12/21/2011 | 40,140 | 39,267 | 40,221 | 954 | |
| Euro, | | | | | |
| Expiring 12/21/2011 | 235,453 | 326,762 | 325,661 | (1,101 | ) |
| Euro, | | | | | |
| Expiring 12/21/2011 | 377,340 | 520,039 | 521,908 | 1,869 | |
| Euro, | | | | | |
| Expiring 12/21/2011 | 152,260 | 209,753 | 210,594 | 841 | |
| Euro, | | | | | |
| Expiring 12/21/2011 | 52,000 | 70,049 | 71,922 | 1,873 | |
| Euro, | | | | | |
| Expiring 12/21/2011 | 52,000 | 70,169 | 71,922 | 1,753 | |
| Euro, | | | | | |
| Expiring 12/21/2011 | 466,200 | 634,061 | 644,812 | 10,751 | |
| Euro, | | | | | |
| Expiring 12/21/2011 | 199,800 | 272,297 | 276,348 | 4,051 | |
| Euro, | | | | | |
| Expiring 12/21/2011 | 243,000 | 330,376 | 336,099 | 5,723 | |
| Euro, | | | | | |
| Expiring 12/21/2011 | 357,000 | 484,710 | 493,775 | 9,065 | |
| Euro, | | | | | |
| Expiring 12/21/2011 | 12,000 | 16,076 | 16,597 | 521 | |
| Euro, | | | | | |
| Expiring 12/21/2011 | 48,000 | 64,278 | 66,389 | 2,111 | |
| Euro, | | | | | |
| Expiring 12/21/2011 | 212,670 | 286,002 | 294,148 | 8,146 | |
| Euro, | | | | | |
| Expiring 12/21/2011 | 280,000 | 382,236 | 387,275 | 5,039 | |
| Euro, | | | | | |
| Expiring 12/21/2011 | 503,000 | 694,668 | 695,711 | 1,043 | |
52
| | | | | |
| | Foreign | | | Unrealized | |
| Forward Foreign Currency | Currency | | | Appreciation | |
| Exchange Contracts | Amounts | Cost ($) | Value ($) (Depreciation) ($) | |
| Purchases (continued): | | | | | |
| Euro, | | | | | |
| Expiring 12/21/2011 | 305,400 | 420,843 | 422,406 | 1,563 | |
| Euro, | | | | | |
| Expiring 12/21/2011 | 203,600 | 280,485 | 281,604 | 1,119 | |
| Euro, | | | | | |
| Expiring 12/21/2011 | 9,090 | 12,445 | 12,573 | 128 | |
| Euro, | | | | | |
| Expiring 12/21/2011 | 33,330 | 45,561 | 46,100 | 539 | |
| Euro, | | | | | |
| Expiring 12/21/2011 | 38,380 | 52,501 | 53,084 | 583 | |
| Euro, | | | | | |
| Expiring 12/21/2011 | 20,200 | 27,735 | 27,939 | 204 | |
| Euro, | | | | | |
| Expiring 12/21/2011 | 478,880 | 678,381 | 662,350 | (16,031 | ) |
| Euro, | | | | | |
| Expiring 12/21/2011 | 105,120 | 148,846 | 145,394 | (3,452 | ) |
| Japanese Yen, | | | | | |
| Expiring 12/21/2011 | 31,540,647 | 410,862 | 403,856 | (7,006 | ) |
| Japanese Yen, | | | | | |
| Expiring 12/21/2011 | 42,001,925 | 548,378 | 537,805 | (10,573 | ) |
| Japanese Yen, | | | | | |
| Expiring 12/21/2011 | 41,170,204 | 537,912 | 527,155 | (10,757 | ) |
| Japanese Yen, | | | | | |
| Expiring 12/21/2011 | 18,421,298 | 240,647 | 235,872 | (4,775 | ) |
| Japanese Yen, | | | | | |
| Expiring 12/21/2011 | 16,000,180 | 208,367 | 204,871 | (3,496 | ) |
| Japanese Yen, | | | | | |
| Expiring 12/21/2011 | 39,652,620 | 516,748 | 507,724 | (9,024 | ) |
| Japanese Yen, | | | | | |
| Expiring 12/21/2011 | 4,169,300 | 54,589 | 53,385 | (1,204 | ) |
| Japanese Yen, | | | | | |
| Expiring 12/21/2011 | 16,677,200 | 218,419 | 213,540 | (4,879 | ) |
| Japanese Yen, | | | | | |
| Expiring 12/21/2011 | 20,846,500 | 273,271 | 266,925 | (6,346 | ) |
| Japanese Yen, | | | | | |
| Expiring 12/21/2011 | 23,491,800 | 306,804 | 300,796 | (6,008 | ) |
| Japanese Yen, | | | | | |
| Expiring 12/21/2011 | 54,814,200 | 716,012 | 701,857 | (14,155 | ) |
| Japanese Yen, | | | | | |
| Expiring 12/21/2011 | 29,830,650 | 387,299 | 381,960 | (5,339 | ) |
| Japanese Yen, | | | | | |
| Expiring 12/21/2011 | 28,172,400 | 367,427 | 360,728 | (6,699 | ) |
| Japanese Yen, | | | | | |
| Expiring 12/21/2011 | 80,814,000 | 1,054,834 | 1,034,766 | (20,068 | ) |
The Fund 53
NOTES TO FINANCIAL STATEMENTS (continued)
| | | | | |
| | Foreign | | | Unrealized | |
| Forward Foreign Currency | Currency | | | Appreciation | |
| Exchange Contracts | Amounts | Cost ($) | Value ($) (Depreciation) ($) | |
| Purchases (continued): | | | | | |
| Japanese Yen, | | | | | |
| Expiring 12/21/2011 | 50,509,200 | 655,695 | 646,735 | (8,960 | ) |
| Japanese Yen, | | | | | |
| Expiring 12/21/2011 | 33,672,800 | 437,480 | 431,156 | (6,324 | ) |
| Japanese Yen, | | | | | |
| Expiring 12/21/2011 | 32,051,800 | 415,130 | 410,401 | (4,729 | ) |
| Japanese Yen, | | | | | |
| Expiring 12/21/2011 | 5,656,200 | 73,334 | 72,424 | (910 | ) |
| Japanese Yen, | | | | | |
| Expiring 12/21/2011 | 30,361,000 | 395,949 | 388,751 | (7,198 | ) |
| Japanese Yen, | | | | | |
| Expiring 12/21/2011 | 9,015,000 | 117,429 | 115,431 | (1,998 | ) |
| Japanese Yen, | | | | | |
| Expiring 12/21/2011 | 2,248,200 | 29,265 | 28,787 | (478 | ) |
| Japanese Yen, | | | | | |
| Expiring 12/21/2011 | 4,996,000 | 65,026 | 63,970 | (1,056 | ) |
| Japanese Yen, | | | | | |
| Expiring 12/21/2011 | 9,492,400 | 123,454 | 121,543 | (1,911 | ) |
| Japanese Yen, | | | | | |
| Expiring 12/21/2011 | 8,243,400 | 107,360 | 105,551 | (1,809 | ) |
| New Zealand Dollar, | | | | | |
| Expiring 12/21/2011 | 922,547 | 752,577 | 743,365 | (9,212 | ) |
| New Zealand Dollar, | | | | | |
| Expiring 12/21/2011 | 115,020 | 87,688 | 92,680 | 4,992 | |
| New Zealand Dollar, | | | | | |
| Expiring 12/21/2011 | 271,000 | 211,163 | 218,364 | 7,201 | |
| New Zealand Dollar, | | | | | |
| Expiring 12/21/2011 | 138,550 | 110,856 | 111,640 | 784 | |
| New Zealand Dollar, | | | | | |
| Expiring 12/21/2011 | 24,450 | 19,580 | 19,701 | 121 | |
| New Zealand Dollar, | | | | | |
| Expiring 12/21/2011 | 94,000 | 74,326 | 75,743 | 1,417 | |
| New Zealand Dollar, | | | | | |
| Expiring 12/21/2011 | 747,020 | 612,148 | 601,930 | (10,218 | ) |
| New Zealand Dollar, | | | | | |
| Expiring 12/21/2011 | 163,980 | 134,555 | 132,131 | (2,424 | ) |
| Norwegian Krone, | | | | | |
| Expiring 12/21/2011 | 1,544,297 | 276,399 | 276,572 | 173 | |
| Norwegian Krone, | | | | | |
| Expiring 12/21/2011 | 841,320 | 150,177 | 150,674 | 497 | |
| Norwegian Krone, | | | | | |
| Expiring 12/21/2011 | 339,480 | 60,451 | 60,798 | 347 | |
| Norwegian Krone, | | | | | |
| Expiring 12/21/2011 | 1,812,500 | 320,167 | 324,606 | 4,439 | |
54
| | | | |
| | Foreign | | | Unrealized |
| Forward Foreign Currency | Currency | | | Appreciation |
| Exchange Contracts | Amounts | Cost ($) | Value ($) (Depreciation) ($) |
| Purchases (continued): | | | | |
| Norwegian Krone, | | | | |
| Expiring 12/21/2011 | 1,450,000 | 255,737 | 259,685 | 3,948 |
| Norwegian Krone, | | | | |
| Expiring 12/21/2011 | 362,500 | 63,807 | 64,921 | 1,114 |
| Norwegian Krone, | | | | |
| Expiring 12/21/2011 | 702,900 | 119,980 | 125,884 | 5,904 |
| Norwegian Krone, | | | | |
| Expiring 12/21/2011 | 537,030 | 92,210 | 96,178 | 3,968 |
| Norwegian Krone, | | | | |
| Expiring 12/21/2011 | 1,368,150 | 239,856 | 245,026 | 5,170 |
| Norwegian Krone, | | | | |
| Expiring 12/21/2011 | 390,900 | 68,423 | 70,007 | 1,584 |
| Norwegian Krone, | | | | |
| Expiring 12/21/2011 | 2,008,000 | 352,281 | 359,618 | 7,337 |
| Norwegian Krone, | | | | |
| Expiring 12/21/2011 | 2,475,000 | 435,609 | 443,254 | 7,645 |
| Norwegian Krone, | | | | |
| Expiring 12/21/2011 | 299,550 | 53,574 | 53,647 | 73 |
| Norwegian Krone, | | | | |
| Expiring 12/21/2011 | 1,697,450 | 303,518 | 304,001 | 483 |
| Norwegian Krone, | | | | |
| Expiring 12/21/2011 | 1,304,000 | 231,322 | 233,536 | 2,214 |
| Swedish Krona, | | | | |
| Expiring 12/21/2011 | 2,023,980 | 303,098 | 309,689 | 6,591 |
| Swedish Krona, | | | | |
| Expiring 12/21/2011 | 6,961,714 | 1,035,754 | 1,065,210 | 29,456 |
| Swedish Krona, | | | | |
| Expiring 12/21/2011 | 2,851,010 | 431,716 | 436,232 | 4,516 |
| Swedish Krona, | | | | |
| Expiring 12/21/2011 | 500,480 | 75,016 | 76,578 | 1,562 |
| Swedish Krona, | | | | |
| Expiring 12/21/2011 | 1,240,320 | 186,531 | 189,780 | 3,249 |
| Swedish Krona, | | | | |
| Expiring 12/21/2011 | 817,600 | 122,933 | 125,100 | 2,167 |
| Swedish Krona, | | | | |
| Expiring 12/21/2011 | 204,400 | 30,711 | 31,275 | 564 |
| Swedish Krona, | | | | |
| Expiring 12/21/2011 | 1,022,000 | 153,516 | 156,376 | 2,860 |
| Swedish Krona, | | | | |
| Expiring 12/21/2011 | 643,000 | 93,717 | 98,385 | 4,668 |
| Swedish Krona, | | | | |
| Expiring 12/21/2011 | 696,300 | 103,149 | 106,540 | 3,391 |
| Swedish Krona, | | | | |
| Expiring 12/21/2011 | 1,624,700 | 239,950 | 248,595 | 8,645 |
The Fund 55
NOTES TO FINANCIAL STATEMENTS (continued)
| | | | | |
| | Foreign | | | Unrealized | |
| Forward Foreign Currency | Currency | | | Appreciation | |
| Exchange Contracts | Amounts | Cost ($) | Value ($) (Depreciation) ($) | |
| Purchases (continued): | | | | | |
| Swedish Krona, | | | | | |
| Expiring 12/21/2011 | 4,144,980 | 605,507 | 634,222 | 28,715 | |
| Swedish Krona, | | | | | |
| Expiring 12/21/2011 | 742,300 | 107,582 | 113,579 | 5,997 | |
| Swedish Krona, | | | | | |
| Expiring 12/21/2011 | 1,233,360 | 178,644 | 188,716 | 10,072 | |
| Swedish Krona, | | | | | |
| Expiring 12/21/2011 | 308,340 | 44,583 | 47,179 | 2,596 | |
| Swedish Krona, | | | | | |
| Expiring 12/21/2011 | 1,453,600 | 211,485 | 222,414 | 10,929 | |
| Swedish Krona, | | | | | |
| Expiring 12/21/2011 | 363,400 | 52,962 | 55,604 | 2,642 | |
| Swedish Krona, | | | | | |
| Expiring 12/21/2011 | 2,056,320 | 302,433 | 314,637 | 12,204 | |
| Swedish Krona, | | | | | |
| Expiring 12/21/2011 | 256,400 | 38,449 | 39,232 | 783 | |
| Swedish Krona, | | | | | |
| Expiring 12/21/2011 | 897,400 | 134,648 | 137,311 | 2,663 | |
| Swiss Franc, | | | | | |
| Expiring 12/21/2011 | 317,272 | 363,011 | 361,765 | (1,246 | ) |
| Swiss Franc, | | | | | |
| Expiring 12/21/2011 | 82,200 | 92,139 | 93,727 | 1,588 | |
| Swiss Franc, | | | | | |
| Expiring 12/21/2011 | 191,800 | 214,316 | 218,697 | 4,381 | |
| Swiss Franc, | | | | | |
| Expiring 12/21/2011 | 233,590 | 258,631 | 266,348 | 7,717 | |
| Swiss Franc, | | | | | |
| Expiring 12/21/2011 | 92,000 | 100,588 | 104,901 | 4,313 | |
| Sales: | | Proceeds ($) | | | |
| Australian Dollar, | | | | | |
| Expiring 12/21/2011 | 660,000 | 672,692 | 691,195 | (18,503 | ) |
| Australian Dollar, | | | | | |
| Expiring 12/21/2011 | 713,473 | 721,264 | 747,195 | (25,931 | ) |
| Australian Dollar, | | | | | |
| Expiring 12/21/2011 | 655,753 | 669,688 | 686,747 | (17,059 | ) |
| Australian Dollar, | | | | | |
| Expiring 12/21/2011 | 144,780 | 148,327 | 151,623 | (3,296 | ) |
| Australian Dollar, | | | | | |
| Expiring 12/21/2011 | 58,420 | 59,933 | 61,181 | (1,248 | ) |
| Australian Dollar, | | | | | |
| Expiring 12/21/2011 | 174,220 | 163,075 | 182,455 | (19,380 | ) |
| Australian Dollar, | | | | | |
| Expiring 12/21/2011 | 286,620 | 268,081 | 300,167 | (32,086 | ) |
| Australian Dollar, | | | | | |
| Expiring 12/21/2011 | 101,160 | 94,677 | 105,941 | (11,264 | ) |
56
| | | | | |
| | Foreign | | | Unrealized | |
| Forward Foreign Currency | Currency | | | Appreciation | |
| Exchange Contracts | Amounts | Proceeds ($) | Value ($) (Depreciation) ($) | |
| Sales (continued): | | | | | |
| Australian Dollar, | | | | | |
| Expiring 12/21/2011 | 165,000 | 167,478 | 172,799 | (5,321 | ) |
| Australian Dollar, | | | | | |
| Expiring 12/21/2011 | 220,580 | 234,750 | 231,006 | 3,744 | |
| Australian Dollar, | | | | | |
| Expiring 12/21/2011 | 48,420 | 51,577 | 50,709 | 868 | |
| British Pound, | | | | | |
| Expiring 12/21/2011 | 181,650 | 286,854 | 291,915 | (5,061 | ) |
| British Pound, | | | | | |
| Expiring 12/21/2011 | 369,930 | 583,557 | 594,484 | (10,927 | ) |
| British Pound, | | | | | |
| Expiring 12/21/2011 | 149,270 | 235,554 | 239,879 | (4,325 | ) |
| British Pound, | | | | | |
| Expiring 12/21/2011 | 615,200 | 944,752 | 988,637 | (43,885 | ) |
| British Pound, | | | | | |
| Expiring 12/21/2011 | 37,000 | 57,586 | 59,460 | (1,874 | ) |
| British Pound, | | | | | |
| Expiring 12/21/2011 | 184,800 | 289,871 | 296,977 | (7,106 | ) |
| British Pound, | | | | | |
| Expiring 12/21/2011 | 431,200 | 673,250 | 692,946 | (19,696 | ) |
| British Pound, | | | | | |
| Expiring 12/21/2011 | 211,005 | 330,045 | 339,089 | (9,044 | ) |
| British Pound, | | | | | |
| Expiring 12/21/2011 | 309,995 | 483,251 | 498,167 | (14,916 | ) |
| British Pound, | | | | | |
| Expiring 12/21/2011 | 79,050 | 123,118 | 127,035 | (3,917 | ) |
| British Pound, | | | | | |
| Expiring 12/21/2011 | 95,300 | 149,244 | 153,149 | (3,905 | ) |
| British Pound, | | | | | |
| Expiring 12/21/2011 | 333,550 | 522,347 | 536,021 | (13,674 | ) |
| British Pound, | | | | | |
| Expiring 12/21/2011 | 742,000 | 1,156,073 | 1,192,407 | (36,334 | ) |
| British Pound, | | | | | |
| Expiring 12/21/2011 | 730,000 | 1,150,079 | 1,173,122 | (23,043 | ) |
| British Pound, | | | | | |
| Expiring 12/21/2011 | 125,000 | 196,183 | 200,877 | (4,694 | ) |
| British Pound, | | | | | |
| Expiring 12/21/2011 | 76,500 | 120,903 | 122,937 | (2,034 | ) |
| British Pound, | | | | | |
| Expiring 12/21/2011 | 13,500 | 21,334 | 21,695 | (361 | ) |
| British Pound, | | | | | |
| Expiring 12/21/2011 | 392,780 | 633,039 | 631,204 | 1,835 | |
| British Pound, | | | | | |
| Expiring 12/21/2011 | 86,220 | 138,934 | 138,557 | 377 | |
The Fund 57
NOTES TO FINANCIAL STATEMENTS (continued)
| | | | | |
| | Foreign | | | Unrealized | |
| Forward Foreign Currency | Currency | | | Appreciation | |
| Exchange Contracts | Amounts | Proceeds ($) | Value ($) (Depreciation) ($) | |
| Sales (continued): | | | | | |
| Canadian Dollar, | | | | | |
| Expiring 12/21/2011 | 103,007 | 103,700 | 103,217 | 483 | |
| Canadian Dollar, | | | | | |
| Expiring 12/21/2011 | 15,200 | 15,290 | 15,231 | 59 | |
| Canadian Dollar, | | | | | |
| Expiring 12/21/2011 | 76,000 | 76,393 | 76,155 | 238 | |
| Canadian Dollar, | | | | | |
| Expiring 12/21/2011 | 60,800 | 61,160 | 60,924 | 236 | |
| Canadian Dollar, | | | | | |
| Expiring 12/21/2011 | 32,000 | 31,979 | 32,065 | (86 | ) |
| Canadian Dollar, | | | | | |
| Expiring 12/21/2011 | 1,439,000 | 1,392,932 | 1,441,939 | (49,007 | ) |
| Canadian Dollar, | | | | | |
| Expiring 12/21/2011 | 661,500 | 643,188 | 662,851 | (19,663 | ) |
| Canadian Dollar, | | | | | |
| Expiring 12/21/2011 | 661,500 | 640,219 | 662,851 | (22,632 | ) |
| Canadian Dollar, | | | | | |
| Expiring 12/21/2011 | 325,890 | 312,989 | 326,556 | (13,567 | ) |
| Canadian Dollar, | | | | | |
| Expiring 12/21/2011 | 32,670 | 31,027 | 32,737 | (1,710 | ) |
| Canadian Dollar, | | | | | |
| Expiring 12/21/2011 | 78,650 | 74,980 | 78,811 | (3,831 | ) |
| Canadian Dollar, | | | | | |
| Expiring 12/21/2011 | 130,680 | 124,420 | 130,947 | (6,527 | ) |
| Canadian Dollar, | | | | | |
| Expiring 12/21/2011 | 83,700 | 78,737 | 83,871 | (5,134 | ) |
| Canadian Dollar, | | | | | |
| Expiring 12/21/2011 | 48,600 | 45,736 | 48,699 | (2,963 | ) |
| Canadian Dollar, | | | | | |
| Expiring 12/21/2011 | 253,000 | 239,645 | 253,517 | (13,872 | ) |
| Canadian Dollar, | | | | | |
| Expiring 12/21/2011 | 137,700 | 129,411 | 137,981 | (8,570 | ) |
| Canadian Dollar, | | | | | |
| Expiring 12/21/2011 | 48,150 | 47,458 | 48,248 | (790 | ) |
| Canadian Dollar, | | | | | |
| Expiring 12/21/2011 | 272,850 | 268,588 | 273,407 | (4,819 | ) |
| Canadian Dollar, | | | | | |
| Expiring 12/21/2011 | 155,000 | 152,123 | 155,317 | (3,194 | ) |
| Canadian Dollar, | | | | | |
| Expiring 12/21/2011 | 37,720 | 37,932 | 37,737 | 195 | |
| Canadian Dollar, | | | | | |
| Expiring 12/21/2011 | 8,280 | 8,329 | 8,297 | 32 | |
| Euro, | | | | | |
| Expiring 12/21/2011 | 896,988 | 1,230,623 | 1,240,646 | (10,023 | ) |
58
| | | | | |
| | Foreign | | | Unrealized | |
| Forward Foreign Currency | Currency | | | Appreciation | |
| Exchange Contracts | Amounts | Proceeds ($) | Value ($) (Depreciation) ($) | |
| Sales (continued): | | | | | |
| Euro, | | | | | |
| Expiring 12/21/2011 | 2,159,189 | 2,957,679 | 2,986,426 | (28,747 | ) |
| Euro, | | | | | |
| Expiring 12/21/2011 | 66,200 | 90,634 | 91,563 | (929 | ) |
| Euro, | | | | | |
| Expiring 12/21/2011 | 331,000 | 452,153 | 457,814 | (5,661 | ) |
| Euro, | | | | | |
| Expiring 12/21/2011 | 264,800 | 362,829 | 366,251 | (3,422 | ) |
| Euro, | | | | | |
| Expiring 12/21/2011 | 265,000 | 362,586 | 366,528 | (3,942 | ) |
| Euro, | | | | | |
| Expiring 12/21/2011 | 702,000 | 943,746 | 970,953 | (27,207 | ) |
| Euro, | | | | | |
| Expiring 12/21/2011 | 253,000 | 341,967 | 349,930 | (7,963 | ) |
| Euro, | | | | | |
| Expiring 12/21/2011 | 498,420 | 669,936 | 689,377 | (19,441 | ) |
| Euro, | | | | | |
| Expiring 12/21/2011 | 45,765 | 60,592 | 63,299 | (2,707 | ) |
| Euro, | | | | | |
| Expiring 12/21/2011 | 183,060 | 242,913 | 253,195 | (10,282 | ) |
| Euro, | | | | | |
| Expiring 12/21/2011 | 110,175 | 146,067 | 152,386 | (6,319 | ) |
| Euro, | | | | | |
| Expiring 12/21/2011 | 27,000 | 37,412 | 37,345 | 67 | |
| Euro, | | | | | |
| Expiring 12/21/2011 | 153,000 | 211,882 | 211,618 | 264 | |
| Euro, | | | | | |
| Expiring 12/21/2011 | 435,000 | 598,329 | 601,659 | (3,330 | ) |
| Euro, | | | | | |
| Expiring 12/21/2011 | 419,000 | 574,956 | 579,529 | (4,573 | ) |
| Japanese Yen, | | | | | |
| Expiring 12/21/2011 | 2,376,000 | 31,123 | 30,423 | 700 | |
| Japanese Yen, | | | | | |
| Expiring 12/21/2011 | 73,415,000 | 962,586 | 940,027 | 22,559 | |
| Japanese Yen, | | | | | |
| Expiring 12/21/2011 | 62,419,500 | 818,185 | 799,238 | 18,947 | |
| Japanese Yen, | | | | | |
| Expiring 12/21/2011 | 62,419,500 | 813,962 | 799,238 | 14,724 | |
| Japanese Yen, | | | | | |
| Expiring 12/21/2011 | 13,723,450 | 179,130 | 175,719 | 3,411 | |
| Japanese Yen, | | | | | |
| Expiring 12/21/2011 | 22,802,040 | 297,812 | 291,964 | 5,848 | |
| Japanese Yen, | | | | | |
| Expiring 12/21/2011 | 5,700,510 | 74,477 | 72,991 | 1,486 | |
The Fund 59
NOTES TO FINANCIAL STATEMENTS (continued)
| | | | | |
| | Foreign | | | Unrealized | |
| Forward Foreign Currency | Currency | | | Appreciation | |
| Exchange Contracts | Amounts | Proceeds ($) | Value ($) (Depreciation) ($) | |
| Sales (continued): | | | | | |
| Japanese Yen, | | | | | |
| Expiring 12/21/2011 | 25,758,000 | 336,235 | 329,813 | 6,422 | |
| Japanese Yen, | | | | | |
| Expiring 12/21/2011 | 26,552,640 | 346,507 | 339,988 | 6,519 | |
| Japanese Yen, | | | | | |
| Expiring 12/21/2011 | 16,139,840 | 210,247 | 206,659 | 3,588 | |
| Japanese Yen, | | | | | |
| Expiring 12/21/2011 | 9,371,520 | 122,089 | 119,996 | 2,093 | |
| Japanese Yen, | | | | | |
| Expiring 12/21/2011 | 7,697,340 | 101,715 | 98,559 | 3,156 | |
| Japanese Yen, | | | | | |
| Expiring 12/21/2011 | 1,689,660 | 22,335 | 21,635 | 700 | |
| New Zealand Dollar, | | | | | |
| Expiring 12/21/2011 | 198,697 | 162,528 | 160,105 | 2,423 | |
| New Zealand Dollar, | | | | | |
| Expiring 12/21/2011 | 135,010 | 111,361 | 108,788 | 2,573 | |
| New Zealand Dollar, | | | | | |
| Expiring 12/21/2011 | 334,590 | 275,447 | 269,604 | 5,843 | |
| New Zealand Dollar, | | | | | |
| Expiring 12/21/2011 | 64,300 | 52,724 | 51,811 | 913 | |
| New Zealand Dollar, | | | | | |
| Expiring 12/21/2011 | 257,200 | 210,724 | 207,245 | 3,479 | |
| New Zealand Dollar, | | | | | |
| Expiring 12/21/2011 | 321,500 | 262,694 | 259,057 | 3,637 | |
| New Zealand Dollar, | | | | | |
| Expiring 12/21/2011 | 361,000 | 279,743 | 290,885 | (11,142 | ) |
| New Zealand Dollar, | | | | | |
| Expiring 12/21/2011 | 361,000 | 278,049 | 290,885 | (12,836 | ) |
| New Zealand Dollar, | | | | | |
| Expiring 12/21/2011 | 527,800 | 414,254 | 425,288 | (11,034 | ) |
| New Zealand Dollar, | | | | | |
| Expiring 12/21/2011 | 226,200 | 178,297 | 182,266 | (3,969 | ) |
| New Zealand Dollar, | | | | | |
| Expiring 12/21/2011 | 91,800 | 69,282 | 73,970 | (4,688 | ) |
| New Zealand Dollar, | | | | | |
| Expiring 12/21/2011 | 55,250 | 41,772 | 44,519 | (2,747 | ) |
| New Zealand Dollar, | | | | | |
| Expiring 12/21/2011 | 22,950 | 17,199 | 18,493 | (1,294 | ) |
| New Zealand Dollar, | | | | | |
| Expiring 12/21/2011 | 88,200 | 67,265 | 71,069 | (3,804 | ) |
| New Zealand Dollar, | | | | | |
| Expiring 12/21/2011 | 352,800 | 269,158 | 284,277 | (15,119 | ) |
| New Zealand Dollar, | | | | | |
| Expiring 12/21/2011 | 361,080 | 277,395 | 290,949 | (13,554 | ) |
60
| | | | | |
| | Foreign | | | Unrealized | |
| Forward Foreign Currency | Currency | | | Appreciation | |
| Exchange Contracts | Amounts | Proceeds ($) | Value ($) (Depreciation) ($) | |
| Sales (continued): | | | | | |
| New Zealand Dollar, | | | | | |
| Expiring 12/21/2011 | 30,400 | 24,029 | 24,496 | (467 | ) |
| New Zealand Dollar, | | | | | |
| Expiring 12/21/2011 | 13,680 | 10,764 | 11,023 | (259 | ) |
| New Zealand Dollar, | | | | | |
| Expiring 12/21/2011 | 50,160 | 39,393 | 40,418 | (1,025 | ) |
| New Zealand Dollar, | | | | | |
| Expiring 12/21/2011 | 57,760 | 45,443 | 46,541 | (1,098 | ) |
| Norwegian Krone, | | | | | |
| Expiring 12/21/2011 | 8,420,833 | 1,477,210 | 1,508,110 | (30,900 | ) |
| Norwegian Krone, | | | | | |
| Expiring 12/21/2011 | 3,424,400 | 592,406 | 613,285 | (20,879 | ) |
| Norwegian Krone, | | | | | |
| Expiring 12/21/2011 | 1,467,600 | 255,502 | 262,837 | (7,335 | ) |
| Norwegian Krone, | | | | | |
| Expiring 12/21/2011 | 171,720 | 30,337 | 30,754 | (417 | ) |
| Norwegian Krone, | | | | | |
| Expiring 12/21/2011 | 381,600 | 67,649 | 68,342 | (693 | ) |
| Norwegian Krone, | | | | | |
| Expiring 12/21/2011 | 629,640 | 111,243 | 112,764 | (1,521 | ) |
| Norwegian Krone, | | | | | |
| Expiring 12/21/2011 | 725,040 | 128,438 | 129,849 | (1,411 | ) |
| Norwegian Krone, | | | | | |
| Expiring 12/21/2011 | 891,340 | 163,893 | 159,633 | 4,260 | |
| Norwegian Krone, | | | | | |
| Expiring 12/21/2011 | 195,660 | 35,939 | 35,041 | 898 | |
| Swedish Krona, | | | | | |
| Expiring 12/21/2011 | 2,141,500 | 311,161 | 327,670 | (16,509 | ) |
| Swedish Krona, | | | | | |
| Expiring 12/21/2011 | 2,141,500 | 307,904 | 327,670 | (19,766 | ) |
| Swedish Krona, | | | | | |
| Expiring 12/21/2011 | 4,061,000 | 605,064 | 621,373 | (16,309 | ) |
| Swedish Krona, | | | | | |
| Expiring 12/21/2011 | 404,850 | 61,163 | 61,946 | (783 | ) |
| Swedish Krona, | | | | | |
| Expiring 12/21/2011 | 2,294,150 | 347,151 | 351,027 | (3,876 | ) |
| Swedish Krona, | | | | | |
| Expiring 12/21/2011 | 3,087,300 | 483,634 | 472,387 | 11,247 | |
| Swedish Krona, | | | | | |
| Expiring 12/21/2011 | 677,700 | 105,998 | 103,695 | 2,303 | |
| Swiss Franc, | | | | | |
| Expiring 12/21/2011 | 65,522 | 75,540 | 74,711 | 829 | |
| Swiss Franc, | | | | | |
| Expiring 12/21/2011 | 22,310 | 25,555 | 25,439 | 116 | |
The Fund 61
NOTES TO FINANCIAL STATEMENTS (continued)
| | | | | |
| | Foreign | | | Unrealized | |
| Forward Foreign Currency | Currency | | | Appreciation | |
| Exchange Contracts | Amounts | Proceeds ($) | Value ($) (Depreciation) ($) | |
| Sales (continued): | | | | | |
| Swiss Franc, | | | | | |
| Expiring 12/21/2011 | 55,290 | 63,245 | 63,044 | 201 | |
| Swiss Franc, | | | | | |
| Expiring 12/21/2011 | 26,500 | 29,306 | 30,216 | (910 | ) |
| Swiss Franc, | | | | | |
| Expiring 12/21/2011 | 26,500 | 29,338 | 30,216 | (878 | ) |
| Swiss Franc, | | | | | |
| Expiring 12/21/2011 | 140,250 | 152,372 | 159,918 | (7,546 | ) |
| Swiss Franc, | | | | | |
| Expiring 12/21/2011 | 205,000 | 227,031 | 233,748 | (6,717 | ) |
| Swiss Franc, | | | | | |
| Expiring 12/21/2011 | 142,800 | 159,937 | 162,826 | (2,889 | ) |
| Swiss Franc, | | | | | |
| Expiring 12/21/2011 | 25,200 | 28,231 | 28,734 | (503 | ) |
| Swiss Franc, | | | | | |
| Expiring 12/21/2011 | 24,800 | 27,692 | 28,278 | (586 | ) |
| Swiss Franc, | | | | | |
| Expiring 12/21/2011 | 11,160 | 12,424 | 12,725 | (301 | ) |
| Swiss Franc, | | | | | |
| Expiring 12/21/2011 | 47,120 | 52,465 | 53,728 | (1,263 | ) |
| Swiss Franc, | | | | | |
| Expiring 12/21/2011 | 40,920 | 45,502 | 46,658 | (1,156 | ) |
| Gross Unrealized | | | | | |
| Appreciation | | | | 988,345 | |
| Gross Unrealized | | | | | |
| Depreciation | | | | (1,081,103 | ) |
The following summarizes the average market value of derivatives outstanding during the period ended October 31, 2011:
| |
| | Average Market Value ($) |
| Interest rate futures contracts | 33,575,642 |
| Forward contracts | 13,033,733 |
At October 31, 2011, the cost of investments for federal income tax purposes was $88,004,107; accordingly, accumulated net unrealized appreciation on investments was $2,512,506, consisting of $2,971,319 gross unrealized appreciation and $458,813 gross unrealized depreciation.
62
REPORT OF INDEPENDENT REGISTERED
PUBLIC ACCOUNTING FIRM
Shareholders and Board of Directors Dreyfus Total Return Advantage Fund
We have audited the accompanying statement of assets and liabilities, including the statements of investments, financial futures and securities sold short, of Dreyfus Total Return Advantage Fund (one of the series comprising Advantage Funds, Inc.) as of October 31, 2011, and the related statement of operations for the year then ended, the statement of changes in net assets for each of the two years in the period then ended and financial highlights for each of the years indicated therein. These financial statements and financial highlights are the responsibility of the Fund’s management. Our responsibility is to express an opinion on these financial statements and financial highlights based on our audits.
We conducted our audits in accordance with the standards of the Public Company Accounting Oversight Board (United States).Those standards require that we plan and perform the audit to obtain reasonable assurance about whether the financial statements and financial highlights are free of material misstatement.We were not engaged to perform an audit of the Fund’s internal control over financial reporting. Our audits included consideration of internal control over financial reporting as a basis for designing audit procedures that are appropriate in the circumstances, but not for the purpose of expressing an opinion on the effectiveness of the Fund’s internal control over financial reporting. Accordingly, we express no such opinion.An audit also includes examining, on a test basis, evidence supporting the amounts and disclosures in the financial statements and financial highlights, assessing the accounting principles used and significant estimates made by management, and evaluating the overall financial statement presentation. Our procedures included confirmation of securities owned as of October 31, 2011 by correspondence with the custodian and others. We believe that our audits provide a reasonable basis for our opinion.
In our opinion, the financial statements and financial highlights referred to above present fairly, in all material respects, the financial position of Dreyfus Total Return Advantage Fund at October 31, 2011, the results of its operations for the year then ended, the changes in its net assets for each of the two years in the period then ended and the financial highlights for each of the indicated years, in conformity with U.S. generally accepted accounting principles.

New York, New York
December 29, 2011
The Fund 63
IMPORTANT TAX INFORMATION (Unaudited)
For federal tax purposes the fund hereby designates 100% of ordinary income dividends paid during the fiscal year ended October 31, 2011 as qualifying interest related dividends.Also, the fund hereby designates $.2778 per share as a short-term capital gain distribution paid and also designates $.2689 per share as a long-term capital gain distribution paid on December 28, 2010.
64
BOARD MEMBERS INFORMATION (Unaudited)
|
| Joseph S. DiMartino (68) |
| Chairman of the Board (1995) |
| Principal Occupation During Past 5Years: |
| • Corporate Director and Trustee |
| Other Public Company Board Memberships During Past 5Years: |
| • CBIZ (formerly, Century Business Services, Inc.), a provider of outsourcing functions for small |
| and medium size companies, Director (1997-present) |
| • Sunair Services Corporation, a provider of certain outdoor-related services to homes and |
| businesses, Director (2005-2009) |
| • The Newark Group, a provider of a national market of paper recovery facilities, paperboard |
| mills and paperboard converting plants, Director (2000-2010) |
| No. of Portfolios for which Board Member Serves: 167 |
| ——————— |
| Peggy C. Davis (68) |
| Board Member (2006) |
| Principal Occupation During Past 5Years: |
| • Shad Professor of Law, New York University School of Law |
| • Writer and teacher in the fields of evidence, constitutional theory, family law, social sciences |
| and the law, legal process and professional methodology and training |
| No. of Portfolios for which Board Member Serves: 53 |
| ——————— |
| David P. Feldman (71) |
| Board Member (1996) |
| Principal Occupation During Past 5Years: |
| • Corporate Director and Trustee |
| Other Public Company Board Memberships During Past 5Years: |
| • BBH Mutual Funds Group (4 registered mutual funds), Director (1992-present) |
| • QMed, Inc. a healthcare company, Director (1999-2007) |
| No. of Portfolios for which Board Member Serves: 50 |
The Fund 65
BOARD MEMBERS INFORMATION (Unaudited) (continued)
|
| Ehud Houminer (71) |
| Board Member (1993) |
| Principal Occupation During Past 5Years: |
| • Executive-in-Residence at the Columbia Business School, Columbia University (1992-present) |
| Other Public Company Board Memberships During Past 5Years: |
| • Avnet Inc., an electronics distributor, Director (1993-present) |
| No. of Portfolios for which Board Member Serves: 64 |
| ——————— |
| Dr. Martin Peretz (72) |
| Board Member (2006) |
| Principal Occupation During Past 5Years: |
| • Editor-in-Chief Emeritus of The New Republic Magazine (2010-present) (previously, |
| Editor-in-Chief, 1974-2010) |
| • Director of TheStreet.com, a financial information service on the web (1996-present) |
| No. of Portfolios for which Board Member Serves: 35 |
| ——————— |
| Once elected all Board Members serve for an indefinite term, but achieve Emeritus status upon reaching age 80.The |
| address of the Board Members and Officers is in c/o The Dreyfus Corporation, 200 Park Avenue, NewYork, NewYork |
| 10166.Additional information about the Board Members is available in the fund’s Statement of Additional Information |
| which can be obtained from Dreyfus free of charge by calling this toll free number: 1-800-DREYFUS. |
| James F. Henry, Emeritus Board Member |
| Dr. Paul A. Marks, Emeritus Board Member |
| Gloria Messinger, Emeritus Board Member |
66
OFFICERS OF THE FUND (Unaudited)
The Fund 67
OFFICERS OF THE FUND (Unaudited) (continued)
68
The Fund 69
Global Alpha Fund
ANNUAL REPORT October 31, 2011

Save time. Save paper. View your next shareholder report online as soon as it’s available. Log into www.dreyfus.com and sign up for Dreyfus eCommunications. It’s simple and only takes a few minutes.
The views expressed in this report reflect those of the portfolio manager only through the end of the period covered and do not necessarily represent the views of Dreyfus or any other person in the Dreyfus organization. Any such views are subject to change at any time based upon market or other conditions and Dreyfus disclaims any responsibility to update such views.These views may not be relied on as investment advice and, because investment decisions for a Dreyfus fund are based on numerous factors, may not be relied on as an indication of trading intent on behalf of any Dreyfus fund.
| | Contents |
| | THE FUND |
| 2 | A Letter from the Chairman and CEO |
| 3 | Discussion of Fund Performance |
| 6 | Fund Performance |
| 8 | Understanding Your Fund’s Expenses |
| 8 | Comparing Your Fund’s Expenses With Those of Other Funds |
| 9 | Statement of Investments |
| 57 | Statement of Financial Futures |
| 58 | Statement of Options Written |
| 59 | Statement of Assets and Liabilities |
| 60 | Statement of Operations |
| 61 | Statement of Changes in Net Assets |
| 62 | Financial Highlights |
| 65 | Notes to Financial Statements |
| 100 | Report of Independent Registered Public Accounting Firm |
| 101 | Board Members Information |
| 103 | Officers of the Fund |
| | FOR MORE INFORMATION |
| | Back Cover |
Global Alpha Fund
The Fund

A LETTER FROM THE CHAIRMAN AND CEO
Dear Shareholder:
We present to you this annual report for Global Alpha Fund, covering the 12-month period from November 1, 2010, through October 31, 2011. For information about how the fund performed during the reporting period, as well as general market perspectives, we provide a Discussion of Fund Performance on the pages that follow.
Investors were encouraged by expectations of a more robust economic recovery during the final months of 2010, but sentiment deteriorated in 2011 due to disappointing global economic data, rising commodity prices, an escalating sovereign debt crisis in Europe and a contentious debate regarding taxes, spending and borrowing in the United States. International stocks proved sensitive to these macroeconomic developments, often regardless of underlying company fundamentals, and most international equity market indices ended the reporting period with mildly negative absolute returns.
The global economic outlook currently remains clouded by market turbulence and political infighting, but we believe that a continued subpar global expansion is more likely than a return to recession. Although Europe continues to struggle with a debt crisis, inflationary pressures appear to be waning in most countries as energy prices recently have retreated from their highs. In Asia, China seems to have averted an economic contraction after implementing measures to dampen inflationary pressures. In the United States, moderately low core inflation and an accommodative monetary policy could help support near-trend growth despite ongoing deleveraging activity in the private sector.To assess the potential impact of these and other developments on your investments, we encourage you, as always, to speak with your financial advisor.
Thank you for your continued confidence and support.

Jonathan R. Baum
Chairman and Chief Executive Officer
The Dreyfus Corporation
November 15, 2011
2

DISCUSSION OF FUND PERFORMANCE
For the period of November 1, 2010, through October 31, 2011, as provided by Vassilis Dagioglu, James Stavena, Torrey Zaches and Joseph Miletich, Portfolio Managers
Fund and Market Performance Overview
For the 12-month period ended October 31, 2011, Global Alpha Fund’s Class A shares produced a total return of 3.07%, Class C shares returned 2.32% and Class I shares returned 3.50%.1 In comparison, the fund’s benchmark, a hybrid index comprised of 60% Morgan Stanley Capital International World Index (half-hedged) and 40% Citigroup World Government Bond Index 1+ World Index (half-hedged), produced a total return of 2.19% for the same period.2 Separately, the Morgan Stanley Capital International World Index (half-hedged) produced a total return of 1.07%, and the Citigroup World Government Bond Index 1+ World Index (half-hedged) produced a 2.98% total return for the same period.
Global financial markets generally rallied into the first quarter of 2011 as an economic recovery gained traction, but renewed macroeconomic concerns later caused riskier assets to give back many of their previous gains.The fund generally produced higher returns than its benchmark, primarily due to positive results from three of the four alpha sources considered by our quantitative investment approach.
The Fund’s Investment Approach
The fund seeks total return through investments in securities and instruments that provide investment exposure to global stock, bond and currency markets and fixed-income securities. For allocation among equity markets, the portfolio managers employ a bottom-up valuation approach using proprietary models to derive market level expected returns. For allocation among bond markets, the portfolio managers use proprietary models to identify temporary mispricings among the long-term government bond markets. The most relevant long-term bond yield within each country serves as the expected return for each bond market. Our quantitative investment approach is designed to identify and exploit relative misvaluations across and within major developed capital markets such as the United States, Canada, Japan,Australia and many Western European countries.
The Fund 3
DISCUSSION OF FUND PERFORMANCE (continued)
Shifting Sentiment Sparked Heightened Market Volatility
Improving economic data supported stocks and higher yielding bonds over the first several months of the reporting period. However, the rallies were interrupted in February when political unrest in the Middle East led to sharply rising crude oil prices, and again in March when natural and nuclear disasters in Japan disrupted the global industrial supply chain. Nonetheless, markets proved resilient, and most financial assets rebounded quickly from these unexpected shocks.
Investor sentiment began to deteriorate in earnest in late April when Greece appeared headed for default and pressures mounted on the banking systems of other European nations. In addition, U.S. economic data proved disappointing, and investors reacted cautiously to a contentious debate regarding U.S. government spending and borrowing. Financial markets suffered bouts of heightened volatility when newly risk-averse investors shifted their focus to markets that historically have held up well under uncertain economic conditions.The flight to quality also lifted currencies that traditionally have been considered safe havens, including the U.S. dollar and Japanese yen. Market volatility was particularly severe in August and September, after a major credit-rating agency downgraded its assessment of long-term U.S. government debt. In contrast, markets rebounded strongly in October when some macroeconomic worries seemed to ease.
Quantitative Models Supported Relative Performance
The fund’s investment process proved relatively effective in this turbulent environment, as three of the four alpha sources we considered contributed positively to relative performance. Only the model designed to determine allocations between stocks and bonds produced a shortfall, primarily due to overweighted exposure to stocks during the third quarter of 2011. Models guiding equity and bond market selections produced stronger results.
Among stocks, the fund benefited later in the reporting period from overweighted exposure to Germany and short positions in Hong Kong and Japan. In the global bond market, positive results from a long position in U.S.Treasury securities were offset by a less successful short position in the German Bund.
The fund’s currency component produced mixed results, as the benefits of an overweighted position in the Australian dollar and a short
4
position in the Swiss franc were balanced by losses stemming from short positions in the Swedish krona and Canadian dollar.
Seeking Opportunities in Uncertain Markets
Until October, financial markets seemed to react more to macroeconomic developments than to their underlying fundamental strengths and weaknesses. Consequently, while our models continue to signal greater opportunities among stocks than bonds, we have limited the fund’s allocations to global equities in order to manage risks stemming from heightened volatility.
Our market selection models have identified what we believe to be attractive relative values among equities in Germany and the Netherlands, but stock markets in Asia appear less attractive to us. Sovereign bonds in the United States and Germany seem to offer good value, while U.K. gilts appear vulnerable to inflationary pressures. The fund also ended the reporting period with short positions in the euro and U.S. dollar, and long exposure to the Japanese yen and the Swedish krona.
November 15, 2011
| |
| | Investing in foreign companies involves special risks, including changes in currency rates, |
| | political, economic and social instability, a lack of comprehensive company information, |
| | differing auditing and legal standards, and less market liquidity. |
| | Equity securities are subject generally to market, market sector, market liquidity, issuer and |
| | investment style risks, among other factors, to varying degrees, all of which are more fully described |
| | in the fund’s prospectus. Bond securities are subject generally to interest rate, credit, liquidity, call, |
| | sector and market risks, to varying degrees, all of which are more fully described in the fund’s |
| | prospectus. |
| | Investments in foreign currencies are subject to the risk that those currencies will decline in value |
| | relative to the U.S. dollar, or, in the case of hedged positions, that the U.S. dollar will decline |
| | relative to the currency being hedged. |
| 1 | Total return includes reinvestment of dividends and any capital gains paid, and does not take into |
| | consideration the maximum initial sales charge in the case of Class A shares, or the applicable |
| | contingent deferred sales charge imposed on redemptions in the case of Class C shares. Had these |
| | charges been reflected, returns would have been lower. Past performance is no guarantee of future |
| | results. Share price, yield and investment return fluctuate such that upon redemption, fund shares |
| | may be worth more or less than their original cost. |
| 2 | SOURCE: FactSet – Reflects reinvestment of net dividends and, where applicable, capital gain |
| | distributions.The Morgan Stanley Capital International (MSCI) World Index is an unmanaged |
| | index of global stock market performance, including the United States, Canada, Europe,Australia, |
| | New Zealand and the Far East.The Citigroup World Government Bond Index is a market- |
| | capitalization weighted index which includes select designated government bond markets of |
| | developed countries. Investors cannot invest directly in any index. |
The Fund 5
FUND PERFORMANCE

|
| † Source: FactSet |
| Past performance is not predictive of future performance. |
| The above graph compares a $10,000 investment made in Class A, Class C and Class I shares of Global Alpha Fund |
| on May 2, 2006 (inception date) to a $10,000 investment made on that date in each of the following: the Morgan |
| Stanley Capital International World Index (the “MSCI Index”) (half-hedged); the Citigroup World Government Bond |
| Index 1 + World Index (the “CWGB Index”) (half-hedged); and an unmanaged hybrid index composed of 60% |
| MSCI Index and 40% CWGB Index (the “Hybrid Index”). Returns assume all dividends and capital gain |
| distributions are reinvested. |
| The fund invests primarily in instruments that provide exposure to global equity, bond and currency markets.The fund’s |
| performance shown in the line graph above takes into account the maximum initial sales charge on Class A shares and |
| all other applicable fees and expenses on all classes.The MSCI Index (half-hedged) is an unmanaged index of global |
| stock market performance, including the United States, Canada,Australia, New Zealand and the Far East and includes |
| net dividends reinvested.The CWGB Index (half-hedged) is an unmanaged index that tracks the performance of 22 |
| government bond markets. Unlike a mutual fund, the indices are not subject to charges, fees and other expenses. Investors |
| cannot invest directly in any index. Further information relating to fund performance, including expense reimbursements, |
| if applicable, is contained in the Financial Highlights section of the prospectus and elsewhere in this report. |
6
| | | | | | | |
| Average Annual Total Returns as of 10/31/11 | | | | | | |
| |
| | Inception | | | | | From | |
| | Date | 1 | Year | 5 Years | | Inception | |
| Class A shares | | | | | | | |
| with maximum sales charge (5.75%) | 5/2/06 | –2.82 | % | –1.72 | % | –0.54% | |
| without sales charge | 5/2/06 | 3.07 | % | –0.55 | % | 0.54% | |
| Class C shares | | | | | | | |
| with applicable redemption charge † | 5/2/06 | 1.32 | % | –1.27 | % | –0.22% | |
| without redemption | 5/2/06 | 2.32 | % | –1.27 | % | –0.22% | |
| Class I shares | 5/2/06 | 3.50 | % | –0.19 | % | 0.88% | |
| Morgan Stanley Capital International | | | | | | | |
| World Index (half-hedged) | 4/30/06 | 1.07 | % | –1.54 | % | –0.59%†† | |
| Citigroup World Government | | | | | | | |
| Bond Index 1+ World Index | | | | | | | |
| (half-hedged) | 4/30/06 | 2.98 | % | 6.11 | % | 6.26%†† | |
| Hybrid Index | 4/30/06 | 2.19 | % | 1.93 | % | 2.54%†† | |
Past performance is not predictive of future performance.The fund’s performance shown in the graph and table does not reflect the deduction of taxes that a shareholder would pay on fund distributions or the redemption of fund shares.
| |
| † | The maximum contingent deferred sales charge for Class C shares is 1% for shares redeemed within one year of the |
| | date of purchase. |
| †† | For comparative purposes, the value of the Index as of 4/30/06 is used as the beginning value on 5/2/06. |
The Fund 7
UNDERSTANDING YOUR FUND’S EXPENSES (Unaudited)
As a mutual fund investor, you pay ongoing expenses, such as management fees and other expenses. Using the information below, you can estimate how these expenses affect your investment and compare them with the expenses of other funds.You also may pay one-time transaction expenses, including sales charges (loads) and redemption fees, which are not shown in this section and would have resulted in higher total expenses. For more information, see your fund’s prospectus or talk to your financial adviser.
Review your fund’s expenses
The table below shows the expenses you would have paid on a $1,000 investment in Global Alpha Fund from May 1, 2011 to October 31, 2011. It also shows how much a $1,000 investment would be worth at the close of the period, assuming actual returns and expenses.
Expenses and Value of a $1,000 Investment
assuming actual returns for the six months ended October 31, 2011
| | | | | | |
| | | Class A | | Class C | | Class I |
| Expenses paid per $1,000† | | $9.33 | | $13.03 | | $7.47 |
| Ending value (after expenses) | | $947.50 | | $944.10 | | $948.70 |
COMPARING YOUR FUND’S EXPENSES
WITH THOSE OF OTHER FUNDS (Unaudited)
Using the SEC’s method to compare expenses
The Securities and Exchange Commission (SEC) has established guidelines to help investors assess fund expenses. Per these guidelines, the table below shows your fund’s expenses based on a $1,000 investment, assuming a hypothetical 5% annualized return. You can use this information to compare the ongoing expenses (but not transaction expenses or total cost) of investing in the fund with those of other funds.All mutual fund shareholder reports will provide this information to help you make this comparison. Please note that you cannot use this information to estimate your actual ending account balance and expenses paid during the period.
Expenses and Value of a $1,000 Investment
assuming a hypothetical 5% annualized return for the six months ended October 31, 2011
| | | | | | |
| | | Class A | | Class C | | Class I |
| Expenses paid per $1,000† | | $ 9.65 | | $13.49 | | $ 7.73 |
| Ending value (after expenses) | | $ 1,015.63 | | $1,011.80 | | $ 1,017.54 |
|
| † Expenses are equal to the fund’s annualized expense ratio of 1.90% for Class A, 2.66% for Class C and |
| 1.52% for Class I, multiplied by the average account value over the period, multiplied by 184/365 (to reflect |
| the one-half year period). |
8
STATEMENT OF INVESTMENTS
October 31, 2011
| | | | |
| Common Stocks—59.6% | Shares | | | Value ($) |
| Australia—2.3% | | | | |
| AGL Energy | 1,031 | | | 15,647 |
| Alumina | 4,253 | | | 6,440 |
| Amcor | 2,269 | | | 16,737 |
| AMP | 5,759 | | | 25,797 |
| Asciano | 5,000 | | | 7,948 |
| ASX | 302 | | | 9,756 |
| Australia & New Zealand Banking Group | 5,125 | | | 116,357 |
| Bendigo and Adelaide Bank | 679 | | | 6,745 |
| BHP Billiton | 6,455 | | | 254,398 |
| BlueScope Steel | 3,664 | | | 3,226 |
| Boral | 1,114 | | | 4,581 |
| Brambles | 2,996 | | | 20,814 |
| Caltex Australia | 304 | | | 4,241 |
| CFS Retail Property Trust | 4,605 | | | 8,830 |
| Coca-Cola Amatil | 1,167 | | | 15,173 |
| Cochlear | 131 | | | 8,056 |
| Commonwealth Bank of Australia | 3,145 | | | 162,590 |
| Computershare | 633 | | | 5,041 |
| Crown | 793 | | | 6,665 |
| CSL | 1,096 | | | 33,042 |
| Dexus Property Group | 10,980 | | | 9,784 |
| Echo Entertainment Group | 1,233 | a | | 4,810 |
| Fairfax Media | 3,972 | | | 3,824 |
| Fortescue Metals Group | 2,325 | | | 11,656 |
| Foster’s Group | 4,115 | | | 23,222 |
| Goodman Group | 11,621 | | | 7,511 |
| GPT Group | 3,997 | | | 13,253 |
| Harvey Norman Holdings | 1,739 | | | 3,952 |
| Iluka Resources | 927 | | | 15,513 |
| Incitec Pivot | 3,663 | | | 13,161 |
| Insurance Australia Group | 3,514 | | | 11,559 |
| James Hardie Industries-CDI | 813 | a | | 5,290 |
| Leighton Holdings | 370 | | | 8,335 |
| Lend Lease Group | 956 | | | 7,727 |
| Lynas | 2,174 | a | | 2,588 |
| MacArthur Coal | 376 | | | 6,405 |
The Fund 9
STATEMENT OF INVESTMENTS (continued)
| | | |
| Common Stocks (continued) | Shares | | Value ($) |
| Australia (continued) | | | |
| Macquarie Group | 730 | | 18,571 |
| Map Group | 1,203 | | 4,325 |
| Metcash | 1,382 | | 6,075 |
| Mirvac Group | 8,029 | | 10,576 |
| National Australia Bank | 4,284 | | 115,115 |
| Newcrest Mining | 1,506 | | 53,407 |
| OneSteel | 2,718 | | 3,416 |
| Orica | 763 | | 20,621 |
| Origin Energy | 2,143 | | 32,391 |
| OZ Minerals | 594 | | 7,049 |
| Paladin Energy | 1,333 | a | 2,021 |
| Qantas Airways | 1,470 | a | 2,482 |
| QBE Insurance Group | 2,131 | | 32,926 |
| QR National | 3,288 | | 11,356 |
| Ramsay Health Care | 282 | | 5,564 |
| Rio Tinto | 857 | | 61,862 |
| Santos | 1,699 | | 22,736 |
| Sims Metal Management | 204 | | 2,959 |
| Sonic Healthcare | 650 | | 7,554 |
| SP Ausnet | 4,324 | | 4,539 |
| Stockland | 5,224 | | 17,184 |
| Suncorp Group | 2,676 | | 24,095 |
| TABCORP Holdings | 1,233 | | 3,820�� |
| Tatts Group | 3,183 | | 7,783 |
| Telstra | 8,702 | | 28,492 |
| Toll Holdings | 1,206 | | 6,070 |
| Transurban Group | 2,443 | | 13,472 |
| Wesfarmers | 1,979 | | 67,017 |
| Wesfarmers-PPS | 331 | | 11,403 |
| Westfield Group | 4,421 | | 35,791 |
| Westfield Retail Trust | 5,209 | | 13,890 |
| Westpac Banking | 5,930 | | 138,944 |
| Woodside Petroleum | 1,231 | | 46,638 |
| Woolworths | 2,391 | | 59,859 |
| WorleyParsons | 374 | | 10,895 |
| | | | 1,791,572 |
10
| | | |
| Common Stocks (continued) | Shares | | Value ($) |
| Austria—.1% | | | |
| Erste Group Bank | 335 | | 7,289 |
| IMMOFINANZ | 1,396 | a | 4,648 |
| OMV | 349 | | 12,303 |
| Raiffeisen Bank International | 116 | | 3,284 |
| Telekom Austria | 603 | | 6,922 |
| Verbund | 172 | | 5,046 |
| Vienna Insurance Group | 90 | | 3,812 |
| Voestalpine | 207 | | 7,218 |
| | | | 50,522 |
| Belgium—.2% | | | |
| Ageas | 3,624 | | 7,380 |
| Anheuser-Busch InBev | 1,588 | | 89,074 |
| Anheuser-Busch InBev (STRIP) | 1,224 | a | 2 |
| Bekaert | 38 | | 1,713 |
| Belgacom | 249 | | 7,613 |
| Colruyt | 135 | | 5,611 |
| Delhaize Group | 180 | | 11,885 |
| Dexia | 1,010 | a | 803 |
| Groupe Bruxelles Lambert | 183 | | 14,253 |
| Groupe Bruxelles Lambert (STRIP) | 31 | a | 0 |
| KBC Groep | 268 | | 6,067 |
| Mobistar | 79 | | 4,547 |
| Solvay | 127 | | 13,121 |
| UCB | 179 | | 7,964 |
| Umicore | 206 | | 8,940 |
| | | | 178,973 |
| Canada—3.1% | | | |
| Agnico-Eagle Mines | 400 | | 17,413 |
| Agrium | 300 | | 24,821 |
| Alimentation Couche Tard, Cl. B | 200 | | 6,041 |
| ARC Resources | 600 | | 15,313 |
| Athabasca Oil Sands | 720 | a | 9,373 |
| Bank of Montreal | 1,300 | | 77,077 |
| Bank of Nova Scotia | 2,120 | | 112,120 |
| Barrick Gold | 1,972 | | 97,702 |
| Baytex Energy | 192 | | 10,185 |
The Fund 11
STATEMENT OF INVESTMENTS (continued)
| | | |
| Common Stocks (continued) | Shares | | Value ($) |
| Canada (continued) | | | |
| BCE | 500 | | 19,889 |
| Bell Aliant | 189 | | 5,339 |
| Bombardier, Cl. B | 2,429 | | 10,075 |
| Bonavista Energy | 335 | | 8,654 |
| Brookfield Asset Management, Cl. A | 1,128 | | 32,753 |
| Brookfield Office Properties | 400 | | 6,588 |
| CAE | 500 | | 5,351 |
| Cameco | 826 | | 17,788 |
| Canadian Imperial Bank of Commerce | 800 | | 60,488 |
| Canadian National Railway | 907 | | 71,300 |
| Canadian Natural Resources | 2,200 | | 77,878 |
| Canadian Oil Sands | 939 | | 21,838 |
| Canadian Pacific Railway | 354 | | 21,958 |
| Canadian Tire, Cl. A | 135 | | 8,098 |
| Canadian Utilities, Cl. A | 200 | | 12,132 |
| Cenovus Energy | 1,499 | | 51,524 |
| Centerra Gold | 297 | | 5,909 |
| CGI Group, Cl. A | 427 | a | 8,770 |
| CI Financial | 300 | | 6,041 |
| Crescent Point Energy | 500 | | 21,430 |
| Eldorado Gold | 1,129 | | 21,290 |
| Empire, Cl. A | 100 | | 6,134 |
| Enbridge | 1,500 | | 52,147 |
| EnCana | 1,500 | | 32,650 |
| Enerplus | 305 | | 8,512 |
| Fairfax Financial Holdings | 44 | | 18,458 |
| Finning International | 296 | | 6,944 |
| First Quantum Minerals | 913 | | 19,221 |
| Fortis | 300 | | 10,179 |
| Franco-Nevada | 300 | | 11,927 |
| George Weston | 100 | | 6,956 |
| Gildan Activewear | 206 | | 5,334 |
| Goldcorp | 1,600 | | 78,127 |
| Great-West Lifeco | 500 | | 11,170 |
| Husky Energy | 600 | | 15,458 |
| IAMGOLD | 814 | | 17,563 |
12
| | | |
| Common Stocks (continued) | Shares | | Value ($) |
| Canada (continued) | | | |
| IGM Financial | 200 | | 8,666 |
| Imperial Oil | 628 | | 26,100 |
| Industrial Alliance Insurance & Financial Services | 200 | | 6,530 |
| Inmet Mining | 100 | | 5,990 |
| Intact Financial | 196 | | 10,976 |
| Ivanhoe Mines | 515 | a | 10,577 |
| Kinross Gold | 2,279 | | 32,605 |
| Loblaw | 200 | | 7,682 |
| Lululemon Athletica | 198 | a | 11,183 |
| Magna International | 471 | | 18,034 |
| Manulife Financial | 3,600 | | 47,698 |
| MEG Energy | 248 | a | 11,226 |
| Metro, Cl. A | 200 | | 9,834 |
| National Bank of Canada | 300 | | 21,487 |
| New Gold | 700 | a | 8,704 |
| Nexen | 1,079 | | 18,392 |
| Niko Resources | 80 | | 4,416 |
| Onex | 200 | | 6,655 |
| Open Text | 100 | a | 6,142 |
| Osisko Mining | 597 | a | 7,225 |
| Pacific Rubiales Energy | 600 | | 14,039 |
| Pan American Silver | 200 | | 5,608 |
| Pengrowth Energy | 600 | | 6,282 |
| Penn West Petroleum | 800 | | 14,345 |
| Potash Corporation of Saskatchewan | 1,689 | | 80,229 |
| Power Corporation of Canada | 800 | | 20,216 |
| Power Financial | 400 | | 10,833 |
| Precision Drilling | 400 | a | 4,655 |
| Progress Energy Resources | 300 | | 4,262 |
| Research In Motion | 960 | a | 19,485 |
| RioCan Real Estate Investment Trust | 200 | | 5,092 |
| Ritchie Bros. Auctioneers | 200 | | 3,995 |
| Rogers Communications, Cl. B | 900 | | 32,937 |
| Royal Bank of Canada | 2,900 | | 141,956 |
| Saputo | 249 | | 10,323 |
| Shaw Communications, Cl. B | 800 | | 16,262 |
The Fund 13
STATEMENT OF INVESTMENTS (continued)
| | | |
| Common Stocks (continued) | Shares | | Value ($) |
| Canada (continued) | | | |
| Shoppers Drug Mart | 468 | | 19,742 |
| Silver Wheaton | 673 | | 23,322 |
| Sino-Forest | 423 | a,b | 579 |
| SNC-Lavalin Group | 328 | | 16,541 |
| Sun Life Financial | 1,100 | | 27,864 |
| Suncor Energy | 3,094 | | 98,902 |
| Talisman Energy | 2,100 | | 29,896 |
| Teck Resources, Cl. B | 1,201 | | 48,318 |
| TELUS | 100 | | 5,399 |
| TELUS (Non-Voting Shares) | 300 | | 15,383 |
| Thomas Reuters | 800 | | 23,752 |
| Tim Hortons | 300 | | 14,818 |
| TMX Group | 200 | | 8,819 |
| Toronto-Dominion Bank | 1,800 | | 136,334 |
| Tourmaline Oil | 227 | | 7,574 |
| TransAlta | 400 | | 8,832 |
| TransCanada | 1,400 | | 59,721 |
| Valeant Pharmaceuticals International | 593 | | 23,499 |
| Vermillion Energy | 148 | | 6,997 |
| Viterra | 649 | | 6,704 |
| Yamana Gold | 1,600 | | 23,970 |
| | | | 2,443,525 |
| China—.0% | | | |
| Foxconn International Holdings | 7,000 | a | 4,693 |
| Yangzijiang Shipbuilding Holdings | 4,000 | | 2,962 |
| | | | 7,655 |
| Denmark—.3% | | | |
| AP Moller—Maersk, Cl. A | 1 | | 6,535 |
| AP Moller—Maersk, Cl. B | 3 | | 20,628 |
| Carlsberg, Cl. B | 234 | | 16,054 |
| Coloplast, Cl. B | 47 | | 6,921 |
| Danske Bank | 1,206 | a | 16,842 |
| DSV | 410 | | 8,354 |
| Novo Nordisk, Cl. B | 829 | | 89,355 |
| Novozymes, Cl. B | 81 | | 12,231 |
| Pandora | 66 | | 642 |
14
| | | | |
| Common Stocks (continued) | Shares | | | Value ($) |
| Denmark (continued) | | | | |
| TDC | 800 | | | 6,663 |
| Tryg | 63 | | | 3,552 |
| Vestas Wind Systems | 325 | a | | 5,139 |
| William Demant Holding | 49 | a | | 3,941 |
| | | | | 196,857 |
| Finland—.2% | | | | |
| Elisa | 324 | | | 6,901 |
| Fortum | 909 | | | 22,353 |
| Kesko, Cl. B | 161 | | | 5,785 |
| Kone, Cl. B | 325 | | | 18,105 |
| Metso | 231 | | | 9,067 |
| Neste Oil | 180 | | | 2,206 |
| Nokia | 7,711 | | | 52,378 |
| Nokian Renkaat | 166 | | | 6,147 |
| Orion, Cl. B | 239 | | | 5,024 |
| Outokumpu | 185 | | | 1,579 |
| Pohjola Bank, Cl. A | 426 | | | 4,970 |
| Rautaruukki | 107 | | | 1,154 |
| Sampo, Cl. A | 889 | | | 24,762 |
| Sanoma | 219 | | | 2,972 |
| Stora Enso, Cl. R | 1,052 | | | 6,747 |
| UPM-Kymmene | 1,165 | | | 13,779 |
| Wartsila | 304 | | | 9,358 |
| | | | | 193,287 |
| France—2.3% | | | | |
| Accor | 237 | | | 7,853 |
| Aeroports de Paris | 60 | | | 4,771 |
| Air France | 288 | a | | 2,213 |
| Air Liquide | 560 | | | 73,227 |
| Alcatel-Lucent | 5,032 | a | | 13,946 |
| Alstom | 429 | | | 16,216 |
| Arkema | 129 | | | 8,895 |
| Atos | 112 | | | 5,471 |
| AXA | 3,441 | | | 56,490 |
| BNP Paribas | 1,897 | | | 86,919 |
| Bouygues | 500 | | | 18,941 |
The Fund 15
STATEMENT OF INVESTMENTS (continued)
| | | |
| Common Stocks (continued) | Shares | | Value ($) |
| France (continued) | | | |
| Bureau Veritas | 111 | | 8,704 |
| Cap Gemini | 262 | | 10,130 |
| Carrefour | 1,168 | | 31,328 |
| Casino Guichard Perrachon | 98 | | 9,284 |
| Christian Dior | 98 | | 13,983 |
| Cie de St-Gobain | 828 | | 38,908 |
| Cie Generale d’Optique Essilor International | 381 | | 27,846 |
| Cie Generale de Geophysique-Veritas | 212 | a | 4,644 |
| Cie Generale des Etablissements Michelin, Cl. B | 375 | | 27,554 |
| CNP Assurances | 276 | | 4,262 |
| Credit Agricole | 1,825 | | 14,448 |
| Danone | 1,155 | | 81,033 |
| Dassault Systemes | 114 | | 9,695 |
| Edenred | 237 | | 6,777 |
| EDF | 506 | | 15,322 |
| Eiffage | 95 | | 3,262 |
| Eramet | 10 | | 1,590 |
| Eurazeo | 74 | | 3,580 |
| Eutelsat Communications | 173 | | 7,203 |
| Fonciere des Regions | 64 | | 4,767 |
| France Telecom | 3,681 | | 66,951 |
| GDF Suez | 2,454 | | 70,219 |
| Gecina | 42 | | 4,193 |
| Groupe Eurotunnel | 1,230 | | 11,230 |
| ICADE | 48 | | 4,353 |
| Iliad | 42 | | 4,955 |
| Imerys | 52 | | 3,006 |
| JC Decaux | 159 | a | 4,295 |
| Klepierre | 157 | | 4,952 |
| L’Oreal | 477 | | 53,099 |
| Lafarge | 420 | | 17,267 |
| Lagardere | 214 | | 5,811 |
| Legrand | 422 | | 15,106 |
| LVMH Moet Hennessy Louis Vuitton | 503 | | 84,365 |
| Metropole Television | 98 | | 1,698 |
| Natixis | 1,498 | | 4,839 |
16
| | | |
| Common Stocks (continued) | Shares | | Value ($) |
| France (continued) | | | |
| Neopost | 74 | | 5,691 |
| Pernod-Ricard | 400 | | 37,659 |
| Peugeot | 282 | | 6,244 |
| PPR | 156 | | 24,566 |
| Publicis Groupe | 208 | | 10,164 |
| Renault | 424 | | 18,005 |
| Safran | 286 | | 9,442 |
| Sanofi | 2,247 | | 162,848 |
| Schneider Electric | 966 | | 57,466 |
| SCOR | 300 | | 7,076 |
| Societe BIC | 49 | | 4,413 |
| Societe Generale | 1,276 | | 37,553 |
| Societe Television Francaise 1 | 223 | | 3,038 |
| Sodexo | 168 | | 12,258 |
| Suez Environnement | 631 | | 9,985 |
| Technip | 214 | | 20,512 |
| Thales | 168 | | 5,993 |
| Total | 4,270 | | 225,218 |
| Unibail-Rodamco | 184 | | 37,085 |
| Vallourec | 251 | | 15,397 |
| Veolia Environnement | 578 | | 8,284 |
| Vinci | 890 | | 44,317 |
| Vivendi | 2,466 | | 55,893 |
| Wendel | 72 | | 5,419 |
| | | | 1,800,127 |
| Germany—2.0% | | | |
| Adidas | 426 | | 30,398 |
| Allianz | 898 | | 101,718 |
| Axel Springer | 81 | | 3,308 |
| BASF | 1,811 | | 134,357 |
| Bayer | 1,634 | | 105,511 |
| Bayerische Motoren Werke | 662 | | 54,533 |
| Beiersdorf | 224 | | 13,055 |
| Brenntag | 50 | | 5,091 |
| Celesio | 112 | | 1,787 |
| Commerzbank | 7,389 | a | 18,376 |
The Fund 17
STATEMENT OF INVESTMENTS (continued)
| | | |
| Common Stocks (continued) | Shares | | Value ($) |
| Germany (continued) | | | |
| Continental | 156 | a | 11,791 |
| Daimler | 1,792 | | 92,481 |
| Deutsche Bank | 1,833 | | 77,582 |
| Deutsche Boerse | 410 | a | 22,875 |
| Deutsche Lufthansa | 560 | | 7,711 |
| Deutsche Post | 1,728 | | 26,536 |
| Deutsche Telekom | 5,567 | | 71,390 |
| E.ON | 3,570 | | 87,190 |
| Fraport Frankfurt Airport Services Worldwide | 66 | | 4,211 |
| Fresenius & Co. | 233 | | 23,175 |
| Fresenius Medical Care & Co. | 436 | | 32,091 |
| GEA Group | 268 | | 7,463 |
| Hannover Rueckversicherung | 81 | | 4,051 |
| HeidelbergCement | 234 | | 10,764 |
| Henkel & Co. | 267 | | 13,191 |
| Hochtief | 76 | | 5,596 |
| Infineon Technologies | 2,282 | | 20,781 |
| K+S | 361 | | 23,159 |
| Kabel Deutschland Holding | 209 | a | 12,028 |
| Lanxess | 155 | | 9,208 |
| Linde | 338 | | 54,192 |
| MAN | 110 | | 9,833 |
| Merck | 106 | | 9,995 |
| Metro | 278 | | 13,063 |
| Muenchener Rueckversicherungs | 376 | | 51,112 |
| RWE | 847 | | 36,558 |
| Salzgitter | 53 | | 3,026 |
| SAP | 1,819 | | 110,683 |
| Siemens | 1,658 | | 176,264 |
| Suedzucker | 90 | | 2,661 |
| ThyssenKrupp | 689 | | 20,042 |
| United Internet | 250 | | 4,974 |
| Volkswagen | 50 | | 7,936 |
| Wacker Chemie | 21 | | 2,141 |
| | | | 1,533,888 |
18
| | | |
| Common Stocks (continued) | Shares | | Value ($) |
| Greece—.0% | | | |
| Alpha Bank | 911 | a | 1,258 |
| Bank of Cyprus | 1,162 | | 1,621 |
| Coca-Cola Hellenic Bottling | 333 | a | 6,619 |
| EFG Eurobank Ergasias | 769 | a | 729 |
| Hellenic Telecommunications Organization | 542 | | 3,024 |
| National Bank of Greece | 2,049 | a | 4,916 |
| OPAP | 436 | | 5,108 |
| Public Power | 232 | | 2,009 |
| | | | 25,284 |
| Hong Kong—.7% | | | |
| AIA Group | 17,400 | | 52,507 |
| ASM Pacific Technology | 400 | | 4,396 |
| Bank of East Asia | 2,540 | | 9,190 |
| BOC Hong Kong Holdings | 6,500 | | 15,241 |
| Cathay Pacific Airways | 2,000 | | 3,601 |
| Cheung Kong Holdings | 3,000 | | 37,269 |
| Cheung Kong Infrastructure Holdings | 1,000 | | 5,351 |
| CLP Holdings | 4,000 | | 35,626 |
| Esprit Holdings | 2,162 | | 3,126 |
| Galaxy Entertainment Group | 3,000 | a | 5,850 |
| Hang Lung Group | 2,000 | | 12,172 |
| Hang Lung Properties | 5,000 | | 18,207 |
| Hang Seng Bank | 1,600 | | 20,617 |
| Henderson Land Development | 2,000 | | 10,822 |
| Hong Kong & China Gas | 10,470 | | 23,619 |
| Hong Kong Exchanges & Clearing | 2,100 | | 35,218 |
| Hopewell Holdings | 1,000 | | 2,584 |
| Hutchison Whampoa | 4,000 | | 36,564 |
| Hysan Development | 1,000 | | 3,499 |
| Kerry Properties | 1,500 | | 5,523 |
| Li & Fung | 12,000 | | 23,176 |
| Lifestyle International Holdings | 1,500 | | 4,016 |
| Link REIT | 4,000 | | 13,679 |
| MTR | 3,000 | | 9,642 |
| New World Development | 4,000 | | 4,215 |
The Fund 19
STATEMENT OF INVESTMENTS (continued)
| | | |
| Common Stocks (continued) | Shares | | Value ($) |
| Hong Kong (continued) | | | |
| NWS Holdings | 4,000 | | 6,075 |
| Orient Overseas International | 500 | | 2,258 |
| PCCW | 11,000 | | 4,372 |
| Power Assets Holdings | 3,000 | | 22,896 |
| Shangri-La Asia | 2,000 | | 3,990 |
| Sino Land | 4,000 | | 6,320 |
| SJM Holdings | 3,000 | | 5,076 |
| Sun Hung Kai Properties | 3,000 | | 40,919 |
| Swire Pacific, Cl. A | 1,500 | | 17,360 |
| Wharf Holdings | 3,200 | | 17,026 |
| Wheelock & Co | 2,000 | | 5,771 |
| Yue Yuen Industrial Holdings | 1,000 | | 2,834 |
| | | | 530,607 |
| Ireland—.1% | | | |
| CRH | 1,456 | | 26,573 |
| Elan | 1,004 | a | 11,931 |
| Irish Bank Resolution | 3,069 | a,b | 4 |
| Kerry Group, Cl. A | 260 | | 9,846 |
| | | | 48,354 |
| Israel—.2% | | | |
| Bank Hapoalim | 2,512 | | 9,833 |
| Bank Leumi Le-Israel | 2,777 | | 9,729 |
| Bezeq Israeli Telecommunication | 4,209 | | 8,975 |
| Cellcom Israel | 176 | | 3,904 |
| Israel | 7 | | 5,156 |
| Israel Chemicals | 945 | | 11,371 |
| Israel Discount Bank, Cl. A | 2,485 | a | 4,146 |
| Mizrahi Tefahot Bank | 424 | | 3,684 |
| NICE Systems | 136 | a | 4,881 |
| Teva Pharmaceutical Industries | 1,853 | | 75,909 |
| | | | 137,588 |
| Italy—.6% | | | |
| A2A | 1,653 | | 2,283 |
| Assicurazioni Generali | 2,346 | | 42,637 |
| Atlantia | 719 | | 11,082 |
| Autogrill | 352 | | 4,114 |
20
| | | |
| Common Stocks (continued) | Shares | | Value ($) |
| Italy (continued) | | | |
| Banca Carige | 966 | | 1,913 |
| Banca Monte dei Paschi di Siena | 6,557 | | 3,094 |
| Banco Popolare | 2,540 | | 3,826 |
| Enel | 13,089 | | 62,255 |
| Enel Green Power | 3,490 | | 8,090 |
| ENI | 4,748 | | 105,894 |
| EXOR | 146 | | 3,238 |
| Fiat | 1,272 | | 7,877 |
| Fiat Industrial | 1,272 | a | 11,186 |
| Finmeccanica | 723 | | 5,008 |
| Intesa Sanpaolo | 20,373 | | 36,685 |
| Intesa Sanpaolo-RSP | 2,248 | | 3,295 |
| Luxottica Group | 184 | | 5,479 |
| Mediaset | 1,052 | | 3,930 |
| Mediobanca | 844 | | 6,781 |
| Parmalat | 1,177 | | 2,641 |
| Pirelli & C | 735 | | 6,561 |
| Prysmian | 517 | | 7,896 |
| Saipem | 541 | | 24,449 |
| Snam Rete Gas | 3,371 | | 16,560 |
| Telecom Italia | 19,854 | | 24,909 |
| Telecom Italia-RSP | 13,412 | | 14,171 |
| Terna Rete Elettrica Nazionale | 2,144 | | 8,272 |
| UniCredit | 27,218 | | 32,193 |
| Unione di Banche Italiane | 1,956 | | 7,530 |
| | | | 473,849 |
| Japan—5.5% | | | |
| Advantest | 300 | | 3,498 |
| Aeon | 1,100 | | 14,484 |
| Aeon Credit Service | 300 | | 4,499 |
| AEON Mall | 200 | | 4,676 |
| Aisin Seiki | 300 | | 9,556 |
| Ajinomoto | 1,000 | | 11,213 |
| Alfresa Holdings | 100 | | 3,780 |
| All Nippon Airways | 2,000 | | 6,050 |
| Amada | 1,000 | | 6,607 |
The Fund 21
STATEMENT OF INVESTMENTS (continued)
| | |
| Common Stocks (continued) | Shares | Value ($) |
| Japan (continued) | | |
| Aozora Bank | 2,000 | 5,059 |
| Asahi Glass | 2,000 | 17,560 |
| Asahi Group Holdings | 700 | 14,398 |
| Asahi Kasei | 3,000 | 17,813 |
| Astellas Pharma | 900 | 32,925 |
| Bank of Kyoto | 1,000 | 8,521 |
| Bank of Yokohama | 3,000 | 13,781 |
| Benesse Holdings | 100 | 4,379 |
| Bridgestone | 1,200 | 28,147 |
| Brother Industries | 400 | 5,235 |
| Canon | 2,300 | 105,308 |
| Casio Computer | 600 | 3,689 |
| Central Japan Railway | 3 | 25,577 |
| Chiba Bank | 2,000 | 12,294 |
| Chubu Electric Power | 1,400 | 25,701 |
| Chugai Pharmaceutical | 400 | 6,277 |
| Chugoku Electric Power | 500 | 7,490 |
| Citizen Holdings | 400 | 2,125 |
| Coca-Cola West | 200 | 3,576 |
| Cosmo Oil | 1,000 | 2,498 |
| Credit Saison | 300 | 5,911 |
| Dai Nippon Printing | 1,000 | 10,498 |
| Dai-ichi Life Insurance | 17 | 19,312 |
| Daicel Chemical Industries | 1,000 | 5,691 |
| Daido Steel | 1,000 | 6,105 |
| Daiichi Sankyo | 1,400 | 27,296 |
| Daikin Industries | 400 | 11,881 |
| Dainippon Sumitomo Pharma | 400 | 4,391 |
| Daito Trust Construction | 200 | 17,809 |
| Daiwa House Industry | 1,000 | 12,463 |
| Daiwa Securities Group | 3,000 | 10,524 |
| Dena | 200 | 8,717 |
| Denki Kagaku Kogyo | 1,000 | 3,823 |
| Denso | 1,000 | 30,962 |
| Dentsu | 300 | 9,143 |
| East Japan Railway | 700 | 42,619 |
22
| | | |
| Common Stocks (continued) | Shares | | Value ($) |
| Japan (continued) | | | |
| Eisai | 500 | | 19,925 |
| Electric Power Development | 200 | | 4,996 |
| Elpida Memory | 300 | a | 1,883 |
| FamilyMart | 100 | | 3,949 |
| FANUC | 400 | | 64,760 |
| Fast Retailing | 100 | | 18,010 |
| Fuji Electric | 2,000 | | 5,840 |
| Fuji Heavy Industries | 1,000 | | 6,403 |
| FUJIFILM Holdings | 1,000 | | 24,587 |
| Fujitsu | 4,000 | | 21,419 |
| Fukuoka Financial Group | 2,000 | | 7,764 |
| Furukawa Electric | 1,000 | | 2,805 |
| Gree | 200 | | 6,540 |
| GS Yuasa | 1,000 | | 5,212 |
| Gunma Bank | 1,000 | | 5,157 |
| Hachijuni Bank | 1,000 | | 5,573 |
| Hakuhodo DY Holdings | 70 | | 3,815 |
| Hamamatsu Photonics | 100 | | 3,823 |
| Hino Motors | 1,000 | | 5,942 |
| Hirose Electric | 100 | | 9,624 |
| Hiroshima Bank | 1,000 | | 4,463 |
| Hisamitsu Pharmaceutical | 100 | | 4,040 |
| Hitachi | 9,000 | | 48,432 |
| Hitachi Chemical | 200 | | 3,582 |
| Hitachi Construction Machinery | 200 | | 3,856 |
| Hitachi High-Technologies | 200 | | 4,192 |
| Hokkaido Electric Power | 300 | | 3,789 |
| Hokuhoku Financial Group | 3,000 | | 5,621 |
| Hokuriku Electric Power | 300 | | 4,810 |
| Honda Motor | 3,200 | | 96,707 |
| Hoya | 900 | | 19,795 |
| Ibiden | 200 | | 4,399 |
| Idemitsu Kosan | 100 | | 9,337 |
| IHI | 3,000 | | 6,854 |
| INPEX | 4 | | 26,385 |
| Isetan Mitsukoshi Holdings | 680 | | 6,961 |
The Fund 23
STATEMENT OF INVESTMENTS (continued)
| | |
| Common Stocks (continued) | Shares | Value ($) |
| Japan (continued) | | |
| Isuzu Motors | 2,000 | 8,528 |
| ITOCHU | 2,800 | 27,688 |
| Itochu Techno-Solutions | 100 | 4,337 |
| Iyo Bank | 1,000 | 9,402 |
| J Front Retailing | 1,200 | 5,307 |
| Japan Real Estate Investment | 1 | 8,582 |
| Japan Retail Fund Investment | 4 | 6,257 |
| Japan Steel Works | 1,000 | 6,858 |
| Japan Tobacco | 9 | 45,238 |
| JFE Holdings | 800 | 15,114 |
| Joyo Bank | 1,000 | 4,199 |
| JS Group | 600 | 12,590 |
| JSR | 300 | 5,741 |
| JTEKT | 300 | 3,308 |
| Jupiter Telecommunications | 3 | 2,939 |
| JX Holdings | 4,540 | 26,486 |
| Kajima | 2,000 | 6,401 |
| Kamigumi | 1,000 | 8,736 |
| Kaneka | 1,000 | 5,433 |
| Kansai Electric Power | 1,500 | 22,256 |
| Kansai Paint | 1,000 | 9,432 |
| Kao | 1,100 | 28,914 |
| Kawasaki Heavy Industries | 2,000 | 5,134 |
| Kawasaki Kisen Kaisha | 1,000 | 2,041 |
| KDDI | 6 | 44,010 |
| Keikyu | 1,000 | 9,020 |
| Keio | 1,000 | 6,888 |
| Keisei Electric Railway | 1,000 | 6,773 |
| Keyence | 110 | 28,052 |
| Kintetsu | 3,000 | 10,555 |
| Kirin Holdings | 2,000 | 24,573 |
| Kobe Steel | 4,000 | 6,695 |
| Komatsu | 1,900 | 46,905 |
| Konami | 200 | 6,563 |
| Konica Minolta Holdings | 1,000 | 7,303 |
| Kubota | 2,000 | 16,493 |
24
| | | |
| Common Stocks (continued) | Shares | | Value ($) |
| Japan (continued) | | | |
| Kuraray | 800 | | 11,230 |
| Kurita Water Industries | 200 | | 5,530 |
| Kyocera | 300 | | 26,487 |
| Kyowa Hakko Kirin | 371 | | 4,200 |
| Kyushu Electric Power | 900 | | 11,977 |
| Lawson | 100 | | 5,661 |
| Makita | 200 | | 7,481 |
| Marubeni | 3,000 | | 17,420 |
| Marui Group | 600 | | 4,708 |
| Mazda Motor | 3,000 | a | 6,360 |
| McDonald’s Holdings Japan | 200 | | 5,304 |
| Medipal Holdings | 500 | | 4,675 |
| MEIJI Holdings | 117 | | 5,156 |
| Minebea | 1,000 | | 3,575 |
| Miraca Holdings | 100 | | 3,813 |
| Mitsubishi | 2,700 | | 55,724 |
| Mitsubishi Chemical Holdings | 3,000 | | 18,284 |
| Mitsubishi Electric | 4,000 | | 36,929 |
| Mitsubishi Estate | 3,000 | | 50,949 |
| Mitsubishi Gas Chemical | 1,000 | | 6,541 |
| Mitsubishi Heavy Industries | 6,000 | | 24,581 |
| Mitsubishi Materials | 2,000 | | 5,346 |
| Mitsubishi Motors | 9,000 | a | 11,976 |
| Mitsubishi Tanabe Pharma | 400 | | 6,958 |
| Mitsubishi UFJ Financial Group | 25,060 | | 108,847 |
| Mitsubishi UFJ Lease & Finance | 120 | | 4,660 |
| Mitsui & Co. | 3,400 | | 49,742 |
| Mitsui Chemicals | 2,000 | | 6,612 |
| Mitsui Engineering & Shipbuilding | 2,000 | | 3,203 |
| Mitsui Fudosan | 2,000 | | 33,165 |
| Mitsui OSK Lines | 2,000 | | 7,746 |
| Mizuho Financial Group | 46,300 | | 65,106 |
| MS&AD Insurance Group Holdings | 1,090 | | 21,490 |
| Murata Manufacturing | 400 | | 22,331 |
| Nabtesco | 200 | | 4,380 |
| Namco Bandai Holdings | 500 | | 7,305 |
The Fund 25
STATEMENT OF INVESTMENTS (continued)
| | | |
| Common Stocks (continued) | Shares | | Value ($) |
| Japan (continued) | | | |
| NEC | 6,000 | a | 13,469 |
| NGK Insulators | 1,000 | | 11,554 |
| Nidec | 200 | | 16,503 |
| Nikon | 700 | | 15,753 |
| Nintendo | 200 | | 30,329 |
| Nippon Building Fund | 1 | | 9,718 |
| Nippon Electric Glass | 1,000 | | 8,939 |
| Nippon Express | 2,000 | | 7,776 |
| Nippon Meat Packers | 1,000 | | 12,528 |
| Nippon Paper Group | 200 | | 4,610 |
| Nippon Sheet Glass | 1,000 | | 2,159 |
| Nippon Steel | 10,000 | | 26,198 |
| Nippon Telegraph & Telephone | 1,000 | | 51,257 |
| Nippon Yusen | 3,000 | | 7,612 |
| Nishi-Nippon City Bank | 2,000 | | 5,463 |
| Nissan Motor | 5,100 | | 47,109 |
| Nisshin Seifun Group | 500 | | 6,169 |
| Nisshin Steel | 2,000 | | 3,173 |
| Nissin Foods Holdings | 100 | | 3,850 |
| Nitori Holdings | 100 | | 9,590 |
| Nitto Denko | 300 | | 12,660 |
| NKSJ Holdings | 725 | | 14,614 |
| NOK | 300 | | 5,145 |
| Nomura Holdings | 7,100 | | 27,051 |
| Nomura Real Estate Holdings | 300 | | 4,866 |
| Nomura Real Estate Office Fund | 1 | | 5,380 |
| Nomura Research Institute | 200 | | 4,529 |
| NSK | 1,000 | | 7,575 |
| NTN | 1,000 | | 4,425 |
| NTT Data | 2 | | 6,734 |
| NTT DoCoMo | 30 | | 53,130 |
| Obayashi | 1,000 | | 4,565 |
| Odakyu Electric Railway | 1,000 | | 9,409 |
| OJI Paper | 2,000 | | 9,937 |
| Olympus | 500 | | 7,636 |
| Omron | 400 | | 8,589 |
26
| | |
| Common Stocks (continued) | Shares | Value ($) |
| Japan (continued) | | |
| Ono Pharmaceutical | 200 | 10,497 |
| ORACLE JAPAN | 100 | 3,456 |
| Oriental Land | 100 | 9,986 |
| ORIX | 210 | 18,397 |
| Osaka Gas | 4,000 | 15,198 |
| Otsuka Holdings | 400 | 10,325 |
| Panasonic | 4,400 | 44,946 |
| Rakuten | 15 | 16,529 |
| Resona Holdings | 3,800 | 17,020 |
| Ricoh | 1,000 | 8,225 |
| Rinnai | 100 | 7,493 |
| Rohm | 200 | 10,215 |
| Sankyo | 100 | 5,240 |
| Santen Pharmaceutical | 100 | 3,739 |
| SBI Holdings | 44 | 3,666 |
| Secom | 400 | 19,039 |
| Sega Sammy Holdings | 500 | 10,914 |
| Seiko Epson | 300 | 3,985 |
| Sekisui Chemical | 1,000 | 7,861 |
| Sekisui House | 1,000 | 8,928 |
| Seven & I Holdings | 1,500 | 40,222 |
| Seven Bank | 1 | 1,791 |
| Sharp | 2,000 | 18,501 |
| Shikoku Electric Power | 300 | 7,688 |
| Shimadzu | 1,000 | 8,559 |
| Shimamura | 100 | 10,043 |
| Shimano | 200 | 9,926 |
| Shimizu | 1,000 | 4,272 |
| Shin-Etsu Chemical | 800 | 41,199 |
| Shinsei Bank | 4,000 | 4,422 |
| Shionogi & Co. | 500 | 6,813 |
| Shiseido | 800 | 14,692 |
| Shizuoka Bank | 1,000 | 9,768 |
| Showa Denko | 3,000 | 5,492 |
| Showa Shell Sekiyu | 500 | 3,625 |
| SMC | 100 | 15,622 |
The Fund 27
STATEMENT OF INVESTMENTS (continued)
| | | |
| Common Stocks (continued) | Shares | | Value ($) |
| Japan (continued) | | | |
| Softbank | 1,700 | | 55,452 |
| Sojitz | 2,900 | | 4,967 |
| Sony | 2,000 | | 42,166 |
| Sony Financial Holdings | 200 | | 3,314 |
| Square Enix Holdings | 200 | | 3,815 |
| Stanley Electric | 300 | | 4,393 |
| Sumco | 200 | a | 2,018 |
| Sumitomo | 2,300 | | 28,604 |
| Sumitomo Chemical | 3,000 | | 11,145 |
| Sumitomo Electric Industries | 1,300 | | 14,539 |
| Sumitomo Heavy Industries | 1,000 | | 5,656 |
| Sumitomo Metal Industries | 6,000 | | 11,331 |
| Sumitomo Metal Mining | 1,000 | | 13,814 |
| Sumitomo Mitsui Financial Group | 2,600 | | 72,676 |
| Sumitomo Mitsui Trust Holdings | 5,980 | | 20,476 |
| Sumitomo Realty & Development | 1,000 | | 20,792 |
| Sumitomo Rubber Industries | 400 | | 4,997 |
| Suzuken | 100 | | 2,403 |
| Suzuki Motor | 600 | | 12,828 |
| Sysmex | 200 | | 6,604 |
| T&D Holdings | 1,300 | | 12,902 |
| Taisei | 2,000 | | 5,345 |
| Taiyo Nippon Sanso | 1,000 | | 7,186 |
| Takashimaya | 1,000 | | 7,140 |
| Takeda Pharmaceutical | 1,600 | | 72,382 |
| TDK | 200 | | 8,198 |
| Teijin | 2,000 | | 7,017 |
| Terumo | 300 | | 15,271 |
| THK | 200 | | 3,890 |
| Tobu Railway | 2,000 | | 9,600 |
| Toho | 200 | | 3,465 |
| Toho Gas | 1,000 | | 5,685 |
| Tohoku Electric Power | 1,000 | | 11,073 |
| Tokio Marine Holdings | 1,400 | | 33,409 |
| Tokyo Electric Power | 3,000 | a | 10,899 |
| Tokyo Electron | 300 | | 16,061 |
| Tokyo Gas | 5,000 | | 21,533 |
28
| | | |
| Common Stocks (continued) | Shares | | Value ($) |
| Japan (continued) | | | |
| Tokyu | 2,000 | | 9,702 |
| Tokyu Land | 1,000 | | 4,219 |
| TonenGeneral Sekiyu | 1,000 | | 11,307 |
| Toppan Printing | 1,000 | | 7,789 |
| Toray Industries | 3,000 | | 21,398 |
| Toshiba | 8,000 | | 35,323 |
| Tosoh | 1,000 | | 3,261 |
| TOTO | 1,000 | | 8,293 |
| Toyo Seikan Kaisha | 300 | | 4,568 |
| Toyoda Gosei | 200 | | 3,564 |
| Toyota Industries | 300 | | 8,505 |
| Toyota Motor | 5,500 | | 184,380 |
| Toyota Tsusho | 400 | | 6,324 |
| Trend Micro | 300 | | 10,764 |
| Tsumura & Co. | 100 | | 2,826 |
| Ube Industries | 2,000 | | 5,899 |
| UNICHARM | 200 | | 9,007 |
| Ushio | 200 | | 2,983 |
| USS | 60 | | 4,978 |
| West Japan Railway | 300 | | 12,750 |
| Yahoo! Japan | 24 | | 7,764 |
| Yakult Honsha | 200 | | 5,688 |
| Yamada Denki | 140 | | 10,116 |
| Yamaguchi Financial Group | 1,000 | | 8,935 |
| Yamaha | 400 | | 4,070 |
| Yamaha Motor | 400 | a | 5,726 |
| Yamato Holdings | 700 | | 11,634 |
| Yaskawa Electric | 1,000 | | 8,743 |
| Yokogawa Electric | 400 | a | 3,785 |
| | | | 4,220,959 |
| Luxembourg—.1% | | | |
| ArcelorMittal | 1,598 | | 33,500 |
| Millicom International | | | |
| Cellular, SDR | 159 | | 17,668 |
| SES | 651 | | 16,798 |
| Tenaris | 794 | | 12,791 |
| | | | 80,757 |
The Fund 29
STATEMENT OF INVESTMENTS (continued)
| | | |
| Common Stocks (continued) | Shares | | Value ($) |
| Macau—.0% | | | |
| Sands China | 5,200 | a | 15,307 |
| Wynn Macau | 3,200 | | 8,792 |
| | | | 24,099 |
| Netherlands—.7% | | | |
| Aegon | 3,776 | a | 18,302 |
| Akzo Nobel | 476 | | 25,372 |
| ASML Holding | 875 | | 36,943 |
| Corio | 129 | | 6,639 |
| Delta Lloyd | 221 | | 3,941 |
| European Aeronautic Defence and Space | 862 | | 25,693 |
| Fugro | 121 | | 7,212 |
| Heineken | 490 | | 23,996 |
| Heineken Holding | 247 | | 10,692 |
| ING Groep | 7,551 | a | 65,931 |
| Koninklijke Ahold | 2,421 | | 31,286 |
| Koninklijke Boskalis Westminster | 92 | | 3,259 |
| Koninklijke DSM | 277 | | 14,380 |
| Koninklijke KPN | 3,150 | | 41,722 |
| Koninklijke Philips Electronics | 1,982 | | 41,730 |
| Koninklijke Vopak | 176 | | 9,181 |
| PostNL | 628 | | 3,224 |
| QIAGEN | 398 | a | 5,590 |
| Randstad Holding | 180 | | 6,471 |
| Reed Elsevier | 1,224 | | 15,215 |
| SBM Offshore | 365 | | 8,146 |
| STMicroelectronics | 1,054 | | 7,351 |
| TNT Express | 628 | | 5,407 |
| Unilever | 3,215 | | 111,972 |
| Wolters Kluwer | 545 | | 9,734 |
| | | | 539,389 |
| New Zealand—.0% | | | |
| Auckland International Airport | 2,415 | | 4,576 |
| Contact Energy | 460 | a | 2,081 |
| Fletcher Building | 1,409 | | 7,537 |
| Sky City Entertainment Group | 1,940 | | 5,533 |
| Telecom Corporation of New Zealand | 4,764 | | 9,818 |
| | | | 29,545 |
30
| | | | |
| Common Stocks (continued) | Shares | | | Value ($) |
| Norway—.2% | | | | |
| Aker Solutions | 268 | | | 3,147 |
| DnB NOR | 1,894 | | | 22,308 |
| Gjensidige Forsikring | 483 | | | 5,360 |
| Norsk Hydro | 1,845 | | | 9,726 |
| Orkla | 1,726 | | | 15,180 |
| Renewable Energy | 600 | a | | 589 |
| SeaDrill | 588 | | | 19,630 |
| Statoil | 2,225 | | | 57,335 |
| Telenor | 1,391 | | | 25,073 |
| Yara International | 337 | | | 16,207 |
| | | | | 174,555 |
| Portugal—.1% | | | | |
| Banco Comercial Portugues, Cl. R | 5,684 | a | | 1,229 |
| Banco Espirito Santo | 905 | | | 1,982 |
| Cimpor-Cimentos de Portugal | 565 | | | 4,246 |
| Energias de Portugal | 4,216 | | | 13,437 |
| Galp Energia, Cl. B | 600 | | | 12,536 |
| Jeronimo Martins | 521 | | | 9,084 |
| Portugal Telecom | 1,514 | | | 10,981 |
| | | | | 53,495 |
| Singapore—.5% | | | | |
| Ascendas Real Estate Investment Trust | 3,400 | | | 5,544 |
| CapitaLand | 4,500 | | | 9,705 |
| CapitaMall Trust | 4,000 | | | 5,936 |
| Capitamalls Asia | 4,000 | | | 4,317 |
| City Developments | 1,000 | | | 8,665 |
| ComfortDelgro | 5,000 | | | 5,557 |
| Cosco Singapore | 3,000 | | | 2,400 |
| DBS Group Holdings | 3,500 | | | 34,228 |
| Flextronics International | 1,406 | a | | 9,230 |
| Fraser and Neave | 2,000 | | | 9,746 |
| Genting Singapore | 13,000 | a | | 17,795 |
| Global Logistic Properties | 4,150 | | | 5,796 |
| Golden Agri-Resources | 12,640 | | | 6,421 |
| Hutchison Port Holdings Trust | 9,000 | | | 5,951 |
| Keppel | 3,200 | | | 23,971 |
| Keppel Land | 1,000 | | | 2,209 |
The Fund 31
STATEMENT OF INVESTMENTS (continued)
| | | | |
| Common Stocks (continued) | Shares | | | Value ($) |
| Singapore (continued) | | | | |
| Noble Group | 7,636 | | | 9,321 |
| Olam International | 3,045 | | | 6,103 |
| Oversea-Chinese Banking | 5,000 | | | 33,502 |
| SembCorp Industries | 2,000 | | | 6,604 |
| SembCorp Marine | 2,000 | | | 6,632 |
| Singapore Airlines | 866 | | | 8,032 |
| Singapore Exchange | 2,000 | | | 10,713 |
| Singapore Press Holdings | 3,000 | | | 9,302 |
| Singapore Technologies Engineering | 4,000 | | | 8,982 |
| Singapore Telecommunications | 15,000 | | | 38,089 |
| StarHub | 2,000 | | | 4,490 |
| United Overseas Bank | 3,000 | | | 40,759 |
| UOL Group | 1,000 | | | 3,538 |
| Wilmar International | 4,000 | | | 17,214 |
| | | | | 360,752 |
| Spain—.9% | | | | |
| Abertis Infraestructuras | 752 | | | 12,518 |
| Acciona | 39 | | | 3,733 |
| Acerinox | 192 | | | 2,576 |
| ACS Actividades de Construccion y Servicios | 261 | | | 9,993 |
| Amadeus IT Holding, Cl. A | 676 | | | 12,880 |
| Banco Bilbao Vizcaya Argentaria | 8,556 | | | 78,310 |
| Banco de Sabadell | 2,636 | | | 9,596 |
| Banco Popular Espanol | 1,664 | | | 7,731 |
| Banco Santander | 16,614 | | | 143,141 |
| Bankia | 1,979 | | | 10,089 |
| Bankinter | 357 | | | 2,216 |
| CaixaBank | 1,838 | | | 9,086 |
| Distribuidora Internacional de Alimentacion | 986 | a | | 4,545 |
| EDP Renovaveis | 522 | a | | 3,160 |
| Enagas | 438 | | | 8,718 |
| Ferrovial | 725 | | | 9,303 |
| Fomento de Construcciones y Contratas | 161 | | | 4,217 |
| Gas Natural SDG | 675 | | | 12,696 |
| Grifols | 170 | a | | 3,198 |
| Iberdrola | 7,862 | | | 57,659 |
32
| | |
| Common Stocks (continued) | Shares | Value ($) |
| Spain (continued) | | |
| Inditex | 451 | 41,367 |
| Indra Sistemas | 130 | 2,205 |
| Mapfre | 1,615 | 5,994 |
| Mediaset Espana Comunicacion | 537 | 3,595 |
| Red Electrica | 248 | 12,098 |
| Repsol | 1,633 | 49,882 |
| Telefonica | 8,274 | 177,494 |
| Zardoya Otis | 186 | 2,535 |
| | | 700,535 |
| Sweden—.8% | | |
| Alfa Laval | 650 | 12,274 |
| Assa Abloy, Cl. B | 691 | 17,002 |
| Atlas Copco, Cl. A | 1,364 | 30,102 |
| Atlas Copco, Cl. B | 708 | 13,950 |
| Autoliv | 210 | 12,132 |
| Boliden | 378 | 5,448 |
| Electrolux, Ser. B | 407 | 7,667 |
| Getinge, Cl. B | 363 | 9,510 |
| Hennes & Mauritz, Cl. B | 2,033 | 67,881 |
| Hexagon, Cl. B | 485 | 7,546 |
| Holmen, Cl. B | 75 | 2,143 |
| Husqvarna, Cl. B | 673 | 3,450 |
| Industrivarden, Cl. C | 308 | 3,889 |
| Investor, Cl. B | 962 | 19,058 |
| Kinnevik Investment, Cl. B | 358 | 7,580 |
| Modern Times Group, Cl. B | 68 | 3,637 |
| Nordea Bank | 5,276 | 48,671 |
| Ratos, Cl. B | 334 | 4,504 |
| Sandvik | 2,059 | 28,706 |
| Scania, Cl. B | 520 | 8,846 |
| Securitas, Cl. B | 706 | 6,518 |
| Skandinaviska Enskilda Banken, Cl. A | 2,519 | 16,039 |
| Skanska, Cl. B | 905 | 14,976 |
| SKF, Cl. B | 823 | 18,532 |
| SSAB, Cl. A | 326 | 3,191 |
| Svenska Cellulosa, Cl. B | 1,254 | 18,482 |
The Fund 33
STATEMENT OF INVESTMENTS (continued)
| | | |
| Common Stocks (continued) | Shares | | Value ($) |
| Sweden (continued) | | | |
| Svenska Handelsbanken, Cl. A | 997 | | 28,972 |
| Swedbank, Cl. A | 1,505 | | 21,378 |
| Swedish Match | 411 | | 14,340 |
| Tele2, Cl. B | 581 | | 12,364 |
| Telefonaktiebolaget LM Ericsson, Cl. B | 5,930 | | 62,454 |
| TeliaSonera | 4,298 | | 30,211 |
| Volvo, Cl. B | 2,882 | | 36,392 |
| | | | 597,845 |
| Switzerland—2.2% | | | |
| ABB | 4,337 | a | 83,274 |
| Actelion | 178 | a | 6,678 |
| Adecco | 300 | a | 14,611 |
| Aryzta | 202 | | 9,847 |
| Baloise Holding | 91 | | 7,508 |
| Cie Financiere Richemont, Cl. A | 1,040 | | 60,014 |
| Credit Suisse Group | 2,221 | a | 65,294 |
| GAM Holding | 436 | a | 5,282 |
| Geberit | 85 | a | 17,619 |
| Givaudan | 17 | a | 15,657 |
| Holcim | 498 | a | 32,026 |
| Julius Baer Group | 371 | a | 14,204 |
| Kuehne & Nagel International | 100 | | 12,552 |
| Lindt & Spruengli-PC | 3 | | 9,343 |
| Lonza Group | 82 | a | 5,518 |
| Nestle | 6,948 | | 406,124 |
| Novartis | 4,687 | | 267,021 |
| Pargesa Holding-BR | 64 | | 5,060 |
| Roche Holding | 1,412 | | 234,631 |
| Schindler Holding | 48 | | 5,694 |
| Schindler Holding-PC | 85 | | 10,074 |
| SGS | 12 | | 20,808 |
| Sika-BR | 5 | | 9,916 |
| Sonova Holding | 118 | a | 12,670 |
| Straumann Holding | 19 | | 3,382 |
| Sulzer | 31 | | 3,667 |
| Swatch Group | 75 | | 5,611 |
34
| | | | |
| Common Stocks (continued) | Shares | | | Value ($) |
| Switzerland (continued) | | | | |
| Swatch Group-BR | 63 | | | 26,884 |
| Swiss Life Holding | 58 | a | | 7,247 |
| Swiss Re | 730 | a | | 40,432 |
| Swisscom | 42 | | | 17,108 |
| Syngenta | 189 | a | | 58,276 |
| Synthes | 123 | c | | 20,792 |
| Transocean | 600 | | | 34,451 |
| UBS | 7,193 | a | | 92,597 |
| Zurich Financial Services | 287 | a | | 67,169 |
| | | | | 1,709,041 |
| United Kingdom—5.9% | | | | |
| 3i Group | 1,736 | | | 5,761 |
| Admiral Group | 331 | | | 6,299 |
| Aggreko | 475 | | | 13,126 |
| AMEC | 595 | | | 8,888 |
| Anglo American | 2,610 | | | 96,621 |
| Antofagasta | 731 | | | 13,770 |
| ARM Holdings | 2,837 | | | 26,765 |
| Associated British Foods | 591 | | | 10,551 |
| AstraZeneca | 2,784 | | | 134,181 |
| Aviva | 5,997 | | | 32,989 |
| Babcock International Group | 857 | | | 9,745 |
| BAE Systems | 6,925 | | | 30,917 |
| Balfour Beatty | 1,187 | | | 4,826 |
| Barclays | 22,832 | | | 71,974 |
| BG Group | 6,670 | | | 146,042 |
| BHP Billiton | 4,320 | | | 137,192 |
| BP | 37,926 | | | 282,208 |
| British American Tobacco | 3,927 | | | 181,568 |
| British Land | 1,615 | | | 13,308 |
| British Sky Broadcasting Group | 2,397 | | | 27,238 |
| BT Group | 15,983 | | | 48,526 |
| Bunzl | 499 | | | 6,492 |
| Burberry Group | 776 | | | 16,797 |
| Cairn Energy | 3,083 | a | | 14,660 |
| Capita Group | 1,353 | | | 15,866 |
The Fund 35
STATEMENT OF INVESTMENTS (continued)
| | | | |
| Common Stocks (continued) | Shares | | | Value ($) |
| United Kingdom (continued) | | | | |
| Capital Shopping Centres Group | 773 | | | 4,109 |
| Carnival | 420 | | | 15,477 |
| Centrica | 10,295 | | | 49,303 |
| Cobham | 2,046 | | | 5,944 |
| Compass Group | 3,941 | | | 36,004 |
| Diageo | 4,954 | | | 103,072 |
| Essar Energy | 227 | a | | 1,127 |
| Eurasian Natural Resources | 384 | | | 4,078 |
| Experian | 1,944 | | | 25,432 |
| Fresnillo | 386 | | | 10,579 |
| G4S | 2,575 | | | 10,150 |
| GKN | 2,473 | | | 7,596 |
| GlaxoSmithKline | 10,372 | | | 234,380 |
| Glencore International | 1,647 | | | 11,644 |
| Hammerson | 1,232 | | | 8,095 |
| HSBC Holdings | 35,777 | | | 314,667 |
| ICAP | 931 | | | 6,073 |
| Imperial Tobacco Group | 2,009 | | | 73,740 |
| Inmarsat | 794 | | | 6,013 |
| Intercontinental Hotels Group | 460 | | | 8,531 |
| International Consolidated Airlines Group | 1,579 | a | | 4,224 |
| International Power | 3,211 | | | 17,528 |
| Intertek Group | 371 | | | 12,306 |
| Invensys | 1,440 | | | 5,241 |
| Investec | 662 | | | 4,043 |
| ITV | 8,986 | a | | 9,290 |
| J Sainsbury | 2,638 | | | 12,736 |
| Johnson Matthey | 385 | | | 11,677 |
| Kazakhmys | 315 | | | 4,716 |
| Kingfisher | 4,977 | | | 20,798 |
| Land Securities Group | 1,614 | | | 17,819 |
| Legal & General Group | 12,314 | | | 21,963 |
| Lloyds Banking Group | 80,921 | a | | 42,443 |
| London Stock Exchange Group | 302 | | | 4,387 |
| Lonmin | 237 | | | 4,162 |
| Man Group | 3,853 | | | 9,322 |
36
| | | |
| Common Stocks (continued) | Shares | | Value ($) |
| United Kingdom (continued) | | | |
| Marks & Spencer Group | 3,182 | | 16,533 |
| National Grid | 6,921 | | 68,982 |
| Next | 320 | | 13,202 |
| Old Mutual | 11,390 | | 20,223 |
| Pearson | 1,653 | | 30,550 |
| Petrofac | 592 | | 13,722 |
| Prudential | 5,089 | | 53,187 |
| Randgold Resources | 181 | | 19,852 |
| Reckitt Benckiser Group | 1,218 | | 62,872 |
| Reed Elsevier | 2,543 | | 21,939 |
| Resolution | 2,757 | | 12,238 |
| Rexam | 1,726 | | 9,642 |
| Rio Tinto | 2,877 | | 157,192 |
| Rolls-Royce Holdings | 3,514 | a | 39,845 |
| Royal Bank of Scotland Group | 38,719 | a | 15,143 |
| Royal Dutch Shell, Cl. A | 7,226 | | 257,297 |
| Royal Dutch Shell, Cl. B | 5,428 | | 195,860 |
| RSA Insurance Group | 6,348 | | 11,445 |
| SABMiller | 1,893 | | 69,406 |
| Sage Group | 2,356 | | 10,576 |
| Schroders | 205 | | 4,728 |
| Scottish & Southern Energy | 1,875 | | 40,675 |
| Segro | 1,292 | | 5,084 |
| Serco Group | 873 | | 7,320 |
| Severn Trent | 444 | | 10,865 |
| Shire | 1,135 | | 35,742 |
| Smith & Nephew | 1,887 | | 17,376 |
| Smiths Group | 886 | | 13,686 |
| Standard Chartered | 4,640 | | 109,271 |
| Standard Life | 4,201 | | 14,633 |
| Subsea 7 | 628 | a | 13,791 |
| Tesco | 15,903 | | 103,125 |
| Tui Travel | 1,371 | | 3,777 |
| Tullow Oil | 1,802 | | 40,808 |
| Unilever | 2,541 | | 85,556 |
| United Utilities Group | 1,206 | | 11,806 |
The Fund 37
STATEMENT OF INVESTMENTS (continued)
| | | | |
| Common Stocks (continued) | Shares | | | Value ($) |
| United Kingdom (continued) | | | | |
| Vedanta Resources | 192 | | | 3,961 |
| Virgin Media | 563 | | | 13,726 |
| Vodafone Group | 102,955 | | | 287,242 |
| Weir Group | 397 | | | 12,297 |
| Whitbread | 332 | | | 8,880 |
| Willis Group Holdings | 338 | | | 12,273 |
| WM Morrison Supermarkets | 4,437 | | | 21,643 |
| Wolseley | 631 | | | 18,313 |
| WPP | 2,590 | | | 27,006 |
| Xstrata | 4,128 | | | 69,662 |
| | | | | 4,587,931 |
| United States—30.6% | | | | |
| 3M | 1,336 | | | 105,571 |
| Abbott Laboratories | 3,134 | | | 168,829 |
| Abercrombie & Fitch, Cl. A | 160 | | | 11,904 |
| Accenture, Cl. A | 1,264 | | | 76,169 |
| ACE | 725 | | | 52,309 |
| Activision Blizzard | 1,022 | | | 13,685 |
| Adobe Systems | 1,066 | a | | 31,351 |
| Advance Auto Parts | 156 | | | 10,151 |
| Advanced Micro Devices | 1,129 | a | | 6,582 |
| AES | 1,220 | a | | 13,688 |
| Aetna | 784 | | | 31,172 |
| Aflac | 954 | | | 43,016 |
| AGCO | 156 | a | | 6,837 |
| Agilent Technologies | 734 | a | | 27,209 |
| Air Products & Chemicals | 436 | | | 37,557 |
| Airgas | 137 | | | 9,446 |
| Akamai Technologies | 324 | a | | 8,729 |
| Alcoa | 2,185 | | | 23,511 |
| Alexion Pharmaceuticals | 386 | a | | 26,059 |
| Allegheny Technologies | 240 | | | 11,136 |
| Allergan | 614 | | | 51,650 |
| Alliance Data Systems | 107 | a | | 10,961 |
| Alliant Energy | 201 | | | 8,197 |
| Allstate | 1,084 | | | 28,553 |
38
| | | | |
| Common Stocks (continued) | Shares | | | Value ($) |
| United States (continued) | | | | |
| Alpha Natural Resources | 385 | a | | 9,255 |
| Altera | 660 | | | 25,027 |
| Altria Group | 4,135 | | | 113,919 |
| Amazon.com | 729 | a | | 155,649 |
| Ameren | 535 | | | 17,056 |
| American Electric Power | 972 | | | 38,180 |
| American Express | 2,142 | | | 108,428 |
| American International Group | 981 | a | | 24,221 |
| American Tower, Cl. A | 801 | a | | 44,135 |
| American Water Works | 404 | | | 12,334 |
| Ameriprise Financial | 513 | | | 23,947 |
| AmerisourceBergen | 526 | | | 21,461 |
| AMETEK | 366 | | | 14,464 |
| Amgen | 1,846 | | | 105,720 |
| Amphenol, Cl. A | 312 | | | 14,817 |
| Anadarko Petroleum | 980 | | | 76,930 |
| Analog Devices | 641 | | | 23,441 |
| Annaly Capital Management | 1,925 | d | | 32,436 |
| Aon | 613 | | | 28,578 |
| Apache | 755 | | | 75,221 |
| Apollo Group, Cl. A | 252 | a | | 11,932 |
| Apple | 1,852 | a | | 749,653 |
| Applied Materials | 2,475 | | | 30,492 |
| Arch Capital Group | 258 | a | | 9,280 |
| Arch Coal | 499 | | | 9,092 |
| Archer-Daniels-Midland | 1,289 | | | 37,304 |
| Arrow Electronics | 221 | a | | 7,967 |
| Assurant | 223 | | | 8,594 |
| AT&T | 11,885 | | | 348,349 |
| Autodesk | 520 | a | | 17,992 |
| Automatic Data Processing | 995 | | | 52,068 |
| AutoZone | 52 | a | | 16,827 |
| Avago Technologies | 486 | | | 16,412 |
| AvalonBay Communities | 194 | d | | 25,936 |
| Avery Dennison | 191 | | | 5,081 |
| Avnet | 304 | a | | 9,214 |
The Fund 39
STATEMENT OF INVESTMENTS (continued)
| | | |
| Common Stocks (continued) | Shares | | Value ($) |
| United States (continued) | | | |
| Avon Products | 784 | | 14,332 |
| Axis Capital Holdings | 202 | | 6,333 |
| Baker Hughes | 869 | | 50,393 |
| Ball | 292 | | 10,094 |
| Bank of America | 19,979 | | 136,457 |
| Baxter International | 1,144 | | 62,897 |
| BB&T | 1,419 | | 33,119 |
| Beam | 258 | | 12,753 |
| Becton Dickinson & Co. | 413 | | 32,309 |
| Bed Bath & Beyond | 483 | a | 29,869 |
| Berkshire Hathaway, Cl. B | 1,823 | a | 141,939 |
| Best Buy | 636 | | 16,682 |
| Biogen Idec | 461 | a | 53,642 |
| BlackRock | 188 | | 29,665 |
| BMC Software | 334 | a | 11,610 |
| Boeing | 1,387 | | 91,251 |
| BorgWarner | 246 | a | 18,816 |
| Boston Properties | 308 | d | 30,489 |
| Boston Scientific | 3,304 | a | 19,461 |
| Bristol-Myers Squibb | 3,371 | | 106,490 |
| Broadcom, Cl. A | 1,004 | a | 36,234 |
| Brown-Forman, Cl. B | 160 | | 11,957 |
| Bunge | 319 | | 19,705 |
| C.H. Robinson Worldwide | 319 | | 22,148 |
| C.R. Bard | 164 | | 14,096 |
| CA | 762 | | 16,505 |
| Cablevision Systems (NY Group), Cl. A | 423 | | 6,121 |
| Cabot Oil & Gas | 209 | | 16,243 |
| Calpine | 686 | a | 10,407 |
| Cameron International | 468 | a | 22,997 |
| Campbell Soup | 378 | | 12,569 |
| Capital One Financial | 915 | | 41,779 |
| Cardinal Health | 736 | | 32,583 |
| CareFusion | 513 | a | 13,133 |
| CarMax | 514 | a | 15,451 |
| Carnival | 931 | | 32,781 |
40
| | | |
| Common Stocks (continued) | Shares | | Value ($) |
| United States (continued) | | | |
| Caterpillar | 1,263 | | 119,303 |
| CBRE Group, | 456 | a | 8,108 |
| CBS, Cl. B | 1,317 | | 33,992 |
| Celanese, Ser. A | 289 | | 12,586 |
| Celgene | 941 | a | 61,005 |
| CenterPoint Energy | 880 | | 18,339 |
| CenturyLink | 1,237 | | 43,617 |
| Cerner | 307 | a | 19,473 |
| CF Industries Holdings | 146 | | 23,691 |
| Charles Schwab | 2,298 | | 28,219 |
| Chesapeake Energy | 1,317 | | 37,034 |
| Chevron | 4,033 | | 423,667 |
| Chipotle Mexican Grill | 66 | a | 22,184 |
| Chubb | 597 | | 40,029 |
| Church & Dwight | 264 | | 11,664 |
| Cigna | 503 | | 22,303 |
| Cimarex Energy | 155 | | 9,920 |
| Cincinnati Financial | 311 | | 9,000 |
| Cintas | 277 | | 8,279 |
| Cisco Systems | 10,882 | | 201,643 |
| CIT Group | 324 | a | 11,291 |
| Citigroup | 5,877 | | 185,654 |
| Citrix Systems | 401 | a | 29,205 |
| Cliffs Natural Resources | 271 | | 18,488 |
| Clorox | 267 | | 17,873 |
| CME Group | 134 | | 36,925 |
| Coach | 602 | | 39,172 |
| Coca-Cola | 4,140 | | 282,845 |
| Coca-Cola Enterprises | 721 | | 19,337 |
| Cognizant Technology Solutions, Cl. A | 615 | a | 44,741 |
| Colgate-Palmolive | 979 | | 88,472 |
| Comcast, Cl. A | 4,109 | | 96,356 |
| Comcast, Cl. A (Special) | 1,338 | | 30,774 |
| Comerica | 458 | | 11,702 |
| Computer Sciences | 290 | | 9,123 |
| ConAgra Foods | 823 | | 20,847 |
The Fund 41
STATEMENT OF INVESTMENTS (continued)
| | | |
| Common Stocks (continued) | Shares | | Value ($) |
| United States (continued) | | | |
| Concho Resources | 193 | a | 18,281 |
| ConocoPhillips | 2,671 | | 186,035 |
| Consol Energy | 474 | | 20,268 |
| Consolidated Edison | 593 | | 34,317 |
| Constellation Brands, Cl. A | 362 | a | 7,320 |
| Constellation Energy Group | 338 | | 13,419 |
| Continental Resources | 106 | a | 6,429 |
| Cooper Industries | 304 | | 15,948 |
| Corning | 3,143 | | 44,913 |
| Costco Wholesale | 861 | | 71,678 |
| Covance | 119 | a | 6,037 |
| Coventry Health Care | 297 | a | 9,448 |
| Covidien | 989 | | 46,523 |
| Cree | 170 | a | 4,529 |
| Crown Castle International | 554 | a | 22,913 |
| Crown Holdings | 306 | a�� | 10,340 |
| CSX | 2,231 | | 49,551 |
| Cummins | 389 | | 38,678 |
| CVS Caremark | 2,710 | | 98,373 |
| D.R. Horton | 490 | | 5,454 |
| Danaher | 1,110 | | 53,669 |
| Darden Restaurants | 263 | | 12,592 |
| DaVita | 177 | a | 12,390 |
| Deere & Co. | 832 | | 63,149 |
| Dell | 3,479 | a | 55,003 |
| Delta Air Lines | 279 | a | 2,377 |
| Denbury Resources | 906 | a | 14,224 |
| DENTSPLY International | 229 | | 8,464 |
| Devon Energy | 811 | | 52,674 |
| DeVry | 129 | | 4,861 |
| Diamond Offshore Drilling | 124 | | 8,127 |
| DIRECTV, Cl. A | 1,560 | a | 70,918 |
| Discover Financial Services | 1,051 | | 24,762 |
| Discovery Communications, Cl. A | 270 | a | 11,734 |
| Discovery Communications, Cl. C | 282 | a | 11,159 |
| DISH Network, Cl. A | 476 | a | 11,505 |
42
| | | |
| Common Stocks (continued) | Shares | | Value ($) |
| United States (continued) | | | |
| Dolby Laboratories, Cl. A | 89 | a | 2,602 |
| Dollar General | 239 | a | 9,479 |
| Dollar Tree | 246 | a | 19,670 |
| Dominion Resources | 1,148 | | 59,225 |
| Dover | 340 | | 18,880 |
| Dow Chemical | 2,306 | | 64,291 |
| Dr. Pepper Snapple Group | 462 | | 17,302 |
| DTE Energy | 299 | | 15,581 |
| Duke Energy | 2,664 | | 54,399 |
| Duke Realty | 396 | d | 4,863 |
| Dun & Bradstreet | 102 | | 6,820 |
| E.I. du Pont de Nemours & Co. | 1,828 | | 87,872 |
| Eastman Chemical | 236 | | 9,272 |
| Eaton | 686 | | 30,747 |
| Eaton Vance | 238 | | 6,257 |
| eBay | 2,309 | a | 73,495 |
| Ecolab | 492 | | 26,489 |
| Edison International | 658 | | 26,715 |
| Edwards Lifesciences | 214 | a | 16,140 |
| El Paso | 1,616 | | 40,416 |
| Electronic Arts | 745 | a | 17,396 |
| Eli Lilly & Co. | 2,071 | | 76,958 |
| EMC | 4,100 | a | 100,491 |
| Emerson Electric | 1,488 | | 71,603 |
| Energen | 116 | | 5,691 |
| Energizer Holdings | 129 | a | 9,519 |
| Entergy | 339 | | 23,449 |
| EOG Resources | 554 | | 49,544 |
| EQT | 254 | | 16,129 |
| Equifax | 253 | | 8,893 |
| Equity Residential | 595 | d | 34,915 |
| Estee Lauder, Cl. A | 251 | | 24,711 |
| Everest Re Group | 102 | | 9,172 |
| Exelon | 1,322 | | 58,684 |
| Expedia | 460 | | 12,080 |
| Expeditors International of Washington | 386 | | 17,602 |
The Fund 43
STATEMENT OF INVESTMENTS (continued)
| | | | |
| Common Stocks (continued) | Shares | | | Value ($) |
| United States (continued) | | | | |
| Express Scripts | 1,007 | a | | 46,050 |
| Exxon Mobil | 9,864 | | | 770,280 |
| F5 Networks | 182 | a | | 18,919 |
| Family Dollar Stores | 252 | | | 14,775 |
| Fastenal | 602 | | | 22,930 |
| Federal Realty Investment Trust | 119 | d | | 10,562 |
| FedEx | 601 | | | 49,180 |
| Fidelity National Financial, Cl. A | 408 | | | 6,300 |
| Fidelity National Information Services | 485 | | | 12,697 |
| Fifth Third Bancorp | 1,941 | | | 23,311 |
| First Solar | 95 | a | | 4,728 |
| FirstEnergy | 868 | | | 39,025 |
| Fiserv | 320 | a | | 18,838 |
| FLIR Systems | 304 | | | 7,995 |
| Flowserve | 97 | | | 8,991 |
| Fluor | 377 | | | 21,432 |
| FMC | 130 | | | 10,256 |
| FMC Technologies | 466 | a | | 20,886 |
| Ford Motor | 6,963 | a | | 81,328 |
| Forest Laboratories | 543 | a | | 16,996 |
| Fossil | 126 | a | | 13,061 |
| Foster Wheeler | 254 | a | | 5,415 |
| Franklin Resources | 316 | | | 33,695 |
| Freeport-McMoRan Copper & Gold | 1,867 | | | 75,165 |
| Frontier Communications | 2,204 | | | 13,797 |
| GameStop, Cl. A | 315 | a | | 8,055 |
| Gap | 928 | | | 17,539 |
| Garmin | 202 | | | 6,947 |
| General Dynamics | 657 | | | 42,173 |
| General Electric | 21,288 | | | 355,722 |
| General Growth Properties | 945 | d | | 13,892 |
| General Mills | 1,275 | | | 49,126 |
| General Motors | 1,624 | | | 41,980 |
| Genuine Parts | 342 | | | 19,641 |
| Genworth Financial, Cl. A | 798 | a | | 5,091 |
| Gilead Sciences | 1,571 | a | | 65,448 |
44
| | | |
| Common Stocks (continued) | Shares | | Value ($) |
| United States (continued) | | | |
| Goldman Sachs Group | 978 | | 107,140 |
| Goodrich | 262 | | 32,129 |
| Goodyear Tire & Rubber | 433 | a | 6,218 |
| Google, Cl. A | 509 | a | 301,654 |
| Green Mountain Coffee Roasters | 244 | a | 15,865 |
| H&R Block | 635 | | 9,709 |
| H.J. Heinz | 651 | | 34,789 |
| Halliburton | 1,802 | | 67,323 |
| Hansen Natural | 131 | a | 11,671 |
| Harley-Davidson | 515 | | 20,034 |
| Harris | 226 | | 8,532 |
| Hartford Financial Services Group | 937 | | 18,037 |
| Hasbro | 240 | | 9,134 |
| HCA Holdings | 328 | | 7,692 |
| HCP | 769 | d | 30,645 |
| Health Care REIT | 316 | d | 16,650 |
| Helmerich & Payne | 251 | | 13,348 |
| Henry Schein | 182 | a | 12,616 |
| Hershey | 351 | | 20,088 |
| Hertz Global Holdings | 588 | a | 6,821 |
| Hess | 615 | | 38,474 |
| Hewlett-Packard | 4,299 | | 114,396 |
| HollyFrontier | 360 | | 11,048 |
| Hologic | 515 | a | 8,302 |
| Home Depot | 3,239 | | 115,956 |
| Honeywell International | 1,473 | | 77,185 |
| Hormel Foods | 274 | | 8,075 |
| Hospira | 294 | a | 9,246 |
| Host Hotels & Resorts | 1,502 | d | 21,434 |
| Hudson City Bancorp | 833 | | 5,206 |
| Human Genome Sciences | 315 | a | 3,232 |
| Humana | 310 | | 26,316 |
| IHS, Cl. A | 90 | a | 7,559 |
| Illinois Tool Works | 905 | | 44,010 |
| Illumina | 289 | a | 8,849 |
| Ingersoll-Rand | 758 | | 23,597 |
The Fund 45
STATEMENT OF INVESTMENTS (continued)
| | | | |
| Common Stocks (continued) | Shares | | | Value ($) |
| United States (continued) | | | | |
| Integrys Energy Group | 130 | | | 6,878 |
| Intel | 10,661 | | | 261,621 |
| IntercontinentalExchange | 156 | a | | 20,261 |
| International Business Machines | 2,429 | | | 448,466 |
| International Flavors & Fragrances | 188 | | | 11,385 |
| International Game Technology | 508 | | | 8,936 |
| International Paper | 889 | | | 24,625 |
| Interpublic Group of Cos. | 828 | | | 7,849 |
| Intuit | 561 | | | 30,109 |
| Intuitive Surgical | 83 | a | | 36,010 |
| Invesco | 1,012 | | | 20,312 |
| Iron Mountain | 417 | | | 12,898 |
| ITT | 319 | | | 14,546 |
| J.C. Penney | 357 | | | 11,453 |
| J.M. Smucker | 216 | | | 16,636 |
| Jacobs Engineering Group | 213 | a | | 8,264 |
| JB Hunt Transport Services | 158 | | | 6,685 |
| Jefferies Group | 165 | | | 2,188 |
| Johnson & Johnson | 5,501 | | | 354,209 |
| Johnson Controls | 1,365 | | | 44,949 |
| Joy Global | 230 | | | 20,056 |
| JPMorgan Chase & Co. | 7,998 | | | 278,010 |
| Juniper Networks | 1,106 | a | | 27,064 |
| KBR | 301 | | | 8,401 |
| Kellogg | 476 | | | 25,804 |
| KeyCorp | 2,161 | | | 15,257 |
| Kimberly-Clark | 808 | | | 56,326 |
| Kimco Realty | 726 | d | | 12,683 |
| Kinder Morgan | 248 | | | 7,093 |
| Kinder Morgan Management | 159 | a | | 10,515 |
| KLA-Tencor | 378 | | | 17,800 |
| Kohl’s | 569 | | | 30,163 |
| Kraft Foods, Cl. A | 3,283 | | | 115,496 |
| Kroger | 1,108 | | | 25,683 |
| L-3 Communications Holdings | 215 | | | 14,573 |
| Laboratory Corp. of America Holdings | 180 | a | | 15,093 |
46
| | | | |
| Common Stocks (continued) | Shares | | | Value ($) |
| United States (continued) | | | | |
| Lam Research | 292 | a | | 12,553 |
| Las Vegas Sands | 725 | a | | 34,039 |
| Legg Mason | 319 | | | 8,773 |
| Leggett & Platt | 272 | | | 5,957 |
| Leucadia National | 496 | | | 13,308 |
| Level 3 Communications | 375 | a | | 9,996 |
| Liberty Global, Cl. A | 247 | a | | 9,924 |
| Liberty Global, Ser. C | 203 | a | | 7,789 |
| Liberty Interactive, Cl. A | 1,084 | a | | 17,810 |
| Liberty Property Trust | 187 | d | | 5,984 |
| Life Technologies | 323 | a | | 13,136 |
| Limited Brands | 515 | | | 21,996 |
| Lincoln National | 551 | | | 10,497 |
| Linear Technology | 512 | | | 16,543 |
| Lockheed Martin | 614 | | | 46,603 |
| Loews | 631 | | | 25,051 |
| Lorillard | 300 | | | 33,198 |
| Lowe’s | 2,707 | | | 56,901 |
| LSI | 1,233 | a | | 7,706 |
| LyondellBasell Industries, Cl. A | 622 | | | 20,439 |
| M&T Bank | 204 | | | 15,526 |
| Macerich | 301 | d | | 14,978 |
| Macy’s | 905 | | | 27,630 |
| Manpower | 158 | | | 6,816 |
| Marathon Oil | 1,432 | | | 37,275 |
| Marathon Petroleum | 740 | | | 26,566 |
| Marriott International, Cl. A | 625 | | | 19,688 |
| Marsh & McLennan | 1,107 | | | 33,896 |
| Martin Marietta Materials | 71 | | | 5,124 |
| Marvell Technology Group | 960 | a | | 13,430 |
| Masco | 590 | | | 5,664 |
| MasterCard, Cl. A | 219 | | | 76,046 |
| Mattel | 655 | | | 18,497 |
| Maxim Integrated Products | 527 | | | 13,786 |
| McCormick & Co. | 225 | | | 10,926 |
| McDonald’s | 2,053 | | | 190,621 |
The Fund 47
STATEMENT OF INVESTMENTS (continued)
| | | | |
| Common Stocks (continued) | Shares | | | Value ($) |
| United States (continued) | | | | |
| McGraw-Hill | 562 | | | 23,885 |
| McKesson | 524 | | | 42,732 |
| MDU Resources Group | 351 | | | 7,234 |
| Mead Johnson Nutrition | 381 | | | 27,375 |
| MeadWestvaco | 345 | | | 9,629 |
| Medco Health Solutions | 813 | a | | 44,601 |
| Medtronic | 2,121 | | | 73,684 |
| Merck & Co | 6,214 | | | 214,383 |
| MetLife | 2,086 | | | 73,344 |
| MetroPCS Communications | 331 | a | | 2,814 |
| MGM Resorts International | 876 | a | | 10,092 |
| Microchip Technology | 368 | | | 13,307 |
| Micron Technology | 1,509 | a | | 8,435 |
| Microsoft | 15,223 | | | 405,388 |
| Mohawk Industries | 104 | a | | 5,476 |
| Molson Coors Brewing, Cl. B | 362 | | | 15,327 |
| Monsanto | 1,059 | | | 77,042 |
| Moody’s | 475 | | | 16,858 |
| Morgan Stanley | 2,799 | | | 49,374 |
| Mosaic | 638 | | | 37,361 |
| Motorola Mobility Holdings | 598 | a | | 23,250 |
| Motorola Solutions | 578 | | | 27,114 |
| Murphy Oil | 334 | | | 18,494 |
| Mylan | 791 | a | | 15,480 |
| Nabors Industries | 516 | a | | 9,458 |
| NASDAQ OMX Group | 219 | a | | 5,486 |
| National Oilwell Varco | 841 | | | 59,989 |
| NetApp | 739 | a | | 30,269 |
| Netflix | 94 | a | | 7,716 |
| New York Community Bancorp | 1,008 | | | 13,416 |
| Newell Rubbermaid | 529 | | | 7,829 |
| Newfield Exploration | 231 | a | | 9,300 |
| Newmont Mining | 961 | | | 64,224 |
| News, Cl. A | 3,607 | | | 63,195 |
| News, Cl. B | 788 | | | 14,066 |
| NextEra Energy | 803 | | | 45,289 |
48
| | | |
| Common Stocks (continued) | Shares | | Value ($) |
| United States (continued) | | | |
| Nielson Holdings | 210 | | 6,164 |
| NII Holdings | 289 | a | 6,800 |
| NIKE, Cl. B | 728 | | 70,143 |
| NiSource | 516 | | 11,398 |
| Noble | 481 | a | 17,287 |
| Noble Energy | 357 | | 31,894 |
| Nordstrom | 380 | | 19,262 |
| Norfolk Southern | 715 | | 52,903 |
| Northeast Utilities | 332 | | 11,477 |
| Northern Trust | 406 | | 16,431 |
| Northrop Grumman | 521 | | 30,088 |
| NRG Energy | 457 | a | 9,789 |
| NSTAR | 202 | | 9,108 |
| Nuance Communications | 567 | a | 15,014 |
| Nucor | 675 | | 25,502 |
| NVIDIA | 1,306 | a | 19,329 |
| NYSE Euronext | 604 | | 16,048 |
| O’Reilly Automotive | 299 | a | 22,739 |
| Occidental Petroleum | 1,602 | | 148,890 |
| Old Republic International | 426 | | 3,766 |
| Omnicare | 202 | | 6,024 |
| Omnicom Group | 588 | | 26,154 |
| ONEOK | 201 | | 15,286 |
| Oracle | 8,139 | | 266,715 |
| Owens-Illinois | 292 | a | 5,863 |
| PACCAR | 626 | | 27,068 |
| Pall | 237 | | 12,127 |
| Parker Hannifin | 301 | | 24,547 |
| PartnerRe | 125 | | 7,778 |
| Patterson | 139 | | 4,374 |
| Paychex | 705 | | 20,544 |
| Peabody Energy | 581 | | 25,198 |
| Pentair | 186 | | 6,687 |
| People’s United Financial | 715 | | 9,116 |
| Pepco Holdings | 419 | | 8,296 |
| PepsiCo | 3,183 | | 200,370 |
The Fund 49
STATEMENT OF INVESTMENTS (continued)
| | | |
| Common Stocks (continued) | Shares | | Value ($) |
| United States (continued) | | | |
| Perrigo | 178 | | 16,070 |
| PetSmart | 229 | | 10,752 |
| Pfizer | 15,693 | | 302,247 |
| PG&E | 804 | | 34,492 |
| Pharmaceutical Product Development | 185 | | 6,103 |
| Philip Morris International | 3,530 | | 246,641 |
| Pinnacle West Capital | 192 | | 8,751 |
| Pioneer Natural Resources | 200 | | 16,780 |
| Pitney Bowes | 342 | | 6,970 |
| Plains Exploration & Production | 227 | a | 7,151 |
| Plum Creek Timber | 278 | d | 10,469 |
| PNC Financial Services Group | 1,054 | | 56,610 |
| PPG Industries | 332 | | 28,688 |
| PPL | 1,204 | | 35,361 |
| Praxair | 606 | | 61,612 |
| Precision Castparts | 288 | | 46,987 |
| Priceline.com | 99 | a | 50,264 |
| Principal Financial Group | 715 | | 18,433 |
| Procter & Gamble | 5,601 | | 358,408 |
| Progress Energy | 600 | | 31,260 |
| Progressive | 1,145 | | 21,766 |
| ProLogis | 937 | d | 27,885 |
| Prudential Financial | 972 | | 52,682 |
| Public Service Enterprise Group | 1,027 | | 34,610 |
| Public Storage | 291 | d | 37,554 |
| Pulte Group | 591 | a | 3,061 |
| QEP Resources | 318 | | 11,305 |
| QUALCOMM | 3,365 | | 173,634 |
| Quanta Services | 378 | a | 7,896 |
| Quest Diagnostics | 373 | | 20,813 |
| R.R. Donnelley & Sons | 415 | | 6,765 |
| Ralcorp Holdings | 107 | a | 8,650 |
| Ralph Lauren | 141 | | 22,389 |
| Range Resources | 345 | | 23,750 |
| Rayonier | 219 | d | 9,139 |
| Raytheon | 733 | | 32,391 |
50
| | | | |
| Common Stocks (continued) | Shares | | | Value ($) |
| United States (continued) | | | | |
| Red Hat | 431 | a | | 21,399 |
| Regency Centers | 138 | d | | 5,652 |
| Regions Financial | 2,243 | | | 8,815 |
| RenaissanceRe Holdings | 95 | | | 6,471 |
| Republic Services | 678 | | | 19,296 |
| Reynolds American | 738 | | | 28,546 |
| Robert Half International | 274 | | | 7,242 |
| Rock-Tenn, Cl. A | 119 | | | 7,044 |
| Rockwell Automation | 312 | | | 21,107 |
| Rockwell Collins | 288 | | | 16,079 |
| Roper Industries | 183 | | | 14,841 |
| Ross Stores | 216 | | | 18,950 |
| Rowan | 295 | a | | 10,175 |
| Royal Caribbean Cruises | 221 | | | 6,568 |
| Safeway | 725 | | | 14,043 |
| SAIC | 706 | a | | 8,776 |
| Salesforce.com | 254 | a | | 33,825 |
| SanDisk | 509 | a | | 25,791 |
| Sara Lee | 1,227 | | | 21,841 |
| SBA Communications, Cl. A | 191 | a | | 7,275 |
| SCANA | 233 | | | 9,851 |
| Schlumberger | 2,735 | | | 200,940 |
| Scripps Networks Interactive, Cl. A | 179 | | | 7,604 |
| Seagate Technology | 786 | | | 12,694 |
| Sealed Air | 291 | | | 5,180 |
| Sears Holdings | 80 | a | | 6,254 |
| SEI Investments | 221 | | | 3,578 |
| Sempra Energy | 418 | | | 22,459 |
| Sherwin-Williams | 175 | | | 14,474 |
| Sigma-Aldrich | 269 | | | 17,614 |
| Simon Property Group | 578 | d | | 74,238 |
| Sirius XM Radio | 7,333 | a | | 13,126 |
| SLM | 1,170 | | | 15,994 |
| Southern | 1,731 | | | 74,779 |
| Southwest Airlines | 263 | | | 2,249 |
| Southwestern Energy | 735 | a | | 30,899 |
The Fund 51
STATEMENT OF INVESTMENTS (continued)
| | | |
| Common Stocks (continued) | Shares | | Value ($) |
| United States (continued) | | | |
| Spectra Energy | 1,313 | | 37,591 |
| Sprint Nextel | 5,370 | a | 13,801 |
| SPX | 89 | | 4,860 |
| St. Jude Medical | 697 | | 27,183 |
| Stanley Black & Decker | 335 | | 21,390 |
| Staples | 1,528 | | 22,859 |
| Starbucks | 1,492 | | 63,171 |
| Starwood Hotels & Resorts Worldwide | 421 | d | 21,096 |
| State Street | 1,020 | | 41,198 |
| Stericycle | 162 | a | 13,540 |
| Stryker | 611 | | 29,273 |
| Sunoco | 198 | | 7,372 |
| SunTrust Banks | 1,127 | | 22,236 |
| Symantec | 1,570 | a | 26,706 |
| Synopsys | 266 | a | 7,131 |
| Sysco | 1,184 | | 32,820 |
| T. Rowe Price Group | 491 | | 25,944 |
| Target | 1,322 | | 72,380 |
| TD Ameritrade Holding | 489 | | 8,205 |
| TE Connectivity | 807 | | 28,689 |
| Teradata | 366 | a | 21,836 |
| Texas Instruments | 2,314 | | 71,109 |
| Textron | 542 | | 10,526 |
| Thermo Fisher Scientific | 793 | a | 39,864 |
| Tiffany & Co. | 212 | | 16,903 |
| Time Warner | 2,157 | | 75,473 |
| Time Warner Cable | 691 | | 44,010 |
| TJX | 797 | | 46,967 |
| Toll Brothers | 239 | a | 4,168 |
| Torchmark | 249 | | 10,192 |
| Total System Services | 300 | | 5,967 |
| Travelers | 867 | | 50,589 |
| TRW Automotive Holdings | 256 | a | 10,778 |
| Tyco International | 1,003 | | 45,687 |
52
| | | |
| Common Stocks (continued) | Shares | | Value ($) |
| United States (continued) | | | |
| Tyson Foods, Cl. A | 547 | | 10,557 |
| U.S. Bancorp | 3,812 | | 97,549 |
| Ultra Petroleum | 276 | a | 8,793 |
| Union Pacific | 973 | | 96,882 |
| United Continential Holdings | 87 | a | 1,681 |
| United Parcel Service, Cl. B | 1,455 | | 102,199 |
| United States Steel | 255 | | 6,467 |
| United Technologies | 1,728 | | 134,749 |
| UnitedHealth Group | 2,164 | | 103,850 |
| Unum Group | 602 | | 14,352 |
| Urban Outfitters | 254 | a | 6,922 |
| URS | 153 | a | 5,462 |
| Valero Energy | 1,056 | | 25,978 |
| Varian Medical Systems | 215 | a | 12,625 |
| Ventas | 564 | d | 31,364 |
| VeriSign | 349 | | 11,199 |
| Verisk Analytics, Cl. A | 295 | a | 10,369 |
| Verizon Communications | 5,694 | | 210,564 |
| Vertex Pharmaceuticals | 431 | a | 17,063 |
| VF | 186 | | 25,709 |
| Viacom, Cl. B | 1,094 | | 47,972 |
| Visa, Cl. A | 1,063 | | 99,135 |
| VMware, Cl. A | 166 | a | 16,227 |
| Vornado Realty Trust | 351 | d | 29,066 |
| Vulcan Materials | 217 | | 6,790 |
| W.R. Berkley | 221 | | 7,693 |
| W.W. Grainger | 111 | | 19,015 |
| Wal-Mart Stores | 3,844 | | 218,032 |
| Walgreen | 1,820 | | 60,424 |
| Walt Disney | 3,563 | | 124,277 |
| Walter Energy | 122 | | 9,229 |
| Warner Chilcott, Cl. A | 230 | a | 4,168 |
| Washington Post, Cl. B | 10 | | 3,402 |
| Waste Management | 943 | | 31,053 |
The Fund 53
STATEMENT OF INVESTMENTS (continued)
| | | | |
| Common Stocks (continued) | Shares | | | Value ($) |
| United States (continued) | | | | |
| Waters | 205 | a | | 16,425 |
| Watson Pharmaceuticals | 276 | a | | 18,536 |
| Weatherford International | 1,632 | a | | 25,296 |
| WellPoint | 755 | | | 52,020 |
| Wells Fargo & Co. | 10,100 | | | 261,691 |
| Western Digital | 414 | a | | 11,029 |
| Western Union | 1,341 | | | 23,427 |
| Weyerhaeuser | 1,137 | d | | 20,443 |
| Whirlpool | 129 | | | 6,554 |
| Whiting Petroleum | 233 | a | | 10,846 |
| Whole Foods Market | 283 | | | 20,410 |
| Williams | 1,190 | | | 35,831 |
| Windstream | 881 | | | 10,722 |
| Wisconsin Energy | 522 | | | 16,928 |
| Wynn Resorts | 167 | | | 22,178 |
| Xcel Energy | 996 | | | 25,747 |
| Xerox | 2,902 | | | 23,738 |
| Xilinx | 501 | | | 16,763 |
| XL Group | 594 | | | 12,914 |
| Yahoo! | 2,523 | a | | 39,459 |
| Yum! Brands | 937 | | | 50,195 |
| Zimmer Holdings | 402 | a | | 21,157 |
| | | | | 23,671,187 |
| Total Common Stocks | | | | |
| (cost $50,504,638) | | | | 46,162,178 |
| |
| Preferred Stocks—.1% | | | | |
| Germany | | | | |
| Bayerische Motoren Werke | 132 | | | 7,284 |
| Henkel & Co. | 327 | | | 19,662 |
| Porsche Automobil Holding | 281 | | | 16,612 |
| ProSiebenSat.1 Media | 139 | | | 3,005 |
| RWE | 68 | | | 2,575 |
54
| | | | |
| | Preferred Stocks (continued) | Shares | | Value ($) |
| | Germany (continued) | | | |
| | Volkswagen | 310 | | 54,827 |
| | Total Preferred Stocks | | | |
| | (cost $68,942) | | | 103,965 |
| |
| | Rights—.0% | | | |
| | Hong Kong | | | |
| | New World Development | | | |
| | (cost $614) | 2,000 | a | 683 |
| | | Face Amount | | |
| | | Covered by | | |
| | Options Purchased—5.5% | Contracts ($) | | Value ($) |
| | Call Options—5.5% | | | |
| | U.S. Treasury 10 Year Note Futures, | | | |
| | November 2011 @ $109 | 211,000 | a | 4,233,188 |
| | | Number of | | |
| | | Contracts | | Value ($) |
| | Put Options—.0% | | | |
| | Swiss Market Index Futures, | | | |
| | December 2011 @ CHF 5,405 | 90 | a | 6,872 |
| | Swiss Market Index Futures, | | | |
| | December 2011 @ CHF 5,694 | 110 | a | 18,431 |
| | | | | 25,303 |
| | Total Options Purchased | | | |
| | (cost $4,303,828) | | | 4,258,491 |
| | | Principal | | |
| Short-Term Investments—18.5% | Amount ($) | | Value ($) |
| | U.S. Treasury Bills: | | | |
| | 0.01%, 12/1/11 | 2,500,000 | | 2,499,980 |
| | 0.01%, 12/29/11 | 1,270,000 | | 1,269,975 |
| | 0.02%, 1/12/12 | 3,350,000 | | 3,349,916 |
| | 0.02%, 3/22/12 | 3,400,000 | e | 3,399,565 |
| | 0.03%, 1/19/12 | 3,760,000 | | 3,759,898 |
| | Total Short-Term Investments | | | |
| | (cost $14,279,353) | | | 14,279,334 |
The Fund 55
STATEMENT OF INVESTMENTS (continued)
| | | | |
| Other investment—16.3% | Shares | | Value ($) | |
| Registered Investment Company; | | | | |
| Dreyfus Institutional Preferred | | | | |
| Plus Money Market Fund | | | | |
| (cost $12,607,663) | 12,607,663 | f | 12,607,663 | |
| |
| Total Investments (cost $81,765,038) | 100.0 | % | 77,412,314 | |
| Liabilities, Less Cash and Receivables | 0.00 | % | (34,778 | ) |
| Net Assets | 100.0 | % | 77,377,536 | |
|
| BR—Bearer Certificate |
| CDI—Chess Depository Interest |
| CHF—Swiss Franc |
| PC—Participation Certificate |
| PPS—Price Protected Shares |
| REIT—Real Estate Investment Trust |
| RSP—Risparmio (Savings) Shares |
| SDR—Swedish Depository Receipts |
| STRIP—Separate Trading of Registered Interest and Principal of Securities |
|
| a Non-income producing security. |
| b The valuation of these securities has been determined in good faith by management under the direction of the Board |
| of Directors.At October 31, 2011, the value of these securities amounted to $583 or less than .01% of net assets. |
| c Securities exempt from registration under Rule 144A of the Securities Act of 1933.These securities may be resold in |
| transactions exempt from registration, normally to qualified institutional buyers.At October 31, 2011, this security |
| was valued at $20,792 or .03% of net assets. |
| d Investment in real estate investment trust. |
| e Held by a broker as collateral for open financial futures, forward foreign currency exchange contracts, and options positions. |
| f Investment in affiliated money market mutual fund. |
| | | |
| Portfolio Summary (Unaudited)† | | |
| |
| | Value (%) | | Value (%) |
| Short-Term/ | | Health Care | 5.9 |
| Money Market Investments | 34.8 | Energy | 5.8 |
| Financial | 11.0 | Options Purchased | 5.5 |
| Information Technology | 7.3 | Materials | 4.3 |
| Consumer Discretionary | 6.5 | Utilities | 3.7 |
| Industrial | 6.5 | Telecommunication Services | 2.5 |
| Consumer Staples | 6.2 | | 100.0 |
| |
| † Based on net assets. | | | |
| See notes to financial statements. | | | |
56
STATEMENT OF FINANCIAL FUTURES
October 31, 2011
| | | | | | |
| | | | | | Unrealized | |
| | | Market Value | | | Appreciation | |
| | | Covered by | | | (Depreciation) | |
| | Contracts | Contracts ($) | | Expiration | at 10/31/2011 | ($) |
| Financial Futures Long | | | | | | |
| Amsterdam Exchange Index | 54 | 4,611,786 | | November 2011 | 115,420 | |
| ASX SPI 200 | 22 | 2,499,814 | | December 2011 | 143,993 | |
| Australian 10 Year Bond | 23 | 2,724,014 | | December 2011 | (77,590 | ) |
| Canadian 10 Year Bond | 24 | 3,172,857 | | December 2011 | (38,811 | ) |
| DAX | 28 | 6,026,083 | | December 2011 | 485,488 | |
| Euro-Bond | 119 | 22,485,431 | | December 2011 | 99,490 | |
| IBEX 35 Index | 1 | 123,412 | | November 2011 | 1,369 | |
| Japanese 10 Year Bond | 1 | 1,821,866 | | December 2011 | (8,475 | ) |
| FTSE / MIB Index | 1 | 111,249 | | December 2011 | 14,237 | |
| Standard & Poor’s 500 E-mini | 54 | 3,373,110 | | December 2011 | 89,592 | |
| Financial Futures Short | | | | | | |
| FTSE 100 | 18 | (1,609,145 | ) | December 2011 | (32,743 | ) |
| Long Gilt | 143 | (29,622,978 | ) | December 2011 | 132,995 | |
| Hang Seng | 16 | (2,038,377 | ) | November 2011 | (106,854 | ) |
| Japanese 10 Year Mini Bond | 7 | (1,276,563 | ) | December 2011 | 4,170 | |
| S&P/ Toronto Stock | | | | | | |
| Exchange Index | 12 | (1,683,443 | ) | December 2011 | (14,417 | ) |
| Topix | 50 | (4,866,945 | ) | December 2011 | (93,358 | ) |
| U.S Treasury 10 Year Notes | 9 | (1,161,563 | ) | December 2011 | (502 | ) |
| Gross Unrealized Appreciation | | | | | 1,086,754 | |
| Gross Unrealized Depreciation | | | | | (372,750 | ) |
| |
| See notes to financial statements. | | | | | | |
The Fund 57
| | | | |
| STATEMENT OF OPTIONS WRITTEN | | | | |
| October 31, 2011 | | | | |
| |
| |
| |
| | Number of | | | |
| | Contracts ($) | | Value ($) | |
| Call Options: | | | | |
| Swiss Market Index Futures, | | | | |
| December 2011 @ CHF 5,405 | 90 | a | (40,266 | ) |
| Swiss Market Index Futures, | | | | |
| December 2011 @ CHF 5,694 | 110 | a | (22,859 | ) |
| (premiums received $63,604) | | | (63,125 | ) |
CHF—Swiss Franc
a Non-income producing security.
See notes to financial statements.
58
STATEMENT OF ASSETS AND LIABILITIES
October 31, 2011
| | | |
| | Cost | Value | |
| Assets ($): | | | |
| Investments in securities—See Statement of Investments: | | | |
| Unaffiliated issuers | 69,157,375 | 64,804,651 | |
| Affiliated issuers | 12,607,663 | 12,607,663 | |
| Cash | | 39,007 | |
| Cash denominated in foreign currencies | 728,450 | 745,067 | |
| Unrealized appreciation on forward foreign | | | |
| currency exchange contracts—Note 4 | | 3,185,933 | |
| Dividends receivable | | 117,421 | |
| Receivable for shares of Common Stock subscribed | | 27,891 | |
| Prepaid expenses | | 8,795 | |
| | | 81,536,428 | |
| Liabilities ($): | | | |
| Due to The Dreyfus Corporation and affiliates—Note 3(c) | | 95,642 | |
| Unrealized depreciation on forward foreign | | | |
| currency exchange contracts—Note 4 | | 3,561,263 | |
| Payable for futures variation margin—Note 4 | | 260,774 | |
| Payable for shares of Common Stock redeemed | | 106,549 | |
| Outstanding options written, at value (premiums received | | | |
| $63,604)—See Statement of Options Written—Note 4 | | 63,125 | |
| Accrued expenses | | 71,539 | �� |
| | | 4,158,892 | |
| Net Assets ($) | | 77,377,536 | |
| Composition of Net Assets ($): | | | |
| Paid-in capital | | 161,917,611 | |
| Accumulated investment (loss)—net | | (40,340 | ) |
| Accumulated net realized gain (loss) on investments | | (80,511,196 | ) |
| Accumulated net unrealized appreciation (depreciation) on investments, | | |
| options transactions and foreign currency transactions (including | | | |
| $714,004 net unrealized appreciation on financial futures) | | (3,988,539 | ) |
| Net Assets ($) | | 77,377,536 | |
| | | |
| Net Asset Value Per Share | | | |
| | Class A | Class C | Class I |
| Net Assets ($) | 18,797,099 | 9,180,425 | 49,400,012 |
| Shares Outstanding | 1,601,683 | 799,820 | 4,171,224 |
| Net Asset Value Per Share ($) | 11.74 | 11.48 | 11.84 |
| |
| See notes to financial statements. | | | |
The Fund 59
| | |
| STATEMENT OF OPERATIONS | | |
| Year Ended October 31, 2011 | | |
| |
| |
| |
| |
| Investment Income ($): | | |
| Income: | | |
| Cash dividends (net of $60,746 foreign taxes withheld at source): | | |
| Unaffiliated issuers | 1,056,671 | |
| Affiliated issuers | 15,842 | |
| Interest | 441 | |
| Total Income | 1,072,954 | |
| Expenses: | | |
| Management fee—Note 3(a) | 784,821 | |
| Shareholder servicing costs—Note 3(c) | 144,669 | |
| Distribution fees—Note 3(b) | 80,751 | |
| Auditing fees | 64,444 | |
| Registration fees | 37,863 | |
| Custodian fees—Note 3(c) | 24,612 | |
| Prospectus and shareholders’ reports | 19,329 | |
| Directors’ fees and expenses—Note 3(d) | 4,973 | |
| Legal fees | 1,391 | |
| Loan commitment fees—Note 2 | 1,113 | |
| Miscellaneous | 104,866 | |
| Total Expenses | 1,268,832 | |
| Less—reduction in fees due to earnings credits—Note 3(c) | (50 | ) |
| Net Expenses | 1,268,782 | |
| Investment (Loss)—Net | (195,828 | ) |
| Realized and Unrealized Gain (Loss) on Investments—Note 4 ($): | | |
| Net realized gain (loss) on investments and foreign currency transactions | (150,521 | ) |
| Net realized gain (loss) on options transactions | 1,710,106 | |
| Net realized gain (loss) on financial futures | (337,591 | ) |
| Net realized gain (loss) on forward foreign currency exchange contracts | 841,432 | |
| Net Realized Gain (Loss) | 2,063,426 | |
| Net unrealized appreciation (depreciation) on | | |
| investments and foreign currency transactions | 144,196 | |
| Net unrealized appreciation (depreciation) on options transactions | (182,710 | ) |
| Net unrealized appreciation (depreciation) on financial futures | 694,081 | |
| Net unrealized appreciation (depreciation) on | | |
| forward foreign currency exchange contracts | (687,551 | ) |
| Net Unrealized Appreciation (Depreciation) | (31,984 | ) |
| Net Realized and Unrealized Gain (Loss) on Investments | 2,031,442 | |
| Net Increase in Net Assets Resulting from Operations | 1,835,614 | |
| |
| See notes to financial statements. | | |
60
STATEMENT OF CHANGES IN NET ASSETS
| | | | |
| | Year Ended October 31, | |
| | 2011 | | 2010 | |
| Operations ($): | | | | |
| Investment (loss)—net | (195,828 | ) | (388,404 | ) |
| Net realized gain (loss) on investments | 2,063,426 | | 4,173,420 | |
| Net unrealized appreciation | | | | |
| (depreciation) on investments | (31,984 | ) | 4,835,840 | |
| Net Increase (Decrease) in Net Assets | | | | |
| Resulting from Operations | 1,835,614 | | 8,620,856 | |
| Capital Stock Transactions ($): | | | | |
| Net proceeds from shares sold: | | | | |
| Class A Shares | 1,835,994 | | 1,486,128 | |
| Class C Shares | 228,056 | | 214,262 | |
| Class I Shares | 33,309,183 | | 14,351,275 | |
| Cost of shares redeemed: | | | | |
| Class A Shares | (7,852,506 | ) | (17,799,249 | ) |
| Class C Shares | (3,962,032 | ) | (6,885,019 | ) |
| Class I Shares | (12,256,698 | ) | (7,619,255 | ) |
| Increase (Decrease) in Net Assets | | | | |
| from Capital Stock Transactions | 11,301,997 | | (16,251,858 | ) |
| Total Increase (Decrease) in Net Assets | 13,137,611 | | (7,631,002 | ) |
| Net Assets ($): | | | | |
| Beginning of Period | 64,239,925 | | 71,870,927 | |
| End of Period | 77,377,536 | | 64,239,925 | |
| Accumulated investment (loss)—net | (40,340 | ) | (47,951 | ) |
| Capital Share Transactions (Shares): | | | | |
| Class A | | | | |
| Shares sold | 156,682 | | 141,992 | |
| Shares redeemed | (671,148 | ) | (1,700,282 | ) |
| Net Increase (Decrease) in Shares Outstanding | (514,466 | ) | (1,558,290 | ) |
| Class C | | | | |
| Shares sold | 19,817 | | 20,674 | |
| Shares redeemed | (342,904 | ) | (664,898 | ) |
| Net Increase (Decrease) in Shares Outstanding | (323,087 | ) | (644,224 | ) |
| Class I | | | | |
| Shares sold | 2,798,559 | | 1,364,272 | |
| Shares redeemed | (1,034,286 | ) | (728,702 | ) |
| Net Increase (Decrease) in Shares Outstanding | 1,764,273 | | 635,570 | |
| |
| See notes to financial statements. | | | | |
The Fund 61
FINANCIAL HIGHLIGHTS
The following tables describe the performance for each share class for the fiscal periods indicated.All information (except portfolio turnover rate) reflects financial results for a single fund share.Total return shows how much your investment in the fund would have increased (or decreased) during each period, assuming you had reinvested all dividends and distributions.These figures have been derived from the fund’s financial statements.
| | | | | | | | | | |
| | | | Year Ended October 31, | | | |
| Class A Shares | 2011 | | 2010 | | 2009 | | 2008 | | 2007 | |
| Per Share Data ($): | | | | | | | | | | |
| Net asset value, beginning of period | 11.39 | | 9.98 | | 8.48 | | 14.25 | | 13.23 | |
| Investment Operations: | | | | | | | | | | |
| Investment income (loss)—neta | (.04 | ) | (.06 | ) | (.01 | ) | .13 | | .32 | |
| Net realized and unrealized | | | | | | | | | | |
| gain (loss) on investments | .39 | | 1.47 | | 1.87 | | (5.47 | ) | .93 | |
| Total from Investment Operations | .35 | | 1.41 | | 1.86 | | (5.34 | ) | 1.25 | |
| Distributions: | | | | | | | | | | |
| Dividends from investment income—net | — | | — | | (.36 | ) | (.26 | ) | (.07 | ) |
| Dividends from net realized | | | | | | | | | | |
| gain on investments | — | | — | | — | | (.17 | ) | (.16 | ) |
| Total Distributions | — | | — | | (.36 | ) | (.43 | ) | (.23 | ) |
| Net asset value, end of period | 11.74 | | 11.39 | | 9.98 | | 8.48 | | 14.25 | |
| Total Return (%)b | 3.07 | | 14.13 | | 22.83 | | (38.52 | ) | 9.53 | |
| Ratios/Supplemental Data (%): | | | | | | | | | | |
| Ratio of total expenses | | | | | | | | | | |
| to average net assets | 1.88 | | 2.06 | | 1.98 | | 1.61 | | 1.52 | |
| Ratio of net expenses | | | | | | | | | | |
| to average net assets | 1.88 | | 2.06 | | 1.97 | | 1.61 | | 1.44 | |
| Ratio of net investment income | | | | | | | | | | |
| (loss) to average net assets | (.38 | ) | (.54 | ) | (.14 | ) | 1.09 | | 2.31 | |
| Portfolio Turnover Rate | 4.78 | | 2.91 | | 14.88 | | 24.53 | | 3.05 | |
| Net Assets, end of period ($ x 1,000) | 18,797 | | 24,096 | | 36,670 | | 74,083 | | 298,284 | |
| |
| a | Based on average shares outstanding at each month end. |
| b | Exclusive of sales charge. |
See notes to financial statements.
62
| | | | | | | | | | |
| | | | Year Ended October 31, | | | |
| Class C Shares | 2011 | | 2010 | | 2009 | | 2008 | | 2007 | |
| Per Share Data ($): | | | | | | | | | | |
| Net asset value, beginning of period | 11.22 | | 9.91 | | 8.37 | | 14.10 | | 13.18 | |
| Investment Operations: | | | | | | | | | | |
| Investment income (loss)—neta | (.13 | ) | (.15 | ) | (.07 | ) | .04 | | .21 | |
| Net realized and unrealized | | | | | | | | | | |
| gain (loss) on investments | .39 | | 1.46 | | 1.86 | | (5.40 | ) | .93 | |
| Total from Investment Operations | .26 | | 1.31 | | 1.79 | | (5.36 | ) | 1.14 | |
| Distributions: | | | | | | | | | | |
| Dividends from investment income—net | — | | — | | (.25 | ) | (.20 | ) | (.06 | ) |
| Dividends from net realized | | | | | | | | | | |
| gain on investments | — | | — | | — | | (.17 | ) | (.16 | ) |
| Total Distributions | — | | — | | (.25 | ) | (.37 | ) | (.22 | ) |
| Net asset value, end of period | 11.48 | | 11.22 | | 9.91 | | 8.37 | | 14.10 | |
| Total Return (%)b | 2.32 | | 13.22 | | 21.94 | | (38.97 | ) | 8.80 | |
| Ratios/Supplemental Data (%): | | | | | | | | | | |
| Ratio of total expenses | | | | | | | | | | |
| to average net assets | 2.63 | | 2.81 | | 2.73 | | 2.35 | | 2.28 | |
| Ratio of net expenses | | | | | | | | | | |
| to average net assets | 2.63 | | 2.81 | | 2.72 | | 2.35 | | 2.19 | |
| Ratio of net investment income | | | | | | | | | | |
| (loss) to average net assets | (1.12 | ) | (1.43 | ) | (.89 | ) | .32 | | 1.53 | |
| Portfolio Turnover Rate | 4.78 | | 2.91 | | 14.88 | | 24.53 | | 3.05 | |
| Net Assets, end of period ($ x 1,000) | 9,180 | | 12,600 | | 17,510 | | 26,706 | | 84,660 | |
| |
| a | Based on average shares outstanding at each month end. |
| b | Exclusive of sales charge. |
See notes to financial statements.
The Fund 63
FINANCIAL HIGHLIGHTS (continued)
| | | | | | | | | | |
| | | | Year Ended October 31, | | | |
| Class I Shares | 2011 | | 2010 | | 2009 | | 2008 | | 2007 | a |
| Per Share Data ($): | | | | | | | | | | |
| Net asset value, beginning of period | 11.44 | | 9.99 | | 8.52 | | 14.30 | | 13.24 | |
| Investment Operations: | | | | | | | | | | |
| Investment income (loss)—netb | .00 | c | (.01 | ) | .02 | | .17 | | .36 | |
| Net realized and unrealized | | | | | | | | | | |
| gain (loss) on investments | .40 | | 1.46 | | 1.87 | | (5.48 | ) | .93 | |
| Total from Investment Operations | .40 | | 1.45 | | 1.89 | | (5.31 | ) | 1.29 | |
| Distributions: | | | | | | | | | | |
| Dividends from investment income—net | — | | — | | (.42 | ) | (.30 | ) | (.07 | ) |
| Dividends from net realized | | | | | | | | | | |
| gain on investments | — | | — | | — | | (.17 | ) | (.16 | ) |
| Total Distributions | — | | — | | (.42 | ) | (.47 | ) | (.23 | ) |
| Net asset value, end of period | 11.84 | | 11.44 | | 9.99 | | 8.52 | | 14.30 | |
| Total Return (%) | 3.50 | | 14.51 | | 23.29 | | (38.29 | ) | 9.86 | |
| Ratios/Supplemental Data (%): | | | | | | | | | | |
| Ratio of total expenses | | | | | | | | | | |
| to average net assets | 1.49 | | 1.64 | | 1.60 | | 1.26 | | 1.23 | |
| Ratio of net expenses | | | | | | | | | | |
| to average net assets | 1.49 | | 1.64 | | 1.59 | | 1.26 | | 1.17 | |
| Ratio of net investment income | | | | | | | | | | |
| (loss) to average net assets | .01 | | (.12 | ) | .23 | | 1.37 | | 2.58 | |
| Portfolio Turnover Rate | 4.78 | | 2.91 | | 14.88 | | 24.53 | | 3.05 | |
| Net Assets, end of period ($ x 1,000) | 49,400 | | 27,544 | | 17,691 | | 21,124 | | 62,712 | |
| |
| a | Effective June 1, 2007, Class R shares were redesignated as Class I shares. |
| b | Based on average shares outstanding at each month end. |
| c | Amount represents less than $.01 per share. |
See notes to financial statements.
64
NOTES TO FINANCIAL STATEMENTS
NOTE 1—Significant Accounting Policies:
Global Alpha Fund (the “fund”) is a separate non-diversified series of Advantage Funds, Inc. (the “Company”), which is registered under the Investment Company Act of 1940, as amended (the “Act”), as an open-end management investment company and operates as a series company that offers twelve series, including the fund. The fund’s investment objective is to seek total return by investing in instruments that provide investment exposure to global equity, bond and currency markets, and in fixed income securities. The Dreyfus Corporation (the “Manager” or “Dreyfus”), a wholly-owned subsidiary of The Bank of New York Mellon Corporation (“BNY Mellon”), serves as the fund’s investment adviser. Mellon Capital Management Corporation (“Mellon Capital”), a subsidiary of BNY Mellon, serves as the fund’s sub-investment adviser.
MBSC Securities Corporation (the “Distributor”), a wholly-owned subsidiary of Dreyfus, is the distributor of the fund’s shares.The fund is authorized to issue 400 million shares of $.001 par value Common Stock.The fund currently offers three classes of shares: Class A (200 million shares authorized), Class C (100 million shares authorized) and Class I (100 million shares authorized). Class A shares are subject to a sales charge imposed at the time of purchase. Class C shares are subject to a contingent deferred sales charge (“CDSC”) imposed on Class C shares redeemed within one year of purchase. Class I shares are sold at net asset value per share only to institutional investors. Other differences between the classes include the services offered to and the expenses borne by each class, the allocation of certain transfer agency costs and certain voting rights. Income, expenses (other than expenses attributable to a specific class) and realized and unrealized gains or losses on investments are allocated to each class of shares based on its relative net assets.
The Fund 65
NOTES TO FINANCIAL STATEMENTS (continued)
The Company accounts separately for the assets, liabilities and operations of each series. Expenses directly attributable to each series are charged to that series’ operations; expenses which are applicable to all series are allocated among them on a pro rata basis.
The Financial Accounting Standards Board (“FASB”) Accounting Standards Codification (“ASC”) is the exclusive reference of authoritative U.S. generally accepted accounting principles (“GAAP”) recognized by the FASB to be applied by nongovernmental entities. Rules and interpretive releases of the Securities and Exchange Commission (“SEC”) under authority of federal laws are also sources of authoritative GAAP for SEC registrants. The fund’s financial statements are prepared in accordance with GAAP, which may require the use of management estimates and assumptions.Actual results could differ from those estimates.
The Company enters into contracts that contain a variety of indemnifications.The fund’s maximum exposure under these arrangements is unknown.The fund does not anticipate recognizing any loss related to these arrangements.
(a) Portfolio valuation: The fair value of a financial instrument is the amount that would be received to sell an asset or paid to transfer a liability in an orderly transaction between market participants at the measurement date (i.e. the exit price). GAAP establishes a fair value hierarchy that prioritizes the inputs of valuation techniques used to measure fair value.This hierarchy gives the highest priority to unadjusted quoted prices in active markets for identical assets or liabilities (Level 1 measurements) and the lowest priority to unobservable inputs (Level 3 measurements).
Additionally, GAAP provides guidance on determining whether the volume and activity in a market has decreased significantly and whether such a decrease in activity results in transactions that are not orderly. GAAP requires enhanced disclosures around valuation inputs and techniques used during annual and interim periods.
66
Various inputs are used in determining the value of the fund’s investments relating to fair value measurements.These inputs are summarized in the three broad levels listed below:
Level 1—unadjusted quoted prices in active markets for identical investments.
Level 2—other significant observable inputs (including quoted prices for similar investments, interest rates, prepayment speeds, credit risk, etc.).
Level 3—significant unobservable inputs (including the fund’s own assumptions in determining the fair value of investments).
The inputs or methodology used for valuing securities are not necessarily an indication of the risk associated with investing in those securities.
Changes in valuation techniques may result in transfers in or out of an assigned level within the disclosure hierarchy. Valuation techniques used to value the fund’s investments are as follows:
Investments in securities are valued at the last sales price on the securities exchange or national securities market on which such securities are primarily traded. Securities listed on the National Market System for which market quotations are available are valued at the official closing price or, if there is no official closing price that day, at the last sales price. Securities not listed on an exchange or the national securities market, or securities for which there were no transactions, are valued at the average of the most recent bid and asked prices, except for open short positions, where the asked price is used for valuation purposes. Bid price is used when no asked price is available. Registered investment companies that are not traded on an exchange are valued at their net asset value.All preceding securities are categorized within Level 1 of the fair value hierarchy.
The Fund 67
NOTES TO FINANCIAL STATEMENTS (continued)
U.S. Treasury Bills are valued at the mean price between quoted bid prices and asked prices by an independent pricing service approved by the Board of Directors. These securities are generally categorized within Level 2 of the fair value hierarchy.
Fair valuing of securities may be determined with the assistance of a pricing service using calculations based on indices of domestic securities and other appropriate indicators, such as prices of relevant American Depository Receipts and futures contracts. Utilizing these techniques may result in transfers between Level 1 and Level 2 of the fair value hierarchy.
When market quotations or official closing prices are not readily available, or are determined not to reflect accurately fair value, such as when the value of a security has been significantly affected by events after the close of the exchange or market on which the security is principally traded (for example, a foreign exchange or market), but before the fund calculates its net asset value, the fund may value these investments at fair value as determined in accordance with the procedures approved by the Board of Directors. Certain factors may be considered when fair valuing investments such as: fundamental analytical data, the nature and duration of restrictions on disposition, an evaluation of the forces that influence the market in which the securities are purchased and sold, and public trading in similar securities of the issuer or comparable issuers. These securities are either categorized as Level 2 or 3 depending on the relevant inputs used.
For restricted securities where observable inputs are limited, assumptions about market activity and risk are used and are categorized within Level 3 of the fair value hierarchy.
Financial futures and options, which are traded on an exchange, are valued at the last sales price on the securities exchange on which such securities are primarily traded or at the last sales price on the national securities market on each business day. These securities are generally categorized within Level 1 of the fair value hierarchy. Options traded over-the-counter are valued at the mean between the bid and asked
68
price.These securities are generally categorized within Level 2 of the fair value hierarchy. Investments denominated in foreign currencies are translated to U.S. dollars at the prevailing rates of exchange. Forward foreign currency exchange contracts (“forward contracts”) are valued at the forward rate. These securities are generally categorized within Level 2 of the fair value hierarchy.
The following is a summary of the inputs used as of October 31, 2011 in valuing the fund’s investments:
| | | | | | | |
| | | | Level 2—Other | | Level 3— | | |
| | Level 1— | | Significant | | Significant | | |
| | Unadjusted | | Observable | | Unobservable | | |
| | Quoted Prices | | Inputs | | Inputs | Total | |
| Assets ($) | | | | | | | |
| Investments in Securities: | | | | | | |
| Equity Securities— | | | | | | | |
| Domestic† | 23,671,187 | | — | | — | 23,671,187 | |
| Equity Securities— | | | | | | | |
| Foreign† | 15,638,414 | | 6,955,959 | †† | 583 | 22,594,956 | |
| Mutual Funds | 12,607,663 | | — | | — | 12,607,663 | |
| U.S. Treasury | — | | 14,279,334 | | — | 14,279,334 | |
| Rights† | 683 | | | | | 683 | |
| Other Financial | | | | | | | |
| Instruments: | | | | | | | |
| Forward Foreign | | | | | | | |
| Currency Exchange | | | | | | | |
| Contracts††† | — | | 3,185,933 | | — | 3,185,933 | |
| Futures††† | 1,086,754 | | — | | — | 1,086,754 | |
| Options Purchased | 4,258,491 | | — | | — | 4,258,491 | |
| Liabilities ($) | | | | | | | |
| Other Financial | | | | | | | |
| Instruments: | | | | | | | |
| Forward Foreign | | | | | | | |
| Currency Exchange | | | | | | | |
| Contracts††† | — | | (3,561,263 | ) | — | (3,561,263 | ) |
| Futures††† | (372,750 | ) | — | | — | (372,750 | ) |
| Options Written | (63,125 | ) | — | | — | (63,125 | ) |
| |
| † | See Statement of Investments for additional detailed categorizations. |
| †† | Securities classified as Level 2 at period end as the values were determined pursuant to the |
| | fund’s fair valuation procedures. |
| ††† | Amount shown represents unrealized appreciation (depreciation) at period end. |
The Fund 69
NOTES TO FINANCIAL STATEMENTS (continued)
The following is a reconciliation of Level 3 assets for which significant unobservable inputs were used to determine fair value:
| | |
| | Equity Securities— | |
| | Foreign ($) | |
| Balance as of 10/31/2010 | 4 | |
| Realized gain (loss) | — | |
| Change in unrealized appreciation (depreciation) | (1,486 | ) |
| Purchases | — | |
| Sales | — | |
| Transfers into Level 3† | 2,065 | |
| Transfers out of Level 3 | — | |
| Balance as of 10/31/2011 | 583 | |
| The amount of total gains (losses) for the period | | |
| included in earnings attributable to the change | | |
| in unrealized gains (losses) relating to | | |
| investments still held at 10/31/2011 | (1,486 | ) |
| |
| †††† | Transfers into Level 3 represent the value at the date of transfer.The transfer for the current |
| | period was due to the suspension of trading of a security. |
In May 2011, FASB issued Accounting Standards Update (“ASU”) No. 2011-04 “Amendments to Achieve Common FairValue Measurement and Disclosure Requirements in GAAP and International Financial Reporting Standards (“IFRS”)” (“ASU 2011-04”). ASU 2011-04 includes common requirements for measurement of and disclosure about fair value between GAAP and IFRS. ASU 2011-04 will require reporting entities to disclose the following information for fair value measurements categorized within Level 3 of the fair value hierarchy: quantitative information about the unobservable inputs used in the fair value measurement, the valuation processes used by the reporting entity and a narrative description of the sensitivity of the fair value measurement to changes in unobservable inputs and the interrelationships between those unobservable inputs. In addition, ASU 2011-04 will require reporting entities to make disclosures about amounts and reasons for all transfers in and out of Level 1 and Level 2 fair value measurements.The new and revised disclosures are effective for interim and annual reporting periods beginning after December 15, 2011. At this time, management is evaluating the implications of ASU 2011-04 and its impact on the financial statements.
70
(b) Foreign currency transactions: The fund does not isolate that portion of the results of operations resulting from changes in foreign exchange rates on investments from the fluctuations arising from changes in the market prices of securities held. Such fluctuations are included with the net realized and unrealized gain or loss on investments.
Net realized foreign exchange gains or losses arise from sales of foreign currencies, currency gains or losses realized on securities transactions between trade date and settlement date and the difference between the amounts of dividends, interest and foreign withholding taxes recorded on the fund’s books and the U.S. dollar equivalent of the amounts actually received or paid. Net unrealized foreign exchange gains or losses arise from changes in the value of assets and liabilities other than investments resulting from changes in exchange rates. Foreign currency gains and losses on investments are included with net realized and unrealized gain or loss on investments.
(c) Securities transactions and investment income: Securities transactions are recorded on a trade date basis. Realized gains and losses from securities transactions are recorded on the identified cost basis. Dividend income is recognized on the ex-dividend date and interest income, including, where applicable, accretion of discount and amortization of premium on investments, is recognized on the accrual basis.
Investing in foreign markets may involve special risks and considerations not typically associated with investing in the U.S. These risks include revaluation of currencies, high rates of inflation, repatriation restrictions on income and capital, and adverse political and economic developments. Moreover, securities issued in these markets may be less liquid, subject to government ownership controls and delayed settlements, and their prices may be more volatile than those of comparable securities in the U.S.
(d) Affiliated issuers: Investments in other investment companies advised by Dreyfus are defined as “affiliated” in the Act.
The Fund 71
NOTES TO FINANCIAL STATEMENTS (continued)
The fund may invest in shares of certain affiliated investment companies also advised or managed by Dreyfus. Investments in affiliated investment companies for the period ended October 31, 2011 were as follows:
| | | | | | | |
| Affiliated | | | | | | | |
| Investment | Value | | | | Value | | Net |
| Company | 10/31/2010 | ($) | Purchases ($) | Sales ($) | 10/31/2011 | ($) | Assets (%) |
| Dreyfus | | | | | | | |
| Institutional | | | | | | | |
| Preferred | | | | | | | |
| Plus Money | | | | | | | |
| Market Fund | 11,610,000 | | 35,748,072 | 34,750,409 | 12,607,663 | | 16.3 |
(e) Dividends to shareholders: Dividends are recorded on the ex-dividend date. Dividends from investment income-net and dividends from net realized capital gains, if any, are normally declared and paid annually, but the fund may make distributions on a more frequent basis to comply with the distribution requirements of the Internal Revenue Code of 1986, as amended (the “Code”).To the extent that net realized capital gains can be offset by capital loss carryovers, it is the policy of the fund not to distribute such gains. Income and capital gain distributions are determined in accordance with income tax regulations, which may differ from GAAP.
(f) Federal income taxes: It is the policy of the fund to continue to qualify as a regulated investment company, if such qualification is in the best interests of its shareholders, by complying with the applicable provisions of the Code, and to make distributions of taxable income sufficient to relieve it from substantially all federal income and excise taxes.
As of and during the period ended October 31, 2011, the fund did not have any liabilities for any uncertain tax positions.The fund recognizes interest and penalties, if any, related to uncertain tax positions as income tax expense in the Statement of Operations. During the period, the fund did not incur any interest or penalties.
Each of the tax years in the four-year period ended October 31, 2011 remains subject to examination by the Internal Revenue Service and state taxing authorities.
72
At October 31, 2011, the components of accumulated earnings on a tax basis were as follows: accumulated capital losses $80,623,634 and unrealized depreciation $3,916,441.
The accumulated capital loss carryover is available for federal income tax purposes to be applied against future net securities profits, if any, realized subsequent to October 31, 2011. If not applied, $62,287,181 of the carryover expires in fiscal 2016 and $18,336,453 expires in fiscal 2017.
Under the recently enacted Regulated Investment Company Modernization Act of 2010 (the “2010 Act”), the fund will be permitted to carry forward capital losses incurred in taxable years beginning after December 22, 2010 (“post-enactment losses”) for an unlimited period. However, the 2010 Act requires post-enactment losses to be utilized before the utilization of losses incurred in taxable years prior to the effective date of the 2010 Act. As a result of this ordering rule, capital loss carryovers related to taxable years beginning prior to the effective date of the 2010 Act may be more likely to expire unused.
During the period ended October 31, 2011, as a result of permanent book to tax differences, primarily due to the tax treatment for foreign currency transactions, passive foreign investment companies, net operating losses and real estate investment trusts, the fund increased accumulated undistributed investment income-net by $203,439, decreased accumulated net realized gain (loss) on investments by $138,000 and decreased paid-in capital by $65,439. Net assets and net asset value per share were not affected by this reclassification.
NOTE 2—Bank Lines of Credit:
The fund participates with other Dreyfus-managed funds in a $225 million unsecured credit facility led by Citibank, N.A. and a $300 million unsecured credit facility provided by The Bank of New York Mellon, a subsidiary of BNY Mellon and an affiliate of Dreyfus, (each, a “Facility”), each to be utilized primarily for temporary or emergency
The Fund 73
NOTES TO FINANCIAL STATEMENTS (continued)
purposes, including the financing of redemptions. In connection therewith, the fund has agreed to pay its pro rata portion of commitment fees for each Facility. Interest is charged to the fund based on rates determined pursuant to the terms of the respective Facility at the time of borrowing. During the period ended October 31, 2011, the fund did not borrow under the Facilities.
NOTE 3—Management Fee, Sub-Investment Advisory Fee and Other Transactions With Affiliates:
(a) Pursuant to a management agreement with Dreyfus, the management fee is computed at the annual rate of 1.10% of the value of the fund’s average daily net assets and is payable monthly.
Pursuant to a sub-investment advisory agreement between Dreyfus and Mellon Capital, Dreyfus pays Mellon Capital an annual fee of .65% of the value of the fund’s average daily net assets, payable monthly.
During the period ended October 31, 2011, the Distributor retained $2,117 from commissions earned on sales of the fund’s Class A shares and $1,065 from CDSCs on redemptions of the fund’s Class C shares.
(b) Under the Distribution Plan (the “Plan”) adopted pursuant to Rule 12b-1 under the Act, Class C shares pay the Distributor for distributing its shares at an annual rate of .75% of the value of the average daily net assets of Class C shares. During the period ended October 31, 2011, Class C shares were charged $80,751 pursuant to the Plan.
(c) Under the Shareholder Services Plan, Class A and Class C shares pay the Distributor at an annual rate of .25% of the value of their average daily net assets for the provision of certain services. The services provided may include personal services relating to shareholder accounts, such as answering shareholder inquiries regarding the fund and providing reports and other information, and services related to the maintenance of shareholder accounts. The Distributor may make payments to Service Agents (a securities dealer, financial institution or
74
other industry professional) in respect of these services. The Distributor determines the amounts to be paid to Service Agents. During the period ended October 31, 2011, Class A and Class C shares were charged $52,919 and $26,917, respectively, pursuant to the Shareholder Services Plan.
The fund compensates Dreyfus Transfer, Inc., a wholly-owned subsidiary of Dreyfus, under a transfer agency agreement for providing personnel and facilities to perform transfer agency services for the fund. During the period ended October 31, 2011, the fund was charged $16,055 pursuant to the transfer agency agreement, which is included in Shareholder servicing costs in the Statement of Operations.
The fund has arrangements with the custodian and cash management bank whereby the fund may receive earnings credits when positive cash balances are maintained, which are used to offset custody and cash management fees. For financial reporting purposes, the fund includes net earnings credits as an expense offset in the Statement of Operations.
The fund compensates The Bank of New York Mellon under cash management agreements for performing cash management services related to fund subscriptions and redemptions. During the period ended October 31, 2011, the fund was charged $1,252 pursuant to the cash management agreements, which is included in Shareholder servicing costs in the Statement of Operations.These fees were partially offset by earnings credits of $50.
The fund also compensates The Bank of New York Mellon under a custody agreement for providing custodial services for the fund. During the period ended October 31, 2011, the fund was charged $24,612 pursuant to the custody agreement.
During the period ended October 31, 2011, the fund was charged $6,751 for services performed by the Chief Compliance Officer.
The Fund 75
NOTES TO FINANCIAL STATEMENTS (continued)
The components of “Due to The Dreyfus Corporation and affiliates” in the Statement of Assets and Liabilities consist of: management fees $70,518, Rule 12b-1 distribution plan fees $5,809, shareholder services plan fees $5,907, custodian fees $5,062, chief compliance officer fees $4,246 and transfer agency per account fees $4,100.
(d) Each Board member also serves as a Board member of other funds within the Dreyfus complex. Annual retainer fees and attendance fees are allocated to each fund based on net assets.
NOTE 4—Securities Transactions:
The aggregate amount of purchases and sales of investment securities, excluding short-term securities, financial futures, options transactions and forward contracts during the period ended October 31, 2011, amounted to $11,095,598 and $2,006,748, respectively.
The following tables show the fund’s exposure to different types of market risk as it relates to the statement of Assets and Liabilities and the Statement of Operations, respectively.
Fair value of derivative instruments as of October 31, 2011 is shown below:
| | | | |
| | Derivative | | Derivative | |
| | Assets ($) | | Liabilities ($) | |
| Equity risk1,2 | 875,402 | Equity risk1,3 | (310,497 | ) |
| Interest rate risk1,2 | 4,469,843 | Interest rate risk1 | (125,378 | ) |
| Foreign exchange risk4 | 3,185,933 | Foreign exchange risk5 | (3,561,263 | ) |
| Gross fair value of | | | | |
| derivative contracts | 8,531,178 | | (3,997,138 | ) |
Statement of Assets and Liabilities location:
| |
| 1 | Includes cumulative appreciation (depreciation) on futures contracts as reported in the Statement of |
| | Financial Futures, but only the unpaid variation margin is reported in the Statement of Assets |
| | and Liabilities. |
| 2 | Options purchased are included in Investments in securities of Unaffiliated issuers at market value. |
| 3 | Outstanding options written, at value. |
| 4 | Unrealized appreciation on forward foreign currency exchange contracts. |
| 5 | Unrealized depreciation on forward foreign currency exchange contracts. |
76
The effect of derivative instruments in the Statement of Operations during the period ended October 31, 2011 is shown below:
| | | | | | | |
| | Amount of realized gain or (loss) on derivatives recognized in income ($) | |
| | | | | | Forward | | |
| Underlying risk | Futures6 | | Options7 | | Contracts8 | Total | |
| Equity | (590,178 | ) | (12,978 | ) | — | (603,156 | ) |
| Interest rate | 252,587 | | 1,723,084 | | — | 1,975,671 | |
| Foreign exchange | — | | — | | 841,432 | 841,432 | |
| Total | (337,591 | ) | 1,710,106 | | 841,432 | 2,213,947 | |
| | | | | | | |
| Change in unrealized appreciation or (depreciation) on derivatives recognized in income ($) | |
| | | | | Forward | | | |
| Underlying risk | Futures9 | Options10 | | Contracts11 | | Total | |
| Equity | 625,176 | (37,822 | ) | — | | 587,354 | |
| Interest rate | 68,905 | (144,888 | ) | — | | (75,983 | ) |
| Foreign exchange | — | — | | (687,551 | ) | (687,551 | ) |
| Total | 694,081 | (182,710 | ) | (687,551 | ) | (176,180 | ) |
Statement of Operations location:
| |
| 6 | Net realized gain (loss) on financial futures. |
| 7 | Net realized gain (loss) on options transactions. |
| 8 | Net realized gain (loss) on forward foreign currency exchange contracts. |
| 9 | Net unrealized appreciation (depreciation) on financial futures. |
| 10 Net unrealized appreciation (depreciation) on options transactions. |
| 11 Net unrealized appreciation (depreciation) on forward foreign currency exchange contracts. |
Futures Contracts: In the normal course of pursuing its investment objective, the fund is exposed to market risk, including equity price risk and interest rate risk, as a result of changes in value of underlying financial instruments.The fund invests in financial futures contracts in order to manage its exposure to or protect against changes in the market. A futures contract represents a commitment for the future purchase or a sale of an asset at a specified date. Upon entering into such contracts, these investments require initial margin deposits with a broker, which consist of cash or cash equivalents. The amount of these deposits is determined by the exchange or Board of Trade on which the contract is traded and is subject to change. Accordingly, variation margin payments are received or made to reflect daily unrealized gains or losses
The Fund 77
NOTES TO FINANCIAL STATEMENTS (continued)
which are recorded in the Statement of Operations. Futures contracts are valued daily at the last sales price established by the Board of Trade or exchange upon which they are traded. When the contracts are closed, the fund recognizes a realized gain or loss. There is minimal counterparty credit risk to the fund with futures since futures are exchange traded, and the exchange’s clearinghouse guarantees the futures against default. Contracts open at October 31, 2011 are set forth in the Statement of Financial Futures.
Options: The fund purchases and writes (sells) put and call options to hedge against changes in interest rates and the value of equities or as a substitute for an investment.The fund is subject to interest rate risk and equity risk in the course of pursuing its investment objectives through its investments in options contracts. A call option gives the purchaser of the option the right (but not the obligation) to buy, and obligates the writer to sell, the underlying security or securities at the exercise price at any time during the option period, or at a specified date. Conversely, a put option gives the purchaser of the option the right (but not the obligation) to sell, and obligates the writer to buy the underlying security or securities at the exercise price at any time during the option period, or at a specified date.
As a writer of call options, the fund receives a premium at the outset and then bears the market risk of unfavorable changes in the price of the financial instrument underlying the option. Generally, the fund realizes a gain, to the extent of the premium, if the price of the underlying financial instrument decreases between the date the option is written and the date on which the option is terminated. Generally, the fund incurs a loss, if the price of the financial instrument increases between those dates.
As a writer of put options, the fund receives a premium at the outset and then bears the market risk of unfavorable changes in the price of the financial instrument underlying the option. Generally, the fund realizes a gain, to the extent of the premium, if the price of the underlying financial instrument increases between the date the option is written and the date on which the option is terminated. Generally, the fund incurs a loss, if the price of the financial instrument decreases between those dates.
78
As a writer of an option, the fund has no control over whether the underlying securities may be sold (call) or purchased (put) and as a result bears the market risk of an unfavorable change in the price of the security underlying the written option.There is a risk of loss from a change in value of such options which may exceed the related premiums received. One risk of holding a put or a call option is that if the option is not sold or exercised prior to its expiration, it becomes worthless. However, this risk is limited to the premium paid by the fund. Upon the expiration or closing of the option transaction, a gain or loss is reported in the Statement of Operations.
The following summarizes the fund’s call/put options written during the period ended October 31, 2011:
| | | | |
| | | | Options Terminated |
| | Number of | Premiums | | Net Realized |
| Options Written: | Contracts | Received ($) | Cost ($) | Gain ($) |
| Contracts outstanding | | | | |
| October 31, 2010 | — | — | | |
| Contracts written | 290 | 97,132 | | |
| Contracts terminated: | | | | |
| Contracts closed | 90 | 33,528 | 12,978 | 20,550 |
| Contracts Outstanding | | | | |
| October 31, 2011 | 200 | 63,604 | | |
Forward Foreign Currency Exchange Contracts: The fund enters into forward contracts in order to hedge its exposure to changes in foreign currency exchange rates on its foreign portfolio holdings, to settle foreign currency transactions or as a part of its investment strategy. When executing forward contracts, the fund is obligated to buy or sell a foreign currency at a specified rate on a certain date in the future. With respect to sales of forward contracts, the fund incurs a loss if the value of the contract increases between the date the forward contract is opened and the date the forward contract is closed.The fund realizes a gain if the value of the contract decreases between those dates.With respect to purchases of forward contracts, the fund incurs a loss if the value of the contract decreases between the date the forward contract
The Fund 79
NOTES TO FINANCIAL STATEMENTS (continued)
is opened and the date the forward contract is closed.The fund realizes a gain if the value of the contract increases between those dates. Any realized gain or loss which occurred during the period is reflected in the Statement of Operations.The fund is exposed to foreign currency risk as a result of changes in value of underlying financial instruments. The fund is also exposed to credit risk associated with counterparty nonperformance on these forward contracts, which is typically limited to the unrealized gain on each open contract.The following summarizes open forward contracts at October 31, 2011:
| | | | |
| | Foreign | | | Unrealized |
| Forward Foreign Currency | Currency | | | Appreciation |
| Exchange Contracts | Amounts | Cost ($) | Value ($) | (Depreciation) ($) |
| Purchases: | | | | |
| Australian Dollar, | | | | |
| Expiring 12/21/2011 | 602,800 | 613,694 | 631,291 | 17,597 |
| Australian Dollar, | | | | |
| Expiring 12/21/2011 | 1,096,000 | 1,116,842 | 1,147,803 | 30,961 |
| Australian Dollar, | | | | |
| Expiring 12/21/2011 | 1,041,200 | 1,059,738 | 1,090,412 | 30,674 |
| Australian Dollar, | | | | |
| Expiring 12/21/2011 | 22,000 | 22,198 | 23,040 | 842 |
| Australian Dollar, | | | | |
| Expiring 12/21/2011 | 1,097,440 | 1,067,101 | 1,149,310 | 82,209 |
| Australian Dollar, | | | | |
| Expiring 12/21/2011 | 2,888 | 2,808 | 3,025 | 217 |
| Australian Dollar, | | | | |
| Expiring 12/21/2011 | 343,672 | 331,736 | 359,915 | 28,179 |
| Australian Dollar, | | | | |
| Expiring 12/21/2011 | 2,536,500 | 2,460,785 | 2,656,387 | 195,602 |
| Australian Dollar, | | | | |
| Expiring 12/21/2011 | 2,536,500 | 2,461,521 | 2,656,388 | 194,867 |
| Australian Dollar, | | | | |
| Expiring 12/21/2011 | 59,600 | 58,732 | 62,417 | 3,685 |
| Australian Dollar, | | | | |
| Expiring 12/21/2011 | 119,200 | 117,687 | 124,834 | 7,147 |
| Australian Dollar, | | | | |
| Expiring 12/21/2011 | 417,200 | 411,664 | 436,919 | 25,255 |
| Australian Dollar, | | | | |
| Expiring 12/21/2011 | 440,000 | 422,792 | 460,797 | 38,005 |
| Australian Dollar, | | | | |
| Expiring 12/21/2011 | 110,000 | 105,803 | 115,199 | 9,396 |
| Australian Dollar, | | | | |
| Expiring 12/21/2011 | 290,700 | 282,635 | 304,440 | 21,805 |
80
| | | | |
| | Foreign | | | Unrealized |
| Forward Foreign Currency | Currency | | | Appreciation |
| Exchange Contracts | Amounts | Cost ($) | Value ($) | (Depreciation) ($) |
| Purchases (continued): | | | | |
| Australian Dollar, | | | | |
| Expiring 12/21/2011 | 413,350 | 409,258 | 432,887 | 23,629 |
| Australian Dollar, | | | | |
| Expiring 12/21/2011 | 118,100 | 116,963 | 123,682 | 6,719 |
| Australian Dollar, | | | | |
| Expiring 12/21/2011 | 1,502,000 | 1,518,251 | 1,572,992 | 54,741 |
| Australian Dollar, | | | | |
| Expiring 12/21/2011 | 178,000 | 179,875 | 186,413 | 6,538 |
| Australian Dollar, | | | | |
| Expiring 12/21/2011 | 267,000 | 270,227 | 279,620 | 9,393 |
| Australian Dollar, | | | | |
| Expiring 12/21/2011 | 271,200 | 277,662 | 284,018 | 6,356 |
| Australian Dollar, | | | | |
| Expiring 12/21/2011 | 379,680 | 388,779 | 397,625 | 8,846 |
| Australian Dollar, | | | | |
| Expiring 12/21/2011 | 1,084,800 | 1,108,220 | 1,136,073 | 27,853 |
| Australian Dollar, | | | | |
| Expiring 12/21/2011 | 569,520 | 582,214 | 596,438 | 14,224 |
| Australian Dollar, | | | | |
| Expiring 12/21/2011 | 406,800 | 416,884 | 426,027 | 9,143 |
| British Pound, | | | | |
| Expiring 12/21/2011 | 1,290,677 | 2,039,799 | 2,074,140 | 34,341 |
| British Pound, | | | | |
| Expiring 12/21/2011 | 2,462,297 | 3,877,675 | 3,956,953 | 79,278 |
| British Pound, | | | | |
| Expiring 12/21/2011 | 629,660 | 989,479 | 1,011,874 | 22,395 |
| British Pound, | | | | |
| Expiring 12/21/2011 | 662,800 | 1,041,403 | 1,065,131 | 23,728 |
| British Pound, | | | | |
| Expiring 12/21/2011 | 364,540 | 572,569 | 585,822 | 13,253 |
| British Pound, | | | | |
| Expiring 12/21/2011 | 942,500 | 1,456,162 | 1,514,613 | 58,451 |
| British Pound, | | | | |
| Expiring 12/21/2011 | 942,500 | 1,458,028 | 1,514,613 | 56,585 |
| British Pound, | | | | |
| Expiring 12/21/2011 | 343,600 | 535,302 | 552,171 | 16,869 |
| British Pound, | | | | |
| Expiring 12/21/2011 | 266,290 | 415,936 | 427,933 | 11,997 |
| British Pound, | | | | |
| Expiring 12/21/2011 | 850,500 | 1,315,328 | 1,366,768 | 51,440 |
| British Pound, | | | | |
| Expiring 12/21/2011 | 212,625 | 328,728 | 341,692 | 12,964 |
The Fund 81
NOTES TO FINANCIAL STATEMENTS (continued)
| | | | | |
| | Foreign | | | Unrealized | |
| Forward Foreign Currency | Currency | | | Appreciation | |
| Exchange Contracts | Amounts | Cost ($) | Value ($) | (Depreciation) ($) | |
| Purchases (continued): | | | | | |
| British Pound, | | | | | |
| Expiring 12/21/2011 | 511,875 | 791,159 | 822,592 | 31,433 | |
| British Pound, | | | | | |
| Expiring 12/21/2011 | 109,440 | 168,321 | 175,871 | 7,550 | |
| British Pound, | | | | | |
| Expiring 12/21/2011 | 94,240 | 145,100 | 151,445 | 6,345 | |
| British Pound, | | | | | |
| Expiring 12/21/2011 | 215,840 | 332,463 | 346,859 | 14,396 | |
| British Pound, | | | | | |
| Expiring 12/21/2011 | 188,480 | 290,044 | 302,890 | 12,846 | |
| British Pound, | | | | | |
| Expiring 12/21/2011 | 644,000 | 989,989 | 1,034,919 | 44,930 | |
| British Pound, | | | | | |
| Expiring 12/21/2011 | 161,000 | 247,710 | 258,730 | 11,020 | |
| British Pound, | | | | | |
| Expiring 12/21/2011 | 323,200 | 509,774 | 519,388 | 9,614 | |
| British Pound, | | | | | |
| Expiring 12/21/2011 | 242,400 | 382,139 | 389,541 | 7,402 | |
| British Pound, | | | | | |
| Expiring 12/21/2011 | 808,000 | 1,273,549 | 1,298,469 | 24,920 | |
| British Pound, | | | | | |
| Expiring 12/21/2011 | 242,400 | 382,065 | 389,541 | 7,476 | |
| British Pound, | | | | | |
| Expiring 12/21/2011 | 414,120 | 647,895 | 665,498 | 17,603 | |
| British Pound, | | | | | |
| Expiring 12/21/2011 | 394,400 | 618,474 | 633,807 | 15,333 | |
| British Pound, | | | | | |
| Expiring 12/21/2011 | 769,080 | 1,205,256 | 1,235,925 | 30,669 | |
| British Pound, | | | | | |
| Expiring 12/21/2011 | 394,400 | 616,435 | 633,807 | 17,372 | |
| British Pound, | | | | | |
| Expiring 12/21/2011 | 479,180 | 752,210 | 770,050 | 17,840 | |
| British Pound, | | | | | |
| Expiring 12/21/2011 | 252,200 | 397,064 | 405,290 | 8,226 | |
| British Pound, | | | | | |
| Expiring 12/21/2011 | 529,620 | 832,546 | 851,108 | 18,562 | |
| Canadian Dollar, | | | | | |
| Expiring 12/21/2011 | 1,204,000 | 1,217,354 | 1,206,458 | (10,896 | ) |
| Canadian Dollar, | | | | | |
| Expiring 12/21/2011 | 1,143,800 | 1,154,019 | 1,146,136 | (7,883 | ) |
| Canadian Dollar, | | | | | |
| Expiring 12/21/2011 | 662,200 | 666,871 | 663,552 | (3,319 | ) |
| Canadian Dollar, | | | | | |
| Expiring 12/21/2011 | 2,386,411 | 2,418,063 | 2,391,284 | (26,779 | ) |
82
| | | | | |
| | Foreign | | | Unrealized | |
| Forward Foreign Currency | Currency | | | Appreciation | |
| Exchange Contracts | Amounts | Cost ($) | Value ($) | (Depreciation) ($) | |
| Purchases (continued): | | | | | |
| Canadian Dollar, | | | | | |
| Expiring 12/21/2011 | 728,000 | 739,354 | 729,486 | (9,868 | ) |
| Canadian Dollar, | | | | | |
| Expiring 12/21/2011 | 611,520 | 620,052 | 612,769 | (7,283 | ) |
| Canadian Dollar, | | | | | |
| Expiring 12/21/2011 | 3,319,680 | 3,381,648 | 3,326,459 | (55,189 | ) |
| Canadian Dollar, | | | | | |
| Expiring 12/21/2011 | 445,800 | 434,852 | 446,710 | 11,858 | |
| Canadian Dollar, | | | | | |
| Expiring 12/21/2011 | 463,400 | 453,843 | 464,346 | 10,503 | |
| Canadian Dollar, | | | | | |
| Expiring 12/21/2011 | 3,243,800 | 3,182,348 | 3,250,424 | 68,076 | |
| Canadian Dollar, | | | | | |
| Expiring 12/21/2011 | 926,800 | 909,493 | 928,692 | 19,199 | |
| Canadian Dollar, | | | | | |
| Expiring 12/21/2011 | 1,216,350 | 1,172,933 | 1,218,834 | 45,901 | |
| Canadian Dollar, | | | | | |
| Expiring 12/21/2011 | 325,750 | 316,247 | 326,415 | 10,168 | |
| Canadian Dollar, | | | | | |
| Expiring 12/21/2011 | 977,250 | 947,168 | 979,246 | 32,078 | |
| Canadian Dollar, | | | | | |
| Expiring 12/21/2011 | 516,250 | 503,324 | 517,304 | 13,980 | |
| Canadian Dollar, | | | | | |
| Expiring 12/21/2011 | 413,000 | 403,675 | 413,843 | 10,168 | |
| Canadian Dollar, | | | | | |
| Expiring 12/21/2011 | 1,135,750 | 1,109,279 | 1,138,069 | 28,790 | |
| Canadian Dollar, | | | | | |
| Expiring 12/21/2011 | 537,320 | 526,558 | 538,417 | 11,859 | |
| Canadian Dollar, | | | | | |
| Expiring 12/21/2011 | 282,800 | 277,609 | 283,378 | 5,769 | |
| Canadian Dollar, | | | | | |
| Expiring 12/21/2011 | 593,880 | 580,965 | 595,093 | 14,128 | |
| Euro, | | | | | |
| Expiring 12/21/2011 | 913,752 | 1,267,196 | 1,263,832 | (3,364 | ) |
| Euro, | | | | | |
| Expiring 12/21/2011 | 278,000 | 382,972 | 384,508 | 1,536 | |
| Euro, | | | | | |
| Expiring 12/21/2011 | 1,267,680 | 1,746,521 | 1,753,359 | 6,838 | |
| Euro, | | | | | |
| Expiring 12/21/2011 | 233,520 | 321,418 | 322,987 | 1,569 | |
| Euro, | | | | | |
| Expiring 12/21/2011 | 385,500 | 519,307 | 533,194 | 13,887 | |
| Euro, | | | | | |
| Expiring 12/21/2011 | 385,500 | 519,827 | 533,194 | 13,367 | |
The Fund 83
NOTES TO FINANCIAL STATEMENTS (continued)
| | | | | |
| | Foreign | | | Unrealized | |
| Forward Foreign Currency | Currency | | | Appreciation | |
| Exchange Contracts | Amounts | Cost ($) | Value ($) | (Depreciation) ($) | |
| Purchases (continued): | | | | | |
| Euro, | | | | | |
| Expiring 12/21/2011 | 187,800 | 255,850 | 259,751 | 3,901 | |
| Euro, | | | | | |
| Expiring 12/21/2011 | 1,314,600 | 1,790,544 | 1,818,254 | 27,710 | |
| Euro, | | | | | |
| Expiring 12/21/2011 | 375,600 | 511,885 | 519,501 | 7,616 | |
| Euro, | | | | | |
| Expiring 12/21/2011 | 316,800 | 430,479 | 438,174 | 7,695 | |
| Euro, | | | | | |
| Expiring 12/21/2011 | 538,560 | 732,210 | 744,895 | 12,685 | |
| Euro, | | | | | |
| Expiring 12/21/2011 | 422,400 | 573,505 | 584,231 | 10,726 | |
| Euro, | | | | | |
| Expiring 12/21/2011 | 834,240 | 1,136,360 | 1,153,857 | 17,497 | |
| Euro, | | | | | |
| Expiring 12/21/2011 | 84,600 | 113,336 | 117,012 | 3,676 | |
| Euro, | | | | | |
| Expiring 12/21/2011 | 338,400 | 453,160 | 468,049 | 14,889 | |
| Euro, | | | | | |
| Expiring 12/21/2011 | 572,220 | 769,532 | 791,451 | 21,919 | |
| Euro, | | | | | |
| Expiring 12/21/2011 | 523,500 | 713,454 | 724,065 | 10,611 | |
| Euro, | | | | | |
| Expiring 12/21/2011 | 174,500 | 238,222 | 241,355 | 3,133 | |
| Euro, | | | | | |
| Expiring 12/21/2011 | 1,703,000 | 2,351,928 | 2,355,460 | 3,532 | |
| Euro, | | | | | |
| Expiring 12/21/2011 | 567,200 | 781,389 | 784,508 | 3,119 | |
| Euro, | | | | | |
| Expiring 12/21/2011 | 850,800 | 1,172,407 | 1,176,762 | 4,355 | |
| Euro, | | | | | |
| Expiring 12/21/2011 | 116,280 | 159,061 | 160,829 | 1,768 | |
| Euro, | | | | | |
| Expiring 12/21/2011 | 61,200 | 83,997 | 84,647 | 650 | |
| Euro, | | | | | |
| Expiring 12/21/2011 | 128,520 | 175,955 | 177,759 | 1,804 | |
| Euro, | | | | | |
| Expiring 12/21/2011 | 128,400 | 181,891 | 177,593 | (4,298 | ) |
| Euro, | | | | | |
| Expiring 12/21/2011 | 263,220 | 372,870 | 364,066 | (8,804 | ) |
| Euro, | | | | | |
| Expiring 12/21/2011 | 134,820 | 191,025 | 186,473 | (4,552 | ) |
| Euro, | | | | | |
| Expiring 12/21/2011 | 115,560 | 163,628 | 159,833 | (3,795 | ) |
84
| | | | | |
| | Foreign | | | Unrealized | |
| Forward Foreign Currency | Currency | | | Appreciation | |
| Exchange Contracts | Amounts | Cost ($) | Value ($) | (Depreciation) ($) | |
| Purchases (continued): | | | | | |
| Japanese Yen, | | | | | |
| Expiring 12/21/2011 | 161,585,946 | 2,104,888 | 2,068,993 | (35,895 | ) |
| Japanese Yen, | | | | | |
| Expiring 12/21/2011 | 219,146,993 | 2,863,282 | 2,806,022 | (57,260 | ) |
| Japanese Yen, | | | | | |
| Expiring 12/21/2011 | 223,574,204 | 2,918,990 | 2,862,709 | (56,281 | ) |
| Japanese Yen, | | | | | |
| Expiring 12/21/2011 | 70,678,584 | 922,962 | 904,989 | (17,973 | ) |
| Japanese Yen, | | | | | |
| Expiring 12/21/2011 | 32,943,625 | 429,018 | 421,820 | (7,198 | ) |
| Japanese Yen, | | | | | |
| Expiring 12/21/2011 | 150,222,930 | 1,956,639 | 1,923,498 | (33,141 | ) |
| Japanese Yen, | | | | | |
| Expiring 12/21/2011 | 27,672,645 | 360,275 | 354,329 | (5,946 | ) |
| Japanese Yen, | | | | | |
| Expiring 12/21/2011 | 56,659,900 | 742,137 | 725,490 | (16,647 | ) |
| Japanese Yen, | | | | | |
| Expiring 12/21/2011 | 32,803,100 | 429,505 | 420,020 | (9,485 | ) |
| Japanese Yen, | | | | | |
| Expiring 12/21/2011 | 59,642,000 | 781,123 | 763,674 | (17,449 | ) |
| Japanese Yen, | | | | | |
| Expiring 12/21/2011 | 25,948,200 | 338,913 | 332,248 | (6,665 | ) |
| Japanese Yen, | | | | | |
| Expiring 12/21/2011 | 181,637,400 | 2,374,748 | 2,325,738 | (49,010 | ) |
| Japanese Yen, | | | | | |
| Expiring 12/21/2011 | 51,896,400 | 677,770 | 664,496 | (13,274 | ) |
| Japanese Yen, | | | | | |
| Expiring 12/21/2011 | 45,595,730 | 592,198 | 583,821 | (8,377 | ) |
| Japanese Yen, | | | | | |
| Expiring 12/21/2011 | 58,833,200 | 766,455 | 753,317 | (13,138 | ) |
| Japanese Yen, | | | | | |
| Expiring 12/21/2011 | 72,568,920 | 946,451 | 929,194 | (17,257 | ) |
| Japanese Yen, | | | | | |
| Expiring 12/21/2011 | 64,281,250 | 838,961 | 823,076 | (15,885 | ) |
| Japanese Yen, | | | | | |
| Expiring 12/21/2011 | 192,843,750 | 2,517,260 | 2,469,228 | (48,032 | ) |
| Japanese Yen, | | | | | |
| Expiring 12/21/2011 | 110,367,600 | 1,433,904 | 1,413,179 | (20,725 | ) |
| Japanese Yen, | | | | | |
| Expiring 12/21/2011 | 165,551,400 | 2,149,139 | 2,119,768 | (29,371 | ) |
| Japanese Yen, | | | | | |
| Expiring 12/21/2011 | 12,039,700 | 155,762 | 154,160 | (1,602 | ) |
| Japanese Yen, | | | | | |
| Expiring 12/21/2011 | 25,283,370 | 327,273 | 323,735 | (3,538 | ) |
The Fund 85
NOTES TO FINANCIAL STATEMENTS (continued)
| | | | | |
| | Foreign | | | Unrealized | |
| Forward Foreign Currency | Currency | | | Appreciation | |
| Exchange Contracts | Amounts | Cost ($) | Value ($) | (Depreciation) ($) | |
| Purchases (continued): | | | | | |
| Japanese Yen, | | | | | |
| Expiring 12/21/2011 | 48,158,800 | 623,092 | 616,639 | (6,453 | ) |
| Japanese Yen, | | | | | |
| Expiring 12/21/2011 | 16,855,580 | 218,311 | 215,824 | (2,487 | ) |
| Japanese Yen, | | | | | |
| Expiring 12/21/2011 | 18,059,550 | 234,147 | 231,239 | (2,908 | ) |
| Japanese Yen, | | | | | |
| Expiring 12/21/2011 | 24,026,600 | 313,340 | 307,644 | (5,696 | ) |
| Japanese Yen, | | | | | |
| Expiring 12/21/2011 | 60,066,500 | 783,146 | 769,109 | (14,037 | ) |
| Japanese Yen, | | | | | |
| Expiring 12/21/2011 | 18,019,950 | 235,052 | 230,732 | (4,320 | ) |
| Japanese Yen, | | | | | |
| Expiring 12/21/2011 | 18,019,950 | 235,109 | 230,732 | (4,377 | ) |
| Japanese Yen, | | | | | |
| Expiring 12/21/2011 | 914,550 | 11,928 | 11,710 | (218 | ) |
| Japanese Yen, | | | | | |
| Expiring 12/21/2011 | 871,000 | 11,361 | 11,153 | (208 | ) |
| Japanese Yen, | | | | | |
| Expiring 12/21/2011 | 871,000 | 11,346 | 11,153 | (193 | ) |
| Japanese Yen, | | | | | |
| Expiring 12/21/2011 | 1,698,450 | 22,159 | 21,747 | (412 | ) |
| Japanese Yen, | | | | | |
| Expiring 12/21/2011 | 32,272,800 | 420,104 | 413,230 | (6,874 | ) |
| Japanese Yen, | | | | | |
| Expiring 12/21/2011 | 29,199,200 | 379,753 | 373,875 | (5,878 | ) |
| Japanese Yen, | | | | | |
| Expiring 12/21/2011 | 15,368,000 | 200,049 | 196,776 | (3,273 | ) |
| Japanese Yen, | | | | | |
| Expiring 12/21/2011 | 18,159,120 | 239,863 | 232,515 | (7,348 | ) |
| Japanese Yen, | | | | | |
| Expiring 12/21/2011 | 35,453,520 | 468,392 | 453,957 | (14,435 | ) |
| Japanese Yen, | | | | | |
| Expiring 12/21/2011 | 17,294,400 | 228,534 | 221,442 | (7,092 | ) |
| Japanese Yen, | | | | | |
| Expiring 12/21/2011 | 15,564,960 | 205,749 | 199,298 | (6,451 | ) |
| New Zealand Dollar, | | | | | |
| Expiring 12/21/2011 | 3,325,119 | 2,712,499 | 2,679,297 | (33,202 | ) |
| New Zealand Dollar, | | | | | |
| Expiring 12/21/2011 | 160,890 | 122,722 | 129,641 | 6,919 | |
| New Zealand Dollar, | | | | | |
| Expiring 12/21/2011 | 207,600 | 158,094 | 167,278 | 9,184 | |
| New Zealand Dollar, | | | | | |
| Expiring 12/21/2011 | 606,750 | 471,272 | 488,904 | 17,632 | |
86
| | | | | |
| | Foreign | | | Unrealized | |
| Forward Foreign Currency | Currency | | | Appreciation | |
| Exchange Contracts | Amounts | Cost ($) | Value ($) | (Depreciation) ($) | |
| Purchases (continued): | | | | | |
| New Zealand Dollar, | | | | | |
| Expiring 12/21/2011 | 202,250 | 157,354 | 162,968 | 5,614 | |
| New Zealand Dollar, | | | | | |
| Expiring 12/21/2011 | 58,400 | 46,677 | 47,057 | 380 | |
| New Zealand Dollar, | | | | | |
| Expiring 12/21/2011 | 122,640 | 97,957 | 98,820 | 863 | |
| New Zealand Dollar, | | | | | |
| Expiring 12/21/2011 | 233,600 | 186,602 | 188,229 | 1,627 | |
| New Zealand Dollar, | | | | | |
| Expiring 12/21/2011 | 81,760 | 65,417 | 65,880 | 463 | |
| New Zealand Dollar, | | | | | |
| Expiring 12/21/2011 | 87,600 | 70,149 | 70,586 | 437 | |
| New Zealand Dollar, | | | | | |
| Expiring 12/21/2011 | 70,600 | 55,823 | 56,887 | 1,064 | |
| New Zealand Dollar, | | | | | |
| Expiring 12/21/2011 | 74,130 | 58,464 | 59,732 | 1,268 | |
| New Zealand Dollar, | | | | | |
| Expiring 12/21/2011 | 70,600 | 55,702 | 56,888 | 1,186 | |
| New Zealand Dollar, | | | | | |
| Expiring 12/21/2011 | 137,670 | 108,757 | 110,931 | 2,174 | |
| New Zealand Dollar, | | | | | |
| Expiring 12/21/2011 | 488,600 | 400,384 | 393,701 | (6,683 | ) |
| New Zealand Dollar, | | | | | |
| Expiring 12/21/2011 | 513,030 | 420,336 | 413,386 | (6,950 | ) |
| New Zealand Dollar, | | | | | |
| Expiring 12/21/2011 | 1,001,630 | 819,944 | 807,088 | (12,856 | ) |
| New Zealand Dollar, | | | | | |
| Expiring 12/21/2011 | 439,740 | 360,833 | 354,331 | (6,502 | ) |
| Norwegian Krone, | | | | | |
| Expiring 12/21/2011 | 6,380,812 | 1,139,156 | 1,142,757 | 3,601 | |
| Norwegian Krone, | | | | | |
| Expiring 12/21/2011 | 726,500 | 129,366 | 130,110 | 744 | |
| Norwegian Krone, | | | | | |
| Expiring 12/21/2011 | 610,260 | 108,482 | 109,293 | 811 | |
| Norwegian Krone, | | | | | |
| Expiring 12/21/2011 | 3,312,840 | 591,293 | 593,305 | 2,012 | |
| Norwegian Krone, | | | | | |
| Expiring 12/21/2011 | 5,343,200 | 942,382 | 956,928 | 14,546 | |
| Norwegian Krone, | | | | | |
| Expiring 12/21/2011 | 2,938,760 | 517,387 | 526,311 | 8,924 | |
| Norwegian Krone, | | | | | |
| Expiring 12/21/2011 | 5,076,040 | 895,545 | 909,082 | 13,537 | |
| Norwegian Krone, | | | | | |
| Expiring 12/21/2011 | 421,000 | 71,712 | 75,398 | 3,686 | |
The Fund 87
NOTES TO FINANCIAL STATEMENTS (continued)
| | | | |
| | Foreign | | | Unrealized |
| Forward Foreign Currency | Currency | | | Appreciation |
| Exchange Contracts | Amounts | Cost ($) | Value ($) | (Depreciation) ($) |
| Purchases (continued): | | | | |
| Norwegian Krone, | | | | |
| Expiring 12/21/2011 | 421,000 | 71,562 | 75,398 | 3,836 |
| Norwegian Krone, | | | | |
| Expiring 12/21/2011 | 1,280,800 | 218,276 | 229,382 | 11,106 |
| Norwegian Krone, | | | | |
| Expiring 12/21/2011 | 992,620 | 169,441 | 177,771 | 8,330 |
| Norwegian Krone, | | | | |
| Expiring 12/21/2011 | 2,048,160 | 351,675 | 366,811 | 15,136 |
| Norwegian Krone, | | | | |
| Expiring 12/21/2011 | 1,312,900 | 230,365 | 235,131 | 4,766 |
| Norwegian Krone, | | | | |
| Expiring 12/21/2011 | 4,595,150 | 805,594 | 822,958 | 17,364 |
| Norwegian Krone, | | | | |
| Expiring 12/21/2011 | 4,827,000 | 844,299 | 864,481 | 20,182 |
| Norwegian Krone, | | | | |
| Expiring 12/21/2011 | 1,609,000 | 282,201 | 288,160 | 5,959 |
| Norwegian Krone, | | | | |
| Expiring 12/21/2011 | 4,398,900 | 775,875 | 787,811 | 11,936 |
| Norwegian Krone, | | | | |
| Expiring 12/21/2011 | 1,999,500 | 351,919 | 358,096 | 6,177 |
| Norwegian Krone, | | | | |
| Expiring 12/21/2011 | 1,599,600 | 282,161 | 286,477 | 4,316 |
| Norwegian Krone, | | | | |
| Expiring 12/21/2011 | 646,500 | 115,513 | 115,783 | 270 |
| Norwegian Krone, | | | | |
| Expiring 12/21/2011 | 905,100 | 161,839 | 162,097 | 258 |
| Norwegian Krone, | | | | |
| Expiring 12/21/2011 | 2,586,000 | 462,744 | 463,134 | 390 |
| Norwegian Krone, | | | | |
| Expiring 12/21/2011 | 1,357,650 | 242,703 | 243,145 | 442 |
| Norwegian Krone, | | | | |
| Expiring 12/21/2011 | 969,750 | 173,436 | 173,675 | 239 |
| Norwegian Krone, | | | | |
| Expiring 12/21/2011 | 829,200 | 147,095 | 148,503 | 1,408 |
| Norwegian Krone, | | | | |
| Expiring 12/21/2011 | 870,660 | 153,846 | 155,929 | 2,083 |
| Norwegian Krone, | | | | |
| Expiring 12/21/2011 | 829,200 | 146,712 | 148,504 | 1,792 |
| Norwegian Krone, | | | | |
| Expiring 12/21/2011 | 1,616,940 | 286,590 | 289,582 | 2,992 |
| Swedish Krona, | | | | |
| Expiring 12/21/2011 | 7,084,875 | 1,060,983 | 1,084,055 | 23,072 |
| Swedish Krona, | | | | |
| Expiring 12/21/2011 | 23,658,546 | 3,519,883 | 3,619,988 | 100,105 |
88
| | | | | |
| | Foreign | | | Unrealized | |
| Forward Foreign Currency | Currency | | | Appreciation | |
| Exchange Contracts | Amounts | Cost ($) | Value ($) | (Depreciation) ($) | |
| Purchases (continued): | | | | | |
| Swedish Krona, | | | | | |
| Expiring 12/21/2011 | 10,352,836 | 1,561,627 | 1,584,085 | 22,458 | |
| Swedish Krona, | | | | | |
| Expiring 12/21/2011 | 1,049,000 | 157,233 | 160,507 | 3,274 | |
| Swedish Krona, | | | | | |
| Expiring 12/21/2011 | 881,160 | 131,962 | 134,826 | 2,864 | |
| Swedish Krona, | | | | | |
| Expiring 12/21/2011 | 4,783,440 | 718,590 | 731,913 | 13,323 | |
| Swedish Krona, | | | | | |
| Expiring 12/21/2011 | 2,856,800 | 429,544 | 437,118 | 7,574 | |
| Swedish Krona, | | | | | |
| Expiring 12/21/2011 | 1,571,240 | 236,049 | 240,415 | 4,366 | |
| Swedish Krona, | | | | | |
| Expiring 12/21/2011 | 2,713,960 | 407,752 | 415,262 | 7,510 | |
| Swedish Krona, | | | | | |
| Expiring 12/21/2011 | 809,900 | 119,831 | 123,923 | 4,092 | |
| Swedish Krona, | | | | | |
| Expiring 12/21/2011 | 1,619,800 | 239,955 | 247,845 | 7,890 | |
| Swedish Krona, | | | | | |
| Expiring 12/21/2011 | 5,669,300 | 840,245 | 867,458 | 27,213 | |
| Swedish Krona, | | | | | |
| Expiring 12/21/2011 | 7,718,800 | 1,121,081 | 1,181,052 | 59,971 | |
| Swedish Krona, | | | | | |
| Expiring 12/21/2011 | 5,982,070 | 873,623 | 915,315 | 41,692 | |
| Swedish Krona, | | | | | |
| Expiring 12/21/2011 | 3,436,020 | 497,685 | 525,745 | 28,060 | |
| Swedish Krona, | | | | | |
| Expiring 12/21/2011 | 859,005 | 124,202 | 131,436 | 7,234 | |
| Swedish Krona, | | | | | |
| Expiring 12/21/2011 | 2,067,975 | 299,711 | 316,420 | 16,709 | |
| Swedish Krona, | | | | | |
| Expiring 12/21/2011 | 911,600 | 132,858 | 139,484 | 6,626 | |
| Swedish Krona, | | | | | |
| Expiring 12/21/2011 | 3,646,400 | 530,517 | 557,935 | 27,418 | |
| Swedish Krona, | | | | | |
| Expiring 12/21/2011 | 6,708,540 | 986,656 | 1,026,472 | 39,816 | |
| Swedish Krona, | | | | | |
| Expiring 12/21/2011 | 871,500 | 130,820 | 133,348 | 2,528 | |
| Swedish Krona, | | | | | |
| Expiring 12/21/2011 | 3,050,250 | 457,666 | 466,718 | 9,052 | |
| Swiss Franc, | | | | | |
| Expiring 12/21/2011 | 419,496 | 479,973 | 478,325 | (1,648 | ) |
| Swiss Franc, | | | | | |
| Expiring 12/21/2011 | 88,100 | 98,567 | 100,455 | 1,888 | |
The Fund 89
NOTES TO FINANCIAL STATEMENTS (continued)
| | | | | |
| | Foreign | | | Unrealized | |
| Forward Foreign Currency | Currency | | | Appreciation | |
| Exchange Contracts | Amounts | Cost ($) | Value ($) | (Depreciation) ($) | |
| Purchases (continued): | | | | | |
| Swiss Franc, | | | | | |
| Expiring 12/21/2011 | 616,700 | 690,308 | 703,184 | 12,876 | |
| Swiss Franc, | | | | | |
| Expiring 12/21/2011 | 176,200 | 197,504 | 200,910 | 3,406 | |
| Swiss Franc, | | | | | |
| Expiring 12/21/2011 | 430,400 | 476,516 | 490,758 | 14,242 | |
| Swiss Franc, | | | | | |
| Expiring 12/21/2011 | 333,560 | 369,562 | 380,337 | 10,775 | |
| Swiss Franc, | | | | | |
| Expiring 12/21/2011 | 2,520 | 2,924 | 2,873 | (51 | ) |
| Swiss Franc, | | | | | |
| Expiring 12/21/2011 | 2,160 | 2,507 | 2,463 | (44 | ) |
| Swiss Franc, | | | | | |
| Expiring 12/21/2011 | 2,400 | 2,787 | 2,736 | (51 | ) |
| Swiss Franc, | | | | | |
| Expiring 12/21/2011 | 4,920 | 5,707 | 5,610 | (97 | ) |
| Sales: | | Proceeds ($) | | | |
| Australian Dollar, | | | | | |
| Expiring 12/21/2011 | 510,840 | 520,407 | 534,985 | (14,578 | ) |
| Australian Dollar, | | | | | |
| Expiring 12/21/2011 | 882,360 | 900,691 | 924,065 | (23,374 | ) |
| Australian Dollar, | | | | | |
| Expiring 12/21/2011 | 928,800 | 949,131 | 972,699 | (23,568 | ) |
| Australian Dollar, | | | | | |
| Expiring 12/21/2011 | 3,119,122 | 3,153,183 | 3,266,548 | (113,365 | ) |
| Australian Dollar, | | | | | |
| Expiring 12/21/2011 | 2,317,147 | 2,360,932 | 2,426,667 | (65,735 | ) |
| Australian Dollar, | | | | | |
| Expiring 12/21/2011 | 128,000 | 131,315 | 134,050 | (2,735 | ) |
| Australian Dollar, | | | | | |
| Expiring 12/21/2011 | 107,520 | 110,126 | 112,602 | (2,476 | ) |
| Australian Dollar, | | | | | |
| Expiring 12/21/2011 | 583,680 | 598,149 | 611,267 | (13,118 | ) |
| Australian Dollar, | | | | | |
| Expiring 12/21/2011 | 4,800 | 4,622 | 5,026 | (404 | ) |
| Australian Dollar, | | | | | |
| Expiring 12/21/2011 | 3,720 | 3,582 | 3,895 | (313 | ) |
| Australian Dollar, | | | | | |
| Expiring 12/21/2011 | 259,920 | 243,262 | 272,205 | (28,943 | ) |
| Australian Dollar, | | | | | |
| Expiring 12/21/2011 | 223,820 | 209,343 | 234,398 | (25,055 | ) |
| Australian Dollar, | | | | | |
| Expiring 12/21/2011 | 447,640 | 419,004 | 468,797 | (49,793 | ) |
90
| | | | | |
| | Foreign | | | Unrealized | |
| Forward Foreign Currency | Currency | | | Appreciation | |
| Exchange Contracts | Amounts | Proceeds ($) | Value ($) | (Depreciation) ($) | |
| Sales (continued): | | | | | |
| Australian Dollar, | | | | | |
| Expiring 12/21/2011 | 512,620 | 480,063 | 536,849 | (56,786 | ) |
| Australian Dollar, | | | | | |
| Expiring 12/21/2011 | 131,250 | 132,676 | 137,453 | (4,777 | ) |
| Australian Dollar, | | | | | |
| Expiring 12/21/2011 | 125,000 | 126,634 | 130,908 | (4,274 | ) |
| Australian Dollar, | | | | | |
| Expiring 12/21/2011 | 125,000 | 126,877 | 130,908 | (4,031 | ) |
| Australian Dollar, | | | | | |
| Expiring 12/21/2011 | 243,750 | 247,007 | 255,271 | (8,264 | ) |
| Australian Dollar, | | | | | |
| Expiring 12/21/2011 | 73,080 | 77,863 | 76,534 | 1,329 | |
| Australian Dollar, | | | | | |
| Expiring 12/21/2011 | 142,680 | 151,948 | 149,423 | 2,525 | |
| Australian Dollar, | | | | | |
| Expiring 12/21/2011 | 69,600 | 74,071 | 72,890 | 1,181 | |
| Australian Dollar, | | | | | |
| Expiring 12/21/2011 | 62,640 | 66,724 | 65,601 | 1,123 | |
| British Pound, | | | | | |
| Expiring 12/21/2011 | 615,916 | 972,463 | 989,787 | (17,324 | ) |
| British Pound, | | | | | |
| Expiring 12/21/2011 | 246,540 | 389,134 | 396,194 | (7,060 | ) |
| British Pound, | | | | | |
| Expiring 12/21/2011 | 1,338,360 | 2,111,289 | 2,150,767 | (39,478 | ) |
| British Pound, | | | | | |
| Expiring 12/21/2011 | 293,500 | 463,154 | 471,659 | (8,505 | ) |
| British Pound, | | | | | |
| Expiring 12/21/2011 | 113,000 | 176,218 | 181,593 | (5,375 | ) |
| British Pound, | | | | | |
| Expiring 12/21/2011 | 1,887,200 | 2,900,434 | 3,032,762 | (132,328 | ) |
| British Pound, | | | | | |
| Expiring 12/21/2011 | 112,800 | 175,561 | 181,272 | (5,711 | ) |
| British Pound, | | | | | |
| Expiring 12/21/2011 | 203,100 | 318,310 | 326,385 | (8,075 | ) |
| British Pound, | | | | | |
| Expiring 12/21/2011 | 406,200 | 637,151 | 652,770 | (15,619 | ) |
| British Pound, | | | | | |
| Expiring 12/21/2011 | 1,421,700 | 2,224,747 | 2,284,696 | (59,949 | ) |
| British Pound, | | | | | |
| Expiring 12/21/2011 | 724,825 | 1,133,463 | 1,164,806 | (31,343 | ) |
| British Pound, | | | | | |
| Expiring 12/21/2011 | 367,000 | 572,116 | 589,775 | (17,659 | ) |
The Fund 91
NOTES TO FINANCIAL STATEMENTS (continued)
| | | | | |
| | Foreign | | | Unrealized | |
| Forward Foreign Currency | Currency | | | Appreciation | |
| Exchange Contracts | Amounts | Proceeds ($) | Value ($) | (Depreciation) ($) | |
| Sales (continued): | | | | | |
| British Pound, | | | | | |
| Expiring 12/21/2011 | 467,925 | 731,908 | 751,963 | (20,055 | ) |
| British Pound, | | | | | |
| Expiring 12/21/2011 | 275,250 | 429,763 | 442,331 | (12,568 | ) |
| British Pound, | | | | | |
| Expiring 12/21/2011 | 286,110 | 445,608 | 459,784 | (14,176 | ) |
| British Pound, | | | | | |
| Expiring 12/21/2011 | 1,013,950 | 1,587,868 | 1,629,435 | (41,567 | ) |
| British Pound, | | | | | |
| Expiring 12/21/2011 | 289,700 | 453,882 | 465,553 | (11,671 | ) |
| British Pound, | | | | | |
| Expiring 12/21/2011 | 616,000 | 959,780 | 989,922 | (30,142 | ) |
| British Pound, | | | | | |
| Expiring 12/21/2011 | 1,848,000 | 2,881,466 | 2,969,767 | (88,301 | ) |
| British Pound, | | | | | |
| Expiring 12/21/2011 | 2,445,000 | 3,851,975 | 3,929,156 | (77,181 | ) |
| British Pound, | | | | | |
| Expiring 12/21/2011 | 105,000 | 164,793 | 168,736 | (3,943 | ) |
| British Pound, | | | | | |
| Expiring 12/21/2011 | 84,000 | 131,749 | 134,989 | (3,240 | ) |
| British Pound, | | | | | |
| Expiring 12/21/2011 | 231,000 | 361,940 | 371,221 | (9,281 | ) |
| British Pound, | | | | | |
| Expiring 12/21/2011 | 29,400 | 46,417 | 47,246 | (829 | ) |
| British Pound, | | | | | |
| Expiring 12/21/2011 | 41,160 | 65,051 | 66,145 | (1,094 | ) |
| British Pound, | | | | | |
| Expiring 12/21/2011 | 117,600 | 185,785 | 188,985 | (3,200 | ) |
| British Pound, | | | | | |
| Expiring 12/21/2011 | 44,100 | 69,691 | 70,869 | (1,178 | ) |
| British Pound, | | | | | |
| Expiring 12/21/2011 | 61,740 | 97,527 | 99,217 | (1,690 | ) |
| British Pound, | | | | | |
| Expiring 12/21/2011 | 305,130 | 492,283 | 490,349 | 1,934 | |
| British Pound, | | | | | |
| Expiring 12/21/2011 | 290,600 | 468,357 | 466,999 | 1,358 | |
| British Pound, | | | | | |
| Expiring 12/21/2011 | 261,540 | 421,445 | 420,299 | 1,146 | |
| British Pound, | | | | | |
| Expiring 12/21/2011 | 595,730 | 960,412 | 957,348 | 3,064 | |
| Canadian Dollar, | | | | | |
| Expiring 12/21/2011 | 1,198,677 | 1,206,737 | 1,201,125 | 5,612 | |
| Canadian Dollar, | | | | | |
| Expiring 12/21/2011 | 220,400 | 221,708 | 220,850 | 858 | |
92
| | | | | |
| | Foreign | | | Unrealized | |
| Forward Foreign Currency | Currency | | | Appreciation | |
| Exchange Contracts | Amounts | Proceeds ($) | Value ($) | (Depreciation) ($) | |
| Sales (continued): | | | | | |
| Canadian Dollar, | | | | | |
| Expiring 12/21/2011 | 121,220 | 121,909 | 121,467 | 442 | |
| Canadian Dollar, | | | | | |
| Expiring 12/21/2011 | 209,380 | 210,703 | 209,807 | 896 | |
| Canadian Dollar, | | | | | |
| Expiring 12/21/2011 | 160,000 | 159,896 | 160,327 | (431 | ) |
| Canadian Dollar, | | | | | |
| Expiring 12/21/2011 | 4,412,000 | 4,269,939 | 4,421,010 | (151,071 | ) |
| Canadian Dollar, | | | | | |
| Expiring 12/21/2011 | 2,793,000 | 2,715,684 | 2,798,703 | (83,019 | ) |
| Canadian Dollar, | | | | | |
| Expiring 12/21/2011 | 2,793,000 | 2,708,479 | 2,798,703 | (90,224 | ) |
| Canadian Dollar, | | | | | |
| Expiring 12/21/2011 | 473,370 | 454,283 | 474,336 | (20,053 | ) |
| Canadian Dollar, | | | | | |
| Expiring 12/21/2011 | 610,800 | 586,180 | 612,047 | (25,867 | ) |
| Canadian Dollar, | | | | | |
| Expiring 12/21/2011 | 105,840 | 100,517 | 106,056 | (5,539 | ) |
| Canadian Dollar, | | | | | |
| Expiring 12/21/2011 | 254,800 | 242,909 | 255,320 | (12,411 | ) |
| Canadian Dollar, | | | | | |
| Expiring 12/21/2011 | 423,360 | 403,080 | 424,224 | (21,144 | ) |
| Canadian Dollar, | | | | | |
| Expiring 12/21/2011 | 212,660 | 200,051 | 213,094 | (13,043 | ) |
| Canadian Dollar, | | | | | |
| Expiring 12/21/2011 | 123,480 | 116,202 | 123,732 | (7,530 | ) |
| Canadian Dollar, | | | | | |
| Expiring 12/21/2011 | 243,530 | 229,274 | 244,027 | (14,753 | ) |
| Canadian Dollar, | | | | | |
| Expiring 12/21/2011 | 227,750 | 215,725 | 228,215 | (12,490 | ) |
| Canadian Dollar, | | | | | |
| Expiring 12/21/2011 | 501,050 | 475,140 | 502,073 | (26,933 | ) |
| Canadian Dollar, | | | | | |
| Expiring 12/21/2011 | 182,200 | 172,582 | 182,572 | (9,990 | ) |
| Canadian Dollar, | | | | | |
| Expiring 12/21/2011 | 106,330 | 99,929 | 106,547 | (6,618 | ) |
| Canadian Dollar, | | | | | |
| Expiring 12/21/2011 | 108,100 | 106,543 | 108,321 | (1,778 | ) |
| Canadian Dollar, | | | | | |
| Expiring 12/21/2011 | 227,010 | 223,248 | 227,474 | (4,226 | ) |
| Canadian Dollar, | | | | | |
| Expiring 12/21/2011 | 162,150 | 159,818 | 162,481 | (2,663 | ) |
| Canadian Dollar, | | | | | |
| Expiring 12/21/2011 | 432,400 | 425,440 | 433,283 | (7,843 | ) |
The Fund 93
NOTES TO FINANCIAL STATEMENTS (continued)
| | | | | |
| | Foreign | | | Unrealized | |
| Forward Foreign Currency | Currency | | | Appreciation | |
| Exchange Contracts | Amounts | Proceeds ($) | Value ($) | (Depreciation) ($) | |
| Sales (continued): | | | | | |
| Canadian Dollar, | | | | | |
| Expiring 12/21/2011 | 151,340 | 148,976 | 151,649 | (2,673 | ) |
| Canadian Dollar, | | | | | |
| Expiring 12/21/2011 | 206,700 | 202,725 | 207,122 | (4,397 | ) |
| Canadian Dollar, | | | | | |
| Expiring 12/21/2011 | 106,000 | 103,734 | 106,216 | (2,482 | ) |
| Canadian Dollar, | | | | | |
| Expiring 12/21/2011 | 106,000 | 104,032 | 106,216 | (2,184 | ) |
| Canadian Dollar, | | | | | |
| Expiring 12/21/2011 | 111,300 | 109,051 | 111,527 | (2,476 | ) |
| Euro, | | | | | |
| Expiring 12/21/2011 | 2,851,451 | 3,912,048 | 3,943,910 | (31,862 | ) |
| Euro, | | | | | |
| Expiring 12/21/2011 | 6,863,882 | 9,402,214 | 9,493,599 | (91,385 | ) |
| Euro, | | | | | |
| Expiring 12/21/2011 | 914,000 | 1,252,364 | 1,264,175 | (11,811 | ) |
| Euro, | | | | | |
| Expiring 12/21/2011 | 868,300 | 1,186,645 | 1,200,967 | (14,322 | ) |
| Euro, | | | | | |
| Expiring 12/21/2011 | 502,700 | 687,941 | 695,296 | (7,355 | ) |
| Euro, | | | | | |
| Expiring 12/21/2011 | 1,225,000 | 1,676,106 | 1,694,327 | (18,221 | ) |
| Euro, | | | | | |
| Expiring 12/21/2011 | 2,151,000 | 2,894,730 | 2,975,100 | (80,370 | ) |
| Euro, | | | | | |
| Expiring 12/21/2011 | 1,092,400 | 1,467,678 | 1,510,925 | (43,247 | ) |
| Euro, | | | | | |
| Expiring 12/21/2011 | 846,610 | 1,137,891 | 1,170,967 | (33,076 | ) |
| Euro, | | | | | |
| Expiring 12/21/2011 | 503,280 | 667,832 | 696,098 | (28,266 | ) |
| Euro, | | | | | |
| Expiring 12/21/2011 | 302,900 | 401,576 | 418,948 | (17,372 | ) |
| Euro, | | | | | |
| Expiring 12/21/2011 | 125,820 | 166,583 | 174,024 | (7,441 | ) |
| Euro, | | | | | |
| Expiring 12/21/2011 | 63,200 | 87,565 | 87,413 | 152 | |
| Euro, | | | | | |
| Expiring 12/21/2011 | 94,800 | 131,358 | 131,120 | 238 | |
| Euro, | | | | | |
| Expiring 12/21/2011 | 252,800 | 349,989 | 349,654 | 335 | |
| Euro, | | | | | |
| Expiring 12/21/2011 | 132,720 | 183,778 | 183,568 | 210 | |
| Euro, | | | | | |
| Expiring 12/21/2011 | 88,480 | 122,532 | 122,379 | 153 | |
94
| | | | | |
| | Foreign | | | Unrealized | |
| Forward Foreign Currency | Currency | | | Appreciation | |
| Exchange Contracts | Amounts | Proceeds ($) | Value ($) | (Depreciation) ($) | |
| Sales (continued): | | | | | |
| Euro, | | | | | |
| Expiring 12/21/2011 | 294,600 | 405,213 | 407,468 | (2,255 | ) |
| Euro, | | | | | |
| Expiring 12/21/2011 | 736,500 | 1,013,163 | 1,018,671 | (5,508 | ) |
| Euro, | | | | | |
| Expiring 12/21/2011 | 220,950 | 303,674 | 305,601 | (1,927 | ) |
| Euro, | | | | | |
| Expiring 12/21/2011 | 220,950 | 303,755 | 305,601 | (1,846 | ) |
| Euro, | | | | | |
| Expiring 12/21/2011 | 246,200 | 336,811 | 340,525 | (3,714 | ) |
| Euro, | | | | | |
| Expiring 12/21/2011 | 246,200 | 337,838 | 340,525 | (2,687 | ) |
| Euro, | | | | | |
| Expiring 12/21/2011 | 258,510 | 353,799 | 357,551 | (3,752 | ) |
| Euro, | | | | | |
| Expiring 12/21/2011 | 480,090 | 657,954 | 664,024 | (6,070 | ) |
| Japanese Yen, | | | | | |
| Expiring 12/21/2011 | 225,079,000 | 2,951,933 | 2,881,977 | 69,956 | |
| Japanese Yen, | | | | | |
| Expiring 12/21/2011 | 252,869,000 | 3,314,567 | 3,237,808 | 76,759 | |
| Japanese Yen, | | | | | |
| Expiring 12/21/2011 | 252,869,000 | 3,309,738 | 3,237,808 | 71,930 | |
| Japanese Yen, | | | | | |
| Expiring 12/21/2011 | 73,511,820 | 960,123 | 941,267 | 18,856 | |
| Japanese Yen, | | | | | |
| Expiring 12/21/2011 | 18,377,955 | 240,109 | 235,317 | 4,792 | |
| Japanese Yen, | | | | | |
| Expiring 12/21/2011 | 44,243,225 | 577,501 | 566,503 | 10,998 | |
| Japanese Yen, | | | | | |
| Expiring 12/21/2011 | 40,694,010 | 530,105 | 521,058 | 9,047 | |
| Japanese Yen, | | | | | |
| Expiring 12/21/2011 | 23,628,780 | 307,827 | 302,550 | 5,277 | |
| Japanese Yen, | | | | | |
| Expiring 12/21/2011 | 20,347,005 | 265,524 | 260,529 | 4,995 | |
| Japanese Yen, | | | | | |
| Expiring 12/21/2011 | 46,601,205 | 607,744 | 596,695 | 11,049 | |
| Japanese Yen, | | | | | |
| Expiring 12/21/2011 | 20,532,800 | 268,028 | 262,908 | 5,120 | |
| Japanese Yen, | | | | | |
| Expiring 12/21/2011 | 56,465,200 | 736,826 | 722,997 | 13,829 | |
| Japanese Yen, | | | | | |
| Expiring 12/21/2011 | 25,666,000 | 335,000 | 328,635 | 6,365 | |
| New Zealand Dollar, | | | | | |
| Expiring 12/21/2011 | 731,534 | 598,014 | 589,451 | 8,563 | |
The Fund 95
NOTES TO FINANCIAL STATEMENTS (continued)
| | | | | |
| | Foreign | | | Unrealized | |
| Forward Foreign Currency | Currency | | | Appreciation | |
| Exchange Contracts | Amounts | Proceeds ($) | Value ($) | (Depreciation) ($) | |
| Sales (continued): | | | | | |
| New Zealand Dollar, | | | | | |
| Expiring 12/21/2011 | 1,211,250 | 998,276 | 975,995 | 22,281 | |
| New Zealand Dollar, | | | | | |
| Expiring 12/21/2011 | 223,125 | 183,994 | 179,788 | 4,206 | |
| New Zealand Dollar, | | | | | |
| Expiring 12/21/2011 | 265,625 | 219,097 | 214,034 | 5,063 | |
| New Zealand Dollar, | | | | | |
| Expiring 12/21/2011 | 885,780 | 726,251 | 713,739 | 12,512 | |
| New Zealand Dollar, | | | | | |
| Expiring 12/21/2011 | 512,820 | 420,347 | 413,217 | 7,130 | |
| New Zealand Dollar, | | | | | |
| Expiring 12/21/2011 | 932,400 | 763,918 | 751,304 | 12,614 | |
| New Zealand Dollar, | | | | | |
| Expiring 12/21/2011 | 1,224,500 | 946,754 | 986,671 | (39,917 | ) |
| New Zealand Dollar, | | | | | |
| Expiring 12/21/2011 | 1,224,500 | 948,877 | 986,671 | (37,794 | ) |
| New Zealand Dollar, | | | | | |
| Expiring 12/21/2011 | 230,400 | 181,408 | 185,650 | (4,242 | ) |
| New Zealand Dollar, | | | | | |
| Expiring 12/21/2011 | 1,612,800 | 1,271,176 | 1,299,553 | (28,377 | ) |
| New Zealand Dollar, | | | | | |
| Expiring 12/21/2011 | 460,800 | 363,215 | 371,301 | (8,086 | ) |
| New Zealand Dollar, | | | | | |
| Expiring 12/21/2011 | 58,590 | 43,907 | 47,210 | (3,303 | ) |
| New Zealand Dollar, | | | | | |
| Expiring 12/21/2011 | 234,360 | 176,873 | 188,841 | (11,968 | ) |
| New Zealand Dollar, | | | | | |
| Expiring 12/21/2011 | 141,050 | 106,642 | 113,654 | (7,012 | ) |
| New Zealand Dollar, | | | | | |
| Expiring 12/21/2011 | 1,068,800 | 815,409 | 861,212 | (45,803 | ) |
| New Zealand Dollar, | | | | | |
| Expiring 12/21/2011 | 267,200 | 203,777 | 215,303 | (11,526 | ) |
| New Zealand Dollar, | | | | | |
| Expiring 12/21/2011 | 1,159,740 | 890,956 | 934,489 | (43,533 | ) |
| New Zealand Dollar, | | | | | |
| Expiring 12/21/2011 | 56,100 | 44,178 | 45,204 | (1,026 | ) |
| New Zealand Dollar, | | | | | |
| Expiring 12/21/2011 | 20,400 | 16,070 | 16,438 | (368 | ) |
| New Zealand Dollar, | | | | | |
| Expiring 12/21/2011 | 25,500 | 20,054 | 20,547 | (493 | ) |
| New Zealand Dollar, | | | | | |
| Expiring 12/21/2011 | 93,200 | 73,595 | 75,098 | (1,503 | ) |
| New Zealand Dollar, | | | | | |
| Expiring 12/21/2011 | 195,720 | 154,002 | 157,706 | (3,704 | ) |
96
| | | | | |
| | Foreign | | | Unrealized | |
| Forward Foreign Currency | Currency | | | Appreciation | |
| Exchange Contracts | Amounts | Proceeds ($) | Value ($) | (Depreciation) ($) | |
| Sales (continued): | | | | | |
| New Zealand Dollar, | | | | | |
| Expiring 12/21/2011 | 177,080 | 139,320 | 142,686 | (3,366 | ) |
| Norwegian Krone, | | | | | |
| Expiring 12/21/2011 | 21,524,042 | 3,799,947 | 3,854,800 | (54,853 | ) |
| Norwegian Krone, | | | | | |
| Expiring 12/21/2011 | 10,702,813 | 1,877,522 | 1,916,797 | (39,275 | ) |
| Norwegian Krone, | | | | | |
| Expiring 12/21/2011 | 1,631,100 | 283,939 | 292,118 | (8,179 | ) |
| Norwegian Krone, | | | | | |
| Expiring 12/21/2011 | 3,262,200 | 567,933 | 584,236 | (16,303 | ) |
| Norwegian Krone, | | | | | |
| Expiring 12/21/2011 | 11,417,700 | 1,980,998 | 2,044,828 | (63,830 | ) |
| Norwegian Krone, | | | | | |
| Expiring 12/21/2011 | 2,346,880 | 415,740 | 420,309 | (4,569 | ) |
| Norwegian Krone, | | | | | |
| Expiring 12/21/2011 | 1,235,200 | 218,747 | 221,215 | (2,468 | ) |
| Norwegian Krone, | | | | | |
| Expiring 12/21/2011 | 2,593,920 | 458,249 | 464,552 | (6,303 | ) |
| Norwegian Krone, | | | | | |
| Expiring 12/21/2011 | 544,140 | 99,947 | 97,452 | 2,495 | |
| Norwegian Krone, | | | | | |
| Expiring 12/21/2011 | 1,239,430 | 228,004 | 221,973 | 6,031 | |
| Norwegian Krone, | | | | | |
| Expiring 12/21/2011 | 634,830 | 116,876 | 113,693 | 3,183 | |
| Norwegian Krone, | | | | | |
| Expiring 12/21/2011 | 604,600 | 111,169 | 108,279 | 2,890 | |
| Swedish Krona, | | | | | |
| Expiring 12/21/2011 | 8,621,500 | 1,243,169 | 1,319,174 | (76,005 | ) |
| Swedish Krona, | | | | | |
| Expiring 12/21/2011 | 8,621,500 | 1,252,706 | 1,319,173 | (66,467 | ) |
| Swedish Krona, | | | | | |
| Expiring 12/21/2011 | 2,984,000 | 444,597 | 456,581 | (11,984 | ) |
| Swedish Krona, | | | | | |
| Expiring 12/21/2011 | 6,564,800 | 980,410 | 1,004,478 | (24,068 | ) |
| Swedish Krona, | | | | | |
| Expiring 12/21/2011 | 2,387,200 | 357,589 | 365,264 | (7,675 | ) |
| Swedish Krona, | | | | | |
| Expiring 12/21/2011 | 907,300 | 136,913 | 138,826 | (1,913 | ) |
| Swedish Krona, | | | | | |
| Expiring 12/21/2011 | 1,270,220 | 192,210 | 194,356 | (2,146 | ) |
| Swedish Krona, | | | | | |
| Expiring 12/21/2011 | 3,629,200 | 547,705 | 555,303 | (7,598 | ) |
| Swedish Krona, | | | | | |
| Expiring 12/21/2011 | 1,905,330 | 287,108 | 291,534 | (4,426 | ) |
The Fund 97
NOTES TO FINANCIAL STATEMENTS (continued)
| | | | | |
| | Foreign | | | Unrealized | |
| Forward Foreign Currency | Currency | | | Appreciation | |
| Exchange Contracts | Amounts | Proceeds ($) | Value ($) | (Depreciation) ($) | |
| Sales (continued): | | | | | |
| Swedish Krona, | | | | | |
| Expiring 12/21/2011 | 1,360,950 | 205,606 | 208,238 | (2,632 | ) |
| Swedish Krona, | | | | | |
| Expiring 12/21/2011 | 1,436,400 | 225,016 | 219,783 | 5,233 | |
| Swedish Krona, | | | | | |
| Expiring 12/21/2011 | 1,292,760 | 202,199 | 197,805 | 4,394 | |
| Swedish Krona, | | | | | |
| Expiring 12/21/2011 | 2,944,620 | 461,523 | 450,555 | 10,968 | |
| Swedish Krona, | | | | | |
| Expiring 12/21/2011 | 1,508,220 | 236,647 | 230,772 | 5,875 | |
| Swiss Franc, | | | | | |
| Expiring 12/21/2011 | 197,136 | 227,364 | 224,782 | 2,582 | |
| Swiss Franc, | | | | | |
| Expiring 12/21/2011 | 39,750 | 45,532 | 45,324 | 208 | |
| Swiss Franc, | | | | | |
| Expiring 12/21/2011 | 33,390 | 38,239 | 38,073 | 166 | |
| Swiss Franc, | | | | | |
| Expiring 12/21/2011 | 181,260 | 207,320 | 206,679 | 641 | |
| Swiss Franc, | | | | | |
| Expiring 12/21/2011 | 11,490 | 13,013 | 13,101 | (88 | ) |
| Swiss Franc, | | | | | |
| Expiring 12/21/2011 | 88,500 | 98,048 | 100,911 | (2,863 | ) |
| Swiss Franc, | | | | | |
| Expiring 12/21/2011 | 88,500 | 97,872 | 100,911 | (3,039 | ) |
| Swiss Franc, | | | | | |
| Expiring 12/21/2011 | 348,330 | 378,438 | 397,179 | (18,741 | ) |
| Swiss Franc, | | | | | |
| Expiring 12/21/2011 | 136,500 | 151,169 | 155,642 | (4,473 | ) |
| Swiss Franc, | | | | | |
| Expiring 12/21/2011 | 300,300 | 333,097 | 342,413 | (9,316 | ) |
| Swiss Franc, | | | | | |
| Expiring 12/21/2011 | 109,200 | 121,661 | 124,514 | (2,853 | ) |
| Swiss Franc, | | | | | |
| Expiring 12/21/2011 | 55,300 | 61,931 | 63,055 | (1,124 | ) |
| Swiss Franc, | | | | | |
| Expiring 12/21/2011 | 77,420 | 86,711 | 88,277 | (1,566 | ) |
| Swiss Franc, | | | | | |
| Expiring 12/21/2011 | 221,200 | 247,713 | 252,220 | (4,507 | ) |
| Swiss Franc, | | | | | |
| Expiring 12/21/2011 | 116,130 | 130,147 | 132,416 | (2,269 | ) |
98
| | | | | |
| | Foreign | | | Unrealized | |
| Forward Foreign Currency | Currency | | | Appreciation | |
| Exchange Contracts | Amounts | Proceeds ($) | Value ($) | (Depreciation) ($) | |
| Sales (continued): | | | | | |
| Swiss Franc, | | | | | |
| Expiring 12/21/2011 | 82,950 | 92,926 | 94,583 | (1,657 | ) |
| Swiss Franc, | | | | | |
| Expiring 12/21/2011 | 153,520 | 170,936 | 175,049 | (4,113 | ) |
| Swiss Franc, | | | | | |
| Expiring 12/21/2011 | 169,680 | 188,896 | 193,475 | (4,579 | ) |
| Swiss Franc, | | | | | |
| Expiring 12/21/2011 | 80,800 | 90,150 | 92,131 | (1,981 | ) |
| Gross Unrealized | | | | | |
| Appreciation | | | | 3,185,933 | |
| Gross Unrealized | | | | | |
| Depreciation | | | | (3,561,263 | ) |
The following summarizes the average market value of derivatives outstanding during the period ended October 31, 2011:
| |
| | Average Market Value ($) |
| Interest rate futures contracts | 42,353,077 |
| Equity futures contracts | 27,150,506 |
| Equity options contracts | 13,817 |
| Interest rate options contracts | 2,892,936 |
| Forward contracts | 52,568,598 |
At October 31, 2011, the cost of investments for federal income tax purposes was $81,892,685; accordingly, accumulated net unrealized depreciation on investments was $4,480,371, consisting of $5,699,091 gross unrealized appreciation and $10,179,462 gross unrealized depreciation.
The Fund 99
REPORT OF INDEPENDENT REGISTERED
PUBLIC ACCOUNTING FIRM
Shareholders and Board of Directors
Global Alpha Fund
We have audited the accompanying statement of assets and liabilities, including the statements of investments, financial futures and options written, of Global Alpha Fund (one of the series comprising Advantage Funds, Inc.) as of October 31, 2011, and the related statement of operations for the year then ended, the statement of changes in net assets for each of the two years in the period then ended and financial highlights for each of the years indicated therein.These financial statements and financial highlights are the responsibility of the Fund’s management. Our responsibility is to express an opinion on these financial statements and financial highlights based on our audits.
We conducted our audits in accordance with the standards of the Public Company Accounting Oversight Board (United States).Those standards require that we plan and perform the audit to obtain reasonable assurance about whether the financial statements and financial highlights are free of material misstatement.We were not engaged to perform an audit of the Fund’s internal control over financial reporting. Our audits included consideration of internal control over financial reporting as a basis for designing audit procedures that are appropriate in the circumstances, but not for the purpose of expressing an opinion on the effectiveness of the Fund’s internal control over financial reporting. Accordingly, we express no such opinion. An audit also includes examining, on a test basis, evidence supporting the amounts and disclosures in the financial statements and financial highlights, assessing the accounting principles used and significant estimates made by management, and evaluating the overall financial statement presentation. Our procedures included confirmation of securities owned as of October 31, 2011 by correspondence with the custodian and others.We believe that our audits provide a reasonable basis for our opinion.
In our opinion, the financial statements and financial highlights referred to above present fairly, in all material respects, the financial position of Global Alpha Fund at October 31, 2011, the results of its operations for the year then ended, the changes in its net assets for each of the two years in the period then ended and the financial highlights for each of the indicated years, in conformity with U.S. generally accepted accounting principles.

New York, New York
December 29, 2011
100
BOARD MEMBERS INFORMATION (Unaudited)
|
| Joseph S. DiMartino (68) |
| Chairman of the Board (1995) |
| Principal Occupation During Past 5Years: |
| • Corporate Director and Trustee |
| Other Public Company Board Memberships During Past 5Years: |
| • CBIZ (formerly, Century Business Services, Inc.), a provider of outsourcing functions for small |
| and medium size companies, Director (1997-present) |
| • Sunair Services Corporation, a provider of certain outdoor-related services to homes and |
| businesses, Director (2005-2009) |
| • The Newark Group, a provider of a national market of paper recovery facilities, paperboard |
| mills and paperboard converting plants, Director (2000-2010) |
| No. of Portfolios for which Board Member Serves: 167 |
| ——————— |
| Peggy C. Davis (68) |
| Board Member (2006) |
| Principal Occupation During Past 5Years: |
| • Shad Professor of Law, New York University School of Law |
| • Writer and teacher in the fields of evidence, constitutional theory, family law, social sciences |
| and the law, legal process and professional methodology and training |
| No. of Portfolios for which Board Member Serves: 53 |
| ——————— |
| David P. Feldman (71) |
| Board Member (1996) |
| Principal Occupation During Past 5Years: |
| • Corporate Director and Trustee |
| Other Public Company Board Memberships During Past 5Years: |
| • BBH Mutual Funds Group (4 registered mutual funds), Director (1992-present) |
| • QMed, Inc. a healthcare company, Director (1999-2007) |
| No. of Portfolios for which Board Member Serves: 50 |
The Fund 101
BOARD MEMBERS INFORMATION (Unaudited) (continued)
|
| Ehud Houminer (71) |
| Board Member (1993) |
| Principal Occupation During Past 5Years: |
| • Executive-in-Residence at the Columbia Business School, ColumbiaUniversity (1992-present) |
| Other Public Company Board Memberships During Past 5Years: |
| • Avnet Inc., an electronics distributor, Director (1993-present) |
| No. of Portfolios for which Board Member Serves: 64 |
| ——————— |
| Dr. Martin Peretz (72) |
| Board Member (2006) |
| Principal Occupation During Past 5Years: |
| • Editor-in-Chief Emeritus of The New Republic Magazine (2010-present) (previously, |
| Editor-in-Chief, 1974-2010) |
| • Director of TheStreet.com, a financial information service on the web (1996-present) |
| No. of Portfolios for which Board Member Serves: 35 |
| ——————— |
| Once elected all Board Members serve for an indefinite term, but achieve Emeritus status upon reaching age 80.The |
| address of the Board Members and Officers is in c/o The Dreyfus Corporation, 200 Park Avenue, NewYork, NewYork |
| 10166.Additional information about the Board Members is available in the fund’s Statement of Additional Information |
| which can be obtained from Dreyfus free of charge by calling this toll free number: 1-800-DREYFUS. |
| James F. Henry, Emeritus Board Member |
| Dr. Paul A. Marks, Emeritus Board Member |
| Gloria Messinger, Emeritus Board Member |
102
OFFICERS OF THE FUND (Unaudited)
The Fund 103
OFFICERS OF THE FUND (Unaudited) (continued)
104
The Fund 105
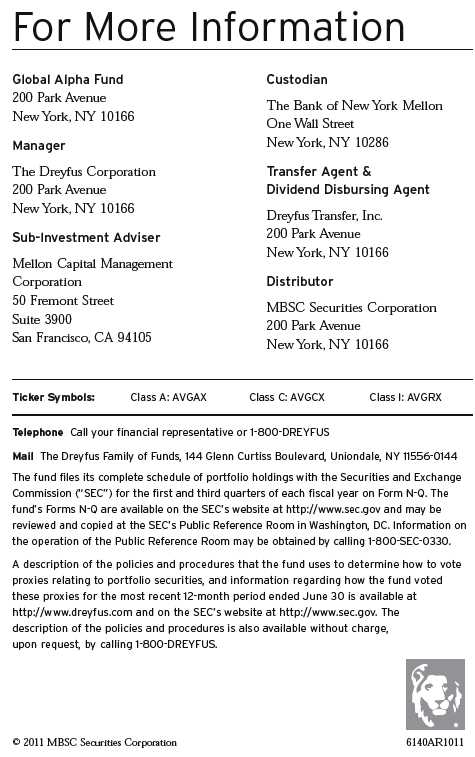
Item 2. Code of Ethics.
The Registrant has adopted a code of ethics that applies to the Registrant's principal executive officer, principal financial officer, principal accounting officer or controller, or persons performing similar functions. There have been no amendments to, or waivers in connection with, the Code of Ethics during the period covered by this Report.
Item 3. Audit Committee Financial Expert.
The Registrant's Board has determined that David P. Feldman, a member of the Audit Committee of the Board, is an audit committee financial expert as defined by the Securities and Exchange Commission (the "SEC"). Mr. David P. Feldman is "independent" as defined by the SEC for purposes of audit committee financial expert determinations.
Item 4. Principal Accountant Fees and Services.
(a) Audit Fees. The aggregate fees billed for each of the last two fiscal years (the "Reporting Periods") for profession0al services rendered by the Registrant's principal accountant (the "Auditor") for the audit of the Registrant's annual financial statements or services that are normally provided by the Auditor in connection with the statutory and regulatory filings or engagements for the Reporting Periods, were $115,000 in 2010 and $220,020 in 2011.
(b) Audit-Related Fees. The aggregate fees billed in the Reporting Periods for assurance and related services by the Auditor that are reasonably related to the performance of the audit of the Registrant's financial statements and are not reported under paragraph (a) of this Item 4 were $16,146 in 2010 and $24,000 in 2011. These services consisted of one or more of the following: (i) agreed upon procedures related to compliance with Internal Revenue Code section 817(h), (ii) security counts required by Rule 17f-2 under the Investment Company Act of 1940, as amended, (iii) advisory services as to the accounting or disclosure treatment of Registrant transactions or events and (iv) advisory services to the accounting or disclosure treatment of the actual or potential impact to the Registrant of final or proposed rules, standards or interpretations by the Securities and Exchange Commission, the Financial Accounting Standards Boards or other regulatory or standard-setting bodies.
The aggregate fees billed in the Reporting Periods for non-audit assurance and related services by the Auditor to the Registrant's investment adviser (not including any sub-investment adviser whose role is primarily portfolio management and is subcontracted with or overseen by another investment adviser), and any entity controlling, controlled by or under common control with the investment adviser that provides ongoing services to the Registrant ("Service Affiliates"), that were reasonably related to the performance of the annual audit of the Service Affiliate, which required pre-approval by the Audit Committee were $-0- in 2010 and $-0- in 2011.
(c) Tax Fees. The aggregate fees billed in the Reporting Periods for professional services rendered by the Auditor for tax compliance, tax advice, and tax planning ("Tax Services") were $16,143 in 2010 and $30,288 in 2011. These services consisted of: (i) review or preparation of U.S. federal, state, local and excise tax returns; (ii) U.S. federal, state and local tax planning, advice and assistance regarding statutory, regulatory or administrative developments; (iii) tax advice regarding tax qualification matters and/or treatment of various financial instruments held or proposed to be acquired or held, and (iv) determination of Passive Foreign Investment Companies. The aggregate fees billed in the Reporting Periods for Tax Services by the Auditor to Service Affiliates, which required pre-approval by the Audit Committee were $-0- in 2010 and $-0- in 2011.
(d) All Other Fees. The aggregate fees billed in the Reporting Periods for products and services provided by the Auditor, other than the services reported in paragraphs (a) through (c) of this Item, were $44 in 2010 and $58 in 2011. These services consisted of a review of the Registrant's anti-money laundering program.
The aggregate fees billed in the Reporting Periods for Non-Audit Services by the Auditor to Service Affiliates, other than the services reported in paragraphs (b) through (c) of this Item, which required pre-approval by the Audit Committee, were $-0- in 2010 and $-0- in 2011.
(e)(1) Audit Committee Pre-Approval Policies and Procedures. The Registrant's Audit Committee has established policies and procedures (the "Policy") for pre-approval (within specified fee limits) of the Auditor's engagements for non-audit services to the Registrant and Service Affiliates without specific case-by-case consideration. The pre-approved services in the Policy can include pre-approved audit services, pre-approved audit-related services, pre-approved tax services and pre-approved all other services. Pre-approval considerations include whether the proposed services are compatible with maintaining the Auditor's independence. Pre-approvals pursuant to the Policy are considered annually.
(e)(2) Note: None of the services described in paragraphs (b) through (d) of this Item 4 were approved by the Audit Committee pursuant to paragraph (c)(7)(i)(C) of Rule 2-01 of Regulation S-X.
(f) None of the hours expended on the principal accountant's engagement to audit the registrant's financial statements for the most recent fiscal year were attributed to work performed by persons other than the principal account's full-time, permanent employees.
Non-Audit Fees. The aggregate non-audit fees billed by the Auditor for services rendered to the Registrant, and rendered to Service Affiliates, for the Reporting Periods were $31,544,905 in 2010 and $16,139,606 in 2011.
Auditor Independence. The Registrant's Audit Committee has considered whether the provision of non-audit services that were rendered to Service Affiliates, which were not pre-approved (not requiring pre-approval), is compatible with maintaining the Auditor's independence.
Item 5. Audit Committee of Listed Registrants.
Not applicable. [CLOSED-END FUNDS ONLY]
Item 6. Investments.
(a) Not applicable.
Item 7. Disclosure of Proxy Voting Policies and Procedures for Closed-End Management
Investment Companies.
Not applicable. [CLOSED-END FUNDS ONLY]
Item 8. Portfolio Managers of Closed-End Management Investment Companies.
Not applicable. [CLOSED-END FUNDS ONLY, beginning with reports for periods ended on and after December 31, 2005]
Item 9. Purchases of Equity Securities by Closed-End Management Investment Companies and
Affiliated Purchasers.
Not applicable. [CLOSED-END FUNDS ONLY]
Item 10. Submission of Matters to a Vote of Security Holders.
There have been no material changes to the procedures applicable to Item 10.
Item 11. Controls and Procedures.
(a) The Registrant's principal executive and principal financial officers have concluded, based on their evaluation of the Registrant's disclosure controls and procedures as of a date within 90 days of the filing date of this report, that the Registrant's disclosure controls and procedures are reasonably designed to ensure that information required to be disclosed by the Registrant on Form N-CSR is recorded, processed, summarized and reported within the required time periods and that information required to be disclosed by the Registrant in the reports that it files or submits on Form N-CSR is accumulated and communicated to the Registrant's management, including its principal executive and principal financial officers, as appropriate to allow timely decisions regarding required disclosure.
(b) There were no changes to the Registrant's internal control over financial reporting that occurred during the second fiscal quarter of the period covered by this report that have materially affected, or are reasonably likely to materially affect, the Registrant's internal control over financial reporting.
Item 12. Exhibits.
(a)(1) Code of ethics referred to in Item 2.
(a)(2) Certifications of principal executive and principal financial officers as required by Rule 30a-2(a) under the Investment Company Act of 1940.
(a)(3) Not applicable.
(b) Certification of principal executive and principal financial officers as required by Rule 30a-2(b) under the Investment Company Act of 1940.
SIGNATURES
Pursuant to the requirements of the Securities Exchange Act of 1934 and the Investment Company Act of 1940, the Registrant has duly caused this Report to be signed on its behalf by the undersigned, thereunto duly authorized.
Advantage Funds, Inc.
By: /s/ Bradley J. Skapyak |
Bradley J. Skapyak, President |
Date: | December 19, 2011 |
|
Pursuant to the requirements of the Securities Exchange Act of 1934 and the Investment Company Act of 1940, this Report has been signed below by the following persons on behalf of the Registrant and in the capacities and on the dates indicated. |
|
By: /s/ Bradley J. Skapyak |
Bradley J. Skapyak, President |
Date: | December 19, 2011 |
|
By: /s/ James Windels |
James Windels, Treasurer |
Date: | December 19 ,2011 |
|
EXHIBIT INDEX
(a)(1) Code of ethics referred to in Item 2.
(a)(2) Certifications of principal executive and principal financial officers as required by Rule 30a-2(a) under the Investment Company Act of 1940. (EX-99.CERT)
(b) Certification of principal executive and principal financial officers as required by Rule 30a-2(b) under the Investment Company Act of 1940. (EX-99.906CERT)