UNITED STATES
SECURITIES AND EXCHANGE COMMISSION
Washington, D.C. 20549
FORM N-CSR/A
CERTIFIED SHAREHOLDER REPORT OF REGISTERED MANAGEMENT
INVESTMENT COMPANIES
Investment Company Act file number | 811- 7123 |
| |
| Advantage Funds, Inc. | |
| (Exact name of Registrant as specified in charter) | |
| | |
| c/o The Dreyfus Corporation 200 Park Avenue New York, New York 10166 | |
| (Address of principal executive offices) (Zip code) | |
| | |
| Janette E. Farragher, Esq. 200 Park Avenue New York, New York 10166 | |
| (Name and address of agent for service) | |
|
Registrant's telephone number, including area code: | (212) 922-6000 |
| |
Date of fiscal year end: | 10/31 | |
Date of reporting period: | 10/31/2012 | |
| | | | | | | |
The following N-CSR relates only to the Registrant’s series listed below and does not affect the other series of the Registrant, which has a different fiscal year end and, therefore, different N-CSR reporting requirements. A separate N-CSR Form will be filed for this series, as appropriate.
ADVANTAGE FUNDS, INC.
- DREYFUS GLOBAL REAL RETURN FUND
FORM N-CSR
Item 1. Reports to Stockholders.
Dreyfus
Global Real
Return Fund
ANNUAL REPORT October 31, 2012

Save time. Save paper. View your next shareholder report online as soon as it’s available. Log into www.dreyfus.com and sign up for Dreyfus eCommunications. It’s simple and only takes a few minutes.
The views expressed in this report reflect those of the portfolio manager only through the end of the period covered and do not necessarily represent the views of Dreyfus or any other person in the Dreyfus organization. Any such views are subject to change at any time based upon market or other conditions and Dreyfus disclaims any responsibility to update such views.These views may not be relied on as investment advice and, because investment decisions for a Dreyfus fund are based on numerous factors, may not be relied on as an indication of trading intent on behalf of any Dreyfus fund.
|
| Not FDIC-Insured • Not Bank-Guaranteed • May LoseValue |
| | Contents |
| | T H E F U N D |
| 2 | A Letter from the Chairman and CEO |
| 3 | Discussion of Fund Performance |
| 6 | Fund Performance |
| 8 | UnderstandingYour Fund’s Expenses |
| 8 | ComparingYour Fund’s Expenses With Those of Other Funds |
| 9 | Statement of Investments |
| 17 | Statement of Options Written |
| 18 | Statement of Assets and Liabilities |
| 19 | Statement of Operations |
| 20 | Statement of Changes in Net Assets |
| 22 | Financial Highlights |
| 25 | Notes to Financial Statements |
| 43 | Report of Independent Registered Public Accounting Firm |
| 44 | Important Tax Information |
| 44 | Proxy Results |
| 45 | Board Members Information |
| 47 | Officers of the Fund |
| |
| F O R M O R E | I N F O R M AT I O N |
| Back Cover | |
Dreyfus
Global Real
Return Fund
The Fund
A L E T T E R F R O M T H E C H A I R M A N A N D C E O

Dear Shareholder:
We are pleased to present this annual report for Dreyfus Global Real Return Fund, covering the 12-month period from November 1, 2011, through October 31, 2012. For information about how the fund performed during the reporting period, as well as general market perspectives, we provide a Discussion of Fund Performance on the pages that follow.
Despite pronounced stock market weakness during the spring of 2012, stocks generally advanced over the reporting period as investors responded to encouraging macroeconomic developments throughout the world. Employment gains in the United States, credible measures to prevent a more severe banking crisis in Europe, and the likelihood of a “soft landing” for China’s economy buoyed investor sentiment, as did aggressively accommodative monetary policies from central banks in the United States, Europe, Japan and China. Consequently, U.S. stocks across all capitalization ranges posted double-digit returns, on average, for the reporting period.
In light of the easy monetary policies adopted by many countries, we expect global growth to be slightly more robust in 2013 than in 2012.The U.S. economic recovery is likely to persist at subpar levels over the first half of the new year, as growth may remain constrained by uncertainties surrounding fiscal policy and tax reforms. However, successful resolution of the current fiscal debate may prompt corporate decision-makers to increase capital spending, which could have positive implications for the U.S. economy and domestic equity markets.As always, we encourage you to stay in touch with your financial advisor as new developments unfold.
Thank you for your continued confidence and support.

Jonathan R. Baum
Chairman and Chief Executive Officer
The Dreyfus Corporation
November 15, 2012
2
D I S C U S S I O N O F F U N D P E R F O R M A N C E
For the period of November 1, 2011, through October 31, 2012, as provided by Suzanne Hutchins (Lead) and James Harries, Portfolio Managers of Newton Capital Management Limited, Sub-Investment Adviser
Fund and Market Performance Overview
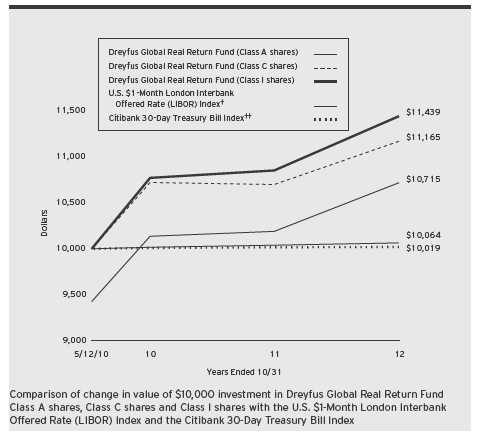
For the 12-month period ending October 31, 2012, Dreyfus Global Real Return Fund’s Class A shares produced a total return of 5.16%,Class C shares returned 4.39% and Class I shares returned 5.45%.1 In comparison, the fund’s performance baseline benchmark, the U.S. $ 1-Month London Interbank Offered Rate (LIBOR), and its broad-based securities market index, the Citibank 30-Day Treasury Bill Index, produced total returns of 0.25% and 0.04%, respectively, for the same period.2,3
An improving macroeconomic outlook helped to support global stock and bond prices over the reporting period.The fund produced higher returns than its performance baseline benchmark, primarily due to favorable results from equities and corporate bonds.
The Fund’s Investment Approach
The fund seeks total return (consisting of capital appreciation and income).To pursue its goal, the fund uses an actively-managed multi-asset strategy to produce absolute or real returns with less volatility than major equity markets over a complete market cycle, typically a period of five years.The fund is not managed relative to an index, but rather seeks to provide an absolute return, with emphasis on capital preservation.The fund is unconstrained in its approach and invests in a core of return-seeking assets, including global equities, bonds and cash. In addition to this “core”, the fund invests, generally to a lesser extent, in other asset classes, including real estate, commodities, currencies and non-traditional asset classes and strategies, in order, along with derivatives, to help protect the fund from volatility and to help it to meet the investment objective.
To allocate the fund’s assets, we combine a top-down approach emphasizing economic trends and current investment themes on a global basis, with bottom-up security selection based on fundamental research. In choosing investments, we consider economic trends as emphasized by our global investment themes, security valuations and fundamentals.Within markets and sectors, we seek attractively priced companies possessing sustainable competitive advantages, and we may invest in such companies anywhere across their capital structures. Identifying the right security characteristics for the prevailing investment environment is key to our approach, which currently emphasizes income generation.
T h e F u n d 3
D I S C U S S I O N O F F U N D P E R F O R M A N C E (continued)
Markets Driven by Macroeconomic Headlines
The reporting period began in the aftermath of major declines among stock markets and the prices of higher yielding bonds throughout the world. Fortunately, by the start of 2012, many financial markets were rallying amid encouraging macroeconomic developments, including U.S. employment gains, efforts to forestall a more severe banking crisis in Europe, and less restrictive monetary and fiscal policies in China. Consequently, investors became more comfortable with riskier investments. While they returned to a risk-averse posture during the spring when U.S. employment gains moderated and austerity programs in Europe encountered resistance, more encouraging economic data over the summer enabled global stocks and bonds to end the reporting period with respectable returns. U.S. markets generally fared better than other regions of the world.
Riskier Assets Buoyed Fund Performance
The fund produced a positive absolute return over the reporting period.The bulk of the fund’s returns were derived from stocks and high yield bonds. Long-dated U.S.Treasury inflation-linked securities also contributed positively to total returns. However, the fund’s commodities-oriented investments generally lagged market averages.
In the fund’s equity portfolio, results from the health care sector were bolstered by pharmaceutical developers Merck & Co., Roche Holding, Sanofi and Abbott Laboratories.We increased the fund’s exposure to utilities in anticipation of inflationary pressures, resulting in strong returns fromWisconsin Energy and SevernTrent.An emphasis on tobacco producers Reynolds American, British American Tobacco and Japan Tobacco also boosted results. Strength in these areas was partly offset by weakness among oil and gas producers Japan’s Inpex, Petroleo Brasileiro, ADR, Cl. A and France’s Total, as global energy demand slackened. Gold miners Newcrest Mining and Barrick Gold lost value as the prices of precious metals moderated.
Among bonds, high yield corporate securities provided robust returns with relatively little volatility, while falling interest rates boosted the value of sovereign bonds in Norway,Australia and New Zealand.
We employed put options and other derivatives instruments to mitigate the impact of equity market volatility upon the fund, and we sold call options on certain stock indices to reduce the costs of our hedging strategy.We also used forward contracts to protect the fund from adverse currency fluctuations.
4
Maintaining a Cautious Investment Posture
As of the reporting period’s end, we expect heightened market volatility to persist amid uncertainty regarding Europe’s financial crisis and fiscal pressures in the United States.Therefore, we have maintained the fund’s emphasis on markets that we see as relatively healthy from a fiscal perspective, such as Germany and some of the emerging markets. Despite prevailing headwinds, we have continued to identify opportunities for attractive returns in global stock and bond markets, while limiting the fund’s exposure to various risks.
November 15, 2012
Please note, the position in any security highlighted with italicized typeface was sold during the reporting period. Equity funds are subject generally to market, market sector, market liquidity, issuer and investment style risks, among other factors, to varying degrees, all of which are more fully described in the prospectus of the fund. Bond securities are subject generally to interest rate, credit, liquidity, call, sector and market risks, to varying degrees, all of which are more fully described in the fund’s prospectus.
The fund’s performance will be influenced by political, social and economic factors affecting investments in foreign companies. Special risks associated with such companies include exposure to currency fluctuations, less liquidity, less developed or less efficient trading markets, lack of comprehensive company information, political instability and differing auditing and legal standards.
Because the fund seeks to provide exposure to alternative or non-traditional asset categories or investment strategies, the fund’s performance will be linked to the performance of these highly volatile asset categories and strategies. Accordingly, investors should consider purchasing shares of the fund only as part of an overall diversified portfolio and should be willing to assume the risks of potentially significant fluctuations in the value of fund shares.The fund may, but is not required to, use derivative instruments, such as options, futures and options on futures, forward contracts and other credit derivatives.A small investment in derivatives could have a potentially large impact on the fund’s performance.The use of derivatives involves risks different from, or possibly greater than, the risks associated with investing directly in the underlying assets.
|
| 1 Total return includes reinvestment of dividends and any capital gains paid, and does not take into consideration the |
| maximum initial sales charge in the case of Class A shares, or the applicable contingent deferred sales charge imposed |
| on redemptions in the case of Class C shares. Had these charges been reflected, returns would have been lower. Return |
| figures provided reflect the absorption of certain fund expenses by The Dreyfus Corporation pursuant to an agreement |
| in effect through March 1, 2014, at which time it may be extended, modified or terminated. Had these expenses not |
| been absorbed, the fund’s returns would have been lower. Past performance is no guarantee of future results. Share |
| price and investment return fluctuate such that upon redemption, fund shares may be worth more or less than their |
| original cost. |
| 2 SOURCE: LIPPER INC. – Citigroup 30-Day Treasury Bill Index is a market value-weighted index of public |
| obligations of the U.S.Treasury with maturities of 30 days. Investors cannot invest directly in any index. |
| 3 SOURCE: BLOOMBERG – London Interbank Offered Rate (LIBOR).The rate of interest at which banks |
| borrow funds, in marketable size from other banks in the London interbank market. LIBOR is the most widely used |
| benchmark or reference rate for short term interest rates, and is an international rate.The London Interbank Offered |
| Rate is fixed each morning at 11 a.m. London time by the British Bankers’ Association (BBA).The rate is an |
| average derived from 16 quotations provided by banks determined by the British Bankers’ Association, the four |
| highest and lowest are then eliminated and an average of the remaining eight is calculated to arrive at the fix. |
| Eurodollar Libor is calculated on an ACT/360 day count basis and settlement is for two days hence. |
T h e F u n d 5
F U N D P E R F O R M A N C E
† Source: Bloomberg L.P.
Source: Lipper Inc.
Past performance is not predictive of future performance.
The above graph compares a $10,000 investment made in each of the Class A, Class C and Class I shares of Dreyfus Global Real Return Fund on 5/12/10 (inception date) to a $10,000 investment made in the Citibank 30-Day Treasury Bill Index and the U.S. $1-Month London Interbank Offered Rate (LIBOR) Index on that date.All dividends and capital gain distributions are reinvested.
The fund’s performance shown in the line graph above takes into account the maximum initial sales charge on Class A shares and all other applicable fees and expenses on all classes.The Citibank 30-Day Treasury Bill Index is a market value-weighted index of public obligations of the U.S.Treasury with maturities of 30 days.The LIBOR is the rate of interest at which banks borrow funds, in marketable size, from other banks in the London interbank market.The LIBOR is the most widely used benchmark or reference rate for short term interest rates, and is an international rate.The LIBOR is fixed each morning at 11 a.m. London time by the British Bankers’ Association (BBA).The rate is an average derived from 16 quotations provided by banks determined by the British Bankers’ Association; the four highest and lowest are then eliminated and an average of the remaining eight is calculated to arrive at the fix. Eurodollar LIBOR is calculated on an ACT/360 day count basis and settlement is for two days hence. Unlike a mutual fund, the indices are not subject to charges, fees and other expenses. Investors cannot invest directly in any index. Further information relating to fund performance, including expense reimbursements, if applicable, is contained in the Financial Highlights section of the prospectus and elsewhere in this report.
6
| | | | | |
| Average Annual Total Returns as of 10/31/12 | | | | | |
| | Inception | | | From | |
| | Date | 1 Year | | Inception | |
| Class A shares | | | | | |
| with maximum sales charge (5.75%) | 5/12/10 | –0.86 | % | 2.83 | % |
| without sales charge | 5/12/10 | 5.16 | % | 5.32 | % |
| Class C shares | | | | | |
| with applicable redemption charge † | 5/12/10 | 3.39 | % | 4.56 | % |
| without redemption | 5/12/10 | 4.39 | % | 4.56 | % |
| Class I shares | 5/12/10 | 5.45 | % | 5.59 | % |
| U.S. $1-Month London Interbank | | | | | |
| Offered Rate (LIBOR) Index | 4/30/10 | 0.25 | % | 0.26 | %†† |
| Citibank 30-Day Treasury Bill Index | 4/30/10 | 0.04 | % | 0.08 | %†† |
Past performance is not predictive of future performance.The fund’s performance shown in the graph and table does not reflect the deduction of taxes that a shareholder would pay on fund distributions or the redemption of fund shares.
| |
| † | The maximum contingent deferred sales charge for Class C shares is 1% for shares redeemed within one year of the |
| | date of purchase. |
| †† | For comparative purposes, the value of the Index as of 4/30/10 is used as the beginning value on 5/12/10. |
T h e F u n d 7
U N D E R S TA N D I N G YO U R F U N D ’ S E X P E N S E S ( U n a u d i t e d )
As a mutual fund investor, you pay ongoing expenses, such as management fees and other expenses. Using the information below, you can estimate how these expenses affect your investment and compare them with the expenses of other funds.You also may pay one-time transaction expenses, including sales charges (loads) and redemption fees, which are not shown in this section and would have resulted in higher total expenses. For more information, see your fund’s prospectus or talk to your financial adviser.
Review your fund’s expenses
The table below shows the expenses you would have paid on a $1,000 investment in Dreyfus Global Real Return Fund from May 1, 2012 to October 31, 2012. It also shows how much a $1,000 investment would be worth at the close of the period, assuming actual returns and expenses.
| | | | | | |
| Expenses and Value of a $1,000 Investment | | | | |
| assuming actual returns for the six months ended October 31, 2012 | | |
| | | Class A | | Class C | | Class I |
| Expenses paid per $1,000† | $ | 7.68 | $ | 11.50 | $ | 6.40 |
| Ending value (after expenses) | $ | 1,036.90 | $ | 1,033.50 | $ | 1,038.30 |
C O M P A R I N G Y O U R F U N D ’ S E X P E N S E S
W I T H T H O S E O F O T H E R F U N D S ( U n a u d i t e d )
Using the SEC’s method to compare expenses
The Securities and Exchange Commission (SEC) has established guidelines to help investors assess fund expenses. Per these guidelines, the table below shows your fund’s expenses based on a $1,000 investment, assuming a hypothetical 5% annualized return. You can use this information to compare the ongoing expenses (but not transaction expenses or total cost) of investing in the fund with those of other funds.All mutual fund shareholder reports will provide this information to help you make this comparison. Please note that you cannot use this information to estimate your actual ending account balance and expenses paid during the period.
Expenses and Value of a $1,000 Investment assuming a hypothetical 5% annualized return for the six months ended October 31, 2012
| | | | | | |
| | | Class A | | Class C | | Class I |
| Expenses paid per $1,000† | $ | 7.61 | $ | 11.39 | $ | 6.34 |
| Ending value (after expenses) | $ | 1,017.60 | $ | 1,013.83 | $ | 1,018.85 |
|
| † Expenses are equal to the fund’s annualized expense ratio of 1.50% for Class A, 2.25% for Class C and 1.25% |
| for Class I,multiplied by the average account value over the period, multiplied by 184/366 (to reflect the one-half |
| year period). |
8
| | |
| S TAT E M E N T | O F | I N V E S T M E N T S |
| O c t o b e r 3 1 , 2 0 1 2 | | |
| | | | | | |
| | | Coupon | Maturity | Principal | | |
| Bonds and Notes—28.2% | | Rate (%) | Date | Amount ($)a | Value ($) |
| Australia—5.6% | | | | | | |
| Australian Goverment, | | | | | | |
| Sr. Unscd. Bonds, Ser. 136 | AUD | 4.75 | 4/21/27 | 840,000 | | 1,003,751 |
| Australian Goverment, | | | | | | |
| Sr. Unscd. Bonds, Ser. 133 | AUD | 5.50 | 4/21/23 | 1,660,000 | | 2,086,285 |
| Queensland Treasury | | | | | | |
| Gov. Gtd. Notes, Ser. 24 | AUD | 5.75 | 7/22/24 | 536,000 | | 628,699 |
| Santos Finance, | | | | | | |
| Gtd. Notes | EUR | 8.25 | 9/22/70 | 150,000 | b | 204,142 |
| | | | | | | 3,922,877 |
| Croatia—.2% | | | | | | |
| Agrokor, | | | | | | |
| Gtd. Notes | EUR | 9.13 | 2/1/20 | 130,000 | | 174,185 |
| El Salvador—.2% | | | | | | |
| Telemovil Finance, | | | | | | |
| Gtd. Notes | | 8.00 | 10/1/17 | 100,000 | | 106,500 |
| Germany—.8% | | | | | | |
| Conti-Gummi Finance, | | | | | | |
| Sr. Scd. Notes | EUR | 7.50 | 9/15/17 | 150,000 | | 209,100 |
| HeidelbergCement Finance, | | | | | | |
| Gtd. Bonds | EUR | 7.50 | 4/3/20 | 125,000 | | 185,235 |
| Unitymedia Hessen, | | | | | | |
| Sr. Scd. Notes | EUR | 8.13 | 12/1/17 | 100,000 | | 140,145 |
| | | | | | | 534,480 |
| Ireland—.5% | | | | | | |
| Ardagh Glass Finance, | | | | | | |
| Gtd. Bonds | EUR | 7.13 | 6/15/17 | 150,000 | | 196,852 |
| Smurfit Kappa Acquisitions, | | | | | | |
| Sr. Scd. Notes | EUR | 7.25 | 11/15/17 | 100,000 | | 139,011 |
| | | | | | | 335,863 |
| Italy—.5% | | | | | | |
| Lottomatica Group, | | | | | | |
| Jr. Sub. Bonds | EUR | 8.25 | 3/31/66 | 150,000 | b | 194,907 |
| Wind Acquisition Finance, | | | | | | |
| Scd. Notes | EUR | 11.75 | 7/15/17 | 150,000 | | 189,561 |
| | | | | | | 384,468 |
| Luxembourg—.2% | | | | | | |
| Aguila 3, | | | | | | |
| Sr. Scd. Notes | | 7.88 | 1/31/18 | 150,000 | | 158,250 |
T h e F u n d 9
S TAT E M E N T O F I N V E S T M E N T S (continued)
| | | | | | |
| | | Coupon | Maturity | Principal | | |
| Bonds and Notes (continued) | Rate (%) | Date | Amount ($)a | | Value ($) |
| Mexico—.2% | | | | | | |
| Satmex Escrow, | | | | | | |
| Sr. Scd. Notes | | 9.50 | 5/15/17 | 126,000 | | 134,820 |
| Netherlands—.6% | | | | | | |
| OI European Group, | | | | | | |
| Gtd. Notes | EUR | 6.75 | 9/15/20 | 100,000 | | 144,844 |
| UPC Holding, | | | | | | |
| Scd. Notes | EUR | 8.38 | 8/15/20 | 100,000 | | 141,830 |
| Ziggo Bond, | | | | | | |
| Gtd. Notes | EUR | 8.00 | 5/15/18 | 100,000 | | 142,738 |
| | | | | | | 429,412 |
| New Zealand—1.9% | | | | | | |
| New Zealand Government, | | | | | | |
| Sr. Unscd. Bonds, | | | | | | |
| Ser. 423 | NZD | 5.50 | 4/15/23 | 505,000 | | 487,911 |
| New Zealand Government, | | | | | | |
| Sr. Unscd. Bonds, | | | | | | |
| Ser. 521 | NZD | 6.00 | 5/15/21 | 830,000 | | 819,061 |
| | | | | | | 1,306,972 |
| Norway—3.7% | | | | | | |
| Norwegian Government, | | | | | | |
| Bonds, Ser. 474 | NOK | 3.75 | 5/25/21 | 1,045,000 | | 210,664 |
| Norwegian Government, | | | | | | |
| Bonds, Ser 473 | NOK | 4.50 | 5/22/19 | 11,705,000 | | 2,408,217 |
| | | | | | | 2,618,881 |
| South Africa—.3% | | | | | | |
| Edcon Proprietary, | | | | | | |
| Scd. Notes | EUR | 3.50 | 6/15/14 | 150,000 | b | 181,784 |
| Sweden—.5% | | | | | | |
| Eileme 2, | | | | | | |
| Sr. Scd. Notes | EUR | 11.75 | 1/31/20 | 110,000 | | 160,540 |
| Norcell Sweden | | | | | | |
| Holding 3, | | | | | | |
| Sr. Scd. Notes | SEK | 9.25 | 9/29/18 | 1,000,000 | | 163,955 |
| | | | | | | 324,495 |
10
| | | | | | |
| | | Coupon | Maturity | Principal | | |
| Bonds and Notes (continued) | Rate (%) | Date | Amount ($)a | Value ($) |
| Switzerland—.4% | | | | | | |
| Matterhorn Mobile, | | | | | | |
| Sr. Scd. Notes | CHF | 6.75 | 5/15/19 | 150,000 | | 171,132 |
| Sunrise Communications | | | | | | |
| International, | | | | | | |
| Sr. Scd. Notes | EUR | 7.00 | 12/31/17 | 100,000 | | 139,659 |
| | | | | | | 310,791 |
| United Kingdom—3.5% | | | | | | |
| Anglian Water | | | | | | |
| Services Financing, | | | | | | |
| Sr. Scd. Notes, Ser. A8 | GBP | 3.67 | 7/30/24 | 50,000 | c | 141,437 |
| Boparan Finance, | | | | | | |
| Gtd. Notes | GBP | 9.88 | 4/30/18 | 100,000 | | 177,514 |
| Cable & Wireless | | | | | | |
| International Finance, | | | | | | |
| Gtd. Bonds | GBP | 8.63 | 3/25/19 | 110,000 | | 190,828 |
| Co-Operative Bank, | | | | | | |
| Sub. Notes | GBP | 5.63 | 11/16/21 | 100,000 | b | 140,074 |
| Dwr Cymru Financing, | | | | | | |
| Asset Backed Bonds | GBP | 1.86 | 3/31/48 | 150,000 | c | 276,254 |
| Ineos Finance, | | | | | | |
| Sr. Scd. Notes | EUR | 7.25 | 2/15/19 | 100,000 | b | 132,531 |
| ISS, | | | | | | |
| Sr. Scd. Notes | EUR | 11.00 | 6/15/14 | 100,000 | | 134,896 |
| Jaguar Land Rover, | | | | | | |
| Gtd. Bonds | | 8.13 | 5/15/21 | 150,000 | | 162,375 |
| John Lewis, | | | | | | |
| Sr. Unscd. Bonds | GBP | 8.38 | 4/8/19 | 75,000 | | 158,452 |
| Kerling, | | | | | | |
| Sr. Scd. Notes | EUR | 10.63 | 2/1/17 | 150,000 | | 181,298 |
| LBG Capital No.1, | | | | | | |
| Gtd. Bonds, Ser. 8 | GBP | 7.87 | 8/25/20 | 70,000 | | 113,359 |
| National Grid | | | | | | |
| Electricity Transmission, | | | | | | |
| Sr. Unscd. Bonds | GBP | 2.98 | 7/8/18 | 32,000 | c | 85,217 |
T h e F u n d 11
S TAT E M E N T O F I N V E S T M E N T S (continued)
| | | | | | |
| | | Coupon | Maturity | Principal | | |
| Bonds and Notes (continued) | Rate (%) | Date | Amount ($)a | Value ($) |
| United Kingdom (continued) | | | | | | |
| National Grid Gas, | | | | | | |
| Gtd. Bonds | GBP | 4.19 | 12/14/22 | 19,000 | c | 61,160 |
| Priory Group No. 3 | | | | | | |
| Sr. Scd. Notes | GBP | 7.00 | 2/15/18 | 100,000 | | 172,269 |
| Prudential, | | | | | | |
| Jr. Sub. Notes | | 11.75 | 12/29/49 | 181,000 | b | 209,055 |
| TESCO, | | | | | | |
| Sr. Unscd. Notes | GBP | 4.00 | 9/8/16 | 60,000 | c | 159,785 |
| | | | | | | 2,496,504 |
| United States—9.1% | | | | | | |
| Catalent Pharma Solutions, | | | | | | |
| Gtd. Notes | EUR | 9.75 | 4/15/17 | 150,000 | | 200,254 |
| CEDC Finance Corp International, | | | | | | |
| Sr. Scd. Notes | | 9.13 | 12/1/16 | 100,000 | | 66,000 |
| Chesapeake Energy, | | | | | | |
| Gtd. Notes | | 6.78 | 3/15/19 | 170,000 | | 170,638 |
| Clearwire Communications, | | | | | | |
| Sr. Scd. Notes | | 12.00 | 12/1/15 | 150,000 | | 160,430 |
| EXCO Resources, | | | | | | |
| Gtd. Notes | | 7.50 | 9/15/18 | 185,000 | | 174,825 |
| Nextel Communications, | | | | | | |
| Gtd. Notes, Ser. D | | 7.38 | 8/1/15 | 50,000 | | 50,188 |
| Offshore Group Investment, | | | | | | |
| Sr. Scd. Notes | | 11.50 | 8/1/15 | 186,000 | | 204,832 |
| Sable International Finance, | | | | | | |
| Sr. Scd. Notes | | 7.75 | 2/15/15 | 100,000 | | 107,000 |
| U.S. Treasury Inflation | | | | | | |
| Protected Securities, Bonds | | 2.50 | 1/15/29 | 1,668,588 | d | 2,415,411 |
| U.S. Treasury Notes | | 0.50 | 11/30/12 | 2,868,000 | | 2,869,233 |
| | | | | | | 6,418,811 |
| Total Bonds and Notes | | | | | | |
| (cost $18,866,734) | | | | | | 19,839,093 |
12
| | |
| Common Stocks—55.3% | Shares | Value ($) |
| Australia—3.1% | | |
| Newcrest Mining | 53,342 | 1,463,480 |
| Telstra | 175,900 | 755,939 |
| | | 2,219,419 |
| Brazil—.8% | | |
| Petroleo Brasileiro, ADR, Cl. A | 28,632 | 587,815 |
| Canada—3.5% | | |
| Barrick Gold | 31,188 | 1,263,114 |
| Yamana Gold | 60,262 | 1,217,006 |
| | | 2,480,120 |
| Denmark—1.2% | | |
| TDC | 119,240 | 821,473 |
| France—3.5% | | |
| Sanofi | 11,768 | 1,034,459 |
| Total | 28,544 | 1,436,227 |
| | | 2,470,686 |
| Germany—3.6% | | |
| Bayer | 21,095 | 1,837,118 |
| Deutsche Telekom | 60,760 | 693,741 |
| | | 2,530,859 |
| Japan—1.9% | | |
| Asahi Group Holdings | 24,800 | 565,091 |
| Japan Tobacco | 29,000 | 801,378 |
| | | 1,366,469 |
| Luxembourg—.9% | | |
| Millicom International Cellular, SDR | 7,365 | 636,244 |
| Netherlands—1.7% | | |
| Koninklijke KPN | 77,107 | 486,816 |
| Reed Elsevier | 50,952 | 684,516 |
| | | 1,171,332 |
T h e F u n d 13
S TAT E M E N T O F I N V E S T M E N T S (continued)
| | | |
| Common Stocks (continued) | Shares | | Value ($) |
| Norway—.8% | | | |
| Statoil | 21,823 | | 539,326 |
| Peru—.1% | | | |
| Cia de Minas Buenaventura, ADR | 1,421 | | 50,815 |
| Poland—.9% | | | |
| Telekomunikacja Polska | 163,594 | | 617,964 |
| South Africa—.9% | | | |
| MTN Group | 35,496 | | 640,026 |
| Sweden—.8% | | | |
| TeliaSonera | 92,060 | | 606,109 |
| Switzerland—4.8% | | | |
| Novartis | 21,902 | | 1,318,165 |
| Roche Holding | 6,606 | | 1,270,412 |
| Syngenta | 1,990 | | 777,367 |
| | | | 3,365,944 |
| United Kingdom—11.1% | | | |
| BAE Systems | 121,007 | | 609,653 |
| British American Tobacco | 10,991 | | 544,433 |
| Cable & Wireless Communications | 340,117 | | 205,771 |
| Centrica | 245,227 | | 1,282,587 |
| GlaxoSmithKline | 84,652 | | 1,894,073 |
| Severn Trent | 31,112 | | 806,330 |
| SSE | 45,275 | | 1,057,953 |
| Vodafone Group | 174,236 | | 473,078 |
| WM Morrison Supermarkets | 216,460 | | 935,815 |
| | | | 7,809,693 |
| United States—15.7% | | | |
| Abbott Laboratories | 14,843 | | 972,513 |
| Accenture, Cl. A | 12,309 | | 829,750 |
| Annaly Capital Management | 39,454 | e | 636,788 |
| Medtronic | 15,691 | | 652,432 |
| Merck & Co. | 21,004 | | 958,413 |
| Newmont Mining | 8,385 | | 457,402 |
| PDL BioPharma | 25,472 | | 189,766 |
14
| | | | |
| | Common Stocks (continued) | Shares | | Value ($) |
| | United States (continued) | | | |
| | PowerShares DB Gold Fund | 43,449 | f | 2,570,877 |
| | Reynolds American | 34,531 | | 1,437,871 |
| | Sprint Nextel | 79,639 | f | 441,200 |
| | Sysco | 32,320 | | 1,004,182 |
| | Wisconsin Energy | 22,708 | | 873,577 |
| | | | | 11,024,771 |
| | Total Common Stocks | | | |
| | (cost $36,811,648) | | | 38,939,065 |
| | | Number of | | |
| | Options Purchased—.2% | Contracts | | Value ($) |
| | Call Options—.1% | | | |
| | CBOE Volatility Index Futures, | | | |
| | January 2013 @ $26 | 129 | f | 20,640 |
| | CBOE Volatility Index Futures, | | | |
| | January 2013 @ $25 | 163 | f | 29,340 |
| | | | | 49,980 |
| | Put Options—.1% | | | |
| | CBOE Volatility Index Futures, | | | |
| | December 2012 @ $18 | 163 | f | 24,450 |
| | CBOE Volatility Index Futures, | | | |
| | December 2012 @ $19 | 129 | f | 27,090 |
| | FTSE 100 Index Futures, | | | |
| | December 2012 @ GBP 5,650 | 42 | f | 55,234 |
| | | | | 106,774 |
| | Total Options Purchased | | | |
| | (cost $167,919) | | | 156,754 |
| | | Principal | | |
| Short-Term Investments—6.3% | Amount ($) | | Value ($) |
| | U.S. Treasury Bills: | | | |
| | 0.00%, 11/8/12 | 755,000 | | 754,992 |
| | 0.08%, 4/4/13 | 3,677,000 | | 3,674,919 |
| | Total Short-Term Investments | | | |
| | (cost $4,429,835) | | | 4,429,911 |
T h e F u n d 15
S TAT E M E N T O F I N V E S T M E N T S (continued)
| | | | |
| Other Investments—12.3% | Shares | | Value ($) | |
| Registered Investment Companies: | | | | |
| Dreyfus Institutional Preferred | | | | |
| Plus Money Market Fund | 8,470,000 | g | 8,470,000 | |
| NB Global Floating Rate Income Fund | 243,862 | | 242,643 | |
| Total Other Investments | | | | |
| (cost $8,706,171) | | | 8,712,643 | |
| |
| Total Investments (cost $68,982,307) | 102.3 | % | 72,077,466 | |
| Liabilities, Less Cash and Receivables | (2.3 | %) | (1,636,318 | ) |
| Net Assets | 100.0 | % | 70,441,148 | |
ADR—American Depository Receipts
SDR—Swedish Depository Receipts
|
| a Principal amount stated in U.S. Dollars unless otherwise noted. |
| AUD—Australian Dollar |
| CHF—Swiss Franc |
| EUR—Euro |
| GBP—British Pound |
| NOK—Norwegian Krone |
| NZD—New Zealand Dollar |
| SEK—Swedish Krona |
| b Variable rate security—interest rate subject to periodic change. |
| c Principal amount for accrual purposes is periodically adjusted based on changes in the British Consumer Price Index. |
| d Principal amount for accrual purposes is periodically adjusted based on changes in the U.S. Consumer Price Index. |
| e Investment in real estate investment trust. |
| f Non-income producing security. |
| g Investment in affiliated money market mutual fund. |
| | | |
| Portfolio Summary (Unaudited)† | | |
| |
| | Value (%) | | Value (%) |
| Short-Term/ | | Energy | 3.6 |
| Money Market Investments | 18.3 | Exchange-Traded Funds | 3.6 |
| Corporate Bonds | 15.5 | Information Technology | 1.2 |
| Health Care | 14.4 | Consumer Discretionary | 1.0 |
| Telecommunication Services | 9.1 | Financial | .9 |
| Consumer Staples | 7.5 | Industrial | .9 |
| U.S. Government Securities | 7.5 | Mutual Fund : Foreign | .3 |
| Materials | 7.4 | Options Purchased | .2 |
| Utilities | 5.7 | | |
| Foreign/Governmental | 5.2 | | 102.3 |
| |
| † Based on net assets. | | | |
| See notes to financial statements. | | | |
16
S TAT E M E N T O F O P T I O N S W R I T T E N
O c t o b e r 3 1 , 2 0 1 2
| | | | |
| | Number of | | | |
| | Contracts | | Value ($) | |
| Call Options: | | | | |
| FTSE 100 Index Futures, | | | | |
| December 2012 @ GBP 6,050 | 106 | a | (31,646 | ) |
| FTSE 100 Index Futures, | | | | |
| January 2013 @ GBP 6,150 | 42 | a | (11,861 | ) |
| Put Options: | | | | |
| FTSE 100 Index Futures, | | | | |
| December 2012 @ GBP 5,350 | 42 | a | (20,332 | ) |
| (premiums received $232,150) | | | (63,839 | ) |
| |
| GBP—British Pound | | | | |
| a Non-income producing security. | | | | |
| See notes to financial statements. | | | | |
T h e F u n d 17
| | | | |
| S TAT E M E N T O F A S S E T S A N D L I A B I L I T I E S |
| O c t o b e r 3 1 , 2 0 1 2 | | | | |
| | | | |
| | | Cost | Value | |
| Assets ($): | | | | |
| Investments in securities—See Statement of Investments: | | | |
| Unaffiliated issuers | | 60,512,307 | 63,607,466 | |
| Affiliated issuers | | 8,470,000 | 8,470,000 | |
| Cash on initial margin—Note 4 | | | 350,560 | |
| Cash denominated in foreign currencies | | 6,570 | 6,409 | |
| Dividends and interest receivable | | | 327,129 | |
| Receivable for shares of Common Stock subscribed | | | 90,561 | |
| Unrealized appreciation on forward foreign | | | | |
| currency exchange contracts—Note 4 | | | 60,003 | |
| Receivable for investment securities sold | | | 56,471 | |
| Prepaid expenses | | | 17,826 | |
| | | | 72,986,425 | |
| Liabilities ($): | | | | |
| Due to The Dreyfus Corporation and affiliates—Note 3(c) | | 65,905 | |
| Cash overdraft due to Custodian | | | 4,490 | |
| Unrealized depreciation on forward foreign | | | | |
| currency exchange contracts—Note 4 | | | 1,167,582 | |
| Payable for investment securities purchased | | | 1,106,308 | |
| Outstanding options written, at value (premiums received | | | |
| $232,150)—See Statement of Options Written—Note 4 | | 63,839 | |
| Payable for shares of Common Stock redeemed | | | 71,396 | |
| Accrued expenses | | | 65,757 | |
| | | | 2,545,277 | |
| Net Assets ($) | | | 70,441,148 | |
| Composition of Net Assets ($): | | | | |
| Paid-in capital | | | 67,629,030 | |
| Accumulated undistributed investment income—net | | | 964,437 | |
| Accumulated net realized gain (loss) on investments | | | (310,572 | ) |
| Accumulated net unrealized appreciation (depreciation) on investments, | | |
| options transactions and foreign currency transactions | | 2,158,253 | |
| Net Assets ($) | | | 70,441,148 | |
| |
| |
| Net Asset Value Per Share | | | | |
| | Class A | Class C | Class I | |
| Net Assets ($) | 17,087,911 | 943,698 | 52,409,539 | |
| Shares Outstanding | 1,214,649 | 67,950 | 3,717,626 | |
| Net Asset Value Per Share ($) | 14.07 | 13.89 | 14.10 | |
| |
| See notes to financial statements. | | | | |
18
| | |
| S TAT E M E N T O F O P E R AT I O N S |
| Ye a r E n d e d O c t o b e r 3 1 , 2 0 1 2 |
| | |
| Investment Income ($): | | |
| Income: | | |
| Cash dividends (net of $49,783 foreign taxes withheld at source): | | |
| Unaffiliated issuers | 806,027 | |
| Affiliated issuers | 3,186 | |
| Interest | 311,320 | |
| Total Income | 1,120,533 | |
| Expenses: | | |
| Management fee—Note 3(a) | 361,553 | |
| Registration fees | 46,272 | |
| Auditing fees | 43,668 | |
| Shareholder servicing costs—Note 3(c) | 42,039 | |
| Custodian fees—Note 3(c) | 34,022 | |
| Prospectus and shareholders’ reports | 19,241 | |
| Distribution fees—Note 3(b) | 4,383 | |
| Directors’ fees and expenses—Note 3(d) | 2,431 | |
| Legal fees | 1,752 | |
| Loan commitment fees—Note 2 | 465 | |
| Interest expense—Note 2 | 74 | |
| Miscellaneous | 24,954 | |
| Total Expenses | 580,854 | |
| Less—reduction in expenses due to undertaking—Note 3(a) | (50,461 | ) |
| Less—reduction in fees due to earnings credits—Note 3(c) | (15 | ) |
| Net Expenses | 530,378 | |
| Investment Income—Net | 590,155 | |
| Realized and Unrealized Gain (Loss) on Investments—Note 4 ($): | | |
| Net realized gain (loss) on investments and foreign currency transactions | (277,379 | ) |
| Net realized gain (loss) on options transactions | (126,952 | ) |
| Net realized gain (loss) on forward foreign currency exchange contracts | 543,119 | |
| Net Realized Gain (Loss) | 138,788 | |
| Net unrealized appreciation (depreciation) on | | |
| investments and foreign currency transactions | 2,701,561 | |
| Net unrealized appreciation (depreciation) on options transactions | 263,019 | |
| Net unrealized appreciation (depreciation) on | | |
| forward foreign currency exchange contracts | (1,154,453 | ) |
| Net Unrealized Appreciation (Depreciation) | 1,810,127 | |
| Net Realized and Unrealized Gain (Loss) on Investments | 1,948,915 | |
| Net Increase in Net Assets Resulting from Operations | 2,539,070 | |
See notes to financial statements.
T h e F u n d 19
S TAT E M E N T O F C H A N G E S I N N E T A S S E T S
| | | | |
| | Year Ended October 31, | |
| | 2012 | | 2011 | |
| Operations ($): | | | | |
| Investment income—net | 590,155 | | 151,180 | |
| Net realized gain (loss) on investments | 138,788 | | (84,680 | ) |
| Net unrealized appreciation | | | | |
| (depreciation) on investments | 1,810,127 | | (48,006 | ) |
| Net Increase (Decrease) in Net Assets | | | | |
| Resulting from Operations | 2,539,070 | | 18,494 | |
| Dividends to Shareholders from ($): | | | | |
| Investment income—net: | | | | |
| Class A Shares | (12,051 | ) | — | |
| Class I Shares | (188,051 | ) | — | |
| Net realized gain on investments: | | | | |
| Class A Shares | (13,147 | ) | — | |
| Class C Shares | (1,870 | ) | — | |
| Class I Shares | (110,122 | ) | — | |
| Total Dividends | (325,241 | ) | — | |
| Capital Stock Transactions ($): | | | | |
| Net proceeds from shares sold: | | | | |
| Class A Shares | 20,229,823 | | 2,125,479 | |
| Class C Shares | 754,317 | | 123,078 | |
| Class I Shares | 36,736,292 | | 21,104,956 | |
| Dividends reinvested: | | | | |
| Class A Shares | 24,685 | | — | |
| Class C Shares | 637 | | — | |
| Class I Shares | 279,676 | | — | |
| Cost of shares redeemed: | | | | |
| Class A Shares | (8,799,384 | ) | (346,366 | ) |
| Class C Shares | (1,022,848 | ) | — | |
| Class I Shares | (7,327,473 | ) | (1,161,870 | ) |
| Increase (Decrease) in Net Assets | | | | |
| from Capital Stock Transactions | 40,875,725 | | 21,845,277 | |
| Total Increase (Decrease) in Net Assets | 43,089,554 | | 21,863,771 | |
| Net Assets ($): | | | | |
| Beginning of Period | 27,351,594 | | 5,487,823 | |
| End of Period | 70,441,148 | | 27,351,594 | |
| Undistributed investment income—net | 964,437 | | 35,066 | |
20
| | | | |
| | Year Ended October 31, | |
| | 2012 | | 2011 | |
| Capital Share Transactions: | | | | |
| Class A | | | | |
| Shares sold | 1,471,625 | | 155,976 | |
| Shares issued for dividends reinvested | 1,846 | | — | |
| Shares redeemed | (637,563 | ) | (25,746 | ) |
| Net Increase (Decrease) in Shares Outstanding | 835,908 | | 130,230 | |
| Class C | | | | |
| Shares sold | 55,033 | | 9,070 | |
| Shares issued for dividends reinvested | 48 | | — | |
| Shares redeemed | (76,201 | ) | — | |
| Net Increase (Decrease) in Shares Outstanding | (21,120 | ) | 9,070 | |
| Class I | | | | |
| Shares sold | 2,680,434 | | 1,558,088 | |
| Shares issued for dividends reinvested | 20,918 | | — | |
| Shares redeemed | (535,472 | ) | (86,342 | ) |
| Net Increase (Decrease) in Shares Outstanding | 2,165,880 | | 1,471,746 | |
| |
| See notes to financial statements. | | | | |
T h e F u n d 21
F I N A N C I A L H I G H L I G H T S
The following tables describe the performance for each share class for the fiscal periods indicated.All information (except portfolio turnover rate) reflects financial results for a single fund share.Total return shows how much your investment in the fund would have increased (or decreased) during each period, assuming you had reinvested all dividends and distributions.These figures have been derived from the fund’s financial statements.
| | | | | | |
| | | | Year Ended October 31, | |
| Class A Shares | 2012 | | 2011 | | 2010 | a |
| Per Share Data ($): | | | | | | |
| Net asset value, beginning of period | 13.51 | | 13.44 | | 12.50 | |
| Investment Operations: | | | | | | |
| Investment income—netb | .17 | | .20 | | .06 | |
| Net realized and unrealized | | | | | | |
| gain (loss) on investments | .53 | | (.13 | ) | .88 | |
| Total from Investment Operations | .70 | | .07 | | .94 | |
| Distributions: | | | | | | |
| Dividends from investment income—net | (.07 | ) | — | | — | |
| Dividends from net realized gain on investments | (.07 | ) | — | | — | |
| Total Distributions | (.14 | ) | — | | — | |
| Net asset value, end of period | 14.07 | | 13.51 | | 13.44 | |
| Total Return (%)c | 5.16 | | .52 | | 7.52 | d |
| Ratios/Supplemental Data (%): | | | | | | |
| Ratio of total expenses to average net assets | 1.72 | | 3.53 | | 5.96 | e |
| Ratio of net expenses to average net assets | 1.50 | | 1.50 | | 1.50 | e |
| Ratio of net investment income | | | | | | |
| to average net assets | 1.26 | | 1.46 | | .94 | e |
| Portfolio Turnover Rate | 53.24 | | 42.97 | | 49.61 | d |
| Net Assets, end of period ($ x 1,000) | 17,088 | | 5,117 | | 3,340 | |
| |
| a | From May 12, 2010 (commencement of operations) to October 31, 2010. |
| b | Based on average shares outstanding at each month end. |
| c | Exclusive of sales charge. |
| d | Not annualized. |
| e | Annualized. |
See notes to financial statements.
22
| | | | | | |
| | | | Year Ended October 31, | |
| Class C Shares | 2012 | | 2011 | | 2010 | a |
| Per Share Data ($): | | | | | | |
| Net asset value, beginning of period | 13.37 | | 13.39 | | 12.50 | |
| Investment Operations: | | | | | | |
| Investment income—netb | .06 | | .10 | | .01 | |
| Net realized and unrealized | | | | | | |
| gain (loss) on investments | .53 | | (.12 | ) | .88 | |
| Total from Investment Operations | .59 | | (.02 | ) | .89 | |
| Distributions: | | | | | | |
| Dividends from net realized gain on investments | (.07 | ) | — | | — | |
| Net asset value, end of period | 13.89 | | 13.37 | | 13.39 | |
| Total Return (%)c | 4.39 | | (.22 | ) | 7.20 | d |
| Ratios/Supplemental Data (%): | | | | | | |
| Ratio of total expenses to average net assets | 2.56 | | 4.37 | | 6.75 | e |
| Ratio of net expenses to average net assets | 2.25 | | 2.25 | | 2.25 | e |
| Ratio of net investment income | | | | | | |
| to average net assets | .51 | | .75 | | .20 | e |
| Portfolio Turnover Rate | 53.24 | | 42.97 | | 49.61 | d |
| Net Assets, end of period ($ x 1,000) | 944 | | 1,190 | | 1,071 | |
| |
| a | From May 12, 2010 (commencement of operations) to October 31, 2010. |
| b | Based on average shares outstanding at each month end. |
| c | Exclusive of sales charge. |
| d | Not annualized. |
| e | Annualized. |
See notes to financial statements.
T h e F u n d 23
F I N A N C I A L H I G H L I G H T S (continued)
| | | | | | |
| | | | Year Ended October 31, | |
| Class I Shares | 2012 | | 2011 | | 2010 | a |
| Per Share Data ($): | | | | | | |
| Net asset value, beginning of period | 13.56 | | 13.46 | | 12.50 | |
| Investment Operations: | | | | | | |
| Investment income—netb | .21 | | .18 | | .07 | |
| Net realized and unrealized | | | | | | |
| gain (loss) on investments | .53 | | (.08 | ) | .89 | |
| Total from Investment Operations | .74 | | .10 | | .96 | |
| Distributions: | | | | | | |
| Dividends from investment income—net | (.13 | ) | — | | — | |
| Dividends from net realized gain on investments | (.07 | ) | — | | — | |
| Total Distributions | (.20 | ) | — | | — | |
| Net asset value, end of period | 14.10 | | 13.56 | | 13.46 | |
| Total Return (%) | 5.45 | | .74 | | 7.68 | c |
| Ratios/Supplemental Data (%): | | | | | | |
| Ratio of total expenses to average net assets | 1.35 | | 2.33 | | 5.75 | d |
| Ratio of net expenses to average net assets | 1.25 | | 1.25 | | 1.25 | d |
| Ratio of net investment income | | | | | | |
| to average net assets | 1.55 | | 1.46 | | 1.19 | d |
| Portfolio Turnover Rate | 53.24 | | 42.97 | | 49.61 | c |
| Net Assets, end of period ($ x 1,000) | 52,410 | | 21,044 | | 1,076 | |
| |
| a | From May 12, 2010 (commencement of operations) to October 31, 2010. |
| b | Based on average shares outstanding at each month end. |
| c | Not annualized. |
| d | Annualized. |
See notes to financial statements.
24
N O T E S T O F I N A N C I A L S TAT E M E N T S
NOTE 1—Significant Accounting Policies:
Dreyfus Global Real Return Fund (the “fund”) is a separate non-diversified series of Advantage Funds, Inc. (the “Company”), which is registered under the Investment Company Act of 1940, as amended (the “Act”), as an open-end management investment company and operates as a series company that offers thirteen series, including the fund.The fund’s investment objective is to seek total return (consisting of capital appreciation and income).The Dreyfus Corporation (the “Manager” or “Dreyfus”), a wholly-owned subsidiary of The Bank of New York Mellon Corporation (“BNY Mellon”), serves as the fund’s investment adviser. Newton Capital Management Limited (“Newton”), an affiliate of BNY Mellon, serves as the fund’s sub-investment adviser.
MBSC Securities Corporation (the “Distributor”), a wholly-owned subsidiary of Dreyfus, is the distributor of the fund’s shares.The fund is authorized to issue 100 million shares of $.001 par value Common Stock in each of the following classes of shares: Class A, Class C and Class I. Class A shares are subject to a sales charge imposed at the time of purchase. Class C shares are subject to a contingent deferred sales charge (“CDSC”) imposed on Class C shares redeemed within one year of purchase. Class I shares are sold at net asset value per share only to institutional investors. Other differences between the classes include the services offered to and the expenses borne by each class, the allocation of certain transfer agency costs and certain voting rights. Income, expenses (other than expenses attributable to a specific class) and realized and unrealized gains or losses on investments are allocated to each class of shares based on its relative net assets.
T h e F u n d 25
N O T E S T O F I N A N C I A L S TAT E M E N T S (continued)
The Company accounts separately for the assets, liabilities and operations of each series. Expenses directly attributable to each series are charged to that series’ operations; expenses which are applicable to all series are allocated among them on a pro rata basis.
The Financial Accounting Standards Board (“FASB”) Accounting Standards Codification is the exclusive reference of authoritative U.S. generally accepted accounting principles (“GAAP”) recognized by the FASB to be applied by nongovernmental entities. Rules and interpretive releases of the Securities and Exchange Commission (“SEC”) under authority of federal laws are also sources of authoritative GAAP for SEC registrants. The fund’s financial statements are prepared in accordance with GAAP, which may require the use of management estimates and assumptions.Actual results could differ from those estimates.
The Company enters into contracts that contain a variety of indemnifications.The fund’s maximum exposure under these arrangements is unknown.The fund does not anticipate recognizing any loss related to these arrangements.
(a) Portfolio valuation: The fair value of a financial instrument is the amount that would be received to sell an asset or paid to transfer a liability in an orderly transaction between market participants at the measurement date (i.e., the exit price). GAAP establishes a fair value hierarchy that prioritizes the inputs of valuation techniques used to measure fair value.This hierarchy gives the highest priority to unadjusted quoted prices in active markets for identical assets or liabilities (Level 1 measurements) and the lowest priority to unobservable inputs (Level 3 measurements).
Additionally, GAAP provides guidance on determining whether the volume and activity in a market has decreased significantly and whether such a decrease in activity results in transactions that are not
26
orderly. GAAP requires enhanced disclosures around valuation inputs and techniques used during annual and interim periods.
Various inputs are used in determining the value of the fund’s investments relating to fair value measurements.These inputs are summarized in the three broad levels listed below:
Level 1—unadjusted quoted prices in active markets for identical investments.
Level 2—other significant observable inputs (including quoted prices for similar investments, interest rates, prepayment speeds, credit risk, etc.).
Level 3—significant unobservable inputs (including the fund’s own assumptions in determining the fair value of investments).
The inputs or methodology used for valuing securities are not necessarily an indication of the risk associated with investing in those securities.
Changes in valuation techniques may result in transfers in or out of an assigned level within the disclosure hierarchy. Valuation techniques used to value the fund’s investments are as follows:
Investments in equity securities are valued at the last sales price on the securities exchange or national securities market on which such securities are primarily traded. Securities listed on the National Market System for which market quotations are available are valued at the official closing price or, if there is no official closing price that day, at the last sales price. Securities not listed on an exchange or the national securities market, or securities for which there were no transactions, are valued at the average of the most recent bid and asked prices, except for open short positions, where the asked price is used for valuation purposes. Bid price is used when no asked price is available. Registered
T h e F u n d 27
N O T E S T O F I N A N C I A L S TAT E M E N T S (continued)
investment companies that are not traded on an exchange are valued at their net asset value. All of the preceding securities are categorized within Level 1 of the fair value hierarchy.
Investments in debt securities excluding short-term investments (other than U.S. Treasury Bills), options and forward foreign currency exchange contracts (“forward contracts”) are valued each business day by an independent pricing service (the “Service”) approved by the Company’s Board of Directors (the “Board”). Investments for which quoted bid prices are readily available and are representative of the bid side of the market in the judgment of the Service are valued at the mean between the quoted bid prices (as obtained by the Service from dealers in such securities) and asked prices (as calculated by the Service based upon its evaluation of the market for such securities). Other investments are valued as determined by the Service, based on methods which include consideration of the following: yields or prices of securities of comparable quality, coupon, maturity and type; indications as to values from dealers; and general market conditions.These securities are generally categorized within Level 2 of the fair value hierarchy.
U.S. Treasury Bills are valued at the mean price between quoted bid prices and asked prices by the Service. These securities are generally categorized within Level 2 of the fair value hierarchy.
The Service’s procedures are reviewed by Dreyfus under the general supervision of the Board.
Fair valuing of securities may be determined with the assistance of a pricing service using calculations based on indices of domestic securities and other appropriate indicators, such as prices of relevant ADRs and financial futures. Utilizing these techniques may result in transfers between Level 1 and Level 2 of the fair value hierarchy.
28
When market quotations or official closing prices are not readily available, or are determined not to reflect accurately fair value, such as when the value of a security has been significantly affected by events after the close of the exchange or market on which the security is principally traded (for example, a foreign exchange or market), but before the fund calculates its net asset value, the fund may value these investments at fair value as determined in accordance with the procedures approved by the Board. Certain factors may be considered when fair valuing investments such as: fundamental analytical data, the nature and duration of restrictions on disposition, an evaluation of the forces that influence the market in which the securities are purchased and sold, and public trading in similar securities of the issuer or comparable issuers.These securities are either categorized as Level 2 or 3 depending on the relevant inputs used.
For restricted securities where observable inputs are limited,assumptions about market activity and risk are used and are categorized within Level 3 of the fair value hierarchy.
Investments denominated in foreign currencies are translated to U.S. dollars at the prevailing rates of exchange.
Options which are traded on an exchange, are valued at the last sales price on the securities exchange on which such securities are primarily traded or at the last sales price on the national securities market on each business day. These securities are generally categorized within Level 1 of the fair value hierarchy. Options traded over-the-counter are valued at the mean between the bid and asked price.These securities are generally categorized within Level 2 of the fair value hierarchy. Forward contracts are valued at the forward rate.These securities are generally categorized within Level 2 of the fair value hierarchy.
T h e F u n d 29
N O T E S T O F I N A N C I A L S TAT E M E N T S (continued)
The following is a summary of the inputs used as of October 31, 2012 in valuing the fund’s investments:
| | | | | | | |
| | | | Level 2—Other | | Level 3— | | |
| | Level 1— | | Significant | | Significant | | |
| | Unadjusted | | Observable | | Unobservable | | |
| | Quoted Prices | | Inputs | | Inputs | Total | |
| Assets ($) | | | | | | | |
| Investments in Securities: | | | | | | | |
| Corporate Bonds† | — | | 6,909,861 | | — | 6,909,861 | |
| Equity Securities—Domestic | | | | | | |
| Common Stocks† | 8,453,894 | | — | | — | 8,453,894 | |
| Equity Securities—Foreign | | | | | | | |
| Common Stocks† | 27,914,294 | | — | | — | 27,914,294 | |
| Exchange-Traded | | | | | | | |
| Funds | 2,570,877 | | — | | — | 2,570,877 | |
| Foreign Government | — | | 7,644,588 | | — | 7,644,588 | |
| Mutual Funds | 8,712,643 | | — | | — | 8,712,643 | |
| U.S. Treasury | — | | 9,714,555 | | — | 9,714,555 | |
| Other Financial | | | | | | | |
| Instruments: | | | | | | | |
| Forward Foreign | | | | | | | |
| Currency Exchange | | | | | | | |
| Contracts†† | — | | 60,003 | | — | 60,003 | |
| Options Purchased | 156,754 | | — | | — | 156,754 | |
| Liabilities ($) | | | | | | | |
| Other Financial | | | | | | | |
| Instruments: | | | | | | | |
| Forward Foreign | | | | | | | |
| Currency Exchange | | | | | | | |
| Contracts†† | — | | (1,167,582 | ) | — | (1,167,582 | ) |
| Options Written | (63,839 | ) | — | | — | (63,839 | ) |
| |
| † | See Statement of Investments for additional detailed categorizations. |
| †† | Amount shown represents unrealized appreciation (depreciation) at period end. |
At October 31, 2011, $1,577,653 of exchange traded foreign equity securities were classified within Level 2 of the fair value hierarchy pursuant to the fund’s fair valuation procedures.
(b) Foreign currency transactions: The fund does not isolate that portion of the results of operations resulting from changes in foreign
30
exchange rates on investments from the fluctuations arising from changes in the market prices of securities held. Such fluctuations are included with the net realized and unrealized gain or loss on investments.
Net realized foreign exchange gains or losses arise from sales of foreign currencies, currency gains or losses realized on securities transactions between trade and settlement date, and the difference between the amounts of dividends, interest and foreign withholding taxes recorded on the fund’s books and the U.S. dollar equivalent of the amounts actually received or paid. Net unrealized foreign exchange gains and losses arise from changes in the value of assets and liabilities other than investments resulting from changes in exchange rates. Foreign currency gains and losses on investments are also included with net realized and unrealized gain or loss on investments.
(c) Securities transactions and investment income: Securities transactions are recorded on a trade date basis. Realized gains and losses from securities transactions are recorded on the identified cost basis. Dividend income is recognized on the ex-dividend date and interest income, including, where applicable, accretion of discount and amortization of premium on investments, is recognized on the accrual basis.
(d) Affiliated issuers: Investments in other investment companies advised by Dreyfus are defined as “affiliated” in the Act. Investments in affiliated investment companies for the period ended October 31, 2012 were as follows:
| | | | | |
| Affiliated | | | | | |
| Investment | Value | | | Value | Net |
| Company | 10/31/2011 ($) | Purchases ($) | Sales ($) | 10/31/2012 (%) | Assets ($) |
| Dreyfus | | | | | |
| Institutional | | | | | |
| Preferred | | | | | |
| Plus Money | | | | | |
| Market Fund | — | 63,575,107 | 55,105,107 | 8,470,000 | 12.0 |
T h e F u n d 31
N O T E S T O F I N A N C I A L S TAT E M E N T S (continued)
(e) Risk: Investing in foreign markets may involve special risks and considerations not typically associated with investing in the U.S. These risks include revaluation of currencies, high rates of inflation, repatriation restrictions on income and capital, and adverse political and economic developments. Moreover, securities issued in these markets may be less liquid, subject to government ownership controls and delayed settlements, and their prices may be more volatile than those of comparable securities in the U.S.
(f) Dividends to shareholders: Dividends are recorded on the ex-dividend date. Dividends from investment income-net and dividends from net realized capital gains, if any, are normally declared and paid annually, but the fund may make distributions on a more frequent basis to comply with the distribution requirements of the Internal Revenue Code of 1986, as amended (the “Code”).To the extent that net realized capital gains can be offset by capital loss carryovers, it is the policy of the fund not to distribute such gains. Income and capital gain distributions are determined in accordance with income tax regulations, which may differ from GAAP.
(g) Federal income taxes: It is the policy of the fund to continue to qualify as a regulated investment company, if such qualification is in the best interests of its shareholders, by complying with the applicable provisions of the Code, and to make distributions of taxable income sufficient to relieve it from substantially all federal income and excise taxes.
As of and during the period ended October 31, 2012, the fund did not have any liabilities for any uncertain tax positions.The fund recognizes interest and penalties, if any, related to uncertain tax positions as income tax expense in the Statement of Operations. During the period, the fund did not incur any interest or penalties.
Each of the tax years in the three-year period ended October 31, 2012 remains subject to examination by the Internal Revenue Service and state taxing authorities.
At October 31, 2012, the components of accumulated earnings on a tax basis were as follows: undistributed ordinary income $207,900, accumulated capital losses $58,862 and unrealized appreciation $2,663,080.
32
Under the Regulated Investment Company Modernization Act of 2010 (the “2010 Act”), the fund is permitted to carry forward capital losses incurred in taxable years beginning after December 22, 2010 (“post-enactment losses”) for an unlimited period. Furthermore, post-enactment capital loss carryovers retain their character as either short-term or long-term capital losses rather than short-term as they were under previous statute.
The accumulated capital loss carryover is available for federal income tax purposes to be applied against future net realized capital gains, if any, realized subsequent to October 31, 2012.The fund has $58,862 of post-enactment short-term capital losses which can be carried forward for an unlimited period.
The tax character of distributions paid to shareholders during the fiscal periods ended October 31, 2012 and October 31, 2011 were as follows: ordinary income $270,888 and $0 and long-term capital gains $54,353 and $0, respectively.
During the period ended October 31, 2012, as a result of permanent book to tax differences, primarily due to the tax treatment for foreign currency gains and losses, passive foreign investment companies and real estate investment trusts, the fund increased accumulated undistributed investment income-net by $539,318 and decreased accumulated net realized gain (loss) on investments by the same amount. Net assets and net asset value per share were not affected by this reclassification.
(h) New Accounting Pronouncement: In December 2011, FASB issued Accounting Standards Update No. 2011-11 “Disclosures about Offsetting Assets and Liabilities” (“ASU 2011-11”). These disclosure requirements are intended to help investors and other financial statement users to better assess the effect or potential effect of offsetting arrangements on a company’s financial position.They also improve transparency in the reporting of how companies mitigate credit risk, including disclosure of related collateral pledged or received. In addition,ASU 2011-11 facilitates comparison between those entities that prepare their financial statements on the basis of GAAP and those entities that prepare their
T h e F u n d 33
N O T E S T O F I N A N C I A L S TAT E M E N T S (continued)
financial statements on the basis of International Financial Reporting Standards (“IFRS”).ASU 2011-11 requires entities to:disclose both gross and net information about both instruments and transactions eligible for offset in the financial statements;and disclose instruments and transactions subject to an agreement similar to a master netting agreement. ASU 2011-11 is effective for fiscal years beginning on or after January 1, 2013, and interim periods within those annual periods. At this time, management is evaluating the implications of ASU 2011-11 and its impact on the fund’s financial statement disclosures.
NOTE 2—Bank Lines of Credit:
The fund participates with other Dreyfus-managed funds in a $225 million unsecured credit facility led by Citibank, N.A. and a $300 million unsecured credit facility provided by The Bank of NewYork Mellon, a subsidiary of BNY Mellon and an affiliate of Dreyfus (each,a “Facility”), each to be utilized primarily for temporary or emergency purposes, including the financing of redemptions. Effective October 10, 2012, the $225 million unsecured credit facility with Citibank, N.A., was decreased to $210 million. In connection therewith, the fund has agreed to pay its pro rata portion of commitment fees for each Facility. Interest is charged to the fund based on rates determined pursuant to the terms of the respective Facility at the time of borrowing.
The average amount of borrowings outstanding under the Facilities during the period ended October 31, 2012, was approximately $6,300, with a related weighted average annualized interest rate of 1.18%.
NOTE 3—Management Fee, Sub-Investment Advisory Fee and Other Transactions With Affiliates:
(a) Pursuant to a management agreement with Dreyfus, the management fee is computed at the annual rate of .90% of the value of the fund’s average daily net assets and is payable monthly. Dreyfus has contractually agreed, until March 1, 2014, to waive receipt of its fees and/or assume the direct expenses of the fund so that the expenses of none of the classes (excluding Rule 12b-1 Distribution Plan fees, Shareholder Services Plan fees, taxes, interest expense, brokerage commissions, com-
34
mitment fees on borrowings and extraordinary expenses) exceed 1.25% of the value of the fund’s average daily net assets. The reduction in expenses, pursuant to the undertaking, amounted to $50,461 during the period ended October 31, 2012.
Pursuant to a Sub-Investment Advisory Agreement between Dreyfus and Newton, Dreyfus pays Newton an annual fee of .43% of the value of the fund’s average daily net assets, payable monthly.
During the period ended October 31, 2012, the Distributor retained $2,180 from commissions earned on sales of the fund’s Class A shares.
(b) Under the Distribution Plan adopted pursuant to Rule 12b-1 under the Act, Class C shares pay the Distributor for distributing its shares at an annual rate of .75% of the value of the average daily net assets of Class C shares. During the period ended October 31, 2012, Class C shares were charged $4,383 pursuant to the Distribution Plan.
(c) Under the Shareholder Services Plan, Class A and Class C shares pay the Distributor at an annual rate of .25% of the value of their average daily net assets for the provision of certain services.The services provided may include personal services relating to shareholder accounts, such as answering shareholder inquiries regarding the fund and providing reports and other information, and services related to the maintenance of shareholder accounts.The Distributor may make payments to Service Agents (securities dealers, financial institutions or other industry professionals) in respect of these services. The Distributor determines the amounts to be paid to Service Agents. During the period ended October 31, 2012, Class A and Class C shares were charged $21,751 and $1,461, respectively, pursuant to the Shareholder Services Plan.
The fund has arrangements with the transfer agent and the custodian whereby the fund may receive earnings credits when positive cash balances are maintained, which are used to offset transfer agency and custody fees. For financial reporting purposes, the fund includes net earnings credits as an expense offset in the Statement of Operations.
T h e F u n d 35
N O T E S T O F I N A N C I A L S TAT E M E N T S (continued)
The fund compensates DreyfusTransfer, Inc. (“DTI”), a wholly-owned subsidiary of Dreyfus, under a transfer agency agreement for providing transfer agency services for the fund and, since May 29, 2012, cash management services related to fund subscriptions and redemptions. During the period ended October 31, 2012, the fund was charged $3,761 for transfer agency services and $67 for cash management services. Cash management fees were partially offset by earnings credits of $8. These fees are included in Shareholder servicing costs in the Statement of Operations.
The fund compensatesThe Bank of NewYork Mellon under a custody agreement for providing custodial services for the fund. During the period ended October 31, 2012, the fund was charged $34,022 pursuant to the custody agreement.
Prior to May 29, 2012, the fund compensated The Bank of NewYork Mellon under a cash management agreement for performing cash management services related to fund subscriptions and redemptions. During the period ended October 31, 2012, the fund was charged $227 pursuant to the cash management agreement, which is included in Shareholder servicing costs in the Statement of Operations.These fees were partially offset by earnings credits of $7.
During the period ended October 31, 2012, the fund was charged $8,517 for services performed by the Chief Compliance Officer and his staff.
The components of “Due to The Dreyfus Corporation and affiliates” in the Statement of Assets and Liabilities consist of: management fees $51,072, Distribution Plan fees $564, Shareholder Services Plan fees $3,774, custodian fees $10,348, Chief Compliance Officer fees $2,654 and transfer agency fees $580, which are offset against an expense reimbursement currently in effect in the amount of $3,087.
36
(d) Each Board member also serves as a Board member of other funds within the Dreyfus complex. Annual retainer fees and attendance fees are allocated to each fund based on net assets.
NOTE 4—Securities Transactions:
The aggregate amount of purchases and sales of investment securities, excluding short-term securities, options transactions and forward contracts, during the period ended October 31, 2012, amounted to $53,026,320 and $18,572,407, respectively.
Derivatives: A derivative is a financial instrument whose performance is derived from the performance of another asset. Each type of derivative instrument that was held by the fund during the period ended October 31, 2012 is discussed below.
The following tables show the fund’s exposure to different types of market risk as it relates to the Statement of Assets and Liabilities and the Statement of Operations, respectively.
Fair value of derivative instruments as of October 31, 2012 is shown below:
| | | | |
| | Derivative | | Derivative | |
| | Assets ($) | | Liabilities ($) | |
| Equity risk1 | 156,754 | Equity risk2 | (63,839 | ) |
| Foreign exchange risk3 | 60,003 | Foreign exchange risk4 | (1,167,582 | ) |
| Gross fair value of | | | | |
| derivatives contracts | 216,757 | | (1,231,421 | ) |
Statement of Assets and Liabilities location:
| |
| 1 | Options purchased are included in investments in securities—Unaffiliated issuers, at value. |
| 2 | Outstanding options written, at value. |
| 3 | Unrealized appreciation on forward foreign currency exchange contracts. |
| 4 | Unrealized depreciation on forward foreign currency exchange contracts. |
T h e F u n d 37
N O T E S T O F I N A N C I A L S TAT E M E N T S (continued)
The effect of derivative instruments in the Statement of Operations during the period ended October 31, 2012 is shown below:
| | | | | |
| | Amount of realized gain or (loss) on derivatives recognized in income ($) | |
| | Options | | Forward | | |
| Underlying risk | Transactions5 | | Contracts6 | Total | |
| Equity | (95,766 | ) | — | (95,766 | ) |
| Foreign exchange | (31,186 | ) | 543,119 | 511,933 | |
| Total | (126,952 | ) | 543,119 | 416,167 | |
| | | | | |
| Change in unrealized appreciation or (depreciation) on derivatives recognized in income ($) | |
| | Options | Forward | | | |
| Underlying risk | Transactions7 | Contracts8 | | Total | |
| Equity | 240,420 | — | | 240,420 | |
| Foreign exchange | 22,599 | (1,154,453 | ) | (1,131,854 | ) |
| Total | 263,019 | (1,154,453 | ) | (891,434 | ) |
Statement of Operations location:
| |
| 5 | Net realized gain (loss) on options transactions. |
| 6 | Net realized gain (loss) on forward foreign currency exchange contracts. |
| 7 | Net unrealized appreciation (depreciation) on options transactions. |
| 8 | Net unrealized appreciation (depreciation) on forward foreign currency exchange contracts. |
Options Transactions: The fund purchases and writes (sells) put and call options to hedge against changes in the values of equities and foreign currencies, or as a substitute for an investment.The fund is subject to market risk and currency risk in the course of pursuing its investment objectives through its investments in options contracts. A call option gives the purchaser of the option the right (but not the obligation) to buy, and obligates the writer to sell, the underlying security or securities at the exercise price at any time during the option period, or at a specified date. Conversely, a put option gives the purchaser of the option the right (but not the obligation) to sell, and obligates the writer to buy the underlying security or securities at the exercise price at any time during the option period, or at a specified date.
As a writer of call options, the fund receives a premium at the outset and then bears the market risk of unfavorable changes in the price of the financial instrument underlying the option. Generally, the fund realizes a gain, to the extent of the premium, if the price of the underlying financial instrument decreases between the date the option is written and the date on which the option is terminated. Generally, the
38
fund incurs a loss if the price of the financial instrument increases between those dates.
As a writer of put options, the fund receives a premium at the outset and then bears the market risk of unfavorable changes in the price of the financial instrument underlying the option. Generally, the fund realizes a gain, to the extent of the premium, if the price of the underlying financial instrument increases between the date the option is written and the date on which the option is terminated. Generally, the fund incurs a loss if the price of the financial instrument decreases between those dates.
As a writer of an option, the fund has no control over whether the underlying securities may be sold (call) or purchased (put) and as a result bears the market risk of an unfavorable change in the price of the security underlying the written option.There is a risk of loss from a change in value of such options which may exceed the related premiums received. The Statement of Operations reflects the following: any unrealized gains or losses which occurred during the period as well as any realized gains or losses which occurred upon the expiration or closing of the option transaction.
The following summarizes the fund’s call/put options written during the period ended October 31, 2012:
| | | | |
| | | | Options Terminated |
| | Number of | Premiums | | Net Realized |
| Options Written: | Contracts | Received ($) | Cost ($) | Gain ($) |
| Contracts outstanding | | | | |
| October 31, 2011 | 160 | 201,111 | | |
| Contracts written | 1,406 | 1,593,211 | | |
| Contracts terminated: | | | | |
| Contracts closed | 914 | 1,043,556 | 527,919 | 515,637 |
| Contracts expired | 462 | 518,616 | — | 518,616 |
| Total contracts terminated | 1,376 | 1,562,172 | 527,919 | 1,034,253 |
| Contracts Outstanding | | | | |
| October 31, 2012 | 190 | 232,150 | | |
Forward Foreign Currency Exchange Contracts: The fund enters into forward contracts in order to hedge its exposure to changes in foreign currency exchange rates on its foreign portfolio holdings, to
T h e F u n d 39
N O T E S T O F I N A N C I A L S TAT E M E N T S (continued)
settle foreign currency transactions or as a part of its investment strategy.When executing forward contracts, the fund is obligated to buy or sell a foreign currency at a specified rate on a certain date in the future.With respect to sales of forward contracts, the fund incurs a loss if the value of the contract increases between the date the forward contract is opened and the date the forward contract is closed. The fund realizes a gain if the value of the contract decreases between those dates.With respect to purchases of forward contracts, the fund incurs a loss if the value of the contract decreases between the date the forward contract is opened and the date the forward contract is closed.The fund realizes a gain if the value of the contract increases between those dates.Any realized or unrealized gains or losses which occurred during the period are reflected in the Statement of Operations.The fund is exposed to foreign currency risk as a result of changes in value of underlying financial instruments.The fund is also exposed to credit risk associated with counterparty nonperformance on these forward contracts, which is typically limited to the unrealized gain on each open contract.The following summarizes open forward contracts at October 31, 2012:
| | | | | |
| | Foreign | | | Unrealized | |
| Forward Foreign Currency | Currency | | | Appreciation | |
| Exchange Contracts | Amounts | Cost ($) | Value ($) (Depreciation) ($) | |
| Purchases: | | | | | |
| British Pound, | | | | | |
| Expiring: | | | | | |
| 11/1/2012a | 27,280 | 43,965 | 44,023 | 58 | |
| 11/14/2012b | 2,452,000 | 3,948,006 | 3,956,720 | 8,714 | |
| 11/14/2012c | 263,000 | 418,226 | 424,395 | 6,169 | |
| Euro, | | | | | |
| Expiring | | | | | |
| 2/15/2013b | 1,842,000 | 2,402,508 | 2,390,126 | (12,382 | ) |
| Sales: | | Proceeds ($) | | | |
| Australian Dollar, | | | | | |
| Expiring: | | | | | |
| 12/14/2012a | 613,000 | 610,023 | 634,023 | (24,000 | ) |
| 12/14/2012b | 6,083,000 | 6,015,490 | 6,291,614 | (276,124 | ) |
| 12/14/2012c | 1,337,000 | 1,338,427 | 1,382,852 | (44,425 | ) |
| British Pound, | | | | | |
| Expiring: | | | | | |
| 11/14/2012a | 2,938,000 | 4,626,847 | 4,740,964 | (114,117 | ) |
| 11/14/2012b | 4,016,773 | 6,445,113 | 6,481,748 | (36,635 | ) |
| 11/14/2012c | 2,120,000 | 3,297,323 | 3,420,981 | (123,658 | ) |
40
| | | | | | |
| | | Foreign | | | Unrealized | |
| Forward Foreign Currency | | Currency | | | Appreciation | |
| Exchange Contracts | | Amounts | Proceeds ($) | Value ($) (Depreciation) ($) | |
| Sales (continued): | | | | | | |
| Canadian Dollar, | | | | | | |
| Expiring | | | | | | |
| 2/15/2013c | | 877,654 | 884,129 | 876,671 | 7,458 | |
| Danish Krone, | | | | | | |
| Expiring | | | | | | |
| 4/15/2013d | | 4,916,000 | 856,195 | 856,764 | (569 | ) |
| Euro, | | | | | | |
| Expiring: | | | | | | |
| 2/15/2013a | | 8,987,350 | 11,375,066 | 11,661,722 | (286,656 | ) |
| 2/15/2013c | | 53,000 | 68,784 | 68,771 | 13 | |
| Japanese Yen, | | | | | | |
| expiring | | | | | | |
| 4/15/2013b | | 106,142,000 | 1,360,409 | 1,331,932 | 28,477 | |
| New Zealand Dollar, | | | | | | |
| expiring | | | | | | |
| 4/15/2013a | | 1,595,000 | 1,285,969 | 1,297,351 | (11,382 | ) |
| Norwegian Krone, | | | | | | |
| Expiring: | | | | | | |
| 2/15/2013a | | 716,000 | 119,754 | 125,081 | (5,327 | ) |
| 2/15/2013c | | 16,305,300 | 2,739,858 | 2,848,438 | (108,580 | ) |
| Polish Zloty, | | | | | | |
| Expiring: | | | | | | |
| 2/15/2013a | | 132,000 | 39,165 | 40,856 | (1,691 | ) |
| 2/15/2013b | | 276,000 | 81,603 | 85,427 | (3,824 | ) |
| 2/15/2013c | | 2,056,000 | 609,710 | 636,368 | (26,658 | ) |
| South African Rand, | | | | | | |
| Expiring: | | | | | | |
| 12/14/2012a | | 921,000 | 106,199 | 105,508 | 691 | |
| 12/14/2012b | | 1,715,100 | 197,413 | 196,479 | 934 | |
| 12/14/2012c | | 1,161,000 | 140,491 | 133,002 | 7,489 | |
| Swedish Krona, | | | | | | |
| Expiring: | | | | | | |
| 2/15/2013a | | 2,576,000 | 383,434 | 387,195 | (3,761 | ) |
| 2/15/2013b | | 1,083,000 | 159,703 | 162,784 | (3,081 | ) |
| 2/15/2013c | | 1,661,000 | 249,372 | 249,663 | (291 | ) |
| Swiss Franc, | | | | | | |
| Expiring: | | | | | | |
| 12/14/2012a | | 2,544,000 | 2,661,399 | 2,733,508 | (72,109 | ) |
| 12/14/2012b | | 319,000 | 331,430 | 342,763 | (11,333 | ) |
| 12/14/2012c | | 181,000 | 193,504 | 194,483 | (979 | ) |
| Gross Unrealized | | | | | | |
| Appreciation | | | | | 60,003 | |
| Gross Unrealized | | | | | | |
| Depreciation | | | | | (1,167,582 | ) |
Counterparties:
a Royal Bank of Scotland
b JPMorgan Chase & Co.
c UBS
d Barclays Capital
T h e F u n d 41
N O T E S T O F I N A N C I A L S TAT E M E N T S (continued)
The following summarizes the average market value of derivatives outstanding during the period ended October 31, 2012:
| |
| | Average Market Value ($) |
| Equity options contracts | 245,050 |
| Foreign currency options contracts | 919 |
| Forward contracts | 24,566,934 |
At October 31,2012,the cost of investments for federal income tax purposes was $69,077,875; accordingly, accumulated net unrealized appreciation on investments was $2,999,591, consisting of $3,981,531 gross unrealized appreciation and $981,940 gross unrealized depreciation.
42
R E P O R T O F I N D E P E N D E N T R E G I S T E R E D
P U B L I C A C C O U N T I N G F I R M
Shareholders and Board of Directors
Dreyfus Global Real Return Fund
We have audited the accompanying statement of assets and liabilities, including the statements of investments and options written, of Dreyfus Global Real Return Fund (one of the series comprising Advantage Funds, Inc.) as of October 31, 2012, and the related statement of operations for the year then ended, the statement of changes in net assets for each of the two years in the period then ended, and the financial highlights for each of the periods indicated therein.These financial statements and financial highlights are the responsibility of the Fund’s management. Our responsibility is to express an opinion on these financial statements and financial highlights based on our audits.
We conducted our audits in accordance with the standards of the Public Company Accounting Oversight Board (United States).Those standards require that we plan and perform the audit to obtain reasonable assurance about whether the financial statements and financial highlights are free of material misstatement.We were not engaged to perform an audit of the Fund’s internal control over financial reporting. Our audits included consideration of internal control over financial reporting as a basis for designing audit procedures that are appropriate in the circumstances, but not for the purpose of expressing an opinion on the effectiveness of the Fund’s internal control over financial reporting. Accordingly, we express no such opinion.An audit also includes examining, on a test basis, evidence supporting the amounts and disclosures in the financial statements and financial highlights, assessing the accounting principles used and significant estimates made by management, and evaluating the overall financial statement presentation. Our procedures included confirmation of securities owned as of October 31, 2012 by correspondence with the custodian and others.We believe that our audits provide a reasonable basis for our opinion.
In our opinion, the financial statements and financial highlights referred to above present fairly, in all material respects, the financial position of Dreyfus Global Real Return Fund at October 31, 2012, the results of its operations for the year then ended, the changes in its net assets for each of the two years in the period then ended, and the financial highlights for each of the indicated periods, in conformity with U.S. generally accepted accounting principles.

NewYork, NewYork
December 27, 2012
T h e F u n d 43
I M P O R TA N T TA X I N F O R M AT I O N ( U n a u d i t e d )
In accordance with federal tax law, the fund elects to provide each shareholder with their portion of the fund’s foreign taxes paid and the income sourced from foreign countries. Accordingly, the fund hereby reports the following information regarding its fiscal year ended October 31, 2012:
—the total amount of taxes paid to foreign countries was $36,024.
—the total amount of income sourced from foreign countries was $1,125,058.
For the fiscal year ended October 31, 2012, certain dividends paid by the fund may be subject to a maximum tax rate of 15%, as provided for by the Jobs and Growth Tax Relief Reconciliation Act of 2003. Of the distributions paid during the fiscal year, $270,888 represents the maximum amount that may be considered qualified dividend income.Also, the fund hereby designates $.0351 per share as a long-term capital gain and $.0381 per share as a short-term capital gain distribution paid on December 29, 2011.
P R O X Y R E S U LT S ( U n a u d i t e d )
The Company held a special meeting of shareholders on August 3, 2012.The proposal considered at the meeting, and the results, are as follows:
| | | |
| | | Shares | |
| | Votes For | | Authority Withheld |
| To elect additional Board Members: | | | |
| Lynn Martin† | 90,334,756 | | 3,252,629 |
| Robin A. Melvin† | 90,449,622 | | 3,137,763 |
| Philip L. Toia† | 90,229,928 | | 3,357,457 |
|
| † Each new Board Member’s term commenced on September 1, 2012. |
| In addition Peggy C. Davis, Joseph S. DiMartino, David P. Feldman, Ehud Houminer and Dr. Martin Peretz continue |
| as Board Members of the Company. |
44
B O A R D M E M B E R S I N F O R M AT I O N ( U n a u d i t e d )
|
| Joseph S. DiMartino (69) |
| Chairman of the Board (1995) |
| Principal Occupation During Past 5Years: |
| • Corporate Director and Trustee |
| Other Public Company Board Memberships During Past 5Years: |
| • CBIZ (formerly, Century Business Services, Inc.), a provider of outsourcing functions for small |
| and medium size companies, Director (1997-present) |
| • Sunair Services Corporation, a provider of certain outdoor-related services to homes and |
| businesses, Director (2005-2009) |
| • The Newark Group, a provider of a national market of paper recovery facilities, paperboard |
| mills and paperboard converting plants, Director (2000-2010) |
| No. of Portfolios for which Board Member Serves: 157 |
| ——————— |
| Peggy C. Davis (69) |
| Board Member (2006) |
| Principal Occupation During Past 5Years: |
| • Shad Professor of Law, NewYork University School of Law (1983-present) |
| No. of Portfolios for which Board Member Serves: 63 |
| ——————— |
| David P. Feldman (72) |
| Board Member (1996) |
| Principal Occupation During Past 5Years: |
| • Corporate Director and Trustee |
| Other Public Company Board Memberships During Past 5Years: |
| • BBH Mutual Funds Group (4 registered mutual funds), Director (1992-present) |
| • QMed, Inc. a healthcare company, Director (1999-2007) |
| No. of Portfolios for which Board Member Serves: 46 |
| ——————— |
| Ehud Houminer (72) |
| Board Member (1993) |
| Principal Occupation During Past 5Years: |
| • Executive-in-Residence at the Columbia Business School, Columbia University (1992-present) |
| Other Public Company Board Memberships During Past 5Years: |
| • Avnet Inc., an electronics distributor, Director (1993-2012) |
| No. of Portfolios for which Board Member Serves: 73 |
T h e F u n d 45
B O A R D M E M B E R S I N F O R M AT I O N ( U n a u d i t e d ) (continued)
|
| Lynn Martin (72) |
| Board Member (2012) |
| Principal Occupation During Past 5Years: |
| • President of The Martin Hall Group LLC, a human resources consulting firm, from January |
| 2005-present |
| Other Public Company Board Memberships During Past 5Years: |
| • AT&T Inc., a telecommunications company, Director (1999-2012) |
| • Ryder System,Inc.,a supply chain and transportation management company,Director (1993-2012) |
| • The Proctor & Gamble Co., a consumer products company, Director (1994-2009) |
| • Constellation Energy Group Inc., Director (2003-2009) |
| No. of Portfolios for which Board Member Serves: 46 |
| ——————— |
| Robin A. Melvin (49) |
| Board Member (2012) |
| Principal Occupation During Past 5Years: |
| • Director, Boisi Family Foundation, a private family foundation that supports youth-serving orga- |
| nizations that promote the self sufficiency of youth from disadvantaged circumstances (1995-2012) |
| No. of Portfolios for which Board Member Serves: 83 |
| ——————— |
| Dr. Martin Peretz (73) |
| Board Member (2006) |
| Principal Occupation During Past 5Years: |
| • Editor-in-Chief Emeritus of The New Republic Magazine (2010-present) (previously, |
| Editor-in-Chief, 1974-2010) |
| • Director of TheStreet.com, a financial information service on the web (1996-present) |
| No. of Portfolios for which Board Member Serves: 46 |
| ——————— |
| Philip L. Toia (79) |
| Board Member (2012) |
| Principal Occupation During Past 5Years: |
| • Private Investor |
| No. of Portfolios for which Board Member Serves: 56 |
| ——————— |
Once elected all Board Members serve for an indefinite term, but achieve Emeritus status upon reaching age 80.The address of the Board Members and Officers is c/o The Dreyfus Corporation, 200 Park Avenue, NewYork, NewYork 10166.Additional information about the Board Members is available in the fund’s Statement of Additional Information which can be obtained from Dreyfus free of charge by calling this toll free number: 1-800-DREYFUS.
James F. Henry, Emeritus Board Member
Dr. Paul A. Marks, Emeritus Board Member
Gloria Messinger, Emeritus Board Member
46
O F F I C E R S O F T H E F U N D ( U n a u d i t e d )
BRADLEY J. SKAPYAK, President since January 2010.
Chief Operating Officer and a director of the Manager since June 2009; from April 2003 to June 2009, Mr. Skapyak was the head of the Investment Accounting and Support Department of the Manager. He is an officer of 72 investment companies (comprised of 156 portfolios) managed by the Manager. He is 53 years old and has been an employee of the Manager since February 1988.
JANETTE E. FARRAGHER, Vice President and Secretary since December 2011.
Assistant General Counsel of BNY Mellon, and an officer of 73 investment companies (comprised of 183 portfolios) managed by the Manager. She is 49 years old and has been an employee of the Manager since February 1984.
KIESHA ASTWOOD, Vice President and Assistant Secretary since January 2010.
Counsel of BNY Mellon, and an officer of 73 investment companies (comprised of 183 portfolios) managed by the Manager. She is 39 years old and has been an employee of the Manager since July 1995.
JAMES BITETTO, Vice President and Assistant Secretary since August 2005.
Senior Counsel of BNY Mellon and Secretary of the Manager, and an officer of 73 investment companies (comprised of 183 portfolios) managed by the Manager. He is 46 years old and has been an employee of the Manager since December 1996.
JONI LACKS CHARATAN, Vice President and Assistant Secretary since August 2005.
Senior Counsel of BNY Mellon, and an officer of 73 investment companies (comprised of 183 portfolios) managed by the Manager. She is 56 years old and has been an employee of the Manager since October 1988.
JOSEPH M. CHIOFFI, Vice President and Assistant Secretary since August 2005.
Senior Counsel of BNY Mellon, and an officer of 73 investment companies (comprised of 183 portfolios) managed by the Manager. He is 50 years old and has been an employee of the Manager since June 2000.
JOHN B. HAMMALIAN, Vice President and Assistant Secretary since August 2005.
Senior Managing Counsel of BNY Mellon, and an officer of 73 investment companies (comprised of 183 portfolios) managed by the Manager. He is 49 years old and has been an employee of the Manager since February 1991.
ROBERT R. MULLERY, Vice President and Assistant Secretary since August 2005.
Managing Counsel of BNY Mellon, and an officer of 73 investment companies (comprised of 183 portfolios) managed by the Manager. He is 60 years old and has been an employee of the Manager since May 1986.
JEFF PRUSNOFSKY, Vice President and Assistant Secretary since August 2005.
Senior Managing Counsel of BNY Mellon, and an officer of 73 investment companies (comprised of 183 portfolios) managed by the Manager. He is 47 years old and has been an employee of the Manager since October 1990.
JAMES WINDELS, Treasurer since November 2001.
Director – Mutual Fund Accounting of the Manager, and an officer of 73 investment companies (comprised of 183 portfolios) managed by the Manager. He is 54 years old and has been an employee of the Manager since April 1985.
T h e F u n d 47
O F F I C E R S O F T H E F U N D ( U n a u d i t e d ) (continued)
RICHARD CASSARO, Assistant Treasurer since January 2008.
Senior Accounting Manager – Money Market and Municipal Bond Funds of the Manager, and an officer of 73 investment companies (comprised of 183 portfolios) managed by the Manager. He is 53 years old and has been an employee of the Manager since September 1982.
GAVIN C. REILLY, Assistant Treasurer since December 2005.
Tax Manager of the Investment Accounting and Support Department of the Manager, and an officer of 73 investment companies (comprised of 183 portfolios) managed by the Manager. He is 44 years old and has been an employee of the Manager since April 1991.
ROBERT S. ROBOL, Assistant Treasurer since August 2005.
Senior Accounting Manager – Fixed Income Funds of the Manager, and an officer of 73 investment companies (comprised of 183 portfolios) managed by the Manager. He is 48 years old and has been an employee of the Manager since October 1988.
ROBERT SALVIOLO, Assistant Treasurer since July 2007.
Senior Accounting Manager – Equity Funds of the Manager, and an officer of 73 investment companies (comprised of 183 portfolios) managed by the Manager. He is 45 years old and has been an employee of the Manager since June 1989.
ROBERT SVAGNA, Assistant Treasurer since December 2002.
Senior Accounting Manager – Equity Funds of the Manager, and an officer of 73 investment companies (comprised of 183 portfolios) managed by the Manager. He is 45 years old and has been an employee of the Manager since November 1990.
JOSEPH W. CONNOLLY, Chief Compliance Officer since October 2004.
Chief Compliance Officer of the Manager and The Dreyfus Family of Funds (73 investment companies, comprised of 183 portfolios). He is 55 years old and has served in various capacities with the Manager since 1980, including manager of the firm’s Fund Accounting Department from 1997 through October 2001.
MATTHEW D. CONNOLLY, Anti-Money Laundering Compliance Officer since April 2012.
Anti-Money Laundering Compliance Officer of the Distributor since October 2011; from March 2010 to September 2011, Global Head, KYC Reviews and Director, UBS Investment Bank; until March 2010,AML Compliance Officer and SeniorVice President, Citi Global Wealth Management. He is an officer of 69 investment companies (comprised of 179 portfolios) managed by the Manager. He is 40 years old and has been an employee of the Distributor since October 2011.
48
For More Information
Telephone Call your financial representative or 1-800-DREYFUS
Mail The Dreyfus Family of Funds, 144 Glenn Curtiss Boulevard, Uniondale, NY 11556-0144
The fund files its complete schedule of portfolio holdings with the Securities and Exchange Commission (“SEC”) for the first and third quarters of each fiscal year on Form N-Q. The fund’s Forms N-Q are available on the SEC’s website at http://www.sec.gov and may be reviewed and copied at the SEC’s Public Reference Room in Washington, DC. Information on the operation of the Public Reference Room may be obtained by calling 1-800-SEC-0330.
A description of the policies and procedures that the fund uses to determine how to vote proxies relating to portfolio securities is available at http://www.dreyfus.com and on the SEC’s website at http://www.sec.gov. The description of the policies and procedures is also available without charge, upon request, by calling 1-800-DREYFUS.

Item 2. Code of Ethics.
The Registrant has adopted a code of ethics that applies to the Registrant's principal executive officer, principal financial officer, principal accounting officer or controller, or persons performing similar functions. There have been no amendments to, or waivers in connection with, the Code of Ethics during the period covered by this Report.
Item 3. Audit Committee Financial Expert.
The Registrant's Board has determined that David P. Feldman, a member of the Audit Committee of the Board, is an audit committee financial expert as defined by the Securities and Exchange Commission (the "SEC"). David P. Feldman is "independent" as defined by the SEC for purposes of audit committee financial expert determinations.
Item 4. Principal Accountant Fees and Services.
(a) Audit Fees. The aggregate fees billed for each of the last two fiscal years (the "Reporting Periods") for professional services rendered by the Registrant's principal accountant (the "Auditor") for the audit of the Registrant's annual financial statements or services that are normally provided by the Auditor in connection with the statutory and regulatory filings or engagements for the Reporting Periods, were $220,020 in 2011 and $225,816 in 2012.
(b) Audit-Related Fees. The aggregate fees billed in the Reporting Periods for assurance and related services by the Auditor that are reasonably related to the performance of the audit of the Registrant's financial statements and are not reported under paragraph (a) of this Item 4 were $24,000 in 2011 and $36,000 in 2012. These services consisted of one or more of the following: (i) agreed upon procedures related to compliance with Internal Revenue Code section 817(h), (ii) security counts required by Rule 17f-2 under the Investment Company Act of 1940, as amended, (iii) advisory services as to the accounting or disclosure treatment of Registrant transactions or events and (iv) advisory services to the accounting or disclosure treatment of the actual or potential impact to the Registrant of final or proposed rules, standards or interpretations by the Securities and Exchange Commission, the Financial Accounting Standards Boards or other regulatory or standard-setting bodies.
The aggregate fees billed in the Reporting Periods for non-audit assurance and related services by the Auditor to the Registrant's investment adviser (not including any sub-investment adviser whose role is primarily portfolio management and is subcontracted with or overseen by another investment adviser), and any entity controlling, controlled by or under common control with the investment adviser that provides ongoing services to the Registrant ("Service Affiliates"), that were reasonably related to the performance of the annual audit of the Service Affiliate, which required pre-approval by the Audit Committee were $-0- in 2011 and $-0- in 2012.
(c) Tax Fees. The aggregate fees billed in the Reporting Periods for professional services rendered by the Auditor for tax compliance, tax advice, and tax planning ("Tax Services") were $30,288 in 2011 and $43,947 in 2012. These services consisted of: (i) review or preparation of U.S. federal, state, local and excise tax returns; (ii) U.S. federal, state and local tax planning, advice and assistance regarding statutory, regulatory or administrative developments; (iii) tax advice regarding tax qualification matters and/or treatment of various financial instruments held or proposed to be acquired or held, and (iv) determination of Passive Foreign Investment Companies. The aggregate fees billed in the Reporting Periods for Tax Services by the Auditor to Service Affiliates, which required pre-approval by the Audit Committee were $-0- in 2011 and $-0- in 2012.
(d) All Other Fees. The aggregate fees billed in the Reporting Periods for products and services provided by the Auditor, other than the services reported in paragraphs (a) through (c) of this Item, were $58 in 2011 and $112 in 2012. These services consisted of a review of the Registrant's anti-money laundering program.
The aggregate fees billed in the Reporting Periods for Non-Audit Services by the Auditor to Service Affiliates, other than the services reported in paragraphs (b) through (c) of this Item, which required pre-approval by the Audit Committee, were $-0- in 2011 and $200,000 in 2012.
(e)(1) Audit Committee Pre-Approval Policies and Procedures. The Registrant's Audit Committee has established policies and procedures (the "Policy") for pre-approval (within specified fee limits) of the Auditor's engagements for non-audit services to the Registrant and Service Affiliates without specific case-by-case consideration. The pre-approved services in the Policy can include pre-approved audit services, pre-approved audit-related services, pre-approved tax services and pre-approved all other services. Pre-approval considerations include whether the proposed services are compatible with maintaining the Auditor's independence. Pre-approvals pursuant to the Policy are considered annually.
(e)(2) Note: None of the services described in paragraphs (b) through (d) of this Item 4 were approved by the Audit Committee pursuant to paragraph (c)(7)(i)(C) of Rule 2-01 of Regulation S-X.
(f) None of the hours expended on the principal accountant's engagement to audit the registrant's financial statements for the most recent fiscal year were attributed to work performed by persons other than the principal account's full-time, permanent employees.
Non-Audit Fees. The aggregate non-audit fees billed by the Auditor for services rendered to the Registrant, and rendered to Service Affiliates, for the Reporting Periods were $18,299,198 in 2011 and $47,346,640 in 2012.
Auditor Independence. The Registrant's Audit Committee has considered whether the provision of non-audit services that were rendered to Service Affiliates, which were not pre-approved (not requiring pre-approval), is compatible with maintaining the Auditor's independence.
Item 5. Audit Committee of Listed Registrants.
Not applicable. [CLOSED-END FUNDS ONLY]
Item 6. Investments.
(a) Not applicable.
Item 7. Disclosure of Proxy Voting Policies and Procedures for Closed-End Management Investment Companies.
Not applicable. [CLOSED-END FUNDS ONLY]
Item 8. Portfolio Managers of Closed-End Management Investment Companies.
Not applicable. [CLOSED-END FUNDS ONLY, beginning with reports for periods ended on and after December 31, 2005]
Item 9. Purchases of Equity Securities by Closed-End Management Investment Companies and Affiliated Purchasers.
Not applicable. [CLOSED-END FUNDS ONLY]
Item 10. Submission of Matters to a Vote of Security Holders.
There have been no material changes to the procedures applicable to Item 10.
Item 11. Controls and Procedures.
(a) The Registrant's principal executive and principal financial officers have concluded, based on their evaluation of the Registrant's disclosure controls and procedures as of a date within 90 days of the filing date of this report, that the Registrant's disclosure controls and procedures are reasonably designed to ensure that information required to be disclosed by the Registrant on Form N-CSR is recorded, processed, summarized and reported within the required time periods and that information required to be disclosed by the Registrant in the reports that it files or submits on Form N-CSR is accumulated and communicated to the Registrant's management, including its principal executive and principal financial officers, as appropriate to allow timely decisions regarding required disclosure.
(b) There were no changes to the Registrant's internal control over financial reporting that occurred during the second fiscal quarter of the period covered by this report that have materially affected, or are reasonably likely to materially affect, the Registrant's internal control over financial reporting.
Item 12. Exhibits.
(a)(1) Code of ethics referred to in Item 2.
(a)(2) Certifications of principal executive and principal financial officers as required by Rule 30a-2(a) under the Investment Company Act of 1940.
(a)(3) Not applicable.
(b) Certification of principal executive and principal financial officers as required by Rule 30a-2(b) under the Investment Company Act of 1940.
SIGNATURES
Pursuant to the requirements of the Securities Exchange Act of 1934 and the Investment Company Act of 1940, the Registrant has duly caused this Report to be signed on its behalf by the undersigned, thereunto duly authorized.
Advantage Funds, Inc. By: /s/ Bradley J. Skapyak |
Bradley J. Skapyak, President |
Date: | April 18, 2013 |
|
Pursuant to the requirements of the Securities Exchange Act of 1934 and the Investment Company Act of 1940, this Report has been signed below by the following persons on behalf of the Registrant and in the capacities and on the dates indicated. |
|
By: /s/ Bradley J. Skapyak |
Bradley J. Skapyak, President |
Date: | April 18, 2013 |
|
By: /s/ James Windels |
James Windels, Treasurer |
Date: | April 18, 2013 |
|
EXHIBIT INDEX
(a)(1) Code of ethics referred to in Item 2.
(a)(2) Certifications of principal executive and principal financial officers as required by Rule 30a-2(a) under the Investment Company Act of 1940. (EX-99.CERT)
(b) Certification of principal executive and principal financial officers as required by Rule 30a-2(b) under the Investment Company Act of 1940. (EX-99.906CERT)