UNITED STATES
SECURITIES AND EXCHANGE COMMISSION
Washington, D.C. 20549
FORM N-CSR
CERTIFIED SHAREHOLDER REPORT OF REGISTERED MANAGEMENT
INVESTMENT COMPANIES
Investment Company Act file number | 811-7123 |
| |
| Advantage Funds, Inc. | |
| (Exact name of Registrant as specified in charter) | |
| | |
| c/o The Dreyfus Corporation 200 Park Avenue New York, New York 10166 | |
| (Address of principal executive offices) (Zip code) | |
| | |
| John Pak, Esq. 200 Park Avenue New York, New York 10166 | |
| (Name and address of agent for service) | |
|
Registrant's telephone number, including area code: | (212) 922-6000 |
| |
Date of fiscal year end: | 8/31 | |
Date of reporting period: | 8/31/2014 | |
| | | | | | | |
FORM N-CSR
Item 1. Reports to Stockholders.
|
| Dreyfus |
| International |
| Value Fund |
ANNUAL REPORT August 31, 2014

Save time. Save paper. View your next shareholder report online as soon as it’s available. Log into www.dreyfus.com and sign up for Dreyfus eCommunications. It’s simple and only takes a few minutes.
The views expressed in this report reflect those of the portfolio manager only through the end of the period covered and do not necessarily represent the views of Dreyfus or any other person in the Dreyfus organization. Any such views are subject to change at any time based upon market or other conditions and Dreyfus disclaims any responsibility to update such views.These views may not be relied on as investment advice and, because investment decisions for a Dreyfus fund are based on numerous factors, may not be relied on as an indication of trading intent on behalf of any Dreyfus fund.
|
| Not FDIC-Insured • Not Bank-Guaranteed • May Lose Value |
| | Contents |
| | THE FUND |
| 2 | A Letter from the President |
| 3 | Discussion of Fund Performance |
| 6 | Fund Performance |
| 8 | Understanding Your Fund’s Expenses |
| 8 | Comparing Your Fund’s Expenses With Those of Other Funds |
| 9 | Statement of Investments |
| 14 | Statement of Assets and Liabilities |
| 15 | Statement of Operations |
| 16 | Statement of Changes in Net Assets |
| 18 | Financial Highlights |
| 21 | Notes to Financial Statements |
| 35 | Report of Independent Registered Public Accounting Firm |
| 36 | Important Tax Information |
| 37 | Information About the Renewal of the Fund’s Management Agreement |
| 42 | Board Members Information |
| 44 | Officers of the Fund |
| | FOR MORE INFORMATION |
| | Back Cover |
Dreyfus
International Value Fund
The Fund
A LETTER FROM THE PRESIDENT
Dear Shareholder:
We are pleased to present this annual report for Dreyfus International Value Fund, covering the 12-month period from September 1, 2013, through August 31, 2014. For information about how the fund performed during the reporting period, as well as general market perspectives, we provide a Discussion of Fund Performance on the pages that follow.
For the 12-month reporting period overall, international stock prices generally advanced as positive reactions to aggressively accommodative monetary policies in Europe and Japan more than offset concerns regarding intensifying geopolitical tensions and sluggish growth in emerging markets. However, most of the market’s advance was achieved during the first half of the reporting period, while the second half generally produced flat returns.
Low inflation has enabled the European Central Bank to reduce short-term interest rates further, and value-added tax hikes in Japan did not shake confidence in the nation’s economic recovery. Meanwhile, China’s economic slowdown appears increasingly unlikely to devolve into a more severe financial crisis, and India’s stock market has surged in anticipation of a more business-friendly government. While these developments may portend well for stock prices over the foreseeable future, our portfolio managers are aware that some regions and industry groups have reached richer valuations. Therefore, selectivity and a long-term perspective seem likely to become more important determinants of investment success. As always, we suggest you talk regularly with your financial advisor to assess the potential impact of these and other developments on your investments.
Thank you for your continued confidence and support.

J. Charles Cardona
President
The Dreyfus Corporation
September 15, 2014
2
DISCUSSION OF FUND PERFORMANCE
For the period of September 1, 2013, through August 31, 2014, as provided by D. Kirk Henry, Portfolio Manager
Fund and Market Performance Overview
For the 12-month period ended August 31, 2014, Dreyfus InternationalValue Fund’s Class A shares produced a total return of 12.58%, Class C shares returned 11.68%, and Class I shares returned 13.01%.1 In comparison, the fund’s benchmark, the Morgan Stanley Capital International Europe, Australasia, Far East Index (“MSCI EAFE Index”), produced a total return of 16.43% for the same period.2
Developed international stock markets generally rallied over the reporting period in response to improving economic conditions in Europe and the United States. The fund produced lower returns than its benchmark, mainly due to disappointing security selections in the United Kingdom, Australia, and Hong Kong.
The Fund’s Investment Approach
The fund seeks long-term capital growth.The fund ordinarily invests most of its assets in securities of foreign companies which Dreyfus considers to be value companies.
The fund’s investment approach is value-oriented and research-driven. In selecting stocks, we attempt to identify potential investments through extensive quantitative and fundamental research. Emphasizing individual stock selection over economic or industry trends, the fund focuses on three key factors: value, or how a stock is valued relative to its intrinsic worth based on traditional value measures; business health, or overall efficiency and profitability as measured by return on assets and return on equity; and business momentum, or the presence of a catalyst (such as corporate restructuring, change in management, or spin-off) that will trigger a price increase near term to midterm.
The fund typically sells a stock when it is no longer considered a value company, appears less likely to benefit from the current market and economic environment, shows deteriorating fundamentals or declining momentum, or falls short of our expectations.
The Fund 3
DISCUSSION OF FUND PERFORMANCE (continued)
Developed Markets Advanced Along with Economic Prospects
Western European equity markets gained ground from September 2013 through May 2014 as economic growth appeared to pick up in some core countries, such as Germany, and long-awaited signs of recovery emerged in some of the region’s more troubled economies, including Italy and Spain. Investors also responded positively to an unexpected reduction in short-term interest rates by the European Central Bank. In June and July 2014, however, many European stocks came under pressure due to disappointing second quarter economic growth rates and uncertainties regarding the impact of geopolitical instability in Ukraine and the Middle East. Nevertheless, European equity markets ended the reporting period with strong gains.
Most developed markets in Asia produced more modestly positive returns. The Japanese stock market was constrained by reports of stalling industrial production and the fading benefits of the government’s aggressively stimulative monetary and fiscal policies. Other developed Asian markets, such as Hong Kong and Australia, were hampered by slowing growth in China. However, some emerging markets, such as India, produced robust gains in response to domestic political and economic reforms.
Security Selection Strategy Produced Mixed Results
While the fund participated in most of the market’s gains, a few holdings detracted from relative returns. In the United Kingdom, business outsourcing services provider Serco Group issued profit warnings and faced a slowing new business pipeline.The fund also held overweight exposure to relatively weak performing U.K. financial institutions, including banks Barclays and Standard Chartered. In Australia, QBE Insurance Group suffered declines due to struggles in its U.S. and Latin American markets, while grocery chain Metcash encountered difficulty in translating a major business purchase into higher earnings and market share. In China, mobile phone and consumer electronics assembler FIH Mobile lost ground.
On a more positive note, the fund delivered relatively strong returns in several countries. In France, a diverse group of good individual stock selections were led by utilities, such as GDF Suez and Electricite de France; energy providers, such as Total; and pharmaceutical companies, such as Sanofi. Likewise, in Japan, top performers included technology companies, such as Fujitsu and Tokyo Electron; energy producers, such as INPEX; telecommunications services providers, such as Nippon Telegraph
4
& Telephone; and industrial gas producer Taiyo Nippon Sanso.The fund also benefited from the rebounding Indian market through investments in State Bank of India as well as petrochemical and petroleum refiner Reliance Industries.
Continuing to Find Attractive Investments
Despite the recent gains in some international equity markets, we currently see opportunities for further gains stemming from positive prospects for gradual economic recovery in Japan, quantitative easing in Europe, and additional asset appreciation in the emerging markets.We believe the fund is currently well positioned to benefit from these positive potential market trends through balanced exposure across most of the major countries we cover. After trimming some technology and consumer staples investments that reached higher valuations, the fund ended the reporting period with mildly overweighted exposure to the financials, industrials, and, to a lesser degree, information technology sectors.
September 15, 2014
Please note, the position in any security highlighted with italicized typeface was sold during the reporting period. Equity funds are subject generally to market, market sector, market liquidity, issuer, and investment style risks, among other factors, to varying degrees, all of which are more fully described in the fund’s prospectus.
The fund’s performance will be influenced by political, social, and economic factors affecting investments in foreign companies. Special risks associated with investments in foreign companies include exposure to currency fluctuations, less liquidity, less developed or less efficient trading markets, lack of comprehensive company information, political instability, and differing auditing and legal standards.These risks are enhanced in emerging market countries. Please read the prospectus for further discussion of these risks.
|
| 1 Total return includes reinvestment of dividends and any capital gains paid, and does not take into consideration the |
| maximum initial sales charge in the case of Class A shares, or the applicable contingent deferred sales charge imposed |
| on redemptions in the case of Class C shares. Had these charges been reflected, returns would have been lower. Past |
| performance is no guarantee of future results. Share price, yield, and investment return fluctuate such that upon |
| redemption fund shares may be worth more or less than their original cost.The fund’s returns reflect the absorption of |
| certain fund expenses by The Dreyfus Corporation pursuant to an agreement in effect through September 30, 2015. |
| Had these expenses not been absorbed, the fund’s returns would have been lower. |
| 2 SOURCE: LIPPER INC. — Reflects reinvestment of net dividends and, where applicable, capital gain |
| distributions.The Morgan Stanley Capital International Europe,Australasia, Far East (MSCI EAFE) Index is an |
| unmanaged index composed of a sample of companies representative of the market structure of European and Pacific |
| Basin countries.The Index does not take into account fees and expenses to which the fund is subject. Investors cannot |
| invest directly in any index. |
The Fund 5
FUND PERFORMANCE
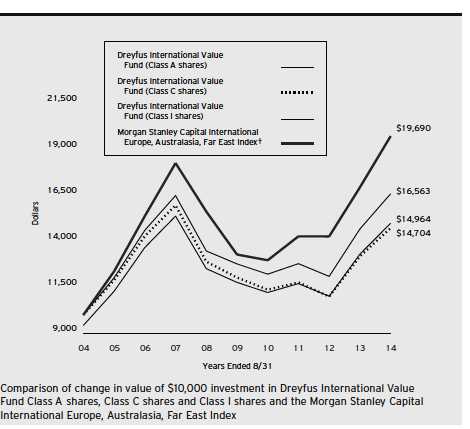
† Source: Lipper Inc.
Past performance is not predictive of future performance.
The above graph compares a $10,000 investment made in each of the Class A, Class C and Class I shares of Dreyfus International Value Fund on 8/31/04 to a $10,000 investment made in the Morgan Stanley Capital International Europe, Australasia, Far East Index (the “Index”) on that date. All dividends and capital gain distributions are reinvested. The fund’s performance shown in the line graph above takes into account the maximum initial sales charge on Class A shares and all other applicable fees and expenses on all classes.The Index is an unmanaged index composed of a sample of companies representative of the market structure of European and Pacific Basin countries. Unlike a mutual fund, the Index is not subject to charges, fees and other expenses. Investors cannot invest directly in any index. Further information relating to fund performance, including expense reimbursements, if applicable, is contained in the Financial Highlights section of the prospectus and elsewhere in this report.
6
| | | | | | |
| Average Annual Total Returns as of 8/31/14 | | | | | | |
| | 1 Year | | 5 Years | | 10 Years | |
| Class A shares | | | | | | |
| with maximum sales charge (5.75%) | 6.14 | % | 3.71 | % | 4.11 | % |
| without sales charge | 12.58 | % | 4.94 | % | 4.73 | % |
| Class C shares | | | | | | |
| with applicable redemption charge† | 10.68 | % | 4.11 | % | 3.93 | % |
| without redemption | 11.68 | % | 4.11 | % | 3.93 | % |
| Class I shares | 13.01 | % | 5.35 | % | 5.18 | % |
| Morgan Stanley Capital | | | | | | |
| International Europe, | | | | | | |
| Australasia, Far East Index | 16.43 | % | 8.21 | % | 7.01 | % |
Past performance is not predictive of future performance.The fund’s performance shown in the graph and table does not reflect the deduction of taxes that a shareholder would pay on fund distributions or the redemption of fund shares. In addition to the performance of Class A shares shown with and without a maximum sales charge, the fund’s performance shown in the table takes into account all other applicable fees and expenses on all classes.
|
| † The maximum contingent deferred sales charge for Class C shares is 1% for shares redeemed within one year of the |
| date of purchase. |
The Fund 7
UNDERSTANDING YOUR FUND’S EXPENSES (Unaudited)
As a mutual fund investor, you pay ongoing expenses, such as management fees and other expenses. Using the information below, you can estimate how these expenses affect your investment and compare them with the expenses of other funds.You also may pay one-time transaction expenses, including sales charges (loads) and redemption fees, which are not shown in this section and would have resulted in higher total expenses. For more information, see your fund’s prospectus or talk to your financial adviser.
Review your fund’s expenses
The table below shows the expenses you would have paid on a $1,000 investment in Dreyfus International Value Fund from March 1, 2014 to August 31, 2014. It also shows how much a $1,000 investment would be worth at the close of the period, assuming actual returns and expenses.
Expenses and Value of a $1,000 Investment
assuming actual returns for the six months ended August 31, 2014
| | | | | | |
| | | Class A | | Class C | | Class I |
| Expenses paid per $1,000† | $ | 7.61 | $ | 11.27 | $ | 5.45 |
| Ending value (after expenses) | $ | 999.20 | $ | 995.30 | $ | 1,001.60 |
COMPARING YOUR FUND’S EXPENSES
WITH THOSE OF OTHER FUNDS (Unaudited)
Using the SEC’s method to compare expenses
The Securities and Exchange Commission (SEC) has established guidelines to help investors assess fund expenses. Per these guidelines, the table below shows your fund’s expenses based on a $1,000 investment, assuming a hypothetical 5% annualized return. You can use this information to compare the ongoing expenses (but not transaction expenses or total cost) of investing in the fund with those of other funds. All mutual fund shareholder reports will provide this information to help you make this comparison. Please note that you cannot use this information to estimate your actual ending account balance and expenses paid during the period.
Expenses and Value of a $1,000 Investment
assuming a hypothetical 5% annualized return for the six months ended August 31, 2014
| | | | | | |
| | | Class A | | Class C | | Class I |
| Expenses paid per $1,000† | $ | 7.68 | $ | 11.37 | $ | 5.50 |
| Ending value (after expenses) | $ | 1,017.59 | $ | 1,013.91 | $ | 1,019.76 |
|
| † Expenses are equal to the fund’s annualized expense ratio of 1.51% for Class A, 2.24% for Class C and 1.08% |
| for Class I, multiplied by the average account value over the period, multiplied by 184/365 (to reflect the one-half |
| year period). |
8
|
| STATEMENT OF INVESTMENTS |
| August 31, 2014 |
| | | |
| Common Stocks—95.3% | Shares | | Value ($) |
| Australia—2.9% | | | |
| Australia & New Zealand Banking Group | 30,841 | | 962,917 |
| Metcash | 434,206 | | 1,139,531 |
| QBE Insurance Group | 182,752 | | 1,966,250 |
| | | | 4,068,698 |
| Austria—.7% | | | |
| Erste Group Bank | 39,460 | | 1,012,606 |
| Belgium—.7% | | | |
| bpost | 38,370 | | 945,058 |
| Brazil—1.0% | | | |
| Petroleo Brasileiro, ADR | 75,380 | | 1,475,187 |
| China—2.5% | | | |
| Beijing Capital International Airport, Cl. H | 1,250,000 | | 977,413 |
| CNOOC | 625,000 | | 1,256,444 |
| FIH Mobile | 842,000 | a | 474,776 |
| Guangzhou Automobile Group, Cl. H | 734,000 | | 763,355 |
| | | | 3,471,988 |
| Denmark—.9% | | | |
| Carlsberg, Cl. B | 13,230 | | 1,206,567 |
| France—10.1% | | | |
| BNP Paribas | 17,500 | | 1,181,444 |
| Bouygues | 37,493 | | 1,376,195 |
| Carrefour | 27,098 | | 939,454 |
| Cie de St-Gobain | 16,032 | | 813,755 |
| Danone | 15,210 | | 1,062,018 |
| Electricite de France | 22,569 | | 733,805 |
| GDF Suez | 56,854 | | 1,400,321 |
| Sanofi | 31,831 | | 3,492,351 |
| Total | 49,760 | | 3,281,547 |
| | | | 14,280,890 |
| Germany—5.2% | | | |
| Aixtron | 87,540 | a | 1,148,512 |
| Deutsche Bank | 77,944 | | 2,666,888 |
| E.ON | 49,640 | | 902,059 |
| LANXESS | 18,290 | | 1,132,280 |
| Muenchener Rueckversicherungs | 2,570 | | 515,310 |
The Fund 9
STATEMENT OF INVESTMENTS (continued)
| | | |
| Common Stocks (continued) | Shares | | Value ($) |
| Germany (continued) | | | |
| Siemens | 7,130 | | 893,194 |
| | | | 7,258,243 |
| Hong Kong—4.2% | | | |
| BOC Hong Kong Holdings | 436,000 | | 1,465,513 |
| CITIC Pacific | 493,000 | | 959,276 |
| COSCO Pacific | 555,298 | | 778,129 |
| Esprit Holdings | 824,430 | | 1,338,227 |
| Pacific Basin Shipping | 714,000 | | 438,531 |
| Yue Yuen Industrial Holdings | 287,000 | | 890,620 |
| | | | 5,870,296 |
| India—1.8% | | | |
| Reliance Industries, GDR | 42,074 | b | 1,400,223 |
| State Bank of India, GDR | 14,100 | | 1,151,970 |
| | | | 2,552,193 |
| Ireland—.8% | | | |
| CRH | 46,436 | | 1,076,949 |
| Israel—.9% | | | |
| Teva Pharmaceutical Industries, ADR | 25,100 | | 1,318,252 |
| Italy—4.0% | | | |
| Assicurazioni Generali | 80,350 | | 1,642,769 |
| Finmeccanica | 104,776 | a | 980,219 |
| Saras | 513,780 | a | 613,652 |
| Telecom Italia | 1,205,720 | a | 1,387,023 |
| UniCredit | 131,820 | | 1,020,182 |
| | | | 5,643,845 |
| Japan—19.1% | | | |
| Aisin Seiki | 20,000 | | 739,103 |
| Credit Saison | 71,000 | | 1,410,515 |
| East Japan Railway | 17,600 | | 1,367,301 |
| Fujitsu | 137,000 | | 939,756 |
| Honda Motor | 58,900 | | 1,988,714 |
| INPEX | 75,800 | | 1,085,511 |
| Matsumotokiyoshi Holdings | 31,710 | | 1,001,176 |
| Mitsubishi UFJ Financial Group | 575,900 | | 3,311,100 |
10
| | | |
| Common Stocks (continued) | Shares | | Value ($) |
| Japan (continued) | | | |
| Nippon Express | 249,890 | | 1,143,233 |
| Nippon Shokubai | 119,000 | | 1,443,395 |
| Nippon Telegraph & Telephone | 17,800 | | 1,194,137 |
| Nippon Telegraph & Telephone, ADR | 3,300 | | 111,012 |
| Nissan Motor | 82,900 | | 795,974 |
| Nomura Real Estate Holdings | 75,100 | | 1,354,824 |
| Ricoh | 122,400 | | 1,324,054 |
| Sawai Pharmaceutical | 18,200 | | 1,037,301 |
| Shimamura | 15,100 | | 1,361,315 |
| Sumco | 108,100 | | 930,920 |
| Sumitomo Electric Industries | 73,100 | | 1,070,030 |
| Sumitomo Mitsui Financial Group | 31,000 | | 1,251,531 |
| Sumitomo Mitsui Trust Holdings | 232,560 | | 954,201 |
| Yamada Denki | 330,000 | | 1,059,349 |
| | | | 26,874,452 |
| Netherlands—4.0% | | | |
| Aegon | 109,081 | | 862,260 |
| ING Groep | 74,800 | a | 1,028,542 |
| Koninklijke Philips | 68,224 | | 2,078,830 |
| NN Group | 12,810 | | 374,255 |
| Randstad Holding | 27,351 | | 1,327,731 |
| | | | 5,671,618 |
| Norway—.3% | | | |
| Norsk Hydro | 73,008 | | 428,769 |
| Russia—.5% | | | |
| Gazprom, ADR | 91,520 | | 654,368 |
| Singapore—.5% | | | |
| DBS Group Holdings | 51,101 | | 733,141 |
| South Africa—.2% | | | |
| Murray & Roberts Holdings | 100,393 | a | 248,388 |
| South Korea—2.1% | | | |
| KB Financial Group | 4,000 | | 163,913 |
| KB Financial Group, ADR | 35,564 | | 1,447,099 |
| Korea Electric Power | 12,110 | | 504,011 |
The Fund 11
STATEMENT OF INVESTMENTS (continued)
| | | |
| Common Stocks (continued) | Shares | | Value ($) |
| South Korea (continued) | | | |
| Samsung Electronics | 740 | | 900,597 |
| | | | 3,015,620 |
| Spain—.5% | | | |
| Banco Popular Espanol | 118,270 | | 738,313 |
| Sweden—3.1% | | | |
| Electrolux, Ser. B | 53,880 | | 1,366,802 |
| Ericsson, Cl. B | 141,490 | | 1,764,260 |
| Getinge, Cl. B | 44,910 | | 1,173,954 |
| | | | 4,305,016 |
| Switzerland—7.7% | | | |
| ABB | 74,710 | a | 1,695,125 |
| Credit Suisse Group | 81,970 | a | 2,310,750 |
| Holcim | 12,660 | a | 1,006,677 |
| Novartis | 41,046 | | 3,681,867 |
| Roche Holding | 4,010 | | 1,169,301 |
| UBS | 52,288 | a | 937,488 |
| | | | 10,801,208 |
| United Kingdom—21.6% | | | |
| Anglo American | 38,823 | | 986,108 |
| ArcelorMittal | 82,370 | | 1,198,654 |
| Barclays | 387,699 | | 1,444,635 |
| BHP Billiton | 42,440 | | 1,343,952 |
| BP | 416,008 | | 3,326,420 |
| esure Group | 358,870 | | 1,578,799 |
| Friends Life Group | 171,046 | | 870,905 |
| GlaxoSmithKline | 112,902 | | 2,763,696 |
| Home Retail Group | 424,988 | | 1,292,546 |
| HSBC Holdings | 270,585 | | 2,928,837 |
| Royal Bank of Scotland Group | 203,190 | a | 1,223,809 |
| Royal Dutch Shell, Cl. A | 80,949 | | 3,276,341 |
| Serco Group | 253,454 | | 1,306,065 |
| Standard Chartered | 141,657 | | 2,852,612 |
| Tesco | 452,260 | | 1,726,496 |
| Unilever | 51,633 | | 2,279,237 |
| | | | 30,399,112 |
| Total Common Stocks | | | |
| (cost $150,371,196) | | | 134,050,777 |
12
| | | | |
| Preferred Stocks—1.4% | Shares | | Value ($) | |
| Germany | | | | |
| Volkswagen | | | | |
| (cost $2,203,997) | 9,100 | | 2,042,855 | |
| |
| Other Investment—3.4% | | | | |
| Registered Investment Company; | | | | |
| Dreyfus Institutional Preferred Plus | | | | |
| Money Market Fund | | | | |
| (cost $4,790,000) | 4,790,000 | c | 4,790,000 | |
| Total Investments (cost $157,365,193) | 100.1 | % | 140,883,632 | |
| Liabilities, Less Cash and Receivables | (.1 | %) | (173,119 | ) |
| Net Assets | 100.0 | % | 140,710,513 | |
ADR—American Depository Receipts
GDR—Global Depository Receipts
|
| a Non-income producing security. |
| b Security exempt from registration pursuant to Rule 144A under the Securities Act of 1933.This security may be |
| resold in transactions exempt from registration, normally to qualified institutional buyers.At August 31, 2014, this |
| security was valued at $1,400,223 or 1.0% of net assets. |
| c Investment in affiliated money market mutual fund. |
| | | |
| Portfolio Summary (Unaudited)† | | |
| |
| | Value (%) | | Value (%) |
| Financial | 29.4 | Materials | 6.1 |
| Industrial | 13.1 | Information Technology | 5.3 |
| Energy | 11.6 | Money Market Investment | 3.4 |
| Health Care | 10.4 | Utilities | 2.5 |
| Consumer Discretionary | 9.7 | Telecommunication Services | 1.9 |
| Consumer Staples | 6.7 | | 100.1 |
| |
| † Based on net assets. | | | |
| See notes to financial statements. | | | |
The Fund 13
|
| STATEMENT OF ASSETS AND LIABILITIES |
| August 31, 2014 |
| | | | |
| | | Cost | Value | |
| Assets ($): | | | | |
| Investments in securities—See Statement of Investments: | | | |
| Unaffiliated issuers | | 152,575,193 | 136,093,632 | |
| Affiliated issuers | | 4,790,000 | 4,790,000 | |
| Cash denominated in foreign currencies | | 656,272 | 654,383 | |
| Dividends receivable | | | 539,359 | |
| Receivable for shares of Common Stock subscribed | | | 464 | |
| Prepaid expenses | | | 14,618 | |
| | | | 142,092,456 | |
| Liabilities ($): | | | | |
| Due to The Dreyfus Corporation and affiliates—Note 3(c) | | 169,211 | |
| Cash overdraft due to Custodian | | | 146,997 | |
| Payable for shares of Common Stock redeemed | | | 667,565 | |
| Payable for investment securities purchased | | | 309,883 | |
| Interest payable—Note 2 | | | 1,212 | |
| Unrealized depreciation on forward foreign | | | | |
| currency exchange contracts—Note 4 | | | 163 | |
| Accrued expenses | | | 86,912 | |
| | | | 1,381,943 | |
| Net Assets ($) | | | 140,710,513 | |
| Composition of Net Assets ($): | | | | |
| Paid-in capital | | | 237,806,947 | |
| Accumulated undistributed investment income—net | | | 1,898,353 | |
| Accumulated net realized gain (loss) on investments | | | (82,504,907 | ) |
| Accumulated net unrealized appreciation (depreciation) | | | |
| on investments and foreign currency transactions | | | (16,489,880 | ) |
| Net Assets ($) | | | 140,710,513 | |
| |
| |
| Net Asset Value Per Share | | | | |
| | Class A | Class C | Class I | |
| Net Assets ($) | 48,052,237 | 7,287,811 | 85,370,465 | |
| Shares Outstanding | 3,754,225 | 576,914 | 6,701,585 | |
| Net Asset Value Per Share ($) | 12.80 | 12.63 | 12.74 | |
| See notes to financial statements. | | | | |
14
| | |
| STATEMENT OF OPERATIONS | | |
| Year Ended August 31, 2014 | | |
| |
| |
| |
| |
| Investment Income ($): | | |
| Income: | | |
| Cash dividends (net of $332,475 foreign taxes withheld at source): | | |
| Unaffiliated issuers | 3,765,254 | |
| Affiliated issuers | 2,867 | |
| Total Income | 3,768,121 | |
| Expenses: | | |
| Management fee—Note 3(a) | 1,419,222 | |
| Shareholder servicing costs—Note 3(c) | 282,347 | |
| Custodian fees—Note 3(c) | 86,574 | |
| Professional fees | 70,104 | |
| Distribution fees—Note 3(b) | 59,904 | |
| Registration fees | 43,805 | |
| Directors’ fees and expenses—Note 3(d) | 17,122 | |
| Prospectus and shareholders’ reports | 16,898 | |
| Interest expense—Note 2 | 3,491 | |
| Loan commitment fees—Note 2 | 1,318 | |
| Miscellaneous | 30,587 | |
| Total Expenses | 2,031,372 | |
| Less—reduction in expenses due to undertaking—Note 3(a) | (141,922 | ) |
| Less—reduction in fees due to earnings credits—Note 3(c) | (70 | ) |
| Net Expenses | 1,889,380 | |
| Investment Income—Net | 1,878,741 | |
| Realized and Unrealized Gain (Loss) on Investments—Note 4 ($): | | |
| Net realized gain (loss) on investments and foreign currency transactions | 9,923,611 | |
| Net realized gain (loss) on forward foreign currency exchange contracts | (136,664 | ) |
| Net Realized Gain (Loss) | 9,786,947 | |
| Net unrealized appreciation (depreciation) on | | |
| investments and foreign currency transactions | 4,341,953 | |
| Net unrealized appreciation (depreciation) on | | |
| forward foreign currency exchange contracts | (18 | ) |
| Net Unrealized Appreciation (Depreciation) | 4,341,935 | |
| Net Realized and Unrealized Gain (Loss) on Investments | 14,128,882 | |
| Net Increase in Net Assets Resulting from Operations | 16,007,623 | |
| |
| See notes to financial statements. | | |
The Fund 15
STATEMENT OF CHANGES IN NET ASSETS
| | | | |
| | Year Ended August 31, | |
| | 2014 | | 2013 | |
| Operations ($): | | | | |
| Investment income—net | 1,878,741 | | 2,276,509 | |
| Net realized gain (loss) on investments | 9,786,947 | | 3,117,463 | |
| Net unrealized appreciation | | | | |
| (depreciation) on investments | 4,341,935 | | 25,123,949 | |
| Net Increase (Decrease) in Net Assets | | | | |
| Resulting from Operations | 16,007,623 | | 30,517,921 | |
| Dividends to Shareholders from ($): | | | | |
| Investment income—net: | | | | |
| Class A | (877,464 | ) | (1,779,844 | ) |
| Class C | (70,871 | ) | (98,693 | ) |
| Class I | (1,320,570 | ) | (1,603,998 | ) |
| Total Dividends | (2,268,905 | ) | (3,482,535 | ) |
| Capital Stock Transactions ($): | | | | |
| Net proceeds from shares sold: | | | | |
| Class A | 23,744,575 | | 12,719,514 | |
| Class C | 459,266 | | 146,329 | |
| Class I | 24,670,716 | | 3,686,507 | |
| Dividends reinvested: | | | | |
| Class A | 833,178 | | 1,718,394 | |
| Class C | 40,444 | | 54,020 | |
| Class I | 1,184,689 | | 1,424,443 | |
| Cost of shares redeemed: | | | | |
| Class A | (51,790,279 | ) | (54,174,851 | ) |
| Class C | (1,711,841 | ) | (1,916,922 | ) |
| Class I | (6,058,957 | ) | (19,133,866 | ) |
| Increase (Decrease) in Net Assets | | | | |
| from Capital Stock Transactions | (8,628,209 | ) | (55,476,432 | ) |
| Total Increase (Decrease) in Net Assets | 5,110,509 | | (28,441,046 | ) |
| Net Assets ($): | | | | |
| Beginning of Period | 135,600,004 | | 164,041,050 | |
| End of Period | 140,710,513 | | 135,600,004 | |
| Undistributed investment income—net | 1,898,353 | | 2,259,459 | |
16
| | | | |
| | Year Ended August 31, | |
| | 2014 | | 2013 | |
| Capital Share Transactions: | | | | |
| Class Aa | | | | |
| Shares sold | 1,865,718 | | 1,206,880 | |
| Shares issued for dividends reinvested | 67,464 | | 169,634 | |
| Shares redeemed | (4,139,037 | ) | (4,951,509 | ) |
| Net Increase (Decrease) in Shares Outstanding | (2,205,855 | ) | (3,574,995 | ) |
| Class Ca | | | | |
| Shares sold | 36,863 | | 13,612 | |
| Shares issued for dividends reinvested | 3,299 | | 5,364 | |
| Shares redeemed | (135,371 | ) | (176,471 | ) |
| Net Increase (Decrease) in Shares Outstanding | (95,209 | ) | (157,495 | ) |
| Class I | | | | |
| Shares sold | 1,948,730 | | 332,712 | |
| Shares issued for dividends reinvested | 96,710 | | 141,454 | |
| Shares redeemed | (485,579 | ) | (1,796,033 | ) |
| Net Increase (Decrease) in Shares Outstanding | 1,559,861 | | (1,321,867 | ) |
|
| a During the period ended August 31, 2013, 12,494 Class C shares representing $147,433 were exchanged for |
| 12,389 Class A shares. |
See notes to financial statements.
The Fund 17
FINANCIAL HIGHLIGHTS
The following tables describe the performance for each share class for the fiscal periods indicated. All information (except portfolio turnover rate) reflects financial results for a single fund share.Total return shows how much your investment in the fund would have increased (or decreased) during each period, assuming you had reinvested all dividends and distributions.These figures have been derived from the fund’s financial statements.
| | | | | | | | | | |
| | | | Year Ended August 31, | | | |
| Class A Shares | 2014 | | 2013 | | 2012 | | 2011 | | 2010 | |
| Per Share Data ($): | | | | | | | | | | |
| Net asset value, beginning of period | 11.54 | | 9.76 | | 10.69 | | 10.37 | | 11.02 | |
| Investment Operations: | | | | | | | | | | |
| Investment income—neta | .15 | | .15 | | .17 | | .20 | | .15 | |
| Net realized and unrealized | | | | | | | | | | |
| gain (loss) on investments | 1.30 | | 1.85 | | (.80 | ) | .26 | | (.65 | ) |
| Total from Investment Operations | 1.45 | | 2.00 | | (.63 | ) | .46 | | (.50 | ) |
| Distributions: | | | | | | | | | | |
| Dividends from investment income—net | (.19 | ) | (.22 | ) | (.30 | ) | (.14 | ) | (.15 | ) |
| Net asset value, end of period | 12.80 | | 11.54 | | 9.76 | | 10.69 | | 10.37 | |
| Total Return (%)b | 12.58 | | 20.76 | | (5.89 | ) | 4.32 | | (4.66 | ) |
| Ratios/Supplemental Data (%): | | | | | | | | | | |
| Ratio of total expenses | | | | | | | | | | |
| to average net assets | 1.59 | | 1.61 | | 1.63 | | 1.54 | | 1.54 | |
| Ratio of net expenses | | | | | | | | | | |
| to average net assets | 1.49 | | 1.51 | | 1.53 | | 1.49 | | 1.54 | |
| Ratio of net investment income | | | | | | | | | | |
| to average net assets | 1.17 | | 1.40 | | 1.74 | | 1.70 | | 1.29 | |
| Portfolio Turnover Rate | 65.25 | | 43.35 | | 40.93 | | 60.72 | | 55.35 | |
| Net Assets, end of period ($ x 1,000) | 48,052 | | 68,771 | | 93,078 | | 102,606 | | 112,716 | |
| |
| a | Based on average shares outstanding. |
| b | Exclusive of sales charge. |
See notes to financial statements.
18
| | | | | | | | | | |
| | | | Year Ended August 31, | | | |
| Class C Shares | 2014 | | 2013 | | 2012 | | 2011 | | 2010 | |
| Per Share Data ($): | | | | | | | | | | |
| Net asset value, beginning of period | 11.41 | | 9.64 | | 10.51 | | 10.19 | | 10.84 | |
| Investment Operations: | | | | | | | | | | |
| Investment income—neta | .04 | | .06 | | .10 | | .11 | | .06 | |
| Net realized and unrealized | | | | | | | | | | |
| gain (loss) on investments | 1.29 | | 1.83 | | (.79 | ) | .25 | | (.65 | ) |
| Total from Investment Operations | 1.33 | | 1.89 | | (.69 | ) | .36 | | (.59 | ) |
| Distributions: | | | | | | | | | | |
| Dividends from investment income—net | (.11 | ) | (.12 | ) | (.18 | ) | (.04 | ) | (.06 | ) |
| Net asset value, end of period | 12.63 | | 11.41 | | 9.64 | | 10.51 | | 10.19 | |
| Total Return (%)b | 11.68 | | 19.82 | | (6.55 | ) | 3.48 | | (5.49 | ) |
| Ratios/Supplemental Data (%): | | | | | | | | | | |
| Ratio of total expenses | | | | | | | | | | |
| to average net assets | 2.37 | | 2.39 | | 2.38 | | 2.31 | | 2.33 | |
| Ratio of net expenses | | | | | | | | | | |
| to average net assets | 2.27 | | 2.29 | | 2.28 | | 2.26 | | 2.33 | |
| Ratio of net investment income | | | | | | | | | | |
| to average net assets | .35 | | .60 | | .99 | | .91 | | .56 | |
| Portfolio Turnover Rate | 65.25 | | 43.35 | | 40.93 | | 60.72 | | 55.35 | |
| Net Assets, end of period ($ x 1,000) | 7,288 | | 7,667 | | 7,998 | | 11,573 | | 14,604 | |
| |
| a | Based on average shares outstanding. |
| b | Exclusive of sales charge. |
See notes to financial statements.
The Fund 19
FINANCIAL HIGHLIGHTS (continued)
| | | | | | | | | | |
| | | | Year Ended August 31, | | | |
| Class I Shares | 2014 | | 2013 | | 2012 | | 2011 | | 2010 | |
| Per Share Data ($): | | | | | | | | | | |
| Net asset value, beginning of period | 11.51 | | 9.74 | | 10.67 | | 10.36 | | 11.02 | |
| Investment Operations: | | | | | | | | | | |
| Investment income—neta | .20 | | .19 | | .23 | | .28 | | .22 | |
| Net realized and unrealized | | | | | | | | | | |
| gain (loss) on investments | 1.29 | | 1.84 | | (.81 | ) | .22 | | (.68 | ) |
| Total from Investment Operations | 1.49 | | 2.03 | | (.58 | ) | .50 | | (.46 | ) |
| Distributions: | | | | | | | | | | |
| Dividends from investment income—net | (.26 | ) | (.26 | ) | (.35 | ) | (.19 | ) | (.20 | ) |
| Net asset value, end of period | 12.74 | | 11.51 | | 9.74 | | 10.67 | | 10.36 | |
| Total Return (%) | 13.01 | | 21.27 | | (5.41 | ) | 4.67 | | (4.37 | ) |
| Ratios/Supplemental Data (%): | | | | | | | | | | |
| Ratio of total expenses | | | | | | | | | | |
| to average net assets | 1.20 | | 1.21 | | 1.19 | | 1.15 | | 1.22 | |
| Ratio of net expenses | | | | | | | | | | |
| to average net assets | 1.10 | | 1.11 | | 1.09 | | 1.09 | | 1.22 | |
| Ratio of net investment income | | | | | | | | | | |
| to average net assets | 1.56 | | 1.76 | | 2.29 | | 2.29 | | 1.93 | |
| Portfolio Turnover Rate | 65.25 | | 43.35 | | 40.93 | | 60.72 | | 55.35 | |
| Net Assets, end of period ($ x 1,000) | 85,370 | | 59,161 | | 62,965 | | 91,998 | | 97,429 | |
| a Based on average shares outstanding. | | | | | | | | | | |
| See notes to financial statements. | | | | | | | | | | |
20
NOTES TO FINANCIAL STATEMENTS
NOTE 1—Significant Accounting Policies:
Dreyfus International Value Fund (the “fund”) is a separate diversified series of Advantage Funds, Inc. (the “Company”), which is registered under the Investment Company Act of 1940, as amended (the “Act”), as an open-end management investment company and operates as a series company currently offering eleven series, including the fund. The fund’s investment objective is to seek long-term capital growth. The Dreyfus Corporation (the “Manager” or “Dreyfus”), a wholly-owned subsidiary of The Bank of New York Mellon Corporation (“BNY Mellon”), serves as the fund’s investment adviser.
MBSC Securities Corporation (the “Distributor”), a wholly-owned subsidiary of the Manager, is the distributor of the fund’s shares. The fund is authorized to issue 500 million shares of $.001 par value Common Stock.The fund currently offers three classes of shares: Class A (200 million shares authorized), Class C (100 million shares authorized) and Class I (200 million shares authorized). Class A shares generally are subject to a sales charge imposed at the time of purchase. Class C shares are subject to a contingent deferred sales charge (“CDSC”) imposed on Class C shares redeemed within one year of purchase. Class I shares are sold at net asset value per share generally to institutional investors. Other differences between the classes include the services offered to and the expenses borne by each class, the allocation of certain transfer agency costs, and certain voting rights. Income, expenses (other than expenses attributable to a specific class), and realized and unrealized gains or losses on investments are allocated to each class of shares based on its relative net assets.
The Company accounts separately for the assets, liabilities and operations of each series. Expenses directly attributable to each series are
The Fund 21
NOTES TO FINANCIAL STATEMENTS (continued)
charged to that series’ operations; expenses which are applicable to all series are allocated among them on a pro rata basis.
The Financial Accounting Standards Board (“FASB”) Accounting Standards Codification is the exclusive reference of authoritative U.S. generally accepted accounting principles (“GAAP”) recognized by the FASB to be applied by nongovernmental entities. Rules and interpretive releases of the Securities and Exchange Commission (“SEC”) under authority of federal laws are also sources of authoritative GAAP for SEC registrants. The fund’s financial statements are prepared in accordance with GAAP, which may require the use of management estimates and assumptions. Actual results could differ from those estimates.
The Company enters into contracts that contain a variety of indemnifications. The fund’s maximum exposure under these arrangements is unknown.The fund does not anticipate recognizing any loss related to these arrangements.
(a) Portfolio valuation: The fair value of a financial instrument is the amount that would be received to sell an asset or paid to transfer a liability in an orderly transaction between market participants at the measurement date (i.e., the exit price). GAAP establishes a fair value hierarchy that prioritizes the inputs of valuation techniques used to measure fair value. This hierarchy gives the highest priority to unadjusted quoted prices in active markets for identical assets or liabilities (Level 1 measurements) and the lowest priority to unobservable inputs (Level 3 measurements).
Additionally, GAAP provides guidance on determining whether the volume and activity in a market has decreased significantly and whether such a decrease in activity results in transactions that are not orderly. GAAP requires enhanced disclosures around valuation inputs and techniques used during annual and interim periods.
22
Various inputs are used in determining the value of the fund’s investments relating to fair value measurements.These inputs are summarized in the three broad levels listed below:
Level 1—unadjusted quoted prices in active markets for identical investments.
Level 2—other significant observable inputs (including quoted prices for similar investments, interest rates, prepayment speeds, credit risk, etc.).
Level 3—significant unobservable inputs (including the fund’s own assumptions in determining the fair value of investments).
The inputs or methodology used for valuing securities are not necessarily an indication of the risk associated with investing in those securities.
Changes in valuation techniques may result in transfers in or out of an assigned level within the disclosure hierarchy. Valuation techniques used to value the fund’s investments are as follows:
Investments in securities are valued at the last sales price on the securities exchange or national securities market on which such securities are primarily traded. Securities listed on the National Market System for which market quotations are available are valued at the official closing price or, if there is no official closing price that day, at the last sales price. Securities not listed on an exchange or the national securities market, or securities for which there were no transactions, are valued at the average of the most recent bid and asked prices, except for open short positions, where the asked price is used for valuation purposes. Bid price is used when no asked price is available. Registered investment companies that are not traded on an exchange are valued at their net asset value.All of the preceding securities are generally categorized within Level 1 of the fair value hierarchy.
The Fund 23
NOTES TO FINANCIAL STATEMENTS (continued)
Fair valuing of securities may be determined with the assistance of a pricing service using calculations based on indices of domestic securities and other appropriate indicators, such as prices of relevant ADRs and financial futures. Utilizing these techniques may result in transfers between Level 1 and Level 2 of the fair value hierarchy.
When market quotations or official closing prices are not readily available, or are determined not to reflect accurately fair value, such as when the value of a security has been significantly affected by events after the close of the exchange or market on which the security is principally traded (for example, a foreign exchange or market), but before the fund calculates its net asset value, the fund may value these investments at fair value as determined in accordance with the procedures approved by the Company’s Board of Directors (the “Board”). Certain factors may be considered when fair valuing investments such as: fundamental analytical data, the nature and duration of restrictions on disposition, an evaluation of the forces that influence the market in which the securities are purchased and sold, and public trading in similar securities of the issuer or comparable issuers. These securities are either categorized within Level 2 or 3 of the fair value hierarchy depending on the relevant inputs used.
For restricted securities where observable inputs are limited, assumptions about market activity and risk are used and are generally categorized within Level 3 of the fair value hierarchy.
Investments denominated in foreign currencies are translated to U.S. dollars at the prevailing rates of exchange.
Forward foreign currency exchange contracts (“forward contracts”) are valued at the forward rate and are generally categorized within Level 2 of the fair value hierarchy.
24
The following is a summary of the inputs used as of August 31, 2014 in valuing the fund's investments:
| | | | | |
| | | Level 2—Other | Level 3— | | |
| | Level 1— | Significant | Significant | | |
| | Unadjusted | Observable | Unobservable | | |
| | Quoted Prices | Inputs | Inputs | Total | |
| Assets ($) | | | | | |
| Investments in Securities: | | | | |
| Equity Securities— | | | | | |
| Foreign | | | | | |
| Common Stocks† | 134,050,777 | — | — | 134,050,777 | |
| Equity Securities— | | | | | |
| Foreign | | | | | |
| Preferred Stocks† | 2,042,855 | — | — | 2,042,855 | |
| Mutual Funds | 4,790,000 | — | — | 4,790,000 | |
| Liabilities ($) | | | | | |
| Other Financial | | | | | |
| Instruments: | | | | | |
| Forward Foreign | | | | | |
| Currency Exchange | | | | | |
| Contracts†† | — | (163) | — | (163 | ) |
| |
| † | See Statement of Investments for additional detailed categorizations. |
| †† | Amount shown represents unrealized (depreciation) at period end. |
At August 31, 2014, there were no transfers between Level 1 and Level 2 of the fair value hierarchy.
(b) Foreign currency transactions: The fund does not isolate that portion of the results of operations resulting from changes in foreign exchange rates on investments from the fluctuations arising from changes in the market prices of securities held. Such fluctuations are included with the net realized and unrealized gain or loss on investments.
Net realized foreign exchange gains or losses arise from sales of foreign currencies, currency gains or losses realized on securities transactions
The Fund 25
NOTES TO FINANCIAL STATEMENTS (continued)
between trade and settlement date, and the difference between the amounts of dividends, interest and foreign withholding taxes recorded on the fund’s books and the U.S. dollar equivalent of the amounts actually received or paid. Net unrealized foreign exchange gains and losses arise from changes in the value of assets and liabilities other than investments resulting from changes in exchange rates. Foreign currency gains and losses on foreign currency transactions are also included with net realized and unrealized gain or loss on investments.
(c) Securities transactions and investment income: Securities transactions are recorded on a trade date basis. Realized gains and losses from securities transactions are recorded on the identified cost basis. Dividend income is recognized on the ex-dividend date and interest income, including, where applicable, accretion of discount and amortization of premium on investments, is recognized on the accrual basis.
(d) Affiliated issuers: Investments in other investment companies advised by Dreyfus are defined as “affiliated” under the Act. Investments in affiliated investment companies during the period ended August 31, 2014 were as follows:
| | | | | |
| Affiliated | | | | | |
| Investment | Value | | | Value | Net |
| Company | 8/31/2013 ($) | Purchases ($) | Sales ($) | 8/31/2014 ($) | Assets (%) |
| Dreyfus | | | | | |
| Institutional | | | | | |
| Preferred | | | | | |
| Plus Money | | | | | |
| Market Fund | 1,870,000 | 62,840,000 | 59,920,000 | 4,790,000 | 3.4 |
(e) Risk: Investing in foreign markets may involve special risks and considerations not typically associated with investing in the U.S.These risks include revaluation of currencies, high rates of inflation, repatriation restrictions on income and capital, and adverse political and economic developments. Moreover, securities issued in these markets may be less liquid, subject to government ownership controls and delayed settlements, and their prices may be more volatile than those of comparable securities in the U.S.
26
(f) Dividends to shareholders: Dividends are recorded on the ex-dividend date. Dividends from investment income-net and dividends from net realized capital gains, if any, are normally declared and paid annually, but the fund may make distributions on a more frequent basis to comply with the distribution requirements of the Internal Revenue Code of 1986, as amended (the “Code”). To the extent that net realized capital gains can be offset by capital loss carryovers, it is the policy of the fund not to distribute such gains. Income and capital gain distributions are determined in accordance with income tax regulations, which may differ from GAAP.
(g) Federal income taxes: It is the policy of the fund to continue to qualify as a regulated investment company, if such qualification is in the best interests of its shareholders, by complying with the applicable provisions of the Code, and to make distributions of taxable income sufficient to relieve it from substantially all federal income and excise taxes.
As of and during the period ended August 31, 2014, the fund did not have any liabilities for any uncertain tax positions.The fund recognizes interest and penalties, if any, related to uncertain tax positions as income tax expense in the Statement of Operations. During the period ended August 31, 2014, the fund did not incur any interest or penalties.
Each tax year in the four-year period ended August 31, 2014 remains subject to examination by the Internal Revenue Service and state taxing authorities.
At August 31, 2014, the components of accumulated earnings on a tax basis were as follows: undistributed ordinary income $1,900,466, accumulated capital losses $81,346,849 and unrealized depreciation $17,650,051.
Under the Regulated Investment Company Modernization Act of 2010 (the “2010 Act”), the fund is permitted to carry forward capital losses incurred in taxable years beginning after December 22, 2010
The Fund 27
NOTES TO FINANCIAL STATEMENTS (continued)
(“post-enactment losses”) for an unlimited period. Furthermore, post-enactment capital loss carryovers retain their character as either short-term or long-term capital losses rather than short-term as they were under previous statute.The 2010 Act requires post-enactment losses to be utilized before the utilization of losses incurred in taxable years prior to the effective date of the 2010 Act (“pre-enactment losses”).As a result of this ordering rule, pre-enactment losses may be more likely to expire unused.
The accumulated capital loss carryover is available for federal income tax purposes to be applied against future net realized capital gains, if any, realized subsequent to August 31, 2014. If not applied, $24,770,979 of the carryover expires in fiscal year 2017 and $41,505,182 expires in fiscal year 2018. The fund has $15,070,688 of post-enactment long-term capital losses which can be carried forward for an unlimited period.
The tax character of distributions paid to shareholders during the fiscal periods ended August 31, 2014 and August 31, 2013 were as follows: ordinary income $2,268,905 and $3,482,535, respectively.
During the period ended August 31, 2014, as a result of permanent book to tax differences, primarily due to the tax treatment for foreign exchange gains and losses and passive foreign investment companies, the fund increased accumulated undistributed investment income-net by $29,058 and decreased accumulated net realized gain (loss) on investments by the same amount. Net assets and net asset value per share were not affected by this reclassification.
NOTE 2—Bank Lines of Credit:
The fund participates with other Dreyfus-managed funds in a $265 million unsecured credit facility led by Citibank, N.A. and a $300 million unsecured credit facility provided by The Bank of New York Mellon, a subsidiary of BNY Mellon and an affiliate of Dreyfus (each, a “Facility”), each to be utilized primarily for temporary or emergency purposes, including the financing of redemptions. Prior to October 9,
28
2013, the unsecured credit facility with Citibank, N.A. was $210 million. In connection therewith, the fund has agreed to pay its pro rata portion of commitment fees for each Facility. Interest is charged to the fund based on rates determined pursuant to the terms of the respective Facility at the time of borrowing.
The average amount of borrowings outstanding under the Facilities during the period ended August 31, 2014 was approximately $315,900 with a related weighted average annualized interest rate of 1.11%.
NOTE 3—Management Fee and Other Transactions with Affiliates:
(a) Pursuant to a management agreement with the Manager, the management fee is computed at the annual rate of 1% of the value of the fund’s average daily net assets and is payable monthly.The Manager has agreed to waive receipt of a portion of the fund’s management fee, in the amount of .10% of the value of the fund’s average daily net assets from September 1, 2013 through September 30, 2015. The reduction in expenses, pursuant to the undertaking, amounted to $141,922 during the period ended August 31, 2014.
During the period ended August 31, 2014, the Distributor retained $1,557 from commissions earned on sales of the fund’s Class A shares and $1,526 from CDSCs on redemptions of the fund’s Class C shares.
(b) Under the Distribution Plan adopted pursuant to Rule 12b-1 under the Act, Class C shares pay the Distributor for distributing its shares at an annual rate of .75% of the value of its average daily net assets. During the period ended August 31, 2014, Class C shares were charged $59,904 pursuant to the Distribution Plan.
(c) Under the Shareholder Services Plan, Class A and Class C shares pay the Distributor at an annual rate of .25% of the value of their average daily net assets for the provision of certain services. The services provided may include personal services relating to shareholder accounts, such as answering shareholder inquiries regarding the fund
The Fund 29
NOTES TO FINANCIAL STATEMENTS (continued)
and providing reports and other information, and services related to the maintenance of shareholder accounts.The Distributor may make payments to Service Agents (securities dealers, financial institutions or other industry professionals) with respect to these services. The Distributor determines the amounts to be paid to Service Agents. During the period ended August 31, 2014, Class A and Class C shares were charged $152,164 and $19,968, respectively, pursuant to the Shareholder Services Plan.
The fund has arrangements with the transfer agent and the custodian whereby the fund may receive earnings credits when positive cash balances are maintained, which are used to offset transfer agency and custody fees. For financial reporting purposes, the fund includes net earnings credits as an expense offset in the Statement of Operations.
The fund compensates Dreyfus Transfer, Inc., a wholly-owned subsidiary of the Manager, under a transfer agency agreement for providing transfer agency and cash management services for the fund.The majority of transfer agency fees are comprised of amounts paid on a per account basis, while cash management fees are related to fund subscriptions and redemptions. During the period ended August 31, 2014, the fund was charged $12,769 for transfer agency services and $944 for cash management services.These fees are included in Shareholder servicing costs in the Statement of Operations. Cash management fees were partially offset by earnings credits of $70.
The fund compensates The Bank of NewYork Mellon under a custody agreement for providing custodial services for the fund.These fees are determined based on net assets, geographic region and transaction activity. During the period ended August 31, 2014, the fund was charged $86,574 pursuant to the custody agreement.
The fund compensated The Bank of New York Mellon under a cash management agreement that was in effect until September 30, 2013 for performing certain cash management services related to fund subscriptions and redemptions. During the period ended August 31, 2014, the fund was charged $25 pursuant to the cash management
30
agreement, which is included in Shareholder servicing costs in the Statement of Operations.
During the period ended August 31, 2014, the fund was charged $8,296 for services performed by the Chief Compliance Officer and his staff.
The components of “Due to The Dreyfus Corporation and affiliates” in the Statement of Assets and Liabilities consist of: management fees $121,040, Distribution Plan fees $4,650, Shareholder Services Plan fees $12,339, custodian fees $37,527, Chief Compliance Officer fees $1,154 and transfer agency fees $4,666, which are offset against an expense reimbursement currently in effect in the amount of $12,165.
(d) Each Board member also serves as a Board member of other funds within the Dreyfus complex. Annual retainer fees and attendance fees are allocated to each fund based on net assets.
NOTE 4—Securities Transactions:
The aggregate amount of purchases and sales of investment securities, excluding short-term securities and forward contracts, during the period ended August 31, 2014 amounted to $89,611,126 and $100,417,478, respectively.
Derivatives: A derivative is a financial instrument whose performance is derived from the performance of another asset. Each type of derivative instrument that was held by the fund during the period ended August 31, 2014 is discussed below.
Forward Foreign Currency Exchange Contracts: The fund enters into forward contracts in order to hedge its exposure to changes in foreign currency exchange rates on its foreign portfolio holdings, to settle foreign currency transactions or as a part of its investment strat-egy.When executing forward contracts, the fund is obligated to buy or sell a foreign currency at a specified rate on a certain date in the future. With respect to sales of forward contracts, the fund incurs a loss if the value of the contract increases between the date the forward contract
The Fund 31
NOTES TO FINANCIAL STATEMENTS (continued)
is opened and the date the forward contract is closed.The fund realizes a gain if the value of the contract decreases between those dates.With respect to purchases of forward contracts, the fund incurs a loss if the value of the contract decreases between the date the forward contract is opened and the date the forward contract is closed.The fund realizes a gain if the value of the contract increases between those dates. Any realized or unrealized gains or losses which occurred during the period are reflected in the Statement of Operations. The fund is exposed to foreign currency risk as a result of changes in value of underlying financial instruments. The fund is also exposed to credit risk associated with counterparty nonperformance on these forward contracts, which is generally limited to the unrealized gain on each open contract. The following summarizes open forward contracts at August 31, 2014:
| | | | | |
| Forward Foreign Currency | Currency | | | Unrealized | |
| Exchange Contracts | Amounts | Cost ($) | Value ($) | (Depreciation) ($) | |
| Purchases: | | | | | |
| British Pound, | | | | | |
| Expiring | | | | | |
| 9/2/2014a | 33,908 | 56,319 | 56,292 | (27 | ) |
| Danish Krone, | | | | | |
| Expiring | | | | | |
| 9/2/2014b | 249,969 | 44,230 | 44,094 | (136 | ) |
| Gross Unrealized | | | | | |
| Depreciation | | | | (163 | ) |
Counterparties:
| |
| a | Northern Trust |
| b | Goldman Sachs International |
In December 2011, with clarification in January 2013, FASB issued guidance that expands disclosure requirements with respect to the offsetting of certain assets and liabilities. The fund adopted these disclosure provisions during the current reporting period. These disclosures are required for certain investments, including derivative financial instruments subject to master netting arrangements (“MNA”) or
32
similar agreements which are eligible for offsetting in the Statement of Assets and Liabilities and require the fund to disclose both gross and net information with respect to such investments. For financial reporting purposes, the fund does not offset derivative assets and derivative liabilities that are subject to MNA in the Statement of Assets and Liabilities.
At August 31, 2014, derivative assets and liabilities (by type) on a gross basis are as follows:
| | | |
| Derivative Financial Instruments: | Assets ($) | Liabilities ($) | |
| Forward contracts | — | (163 | ) |
| Total gross amount of derivative assets | | | |
| and liabilities in the Statement of | | | |
| Assets and Liabilities | — | (163 | ) |
| Derivatives not subject to | | | |
| MNA or similar agreements | — | — | |
| Total gross amount of assets and liabilities | | | |
| subject to MNA or similar agreements | — | (163 | ) |
The following table presents derivative assets and liabilities net of amounts available for offsetting under MNA and net of related collateral pledged, if any, as of August 31, 2014:
| | | | | | |
| | | | Financial | | | |
| | | | Instruments | | | |
| | | | and | | | |
| | | | Derivatives | | | |
| | Gross Amount of | | Available | Collateral | Net Amount of | |
| Counterparties | Liabilities ($)1 | | for Offset ($) | Pledged ($)2 | Liabilities ($) | |
| Goldman Sachs | | | | | | |
| International | (136 | ) | — | — | (136 | ) |
| Northern Trust | (27 | ) | — | — | (27 | ) |
| Total | (163 | ) | — | — | (163 | ) |
| |
| 1 | Absent a default event or early termination, over-the-counter derivative assets and liabilities are |
| | presented at gross amounts and are not offset in the Statement of Assets and Liabilities. |
| 2 | In some instances, the actual collateral pledged may be more than the amount shown due to |
| | overcollateralization. |
The Fund 33
NOTES TO FINANCIAL STATEMENTS (continued)
The following summarizes the average market value of derivatives outstanding during the period ended August 31, 2014:
| |
| | Average Market Value ($) |
| Forward contracts | 588,046 |
At August 31, 2014, the cost of investments for federal income tax purposes was $158,525,364; accordingly, accumulated net unrealized depreciation on investments was $17,641,732, consisting of $5,546,930 gross unrealized appreciation and $23,188,662 gross unrealized depreciation.
34
|
| REPORT OF INDEPENDENT REGISTERED |
| PUBLIC ACCOUNTING FIRM |
Shareholders and Board of Directors
Dreyfus International Value Fund
We have audited the accompanying statement of assets and liabilities, including the statement of investments, of Dreyfus International Value Fund (one of the series comprising Advantage Funds, Inc.) as of August 31, 2014, and the related statement of operations for the year then ended, the statement of changes in net assets for each of the two years in the period then ended, and the financial highlights for each of the five years in the period then ended.These financial statements and financial highlights are the responsibility of the Fund’s management. Our responsibility is to express an opinion on these financial statements and financial highlights based on our audits.
We conducted our audits in accordance with the standards of the Public Company Accounting Oversight Board (United States).Those standards require that we plan and perform the audit to obtain reasonable assurance about whether the financial statements and financial highlights are free of material misstatement. We were not engaged to perform an audit of the Fund’s internal control over financial reporting. Our audits included consideration of internal control over financial reporting as a basis for designing audit procedures that are appropriate in the circumstances, but not for the purpose of expressing an opinion on the effectiveness of the Fund’s internal control over financial reporting. Accordingly, we express no such opinion. An audit also includes examining, on a test basis, evidence supporting the amounts and disclosures in the financial statements and financial highlights, assessing the accounting principles used and significant estimates made by management, and evaluating the overall financial statement presentation. Our procedures included confirmation of securities owned as of August 31, 2014 by correspondence with the custodian and others.We believe that our audits provide a reasonable basis for our opinion.
In our opinion, the financial statements and financial highlights referred to above present fairly, in all material respects, the financial position of Dreyfus International Value Fund at August 31, 2014, the results of its operations for the year then ended, the changes in its net assets for each of the two years in the period then ended, and the financial highlights for each of the five years in the period then ended, in conformity with U.S. generally accepted accounting principles.

New York, New York
October 28, 2014
The Fund 35
IMPORTANT TAX INFORMATION (Unaudited)
In accordance with federal tax law, the fund elects to provide each shareholder with their portion of the fund’s foreign taxes paid and the income sourced from foreign countries. Accordingly, the fund hereby reports the following information regarding its fiscal year ended August 31, 2014:
—the total amount of taxes paid to foreign countries was $319,528.
—the total amount of income sourced from foreign countries was $4,107,490.
Where required by federal tax law rules, shareholders will receive notification of their proportionate share of foreign taxes paid and foreign sourced income for the 2014 calendar year with Form 1099-DIV which will be mailed in early 2015.Also, certain dividends paid by the fund may be subject to a maximum tax rate of 15%, as provided for by the Jobs and Growth Tax Relief Reconciliation Act of 2003. Of the distributions paid during the fiscal year, $2,268,905 represents the maximum amount that may be considered qualified dividend income.
36
|
| INFORMATION ABOUT THE RENEWAL OF THE |
| FUND’S MANAGEMENT AGREEMENT (Unaudited) |
At a meeting of the fund’s Board of Directors held on March 4-5, 2014, the Board considered the renewal of the fund’s Management Agreement pursuant to which Dreyfus provides the fund with investment advisory and administrative services (the “Agreement”). The Board members, none of whom are “interested persons” (as defined in the Investment Company Act of 1940, as amended) of the fund, were assisted in their review by independent legal counsel and met with counsel in executive session separate from Dreyfus representatives. In considering the renewal of the Agreement, the Board considered all factors that it believed to be relevant, including those discussed below.The Board did not identify any one factor as dispositive, and each Board member may have attributed different weights to the factors considered.
Analysis of Nature, Extent, and Quality of Services Provided to the Fund.The Board considered information provided to them at the meeting and in previous presentations from Dreyfus representatives regarding the nature, extent, and quality of the services provided to funds in the Dreyfus fund complex. Dreyfus provided the number of open accounts in the fund, the fund’s asset size and the allocation of fund assets among distribution channels. Dreyfus also had previously provided information regarding the diverse intermediary relationships and distribution channels of funds in the Dreyfus fund complex (such as retail direct or intermediary, in which intermediaries typically are paid by the fund and/or Dreyfus) and Dreyfus’ corresponding need for broad, deep, and diverse resources to be able to provide ongoing shareholder services to each intermediary or distribution channel, as applicable to the fund.
The Board also considered research support available to, and portfolio management capabilities of, the fund’s portfolio management personnel and that Dreyfus also provides oversight of day-to-day fund operations, including fund accounting and administration and assistance in meeting legal and regulatory requirements. The Board also considered Dreyfus’ extensive administrative, accounting, and compliance infrastructures. The Board also considered portfolio management’s brokerage policies and practices (including policies and practices regarding soft dollars) and the standards applied in seeking best execution.
The Fund 37
|
| INFORMATION ABOUT THE RENEWAL OF THE FUND’S |
| MANAGEMENT AGREEMENT (Unaudited) (continued) |
Comparative Analysis of the Fund’s Performance and Management Fee and Expense Ratio. The Board reviewed reports prepared by Lipper, Inc. (“Lipper”), an independent provider of investment company data, which included information comparing (1) the fund’s performance with the performance of a group of comparable funds (the “Performance Group”) and with a broader group of funds (the “Performance Universe”), all for various periods ended December 31, 2013, and (2) the fund’s actual and contractual management fees and total expenses with those of a group of comparable funds (the “Expense Group”) and with a broader group of funds (the “Expense Universe”), the information for which was derived in part from fund financial statements available to Lipper as of the date of its analysis. Dreyfus previously had furnished the Board with a description of the methodology Lipper used to select the Performance Group and Performance Universe and the Expense Group and Expense Universe.
Dreyfus representatives stated that the usefulness of performance comparisons may be affected by a number of factors, including different investment limitations that may be applicable to the fund and comparison funds. The Board discussed the results of the comparisons and noted that the fund’s total return performance was at or below the Performance Group and Performance Universe medians for the various periods, except for the one-year period when the fund’s performance was above the Performance Group and Performance Universe medians. The Board noted that Dreyfus had added the fund’s current lead portfolio manager to the fund in 2011 and that he was appointed lead portfolio manager in 2013. Dreyfus also provided a comparison of the fund’s calendar year total returns to the returns of the fund’s benchmark index.
The Board also reviewed the range of actual and contractual management fees and total expenses of the Expense Group and Expense Universe funds and discussed the results of the comparisons.The Board noted that the fund’s contractual management fee was above the Expense Group median and the fund’s actual management fee and total expenses were above the Expense Group and Expense Universe medians.
38
Dreyfus representatives noted that Dreyfus has agreed to waive receipt of a portion of the fund’s management fee in the amount of .10% of the value of the fund’s average daily net assets until September 30, 2014. On or after September 30, 2014, Dreyfus may terminate this expense waiver at any time.
Dreyfus representatives reviewed with the Board the management or investment advisory fees (1) paid by funds advised or administered by Dreyfus that are in the same Lipper category as the fund and (2) paid to Dreyfus or the Dreyfus-affiliated primary employer of the fund’s primary portfolio manager(s) for advising any separate accounts and/or other types of client portfolios that are considered to have similar investment strategies and policies as the fund (the “Similar Clients”), and explained the nature of the Similar Clients. They discussed differences in fees paid and the relationship of the fees paid in light of any differences in the services provided and other relevant factors. The Board considered the relevance of the fee information provided for the Similar Clients to evaluate the appropriateness and reasonableness of the fund’s management fee.
Analysis of Profitability and Economies of Scale. Dreyfus representatives reviewed the expenses allocated and profit received by Dreyfus and the resulting profitability percentage for managing the fund and the aggregate profitability percentage to Dreyfus of managing the funds in the Dreyfus fund complex, and the method used to determine the expenses and profit. The Board concluded that the profitability results were not unreasonable, given the services rendered and service levels provided by Dreyfus.The Board also noted the fee waiver arrangement and its effect on Dreyfus’ profitability.The Board also had been provided with information prepared by an independent consulting firm regarding Dreyfus’ approach to allocating costs to, and determining the profitability of, individual funds and the entire Dreyfus fund complex.The consulting firm also had analyzed where any economies of scale might emerge in connection with the management of a fund.
The Fund 39
|
| INFORMATION ABOUT THE RENEWAL OF THE FUND’S |
| MANAGEMENT AGREEMENT (Unaudited) (continued) |
The Board considered on the advice of its counsel the profitability analysis (1) as part of its evaluation of whether the fees under the Agreement bear a reasonable relationship to the mix of services provided by Dreyfus, including the nature, extent and quality of such services, and (2) in light of the relevant circumstances for the fund and the extent to which economies of scale would be realized if the fund grows and whether fee levels reflect these economies of scale for the benefit of fund shareholders. Dreyfus representatives noted that a discussion of economies of scale is predicated on a fund having achieved a substantial size with increasing assets and that, if a fund’s assets had been stable or decreasing, the possibility that Dreyfus may have realized any economies of scale would be less. Dreyfus representatives also noted that, as a result of shared and allocated costs among funds in the Dreyfus fund complex, the extent of economies of scale could depend substantially on the level of assets in the complex as a whole, so that increases and decreases in complex-wide assets can affect potential economies of scale in a manner that is disproportionate to, or even in the opposite direction from, changes in the fund’s asset level. The Board also considered potential benefits to Dreyfus from acting as investment adviser and noted the soft dollar arrangements in effect for trading the fund’s investments.
At the conclusion of these discussions, the Board agreed that it had been furnished with sufficient information to make an informed business decision with respect to the renewal of the Agreement. Based on the discussions and considerations as described above, the Board concluded and determined as follows.
The Board concluded that the nature, extent and quality of the services provided by Dreyfus are adequate and appropriate.
The Board noted Dreyfus’ efforts to improve performance and the fund’s improved performance and agreed to continue to closely monitor performance.
The Board concluded that the fee paid to Dreyfus was reasonable in light of the considerations described above.
40
The Board determined that the economies of scale which may accrue to Dreyfus and its affiliates in connection with the management of the fund had been adequately considered by Dreyfus in connection with the fee rate charged to the fund pursuant to the Agreement and that, to the extent in the future it were determined that material economies of scale had not been shared with the fund, the Board would seek to have those economies of scale shared with the fund.
In evaluating the Agreement, the Board considered these conclusions and determinations and also relied on its previous knowledge, gained through meetings and other interactions with Dreyfus and its affiliates, of the fund and the services provided to the fund by Dreyfus. The Board also relied on information received on a routine and regular basis throughout the year relating to the operations of the fund and the investment management and other services provided under the Agreement, including information on the investment performance of the fund in comparison to similar mutual funds and benchmark performance indices; general market outlook as applicable to the fund; and compliance reports. In addition, the Board’s consideration of the contractual fee arrangements for this fund had the benefit of a number of years of reviews of prior or similar agreements during which lengthy discussions took place between the Board and Dreyfus representatives. Certain aspects of the arrangements may receive greater scrutiny in some years than in others, and the Board’s conclusions may be based, in part, on their consideration of the same or similar arrangements in prior years. The Board determined that renewal of the Agreement was in the best interests of the fund and its shareholders.
The Fund 41
|
| BOARD MEMBERS INFORMATION (Unaudited) |
| INDEPENDENT BOARD MEMBERS |
|
| Joseph S. DiMartino (70) |
| Chairman of the Board (1995) |
| Principal Occupation During Past 5Years: |
| • Corporate Director and Trustee (1995-present) |
| Other Public Company Board Memberships During Past 5Years: |
| • CBIZ (formerly, Century Business Services, Inc.), a provider of outsourcing functions for small |
| and medium size companies, Director (1997-present) |
| • The Newark Group, a provider of a national market of paper recovery facilities, paperboard |
| mills and paperboard converting plants, Director (2000-2010) |
| • Sunair Services Corporation, a provider of certain outdoor-related services to homes and |
| businesses, Director (2005-2009) |
| No. of Portfolios for which Board Member Serves: 142 |
| ——————— |
| Peggy C. Davis (71) |
| Board Member (2006) |
| Principal Occupation During Past 5Years: |
| • Shad Professor of Law, New York University School of Law (1983-present) |
| No. of Portfolios for which Board Member Serves: 52 |
| ——————— |
| David P. Feldman (74) |
| Board Member (1996) |
| Principal Occupation During Past 5Years: |
| • Corporate Director and Trustee (1985-present) |
| Other Public Company Board Membership During Past 5Years: |
| • BBH Mutual Funds Group (5 registered mutual funds), Director (1992-present) |
| No. of Portfolios for which Board Member Serves: 38 |
| ——————— |
| Ehud Houminer (74) |
| Board Member (1993) |
| Principal Occupation During Past 5Years: |
| • Executive-in-Residence at the Columbia Business School, Columbia University (1992-present) |
| Other Public Company Board Membership During Past 5Years: |
| • Avnet Inc., an electronics distributor, Director (1993-2012) |
| No. of Portfolios for which Board Member Serves: 62 |
42
|
| Lynn Martin (74) |
| Board Member (2012) |
| Principal Occupation During Past 5Years: |
| • President of The Martin Hall Group LLC, a human resources consulting firm (2005-2012) |
| Other Public Company Board Memberships During Past 5Years: |
| • AT&T Inc., a telecommunications company, Director (1999-2012) |
| • Ryder System, Inc., a supply chain and transportation management company, Director (1993-2012) |
| • The Proctor & Gamble Co., a consumer products company, Director (1994-2009) |
| • Constellation Energy Group Inc., Director (2003-2009) |
| No. of Portfolios for which Board Member Serves: 38 |
| ——————— |
| Robin A. Melvin (50) |
| Board Member (2012) |
| Principal Occupation During Past 5Years: |
| • Board Member, Illinois Mentoring Partnership, non-profit organization dedicated to increasing |
| the quantity and quality of mentoring services in Illinois (2013-present) |
| • Director, Boisi Family Foundation, a private family foundation that supports youth-serving orga- |
| nizations that promote the self sufficiency of youth from disadvantaged circumstances (1995-2012) |
| No. of Portfolios for which Board Member Serves: 109 |
| ——————— |
| Dr. Martin Peretz (75) |
| Board Member (2006) |
| Principal Occupation During Past 5Years: |
| • Editor-in-Chief Emeritus of The New Republic Magazine (2010-2011) (previously, |
| Editor-in-Chief, 1974-2010) |
| • Director of TheStreet.com, a financial information service on the web (1996-2010) |
| No. of Portfolios for which Board Member Serves: 38 |
| ——————— |
Once elected all Board Members serve for an indefinite term, but achieve Emeritus status upon reaching age 80.The address of the Board Members and Officers is c/o The Dreyfus Corporation, 200 Park Avenue, New York, New York 10166. Additional information about the Board Members is available in the fund’s Statement of Additional Information which can be obtained from Dreyfus free of charge by calling this toll free number: 1-800-DREYFUS.
James F. Henry, Emeritus Board Member
Dr. Paul A. Marks, Emeritus Board Member
Philip L.Toia, Emeritus Board Member
The Fund 43
OFFICERS OF THE FUND (Unaudited)
BRADLEY J. SKAPYAK, President since January 2010.
Chief Operating Officer and a director of the Manager since June 2009, Chairman of Dreyfus Transfer, Inc., an affiliate of the Manager and the transfer agent of the funds, since May 2011 and Executive Vice President of the Distributor since June 2007. From April 2003 to June 2009, Mr. Skapyak was the head of the Investment Accounting and Support Department of the Manager. He is an officer of 69 investment companies (comprised of 142 portfolios) managed by the Manager. He is 55 years old and has been an employee of the Manager since February 1988.
JOHN PAK, Chief Legal Officer since March 2013.
Deputy General Counsel, Investment Management, of BNY Mellon since August 2014; Chief Legal Officer of the Manager since August 2012; from March 2005 to July 2012, Managing Director of Deutsche Bank, Deputy Global Head of Deutsche Asset Management Legal and Regional Head of Deutsche Asset Management Americas Legal. He is an officer of 70 investment companies (comprised of 167 portfolios) managed by the Manager. He is 45 years old and has been an employee of the Manager since August 2012.
JANETTE E. FARRAGHER, Vice President and Secretary since December 2011.
Assistant General Counsel of BNY Mellon, and an officer of 70 investment companies (comprised of 167 portfolios) managed by the Manager. She is 51 years old and has been an employee of the Manager since February 1984.
KIESHA ASTWOOD, Vice President and Assistant Secretary since January 2010.
Counsel of BNY Mellon, and an officer of 70 investment companies (comprised of 167 portfolios) managed by the Manager. She is 41 years old and has been an employee of the Manager since July 1995.
JAMES BITETTO, Vice President and Assistant Secretary since August 2005.
Managing Counsel of BNY Mellon and Secretary of the Manager, and an officer of 70 investment companies (comprised of 167 portfolios) managed by the Manager. He is 48 years old and has been an employee of the Manager since December 1996.
JONI LACKS CHARATAN, Vice President and Assistant Secretary since August 2005.
Managing Counsel of BNY Mellon, and an officer of 70 investment companies (comprised of 167 portfolios) managed by the Manager. She is 58 years old and has been an employee of the Manager since October 1988.
JOSEPH M. CHIOFFI, Vice President and Assistant Secretary since August 2005.
Managing Counsel of BNY Mellon, and an officer of 70 investment companies (comprised of 167 portfolios) managed by the Manager. He is 52 years old and has been an employee of the Manager since June 2000.
JOHN B. HAMMALIAN, Vice President and Assistant Secretary since August 2005.
Senior Managing Counsel of BNY Mellon, and an officer of 70 investment companies (comprised of 167 portfolios) managed by the Manager. He is 51 years old and has been an employee of the Manager since February 1991.
SARAH S. KELLEHER, Vice President and Assistant Secretary since April 2014.
Senior Counsel of BNY Mellon, and an officer of 70 investment companies (comprised of 167 portfolios) managed by the Manager; from August 2005 to March 2013, Associate General Counsel of Third Avenue Management. She is 38 years old and has been an employee of the Manager since March 2013.
44
JEFF PRUSNOFSKY, Vice President and Assistant Secretary since August 2005.
Senior Managing Counsel of BNY Mellon, and an officer of 70 investment companies (comprised of 167 portfolios) managed by the Manager. He is 49 years old and has been an employee of the Manager since October 1990.
JAMES WINDELS, Treasurer since November 2001.
Director – Mutual Fund Accounting of the Manager, and an officer of 70 investment companies (comprised of 167 portfolios) managed by the Manager. He is 55 years old and has been an employee of the Manager since April 1985.
RICHARD CASSARO, Assistant Treasurer since January 2008.
Senior Accounting Manager – Money Market and Municipal Bond Funds of the Manager, and an officer of 70 investment companies (comprised of 167 portfolios) managed by the Manager. He is 55 years old and has been an employee of the Manager since September 1982.
GAVIN C. REILLY, Assistant Treasurer since December 2005.
Tax Manager of the Investment Accounting and Support Department of the Manager, and an officer of 70 investment companies (comprised of 167 portfolios) managed by the Manager. He is 46 years old and has been an employee of the Manager since April 1991.
ROBERT S. ROBOL, Assistant Treasurer since August 2005.
Senior Accounting Manager – Fixed Income Funds of the Manager, and an officer of 70 investment companies (comprised of 167 portfolios) managed by the Manager. He is 50 years old and has been an employee of the Manager since October 1988.
ROBERT SALVIOLO, Assistant Treasurer since July 2007.
Senior Accounting Manager – Equity Funds of the Manager, and an officer of 70 investment companies (comprised of 167 portfolios) managed by the Manager. He is 47 years old and has been an employee of the Manager since June 1989.
ROBERT SVAGNA, Assistant Treasurer since August 2005.
Senior Accounting Manager – Equity Funds of the Manager, and an officer of 70 investment companies (comprised of 167 portfolios) managed by the Manager. He is 47 years old and has been an employee of the Manager since November 1990.
JOSEPH W. CONNOLLY, Chief Compliance Officer since October 2004.
Chief Compliance Officer of the Manager and The Dreyfus Family of Funds (70 investment companies, comprised of 167 portfolios).
He is 57 years old and has served in various capacities with the Manager since 1980, including manager of the firm’s Fund Accounting Department from 1997 through October 2001.
MATTHEW D. CONNOLLY, Anti-Money Laundering Compliance Officer since April 2012.
Anti-Money Laundering Compliance Officer of the Distributor since October 2011; from March 2010 to September 2011, Global Head, KYC Reviews and Director of UBS Investment Bank; until March 2010, AML Compliance Officer and Senior Vice President of Citi Global Wealth Management. He is an officer of 65 investment companies (comprised of 162 portfolios) managed by the Manager. He is 42 years old and has been an employee of the Distributor since October 2011.
The Fund 45
For More Information

Telephone Call your financial representative or 1-800-DREYFUS
Mail The Dreyfus Family of Funds, 144 Glenn Curtiss Boulevard, Uniondale, NY 11556-0144
The fund files its complete schedule of portfolio holdings with the Securities and Exchange Commission (“SEC”) for the first and third quarters of each fiscal year on Form N-Q. The fund’s Forms N-Q are available on the SEC’s website at http://www.sec.gov and may be reviewed and copied at the SEC’s Public Reference Room in Washington, DC. Information on the operation of the Public Reference Room may be obtained by calling 1-800-SEC-0330.
A description of the policies and procedures that the fund uses to determine how to vote proxies relating to portfolio securities, and information regarding how the fund voted these proxies for the most recent 12-month period ended June 30 is available at http://www.dreyfus.com and on the SEC’s website at http://www.sec.gov. The description of the policies and procedures is also available without charge, upon request, by calling 1-800-DREYFUS.

|
| Dreyfus |
| Opportunistic |
| Midcap Value Fund |
ANNUAL REPORT August 31, 2014

Save time. Save paper. View your next shareholder report online as soon as it’s available. Log into www.dreyfus.com and sign up for Dreyfus eCommunications. It’s simple and only takes a few minutes.
The views expressed in this report reflect those of the portfolio manager only through the end of the period covered and do not necessarily represent the views of Dreyfus or any other person in the Dreyfus organization. Any such views are subject to change at any time based upon market or other conditions and Dreyfus disclaims any responsibility to update such views.These views may not be relied on as investment advice and, because investment decisions for a Dreyfus fund are based on numerous factors, may not be relied on as an indication of trading intent on behalf of any Dreyfus fund.
|
| Not FDIC-Insured • Not Bank-Guaranteed • May Lose Value |
| | Contents |
| | THE FUND |
| 2 | A Letter from the President |
| 3 | Discussion of Fund Performance |
| 6 | Fund Performance |
| 8 | Understanding Your Fund’s Expenses |
| 8 | Comparing Your Fund’s Expenses With Those of Other Funds |
| 9 | Statement of Investments |
| 13 | Statement of Assets and Liabilities |
| 14 | Statement of Operations |
| 15 | Statement of Changes in Net Assets |
| 17 | Financial Highlights |
| 21 | Notes to Financial Statements |
| 31 | Report of Independent Registered Public Accounting Firm |
| 32 | Important Tax Information |
| 33 | Information About the Renewal of the Fund’s Management Agreement |
| 38 | Board Members Information |
| 40 | Officers of the Fund |
| | FOR MORE INFORMATION |
| | Back Cover |
Dreyfus
Opportunistic
Midcap Value Fund
The Fund
A LETTER FROM THE PRESIDENT
Dear Shareholder:
We are pleased to present this annual report for Dreyfus Opportunistic MidcapValue Fund, covering the 12-month period from September 1, 2013, through August 31, 2014. For information about how the fund performed during the reporting period, as well as general market perspectives, we provide a Discussion of Fund Performance on the pages that follow.
Despite occasional bouts of heightened volatility, U.S. stocks generally gained ground steadily over the reporting period as the domestic economy rebounded. As a result, most broad measures of equity market performance established a series of new record highs over the past 12 months. Growth-oriented and more economically sensitive stocks generally fared well over the reporting period’s first half, but value-oriented stocks rallied more strongly over the second half.
We remain cautiously optimistic regarding the U.S. stock market’s prospects. We currently expect the economy to continue to accelerate as several long-standing drags, including tight fiscal policies and private sector deleveraging, fade from the scene. Of course, a number of risks remain, including the possibilities of higher short-term interest rates and intensifying geopolitical turmoil.Therefore, we suggest you talk regularly with your financial advisor to assess the potential impact of these and other macroeconomic developments on your investments.
Thank you for your continued confidence and support.

J. Charles Cardona
President
The Dreyfus Corporation
September 15, 2014
2
DISCUSSION OF FUND PERFORMANCE
For the period of September 1, 2013, through August 31, 2014, as provided by David A. Daglio, Primary Portfolio Manager
Fund and Market Performance Overview
For the 12-month period ended August 31, 2014, Dreyfus Opportunistic Midcap Value Fund’s Class A shares produced a total return of 25.32%, Class C shares returned 24.35%, Class I shares returned 25.62%, and Class Y shares returned 26.02%.1 In comparison, the fund’s benchmark, the Russell Midcap® Value Index (the “Index”), produced a 27.20% total return for the same period.2
Midcap stocks climbed during the reporting period in an environment of improving economic growth.The fund produced strong absolute returns but lagged its benchmark due to security selection shortfalls in the consumer staples and information technology sectors as well as the impact of fund fees and expenses that are not reflected in the benchmark’s results.
The Fund’s Investment Approach
The fund seeks to surpass the performance of the Index by investing in midcap companies with market capitalizations between $1 billion and $25 billion at the time of purchase. The fund’s portfolio managers identify potential investments through extensive quantitative and fundamental research conducted by the team’s dedicated sector specialists.
The fund focuses on individual stock selection (a “bottom-up” approach), emphasizing three key factors: relative value, business health, and business momentum.
The portfolio managers use an opportunistic value style in an attempt to benefit from valuation inefficiencies and underappreciated fundamental prospects present in the marketplace.To do this, the portfolio managers use mid-cycle estimates, growth prospects, the identification of a revaluation catalyst, and competitive advantages as some of the factors in the valuation assessment.
The Fund 3
DISCUSSION OF FUND PERFORMANCE (continued)
Midcap Stocks Advanced Strongly in a Broad Market Rally
Stocks generally gained value over the fall of 2013 in response to encouraging economic data, enabling several broad measures of U.S. stock market performance to end 2013 near record highs. The market relinquished some of its gains in January 2014 amid concerns regarding economic slowdowns in the world’s emerging markets, but stocks rebounded in February when those worries proved to be overblown.Another bout of weakness in the spring stemmed from the adverse impact of unusually harsh winter weather on economic activity. The market downturn hit the information technology and biotechnology industry groups particularly hard, triggering a shift in market leadership from more aggressive growth stocks to their better established, value-oriented counterparts. It became clear in the spring that the economic recovery had resumed, driving stocks of all capitalization ranges to a series of new record highs over the reporting period’s final three months.
While large-, mid-, and small-cap stocks produced double-digit returns, on average, in this constructive environment, the shift in market leadership to more conservative companies caused midcap stocks to modestly trail their large-cap counterparts for the reporting period overall. However, midcap stocks produced higher returns than small-cap stocks, and midcap value-oriented stocks generally outperformed midcap growth stocks.
Fund Strategies Produced Mixed Results
Although the fund participated in most of the value-oriented midcap stock market’s gains, its relative performance was constrained by a handful of disappointments in the consumer staples and information technology sectors. Most notably, beauty products seller Avon Products failed to execute an expected turnaround in its business. In the information technology sector, Xilinx suffered when Chinese telecommunications companies began to move away from the programmable devices maker’s technologies. These developments prompted the elimination of Avon Products and Xilinx from the fund’s portfolio.
Another technology holding, communications equipment producer JDS Uniphase, trailed market averages despite improved fundamental prospects, which we expect to boost future financial results. Likewise, electronic components distributors Avnet and Arrow Electronics disappointed when pent-up enterprise demand failed to materialize, but we recently have seen hints of greater capital spending as the economy improves.
4
The fund achieved better relative performance in the financials sector, where online brokers E*TRADE Financial and TD Ameritrade Holding saw rising trading volumes and asset growth when financial markets rallied. Better-than-expected growth in key product areas fueled higher profit margins for investment manager Invesco. Insurer Hartford Financial Services Group achieved strongly positive asset flows and a higher market share. Voya Financial, formerly known as ING U.S., fared well as investors increasingly recognized its attractive valuation and rising profits. Among industrial companies, Ingersoll-Rand rallied from previous weakness and appears poised to benefit from greater enterprise spending.
Continuing to Find Attractive Midcap Opportunities
We recently have been encouraged by improved U.S. economic activity, including a stronger labor market. In our judgment, an extended economic recovery should be good for midcap stocks. However, valuations have climbed and interest rates may rise, suggesting that selectivity is likely to become more critical to investment success. Our top-down analyses and bottom-up security selection process have identified an ample number of midcap opportunities meeting our value-oriented criteria in the information technology, financials, industrials, and health care sectors, but fewer in the consumer staples, utilities, and telecommunications services sectors.
September 15, 2014
Equity funds are subject generally to market, market sector, market liquidity, issuer, and investment style risks, among other factors, to varying degrees, all of which are more fully described in the fund’s prospectus.
Stocks of small- and/or midcap companies often experience sharper price fluctuations than stocks of large-cap companies.
|
| 1 Total return includes reinvestment of dividends and any capital gains paid and does not take into consideration the |
| maximum initial sales charge in the case of Class A shares, or the applicable contingent deferred sales charge imposed |
| on redemptions in the case of Class C shares. Had these charges been reflected, returns would have been lower. Past |
| performance is no guarantee of future results. Share price and investment return fluctuate such that upon redemption |
| fund shares may be worth more or less than their original cost. |
| 2 SOURCE: LIPPER INC. — Reflects reinvestment of dividends and, where applicable, capital gain distributions. |
| The Russell Midcap® Value Index is a widely accepted, unmanaged index of medium-cap stock market performance |
| and measures the performance of those Russell midcap companies with lower price-to-book ratios and lower forecasted |
| growth values. Investors cannot invest directly in any index. |
The Fund 5
FUND PERFORMANCE
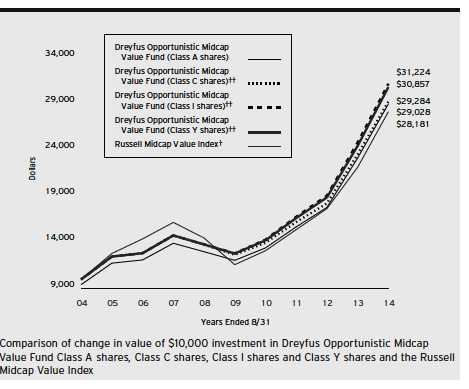
| |
| † | Source: Lipper Inc. |
| †† | The total return figures presented for Class C shares of the fund reflect the performance of the fund’s Class A shares |
| | for the period prior to 5/30/08 (the inception date for Class C shares), not reflecting the applicable sales charges for |
| | Class A shares. |
| | The total return figures presented for Class I shares of the fund reflect the performance of the fund’s Class A shares |
| | for the period prior to 5/30/08 (the inception date for Class I shares), not reflecting the applicable sales charges for |
| | Class A shares. |
| | The total return figures presented for ClassY shares of the fund reflect the performance of the fund’s Class A shares |
| | for the period prior to 7/1/13 (the inception date for ClassY shares), not reflecting the applicable sales charges for |
| | Class A shares. |
Past performance is not predictive of future performance.
The above graph compares a $10,000 investment made in each of the Class A, Class C, Class I and Class Y shares of Dreyfus Opportunistic Midcap Value Fund on 8/31/04 to a $10,000 investment made in the Russell Midcap Value Index (the “Index”) on that date. All dividends and capital gain distributions are reinvested.
The fund’s performance shown in the line graph above takes into account the maximum initial sales charge on Class A shares and all other applicable fees and expenses on all classes.The Index is a widely accepted, unmanaged index of medium-cap stock market performance and measures the performance of those Russell Midcap companies with lower price-to-book ratios and lower forecasted growth values. Unlike a mutual fund, the Index is not subject to charges, fees and other expenses. Investors cannot invest directly in any index. Further information relating to fund performance, including expense reimbursements, if applicable, is contained in the Financial Highlights section of the prospectus and elsewhere in this report.
6
| | | | | | | |
| Average Annual Total Returns as of 8/31/14 | | | | | | |
| Inception | | | | | | |
| | Date | 1 Year | | 5 Years | | 10 Years | |
| Class A shares | | | | | | | |
| with maximum sales charge (5.75%) | 9/29/95 | 18.13 | % | 17.80 | % | 11.25 | % |
| without sales charge | 9/29/95 | 25.32 | % | 19.21 | % | 11.91 | % |
| Class C shares | | | | | | | |
| with applicable redemption charge† | 5/30/08 | 23.35 | % | 18.25 | % | 11.34 | %†† |
| without redemption | 5/30/08 | 24.35 | % | 18.25 | % | 11.34 | %†† |
| Class I shares | 5/30/08 | 25.62 | % | 19.49 | % | 12.06 | %†† |
| Class Y shares | 7/1/13 | 26.02 | % | 19.25 | %†† | 11.93 | %†† |
| Russell Midcap Value Index | | 27.20 | % | 19.45 | % | 10.92 | % |
Past performance is not predictive of future performance.The fund’s performance shown in the graph and table does not reflect the deduction of taxes that a shareholder would pay on fund distributions or the redemption of fund shares. In addition to the performance of Class A shares shown with and without a maximum sales charge, the fund’s performance shown in the table takes into account all other applicable fees and expenses on all classes.
| |
| † | The maximum contingent deferred sales charge for Class C shares is 1% for shares redeemed within one year of the |
| | date of purchase. |
| †† | The total return performance figures presented for Class C shares of the fund reflect the performance of the fund’s |
| | Class A shares for the period prior to 5/30/08 (the inception date for Class C shares), not reflecting the applicable |
| | sales charges for Class A shares. |
| | The total return performance figures presented for Class I shares of the fund reflect the performance of the fund’s |
| | Class A shares for the period prior to 5/30/08 (the inception date for Class I shares), not reflecting the applicable |
| | sales charges for Class A shares. |
| | The total return performance figures presented for ClassY shares of the fund reflect the performance of the fund’s |
| | Class A shares for the period prior to 7/1/13 (the inception date for ClassY shares), not reflecting the applicable |
| | sales charges for Class A shares. |
The Fund 7
UNDERSTANDING YOUR FUND’S EXPENSES (Unaudited)
As a mutual fund investor, you pay ongoing expenses, such as management fees and other expenses. Using the information below, you can estimate how these expenses affect your investment and compare them with the expenses of other funds.You also may pay one-time transaction expenses, including sales charges (loads) and redemption fees, which are not shown in this section and would have resulted in higher total expenses. For more information, see your fund’s prospectus or talk to your financial adviser.
Review your fund’s expenses
The table below shows the expenses you would have paid on a $1,000 investment in Dreyfus Opportunistic Midcap Value Fund from March 1, 2014 to August 31, 2014. It also shows how much a $1,000 investment would be worth at the close of the period, assuming actual returns and expenses.
Expenses and Value of a $1,000 Investment
assuming actual returns for the six months ended August 31, 2014
| | | | | | | | |
| | | Class A | | Class C | | Class I | | Class Y |
| Expenses paid per $1,000† | $ | 6.01 | $ | 9.79 | $ | 4.47 | $ | 4.27 |
| Ending value (after expenses) | $ | 1,036.50 | $ | 1,032.60 | $ | 1,037.90 | $ | 1,040.50 |
COMPARING YOUR FUND’S EXPENSES
WITH THOSE OF OTHER FUNDS (Unaudited)
Using the SEC’s method to compare expenses
The Securities and Exchange Commission (SEC) has established guidelines to help investors assess fund expenses. Per these guidelines, the table below shows your fund’s expenses based on a $1,000 investment, assuming a hypothetical 5% annualized return. You can use this information to compare the ongoing expenses (but not transaction expenses or total cost) of investing in the fund with those of other funds. All mutual fund shareholder reports will provide this information to help you make this comparison. Please note that you cannot use this information to estimate your actual ending account balance and expenses paid during the period.
Expenses and Value of a $1,000 Investment
assuming a hypothetical 5% annualized return for the six months ended August 31, 2014
| | | | | | | | |
| | | Class A | | Class C | | Class I | | Class Y |
| Expenses paid per $1,000† | $ | 5.96 | $ | 9.70 | $ | 4.43 | $ | 4.23 |
| Ending value (after expenses) | $ | 1,019.31 | $ | 1,015.58 | $ | 1,020.82 | $ | 1,021.02 |
|
| † Expenses are equal to the fund’s annualized expense ratio of 1.17% for Class A, 1.91% for Class C, .87% for Class I |
| and .83% for ClassY, multiplied by the average account value over the period, multiplied by 184/365 (to reflect the one- |
| half year period). |
8
|
| STATEMENT OF INVESTMENTS |
| August 31, 2014 |
| | | |
| Common Stocks—99.2% | Shares | | Value ($) |
| Automobiles & Components—3.5% | | | |
| BorgWarner | 220,040 | | 13,684,288 |
| Lear | 391,490 | | 39,591,384 |
| TRW Automotive Holdings | 467,918 | a | 45,055,824 |
| | | | 98,331,496 |
| Banks—5.6% | | | |
| Comerica | 1,859,050 | | 93,584,577 |
| Fifth Third Bancorp | 1,198,990 | | 24,465,391 |
| SunTrust Banks | 1,073,860 | | 40,892,589 |
| | | | 158,942,557 |
| Capital Goods—12.8% | | | |
| Graco | 361,880 | | 27,814,097 |
| IDEX | 294,020 | | 22,621,899 |
| Ingersoll-Rand | 871,710 | | 52,476,942 |
| MSC Industrial Direct, Cl. A | 507,450 | | 45,741,543 |
| PACCAR | 417,050 | | 26,194,911 |
| Parker Hannifin | 674,660 | | 77,923,230 |
| Regal-Beloit | 899,778 | | 63,947,222 |
| Trinity Industries | 938,100 | | 45,385,278 |
| | | | 362,105,122 |
| Commercial & Professional Services—1.4% | | | |
| Equifax | 506,580 | | 39,898,241 |
| Consumer Durables & Apparel—1.8% | | | |
| Newell Rubbermaid | 1,485,320 | | 49,787,926 |
| Diversified Financials—17.3% | | | |
| Blackstone Group | 451,290 | | 15,131,754 |
| Discover Financial Services | 1,282,750 | | 80,005,117 |
| E*TRADE Financial | 3,205,950 | a | 71,364,447 |
| FNFV Group | 552,354 | | 8,274,263 |
| Invesco | 1,450,480 | | 59,237,603 |
| Raymond James Financial | 845,930 | | 46,221,615 |
| SLM | 4,783,430 | | 42,381,190 |
| TD Ameritrade Holding | 2,999,880 | | 99,326,027 |
| Voya Financial | 1,795,384 | | 70,181,561 |
| | | | 492,123,577 |
The Fund 9
STATEMENT OF INVESTMENTS (continued)
| | | |
| Common Stocks (continued) | Shares | | Value ($) |
| Energy—5.8% | | | |
| Antero Resources | 230,278 | | 13,321,582 |
| CONSOL Energy | 647,140 | | 26,066,799 |
| HollyFrontier | 274,830 | | 13,749,745 |
| Range Resources | 435,420 | | 34,219,658 |
| Tesoro | 494,860 | | 32,037,236 |
| Weatherford International | 1,862,050 | a | 44,111,965 |
| | | | 163,506,985 |
| Exchange-Traded Funds—1.2% | | | |
| Standard & Poor’s Depository | | | |
| Receipts S&P MidCap 400 ETF Trust | 128,210 | | 33,557,685 |
| Health Care Equipment & Services—7.0% | | | |
| Catamaran | 977,670 | a | 46,067,810 |
| Cigna | 447,910 | | 42,372,286 |
| MEDNAX | 1,332,210 | a | 76,269,022 |
| Varian Medical Systems | 406,500 | a | 34,560,630 |
| | | | 199,269,748 |
| Insurance—3.1% | | | |
| FNF Group | 1,657,230 | | 46,916,181 |
| Hartford Financial Services Group | 1,134,690 | | 42,040,265 |
| | | | 88,956,446 |
| Materials—6.7% | | | |
| New Gold | 2,374,490 | a | 15,410,440 |
| Newmont Mining | 1,325,638 | | 35,911,533 |
| Sherwin-Williams | 132,540 | | 28,908,299 |
| Valspar | 670,470 | | 54,147,157 |
| Yamana Gold | 6,714,933 | | 57,076,931 |
| | | | 191,454,360 |
| Media—.9% | | | |
| Omnicom Group | 354,890 | | 25,555,629 |
10
| | | |
| Common Stocks (continued) | Shares | | Value ($) |
| Pharmaceuticals, Biotech & Life Sciences—8.4% | | | |
| Agilent Technologies | 1,232,930 | | 70,474,279 |
| Covance | 642,830 | a | 53,290,607 |
| Cubist Pharmaceuticals | 1,119,400 | a | 77,272,182 |
| Salix Pharmaceuticals | 240,450 | a | 38,258,000 |
| | | | 239,295,068 |
| Real Estate—2.7% | | | |
| Realogy Holdings | 1,896,230 | a | 77,309,297 |
| Retailing—.6% | | | |
| Williams-Sonoma | 251,020 | | 16,509,585 |
| Semiconductors & Semiconductor Equipment—3.2% | | | |
| Applied Materials | 3,925,060 | | 90,688,511 |
| Software & Services—.8% | | | |
| DST Systems | 243,145 | | 22,566,287 |
| Technology Hardware & Equipment—13.1% | | | |
| Arrow Electronics | 512,920 | a | 31,929,270 |
| Avnet | 2,194,643 | | 97,683,560 |
| FLIR Systems | 570,660 | | 19,282,601 |
| Ingram Micro, Cl. A | 993,620 | a | 28,646,065 |
| JDS Uniphase | 4,025,083 | a | 46,489,709 |
| Juniper Networks | 2,394,120 | | 55,519,643 |
| Seagate Technology | 1,181,960 | | 73,967,057 |
| Western Digital | 191,750 | | 19,752,167 |
| | | | 373,270,072 |
| Transportation—2.2% | | | |
| Kirby | 524,721 | a | 62,593,968 |
| Utilities—1.1% | | | |
| Great Plains Energy | 1,231,971 | | 31,624,696 |
| Total Common Stocks | | | |
| (cost $2,183,080,786) | | | 2,817,347,256 |
The Fund 11
STATEMENT OF INVESTMENTS (continued)
| | | |
| Other Investment—.8% | Shares | | Value ($) |
| Registered Investment Company; | | | |
| Dreyfus Institutional Preferred | | | |
| Plus Money Market Fund | | | |
| (cost $21,752,291) | 21,752,291 | b | 21,752,291 |
| Total Investments (cost $2,204,833,077) | 100.0 | % | 2,839,099,547 |
| Cash and Receivables (Net) | .0 | % | 339,575 |
| Net Assets | 100.0 | % | 2,839,439,122 |
ETF—Exchange-Traded Fund
| |
| a | Non-income producing security. |
| b | Investment in affiliated money market mutual fund. |
| | | |
| Portfolio Summary (Unaudited)† | | |
| |
| | Value (%) | | Value (%) |
| Diversified Financials | 17.3 | Insurance | 3.1 |
| Technology Hardware & Equipment | 13.1 | Real Estate | 2.7 |
| Capital Goods | 12.8 | Transportation | 2.2 |
| Pharmaceuticals, | | Consumer Durables & Apparel | 1.8 |
| Biotech & Life Sciences | 8.4 | Commercial & Professional Services | 1.4 |
| Health Care Equipment & Services | 7.0 | Exchange-Traded Funds | 1.2 |
| Materials | 6.7 | Utilities | 1.1 |
| Energy | 5.8 | Media | .9 |
| Banks | 5.6 | Money Market Investment | .8 |
| Automobiles & Components | 3.5 | Software & Services | .8 |
| Semiconductors & | | Retailing | .6 |
| Semiconductor Equipment | 3.2 | | 100.0 |
| |
| † Based on net assets. | | | |
| See notes to financial statements. | | | |
12
|
| STATEMENT OF ASSETS AND LIABILITIES |
| August 31, 2014 |
| | | | |
| | | | Cost | Value |
| Assets ($): | | | | |
| Investments in securities—See Statement of Investments: | | | |
| Unaffiliated issuers | | 2,183,080,786 2,817,347,256 |
| Affiliated issuers | | | 21,752,291 | 21,752,291 |
| Cash | | | | 7,287,421 |
| Dividends receivable | | | | 3,331,072 |
| Receivable for shares of Common Stock subscribed | | | 1,662,906 |
| Prepaid expenses | | | | 79,349 |
| | | | 2,851,460,295 |
| Liabilities ($): | | | | |
| Due to The Dreyfus Corporation and affiliates—Note 3(c) | | | 2,228,280 |
| Payable for shares of Common Stock redeemed | | | 9,088,334 |
| Accrued expenses | | | | 704,559 |
| | | | | 12,021,173 |
| Net Assets ($) | | | 2,839,439,122 |
| Composition of Net Assets ($): | | | | |
| Paid-in capital | | | 2,033,562,171 |
| Accumulated undistributed investment income—net | | | 4,982,126 |
| Accumulated net realized gain (loss) on investments | | | 166,628,355 |
| Accumulated net unrealized appreciation | | | |
| (depreciation) on investments | | | | 634,266,470 |
| Net Assets ($) | | | 2,839,439,122 |
| |
| |
| Net Asset Value Per Share | | | | |
| | Class A | Class C | Class I | Class Y |
| Net Assets ($) | 1,417,535,350 114,179,313 | 1,282,577,703 | 25,146,756 |
| Shares Outstanding | 32,834,204 | 2,815,702 | 29,821,791 | 583,114 |
| Net Asset Value Per Share ($) | 43.17 | 40.55 | 43.01 | 43.12 |
| See notes to financial statements. | | | | |
The Fund 13
| | |
| STATEMENT OF OPERATIONS | | |
| Year Ended August 31, 2014 | | |
| |
| |
| |
| |
| Investment Income ($): | | |
| Income: | | |
| Cash dividends (net of $56,254 foreign taxes withheld at source): | | |
| Unaffiliated issuers | 31,667,820 | |
| Affiliated issuers | 22,836 | |
| Income from securities lending—Note 1(b) | 8,525 | |
| Interest | 4,588 | |
| Total Income | 31,703,769 | |
| Expenses: | | |
| Management fee—Note 3(a) | 18,713,441 | |
| Shareholder servicing costs—Note 3(c) | 6,390,627 | |
| Distribution fees—Note 3(b) | 620,560 | |
| Prospectus and shareholders’ reports | 188,882 | |
| Directors’ fees and expenses—Note 3(d) | 179,458 | |
| Registration fees | 171,493 | |
| Professional fees | 118,272 | |
| Custodian fees—Note 3(c) | 111,940 | |
| Loan commitment fees—Note 2 | 22,175 | |
| Interest expense—Note 2 | 6,890 | |
| Miscellaneous | 45,398 | |
| Total Expenses | 26,569,136 | |
| Less—reduction in fees due to earnings credits—Note 3(c) | (556 | ) |
| Net Expenses | 26,568,580 | |
| Investment Income—Net | 5,135,189 | |
| Realized and Unrealized Gain (Loss) on Investments—Note 4 ($): | | |
| Net realized gain (loss) on investments | 237,409,389 | |
| Net unrealized appreciation (depreciation) on investments | 280,671,141 | |
| Net Realized and Unrealized Gain (Loss) on Investments | 518,080,530 | |
| Net Increase in Net Assets Resulting from Operations | 523,215,719 | |
| |
| See notes to financial statements. | | |
14
STATEMENT OF CHANGES IN NET ASSETS
| | | | |
| | Year Ended August 31, | |
| | 2014 | | 2013 | a |
| Operations ($): | | | | |
| Investment income—net | 5,135,189 | | 1,819,759 | |
| Net realized gain (loss) on investments | 237,409,389 | | 208,288,105 | |
| Net unrealized appreciation | | | | |
| (depreciation) on investments | 280,671,141 | | 177,407,747 | |
| Net Increase (Decrease) in Net Assets | | | | |
| Resulting from Operations | 523,215,719 | | 387,515,611 | |
| Dividends to Shareholders from ($): | | | | |
| Investment income—net: | | | | |
| Class A | — | | (2,250,632 | ) |
| Class I | (1,802,406 | ) | (712,158 | ) |
| Class Y | (3 | ) | — | |
| Net realized gain on investments: | | | | |
| Class A | (118,254,358 | ) | — | |
| Class C | (6,774,704 | ) | — | |
| Class I | (100,906,266 | ) | — | |
| Class Y | (114 | ) | — | |
| Total Dividends | (227,737,851 | ) | (2,962,790 | ) |
| Capital Stock Transactions ($): | | | | |
| Net proceeds from shares sold: | | | | |
| Class A | 565,392,684 | | 586,026,538 | |
| Class C | 64,484,510 | | 23,028,774 | |
| Class I | 405,469,244 | | 709,035,073 | |
| Class Y | 25,495,371 | | 1,000 | |
| Dividends reinvested: | | | | |
| Class A | 108,498,885 | | 2,144,543 | |
| Class C | 5,275,653 | | — | |
| Class I | 96,941,746 | | 643,459 | |
| Cost of shares redeemed: | | | | |
| Class A | (490,387,885 | ) | (775,639,557 | ) |
| Class C | (10,847,723 | ) | (5,648,963 | ) |
| Class I | (207,643,551 | ) | (98,634,591 | ) |
| Class Y | (1,602,699 | ) | — | |
| Increase (Decrease) in Net Assets | | | | |
| from Capital Stock Transactions | 561,076,235 | | 440,956,276 | |
| Total Increase (Decrease) in Net Assets | 856,554,103 | | 825,509,097 | |
| Net Assets ($): | | | | |
| Beginning of Period | 1,982,885,019 | | 1,157,375,922 | |
| End of Period | 2,839,439,122 | | 1,982,885,019 | |
| Undistributed investment income—net | 4,982,126 | | 1,799,151 | |
The Fund 15
STATEMENT OF CHANGES IN NET ASSETS (continued)
| | | | |
| | Year Ended August 31, | |
| | 2014 | | 2013 | a |
| Capital Share Transactions: | | | | |
| Class Ab | | | | |
| Shares sold | 13,828,910 | | 17,059,067 | |
| Shares issued for dividends reinvested | 2,823,286 | | 67,523 | |
| Shares redeemed | (12,022,981 | ) | (22,163,606 | ) |
| Net Increase (Decrease) in Shares Outstanding | 4,629,215 | | (5,037,016 | ) |
| Class Cb | | | | |
| Shares sold | 1,668,532 | | 659,569 | |
| Shares issued for dividends reinvested | 145,335 | | — | |
| Shares redeemed | (280,105 | ) | (176,151 | ) |
| Net Increase (Decrease) in Shares Outstanding | 1,533,762 | | 483,418 | |
| Class Ic | | | | |
| Shares sold | 9,890,087 | | 19,936,580 | |
| Shares issued for dividends reinvested | 2,537,742 | | 20,369 | |
| Shares redeemed | (5,083,013 | ) | (2,763,470 | ) |
| Net Increase (Decrease) in Shares Outstanding | 7,344,816 | | 17,193,479 | |
| Class Yc | | | | |
| Shares sold | 621,470 | | 26.68 | |
| Shares redeemed | (38,383 | ) | — | |
| Net Increase (Decrease) in Shares Outstanding | 583,087 | | 26.68 | |
|
| a Effective July 1, 2013, the fund commenced offering ClassY shares. |
| b During the period ended August 31, 2013, 11,964 Class C shares representing $429,516 were |
| exchanged for 11,414 Class A shares. |
| c During the period ended August 31, 2014, 146,870 Class I shares representing $6,126,885 were exchanged for |
| 146,470 ClassY shares. |
See notes to financial statements.
16
FINANCIAL HIGHLIGHTS
The following tables describe the performance for each share class for the fiscal periods indicated. All information (except portfolio turnover rate) reflects financial results for a single fund share.Total return shows how much your investment in the fund would have increased (or decreased) during each period, assuming you had reinvested all dividends and distributions.These figures have been derived from the fund’s financial statements.
| | | | | | | | | |
| | | | Year Ended August 31, | | |
| Class A Shares | 2014 | | 2013 | | 2012 | | 2011 | 2010 | |
| Per Share Data ($): | | | | | | | | | |
| Net asset value, | | | | | | | | | |
| beginning of period | 38.27 | | 29.47 | | 31.19 | | 26.65 | 24.03 | |
| Investment Operations: | | | | | | | | | |
| Investment income (loss)—neta | .05 | | .03 | | .07 | | .22 | (.01 | ) |
| Net realized and unrealized | | | | | | | | | |
| gain (loss) on investments | 9.10 | | 8.83 | | 3.34 | | 4.32 | 2.70 | b |
| Total from Investment Operations | 9.15 | | 8.86 | | 3.41 | | 4.54 | 2.69 | |
| Distributions: | | | | | | | | | |
| Dividends from | | | | | | | | | |
| investment income—net | — | | (.06 | ) | (.23 | ) | — | (.07 | ) |
| Dividends from net realized | | | | | | | | | |
| gain on investments | (4.25 | ) | — | | (4.90 | ) | — | — | |
| Total Distributions | (4.25 | ) | (.06 | ) | (5.13 | ) | — | (.07 | ) |
| Net asset value, end of period | 43.17 | | 38.27 | | 29.47 | | 31.19 | 26.65 | |
| Total Return (%)c | 25.32 | | 30.11 | | 13.44 | | 17.03 | 11.20 | |
| Ratios/Supplemental Data (%): | | | | | | | | | |
| Ratio of total expenses | | | | | | | | | |
| to average net assets | 1.15 | | 1.18 | | 1.22 | | 1.17 | 1.18 | |
| Ratio of net expenses | | | | | | | | | |
| to average net assets | 1.15 | | 1.18 | | 1.22 | | 1.17 | 1.18 | |
| Ratio of net investment income | | | | | | | | | |
| (loss) to average net assets | .12 | | .08 | | .25 | | .64 | (.02 | ) |
| Portfolio Turnover Rate | 67.49 | | 91.31 | | 71.25 | | 114.02 | 122.17 | |
| Net Assets, end of period | | | | | | | | | |
| ($ x 1,000) | 1,417,535 | | 1,079,346 | | 979,628 | | 1,057,495 | 1,068,338 | |
|
| a Based on average shares outstanding. |
| b Amount includes litigation proceeds received by the fund amounting to $.02 per share. |
| c Exclusive of sales charge. |
See notes to financial statements.
The Fund 17
FINANCIAL HIGHLIGHTS (continued)
| | | | | | | | | | |
| | | | Year Ended August 31, | | | |
| Class C Shares | 2014 | | 2013 | | 2012 | | 2011 | | 2010 | |
| Per Share Data ($): | | | | | | | | | | |
| Net asset value, | | | | | | | | | | |
| beginning of period | 36.44 | | 28.22 | | 30.24 | | 26.05 | | 23.72 | |
| Investment Operations: | | | | | | | | | | |
| Investment (loss)—neta | (.26 | ) | (.24 | ) | (.16 | ) | (.16 | ) | (.23 | ) |
| Net realized and unrealized | | | | | | | | | | |
| gain (loss) on investments | 8.62 | | 8.46 | | 3.20 | | 4.35 | | 2.67 | b |
| Total from Investment Operations | 8.36 | | 8.22 | | 3.04 | | 4.19 | | 2.44 | |
| Distributions: | | | | | | | | | | |
| Dividends from | | | | | | | | | | |
| investment income—net | — | | — | | (.16 | ) | — | | (.11 | ) |
| Dividends from net realized | | | | | | | | | | |
| gain on investments | (4.25 | ) | — | | (4.90 | ) | — | | — | |
| Total Distributions | (4.25 | ) | — | | (5.06 | ) | — | | (.11 | ) |
| Net asset value, end of period | 40.55 | | 36.44 | | 28.22 | | 30.24 | | 26.05 | |
| Total Return (%)c | 24.35 | | 29.13 | | 12.48 | | 16.09 | | 10.29 | |
| Ratios/Supplemental Data (%): | | | | | | | | | | |
| Ratio of total expenses | | | | | | | | | | |
| to average net assets | 1.92 | | 1.97 | | 2.03 | | 2.00 | | 2.02 | |
| Ratio of net expenses | | | | | | | | | | |
| to average net assets | 1.92 | | 1.97 | | 2.03 | | 2.00 | | 2.02 | |
| Ratio of net investment (loss) | | | | | | | | | | |
| to average net assets | (.66 | ) | (.72 | ) | (.56 | ) | (.48 | ) | (.83 | ) |
| Portfolio Turnover Rate | 67.49 | | 91.31 | | 71.25 | | 114.02 | | 122.17 | |
| Net Assets, end of period ($ x 1,000) | 114,179 | | 46,708 | | 22,538 | | 22,343 | | 5,218 | |
|
| a Based on average shares outstanding. |
| b Amount includes litigation proceeds received by the fund amounting to $.02 per share. |
| c Exclusive of sales charge. |
See notes to financial statements.
18
| | | | | | | | | |
| | | | Year Ended August 31, | | |
| Class I Shares | 2014 | | 2013 | | 2012 | | 2011 | 2010 | |
| Per Share Data ($): | | | | | | | | | |
| Net asset value, | | | | | | | | | |
| beginning of period | 38.12 | | 29.38 | | 31.21 | | 26.61 | 23.98 | |
| Investment Operations: | | | | | | | | | |
| Investment income—neta | .15 | | .10 | | .14 | | .18 | .10 | |
| Net realized and unrealized | | | | | | | | | |
| gain (loss) on investments | 9.07 | | 8.77 | | 3.32 | | 4.42 | 2.69 | b |
| Total from Investment Operations | 9.22 | | 8.87 | | 3.46 | | 4.60 | 2.79 | |
| Distributions: | | | | | | | | | |
| Dividends from | | | | | | | | | |
| investment income—net | (.08 | ) | (.13 | ) | (.39 | ) | — | (.16 | ) |
| Dividends from net realized | | | | | | | | | |
| gain on investments | (4.25 | ) | — | | (4.90 | ) | — | — | |
| Total Distributions | (4.33 | ) | (.13 | ) | (5.29 | ) | — | (.16 | ) |
| Net asset value, end of period | 43.01 | | 38.12 | | 29.38 | | 31.21 | 26.61 | |
| Total Return (%) | 25.62 | | 30.26 | | 13.71 | | 17.29 | 11.64 | |
| Ratios/Supplemental Data (%): | | | | | | | | | |
| Ratio of total expenses | | | | | | | | | |
| to average net assets | .90 | | .97 | | 1.00 | | .96 | .84 | |
| Ratio of net expenses | | | | | | | | | |
| to average net assets | .90 | | .97 | | 1.00 | | .96 | .84 | |
| Ratio of net investment income | | | | | | | | | |
| to average net assets | .37 | | .27 | | .48 | | .53 | .38 | |
| Portfolio Turnover Rate | 67.49 | | 91.31 | | 71.25 | | 114.02 | 122.17 | |
| Net Assets, end of period ($ x 1,000) | 1,282,578 | | 856,830 | | 155,210 | | 80,041 | 16,691 | |
|
| a Based on average shares outstanding. |
| b Amount includes litigation proceeds received by the fund amounting to $.02 per share. |
See notes to financial statements.
The Fund 19
FINANCIAL HIGHLIGHTS (continued)
| | | | |
| | Year Ended August 31, | |
| Class Y Shares | 2014 | | 2013 | a |
| Per Share Data ($): | | | | |
| Net asset value, beginning of period | 38.12 | | 37.48 | |
| Investment Operations: | | | | |
| Investment income—netb | .19 | | .02 | |
| Net realized and unrealized | | | | |
| gain (loss) on investments | 9.17 | | .62 | |
| Total from Investment Operations | 9.36 | | .64 | |
| Distributions: | | | | |
| Dividends from investment income—net | (.11 | ) | — | |
| Dividends from net realized gain on investments | (4.25 | ) | — | |
| Total Distributions | (4.36 | ) | — | |
| Net asset value, end of period | 43.12 | | 38.12 | |
| Total Return (%) | 26.02 | | 1.74 | c |
| Ratios/Supplemental Data (%): | | | | |
| Ratio of total expenses to average net assets | .83 | | .80 | d |
| Ratio of net expenses to average net assets | .83 | | .80 | d |
| Ratio of net investment income | | | | |
| to average net assets | .50 | | .33 | d |
| Portfolio Turnover Rate | 67.49 | | 91.31 | |
| Net Assets, end of period ($ x 1,000) | 25,147 | | 1 | |
| |
| a | From July 1, 2013 (commencement of initial offering) to August 31, 2013. |
| b | Based on average shares outstanding. |
| c | Not annualized. |
| d | Annualized. |
See notes to financial statements.
20
NOTES TO FINANCIAL STATEMENTS
NOTE 1—Significant Accounting Policies:
Dreyfus Opportunistic Midcap Value Fund (the “fund”) is a separate diversified series of Advantage Funds, Inc. (the “Company”), which is registered under the Investment Company Act of 1940, as amended (the “Act”), as an open-end management investment company and operates as a series company currently offering eleven series, including the fund. The fund’s investment objective seeks to surpass the performance of the Russell Midcap® Value Index. The Dreyfus Corporation (the “Manager” or “Dreyfus”), a wholly-owned subsidiary of The Bank of New York Mellon Corporation (“BNY Mellon”), serves as the fund’s investment adviser.
MBSC Securities Corporation (the “Distributor”), a wholly-owned subsidiary of the Manager, is the distributor of the fund’s shares.The fund is authorized to issue 700 million shares of $.001 par value Common Stock. The fund currently offers four classes of shares: Class A (350 million shares authorized), Class C (125 million shares authorized), Class I (125 million shares authorized) and Class Y (100 million shares authorized). Class A shares generally are subject to a sales charge imposed at the time of purchase. Class C shares are subject to a contingent deferred sales charge (“CDSC”) imposed on Class C shares redeemed within one year of purchase. Class I and Class Y shares are sold at net asset value per share generally to institutional investors. Other differences between the classes include the services offered to and the expenses borne by each class, the allocation of certain transfer agency costs, and certain voting rights. Income, expenses (other than expenses attributable to a specific class), and realized and unrealized gains or losses on investments are allocated to each class of shares based on its relative net assets.
The Company accounts separately for the assets, liabilities and operations of each series. Expenses directly attributable to each series are charged to that series’ operations; expenses which are applicable to all series are allocated among them on a pro rata basis.
The Financial Accounting Standards Board (“FASB”) Accounting Standards Codification is the exclusive reference of authoritative U.S. generally accepted accounting principles (“GAAP”) recognized by the
The Fund 21
NOTES TO FINANCIAL STATEMENTS (continued)
FASB to be applied by nongovernmental entities. Rules and interpretive releases of the Securities and Exchange Commission (“SEC”) under authority of federal laws are also sources of authoritative GAAP for SEC registrants. The fund’s financial statements are prepared in accordance with GAAP, which may require the use of management estimates and assumptions. Actual results could differ from those estimates.
The Company enters into contracts that contain a variety of indemnifications. The fund’s maximum exposure under these arrangements is unknown.The fund does not anticipate recognizing any loss related to these arrangements.
(a) Portfolio valuation: The fair value of a financial instrument is the amount that would be received to sell an asset or paid to transfer a liability in an orderly transaction between market participants at the measurement date (i.e., the exit price). GAAP establishes a fair value hierarchy that prioritizes the inputs of valuation techniques used to measure fair value. This hierarchy gives the highest priority to unadjusted quoted prices in active markets for identical assets or liabilities (Level 1 measurements) and the lowest priority to unobservable inputs (Level 3 measurements).
Additionally, GAAP provides guidance on determining whether the volume and activity in a market has decreased significantly and whether such a decrease in activity results in transactions that are not orderly. GAAP requires enhanced disclosures around valuation inputs and techniques used during annual and interim periods.
Various inputs are used in determining the value of the fund’s investments relating to fair value measurements.These inputs are summarized in the three broad levels listed below:
Level 1—unadjusted quoted prices in active markets for identical investments.
Level 2—other significant observable inputs (including quoted prices for similar investments, interest rates, prepayment speeds, credit risk, etc.).
Level 3—significant unobservable inputs (including the fund’s own assumptions in determining the fair value of investments).
22
The inputs or methodology used for valuing securities are not necessarily an indication of the risk associated with investing in those securities.
Changes in valuation techniques may result in transfers in or out of an assigned level within the disclosure hierarchy. Valuation techniques used to value the fund’s investments are as follows:
Investments in securities are valued at the last sales price on the securities exchange or national securities market on which such securities are primarily traded. Securities listed on the National Market System for which market quotations are available are valued at the official closing price or, if there is no official closing price that day, at the last sales price. Securities not listed on an exchange or the national securities market, or securities for which there were no transactions, are valued at the average of the most recent bid and asked prices, except for open short positions, where the asked price is used for valuation purposes. Bid price is used when no asked price is available. Registered investment companies that are not traded on an exchange are valued at their net asset value. All of the preceding securities are generally categorized within Level 1 of the fair value hierarchy.
Fair valuing of securities may be determined with the assistance of a pricing service using calculations based on indices of domestic securities and other appropriate indicators, such as prices of relevant American Depository Receipts and financial futures. Utilizing these techniques may result in transfers between Level 1 and Level 2 of the fair value hierarchy.
When market quotations or official closing prices are not readily available, or are determined not to reflect accurately fair value, such as when the value of a security has been significantly affected by events after the close of the exchange or market on which the security is principally traded (for example, a foreign exchange or market), but before the fund calculates its net asset value, the fund may value these investments at fair value as determined in accordance with the procedures approved by the Company’s Board of Directors (the “Board”). Certain factors may be considered when fair valuing investments such
The Fund 23
NOTES TO FINANCIAL STATEMENTS (continued)
as: fundamental analytical data, the nature and duration of restrictions on disposition, an evaluation of the forces that influence the market in which the securities are purchased and sold, and public trading in similar securities of the issuer or comparable issuers. These securities are either categorized within Level 2 or 3 of the fair value hierarchy depending on the relevant inputs used.
For restricted securities where observable inputs are limited, assumptions about market activity and risk are used and are generally categorized within Level 3 of the fair value hierarchy.
The following is a summary of the inputs used as of August 31, 2014 in valuing the fund’s investments:
| | | | | |
| | | | Level 2—Other | Level 3— | |
| | | Level 1— | Significant | Significant | |
| | | Unadjusted | Observable | Unobservable | |
| | | Quoted Prices | Inputs | Inputs | Total |
| Assets ($) | | | | | |
| Investments in Securities: | | | |
| Equity Securities— | | | | |
| Domestic | | | | | |
| Common | | | | | |
| Stocks† | 2,711,302,200 | — | — | 2,711,302,200 |
| Equity Securities— | | | | |
| Foreign | | | | | |
| Common Stocks† | 72,487,371 | — | — | 72,487,371 |
| Exchange- | | | | | |
| Traded Funds | 33,557,685 | — | — | 33,557,685 |
| Mutual Funds | | 21,752,291 | — | — | 21,752,291 |
| |
| † See Statement of Investments for additional detailed categorizations. | |
At August 31, 2014, there were no transfers between Level 1 and Level 2 of the fair value hierarchy.
(b) Securities transactions and investment income: Securities transactions are recorded on a trade date basis. Realized gains and losses from securities transactions are recorded on the identified cost basis. Dividend income is recognized on the ex-dividend date and interest income, including, where applicable, accretion of discount and amortization of premium on investments, is recognized on the accrual basis.
24
Pursuant to a securities lending agreement with The Bank of New York Mellon, a subsidiary of BNY Mellon and an affiliate of Dreyfus, the fund may lend securities to qualified institutions. It is the fund’s policy that, at origination, all loans are secured by collateral of at least 102% of the value of U.S. securities loaned and 105% of the value of foreign securities loaned. Collateral equivalent to at least 100% of the market value of securities on loan is maintained at all times. Collateral is either in the form of cash, which can be invested in certain money market mutual funds managed by the Manager or U.S. Government and Agency securities. The fund is entitled to receive all dividends, interest and distributions on securities loaned, in addition to income earned as a result of the lending transaction. Should a borrower fail to return the securities in a timely manner, The Bank of New York Mellon is required to replace the securities for the benefit of the fund or credit the fund with the market value of the unreturned securities and is subrogated to the fund’s rights against the borrower and the collateral. During the period ended August 31, 2014, The Bank of New York Mellon earned $1,830 from lending portfolio securities, pursuant to the securities lending agreement.
(c) Affiliated issuers: Investments in other investment companies advised by Dreyfus are defined as “affiliated” under the Act. Investments in affiliated investment companies during the period ended August 31, 2014 were as follows:
| | | | | |
| Affiliated | | | | | |
| Investment | Value | | | Value | Net |
| Company | 8/31/2013 ($) | Purchases ($) | Sales ($) | 8/31/2014 ($) | Assets (%) |
| Dreyfus | | | | | |
| Institutional | | | | | |
| Preferred | | | | | |
| Plus Money | | | | | |
| Market | | | | | |
| Fund | 5,483,034 | 798,861,310 | 782,592,053 | 21,752,291 | .8 |
| Dreyfus | | | | | |
| Institutional | | | | | |
| Cash | | | | | |
| Advantage | | | | | |
| Fund | 21,355,497 | 104,197,682 | 125,553,179 | — | — |
| Total | 26,838,531 | 903,058,992 | 908,145,232 | 21,752,291 | .8 |
The Fund 25
NOTES TO FINANCIAL STATEMENTS (continued)
(d) Dividends to shareholders: Dividends are recorded on the ex-dividend date. Dividends from investment income-net and dividends from net realized capital gains, if any, are normally declared and paid annually, but the fund may make distributions on a more frequent basis to comply with the distribution requirements of the Internal Revenue Code of 1986, as amended (the “Code”). To the extent that net realized capital gains can be offset by capital loss carryovers, it is the policy of the fund not to distribute such gains. Income and capital gain distributions are determined in accordance with income tax regulations, which may differ from GAAP.
(e) Federal income taxes: It is the policy of the fund to continue to qualify as a regulated investment company, if such qualification is in the best interests of its shareholders, by complying with the applicable provisions of the Code, and to make distributions of taxable income sufficient to relieve it from substantially all federal income and excise taxes.
As of and during the period ended August 31, 2014, the fund did not have any liabilities for any uncertain tax positions.The fund recognizes interest and penalties, if any, related to uncertain tax positions as income tax expense in the Statement of Operations. During the period ended August 31, 2014, the fund did not incur any interest or penalties.
Each tax year in the four-year period ended August 31, 2014 remains subject to examination by the Internal Revenue Service and state taxing authorities.
At August 31, 2014, the components of accumulated earnings on a tax basis were as follows: undistributed ordinary income $68,445,484, undistributed capital gains $110,252,581 and unrealized appreciation $627,178,886.
The tax character of distributions paid to shareholders during the fiscal periods ended August 31, 2014 and August 31, 2013 were as follows: ordinary income $27,301,657 and $2,962,790, and long-term capital gains $200,436,194 and $0, respectively.
26
During the period ended August 31, 2014, as a result of permanent book to tax differences, primarily due to the tax treatment for limited partnerships, the fund decreased accumulated undistributed investment income-net by $149,805 and increased accumulated net realized gain (loss) on investments by the same amount. Net assets and net asset value per share were not affected by this reclassification.
NOTE 2—Bank Lines of Credit:
The fund participates with other Dreyfus-managed funds in a $265 million unsecured credit facility led by Citibank, N.A. and a $300 million unsecured credit facility provided by The Bank of New York Mellon (each, a “Facility”), each to be utilized primarily for temporary or emergency purposes, including the financing of redemptions. Prior to October 9, 2013, the unsecured credit facility with Citibank, N.A. was $210 million. In connection therewith, the fund has agreed to pay its pro rata portion of commitment fees for each Facility. Interest is charged to the fund based on rates determined pursuant to the terms of the respective Facility at the time of borrowing.
The average amount of borrowings outstanding under the Facilities during the period ended August 31, 2014 was approximately $620,300 with a related weighted average annualized interest rate of 1.11%.
NOTE 3—Management Fee and Other Transactions with Affiliates:
(a) Pursuant to a management agreement with the Manager, the management fee is computed at the annual rate of .75% of the value of the fund’s average daily net assets and is payable monthly.
During the period ended August 31, 2014, the Distributor retained $142,496 from commissions earned on sales of the fund’s Class A shares and $19,720 from CDSCs on redemptions of the fund’s Class C shares.
The Fund 27
NOTES TO FINANCIAL STATEMENTS (continued)
(b) Under the Distribution Plan adopted pursuant to Rule 12b-1 under the Act, Class C shares pay the Distributor for distributing its shares at an annual rate of .75% of the value of its average daily net assets. During the period ended August 31, 2014, Class C shares were charged $620,560 pursuant to the Distribution Plan.
(c) Under the Shareholder Services Plan, Class A and Class C shares pay the Distributor at an annual rate of .25% of the value of their average daily net assets for the provision of certain services. The services provided may include personal services relating to shareholder accounts, such as answering shareholder inquiries regarding the fund and providing reports and other information, and services related to the maintenance of shareholder accounts. The Distributor may make payments to Service Agents (securities dealers, financial institutions or other industry professionals) with respect to these services. The Distributor determines the amounts to be paid to Service Agents. During the period ended August 31, 2014, Class A and Class C shares were charged $3,236,075 and $206,853, respectively, pursuant to the Shareholder Services Plan.
The fund has arrangements with the transfer agent and the custodian whereby the fund may receive earnings credits when positive cash balances are maintained, which are used to offset transfer agency and custody fees. For financial reporting purposes, the fund includes net earnings credits as an expense offset in the Statement of Operations.
The fund compensates Dreyfus Transfer, Inc., a wholly-owned subsidiary of the Manager, under a transfer agency agreement for providing transfer agency and cash management services for the fund. The majority of transfer agency fees are comprised of amounts paid on a per account basis, while cash management fees are related to fund subscriptions and redemptions. During the period ended August 31, 2014, the fund was
28
charged $116,091 for transfer agency services and $7,524 for cash management services.These fees are included in Shareholder servicing costs in the Statement of Operations. Cash management fees were partially offset by earnings credits of $555.
The fund compensates The Bank of NewYork Mellon under a custody agreement for providing custodial services for the fund.These fees are determined based on net assets, geographic region and transaction activity. During the period ended August 31, 2014, the fund was charged $111,940 pursuant to the custody agreement.
The fund compensated The Bank of New York Mellon under a cash management agreement that was in effect until September 30, 2013 for performing certain cash management services related to fund subscriptions and redemptions. During the period ended August 31, 2014, the fund was charged $189 pursuant to the cash management agreement, which is included in Shareholder servicing costs in the Statement of Operations.These fees were partially offset by earnings credits of $1.
During the period ended August 31, 2014, the fund was charged $8,296 for services performed by the Chief Compliance Officer and his staff.
The components of “Due to The Dreyfus Corporation and affiliates” in the Statement of Assets and Liabilities consist of: management fees $1,765,780, Distribution Plan fees $70,357, Shareholder Services Plan fees $320,261, custodian fees $42,443, Chief Compliance Officer fees $1,154 and transfer agency fees $28,285.
(d) Each Board member also serves as a Board member of other funds within the Dreyfus complex. Annual retainer fees and attendance fees are allocated to each fund based on net assets.
The Fund 29
NOTES TO FINANCIAL STATEMENTS (continued)
NOTE 4—Securities Transactions:
The aggregate amount of purchases and sales of investment securities, excluding short-term securities, during the period ended August 31, 2014, amounted to $1,971,011,594 and $1,658,600,858, respectively.
At August 31, 2014, the cost of investments for federal income tax purposes was $2,211,920,661; accordingly, accumulated net unrealized appreciation on investments was $627,178,886, consisting of $650,165,841 gross unrealized appreciation and $22,986,955 gross unrealized depreciation.
30
|
| REPORT OF INDEPENDENT REGISTERED |
| PUBLIC ACCOUNTING FIRM |
Shareholders and Board of Directors Dreyfus Opportunistic Midcap Value Fund
We have audited the accompanying statement of assets and liabilities, including the statement of investments, of Dreyfus Opportunistic Midcap Value Fund (one of the series comprising Advantage Funds, Inc.) as of August 31, 2014, and the related statement of operations for the year then ended, the statement of changes in net assets for each of the two years in the period then ended, and the financial highlights for each of the periods indicated therein. These financial statements and financial highlights are the responsibility of the Fund’s management. Our responsibility is to express an opinion on these financial statements and financial highlights based on our audits.
We conducted our audits in accordance with the standards of the Public Company Accounting Oversight Board (United States).Those standards require that we plan and perform the audit to obtain reasonable assurance about whether the financial statements and financial highlights are free of material misstatement.We were not engaged to perform an audit of the Fund’s internal control over financial reporting. Our audits included consideration of internal control over financial reporting as a basis for designing audit procedures that are appropriate in the circumstances, but not for the purpose of expressing an opinion on the effectiveness of the Fund’s internal control over financial reporting. Accordingly, we express no such opinion. An audit also includes examining, on a test basis, evidence supporting the amounts and disclosures in the financial statements and financial highlights, assessing the accounting principles used and significant estimates made by management, and evaluating the overall financial statement presentation. Our procedures included confirmation of securities owned as of August 31, 2014 by correspondence with the custodian and others. We believe that our audits provide a reasonable basis for our opinion.
In our opinion, the financial statements and financial highlights referred to above present fairly, in all material respects, the financial position of Dreyfus Opportunistic Midcap Value Fund at August 31, 2014, the results of its operations for the year then ended, the changes in its net assets for each of the two years in the period then ended, and the financial highlights for each of the indicated periods, in conformity with U.S. generally accepted accounting principles.

New York, New York
October 28, 2014
The Fund 31
IMPORTANT TAX INFORMATION (Unaudited)
For federal tax purposes, the fund hereby reports 62.44% of the ordinary dividends paid during the fiscal year ended August 31, 2014 as qualifying for the corporate dividends received deduction. Also, certain dividends paid by the fund may be subject to a maximum tax rate of 15%, as provided for by the Jobs and Growth Tax Relief Reconciliation Act of 2003. Of the distributions paid during the fiscal year, $27,301,657 represents the maximum amount that may be considered qualified dividend income. The fund also hereby reports $.4802 per share as a short-term capital gain distribution and $3.7746 per share as a long-term capital gain distribution paid on December 4, 2013. Shareholders will receive notification in early 2015 of the percentage applicable to the preparation of their 2014 income tax returns.
32
|
| INFORMATION ABOUT THE RENEWAL OF THE |
| FUND’S MANAGEMENT AGREEMENT (Unaudited) |
At a meeting of the fund’s Board of Directors held on March 4-5, 2014, the Board considered the renewal of the fund’s Management Agreement pursuant to which Dreyfus provides the fund with investment advisory and administrative services (the “Agreement”). The Board members, none of whom are “interested persons” (as defined in the Investment Company Act of 1940, as amended) of the fund, were assisted in their review by independent legal counsel and met with counsel in executive session separate from Dreyfus representatives. In considering the renewal of the Agreement, the Board considered all factors that it believed to be relevant, including those discussed below.The Board did not identify any one factor as dispositive, and each Board member may have attributed different weights to the factors considered.
Analysis of Nature, Extent, and Quality of Services Provided to the Fund. The Board considered information provided to them at the meeting and in previous presentations from Dreyfus representatives regarding the nature, extent, and quality of the services provided to funds in the Dreyfus fund complex. Dreyfus provided the number of open accounts in the fund, the fund’s asset size and the allocation of fund assets among distribution channels. Dreyfus also had previously provided information regarding the diverse intermediary relationships and distribution channels of funds in the Dreyfus fund complex (such as retail direct or intermediary, in which intermediaries typically are paid by the fund and/or Dreyfus) and Dreyfus’ corresponding need for broad, deep, and diverse resources to be able to provide ongoing shareholder services to each intermediary or distribution channel, as applicable to the fund.
The Board also considered research support available to, and portfolio management capabilities of, the fund’s portfolio management personnel and that Dreyfus also provides oversight of day-to-day fund operations, including fund accounting and administration and assistance in meeting legal and regulatory requirements. The Board also considered Dreyfus’ extensive administrative, accounting, and compliance infrastructures.
The Fund 33
|
| INFORMATION ABOUT THE RENEWAL OF THE FUND’S |
| MANAGEMENT AGREEMENT (Unaudited) (continued) |
The Board also considered portfolio management’s brokerage policies and practices (including policies and practices regarding soft dollars) and the standards applied in seeking best execution.
Comparative Analysis of the Fund’s Performance and Management Fee and Expense Ratio. The Board reviewed reports prepared by Lipper, Inc. (“Lipper”), an independent provider of investment company data, which included information comparing (1) the fund’s performance with the performance of a group of comparable funds (the “Performance Group”) and with a broader group of funds (the “Performance Universe”), all for various periods ended December 31, 2013, and (2) the fund’s actual and contractual management fees and total expenses with those of a group of comparable funds (the “Expense Group”) and with a broader group of funds (the “Expense Universe”), the information for which was derived in part from fund financial statements available to Lipper as of the date of its analysis. Dreyfus previously had furnished the Board with a description of the methodology Lipper used to select the Performance Group and Performance Universe and the Expense Group and Expense Universe.
Dreyfus representatives stated that the usefulness of performance comparisons may be affected by a number of factors, including different investment limitations that may be applicable to the fund and comparison funds.The Board discussed the results of the comparisons and noted that the fund’s total return performance was above the Performance Group and Performance Universe medians for all periods, ranking first in the Performance Group for three of the six periods and ranking in the first quartile of the Performance Universe in all periods. Dreyfus also provided a comparison of the fund’s calendar year total returns to the returns of the fund’s benchmark index.
The Board also reviewed the range of actual and contractual management fees and total expenses of the Expense Group and Expense Universe funds and discussed the results of the comparisons. The Board noted that the fund’s contractual management fee was below the Expense Group median, the fund’s actual management fee was at
34
the Expense Group median and above the Expense Universe median and the fund’s total expenses were below the Expense Group and Expense Universe medians.
Dreyfus representatives reviewed with the Board the management or investment advisory fees (1) paid by funds advised or administered by Dreyfus that are in the same Lipper category as the fund and (2) paid to Dreyfus or the Dreyfus-affiliated primary employer of the fund’s primary portfolio manager(s) for advising any separate accounts and/or other types of client portfolios that are considered to have similar investment strategies and policies as the fund (the “Similar Clients”), and explained the nature of the Similar Clients. They discussed differences in fees paid and the relationship of the fees paid in light of any differences in the services provided and other relevant factors. The Board considered the relevance of the fee information provided for the Similar Clients to evaluate the appropriateness and reasonableness of the fund’s management fee.
Analysis of Profitability and Economies of Scale. Dreyfus representatives reviewed the expenses allocated and profit received by Dreyfus and the resulting profitability percentage for managing the fund and the aggregate profitability percentage to Dreyfus of managing the funds in the Dreyfus fund complex, and the method used to determine the expenses and profit. The Board concluded that the profitability results were not unreasonable, given the services rendered and service levels provided by Dreyfus. The Board also had been provided with information prepared by an independent consulting firm regarding Dreyfus’ approach to allocating costs to, and determining the profitability of, individual funds and the entire Dreyfus fund complex.The consulting firm also had analyzed where any economies of scale might emerge in connection with the management of a fund.
The Board considered on the advice of its counsel the profitability analysis (1) as part of its evaluation of whether the fees under the Agreement bear a reasonable relationship to the mix of services pro-
The Fund 35
|
| INFORMATION ABOUT THE RENEWAL OF THE FUND’S |
| MANAGEMENT AGREEMENT (Unaudited) (continued) |
vided by Dreyfus, including the nature, extent and quality of such services, and (2) in light of the relevant circumstances for the fund and the extent to which economies of scale would be realized if the fund grows and whether fee levels reflect these economies of scale for the benefit of fund shareholders. Dreyfus representatives also noted that, as a result of shared and allocated costs among funds in the Dreyfus fund complex, the extent of economies of scale could depend substantially on the level of assets in the complex as a whole, so that increases and decreases in complex-wide assets can affect potential economies of scale in a manner that is disproportionate to, or even in the opposite direction from, changes in the fund’s asset level. The Board also considered potential benefits to Dreyfus from acting as investment adviser and noted the soft dollar arrangements in effect for trading the fund’s investments.
At the conclusion of these discussions, the Board agreed that it had been furnished with sufficient information to make an informed business decision with respect to the renewal of the Agreement. Based on the discussions and considerations as described above, the Board concluded and determined as follows.
The Board concluded that the nature, extent and quality of the services provided by Dreyfus are adequate and appropriate.
The Board was satisfied with the fund’s performance.
The Board concluded that the fee paid to Dreyfus was reasonable in light of the considerations described above.
The Board determined that the economies of scale which may accrue to Dreyfus and its affiliates in connection with the management of the fund had been adequately considered by Dreyfus in connection with the fee rate charged to the fund pursuant to the Agreement and that, to the extent in the future it were determined that material economies of scale had not been shared with the fund, the Board would seek to have those economies of scale shared with the fund.
36
In evaluating the Agreement, the Board considered these conclusions and determinations and also relied on its previous knowledge, gained through meetings and other interactions with Dreyfus and its affiliates, of the fund and the services provided to the fund by Dreyfus. The Board also relied on information received on a routine and regular basis throughout the year relating to the operations of the fund and the investment management and other services provided under the Agreement, including information on the investment performance of the fund in comparison to similar mutual funds and benchmark performance indices; general market outlook as applicable to the fund; and compliance reports. In addition, the Board’s consideration of the contractual fee arrangements for this fund had the benefit of a number of years of reviews of prior or similar agreements during which lengthy discussions took place between the Board and Dreyfus representatives. Certain aspects of the arrangements may receive greater scrutiny in some years than in others, and the Board’s conclusions may be based, in part, on their consideration of the same or similar arrangements in prior years. The Board determined that renewal of the Agreement was in the best interests of the fund and its shareholders.
The Fund 37
|
| BOARD MEMBERS INFORMATION (Unaudited) |
| INDEPENDENT BOARD MEMBERS |
|
| Joseph S. DiMartino (70) |
| Chairman of the Board (1995) |
| Principal Occupation During Past 5Years: |
| • Corporate Director and Trustee (1995-present) |
| Other Public Company Board Memberships During Past 5Years: |
| • CBIZ (formerly, Century Business Services, Inc.), a provider of outsourcing functions for small |
| and medium size companies, Director (1997-present) |
| • The Newark Group, a provider of a national market of paper recovery facilities, paperboard |
| mills and paperboard converting plants, Director (2000-2010) |
| • Sunair Services Corporation, a provider of certain outdoor-related services to homes and |
| businesses, Director (2005-2009) |
| No. of Portfolios for which Board Member Serves: 142 |
| ——————— |
| Peggy C. Davis (71) |
| Board Member (2006) |
| Principal Occupation During Past 5Years: |
| • Shad Professor of Law, New York University School of Law (1983-present) |
| No. of Portfolios for which Board Member Serves: 52 |
| ——————— |
| David P. Feldman (74) |
| Board Member (1996) |
| Principal Occupation During Past 5Years: |
| • Corporate Director and Trustee (1985-present) |
| Other Public Company Board Membership During Past 5Years: |
| • BBH Mutual Funds Group (5 registered mutual funds), Director (1992-present) |
| No. of Portfolios for which Board Member Serves: 38 |
| ——————— |
| Ehud Houminer (74) |
| Board Member (1993) |
| Principal Occupation During Past 5Years: |
| • Executive-in-Residence at the Columbia Business School, Columbia University (1992-present) |
| Other Public Company Board Membership During Past 5Years: |
| • Avnet Inc., an electronics distributor, Director (1993-2012) |
| No. of Portfolios for which Board Member Serves: 62 |
38
| |
| | Lynn Martin (74) |
| | Board Member (2012) |
| | Principal Occupation During Past 5Years: |
| | • President of The Martin Hall Group LLC, a human resources consulting firm (2005-2012) |
| | Other Public Company Board Memberships During Past 5Years: |
| | • AT&T Inc., a telecommunications company, Director (1999-2012) |
| | • Ryder System, Inc., a supply chain and transportation management company, Director (1993-2012) |
| | • The Proctor & Gamble Co., a consumer products company, Director (1994-2009) |
| | • Constellation Energy Group Inc., Director (2003-2009) |
| | No. of Portfolios for which Board Member Serves: 38 |
| —————— |
| | Robin A. Melvin (50) |
| | Board Member (2012) |
| | Principal Occupation During Past 5Years: |
| | • Board Member, Illinois Mentoring Partnership, non-profit organization dedicated to increasing |
| | the quantity and quality of mentoring services in Illinois (2013-present) |
| | • Director, Boisi Family Foundation, a private family foundation that supports youth-serving |
| | organizations that promote the self sufficiency of youth from disadvantaged circumstances |
| | (1995-2012) |
| | No. of Portfolios for which Board Member Serves: 109 |
| —————— |
| | Dr. Martin Peretz (75) |
| | Board Member (2006) |
| | Principal Occupation During Past 5Years: |
| | • Editor-in-Chief Emeritus of The New Republic Magazine (2010-2011) (previously, |
| | Editor-in-Chief, 1974-2010) |
| | • Director of TheStreet.com, a financial information service on the web (1996-2010) |
| | No. of Portfolios for which Board Member Serves: 38 |
| —————— |
Once elected all Board Members serve for an indefinite term, but achieve Emeritus status upon reaching age 80.The address of the Board Members and Officers is c/o The Dreyfus Corporation, 200 Park Avenue, New York, New York 10166. Additional information about the Board Members is available in the fund’s Statement of Additional Information which can be obtained from Dreyfus free of charge by calling this toll free number: 1-800-DREYFUS.
James F. Henry, Emeritus Board Member
Dr. Paul A. Marks, Emeritus Board Member
Philip L.Toia, Emeritus Board Member
The Fund 39
OFFICERS OF THE FUND (Unaudited)
BRADLEY J. SKAPYAK, President since January 2010.
Chief Operating Officer and a director of the Manager since June 2009, Chairman of Dreyfus Transfer, Inc., an affiliate of the Manager and the transfer agent of the funds, since May 2011 and Executive Vice President of the Distributor since June 2007. From April 2003 to June 2009, Mr. Skapyak was the head of the Investment Accounting and Support Department of the Manager. He is an officer of 69 investment companies (comprised of 142 portfolios) managed by the Manager. He is 55 years old and has been an employee of the Manager since February 1988.
JOHN PAK, Chief Legal Officer since March 2013.
Deputy General Counsel, Investment Management, of BNY Mellon since August 2014; Chief Legal Officer of the Manager since August 2012; from March 2005 to July 2012, Managing Director of Deutsche Bank, Deputy Global Head of Deutsche Asset Management Legal and Regional Head of Deutsche Asset Management Americas Legal. He is an officer of 70 investment companies (comprised of 167 portfolios) managed by the Manager. He is 45 years old and has been an employee of the Manager since August 2012.
JANETTE E. FARRAGHER, Vice President and Secretary since December 2011.
Assistant General Counsel of BNY Mellon, and an officer of 70 investment companies (comprised of 167 portfolios) managed by the Manager. She is 51 years old and has been an employee of the Manager since February 1984.
KIESHA ASTWOOD, Vice President and Assistant Secretary since January 2010.
Counsel of BNY Mellon, and an officer of 70 investment companies (comprised of 167 portfolios) managed by the Manager. She is 41 years old and has been an employee of the Manager since July 1995.
JAMES BITETTO, Vice President and Assistant Secretary since August 2005.
Managing Counsel of BNY Mellon and Secretary of the Manager, and an officer of 70 investment companies (comprised of 167 portfolios) managed by the Manager. He is 48 years old and has been an employee of the Manager since December 1996.
JONI LACKS CHARATAN, Vice President and Assistant Secretary since August 2005.
Managing Counsel of BNY Mellon, and an officer of 70 investment companies (comprised of 167 portfolios) managed by the Manager. She is 58 years old and has been an employee of the Manager since October 1988.
JOSEPH M. CHIOFFI, Vice President and Assistant Secretary since August 2005.
Managing Counsel of BNY Mellon, and an officer of 70 investment companies (comprised of 167 portfolios) managed by the Manager. He is 52 years old and has been an employee of the Manager since June 2000.
JOHN B. HAMMALIAN, Vice President and Assistant Secretary since August 2005.
Senior Managing Counsel of BNY Mellon, and an officer of 70 investment companies (comprised of 167 portfolios) managed by the Manager. He is 51 years old and has been an employee of the Manager since February 1991.
SARAH S. KELLEHER, Vice President and Assistant Secretary since April 2014.
Senior Counsel of BNY Mellon, and an officer of 70 investment companies (comprised of 167 portfolios) managed by the Manager; from August 2005 to March 2013, Associate General Counsel of Third Avenue Management. She is 38 years old and has been an employee of the Manager since March 2013.
40
JEFF PRUSNOFSKY, Vice President and Assistant Secretary since August 2005.
Senior Managing Counsel of BNY Mellon, and an officer of 70 investment companies (comprised of 167 portfolios) managed by the Manager. He is 49 years old and has been an employee of the Manager since October 1990.
JAMES WINDELS, Treasurer since November 2001.
Director-Mutual Fund Accounting of the Manager, and an officer of 70 investment companies (comprised of 167 portfolios) managed by the Manager. He is 55 years old and has been an employee of the Manager since April 1985.
RICHARD CASSARO, Assistant Treasurer since January 2008.
Senior Accounting Manager – Money Market and Municipal Bond Funds of the Manager, and an officer of 70 investment companies (comprised of 167 portfolios) managed by the Manager. He is 55 years old and has been an employee of the Manager since September 1982.
GAVIN C. REILLY, Assistant Treasurer since December 2005.
Tax Manager of the Investment Accounting and Support Department of the Manager, and an officer of 70 investment companies (comprised of 167 portfolios) managed by the Manager. He is 46 years old and has been an employee of the Manager since April 1991.
ROBERT S. ROBOL, Assistant Treasurer since August 2005.
Senior Accounting Manager – Fixed Income Funds of the Manager, and an officer of 70 investment companies (comprised of 167 portfolios) managed by the Manager. He is 50 years old and has been an employee of the Manager since October 1988.
ROBERT SALVIOLO, Assistant Treasurer since July 2007.
Senior Accounting Manager – Equity Funds of the Manager, and an officer of 70 investment companies (comprised of 167 portfolios) managed by the Manager. He is 47 years old and has been an employee of the Manager since June 1989.
ROBERT SVAGNA, Assistant Treasurer since December 2002.
Senior Accounting Manager – Equity Funds of the Manager, and an officer of 70 investment companies (comprised of 167 portfolios) managed by the Manager. He is 47 years old and has been an employee of the Manager since November 1990.
JOSEPH W. CONNOLLY, Chief Compliance Officer since October 2004.
Chief Compliance Officer of the Manager and The Dreyfus Family of Funds (70 investment companies, comprised of 167 portfolios). He is 57 years old and has served in various capacities with the Manager since 1980, including manager of the firm’s Fund Accounting Department from 1997 through October 2001.
MATTHEW D. CONNOLLY, Anti-Money Laundering Compliance Officer since April 2012.
Anti-Money Laundering Compliance Officer of the Distributor since October 2011; from March 2010 to September 2011, Global Head, KYC Reviews and Director of UBS Investment Bank; until March 2010, AML Compliance Officer and Senior Vice President of Citi Global Wealth Management. He is an officer of 65 investment companies (comprised of 162 portfolios) managed by the Manager. He is 42 years old and has been an employee of the Distributor since October 2011.
The Fund 41
For More Information
Telephone Call your financial representative or 1-800-DREYFUS
Mail The Dreyfus Family of Funds, 144 Glenn Curtiss Boulevard, Uniondale, NY 11556-0144
The fund files its complete schedule of portfolio holdings with the Securities and Exchange Commission (“SEC”) for the first and third quarters of each fiscal year on Form N-Q. The fund’s Forms N-Q are available on the SEC’s website at http://www.sec.gov and may be reviewed and copied at the SEC’s Public Reference Room in Washington, DC. Information on the operation of the Public Reference Room may be obtained by calling 1-800-SEC-0330.
A description of the policies and procedures that the fund uses to determine how to vote proxies relating to portfolio securities, and information regarding how the fund voted these proxies for the most recent 12-month period ended June 30 is available at http://www.dreyfus.com and on the SEC’s website at http://www.sec.gov. The description of the policies and procedures is also available without charge, upon request, by calling 1-800-DREYFUS.

|
| Dreyfus |
| Opportunistic |
| Small Cap Fund |
ANNUAL REPORT August 31, 2014

Save time. Save paper. View your next shareholder report online as soon as it’s available. Log into www.dreyfus.com and sign up for Dreyfus eCommunications. It’s simple and only takes a few minutes.
The views expressed in this report reflect those of the portfolio manager only through the end of the period covered and do not necessarily represent the views of Dreyfus or any other person in the Dreyfus organization. Any such views are subject to change at any time based upon market or other conditions and Dreyfus disclaims any responsibility to update such views.These views may not be relied on as investment advice and, because investment decisions for a Dreyfus fund are based on numerous factors, may not be relied on as an indication of trading intent on behalf of any Dreyfus fund.
|
| Not FDIC-Insured • Not Bank-Guaranteed • May Lose Value |
| | Contents |
| | THE FUND |
| 2 | A Letter from the President |
| 3 | Discussion of Fund Performance |
| 6 | Fund Performance |
| 7 | Understanding Your Fund’s Expenses |
| 7 | Comparing Your Fund’s Expenses With Those of Other Funds |
| 8 | Statement of Investments |
| 12 | Statement of Assets and Liabilities |
| 13 | Statement of Operations |
| 14 | Statement of Changes in Net Assets |
| 15 | Financial Highlights |
| 16 | Notes to Financial Statements |
| 25 | Report of Independent Registered Public Accounting Firm |
| 26 | Important Tax Information |
| 27 | Information About the Renewal of the Fund’s Management Agreement |
| 32 | Board Members Information |
| 34 | Officers of the Fund |
| | FOR MORE INFORMATION |
| | Back Cover |
Dreyfus
Opportunistic
Small Cap Fund
The Fund
A LETTER FROM THE PRESIDENT
Dear Shareholder:
We are pleased to present this annual report for Dreyfus Opportunistic Small Cap Fund, covering the 12-month period from September 1, 2013, through August 31, 2014. For information about how the fund performed during the reporting period, as well as general market perspectives, we provide a Discussion of Fund Performance on the pages that follow.
Despite occasional bouts of heightened volatility, U.S. stocks generally gained ground steadily over the reporting period as the domestic economy rebounded. As a result, most broad measures of equity market performance established a series of new record highs over the past 12 months. Growth-oriented and more economically sensitive stocks generally fared well over the reporting period’s first half, but value-oriented stocks rallied more strongly over the second half.
We remain cautiously optimistic regarding the U.S. stock market’s prospects. We currently expect the economy to continue to accelerate as several long-standing drags, including tight fiscal policies and private sector deleveraging, fade from the scene. Of course, a number of risks remain, including the possibilities of higher short-term interest rates and intensifying geopolitical turmoil.Therefore, we suggest you talk regularly with your financial advisor to assess the potential impact of these and other macroeconomic developments on your investments.
Thank you for your continued confidence and support.

J. Charles Cardona
President
The Dreyfus Corporation
September 15, 2014
2
DISCUSSION OF FUND PERFORMANCE
For the period of September 1, 2013, through August 31, 2014, as provided by David A. Daglio, Primary Portfolio Manager
Fund and Market Performance Overview
For the 12-month period ended August 31, 2014, Dreyfus Opportunistic Small Cap Fund produced a total return of 16.95%.1 In comparison, the fund’s benchmark, the Russell 2000® Index (the “Index”), produced a total return of 17.68%.The Russell 2000® Value Index returned 18.10% for the same reporting period.2
Small-cap stocks climbed during the reporting period in an environment of improving economic growth.The fund lagged the Index, mainly due to shortfalls in the financials and information technology sectors, as well as the impact of fund fees and expenses that are not reflected in the benchmark’s results.
The Fund’s Investment Approach
The fund seeks capital appreciation.The fund normally invests at least 80% of its assets in the stocks of small-cap companies.The fund currently considers small cap companies to be those companies with market capitalizations that fall within the range of companies in the Index. Stocks are selected for the fund’s portfolio based primarily on bottom-up fundamental analysis. The fund’s team of portfolio managers uses a disciplined investment process that relies, in general, on proprietary fundamental research and valuation. Generally, elements of the process include analysis of mid-cycle business prospects, estimation of the intrinsic value of the company, and the identification of a revaluation trigger. Intrinsic value is based on the combination of the valuation assessment of the company’s operating divisions with the firm’s economic balance sheet. Mid-cycle estimates, growth prospects and competitive advantages are some of the factors used in the valuation assessment. A company’s stated and hidden liabilities and assets are included in the portfolio manager’s economic balance sheet calculation. Sector overweights and underweights are a function of the relative attractiveness of securities within the fund’s investable universe. The fund’s portfolio managers invest in stocks that they believe have attractive reward to risk opportunities and may actively adjust the fund’s portfolio to reflect new developments.
The Fund 3
DISCUSSION OF FUND PERFORMANCE (continued)
Small-Cap Stocks Advanced Strongly in Broad Market Rally
Stocks generally gained value over the fall of 2013 in response to encouraging economic data, enabling several broad measures of U.S. stock market performance to end 2013 near record highs. The market relinquished some of its gains in January 2014 amid concerns regarding economic slowdowns in the world’s emerging markets, but stocks rebounded in February when those worries proved to be overblown. Another bout of weakness in the spring—mainly in the information technology and biotechnology industry groups—signaled a shift in market leadership from more aggressive growth stocks to their better established, value-oriented counterparts. By June, however, positive economic data again bolstered investor sentiment, driving stocks of all capitalization ranges to a series of new record highs over the reporting period’s final three months.
While large-, mid-, and small-cap stocks produced double-digit returns, on average, in this positive environment, the shift in market leadership to more conservative companies caused small-cap stocks to trail their larger counterparts for the reporting period overall.
Fund Strategies Produced Mixed Results
Although the fund participated substantially in the small-cap stock market’s gains, its relative performance was modestly constrained by our security selection process and valuation discipline in the financials sector. Nationstar Mortgage Holdings reported weaker-than-expected lending volumes, triggering its elimination from the portfolio. Underweighted exposure to real estate investment trusts, which we regarded as too richly valued, also hurt relative results. In the information technology sector, Applied Micro Circuits gave back some of its previous gains as investors awaited the semiconductor manufacturer’s new product line. Communications equipment producer JDS Uniphase disappointed despite improved fundamental prospects, which we expect to boost future financial results.
The fund achieved better relative performance in the health care sector, where mergers-and-acquisitions activity boosted stock prices closer to our estimates of their intrinsic values. For example, autoimmune drug developer Salix Pharmaceuticals was acquired by Ireland-based Mallinckrodt Pharmaceuticals.The fund also benefited from positive developments at biotechnology firm Ariad Pharmaceuticals and dental specialist Align Technology.
4
The fund also fared well in the consumer discretionary sector, where underweighted exposure helped cushion the impact of the industry group’s underperformance. Moreover, a relatively new position in for-profit educator Apollo Education Group gained value when enrollments stabilized and cash flows improved, and retailer Office Depot enhanced profitability and shareholder value after acquiring former rival OfficeMax.
Continuing to Find Attractive Small-Cap Opportunities
We recently have been encouraged by improved economic activity, including a stronger labor market. In our judgment, an extended economic recovery should be good for small-cap stocks. However, valuations have climbed and interest rates may rise, suggesting that selectivity is likely to become more critical to investment success. Our top-down analyses and bottom-up security selection process have identified an ample number of opportunities meeting our value-oriented criteria in the information technology, financials, and industrials sectors, but fewer in the consumer staples, utilities, and telecommunications services sectors.
September 15, 2014
Please note, the position in any security highlighted with italicized typeface was sold during the reporting period. Equity funds are subject generally to market, market sector, market liquidity, issuer, and investment style risks, among other factors, to varying degrees, all of which are more fully described in the fund’s prospectus.
Stocks of small cap companies often experience sharper price fluctuations than stocks of large-cap companies.
|
| 1 Total return includes reinvestment of dividends and any capital gains paid. Past performance is no guarantee of future |
| results. Share price and investment return fluctuate such that upon redemption fund shares may be worth more or less |
| than their original cost. |
| 2 SOURCE: LIPPER INC. — Reflects the reinvestment of dividends and, where applicable, capital gain |
| distributions.The Russell 2000® Index is an unmanaged index of small-cap stock performance and is composed of |
| the 2,000 smallest companies in the Russell 3000® Index.The Russell 3000® Index is composed of the 3,000 |
| largest U.S. companies based on total market capitalization.The Russell 2000® Value Index is an unmanaged |
| index, which measures the performance of those Russell 2000® companies with lower price-to-book ratios and lower |
| forecasted growth values. Investors cannot invest directly in any index. |
The Fund 5
FUND PERFORMANCE
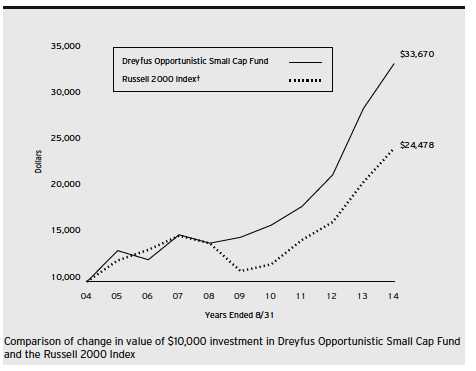
| | | | | | |
| Average Annual Total Returns as of 8/31/14 | | | | | |
| | 1 Year | | 5 Years | | 10 Years | |
| Fund | 16.95 | % | 17.84 | % | 12.91 | % |
| Russell 2000 Index | 17.68 | % | 17.03 | % | 9.36 | % |
† Source: Lipper Inc.
Past performance is not predictive of future performance.The fund’s performance shown in the graph and table does not reflect the deduction of taxes that a shareholder would pay on fund distributions or the redemption of fund shares.
The above graph compares a $10,000 investment made in Dreyfus Opportunistic Small Cap Fund on 8/31/04 to a $10,000 investment made in the Russell 2000 Index (the “Index”) on that date. All dividends and capital gain distributions are reinvested.
The fund’s performance shown in the line graph above takes into account all applicable fees and expenses.The Index is an unmanaged index and is composed of the 2,000 smallest companies in the Russell 3000 Index.The Russell 3000 Index measures the performance of the largest 3,000 U.S. companies representing approximately 98% of the investable U.S. equity market. Unlike a mutual fund, the Index is not subject to charges, fees and other expenses. Investors cannot invest directly in any index. Further information relating to fund performance, including expense reimbursements, if applicable, is contained in the Financial Highlights section of the prospectus and elsewhere in this report.
6
UNDERSTANDING YOUR FUND’S EXPENSES (Unaudited)
As a mutual fund investor, you pay ongoing expenses, such as management fees and other expenses. Using the information below, you can estimate how these expenses affect your investment and compare them with the expenses of other funds.You also may pay one-time transaction expenses, including sales charges (loads) and redemption fees, which are not shown in this section and would have resulted in higher total expenses. For more information, see your fund’s prospectus or talk to your financial adviser.
Review your fund’s expenses
The table below shows the expenses you would have paid on a $1,000 investment in Dreyfus Opportunistic Small Cap Fund from March 1, 2014 to August 31, 2014. It also shows how much a $1,000 investment would be worth at the close of the period, assuming actual returns and expenses.
Expenses and Value of a $1,000 Investment
assuming actual returns for the six months ended August 31, 2014
| | |
| Expenses paid per $1,000† | $ | 5.48 |
| Ending value (after expenses) | $ | 993.30 |
COMPARING YOUR FUND’S EXPENSES
WITH THOSE OF OTHER FUNDS (Unaudited)
Using the SEC’s method to compare expenses
The Securities and Exchange Commission (SEC) has established guidelines to help investors assess fund expenses. Per these guidelines, the table below shows your fund’s expenses based on a $1,000 investment, assuming a hypothetical 5% annualized return. You can use this information to compare the ongoing expenses (but not transaction expenses or total cost) of investing in the fund with those of other funds. All mutual fund shareholder reports will provide this information to help you make this comparison. Please note that you cannot use this information to estimate your actual ending account balance and expenses paid during the period.
Expenses and Value of a $1,000 Investment
assuming a hypothetical 5% annualized return for the six months ended August 31, 2014
| | |
| Expenses paid per $1,000† | $ | 5.55 |
| Ending value (after expenses) | $ | 1,019.71 |
|
| † Expenses are equal to the fund’s annualized expense ratio of 1.09%, multiplied by the average account value over the |
| period, multiplied by 184/365 (to reflect the one-half year period). |
The Fund 7
|
| STATEMENT OF INVESTMENTS |
| August 31, 2014 |
| | | |
| Common Stocks—99.2% | Shares | | Value ($) |
| Automobiles & Components—2.4% | | | |
| Dana Holding | 737,490 | | 17,131,893 |
| Winnebago Industries | 441,300 | a | 10,913,349 |
| | | | 28,045,242 |
| Banks—14.4% | | | |
| Columbia Banking System | 451,700 | | 11,748,717 |
| CVB Financial | 812,841 | | 12,631,549 |
| EverBank Financial | 1,252,710 | | 23,651,165 |
| IBERIABANK | 237,980 | | 15,528,195 |
| Ladder Capital, Cl. A | 643,050 | | 11,960,730 |
| Sandy Spring Bancorp | 246,800 | | 5,965,156 |
| South State | 234,230 | | 13,716,509 |
| SVB Financial Group | 383,850 | a | 42,730,182 |
| UMB Financial | 404,190 | | 23,341,973 |
| WesBanco | 198,650 | | 6,168,082 |
| | | | 167,442,258 |
| Capital Goods—7.5% | | | |
| Altra Industrial Motion | 173,240 | | 5,761,962 |
| Graco | 47,840 | | 3,676,982 |
| L.B. Foster, Cl. A | 95,920 | | 5,031,963 |
| MRC Global | 1,022,220 | a | 25,371,500 |
| Powell Industries | 94,280 | | 4,967,613 |
| Thermon Group Holdings | 1,028,020 | a | 27,910,743 |
| Watts Water Technologies, Cl. A | 236,526 | | 14,969,731 |
| | | | 87,690,494 |
| Commercial & Professional Services—7.5% | | | |
| Herman Miller | 419,633 | | 12,471,493 |
| HNI | 259,203 | | 9,826,386 |
| Interface | 460,250 | | 7,838,057 |
| Knoll | 555,810 | | 10,165,765 |
| Korn/Ferry International | 196,620 | a | 5,947,755 |
| Steelcase, Cl. A | 1,872,970 | | 29,405,629 |
| TrueBlue | 420,480 | a | 11,411,827 |
| | | | 87,066,912 |
| Consumer Durables & Apparel—.3% | | | |
| Brookfield Residential Properties | 201,385 | a | 4,067,977 |
8
| | | |
| Common Stocks (continued) | Shares | | Value ($) |
| Consumer Services—2.7% | | | |
| Apollo Education Group | 509,280 | a | 14,142,706 |
| LifeLock | 1,144,300 | a | 16,958,526 |
| | | | 31,101,232 |
| Diversified Financials—5.9% | | | |
| FNFV Group | 389,970 | | 5,841,751 |
| FXCM, Cl. A | 455,900 | b | 6,605,991 |
| Nelnet, Cl. A | 135,936 | | 5,977,106 |
| Portfolio Recovery Associates | 249,379 | a | 14,172,209 |
| Raymond James Financial | 422,310 | | 23,075,018 |
| SLM | 1,413,000 | | 12,519,180 |
| | | | 68,191,255 |
| Energy—5.0% | | | |
| CARBO Ceramics | 105,880 | b | 11,391,629 |
| CONSOL Energy | 303,690 | | 12,232,633 |
| PDC Energy | 113,010 | a | 6,790,771 |
| Synergy Resources | 557,050 | a | 7,497,893 |
| Western Refining | 427,420 | | 19,887,853 |
| | | | 57,800,779 |
| Insurance—.5% | | | |
| Stewart Information Services | 182,580 | | 5,882,728 |
| Materials—8.7% | | | |
| Allied Nevada Gold | 3,438,870 | a,b | 13,136,483 |
| AuRico Gold | 3,378,100 | | 15,336,574 |
| Chemtura | 1,253,220 | a | 30,942,002 |
| IAMGOLD | 2,949,570 | a | 11,827,776 |
| New Gold | 1,409,766 | a | 9,149,381 |
| OMNOVA Solutions | 1,472,010 | a | 12,350,164 |
| Royal Gold | 31,000 | | 2,410,250 |
| Trinseo | 278,685 | | 5,478,947 |
| | | | 100,631,577 |
| Media—1.7% | | | |
| LIN Media, Cl. A | 531,021 | a | 12,383,410 |
| New York Times, Cl. A | 597,455 | | 7,396,493 |
| | | | 19,779,903 |
The Fund 9
STATEMENT OF INVESTMENTS (continued)
| | | |
| Common Stocks (continued) | Shares | | Value ($) |
| Pharmaceuticals, Biotech & Life Sciences—6.0% | | | |
| Cubist Pharmaceuticals | 97,790 | a | 6,750,444 |
| Emergent BioSolutions | 1,475,416 | a | 36,737,858 |
| TherapeuticsMD | 4,775,884 | a,b | 26,506,156 |
| | | | 69,994,458 |
| Real Estate—1.5% | | | |
| American Residential Properties | 932,190 | a,c | 17,692,966 |
| Retailing—3.1% | | | |
| Office Depot | 6,983,659 | a | 35,756,334 |
| Semiconductors & Semiconductor Equipment—8.7% | | | |
| Applied Micro Circuits | 2,492,300 | a,b | 21,109,781 |
| Lattice Semiconductor | 1,754,217 | a | 13,174,170 |
| Mellanox Technologies | 613,070 | a,b | 25,620,195 |
| Microsemi | 587,540 | a | 15,652,066 |
| Veeco Instruments | 732,970 | a | 25,925,149 |
| | | | 101,481,361 |
| Software & Services—9.1% | | | |
| Cardtronics | 390,600 | a | 13,866,300 |
| CoreLogic | 787,640 | a | 22,266,583 |
| CSG Systems International | 900,992 | | 24,975,498 |
| Dealertrack Technologies | 612,424 | a | 27,412,098 |
| DST Systems | 43,740 | | 4,059,509 |
| Infoblox | 1,003,580 | a | 13,498,151 |
| | | | 106,078,139 |
| Technology Hardware & Equipment—12.8% | | | |
| Arrow Electronics | 429,420 | a | 26,731,395 |
| Belden | 89,770 | | 6,559,494 |
| Ciena | 1,453,870 | a | 30,080,570 |
| Jabil Circuit | 1,512,110 | | 32,631,334 |
| JDS Uniphase | 2,129,590 | a | 24,596,765 |
| ScanSource | 271,699 | a | 10,476,713 |
| Tech Data | 256,530 | a | 17,315,775 |
| | | | 148,392,046 |
| Transportation—1.4% | | | |
| Con-way | 117,564 | | 6,025,155 |
| Landstar System | 147,607 | | 10,017,349 |
| | | | 16,042,504 |
| Total Common Stocks | | | |
| (cost $994,963,345) | | | 1,153,138,165 |
10
| | | | |
| Other Investment—.4% | Shares | | Value ($) | |
| Registered Investment Company; | | | | |
| Dreyfus Institutional Preferred | | | | |
| Plus Money Market Fund | | | | |
| (cost $4,531,480) | 4,531,480 | d | 4,531,480 | |
| |
| Investment of Cash Collateral | | | | |
| for Securities Loaned—3.6% | | | | |
| Registered Investment Company; | | | | |
| Dreyfus Institutional Cash Advantage Fund | | | | |
| (cost $42,129,685) | 42,129,685 | d | 42,129,685 | |
| |
| Total Investments (cost $1,041,624,510) | 103.2 | % | 1,199,799,330 | |
| Liabilities, Less Cash and Receivables | (3.2 | %) | (37,283,042 | ) |
| Net Assets | 100.0 | % | 1,162,516,288 | |
|
| a Non-income producing security. |
| b Security, or portion thereof, on loan.At August 31, 2014, the value of the fund’s securities on loan was |
| $36,737,800 and the value of the collateral held by the fund was $42,129,685. |
| c Investment in real estate investment trust. |
| d Investment in affiliated money market mutual fund. |
| | | |
| Portfolio Summary (Unaudited)† | | |
| |
| | Value (%) | | Value (%) |
| Banks | 14.4 | Energy | 5.0 |
| Technology Hardware & Equipment | 12.8 | Money Market Investments | 4.0 |
| Software & Services | 9.1 | Retailing | 3.1 |
| Materials | 8.7 | Consumer Services | 2.7 |
| Semiconductors & Semiconductor | | Automobiles & Components | 2.4 |
| Equipment | 8.7 | Media | 1.7 |
| Capital Goods | 7.5 | Real Estate | 1.5 |
| Commercial & Professional Services | 7.5 | Transportation | 1.4 |
| Pharmaceuticals, | | Insurance | .5 |
| Biotech & Life Sciences | 6.0 | Consumer Durables & Apparel | .3 |
| Diversified Financials | 5.9 | | 103.2 |
| |
| † Based on net assets. | | | |
| See notes to financial statements. | | | |
The Fund 11
|
| STATEMENT OF ASSETS AND LIABILITIES |
| August 31, 2014 |
| | |
| | Cost | Value |
| Assets ($): | | |
| Investments in securities—See Statement of Investments (including | | |
| securities on loan, valued at $36,737,800)—Note 1(b): | | |
| Unaffiliated issuers | 994,963,345 | 1,153,138,165 |
| Affiliated issuers | 46,661,165 | 46,661,165 |
| Cash | | 725,366 |
| Receivable for investment securities sold | | 5,947,345 |
| Dividends and securities lending income receivable | | 387,740 |
| Receivable for shares of Common Stock subscribed | | 345,681 |
| Prepaid expenses | | 17,328 |
| | | 1,207,222,790 |
| Liabilities ($): | | |
| Due to The Dreyfus Corporation and affiliates—Note 3(b) | | 1,035,753 |
| Liability for securities on loan—Note 1(b) | | 42,129,685 |
| Payable for shares of Common Stock redeemed | | 682,996 |
| Payable for investment securities purchased | | 655,307 |
| Accrued expenses | | 202,761 |
| | | 44,706,502 |
| Net Assets ($) | | 1,162,516,288 |
| Composition of Net Assets ($): | | |
| Paid-in capital | | 883,556,367 |
| Accumulated net realized gain (loss) on investments | | 120,785,101 |
| Accumulated net unrealized appreciation | | |
| (depreciation) on investments | | 158,174,820 |
| Net Assets ($) | | 1,162,516,288 |
| Shares Outstanding | | |
| (200 million shares of $.001 par value Common Stock authorized) | | 32,406,273 |
| Net Asset Value, offering and redemption price per share ($) | | 35.87 |
| See notes to financial statements. | | |
12
| | |
| STATEMENT OF OPERATIONS | | |
| Year Ended August 31, 2014 | | |
| |
| |
| |
| |
| Investment Income ($): | | |
| Income: | | |
| Cash dividends (net of $4,511 foreign taxes withheld at source): | | |
| Unaffiliated issuers | 7,341,743 | |
| Affiliated issuers | 9,495 | |
| Income from securities lending—Note 1(b) | 742,131 | |
| Total Income | 8,093,369 | |
| Expenses: | | |
| Management fee—Note 3(a) | 8,130,989 | |
| Shareholder servicing costs—Note 3(b) | 3,351,792 | |
| Custodian fees—Note 3(b) | 96,421 | |
| Directors’ fees and expenses—Note 3(c) | 84,257 | |
| Professional fees | 75,021 | |
| Prospectus and shareholders’ reports | 73,410 | |
| Registration fees | 60,860 | |
| Loan commitment fees—Note 2 | 9,680 | |
| Interest expense—Note 2 | 1,090 | |
| Miscellaneous | 28,422 | |
| Total Expenses | 11,911,942 | |
| Less—reduction in fees due to earnings credits—Note 3(b) | (556 | ) |
| Net Expenses | 11,911,386 | |
| Investment (Loss)—Net | (3,818,017 | ) |
| Realized and Unrealized Gain (Loss) on Investments—Note 4 ($): | | |
| Net realized gain (loss) on investments | 179,007,894 | |
| Net unrealized appreciation (depreciation) on investments | (21,646,674 | ) |
| Net Realized and Unrealized Gain (Loss) on Investments | 157,361,220 | |
| Net Increase in Net Assets Resulting from Operations | 153,543,203 | |
| See notes to financial statements. | | |
The Fund 13
STATEMENT OF CHANGES IN NET ASSETS
| | | | |
| | Year Ended August 31, | |
| | 2014 | | 2013 | |
| Operations ($): | | | | |
| Investment (loss)—net | (3,818,017 | ) | (2,103,854 | ) |
| Net realized gain (loss) on investments | 179,007,894 | | 119,609,338 | |
| Net unrealized appreciation | | | | |
| (depreciation) on investments | (21,646,674 | ) | 85,560,914 | |
| Net Increase (Decrease) in Net Assets | | | | |
| Resulting from Operations | 153,543,203 | | 203,066,398 | |
| Dividends to Shareholders from ($): | | | | |
| Net realized gain on investments | (117,652,217 | ) | — | |
| Capital Stock Transactions ($): | | | | |
| Net proceeds from shares sold | 409,179,762 | | 267,552,568 | |
| Dividends reinvested | 97,841,528 | | — | |
| Cost of shares redeemed | (231,081,362 | ) | (215,270,862 | ) |
| Increase (Decrease) in Net Assets | | | | |
| from Capital Stock Transactions | 275,939,928 | | 52,281,706 | |
| Total Increase (Decrease) in Net Assets | 311,830,914 | | 255,348,104 | |
| Net Assets ($): | | | | |
| Beginning of Period | 850,685,374 | | 595,337,270 | |
| End of Period | 1,162,516,288 | | 850,685,374 | |
| Capital Share Transactions (Shares): | | | | |
| Shares sold | 11,449,047 | | 8,939,680 | |
| Shares issued for dividends reinvested | 2,911,950 | | — | |
| Shares redeemed | (6,469,635 | ) | (7,304,234 | ) |
| Net Increase (Decrease) in Shares Outstanding | 7,891,362 | | 1,635,446 | |
| See notes to financial statements. | | | | |
14
FINANCIAL HIGHLIGHTS
The following table describes the performance for the fiscal periods indicated. Total return shows how much your investment in the fund would have increased (or decreased) during each period, assuming you had reinvested all dividends and distributions.These figures have been derived from the fund’s financial statements.
| | | | | | | | | | |
| | | | Year Ended August 31, | | | |
| | 2014 | | 2013 | | 2012 | | 2011 | | 2010 | |
| Per Share Data ($): | | | | | | | | | | |
| Net asset value, beginning of period | 34.70 | | 26.02 | | 24.90 | | 22.49 | | 20.65 | |
| Investment Operations: | | | | | | | | | | |
| Investment (loss)—neta | (.13 | ) | (.09 | ) | (.13 | ) | (.07 | ) | (.04 | ) |
| Net realized and unrealized | | | | | | | | | | |
| gain (loss) on investments | 5.70 | | 8.77 | | 4.27 | | 2.97 | | 1.88 | |
| Total from Investment Operations | 5.57 | | 8.68 | | 4.14 | | 2.90 | | 1.84 | |
| Distributions: | | | | | | | | | | |
| Dividends from investment income—net | — | | — | | — | | (.00 | )b | — | |
| Dividends from net realized | | | | | | | | | | |
| gain on investments | (4.40 | ) | — | | (3.02 | ) | (.49 | ) | — | |
| Total Distributions | (4.40 | ) | — | | (3.02 | ) | (.49 | ) | — | |
| Net asset value, end of period | 35.87 | | 34.70 | | 26.02 | | 24.90 | | 22.49 | |
| Total Return (%) | 16.95 | | 33.36 | | 18.81 | | 12.57 | | 8.91 | |
| Ratios/Supplemental Data (%): | | | | | | | | | | |
| Ratio of total expenses | | | | | | | | | | |
| to average net assets | 1.10 | | 1.13 | | 1.19 | | 1.16 | | 1.22 | |
| Ratio of net expenses | | | | | | | | | | |
| to average net assets | 1.10 | | 1.13 | | 1.19 | | 1.16 | | 1.22 | |
| Ratio of net investment (loss) | | | | | | | | | | |
| to average net assets | (.35 | ) | (.29 | ) | (.52 | ) | (.23 | ) | (.15 | ) |
| Portfolio Turnover Rate | 88.69 | | 94.62 | | 85.92 | | 123.29 | | 128.47 | |
| Net Assets, end of period ($ x 1,000) | 1,162,516 | | 850,685 | | 595,337 | | 573,898 | | 476,939 | |
| |
| a | Based on average shares outstanding. |
| b | Amount represents less than $.01 per share. |
See notes to financial statements.
The Fund 15
NOTES TO FINANCIAL STATEMENTS
NOTE 1—Significant Accounting Policies:
Dreyfus Opportunistic Small Cap Fund (the “fund”) is a separate diversified series of Advantage Funds, Inc. (the “Company”), which is registered under the Investment Company Act of 1940, as amended (the “Act”), as an open-end management investment company and operates as a series company currently offering eleven series, including the fund. The fund’s investment objective is to seek capital appreciation. The Dreyfus Corporation (the “Manager” or “Dreyfus”), a wholly-owned subsidiary of The Bank of New York Mellon Corporation (“BNY Mellon”), serves as the fund’s investment adviser. MBSC Securities Corporation (the “Distributor”), a wholly-owned subsidiary of the Manager, is the distributor of the fund’s shares, which are sold to the public without a sales charge.
The Company accounts separately for the assets, liabilities and operations of each series. Expenses directly attributable to each series are charged to that series’ operations; expenses which are applicable to all series are allocated among them on a pro rata basis.
The Financial Accounting Standards Board (“FASB”) Accounting Standards Codification is the exclusive reference of authoritative U.S. generally accepted accounting principles (“GAAP”) recognized by the FASB to be applied by nongovernmental entities. Rules and interpretive releases of the Securities and Exchange Commission (“SEC”) under authority of federal laws are also sources of authoritative GAAP for SEC registrants. The fund’s financial statements are prepared in accordance with GAAP, which may require the use of management estimates and assumptions. Actual results could differ from those estimates.
The Company enters into contracts that contain a variety of indemnifications. The fund’s maximum exposure under these arrangements is unknown.The fund does not anticipate recognizing any loss related to these arrangements.
(a) Portfolio valuation: The fair value of a financial instrument is the amount that would be received to sell an asset or paid to transfer a liability in an orderly transaction between market participants at the
16
measurement date (i.e., the exit price). GAAP establishes a fair value hierarchy that prioritizes the inputs of valuation techniques used to measure fair value. This hierarchy gives the highest priority to unadjusted quoted prices in active markets for identical assets or liabilities (Level 1 measurements) and the lowest priority to unobservable inputs (Level 3 measurements).
Additionally, GAAP provides guidance on determining whether the volume and activity in a market has decreased significantly and whether such a decrease in activity results in transactions that are not orderly. GAAP requires enhanced disclosures around valuation inputs and techniques used during annual and interim periods.
Various inputs are used in determining the value of the fund’s investments relating to fair value measurements.These inputs are summarized in the three broad levels listed below:
Level 1—unadjusted quoted prices in active markets for identical investments.
Level 2—other significant observable inputs (including quoted prices for similar investments, interest rates, prepayment speeds, credit risk, etc.).
Level 3—significant unobservable inputs (including the fund’s own assumptions in determining the fair value of investments).
The inputs or methodology used for valuing securities are not necessarily an indication of the risk associated with investing in those securities.
Changes in valuation techniques may result in transfers in or out of an assigned level within the disclosure hierarchy. Valuation techniques used to value the fund’s investments are as follows:
Investments in securities are valued at the last sales price on the securities exchange or national securities market on which such securities are primarily traded. Securities listed on the National Market System for which market quotations are available are valued at the official closing price or, if there is no official closing price that day, at the last
The Fund 17
NOTES TO FINANCIAL STATEMENTS (continued)
sales price. Securities not listed on an exchange or the national securities market, or securities for which there were no transactions, are valued at the average of the most recent bid and asked prices, except for open short positions, where the asked price is used for valuation purposes. Bid price is used when no asked price is available. Registered investment companies that are not traded on an exchange are valued at their net asset value.All of the preceding securities are generally categorized within Level 1 of the fair value hierarchy.
Fair valuing of securities may be determined with the assistance of a pricing service using calculations based on indices of domestic securities and other appropriate indicators, such as prices of relevant American Depository Receipts and financial futures. Utilizing these techniques may result in transfers between Level 1 and Level 2 of the fair value hierarchy.
When market quotations or official closing prices are not readily available, or are determined not to reflect accurately fair value, such as when the value of a security has been significantly affected by events after the close of the exchange or market on which the security is principally traded (for example, a foreign exchange or market), but before the fund calculates its net asset value, the fund may value these investments at fair value as determined in accordance with the procedures approved by the Company’s Board of Directors (the “Board”). Certain factors may be considered when fair valuing investments such as: fundamental analytical data, the nature and duration of restrictions on disposition, an evaluation of the forces that influence the market in which the securities are purchased and sold, and public trading in similar securities of the issuer or comparable issuers.These securities are either categorized within Level 2 or 3 of the fair value hierarchy depending on the relevant inputs used.
For restricted securities where observable inputs are limited, assumptions about market activity and risk are used and are generally categorized within Level 3 of the fair value hierarchy.
18
The following is a summary of the inputs used as of August 31, 2014 in valuing the fund’s investments:
| | | | |
| | | Level 2—Other | Level 3— | |
| | Level 1— | Significant | Significant | |
| Unadjusted | Observable | Unobservable | |
| | Quoted Prices | Inputs | Inputs | Total |
| Assets ($) | | | | |
| Investments in Securities: | | | |
| Equity Securities— | | | | |
| Domestic | | | | |
| Common Stocks† | 1,112,756,457 | — | — | 1,112,756,457 |
| Equity Securities— | | | | |
| Foreign | | | | |
| Common Stocks† | 40,381,708 | — | — | 40,381,708 |
| Mutual Funds | 46,661,165 | — | — | 46,661,165 |
| |
| † See Statement of Investments for additional detailed categorizations. | |
At August 31, 2014, there were no transfers between Level 1 and Level 2 of the fair value hierarchy.
(b) Securities transactions and investment income: Securities transactions are recorded on a trade date basis. Realized gains and losses from securities transactions are recorded on the identified cost basis. Dividend income is recognized on the ex-dividend date and interest income, including, where applicable, accretion of discount and amortization of premium on investments, is recognized on the accrual basis.
Pursuant to a securities lending agreement with The Bank of New York Mellon, a subsidiary of BNY Mellon and an affiliate of Dreyfus, the fund may lend securities to qualified institutions. It is the fund’s policy that, at origination, all loans are secured by collateral of at least 102% of the value of U.S. securities loaned and 105% of the value of foreign securities loaned. Collateral equivalent to at least 100% of the market value of securities on loan is maintained at all times. Collateral is either in the form of cash, which can be invested in certain money market mutual funds managed by the Manager or U.S. Government
The Fund 19
NOTES TO FINANCIAL STATEMENTS (continued)
and Agency securities. The fund is entitled to receive all dividends, interest and distributions on securities loaned, in addition to income earned as a result of the lending transaction. Should a borrower fail to return the securities in a timely manner, The Bank of New York Mellon is required to replace the securities for the benefit of the fund or credit the fund with the market value of the unreturned securities and is subrogated to the fund’s rights against the borrower and the collateral. During the period ended August 31, 2014, The Bank of New York Mellon earned $187,162 from lending portfolio securities, pursuant to the securities lending agreement.
(c) Affiliated issuers: Investments in other investment companies advised by Dreyfus are defined as “affiliated” under the Act. Investments in affiliated investment companies during the period ended August 31, 2014 were as follows:
| | | | | |
| Affiliated | | | | | |
| Investment | Value | | | Value | Net |
| Company | 8/31/2013 ($) | Purchases ($) | Sales ($) | 8/31/2014 ($) | Assets (%) |
| Dreyfus | | | | | |
| Institutional | | | | | |
| Preferred | | | | | |
| Plus Money | | | | | |
| Market | | | | | |
| Fund | 6,191,257 | 479,549,901 | 481,209,678 | 4,531,480 | .4 |
| Dreyfus | | | | | |
| Institutional | | | | | |
| Cash | | | | | |
| Advantage | | | | | |
| Fund | 46,083,357 | 667,122,069 | 671,075,741 | 42,129,685 | 3.6 |
| Total | 52,274,614 | 1,146,671,970 | 1,152,285,419 | 46,661,165 | 4.0 |
(d) Dividends to shareholders: Dividends are recorded on the ex-dividend date. Dividends from investment income-net and dividends from net realized capital gains, if any, are normally declared and paid annually, but the fund may make distributions on a more frequent basis to comply with the distribution requirements of the Internal Revenue Code of 1986, as amended (the “Code”). To the extent that net realized capital gains can be offset by capital loss carryovers, it is the policy of the fund not to distribute such gains. Income and capital gain distributions are determined in accordance with income tax regulations, which may differ from GAAP.
20
(e) Federal income taxes: It is the policy of the fund to continue to qualify as a regulated investment company, if such qualification is in the best interests of its shareholders, by complying with the applicable provisions of the Code, and to make distributions of taxable income sufficient to relieve it from substantially all federal income and excise taxes.
As of and during the period ended August 31, 2014, the fund did not have any liabilities for any uncertain tax positions.The fund recognizes interest and penalties, if any, related to uncertain tax positions as income tax expense in the Statement of Operations. During the period ended August 31, 2014, the fund did not incur any interest or penalties.
Each tax year in the four-year period ended August 31, 2014 remains subject to examination by the Internal Revenue Service and state taxing authorities.
At August 31, 2014, the components of accumulated earnings on a tax basis were as follows: undistributed ordinary income $37,558,671, undistributed capital gains $98,698,561, accumulated capital losses $12,189,525 and unrealized appreciation $154,892,214.
Under the Regulated Investment Company Modernization Act of 2010 (the “2010 Act”), the fund is permitted to carry forward capital losses incurred in taxable years beginning after December 22, 2010 (“post-enactment losses”) for an unlimited period. Furthermore, post-enactment capital loss carryovers retain their character as either short-term or long-term capital losses rather than short-term as they were under previous statute.The 2010 Act requires post-enactment losses to be utilized before the utilization of losses incurred in taxable years prior to the effective date of the 2010 Act (“pre-enactment losses”).As a result of this ordering rule, pre-enactment losses may be more likely to expire unused.
As a result of the fund’s merger with Dreyfus Emerging Leaders Fund, capital losses of $12,189,525 are available to offset future gains, if any. Based on certain provisions in the Code, the amount of losses which can be utilized in subsequent years is subject to an annual limitation. If not applied, these acquired capital losses expire in fiscal year 2017.
The Fund 21
NOTES TO FINANCIAL STATEMENTS (continued)
The tax character of distributions paid to shareholders during the fiscal periods ended August 31, 2014 and August 31, 2013 were as follows: ordinary income $11,212,224 and $0, and long-term capital gains $106,439,993 and $0, respectively.
During the period ended August 31, 2014, as a result of permanent book to tax differences, primarily due to the tax treatment for net operating losses, the fund increased accumulated undistributed investment income-net by $3,818,017 and decreased accumulated net realized gain (loss) on investments by the same amount. Net assets and net asset value per share were not affected by this reclassification.
NOTE 2—Bank Lines of Credit:
The fund participates with other Dreyfus-managed funds in a $265 million unsecured credit facility led by Citibank, N.A. and a $300 million unsecured credit facility provided by The Bank of New York Mellon (each, a “Facility”), each to be utilized primarily for temporary or emergency purposes, including the financing of redemptions. Prior to October 9, 2013, the unsecured credit facility with Citibank, N.A. was $210 million. In connection therewith, the fund has agreed to pay its pro rata portion of commitment fees for each Facility. Interest is charged to the fund based on rates determined pursuant to the terms of the respective Facility at the time of borrowing.
The average amount of borrowings outstanding under the Facilities during the period ended August 31, 2014 was $100,000 with a related weighted average annualized interest rate of 1.09%.
NOTE 3—Management Fee and Other Transactions with Affiliates:
(a) Pursuant to a management agreement with the Manager, the management fee is computed at the annual rate of .75% of the value of the fund’s average daily net assets and is payable monthly.
(b) Under the Shareholder Services Plan, the fund pays the Distributor at an annual rate of .25% of the value of the fund’s average daily net
22
assets for the provision of certain services. The services provided may include personal services relating to shareholder accounts, such as answering shareholder inquiries regarding the fund and providing reports and other information, and services related to the maintenance of shareholder accounts. The Distributor may make payments to Service Agents (securities dealers, financial institutions or other industry professionals) with respect to these services.The Distributor determines the amounts to be paid to Service Agents. During the period ended August 31, 2014, the fund was charged $2,710,330 pursuant to the Shareholder Services Plan.
The fund has arrangements with the transfer agent and the custodian whereby the fund may receive earnings credits when positive cash balances are maintained, which are used to offset transfer agency and custody fees. For financial reporting purposes, the fund includes net earnings credits as an expense offset in the Statement of Operations.
The fund compensates Dreyfus Transfer, Inc., a wholly-owned subsidiary of the Manager, under a transfer agency agreement for providing transfer agency and cash management services for the fund. The majority of transfer agency fees are comprised of amounts paid on a per account basis, while cash management fees are related to fund subscriptions and redemptions. During the period ended August 31, 2014, the fund was charged $126,937 for transfer agency services and $7,513 for cash management services. These fees are included in Shareholder servicing costs in the Statement of Operations. Cash management fees were partially offset by earnings credits of $555.
The fund compensates The Bank of New York Mellon under a custody agreement for providing custodial services for the fund. These fees are determined based on net assets, geographic region and transaction activity. During the period ended August 31, 2014, the fund was charged $96,421 pursuant to the custody agreement.
The Fund 23
NOTES TO FINANCIAL STATEMENTS (continued)
The fund compensated The Bank of New York Mellon under a cash management agreement that was in effect until September 30, 2013 for performing certain cash management services related to fund subscriptions and redemptions. During the period ended August 31, 2014, the fund was charged $199 pursuant to the cash management agreement, which is included in Shareholder servicing costs in the Statement of Operations. These fees were partially offset by earnings credits of $1.
During the period ended August 31, 2014, the fund was charged $8,296 for services performed by the Chief Compliance Officer and his staff.
The components of “Due to The Dreyfus Corporation and affiliates” in the Statement of Assets and Liabilities consist of: management fees $725,997, Shareholder Services Plan fees $241,999, custodian fees $42,560, Chief Compliance Officer fees $1,154 and transfer agency fees $24,043.
(c) Each Board member also serves as a Board member of other funds within the Dreyfus complex. Annual retainer fees and attendance fees are allocated to each fund based on net assets.
NOTE 4—Securities Transactions:
The aggregate amount of purchases and sales of investment securities, excluding short-term securities, during the period ended August 31, 2014 amounted to $1,095,483,180 and $947,241,805, respectively.
At August 31, 2014, the cost of investments for federal income tax purposes was $1,044,907,116; accordingly, accumulated net unrealized appreciation on investments was $154,892,214, consisting of $181,022,776 gross unrealized appreciation and $26,130,562 gross unrealized depreciation.
24
|
| REPORT OF INDEPENDENT REGISTERED |
| PUBLIC ACCOUNTING FIRM |
Shareholders and Board of Directors Dreyfus Opportunistic Small Cap Fund
We have audited the accompanying statement of assets and liabilities, including the statement of investments, of Dreyfus Opportunistic Small Cap Fund (one of the series comprising Advantage Funds, Inc.) as of August 31, 2014, and the related statement of operations for the year then ended, the statement of changes in net assets for each of the two years in the period then ended, and the financial highlights for each of the five years in the period then ended. These financial statements and financial highlights are the responsibility of the Fund’s management. Our responsibility is to express an opinion on these financial statements and financial highlights based on our audits.
We conducted our audits in accordance with the standards of the Public Company Accounting Oversight Board (United States).Those standards require that we plan and perform the audit to obtain reasonable assurance about whether the financial statements and financial highlights are free of material misstatement.We were not engaged to perform an audit of the Fund’s internal control over financial reporting. Our audits included consideration of internal control over financial reporting as a basis for designing audit procedures that are appropriate in the circumstances, but not for the purpose of expressing an opinion on the effectiveness of the Fund’s internal control over financial reporting. Accordingly, we express no such opinion. An audit also includes examining, on a test basis, evidence supporting the amounts and disclosures in the financial statements and financial highlights, assessing the accounting principles used and significant estimates made by management, and evaluating the overall financial statement presentation. Our procedures included confirmation of securities owned as of August 31, 2014 by correspondence with the custodian and others. We believe that our audits provide a reasonable basis for our opinion.
In our opinion, the financial statements and financial highlights referred to above present fairly, in all material respects, the financial position of Dreyfus Opportunistic Small Cap Fund at August 31, 2014, the results of its operations for the year then ended, the changes in its net assets for each of the two years in the period then ended, and the financial highlights for each of the five years in the period then ended, in conformity with U.S. generally accepted accounting principles.

|
| New York, New York |
| October 28, 2014 |
The Fund 25
IMPORTANT TAX INFORMATION (Unaudited)
For federal tax purposes, the fund hereby reports 8.67% of the ordinary dividends paid during the fiscal year ended August 31, 2014 as qualifying for the corporate dividends received deduction. Also, certain dividends paid by the fund may be subject to a maximum tax rate of 15%, as provided for by the Jobs and Growth Tax Relief Reconciliation Act of 2003. Of the distributions paid during the fiscal year, $10,388,613 represents the maximum amount that may be considered qualified dividend income.The fund also hereby reports $.4197 per share as a short-term capital gain distribution and $3.9843 per share as a long-term capital gain distribution paid on December 11, 2013. Shareholders will receive notification in early 2015 of the percentage applicable to the preparation of their 2014 income tax returns
26
|
| INFORMATION ABOUT THE RENEWAL OF THE |
| FUND’S MANAGEMENT AGREEMENT (Unaudited) |
At a meeting of the fund’s Board of Directors held on March 4-5, 2014, the Board considered the renewal of the fund’s Management Agreement pursuant to which Dreyfus provides the fund with investment advisory and administrative services (the “Agreement”). The Board members, none of whom are interested persons (as defined in the Investment Company Act of 1940, as amended) of the fund, were assisted in their review by independent legal counsel and met with counsel in executive session separate from Dreyfus representatives. In considering the renewal of the Agreement, the Board considered all factors that it believed to be relevant, including those discussed below.The Board did not identify any one factor as dispositive, and each Board member may have attributed different weights to the factors considered.
Analysis of Nature, Extent, and Quality of Services Provided to the Fund. The Board considered information provided to them at the meeting and in previous presentations from Dreyfus representatives regarding the nature, extent, and quality of the services provided to funds in the Dreyfus fund complex. Dreyfus provided the number of open accounts in the fund, the fund’s asset size and the allocation of fund assets among distribution channels. Dreyfus also had previously provided information regarding the diverse intermediary relationships and distribution channels of funds in the Dreyfus fund complex (such as retail direct or intermediary, in which intermediaries typically are paid by the fund and/or Dreyfus) and Dreyfus’ corresponding need for broad, deep, and diverse resources to be able to provide ongoing shareholder services to each intermediary or distribution channel, as applicable to the fund.
The Board also considered research support available to, and portfolio management capabilities of, the fund’s portfolio management personnel and that Dreyfus also provides oversight of day-to-day fund operations, including fund accounting and administration and assistance in meeting legal and regulatory requirements. The Board also considered Dreyfus’ extensive administrative, accounting, and compliance infrastructures.
The Fund 27
|
| INFORMATION ABOUT THE RENEWAL OF THE FUND’S |
| MANAGEMENT AGREEMENT (Unaudited) (continued) |
The Board also considered portfolio management’s brokerage policies and practices (including policies and practices regarding soft dollars) and the standards applied in seeking best execution.
Comparative Analysis of the Fund’s Performance and Management Fee and Expense Ratio. The Board reviewed reports prepared by Lipper, Inc. (Lipper), an independent provider of investment company data, which included information comparing (1) the fund’s performance with the performance of a group of comparable funds (the Performance Group) and with a broader group of funds (the Performance Universe), all for various periods ended December 31, 2013, and (2) the fund’s actual and contractual management fees and total expenses with those of a group of comparable funds (the Expense Group) and with a broader group of funds (the Expense Universe), the information for which was derived in part from fund financial statements available to Lipper as of the date of its analysis. Dreyfus previously had furnished the Board with a description of the methodology Lipper used to select the Performance Group and Performance Universe and the Expense Group and Expense Universe.
Dreyfus representatives stated that the usefulness of performance comparisons may be affected by a number of factors, including different investment limitations that may be applicable to the fund and comparison funds. The Board discussed the results of the comparisons and noted that the fund’s total return performance was above the Performance Group and Performance Universe medians for all periods (ranking first in the Performance Group and in the first quartile of the Performance Universe for most periods), except for the three-year period when the fund’s performance was below the Performance Group median. Dreyfus also provided a comparison of the fund’s calendar year total returns to the returns of the fund’s benchmark index.
The Board also reviewed the range of actual and contractual management fees and total expenses of the Expense Group and Expense Universe funds and discussed the results of the comparisons.The Board noted that the fund’s contractual management fee below the Expense
28
Group median and the fund’s actual management fee and total expenses were below the Expense Group and Expense Universe medians.
Dreyfus representatives reviewed with the Board the management or investment advisory fees (1) paid by funds advised or administered by Dreyfus that are in the same Lipper category as the fund and (2) paid to Dreyfus or the Dreyfus-affiliated primary employer of the fund’s primary portfolio manager(s) for advising any separate accounts and/or other types of client portfolios that are considered to have similar investment strategies and policies as the fund (the Similar Clients), and explained the nature of the Similar Clients.They discussed differences in fees paid and the relationship of the fees paid in light of any differences in the services provided and other relevant factors. The Board considered the relevance of the fee information provided for the Similar Clients to evaluate the appropriateness and reasonableness of the fund’s management fee.
Analysis of Profitability and Economies of Scale. Dreyfus representatives reviewed the expenses allocated and profit received by Dreyfus and the resulting profitability percentage for managing the fund and the aggregate profitability percentage to Dreyfus of managing the funds in the Dreyfus fund complex, and the method used to determine the expenses and profit. The Board concluded that the profitability results were not unreasonable, given the services rendered and service levels provided by Dreyfus. The Board also had been provided with information prepared by an independent consulting firm regarding Dreyfus’ approach to allocating costs to, and determining the profitability of, individual funds and the entire Dreyfus fund complex.The consulting firm also had analyzed where any economies of scale might emerge in connection with the management of a fund.
The Board considered on the advice of its counsel the profitability analysis (1) as part of its evaluation of whether the fees under the Agreement bear a reasonable relationship to the mix of services provided by Dreyfus, including the nature, extent and quality of such ser-
The Fund 29
|
| INFORMATION ABOUT THE RENEWAL OF THE FUND’S |
| MANAGEMENT AGREEMENT (Unaudited) (continued) |
vices, and (2) in light of the relevant circumstances for the fund and the extent to which economies of scale would be realized if the fund grows and whether fee levels reflect these economies of scale for the benefit of fund shareholders. Dreyfus representatives also noted that, as a result of shared and allocated costs among funds in the Dreyfus fund complex, the extent of economies of scale could depend substantially on the level of assets in the complex as a whole, so that increases and decreases in complex-wide assets can affect potential economies of scale in a manner that is disproportionate to, or even in the opposite direction from, changes in the fund’s asset level.The Board also considered potential benefits to Dreyfus from acting as investment adviser and noted the soft dollar arrangements in effect for trading the fund’s investments.
At the conclusion of these discussions, the Board agreed that it had been furnished with sufficient information to make an informed business decision with respect to the renewal of the Agreement. Based on the discussions and considerations as described above, the Board concluded and determined as follows.
The Board concluded that the nature, extent and quality of the services provided by Dreyfus are adequate and appropriate.
The Board was satisfied with the fund’s performance.
The Board concluded that the fee paid to Dreyfus was reasonable in light of the considerations described above.
The Board determined that the economies of scale which may accrue to Dreyfus and its affiliates in connection with the management of the fund had been adequately considered by Dreyfus in connection with the fee rate charged to the fund pursuant to the Agreement and that, to the extent in the future it were determined that material economies of scale had not been shared with the fund, the Board would seek to have those economies of scale shared with the fund.
30
In evaluating the Agreement, the Board considered these conclusions and determinations and also relied on its previous knowledge, gained through meetings and other interactions with Dreyfus and its affiliates, of the fund and the services provided to the fund by Dreyfus. The Board also relied on information received on a routine and regular basis throughout the year relating to the operations of the fund and the investment management and other services provided under the Agreement, including information on the investment performance of the fund in comparison to similar mutual funds and benchmark performance indices; general market outlook as applicable to the fund; and compliance reports. In addition, the Board’s consideration of the contractual fee arrangements for this fund had the benefit of a number of years of reviews of prior or similar agreements during which lengthy discussions took place between the Board and Dreyfus representatives. Certain aspects of the arrangements may receive greater scrutiny in some years than in others, and the Board’s conclusions may be based, in part, on their consideration of the same or similar arrangements in prior years. The Board determined that renewal of the Agreement was in the best interests of the fund and its shareholders.
The Fund 31
|
| BOARD MEMBERS INFORMATION (Unaudited) |
| INDEPENDENT BOARD MEMBERS |
|
| Joseph S. DiMartino (70) |
| Chairman of the Board (1995) |
| Principal Occupation During Past 5Years: |
| • Corporate Director and Trustee (1995-present) |
| Other Public Company Board Memberships During Past 5Years: |
| • CBIZ (formerly, Century Business Services, Inc.), a provider of outsourcing functions for small |
| and medium size companies, Director (1997-present) |
| • The Newark Group, a provider of a national market of paper recovery facilities, paperboard |
| mills and paperboard converting plants, Director (2000-2010) |
| • Sunair Services Corporation, a provider of certain outdoor-related services to homes and |
| businesses, Director (2005-2009) |
| No. of Portfolios for which Board Member Serves: 142 |
| ——————— |
| Peggy C. Davis (71) |
| Board Member (2006) |
| Principal Occupation During Past 5Years: |
| • Shad Professor of Law, New York University School of Law (1983-present) |
| No. of Portfolios for which Board Member Serves: 52 |
| ——————— |
| David P. Feldman (74) |
| Board Member (1996) |
| Principal Occupation During Past 5Years: |
| • Corporate Director and Trustee (1985-present) |
| Other Public Company Board Membership During Past 5Years: |
| • BBH Mutual Funds Group (5 registered mutual funds), Director (1992-present) |
| No. of Portfolios for which Board Member Serves: 38 |
| ——————— |
| Ehud Houminer (74) |
| Board Member (1993) |
| Principal Occupation During Past 5Years: |
| • Executive-in-Residence at the Columbia Business School, Columbia University (1992-present) |
| Other Public Company Board Membership During Past 5Years: |
| • Avnet Inc., an electronics distributor, Director (1993-2012) |
| No. of Portfolios for which Board Member Serves: 62 |
32
| |
| | Lynn Martin (74) |
| | Board Member (2012) |
| | Principal Occupation During Past 5Years: |
| | • President of The Martin Hall Group LLC, a human resources consulting firm (2005-2012) |
| | Other Public Company Board Memberships During Past 5Years: |
| | • AT&T Inc., a telecommunications company, Director (1999-2012) |
| | • Ryder System, Inc., a supply chain and transportation management company, Director |
| | (1993-2012) |
| | • The Proctor & Gamble Co., a consumer products company, Director (1994-2009) |
| | • Constellation Energy Group Inc., Director (2003-2009) |
| | No. of Portfolios for which Board Member Serves: 38 |
| —————— |
| | Robin A. Melvin (50) |
| | Board Member (2012) |
| | Principal Occupation During Past 5Years: |
| | • Board Member, Illinois Mentoring Partnership, non-profit organization dedicated to increasing |
| | the quantity and quality of mentoring services in Illinois (2013-present) |
| | • Director, Boisi Family Foundation, a private family foundation that supports youth-serving |
| | organizations that promote the self sufficiency of youth from disadvantaged circumstances |
| | (1995-2012) |
| | No. of Portfolios for which Board Member Serves: 109 |
| —————— |
| | Dr. Martin Peretz (75) |
| | Board Member (2006) |
| | Principal Occupation During Past 5Years: |
| | • Editor-in-Chief Emeritus of The New Republic Magazine (2010-2011) (previously, Editor-in- |
| | Chief, 1974-2010) |
| | • Director of TheStreet.com, a financial information service on the web (1996-2010) |
| | No. of Portfolios for which Board Member Serves: 38 |
| —————— |
Once elected all Board Members serve for an indefinite term, but achieve Emeritus status upon reaching age 80.The address of the Board Members and Officers is c/o The Dreyfus Corporation, 200 Park Avenue, New York, New York 10166. Additional information about the Board Members is available in the fund’s Statement of Additional Information which can be obtained from Dreyfus free of charge by calling this toll free number: 1-800-DREYFUS.
James F. Henry, Emeritus Board Member
Dr. Paul A. Marks, Emeritus Board Member
Philip L.Toia, Emeritus Board Member
The Fund 33
OFFICERS OF THE FUND (Unaudited)
BRADLEY J. SKAPYAK, President since January 2010.
Chief Operating Officer and a director of the Manager since June 2009, Chairman of Dreyfus Transfer, Inc., an affiliate of the Manager and the transfer agent of the funds, since May 2011 and Executive Vice President of the Distributor since June 2007. From April 2003 to June 2009, Mr. Skapyak was the head of the Investment Accounting and Support Department of the Manager. He is an officer of 69 investment companies (comprised of 142 portfolios) managed by the Manager. He is 55 years old and has been an employee of the Manager since February 1988.
JOHN PAK, Chief Legal Officer since March 2013.
Deputy General Counsel, Investment Management, of BNY Mellon since August 2014; Chief Legal Officer of the Manager since August 2012; from March 2005 to July 2012, Managing Director of Deutsche Bank, Deputy Global Head of Deutsche Asset Management Legal and Regional Head of Deutsche Asset Management Americas Legal. He is an officer of 70 investment companies (comprised of 167 portfolios) managed by the Manager. He is 45 years old and has been an employee of the Manager since August 2012.
JANETTE E. FARRAGHER, Vice President and Secretary since December 2011.
Assistant General Counsel of BNY Mellon, and an officer of 70 investment companies (comprised of 167 portfolios) managed by the Manager. She is 51 years old and has been an employee of the Manager since February 1984.
KIESHA ASTWOOD, Vice President and Assistant Secretary since January 2010.
Counsel of BNY Mellon, and an officer of 70 investment companies (comprised of 167 portfolios) managed by the Manager. She is 41 years old and has been an employee of the Manager since July 1995.
JAMES BITETTO, Vice President and Assistant Secretary since August 2005.
Managing Counsel of BNY Mellon and Secretary of the Manager, and an officer of 70 investment companies (comprised of 167 portfolios) managed by the Manager. He is 48 years old and has been an employee of the Manager since December 1996.
JONI LACKS CHARATAN, Vice President and Assistant Secretary since August 2005.
Managing Counsel of BNY Mellon, and an officer of 70 investment companies (comprised of 167 portfolios) managed by the Manager. She is 58 years old and has been an employee of the Manager since October 1988.
JOSEPH M. CHIOFFI, Vice President and Assistant Secretary since August 2005.
Managing Counsel of BNY Mellon, and an officer of 70 investment companies (comprised of 167 portfolios) managed by the Manager. He is 52 years old and has been an employee of the Manager since June 2000.
JOHN B. HAMMALIAN, Vice President and Assistant Secretary since August 2005.
Senior Managing Counsel of BNY Mellon, and an officer of 70 investment companies (comprised of 167 portfolios) managed by the Manager. He is 51 years old and has been an employee of the Manager since February 1991.
SARAH S. KELLEHER, Vice President and Assistant Secretary since April 2014.
Senior Counsel of BNY Mellon, and an officer of 70 investment companies (comprised of 167 portfolios) managed by the Manager; from August 2005 to March 2013, Associate General Counsel of Third Avenue Management. She is 38 years old and has been an employee of the Manager since March 2013.
34
JEFF PRUSNOFSKY, Vice President and Assistant Secretary since August 2005.
Senior Managing Counsel of BNY Mellon, and an officer of 70 investment companies (comprised of 167 portfolios) managed by the Manager. He is 49 years old and has been an employee of the Manager since October 1990.
JAMES WINDELS, Treasurer since November 2001.
Director – Mutual Fund Accounting of the Manager, and an officer of 70 investment companies (comprised of 167 portfolios) managed by the Manager. He is 55 years old and has been an employee of the Manager since April 1985.
RICHARD CASSARO, Assistant Treasurer since January 2008.
Senior Accounting Manager – Money Market and Municipal Bond Funds of the Manager, and an officer of 70 investment companies (comprised of 167 portfolios) managed by the Manager. He is 55 years old and has been an employee of the Manager since September 1982.
GAVIN C. REILLY, Assistant Treasurer since December 2005.
Tax Manager of the Investment Accounting and Support Department of the Manager, and an officer of 70 investment companies (comprised of 167 portfolios) managed by the Manager. He is 46 years old and has been an employee of the Manager since April 1991.
ROBERT S. ROBOL, Assistant Treasurer since August 2005.
Senior Accounting Manager – Fixed Income Funds of the Manager, and an officer of 70 investment companies (comprised of 167 portfolios) managed by the Manager. He is 50 years old and has been an employee of the Manager since October 1988.
ROBERT SALVIOLO, Assistant Treasurer since July 2007.
Senior Accounting Manager – Equity Funds of the Manager, and an officer of 70 investment companies (comprised of 167 portfolios) managed by the Manager. He is 47 years old and has been an employee of the Manager since June 1989.
ROBERT SVAGNA, Assistant Treasurer since December 2002.
Senior Accounting Manager – Equity Funds of the Manager, and an officer of 70 investment companies (comprised of 167 portfolios) managed by the Manager. He is 47 years old and has been an employee of the Manager since November 1990.
JOSEPH W. CONNOLLY, Chief Compliance Officer since October 2004.
Chief Compliance Officer of the Manager and The Dreyfus Family of Funds (70 investment companies, comprised of 167 portfolios). He is 57 years old and has served in various capacities with the Manager since 1980, including manager of the firm’s Fund Accounting Department from 1997 through October 2001.
MATTHEW D. CONNOLLY, Anti-Money Laundering Compliance Officer since April 2012.
Anti-Money Laundering Compliance Officer of the Distributor since October 2011; from March 2010 to September 2011, Global Head, KYC Reviews and Director of UBS Investment Bank; until March 2010, AML Compliance Officer and Senior Vice President of Citi Global Wealth Management. He is an officer of 65 investment companies (comprised of 162 portfolios) managed by the Manager. He is 42 years old and has been an employee of the Distributor since October 2011.
The Fund 35
For More Information
Ticker Symbol: DSCVX
Telephone 1-800-DREYFUS
Mail The Dreyfus Family of Funds, 144 Glenn Curtiss Boulevard, Uniondale, NY 11556-0144 E-mail Send your request to info@dreyfus.com Internet Information can be viewed online or downloaded at: http://www.dreyfus.com
The fund files its complete schedule of portfolio holdings with the Securities and Exchange Commission (“SEC”) for the first and third quarters of each fiscal year on Form N-Q. The fund’s Forms N-Q are available on the SEC’s website at http://www.sec.gov and may be reviewed and copied at the SEC’s Public Reference Room in Washington, DC. Information on the operation of the Public Reference Room may be obtained by calling 1-800-SEC-0330.
A description of the policies and procedures that the fund uses to determine how to vote proxies relating to portfolio securities, and information regarding how the fund voted these proxies for the most recent 12-month period ended June 30 is available at http://www.dreyfus.com and on the SEC’s website at http://www.sec.gov. The description of the policies and procedures is also available without charge, upon request, by calling 1-800-DREYFUS.

|
| Dreyfus |
| Opportunistic |
| U.S. Stock Fund |
ANNUAL REPORT August 31, 2014

Save time. Save paper. View your next shareholder report online as soon as it’s available. Log into www.dreyfus.com and sign up for Dreyfus eCommunications. It’s simple and only takes a few minutes.
The views expressed in this report reflect those of the portfolio manager only through the end of the period covered and do not necessarily represent the views of Dreyfus or any other person in the Dreyfus organization. Any such views are subject to change at any time based upon market or other conditions and Dreyfus disclaims any responsibility to update such views.These views may not be relied on as investment advice and, because investment decisions for a Dreyfus fund are based on numerous factors, may not be relied on as an indication of trading intent on behalf of any Dreyfus fund.
|
| Not FDIC-Insured • Not Bank-Guaranteed • May Lose Value |
| | Contents |
| | THE FUND |
| 2 | A Letter from the President |
| 3 | Discussion of Fund Performance |
| 6 | Fund Performance |
| 8 | Understanding Your Fund’s Expenses |
| 8 | Comparing Your Fund’s Expenses With Those of Other Funds |
| 9 | Statement of Investments |
| 12 | Statement of Assets and Liabilities |
| 13 | Statement of Operations |
| 14 | Statement of Changes in Net Assets |
| 16 | Financial Highlights |
| 19 | Notes to Financial Statements |
| 29 | Report of Independent Registered Public Accounting Firm |
| 30 | Important Tax Information |
| 31 | Information About the Renewal of the Fund’s Management Agreement |
| 36 | Board Members Information |
| 38 | Officers of the Fund |
| | FOR MORE INFORMATION |
| | Back Cover |
Dreyfus
Opportunistic
U.S. Stock Fund
The Fund
A LETTER FROM THE PRESIDENT
Dear Shareholder:
We are pleased to present this annual report for Dreyfus Opportunistic U.S. Stock Fund, covering the 12-month period from September 1, 2013, through August 31, 2014. For information about how the fund performed during the reporting period, as well as general market perspectives, we provide a Discussion of Fund Performance on the pages that follow.
Despite occasional bouts of heightened volatility, U.S. stocks generally gained ground steadily over the reporting period as the domestic economy rebounded. As a result, most broad measures of equity market performance established a series of new record highs over the past 12 months. Growth-oriented and more economically sensitive stocks generally fared well over the reporting period’s first half, but value-oriented stocks rallied more strongly over the second half.
We remain cautiously optimistic regarding the U.S. stock market’s prospects. We currently expect the economy to continue to accelerate as several long-standing drags, including tight fiscal policies and private sector deleveraging, fade from the scene. Of course, a number of risks remain, including the possibilities of higher short-term interest rates and intensifying geopolitical turmoil.Therefore, we suggest you talk regularly with your financial advisor to assess the potential impact of these and other macroeconomic developments on your investments.
Thank you for your continued confidence and support.

J. Charles Cardona
President
The Dreyfus Corporation
September 15, 2014
2
DISCUSSION OF FUND PERFORMANCE
For the period of September 1, 2013, through August 31, 2014, as provided by David A. Daglio, Primary Portfolio Manager
Fund and Market Performance Overview
For the 12-month period ended August 31, 2014, Dreyfus Opportunistic U.S. Stock Fund’s Class A shares produced a total return of 26.73%, Class C shares returned 25.81%, and Class I shares returned 27.00%.1 In comparison, the fund’s benchmark, the Russell 3000® Index (the “Index”), produced a total return of 24.74%.2
Despite occasional bouts of heightened volatility, U.S. stocks generally climbed during the reporting period in an environment of improving economic growth.The fund produced higher returns than its benchmark, mainly due to the success of our security selection strategy in the financials and health care sectors.
The Fund’s Investment Approach
The fund seeks long-term capital appreciation. The fund normally invests at least 80% of its assets in the stocks of publicly traded companies located in the United States.The fund may invest in the stocks of companies of any market capitalization and may hold growth or value stocks or a blend of both.
Stocks are selected for the fund’s portfolio based on a combination of fundamental, bottom-up research, macro insights, and risk management. With support from a team of research analysts, we use a disciplined, opportunistic investment approach to identify stocks of companies that we believe to be attractive from a valuation and fundamental standpoint, including those that are trading materially below our estimate of intrinsic market value, those that have strong or improving fundamentals, and those that have a revaluation catalyst. We focus on understanding the current fundamentals driving a company’s profits and cash flow, valuing the liabilities most likely to impact the company’s business, and evaluating business conditions most likely to affect the company’s prospects for future growth.
Stocks Advanced Strongly in a Broad Market Rally
Stocks generally gained value over the final months of 2013 in response to encouraging global and domestic economic data, enabling several broad measures of U.S. stock
The Fund 3
DISCUSSION OF FUND PERFORMANCE (continued)
market performance to end 2013 near record highs.The market relinquished some of its gains in January 2014 due to concerns regarding economic slowdowns in the world’s emerging markets, but stocks rebounded in February when those worries proved to be overblown. Another bout of weakness in the spring stemmed from the adverse impact of unusually harsh winter weather on economic activity.This downturn hit the information technology and biotechnology industry groups particularly hard, triggering a shift in market leadership from more aggressive growth stocks to their better established, value-oriented counterparts. However, the economic recovery resumed in warmer weather, and positive economic data drove stocks of all capitalization ranges to a series of new record highs over the reporting period’s final three months.
Favorable Security Selections Buoyed Fund Results
The fund participated more than fully in the broad stock market rally, achieving especially strong results in the financials sector. Financial institutions leveraged to rising financial markets and the economic recovery advanced strongly, including online brokers E*TRADE Financial and TD Ameritrade Holding. Both companies achieved higher trading volumes and customer growth during the rebound.
In the health care sector, our focus on solid business fundamentals and attractive valuations among pharmaceutical developers and biotechnology firms helped the fund withstand the early spring downturn in both industry groups. Indeed, we took advantage of the market dip to add to some health care holdings that we believed would enjoy strong long-term prospects. This approach paid off with biopharmaceutical company Gilead Sciences, which benefited from strong sales of a revolutionary treatment for Hepatitis C. Drugmaker Forest Laboratories nearly doubled in value when it was acquired at a substantial premium to its stock price at the time.
These positive relative results were partly offset by shortfalls in other areas. Most notably, some information technology companies lagged market averages when an increase in corporate capital spending proved less robust than many analysts expected, weighing on the stock prices of holdings such as telecommunications equipment maker JDS Uniphase. The fund also was hurt by lack of exposure to consumer electronics giant Apple, which did not meet our valuation criteria. Overweighted exposure to small-cap stocks further undermined relative performance during a reporting period in which large-cap stocks typically fared better.
4
Continuing to Find Attractive Multi-Cap Opportunities
We recently have been encouraged by improved U.S. economic activity, including a stronger labor market. In our judgment, an extended economic recovery should be good for stocks across the market’s various capitalization ranges. However, valuations have climbed and interest rates may rise, suggesting that selectivity is likely to become more critical to investment success. Our bottom-up security selection process has identified an ample number of opportunities in the financials, health care, and information technology sectors, but fewer in the more richly valued consumer staples, consumer discretionary, utilities, and telecommunications services sectors.
September 15, 2014
Please note, the position in any security highlighted with italicized typeface was sold during the reporting period. Equity funds are subject generally to market, market sector, market liquidity, issuer, and investment style risks, among other factors, to varying degrees, all of which are more fully described in the fund’s prospectus.
Stocks of small- and/or midcap companies often experience sharper price fluctuations than stocks of large-cap companies. The fund’s performance will be influenced by political, social, and economic factors affecting investments in foreign companies. Special risks associated with investments in foreign companies include exposure to currency fluctuations, less liquidity, less developed or less efficient trading markets, lack of comprehensive company information, political instability, and differing auditing and legal standards.These risks are enhanced in emerging market countries. Please read the prospectus for further discussion of these risks.
|
| 1 Total return includes reinvestment of dividends and any capital gains paid and does not take into consideration the |
| maximum initial sales charge in the case of Class A shares, or the applicable contingent deferred sales charge |
| imposed on redemptions in the case of Class C shares. Had these charges been reflected, returns would have been |
| lower. Past performance is no guarantee of future results. Share price and investment return fluctuate such that upon |
| redemption fund shares may be worth more or less than their original cost. The fund’s returns reflect the absorption |
| of certain fund expenses by The Dreyfus Corporation pursuant to an agreement in effect through February 1, 2015, |
| at which time it may be extended, terminated, or modified. Had these expenses not been absorbed, the fund’s returns |
| would have been lower. |
| 2 SOURCE: LIPPER INC. — Reflects the reinvestment of dividends and, where applicable, capital gain |
| distributions.The Russell 3000® Index is composed of the 3,000 largest U.S. companies based on total market |
| capitalization. Investors cannot invest directly in any index. |
The Fund 5
FUND PERFORMANCE
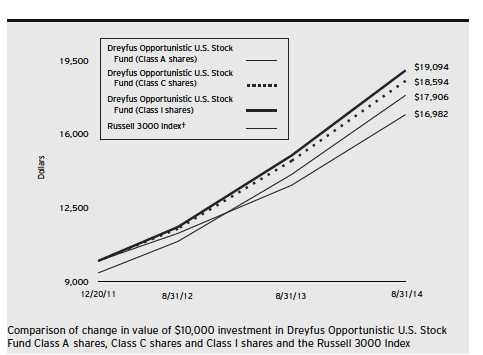
|
| † Source: Lipper Inc. |
| Past performance is not predictive of future performance. |
| The above graph compares a $10,000 investment made in each of the Class A, Class C and Class I shares of Dreyfus |
| Opportunistic U.S. Stock Fund on 12/20/11 (inception date) to a $10,000 investment made in the Russell 3000 |
| Index (the “Index”) on that date.All dividends and capital gain distributions are reinvested. |
| The fund’s performance shown in the line graph above takes into account the maximum initial sales charge on Class A |
| shares and all other applicable fees and expenses on all classes.The Index measures the performance of the largest 3,000 |
| U.S. companies representing approximately 98% of the investable U.S. equity market. Unlike a mutual fund, the Index |
| is not subject to charges, fees and other expenses. Investors cannot invest directly in any index. Further information |
| relating to fund performance, including expense reimbursements, if applicable, is contained in the Financial Highlights |
| section of the prospectus and elsewhere in this report. |
6
| | | | | |
| Average Annual Total Returns as of 8/31/14 | | | | | |
| |
| | Inception | | | From | |
| | Date | 1 Year | | Inception | |
| Class A shares | | | | | |
| with maximum sales charge (5.75%) | 12/20/11 | 19.47 | % | 24.08 | % |
| without sales charge | 12/20/11 | 26.73 | % | 26.82 | % |
| Class C shares | | | | | |
| with applicable redemption charge† | 12/20/11 | 24.81 | % | 25.82 | % |
| without redemption | 12/20/11 | 25.81 | % | 25.82 | % |
| Class I shares | 12/20/11 | 27.00 | % | 27.07 | % |
| Russell 3000 Index | 12/31/11 | 24.74 | % | 21.97 | %†† |
Past performance is not predictive of future performance. The fund’s performance shown in the graph and table does not reflect the deduction of taxes that a shareholder would pay on fund distributions or the redemption of fund shares. In addition to the performance of Class A shares shown with and without a maximum sales charge, the fund’s performance shown in the table takes into account all other applicable fees and expenses on all classes.
| |
| † | The maximum contingent deferred sales charge for Class C shares is 1% for shares redeemed within one year of the |
| | date of purchase. |
| †† | For comparative purposes, the value of the Index on 12/31/11 is used as the beginning value on 12/20/11. |
The Fund 7
UNDERSTANDING YOUR FUND’S EXPENSES (Unaudited)
As a mutual fund investor, you pay ongoing expenses, such as management fees and other expenses. Using the information below, you can estimate how these expenses affect your investment and compare them with the expenses of other funds.You also may pay one-time transaction expenses, including sales charges (loads) and redemption fees, which are not shown in this section and would have resulted in higher total expenses. For more information, see your fund’s prospectus or talk to your financial adviser.
Review your fund’s expenses
The table below shows the expenses you would have paid on a $1,000 investment in Dreyfus Opportunistic U.S. Stock Fund from March 1, 2014 to August 31, 2014. It also shows how much a $1,000 investment would be worth at the close of the period, assuming actual returns and expenses.
Expenses and Value of a $1,000 Investment
assuming actual returns for the six months ended August 31, 2014
| | | | | | |
| | | Class A | | Class C | | Class I |
| Expenses paid per $1,000† | $ | 6.09 | $ | 9.87 | $ | 4.82 |
| Ending value (after expenses) | $ | 1,012.30 | $ | 1,008.50 | $ | 1,013.20 |
COMPARING YOUR FUND’S EXPENSES
WITH THOSE OF OTHER FUNDS (Unaudited)
Using the SEC’s method to compare expenses
The Securities and Exchange Commission (SEC) has established guidelines to help investors assess fund expenses. Per these guidelines, the table below shows your fund’s expenses based on a $1,000 investment, assuming a hypothetical 5% annualized return. You can use this information to compare the ongoing expenses (but not transaction expenses or total cost) of investing in the fund with those of other funds. All mutual fund shareholder reports will provide this information to help you make this comparison. Please note that you cannot use this information to estimate your actual ending account balance and expenses paid during the period.
Expenses and Value of a $1,000 Investment
assuming a hypothetical 5% annualized return for the six months ended August 31, 2014
| | | | | | |
| | | Class A | | Class C | | Class I |
| Expenses paid per $1,000† | $ | 6.11 | $ | 9.91 | $ | 4.84 |
| Ending value (after expenses) | $ | 1,019.16 | $ | 1,015.38 | $ | 1,020.42 |
|
| † Expenses are equal to the fund’s annualized expense ratio of 1.20% for Class A, 1.95% for Class C and .95% |
| for Class I, multiplied by the average account value over the period, multiplied by 184/365 (to reflect the one-half |
| year period). |
8
|
| STATEMENT OF INVESTMENTS |
| August 31, 2014 |
| | | |
| Common Stocks—99.8% | Shares | | Value ($) |
| Banks—9.0% | | | |
| Comerica | 9,860 | | 496,352 |
| SVB Financial Group | 6,620 | a | 736,938 |
| Wells Fargo & Co. | 13,060 | | 671,806 |
| | | | 1,905,096 |
| Capital Goods—6.6% | | | |
| Danaher | 5,580 | | 427,484 |
| MSC Industrial Direct, Cl. A | 4,500 | | 405,630 |
| Parker Hannifin | 4,980 | | 575,190 |
| | | | 1,408,304 |
| Commercial & Professional Services—2.9% | | | |
| Steelcase, Cl. A | 39,430 | | 619,051 |
| Consumer Durables & Apparel—1.6% | | | |
| Michael Kors Holdings | 4,140 | a | 331,697 |
| Consumer Services—1.5% | | | |
| Las Vegas Sands | 4,660 | | 309,937 |
| Diversified Financials—15.7% | | | |
| Discover Financial Services | 10,210 | | 636,798 |
| E*TRADE Financial | 24,270 | a | 540,250 |
| Goldman Sachs Group | 2,900 | | 519,419 |
| Invesco | 13,540 | | 552,974 |
| Raymond James Financial | 8,890 | | 485,750 |
| TD Ameritrade Holding | 17,810 | | 589,689 |
| | | | 3,324,880 |
| Energy—5.5% | | | |
| Anadarko Petroleum | 3,770 | | 424,841 |
| Phillips 66 | 4,580 | | 398,552 |
| Schlumberger | 3,110 | | 340,980 |
| | | | 1,164,373 |
| Exchange-Traded Funds—1.4% | | | |
| SPDR S&P 500 ETF Trust | 1,510 | | 303,072 |
| Food, Beverage & Tobacco—3.9% | | | |
| PepsiCo | 4,610 | | 426,379 |
| Philip Morris International | 4,760 | | 407,361 |
| | | | 833,740 |
The Fund 9
STATEMENT OF INVESTMENTS (continued)
| | | |
| Common Stocks (continued) | Shares | | Value ($) |
| Health Care Equipment & Services—3.9% | | | |
| AmerisourceBergen | 4,963 | | 384,087 |
| HCA Holdings | 6,220 | a | 434,280 |
| | | | 818,367 |
| Materials—2.3% | | | |
| Yamana Gold | 56,550 | | 480,675 |
| Media—3.1% | | | |
| AMC Networks, Cl. A | 5,000 | a | 312,875 |
| Viacom, Cl. B | 4,280 | | 347,322 |
| | | | 660,197 |
| Pharmaceuticals, Biotech & Life Sciences—14.4% | | | |
| Actavis | 1,874 | a | 425,360 |
| Agilent Technologies | 5,130 | | 293,231 |
| Biogen Idec | 1,370 | a | 469,965 |
| Gilead Sciences | 6,180 | a | 664,844 |
| Illumina | 2,300 | a | 412,528 |
| Isis Pharmaceuticals | 5,200 | a | 211,952 |
| Perrigo Company | 2,180 | | 324,253 |
| Vertex Pharmaceuticals | 2,760 | a | 258,253 |
| | | | 3,060,386 |
| Real Estate—2.4% | | | |
| Realogy Holdings | 12,710 | a | 518,187 |
| Semiconductors & Semiconductor Equipment—5.5% | | | |
| Applied Micro Circuits | 31,010 | a | 262,655 |
| Mellanox Technologies | 12,200 | a | 509,838 |
| Veeco Instruments | 11,350 | a | 401,449 |
| | | | 1,173,942 |
| Software & Services—8.2% | | | |
| Dealertrack Technologies | 5,850 | a | 261,846 |
| Google, Cl. A | 410 | a | 238,768 |
| Google, Cl. C | 780 | a | 445,848 |
| Microsoft | 13,030 | | 591,953 |
| Symantec | 8,490 | | 206,137 |
| | | | 1,744,552 |
| Technology Hardware & Equipment—9.3% | | | |
| Arrow Electronics | 4,960 | a | 308,760 |
| Ciena | 29,770 | a | 615,941 |
| EMC | 10,700 | | 315,971 |
10
| | | | |
| Common Stocks (continued) | Shares | | Value ($) | |
| Technology Hardware & Equipment (continued) | | | | |
| JDS Uniphase | 41,500 | a | 479,325 | |
| Juniper Networks | 10,540 | | 244,423 | |
| | | | 1,964,420 | |
| Transportation—2.6% | | | | |
| Kirby | 4,530 | a | 540,384 | |
| Total Common Stocks | | | | |
| (cost $18,772,093) | | | 21,161,260 | |
| |
| Other Investment—.4% | | | | |
| Registered Investment Company; | | | | |
| Dreyfus Institutional Preferred | | | | |
| Plus Money Market Fund | | | | |
| (cost $83,526) | 83,526 | b | 83,526 | |
| |
| Total Investments (cost $18,855,619) | 100.2 | % | 21,244,786 | |
| Liabilities, Less Cash and Receivables | (.2 | %) | (50,937 | ) |
| Net Assets | 100.0 | % | 21,193,849 | |
ETF — Exchange-Traded Fund
| |
| a | Non-income producing security. |
| b | Investment in affiliated money market mutual fund. |
| | | |
| Portfolio Summary (Unaudited)† | | |
| |
| | Value (%) | | Value (%) |
| Diversified Financials | 15.7 | Health Care Equipment & Services | 3.9 |
| Pharmaceuticals, Biotech & | | Media | 3.1 |
| Life Sciences | 14.4 | Commercial & Professional Services | 2.9 |
| Technology Hardware & Equipment | 9.3 | Transportation | 2.6 |
| Banks | 9.0 | Real Estate | 2.4 |
| Software & Services | 8.2 | Materials | 2.3 |
| Capital Goods | 6.6 | Consumer Durables & Apparel | 1.6 |
| Energy | 5.5 | Consumer Services | 1.5 |
| Semiconductors & Semiconductor | | Exchange-Traded Funds | 1.4 |
| Equipment | 5.5 | Money Market Investment | .4 |
| Food, Beverage & Tobacco | 3.9 | | 100.2 |
| |
| † Based on net assets. | | | |
| See notes to financial statements. | | | |
The Fund 11
|
| STATEMENT OF ASSETS AND LIABILITIES |
| August 31, 2014 |
| | | |
| | | Cost | Value |
| Assets ($): | | | |
| Investments in securities—See Statement of Investments: | | |
| Unaffiliated issuers | | 18,772,093 | 21,161,260 |
| Affiliated issuers | | 83,526 | 83,526 |
| Cash | | | 153,759 |
| Receivable for investment securities sold | | | 306,439 |
| Dividends receivable | | | 18,281 |
| Receivable for shares of Common Stock subscribed | | | 4,995 |
| Prepaid expenses | | | 7,716 |
| | | | 21,735,976 |
| Liabilities ($): | | | |
| Due to The Dreyfus Corporation and affiliates—Note 3(c) | | 12,910 |
| Payable for investment securities purchased | | | 484,591 |
| Accrued expenses | | | 44,626 |
| | | | 542,127 |
| Net Assets ($) | | | 21,193,849 |
| Composition of Net Assets ($): | | | |
| Paid-in capital | | | 17,919,958 |
| Accumulated net realized gain (loss) on investments | | | 884,724 |
| Accumulated net unrealized appreciation | | | |
| (depreciation) on investments | | | 2,389,167 |
| Net Assets ($) | | | 21,193,849 |
| |
| |
| Net Asset Value Per Share | | | |
| | Class A | Class C | Class I |
| Net Assets ($) | 15,355,017 | 719,826 | 5,119,006 |
| Shares Outstanding | 744,811 | 35,497 | 247,306 |
| Net Asset Value Per Share ($) | 20.62 | 20.28 | 20.70 |
| See notes to financial statements. | | | |
12
| | |
| STATEMENT OF OPERATIONS | | |
| Year Ended August 31, 2014 | | |
| |
| |
| |
| |
| Investment Income ($): | | |
| Income: | | |
| Cash dividends (net of $448 foreign taxes withheld at source): | | |
| Unaffiliated issuers | 163,504 | |
| Affiliated issuers | 121 | |
| Income from securities lending—Note 1(b) | 88 | |
| Total Income | 163,713 | |
| Expenses: | | |
| Management fee—Note 3(a) | 107,780 | |
| Professional fees | 43,984 | |
| Registration fees | 42,229 | |
| Shareholder servicing costs—Note 3(c) | 32,763 | |
| Prospectus and shareholders’ reports | 8,132 | |
| Custodian fees—Note 3(c) | 5,017 | |
| Distribution fees—Note 3(b) | 2,612 | |
| Directors’ fees and expenses—Note 3(d) | 1,153 | |
| Loan commitment fees—Note 2 | 143 | |
| Miscellaneous | 14,963 | |
| Total Expenses | 258,776 | |
| Less—reduction in expenses due to undertaking—Note 3(a) | (95,569 | ) |
| Less—reduction in fees due to earnings credits—Note 3(c) | (8 | ) |
| Net Expenses | 163,199 | |
| Investment Income—Net | 514 | |
| Realized and Unrealized Gain (Loss) on Investments—Note 4 ($): | | |
| Net realized gain (loss) on investments | 1,094,609 | |
| Net unrealized appreciation (depreciation) on investments | 1,656,973 | |
| Net Realized and Unrealized Gain (Loss) on Investments | 2,751,582 | |
| Net Increase in Net Assets Resulting from Operations | 2,752,096 | |
| |
| See notes to financial statements. | | |
The Fund 13
STATEMENT OF CHANGES IN NET ASSETS
| | | | |
| | Year Ended August 31, | |
| | 2014 | | 2013 | |
| Operations ($): | | | | |
| Investment income—net | 514 | | 15,859 | |
| Net realized gain (loss) on investments | 1,094,609 | | 806,528 | |
| Net unrealized appreciation | | | | |
| (depreciation) on investments | 1,656,973 | | 345,153 | |
| Net Increase (Decrease) in Net Assets | | | | |
| Resulting from Operations | 2,752,096 | | 1,167,540 | |
| Dividends to Shareholders from ($): | | | | |
| Investment income—net: | | | | |
| Class A | (632 | ) | (1,204 | ) |
| Class I | (5,885 | ) | (24,364 | ) |
| Net realized gain on investments: | | | | |
| Class A | (501,146 | ) | (9,879 | ) |
| Class C | (17,102 | ) | (1,858 | ) |
| Class I | (399,816 | ) | (172,461 | ) |
| Total Dividends | (924,581 | ) | (209,766 | ) |
| Capital Stock Transactions ($): | | | | |
| Net proceeds from shares sold: | | | | |
| Class A | 12,319,904 | | 3,122,974 | |
| Class C | 757,405 | | 15,472 | |
| Class I | 149,932 | | 34,240 | |
| Dividends reinvested: | | | | |
| Class A | 499,163 | | 10,003 | |
| Class C | 15,770 | | 1,281 | |
| Class I | 2,995 | | 383 | |
| Cost of shares redeemed: | | | | |
| Class A | (1,684,463 | ) | (239,371 | ) |
| Class C | (124,668 | ) | (8,486 | ) |
| Class I | (9,965 | ) | (9,953 | ) |
| Increase (Decrease) in Net Assets | | | | |
| from Capital Stock Transactions | 11,926,073 | | 2,926,543 | |
| Total Increase (Decrease) in Net Assets | 13,753,588 | | 3,884,317 | |
| Net Assets ($): | | | | |
| Beginning of Period | 7,440,261 | | 3,555,944 | |
| End of Period | 21,193,849 | | 7,440,261 | |
| Undistributed investment income—net | — | | 1,248 | |
14
| | | | |
| | Year Ended August 31, | |
| | 2014 | | 2013 | |
| Capital Share Transactions: | | | | |
| Class Aa | | | | |
| Shares sold | 626,885 | | 184,422 | |
| Shares issued for dividends reinvested | 27,412 | | 678 | |
| Shares redeemed | (85,092 | ) | (13,716 | ) |
| Net Increase (Decrease) in Shares Outstanding | 569,205 | | 171,384 | |
| Class Ca | | | | |
| Shares sold | 38,199 | | 949 | |
| Shares issued for dividends reinvested | 876 | | 87 | |
| Shares redeemed | (6,388 | ) | (499 | ) |
| Net Increase (Decrease) in Shares Outstanding | 32,687 | | 537 | |
| Class I | | | | |
| Shares sold | 7,605 | | 2,183 | |
| Shares issued for dividends reinvested | 164 | | 26 | |
| Shares redeemed | (501 | ) | (675 | ) |
| Net Increase (Decrease) in Shares Outstanding | 7,268 | | 1,534 | |
|
| a During the period ended August 31, 2013, 451 Class C shares representing $7,775 were exchanged for 449 |
| Class A shares. |
See notes to financial statements.
The Fund 15
FINANCIAL HIGHLIGHTS
The following tables describe the performance for each share class for the fiscal periods indicated. All information (except portfolio turnover rate) reflects financial results for a single fund share.Total return shows how much your investment in the fund would have increased (or decreased) during each period, assuming you had reinvested all dividends and distributions.These figures have been derived from the fund’s financial statements.
| | | | | | |
| | Year Ended August 31, | |
| Class A Shares | 2014 | | 2013 | | 2012 | a |
| Per Share Data ($): | | | | | | |
| Net asset value, beginning of period | 17.75 | | 14.49 | | 12.50 | |
| Investment Operations: | | | | | | |
| Investment income (loss)—netb | (.02 | ) | (.01 | ) | .02 | |
| Net realized and unrealized gain | | | | | | |
| (loss) on investments | 4.55 | | 4.08 | | 1.97 | |
| Total from Investment Operations | 4.53 | | 4.07 | | 1.99 | |
| Distributions: | | | | | | |
| Dividends from investment income—net | (.00 | )c | (.09 | ) | — | |
| Dividends from net realized gain on investments | (1.66 | ) | (.72 | ) | — | |
| Total Distributions | (1.66 | ) | (.81 | ) | — | |
| Net asset value, end of period | 20.62 | | 17.75 | | 14.49 | |
| Total Return (%)d | 26.73 | | 29.30 | | 15.92 | e |
| Ratios/Supplemental Data (%): | | | | | | |
| Ratio of total expenses | | | | | | |
| to average net assets | 1.86 | | 2.93 | | 7.51 | f |
| Ratio of net expenses | | | | | | |
| to average net assets | 1.20 | | 1.20 | | 1.20 | f |
| Ratio of net investment income (loss) | | | | | | |
| to average net assets | (.09 | ) | (.04 | ) | .18 | f |
| Portfolio Turnover Rate | 111.14 | | 142.83 | | 46.51 | e |
| Net Assets, end of period ($ x 1,000) | 15,355 | | 3,118 | | 61 | |
| |
| a | From December 20, 2011 (commencement of operations) to August 31, 2012. |
| b | Based on average shares outstanding. |
| c | Amount represents less than $.01 per share. |
| d | Exclusive of sales charge. |
| e | Not annualized. |
| f | Annualized. |
See notes to financial statements.
16
| | | | | | |
| | | | Year Ended August 31, | |
| Class C Shares | 2014 | | 2013 | | 2012 | a |
| Per Share Data ($): | | | | | | |
| Net asset value, beginning of period | 17.61 | | 14.42 | | 12.50 | |
| Investment Operations: | | | | | | |
| Investment (loss)—netb | (.17 | ) | (.10 | ) | (.05 | ) |
| Net realized and unrealized gain | | | | | | |
| (loss) on investments | 4.50 | | 4.01 | | 1.97 | |
| Total from Investment Operations | 4.33 | | 3.91 | | 1.92 | |
| Distributions: | | | | | | |
| Dividends from net realized gain on investments | (1.66 | ) | (.72 | ) | — | |
| Net asset value, end of period | 20.28 | | 17.61 | | 14.42 | |
| Total Return (%)c | 25.81 | | 28.12 | | 15.36 | d |
| Ratios/Supplemental Data (%): | | | | | | |
| Ratio of total expenses | | | | | | |
| to average net assets | 2.75 | | 5.44 | | 8.09 | e |
| Ratio of net expenses | | | | | | |
| to average net assets | 1.95 | | 1.95 | | 1.95 | e |
| Ratio of net investment (loss) | | | | | | |
| to average net assets | (.87 | ) | (.60 | ) | (.53 | )e |
| Portfolio Turnover Rate | 111.14 | | 142.83 | | 46.51 | d |
| Net Assets, end of period ($ x 1,000) | 720 | | 49 | | 33 | |
| |
| a | From December 20, 2011 (commencement of operations) to August 31, 2012. |
| b | Based on average shares outstanding. |
| c | Exclusive of sales charge. |
| d | Not annualized. |
| e | Annualized. |
See notes to financial statements.
The Fund 17
FINANCIAL HIGHLIGHTS (continued)
| | | | | | |
| | | | Year Ended August 31, | |
| Class I Shares | 2014 | | 2013 | | 2012 | a |
| Per Share Data ($): | | | | | | |
| Net asset value, beginning of period | 17.80 | | 14.52 | | 12.50 | |
| Investment Operations: | | | | | | |
| Investment income—netb | .05 | | .07 | | .04 | |
| Net realized and unrealized gain | | | | | | |
| (loss) on investments | 4.53 | | 4.03 | | 1.98 | |
| Total from Investment Operations | 4.58 | | 4.10 | | 2.02 | |
| Distributions: | | | | | | |
| Dividends from investment income—net | (.02 | ) | (.10 | ) | — | |
| Dividends from net realized gain on investments | (1.66 | ) | (.72 | ) | — | |
| Total Distributions | (1.68 | ) | (.82 | ) | — | |
| Net asset value, end of period | 20.70 | | 17.80 | | 14.52 | |
| Total Return (%) | 27.00 | | 29.43 | | 16.16 | c |
| Ratios/Supplemental Data (%): | | | | | | |
| Ratio of total expenses | | | | | | |
| to average net assets | 1.61 | | 4.05 | | 7.13 | d |
| Ratio of net expenses | | | | | | |
| to average net assets | .95 | | .95 | | .95 | d |
| Ratio of net investment income | | | | | | |
| to average net assets | .24 | | .43 | | .40 | d |
| Portfolio Turnover Rate | 111.14 | | 142.83 | | 46.51 | c |
| Net Assets, end of period ($ x 1,000) | 5,119 | | 4,273 | | 3,462 | |
| |
| a | From December 20, 2011 (commencement of operations) to August 31, 2012. |
| b | Based on average shares outstanding. |
| c | Not annualized. |
| d | Annualized. |
See notes to financial statements.
18
NOTES TO FINANCIAL STATEMENTS
NOTE 1—Significant Accounting Policies:
Dreyfus Opportunistic U.S. Stock Fund (the “fund”) is a separate diversified series of Advantage Funds, Inc. (the “Company”), which is registered under the Investment Company Act of 1940, as amended (the “Act”), as an open-end management investment company and operates as a series company currently offering eleven series, including the fund.The fund’s investment objective is to seek long-term capital appreciation.The Dreyfus Corporation (the “Manager” or “Dreyfus”), a wholly-owned subsidiary of The Bank of New York Mellon Corporation (“BNY Mellon”), serves as the fund’s investment adviser.
MBSC Securities Corporation (the “Distributor”), a wholly-owned subsidiary of the Manager, is the distributor of the fund’s shares. The fund is authorized to issue 100 million shares of $.001 par value Common Stock in each of the following classes of shares: Class A, Class C and Class I. Class A shares generally are subject to a sales charge imposed at the time of purchase. Class C shares are subject to a contingent deferred sales charge (“CDSC”) imposed on Class C shares redeemed within one year of purchase. Class I shares are sold at net asset value per share generally to institutional investors. Other differences between the classes include the services offered to and the expenses borne by each class, the allocation of certain transfer agency costs, and certain voting rights. Income, expenses (other than expenses attributable to a specific class), and realized and unrealized gains or losses on investments are allocated to each class of shares based on its relative net assets.
As of August 31, 2014, MBC Investments Corp., an indirect subsidiary of BNY Mellon, held 238,400 Class I shares of the fund.
The Fund 19
NOTES TO FINANCIAL STATEMENTS (continued)
The Company accounts separately for the assets, liabilities and operations of each series. Expenses directly attributable to each series are charged to that series’ operations; expenses which are applicable to all series are allocated among them on a pro rata basis.
The Financial Accounting Standards Board (“FASB”) Accounting Standards Codification is the exclusive reference of authoritative U.S. generally accepted accounting principles (“GAAP”) recognized by the FASB to be applied by nongovernmental entities. Rules and interpretive releases of the Securities and Exchange Commission (“SEC”) under authority of federal laws are also sources of authoritative GAAP for SEC registrants. The fund’s financial statements are prepared in accordance with GAAP, which may require the use of management estimates and assumptions. Actual results could differ from those estimates.
The Company enters into contracts that contain a variety of indemnifications. The fund’s maximum exposure under these arrangements is unknown.The fund does not anticipate recognizing any loss related to these arrangements.
(a) Portfolio valuation: The fair value of a financial instrument is the amount that would be received to sell an asset or paid to transfer a liability in an orderly transaction between market participants at the measurement date (i.e., the exit price). GAAP establishes a fair value hierarchy that prioritizes the inputs of valuation techniques used to measure fair value. This hierarchy gives the highest priority to unadjusted quoted prices in active markets for identical assets or liabilities (Level 1 measurements) and the lowest priority to unobservable inputs (Level 3 measurements).
Additionally, GAAP provides guidance on determining whether the volume and activity in a market has decreased significantly and whether such a decrease in activity results in transactions that are not orderly. GAAP requires enhanced disclosures around valuation inputs and techniques used during annual and interim periods.
20
Various inputs are used in determining the value of the fund’s investments relating to fair value measurements.These inputs are summarized in the three broad levels listed below:
Level 1—unadjusted quoted prices in active markets for identical investments.
Level 2—other significant observable inputs (including quoted prices for similar investments, interest rates, prepayment speeds, credit risk, etc.).
Level 3—significant unobservable inputs (including the fund’s own assumptions in determining the fair value of investments).
The inputs or methodology used for valuing securities are not necessarily an indication of the risk associated with investing in those securities.
Changes in valuation techniques may result in transfers in or out of an assigned level within the disclosure hierarchy. Valuation techniques used to value the fund’s investments are as follows:
Investments in securities are valued at the last sales price on the securities exchange or national securities market on which such securities are primarily traded. Securities listed on the National Market System for which market quotations are available are valued at the official closing price or, if there is no official closing price that day, at the last sales price. Securities not listed on an exchange or the national securities market, or securities for which there were no transactions, are valued at the average of the most recent bid and asked prices, except for open short positions, where the asked price is used for valuation purposes. Bid price is used when no asked price is available. Registered investment companies that are not traded on an exchange are valued at their net asset value.All of the preceding securities are generally categorized within Level 1 of the fair value hierarchy.
The Fund 21
NOTES TO FINANCIAL STATEMENTS (continued)
Fair valuing of securities may be determined with the assistance of a pricing service using calculations based on indices of domestic securities and other appropriate indicators, such as prices of relevant American Depository Receipts and financial futures. Utilizing these techniques may result in transfers between Level 1 and Level 2 of the fair value hierarchy.
When market quotations or official closing prices are not readily available, or are determined not to reflect accurately fair value, such as when the value of a security has been significantly affected by events after the close of the exchange or market on which the security is principally traded (for example, a foreign exchange or market), but before the fund calculates its net asset value, the fund may value these investments at fair value as determined in accordance with the procedures approved by the Company’s Board of Directors (the “Board”). Certain factors may be considered when fair valuing investments such as: fundamental analytical data, the nature and duration of restrictions on disposition, an evaluation of the forces that influence the market in which the securities are purchased and sold, and public trading in similar securities of the issuer or comparable issuers. These securities are either categorized within Level 2 or 3 of the fair value hierarchy depending on the relevant inputs used.
For restricted securities where observable inputs are limited, assumptions about market activity and risk are used and are generally categorized within Level 3 of the fair value hierarchy.
22
The following is a summary of the inputs used as of August 31, 2014 in valuing the fund’s investments:
| | | | |
| | | Level 2—Other | Level 3— | |
| | Level 1— | Significant | Significant | |
| | Unadjusted | Observable | Unobservable | |
| | Quoted Prices | Inputs | Inputs | Total |
| Assets ($) | | | | |
| Investments in Securities: | | | |
| Equity Securities— | | | | |
| Domestic | | | | |
| Common Stocks† | 20,045,816 | — | — | 20,045,816 |
| Equity Securities— | | | | |
| Foreign | | | | |
| Common Stocks† | 812,372 | — | — | 812,372 |
| Exchange-Traded | | | | |
| Funds | 303,072 | — | — | 303,072 |
| Mutual Funds | 83,526 | — | — | 83,526 |
| |
| † See Statement of Investments for additional detailed categorizations. | |
At August 31, 2014, there were no transfers between Level 1 and Level 2 of the fair value hierarchy.
(b) Securities transactions and investment income: Securities transactions are recorded on a trade date basis. Realized gains and losses from securities transactions are recorded on the identified cost basis. Dividend income is recognized on the ex-dividend date and interest income, including, where applicable, accretion of discount and amortization of premium on investments, is recognized on the accrual basis.
The Fund 23
NOTES TO FINANCIAL STATEMENTS (continued)
Pursuant to a securities lending agreement with The Bank of New York Mellon, a subsidiary of BNY Mellon and an affiliate of Dreyfus, the fund may lend securities to qualified institutions. It is the fund’s policy that, at origination, all loans are secured by collateral of at least 102% of the value of U.S. securities loaned and 105% of the value of foreign securities loaned. Collateral equivalent to at least 100% of the market value of securities on loan is maintained at all times. Collateral is either in the form of cash, which can be invested in certain money market mutual funds managed by the Manager or U.S. Government and Agency securities. The fund is entitled to receive all dividends, interest and distributions on securities loaned, in addition to income earned as a result of the lending transaction. Should a borrower fail to return the securities in a timely manner, The Bank of New York Mellon is required to replace the securities for the benefit of the fund or credit the fund with the market value of the unreturned securities and is subrogated to the fund’s rights against the borrower and the collateral. During the period ended August 31, 2014, The Bank of New York Mellon earned $29 from lending portfolio securities, pursuant to the securities lending agreement.
(c) Affiliated issuers: Investments in other investment companies advised by Dreyfus are defined as “affiliated” under the Act. Investments in affiliated investment companies during the period ended August 31, 2014 were as follows:
| | | | | | | |
| Affiliated | | | | | | | |
| Investment | Value | | | | Value | | Net |
| Company | 8/31/2013 | ($) | Purchases ($) | Sales ($) | 8/31/2014 | ($) | Assets (%) |
| Dreyfus | | | | | | | |
| Institutional | | | | | | | |
| Preferred | | | | | | | |
| Plus Money | | | | | | | |
| Market Fund | 36,854 | | 7,312,158 | 7,265,486 | 83,526 | | .4 |
| Dreyfus | | | | | | | |
| Institutional | | | | | | | |
| Cash Advantage | | | | | | |
| Fund | — | | 1,203,795 | 1,203,795 | — | | — |
| Total | 36,854 | | 8,515,953 | 8,469,281 | 83,526 | | .4 |
24
(d) Dividends to shareholders: Dividends are recorded on the ex-dividend date. Dividends from investment income-net and dividends from net realized capital gains, if any, are normally declared and paid annually, but the fund may make distributions on a more frequent basis to comply with the distribution requirements of the Internal Revenue Code of 1986, as amended (the “Code”). To the extent that net realized capital gains can be offset by capital loss carryovers, it is the policy of the fund not to distribute such gains. Income and capital gain distributions are determined in accordance with income tax regulations, which may differ from GAAP.
(e) Federal income taxes: It is the policy of the fund to continue to qualify as a regulated investment company, if such qualification is in the best interests of its shareholders, by complying with the applicable provisions of the Code, and to make distributions of taxable income sufficient to relieve it from substantially all federal income and excise taxes.
As of and during the period ended August 31, 2014, the fund did not have any liabilities for any uncertain tax positions.The fund recognizes interest and penalties, if any, related to uncertain tax positions as income tax expense in the Statement of Operations. During the period ended August 31, 2014, the fund did not incur any interest or penalties.
Each tax year in the three-year period ended August 31, 2014 remains subject to examination by the Internal Revenue Service and state taxing authorities.
At August 31, 2014, the components of accumulated earnings on a tax basis were as follows: undistributed ordinary income $514,727, undistributed capital gains $374,373 and unrealized appreciation $2,384,791.
The tax character of distributions paid to shareholders during the fiscal periods ended August 31, 2014 and August 31, 2013 were as follows: ordinary income $554,532 and $209,766, and long-term capital gains $370,049 and $0, respectively.
The Fund 25
NOTES TO FINANCIAL STATEMENTS (continued)
During the period ended August 31, 2014, as a result of permanent book to tax differences, primarily due to the tax treatment for net operating losses, limited partnerships and dividend reclassification, the fund increased accumulated undistributed investment income-net by $4,755 and decreased accumulated net realized gain (loss) on investments by the same amount. Net assets and net asset value per share were not affected by this reclassification.
NOTE 2—Bank Lines of Credit:
The fund participates with other Dreyfus-managed funds in a $265 million unsecured credit facility led by Citibank, N.A. and a $300 million unsecured credit facility provided by The Bank of New York Mellon (each, a “Facility”), each to be utilized primarily for temporary or emergency purposes, including the financing of redemptions. Prior to October 9, 2013, the unsecured credit facility with Citibank, N.A. was $210 million. In connection therewith, the fund has agreed to pay its pro rata portion of commitment fees for each Facility. Interest is charged to the fund based on rates determined pursuant to the terms of the respective Facility at the time of borrowing. During the period ended August 31, 2014, the fund did not borrow under the Facilities.
NOTE 3—Management Fee and Other Transactions with Affiliates:
(a) Pursuant to a management agreement with the Manager, the management fee is computed at an annual rate of .75% of the value of the fund’s average daily net assets and is payable monthly.The Manager has contractually agreed, from September 1, 2013 through February 1, 2015, to waive receipt of its fees and/or assume the direct expenses of the fund so that the expenses of none of the classes (excluding Rule 12b-1 Distribution Plan fees, Shareholder Services Plan fees, taxes, interest expense, brokerage commissions, commitment fees on borrowings and extraordinary expenses) exceed .95% of the value of the fund’s average daily net assets.The reduction in expenses, pursuant to the undertaking, amounted to $95,569 during the period ended August 31, 2014.
During the period ended August 31, 2014, the Distributor retained $3,010 from commissions earned on sales of the fund’s Class A shares.
26
(b) Under the Distribution Plan adopted pursuant to Rule 12b-1 under the Act, Class C shares pay the Distributor for distributing its shares at an annual rate of .75% of the value of its average daily net assets. During the period ended August 31, 2014, Class C shares were charged $2,612 pursuant to the Distribution Plan.
(c) Under the Shareholder Services Plan, Class A and Class C shares pay the Distributor at an annual rate of .25% of the value of their average daily net assets for the provision of certain services. The services provided may include personal services relating to shareholder accounts, such as answering shareholder inquiries regarding the fund and providing reports and other information, and services related to the maintenance of shareholder accounts. The Distributor may make payments to Service Agents (securities dealers, financial institutions or other industry professionals) with respect to these services. The Distributor determines the amounts to be paid to Service Agents. During the period ended August 31, 2014, Class A and Class C shares were charged $23,051 and $871, respectively, pursuant to the Shareholder Services Plan.
The fund has arrangements with the transfer agent and the custodian whereby the fund may receive earnings credits when positive cash balances are maintained, which are used to offset transfer agency and custody fees. For financial reporting purposes, the fund includes net earnings credits as an expense offset in the Statement of Operations.
The fund compensates Dreyfus Transfer, Inc., a wholly-owned subsidiary of the Manager, under a transfer agency agreement for providing transfer agency and cash management services for the fund. The majority of transfer agency fees are comprised of amounts paid on a per account basis, while cash management fees are related to fund subscriptions and redemptions. During the period ended August 31, 2014, the fund was charged $3,210 for transfer agency services and $106 for cash management services.These fees are included in Shareholder servicing costs in the Statement of Operations. Cash management fees were partially offset by earnings credits of $8.
The Fund 27
NOTES TO FINANCIAL STATEMENTS (continued)
The fund compensates The Bank of New York Mellon under a custody agreement for providing custodial services for the fund. These fees are determined based on net assets, geographic region and transaction activity. During the period ended August 31, 2014, the fund was charged $5,017 pursuant to the custody agreement.
The fund compensated The Bank of New York Mellon under a cash management agreement that was in effect until September 30, 2013 for performing certain cash management services related to fund subscriptions and redemptions. During the period ended August 31, 2014, the fund was charged $1 pursuant to the cash management agreement, which is included in Shareholder servicing costs in the Statement of Operations.
During the period ended August 31, 2014, the fund was charged $8,296 for services performed by the Chief Compliance Officer and his staff.
The components of “Due to The Dreyfus Corporation and affiliates” in the Statement of Assets and Liabilities consist of: management fees $13,035, Distribution Plan fees $368, Shareholder Services Plan fees $3,283, custodian fees $2,757, Chief Compliance Officer fees $1,154 and transfer agency fees $719, which are offset against an expense reimbursement currently in effect in the amount of $8,406.
(d) Each Board member also serves as a Board member of other funds within the Dreyfus complex. Annual retainer fees and attendance fees are allocated to each fund based on net assets.
NOTE 4—Securities Transactions:
The aggregate amount of purchases and sales of investment securities, excluding short-term securities, during the period ended August 31, 2014, amounted to $26,731,382 and $15,780,887, respectively.
At August 31, 2014, the cost of investments for federal income tax purposes was $18,859,995; accordingly, accumulated net unrealized appreciation on investments was $2,384,791, consisting of $2,628,714 gross unrealized appreciation and $243,923 gross unrealized depreciation.
28
|
| REPORT OF INDEPENDENT REGISTERED |
| PUBLIC ACCOUNTING FIRM |
Shareholders and Board of Directors Dreyfus Opportunistic U.S. Stock Fund
We have audited the accompanying statement of assets and liabilities, including the statement of investments, of Dreyfus Opportunistic U.S. Stock Fund (one of the series comprising Advantage Funds, Inc.) as of August 31, 2014, and the related statement of operations for the year then ended, the statement of changes in net assets for each of the two years in the period then ended, and the financial highlights for the each of the periods indicated therein. These financial statements and financial highlights are the responsibility of the Fund’s management. Our responsibility is to express an opinion on these financial statements and financial highlights based on our audits.
We conducted our audits in accordance with the standards of the Public Company Accounting Oversight Board (United States). Those standards require that we plan and perform the audit to obtain reasonable assurance about whether the financial statements and financial highlights are free of material misstatement. We were not engaged to perform an audit of the Fund’s internal control over financial reporting. Our audits included consideration of internal control over financial reporting as a basis for designing audit procedures that are appropriate in the circumstances, but not for the purpose of expressing an opinion on the effectiveness of the Fund’s internal control over financial reporting. Accordingly, we express no such opinion. An audit also includes examining, on a test basis, evidence supporting the amounts and disclosures in the financial statements and financial highlights, assessing the accounting principles used and significant estimates made by management, and evaluating the overall financial statement presentation. Our procedures included confirmation of securities owned as of August 31, 2014 by correspondence with the custodian and others.We believe that our audits provide a reasonable basis for our opinion.
In our opinion, the financial statements and financial highlights referred to above present fairly, in all material respects, the financial position of Dreyfus Opportunistic U.S. Stock Fund at August 31, 2014, the results of its operations for the year then ended, the changes in its net assets for each of the two years in the period then ended, and the financial highlights for each of the indicated periods, in conformity with U.S. generally accepted accounting principles.

New York, New York
October 28, 2014
The Fund 29
IMPORTANT TAX INFORMATION (Unaudited)
For federal tax purposes, the fund hereby reports 11.05% of the ordinary dividends paid during the fiscal year ended August 31, 2014 as qualifying for the corporate dividends received deduction.Also, certain dividends paid by the fund may be subject to a maximum tax rate of 15%, as provided for by the Jobs and Growth Tax Relief Reconciliation Act of 2003. Of the distributions paid during the fiscal year, $61,881 represents the maximum amount that may be considered qualified dividend income. The fund also hereby reports $.9937 per share as a short-term capital gain distribution and $.6710 per share as a long-term capital gain distribution paid on December 11, 2013. Shareholders will receive notification in early 2015 of the percentage applicable to the preparation of their 2014 income tax returns.
30
|
| INFORMATION ABOUT THE RENEWAL OF THE |
| FUND’S MANAGEMENT AGREEMENT (Unaudited) |
At a meeting of the fund’s Board of Directors held on March 4-5, 2014, the Board considered the renewal of the fund’s Management Agreement pursuant to which Dreyfus provides the fund with investment advisory and administrative services (the “Agreement”). The Board members, none of whom are “interested persons” (as defined in the Investment Company Act of 1940, as amended) of the fund, were assisted in their review by independent legal counsel and met with counsel in executive session separate from Dreyfus representatives. In considering the renewal of the Agreement, the Board considered all factors that it believed to be relevant, including those discussed below.The Board did not identify any one factor as dispositive, and each Board member may have attributed different weights to the factors considered.
Analysis of Nature, Extent, and Quality of Services Provided to the Fund.The Board considered information provided to them at the meeting and in previous presentations from Dreyfus representatives regarding the nature, extent, and quality of the services provided to funds in the Dreyfus fund complex. Dreyfus provided the number of open accounts in the fund, the fund’s asset size and the allocation of fund assets among distribution channels. Dreyfus also had previously provided information regarding the diverse intermediary relationships and distribution channels of funds in the Dreyfus fund complex (such as retail direct or intermediary, in which intermediaries typically are paid by the fund and/or Dreyfus) and Dreyfus’ corresponding need for broad, deep, and diverse resources to be able to provide ongoing shareholder services to each intermediary or distribution channel, as applicable to the fund.
The Board also considered research support available to, and portfolio management capabilities of, the fund’s portfolio management personnel and that Dreyfus also provides oversight of day-to-day fund operations, including fund accounting and administration and assistance in meeting legal and regulatory requirements.The Board also considered Dreyfus’ extensive administrative, accounting, and compliance infra-structures.The Board also considered portfolio management’s brokerage policies and practices (including policies and practices regarding soft dollars) and the standards applied in seeking best execution.
The Fund 31
|
| INFORMATION ABOUT THE RENEWAL OF THE FUND’S |
| MANAGEMENT AGREEMENT (Unaudited) (continued) |
Comparative Analysis of the Fund’s Performance and Management Fee and Expense Ratio. The Board reviewed reports prepared by Lipper, Inc. (“Lipper”), an independent provider of investment company data, which included information comparing (1) the fund’s performance with the performance of a group of comparable funds (the “Performance Group”) and with a broader group of funds (the “Performance Universe”), all for various periods ended December 31, 2013, and (2) the fund’s actual and contractual management fees and total expenses with those of a group of comparable funds (the “Expense Group”) and with a broader group of funds (the “Expense Universe”), the information for which was derived in part from fund financial statements available to Lipper as of the date of its analysis. Dreyfus previously had furnished the Board with a description of the methodology Lipper used to select the Performance Group and Performance Universe and the Expense Group and Expense Universe.
Dreyfus representatives stated that the usefulness of performance comparisons may be affected by a number of factors, including different investment limitations that may be applicable to the fund and comparison funds. The Board discussed the results of the comparisons and noted that the fund’s total return performance was ranked first in the Performance Group and in the first quartile of the Performance Universe for the one- and two-year periods since the fund commenced operations on December 20, 2011. Dreyfus also provided a comparison of the fund’s calendar year total returns to the returns of the fund’s benchmark index.
The Board also reviewed the range of actual and contractual management fees and total expenses of the Expense Group and Expense Universe funds and discussed the results of the comparisons. The Board noted that the fund’s contractual management fee was at the Expense Group median, the fund’s actual management fee (which was zero) was at the Expense Group median and below the Expense Universe median and the fund’s total expenses were slightly below the Expense Group and the Expense Universe medians.
32
Dreyfus representatives noted that Dreyfus has contractually agreed to waive receipt of its fees and/or assume the direct expenses of the fund, until February 1, 2015, so that the expenses of none of the classes (excluding Rule 12b-1 fees, shareholder services fees, taxes, interest, brokerage commissions, commitment fees on borrowings, and extraordinary expenses) exceed .95% of the value of the fund’s average daily net assets.
Dreyfus representatives reviewed with the Board the management or investment advisory fees (1) paid by funds advised or administered by Dreyfus that are in the same Lipper category as the fund and (2) paid to Dreyfus or the Dreyfus-affiliated primary employer of the fund’s primary portfolio manager(s) for advising any separate accounts and/or other types of client portfolios that are considered to have similar investment strategies and policies as the fund (the “Similar Clients”), and explained the nature of the Similar Clients. They discussed differences in fees paid and the relationship of the fees paid in light of any differences in the services provided and other relevant factors. The Board considered the relevance of the fee information provided for the Similar Clients to evaluate the appropriateness and reasonableness of the fund’s management fee.
Analysis of Profitability and Economies of Scale. Dreyfus representatives reviewed the expenses allocated and profit received by Dreyfus and the resulting profitability percentage for managing the fund and the aggregate profitability percentage to Dreyfus of managing the funds in the Dreyfus fund complex, and the method used to determine the expenses and profit. The Board concluded that the profitability results were not unreasonable, given the services rendered and service levels provided by Dreyfus. The Board also noted the expense limitation arrangement and its effect on Dreyfus’ profitability.The Board also had been provided with information prepared by an independent consulting firm regarding Dreyfus’ approach to allocating costs to, and determining the profitability of, individual funds and the entire
The Fund 33
|
| INFORMATION ABOUT THE RENEWAL OF THE FUND’S |
| MANAGEMENT AGREEMENT (Unaudited) (continued) |
Dreyfus fund complex. The consulting firm also had analyzed where any economies of scale might emerge in connection with the management of a fund.
The Board considered on the advice of its counsel the profitability analysis (1) as part of its evaluation of whether the fees under the Agreement bear a reasonable relationship to the mix of services provided by Dreyfus, including the nature, extent and quality of such services, and (2) in light of the relevant circumstances for the fund and the extent to which economies of scale would be realized if the fund grows and whether fee levels reflect these economies of scale for the benefit of fund shareholders. Dreyfus representatives noted that a discussion of economies of scale is predicated on a fund having achieved a substantial size with increasing assets and that, if a fund’s assets had been stable or decreasing, the possibility that Dreyfus may have realized any economies of scale would be less. Dreyfus representatives also noted that, as a result of shared and allocated costs among funds in the Dreyfus fund complex, the extent of economies of scale could depend substantially on the level of assets in the complex as a whole, so that increases and decreases in complex-wide assets can affect potential economies of scale in a manner that is disproportionate to, or even in the opposite direction from, changes in the fund’s asset level. The Board also considered potential benefits to Dreyfus from acting as investment adviser and noted the soft dollar arrangements in effect for trading the fund’s investments.
At the conclusion of these discussions, the Board agreed that it had been furnished with sufficient information to make an informed business decision with respect to the renewal of the Agreement. Based on the discussions and considerations as described above, the Board concluded and determined as follows.
The Board concluded that the nature, extent and quality of the services provided by Dreyfus are adequate and appropriate.
The Board was satisfied with the fund’s performance.
The Board concluded that the fee paid to Dreyfus was reasonable in light of the considerations described above.
34
The Board determined that the economies of scale which may accrue to Dreyfus and its affiliates in connection with the management of the fund had been adequately considered by Dreyfus in connection with the fee rate charged to the fund pursuant to the Agreement and that, to the extent in the future it were determined that material economies of scale had not been shared with the fund, the Board would seek to have those economies of scale shared with the fund.
In evaluating the Agreement, the Board considered these conclusions and determinations and also relied on its previous knowledge, gained through meetings and other interactions with Dreyfus and its affiliates, of the fund and the services provided to the fund by Dreyfus. The Board also relied on information received on a routine and regular basis throughout the year relating to the operations of the fund and the investment management and other services provided under the Agreement, including information on the investment performance of the fund in comparison to similar mutual funds and benchmark performance indices; general market outlook as applicable to the fund; and compliance reports. In addition, the Board’s consideration of the contractual fee arrangements for this fund had the benefit of a number of years of reviews of prior or similar agreements during which lengthy discussions took place between the Board and Dreyfus representatives. Certain aspects of the arrangements may receive greater scrutiny in some years than in others, and the Board’s conclusions may be based, in part, on their consideration of the same or similar arrangements in prior years. The Board determined that renewal of the Agreement was in the best interests of the fund and its shareholders.
The Fund 35
|
| BOARD MEMBERS INFORMATION (Unaudited) |
| INDEPENDENT BOARD MEMBERS |
|
| Joseph S. DiMartino (70) |
| Chairman of the Board (1995) |
| Principal Occupation During Past 5Years: |
| • Corporate Director and Trustee (1995-present) |
| Other Public Company Board Memberships During Past 5Years: |
| • CBIZ (formerly, Century Business Services, Inc.), a provider of outsourcing functions for small |
| and medium size companies, Director (1997-present) |
| • The Newark Group, a provider of a national market of paper recovery facilities, paperboard |
| mills and paperboard converting plants, Director (2000-2010) |
| • Sunair Services Corporation, a provider of certain outdoor-related services to homes and |
| businesses, Director (2005-2009) |
| No. of Portfolios for which Board Member Serves: 142 |
| ——————— |
| Peggy C. Davis (71) |
| Board Member (2006) |
| Principal Occupation During Past 5Years: |
| • Shad Professor of Law, New York University School of Law (1983-present) |
| No. of Portfolios for which Board Member Serves: 52 |
| ——————— |
| David P. Feldman (74) |
| Board Member (1996) |
| Principal Occupation During Past 5Years: |
| • Corporate Director and Trustee (1985-present) |
| Other Public Company Board Membership During Past 5Years: |
| • BBH Mutual Funds Group (5 registered mutual funds), Director (1992-present) |
| No. of Portfolios for which Board Member Serves: 38 |
| ——————— |
| Ehud Houminer (74) |
| Board Member (1993) |
| Principal Occupation During Past 5Years: |
| • Executive-in-Residence at the Columbia Business School, Columbia University (1992-present) |
| Other Public Company Board Membership During Past 5Years: |
| • Avnet Inc., an electronics distributor, Director (1993-2012) |
| No. of Portfolios for which Board Member Serves: 62 |
36
|
| Lynn Martin (74) |
| Board Member (2012) |
| Principal Occupation During Past 5Years: |
| • President of The Martin Hall Group LLC, a human resources consulting firm (2005-2012) |
| Other Public Company Board Memberships During Past 5Years: |
| • AT&T Inc., a telecommunications company, Director (1999-2012) |
| • Ryder System, Inc., a supply chain and transportation management company, Director (1993-2012) |
| • The Proctor & Gamble Co., a consumer products company, Director (1994-2009) |
| • Constellation Energy Group Inc., Director (2003-2009) |
| No. of Portfolios for which Board Member Serves: 38 |
| ——————— |
| Robin A. Melvin (50) |
| Board Member (2012) |
| Principal Occupation During Past 5Years: |
| • Board Member, Illinois Mentoring Partnership, non-profit organization dedicated to increasing |
| the quantity and quality of mentoring services in Illinois (2013-present) |
| • Director, Boisi Family Foundation, a private family foundation that supports youth-serving orga- |
| nizations that promote the self sufficiency of youth from disadvantaged circumstances (1995-2012) |
| No. of Portfolios for which Board Member Serves: 109 |
| ——————— |
| Dr. Martin Peretz (75) |
| Board Member (2006) |
| Principal Occupation During Past 5Years: |
| • Editor-in-Chief Emeritus of The New Republic Magazine (2010-2011) (previously, |
| Editor-in-Chief, 1974-2010) |
| • Director of TheStreet.com, a financial information service on the web (1996-2010) |
| No. of Portfolios for which Board Member Serves: 38 |
| ——————— |
Once elected all Board Members serve for an indefinite term, but achieve Emeritus status upon reaching age 80.The address of the Board Members and Officers is c/o The Dreyfus Corporation, 200 Park Avenue, New York, New York 10166. Additional information about the Board Members is available in the fund’s Statement of Additional Information which can be obtained from Dreyfus free of charge by calling this toll free number: 1-800-DREYFUS.
James F. Henry, Emeritus Board Member
Dr. Paul A. Marks, Emeritus Board Member
Philip L.Toia, Emeritus Board Member
The Fund 37
OFFICERS OF THE FUND (Unaudited)
BRADLEY J. SKAPYAK, President since January 2010.
Chief Operating Officer and a director of the Manager since June 2009, Chairman of Dreyfus Transfer, Inc., an affiliate of the Manager and the transfer agent of the funds, since May 2011 and Executive Vice President of the Distributor since June 2007. From April 2003 to June 2009, Mr. Skapyak was the head of the Investment Accounting and Support Department of the Manager. He is an officer of 69 investment companies (comprised of 142 portfolios) managed by the Manager. He is 55 years old and has been an employee of the Manager since February 1988.
JOHN PAK, Chief Legal Officer since March 2013.
Deputy General Counsel, Investment Management, of BNY Mellon since August 2014; Chief Legal Officer of the Manager since August 2012; from March 2005 to July 2012, Managing Director of Deutsche Bank, Deputy Global Head of Deutsche Asset Management Legal and Regional Head of Deutsche Asset Management Americas Legal. He is an officer of 70 investment companies (comprised of 167 portfolios) managed by the Manager. He is 45 years old and has been an employee of the Manager since August 2012.
JANETTE E. FARRAGHER, Vice President and Secretary since December 2011.
Assistant General Counsel of BNY Mellon, and an officer of 70 investment companies (comprised of 167 portfolios) managed by the Manager. She is 51 years old and has been an employee of the Manager since February 1984.
KIESHA ASTWOOD, Vice President and Assistant Secretary since January 2010.
Counsel of BNY Mellon, and an officer of 70 investment companies (comprised of 167 portfolios) managed by the Manager. She is 41 years old and has been an employee of the Manager since July 1995.
JAMES BITETTO, Vice President and Assistant Secretary since August 2005.
Managing Counsel of BNY Mellon and Secretary of the Manager, and an officer of 70 investment companies (comprised of 167 portfolios) managed by the Manager. He is 48 years old and has been an employee of the Manager since December 1996.
JONI LACKS CHARATAN, Vice President and Assistant Secretary since August 2005.
Managing Counsel of BNY Mellon, and an officer of 70 investment companies (comprised of 167 portfolios) managed by the Manager. She is 58 years old and has been an employee of the Manager since October 1988.
JOSEPH M. CHIOFFI, Vice President and Assistant Secretary since August 2005.
Managing Counsel of BNY Mellon, and an officer of 70 investment companies (comprised of 167 portfolios) managed by the Manager. He is 52 years old and has been an employee of the Manager since June 2000.
JOHN B. HAMMALIAN, Vice President and Assistant Secretary since August 2005.
Senior Managing Counsel of BNY Mellon, and an officer of 70 investment companies (comprised of 167 portfolios) managed by the Manager. He is 51 years old and has been an employee of the Manager since February 1991.
SARAH S. KELLEHER, Vice President and Assistant Secretary since April 2014.
Senior Counsel of BNY Mellon, and an officer of 70 investment companies (comprised of 167 portfolios) managed by the Manager; from August 2005 to March 2013, Associate General Counsel of Third Avenue Management. She is 38 years old and has been an employee of the Manager since March 2013.
38
JEFF PRUSNOFSKY, Vice President and Assistant Secretary since August 2005.
Senior Managing Counsel of BNY Mellon, and an officer of 70 investment companies (comprised of 167 portfolios) managed by the Manager. He is 49 years old and has been an employee of the Manager since October 1990.
JAMES WINDELS, Treasurer since November 2001.
Director – Mutual Fund Accounting of the Manager, and an officer of 70 investment companies (comprised of 167 portfolios) managed by the Manager. He is 55 years old and has been an employee of the Manager since April 1985.
RICHARD CASSARO, Assistant Treasurer since January 2008.
Senior Accounting Manager – Money Market and Municipal Bond Funds of the Manager, and an officer of 70 investment companies (comprised of 167 portfolios) managed by the Manager. He is 55 years old and has been an employee of the Manager since September 1982.
GAVIN C. REILLY, Assistant Treasurer since December 2005.
Tax Manager of the Investment Accounting and Support Department of the Manager, and an officer of 70 investment companies (comprised of 167 portfolios) managed by the Manager. He is 46 years old and has been an employee of the Manager since April 1991.
ROBERT S. ROBOL, Assistant Treasurer since August 2005.
Senior Accounting Manager – Fixed Income Funds of the Manager, and an officer of 70 investment companies (comprised of 167 portfolios) managed by the Manager. He is 50 years old and has been an employee of the Manager since October 1988.
ROBERT SALVIOLO, Assistant Treasurer since July 2007.
Senior Accounting Manager – Equity Funds of the Manager, and an officer of 70 investment companies (comprised of 167 portfolios) managed by the Manager. He is 47 years old and has been an employee of the Manager since June 1989.
ROBERT SVAGNA, Assistant Treasurer since August 2005.
Senior Accounting Manager – Equity Funds of the Manager, and an officer of 70 investment companies (comprised of 167 portfolios) managed by the Manager. He is 47 years old and has been an employee of the Manager since November 1990.
JOSEPH W. CONNOLLY, Chief Compliance Officer since October 2004.
Chief Compliance Officer of the Manager and The Dreyfus Family of Funds (70 investment companies, comprised of 167 portfolios).
He is 57 years old and has served in various capacities with the Manager since 1980, including manager of the firm’s Fund Accounting Department from 1997 through October 2001.
MATTHEW D. CONNOLLY, Anti-Money Laundering Compliance Officer since April 2012.
Anti-Money Laundering Compliance Officer of the Distributor since October 2011; from March 2010 to September 2011, Global Head, KYC Reviews and Director of UBS Investment Bank; until March 2010, AML Compliance Officer and Senior Vice President of Citi Global Wealth Management. He is an officer of 65 investment companies (comprised of 162 portfolios) managed by the Manager. He is 42 years old and has been an employee of the Distributor since October 2011.
The Fund 39
For More Information
Telephone Call your financial representative or 1-800-DREYFUS
Mail The Dreyfus Family of Funds, 144 Glenn Curtiss Boulevard, Uniondale, NY 11556-0144
The fund files its complete schedule of portfolio holdings with the Securities and Exchange Commission (“SEC”) for the first and third quarters of each fiscal year on Form N-Q. The fund’s Forms N-Q are available on the SEC’s website at http://www.sec.gov and may be reviewed and copied at the SEC’s Public Reference Room in Washington, DC. Information on the operation of the Public Reference Room may be obtained by calling 1-800-SEC-0330.
A description of the policies and procedures that the fund uses to determine how to vote proxies relating to portfolio securities, and information regarding how the fund voted these proxies for the most recent 12-month period ended June 30 is available at http://www.dreyfus.com and on the SEC’s website at http://www.sec.gov. The description of the policies and procedures is also available without charge, upon request, by calling 1-800-DREYFUS.

|
| Dreyfus |
| Strategic Value Fund |
ANNUAL REPORT August 31, 2014

Save time. Save paper. View your next shareholder report online as soon as it’s available. Log into www.dreyfus.com and sign up for Dreyfus eCommunications. It’s simple and only takes a few minutes.
The views expressed in this report reflect those of the portfolio manager only through the end of the period covered and do not necessarily represent the views of Dreyfus or any other person in the Dreyfus organization. Any such views are subject to change at any time based upon market or other conditions and Dreyfus disclaims any responsibility to update such views.These views may not be relied on as investment advice and, because investment decisions for a Dreyfus fund are based on numerous factors, may not be relied on as an indication of trading intent on behalf of any Dreyfus fund.
|
| Not FDIC-Insured • Not Bank-Guaranteed • May Lose Value |
| | Contents |
| | THE FUND |
| 2 | A Letter from the President |
| 3 | Discussion of Fund Performance |
| 6 | Fund Performance |
| 8 | Understanding Your Fund’s Expenses |
| 8 | Comparing Your Fund’s Expenses With Those of Other Funds |
| 9 | Statement of Investments |
| 14 | Statement of Assets and Liabilities |
| 15 | Statement of Operations |
| 16 | Statement of Changes in Net Assets |
| 18 | Financial Highlights |
| 22 | Notes to Financial Statements |
| 32 | Report of Independent Registered Public Accounting Firm |
| 33 | Important Tax Information |
| 34 | Information About the Renewal of the Fund’s Management Agreement |
| 39 | Board Members Information |
| 41 | Officers of the Fund |
| | FOR MORE INFORMATION |
| | Back Cover |
Dreyfus
Strategic Value Fund
The Fund
A LETTER FROM THE PRESIDENT
Dear Shareholder:
We are pleased to present this annual report for Dreyfus Strategic Value Fund, covering the 12-month period from September 1, 2013, through August 31, 2014. For information about how the fund performed during the reporting period, as well as general market perspectives, we provide a Discussion of Fund Performance on the pages that follow.
Despite occasional bouts of heightened volatility, U.S. stocks generally gained ground steadily over the reporting period as the domestic economy rebounded. As a result, most broad measures of equity market performance established a series of new record highs over the past 12 months. Growth-oriented and more economically sensitive stocks generally fared well over the reporting period’s first half, but value-oriented stocks rallied more strongly over the second half.
We remain cautiously optimistic regarding the U.S. stock market’s prospects. We currently expect the economy to continue to accelerate as several long-standing drags, including tight fiscal policies and private sector deleveraging, fade from the scene. Of course, a number of risks remain, including the possibilities of higher short-term interest rates and intensifying geopolitical turmoil.Therefore, we suggest you talk regularly with your financial advisor to assess the potential impact of these and other macroeconomic developments on your investments.
Thank you for your continued confidence and support.

J. Charles Cardona
President
The Dreyfus Corporation
September 15, 2014
2
DISCUSSION OF FUND PERFORMANCE
For the period of September 1, 2013, through August 31, 2014, as provided by Brian Ferguson, Portfolio Manager
Fund and Market Performance Overview
For the 12-month period ended August 31, 2014, Dreyfus Strategic Value Fund’s Class A shares produced a total return of 23.09%, Class C shares returned 22.17%, Class I shares returned 23.40%, and Class Y shares returned 23.40%.1 The fund’s benchmark, the Russell 1000® Value Index, produced a total return of 24.43% for the same period.2
Despite occasional bouts of heightened volatility, U.S. stocks generally climbed during the reporting period in an environment of improving economic growth.The fund participated in most of the large-cap value market’s gains, but it lagged its benchmark due to security selection shortfalls in the information technology and consumer discretionary sectors.
The Fund’s Investment Approach
The fund seeks capital appreciation. We identify potential investments through extensive quantitative and fundamental research. The fund will focus on individual stock selection (a “bottom-up” approach), emphasizing three key factors: value, quantitative screens that track traditional measures, such as price-to-earnings, price-to-book and price-to-sales ratios, which are analyzed and compared against the market; sound business fundamentals, a company’s balance sheet and income data are examined to determine the company’s financial history; and positive business momentum, a company’s earnings and forecast changes are analyzed and sales and earnings trends are reviewed to determine the company’s financial condition or the presence of a catalyst that will trigger a price increase near- to mid-term.
The fund typically sells a stock when we believe there is a more attractive alternative, the stock’s valuation is excessive, or there are deteriorating fundamentals, such as a loss of competitive advantage, a failure in management execution, or deteriorating capital structure.
The Fund 3
DISCUSSION OF FUND PERFORMANCE (continued)
Stocks Advanced Strongly in a Broad Market Rally
U.S. stocks generally gained value over the final months of 2013 in response to encouraging global and domestic economic data, enabling several broad measures of stock market performance to end 2013 near record highs. The market relinquished some of its gains in January 2014 due to concerns regarding economic slowdowns in the world’s emerging markets, but stocks rebounded in February when those worries proved to be overblown. Another bout of weakness in the spring stemmed from the adverse impact of unusually harsh winter weather on economic activity.This downturn hit growth-oriented companies in the information technology and biotechnology industry groups particularly hard, triggering a shift in market leadership from smaller, more aggressive stocks to their better established, value-oriented counterparts. The economic recovery resumed in warmer weather, and positive economic data drove stocks to a series of new record highs over the reporting period’s final three months.
While stocks of all capitalization ranges produced double-digit returns, on average, in this constructive environment, the shift in market leadership to more conservative companies helped large-cap stocks lead the broad market’s advance for the reporting period overall. However, large-cap growth stocks generally outperformed value-oriented stocks over the full 12-month reporting period.
Security Selections Dampened Relative Results
The fund participated substantially in the stock market rally, but its results compared to the benchmark were mildly constrained by a handful of disappointments in the consumer discretionary sector. Most notably, electronics retailer Best Buy lost value after a lackluster 2013 holiday season, prompting its elimination from the portfolio. After encountering inventory management issues, apparel producer PVH reduced the future earnings guidance it issues to analysts. In the information technology sector, an emphasis on companies leveraged to enterprise spending, such as networking giant Cisco Systems, Inc. and storage specialist EMC, hindered relative performance when capital spending increased less robustly than analysts expected. Underweighted exposure to Hewlett-Packard also weighed on relative results when better-than-expected personal computer sales lifted the hardware manufacturer’s stock.
The fund achieved better relative performance in the financials sector. Financial institutions leveraged to rising financial markets and the economic recovery advanced
4
strongly, including online broker TD Ameritrade Holding. The company achieved higher trading volumes and customer growth during the rebound. Among industrial companies, Delta Air Lines more than doubled in value amid lower fuel costs and rising travel volumes. In the utilities sector, electricity producer NRG Energy unlocked shareholder value through a corporate restructuring, and we reduced the fund’s position when it moved closer to our estimate of its intrinsic value.
Continuing to Find Attractive Value-Oriented Opportunities
We recently have been encouraged by improved U.S. economic activity, including a stronger labor market. In our judgment, an extended economic recovery should be good for equities, including large-cap value stocks. However, valuations have climbed and interest rates may rise, suggesting that selectivity is likely to become more critical to investment success. Using our bottom-up security selection process, we have increased the fund’s exposure to the financials and health care sectors, but we trimmed positions in the utilities and consumer discretionary sectors.
September 15, 2014
Equity funds are subject generally to market, market sector, market liquidity, issuer, and investment style risks, among other factors, to varying degrees, all of which are more fully described in the fund’s prospectus.
The fund’s performance will be influenced by political, social, and economic factors affecting investments in foreign companies. Special risks associated with investments in foreign companies include exposure to currency fluctuations, less liquidity, less developed or less efficient trading markets, lack of comprehensive company information, political instability, and differing auditing and legal standards.These risks are enhanced in emerging market countries. Please read the prospectus for further discussion of these risks.
|
| 1 Total return includes reinvestment of dividends and any capital gains paid and does not take into consideration the |
| maximum initial sales charge in the case of Class A shares, or the applicable contingent deferred sales charges |
| imposed on redemptions in the case of Class C shares. Had these charges been reflected, returns would have been |
| lower. Past performance is no guarantee of future results. Share price and investment return fluctuate such that upon |
| redemption fund shares may be worth more or less than their original cost. The fund’s returns reflect the absorption |
| of certain fund expenses by The Dreyfus Corporation pursuant to an agreement in effect through January 1, 2015, |
| at which time it may be extended, terminated, or modified. Had these expenses not been absorbed, the fund’s returns |
| would have been lower. |
| 2 SOURCE: LIPPER INC. — Reflects the reinvestment of dividends and, where applicable, capital gain |
| distributions.The Russell 1000® Value Index is an unmanaged index which measures the performance of those |
| Russell 1000® companies with lower price-to-book ratios and lower forecasted growth values. Investors cannot invest |
| directly in any index. |
The Fund 5
FUND PERFORMANCE
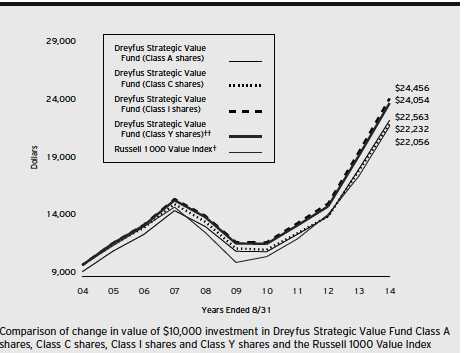
| |
| † | Source: Lipper Inc. |
| †† | The total return figures presented for ClassY shares of the fund reflect the performance of the fund’s Class A shares |
| | for the period prior to 7/1/13 (the inception date for ClassY shares), not reflecting the applicable sales charges for |
| | Class A shares. |
Past performance is not predictive of future performance.
The above graph compares a $10,000 investment made in each of the Class A, Class C, Class I and Class Y shares of Dreyfus Strategic Value Fund on 8/31/04 to a $10,000 investment made in the Russell 1000 Value Index (the “Index”) on that date. All dividends and capital gain distributions are reinvested.
The fund’s performance shown in the line graph above takes into account the maximum initial sales charge on Class A shares and all other applicable fees and expenses on all classes.The Index uses company price-to-book ratios and long-term growth rates to calculate a composite ranking, which is used to determine if a stock is “growth” or “value.” Unlike a mutual fund, the Index is not subject to charges, fees and other expenses. Investors cannot invest directly in any index. Further information relating to fund performance, including expense reimbursements, if applicable, is contained in the Financial Highlights section of the prospectus and elsewhere in this report.
6
| | | | | | | |
| Average Annual Total Returns as of 8/31/14 | | | | | | |
| Inception |
| | Date | 1 Year | | 5 Years | | 10 Years | |
| Class A shares | | | | | | | |
| with maximum sales charge (5.75%) | 9/29/95 | 16.03 | % | 13.70 | % | 8.48 | % |
| without sales charge | 9/29/95 | 23.09 | % | 15.05 | % | 9.12 | % |
| Class C shares | | | | | | | |
| with applicable redemption charge† | 5/31/01 | 21.17 | % | 14.22 | % | 8.32 | % |
| without redemption | 5/31/01 | 22.17 | % | 14.22 | % | 8.32 | % |
| Class I shares | 5/31/01 | 23.40 | % | 15.34 | % | 9.36 | % |
| Class Y shares | 7/1/13 | 23.40 | % | 15.16 | %†† | 9.17 | %†† |
| Russell 1000 Value Index | | 24.43 | % | 16.62 | % | 8.23 | % |
Past performance is not predictive of future performance.The fund’s performance shown in the graph and table does not reflect the deduction of taxes that a shareholder would pay on fund distributions or the redemption of fund shares. In addition to the performance of Class A shares shown with and without a maximum sales charge, the fund’s performance shown in the table takes into account all other applicable fees and expenses on all classes.
| |
| † | The maximum contingent deferred sales charge for Class C shares is 1% for shares redeemed within one year of the |
| | date of purchase. |
| †† | The total return performance figures presented for ClassY shares of the fund reflect the performance of the fund’s |
| | Class A shares for the period prior to 7/1/13 (the inception date for ClassY shares), not reflecting the applicable |
| | sales charges for Class A shares. |
The Fund 7
UNDERSTANDING YOUR FUND’S EXPENSES (Unaudited)
As a mutual fund investor, you pay ongoing expenses, such as management fees and other expenses. Using the information below, you can estimate how these expenses affect your investment and compare them with the expenses of other funds.You also may pay one-time transaction expenses, including sales charges (loads) and redemption fees, which are not shown in this section and would have resulted in higher total expenses. For more information, see your fund’s prospectus or talk to your financial adviser.
Review your fund’s expenses
The table below shows the expenses you would have paid on a $1,000 investment in Dreyfus Strategic Value Fund from March 1, 2014 to August 31, 2014. It also shows how much a $1,000 investment would be worth at the close of the period, assuming actual returns and expenses.
Expenses and Value of a $1,000 Investment
assuming actual returns for the six months ended August 31, 2014
| | | | | | | | |
| | | Class A | | Class C | | Class I | | Class Y |
| Expenses paid per $1,000† | $ | 5.11 | $ | 9.01 | $ | 3.81 | $ | 3.81 |
| Ending value (after expenses) | $ | 1,069.90 | $ | 1,065.70 | $ | 1,071.30 | $ | 1,071.30 |
COMPARING YOUR FUND’S EXPENSES
WITH THOSE OF OTHER FUNDS (Unaudited)
Using the SEC’s method to compare expenses
The Securities and Exchange Commission (SEC) has established guidelines to help investors assess fund expenses. Per these guidelines, the table below shows your fund’s expenses based on a $1,000 investment, assuming a hypothetical 5% annualized return. You can use this information to compare the ongoing expenses (but not transaction expenses or total cost) of investing in the fund with those of other funds. All mutual fund shareholder reports will provide this information to help you make this comparison. Please note that you cannot use this information to estimate your actual ending account balance and expenses paid during the period.
Expenses and Value of a $1,000 Investment
assuming a hypothetical 5% annualized return for the six months ended August 31, 2014
| | | | | | | | |
| | | Class A | | Class C | | Class I | | Class Y |
| Expenses paid per $1,000† | $ | 4.99 | $ | 8.79 | $ | 3.72 | $ | 3.72 |
| Ending value (after expenses) | $ | 1,020.27 | $ | 1,016.48 | $ | 1,021.53 | $ | 1,021.53 |
|
| † Expenses are equal to the fund’s annualized expense ratio of .98% for Class A, 1.73% for Class C, .73% for |
| Class I and .73% for Class Y, multiplied by the average account value over the period, multiplied by 184/365 (to |
| reflect the one-half year period). |
8
|
| STATEMENT OF INVESTMENTS |
| August 31, 2014 |
| | | |
| Common Stocks—99.8% | Shares | | Value ($) |
| Automobiles & Components—.7% | | | |
| General Motors | 345,845 | | 12,035,406 |
| Banks—13.5% | | | |
| Bank of America | 2,536,550 | | 40,813,089 |
| Citigroup | 682,350 | | 35,243,377 |
| Comerica | 321,220 | | 16,170,215 |
| Fifth Third Bancorp | 505,895 | | 10,322,787 |
| JPMorgan Chase & Co. | 884,270 | | 52,569,851 |
| PNC Financial Services Group | 218,250 | | 18,496,687 |
| Regions Financial | 715,190 | | 7,259,179 |
| Wells Fargo & Co. | 821,270 | | 42,246,129 |
| | | | 223,121,314 |
| Capital Goods—4.8% | | | |
| Cummins | 151,470 | | 21,979,812 |
| Eaton | 111,550 | | 7,787,306 |
| Honeywell International | 255,210 | | 24,303,648 |
| Owens Corning | 276,570 | | 9,956,520 |
| PACCAR | 239,270 | | 15,028,549 |
| | | | 79,055,835 |
| Commercial & Professional Services—.5% | | | |
| Tyco International | 179,820 | | 8,023,568 |
| Consumer Durables & Apparel—.9% | | | |
| PVH | 122,990 | | 14,357,853 |
| Consumer Services—1.0% | | | |
| Carnival | 435,250 | | 16,487,270 |
| Diversified Financials—13.1% | | | |
| Ameriprise Financial | 220,083 | | 27,677,638 |
| Berkshire Hathaway, Cl. B | 371,279 | a | 50,958,043 |
| Discover Financial Services | 131,330 | | 8,191,052 |
| Goldman Sachs Group | 221,820 | | 39,730,180 |
| Invesco | 209,420 | | 8,552,713 |
| Morgan Stanley | 899,550 | | 30,863,560 |
The Fund 9
STATEMENT OF INVESTMENTS (continued)
| | | |
| Common Stocks (continued) | Shares | | Value ($) |
| Diversified Financials (continued) | | | |
| TD Ameritrade Holding | 444,460 | | 14,716,071 |
| Voya Financial | 920,259 | | 35,972,924 |
| | | | 216,662,181 |
| Energy—11.9% | | | |
| Anadarko Petroleum | 331,730 | | 37,382,654 |
| Cameron International | 110,840 | a | 8,238,737 |
| Marathon Oil | 512,140 | | 21,351,117 |
| Occidental Petroleum | 771,693 | | 80,047,715 |
| Phillips 66 | 195,920 | | 17,048,958 |
| Schlumberger | 293,860 | | 32,218,810 |
| | | | 196,287,991 |
| Exchange-Traded Funds—.6% | | | |
| iShares Russell 1000 Value Index Fund | 98,340 | | 10,093,618 |
| Food & Staples Retailing—1.7% | | | |
| CVS Caremark | 346,720 | | 27,546,904 |
| Food, Beverage & Tobacco—4.5% | | | |
| Archer-Daniels-Midland | 433,530 | | 21,615,806 |
| Coca-Cola Enterprises | 285,030 | | 13,618,733 |
| Molson Coors Brewing, Cl. B | 180,990 | | 13,384,210 |
| PepsiCo | 174,100 | | 16,102,509 |
| Philip Morris International | 115,420 | | 9,877,644 |
| | | | 74,598,902 |
| Health Care Equipment & Services—7.6% | | | |
| Aetna | 151,970 | | 12,481,296 |
| Cardinal Health | 405,640 | | 29,895,668 |
| Cigna | 243,120 | | 22,999,152 |
| Laboratory Corporation of America Holdings | 116,970 | a | 12,542,693 |
| McKesson | 83,690 | | 16,322,061 |
| Omnicare | 195,880 | | 12,491,268 |
| UnitedHealth Group | 226,170 | | 19,604,416 |
| | | | 126,336,554 |
10
| | | |
| Common Stocks (continued) | Shares | | Value ($) |
| Household & Personal Products—.2% | | | |
| Avon Products | 233,959 | | 3,284,784 |
| Insurance—5.4% | | | |
| Allstate | 193,630 | | 11,906,309 |
| American International Group | 290,380 | | 16,278,703 |
| Genworth Financial, Cl. A | 565,320 | a | 8,021,891 |
| Hartford Financial Services Group | 444,210 | | 16,457,980 |
| MetLife | 400,559 | | 21,926,600 |
| Prudential Financial | 162,660 | | 14,590,602 |
| | | | 89,182,085 |
| Materials—3.5% | | | |
| Dow Chemical | 309,510 | | 16,574,260 |
| Martin Marietta Materials | 223,151 | | 29,223,855 |
| Vulcan Materials | 187,410 | | 11,878,046 |
| | | | 57,676,161 |
| Media—5.3% | | | |
| News Corp., Cl. A | 407,530 | a | 7,182,716 |
| Omnicom Group | 167,270 | | 12,045,113 |
| Time Warner | 167,890 | | 12,932,567 |
| Twenty-First Century Fox, Cl. A | 427,798 | | 15,152,605 |
| Viacom, Cl. B | 96,090 | | 7,797,704 |
| Walt Disney | 360,310 | | 32,384,663 |
| | | | 87,495,368 |
| Pharmaceuticals, Biotech & | | | |
| Life Sciences—8.5% | | | |
| AbbVie | 291,500 | | 16,114,120 |
| Agilent Technologies | 210,780 | | 12,048,185 |
| Amgen | 137,030 | | 19,099,241 |
| Merck & Co. | 739,560 | | 44,454,952 |
| Mylan | 259,050 | a | 12,589,830 |
| Pfizer | 1,258,630 | | 36,991,136 |
| | | | 141,297,464 |
The Fund 11
STATEMENT OF INVESTMENTS (continued)
| | | |
| Common Stocks (continued) | Shares | | Value ($) |
| Retailing—.5% | | | |
| Kohl’s | 149,350 | | 8,780,286 |
| Semiconductors & Semiconductor Equipment—2.8% | | | |
| Applied Materials | 728,500 | | 16,831,992 |
| Texas Instruments | 331,420 | | 15,967,816 |
| Xilinx | 326,820 | | 13,808,145 |
| | | | 46,607,953 |
| Software & Services—2.7% | | | |
| Google, Cl. C | 27,736 | a | 15,853,898 |
| Microsoft | 382,160 | | 17,361,529 |
| Symantec | 451,440 | | 10,960,963 |
| | | | 44,176,390 |
| Technology Hardware & Equipment—7.4% | | | |
| Apple | 404,241 | | 41,434,702 |
| Cisco Systems | 1,626,370 | | 40,642,986 |
| EMC | 862,880 | | 25,480,846 |
| Hewlett-Packard | 298,460 | | 11,341,480 |
| Western Digital | 40,626 | | 4,184,884 |
| | | | 123,084,898 |
| Telecommunication Services—.5% | | | |
| Windstream Holdings | 714,630 | | 8,075,319 |
| Transportation—1.2% | | | |
| Delta Air Lines | 502,290 | | 19,880,638 |
| Utilities—1.0% | | | |
| Exelon | 238,390 | | 7,966,994 |
| NRG Energy | 252,320 | | 7,766,410 |
| | | | 15,733,404 |
| Total Common Stocks | | | |
| (cost $1,259,896,711) | | | 1,649,882,146 |
12
| | | | |
| Other Investment—.2% | Shares | | Value ($) | |
| Registered Investment Company; | | | | |
| Dreyfus Institutional Preferred | | | | |
| Plus Money Market Fund | | | | |
| (cost $3,665,526) | 3,665,526 | b | 3,665,526 | |
| Total Investments (cost $1,263,562,237) | 100.0 | % | 1,653,547,672 | |
| Liabilities, Less Cash and Receivables | (.0 | %) | (507,425 | ) |
| Net Assets | 100.0 | % | 1,653,040,247 | |
| |
| a | Non-income producing security. |
| b | Investment in affiliated money market mutual fund. |
| | | |
| Portfolio Summary (Unaudited)† | | |
| |
| | Value (%) | | Value (%) |
| Banks | 13.5 | Software & Services | 2.7 |
| Diversified Financials | 13.1 | Food & Staples Retailing | 1.7 |
| Energy | 11.9 | Transportation | 1.2 |
| Pharmaceuticals, Biotech & | | Consumer Services | 1.0 |
| Life Sciences | 8.5 | Utilities | 1.0 |
| Health Care Equipment & Services | 7.6 | Consumer Durables & Apparel | .9 |
| Technology Hardware & Equipment | 7.4 | Automobiles & Components | .7 |
| Insurance | 5.4 | Exchange-Traded Funds | .6 |
| Media | 5.3 | Commercial & Professional Services | .5 |
| Capital Goods | 4.8 | Retailing | .5 |
| Food, Beverage & Tobacco | 4.5 | Telecommunication Services | .5 |
| Materials | 3.5 | Household & Personal Products | .2 |
| Semiconductors & Semiconductor | | Money Market Investment | .2 |
| Equipment | 2.8 | | 100.0 |
| |
| † Based on net assets. | | | |
| See notes to financial statements. | | | |
The Fund 13
|
| STATEMENT OF ASSETS AND LIABILITIES |
| August 31, 2014 |
| | | | |
| | | | Cost | Value |
| Assets ($): | | | | |
| Investments in securities—See Statement of Investments: | | |
| Unaffiliated issuers | | 1,259,896,711 | 1,649,882,146 |
| Affiliated issuers | | | 3,665,526 | 3,665,526 |
| Cash | | | | 371,940 |
| Dividends receivable | | | | 2,663,604 |
| Receivable for investment securities sold | | | 817,249 |
| Receivable for shares of Common Stock subscribed | | | 487,730 |
| Prepaid expenses | | | | 35,625 |
| | | | | 1,657,923,820 |
| Liabilities ($): | | | | |
| Due to The Dreyfus Corporation and affiliates—Note 3(c) | | 1,189,809 |
| Payable for investment securities purchased | | | 1,968,775 |
| Payable for shares of Common Stock redeemed | | | 1,427,013 |
| Interest payable—Note 2 | | | | 1,028 |
| Accrued expenses | | | | 296,948 |
| | | | | 4,883,573 |
| Net Assets ($) | | | | 1,653,040,247 |
| Composition of Net Assets ($): | | | | |
| Paid-in capital | | | | 1,146,173,691 |
| Accumulated undistributed investment income—net | | | 12,007,936 |
| Accumulated net realized gain (loss) on investments | | | 104,873,185 |
| Accumulated net unrealized appreciation | | | |
| (depreciation) on investments | | | | 389,985,435 |
| Net Assets ($) | | | | 1,653,040,247 |
| |
| |
| Net Asset Value Per Share | | | | |
| | Class A | Class C | Class I | Class Y |
| Net Assets ($) | 970,816,697 | 59,442,432 | 392,259,614 | 230,521,504 |
| Shares Outstanding | 22,401,663 | 1,443,703 | 9,028,608 | 5,306,003 |
| Net Asset Value Per Share ($) | 43.34 | 41.17 | 43.45 | 43.45 |
| See notes to financial statements. | | | | |
14
| | |
| STATEMENT OF OPERATIONS | | |
| Year Ended August 31, 2014 | | |
| |
| |
| |
| |
| Investment Income ($): | | |
| Income: | | |
| Cash dividends: | | |
| Unaffiliated issuers | 29,302,263 | |
| Affiliated issuers | 3,587 | |
| Income from securities lending—Note 1(b) | 5,521 | |
| Total Income | 29,311,371 | |
| Expenses: | | |
| Management fee—Note 3(a) | 11,853,425 | |
| Shareholder servicing costs—Note 3(c) | 4,017,842 | |
| Distribution fees—Note 3(b) | 425,247 | |
| Registration fees | 98,850 | |
| Directors’ fees and expenses—Note 3(d) | 97,094 | |
| Custodian fees—Note 3(c) | 97,084 | |
| Professional fees | 93,483 | |
| Prospectus and shareholders’ reports | 76,207 | |
| Loan commitment fees—Note 2 | 16,051 | |
| Interest expense—Note 2 | 4,991 | |
| Miscellaneous | 39,916 | |
| Total Expenses | 16,820,190 | |
| Less—reduction in expenses due to undertaking—Note 3(a) | (2,084,555 | ) |
| Less—reduction in fees due to earnings credits—Note 3(c) | (1,225 | ) |
| Net Expenses | 14,734,410 | |
| Investment Income—Net | 14,576,961 | |
| Realized and Unrealized Gain (Loss) on Investments—Note 4 ($): | | |
| Net realized gain (loss) on investments | 162,427,563 | |
| Net unrealized appreciation (depreciation) on investments | 146,604,326 | |
| Net Realized and Unrealized Gain (Loss) on Investments | 309,031,889 | |
| Net Increase in Net Assets Resulting from Operations | 323,608,850 | |
| See notes to financial statements. | | |
The Fund 15
STATEMENT OF CHANGES IN NET ASSETS
| | | | |
| | Year Ended August 31, | |
| | 2014 | | 2013 | a |
| Operations ($): | | | | |
| Investment income—net | 14,576,961 | | 14,461,029 | |
| Net realized gain (loss) on investments | 162,427,563 | | 78,404,599 | |
| Net unrealized appreciation | | | | |
| (depreciation) on investments | 146,604,326 | | 200,376,811 | |
| Net Increase (Decrease) in Net Assets | | | | |
| Resulting from Operations | 323,608,850 | | 293,242,439 | |
| Dividends to Shareholders from ($): | | | | |
| Investment income—net: | | | | |
| Class A | (6,575,324 | ) | (10,377,450 | ) |
| Class C | — | | (241,268 | ) |
| Class I | (3,924,651 | ) | (2,683,044 | ) |
| Class Y | (10 | ) | — | |
| Net realized gain on investments: | | | | |
| Class A | (51,839,906 | ) | — | |
| Class C | (2,898,515 | ) | — | |
| Class I | (22,359,910 | ) | — | |
| Class Y | (56 | ) | — | |
| Total Dividends | (87,598,372 | ) | (13,301,762 | ) |
| Capital Stock Transactions ($): | | | | |
| Net proceeds from shares sold: | | | | |
| Class A | 93,294,127 | | 177,137,848 | |
| Class C | 7,071,130 | | 5,439,278 | |
| Class I | 373,408,183 | | 180,872,886 | |
| Class Y | 230,386,990 | | 1,000 | |
| Dividends reinvested: | | | | |
| Class A | 55,175,244 | | 9,589,161 | |
| Class C | 2,210,170 | | 186,217 | |
| Class I | 17,180,086 | | 2,105,267 | |
| Cost of shares redeemed: | | | | |
| Class A | (398,158,894 | ) | (220,294,063 | ) |
| Class C | (8,745,938 | ) | (15,076,115 | ) |
| Class I | (382,029,658 | ) | (89,202,928 | ) |
| Class Y | (6,888,189 | ) | — | |
| Increase (Decrease) in Net Assets | | | | |
| from Capital Stock Transactions | (17,096,749 | ) | 50,758,551 | |
| Total Increase (Decrease) in Net Assets | 218,913,729 | | 330,699,228 | |
| Net Assets ($): | | | | |
| Beginning of Period | 1,434,126,518 | | 1,103,427,290 | |
| End of Period | 1,653,040,247 | | 1,434,126,518 | |
| Undistributed investment income—net | 12,007,936 | | 7,930,960 | |
16
| | | | |
| | Year Ended August 31, | |
| | 2014 | | 2013 | a |
| Capital Share Transactions: | | | | |
| Class Ab | | | | |
| Shares sold | 2,319,848 | | 5,047,494 | |
| Shares issued for dividends reinvested | 1,401,810 | | 306,755 | |
| Shares redeemed | (9,912,476 | ) | (6,673,520 | ) |
| Net Increase (Decrease) in Shares Outstanding | (6,190,818 | ) | (1,319,271 | ) |
| Class Cb | | | | |
| Shares sold | 184,889 | | 164,904 | |
| Shares issued for dividends reinvested | 58,781 | | 6,215 | |
| Shares redeemed | (225,679 | ) | (457,883 | ) |
| Net Increase (Decrease) in Shares Outstanding | 17,991 | | (286,764 | ) |
| Class Ic | | | | |
| Shares sold | 9,328,702 | | 4,943,265 | |
| Shares issued for dividends reinvested | 436,154 | | 67,304 | |
| Shares redeemed | (9,243,274 | ) | (2,634,888 | ) |
| Net Increase (Decrease) in Shares Outstanding | 521,582 | | 2,375,681 | |
| Class Yc | | | | |
| Shares sold | 5,467,286 | | 27.25 | |
| Shares redeemed | (161,310 | ) | — | |
| Net Increase (Decrease) in Shares Outstanding | 5,305,976 | | 27.25 | |
|
| a Effective July 1, 2013, the fund commenced offering ClassY shares. |
| b During the period ended August 31, 2013, 141,569 Class C shares representing $5,004,454 were exchanged for |
| 135,292 Class A shares. |
| c During the period ended August 31, 2014, 3,024,991 Class I shares representing $127,810,865 were exchanged |
| for 3,024,991 ClassY shares. |
See notes to financial statements.
The Fund 17
FINANCIAL HIGHLIGHTS
The following tables describe the performance for each share class for the fiscal periods indicated. All information (except portfolio turnover rate) reflects financial results for a single fund share.Total return shows how much your investment in the fund would have increased (or decreased) during each period, assuming you had reinvested all dividends and distributions.These figures have been derived from the fund’s financial statements.
| | | | | | | | | | |
| | | | Year Ended August 31, | | | |
| Class A Shares | 2014 | | 2013 | | 2012 | | 2011 | | 2010 | |
| Per Share Data ($): | | | | | | | | | | |
| Net asset value, beginning of period | 37.27 | | 29.28 | | 26.27 | | 23.30 | | 23.50 | |
| Investment Operations: | | | | | | | | | | |
| Investment income—neta | .35 | | .40 | | .30 | | .21 | | .14 | |
| Net realized and unrealized | | | | | | | | | | |
| gain (loss) on investments | 8.03 | | 7.97 | | 2.91 | | 2.95 | | (.20 | ) |
| Total from Investment Operations | 8.38 | | 8.37 | | 3.21 | | 3.16 | | (.06 | ) |
| Distributions: | | | | | | | | | | |
| Dividends from | | | | | | | | | | |
| investment income—net | (.26 | ) | (.38 | ) | (.20 | ) | (.19 | ) | (.14 | ) |
| Dividends from net realized | | | | | | | | | | |
| gain on investments | (2.05 | ) | — | | — | | — | | — | |
| Total Distributions | (2.31 | ) | (.38 | ) | (.20 | ) | (.19 | ) | (.14 | ) |
| Net asset value, end of period | 43.34 | | 37.27 | | 29.28 | | 26.27 | | 23.30 | |
| Total Return (%)b | 23.09 | | 28.82 | | 12.31 | | 13.52 | | (.29 | ) |
| Ratios/Supplemental Data (%): | | | | | | | | | | |
| Ratio of total expenses | | | | | | | | | | |
| to average net assets | 1.12 | | 1.14 | | 1.20 | | 1.20 | | 1.22 | |
| Ratio of net expenses | | | | | | | | | | |
| to average net assets | .98 | | .98 | | .98 | | .98 | | 1.05 | |
| Ratio of net investment income | | | | | | | | | | |
| to average net assets | .88 | | 1.19 | | 1.07 | | .74 | | .56 | |
| Portfolio Turnover Rate | 67.00 | | 76.28 | | 95.38 | | 88.37 | | 91.83 | |
| Net Assets, end of period | | | | | | | | | | |
| ($ x 1,000) | 970,817 | | 1,065,660 | | 875,703 | | 599,377 | | 541,877 | |
| |
| a | Based on average shares outstanding. |
| b | Exclusive of sales charge. |
See notes to financial statements.
18
| | | | | | | | | |
| | | | Year Ended August 31, | | | |
| Class C Shares | 2014 | | 2013 | | 2012 | 2011 | | 2010 | |
| Per Share Data ($): | | | | | | | | | |
| Net asset value, beginning of period | 35.54 | | 27.93 | | 25.05 | 22.24 | | 22.45 | |
| Investment Operations: | | | | | | | | | |
| Investment income (loss)—neta | .05 | | .14 | | .08 | (.00 | )b | (.05 | ) |
| Net realized and unrealized | | | | | | | | | |
| gain (loss) on investments | 7.63 | | 7.62 | | 2.80 | 2.81 | | (.16 | ) |
| Total from Investment Operations | 7.68 | | 7.76 | | 2.88 | 2.81 | | (.21 | ) |
| Distributions: | | | | | | | | | |
| Dividends from | | | | | | | | | |
| investment income—net | — | | (.15 | ) | — | (.00 | )b | — | |
| Dividends from net realized | | | | | | | | | |
| gain on investments | (2.05 | ) | — | | — | — | | — | |
| Total Distributions | (2.05 | ) | (.15 | ) | — | (.00 | )b | — | |
| Net asset value, end of period | 41.17 | | 35.54 | | 27.93 | 25.05 | | 22.24 | |
| Total Return (%)c | 22.17 | | 27.87 | | 11.50 | 12.64 | | (.94 | ) |
| Ratios/Supplemental Data (%): | | | | | | | | | |
| Ratio of total expenses | | | | | | | | | |
| to average net assets | 1.88 | | 1.91 | | 1.97 | 1.93 | | 1.95 | |
| Ratio of net expenses | | | | | | | | | |
| to average net assets | 1.73 | | 1.73 | | 1.73 | 1.73 | | 1.80 | |
| Ratio of net investment income | | | | | | | | | |
| (loss) to average net assets | .12 | | .45 | | .32 | (.01 | ) | (.19 | ) |
| Portfolio Turnover Rate | 67.00 | | 76.28 | | 95.38 | 88.37 | | 91.83 | |
| Net Assets, end of period ($ x 1,000) | 59,442 | | 50,665 | | 47,824 | 50,792 | | 46,986 | |
| |
| a | Based on average shares outstanding. |
| b | Amount represents less than $.01 per share. |
| c | Exclusive of sales charge. |
See notes to financial statements.
The Fund 19
FINANCIAL HIGHLIGHTS (continued)
| | | | | | | | | | |
| | | | Year Ended August 31, | | | |
| Class I Shares | 2014 | | 2013 | | 2012 | | 2011 | | 2010 | |
| Per Share Data ($): | | | | | | | | | | |
| Net asset value, beginning of period | 37.36 | | 29.34 | | 26.30 | | 23.31 | | 23.48 | |
| Investment Operations: | | | | | | | | | | |
| Investment income—neta | .47 | | .48 | | .37 | | .28 | | .21 | |
| Net realized and unrealized | | | | | | | | | | |
| gain (loss) on investments | 8.03 | | 7.99 | | 2.90 | | 2.94 | | (.21 | ) |
| Total from Investment Operations | 8.50 | | 8.47 | | 3.27 | | 3.22 | | — | |
| Distributions: | | | | | | | | | | |
| Dividends from investment income—net | (.36 | ) | (.45 | ) | (.23 | ) | (.23 | ) | (.17 | ) |
| Dividends from net realized | | | | | | | | | | |
| gain on investments | (2.05 | ) | — | | — | | — | | — | |
| Total Distributions | (2.41 | ) | (.45 | ) | (.23 | ) | (.23 | ) | (.17 | ) |
| Net asset value, end of period | 43.45 | | 37.36 | | 29.34 | | 26.30 | | 23.31 | |
| Total Return (%) | 23.40 | | 29.18 | | 12.57 | | 13.83 | | (.07 | ) |
| Ratios/Supplemental Data (%): | | | | | | | | | | |
| Ratio of total expenses | | | | | | | | | | |
| to average net assets | .84 | | .95 | | .97 | | 1.10 | | 1.12 | |
| Ratio of net expenses | | | | | | | | | | |
| to average net assets | .73 | | .73 | | .73 | | .73 | | .82 | |
| Ratio of net investment income | | | | | | | | | | |
| to average net assets | 1.14 | | 1.45 | | 1.33 | | .98 | | .81 | |
| Portfolio Turnover Rate | 67.00 | | 76.28 | | 95.38 | | 88.37 | | 91.83 | |
| Net Assets, end of period ($ x 1,000) | 392,260 | | 317,800 | | 179,900 | | 123,565 | | 68,071 | |
| a Based on average shares outstanding. | | | | | | | | | | |
| See notes to financial statements. | | | | | | | | | | |
20
| | | | |
| | Year Ended August 31, | |
| Class Y Shares | 2014 | | 2013 | a |
| Per Share Data ($): | | | | |
| Net asset value, beginning of period | 37.36 | | 36.70 | |
| Investment Operations: | | | | |
| Investment income—netb | .32 | | .08 | |
| Net realized and unrealized | | | | |
| gain (loss) on investments | 8.18 | | .58 | |
| Total from Investment Operations | 8.50 | | .66 | |
| Distributions: | | | | |
| Dividends from investment income—net | (.36 | ) | — | |
| Dividends from net realized gain on investments | (2.05 | ) | — | |
| Total Distributions | (2.41 | ) | — | |
| Net asset value, end of period | 43.45 | | 37.36 | |
| Total Return (%) | 23.40 | | 1.80 | c |
| Ratios/Supplemental Data (%): | | | | |
| Ratio of total expenses | | | | |
| to average net assets | .78 | | .83 | d |
| Ratio of net expenses | | | | |
| to average net assets | .73 | | .73 | d |
| Ratio of net investment income | | | | |
| to average net assets | .87 | | 1.21 | d |
| Portfolio Turnover Rate | 67.00 | | 76.28 | |
| Net Assets, end of period ($ x 1,000) | 230,522 | | 1 | |
| |
| a | From July 1, 2013 (commencement of initial offering) to August 31, 2013. |
| b | Based on average shares outstanding. |
| c | Not annualized. |
| d | Annualized. |
See notes to financial statements.
The Fund 21
NOTES TO FINANCIAL STATEMENTS
NOTE 1—Significant Accounting Policies:
Dreyfus StrategicValue Fund (the “fund”) is a separate diversified series of Advantage Funds, Inc. (the “Company”), which is registered under the Investment Company Act of 1940, as amended (the “Act”), as an open-end management investment company and operates as a series company currently offering eleven series, including the fund. The fund’s investment objective is to seek capital appreciation.The Dreyfus Corporation (the “Manager” or “Dreyfus”), a wholly-owned subsidiary of The Bank of New York Mellon Corporation (“BNY Mellon”), serves as the fund’s investment adviser.
MBSC Securities Corporation (the “Distributor”), a wholly-owned subsidiary of the Manager, is the distributor of the fund’s shares. The fund is authorized to issue 700 million shares of $.001 par value Common Stock.The fund currently offers four classes of shares: Class A (300 million shares authorized), Class C (100 million shares authorized), Class I (200 million shares authorized) and Class Y (100 million shares authorized). Class A shares generally are subject to a sales charge imposed at the time of purchase. Class C shares are subject to a contingent deferred sales charge (“CDSC”) imposed on Class C shares redeemed within one year of purchase. Class I and Class Y shares are sold at net asset value per share generally to institutional investors. Other differences between the classes include the services offered to and the expenses borne by each class, the allocation of certain transfer agency costs, and certain voting rights. Income, expenses (other than expenses attributable to a specific class), and realized and unrealized gains or losses on investments are allocated to each class of shares based on its relative net assets.
The Company accounts separately for the assets, liabilities and operations of each series. Expenses directly attributable to each series are charged to that series’ operations; expenses which are applicable to all series are allocated among them on a pro rata basis.
The Financial Accounting Standards Board (“FASB”) Accounting Standards Codification is the exclusive reference of authoritative U.S. generally accepted accounting principles (“GAAP”) recognized by the FASB to be applied by nongovernmental entities. Rules and interpretive
22
releases of the Securities and Exchange Commission (“SEC”) under authority of federal laws are also sources of authoritative GAAP for SEC registrants. The fund’s financial statements are prepared in accordance with GAAP, which may require the use of management estimates and assumptions. Actual results could differ from those estimates.
The Company enters into contracts that contain a variety of indemnifications. The fund’s maximum exposure under these arrangements is unknown.The fund does not anticipate recognizing any loss related to these arrangements.
(a) Portfolio valuation: The fair value of a financial instrument is the amount that would be received to sell an asset or paid to transfer a liability in an orderly transaction between market participants at the measurement date (i.e., the exit price). GAAP establishes a fair value hierarchy that prioritizes the inputs of valuation techniques used to measure fair value. This hierarchy gives the highest priority to unadjusted quoted prices in active markets for identical assets or liabilities (Level 1 measurements) and the lowest priority to unobservable inputs (Level 3 measurements).
Additionally, GAAP provides guidance on determining whether the volume and activity in a market has decreased significantly and whether such a decrease in activity results in transactions that are not orderly. GAAP requires enhanced disclosures around valuation inputs and techniques used during annual and interim periods.
Various inputs are used in determining the value of the fund’s investments relating to fair value measurements. These inputs are summarized in the three broad levels listed below:
Level 1—unadjusted quoted prices in active markets for identical investments.
Level 2—other significant observable inputs (including quoted prices for similar investments, interest rates, prepayment speeds, credit risk, etc.).
Level 3—significant unobservable inputs (including the fund’s own assumptions in determining the fair value of investments).
The Fund 23
NOTES TO FINANCIAL STATEMENTS (continued)
The inputs or methodology used for valuing securities are not necessarily an indication of the risk associated with investing in those securities.
Changes in valuation techniques may result in transfers in or out of an assigned level within the disclosure hierarchy. Valuation techniques used to value the fund’s investments are as follows:
Investments in securities are valued at the last sales price on the securities exchange or national securities market on which such securities are primarily traded. Securities listed on the National Market System for which market quotations are available are valued at the official closing price or, if there is no official closing price that day, at the last sales price. Securities not listed on an exchange or the national securities market, or securities for which there were no transactions, are valued at the average of the most recent bid and asked prices, except for open short positions, where the asked price is used for valuation purposes. Bid price is used when no asked price is available. Registered investment companies that are not traded on an exchange are valued at their net asset value.All of the preceding securities are generally categorized within Level 1 of the fair value hierarchy.
Fair valuing of securities may be determined with the assistance of a pricing service using calculations based on indices of domestic securities and other appropriate indicators, such as prices of relevant American Depository Receipts and financial futures. Utilizing these techniques may result in transfers between Level 1 and Level 2 of the fair value hierarchy.
When market quotations or official closing prices are not readily available, or are determined not to reflect accurately fair value, such as when the value of a security has been significantly affected by events after the close of the exchange or market on which the security is principally traded (for example, a foreign exchange or market), but before the fund calculates its net asset value, the fund may value these investments at fair value as determined in accordance with the procedures approved by the Company’s Board of Directors (the “Board”). Certain factors may be considered when fair valuing investments such as: fundamental analytical data, the nature and duration of restrictions
24
on disposition, an evaluation of the forces that influence the market in which the securities are purchased and sold, and public trading in similar securities of the issuer or comparable issuers. These securities are either categorized within Level 2 or 3 of the fair value hierarchy depending on the relevant inputs used.
For restricted securities where observable inputs are limited, assumptions about market activity and risk are used and are generally categorized within Level 3 of the fair value hierarchy.
The following is a summary of the inputs used as of August 31, 2014 in valuing the fund's investments:
| | | | |
| | | Level 2—Other | Level 3— | |
| | Level 1— | Significant | Significant | |
| | Unadjusted | Observable | Unobservable | |
| | Quoted Prices | Inputs | Inputs | Total |
| Assets ($) | | | | |
| Investments in Securities: | | | |
| Equity Securities— | | | | |
| Domestic | | | | |
| Common | | | | |
| Stocks† | 1,639,788,528 | — | — | 1,639,788,528 |
| Exchange-Traded | | | | |
| Funds | 10,093,618 | — | — | 10,093,618 |
| Mutual Funds | 3,665,526 | — | — | 3,665,526 |
| |
| † See Statement of Investments for additional detailed categorizations. | |
At August 31, 2014, there were no transfers between Level 1 and Level 2 of the fair value hierarchy.
(b) Securities transactions and investment income: Securities transactions are recorded on a trade date basis. Realized gains and losses from securities transactions are recorded on the identified cost basis. Dividend income is recognized on the ex-dividend date and interest income, including, where applicable, accretion of discount and amortization of premium on investments, is recognized on the accrual basis.
Pursuant to a securities lending agreement with The Bank of New York Mellon, a subsidiary of BNY Mellon and an affiliate of Dreyfus, the fund may lend securities to qualified institutions. It is the fund’s
The Fund 25
NOTES TO FINANCIAL STATEMENTS (continued)
policy that, at origination, all loans are secured by collateral of at least 102% of the value of U.S. securities loaned and 105% of the value of foreign securities loaned. Collateral equivalent to at least 100% of the market value of securities on loan is maintained at all times. Collateral is either in the form of cash, which can be invested in certain money market mutual funds managed by the Manager or U.S. Government and Agency securities. The fund is entitled to receive all dividends, interest and distributions on securities loaned, in addition to income earned as a result of the lending transaction. Should a borrower fail to return the securities in a timely manner, The Bank of New York Mellon is required to replace the securities for the benefit of the fund or credit the fund with the market value of the unreturned securities and is subrogated to the fund’s rights against the borrower and the collateral. During the period ended August 31, 2014, The Bank of New York Mellon earned $1,840 from lending portfolio securities, pursuant to the securities lending agreement.
(c) Affiliated issuers: Investments in other investment companies advised by Dreyfus are defined as “affiliated” under the Act. Investments in affiliated investment companies during the period ended August 31, 2014 were as follows:
| | | | | |
| Affiliated | | | | | |
| Investment | Value | | | Value | Net |
| Company | 8/31/2013 ($) | Purchases ($) | Sales ($) | 8/31/2014 ($) | Assets (%) |
| Dreyfus | | | | | |
| Institutional | | | | | |
| Preferred | | | | | |
| Plus Money | | | | | |
| Market Fund | 4,895,169 | 261,169,517 | 262,399,160 | 3,665,526 | .2 |
| Dreyfus | | | | | |
| Institutional | | | | | |
| Cash | | | | | |
| Advantage | | | | | |
| Fund | — | 32,577,867 | 32,577,867 | — | — |
| Total | 4,895,169 | 293,747,384 | 294,977,027 | 3,665,526 | .2 |
(d) Dividends to shareholders: Dividends are recorded on the ex-dividend date. Dividends from investment income-net and dividends from net realized capital gains, if any, are normally declared and paid annually, but the fund may make distributions on a more frequent basis
26
to comply with the distribution requirements of the Internal Revenue Code of 1986, as amended (the “Code”).To the extent that net realized capital gains can be offset by capital loss carryovers, it is the policy of the fund not to distribute such gains. Income and capital gain distributions are determined in accordance with income tax regulations, which may differ from GAAP.
(e) Federal income taxes: It is the policy of the fund to continue to qualify as a regulated investment company, if such qualification is in the best interests of its shareholders, by complying with the applicable provisions of the Code, and to make distributions of taxable income sufficient to relieve it from substantially all federal income and excise taxes.
As of and during the period ended August 31, 2014, the fund did not have any liabilities for any uncertain tax positions.The fund recognizes interest and penalties, if any, related to uncertain tax positions as income tax expense in the Statement of Operations. During the period ended August 31, 2014, the fund did not incur any interest or penalties.
Each tax year in the four-year period ended August 31, 2014 remains subject to examination by the Internal Revenue Service and state taxing authorities.
At August 31, 2014, the components of accumulated earnings on a tax basis were as follows: undistributed ordinary income $41,037,056, undistributed capital gains $100,856,698, accumulated capital losses $19,207,939 and unrealized appreciation $384,180,741.
Under the Regulated Investment Company Modernization Act of 2010 (the “2010 Act”), the fund is permitted to carry forward capital losses incurred in taxable years beginning after December 22, 2010 (“post-enactment losses”) for an unlimited period. Furthermore, post-enactment capital loss carryovers retain their character as either short-term or long-term capital losses rather than short-term as they were under previous statute.The 2010 Act requires post-enactment losses to be utilized before the utilization of losses incurred in taxable years prior to the effective date of the 2010 Act (“pre-enactment losses”).As
The Fund 27
NOTES TO FINANCIAL STATEMENTS (continued)
a result of this ordering rule, pre-enactment losses may be more likely to expire unused.
As a result of the fund’s merger with Dreyfus Core Value Fund, capital losses of $13,044,257 are available to offset future gains, if any. Based on certain provisions in the Code, the amount of losses which can be utilized in subsequent years is subject to an annual limitation. This acquired capital loss will expire in fiscal year 2017. As a result of the fund’s merger with Dreyfus Large Cap Value Fund, capital losses of $6,163,682 are available to offset future gains, if any. Based on certain provisions in the Code, the amount of losses which can be utilized in subsequent years is subject to an annual limitation. Of this acquired capital loss, $5,004,074 will expire in fiscal year 2017 and $1,159,608 will expire in fiscal year 2018.
The tax character of distributions paid to shareholders during the fiscal periods ended August 31, 2014 and August 31, 2013 were as follows: ordinary income $30,943,738 and $13,301,762, and long-term capital gains $56,654,634 and $0, respectively.
NOTE 2—Bank Lines of Credit:
The fund participates with other Dreyfus-managed funds in a $265 million unsecured credit facility led by Citibank, N.A. and a $300 million unsecured credit facility provided by The Bank of New York Mellon (each, a “Facility”), each to be utilized primarily for temporary or emergency purposes, including the financing of redemptions. Prior to October 9, 2013, the unsecured credit facility with Citibank, N.A. was $210 million. In connection therewith, the fund has agreed to pay its pro rata portion of commitment fees for each Facility. Interest is charged to the fund based on rates determined pursuant to the terms of the respective Facility at the time of borrowing.
The average amount of borrowings outstanding under the Facilities during the period ended August 31, 2014 was approximately $454,000 with a related weighted average annualized interest rate of 1.10%.
28
NOTE 3—Management Fee and Other Transactions with Affiliates:
(a) Pursuant to a management agreement with the Manager, the management fee is computed at the annual rate of .75% of the value of the fund’s average daily net assets and is payable monthly.The Manager has contractually agreed, from September 1, 2013 through January 1, 2015 for Class A, Class C, Class I and Class Y shares, to waive receipt of its fees and/or assume the expenses of the fund, so that the expenses of Class A, Class C, Class I and Class Y shares (excluding taxes, interest expense, brokerage commissions, commitment fees on borrowings and extraordinary expenses) do not exceed .98%, 1.73%, .73% and .73% of the value of the respective class’ average daily net assets.The reduction in expenses, pursuant to the undertaking, amounted to $2,084,555 during the period ended August 31, 2014.
During the period ended August 31, 2014, the Distributor retained $30,954 from commissions earned on sales of the fund’s Class A shares and $9,162 from CDSCs on redemptions of the fund’s Class C shares.
(b) Under the Distribution Plan adopted pursuant to Rule 12b-1 under the Act, Class C shares pay the Distributor for distributing its shares at an annual rate of .75% of the value of its average daily net assets. During the period ended August 31, 2014, Class C shares were charged $425,247 pursuant to the Distribution Plan.
(c) Under the Shareholder Services Plan, Class A and Class C shares pay the Distributor at an annual rate of .25% of the value of their average daily net assets for the provision of certain services. The services provided may include personal services relating to shareholder accounts, such as answering shareholder inquiries regarding the fund and providing reports and other information, and services related to the maintenance of shareholder accounts. The Distributor may make payments to Service Agents (securities dealers, financial institutions or other industry professionals) with respect to these services. The
The Fund 29
NOTES TO FINANCIAL STATEMENTS (continued)
Distributor determines the amounts to be paid to Service Agents. During the period ended August 31, 2014, Class A and Class C shares were charged $2,613,279 and $141,749, respectively, pursuant to the Shareholder Services Plan.
The fund has arrangements with the transfer agent and the custodian whereby the fund may receive earnings credits when positive cash balances are maintained, which are used to offset transfer agency and custody fees. For financial reporting purposes, the fund includes net earnings credits as an expense offset in the Statement of Operations.
The fund compensates Dreyfus Transfer, Inc., a wholly-owned subsidiary of the Manager, under a transfer agency agreement for providing transfer agency and cash management services for the fund. The majority of transfer agency fees are comprised of amounts paid on a per account basis, while cash management fees are related to fund subscriptions and redemptions. During the period ended August 31, 2014, the fund was charged $276,918 for transfer agency services and $16,541 for cash management services. These fees are included in Shareholder servicing costs in the Statement of Operations. Cash management fees were partially offset by earnings credits of $1,223.
The fund compensates The Bank of New York Mellon under a custody agreement for providing custodial services for the fund. These fees are determined based on net assets, geographic region and transaction activity. During the period ended August 31, 2014, the fund was charged $97,084 pursuant to the custody agreement.
The fund compensated The Bank of New York Mellon under a cash management agreement that was in effect until September 30, 2013 for performing certain cash management services related to fund subscriptions and redemptions. During the period ended August 31, 2014, the fund was charged $436 pursuant to the cash management agreement, which is included in Shareholder servicing costs in the Statement of Operations. These fees were partially offset by earnings credits of $2.
30
During the period ended August 31, 2014, the fund was charged $8,296 for services performed by the Chief Compliance Officer and his staff.
The components of “Due to The Dreyfus Corporation and affiliates” in the Statement of Assets and Liabilities consist of: management fees $1,030,525, Distribution Plan fees $37,102, Shareholder Services Plan fees $219,107, custodian fees $39,478, Chief Compliance Officer fees $1,154 and transfer agency fees $52,401, which are offset against an expense reimbursement currently in effect in the amount of $189,958.
(d) Each Board member also serves as a Board member of other funds within the Dreyfus complex. Annual retainer fees and attendance fees are allocated to each fund based on net assets.
NOTE 4—Securities Transactions:
The aggregate amount of purchases and sales of investment securities, excluding short-term securities, during the period ended August 31, 2014, amounted to $1,053,809,570 and $1,140,030,589, respectively.
At August 31, 2014, the cost of investments for federal income tax purposes was $1,269,366,931; accordingly, accumulated net unrealized appreciation on investments was $384,180,741, consisting of $394,931,911 gross unrealized appreciation and $10,751,170 gross unrealized depreciation.
The Fund 31
|
| REPORT OF INDEPENDENT REGISTERED |
| PUBLIC ACCOUNTING FIRM |
Shareholders and Board of Directors
Dreyfus Strategic Value Fund
We have audited the accompanying statement of assets and liabilities, including the statement of investments, of Dreyfus Strategic Value Fund (one of the series comprising Advantage Funds, Inc.) as of August 31, 2014, and the related statement of operations for the year then ended, the statement of changes in net assets for each of the two years in the period then ended, and the financial highlights for each of the periods indicated therein. These financial statements and financial highlights are the responsibility of the Fund’s management. Our responsibility is to express an opinion on these financial statements and financial highlights based on our audits.
We conducted our audits in accordance with the standards of the Public Company Accounting Oversight Board (United States).Those standards require that we plan and perform the audit to obtain reasonable assurance about whether the financial statements and financial highlights are free of material misstatement. We were not engaged to perform an audit of the Fund’s internal control over financial reporting. Our audits included consideration of internal control over financial reporting as a basis for designing audit procedures that are appropriate in the circumstances, but not for the purpose of expressing an opinion on the effectiveness of the Fund’s internal control over financial reporting. Accordingly, we express no such opinion. An audit also includes examining, on a test basis, evidence supporting the amounts and disclosures in the financial statements and financial highlights, assessing the accounting principles used and significant estimates made by management, and evaluating the overall financial statement presentation. Our procedures included confirmation of securities owned as of August 31, 2014 by correspondence with the custodian and others.We believe that our audits provide a reasonable basis for our opinion.
In our opinion, the financial statements and financial highlights referred to above present fairly, in all material respects, the financial position of Dreyfus StrategicValue Fund at August 31, 2014, the results of its operations for the year then ended, the changes in its net assets for each of the two years in the period then ended, and the financial highlights for each of the indicated periods, in conformity with U.S. generally accepted accounting principles.

New York, New York
October 28, 2014
32
IMPORTANT TAX INFORMATION (Unaudited)
For federal tax purposes, the fund hereby reports 73.00% of the ordinary dividends paid during the fiscal year ended August 31, 2014 as qualifying for the corporate dividends received deduction. Also, certain dividends paid by the fund may be subject to a maximum tax rate of 15%, as provided for by the Jobs and Growth Tax Relief Reconciliation Act of 2003. Of the distributions paid during the fiscal year, $24,635,515 represents the maximum amount that may be considered qualified dividend income. The fund also hereby reports $.5425 per share as a short-term capital gain distribution and $1.5034 per share as a long-term capital gain distribution paid on December 18, 2013. Shareholders will receive notification in early 2015 of the percentage applicable to the preparation of their 2014 income tax returns.
The Fund 33
|
| INFORMATION ABOUT THE RENEWAL OF THE |
| FUND’S MANAGEMENT AGREEMENT (Unaudited) |
At a meeting of the fund’s Board of Directors held on March 4-5, 2014, the Board considered the renewal of the fund’s Management Agreement pursuant to which Dreyfus provides the fund with investment advisory and administrative services (the “Agreement”). The Board members, none of whom are “interested persons” (as defined in the Investment Company Act of 1940, as amended) of the fund, were assisted in their review by independent legal counsel and met with counsel in executive session separate from Dreyfus representatives. In considering the renewal of the Agreement, the Board considered all factors that it believed to be relevant, including those discussed below.The Board did not identify any one factor as dispositive, and each Board member may have attributed different weights to the factors considered.
Analysis of Nature, Extent, and Quality of Services Provided to the Fund.The Board considered information provided to them at the meeting and in previous presentations from Dreyfus representatives regarding the nature, extent, and quality of the services provided to funds in the Dreyfus fund complex. Dreyfus provided the number of open accounts in the fund, the fund’s asset size and the allocation of fund assets among distribution channels. Dreyfus also had previously provided information regarding the diverse intermediary relationships and distribution channels of funds in the Dreyfus fund complex (such as retail direct or intermediary, in which intermediaries typically are paid by the fund and/or Dreyfus) and Dreyfus’ corresponding need for broad, deep, and diverse resources to be able to provide ongoing shareholder services to each intermediary or distribution channel, as applicable to the fund.
The Board also considered research support available to, and portfolio management capabilities of, the fund’s portfolio management personnel and that Dreyfus also provides oversight of day-to-day fund operations, including fund accounting and administration and assistance in meeting legal and regulatory requirements.The Board also considered Dreyfus’ extensive administrative, accounting, and compliance infra-structures.The Board also considered portfolio management’s brokerage policies and practices (including policies and practices regarding soft dollars) and the standards applied in seeking best execution.
34
Comparative Analysis of the Fund’s Performance and Management Fee and Expense Ratio. The Board reviewed reports prepared by Lipper, Inc. (“Lipper”), an independent provider of investment company data, which included information comparing (1) the fund’s performance with the performance of a group of comparable funds (the “Performance Group”) and with a broader group of funds (the “Performance Universe”), all for various periods ended December 31, 2013, and (2) the fund’s actual and contractual management fees and total expenses with those of a group of comparable funds (the “Expense Group”) and with a broader group of funds (the “Expense Universe”), the information for which was derived in part from fund financial statements available to Lipper as of the date of its analysis. Dreyfus previously had furnished the Board with a description of the methodology Lipper used to select the Performance Group and Performance Universe and the Expense Group and Expense Universe.
Dreyfus representatives stated that the usefulness of performance comparisons may be affected by a number of factors, including different investment limitations that may be applicable to the fund and comparison funds. The Board discussed the results of the comparisons and noted that the fund’s total return performance was above or at the Performance Group and Performance Universe medians and ranked first in the Performance Group and in the first quartile of the Performance Universe for the one-, two-year and ten-year periods. Dreyfus also provided a comparison of the fund’s calendar year total returns to the returns of the fund’s benchmark index.
The Board also reviewed the range of actual and contractual management fees and total expenses of the Expense Group and Expense Universe funds and discussed the results of the comparisons.The Board noted that the fund’s contractual management fee was above the Expense Group median and the fund’s actual management fee and total expenses were below the Expense Group and Expense Universe medians.
The Fund 35
|
| INFORMATION ABOUT THE RENEWAL OF THE FUND’S |
| MANAGEMENT AGREEMENT (Unaudited) (continued) |
Dreyfus representatives noted that Dreyfus has contractually agreed, until January 1, 2015, to waive receipt of its fees and/or assume the expenses of the fund so that the expenses of Class A, Class C, Class I and Class Y shares (excluding taxes, interest expense, brokerage commissions, commitment fees on borrowings and extraordinary expenses) do not exceed .98%, 1.73%, .73% and .73%, respectively, of each class’ average daily net assets.
Dreyfus representatives reviewed with the Board the management or investment advisory fees (1) paid by funds advised or administered by Dreyfus that are in the same Lipper category as the fund and (2) paid to Dreyfus or the Dreyfus-affiliated primary employer of the fund’s primary portfolio manager(s) for advising any separate accounts and/or other types of client portfolios that are considered to have similar investment strategies and policies as the fund (the “Similar Clients”), and explained the nature of the Similar Clients. They discussed differences in fees paid and the relationship of the fees paid in light of any differences in the services provided and other relevant factors. The Board considered the relevance of the fee information provided for the Similar Clients to evaluate the appropriateness and reasonableness of the fund’s management fee.
Analysis of Profitability and Economies of Scale. Dreyfus representatives reviewed the expenses allocated and profit received by Dreyfus and the resulting profitability percentage for managing the fund and the aggregate profitability percentage to Dreyfus of managing the funds in the Dreyfus fund complex, and the method used to determine the expenses and profit. The Board concluded that the profitability results were not unreasonable, given the services rendered and service levels provided by Dreyfus.The Board also noted the expense limitation arrangement and its effect on Dreyfus’ profitability. The Board also had been provided with information prepared by an independent consulting firm regarding Dreyfus’ approach to allocating costs to, and determining the profitability of, individual funds and the entire Dreyfus fund complex.The consulting firm also had analyzed where any economies of scale might emerge in connection with the management of a fund.
36
The Board considered on the advice of its counsel the profitability analysis (1) as part of its evaluation of whether the fees under the Agreement bear a reasonable relationship to the mix of services provided by Dreyfus, including the nature, extent and quality of such services, and (2) in light of the relevant circumstances for the fund and the extent to which economies of scale would be realized if the fund grows and whether fee levels reflect these economies of scale for the benefit of fund shareholders. Dreyfus representatives also noted that, as a result of shared and allocated costs among funds in the Dreyfus fund complex, the extent of economies of scale could depend substantially on the level of assets in the complex as a whole, so that increases and decreases in complex-wide assets can affect potential economies of scale in a manner that is disproportionate to, or even in the opposite direction from, changes in the fund’s asset level. The Board also considered potential benefits to Dreyfus from acting as investment adviser and noted the soft dollar arrangements in effect for trading the fund’s investments.
At the conclusion of these discussions, the Board agreed that it had been furnished with sufficient information to make an informed business decision with respect to the renewal of the Agreement. Based on the discussions and considerations as described above, the Board concluded and determined as follows.
The Board concluded that the nature, extent and quality of the services provided by Dreyfus are adequate and appropriate.
The Board was satisfied with the fund’s performance.
The Board concluded that the fee paid to Dreyfus was reasonable in light of the considerations described above.
The Board determined that the economies of scale which may accrue to Dreyfus and its affiliates in connection with the management of the fund had been adequately considered by Dreyfus in connection with the fee rate charged to the fund pursuant to the Agreement and that, to the extent in the future it were determined that material economies of scale had not been shared with the fund, the Board would seek to have those economies of scale shared with the fund.
The Fund 37
|
| INFORMATION ABOUT THE RENEWAL OF THE FUND’S |
| MANAGEMENT AGREEMENT (Unaudited) (continued) |
In evaluating the Agreement, the Board considered these conclusions and determinations and also relied on its previous knowledge, gained through meetings and other interactions with Dreyfus and its affiliates, of the fund and the services provided to the fund by Dreyfus. The Board also relied on information received on a routine and regular basis throughout the year relating to the operations of the fund and the investment management and other services provided under the Agreement, including information on the investment performance of the fund in comparison to similar mutual funds and benchmark performance indices; general market outlook as applicable to the fund; and compliance reports. In addition, the Board’s consideration of the contractual fee arrangements for this fund had the benefit of a number of years of reviews of prior or similar agreements during which lengthy discussions took place between the Board and Dreyfus representatives. Certain aspects of the arrangements may receive greater scrutiny in some years than in others, and the Board’s conclusions may be based, in part, on their consideration of the same or similar arrangements in prior years. The Board determined that renewal of the Agreement was in the best interests of the fund and its shareholders.
38
|
| BOARD MEMBERS INFORMATION (Unaudited) |
| INDEPENDENT BOARD MEMBERS |
|
| Joseph S. DiMartino (70) |
| Chairman of the Board (1995) |
| Principal Occupation During Past 5Years: |
| • Corporate Director and Trustee (1995-present) |
| Other Public Company Board Memberships During Past 5Years: |
| • CBIZ (formerly, Century Business Services, Inc.), a provider of outsourcing functions for small |
| and medium size companies, Director (1997-present) |
| • The Newark Group, a provider of a national market of paper recovery facilities, paperboard |
| mills and paperboard converting plants, Director (2000-2010) |
| • Sunair Services Corporation, a provider of certain outdoor-related services to homes and |
| businesses, Director (2005-2009) |
| No. of Portfolios for which Board Member Serves: 142 |
| ——————— |
| Peggy C. Davis (71) |
| Board Member (2006) |
| Principal Occupation During Past 5Years: |
| • Shad Professor of Law, New York University School of Law (1983-present) |
| No. of Portfolios for which Board Member Serves: 52 |
| ——————— |
| David P. Feldman (74) |
| Board Member (1996) |
| Principal Occupation During Past 5Years: |
| • Corporate Director and Trustee (1985-present) |
| Other Public Company Board Membership During Past 5Years: |
| • BBH Mutual Funds Group (5 registered mutual funds), Director (1992-present) |
| No. of Portfolios for which Board Member Serves: 38 |
| ——————— |
| Ehud Houminer (74) |
| Board Member (1993) |
| Principal Occupation During Past 5Years: |
| • Executive-in-Residence at the Columbia Business School, Columbia University (1992-present) |
| Other Public Company Board Membership During Past 5Years: |
| • Avnet Inc., an electronics distributor, Director (1993-2012) |
| No. of Portfolios for which Board Member Serves: 62 |
The Fund 39
|
| BOARD MEMBERS INFORMATION (Unaudited) (continued) |
| INDEPENDENT BOARD MEMBERS (continued) |
|
| Lynn Martin (74) |
| Board Member (2012) |
| Principal Occupation During Past 5Years: |
| • President of The Martin Hall Group LLC, a human resources consulting firm (2005-2012) |
| Other Public Company Board Memberships During Past 5Years: |
| • AT&T Inc., a telecommunications company, Director (1999-2012) |
| • Ryder System, Inc., a supply chain and transportation management company, Director (1993-2012) |
| • The Proctor & Gamble Co., a consumer products company, Director (1994-2009) |
| • Constellation Energy Group Inc., Director (2003-2009) |
| No. of Portfolios for which Board Member Serves: 38 |
| ——————— |
| Robin A. Melvin (50) |
| Board Member (2012) |
| Principal Occupation During Past 5Years: |
| • Board Member, Illinois Mentoring Partnership, non-profit organization dedicated to increasing |
| the quantity and quality of mentoring services in Illinois (2013-present) |
| • Director, Boisi Family Foundation, a private family foundation that supports youth-serving orga- |
| nizations that promote the self sufficiency of youth from disadvantaged circumstances (1995-2012) |
| No. of Portfolios for which Board Member Serves: 109 |
| ——————— |
| Dr. Martin Peretz (75) |
| Board Member (2006) |
| Principal Occupation During Past 5Years: |
| • Editor-in-Chief Emeritus of The New Republic Magazine (2010-2011) (previously, |
| Editor-in-Chief, 1974-2010) |
| • Director of TheStreet.com, a financial information service on the web (1996-2010) |
| No. of Portfolios for which Board Member Serves: 38 |
| ——————— |
Once elected all Board Members serve for an indefinite term, but achieve Emeritus status upon reaching age 80.The address of the Board Members and Officers is c/o The Dreyfus Corporation, 200 Park Avenue, New York, New York 10166. Additional information about the Board Members is available in the fund’s Statement of Additional Information which can be obtained from Dreyfus free of charge by calling this toll free number: 1-800-DREYFUS.
James F. Henry, Emeritus Board Member
Dr. Paul A. Marks, Emeritus Board Member
Philip L.Toia, Emeritus Board Member
40
OFFICERS OF THE FUND (Unaudited)
BRADLEY J. SKAPYAK, President since January 2010.
Chief Operating Officer and a director of the Manager since June 2009, Chairman of Dreyfus Transfer, Inc., an affiliate of the Manager and the transfer agent of the funds, since May 2011 and Executive Vice President of the Distributor since June 2007. From April 2003 to June 2009, Mr. Skapyak was the head of the Investment Accounting and Support Department of the Manager. He is an officer of 69 investment companies (comprised of 142 portfolios) managed by the Manager. He is 55 years old and has been an employee of the Manager since February 1988.
JOHN PAK, Chief Legal Officer since March 2013.
Deputy General Counsel, Investment Management, of BNY Mellon since August 2014; Chief Legal Officer of the Manager since August 2012; from March 2005 to July 2012, Managing Director of Deutsche Bank, Deputy Global Head of Deutsche Asset Management Legal and Regional Head of Deutsche Asset Management Americas Legal. He is an officer of 70 investment companies (comprised of 167 portfolios) managed by the Manager. He is 45 years old and has been an employee of the Manager since August 2012.
JANETTE E. FARRAGHER, Vice President and Secretary since December 2011.
Assistant General Counsel of BNY Mellon, and an officer of 70 investment companies (comprised of 167 portfolios) managed by the Manager. She is 51 years old and has been an employee of the Manager since February 1984.
KIESHA ASTWOOD, Vice President and Assistant Secretary since January 2010.
Counsel of BNY Mellon, and an officer of 70 investment companies (comprised of 167 portfolios) managed by the Manager. She is 41 years old and has been an employee of the Manager since July 1995.
JAMES BITETTO, Vice President and Assistant Secretary since August 2005.
Managing Counsel of BNY Mellon and Secretary of the Manager, and an officer of 70 investment companies (comprised of 167 portfolios) managed by the Manager. He is 48 years old and has been an employee of the Manager since December 1996.
JONI LACKS CHARATAN, Vice President and Assistant Secretary since August 2005.
Managing Counsel of BNY Mellon, and an officer of 70 investment companies (comprised of 167 portfolios) managed by the Manager. She is 58 years old and has been an employee of the Manager since October 1988.
JOSEPH M. CHIOFFI, Vice President and Assistant Secretary since August 2005.
Managing Counsel of BNY Mellon, and an officer of 70 investment companies (comprised of 167 portfolios) managed by the Manager. He is 52 years old and has been an employee of the Manager since June 2000.
JOHN B. HAMMALIAN, Vice President and Assistant Secretary since August 2005.
Senior Managing Counsel of BNY Mellon, and an officer of 70 investment companies (comprised of 167 portfolios) managed by the Manager. He is 51 years old and has been an employee of the Manager since February 1991.
SARAH S. KELLEHER, Vice President and Assistant Secretary since April 2014.
Senior Counsel of BNY Mellon, and an officer of 70 investment companies (comprised of 167 portfolios) managed by the Manager; from August 2005 to March 2013, Associate General Counsel of Third Avenue Management. She is 38 years old and has been an employee of the Manager since March 2013.
The Fund 41
OFFICERS OF THE FUND (Unaudited) (continued)
JEFF PRUSNOFSKY, Vice President and Assistant Secretary since August 2005.
Senior Managing Counsel of BNY Mellon, and an officer of 70 investment companies (comprised of 167 portfolios) managed by the Manager. He is 49 years old and has been an employee of the Manager since October 1990.
JAMES WINDELS, Treasurer since November 2001.
Director – Mutual Fund Accounting of the Manager, and an officer of 70 investment companies (comprised of 167 portfolios) managed by the Manager. He is 55 years old and has been an employee of the Manager since April 1985.
RICHARD CASSARO, Assistant Treasurer since January 2008.
Senior Accounting Manager – Money Market and Municipal Bond Funds of the Manager, and an officer of 70 investment companies (comprised of 167 portfolios) managed by the Manager. He is 55 years old and has been an employee of the Manager since September 1982.
GAVIN C. REILLY, Assistant Treasurer since December 2005.
Tax Manager of the Investment Accounting and Support Department of the Manager, and an officer of 70 investment companies (comprised of 167 portfolios) managed by the Manager. He is 46 years old and has been an employee of the Manager since April 1991.
ROBERT S. ROBOL, Assistant Treasurer since August 2005.
Senior Accounting Manager – Fixed Income Funds of the Manager, and an officer of 70 investment companies (comprised of 167 portfolios) managed by the Manager. He is 50 years old and has been an employee of the Manager since October 1988.
ROBERT SALVIOLO, Assistant Treasurer since July 2007.
Senior Accounting Manager – Equity Funds of the Manager, and an officer of 70 investment companies (comprised of 167 portfolios) managed by the Manager. He is 47 years old and has been an employee of the Manager since June 1989.
ROBERT SVAGNA, Assistant Treasurer since August 2005.
Senior Accounting Manager – Equity Funds of the Manager, and an officer of 70 investment companies (comprised of 167 portfolios) managed by the Manager. He is 47 years old and has been an employee of the Manager since November 1990.
JOSEPH W. CONNOLLY, Chief Compliance Officer since October 2004.
Chief Compliance Officer of the Manager and The Dreyfus Family of Funds (70 investment companies, comprised of 167 portfolios).
He is 57 years old and has served in various capacities with the Manager since 1980, including manager of the firm’s Fund Accounting Department from 1997 through October 2001.
MATTHEW D. CONNOLLY, Anti-Money Laundering Compliance Officer since April 2012.
Anti-Money Laundering Compliance Officer of the Distributor since October 2011; from March 2010 to September 2011, Global Head, KYC Reviews and Director of UBS Investment Bank; until March 2010, AML Compliance Officer and Senior Vice President of Citi Global Wealth Management. He is an officer of 65 investment companies (comprised of 162 portfolios) managed by the Manager. He is 42 years old and has been an employee of the Distributor since October 2011.
42
For More Information
Telephone Call your financial representative or 1-800-DREYFUS
Mail The Dreyfus Family of Funds, 144 Glenn Curtiss Boulevard, Uniondale, NY 11556-0144
The fund files its complete schedule of portfolio holdings with the Securities and Exchange Commission (“SEC”) for the first and third quarters of each fiscal year on Form N-Q. The fund’s Forms N-Q are available on the SEC’s website at http://www.sec.gov and may be reviewed and copied at the SEC’s Public Reference Room in Washington, DC. Information on the operation of the Public Reference Room may be obtained by calling 1-800-SEC-0330.
A description of the policies and procedures that the fund uses to determine how to vote proxies relating to portfolio securities, and information regarding how the fund voted these proxies for the most recent 12-month period ended June 30 is available at http://www.dreyfus.com and on the SEC’s website at http://www.sec.gov. The description of the policies and procedures is also available without charge, upon request, by calling 1-800-DREYFUS.

|
| Dreyfus |
| Structured Midcap Fund |
ANNUAL REPORT August 31, 2014

Save time. Save paper. View your next shareholder report online as soon as it’s available. Log into www.dreyfus.com and sign up for Dreyfus eCommunications. It’s simple and only takes a few minutes.
The views expressed in this report reflect those of the portfolio manager only through the end of the period covered and do not necessarily represent the views of Dreyfus or any other person in the Dreyfus organization. Any such views are subject to change at any time based upon market or other conditions and Dreyfus disclaims any responsibility to update such views.These views may not be relied on as investment advice and, because investment decisions for a Dreyfus fund are based on numerous factors, may not be relied on as an indication of trading intent on behalf of any Dreyfus fund.
|
| Not FDIC-Insured • Not Bank-Guaranteed • May Lose Value |
| | Contents |
| | THE FUND |
| 2 | A Letter from the President |
| 3 | Discussion of Fund Performance |
| 6 | Fund Performance |
| 8 | Understanding Your Fund’s Expenses |
| 8 | Comparing Your Fund’s Expenses With Those of Other Funds |
| 9 | Statement of Investments |
| 14 | Statement of Assets and Liabilities |
| 15 | Statement of Operations |
| 16 | Statement of Changes in Net Assets |
| 18 | Financial Highlights |
| 22 | Notes to Financial Statements |
| 33 | Report of Independent Registered Public Accounting Firm |
| 34 | Important Tax Information |
| 35 | Information About the Renewal of the Fund’s Management and Sub-Investment Advisory Agreements |
| 40 | Board Members Information |
| 42 | Officers of the Fund |
| | FOR MORE INFORMATION |
| | Back Cover |
Dreyfus
Structured Midcap Fund
The Fund
A LETTER FROM THE PRESIDENT
Dear Shareholder:
We are pleased to present this annual report for Dreyfus Structured Midcap Fund, covering the 12-month period from September 1, 2013, through August 31, 2014. For information about how the fund performed during the reporting period, as well as general market perspectives, we provide a Discussion of Fund Performance on the pages that follow.
Despite occasional bouts of heightened volatility, U.S. stocks generally gained ground steadily over the reporting period as the domestic economy rebounded. As a result, most broad measures of equity market performance established a series of new record highs over the past 12 months. Growth-oriented and more economically sensitive stocks generally fared well over the reporting period’s first half, but value-oriented stocks rallied more strongly over the second half.
We remain cautiously optimistic regarding the U.S. stock market’s prospects. We currently expect the economy to continue to accelerate as several long-standing drags, including tight fiscal policies and private sector deleveraging, fade from the scene. Of course, a number of risks remain, including the possibilities of higher short-term interest rates and intensifying geopolitical turmoil.Therefore, we suggest you talk regularly with your financial advisor to assess the potential impact of these and other macroeconomic developments on your investments.
Thank you for your continued confidence and support.

J. Charles Cardona
President
The Dreyfus Corporation
September 15, 2014
2
DISCUSSION OF FUND PERFORMANCE
For the period of September 1, 2013, through August 31, 2014, as provided by Warren Chiang, Ronald Gala and C. Wesley Boggs, Portfolio Managers of Mellon Capital Management Corp., Sub-Investment Adviser
Fund and Market Performance Overview
For the 12-month period ended August 31, 2014, Dreyfus Structured Midcap Fund’s Class A shares produced a total return of 27.21%, Class C shares returned 26.25%, Class I shares returned 27.57% and Class Y shares returned 27.69%.1 In comparison, the Standard & Poor’s® MidCap 400 Index (“S&P® 400 Index”), the fund’s benchmark, produced a total return of 23.25% for the same period.2
U.S. equities climbed during the reporting period in an environment of continued domestic economic growth and strong corporate earnings reports.The fund capitalized on the favorable investment climate, outperforming its benchmark primarily due to the success of our disciplined security selection process across a variety of market sectors.
The Fund’s Investment Approach
The fund seeks long-term capital growth.To pursue this goal, the fund normally invests at least 80% of its net assets, plus any borrowings for investment purposes, in the stocks of companies included in the S&P® 400 Index or the Russell Midcap® Index.The fund invests principally in common stocks, but the fund’s equity investments may also include preferred stocks, convertible securities of U.S. and foreign issuers, including those purchased in initial public offerings and securities issued by real estate investment trusts (REITs).We construct the portfolio through a “bottom-up” structured approach focusing on stock selection as opposed to making proactive decisions as to industry sector exposure. The approach seeks to identify undervalued securities through a quantitative process that ranks stocks based on value measures, behavioral/momentum factors and earnings quality metrics.
Midcap Stocks Participated in Broad Market Rally
Stocks generally advanced over the final months of 2013 in response to encouraging global and domestic economic data, enabling several broad measures of stock market performance to end 2013 near record highs. The market relinquished some of its
The Fund 3
DISCUSSION OF FUND PERFORMANCE (continued)
gains in January 2014 amid concerns regarding economic slowdowns in the world’s emerging markets, but stocks rebounded sharply in February when those worries proved to be overblown. Another bout of weakness in the spring — mainly in the information technology and biotechnology industry groups — signaled a shift in market leadership from economically sensitive growth stocks to their more defensive, value-oriented counterparts. By June, however, positive economic data again bolstered investor sentiment, driving stocks of all capitalization ranges to a series of new record highs over the reporting period’s final three months.
While large-, mid-, and small-cap stocks all produced double-digit returns, on average, in this positive environment, market leadership shifted up the capitalization spectrum. Generally, large-cap stocks outperformed midcap stocks which outperformed small-cap stocks during the reporting period.
Stock Selection Strategy Drove Fund Performance
The fund participated more than fully in the midcap stock market’s gains, outperforming its benchmark due to the effective performance of our disciplined, quantitative security selection process. It added value in nearly all of the benchmark’s market sectors by investing in attractive stocks based on a variety of quality, valuation and behavioral metrics.
The fund produced particularly robust results in the information technology sector, where power-management semiconductor manufacturer International Rectifier was acquired at a premium over its stock price at the time.The company’s takeover was part of a broader trend of consolidation and improved pricing power in the semiconductor industry. Mergers-and-acquisitions activity in the consumer staples sector also boosted the fund’s relative results, as food producer Hillshire Brands was bought by Tyson Foods after a bidding war between two protein companies that drove the purchase price higher.
In the industrials sector, service provider Deluxe Enterprise reported better-than-expected earnings in four consecutive quarters over the reporting period. In other areas, investors responded positively when apparel maker Hanesbrands exceeded earnings expectations, raised future guidance, and made an accretive acquisition. Biotechnology firm United Therapeutics gained value after a regulatory ruling protected a key product from generic competition.
4
Only the fund’s investments in the financials sector trailed their respective benchmark components during the reporting period, mainly due to disappointing security selections among real estate investment trusts.Among individual companies, laggards included technology services provider NeuStar, Cl. A, which encountered concerns surrounding the renewal of a key customer contract, and gaming equipment producer Bally Technologies, which was hurt by sluggish trends in the casino industry and intensifying competitive pressures.
Continuing to Find Attractive Midcap Opportunities
Overall, we have been pleased with the positive performance of U.S. equities, including the midcap asset class. As of the reporting period’s end, we continue to maintain a broadly diversified portfolio across the midcap segment of the market. Despite recent market gains, our bottom-up, quantitative stock ranking process has continued to identify attractive investment opportunities throughout the midcap stock market.
September 15, 2014
Please note, the position in any security highlighted with italicized typeface was sold during the reporting period. Equity funds are subject generally to market, market sector, market liquidity, issuer, and investment style risks, among other factors, to varying degrees, all of which are more fully described in the fund’s prospectus.
Stocks of small- and/or midcap companies often experience sharper price fluctuations than stocks of large-cap companies.
|
| 1 Total return includes reinvestment of dividends and any capital gains paid, and does not take into consideration the |
| maximum initial sales charge in the case of Class A shares or the applicable contingent deferred sales charge imposed |
| on redemptions in the case of Class C shares. Had these charges been reflected, returns would have been lower. Past |
| performance is no guarantee of future results. Share price, yield, and investment return fluctuate such that upon |
| redemption fund shares may be worth more or less than their original cost.The fund’s returns reflect the absorption of |
| certain fund expenses by The Dreyfus Corporation pursuant to an agreement in effect through January 1, 2015, at |
| which time it may be extended, terminated or modified. Had these expenses not been absorbed, the fund’s returns |
| would have been lower. |
| 2 SOURCE: LIPPER INC. — Reflects reinvestment of dividends and, where applicable, capital gain distributions. |
| The Standard & Poor’s MidCap 400 Index is a widely accepted, unmanaged total return index measuring the |
| performance of the midsize company segment of the U.S. market. Investors cannot invest directly in any index. |
The Fund 5
FUND PERFORMANCE
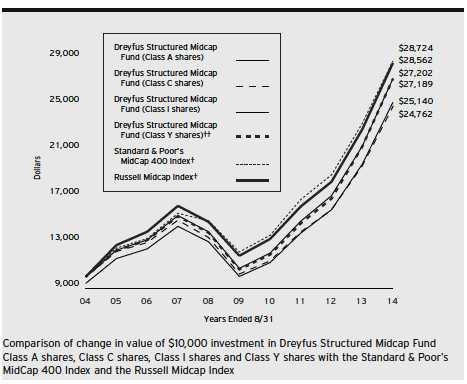
| |
| † | Source: Lipper Inc. |
| †† | The total return figures presented for ClassY shares of the fund reflect the performance of the fund’s Class A shares |
| | for the period prior to 7/1/13 (the inception date for ClassY shares), not reflecting the applicable sales charges for |
| | Class A shares. |
Past performance is not predictive of future performance.
The above graph compares a $10,000 investment made in each of the Class A, Class C, Class I and Class Y shares of Dreyfus Structured Midcap Fund on 8/31/04 to a $10,000 investment made in each of the Standard & Poor’s MidCap 400 Index (the “S&P 400 Index”) and the Russell Midcap Index on that date. All dividends and capital gain distributions are reinvested.
The fund’s performance shown in the line graph above takes into account the maximum initial sales charge on Class A shares and all other applicable fees and expenses on all classes.The S&P 400 Index is a widely accepted, unmanaged total return index measuring the performance of the midsize company segment of the U.S. market.The Russell Midcap Index is a widely accepted, unmanaged index of medium-cap stock market performance. Unlike a mutual fund, the indices are not subject to charges, fees and other expenses. Investors cannot invest directly in any index. Further information relating to fund performance, including expense reimbursements, if applicable, is contained in the Financial Highlights section of the prospectus and elsewhere in this report.
6
| | | | | | | |
| Average Annual Total Returns as of 8/31/14 | | | | | | |
| Inception |
| | Date | 1 Year | | 5 Years | | 10 Years | |
| Class A shares | | | | | | | |
| with maximum sales charge (5.75%) | 6/29/01 | 19.88 | % | 18.76 | % | 9.66 | % |
| without sales charge | 6/29/01 | 27.21 | % | 20.18 | % | 10.31 | % |
| Class C shares | | | | | | | |
| with applicable redemption charge † | 6/29/01 | 25.25 | % | 19.32 | % | 9.49 | % |
| without redemption | 6/29/01 | 26.25 | % | 19.32 | % | 9.49 | % |
| Class I shares | 6/29/01 | 27.57 | % | 20.45 | % | 10.53 | % |
| Class Y shares | 7/1/13 | 27.69 | % | 20.64 | %†† | 10.52 | %†† |
| Standard & Poor’s MidCap 400 Index | | 23.25 | % | 18.77 | % | 11.13 | % |
| Russell Midcap Index | | 25.32 | % | 19.29 | % | 11.07 | % |
Past performance is not predictive of future performance.The fund’s performance shown in the graph and table does not reflect the deduction of taxes that a shareholder would pay on fund distributions or the redemption of fund shares. In addition to the performance of Class A shares shown with and without a maximum sales charge, the fund’s performance shown in the table takes into account all other applicable fees and expenses on all classes.
| |
| † | The maximum contingent deferred sales charge for Class C shares is 1% for shares redeemed within one year of the |
| | date of purchase. |
| †† | The total return performance figures presented for ClassY shares of the fund reflect the performance of the fund’s |
| | Class A shares for the period prior to 7/1/13 (the inception date for ClassY shares), not reflecting the applicable |
| | sales charges for Class A shares. |
The Fund 7
UNDERSTANDING YOUR FUND’S EXPENSES (Unaudited)
As a mutual fund investor, you pay ongoing expenses, such as management fees and other expenses. Using the information below, you can estimate how these expenses affect your investment and compare them with the expenses of other funds.You also may pay one-time transaction expenses, including sales charges (loads) and redemption fees, which are not shown in this section and would have resulted in higher total expenses. For more information, see your fund’s prospectus or talk to your financial adviser.
Review your fund’s expenses
The table below shows the expenses you would have paid on a $1,000 investment in Dreyfus Structured Midcap Fund from March 1, 2014 to August 31, 2014. It also shows how much a $1,000 investment would be worth at the close of the period, assuming actual returns and expenses.
Expenses and Value of a $1,000 Investment
assuming actual returns for the six months ended August 31, 2014
| | | | | | | | |
| | | Class A | | Class C | | Class I | | Class Y |
| Expenses paid per $1,000† | $ | 6.56 | $ | 10.39 | $ | 5.18 | $ | 4.55 |
| Ending value (after expenses) | $ | 1,097.30 | $ | 1,093.30 | $ | 1,098.70 | $ | 1,099.40 |
COMPARING YOUR FUND’S EXPENSES
WITH THOSE OF OTHER FUNDS (Unaudited)
Using the SEC’s method to compare expenses
The Securities and Exchange Commission (SEC) has established guidelines to help investors assess fund expenses. Per these guidelines, the table below shows your fund’s expenses based on a $1,000 investment, assuming a hypothetical 5% annualized return. You can use this information to compare the ongoing expenses (but not transaction expenses or total cost) of investing in the fund with those of other funds. All mutual fund shareholder reports will provide this information to help you make this comparison. Please note that you cannot use this information to estimate your actual ending account balance and expenses paid during the period.
Expenses and Value of a $1,000 Investment
assuming a hypothetical 5% annualized return for the six months ended August 31, 2014
| | | | | | | | |
| | | Class A | | Class C | | Class I | | Class Y |
| Expenses paid per $1,000† | $ | 6.31 | $ | 10.01 | $ | 4.99 | $ | 4.38 |
| Ending value (after expenses) | $ | 1,018.95 | $ | 1,015.27 | $ | 1,020.27 | $ | 1,020.87 |
|
| † Expenses are equal to the fund's annualized expense ratio of 1.24% for Class A, 1.97% for Class C, .98% for Class |
| I and .86% for ClassY, multiplied by the average account value over the period, multiplied by 184/365 (to reflect the |
| one-half year period). |
8
|
| STATEMENT OF INVESTMENTS |
| August 31, 2014 |
| | | |
| Common Stocks—99.3% | Shares | | Value ($) |
| Banks—4.5% | | | |
| Associated Banc-Corp | 72,400 | | 1,316,232 |
| BancorpSouth | 95,900 | | 2,030,203 |
| BankUnited | 25,100 | | 791,905 |
| Cathay General Bancorp | 47,000 | | 1,223,880 |
| Comerica | 20,800 | | 1,047,072 |
| East West Bancorp | 117,100 | | 4,079,764 |
| Webster Financial | 27,300 | | 805,350 |
| | | | 11,294,406 |
| Capital Goods—11.2% | | | |
| Alliant Techsystems | 7,700 | | 970,200 |
| Huntington Ingalls Industries | 52,300 | | 5,340,353 |
| IDEX | 21,500 | | 1,654,210 |
| Lennox International | 59,400 | | 4,975,344 |
| Lincoln Electric Holdings | 60,900 | | 4,329,990 |
| Oshkosh | 22,100 | | 1,097,928 |
| SPX | 46,800 | | 4,869,540 |
| Trinity Industries | 78,300 | | 3,788,154 |
| WABCO Holdings | 8,500 | a | 877,200 |
| | | | 27,902,919 |
| Commercial & Professional Services—3.8% | | | |
| Deluxe | 87,000 | | 5,180,850 |
| Manpowergroup | 55,000 | | 4,266,900 |
| | | | 9,447,750 |
| Consumer Durables & Apparel—4.2% | | | |
| Deckers Outdoor | 48,500 | a | 4,473,640 |
| Hanesbrands | 22,200 | | 2,279,496 |
| NVR | 3,090 | a | 3,625,157 |
| | | | 10,378,293 |
| Consumer Services—.1% | | | |
| Wyndham Worldwide | 2,600 | | 210,444 |
| Diversified Financials—4.3% | | | |
| Affiliated Managers Group | 17,600 | a | 3,716,240 |
| Navient | 21,600 | | 387,504 |
| SEI Investments | 36,000 | | 1,364,220 |
The Fund 9
STATEMENT OF INVESTMENTS (continued)
| | | |
| Common Stocks (continued) | Shares | | Value ($) |
| Diversified Financials (continued) | | | |
| T. Rowe Price Group | 5,000 | | 404,975 |
| Waddell & Reed Financial, Cl. A | 89,300 | | 4,866,850 |
| | | | 10,739,789 |
| Energy—5.0% | | | |
| Chesapeake Energy | 52,400 | | 1,425,280 |
| Dril-Quip | 46,400 | a | 4,708,208 |
| EQT | 5,400 | | 534,924 |
| Kosmos Energy | 23,100 | a | 231,462 |
| SM Energy | 63,400 | | 5,645,136 |
| | | | 12,545,010 |
| Food, Beverage & Tobacco—.9% | | | |
| Coca-Cola Enterprises | 11,300 | | 539,914 |
| Ingredion | 3,500 | | 279,160 |
| Monster Beverage | 15,800 | a | 1,396,878 |
| | | | 2,215,952 |
| Health Care Equipment & Services—7.2% | | | |
| Boston Scientific | 316,400 | a | 4,011,952 |
| C.R. Bard | 16,300 | | 2,419,572 |
| Health Net | 115,700 | a | 5,461,040 |
| Hill-Rom Holdings | 79,500 | | 3,482,895 |
| Teleflex | 7,500 | | 821,100 |
| Universal Health Services, Cl. B | 14,300 | | 1,636,492 |
| | | | 17,833,051 |
| Household & Personal Products—2.3% | | | |
| Energizer Holdings | 48,100 | | 5,845,112 |
| Insurance—2.8% | | | |
| Everest Re Group | 6,400 | | 1,048,576 |
| The Hanover Insurance Group | 31,800 | | 2,017,710 |
| Lincoln National | 6,900 | | 379,776 |
| Old Republic International | 164,100 | | 2,518,935 |
| Reinsurance Group of America | 13,100 | | 1,087,038 |
| | | | 7,052,035 |
| Materials—8.4% | | | |
| Cabot | 42,100 | | 2,306,238 |
| Commercial Metals | 136,900 | | 2,365,632 |
| Minerals Technologies | 11,500 | | 720,130 |
| Olin | 137,100 | | 3,741,459 |
10
| | | |
| Common Stocks (continued) | Shares | | Value ($) |
| Materials (continued) | | | |
| Packaging Corporation of America | 29,800 | | 2,026,102 |
| Reliance Steel & Aluminum | 23,700 | | 1,657,104 |
| Scotts Miracle-Gro, Cl. A | 59,000 | | 3,406,070 |
| Worthington Industries | 117,200 | | 4,739,568 |
| | | | 20,962,303 |
| Media—2.0% | | | |
| New York Times, Cl. A | 55,000 | | 680,900 |
| Starz, Cl. A | 135,400 | a | 4,236,666 |
| | | | 4,917,566 |
| Pharmaceuticals, Biotech & Life Sciences—5.5% | | | |
| Charles River Laboratories International | 5,300 | a | 313,230 |
| Covance | 21,800 | a | 1,807,220 |
| Mettler-Toledo International | 21,300 | a | 5,761,224 |
| United Therapeutics | 48,500 | a | 5,714,755 |
| | | | 13,596,429 |
| Real Estate—7.7% | | | |
| Corrections Corporation of America | 115,550 | b | 4,118,202 |
| Extra Space Storage | 6,800 | b | 358,360 |
| Host Hotels & Resorts | 68,200 | b | 1,556,324 |
| Kimco Realty | 5,700 | b | 133,893 |
| National Retail Properties | 20,300 | b | 753,942 |
| Omega Healthcare Investors | 24,200 | b | 911,614 |
| Potlatch | 74,200 | b | 3,166,856 |
| Taubman Centers | 56,700 | b | 4,318,839 |
| Weingarten Realty Investors | 111,500 | b | 3,815,530 |
| | | | 19,133,560 |
| Retailing—4.0% | | | |
| Bed Bath & Beyond | 64,900 | a | 4,170,474 |
| Dillard’s, Cl. A | 27,300 | | 3,120,936 |
| GameStop, Cl. A | 60,400 | | 2,548,880 |
| | | | 9,840,290 |
| Semiconductors & Semiconductor | | | |
| Equipment—4.8% | | | |
| Integrated Device Technology | 248,200 | a | 4,082,890 |
| International Rectifier | 148,100 | a | 5,835,140 |
| Skyworks Solutions | 35,200 | | 1,994,432 |
| | | | 11,912,462 |
The Fund 11
STATEMENT OF INVESTMENTS (continued)
| | | |
| Common Stocks (continued) | Shares | | Value ($) |
| Software & Services—6.4% | | | |
| Amdocs | 15,300 | | 720,630 |
| Broadridge Financial Solutions | 40,200 | | 1,710,108 |
| Convergys | 48,900 | | 938,880 |
| DST Systems | 50,415 | | 4,679,017 |
| FactSet Research Systems | 14,500 | | 1,847,300 |
| Mentor Graphics | 136,500 | | 2,977,065 |
| NeuStar, Cl. A | 99,200 | a | 2,925,408 |
| | | | 15,798,408 |
| Technology Hardware & Equipment—5.5% | | | |
| Arrow Electronics | 6,400 | a | 398,400 |
| Brocade Communications Systems | 451,300 | | 4,761,215 |
| Harris | 50,600 | | 3,612,334 |
| NetApp | 113,800 | | 4,797,808 |
| | | | 13,569,757 |
| Transportation—4.4% | | | |
| Alaska Air Group | 34,000 | | 1,575,560 |
| Kirby | 47,800 | a | 5,702,062 |
| Southwest Airlines | 111,800 | | 3,578,718 |
| | | | 10,856,340 |
| Utilities—4.3% | | | |
| Entergy | 49,900 | | 3,862,759 |
| IDACORP | 75,100 | | 4,259,672 |
| PNM Resources | 44,600 | | 1,168,966 |
| Wisconsin Energy | 31,100 | | 1,409,763 |
| | | | 10,701,160 |
| Total Common Stocks | | | |
| (cost $204,474,002) | | | 246,753,036 |
12
| | | |
| Other Investment—.5% | Shares | | Value ($) |
| Registered Investment Company; | | | |
| Dreyfus Institutional Preferred | | | |
| Plus Money Market Fund | | | |
| (cost $1,355,057) | 1,355,057 | c | 1,355,057 |
| Total Investments (cost $205,829,059) | 99.8 | % | 248,108,093 |
| Cash and Receivables (Net) | .2 | % | 374,329 |
| Net Assets | 100.0 | % | 248,482,422 |
| |
| a | Non-income producing security. |
| b | Investment in real estate investment trust. |
| c | Investment in affiliated money market mutual fund. |
| | | |
| Portfolio Summary (Unaudited)† | | |
| |
| | Value (%) | | Value (%) |
| Capital Goods | 11.2 | Utilities | 4.3 |
| Materials | 8.4 | Diversified Financials | 4.3 |
| Real Estate | 7.7 | Consumer Durables & Apparel | 4.2 |
| Health Care Equipment & Services | 7.2 | Retailing | 4.0 |
| Software & Services | 6.4 | Commercial & Professional Services | 3.8 |
| Technology Hardware & Equipment | 5.5 | Insurance | 2.8 |
| Pharmaceuticals, Biotech & | | Household & Personal Products | 2.3 |
| Life Sciences | 5.5 | Media | 2.0 |
| Energy | 5.0 | Food, Beverage & Tobacco | .9 |
| Semiconductors & Semiconductor | | Money Market Investment | .5 |
| Equipment | 4.8 | Consumer Services | .1 |
| Banks | 4.5 | | |
| Transportation | 4.4 | | 99.8 |
| |
| † Based on net assets. | | | |
| See notes to financial statements. | | | |
The Fund 13
|
| STATEMENT OF ASSETS AND LIABILITIES |
| August 31, 2014 |
| | | | |
| | | | Cost | Value |
| Assets ($): | | | | |
| Investments in securities—See Statement of Investments: | | |
| Unaffiliated issuers | | | 204,474,002 | 246,753,036 |
| Affiliated issuers | | | 1,355,057 | 1,355,057 |
| Cash | | | | 286,177 |
| Dividends receivable | | | | 419,327 |
| Receivable for shares of Common Stock subscribed | | | 158,818 |
| Prepaid expenses | | | | 26,640 |
| | | | | 248,999,055 |
| Liabilities ($): | | | | |
| Due to The Dreyfus Corporation and affiliates—Note 3(c) | | 221,874 |
| Payable for shares of Common Stock redeemed | | | 196,954 |
| Interest payable—Note 2 | | | | 161 |
| Accrued expenses | | | | 97,644 |
| | | | | 516,633 |
| Net Assets ($) | | | | 248,482,422 |
| Composition of Net Assets ($): | | | | |
| Paid-in capital | | | | 199,085,724 |
| Accumulated undistributed investment income—net | | | 779,678 |
| Accumulated net realized gain (loss) on investments | | | 6,337,986 |
| Accumulated net unrealized appreciation | | | |
| (depreciation) on investments | | | | 42,279,034 |
| Net Assets ($) | | | | 248,482,422 |
| |
| |
| Net Asset Value Per Share | | | | |
| | Class A | Class C | Class I | Class Y |
| Net Assets ($) | 123,056,660 | 30,502,052 | 72,946,672 | 21,977,038 |
| Shares Outstanding | 3,698,107 | 996,796 | 2,156,460 | 649,343 |
| Net Asset Value Per Share ($) | 33.28 | 30.60 | 33.83 | 33.85 |
| See notes to financial statements. | | | | |
14
| | |
| STATEMENT OF OPERATIONS | | |
| Year Ended August 31, 2014 | | |
| |
| |
| |
| |
| Investment Income ($): | | |
| Income: | | |
| Cash dividends: | | |
| Unaffiliated issuers | 3,676,786 | |
| Affiliated issuers | 1,453 | |
| Income from securities lending—Note 1(b) | 45,858 | |
| Total Income | 3,724,097 | |
| Expenses: | | |
| Management fee—Note 3(a) | 1,736,420 | |
| Shareholder servicing costs—Note 3(c) | 838,604 | |
| Distribution fees—Note 3(b) | 214,351 | |
| Registration fees | 67,594 | |
| Prospectus and shareholders’ reports | 55,313 | |
| Professional fees | 50,293 | |
| Custodian fees—Note 3(c) | 19,554 | |
| Directors’ fees and expenses—Note 3(d) | 15,210 | |
| Loan commitment fees—Note 2 | 1,410 | |
| Interest expense—Note 2 | 254 | |
| Miscellaneous | 12,951 | |
| Total Expenses | 3,011,954 | |
| Less—reduction in expenses due to undertaking—Note 3(a) | (153,961 | ) |
| Less—reduction in fees due to earnings credits—Note 3(c) | (218 | ) |
| Net Expenses | 2,857,775 | |
| Investment Income—Net | 866,322 | |
| Realized and Unrealized Gain (Loss) on Investments—Note 4 ($): | | |
| Net realized gain (loss) on investments | 38,152,410 | |
| Net unrealized appreciation (depreciation) on investments | 15,757,601 | |
| Net Realized and Unrealized Gain (Loss) on Investments | 53,910,011 | |
| Net Increase in Net Assets Resulting from Operations | 54,776,333 | |
| |
| See notes to financial statements. | | |
The Fund 15
STATEMENT OF CHANGES IN NET ASSETS
| | | | |
| | Year Ended August 31, | |
| | 2014 | | 2013 | a |
| Operations ($): | | | | |
| Investment income—net | 866,322 | | 1,041,288 | |
| Net realized gain (loss) on investments | 38,152,410 | | 10,080,166 | |
| Net unrealized appreciation | | | | |
| (depreciation) on investments | 15,757,601 | | 6,065,896 | |
| Net Increase (Decrease) in Net Assets | | | | |
| Resulting from Operations | 54,776,333 | | 17,187,350 | |
| Dividends to Shareholders from ($): | | | | |
| Investment income—net: | | | | |
| Class A | (381,712 | ) | (266,836 | ) |
| Class C | — | | (32,069 | ) |
| Class I | (393,186 | ) | (341,480 | ) |
| Class Y | (25,283 | ) | — | |
| Net realized gain on investments: | | | | |
| Class A | (1,107,667 | ) | — | |
| Class C | (291,556 | ) | — | |
| Class I | (759,090 | ) | — | |
| Class Y | (42,458 | ) | — | |
| Total Dividends | (3,000,952 | ) | (640,385 | ) |
| Capital Stock Transactions ($): | | | | |
| Net proceeds from shares sold: | | | | |
| Class A | 14,960,407 | | 15,864,149 | |
| Class C | 1,782,484 | | 1,405,406 | |
| Class I | 30,900,200 | | 24,417,922 | |
| Class Y | 26,873,936 | | 1,000 | |
| Net assets received in connection | | | | |
| with reorganization—Note 1 | — | | 112,261,207 | |
| Dividends reinvested: | | | | |
| Class A | 1,425,377 | | 249,886 | |
| Class C | 221,915 | | 19,807 | |
| Class I | 1,100,958 | | 336,599 | |
| Class Y | 67,724 | | — | |
| Cost of shares redeemed: | | | | |
| Class A | (25,811,227 | ) | (13,607,551 | ) |
| Class C | (3,868,671 | ) | (2,652,901 | ) |
| Class I | (46,020,290 | ) | (21,411,400 | ) |
| Class Y | (6,247,762 | ) | — | |
| Increase (Decrease) in Net Assets | | | | |
| from Capital Stock Transactions | (4,614,949 | ) | 116,884,124 | |
| Total Increase (Decrease) in Net Assets | 47,160,432 | | 133,431,089 | |
| Net Assets ($): | | | | |
| Beginning of Period | 201,321,990 | | 67,890,901 | |
| End of Period | 248,482,422 | | 201,321,990 | |
| Undistributed investment income—net | 779,678 | | 713,537 | |
16
| | | | |
| | Year Ended August 31, | |
| | 2014 | | 2013 | a |
| Capital Share Transactions: | | | | |
| Class Ab | | | | |
| Shares sold | 498,384 | | 643,889 | |
| Shares issued in connection | | | | |
| with reorganization—Note 1 | — | | 2,653,703 | |
| Shares issued for dividends reinvested | 48,269 | | 11,294 | |
| Shares redeemed | (858,652 | ) | (550,149 | ) |
| Net Increase (Decrease) in Shares Outstanding | (311,999 | ) | 2,758,737 | |
| Class Cb | | | | |
| Shares sold | 63,853 | | 60,890 | |
| Shares issued in connection | | | | |
| with reorganization—Note 1 | — | | 587,537 | |
| Shares issued for dividends reinvested | 8,132 | | 954 | |
| Shares redeemed | (139,609 | ) | (113,634 | ) |
| Net Increase (Decrease) in Shares Outstanding | (67,624 | ) | 535,747 | |
| Class Ic | | | | |
| Shares sold | 1,021,319 | | 950,243 | |
| Shares issued in connection | | | | |
| with reorganization—Note 1 | — | | 1,038,784 | |
| Shares issued for dividends reinvested | 36,748 | | 15,019 | |
| Shares redeemed | (1,466,904 | ) | (848,913 | ) |
| Net Increase (Decrease) in Shares Outstanding | (408,837 | ) | 1,155,133 | |
| Class Yc | | | | |
| Shares sold | 836,599 | | 37.90 | |
| Shares issued for dividends reinvested | 2,260 | | — | |
| Shares redeemed | (189,554 | ) | — | |
| Net Increase (Decrease) in Shares Outstanding | 649,305 | | 37.90 | |
|
| a Effective July 1, 2013, the fund commenced offering ClassY shares. |
| b During the period ended August 31, 2013, 10,690 Class C shares representing $265,762 were exchanged for |
| 9,902 Class A shares. |
| c During the period ended August 31, 2014, 114,784 Class I shares representing $3,626,811 were exchanged for |
| 114,713 ClassY shares. |
See notes to financial statements.
The Fund 17
FINANCIAL HIGHLIGHTS
The following tables describe the performance for each share class for the fiscal periods indicated. All information (except portfolio turnover rate) reflects financial results for a single fund share.Total return shows how much your investment in the fund would have increased (or decreased) during each period, assuming you had reinvested all dividends and distributions.These figures have been derived from the fund's financial statements.
| | | | | | | | | |
| | | | Year Ended August 31, | | | |
| Class A Shares | 2014 | | 2013 | | 2012 | 2011 | | 2010 | |
| Per Share Data ($): | | | | | | | | | |
| Net asset value, beginning of period | 26.49 | | 21.41 | | 18.67 | 15.20 | | 13.62 | |
| Investment Operations: | | | | | | | | | |
| Investment income (loss)—neta | .11 | | .23 | | .11 | (.05 | ) | .04 | |
| Net realized and unrealized | | | | | | | | | |
| gain (loss) on investments | 7.06 | | 5.06 | | 2.63 | 3.52 | | 1.59 | |
| Total from Investment Operations | 7.17 | | 5.29 | | 2.74 | 3.47 | | 1.63 | |
| Distributions: | | | | | | | | | |
| Dividends from investment income—net | (.10 | ) | (.21 | ) | — | — | | (.05 | ) |
| Dividends from net realized | | | | | | | | | |
| gain on investments | (.28 | ) | — | | — | — | | — | |
| Total Distributions | (.38 | ) | (.21 | ) | — | — | | (.05 | ) |
| Net asset value, end of period | 33.28 | | 26.49 | | 21.41 | 18.67 | | 15.20 | |
| Total Return (%)b | 27.21 | | 24.94 | | 14.68 | 22.83 | | 11.97 | |
| Ratios/Supplemental Data (%): | | | | | | | | | |
| Ratio of total expenses | | | | | | | | | |
| to average net assets | 1.25 | | 1.35 | | 1.41 | 1.43 | | 1.36 | |
| Ratio of net expenses | | | | | | | | | |
| to average net assets | 1.24 | | 1.26 | | 1.41 | 1.43 | | 1.36 | |
| Ratio of net investment income | | | | | | | | | |
| (loss) to average net assets | .37 | | .92 | | .55 | (.29 | ) | .27 | |
| Portfolio Turnover Rate | 74.66 | | 57.54 | | 93.44 | 77.12 | | 84.88 | |
| Net Assets, end of period ($ x 1,000) | 123,057 | | 106,245 | | 26,786 | 23,916 | | 34,811 | |
| |
| a | Based on average shares outstanding. |
| b | Exclusive of sales charge. |
See notes to financial statements.
18
| | | | | | | | | | |
| | | | Year Ended August 31, | | | |
| Class C Shares | 2014 | | 2013 | | 2012 | | 2011 | | 2010 | |
| Per Share Data ($): | | | | | | | | | | |
| Net asset value, beginning of period | 24.48 | | 19.80 | | 17.40 | | 14.25 | | 12.82 | |
| Investment Operations: | | | | | | | | | | |
| Investment income (loss)—neta | (.10 | ) | .06 | | (.04 | ) | (.17 | ) | (.07 | ) |
| Net realized and unrealized | | | | | | | | | | |
| gain (loss) on investments | 6.50 | | 4.68 | | 2.44 | | 3.32 | | 1.50 | |
| Total from Investment Operations | 6.40 | | 4.74 | | 2.40 | | 3.15 | | 1.43 | |
| Distributions: | | | | | | | | | | |
| Dividends from investment income—net | — | | (.06 | ) | — | | — | | — | |
| Dividends from net realized | | | | | | | | | | |
| gain on investments | (.28 | ) | — | | — | | — | | — | |
| Total Distributions | (.28 | ) | (.06 | ) | — | | — | | — | |
| Net asset value, end of period | 30.60 | | 24.48 | | 19.80 | | 17.40 | | 14.25 | |
| Total Return (%)b | 26.25 | | 24.06 | | 13.79 | | 22.11 | | 11.15 | |
| Ratios/Supplemental Data (%): | | | | | | | | | | |
| Ratio of total expenses | | | | | | | | | | |
| to average net assets | 1.98 | | 2.10 | | 2.14 | | 2.09 | | 2.11 | |
| Ratio of net expenses | | | | | | | | | | |
| to average net assets | 1.98 | | 2.01 | | 2.14 | | 2.09 | | 2.11 | |
| Ratio of net investment income | | | | | | | | | | |
| (loss) to average net assets | (.37 | ) | .26 | | (.20 | ) | (.95 | ) | (.49 | ) |
| Portfolio Turnover Rate | 74.66 | | 57.54 | | 93.44 | | 77.12 | | 84.88 | |
| Net Assets, end of period ($ x 1,000) | 30,502 | | 26,061 | | 10,468 | | 10,246 | | 9,764 | |
| |
| a | Based on average shares outstanding. |
| b | Exclusive of sales charge. |
See notes to financial statements.
The Fund 19
FINANCIAL HIGHLIGHTS (continued)
| | | | | | | | | |
| | | | Year Ended August 31, | | | |
| Class I Shares | 2014 | | 2013 | | 2012 | 2011 | | 2010 | |
| Per Share Data ($): | | | | | | | | | |
| Net asset value, beginning of period | 26.90 | | 21.73 | | 18.91 | 15.39 | | 13.79 | |
| Investment Operations: | | | | | | | | | |
| Investment income (loss)—neta | .19 | | .33 | | .16 | (.02 | ) | .09 | |
| Net realized and unrealized | | | | | | | | | |
| gain (loss) on investments | 7.17 | | 5.09 | | 2.66 | 3.56 | | 1.61 | |
| Total from Investment Operations | 7.36 | | 5.42 | | 2.82 | 3.54 | | 1.70 | |
| Distributions: | | | | | | | | | |
| Dividends from investment income—net | (.15 | ) | (.25 | ) | — | (.02 | ) | (.10 | ) |
| Dividends from net realized | | | | | | | | | |
| gain on investments | (.28 | ) | — | | — | — | | — | |
| Total Distributions | (.43 | ) | (.25 | ) | — | (.02 | ) | (.10 | ) |
| Net asset value, end of period | 33.83 | | 26.90 | | 21.73 | 18.91 | | 15.39 | |
| Total Return (%) | 27.57 | | 25.17 | | 14.91 | 22.97 | | 12.37 | |
| Ratios/Supplemental Data (%): | | | | | | | | | |
| Ratio of total expenses | | | | | | | | | |
| to average net assets | 1.16 | | 1.26 | | 1.22 | 1.30 | | 1.05 | |
| Ratio of net expenses | | | | | | | | | |
| to average net assets | .99 | | 1.03 | | 1.22 | 1.30 | | 1.05 | |
| Ratio of net investment income | | | | | | | | | |
| (loss) to average net assets | .62 | | 1.27 | | .78 | (.12 | ) | .57 | |
| Portfolio Turnover Rate | 74.66 | | 57.54 | | 93.44 | 77.12 | | 84.88 | |
| Net Assets, end of period ($ x 1,000) | 72,947 | | 69,014 | | 30,636 | 24,045 | | 46,340 | |
| |
| a Based on average shares outstanding. | | | | | | | | | |
| See notes to financial statements. | | | | | | | | | |
20
| | | | |
| | Year Ended August 31, | |
| Class Y Shares | 2014 | | 2013 | a |
| Per Share Data ($): | | | | |
| Net asset value, beginning of period | 26.91 | | 26.38 | |
| Investment Operations: | | | | |
| Investment income—netb | .19 | | .02 | |
| Net realized and unrealized | | | | |
| gain (loss) on investments | 7.20 | | .51 | |
| Total from Investment Operations | 7.39 | | .53 | |
| Distributions: | | | | |
| Dividends from investment income—net | (.17 | ) | — | |
| Dividends from net realized gain on investments | (.28 | ) | — | |
| Total Distributions | (.45 | ) | — | |
| Net asset value, end of period | 33.85 | | 26.91 | |
| Total Return (%) | 27.69 | | 2.01 | c |
| Ratios/Supplemental Data (%): | | | | |
| Ratio of total expenses | | | | |
| to average net assets | .87 | | .97 | d |
| Ratio of net expenses | | | | |
| to average net assets | .87 | | .89 | d |
| Ratio of net investment income | | | | |
| to average net assets | .58 | | .35 | d |
| Portfolio Turnover Rate | 74.66 | | 57.54 | |
| Net Assets, end of period ($ x 1,000) | 21,977 | | 1 | |
| |
| a | From July 1, 2013 (commencement of initial offering) to August 31, 2013. |
| b | Based on average shares outstanding. |
| c | Not annualized. |
| d | Annualized. |
See notes to financial statements.
The Fund 21
NOTES TO FINANCIAL STATEMENTS
NOTE 1—Significant Accounting Policies:
Dreyfus Structured Midcap Fund (the “fund”) is a separate diversified series of Advantage Funds, Inc. (the “Company”), which is registered under the Investment Company Act of 1940, as amended (the “Act”), as an open-end management investment company and operates as a series company currently offering eleven series, including the fund. The fund’s investment objective is to seek long-term capital growth. The Dreyfus Corporation (the “Manager” or “Dreyfus”), a wholly-owned subsidiary of The Bank of New York Mellon Corporation (“BNY Mellon”), serves as the fund’s investment adviser. Mellon Capital Management Corporation (“Mellon Capital”), an affiliate of Dreyfus, serves as the fund’s sub-investment adviser.
As of the close of business on June 7, 2013, pursuant to an Agreement and Plan of Reorganization previously approved by the Company’s Board of Directors (the “Board”), all of the assets, subject to the liabilities, of Dreyfus Manager Fund I—Dreyfus MidCap Core Fund (“MidCap Core”) were transferred to the fund in exchange for corresponding classes of shares of Common Stock of the fund of equal value. The purpose of the transaction was to combine two funds with comparable investment objectives and strategies. Shareholders of Class A, Class C and Class I shares of MidCap Core received Class A, Class C and Class I shares of the fund, respectively, in each case in an amount equal to the aggregate net asset value of their investment in MidCap Core at the time of the exchange.The exchange ratio for each class was as follows: Class A—.92 to 1, Class C—.91 to 1 and Class I—.94 to 1. The net asset value of the fund’s shares on the close of business June 7, 2013, after the reorganization was $26.40 for Class A, $24.44 for Class C and $26.79 for Class I shares, and a total of 2,653,703 Class A shares, 587,537 Class C shares and 1,038,784 Class I shares were issued to shareholders of MidCap Core in the exchange. Net assets acquired of $112,261,207 included unrealized appreciation of $16,766,891.
MBSC Securities Corporation (the “Distributor”), a wholly-owned subsidiary of Dreyfus, is the distributor of the fund’s shares. The fund is authorized to issue 600 million shares of $.001 par value Common
22
Stock. The fund currently offers four classes of shares: Class A (200 million shares authorized), Class C (100 million shares authorized) Class I (200 million shares authorized) and Class Y (100 million shares authorized). Class A shares generally are subject to a sales charge imposed at the time of purchase. Class C shares are subject to a contingent deferred sales charge (“CDSC”) imposed on Class C shares redeemed within one year of purchase. Class I and Class Y shares are sold at net asset value per share generally to institutional investors. Other differences between the classes include the services offered to and the expenses borne by each class, the allocation of certain transfer agency costs, and certain voting rights. Income, expenses (other than expenses attributable to a specific class), and realized and unrealized gains or losses on investments are allocated to each class of shares based on its relative net assets.
The Company accounts separately for the assets, liabilities and operations of each series. Expenses directly attributable to each series are charged to that series’ operations; expenses which are applicable to all series are allocated among them on a pro rata basis.
The Financial Accounting Standards Board (“FASB”) Accounting Standards Codification is the exclusive reference of authoritative U.S. generally accepted accounting principles (“GAAP”) recognized by the FASB to be applied by nongovernmental entities. Rules and interpretive releases of the Securities and Exchange Commission (“SEC”) under authority of federal laws are also sources of authoritative GAAP for SEC registrants. The fund’s financial statements are prepared in accordance with GAAP, which may require the use of management estimates and assumptions. Actual results could differ from those estimates.
The Company enters into contracts that contain a variety of indemnifications. The fund’s maximum exposure under these arrangements is unknown.The fund does not anticipate recognizing any loss related to these arrangements.
(a) Portfolio valuation: The fair value of a financial instrument is the amount that would be received to sell an asset or paid to transfer a lia-
The Fund 23
NOTES TO FINANCIAL STATEMENTS (continued)
bility in an orderly transaction between market participants at the measurement date (i.e., the exit price). GAAP establishes a fair value hierarchy that prioritizes the inputs of valuation techniques used to measure fair value. This hierarchy gives the highest priority to unadjusted quoted prices in active markets for identical assets or liabilities (Level 1 measurements) and the lowest priority to unobservable inputs (Level 3 measurements).
Additionally, GAAP provides guidance on determining whether the volume and activity in a market has decreased significantly and whether such a decrease in activity results in transactions that are not orderly. GAAP requires enhanced disclosures around valuation inputs and techniques used during annual and interim periods.
Various inputs are used in determining the value of the fund’s investments relating to fair value measurements. These inputs are summarized in the three broad levels listed below:
Level 1—unadjusted quoted prices in active markets for identical investments.
Level 2—other significant observable inputs (including quoted prices for similar investments, interest rates, prepayment speeds, credit risk, etc.).
Level 3—significant unobservable inputs (including the fund’s own assumptions in determining the fair value of investments).
The inputs or methodology used for valuing securities are not necessarily an indication of the risk associated with investing in those securities.
Changes in valuation techniques may result in transfers in or out of an assigned level within the disclosure hierarchy. Valuation techniques used to value the fund’s investments are as follows:
Investments in securities are valued at the last sales price on the securities exchange or national securities market on which such securities are primarily traded. Securities listed on the National Market System for which market quotations are available are valued at the official
24
closing price or, if there is no official closing price that day, at the last sales price. Securities not listed on an exchange or the national securities market, or securities for which there were no transactions, are valued at the average of the most recent bid and asked prices, except for open short positions, where the asked price is used for valuation purposes. Bid price is used when no asked price is available. Registered investment companies that are not traded on an exchange are valued at their net asset value.All of the preceding securities are generally categorized within Level 1 of the fair value hierarchy.
Fair valuing of securities may be determined with the assistance of a pricing service using calculations based on indices of domestic securities and other appropriate indicators, such as prices of relevant American Depository Receipts and financial futures. Utilizing these techniques may result in transfers between Level 1 and Level 2 of the fair value hierarchy.
When market quotations or official closing prices are not readily available, or are determined not to reflect accurately fair value, such as when the value of a security has been significantly affected by events after the close of the exchange or market on which the security is principally traded (for example, a foreign exchange or market), but before the fund calculates its net asset value, the fund may value these investments at fair value as determined in accordance with the procedures approved by the Board. Certain factors may be considered when fair valuing investments such as: fundamental analytical data, the nature and duration of restrictions on disposition, an evaluation of the forces that influence the market in which the securities are purchased and sold, and public trading in similar securities of the issuer or comparable issuers. These securities are either categorized within Level 2 or 3 of the fair value hierarchy depending on the relevant inputs used.
For restricted securities where observable inputs are limited, assumptions about market activity and risk are used and are generally categorized within Level 3 of the fair value hierarchy.
The Fund 25
NOTES TO FINANCIAL STATEMENTS (continued)
The following is a summary of the inputs used as of August 31, 2014 in valuing the fund’s investments:
| | | | |
| | | Level 2—Other | Level 3— | |
| | Level 1— | Significant | Significant | |
| | Unadjusted | Observable | Unobservable | |
| | Quoted Prices | Inputs | Inputs | Total |
| Assets ($) | | | | |
| Investments in Securities: | | | |
| Equity Securities— | | | | |
| Domestic | | | | |
| Common Stocks† | 246,753,036 | — | — | 246,753,036 |
| Mutual Funds | 1,355,057 | — | — | 1,355,057 |
| |
| † See Statement of Investments for additional detailed categorizations. | |
At August 31, 2014, there were no transfers between Level 1 and Level 2 of the fair value hierarchy.
(b) Securities transactions and investment income: : Securities transactions are recorded on a trade date basis. Realized gains and losses from securities transactions are recorded on the identified cost basis. Dividend income is recognized on the ex-dividend date and interest income, including, where applicable, accretion of discount and amortization of premium on investments, is recognized on the accrual basis.
Pursuant to a securities lending agreement with The Bank of New York Mellon, a subsidiary of BNY Mellon and an affiliate of Dreyfus, the fund may lend securities to qualified institutions. It is the fund’s policy that, at origination, all loans are secured by collateral of at least 102% of the value of U.S. securities loaned and 105% of the value of foreign securities loaned. Collateral equivalent to at least 100% of the market value of securities on loan is maintained at all times. Collateral is either in the form of cash, which can be invested in certain money market mutual funds managed by Dreyfus or U.S. Government and Agency securities.The fund is entitled to receive all dividends, interest and distributions on securities loaned, in addition to income earned as a result of the lending transaction. Should a borrower fail to return the securities in a timely manner, The Bank of New York Mellon is required to replace the securities for the benefit of the fund or credit
26
the fund with the market value of the unreturned securities and is subrogated to the fund’s rights against the borrower and the collateral. During the period ended August 31, 2014, The Bank of New York Mellon earned $11,870 from lending portfolio securities, pursuant to the securities lending agreement.
(c) Affiliated issuers: Investments in other investment companies advised by Dreyfus are defined as “affiliated” under the Act. Investments in affiliated investment companies during the period ended August 31, 2014 were as follows:
| | | | | | | |
| Affiliated | | | | | | | |
| Investment | Value | | | | Value | | Net |
| Company | 8/31/2013 | ($) | Purchases ($) | Sales ($) | 8/31/2014 | ($) | Assets (%) |
| Dreyfus | | | | | | | |
| Institutional | | | | | | | |
| Preferred | | | | | | | |
| Plus Money | | | | | | | |
| Market Fund | 3,184,015 | | 41,178,032 | 43,006,990 | 1,355,057 | | .5 |
| Dreyfus | | | | | | | |
| Institutional | | | | | | | |
| Cash | | | | | | | |
| Advantage | | | | | | | |
| Fund | 13,044,247 | | 50,832,030 | 63,876,277 | — | | — |
| Total | 16,228,262 | | 92,010,062 | 106,883,267 | 1,355,057 | | .5 |
(d) Dividends to shareholders: Dividends are recorded on the ex-dividend date. Dividends from investment income-net and dividends from net realized capital gains, if any, are normally declared and paid annually, but the fund may make distributions on a more frequent basis to comply with the distribution requirements of the Internal Revenue Code of 1986, as amended (the “Code”). To the extent that net realized capital gains can be offset by capital loss carryovers, it is the policy of the fund not to distribute such gains. Income and capital gain distributions are determined in accordance with income tax regulations, which may differ from GAAP.
(e) Federal income taxes: It is the policy of the fund to continue to qualify as a regulated investment company, if such qualification is in the
The Fund 27
NOTES TO FINANCIAL STATEMENTS (continued)
best interests of its shareholders, by complying with the applicable provisions of the Code, and to make distributions of taxable income sufficient to relieve it from substantially all federal income and excise taxes.
As of and during the period ended August 31, 2014, the fund did not have any liabilities for any uncertain tax positions.The fund recognizes interest and penalties, if any, related to uncertain tax positions as income tax expense in the Statement of Operations. During the period ended August 31, 2014, the fund did not incur any interest or penalties.
Each tax year in the four-year period ended August 31, 2014 remains subject to examination by the Internal Revenue Service and state taxing authorities.
At August 31, 2014, the components of accumulated earnings on a tax basis were as follows: undistributed ordinary income $779,678, undistributed capital gains $26,116,388, accumulated capital losses $19,769,604 and unrealized appreciation $42,270,236.
Under the Regulated Investment Company Modernization Act of 2010 (the “2010 Act”), the fund is permitted to carry forward capital losses incurred in taxable years beginning after December 22, 2010 (“post-enactment losses”) for an unlimited period. Furthermore, post-enactment capital loss carryovers retain their character as either short-term or long-term capital losses rather than short-term as they were under previous statute.The 2010 Act requires post-enactment losses to be utilized before the utilization of losses incurred in taxable years prior to the effective date of the 2010 Act (“pre-enactment losses”).As a result of this ordering rule, pre-enactment losses may be more likely to expire unused.
As a result of the fund’s merger with Dreyfus MidCap Core Fund, capital losses of $19,769,604 are available to offset future realized gains, if any. Based on certain provisions in the Code, the amount of losses which can be utilized in subsequent years is subject to an annual limitation. If not applied, $15,474,385 of these acquired capital losses expires in fiscal year 2015, $3,806,018 expires in fiscal year 2016 and $489,201 expires in fiscal year 2017.
28
The tax character of distributions paid to shareholders during the fiscal periods ended August 31, 2014 and August 31, 2013 were as follows: ordinary income $800,181 and $640,385, and long-term capital gains $2,200,771 and $0, respectively.
NOTE 2—Bank Lines of Credit:
The fund participates with other Dreyfus-managed funds in a $265 million unsecured credit facility led by Citibank, N.A. and a $300 million unsecured credit facility provided by The Bank of New York Mellon (each, a “Facility”), each to be utilized primarily for temporary or emergency purposes, including the financing of redemptions. Prior to October 9, 2013, the unsecured credit facility with Citibank, N.A. was $210 million. In connection therewith, the fund has agreed to pay its pro rata portion of commitment fees for each Facility. Interest is charged to the fund based on rates determined pursuant to the terms of the respective Facility at the time of borrowing.
The average amount of borrowings outstanding under the Facilities during the period ended August 31, 2014 was approximately $23,300 with a related weighted average annualized interest rate of 1.09%.
NOTE 3—Management Fee, Sub-Investment Advisory Fee and Other Transactions with Affiliates:
(a) Pursuant to a management agreement with Dreyfus, the management fee is computed at the annual rate of .75% of the value of the fund’s average daily net assets and is payable monthly. Dreyfus has contractually agreed, from September 1, 2013 through January 1, 2015, to waive receipt of its fees and/or assume the direct expenses of the fund so that the expenses of none of the classes (excluding Rule 12b-1 Distribution Plan fees, Shareholder Services Plan fees, taxes, interest expense, brokerage commissions, commitment fees on borrowings and extraordinary expenses) exceed 1.00% of the value of the fund’s average daily net assets.The reduction in expenses, pursuant to the undertaking, amounted to $153,961 during the period ended August 31, 2014.
The Fund 29
NOTES TO FINANCIAL STATEMENTS (continued)
Pursuant to a sub-investment advisory agreement between Dreyfus and Mellon Capital, the sub-investment advisory fee is payable monthly by Dreyfus, and is based upon the value of the fund’s average daily net assets, computed at the following annual rates:
| | |
| Average Net Assets | | |
| 0 up to $100 million | .25 | % |
| $100 million up to $1 billion | .20 | % |
| $1 billion up to $1.5 billion | .16 | % |
| In excess of $1.5 billion | .10 | % |
During the period ended August 31, 2014, the Distributor retained $4,078 from commissions earned on sales of the fund’s Class A shares and $412 from CDSCs on redemptions of the fund’s Class C shares.
(b) Under the Distribution Plan adopted pursuant to Rule 12b-1 under the Act, Class C shares pay the Distributor for distributing its shares at an annual rate of .75% of the value of its average daily net assets. During the period ended August 31, 2014, Class C shares were charged $214,351 pursuant to the Distribution Plan.
(c) Under the Shareholder Services Plan, Class A and Class C shares pay the Distributor at an annual rate of .25% of the value of their average daily net assets for the provision of certain services. The services provided may include personal services relating to shareholder accounts, such as answering shareholder inquiries regarding the fund and providing reports and other information, and services related to the maintenance of shareholder accounts. The Distributor may make payments to Service Agents (securities dealers, financial institutions or other industry professionals) with respect to these services. The Distributor determines the amounts to be paid to Service Agents. During the period ended August 31, 2014, Class A and Class C shares were charged $291,676 and $71,450, respectively, pursuant to the Shareholder Services Plan.
The fund has arrangements with the transfer agent and the custodian whereby the fund may receive earnings credits when positive cash bal-
30
ances are maintained, which are used to offset transfer agency and custody fees. For financial reporting purposes, the fund includes net earnings credits as an expense offset in the Statement of Operations.
The fund compensates Dreyfus Transfer, Inc., a wholly-owned subsidiary of Dreyfus, under a transfer agency agreement for providing transfer agency and cash management services for the fund. The majority of transfer agency fees are comprised of amounts paid on a per account basis, while cash management fees are related to fund subscriptions and redemptions. During the period ended August 31, 2014, the fund was charged $65,026 for transfer agency services and $2,950 for cash management services. These fees are included in Shareholder servicing costs in the Statement of Operations. Cash management fees were partially offset by earnings credits of $218.
The fund compensates The Bank of New York Mellon under a custody agreement for providing custodial services for the fund. These fees are determined based on net assets, geographic region and transaction activity. During the period ended August 31, 2014, the fund was charged $19,554 pursuant to the custody agreement.
The fund compensated The Bank of New York Mellon under a cash management agreement that was in effect until September 30, 2013 for performing certain cash management services related to fund subscriptions and redemptions. During the period ended August 31, 2014, the fund was charged $78 pursuant to the cash management agreement, which is included in Shareholder servicing costs in the Statement of Operations.
During the period ended August 31, 2014, the fund was charged $8,296 for services performed by the Chief Compliance Officer and his staff.
The components of “Due to The Dreyfus Corporation and affiliates” in the Statement of Assets and Liabilities consist of: management fees $152,392, Distribution Plan fees $18,815, Shareholder Services Plan
The Fund 31
NOTES TO FINANCIAL STATEMENTS (continued)
fees $31,573, custodian fees $8,513, Chief Compliance Officer fees $1,154 and transfer agency fees $12,511, which are offset against an expense reimbursement currently in effect in the amount of $3,084.
(d) Each Board member also serves as a Board member of other funds within the Dreyfus complex. Annual retainer fees and attendance fees are allocated to each fund based on net assets.
NOTE 4—Securities Transactions:
The aggregate amount of purchases and sales of investment securities, excluding short-term securities, during the period ended August 31, 2014, amounted to $171,289,535 and $176,830,252, respectively.
At August 31, 2014, the cost of investments for federal income tax purposes was $205,837,857; accordingly, accumulated net unrealized appreciation on investments was $42,270,236, consisting of $46,179,953 gross unrealized appreciation and $3,909,717 gross unrealized depreciation.
32
|
| REPORT OF INDEPENDENT REGISTERED |
| PUBLIC ACCOUNTING FIRM |
Shareholders and Board of Directors
Dreyfus Structured Midcap Fund
We have audited the accompanying statement of assets and liabilities, including the statement of investments, of Dreyfus Structured Midcap Fund (one of the series comprising Advantage Funds, Inc.) as of August 31, 2014, and the related statement of operations for the year then ended, the statement of changes in net assets for each of the two years in the period then ended, and the financial highlights for each of the periods indicated therein. These financial statements and financial highlights are the responsibility of the Fund’s management. Our responsibility is to express an opinion on these financial statements and financial highlights based on our audits.
We conducted our audits in accordance with the standards of the Public Company Accounting Oversight Board (United States). Those standards require that we plan and perform the audit to obtain reasonable assurance about whether the financial statements and financial highlights are free of material misstatement. We were not engaged to perform an audit of the Fund’s internal control over financial reporting. Our audits included consideration of internal control over financial reporting as a basis for designing audit procedures that are appropriate in the circumstances, but not for the purpose of expressing an opinion on the effectiveness of the Fund’s internal control over financial reporting. Accordingly, we express no such opinion. An audit also includes examining, on a test basis, evidence supporting the amounts and disclosures in the financial statements and financial highlights, assessing the accounting principles used and significant estimates made by management, and evaluating the overall financial statement presentation. Our procedures included confirmation of securities owned as of August 31, 2014 by correspondence with the custodian and others. We believe that our audits provide a reasonable basis for our opinion.
In our opinion, the financial statements and financial highlights referred to above present fairly, in all material respects, the financial position of Dreyfus Structured Midcap Fund at August 31, 2014, the results of its operations for the year then ended, the changes in its net assets for each of the two years in the period then ended, and the financial highlights for each of the indicated periods, in conformity with U.S. generally accepted accounting principles.

New York, New York
October 28, 2014
The Fund 33
IMPORTANT TAX INFORMATION (Unaudited)
For federal tax purposes, the fund hereby reports 100% of the ordinary dividends paid during the fiscal year ended August 31, 2014 as qualifying for the corporate dividends received deduction. Also, certain dividends paid by the fund may be subject to a maximum tax rate of 15%, as provided for by the Jobs and Growth Tax Relief Reconciliation Act of 2003. Of the distributions paid during the fiscal year, $800,181 represents the maximum amount that may be considered qualified dividend income. The fund also hereby reports $.2838 per share as a long-term capital gain distribution paid on December 20, 2013. Shareholders will receive notification in early 2015 of the percentage applicable to the preparation of their 2014 income tax returns.
34
|
| INFORMATION ABOUT THE RENEWAL OF THE |
| FUND’S MANAGEMENT AND SUB-INVESTMENT |
| ADVISORY AGREEMENTS (Unaudited) |
At a meeting of the fund’s Board of Directors held on March 4-5, 2014, the Board considered the renewal of the fund’s Management Agreement pursuant to which Dreyfus provides the fund with investment advisory and administrative services (the “Agreement”), and the Sub-Investment Advisory Agreement (together, the “Agreements”), pursuant to which Mellon Capital Management Corporation (the “Sub-Adviser”) provides day-to-day management of the fund’s invest-ments.The Board members, none of whom are “interested persons” (as defined in the Investment Company Act of 1940, as amended) of the fund, were assisted in their review by independent legal counsel and met with counsel in executive session separate from representatives of Dreyfus and the Sub-Adviser. In considering the renewal of the Agreements, the Board considered all factors that it believed to be relevant, including those discussed below. The Board did not identify any one factor as dispositive, and each Board member may have attributed different weights to the factors considered.
Analysis of Nature, Extent, and Quality of Services Provided to the Fund. The Board considered information provided to them at the meeting and in previous presentations from Dreyfus representatives regarding the nature, extent, and quality of the services provided to funds in the Dreyfus fund complex. Dreyfus provided the number of open accounts in the fund, the fund’s asset size and the allocation of fund assets among distribution channels. Dreyfus also had previously provided information regarding the diverse intermediary relationships and distribution channels of funds in the Dreyfus fund complex (such as retail direct or intermediary, in which intermediaries typically are paid by the fund and/or Dreyfus) and Dreyfus’ corresponding need for broad, deep, and diverse resources to be able to provide ongoing shareholder services to each intermediary or distribution channel, as applicable to the fund.
The Board also considered research support available to, and portfolio management capabilities of, the fund’s portfolio management personnel and that Dreyfus also provides oversight of day-to-day fund operations, including fund accounting and administration and assistance in meeting
The Fund 35
|
| INFORMATION ABOUT THE RENEWAL OF THE FUND’S MANAGEMENT |
| AND SUB-INVESTMENT ADVISORY AGREEMENTS (Unaudited) (continued) |
legal and regulatory requirements. The Board also considered Dreyfus’ extensive administrative, accounting, and compliance infrastructures, as well as Dreyfus’ supervisory activities over the Sub-Adviser.The Board also considered portfolio management’s brokerage policies and practices (including policies and practices regarding soft dollars) and the standards applied in seeking best execution.
Comparative Analysis of the Fund’s Performance and Management Fee and Expense Ratio. The Board reviewed reports prepared by Lipper, Inc. (“Lipper”), an independent provider of investment company data, which included information comparing (1) the fund’s performance with the performance of a group of comparable funds (the “Performance Group”) and with a broader group of funds (the “Performance Universe”), all for various periods ended December 31, 2013, and (2) the fund’s actual and contractual management fees and total expenses with those of a group of comparable funds (the “Expense Group”) and with a broader group of funds (the “Expense Universe”), the information for which was derived in part from fund financial statements available to Lipper as of the date of its analysis. Dreyfus previously had furnished the Board with a description of the methodology Lipper used to select the Performance Group and Performance Universe and the Expense Group and Expense Universe.
Dreyfus representatives stated that the usefulness of performance comparisons may be affected by a number of factors, including different investment limitations that may be applicable to the fund and comparison funds. The Board discussed the results of the comparisons and noted that the fund’s total return performance was above the Performance Group and Performance Universe medians for the various periods, except for the one-year period when the fund’s performance was below the Performance Group median. Dreyfus also provided a comparison of the fund’s calendar year total returns to the returns of the fund’s benchmark index.
The Board also reviewed the range of actual and contractual management fees and total expenses of the Expense Group and Expense Universe funds and discussed the results of the comparisons.The Board
36
noted that the fund’s contractual management fee was below the Expense Group median and the fund’s actual management fee and total expenses were below the Expense Group and Expense Universe medians.
Dreyfus representatives noted that Dreyfus has contractually agreed to waive receipt of its fees and/or assume the direct expenses of the fund, until January 1, 2015, so that the expenses of none of the classes (excluding Rule 12b-1 fees, shareholder services fees, taxes, interest, brokerage commissions, commitment fees on borrowings and extraordinary expenses) exceed 1.00% of the value of the fund’s average daily net assets.
Dreyfus representatives reviewed with the Board the management or investment advisory fees (1) paid by funds advised or administered by Dreyfus that are in the same Lipper category as the fund and (2) paid to Dreyfus or the Sub-Adviser or its affiliates for advising any separate accounts and/or other types of client portfolios that are considered to have similar investment strategies and policies as the fund (the “Similar Clients”), and explained the nature of the Similar Clients.They discussed differences in fees paid and the relationship of the fees paid in light of any differences in the services provided and other relevant factors. The Board considered the relevance of the fee information provided for the Similar Clients to evaluate the appropriateness and reasonableness of the fund’s management fee.
The Board considered the fee to the Sub-Adviser in relation to the fee paid to Dreyfus by the fund and the respective services provided by the Sub-Adviser and Dreyfus.The Board also noted the Sub-Adviser’s fee is paid by Dreyfus (out of its fee from the fund) and not the fund.
Analysis of Profitability and Economies of Scale. Dreyfus representatives reviewed the expenses allocated and profit received by Dreyfus and the resulting profitability percentage for managing the fund and the aggregate profitability percentage to Dreyfus of managing the funds in the Dreyfus fund complex, and the method used to determine the expenses and profit. The Board concluded that the profitability results were not unreasonable, given the services rendered and service
The Fund 37
|
| INFORMATION ABOUT THE RENEWAL OF THE FUND’S MANAGEMENT |
| AND SUB-INVESTMENT ADVISORY AGREEMENTS (Unaudited) (continued) |
levels provided by Dreyfus. The Board also had been provided with information prepared by an independent consulting firm regarding Dreyfus’ approach to allocating costs to, and determining the profitability of, individual funds and the entire Dreyfus fund complex.The consulting firm also had analyzed where any economies of scale might emerge in connection with the management of a fund.
The Board considered on the advice of its counsel the profitability analysis (1) as part of its evaluation of whether the fees under the Agreements bear a reasonable relationship to the mix of services provided by Dreyfus and the Sub-Adviser, including the nature, extent and quality of such services, and (2) in light of the relevant circumstances for the fund and the extent to which economies of scale would be realized if the fund grows and whether fee levels reflect these economies of scale for the benefit of fund shareholders. Since Dreyfus, and not the fund, pays the Sub-Adviser pursuant to the Sub-Investment Advisory Agreement, the Board did not consider the Sub-Adviser’s profitability to be relevant to its deliberations. Dreyfus representatives also noted that, as a result of shared and allocated costs among funds in the Dreyfus fund complex, the extent of economies of scale could depend substantially on the level of assets in the complex as a whole, so that increases and decreases in complex-wide assets can affect potential economies of scale in a manner that is disproportionate to, or even in the opposite direction from, changes in the fund’s asset level.The Board also considered potential benefits to Dreyfus and the Sub-Adviser from acting as investment adviser and sub-investment adviser, respectively, and noted the soft dollar arrangements in effect for trading the fund’s investments.
At the conclusion of these discussions, the Board agreed that it had been furnished with sufficient information to make an informed business decision with respect to the renewal of the Agreements. Based on the discussions and considerations as described above, the Board concluded and determined as follows.
38
The Board was satisfied with the fund’s performance.
The Board concluded that the fees paid to Dreyfus and the Sub- Adviser were reasonable in light of the considerations described above.
The Board determined that the economies of scale which may accrue to Dreyfus and its affiliates in connection with the management of the fund had been adequately considered by Dreyfus in connection with the fee rate charged to the fund pursuant to the Agreements and that, to the extent in the future it were determined that material economies of scale had not been shared with the fund, the Board would seek to have those economies of scale shared with the fund.
In evaluating the Agreements, the Board considered these conclusions and determinations and also relied on its previous knowledge, gained through meetings and other interactions with Dreyfus and its affiliates and the Sub-Adviser, of the fund and the services provided to the fund by Dreyfus and the Sub-Adviser.The Board also relied on information received on a routine and regular basis throughout the year relating to the operations of the fund and the investment management and other services provided under the Agreements, including information on the investment performance of the fund in comparison to similar mutual funds and benchmark performance indices; general market outlook as applicable to the fund; and compliance reports. In addition, the Board’s consideration of the contractual fee arrangements for this fund had the benefit of a number of years of reviews of prior or similar agreements during which lengthy discussions took place between the Board and Dreyfus representatives. Certain aspects of the arrangements may receive greater scrutiny in some years than in others, and the Board’s conclusions may be based, in part, on their consideration of the same or similar arrangements in prior years.The Board determined that renewal of the Agreements was in the best interests of the fund and its shareholders.
The Fund 39
|
| BOARD MEMBERS INFORMATION (Unaudited) |
| INDEPENDENT BOARD MEMBERS |
|
| Joseph S. DiMartino (70) |
| Chairman of the Board (1995) |
| Principal Occupation During Past 5Years: |
| • Corporate Director and Trustee (1995-present) |
| Other Public Company Board Memberships During Past 5Years: |
| • CBIZ (formerly, Century Business Services, Inc.), a provider of outsourcing functions for small |
| and medium size companies, Director (1997-present) |
| • The Newark Group, a provider of a national market of paper recovery facilities, paperboard |
| mills and paperboard converting plants, Director (2000-2010) |
| • Sunair Services Corporation, a provider of certain outdoor-related services to homes and |
| businesses, Director (2005-2009) |
| No. of Portfolios for which Board Member Serves: 142 |
| ——————— |
| Peggy C. Davis (71) |
| Board Member (2006) |
| Principal Occupation During Past 5Years: |
| • Shad Professor of Law, New York University School of Law (1983-present) |
| No. of Portfolios for which Board Member Serves: 52 |
| ——————— |
| David P. Feldman (74) |
| Board Member (1996) |
| Principal Occupation During Past 5Years: |
| • Corporate Director and Trustee (1985-present) |
| Other Public Company Board Membership During Past 5Years: |
| • BBH Mutual Funds Group (5 registered mutual funds), Director (1992-present) |
| No. of Portfolios for which Board Member Serves: 38 |
| ——————— |
| Ehud Houminer (74) |
| Board Member (1993) |
| Principal Occupation During Past 5Years: |
| • Executive-in-Residence at the Columbia Business School, Columbia University (1992-present) |
| Other Public Company Board Membership During Past 5Years: |
| • Avnet Inc., an electronics distributor, Director (1993-2012) |
| No. of Portfolios for which Board Member Serves: 62 |
40
|
| Lynn Martin (74) |
| Board Member (2012) |
| Principal Occupation During Past 5Years: |
| • President of The Martin Hall Group LLC, a human resources consulting firm (2005-2012) |
| Other Public Company Board Memberships During Past 5Years: |
| • AT&T Inc., a telecommunications company, Director (1999-2012) |
| • Ryder System, Inc., a supply chain and transportation management company, Director (1993-2012) |
| • The Proctor & Gamble Co., a consumer products company, Director (1994-2009) |
| • Constellation Energy Group Inc., Director (2003-2009) |
| No. of Portfolios for which Board Member Serves: 38 |
| ——————— |
| Robin A. Melvin (50) |
| Board Member (2012) |
| Principal Occupation During Past 5Years: |
| • Board Member, Illinois Mentoring Partnership, non-profit organization dedicated to increasing |
| the quantity and quality of mentoring services in Illinois (2013-present) |
| • Director, Boisi Family Foundation, a private family foundation that supports youth-serving orga- |
| nizations that promote the self sufficiency of youth from disadvantaged circumstances (1995-2012) |
| No. of Portfolios for which Board Member Serves: 109 |
| ——————— |
| Dr. Martin Peretz (75) |
| Board Member (2006) |
| Principal Occupation During Past 5Years: |
| • Editor-in-Chief Emeritus of The New Republic Magazine (2010-2011) (previously, |
| Editor-in-Chief, 1974-2010) |
| • Director of TheStreet.com, a financial information service on the web (1996-2010) |
| No. of Portfolios for which Board Member Serves: 38 |
| ——————— |
Once elected all Board Members serve for an indefinite term, but achieve Emeritus status upon reaching age 80.The address of the Board Members and Officers is c/o The Dreyfus Corporation, 200 Park Avenue, New York, New York 10166. Additional information about the Board Members is available in the fund’s Statement of Additional Information which can be obtained from Dreyfus free of charge by calling this toll free number: 1-800-DREYFUS.
James F. Henry, Emeritus Board Member
Dr. Paul A. Marks, Emeritus Board Member
Philip L.Toia, Emeritus Board Member
The Fund 41
OFFICERS OF THE FUND (Unaudited)
BRADLEY J. SKAPYAK, President since January 2010.
Chief Operating Officer and a director of the Manager since June 2009, Chairman of Dreyfus Transfer, Inc., an affiliate of the Manager and the transfer agent of the funds, since May 2011 and Executive Vice President of the Distributor since June 2007. From April 2003 to June 2009, Mr. Skapyak was the head of the Investment Accounting and Support Department of the Manager. He is an officer of 69 investment companies (comprised of 142 portfolios) managed by the Manager. He is 55 years old and has been an employee of the Manager since February 1988.
JOHN PAK, Chief Legal Officer since March 2013.
Deputy General Counsel, Investment Management, of BNY Mellon since August 2014; Chief Legal Officer of the Manager since August 2012; from March 2005 to July 2012, Managing Director of Deutsche Bank, Deputy Global Head of Deutsche Asset Management Legal and Regional Head of Deutsche Asset Management Americas Legal. He is an officer of 70 investment companies (comprised of 167 portfolios) managed by the Manager. He is 45 years old and has been an employee of the Manager since August 2012.
JANETTE E. FARRAGHER, Vice President and Secretary since December 2011.
Assistant General Counsel of BNY Mellon, and an officer of 70 investment companies (comprised of 167 portfolios) managed by the Manager. She is 51 years old and has been an employee of the Manager since February 1984.
KIESHA ASTWOOD, Vice President and Assistant Secretary since January 2010.
Counsel of BNY Mellon, and an officer of 70 investment companies (comprised of 167 portfolios) managed by the Manager. She is 41 years old and has been an employee of the Manager since July 1995.
JAMES BITETTO, Vice President and Assistant Secretary since August 2005.
Managing Counsel of BNY Mellon and Secretary of the Manager, and an officer of 70 investment companies (comprised of 167 portfolios) managed by the Manager. He is 48 years old and has been an employee of the Manager since December 1996.
JONI LACKS CHARATAN, Vice President and Assistant Secretary since August 2005.
Managing Counsel of BNY Mellon, and an officer of 70 investment companies (comprised of 167 portfolios) managed by the Manager. She is 58 years old and has been an employee of the Manager since October 1988.
JOSEPH M. CHIOFFI, Vice President and Assistant Secretary since August 2005.
Managing Counsel of BNY Mellon, and an officer of 70 investment companies (comprised of 167 portfolios) managed by the Manager. He is 52 years old and has been an employee of the Manager since June 2000.
JOHN B. HAMMALIAN, Vice President and Assistant Secretary since August 2005.
Senior Managing Counsel of BNY Mellon, and an officer of 70 investment companies (comprised of 167 portfolios) managed by the Manager. He is 51 years old and has been an employee of the Manager since February 1991.
SARAH S. KELLEHER, Vice President and Assistant Secretary since April 2014.
Senior Counsel of BNY Mellon, and an officer of 70 investment companies (comprised of 167 portfolios) managed by the Manager; from August 2005 to March 2013, Associate General Counsel of Third Avenue Management. She is 38 years old and has been an employee of the Manager since March 2013.
42
JEFF PRUSNOFSKY, Vice President and Assistant Secretary since August 2005.
Senior Managing Counsel of BNY Mellon, and an officer of 70 investment companies (comprised of 167 portfolios) managed by the Manager. He is 49 years old and has been an employee of the Manager since October 1990.
JAMES WINDELS, Treasurer since November 2001.
Director – Mutual Fund Accounting of the Manager, and an officer of 70 investment companies (comprised of 167 portfolios) managed by the Manager. He is 55 years old and has been an employee of the Manager since April 1985.
RICHARD CASSARO, Assistant Treasurer since January 2008.
Senior Accounting Manager – Money Market and Municipal Bond Funds of the Manager, and an officer of 70 investment companies (comprised of 167 portfolios) managed by the Manager. He is 55 years old and has been an employee of the Manager since September 1982.
GAVIN C. REILLY, Assistant Treasurer since December 2005.
Tax Manager of the Investment Accounting and Support Department of the Manager, and an officer of 70 investment companies (comprised of 167 portfolios) managed by the Manager. He is 46 years old and has been an employee of the Manager since April 1991.
ROBERT S. ROBOL, Assistant Treasurer since August 2005.
Senior Accounting Manager – Fixed Income Funds of the Manager, and an officer of 70 investment companies (comprised of 167 portfolios) managed by the Manager. He is 50 years old and has been an employee of the Manager since October 1988.
ROBERT SALVIOLO, Assistant Treasurer since July 2007.
Senior Accounting Manager – Equity Funds of the Manager, and an officer of 70 investment companies (comprised of 167 portfolios) managed by the Manager. He is 47 years old and has been an employee of the Manager since June 1989.
ROBERT SVAGNA, Assistant Treasurer since August 2005.
Senior Accounting Manager – Equity Funds of the Manager, and an officer of 70 investment companies (comprised of 167 portfolios) managed by the Manager. He is 47 years old and has been an employee of the Manager since November 1990.
JOSEPH W. CONNOLLY, Chief Compliance Officer since October 2004.
Chief Compliance Officer of the Manager and The Dreyfus Family of Funds (70 investment companies, comprised of 167 portfolios).
He is 57 years old and has served in various capacities with the Manager since 1980, including manager of the firm’s Fund Accounting Department from 1997 through October 2001.
MATTHEW D. CONNOLLY, Anti-Money Laundering Compliance Officer since April 2012.
Anti-Money Laundering Compliance Officer of the Distributor since October 2011; from March 2010 to September 2011, Global Head, KYC Reviews and Director of UBS Investment Bank; until March 2010, AML Compliance Officer and Senior Vice President of Citi Global Wealth Management. He is an officer of 65 investment companies (comprised of 162 portfolios) managed by the Manager. He is 42 years old and has been an employee of the Distributor since October 2011.
The Fund 43
For More Information
Telephone Call your financial representative or 1-800-DREYFUS
Mail The Dreyfus Family of Funds, 144 Glenn Curtiss Boulevard, Uniondale, NY 11556-0144
The fund files its complete schedule of portfolio holdings with the Securities and Exchange Commission (“SEC”) for the first and third quarters of each fiscal year on Form N-Q. The fund’s Forms N-Q are available on the SEC’s website at http://www.sec.gov and may be reviewed and copied at the SEC’s Public Reference Room in Washington, DC. Information on the operation of the Public Reference Room may be obtained by calling 1-800-SEC-0330.
A description of the policies and procedures that the fund uses to determine how to vote proxies relating to portfolio securities, and information regarding how the fund voted these proxies for the most recent 12-month period ended June 30 is available at http://www.dreyfus.com and on the SEC’s website at http://www.sec.gov. The description of the policies and procedures is also available without charge, upon request, by calling 1-800-DREYFUS.

|
| Dreyfus |
| Technology Growth Fund |
ANNUAL REPORT August 31, 2014

Save time. Save paper. View your next shareholder report online as soon as it’s available. Log into www.dreyfus.com and sign up for Dreyfus eCommunications. It’s simple and only takes a few minutes.
The views expressed in this report reflect those of the portfolio manager only through the end of the period covered and do not necessarily represent the views of Dreyfus or any other person in the Dreyfus organization. Any such views are subject to change at any time based upon market or other conditions and Dreyfus disclaims any responsibility to update such views.These views may not be relied on as investment advice and, because investment decisions for a Dreyfus fund are based on numerous factors, may not be relied on as an indication of trading intent on behalf of any Dreyfus fund.
|
| Not FDIC-Insured • Not Bank-Guaranteed • May Lose Value |
| | Contents |
| | THE FUND |
| 2 | A Letter from the President |
| 3 | Discussion of Fund Performance |
| 6 | Fund Performance |
| 8 | Understanding Your Fund’s Expenses |
| 8 | Comparing Your Fund’s Expenses With Those of Other Funds |
| 9 | Statement of Investments |
| 12 | Statement of Assets and Liabilities |
| 13 | Statement of Operations |
| 14 | Statement of Changes in Net Assets |
| 16 | Financial Highlights |
| 19 | Notes to Financial Statements |
| 29 | Report of Independent Registered Public Accounting Firm |
| 30 | Important Tax Information |
| 31 | Information About the Renewal of the Fund’s Management Agreement |
| 36 | Board Members Information |
| 38 | Officers of the Fund |
| | FOR MORE INFORMATION |
| | Back Cover |
Dreyfus
Technology Growth Fund
The Fund
A LETTER FROM THE PRESIDENT
Dear Shareholder:
We are pleased to present this annual report for Dreyfus Technology Growth Fund, covering the 12-month period from September 1, 2013, through August 31, 2014. For information about how the fund performed during the reporting period, as well as general market perspectives, we provide a Discussion of Fund Performance on the pages that follow.
Despite occasional bouts of heightened volatility, U.S. stocks generally gained ground steadily over the reporting period as the domestic economy rebounded. As a result, most broad measures of equity market performance established a series of new record highs over the past 12 months. Growth-oriented and more economically sensitive stocks generally fared well over the reporting period’s first half, but value-oriented stocks rallied more strongly over the second half.
We remain cautiously optimistic regarding the U.S. stock market’s prospects. We currently expect the economy to continue to accelerate as several long-standing drags, including tight fiscal policies and private sector deleveraging, fade from the scene. Of course, a number of risks remain, including the possibilities of higher short-term interest rates and intensifying geopolitical turmoil.Therefore, we suggest you talk regularly with your financial advisor to assess the potential impact of these and other macroeconomic developments on your investments.
Thank you for your continued confidence and support.

J. Charles Cardona
President
The Dreyfus Corporation
September 15, 2014
2
DISCUSSION OF FUND PERFORMANCE
For the period of September 1, 2013, through August 31, 2014, as provided by Barry K. Mills, CFA, Portfolio Manager
Fund and Market Performance Overview
For the 12-month period ended August 31, 2014, Dreyfus Technology Growth Fund’s Class A shares produced a total return of 26.37%, Class C shares returned 25.33%, and Class I shares returned 26.61%.1 In comparison, the fund’s benchmarks, the Morgan Stanley High Technology 35 Index (“MS High Tech 35 Index”) and the Standard & Poor’s 500® Composite Stock Price Index (“S&P 500 Index”), produced total returns of 30.96% and 25.21%, respectively, over the same period.2,3
U.S. stocks rallied strongly over the reporting period amid continued domestic economic growth.Technology stocks averaged greater gains than the overall market, partly due to the start of a recovery in business spending on productivity-enhancing technologies.While the fund produced higher returns than the S&P 500 Index and participated substantially in the sector’s rise, its returns lagged the MS High Tech 35 Index as a result of a few company-specific disappointments.
The Fund’s Investment Approach
The fund seeks capital appreciation by investing in growth companies of any size that we regard as leading producers or beneficiaries of technological innovation. The fund’s investment process centers on a multi-dimensional approach that looks for opportunities across emerging growth, cyclical, or stable growth companies.The fund seeks companies that appear to have strong earnings momentum, positive earnings revisions, favorable growth, product or market cycles, and/or favorable valuations.
Recovering Economy Fueled Market’s Gains
The reporting period began on a positive note when investors learned in early September 2013 that the Federal Reserve Board would refrain from immediately tapering its massive, open-ended quantitative easing program. Stocks advanced from September through December 2013 in response to new releases of encouraging economic data, enabling the S&P 500 Index to end the year near record highs.The market relinquished some of its gains in January 2014 when concerns surfaced
The Fund 3
DISCUSSION OF FUND PERFORMANCE (continued)
regarding economic slowdowns in the world’s emerging markets, but stocks rebounded in February when those worries proved to be overblown. Another short-term market correction in March, April, and May—this one concentrated in the information technology and biotechnology industry groups—again drove the market temporarily lower, as did news of a weather-related U.S. economic slowdown during the first quarter of the year. By June, however, positive economic data once more bolstered investor sentiment, driving stocks to a series of new record highs during the final three months of the reporting period.
The information technology sector proved more volatile than most other market sectors, advancing more rapidly during periods of market strength while retreating sharply when markets fell. On the whole, however, technology investors benefited from pent-up enterprise spending by companies seeking to boost productivity and efficiency through technological advances such as cloud computing, software as a service, and mobile computing. In contrast, communications equipment makers and information technology services providers generally lagged sector averages.
Fund’s Gains Constrained by Company-Specific Developments
The fund participated fully in the broad equity market’s rise during the reporting period, but its returns lagged the technology-specific MS High Tech 35 Index due to a few developments among individual companies. Most notably, the fund did not hold two of the reporting period’s most active technology stocks: struggling mobile device maker Nokia experienced a sharp rise in its stock price in September 2013 when Microsoft announced its planned acquisition of most of the company’s assets; and computer hardware maker Hewlett-Packard rose amid slowing declines in personal computer sales and the arrival of a new management team.
A small number of the fund’s holdings also disappointed. Expense management solutions provider Concur Technologies lost ground during the technology correction in the spring of 2014 despite solid financial performance. Semiconductor maker Xilinx declined after reporting lower-than-expected earnings and profit margins.
On the other hand, several of the fund’s investments in innovative technology companies produced strong results. Social networking company Facebook proved able to monetize its mobile applications through robust advertising sales. Another top performer, software developer Adobe Systems, successfully transitioned to a
4
more stable business model with better growth prospects. The fund’s single best performing holding during the reporting period, semiconductor maker Micron Technology, benefited from a period of industry consolidation and an improved pricing environment.
Investing in Well-Positioned Technology Innovators
As of the reporting period’s end, we have identified an ample number of opportunities meeting our investment criteria among social networking companies, producers of cloud computing applications and infrastructure, and companies engaged in technology-assisted transaction processing and payment-related services. We believe these companies are well positioned to benefit from improving corporate and government spending trends on key technology-related products and services.At the same time, we remain watchful of the international political and economic developments in Western Europe, Russia, and the Middle East, which could hamper growth prospects for some technology companies with global reach.
September 15, 2014
Please note, the position in any security highlighted with italicized typeface was sold during the reporting period. Equity funds are subject generally to market, market sector, market liquidity, issuer, and investment style risks, among other factors, to varying degrees, all of which are more fully described in the fund’s prospectus.
The technology sector has been among the most volatile sectors of the stock market.Technology companies involve greater risk because their revenue and/or earnings tend to be less predictable and some companies may be experiencing significant losses.
|
| 1 Total return includes reinvestment of dividends and any capital gains paid, and does not take into consideration the |
| maximum initial sales charge in the case of Class A shares, or the applicable contingent deferred sales charge imposed |
| on redemptions in the case of Class C shares. Had these charges been reflected, returns would have been lower. Past |
| performance is no guarantee of future results. Share price, yield, and investment return fluctuate such that upon |
| redemption, fund shares may be worth more or less than their original cost. |
| 2 SOURCE: BLOOMBERG L.P. — Reflects reinvestment of net dividends and, where applicable, capital gain |
| distributions.The Morgan Stanley High Technology 35 Index is an unmanaged, equal dollar-weighted index of 35 |
| stocks from the electronics-based subsectors.The index does not take into account fees and expenses to which the fund |
| is subject. Investors cannot invest directly in any index. |
| 3 SOURCE: LIPPER INC. — Reflects monthly reinvestment of dividends and, where applicable, capital gain |
| distributions.The Standard & Poor’s 500® Composite Stock Price Index is a widely accepted, unmanaged index of |
| U.S. stock market performance.The index does not take into account fees and expenses to which the fund is subject. |
| Investors cannot invest directly in any index. |
The Fund 5
FUND PERFORMANCE

| |
| † | Source: Bloomberg L.P. |
| †† | Source: Lipper Inc. |
Past performance is not predictive of future performance.
The above graph compares a $10,000 investment made in each of the Class A, Class C and Class I shares of Dreyfus Technology Growth Fund on 8/31/04 to a $10,000 investment made in each of the Standard & Poor’s 500 Composite Stock Price Index (the “S&P 500 Index”) and the Morgan Stanley High Technology 35 Index (the “MS High Tech 35 Index”) on that date. All dividends and capital gain distributions are reinvested.
The fund’s performance shown in the line graph above takes into account the maximum initial sales charge on Class A shares and all other applicable fees and expenses on all classes.The S&P 500 Index is a widely accepted, unmanaged index of U.S. stock market performance.The MS High Tech 35 Index reflects reinvestment of net dividends and, where applicable, capital gain distributions.The MS High Tech 35 Index is an unmanaged, equal dollar-weighted index from the electronics-based subsectors. Unlike a mutual fund, the indices are not subject to charges, fees and other expenses. Investors cannot invest directly in any index. Further information relating to fund performance, including expense reimbursements, if applicable, is contained in the Financial Highlights section of the prospectus and elsewhere in this report.
6
| | | | | | |
| Average Annual Total Returns as of 8/31/14 | | | | | | |
| |
| | 1 Year | | 5 Years | | 10 Years | |
| Class A shares | | | | | | |
| with maximum sales charge (5.75%) | 19.11 | % | 16.01 | % | 8.75 | % |
| without sales charge | 26.37 | % | 17.39 | % | 9.40 | % |
| Class C shares | | | | | | |
| with applicable redemption charge † | 24.33 | % | 16.40 | % | 8.42 | % |
| without redemption | 25.33 | % | 16.40 | % | 8.42 | % |
| Class I shares | 26.61 | % | 17.77 | % | 9.80 | % |
| Morgan Stanley | | | | | | |
| High Technology 35 Index | 30.96 | % | 16.17 | % | 10.10 | % |
| Standard & Poor’s 500 | | | | | | |
| Composite Stock Price Index | 25.21 | % | 16.87 | % | 8.37 | % |
Past performance is not predictive of future performance.The fund’s performance shown in the graph and table does not reflect the deduction of taxes that a shareholder would pay on fund distributions or the redemption of fund shares. In addition to the performance of Class A shares shown with and without a maximum sales charge, the fund’s performance shown in the table takes into account all other applicable fees and expenses on all classes.
|
| † The maximum contingent deferred sales charge for Class C shares is 1% for shares redeemed within one year of the |
| date of purchase. |
The Fund 7
UNDERSTANDING YOUR FUND’S EXPENSES (Unaudited)
As a mutual fund investor, you pay ongoing expenses, such as management fees and other expenses. Using the information below, you can estimate how these expenses affect your investment and compare them with the expenses of other funds.You also may pay one-time transaction expenses, including sales charges (loads) and redemption fees, which are not shown in this section and would have resulted in higher total expenses. For more information, see your fund’s prospectus or talk to your financial adviser.
Review your fund’s expenses
The table below shows the expenses you would have paid on a $1,000 investment in Dreyfus Technology Growth Fund from March 1, 2014 to August 31, 2014. It also shows how much a $1,000 investment would be worth at the close of the period, assuming actual returns and expenses.
Expenses and Value of a $1,000 Investment
assuming actual returns for the six months ended August 31, 2014
| | | | | | |
| | | Class A | | Class C | | Class I |
| Expenses paid per $1,000† | $ | 6.21 | $ | 10.40 | $ | 5.11 |
| Ending value (after expenses) | $ | 988.30 | $ | 984.20 | $ | 989.40 |
COMPARING YOUR FUND’S EXPENSES
WITH THOSE OF OTHER FUNDS (Unaudited)
Using the SEC’s method to compare expenses
The Securities and Exchange Commission (SEC) has established guidelines to help investors assess fund expenses. Per these guidelines, the table below shows your fund’s expenses based on a $1,000 investment, assuming a hypothetical 5% annualized return. You can use this information to compare the ongoing expenses (but not transaction expenses or total cost) of investing in the fund with those of other funds. All mutual fund shareholder reports will provide this information to help you make this comparison. Please note that you cannot use this information to estimate your actual ending account balance and expenses paid during the period.
Expenses and Value of a $1,000 Investment
assuming a hypothetical 5% annualized return for the six months ended August 31, 2014
| | | | | | |
| | | Class A | | Class C | | Class I |
| Expenses paid per $1,000† | $ | 6.31 | $ | 10.56 | $ | 5.19 |
| Ending value (after expenses) | $ | 1,018.95 | $ | 1,014.72 | $ | 1,020.06 |
|
| † Expenses are equal to the fund’s annualized expense ratio of 1.24% for Class A, 2.08% for Class C and 1.02% for |
| Class I; multiplied by the average account value over the period, multiplied by 184/365 (to reflect the one-half year period). |
8
|
| STATEMENT OF INVESTMENTS |
| August 31, 2014 |
| | | |
| Common Stocks—95.0% | Shares | | Value ($) |
| Communications Equipment—15.6% | | | |
| Apple | 148,270 | | 15,197,675 |
| Cisco Systems | 439,590 | | 10,985,354 |
| Fortinet | 241,730 | a | 6,239,051 |
| Juniper Networks | 500,930 | | 11,616,567 |
| | | | 44,038,647 |
| Computers & Peripherals—8.8% | | | |
| EMC | 387,740 | | 11,449,962 |
| Lenovo Group | 4,688,000 | | 7,162,008 |
| Western Digital | 61,860 | | 6,372,199 |
| | | | 24,984,169 |
| Electronic Equipment & Instruments—2.9% | | | |
| Amphenol, Cl. A | 78,620 | | 8,098,646 |
| Internet & Catalog Retail—7.5% | | | |
| Netflix | 22,550 | a | 10,770,782 |
| Priceline Group | 8,270 | a | 10,290,444 |
| | | | 21,061,226 |
| Internet Software & Services—18.2% | | | |
| Akamai Technologies | 141,050 | a | 8,522,241 |
| Facebook, Cl. A | 181,810 | a | 13,603,024 |
| Google, Cl. A | 10,248 | a | 5,968,025 |
| Google, Cl. C | 10,248 | a | 5,857,757 |
| LinkedIn, Cl. A | 45,360 | a | 10,240,020 |
| Tencent Holdings | 435,200 | | 7,103,541 |
| | | | 51,294,608 |
| IT Services—7.3% | | | |
| Cognizant Technology Solutions, | | | |
| Cl. A | 175,354 | a | 8,018,939 |
| Visa, Cl. A | 59,720 | | 12,691,694 |
| | | | 20,710,633 |
| Life Sciences Tools & Services—2.1% | | | |
| Illumina | 33,040 | a | 5,926,054 |
The Fund 9
STATEMENT OF INVESTMENTS (continued)
| | | |
| Common Stocks (continued) | Shares | | Value ($) |
| Semiconductors & Semiconductor Equipment—9.9% | | | |
| Applied Materials | 462,990 | | 10,697,384 |
| SanDisk | 120,770 | | 11,830,629 |
| Texas Instruments | 115,220 | | 5,551,300 |
| | | | 28,079,313 |
| Software—22.7% | | | |
| Adobe Systems | 146,550 | a | 10,536,945 |
| Concur Technologies | 75,630 | a | 7,591,739 |
| Microsoft | 289,020 | | 13,130,179 |
| salesforce.com | 191,390 | a | 11,309,235 |
| ServiceNow | 95,530 | a | 5,839,749 |
| Symantec | 285,300 | | 6,927,084 |
| VMware, Cl. A | 87,660 | a | 8,641,523 |
| | | | 63,976,454 |
| Total Common Stocks | | | |
| (cost $199,467,291) | | | 268,169,750 |
| |
| Limited Partnership Interests—.2% | | | |
| Semiconductors & Semiconductor Equipment | | | |
| Bluestream Ventures, LPa,c | | | |
| (cost $2,061,175) | | | 621,342 |
10
| | | | |
| Other Investment—4.9% | Shares | | Value ($) | |
| Registered Investment Company; | | | | |
| Dreyfus Institutional Preferred | | | | |
| Plus Money Market Fund | | | | |
| (cost $13,850,664) | 13,850,664 | b | 13,850,664 | |
| Total Investments (cost $215,379,130) | 100.1 | % | 282,641,756 | |
| Liabilities, Less Cash and Receivables | (.1 | %) | (350,561 | ) |
| Net Assets | 100.0 | % | 282,291,195 | |
|
| a Non-income producing security. |
| b Investment in affiliated money market mutual fund. |
| c Security restricted as to public resale. Investment in restricted security with aggregate value of $621,342 representing .2% |
| of net assets (see below). |
| | | | |
| Issuer | Acquisition Date | Cost ($) | Net Assets (%) | Valuation ($)† |
| Bluestream Ventures, LP | 4/28/2005-6/11/2008 | 2,061,175 | .2 | 621,342 |
|
| † The valuation of this security has been determined in good faith by management under the direction of the Board |
| of Directors. |
| | | |
| Portfolio Summary (Unaudited)†† | | |
| |
| | Value (%) | | Value (%) |
| Software | 22.7 | Internet & Catalog Retail | 7.5 |
| Internet Software & Services | 18.2 | IT Services | 7.3 |
| Communications Equipment | 15.6 | Money Market Investment | 4.9 |
| Semiconductors & | | Electronic Equipment & Instruments | 2.9 |
| Semiconductor Equipment | 10.1 | Life Sciences Tools & Services | 2.1 |
| Computers & Peripherals | 8.8 | | 100.1 |
| |
| †† Based on net assets. | | | |
| See notes to financial statements. | | | |
The Fund 11
|
| STATEMENT OF ASSETS AND LIABILITIES |
| August 31, 2014 |
| | | |
| | | Cost | Value |
| Assets ($): | | | |
| Investments in securities—See Statement of Investments: | | |
| Unaffiliated issuers | | 201,528,466 | 268,791,092 |
| Affiliated issuers | | 13,850,664 | 13,850,664 |
| Cash | | | 12,491 |
| Dividends receivable | | | 246,191 |
| Receivable for shares of Common Stock subscribed | | 21,513 |
| Prepaid expenses | | | 23,811 |
| | | | 282,945,762 |
| Liabilities ($): | | | |
| Due to The Dreyfus Corporation and affiliates—Note 3(c) | | 308,873 |
| Payable for shares of Common Stock redeemed | | | 216,384 |
| Accrued expenses | | | 129,310 |
| | | | 654,567 |
| Net Assets ($) | | | 282,291,195 |
| Composition of Net Assets ($): | | | |
| Paid-in capital | | | 169,300,168 |
| Accumulated net realized gain (loss) on investments | | 45,728,401 |
| Accumulated net unrealized appreciation | | | |
| (depreciation) on investments | | | 67,262,626 |
| Net Assets ($) | | | 282,291,195 |
| |
| |
| Net Asset Value Per Share | | | |
| | Class A | Class C | Class I |
| Net Assets ($) | 237,657,000 | 29,097,968 | 15,536,227 |
| Shares Outstanding | 5,026,126 | 706,735 | 309,852 |
| Net Asset Value Per Share ($) | 47.28 | 41.17 | 50.14 |
| See notes to financial statements. | | | |
12
| | |
| STATEMENT OF OPERATIONS | | |
| Year Ended August 31, 2014 | | |
| |
| |
| |
| |
| Investment Income ($): | | |
| Income: | | |
| Cash dividends: | | |
| Unaffiliated issuers | 2,116,497 | |
| Affiliated issuers | 5,225 | |
| Income from securities lending—Note 1(b) | 74,161 | |
| Total Income | 2,195,883 | |
| Expenses: | | |
| Management fee—Note 3(a) | 2,086,887 | |
| Shareholder servicing costs—Note 3(c) | 1,192,831 | |
| Distribution fees—Note 3(b) | 215,218 | |
| Professional fees | 60,504 | |
| Prospectus and shareholders’ reports | 52,584 | |
| Registration fees | 43,774 | |
| Custodian fees—Note 3(c) | 19,616 | |
| Directors’ fees and expenses—Note 3(d) | 16,925 | |
| Loan commitment fees—Note 2 | 2,458 | |
| Interest expense—Note 2 | 193 | |
| Miscellaneous | 20,005 | |
| Total Expenses | 3,710,995 | |
| Less—reduction in fees due to | | |
| earnings credits—Note 3(c) | (820 | ) |
| Net Expenses | 3,710,175 | |
| Investment (Loss)—Net | (1,514,292 | ) |
| Realized and Unrealized Gain (Loss) on Investments—Note 4 ($): | | |
| Net realized gain (loss) on investments | 48,295,958 | |
| Net unrealized appreciation (depreciation) on investments | 16,132,585 | |
| Net Realized and Unrealized Gain (Loss) on Investments | 64,428,543 | |
| Net Increase in Net Assets Resulting from Operations | 62,914,251 | |
| |
| See notes to financial statements. | | |
The Fund 13
STATEMENT OF CHANGES IN NET ASSETS
| | | | |
| | Year Ended August 31, | |
| | 2014 | | 2013 | |
| Operations ($): | | | | |
| Investment (loss)—net | (1,514,292 | ) | (1,573,759 | ) |
| Net realized gain (loss) on investments | 48,295,958 | | 30,662,333 | |
| Net unrealized appreciation | | | | |
| (depreciation) on investments | 16,132,585 | | (3,379,076 | ) |
| Net Increase (Decrease) in Net Assets | | | | |
| Resulting from Operations | 62,914,251 | | 25,709,498 | |
| Dividends to Shareholders from ($): | | | | |
| Net realized gain on investments: | | | | |
| Class A | (4,509,258 | ) | — | |
| Class C | (620,269 | ) | — | |
| Class I | (286,758 | ) | — | |
| Total Dividends | (5,416,285 | ) | — | |
| Capital Stock Transactions ($): | | | | |
| Net proceeds from shares sold: | | | | |
| Class A | 19,102,013 | | 19,822,487 | |
| Class C | 2,382,762 | | 2,406,109 | |
| Class I | 6,674,792 | | 7,517,588 | |
| Dividends reinvested: | | | | |
| Class A | 4,129,324 | | — | |
| Class C | 434,422 | | — | |
| Class I | 227,245 | | — | |
| Cost of shares redeemed: | | | | |
| Class A | (46,747,539 | ) | (63,928,305 | ) |
| Class C | (4,576,460 | ) | (7,001,384 | ) |
| Class I | (6,931,430 | ) | (9,791,035 | ) |
| Increase (Decrease) in Net Assets | | | | |
| from Capital Stock Transactions | (25,304,871 | ) | (50,974,540 | ) |
| Total Increase (Decrease) in Net Assets | 32,193,095 | | (25,265,042 | ) |
| Net Assets ($): | | | | |
| Beginning of Period | 250,098,100 | | 275,363,142 | |
| End of Period | 282,291,195 | | 250,098,100 | |
| Accumulated investment (loss)—net | — | | (1,063,750 | ) |
14
| | | | |
| | Year Ended August 31, | |
| | 2014 | | 2013 | |
| Capital Share Transactions: | | | | |
| Class Aa | | | | |
| Shares sold | 435,877 | | 558,585 | |
| Shares issued for dividends reinvested | 97,597 | | — | |
| Shares redeemed | (1,072,847 | ) | (1,809,000 | ) |
| Net Increase (Decrease) in Shares Outstanding | (539,373 | ) | (1,250,415 | ) |
| Class Ca | | | | |
| Shares sold | 59,758 | | 76,596 | |
| Shares issued for dividends reinvested | 11,719 | | — | |
| Shares redeemed | (116,377 | ) | (223,036 | ) |
| Net Increase (Decrease) in Shares Outstanding | (44,900 | ) | (146,440 | ) |
| Class I | | | | |
| Shares sold | 141,822 | | 199,835 | |
| Shares issued for dividends reinvested | 5,072 | | — | |
| Shares redeemed | (146,103 | ) | (262,753 | ) |
| Net Increase (Decrease) in Shares Outstanding | 791 | | (62,918 | ) |
|
| a During the period ended August 31, 2013, 52,151 Class C shares representing $1,689,179 were exchanged for |
| 46,027 Class A shares. |
See notes to financial statements.
The Fund 15
FINANCIAL HIGHLIGHTS
The following tables describe the performance for each share class for the fiscal periods indicated. All information (except portfolio turnover rate) reflects financial results for a single fund share.Total return shows how much your investment in the fund would have increased (or decreased) during each period, assuming you had reinvested all dividends and distributions.These figures have been derived from the fund’s financial statements.
| | | | | | | | | | |
| | | | Year Ended August 31, | | | |
| Class A Shares | 2014 | | 2013 | | 2012 | | 2011 | | 2010 | |
| Per Share Data ($): | | | | | | | | | | |
| Net asset value, beginning of period | 38.16 | | 34.40 | | 29.58 | | 25.75 | | 21.63 | |
| Investment Operations: | | | | | | | | | | |
| Investment (loss)—neta | (.21 | ) | (.19 | ) | (.22 | ) | (.25 | ) | (.27 | ) |
| Net realized and unrealized | | | | | | | | | | |
| gain (loss) on investments | 10.17 | | 3.95 | | 5.04 | | 4.08 | | 4.39 | |
| Total from Investment Operations | 9.96 | | 3.76 | | 4.82 | | 3.83 | | 4.12 | |
| Distributions: | | | | | | | | | | |
| Dividends from net realized | | | | | | | | | | |
| gain on investments | (.84 | ) | — | | — | | — | | — | |
| Net asset value, end of period | 47.28 | | 38.16 | | 34.40 | | 29.58 | | 25.75 | |
| Total Return (%)b | 26.37 | | 10.93 | | 16.30 | | 14.87 | | 19.05 | |
| Ratios/Supplemental Data (%): | | | | | | | | | | |
| Ratio of total expenses | | | | | | | | | | |
| to average net assets | 1.26 | | 1.39 | | 1.45 | | 1.36 | | 1.51 | |
| Ratio of net expenses | | | | | | | | | | |
| to average net assets | 1.26 | | 1.39 | | 1.45 | | 1.36 | | 1.51 | |
| Ratio of net investment | | | | | | | | | | |
| (loss) to average net assets | (.47 | ) | (.54 | ) | (.67 | ) | (.79 | ) | (1.09 | ) |
| Portfolio Turnover Rate | 69.81 | | 54.34 | | 69.20 | | 90.28 | | 110.92 | |
| Net Assets, end of period ($ x 1,000) | 237,657 | | 212,378 | | 234,452 | | 226,016 | | 242,999 | |
| |
| a | Based on average shares outstanding. |
| b | Exclusive of sales charge. |
See notes to financial statements.
16
| | | | | | | | | | |
| | | | Year Ended August 31, | | | |
| Class C Shares | 2014 | | 2013 | | 2012 | | 2011 | | 2010 | |
| Per Share Data ($): | | | | | | | | | | |
| Net asset value, beginning of period | 33.60 | | 30.54 | | 26.48 | | 23.25 | | 19.71 | |
| Investment Operations: | | | | | | | | | | |
| Investment (loss)—neta | (.51 | ) | (.43 | ) | (.43 | ) | (.47 | ) | (.45 | ) |
| Net realized and unrealized | | | | | | | | | | |
| gain (loss) on investments | 8.92 | | 3.49 | | 4.49 | | 3.70 | | 3.99 | |
| Total from Investment Operations | 8.41 | | 3.06 | | 4.06 | | 3.23 | | 3.54 | |
| Distributions: | | | | | | | | | | |
| Dividends from net realized | | | | | | | | | | |
| gain on investments | (.84 | ) | — | | — | | — | | — | |
| Net asset value, end of period | 41.17 | | 33.60 | | 30.54 | | 26.48 | | 23.25 | |
| Total Return (%)b | 25.33 | | 10.02 | | 15.33 | | 13.89 | | 17.96 | |
| Ratios/Supplemental Data (%): | | | | | | | | | | |
| Ratio of total expenses | | | | | | | | | | |
| to average net assets | 2.10 | | 2.23 | | 2.27 | | 2.21 | | 2.44 | |
| Ratio of net expenses | | | | | | | | | | |
| to average net assets | 2.10 | | 2.23 | | 2.27 | | 2.21 | | 2.43 | |
| Ratio of net investment | | | | | | | | | | |
| (loss) to average net assets | (1.31 | ) | (1.37 | ) | (1.49 | ) | (1.63 | ) | (2.03 | ) |
| Portfolio Turnover Rate | 69.81 | | 54.34 | | 69.20 | | 90.28 | | 110.92 | |
| Net Assets, end of period ($ x 1,000) | 29,098 | | 25,253 | | 27,428 | | 27,954 | | 23,274 | |
| |
| a | Based on average shares outstanding. |
| b | Exclusive of sales charge. |
See notes to financial statements.
The Fund 17
FINANCIAL HIGHLIGHTS (continued)
| | | | | | | | | | |
| | | | Year Ended August 31, | | | |
| Class I Shares | 2014 | | 2013 | | 2012 | | 2011 | | 2010 | |
| Per Share Data ($): | | | | | | | | | | |
| Net asset value, beginning of period | 40.34 | | 36.25 | | 31.06 | | 26.94 | | 22.55 | |
| Investment Operations: | | | | | | | | | | |
| Investment (loss)—neta | (.12 | ) | (.08 | ) | (.11 | ) | (.14 | ) | (.20 | ) |
| Net realized and unrealized gain | | | | | | | | | | |
| (loss) on investments | 10.76 | | 4.17 | | 5.30 | | 4.26 | | 4.59 | |
| Total from Investment Operations | 10.64 | | 4.09 | | 5.19 | | 4.12 | | 4.39 | |
| Distributions: | | | | | | | | | | |
| Dividends from net realized | | | | | | | | | | |
| gain on investments | (.84 | ) | — | | — | | — | | — | |
| Net asset value, end of period | 50.14 | | 40.34 | | 36.25 | | 31.06 | | 26.94 | |
| Total Return (%) | 26.61 | | 11.28 | | 16.71 | | 15.30 | | 19.47 | |
| Ratios/Supplemental Data (%): | | | | | | | | | | |
| Ratio of total expenses | | | | | | | | | | |
| to average net assets | 1.05 | | 1.07 | | 1.08 | | 1.01 | | 1.19 | |
| Ratio of net expenses | | | | | | | | | | |
| to average net assets | 1.05 | | 1.07 | | 1.08 | | 1.01 | | 1.19 | |
| Ratio of net investment (loss) | | | | | | | | | | |
| to average net assets | (.26 | ) | (.22 | ) | (.32 | ) | (.42 | ) | (.76 | ) |
| Portfolio Turnover Rate | 69.81 | | 54.34 | | 69.20 | | 90.28 | | 110.92 | |
| Net Assets, end of period ($ x 1,000) | 15,536 | | 12,467 | | 13,483 | | 14,932 | | 3,782 | |
| |
| a Based on average shares outstanding. | | | | | | | | | | |
| See notes to financial statements. | | | | | | | | | | |
18
NOTES TO FINANCIAL STATEMENTS
NOTE 1—Significant Accounting Policies:
Dreyfus Technology Growth Fund (the “fund”) is a separate diversified series of Advantage Funds, Inc. (the “Company”), which is registered under the Investment Company Act of 1940, as amended (the “Act”), as an open-end management investment company and operates as a series company currently offering eleven series, including the fund. The fund’s investment objective is to seek capital appreciation. The Dreyfus Corporation (the “Manager” or “Dreyfus”), a wholly-owned subsidiary of The Bank of New York Mellon Corporation (“BNY Mellon”), serves as the fund’s investment adviser.
MBSC Securities Corporation (the “Distributor”), a wholly-owned subsidiary of the Manager, is the distributor of the fund’s shares. The fund is authorized to issue 500 million shares of $.001 par value Common Stock.The fund currently offers three classes of shares: Class A (200 million shares authorized), Class C (100 million shares authorized) and Class I (200 million shares authorized). Class A shares generally are subject to a sales charge imposed at the time of purchase. Class C shares are subject to a contingent deferred sales charge (“CDSC”) imposed on Class C shares redeemed within one year of purchase. Class I shares are sold at net asset value per share generally to institutional investors. Other differences between the classes include the services offered to and the expenses borne by each class, the allocation of certain transfer agency costs, and certain voting rights. Income, expenses (other than expenses attributable to a specific class), and realized and unrealized gains or losses on investments are allocated to each class of shares based on its relative net assets.
The Company accounts separately for the assets, liabilities and operations of each series. Expenses directly attributable to each series are charged to that series’ operations; expenses which are applicable to all series are allocated among them on a pro rata basis.
The Financial Accounting Standards Board (“FASB”) Accounting Standards Codification is the exclusive reference of authoritative U.S. generally accepted accounting principles (“GAAP”) recognized by the
The Fund 19
NOTES TO FINANCIAL STATEMENTS (continued)
FASB to be applied by nongovernmental entities. Rules and interpretive releases of the Securities and Exchange Commission (“SEC”) under authority of federal laws are also sources of authoritative GAAP for SEC registrants. The fund’s financial statements are prepared in accordance with GAAP, which may require the use of management estimates and assumptions. Actual results could differ from those estimates.
The Company enters into contracts that contain a variety of indemnifications. The fund’s maximum exposure under these arrangements is unknown.The fund does not anticipate recognizing any loss related to these arrangements.
(a) Portfolio valuation: The fair value of a financial instrument is the amount that would be received to sell an asset or paid to transfer a liability in an orderly transaction between market participants at the measurement date (i.e., the exit price). GAAP establishes a fair value hierarchy that prioritizes the inputs of valuation techniques used to measure fair value. This hierarchy gives the highest priority to unadjusted quoted prices in active markets for identical assets or liabilities (Level 1 measurements) and the lowest priority to unobservable inputs (Level 3 measurements).
Additionally, GAAP provides guidance on determining whether the volume and activity in a market has decreased significantly and whether such a decrease in activity results in transactions that are not orderly. GAAP requires enhanced disclosures around valuation inputs and techniques used during annual and interim periods.
Various inputs are used in determining the value of the fund’s investments relating to fair value measurements.These inputs are summarized in the three broad levels listed below:
Level 1—unadjusted quoted prices in active markets for identical investments.
Level 2—other significant observable inputs (including quoted prices for similar investments, interest rates, prepayment speeds, credit risk, etc.).
Level 3—significant unobservable inputs (including the fund’s own assumptions in determining the fair value of investments).
20
The inputs or methodology used for valuing securities are not necessarily an indication of the risk associated with investing in those securities.
Changes in valuation techniques may result in transfers in or out of an assigned level within the disclosure hierarchy. Valuation techniques used to value the fund’s investments are as follows:
Investments in securities are valued at the last sales price on the securities exchange or national securities market on which such securities are primarily traded. Securities listed on the National Market System for which market quotations are available are valued at the official closing price or, if there is no official closing price that day, at the last sales price. Securities not listed on an exchange or the national securities market, or securities for which there were no transactions, are valued at the average of the most recent bid and asked prices, except for open short positions, where the asked price is used for valuation purposes. Bid price is used when no asked price is available. Registered investment companies that are not traded on an exchange are valued at their net asset value. All of the preceding securities are generally categorized within Level 1 of the fair value hierarchy.
Fair valuing of securities may be determined with the assistance of a pricing service using calculations based on indices of domestic securities and other appropriate indicators, such as prices of relevant American Depository Receipts and financial futures. Utilizing these techniques may result in transfers between Level 1 and Level 2 of the fair value hierarchy.
When market quotations or official closing prices are not readily available, or are determined not to reflect accurately fair value, such as when the value of a security has been significantly affected by events after the close of the exchange or market on which the security is principally traded (for example, a foreign exchange or market), but before the fund calculates its net asset value, the fund may value these investments at fair value as determined in accordance with the procedures approved by the Company’s Board of Directors (the “Board”). Certain factors may be considered when fair valuing investments such
The Fund 21
NOTES TO FINANCIAL STATEMENTS (continued)
as: fundamental analytical data, the nature and duration of restrictions on disposition, an evaluation of the forces that influence the market in which the securities are purchased and sold, and public trading in similar securities of the issuer or comparable issuers. These securities are either categorized within Level 2 or 3 of the fair value hierarchy depending on the relevant inputs used.
The fair value of the fund’s interest in a limited partnership represents the amount that the fund could reasonably expect to receive from the limited partnership if the fund’s capital was withdrawn from the limited partnership at the time of valuation, based on information available at the time the valuation is made and that the fund believes to be reliable. The valuation utilizes financial information supplied by the limited partnership with adjustments made daily for any underlying exchange traded securities. Limited partnerships are generally categorized within Level 3 of the fair value hierarchy.
For restricted securities where observable inputs are limited, assumptions about market activity and risk are used and are generally categorized within Level 3 of the fair value hierarchy.
The following is a summary of the inputs used as of August 31, 2014 in valuing the fund’s investments:
| | | | |
| | | Level 2—Other | Level 3— | |
| | Level 1— | Significant | Significant | |
| | Unadjusted | Observable | Unobservable | |
| | Quoted Prices | Inputs | Inputs | Total |
| Assets ($) | | | | |
| Investments in Securities: | | | |
| Equity Securities— | | | | |
| Domestic | | | | |
| Common Stocks† | 253,904,201 | — | — | 253,904,201 |
| Equity Securities— | | | | |
| Foreign | | | | |
| Common Stocks† | 14,265,549 | — | — | 14,265,549 |
| Limited Partnership | | | | |
| Interests† | — | — | 621,342 | 621,342 |
| Mutual Funds | 13,850,664 | — | — | 13,850,664 |
| |
| † | See Statement of Investments for additional detailed categorizations. |
22
At August 31, 2014, there were no transfers between Level 1 and Level 2 of the fair value hierarchy.
The following is a reconciliation of Level 3 assets for which significant unobservable inputs were used to determine fair value:
| |
| | Limited Partnership |
| | Interests ($) |
| Balance as of 8/31/2013 | 548,348 |
| Purchases | — |
| Sales | — |
| Realized gain (loss) | — |
| Change in unrealized appreciation (depreciation) | 72,994 |
| Transfers into Level 3 | — |
| Transfers out of Level 3 | — |
| Balance as of 8/31/2014 | 621,342 |
| The amount of the total gains (losses) for the | |
| period included in earnings attributable to the | |
| change in unrealized gains (losses) relating to | |
| investments still held at 8/31/2014 | 72,994 |
(b) Securities transactions and investment income: Securities transactions are recorded on a trade date basis. Realized gains and losses from securities transactions are recorded on the identified cost basis. Dividend income is recognized on the ex-dividend date and interest income, including, where applicable, accretion of discount and amortization of premium on investments, is recognized on the accrual basis.
Pursuant to a securities lending agreement with The Bank of NewYork Mellon, a subsidiary of BNY Mellon and an affiliate of Dreyfus, the fund may lend securities to qualified institutions. It is the fund’s policy that, at origination, all loans are secured by collateral of at least 102% of the value of U.S. securities loaned and 105% of the value of foreign securities loaned. Collateral equivalent to at least 100% of the market value of securities on loan is maintained at all times. Collateral is either in the form of cash, which can be invested in certain money market mutual funds managed by the Manager or U.S. Government and Agency securities.The fund is entitled to receive all dividends, interest
The Fund 23
NOTES TO FINANCIAL STATEMENTS (continued)
and distributions on securities loaned, in addition to income earned as a result of the lending transaction. Should a borrower fail to return the securities in a timely manner, The Bank of New York Mellon is required to replace the securities for the benefit of the fund or credit the fund with the market value of the unreturned securities and is subrogated to the fund’s rights against the borrower and the collateral. During the period ended August 31, 2014, The Bank of New York Mellon earned $22,972 from lending portfolio securities, pursuant to the securities lending agreement.
(c) Affiliated issuers: Investments in other investment companies advised by Dreyfus are defined as “affiliated” under the Act. Investments in affiliated investment companies during the period ended August 31, 2014 were as follows:
| | | | | |
| Affiliated | | | | | |
| Investment | Value | | | Value | Net |
| Company | 8/31/2013 ($) | Purchases ($) | Sales ($) | 8/31/2014 ($) | Assets (%) |
| Dreyfus | | | | | |
| Institutional | | | | | |
| Preferred | | | | | |
| Plus Money | | | | | |
| Market Fund | 3,085,877 | 132,212,747 | 121,447,960 | 13,850,664 | 4.9 |
| Dreyfus | | | | | |
| Institutional | | | | | |
| Cash | | | | | |
| Advantage | | | | | |
| Fund | — | 38,294,553 | 38,294,553 | — | — |
| Total | 3,085,877 | 170,507,300 | 159,742,513 | 13,850,664 | 4.9 |
(d) Dividends to shareholders: Dividends are recorded on the ex-dividend date. Dividends from investment income-net and dividends from net realized capital gains, if any, are normally declared and paid annually, but the fund may make distributions on a more frequent basis to comply with the distribution requirements of the Internal Revenue Code of 1986, as amended (the “Code”). To the extent that net realized capital gains can be offset by capital loss carryovers, it is the policy of the fund not to distribute such gains. Income and capital gain distributions are determined in accordance with income tax regulations, which may differ from GAAP.
24
(e) Federal income taxes: It is the policy of the fund to continue to qualify as a regulated investment company, if such qualification is in the best interests of its shareholders, by complying with the applicable provisions of the Code, and to make distributions of taxable income sufficient to relieve it from substantially all federal income and excise taxes.
As of and during the period ended August 31, 2014, the fund did not have any liabilities for any uncertain tax positions. The fund recognizes interest and penalties, if any, related to uncertain tax positions as income tax expense in the Statement of Operations. During the period ended August 31, 2014, the fund did not incur any interest or penalties.
Each tax year in the four-year period ended August 31, 2014 remains subject to examination by the Internal Revenue Service and state taxing authorities.
At August 31, 2014, the components of accumulated earnings on a tax basis were as follows: undistributed ordinary income $7,066,675, undistributed capital gains $38,711,257 and unrealized appreciation $67,213,095.
The tax character of distributions paid to shareholders during the fiscal periods ended August 31, 2014 and August 31, 2013 were as follows: long-term capital gains $5,416,285 and $0, respectively.
During the period ended August 31, 2014, as a result of permanent book to tax differences, primarily due to the tax treatment for net operating losses and limited partnerships, the fund increased accumulated undistributed investment income-net by $2,578,042, decreased accumulated net realized gain (loss) on investments by $2,505,420 and decreased paid-in capital by $72,622. Net assets and net asset value per share were not affected by this reclassification.
NOTE 2—Bank Lines of Credit:
The fund participates with other Dreyfus-managed funds in a $265 million unsecured credit facility led by Citibank, N.A. and a $300 mil-
The Fund 25
NOTES TO FINANCIAL STATEMENTS (continued)
lion unsecured credit facility provided by The Bank of New York Mellon (each a “Facility”), each to be utilized primarily for temporary or emergency purposes, including the financing of redemptions. Prior to October 9, 2013, the unsecured credit facility with Citibank, N.A. was $210 million. In connection therewith, the fund has agreed to pay its pro rata portion of commitment fees for each Facility. Interest is charged to the fund based on rates determined pursuant to the terms of the respective Facility at the time of borrowing.
The average amount of borrowings outstanding under the Facilities during the period ended August 31, 2014 was approximately $17,300 with a related weighted average annualized interest rate of 1.12%.
NOTE 3—Management Fee and Other Transactions with Affiliates:
(a) Pursuant to a management agreement with the Manager, the management fee is computed at the annual rate of .75% of the value of the fund’s average daily net assets and is payable monthly.
During the period ended August 31, 2014, the Distributor retained $9,372 from commissions earned on sales of the fund’s Class A shares and $219 from CDSCs on redemptions of the fund’s Class C shares.
(b) Under the Distribution Plan adopted pursuant to Rule 12b-1 under the Act, Class C shares pay the Distributor for distributing its shares at an annual rate of .75% of the value of its average daily net assets. During the period ended August 31, 2014, Class C shares were charged $215,218 pursuant to the Distribution Plan.
(c) Under the Shareholder Services Plan, Class A and Class C shares pay the Distributor at an annual rate of .25% of the value of their average daily net assets for the provision of certain services. The services provided may include personal services relating to shareholder accounts, such as answering shareholder inquiries regarding the fund and providing reports and other information, and services related to the maintenance of shareholder accounts. The Distributor may make payments to Service Agents (securities dealers, financial institutions or
26
other industry professionals) with respect to these services. The Distributor determines the amounts to be paid to Service Agents. During the period ended August 31, 2014, Class A and Class C shares were charged $586,730 and $71,740, respectively, pursuant to the Shareholder Services Plan.
The fund has arrangements with the transfer agent and the custodian whereby the fund may receive earnings credits when positive cash balances are maintained, which are used to offset transfer agency and custody fees. For financial reporting purposes, the fund includes net earnings credits as an expense offset in the Statement of Operations.
The fund compensates Dreyfus Transfer, Inc., a wholly-owned subsidiary of the Manager, under a transfer agency agreement for providing transfer agency and cash management services for the fund. The majority of transfer agency fees are comprised of amounts paid on a per account basis, while cash management fees are related to fund subscriptions and redemptions. During the period ended August 31, 2014, the fund was charged $159,557 for transfer agency services and $11,071 for cash management services. These fees are included in Shareholder servicing costs in the Statement of Operations. Cash management fees were partially offset by earnings credits of $819.
The fund compensates The Bank of NewYork Mellon under a custody agreement for providing custodial services for the fund.These fees are determined based on net assets, geographic region and transaction activity. During the period ended August 31, 2014, the fund was charged $19,616 pursuant to the custody agreement.
The fund compensated The Bank of New York Mellon under a cash management agreement that was in effect until September 30, 2013 for performing certain cash management services related to fund subscriptions and redemptions. During the period ended August 31, 2014, the fund was charged $296 pursuant to the cash management agreement, which is included in Shareholder servicing costs in the Statement of Operations.These fees were partially offset by earnings credits of $1.
The Fund 27
NOTES TO FINANCIAL STATEMENTS (continued)
During the period ended August 31, 2014, the fund was charged $8,296 for services performed by the Chief Compliance Officer and his staff.
The components of “Due to The Dreyfus Corporation and affiliates” in the Statement of Assets and Liabilities consist of: management fees $177,431, Distribution Plan fees $18,301, Shareholder Services Plan fees $55,940, custodian fees $8,782, Chief Compliance Officer fees $1,154 and transfer agency fees $47,265.
(d) Each Board member also serves as a Board member of other funds within the Dreyfus complex. Annual retainer fees and attendance fees are allocated to each fund based on net assets.
NOTE 4—Securities Transactions:
The aggregate amount of purchases and sales of investment securities, excluding short-term securities, during the period ended August 31, 2014 amounted to $187,813,109 and $228,658,564, respectively.
At August 31, 2014, the cost of investments for federal income tax purposes was $215,428,661; accordingly, accumulated net unrealized appreciation on investments was $67,213,095, consisting of $69,764,701 gross unrealized appreciation and $2,551,606 gross unrealized depreciation.
28
|
| REPORT OF INDEPENDENT REGISTERED |
| PUBLIC ACCOUNTING FIRM |
Shareholders and Board of Directors
Dreyfus Technology Growth Fund
We have audited the accompanying statement of assets and liabilities, including the statement of investments, of Dreyfus Technology Growth Fund (one of the series comprising Advantage Funds, Inc.) as of August 31, 2014, and the related statement of operations for the year then ended, the statement of changes in net assets for each of the two years in the period then ended, and the financial highlights for each of the five years in the period then ended.These financial statements and financial highlights are the responsibility of the Fund’s management. Our responsibility is to express an opinion on these financial statements and financial highlights based on our audits.
We conducted our audits in accordance with the standards of the Public Company Accounting Oversight Board (United States).Those standards require that we plan and perform the audit to obtain reasonable assurance about whether the financial statements and financial highlights are free of material misstatement. We were not engaged to perform an audit of the Fund’s internal control over financial reporting. Our audits included consideration of internal control over financial reporting as a basis for designing audit procedures that are appropriate in the circumstances, but not for the purpose of expressing an opinion on the effectiveness of the Fund’s internal control over financial reporting. Accordingly, we express no such opinion. An audit also includes examining, on a test basis, evidence supporting the amounts and disclosures in the financial statements and financial highlights, assessing the accounting principles used and significant estimates made by management, and evaluating the overall financial statement presentation. Our procedures included confirmation of securities owned as of August 31, 2014 by correspondence with the custodian and others.We believe that our audits provide a reasonable basis for our opinion.
In our opinion, the financial statements and financial highlights referred to above present fairly, in all material respects, the financial position of Dreyfus Technology Growth Fund at August 31, 2014, the results of its operations for the year then ended, the changes in its net assets for each of the two years in the period then ended, and the financial highlights for each of the five years in the period then ended, in conformity with U.S. generally accepted accounting principles.

|
| New York, New York |
| October 28, 2014 |
The Fund 29
IMPORTANT TAX INFORMATION (Unaudited)
For federal tax purposes, the fund hereby reports $.8369 per share as a long-term capital gain distribution paid on December 4, 2013.
30
|
| INFORMATION ABOUT THE RENEWAL OF THE |
| FUND’S MANAGEMENT AGREEMENT (Unaudited) |
At a meeting of the fund’s Board of Directors held on March 4-5, 2014, the Board considered the renewal of the fund’s Management Agreement pursuant to which Dreyfus provides the fund with investment advisory and administrative services (the “Agreement”). The Board members, none of whom are “interested persons” (as defined in the Investment Company Act of 1940, as amended) of the fund, were assisted in their review by independent legal counsel and met with counsel in executive session separate from Dreyfus representatives. In considering the renewal of the Agreement, the Board considered all factors that it believed to be relevant, including those discussed below.The Board did not identify any one factor as dispositive, and each Board member may have attributed different weights to the factors considered.
Analysis of Nature, Extent, and Quality of Services Provided to the Fund. The Board considered information provided to them at the meeting and in previous presentations from Dreyfus representatives regarding the nature, extent, and quality of the services provided to funds in the Dreyfus fund complex. Dreyfus provided the number of open accounts in the fund, the fund’s asset size and the allocation of fund assets among distribution channels. Dreyfus also had previously provided information regarding the diverse intermediary relationships and distribution channels of funds in the Dreyfus fund complex (such as retail direct or intermediary, in which intermediaries typically are paid by the fund and/or Dreyfus) and Dreyfus’ corresponding need for broad, deep, and diverse resources to be able to provide ongoing shareholder services to each intermediary or distribution channel, as applicable to the fund.
The Board also considered research support available to, and portfolio management capabilities of, the fund’s portfolio management personnel and that Dreyfus also provides oversight of day-to-day fund operations, including fund accounting and administration and assistance in meeting legal and regulatory requirements. The Board also considered Dreyfus’ extensive administrative, accounting, and compliance infrastructures. The Board also considered portfolio management’s brokerage policies and practices (including policies and practices regarding soft dollars) and the standards applied in seeking best execution.
The Fund 31
|
| INFORMATION ABOUT THE RENEWAL OF THE FUND’S |
| MANAGEMENT AGREEMENT (Unaudited) (continued) |
Comparative Analysis of the Fund’s Performance and Management Fee and Expense Ratio. The Board reviewed reports prepared by Lipper, Inc. (“Lipper”), an independent provider of investment company data, which included information comparing (1) the fund’s performance with the performance of a group of comparable funds (the “Performance Group”) and with a broader group of funds (the “Performance Universe”), all for various periods ended December 31, 2013, and (2) the fund’s actual and contractual management fees and total expenses with those of a group of comparable funds (the “Expense Group”) and with a broader group of funds (the “Expense Universe”), the information for which was derived in part from fund financial statements available to Lipper as of the date of its analysis. Dreyfus previously had furnished the Board with a description of the methodology Lipper used to select the Performance Group and Performance Universe and the Expense Group and Expense Universe.
Dreyfus representatives stated that the usefulness of performance comparisons may be affected by a number of factors, including different investment limitations that may be applicable to the fund and comparison funds. The Board discussed the results of the comparisons and noted that the fund’s total return performance was variously above and below the Performance Group and Performance Universe medians. Dreyfus also provided a comparison of the fund’s calendar year total returns to the returns of the fund’s benchmark index.
The Board also reviewed the range of actual and contractual management fees and total expenses of the Expense Group and Expense Universe funds and discussed the results of the comparisons.The Board noted that the fund’s contractual management fee was below the Expense Group median and the fund’s actual management fee and total expenses were below the Expense Group and Expense Universe medians.
Dreyfus representatives reviewed with the Board the management or investment advisory fees (1) paid by funds advised or administered by Dreyfus that are in the same Lipper category as the fund and (2) paid to Dreyfus or the Dreyfus-affiliated primary employer of the fund’s pri-
32
mary portfolio manager(s) for advising any separate accounts and/or other types of client portfolios that are considered to have similar investment strategies and policies as the fund (the “Similar Clients”), and explained the nature of the Similar Clients. They discussed differences in fees paid and the relationship of the fees paid in light of any differences in the services provided and other relevant factors. The Board considered the relevance of the fee information provided for the Similar Clients to evaluate the appropriateness and reasonableness of the fund’s management fee.
Analysis of Profitability and Economies of Scale. Dreyfus representatives reviewed the expenses allocated and profit received by Dreyfus and the resulting profitability percentage for managing the fund and the aggregate profitability percentage to Dreyfus of managing the funds in the Dreyfus fund complex, and the method used to determine the expenses and profit. The Board concluded that the profitability results were not unreasonable, given the services rendered and service levels provided by Dreyfus. The Board also had been provided with information prepared by an independent consulting firm regarding Dreyfus’ approach to allocating costs to, and determining the profitability of, individual funds and the entire Dreyfus fund complex.The consulting firm also had analyzed where any economies of scale might emerge in connection with the management of a fund.
The Board considered on the advice of its counsel the profitability analysis (1) as part of its evaluation of whether the fees under the Agreement bear a reasonable relationship to the mix of services provided by Dreyfus, including the nature, extent and quality of such services, and (2) in light of the relevant circumstances for the fund and the extent to which economies of scale would be realized if the fund grows and whether fee levels reflect these economies of scale for the benefit of fund shareholders. Dreyfus representatives also noted that, as a result of shared and allocated costs among funds in the Dreyfus fund complex, the extent of economies of scale could depend substantially on the level of assets in the complex as a whole, so that increases and decreases in complex-wide assets can
The Fund 33
|
| INFORMATION ABOUT THE RENEWAL OF THE FUND’S |
| MANAGEMENT AGREEMENT (Unaudited) (continued) |
affect potential economies of scale in a manner that is disproportionate to, or even in the opposite direction from, changes in the fund’s asset level.The Board also considered potential benefits to Dreyfus from acting as investment adviser and noted the soft dollar arrangements in effect for trading the fund’s investments.
At the conclusion of these discussions, the Board agreed that it had been furnished with sufficient information to make an informed business decision with respect to the renewal of the Agreement. Based on the discussions and considerations as described above, the Board concluded and determined as follows.
The Board concluded that the nature, extent and quality of the services provided by Dreyfus are adequate and appropriate.
The Board generally was satisfied with the fund’s overall performance.
The Board concluded that the fee paid to Dreyfus was reasonable in light of the considerations described above.
The Board determined that the economies of scale which may accrue to Dreyfus and its affiliates in connection with the management of the fund had been adequately considered by Dreyfus in connection with the fee rate charged to the fund pursuant to the Agreement and that, to the extent in the future it were determined that material economies of scale had not been shared with the fund, the Board would seek to have those economies of scale shared with the fund.
In evaluating the Agreement, the Board considered these conclusions and determinations and also relied on its previous knowledge, gained through meetings and other interactions with Dreyfus and its affiliates, of the fund and the services provided to the fund by Dreyfus. The Board also relied on information received on a routine and regular basis throughout the year relating to the operations of the fund and the investment management and other services provided under the
34
Agreement, including information on the investment performance of the fund in comparison to similar mutual funds and benchmark performance indices; general market outlook as applicable to the fund; and compliance reports. In addition, the Board’s consideration of the contractual fee arrangements for this fund had the benefit of a number of years of reviews of prior or similar agreements during which lengthy discussions took place between the Board and Dreyfus representatives. Certain aspects of the arrangements may receive greater scrutiny in some years than in others, and the Board’s conclusions may be based, in part, on their consideration of the same or similar arrangements in prior years. The Board determined that renewal of the Agreement was in the best interests of the fund and its shareholders.
The Fund 35
|
| BOARD MEMBERS INFORMATION (Unaudited) |
| INDEPENDENT BOARD MEMBERS |
|
| Joseph S. DiMartino (70) |
| Chairman of the Board (1995) |
| Principal Occupation During Past 5Years: |
| • Corporate Director and Trustee (1995-present) |
| Other Public Company Board Memberships During Past 5Years: |
| • CBIZ (formerly, Century Business Services, Inc.), a provider of outsourcing functions for small |
| and medium size companies, Director (1997-present) |
| • The Newark Group, a provider of a national market of paper recovery facilities, paperboard mills |
| and paperboard converting plants, Director (2000-2010) |
| • Sunair Services Corporation, a provider of certain outdoor-related services to homes and |
| businesses, Director (2005-2009) |
| No. of Portfolios for which Board Member Serves: 142 |
| ——————— |
| Peggy C. Davis (71) |
| Board Member (2006) |
| Principal Occupation During Past 5Years: |
| • Shad Professor of Law, New York University School of Law (1983-present) |
| No. of Portfolios for which Board Member Serves: 52 |
| ——————— |
| David P. Feldman (74) |
| Board Member (1996) |
| Principal Occupation During Past 5Years: |
| • Corporate Director and Trustee (1985-present) |
| Other Public Company Board Membership During Past 5Years: |
| • BBH Mutual Funds Group (5 registered mutual funds), Director (1992-present) |
| No. of Portfolios for which Board Member Serves: 38 |
| ——————— |
| Ehud Houminer (74) |
| Board Member (1993) |
| Principal Occupation During Past 5Years: |
| • Executive-in-Residence at the Columbia Business School, Columbia University (1992-present) |
| Other Public Company Board Membership During Past 5Years: |
| • Avnet Inc., an electronics distributor, Director (1993-2012) |
| No. of Portfolios for which Board Member Serves: 62 |
36
|
| Lynn Martin (74) |
| Board Member (2012) |
| Principal Occupation During Past 5Years: |
| • President of The Martin Hall Group LLC, a human resources consulting firm (2005-2012) |
| Other Public Company Board Memberships During Past 5Years: |
| • AT&T Inc., a telecommunications company, Director (1999-2012) |
| • Ryder System, Inc., a supply chain and transportation management company, Director (1993-2012) |
| • The Proctor & Gamble Co., a consumer products company, Director (1994-2009) |
| • Constellation Energy Group Inc., Director (2003-2009) |
| No. of Portfolios for which Board Member Serves: 38 |
| ——————— |
| Robin A. Melvin (50) |
| Board Member (2012) |
| Principal Occupation During Past 5Years: |
| • Board Member, Illinois Mentoring Partnership, non-profit organization dedicated to increasing |
| the quantity and quality of mentoring services in Illinois (2013-present) |
| • Director, Boisi Family Foundation, a private family foundation that supports youth-serving orga- |
| nizations that promote the self sufficiency of youth from disadvantaged circumstances (1995-2012) |
| No. of Portfolios for which Board Member Serves: 109 |
| ——————— |
| Dr. Martin Peretz (75) |
| Board Member (2006) |
| Principal Occupation During Past 5Years: |
| • Editor-in-Chief Emeritus of The New Republic Magazine (2010-2011) (previously, |
| Editor-in-Chief, 1974-2010) |
| • Director of TheStreet.com, a financial information service on the web (1996-2010) |
| No. of Portfolios for which Board Member Serves: 38 |
| ——————— |
Once elected all Board Members serve for an indefinite term, but achieve Emeritus status upon reaching age 80.The address of the Board Members and Officers is c/o The Dreyfus Corporation, 200 Park Avenue, New York, New York 10166. Additional information about the Board Members is available in the fund’s Statement of Additional Information which can be obtained from Dreyfus free of charge by calling this toll free number: 1-800-DREYFUS.
James F. Henry, Emeritus Board Member
Dr. Paul A. Marks, Emeritus Board Member
Philip L.Toia, Emeritus Board Member
The Fund 37
OFFICERS OF THE FUND (Unaudited)
BRADLEY J. SKAPYAK, President since January 2010.
Chief Operating Officer and a director of the Manager since June 2009, Chairman of Dreyfus Transfer, Inc., an affiliate of the Manager and the transfer agent of the funds, since May 2011 and Executive Vice President of the Distributor since June 2007. From April 2003 to June 2009, Mr. Skapyak was the head of the Investment Accounting and Support Department of the Manager. He is an officer of 69 investment companies (comprised of 142 portfolios) managed by the Manager. He is 55 years old and has been an employee of the Manager since February 1988.
JOHN PAK, Chief Legal Officer since March 2013.
Deputy General Counsel, Investment Management, of BNY Mellon since August 2014; Chief Legal Officer of the Manager since August 2012; from March 2005 to July 2012, Managing Director of Deutsche Bank, Deputy Global Head of Deutsche Asset Management Legal and Regional Head of Deutsche Asset Management Americas Legal. He is an officer of 70 investment companies (comprised of 167 portfolios) managed by the Manager. He is 45 years old and has been an employee of the Manager since August 2012.
JANETTE E. FARRAGHER, Vice President and Secretary since December 2011.
Assistant General Counsel of BNY Mellon, and an officer of 70 investment companies (comprised of 167 portfolios) managed by the Manager. She is 51 years old and has been an employee of the Manager since February 1984.
KIESHA ASTWOOD, Vice President and Assistant Secretary since January 2010.
Counsel of BNY Mellon, and an officer of 70 investment companies (comprised of 167 portfolios) managed by the Manager. She is 41 years old and has been an employee of the Manager since July 1995.
JAMES BITETTO, Vice President and Assistant Secretary since August 2005.
Managing Counsel of BNY Mellon and Secretary of the Manager, and an officer of 70 investment companies (comprised of 167 portfolios) managed by the Manager. He is 48 years old and has been an employee of the Manager since December 1996.
JONI LACKS CHARATAN, Vice President and Assistant Secretary since August 2005.
Managing Counsel of BNY Mellon, and an officer of 70 investment companies (comprised of 167 portfolios) managed by the Manager. She is 58 years old and has been an employee of the Manager since October 1988.
JOSEPH M. CHIOFFI, Vice President and Assistant Secretary since August 2005.
Managing Counsel of BNY Mellon, and an officer of 70 investment companies (comprised of 167 portfolios) managed by the Manager. He is 52 years old and has been an employee of the Manager since June 2000.
JOHN B. HAMMALIAN, Vice President and Assistant Secretary since August 2005.
Senior Managing Counsel of BNY Mellon, and an officer of 70 investment companies (comprised of 167 portfolios) managed by the Manager. He is 51 years old and has been an employee of the Manager since February 1991.
SARAH S. KELLEHER, Vice President and Assistant Secretary since April 2014.
Senior Counsel of BNY Mellon, and an officer of 70 investment companies (comprised of 167 portfolios) managed by the Manager; from August 2005 to March 2013, Associate General Counsel of Third Avenue Management. She is 38 years old and has been an employee of the Manager since March 2013.
38
JEFF PRUSNOFSKY, Vice President and Assistant Secretary since August 2005.
Senior Managing Counsel of BNY Mellon, and an officer of 70 investment companies (comprised of 167 portfolios) managed by the Manager. He is 49 years old and has been an employee of the Manager since October 1990.
JAMES WINDELS, Treasurer since November 2001.
Director – Mutual Fund Accounting of the Manager, and an officer of 70 investment companies (comprised of 167 portfolios) managed by the Manager. He is 55 years old and has been an employee of the Manager since April 1985.
RICHARD CASSARO, Assistant Treasurer since January 2008.
Senior Accounting Manager – Money Market and Municipal Bond Funds of the Manager, and an officer of 70 investment companies (comprised of 167 portfolios) managed by the Manager. He is 55 years old and has been an employee of the Manager since September 1982.
GAVIN C. REILLY, Assistant Treasurer since December 2005.
Tax Manager of the Investment Accounting and Support Department of the Manager, and an officer of 70 investment companies (comprised of 167 portfolios) managed by the Manager. He is 46 years old and has been an employee of the Manager since April 1991.
ROBERT S. ROBOL, Assistant Treasurer since August 2005.
Senior Accounting Manager – Fixed Income Funds of the Manager, and an officer of 70 investment companies (comprised of 167 portfolios) managed by the Manager. He is 50 years old and has been an employee of the Manager since October 1988.
ROBERT SALVIOLO, Assistant Treasurer since July 2007.
Senior Accounting Manager – Equity Funds of the Manager, and an officer of 70 investment companies (comprised of 167 portfolios) managed by the Manager. He is 47 years old and has been an employee of the Manager since June 1989.
ROBERT SVAGNA, Assistant Treasurer since December 2002.
Senior Accounting Manager – Equity Funds of the Manager, and an officer of 70 investment companies (comprised of 167 portfolios) managed by the Manager. He is 47 years old and has been an employee of the Manager since November 1990.
JOSEPH W. CONNOLLY, Chief Compliance Officer since October 2004.
Chief Compliance Officer of the Manager and The Dreyfus Family of Funds (70 investment companies, comprised of 167 portfolios). He is 57 years old and has served in various capacities with the Manager since 1980, including manager of the firm’s Fund Accounting Department from 1997 through October 2001.
MATTHEW D. CONNOLLY, Anti-Money Laundering Compliance Officer since April 2012.
Anti-Money Laundering Compliance Officer of the Distributor since October 2011; from March 2010 to September 2011, Global Head, KYC Reviews and Director of UBS Investment Bank; until March 2010, AML Compliance Officer and Senior Vice President of Citi Global Wealth Management. He is an officer of 65 investment companies (comprised of 162 portfolios) managed by the Manager. He is 42 years old and has been an employee of the Distributor since October 2011.
The Fund 39
For More Information
Telephone Call your financial representative or 1-800-DREYFUS
Mail The Dreyfus Family of Funds, 144 Glenn Curtiss Boulevard, Uniondale, NY 11556-0144
The fund files its complete schedule of portfolio holdings with the Securities and Exchange Commission (“SEC”) for the first and third quarters of each fiscal year on Form N-Q. The fund’s Forms N-Q are available on the SEC’s website at http://www.sec.gov and may be reviewed and copied at the SEC’s Public Reference Room in Washington, DC. Information on the operation of the Public Reference Room may be obtained by calling 1-800-SEC-0330.
A description of the policies and procedures that the fund uses to determine how to vote proxies relating to portfolio securities, and information regarding how the fund voted these proxies for the most recent 12-month period ended June 30 is available at http://www.dreyfus.com and on the SEC’s website at http://www.sec.gov. The description of the policies and procedures is also available without charge, upon request, by calling 1-800-DREYFUS.

Item 2. Code of Ethics.
The Registrant has adopted a code of ethics that applies to the Registrant's principal executive officer, principal financial officer, principal accounting officer or controller, or persons performing similar functions. There have been no amendments to, or waivers in connection with, the Code of Ethics during the period covered by this Report.
Item 3. Audit Committee Financial Expert.
The Registrant's Board has determined that Mr. David P. Feldman, a member of the Audit Committee of the Board, is an audit committee financial expert as defined by the Securities and Exchange Commission (the "SEC"). Mr. Feldman is "independent" as defined by the SEC for purposes of audit committee financial expert determinations.
Item 4. Principal Accountant Fees and Services.
(a) Audit Fees. The aggregate fees billed for each of the last two fiscal years (the "Reporting Periods") for professional services rendered by the Registrant's principal accountant (the "Auditor") for the audit of the Registrant's annual financial statements or services that are normally provided by the Auditor in connection with the statutory and regulatory filings or engagements for the Reporting Periods, were $232,140 in 2013 and $236,784 in 2014.
(b) Audit-Related Fees. The aggregate fees billed in the Reporting Periods for assurance and related services by the Auditor that are reasonably related to the performance of the audit of the Registrant's financial statements and are not reported under paragraph (a) of this Item 4 were $46,601 in 2013 and $84,840 in 2014. These services consisted of one or more of the following: (i) agreed upon procedures related to compliance with Internal Revenue Code section 817(h), (ii) security counts required by Rule 17f-2 under the Investment Company Act of 1940, as amended, (iii) advisory services as to the accounting or disclosure treatment of Registrant transactions or events and (iv) advisory services to the accounting or disclosure treatment of the actual or potential impact to the Registrant of final or proposed rules, standards or interpretations by the Securities and Exchange Commission, the Financial Accounting Standards Boards or other regulatory or standard-setting bodies.
The aggregate fees billed in the Reporting Periods for non-audit assurance and related services by the Auditor to the Registrant's investment adviser (not including any sub-investment adviser whose role is primarily portfolio management and is subcontracted with or overseen by another investment adviser), and any entity controlling, controlled by or under common control with the investment adviser that provides ongoing services to the Registrant ("Service Affiliates"), that were reasonably related to the performance of the annual audit of the Service Affiliate, which required pre-approval by the Audit Committee were $0 in 2013 and $0 in 2014.
(c) Tax Fees. The aggregate fees billed in the Reporting Periods for professional services rendered by the Auditor for tax compliance, tax advice, and tax planning ("Tax Services") were $30,359 in 2013 and $26,820 in 2014. These services consisted of: (i) review or preparation of U.S. federal, state, local and excise tax returns; (ii) U.S. federal, state and local tax planning, advice and assistance regarding statutory, regulatory or administrative developments; (iii) tax advice regarding tax qualification matters and/or treatment of various financial instruments held or proposed to be acquired or held, and (iv) determination of Passive Foreign Investment Companies. The aggregate fees billed in the Reporting Periods for Tax Services by the Auditor to Service Affiliates, which required pre-approval by the Audit Committee were $0 in 2013 and $0 in 2014.
(d) All Other Fees. The aggregate fees billed in the Reporting Periods for products and services provided by the Auditor, other than the services reported in paragraphs (a) through (c) of this Item, were $6,777 in 2013 and $3,828 in 2014. [These services included a review of the Registrant's anti-money laundering program].
The aggregate fees billed in the Reporting Periods for Non-Audit Services by the Auditor to Service Affiliates, other than the services reported in paragraphs (b) through (c) of this Item, which required pre-approval by the Audit Committee, were $$0 in 2013 and $0 in 2014.
(e)(1) Audit Committee Pre-Approval Policies and Procedures. The Registrant's Audit Committee has established policies and procedures (the "Policy") for pre-approval (within specified fee limits) of the Auditor's engagements for non-audit services to the Registrant and Service Affiliates without specific case-by-case consideration. The pre-approved services in the Policy can include pre-approved audit services, pre-approved audit-related services, pre-approved tax services and pre-approved all other services. Pre-approval considerations include whether the proposed services are compatible with maintaining the Auditor's independence. Pre-approvals pursuant to the Policy are considered annually.
(e)(2) Note: None of the services described in paragraphs (b) through (d) of this Item 4 were approved by the Audit Committee pursuant to paragraph (c)(7)(i)(C) of Rule 2-01 of Regulation S-X.
(f) None of the hours expended on the principal accountant's engagement to audit the registrant's financial statements for the most recent fiscal year were attributed to work performed by persons other than the principal account's full-time, permanent employees.
Non-Audit Fees. The aggregate non-audit fees billed by the Auditor for services rendered to the Registrant, and rendered to Service Affiliates, for the Reporting Periods were $51,569,616 in 2013 and $32,746,283 in 2014.
Auditor Independence. The Registrant's Audit Committee has considered whether the provision of non-audit services that were rendered to Service Affiliates, which were not pre-approved (not requiring pre-approval), is compatible with maintaining the Auditor's independence.
Item 5. Audit Committee of Listed Registrants.
Not applicable. [CLOSED-END FUNDS ONLY]
Item 6. Investments.
(a) Not applicable.
Item 7. Disclosure of Proxy Voting Policies and Procedures for Closed-End Management Investment Companies.
Not applicable. [CLOSED-END FUNDS ONLY]
Item 8. Portfolio Managers of Closed-End Management Investment Companies.
Not applicable. [CLOSED-END FUNDS ONLY, beginning with reports for periods ended on and after December 31, 2005]
Item 9. Purchases of Equity Securities by Closed-End Management Investment Companies and Affiliated Purchasers.
Not applicable. [CLOSED-END FUNDS ONLY]
Item 10. Submission of Matters to a Vote of Security Holders.
There have been no material changes to the procedures applicable to Item 10.
Item 11. �� Controls and Procedures.
(a) The Registrant's principal executive and principal financial officers have concluded, based on their evaluation of the Registrant's disclosure controls and procedures as of a date within 90 days of the filing date of this report, that the Registrant's disclosure controls and procedures are reasonably designed to ensure that information required to be disclosed by the Registrant on Form N-CSR is recorded, processed, summarized and reported within the required time periods and that information required to be disclosed by the Registrant in the reports that it files or submits on Form N-CSR is accumulated and communicated to the Registrant's management, including its principal executive and principal financial officers, as appropriate to allow timely decisions regarding required disclosure.
(b) There were no changes to the Registrant's internal control over financial reporting that occurred during the second fiscal quarter of the period covered by this report that have materially affected, or are reasonably likely to materially affect, the Registrant's internal control over financial reporting.
Item 12. Exhibits.
(a)(1) Code of ethics referred to in Item 2.
(a)(2) Certifications of principal executive and principal financial officers as required by Rule 30a-2(a) under the Investment Company Act of 1940.
(a)(3) Not applicable.
(b) Certification of principal executive and principal financial officers as required by Rule 30a-2(b) under the Investment Company Act of 1940.
SIGNATURES
Pursuant to the requirements of the Securities Exchange Act of 1934 and the Investment Company Act of 1940, the Registrant has duly caused this Report to be signed on its behalf by the undersigned, thereunto duly authorized.
Advantage Funds, Inc.
By: /s/Bradley J. Skapyak
Bradley J. Skapyak,
President
Date: October 23, 2014
Pursuant to the requirements of the Securities Exchange Act of 1934 and the Investment Company Act of 1940, this Report has been signed below by the following persons on behalf of the Registrant and in the capacities and on the dates indicated.
By: /s/Bradley J. Skapyak
Bradley J. Skapyak,
President
Date: October 23, 2014
By: /s/James Windels
James Windels,
Treasurer
Date: October 23, 2014
EXHIBIT INDEX
(a)(1) Code of ethics referred to in Item 2.
(a)(2) Certifications of principal executive and principal financial officers as required by Rule 30a-2(a) under the Investment Company Act of 1940. (EX-99.CERT)
(b) Certification of principal executive and principal financial officers as required by Rule 30a-2(b) under the Investment Company Act of 1940. (EX-99.906CERT)