UNITED STATES
SECURITIES AND EXCHANGE COMMISSION
Washington, D.C. 20549
FORM N-CSR
CERTIFIED SHAREHOLDER REPORT OF REGISTERED MANAGEMENT
INVESTMENT COMPANIES
Investment Company Act file number | 811-7123 |
| |
| Advantage Funds, Inc. | |
| (Exact name of Registrant as specified in charter) | |
| | |
| c/o The Dreyfus Corporation 200 Park Avenue New York, New York 10166 | |
| (Address of principal executive offices) (Zip code) | |
| | |
| John Pak, Esq. 200 Park Avenue New York, New York 10166 | |
| (Name and address of agent for service) | |
|
Registrant's telephone number, including area code: | (212) 922-6000 |
| |
Date of fiscal year end: | 8/31 | |
Date of reporting period: | 8/31/2013 | |
| | | | | | | |
The following N-CSR relates only to the Registrant's series listed below and does not affect the other series of the Registrant, which have a different fiscal year end and, therefore, different N-CSR reporting requirements. A separate N-CSR Form will be filed for the remaining series as appropriate.
-DREYFUS INTERNATIONAL VALUE FUND
-DREYFUS OPPORTUNISTIC MIDCAP VALUE FUND
-DREYFUS OPPORTUNISTIC SMALL CAP FUND
-DREYFUS OPPORTUNISTIC U.S. STOCK FUND
-DREYFUS STRATEGIC VALUE FUND
-DREYFUS STRUCTURED MIDCAP FUND
-DREYFUS TECHNOLOGY GROWTH FUND
FORM N-CSR
Item 1. Reports to Stockholders.
Save time. Save paper. View your next shareholder report online as soon as it’s available. Log into www.dreyfus.com and sign up for Dreyfus eCommunications. It’s simple and only takes a few minutes.
The views expressed in this report reflect those of the portfolio manager only through the end of the period covered and do not necessarily represent the views of Dreyfus or any other person in the Dreyfus organization. Any such views are subject to change at any time based upon market or other conditions and Dreyfus disclaims any responsibility to update such views.These views may not be relied on as investment advice and, because investment decisions for a Dreyfus fund are based on numerous factors, may not be relied on as an indication of trading intent on behalf of any Dreyfus fund.
| | Contents |
| | THE FUND |
| 2 | A Letter from the President |
| 3 | Discussion of Fund Performance |
| 6 | Fund Performance |
| 8 | Understanding Your Fund’s Expenses |
| 8 | Comparing Your Fund’s Expenses With Those of Other Funds |
| 9 | Statement of Investments |
| 14 | Statement of Assets and Liabilities |
| 15 | Statement of Operations |
| 16 | Statement of Changes in Net Assets |
| 18 | Financial Highlights |
| 21 | Notes to Financial Statements |
| 34 | Report of Independent Registered Public Accounting Firm |
| 35 | Important Tax Information |
| 36 | Information About the Renewal of the Fund’s Management Agreement |
| 42 | Board Members Information |
| 44 | Officers of the Fund |
| | FOR MORE INFORMATION |
| | Back Cover |
Dreyfus
International Value Fund
The Fund
A LETTER FROM THE PRESIDENT
Dear Shareholder:
We are pleased to present this annual report for Dreyfus International Value Fund, covering the 12-month period from September 1, 2012, through August 31, 2013. For information about how the fund performed during the reporting period, as well as general market perspectives, we provide a Discussion of Fund Performance on the pages that follow.
U.S. equities fared quite well over the reporting period. Low interest rates, muted inflationary pressures, and a strong U.S. dollar helped fuel the market’s gains, as did a declining unemployment rate, rebounding housing markets, and increased production of domestic oil and natural gas. International equities produced widely divergent returns over the past year, as stocks in developed markets advanced more strongly than their counterparts in emerging markets. Developed markets in Europe and Japan benefited from a rebound from depressed levels of economic activity in response to the aggressively accommodative monetary policies adopted by their central banks. In contrast, some of the major emerging markets, most notably China, have seen their growth rates moderate to more sustainable levels after years of torrid expansion, making it more difficult for monetary policymakers to stimulate their economies without risking an unwanted acceleration of inflation.
We expect a broad pattern of economic growth to persist in both developed and emerging countries, with emerging markets exhibiting higher long-term growth trends. However, developed markets appear to have better prospects over the near term, as they remain supported by more stimulative monetary policies. For information on how these developments may affect your investments, we urge you to discuss these matters with your financial advisor.
Thank you for your continued confidence and support.
Sincerely,

J. Charles Cardona
President
The Dreyfus Corporation
September 16, 2013
2
DISCUSSION OF FUND PERFORMANCE
For the period of September 1, 2012, through August 31, 2013, as provided by D. Kirk Henry, Portfolio Manager
Fund and Market Performance Overview
For the 12-month period ended August 31, 2013, Dreyfus International Value Fund’s Class A shares produced a total return of 20.76%, Class C shares returned 19.82%, and Class I shares returned 21.27%.1 In comparison, the fund’s benchmark, the Morgan Stanley Capital International Europe, Australasia, Far East Index (“MSCI EAFE Index”), produced a total return of 18.66% for the same period.2
International stock markets rallied over the reporting period as economic conditions improved in developed countries. The fund outperformed its benchmark on the strength of successful stock selections in Japan, Switzerland, and Australia.
The Fund’s Investment Approach
The fund seeks long-term capital growth.The fund ordinarily invests most of its assets in securities of foreign companies which Dreyfus considers to be value companies.
The fund’s investment approach is value-oriented and research-driven. In selecting stocks, we attempt to identify potential investments through extensive quantitative and fundamental research. Emphasizing individual stock selection over economic or industry trends, the fund focuses on three key factors: value, or how a stock is valued relative to its intrinsic worth based on traditional value measures; business health, or overall efficiency and profitability as measured by return on assets and return on equity; and business momentum, or the presence of a catalyst (such as corporate restructuring, change in management, or spin-off) that will trigger a price increase near term to midterm.
The fund typically sells a stock when it is no longer considered a value company, appears less likely to benefit from the current market and economic environment, shows deteriorating fundamentals or declining momentum, or falls short of our expectations.
The Fund 3
DISCUSSION OF FUND PERFORMANCE (continued)
Recovering Global Economy Fueled Equity Markets’ Gains
The reporting period began near the outset of stock market rallies driven by improved global economic trends in developed nations. Investors were particularly encouraged by the European Central Bank’s efforts to shore up the region’s banking system, newly stimulative fiscal and monetary policies in Japan, and a new quantitative easing program in the United States.
Global economic data continued to show signs of improvement, and stocks generally continued to rally, through the spring of 2013. In late May, remarks by Federal Reserve Board Chairman Ben Bernanke were widely interpreted as a signal that U.S. monetary policymakers would begin to back away from their quantitative easing program sooner than expected. Consequently, global stock markets encountered heightened volatility in June, and a strengthening U.S. dollar further eroded returns from international investments for U.S. residents. Global equity markets generally stabilized in July and August when investors realized that the end of the quantitative easing program did not necessarily portend higher short-term interest rates, and they returned their focus to company and market fundamentals.
Strong Stock Selections in Developed Markets
In this environment, the fund’s strong relative performance was driven by our stock selection strategy in several of the world’s more developed markets. Japanese holdings provided a strong boost to relative results, led by consumer discretionary companies such as carmaker Toyota Motor and auto parts manufacturer Denso, and technology firms, such as automation equipment producer Omron, robotics specialist Yaskawa Electric, and office equipment maker Ricoh. Japanese financial services firms also advanced, including banks Nomura Holdings and Sumitomo Mitsui Trust Holdings.
Winners in Switzerland included banking giant UBS, pharmaceuticals developer Roche Holding, and specialty chemicals producer Clariant, while lack of participation in Nestle helped the fund avoid relative weakness in the global food company. Underweighted exposure to Australia also bolstered relative performance, as did strong stock selections such as medical professional services provider Primary Health Care. The fund particularly benefited from lack of exposure to Australian materials producers, which suffered due to economic slowdowns in nearby emerging markets. Finally, the fund was helped by grocery and convenience stores in France, Belgium, and Japan.
4
Disappointments during the reporting period were concentrated in the traditionally defensive utilities and telecommunications services sectors, where French telephony provider Orange and German electricity producer E.ON weighed on relative results. Investments in the emerging markets also trailed market averages, with particular weakness in Brazilian oil producer Petroleo Brasileiro, Brazilian bank Banco Santander Brasil, and Indian energy and materials conglomerate Reliance Industries.
Finding Opportunities in Most Markets
We have been encouraged by positive economic data in Europe, Japan, and the United States. Despite richer valuations in some regions and industry groups, our value-oriented investment process has continued to identify opportunities in a variety of markets.We recently have found an ample number of opportunities in France and certain emerging markets, but fewer in Australia, Japan, and the United Kingdom. From a market sector perspective, the fund ended the reporting period with overweighted positions in the energy and information technology sectors and underweighted exposure to the consumer discretionary, consumer staples, and materials sectors.
September 16, 2013
Please note, the position in any security highlighted with italicized typeface was sold during the reporting period. Equity funds are subject generally to market, market sector, market liquidity, issuer and investment style risks, among other factors, to varying degrees, all of which are more fully described in the fund’s prospectus.
The fund’s performance will be influenced by political, social and economic factors affecting investments in foreign companies. Special risks associated with investments in foreign companies include exposure to currency fluctuations, less liquidity, less developed or less efficient trading markets, lack of comprehensive company information, political instability and differing auditing and legal standards.These risks are enhanced in emerging market countries. Please read the prospectus for further discussion of these risks.
|
| 1 Total return includes reinvestment of dividends and any capital gains paid, and does not take into consideration the |
| maximum initial sales charge in the case of Class A shares, or the applicable contingent deferred sales charge imposed |
| on redemptions in the case of Class C shares. Had these charges been reflected, returns would have been lower. Past |
| performance is no guarantee of future results. Share price, yield and investment return fluctuate such that upon |
| redemption fund shares may be worth more or less than their original cost.The fund’s returns reflect the absorption of |
| certain fund expenses by The Dreyfus Corporation pursuant to an agreement in effect through March 31, 2014. Had |
| these expenses not been absorbed, the fund’s returns would have been lower. |
| 2 SOURCE: LIPPER INC. — Reflects reinvestment of net dividends and, where applicable, capital gain |
| distributions.The Morgan Stanley Capital International Europe,Australasia, Far East (MSCI EAFE) Index is an |
| unmanaged index composed of a sample of companies representative of the market structure of European and Pacific |
| Basin countries.The Index does not take into account fees and expenses to which the fund is subject. Investors cannot |
| invest directly in any index. |
The Fund 5

6
| | | | | | |
| Average Annual Total Returns as of 8/31/13 | | | | | | |
| | 1 Year | | 5 Years | | 10 Years | |
| Class A shares | | | | | | |
| with maximum sales charge (5.75%) | 13.77 | % | 0.04 | % | 4.99 | % |
| without sales charge | 20.76 | % | 1.23 | % | 5.61 | % |
| Class C shares | | | | | | |
| with applicable redemption charge † | 18.82 | % | 0.43 | % | 4.81 | % |
| without redemption | 19.82 | % | 0.43 | % | 4.81 | % |
| Class I shares | 21.27 | % | 1.71 | % | 6.06 | % |
| Morgan Stanley Capital | | | | | | |
| International Europe, | | | | | | |
| Australasia, Far East Index | 18.66 | % | 1.62 | % | 7.57 | % |
Past performance is not predictive of future performance.The fund’s performance shown in the graph and table does not reflect the deduction of taxes that a shareholder would pay on fund distributions or the redemption of fund shares.
|
| † The maximum contingent deferred sales charge for Class C shares is 1% for shares redeemed within one year of the |
| date of purchase. |
The Fund 7
UNDERSTANDING YOUR FUND’S EXPENSES (Unaudited)
As a mutual fund investor, you pay ongoing expenses, such as management fees and other expenses. Using the information below, you can estimate how these expenses affect your investment and compare them with the expenses of other funds.You also may pay one-time transaction expenses, including sales charges (loads) and redemption fees, which are not shown in this section and would have resulted in higher total expenses. For more information, see your fund’s prospectus or talk to your financial adviser.
Review your fund’s expenses
The table below shows the expenses you would have paid on a $1,000 investment in Dreyfus International Value Fund from March 1, 2013 to August 31, 2013. It also shows how much a $1,000 investment would be worth at the close of the period, assuming actual returns and expenses.
Expenses and Value of a $1,000 Investment
assuming actual returns for the six months ended August 31, 2013
| | | | | | |
| | | Class A | | Class C | | Class I |
| Expenses paid per $1,000† | $ | 7.98 | $ | 11.92 | $ | 5.85 |
| Ending value (after expenses) | $ | 1,068.50 | $ | 1,065.40 | $ | 1,071.70 |
COMPARING YOUR FUND’S EXPENSES
WITH THOSE OF OTHER FUNDS (Unaudited)
Using the SEC’s method to compare expenses
The Securities and Exchange Commission (SEC) has established guidelines to help
investors assess fund expenses. Per these guidelines, the table below shows your fund’s
expenses based on a $1,000 investment, assuming a hypothetical 5% annualized return.
You can use this information to compare the ongoing expenses (but not transaction
expenses or total cost) of investing in the fund with those of other funds.All mutual fund
shareholder reports will provide this information to help you make this comparison.
Please note that you cannot use this information to estimate your actual ending account
balance and expenses paid during the period.
Expenses and Value of a $1,000 Investment
assuming a hypothetical 5% annualized return for the six months ended August 31, 2013
| | | | | | |
| | | Class A | | Class C | | Class I |
| Expenses paid per $1,000† | $ | 7.78 | $ | 11.62 | $ | 5.70 |
| Ending value (after expenses) | $ | 1,017.49 | $ | 1,013.66 | $ | 1,019.56 |
|
| † Expenses are equal to the fund’s annualized expense ratio of 1.53% for Class A, 2.29% for Class C and 1.12% |
| for Class I, multiplied by the average account value over the period, multiplied by 184/365 (to reflect the one-half |
| year period). |
8
STATEMENT OF INVESTMENTS
August 31, 2013
| | | |
| Common Stocks—98.0% | Shares | | Value ($) |
| Australia—2.9% | | | |
| Australia & New Zealand Banking Group | 43,141 | | 1,140,029 |
| Metcash | 265,300 | | 767,425 |
| Primary Health Care | 55,830 | | 255,912 |
| QBE Insurance Group | 127,962 | | 1,731,171 |
| | | | 3,894,537 |
| Belgium—.4% | | | |
| Delhaize Group | 8,090 | | 516,163 |
| Brazil—1.4% | | | |
| Banco Santander Brasil, ADS | 181,250 | | 1,045,813 |
| Petroleo Brasileiro, ADR | 62,260 | | 841,755 |
| | | | 1,887,568 |
| China—2.4% | | | |
| Beijing Capital International Airport, Cl. H | 1,186,000 | | 776,958 |
| CNOOC | 469,000 | | 931,414 |
| FIH Mobile | 1,281,000 | a | 832,585 |
| Guangzhou Automobile Group, Cl. H | 650,194 | | 663,237 |
| | | | 3,204,194 |
| Denmark—.8% | | | |
| Carlsberg, Cl. B | 11,600 | | 1,125,216 |
| France—12.0% | | | |
| Alstom | 41,820 | | 1,471,601 |
| BNP Paribas | 20,310 | | 1,272,747 |
| Bouygues | 22,430 | | 701,540 |
| Carrefour | 78,701 | | 2,463,599 |
| Cie de St-Gobain | 29,677 | | 1,386,127 |
| Danone | 15,020 | | 1,118,416 |
| Electricite de France | 29,229 | | 818,967 |
| GDF Suez | 76,604 | | 1,660,396 |
| Sanofi | 20,871 | | 2,005,092 |
| Total | 60,670 | | 3,360,933 |
| | | | 16,259,418 |
| Germany—8.4% | | | |
| Aixtron | 82,520 | a | 1,290,755 |
| Celesio | 63,060 | | 1,314,323 |
| Daimler | 26,786 | | 1,838,057 |
The Fund 9
STATEMENT OF INVESTMENTS (continued)
| | | | |
| Common Stocks (continued) | Shares | | | Value ($) |
| Germany (continued) | | | | |
| Deutsche Bank | 51,390 | | | 2,225,046 |
| Deutsche Telekom | 72,820 | | | 932,783 |
| E.ON | 29,040 | | | 459,801 |
| Muenchener Rueckversicherungs | 5,440 | | | 991,470 |
| Siemens | 22,360 | | | 2,366,827 |
| | | | | 11,419,062 |
| Hong Kong—3.7% | | | | |
| COSCO Pacific | 662,392 | | | 973,798 |
| Esprit Holdings | 875,239 | | | 1,494,389 |
| Hang Seng Bank | 72,800 | | | 1,131,273 |
| Pacific Basin Shipping | 518,000 | | | 324,650 |
| Yue Yuen Industrial Holdings | 344,000 | | | 1,060,243 |
| | | | | 4,984,353 |
| India—1.2% | | | | |
| Reliance Industries, GDR | 41,974 | b | | 1,056,066 |
| State Bank of India, GDR | 11,470 | | | 525,326 |
| | | | | 1,581,392 |
| Ireland—.8% | | | | |
| CRH | 53,040 | | | 1,126,080 |
| Israel—1.5% | | | | |
| Teva Pharmaceutical Industries, ADR | 53,540 | | | 2,046,299 |
| Italy—2.6% | | | | |
| Assicurazioni Generali | 38,170 | | | 731,487 |
| Eni | 37,005 | | | 845,124 |
| Finmeccanica | 136,916 | a | | 700,296 |
| Saras | 994,610 | a | 1,202,792 |
| | | | | 3,479,699 |
| Japan—20.4% | | | | |
| East Japan Railway | 11,600 | | | 890,808 |
| Fujitsu | 199,000 | | | 735,723 |
| INPEX | 313 | | | 1,420,191 |
| Kao | 42,600 | | | 1,245,221 |
| Matsumotokiyoshi Holdings | 21,300 | | | 720,232 |
| Mitsubishi UFJ Financial Group | 527,200 | | | 3,092,806 |
| Nippon Express | 306,000 | | | 1,433,620 |
| Nippon Shokubai | 117,000 | | | 1,190,436 |
10
| | | |
| Common Stocks (continued) | Shares | | Value ($) |
| Japan (continued) | | | |
| Nippon Telegraph & Telephone | 18,600 | | 946,244 |
| Nomura Holdings | 49,800 | | 347,943 |
| Nomura Real Estate Holdings | 36,700 | | 841,014 |
| Ricoh | 128,800 | | 1,399,701 |
| Shimamura | 9,500 | | 971,432 |
| Shin-Etsu Chemical | 10,220 | | 617,249 |
| Sumitomo Electric Industries | 104,200 | | 1,406,172 |
| Sumitomo Mitsui Financial Group | 33,800 | | 1,497,479 |
| Sumitomo Mitsui Trust Holdings | 174,560 | | 760,928 |
| Taiyo Nippon Sanso | 227,000 | | 1,491,216 |
| Tokyo Electron | 32,500 | | 1,355,477 |
| Toyota Motor | 60,600 | | 3,666,181 |
| Yamada Denki | 28,270 | | 895,449 |
| Yamaha Motor | 52,600 | | 684,119 |
| | | | 27,609,641 |
| Netherlands—2.1% | | | |
| Aegon | 111,523 | | 795,340 |
| Koninklijke Philips | 68,038 | | 2,103,285 |
| | | | 2,898,625 |
| Norway—1.2% | | | |
| Norsk Hydro | 178,348 | | 718,072 |
| Orkla | 126,010 | | 909,271 |
| | | | 1,627,343 |
| Russia—.5% | | | |
| Gazprom, ADR | 88,460 | | 695,296 |
| Singapore—2.1% | | | |
| Avago Technologies | 21,860 | | 841,829 |
| DBS Group Holdings | 77,782 | | 963,433 |
| United Overseas Bank | 65,000 | | 1,013,523 |
| | | | 2,818,785 |
| South Africa—.2% | | | |
| Murray & Roberts Holdings | 126,343 | a | 318,269 |
| South Korea—3.3% | | | |
| Hyundai Mobis | 1,803 | | 453,166 |
| KB Financial Group | 6,000 | | 192,964 |
| KB Financial Group, ADR | 33,244 | | 1,050,843 |
The Fund 11
STATEMENT OF INVESTMENTS (continued)
| | | |
| Common Stocks (continued) | Shares | | Value ($) |
| South Korea (continued) | | | |
| Korea Electric Power | 25,400 | a | 702,473 |
| Korea Electric Power, ADR | 43,714 | | 599,756 |
| Samsung Electronics | 604 | | 744,356 |
| Samsung Fire & Marine Insurance | 3,394 | | 764,380 |
| | | | 4,507,938 |
| Spain—.5% | | | |
| Banco Bilbao Vizcaya Argentaria | 66,520 | | 634,755 |
| Sweden—2.2% | | | |
| Ericsson, Cl. B | 187,820 | | 2,207,697 |
| Svenska Cellulosa, Cl. B | 33,450 | | 817,152 |
| | | | 3,024,849 |
| Switzerland—8.5% | | | |
| Adecco | 14,950 | a | 941,555 |
| Clariant | 65,080 | a | 1,055,465 |
| Credit Suisse Group | 20,470 | a | 590,043 |
| Novartis | 59,566 | | 4,343,654 |
| Roche Holding | 11,280 | | 2,813,787 |
| UBS | 95,388 | a | 1,847,377 |
| | | | 11,591,881 |
| Taiwan—1.2% | | | |
| Advanced Semiconductor Engineering | 795,000 | | 702,693 |
| Hon Hai Precision Industry | 344,400 | a | 934,528 |
| | | | 1,637,221 |
| United Kingdom—17.7% | | | |
| Anglo American | 59,043 | | 1,352,804 |
| AZ Electronic Materials | 82,920 | | 392,826 |
| Barclays | 220,929 | | 970,110 |
| BHP Billiton | 48,580 | | 1,413,833 |
| BP | 338,184 | | 2,338,448 |
| Direct Line Insurance Group | 208,527 | | 700,594 |
| eSure Group | 285,630 | a | 1,071,184 |
| Home Retail Group | 409,565 | | 904,446 |
| HSBC Holdings | 396,858 | | 4,157,449 |
| Resolution | 176,067 | | 869,571 |
| Royal Dutch Shell, Cl. A | 106,621 | | 3,449,168 |
| Shire | 29,160 | | 1,074,142 |
12
| | | |
| Common Stocks (continued) | Shares | | Value ($) |
| United Kingdom (continued) | | | |
| Standard Chartered | 37,630 | | 840,317 |
| Tesco | 187,694 | | 1,066,175 |
| Unilever | 25,795 | | 982,967 |
| Vodafone Group | 756,317 | | 2,417,369 |
| | | | 24,001,403 |
| Total Common Stocks | | | |
| (cost $153,720,884) | | | 132,889,987 |
| |
| Other Investment—1.4% | | | |
| Registered Investment Company; | | | |
| Dreyfus Institutional Preferred | | | |
| Plus Money Market Fund | | | |
| (cost $1,870,000) | 1,870,000 | c | 1,870,000 |
| Total Investments (cost $155,590,884) | 99.4 | % | 134,759,987 |
| Cash and Receivables (Net) | .6 | % | 840,017 |
| Net Assets | 100.0 | % | 135,600,004 |
ADR—American Depository Receipts
ADS—American Depository Shares
GDR—Global Depository Receipts
|
| a Non-income producing security. |
| b Security exempt from registration pursuant to Rule 144A under the Securities Act of 1933.This security may be |
| resold in transactions exempt from registration, normally to qualified institutional buyers.At August 31, 2013, this |
| security was valued at $1,056,066 or .8% of net assets. |
| c Investment in affiliated money market mutual fund. |
Portfolio Summary (Unaudited)†
| | | |
| | Value (%) | | Value (%) |
| Financial | 24.9 | Consumer Staples | 8.7 |
| Energy | 11.9 | Materials | 6.9 |
| Health Care | 10.2 | Telecommunication Services | 3.2 |
| Industrial | 10.1 | Utilities | 3.1 |
| Information Technology | 9.7 | Money Market Investment | 1.4 |
| Consumer Discretionary | 9.3 | | 99.4 |
|
| † Based on net assets. |
| See notes to financial statements. |
The Fund 13
STATEMENT OF ASSETS AND LIABILITIES
August 31, 2013
| | | | |
| | | Cost | Value | |
| Assets ($): | | | | |
| Investments in securities—See Statement of Investments: | | | |
| Unaffiliated issuers | | 153,720,884 | 132,889,987 | |
| Affiliated issuers | | 1,870,000 | 1,870,000 | |
| Cash | | | 44,070 | |
| Cash denominated in foreign currencies | | 527,235 | 524,279 | |
| Dividends receivable | | | 626,532 | |
| Receivable for investment securities sold | | | 528,096 | |
| Receivable for shares of Common Stock subscribed | | | 1,376 | |
| Prepaid expenses | | | 18,429 | |
| | | | 136,502,769 | |
| Liabilities ($): | | | | |
| Due to The Dreyfus Corporation and affiliates—Note 3(c) | | 177,385 | |
| Payable for investment securities purchased | | | 495,166 | |
| Payable for shares of Common Stock redeemed | | | 130,545 | |
| Unrealized depreciation on forward foreign | | | | |
| currency exchange contracts—Note 4 | | | 145 | |
| Accrued expenses | | | 99,524 | |
| | | | 902,765 | |
| Net Assets ($) | | | 135,600,004 | |
| Composition of Net Assets ($): | | | | |
| Paid-in capital | | | 246,435,156 | |
| Accumulated undistributed investment income—net | | | 2,259,459 | |
| Accumulated net realized gain (loss) on investments | | | (92,262,796 | ) |
| Accumulated net unrealized appreciation (depreciation) | | | |
| on investments and foreign currency transactions | | | (20,831,815 | ) |
| Net Assets ($) | | | 135,600,004 | |
| |
| |
| Net Asset Value Per Share | | | | |
| | Class A | Class C | Class I | |
| Net Assets ($) | 68,771,181 | 7,667,435 | 59,161,388 | |
| Shares Outstanding | 5,960,080 | 672,123 | 5,141,724 | |
| Net Asset Value Per Share ($) | 11.54 | 11.41 | 11.51 | |
| |
| See notes to financial statements. | | | | |
14
STATEMENT OF OPERATIONS
Year Ended August 31, 2013
| | |
| Investment Income ($): | | |
| Income: | | |
| Cash dividends (net of $407,226 foreign taxes withheld at source): | | |
| Unaffiliated issuers | 4,383,112 | |
| Affiliated issuers | 2,040 | |
| Interest | 1,002 | |
| Total Income | 4,386,154 | |
| Expenses: | | |
| Management fee—Note 3(a) | 1,515,719 | |
| Shareholder servicing costs—Note 3(c) | 397,567 | |
| Custodian fees—Note 3(c) | 93,842 | |
| Professional fees | 64,858 | |
| Distribution fees—Note 3(b) | 60,716 | |
| Registration fees | 44,669 | |
| Prospectus and shareholders’ reports | 22,852 | |
| Directors’ fees and expenses—Note 3(d) | 14,583 | |
| Interest expense—Note 2 | 5,265 | |
| Loan commitment fees—Note 2 | 905 | |
| Miscellaneous | 40,381 | |
| Total Expenses | 2,261,357 | |
| Less—reduction in expenses due to undertaking—Note 3(a) | (151,575 | ) |
| Less—reduction in fees due to earnings credits—Note 3(c) | (137 | ) |
| Net Expenses | 2,109,645 | |
| Investment Income—Net | 2,276,509 | |
| Realized and Unrealized Gain (Loss) on Investments—Note 4 ($): | | |
| Net realized gain (loss) on investments and foreign currency transactions | 3,109,679 | |
| Net realized gain (loss) on forward foreign currency exchange contracts | 7,784 | |
| Net Realized Gain (Loss) | 3,117,463 | |
| Net unrealized appreciation (depreciation) on | | |
| investments and foreign currency transactions | 25,122,131 | |
| Net unrealized appreciation (depreciation) on | | |
| forward foreign currency exchange contracts | 1,818 | |
| Net Unrealized Appreciation (Depreciation) | 25,123,949 | |
| Net Realized and Unrealized Gain (Loss) on Investments | 28,241,412 | |
| Net Increase in Net Assets Resulting from Operations | 30,517,921 | |
| |
| See notes to financial statements. | | |
The Fund 15
STATEMENT OF CHANGES IN NET ASSETS
| | | | |
| | Year Ended August 31, | |
| | 2013 | | 2012 | a |
| Operations ($): | | | | |
| Investment income—net | 2,276,509 | | 3,460,352 | |
| Net realized gain (loss) on investments | 3,117,463 | | (24,426,152 | ) |
| Net unrealized appreciation | | | | |
| (depreciation) on investments | 25,123,949 | | 5,562,944 | |
| Net Increase (Decrease) in Net Assets | | | | |
| Resulting from Operations | 30,517,921 | | (15,402,856 | ) |
| Dividends to Shareholders from ($): | | | | |
| Investment income—net: | | | | |
| Class A | (1,779,844 | ) | (2,772,443 | ) |
| Class C | (98,693 | ) | (186,447 | ) |
| Class I | (1,603,998 | ) | (2,975,318 | ) |
| Total Dividends | (3,482,535 | ) | (5,934,208 | ) |
| Capital Stock Transactions ($): | | | | |
| Net proceeds from shares sold: | | | | |
| Class A | 12,719,514 | | 20,878,977 | |
| Class B | — | | 13,986 | |
| Class C | 146,329 | | 255,905 | |
| Class I | 3,686,507 | | 16,118,621 | |
| Dividends reinvested: | | | | |
| Class A | 1,718,394 | | 2,666,058 | |
| Class C | 54,020 | | 98,544 | |
| Class I | 1,424,443 | | 2,622,324 | |
| Cost of shares redeemed: | | | | |
| Class A | (54,174,851 | ) | (23,471,434 | ) |
| Class B | — | | (476,981 | ) |
| Class C | (1,916,922 | ) | (2,885,040 | ) |
| Class I | (19,133,866 | ) | (37,097,091 | ) |
| Increase (Decrease) in Net Assets | | | | |
| from Capital Stock Transactions | (55,476,432 | ) | (21,276,131 | ) |
| Total Increase (Decrease) in Net Assets | (28,441,046 | ) | (42,613,195 | ) |
| Net Assets ($): | | | | |
| Beginning of Period | 164,041,050 | | 206,654,245 | |
| End of Period | 135,600,004 | | 164,041,050 | |
| Undistributed investment income—net | 2,259,459 | | 3,417,397 | |
16
| | | | |
| | Year Ended August 31, | |
| | 2013 | | 2012 | a |
| Capital Share Transactions: | | | | |
| Class Ab,c | | | | |
| Shares sold | 1,206,880 | | 2,047,935 | |
| Shares issued for dividends reinvested | 169,634 | | 274,286 | |
| Shares redeemed | (4,951,509 | ) | (2,387,133 | ) |
| Net Increase (Decrease) in Shares Outstanding | (3,574,995 | ) | (64,912 | ) |
| Class Bb | | | | |
| Shares sold | — | | 1,369 | |
| Shares redeemed | — | | (46,819 | ) |
| Net Increase (Decrease) in Shares Outstanding | — | | (45,450 | ) |
| Class Cc | | | | |
| Shares sold | 13,612 | | 18,196 | |
| Shares issued for dividends reinvested | 5,364 | | 10,212 | |
| Shares redeemed | (176,471 | ) | (299,702 | ) |
| Net Increase (Decrease) in Shares Outstanding | (157,495 | ) | (271,294 | ) |
| Class I | | | | |
| Shares sold | 332,712 | | 1,535,195 | |
| Shares issued for dividends reinvested | 141,454 | | 271,462 | |
| Shares redeemed | (1,796,033 | ) | (3,962,000 | ) |
| Net Increase (Decrease) in Shares Outstanding | (1,321,867 | ) | (2,155,343 | ) |
| a | Effective as of the close of business on March 13, 2012, the fund no longer offers Class B shares. |
| b | During the period ended August 31, 2012, 27,053 Class B shares representing $272,804 were automatically converted to 26,973 Class A shares. |
| c | During the period ended August 31, 2013, 12,494 Class C shares representing $147,433 were exchanged for 12,389 Class A shares. |
See notes to financial statements.
The Fund 17
FINANCIAL HIGHLIGHTS
The following tables describe the performance for each share class for the fiscal periods indicated.All information (except portfolio turnover rate) reflects financial results for a single fund share.Total return shows how much your investment in the fund would have increased (or decreased) during each period, assuming you had reinvested all dividends and distributions.These figures have been derived from the fund’s financial statements.
| | | | | | | | | | |
| | | | Year Ended August 31, | | | |
| Class A Shares | 2013 | | 2012 | | 2011 | | 2010 | | 2009 | |
| Per Share Data ($): | | | | | | | | | | |
| Net asset value, beginning of period | 9.76 | | 10.69 | | 10.37 | | 11.02 | | 12.30 | |
| Investment Operations: | | | | | | | | | | |
| Investment income—neta | .15 | | .17 | | .20 | | .15 | | .15 | |
| Net realized and unrealized | | | | | | | | | | |
| gain (loss) on investments | 1.85 | | (.80 | ) | .26 | | (.65 | ) | (1.01 | ) |
| Total from Investment Operations | 2.00 | | (.63 | ) | .46 | | (.50 | ) | (.86 | ) |
| Distributions: | | | | | | | | | | |
| Dividends from investment income—net | (.22 | ) | (.30 | ) | (.14 | ) | (.15 | ) | (.42 | ) |
| Net asset value, end of period | 11.54 | | 9.76 | | 10.69 | | 10.37 | | 11.02 | |
| Total Return (%)b | 20.76 | | (5.89 | ) | 4.32 | | (4.66 | ) | (5.97 | ) |
| Ratios/Supplemental Data (%): | | | | | | | | | | |
| Ratio of total expenses | | | | | | | | | | |
| to average net assets | 1.61 | | 1.63 | | 1.54 | | 1.54 | | 1.84 | |
| Ratio of net expenses | | | | | | | | | | |
| to average net assets | 1.51 | | 1.53 | | 1.49 | | 1.54 | | 1.84 | |
| Ratio of net investment income | | | | | | | | | | |
| to average net assets | 1.40 | | 1.74 | | 1.70 | | 1.29 | | 1.66 | |
| Portfolio Turnover Rate | 43.35 | | 40.93 | | 60.72 | | 55.35 | | 69.63 | |
| Net Assets, end of period ($ x 1,000) | 68,771 | | 93,078 | | 102,606 | | 112,716 | | 159,260 | |
| a | Based on average shares outstanding at each month end. |
| b | Exclusive of sales charge. |
See notes to financial statements.
18
| | | | | | | | | | |
| | | | Year Ended August 31, | | | |
| Class C Shares | 2013 | | 2012 | | 2011 | | 2010 | | 2009 | |
| Per Share Data ($): | | | | | | | | | | |
| Net asset value, beginning of period | 9.64 | | 10.51 | | 10.19 | | 10.84 | | 11.98 | |
| Investment Operations: | | | | | | | | | | |
| Investment income—neta | .06 | | .10 | | .11 | | .06 | | .08 | |
| Net realized and unrealized | | | | | | | | | | |
| gain (loss) on investments | 1.83 | | (.79 | ) | .25 | | (.65 | ) | (.96 | ) |
| Total from Investment Operations | 1.89 | | (.69 | ) | .36 | | (.59 | ) | (.88 | ) |
| Distributions: | | | | | | | | | | |
| Dividends from investment income—net | (.12 | ) | (.18 | ) | (.04 | ) | (.06 | ) | (.26 | ) |
| Net asset value, end of period | 11.41 | | 9.64 | | 10.51 | | 10.19 | | 10.84 | |
| Total Return (%)b | 19.82 | | (6.55 | ) | 3.48 | | (5.49 | ) | (6.71 | ) |
| Ratios/Supplemental Data (%): | | | | | | | | | | |
| Ratio of total expenses | | | | | | | | | | |
| to average net assets | 2.39 | | 2.38 | | 2.31 | | 2.33 | | 2.63 | |
| Ratio of net expenses | | | | | | | | | | |
| to average net assets | 2.29 | | 2.28 | | 2.26 | | 2.33 | | 2.63 | |
| Ratio of net investment income | | | | | | | | | | |
| to average net assets | .60 | | .99 | | .91 | | .56 | | .87 | |
| Portfolio Turnover Rate | 43.35 | | 40.93 | | 60.72 | | 55.35 | | 69.63 | |
| Net Assets, end of period ($ x 1,000) | 7,667 | | 7,998 | | 11,573 | | 14,604 | | 18,607 | |
| a | Based on average shares outstanding at each month end. |
| b | Exclusive of sales charge. |
See notes to financial statements.
The Fund 19
FINANCIAL HIGHLIGHTS (continued)
| | | | | | | | | | |
| | | | Year Ended August 31, | | | |
| Class I Shares | 2013 | | 2012 | | 2011 | | 2010 | | 2009 | |
| Per Share Data ($): | | | | | | | | | | |
| Net asset value, beginning of period | 9.74 | | 10.67 | | 10.36 | | 11.02 | | 12.31 | |
| Investment Operations: | | | | | | | | | | |
| Investment income—neta | .19 | | .23 | | .28 | | .22 | | .19 | |
| Net realized and unrealized | | | | | | | | | | |
| gain (loss) on investments | 1.84 | | (.81 | ) | .22 | | (.68 | ) | (.98 | ) |
| Total from Investment Operations | 2.03 | | (.58 | ) | .50 | | (.46 | ) | (.79 | ) |
| Distributions: | | | | | | | | | �� | |
| Dividends from investment income—net | (.26 | ) | (.35 | ) | (.19 | ) | (.20 | ) | (.50 | ) |
| Net asset value, end of period | 11.51 | | 9.74 | | 10.67 | | 10.36 | | 11.02 | |
| Total Return (%) | 21.27 | | (5.41 | ) | 4.67 | | (4.37 | ) | (5.21 | ) |
| Ratios/Supplemental Data (%): | | | | | | | | | | |
| Ratio of total expenses | | | | | | | | | | |
| to average net assets | 1.21 | | 1.19 | | 1.15 | | 1.22 | | 1.37 | |
| Ratio of net expenses | | | | | | | | | | |
| to average net assets | 1.11 | | 1.09 | | 1.09 | | 1.22 | | 1.36 | |
| Ratio of net investment income | | | | | | | | | | |
| to average net assets | 1.76 | | 2.29 | | 2.29 | | 1.93 | | 2.09 | |
| Portfolio Turnover Rate | 43.35 | | 40.93 | | 60.72 | | 55.35 | | 69.63 | |
| Net Assets, end of period ($ x 1,000) | 59,161 | | 62,965 | | 91,998 | | 97,429 | | 41,460 | |
| |
| a Based on average shares outstanding at each month end. | | | | | | | | | |
| See notes to financial statements. | | | | | | | | | | |
20
NOTES TO FINANCIAL STATEMENTS
NOTE 1—Significant Accounting Policies:
Dreyfus International Value Fund (the “fund”) is a separate diversified series of Advantage Funds, Inc. (the “Company”), which is registered under the Investment Company Act of 1940, as amended (the “Act”), as an open-end management investment company and operates as a series company currently offering twelve series, including the fund. The fund’s investment objective is to seek long-term capital growth. The Dreyfus Corporation (the “Manager” or “Dreyfus”), a wholly-owned subsidiary of The Bank of New York Mellon Corporation (“BNY Mellon”), serves as the fund’s investment adviser.
MBSC Securities Corporation (the “Distributor”), a wholly-owned subsidiary of the Manager, is the distributor of the fund’s shares. The fund is authorized to issue 500 million shares of $.001 par value Common Stock. The fund currently offers three classes of shares: Class A (200 million shares authorized), Class C (100 million shares authorized) and Class I (200 million shares authorized). Class A shares generally are subject to a sales charge imposed at the time of purchase. Class C shares are subject to a contingent deferred sales charge (“CDSC”) imposed on Class C shares redeemed within one year of purchase. Class I shares are sold at net asset value per share only to institutional investors. Other differences between the classes include the services offered to and the expenses borne by each class, the allocation of certain transfer agency costs and certain voting rights. Income, expenses (other than expenses attributable to a specific class), and realized and unrealized gains or losses on investments are allocated to each class of shares based on its relative net assets.
The sales charge may be reduced or waived for certain purchases of Class A shares. Effective April 1, 2013, pursuant to new/modified front-end sales charge waivers, Class A shares of the fund may be purchased at net asset value without payment of a sales charge by (a) investors who participate in a self-directed investment brokerage account program offered by financial intermediaries that have entered into an agreement
The Fund 21
NOTES TO FINANCIAL STATEMENTS (continued)
with the fund’s Distributor (financial intermediaries offering self-directed investment brokerage accounts may or may not charge their customers a transaction fee) and (b) investors who purchase Class A shares directly through the fund’s Distributor, and either (i) have, or whose spouse or minor children have, beneficially owned shares and continuously maintained an open account with the Distributor in a Dreyfus-managed fund since on or before February 28, 2006, or (ii) such purchase is for a self-directed investment account that may or may not be subject to a transaction fee.
The Company accounts separately for the assets, liabilities and operations of each series. Expenses directly attributable to each series are charged to that series’ operations; expenses which are applicable to all series are allocated among them on a pro rata basis.
The Financial Accounting Standards Board (“FASB”) Accounting Standards Codification is the exclusive reference of authoritative U.S. generally accepted accounting principles (“GAAP”) recognized by the FASB to be applied by nongovernmental entities. Rules and interpretive releases of the Securities and Exchange Commission (“SEC”) under authority of federal laws are also sources of authoritative GAAP for SEC registrants. The fund’s financial statements are prepared in accordance with GAAP, which may require the use of management estimates and assumptions.Actual results could differ from those estimates.
The Company enters into contracts that contain a variety of indemnifications.The fund’s maximum exposure under these arrangements is unknown.The fund does not anticipate recognizing any loss related to these arrangements.
(a) Portfolio valuation: The fair value of a financial instrument is the amount that would be received to sell an asset or paid to transfer a liability in an orderly transaction between market participants at the measurement date (i.e., the exit price). GAAP establishes a fair value hierarchy that prioritizes the inputs of valuation techniques used to
22
measure fair value.This hierarchy gives the highest priority to unadjusted quoted prices in active markets for identical assets or liabilities (Level 1 measurements) and the lowest priority to unobservable inputs (Level 3 measurements).
Additionally, GAAP provides guidance on determining whether the volume and activity in a market has decreased significantly and whether such a decrease in activity results in transactions that are not orderly. GAAP requires enhanced disclosures around valuation inputs and techniques used during annual and interim periods.
Various inputs are used in determining the value of the fund’s investments relating to fair value measurements.These inputs are summarized in the three broad levels listed below:
Level 1—unadjusted quoted prices in active markets for identical investments.
Level 2—other significant observable inputs (including quoted prices for similar investments, interest rates, prepayment speeds, credit risk, etc.).
Level 3—significant unobservable inputs (including the fund’s own assumptions in determining the fair value of investments).
The inputs or methodology used for valuing securities are not necessarily an indication of the risk associated with investing in those securities.
Changes in valuation techniques may result in transfers in or out of an assigned level within the disclosure hierarchy. Valuation techniques used to value the fund’s investments are as follows:
Investments in securities are valued at the last sales price on the securities exchange or national securities market on which such securities are primarily traded. Securities listed on the National Market System for which market quotations are available are valued at the official closing price or, if there is no official closing price that day, at the last sales
The Fund 23
NOTES TO FINANCIAL STATEMENTS (continued)
price. Securities not listed on an exchange or the national securities market, or securities for which there were no transactions, are valued at the average of the most recent bid and asked prices, except for open short positions, where the asked price is used for valuation purposes. Bid price is used when no asked price is available. Registered investment companies that are not traded on an exchange are valued at their net asset value. All of the preceding securities are categorized within Level 1 of the fair value hierarchy.
Fair valuing of securities may be determined with the assistance of a pricing service using calculations based on indices of domestic securities and other appropriate indicators, such as prices of relevant ADRs and financial futures. Utilizing these techniques may result in transfers between Level 1 and Level 2 of the fair value hierarchy.
When market quotations or official closing prices are not readily available, or are determined not to reflect accurately fair value, such as when the value of a security has been significantly affected by events after the close of the exchange or market on which the security is principally traded (for example, a foreign exchange or market), but before the fund calculates its net asset value, the fund may value these investments at fair value as determined in accordance with the procedures approved by the Company’s Board of Directors (the “Board”). Certain factors may be considered when fair valuing investments such as: fundamental analytical data, the nature and duration of restrictions on disposition, an evaluation of the forces that influence the market in which the securities are purchased and sold, and public trading in similar securities of the issuer or comparable issuers. These securities are either categorized within Level 2 or 3 of the fair value hierarchy depending on the relevant inputs used.
For restricted securities where observable inputs are limited, assumptions about market activity and risk are used and are categorized within Level 3 of the fair value hierarchy.
24
Investments denominated in foreign currencies are translated to U.S. dollars at the prevailing rates of exchange.
Forward foreign currency exchange contracts (“forward contracts”) are valued at the forward rate and are generally categorized within Level 2 of the fair value hierarchy.
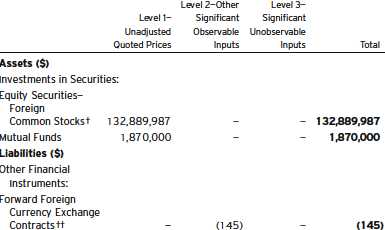
The following is a summary of the inputs used as of August 31, 2013 in valuing the fund's investments:
| |
| † | See Statement of Investments for additional detailed categorizations. |
| †† | Amount shown represents unrealized (depreciation) at period end. |
At August 31, 2013, there were no transfers between Level 1 and Level 2 of the fair value hierarchy.
(b) Foreign currency transactions: The fund does not isolate that portion of the results of operations resulting from changes in foreign exchange rates on investments from the fluctuations arising from changes in the market prices of securities held. Such fluctuations are included with the net realized and unrealized gain or loss on investments.
The Fund 25
NOTES TO FINANCIAL STATEMENTS (continued)
Net realized foreign exchange gains or losses arise from sales of foreign currencies, currency gains or losses realized on securities transactions between trade and settlement date, and the difference between the amounts of dividends, interest and foreign withholding taxes recorded on the fund’s books and the U.S. dollar equivalent of the amounts actually received or paid. Net unrealized foreign exchange gains and losses arise from changes in the value of assets and liabilities other than investments resulting from changes in exchange rates. Foreign currency gains and losses on foreign currency transactions are also included with net realized and unrealized gain or loss on investments.
(c) Securities transactions and investment income: Securities transactions are recorded on a trade date basis. Realized gains and losses from securities transactions are recorded on the identified cost basis. Dividend income is recognized on the ex-dividend date and interest income, including, where applicable, accretion of discount and amortization of premium on investments, is recognized on the accrual basis.
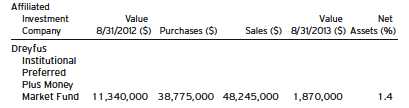
(d) Affiliated issuers: Investments in other investment companies advised by Dreyfus are defined as “affiliated” under the Act. Investments in affiliated investment companies during the period ended August 31, 2013 were as follows:
(e) Risk: Investing in foreign markets may involve special risks and considerations not typically associated with investing in the U.S.These risks include revaluation of currencies, high rates of inflation, repatriation restrictions on income and capital, and adverse political and economic developments. Moreover, securities issued in these markets may be less
26
liquid, subject to government ownership controls and delayed settlements, and their prices may be more volatile than those of comparable securities in the U.S.
(f) Dividends to shareholders: Dividends are recorded on the ex-dividend date. Dividends from investment income-net and dividends from net realized capital gains, if any, are normally declared and paid annually, but the fund may make distributions on a more frequent basis to comply with the distribution requirements of the Internal Revenue Code of 1986, as amended (the “Code”).To the extent that net realized capital gains can be offset by capital loss carryovers, it is the policy of the fund not to distribute such gains. Income and capital gain distributions are determined in accordance with income tax regulations, which may differ from GAAP.
(g) Federal income taxes: It is the policy of the fund to continue to qualify as a regulated investment company, if such qualification is in the best interests of its shareholders, by complying with the applicable provisions of the Code, and to make distributions of taxable income sufficient to relieve it from substantially all federal income and excise taxes.
As of and during the period ended August 31, 2013, the fund did not have any liabilities for any uncertain tax positions.The fund recognizes interest and penalties, if any, related to uncertain tax positions as income tax expense in the Statement of Operations. During the period, the fund did not incur any interest or penalties.
Each tax year in the four-year period ended August 31, 2013 remains subject to examination by the Internal Revenue Service and state taxing authorities.
At August 31, 2013, the components of accumulated earnings on a tax basis were as follows: undistributed ordinary income $2,259,459, accumulated capital losses $90,459,306 and unrealized depreciation $22,635,305.
The Fund 27
NOTES TO FINANCIAL STATEMENTS (continued)
Under the Regulated Investment Company Modernization Act of 2010 (the “2010 Act”), the fund is permitted to carry forward capital losses incurred in taxable years beginning after December 22, 2010 (“post-enactment losses”) for an unlimited period. Furthermore, post-enactment capital loss carryovers retain their character as either short-term or long-term capital losses rather than short-term as they were under previous statute. The 2010 Act requires post-enactment losses to be utilized before the utilization of losses incurred in taxable years prior to the effective date of the 2010 Act (“pre-enactment losses”).As a result of this ordering rule, pre-enactment losses may be more likely to expire unused.
The accumulated capital loss carryover is available for federal income tax purposes to be applied against future net realized capital gains, if any, realized subsequent to August 31, 2013. If not applied, $24,770,979 of the carryover expires in fiscal year 2017 and $41,505,181 expires in fiscal year 2018.The fund has $24,183,146 of post-enactment long-term capital losses which can be carried forward for an unlimited period.
The tax character of distributions paid to shareholders during the fiscal periods ended August 31, 2013 and August 31, 2012 were as follows: ordinary income $3,482,535 and $5,934,208, respectively.
During the period ended August 31, 2013, as a result of permanent book to tax differences, primarily due to the tax treatment for foreign exchange gains and losses and passive foreign investment companies, the fund increased accumulated undistributed investment income-net by $48,088 and decreased accumulated net realized gain (loss) on investments by the same amount. Net assets and net asset value per share were not affected by this reclassification.
(h) Accounting Pronouncement: In January 2013, FASB issued Accounting Standards Update No. 2013-01 (“ASU 2013-01”), “Clarifying the Scope of Disclosures about Offsetting Assets and Liabilities”, which replaced Accounting Standards Update No. 2011-11 (“ASU 2011-11”), “Disclosures about Offsetting Assets and Liabilities”.
28
ASU 2013-01 is effective for fiscal years beginning on or after January 1, 2013, and interim periods within those annual periods. ASU 2011-11 was intended to enhance disclosure requirements on the offsetting of financial assets and liabilities.ASU 2013-01 limits the scope of the new balance sheet offsetting disclosures to derivatives, repurchase agreements, and securities lending transactions to the extent that they are (1) offset in the financial statements or (2) subject to enforceable master netting arrangements (“MNA”) or similar agreements. Management is currently evaluating the application of ASU 2013-01 and its impact on the fund’s financial statements.
NOTE 2—Bank Lines of Credit:
The fund participates with other Dreyfus-managed funds in a $210 million unsecured credit facility led by Citibank, N.A. and a $300 million unsecured credit facility provided by The Bank of New York Mellon, a subsidiary of BNY Mellon and an affiliate of Dreyfus (each, a “Facility”), each to be utilized primarily for temporary or emergency purposes, including the financing of redemptions. Prior to October 10, 2012, the unsecured credit facility with Citibank, N.A. was $225 million. In connection therewith, the fund has agreed to pay its pro rata portion of commitment fees for each Facility. Interest is charged to the fund based on rates determined pursuant to the terms of the respective Facility at the time of borrowing.
The average amount of borrowings outstanding under the Facilities during the period ended August 31, 2013 was approximately $463,600 with a related weighted average annualized interest rate of 1.14%.
NOTE 3—Management Fee and Other Transactions with Affiliates:
(a) Pursuant to a management agreement with the Manager, the management fee is computed at the annual rate of 1% of the value of the fund’s average daily net assets and is payable monthly.The Manager has agreed to waive receipt of a portion of the fund’s management fee, in
The Fund 29
NOTES TO FINANCIAL STATEMENTS (continued)
the amount of .10% of the value of the fund’s average daily net assets from September 1, 2012 through March 31, 2014. The reduction in expenses, pursuant to the undertaking, amounted to $151,575 during the period ended August 31, 2013.
During the period ended August 31, 2013, the Distributor retained $1,399 from commissions earned on sales of the fund’s Class A shares and $295 from CDSCs on redemptions of the fund’s Class C shares.
(b) Under the Distribution Plan adopted pursuant to Rule 12b-1 under the Act, Class C shares pay the Distributor for distributing its shares at an annual rate of .75% of the value of its average daily net assets. During the period ended August 31, 2013, Class C shares were charged $60,716 pursuant to the Distribution Plan.
(c) Under the Shareholder Services Plan, Class A and Class C shares pay the Distributor at an annual rate of .25% of the value of their average daily net assets for the provision of certain services.The services provided may include personal services relating to shareholder accounts, such as answering shareholder inquiries regarding the fund and providing reports and other information, and services related to the maintenance of shareholder accounts.The Distributor may make payments to Service Agents (securities dealers, financial institutions or other industry professionals) with respect to these services. The Distributor determines the amounts to be paid to Service Agents. During the period ended August 31, 2013, Class A and Class C shares were charged $207,798 and $20,239, respectively, pursuant to the Shareholder Services Plan.
The fund has arrangements with the transfer agent and the custodian whereby the fund may receive earnings credits when positive cash balances are maintained, which are used to offset transfer agency and custody fees. For financial reporting purposes, the fund includes net earnings credits as an expense offset in the Statement of Operations.
The fund compensates DreyfusTransfer, Inc., a wholly-owned subsidiary of the Manager, under a transfer agency agreement for providing transfer agency services for the fund and cash management services related to fund subscriptions and redemptions. During the period ended August
30
31, 2013, the fund was charged $25,053 for transfer agency services and $1,052 for cash management services. These fees are included in Shareholder servicing costs in the Statement of Operations. Cash management fees were partially offset by earnings credits of $133.
The fund compensatesThe Bank of NewYork Mellon under a custody agreement for providing custodial services for the fund. During the period ended August 31, 2013, the fund was charged $93,842 pursuant to the custody agreement.
The fund compensates The Bank of New York Mellon under a cash management agreement for performing certain cash management services related to fund subscriptions and redemptions. During the period ended August 31, 2013, the fund was charged $588 pursuant to the cash management agreement, which is included in Shareholder servicing costs in the Statement of Operations.These fees were partially offset by earnings credits of $4.
During the period ended August 31, 2013, the fund was charged $8,973 for services performed by the Chief Compliance Officer and his staff.
The components of “Due to The Dreyfus Corporation and affiliates” in the Statement of Assets and Liabilities consist of: management fees $118,478, Distribution Plan fees $5,051, Shareholder Services Plan fees $16,753, custodian fees $34,744, Chief Compliance Officer fees $6,172 and transfer agency fees $7,856, which are offset against an expense reimbursement currently in effect in the amount of $11,669.
(d) Each Board member also serves as a Board member of other funds within the Dreyfus complex. Annual retainer fees and attendance fees are allocated to each fund based on net assets.
NOTE 4—Securities Transactions:
The aggregate amount of purchases and sales of investment securities, excluding short-term securities and forward contracts, during the period ended August 31, 2013 amounted to $63,832,856 and $116,874,003, respectively.
The Fund 31
NOTES TO FINANCIAL STATEMENTS (continued)
Derivatives: A derivative is a financial instrument whose performance is derived from the performance of another asset. Each type of derivative instrument that was held by the fund during the period ended August 31, 2013 is discussed below.
Forward Foreign Currency Exchange Contracts: The fund enters into forward contracts in order to hedge its exposure to changes in foreign currency exchange rates on its foreign portfolio holdings, to settle foreign currency transactions or as a part of its investment strategy. When executing forward contracts, the fund is obligated to buy or sell a foreign currency at a specified rate on a certain date in the future. With respect to sales of forward contracts, the fund incurs a loss if the value of the contract increases between the date the forward contract is opened and the date the forward contract is closed.The fund realizes a gain if the value of the contract decreases between those dates.With respect to purchases of forward contracts, the fund incurs a loss if the value of the contract decreases between the date the forward contract is opened and the date the forward contract is closed.The fund realizes a gain if the value of the contract increases between those dates. Any realized or unrealized gains or losses which occurred during the period are reflected in the Statement of Operations. The fund is exposed to foreign currency risk as a result of changes in value of underlying financial instruments.The fund is also exposed to credit risk associated with counterparty nonperformance on these forward contracts, which is typically limited to the unrealized gain on each open contract.The following summarizes open forward contracts at August 31, 2013:
| | | | | |
| | Foreign | | | | |
| Forward Foreign Currency | Currency | | | Unrealized | |
| Exchange Contracts | Amounts | Cost ($) | Value ($) | (Depreciation) ($) | |
| Purchases: | | | | | |
| Australian Dollar, | | | | | |
| Expiring 9/3/2013a | 69,928 | 62,385 | 62,240 | (145 | ) |
| |
| Counterparty: | | | | | |
| a Barclays Bank | | | | | |
32
The following summarizes the average market value of derivatives outstanding during the period ended August 31, 2013:

At August 31, 2013, the cost of investments for federal income tax purposes was $157,394,374; accordingly, accumulated net unrealized depreciation on investments was $22,634,387, consisting of $7,359,629 gross unrealized appreciation and $29,994,016 gross unrealized depreciation.
The Fund 33
REPORT OF INDEPENDENT REGISTERED
PUBLIC ACCOUNTING FIRM
Shareholders and Board of Directors
Dreyfus International Value Fund
We have audited the accompanying statement of assets and liabilities, including the statement of investments, of Dreyfus International Value Fund (one of the series comprising Advantage Funds, Inc.) as of August 31, 2013, and the related statement of operations for the year then ended, the statement of changes in net assets for each of the two years in the period then ended, and the financial highlights for each of the five years in the period then ended. These financial statements and financial highlights are the responsibility of the Fund’s management. Our responsibility is to express an opinion on these financial statements and financial highlights based on our audits.
We conducted our audits in accordance with the standards of the Public Company Accounting Oversight Board (United States).Those standards require that we plan and perform the audit to obtain reasonable assurance about whether the financial statements and financial highlights are free of material misstatement.We were not engaged to perform an audit of the Fund’s internal control over financial reporting. Our audits included consideration of internal control over financial reporting as a basis for designing audit procedures that are appropriate in the circumstances, but not for the purpose of expressing an opinion on the effectiveness of the Fund’s internal control over financial reporting. Accordingly, we express no such opinion.An audit also includes examining, on a test basis, evidence supporting the amounts and disclosures in the financial statements and financial highlights, assessing the accounting principles used and significant estimates made by management, and evaluating the overall financial statement presentation. Our procedures included confirmation of securities owned as of August 31, 2013 by correspondence with the custodian and others.We believe that our audits provide a reasonable basis for our opinion.
In our opinion, the financial statements and financial highlights referred to above present fairly, in all material respects, the financial position of Dreyfus International Value Fund at August 31, 2013, the results of its operations for the year then ended, the changes in its net assets for each of the two years in the period then ended, and the financial highlights for each of the five years in the period then ended, in conformity with U.S. generally accepted accounting principles.

New York, New York
October 28, 2013
34
IMPORTANT TAX INFORMATION (Unaudited)
In accordance with federal tax law, the fund elects to provide each shareholder with their portion of the fund’s foreign taxes paid and the income sourced from foreign countries.Accordingly, the fund hereby reports the following information regarding its fiscal year ended August 31, 2013:
—the total amount of taxes paid to foreign countries was $269,633
—the total amount of income sourced from foreign countries was $4,790,337.
Where required by federal tax law rules, shareholders will receive notification of their proportionate share of foreign taxes paid and foreign sourced income for the 2013 calendar year with Form 1099-DIV which will be mailed in early 2014.Also certain dividends paid by the fund may be subject to a maximum tax rate of 15%, as provided for by the Jobs and Growth Tax Relief Reconciliation Act of 2003. Of the distributions paid during the fiscal year, $3,482,535 represents the maximum amount that may be considered qualified dividend income.
The Fund 35
INFORMATION ABOUT THE RENEWAL OF THE
FUND’S MANAGEMENT AGREEMENT (Unaudited)
At a meeting of the fund’s Board of Directors held on March 4-5, 2013, the Board considered the renewal of the fund’s Management Agreement pursuant to which Dreyfus provides the fund with investment advisory and administrative services (the “Agreement”). The Board members, none of whom are “interested persons” (as defined in the Investment Company Act of 1940, as amended) of the fund, were assisted in their review by independent legal counsel and met with counsel in executive session separate from Dreyfus representatives. In considering the renewal of the Agreement, the Board considered all factors that it believed to be relevant, including those discussed below.The Board did not identify any one factor as dispositive, and each Board member may have attributed different weights to the factors considered.
Analysis of Nature, Extent, and Quality of Services Provided to the Fund. The Board considered information provided to them at the meeting and in previous presentations from Dreyfus representatives regarding the nature, extent, and quality of the services provided to funds in the Dreyfus fund complex. Dreyfus provided the number of open accounts in the fund, the fund’s asset size and the allocation of fund assets among distribution channels. Dreyfus also had previously provided information regarding the diverse intermediary relationships and distribution channels of funds in the Dreyfus fund complex (such as retail direct or intermediary, in which intermediaries typically are paid by the fund and/or Dreyfus) and Dreyfus’ corresponding need for broad, deep, and diverse resources to be able to provide ongoing shareholder services to each intermediary or distribution channel, as applicable to the fund.
The Board also considered research support available to, and portfolio management capabilities of, the fund’s portfolio management personnel and that Dreyfus also provides oversight of day-to-day fund operations, including fund accounting and administration and assistance in meeting legal and regulatory requirements.The Board also considered Dreyfus’
36
extensive administrative, accounting, and compliance infrastructures. The Board also considered portfolio management’s brokerage policies and practices (including policies and practices regarding soft dollars) and the standards applied in seeking best execution.
Comparative Analysis of the Fund’s Performance and Management Fee and Expense Ratio. The Board reviewed reports prepared by Lipper, Inc. (“Lipper”), an independent provider of investment company data, which included information comparing (1) the fund’s performance with the performance of a group of comparable funds (the “Performance Group”) and with a broader group of funds (the “Performance Universe”), all for various periods ended December 31, 2012, and (2) the fund’s actual and contractual management fees and total expenses with those of a group of comparable funds (the “Expense Group”) and with a broader group of funds (the “Expense Universe”), the information for which was derived in part from fund financial statements available to Lipper as of the date of its analysis. Dreyfus previously had furnished the Board with a description of the methodology Lipper used to select the Performance Group and Performance Universe and the Expense Group and Expense Universe.
Dreyfus representatives stated that the usefulness of performance comparisons may be affected by a number of factors, including different investment limitations that may be applicable to the fund and comparison funds.The Board discussed the results of the comparisons and noted that the fund’s total return performance was below the Performance Group and Performance Universe medians in all periods and ranked in the fourth quartile of the Performance Group and Performance Universe in most of the periods. Dreyfus also provided a comparison of the fund’s calendar year total returns to the returns of the fund’s benchmark index. Dreyfus representatives discussed with the Board the reasons for the fund’s underperformance and the addi-
The Fund 37
INFORMATION ABOUT THE RENEWAL OF THE FUND’S
MANAGEMENT AGREEMENT (Unaudited) (continued)
tional steps taken to improve performance, including appointing one of the fund’s portfolio managers as lead portfolio manager in early 2013.The Board stated its expectations for improvements in the fund’s performance results in the future.
The Board also reviewed the range of actual and contractual management fees and total expenses of the Expense Group and Expense Universe funds and discussed the results of the comparisons.The Board noted that the fund’s contractual management fee was above the Expense Group median and the fund’s actual management fee and the fund’s total expense ratio were above the Expense Group and Expense Universe medians.
Dreyfus representatives noted that Dreyfus has contractually agreed to waive receipt of a portion of the fund’s management fee in the amount of .10% of the value of the fund’s average daily net assets until March 31, 2014.
Dreyfus representatives reviewed with the Board the management or investment advisory fees (1) paid by funds advised or administered by Dreyfus that are in the same Lipper category as the fund and (2) paid to Dreyfus or the Dreyfus-affiliated primary employer of the fund’s primary portfolio manager(s) for advising any separate accounts and/or other types of client portfolios that are considered to have similar investment strategies and policies as the fund (the “Similar Clients”), and explained the nature of the Similar Clients.They discussed differences in fees paid and the relationship of the fees paid in light of any differences in the services provided and other relevant factors. The Board considered the relevance of the fee information provided for the Similar Clients to evaluate the appropriateness and reasonableness of the fund’s management fee.
Analysis of Profitability and Economies of Scale. Dreyfus representatives reviewed the expenses allocated and profit received by Dreyfus and the resulting profitability percentage for managing the fund and the aggre-
38
gate profitability percentage to Dreyfus of managing the funds in the Dreyfus fund complex, and the method used to determine the expenses and profit.The Board concluded that the profitability results were not unreasonable, given the services rendered and service levels provided by Dreyfus.The Board also noted the fee waiver arrangement and its effect on Dreyfus’ profitability.The Board also had been provided with information prepared by an independent consulting firm regarding Dreyfus’ approach to allocating costs to, and determining the profitability of, individual funds and the entire Dreyfus fund complex.The consulting firm also had analyzed where any economies of scale might emerge in connection with the management of a fund.
The Board’s counsel stated that the Board should consider the profitability analysis (1) as part of the evaluation of whether the fees under the Agreement bear a reasonable relationship to the mix of services provided by Dreyfus, including the nature, extent and quality of such services, and (2) in light of the relevant circumstances for the fund and the extent to which economies of scale would be realized if the fund grows and whether fee levels reflect these economies of scale for the benefit of fund shareholders. Dreyfus representatives noted that a discussion of economies of scale is predicated on a fund having achieved a substantial size with increasing assets and that, if a fund’s assets had been stable or decreasing, the possibility that Dreyfus may have realized any economies of scale would be less. Dreyfus representatives also noted that, as a result of shared and allocated costs among funds in the Dreyfus fund complex, the extent of economies of scale could depend substantially on the level of assets in the complex as a whole, so that increases and decreases in complex-wide assets can affect potential economies of scale in a manner that is disproportionate to, or even in the opposite direction from, changes in the fund’s asset level. The Board also considered potential benefits to Dreyfus from acting as investment adviser and noted the soft dollar arrangements in effect for trading the fund’s investments.
The Fund 39
INFORMATION ABOUT THE RENEWAL OF THE FUND’S
MANAGEMENT AGREEMENT (Unaudited) (continued)
At the conclusion of these discussions, the Board agreed that it had been furnished with sufficient information to make an informed business decision with respect to the renewal of the Agreement. Based on the discussions and considerations as described above, the Board concluded and determined as follows.
The Board concluded that the nature, extent and quality of the services provided by Dreyfus are adequate and appropriate.
The Board agreed to closely monitor performance and determined to approve renewal of the Agreement only through September 30, 2013.
The Board concluded that the fee paid to Dreyfus was reasonable in light of the considerations described above.
The Board determined that the economies of scale which may accrue to Dreyfus and its affiliates in connection with the management of the fund had been adequately considered by Dreyfus in connection with the fee rate charged to the fund pursuant to the Agreement and that, to the extent in the future it were determined that material economies of scale had not been shared with the fund, the Board would seek to have those economies of scale shared with the fund.
In evaluating the Agreement, the Board considered these conclusions and determinations and also relied on its previous knowledge, gained through meetings and other interactions with Dreyfus and its affiliates, of the fund and the services provided to the fund by Dreyfus. The Board also relied on information received on a routine and regular basis throughout the year relating to the operations of the fund and the investment management and other services provided under the Agreement, including information on the investment performance of the fund in comparison to similar mutual funds and benchmark performance indices; general market outlook as applicable to the fund;
40
and compliance reports. In addition, it should be noted that the Board’s consideration of the contractual fee arrangements for this fund had the benefit of a number of years of reviews of prior or similar agreements during which lengthy discussions took place between the Board and Dreyfus representatives. Certain aspects of the arrangements may receive greater scrutiny in some years than in others, and the Board’s conclusions may be based, in part, on their consideration of the same or similar arrangements in prior years.The Board determined that renewal of the Agreement through September 30, 2013 was in the best interests of the fund and its shareholders.
The Fund 41
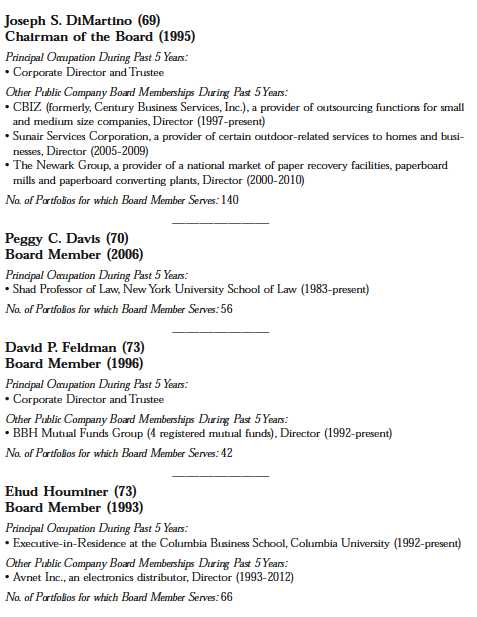
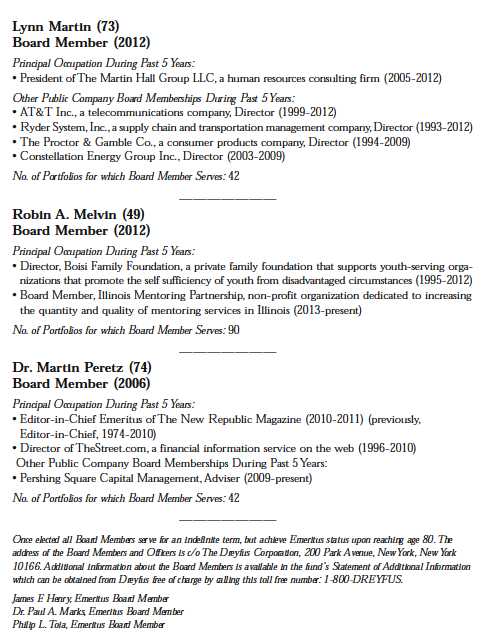
BOARD MEMBERS INFORMATION (Unaudited)
42
The Fund 43
OFFICERS OF THE FUND (Unaudited)
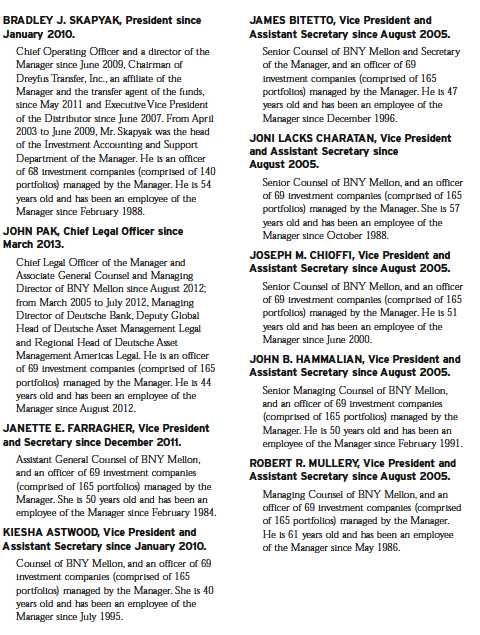
44

The Fund 45
Save time. Save paper. View your next shareholder report online as soon as it’s available. Log into www.dreyfus.com and sign up for Dreyfus eCommunications. It’s simple and only takes a few minutes.
The views expressed in this report reflect those of the portfolio manager only through the end of the period covered and do not necessarily represent the views of Dreyfus or any other person in the Dreyfus organization. Any such views are subject to change at any time based upon market or other conditions and Dreyfus disclaims any responsibility to update such views.These views may not be relied on as investment advice and, because investment decisions for a Dreyfus fund are based on numerous factors, may not be relied on as an indication of trading intent on behalf of any Dreyfus fund.
| | Contents |
| | THE FUND |
| 2 | A Letter from the President |
| 3 | Discussion of Fund Performance |
| 6 | Fund Performance |
| 8 | Understanding Your Fund’s Expenses |
| 8 | Comparing Your Fund’s Expenses With Those of Other Funds |
| 9 | Statement of Investments |
| 13 | Statement of Assets and Liabilities |
| 14 | Statement of Operations |
| 15 | Statement of Changes in Net Assets |
| 17 | Financial Highlights |
| 21 | Notes to Financial Statements |
| 31 | Report of Independent Registered Public Accounting Firm |
| 32 | Important Tax Information |
| 33 | Information About the Renewal of the Fund’s Management Agreement |
| 38 | Board Members Information |
| 40 | Officers of the Fund |
| | FOR MORE INFORMATION |
| | Back Cover |
Dreyfus
Opportunistic
Midcap Value Fund
The Fund
A LETTER FROM THE PRESIDENT
Dear Shareholder:
We are pleased to present this annual report for Dreyfus Opportunistic MidcapValue Fund, covering the 12-month period from September 1, 2012, through August 31, 2013. For information about how the fund performed during the reporting period, as well as general market perspectives, we provide a Discussion of Fund Performance on the pages that follow.
U.S. equities fared quite well over the past year, weathering periodic bouts of volatility after setting new record highs in the spring for many broad measures of stock market performance. Low interest rates, muted inflationary pressures, and a strong U.S. dollar helped fuel the market’s gains, as did a declining unemployment rate, rebounding housing markets, and increased production of domestic oil and natural gas.
In our analysis, the U.S. economy is nearing an inflection point to a somewhat faster growth rate.We expect a reduced fiscal drag in 2014 and beyond, and the stimulative monetary policy of the past five years should continue to support economic expansion, particularly in interest rate-sensitive industry groups. For information on how these developments may affect your investments, we urge you to discuss these matters with your financial advisor.
Thank you for your continued confidence and support.
Sincerely,

J. Charles Cardona
President
The Dreyfus Corporation
September 16, 2013
2
DISCUSSION OF FUND PERFORMANCE
For the period of September 1, 2012, through August 31, 2013, as provided by David A. Daglio, Primary Portfolio Manager
Fund and Market Performance Overview
For the 12-month period ended August 31, 2013, Dreyfus Opportunistic Midcap Value Fund’s Class A shares produced a total return of 30.11%, Class C shares returned 29.13% and Class I shares returned 30.26%.1 In comparison, the fund’s benchmark, the Russell Midcap® Value Index (the “Index”), produced a 25.37% total return for the same period.2 The fund’s ClassY shares produced a total return of 1.74% for the period since its inception of July 1, 2013, through August 31, 2013.
Midcap stocks rallied strongly over the reporting period as investors responded positively to improving economic data.The fund produced higher returns than its benchmark over the full reporting period, primarily due to the success of its security selection strategy in the financials, consumer discretionary and energy sectors as well as its large underweight of the weak performing REIT and utilities sectors.
The Fund’s Investment Approach
The fund seeks to surpass the performance of the Index by investing in midcap companies, which we consider as having market capitalizations between $1 billion and $25 billion at the time of purchase.We identify potential investments through extensive fundamental research conducted by the team’s dedicated sector specialists.
When selecting stocks, the fund will focus on individual stock selection, emphasizing three key factors: discount from intrinsic valuation, strong mid-cycle fundamentals, and a revaluation catalyst.
We typically sell a stock when we no longer consider it attractively valued, it shows deteriorating fundamentals, the revaluation catalyst becomes impaired, or a better risk/reward opportunity is presented.
Recovering Economy Fueled Market Gains
The reporting period began near the outset of a sustained stock market rally driven by improving economic fundamentals. Investors responded positively to several economic trends, most notably improved U.S. employment and housing market data. In addition, investors were encouraged by an aggressively accommodative monetary policy from the Federal Reserve Board (the “Fed”), including the launch of a new round of quantitative easing involving monthly purchases of $85 billion of U.S. government
The Fund 3
DISCUSSION OF FUND PERFORMANCE (continued)
securities over an indefinite time frame. Improving conditions in overseas markets also contributed to greater investor optimism.
Economic data continued to improve, and stocks generally continued to rally through the spring of 2013. Consequently, by mid-May several broad measures of stock market performance reached new record highs. In late May, remarks by Fed chairman Ben Bernanke were widely interpreted as a signal that U.S. monetary policymakers were likely to back away from their quantitative easing program sooner than many had expected.As a result, most financial markets encountered heightened volatility in June, erasing some of the stock market’s previous gains. Moreover, investors began to turn away from relatively conservative, dividend-paying stocks and toward more speculative growth stocks, particularly those of companies considered more economically sensitive, including midcap companies. Equity markets generally stabilized in July and August when investors realized that an end to quantitative easing would not necessarily portend higher short-term interest rates, and they returned their focus to company and market fundamentals.
Strong Stock Selections in Several Sectors Drove Gains
Financials were the top contributing sector to performance, but it was our valuation discipline keeping REITs out of the fund that helped the most. By the team’s estimates, midcap REITs have been trading above their intrinsic values and therefore excluded from ownership in the fund. This positioning has been a headwind to performance when REITs have been strong performers, but our conviction was rewarded in the past 12 months. On plan with our long-term expectations, online brokerage firms TD Ameritrade Holding and E*TRADE Financial reported rising trading volumes as investors began to shift assets from fixed-income securities into equities. Insurance firm Principal Financial Group posted a strong increase in assets under management.
Attractive mid-cycle fundamentals and large discounts from intrinsic value led the fund to significantly overweight exposure to automotive suppliers in the consumer discretionary sector. Automotive suppliers Dana Holding, TRW Automotive Holdings, and Delphi Automotive appreciated as the companies began to approach our long-standing sales and profit margin forecasts. Per our investment theses, floor coverings manufacturer Mohawk Industries and homebuilders PulteGroup and D.R. Horton proved well positioned for recovering housing markets and rising home prices. Among retailers, home improvement chain Lowe’s and kitchenware seller Williams-Sonoma benefited from the housing rebound and strong Internet sales, respectively. Housewares maker Newell Rubbermaid continued to execute on its five-year plan to concentrate its product portfolio and raise profit margins.
4
Among energy companies, Cabot Oil & Gas and Pioneer Natural Resources discovered new North American oil and gas resources and achieved better-than-expected drilling results from exploratory wells.
Disappointments during the reporting period were concentrated mainly in the information technology sector, where semiconductor maker Broadcom’s new product development efforts fell short of expectations. In addition, reservations systems developer MICROS Systems encountered intensifying competitive pressures, building design software developer Autodesk encountered soft commercial construction trends, and rising order volumes have not yet materialized for communications equipment manufacturer JDS Uniphase and networking specialist Juniper Networks.
Finding Ample Opportunities Among Individual Stocks
After the strong performance gains over the past two years, the midcap landscape has become more selective. Investor skepticism about near term earning prospects has created meaningful discounts from intrinsic valuations for many companies in the technology, financials and industrial sectors.We believe the pending recovery in CEO business confidence will produce higher levels of discretionary spending which will benefit each of these industries and is reflected in the fund’s positioning. In addition, overlooked opportunities have quietly appeared in the health care sector.
On the other hand, market interest for higher yielding stocks has elevated valuations for many stocks in the consumer staples, utilities, telecommunication services and REIT areas to the point where the stocks do not meet our investment disciplines.
September 16, 2013
Please note, the position in any security highlighted with italicized typeface was sold during the reporting period. Equity funds are subject generally to market, market sector, market liquidity, issuer and investment style risks, among other factors, to varying degrees, all of which are more fully described in the fund’s prospectus.
Stocks of small- and/or midcap companies often experience sharper price fluctuations than stocks of large-cap companies.
|
| 1 Total return includes reinvestment of dividends and any capital gains paid and does not take into consideration the |
| maximum initial sales charge in the case of Class A shares, or the applicable contingent deferred sales charge imposed |
| on redemptions in the case of Class C shares. Had these charges been reflected, returns would have been lower. Past |
| performance is no guarantee of future results. Share price and investment return fluctuate such that upon redemption, |
| fund shares may be worth more or less than their original cost. |
| 2 SOURCE: LIPPER INC. — Reflects reinvestment of dividends and, where applicable, capital gain distributions. |
| The Russell Midcap® Value Index is a widely accepted, unmanaged index of medium-cap stock market performance |
| and measures the performance of those Russell midcap companies with lower price-to-book ratios and lower forecasted |
| growth values. Investors cannot invest directly in any index. |
The Fund 5

Past performance is not predictive of future performance.
The above graph compares a $10,000 investment made in each of the Class A, Class C, Class I and ClassY shares of Dreyfus Opportunistic Midcap Value Fund on 8/31/03 to a $10,000 investment made in the Russell Midcap Value Index (the “Index”) on that date.All dividends and capital gain distributions are reinvested.
On June 18, 2013, the Board authorized the fund to offer ClassY shares, as a new class of shares, to certain investors, including certain institutional investors. On July 1, 2013, ClassY shares were offered at net asset value and are not subject to certain fees, including Distribution Plan and Shareholder Services Plan fees.
The fund’s performance shown in the line graph above takes into account the maximum initial sales charge on Class A shares and all other applicable fees and expenses on all classes.The Index is a widely accepted, unmanaged index of medium-cap stock market performance and measures the performance of those Russell Midcap companies with lower price-to-book ratios and lower forecasted growth values. Unlike a mutual fund, the Index is not subject to charges, fees and other expenses. Investors cannot invest directly in any index. Further information relating to fund performance, including expense reimbursements, if applicable, is contained in the Financial Highlights section of the prospectus and elsewhere in this report.
6
Average Annual Total Returns as of 8/31/13
| | | | | | | |
|
| | Inception Date | 1 Year | | 5 Years | | 10 Years | |
| Class A shares | | | | | | | |
| with maximum sales charge (5.75%) | 9/29/95 | 22.63 | % | 10.93 | % | 10.22 | % |
| without sales charge | 9/29/95 | 30.11 | % | 12.25 | % | 10.88 | % |
| Class C shares | | | | | | | |
| with applicable redemption charge † | 5/30/08 | 28.13 | % | 11.34 | % | 10.40 | %†† |
| without redemption | 5/30/08 | 29.13 | % | 11.34 | % | 10.40 | %†† |
| Class I shares | 5/30/08 | 30.26 | % | 12.51 | % | 11.00 | %†† |
| Class Y shares | 7/1/13 | 29.64 | %†† | 12.17 | %†† | 10.83 | %†† |
| Russell Midcap Value Index | | 25.37 | % | 8.87 | % | 10.37 | % |
Past performance is not predictive of future performance.The fund’s performance shown in the graph and table does not reflect the deduction of taxes that a shareholder would pay on fund distributions or the redemption of fund shares.
| |
| † | The maximum contingent deferred sales charge for Class C shares is 1% for shares redeemed within one year of the |
| | date of purchase. |
| †† | The total return performance figures presented for Class C shares of the fund reflect the performance of the fund’s |
| | Class A shares for the period prior to 5/30/08 (the inception date for Class C shares). |
| | The total return performance figures presented for Class I shares of the fund reflect the performance of the fund’s |
| | Class A shares for the period prior to 5/30/08 (the inception date for Class I shares). |
| | The total return performance figures presented for ClassY shares of the fund reflect the performance of the fund’s |
| | Class A shares for the period prior to 7/1/13 (the inception date for ClassY shares). |
The Fund 7
UNDERSTANDING YOUR FUND’S EXPENSES (Unaudited)
As a mutual fund investor, you pay ongoing expenses, such as management fees and other expenses. Using the information below, you can estimate how these expenses affect your investment and compare them with the expenses of other funds.You also may pay one-time transaction expenses, including sales charges (loads) and redemption fees, which are not shown in this section and would have resulted in higher total expenses. For more information, see your fund’s prospectus or talk to your financial adviser.
Review your fund’s expenses
The table below shows the expenses you would have paid on a $1,000 investment in Dreyfus Opportunistic MidcapValue Fund from March 1, 2013 to August 31, 2013. It also shows how much a $1,000 investment would be worth at the close of the period, assuming actual returns and expenses.
Expenses and Value of a $1,000 Investment
assuming actual returns for the six months ended August 31, 2013†
| | | | | | | | |
| | | Class A | | Class C | | Class I | | Class Y |
| Expenses paid per $1,000†† | $ | 6.24 | $ | 10.23 | $ | 4.87 | $ | 1.35 |
| Ending value (after expenses) | $ | 1,096.90 | $ | 1,092.70 | $ | 1,098.20 | $ | 1,017.40 |
COMPARING YOUR FUND’S EXPENSES
WITH THOSE OF OTHER FUNDS (Unaudited)
Using the SEC’s method to compare expenses
The Securities and Exchange Commission (SEC) has established guidelines to help
investors assess fund expenses. Per these guidelines, the table below shows your fund’s
expenses based on a $1,000 investment, assuming a hypothetical 5% annualized return.
You can use this information to compare the ongoing expenses (but not transaction
expenses or total cost) of investing in the fund with those of other funds.All mutual fund
shareholder reports will provide this information to help you make this comparison.
Please note that you cannot use this information to estimate your actual ending account
balance and expenses paid during the period.
Expenses and Value of a $1,000 Investment
assuming a hypothetical 5% annualized return for the six months ended August 31, 2013
| | | | | | | | |
| | | Class A | | Class C | | Class I | | Class Y |
| Expenses paid per $1,000†††† | $ | 6.01 | $ | 9.86 | $ | 4.69 | $ | 4.08 |
| Ending value (after expenses) | $ | 1,019.26 | $ | 1,015.43 | $ | 1,020.57 | $ | 1,021.17 |
| |
| † | From July 1, 2013 (commencement of initial offering) to August 31, 2013 for ClassY shares. |
| †† | Expenses are equal to the fund’s annualized expense ratio of 1.18% for Class A, 1.94% for Class C and .92% for |
| | Class I, multiplied by the average account value over the period, multiplied by 184/365 (to reflect the one-half year |
| | period). Expenses are equal to the fund’s annualized expense ratio of .80% for Class Y, multiplied by the average |
| | account value over the period, multiplied by 61/365 (to reflect the actual days in the period). |
| ††† | Please note that while ClassY shares commenced operations on July 1, 2013, the hypothetical expenses paid during |
| | the period reflect projected activity for the full six month period for purposes of comparability.This projection assumes |
| | that annualized expense ratios were in effect during the period March 1, 2013 to August 31, 2013. |
| †††† | Expenses are equal to the fund’s annualized expense ratio of 1.18% for Class A, 1.94% for Class C, .92% for |
| | Class I and .80% for Class Y, multiplied by the average account value over the period, multiplied by 184/365 (to |
| | reflect the one-half year period). |
8
STATEMENT OF INVESTMENTS
August 31, 2013
| | | | |
| Common Stocks—100.2% | Shares | | | Value ($) |
| Automobiles & Components—7.0% | | | | |
| BorgWarner | 165,810 | | | 16,013,930 |
| Dana Holding | 751,657 | | | 15,754,731 |
| Delphi Automotive | 680,522 | | | 37,442,320 |
| Lear | 348,080 | | | 23,930,500 |
| TRW Automotive Holdings | 648,878 | a | | 44,818,003 |
| | | | | 137,959,484 |
| Banks—6.5% | | | | |
| Comerica | 1,084,050 | | | 44,272,602 |
| Fifth Third Bancorp | 1,623,800 | | | 29,699,302 |
| SunTrust Banks | 1,727,360 | | | 55,310,067 |
| | | | | 129,281,971 |
| Capital Goods—11.7% | | | | |
| Ingersoll-Rand | 1,007,790 | | | 59,600,701 |
| MSC Industrial Direct, Cl. A | 228,850 | | | 17,392,600 |
| PACCAR | 370,000 | b | 19,835,700 |
| Parker Hannifin | 574,870 | | | 57,458,256 |
| Regal-Beloit | 631,058 | | | 40,198,395 |
| Trinity Industries | 869,510 | | | 36,710,712 |
| | | | | 231,196,364 |
| Commercial & Professional Services—1.5% | | | | |
| Equifax | 496,080 | | | 29,313,367 |
| Consumer Durables & Apparel—2.9% | | | | |
| Michael Kors Holdings | 144,700 | a | 10,720,823 |
| Mohawk Industries | 99,352 | a | 11,672,866 |
| Newell Rubbermaid | 1,107,270 | | | 28,013,931 |
| Toll Brothers | 263,800 | a | 8,074,918 |
| | | | | 58,482,538 |
| Diversified Financials—11.7% | | | | |
| Blackstone Group | 451,290 | | | 9,856,174 |
| CME Group | 430,060 | | | 30,581,567 |
| E*TRADE Financial | 2,953,520 | a | | 41,467,421 |
| Invesco | 1,904,680 | | | 57,826,085 |
| Northern Trust | 276,570 | | | 15,175,396 |
| TD Ameritrade Holding | 3,020,530 | | | 77,537,005 |
| | | | | 232,443,648 |
The Fund 9
STATEMENT OF INVESTMENTS (continued)
| | | | |
| Common Stocks (continued) | Shares | | | Value ($) |
| Energy—4.3% | | | | |
| National Oilwell Varco | 157,590 | | | 11,708,937 |
| Pioneer Natural Resources | 139,090 | | | 24,336,577 |
| Range Resources | 396,040 | | | 29,695,079 |
| Weatherford International | 1,354,620 | a | | 20,197,384 |
| | | | | 85,937,977 |
| Exchange-Traded Funds—1.5% | | | | |
| Standard & Poor’s Depository | | | | |
| Receipts S&P MidCap 400 ETF Trust | 136,330 | | | 29,372,299 |
| Health Care Equipment & | | | | |
| Services—6.2% | | | | |
| CareFusion | 500,400 | a | | 17,939,340 |
| Cigna | 712,350 | | | 56,054,821 |
| MEDNAX | 502,930 | a | | 48,970,294 |
| | | | | 122,964,455 |
| Household & Personal Products—1.9% | | | | |
| Avon Products | 1,900,020 | | | 37,563,395 |
| Insurance—3.4% | | | | |
| Brown & Brown | 245,710 | | | 7,651,409 |
| Hartford Financial Services Group | 1,245,670 | | | 36,871,832 |
| Principal Financial Group | 567,510 | | | 23,222,509 |
| | | | | 67,745,750 |
| Materials—4.9% | | | | |
| Sherwin-Williams | 317,930 | | | 54,811,132 |
| Valspar | 693,950 | | | 43,135,932 |
| | | | | 97,947,064 |
| Media—.6% | | | | |
| Scripps Networks Interactive, Cl. A | 165,810 | | | 12,192,009 |
| Pharmaceuticals, Biotech & | | | | |
| Life Sciences—7.4% | | | | |
| Agilent Technologies | 683,820 | | | 31,893,365 |
| Covance | 262,420 | a | | 21,266,517 |
| Cubist Pharmaceuticals | 626,260 | a | | 39,679,834 |
| Perrigo | 218,570 | b | | 26,567,184 |
| Salix Pharmaceuticals | 396,720 | a | | 26,556,437 |
| | | | | 145,963,337 |
10
| | | |
| Common Stocks (continued) | Shares | | Value ($) |
| Retailing—5.2% | | | |
| Lowe’s | 346,640 | | 15,883,045 |
| Staples | 2,576,950 | b | 35,845,375 |
| Tiffany & Co. | 248,720 | | 19,178,799 |
| Williams-Sonoma | 581,040 | | 32,776,466 |
| | | | 103,683,685 |
| Semiconductors & Semiconductor Equipment—1.1% | | | |
| Xilinx | 485,110 | | 21,063,476 |
| Software & Services—5.8% | | | |
| Akamai Technologies | 186,370 | a | 8,569,293 |
| Autodesk | 792,420 | a | 29,121,435 |
| DST Systems | 88,390 | | 6,308,394 |
| Intuit | 1,105,890 | | 70,257,192 |
| | | | 114,256,314 |
| Technology Hardware & Equipment—12.6% | | | |
| Arrow Electronics | 454,970 | a | 21,119,707 |
| Avnet | 1,992,523 | | 76,831,687 |
| FLIR Systems | 186,370 | | 5,829,654 |
| JDS Uniphase | 3,533,563 | a | 45,335,613 |
| Juniper Networks | 2,421,450 | a | 45,765,405 |
| SanDisk | 391,120 | | 21,582,002 |
| Seagate Technology | 693,730 | | 26,583,734 |
| TE Connectivity | 150,880 | | 7,393,120 |
| | | | 250,440,922 |
| Transportation—2.8% | | | |
| Kirby | 685,870 | a | 55,164,524 |
| Utilities—1.2% | | | |
| Great Plains Energy | 1,092,873 | | 23,955,776 |
| Total Common Stocks | | | |
| (cost $1,633,333,026) | | | 1,986,928,355 |
| |
| Other Investment—.3% | | | |
| Registered Investment Company; | | | |
| Dreyfus Institutional Preferred | | | |
| Plus Money Market Fund | | | |
| (cost $5,483,034) | 5,483,034 | c | 5,483,034 |
The Fund 11
STATEMENT OF INVESTMENTS (continued)
| | | | |
| Investment of Cash Collateral | | | | |
| for Securities Loaned—1.1% | Shares | | Value ($) | |
| Registered Investment Company; | | | | |
| Dreyfus Institutional Cash | | | | |
| Advantage Fund�� | | | | |
| (cost $21,355,497) | 21,355,497 | c | 21,355,497 | |
| |
| Total Investments (cost $1,660,171,557) | 101.6 | % | 2,013,766,886 | |
| Liabilities, Less Cash and Receivables | (1.6 | %) | (30,881,867 | ) |
| Net Assets | 100.0 | % | 1,982,885,019 | |
ETF—Exchange Traded Fund
|
| a Non-income producing security. |
| b Security, or portion thereof, on loan.At August 31, 2013, the value of the fund’s securities on loan was |
| $55,665,869 and the value of the collateral held by the fund was $57,006,525, consisting of cash collateral of |
| $21,355,497 and U.S. Government and Agency securities valued at $35,651,028. |
| c Investment in affiliated money market mutual fund. |
| | | |
| Portfolio Summary (Unaudited)† | | |
| |
| | Value (%) | | Value (%) |
| Technology Hardware & Equipment | 12.6 | Insurance | 3.4 |
| Capital Goods | 11.7 | Consumer Durables & Apparel | 2.9 |
| Diversified Financials | 11.7 | Transportation | 2.8 |
| Pharmaceuticals, Biotech & | | Household & Personal Products | 1.9 |
| Life Sciences | 7.4 | Commercial & Professional Services | 1.5 |
| Automobiles & Components | 7.0 | Exchange-Traded Funds | 1.5 |
| Banks | 6.5 | Money Market Investments | 1.4 |
| Health Care Equipment & Services | 6.2 | Utilities | 1.2 |
| Software & Services | 5.8 | Semiconductors & Semiconductor | |
| Retailing | 5.2 | Equipment | 1.1 |
| Materials | 4.9 | Media | .6 |
| Energy | 4.3 | | 101.6 |
|
| † Based on net assets. |
| See notes to financial statements. |
12
STATEMENT OF ASSETS AND LIABILITIES
August 31, 2013
| | | | | |
| | | | Cost | | Value |
| Assets ($): | | | | | |
| Investments in securities—See Statement of Investments (including | | | |
| securities on loan, valued at $55,665,869)—Note 1(b): | | | |
| Unaffiliated issuers | | 1,633,333,026 | 1,986,928,355 |
| Affiliated issuers | | | 26,838,531 | 26,838,531 |
| Cash | | | | | 4,736,619 |
| Receivable for investment securities sold | | | 18,613,236 |
| Dividends and securities lending income receivable | | | | 2,134,535 |
| Receivable for shares of Common Stock subscribed | | | | 1,726,365 |
| Prepaid expenses | | | | | 148,764 |
| | | | | 2,041,126,405 |
| Liabilities ($): | | | | | |
| Due to The Dreyfus Corporation and affiliates—Note 3(c) | | | | 1,654,751 |
| Payable for investment securities purchased | | | 22,183,585 |
| Liability for securities on loan—Note 1(b) | | | 21,355,497 |
| Payable for shares of Common Stock redeemed | | | 12,040,015 |
| Accrued expenses | | | | | 1,007,538 |
| | | | | 58,241,386 |
| Net Assets ($) | | | | 1,982,885,019 |
| Composition of Net Assets ($): | | | | | |
| Paid-in capital | | | | 1,472,485,936 |
| Accumulated undistributed investment income—net | | | | 1,799,151 |
| Accumulated net realized gain (loss) on investments | | | 155,004,603 |
| Accumulated net unrealized appreciation | | | | |
| (depreciation) on investments | | | | 353,595,329 |
| Net Assets ($) | | | | 1,982,885,019 |
| |
| |
| Net Asset Value Per Share | | | | | |
| | Class A | Class C | Class I | Class Y |
| Net Assets ($) | 1,079,345,890 | 46,708,247 | 856,829,865 | 1,017 |
| Shares Outstanding | 28,204,989 | 1,281,940 | 22,476,975 | 26.68 |
| Net Asset Value Per Share ($) | 38.27 | 36.44 | 38.12 | 38.12 |
See notes to financial statements.
The Fund 13
STATEMENT OF OPERATIONS
Year Ended August 31, 2013
| | |
| Investment Income ($): | | |
| Income: | | |
| Cash dividends (net of $365,925 foreign taxes withheld at source): | | |
| Unaffiliated issuers | 19,828,879 | |
| Affiliated issuers | 14,576 | |
| Income from securities lending—Note 1(b) | 117,435 | |
| Total Income | 19,960,890 | |
| Expenses: | | |
| Management fee—Note 3(a) | 11,916,347 | |
| Shareholder servicing costs—Note 3(c) | 5,223,410 | |
| Distribution fees—Note 3(b) | 229,493 | |
| Prospectus and shareholders’ reports | 201,048 | |
| Directors’ fees and expenses—Note 3(d) | 145,308 | |
| Registration fees | 141,929 | |
| Professional fees | 137,236 | |
| Custodian fees—Note 3(c) | 91,641 | |
| Loan commitment fees—Note 2 | 11,614 | |
| Interest expense—Note 2 | 1,970 | |
| Miscellaneous | 42,094 | |
| Total Expenses | 18,142,090 | |
| Less—reduction in fees due to earnings credits—Note 3(c) | (959 | ) |
| Net Expenses | 18,141,131 | |
| Investment Income—Net | 1,819,759 | |
| Realized and Unrealized Gain (Loss) on Investments—Note 4 ($): | | |
| Net realized gain (loss) on investments | 208,288,105 | |
| Net unrealized appreciation (depreciation) on investments | 177,407,747 | |
| Net Realized and Unrealized Gain (Loss) on Investments | 385,695,852 | |
| Net Increase in Net Assets Resulting from Operations | 387,515,611 | |
See notes to financial statements.
14
STATEMENT OF CHANGES IN NET ASSETS
| | | | |
| | Year Ended August 31, | |
| | 2013 | a | 2012 | |
| Operations ($): | | | | |
| Investment income—net | 1,819,759 | | 2,982,117 | |
| Net realized gain (loss) on investments | 208,288,105 | | (32,907,887 | ) |
| Net unrealized appreciation | | | | |
| (depreciation) on investments | 177,407,747 | | 167,437,544 | |
| Net Increase (Decrease) in Net Assets | | | | |
| Resulting from Operations | 387,515,611 | | 137,511,774 | |
| Dividends to Shareholders from ($): | | | | |
| Investment income—net: | | | | |
| Class A | (2,250,632 | ) | (6,968,729 | ) |
| Class C | — | | (120,754 | ) |
| Class I | (712,158 | ) | (1,673,307 | ) |
| Net realized gain on investments: | | | | |
| Class A | — | | (146,600,210 | ) |
| Class C | — | | (3,673,141 | ) |
| Class I | — | | (20,560,305 | ) |
| Total Dividends | (2,962,790 | ) | (179,596,446 | ) |
| Capital Stock Transactions ($): | | | | |
| Net proceeds from shares sold: | | | | |
| Class A | 586,026,538 | | 172,558,017 | |
| Class C | 23,028,774 | | 7,073,356 | |
| Class I | 709,035,073 | | 139,761,227 | |
| Class Y | 1,000 | | — | |
| Dividends reinvested: | | | | |
| Class A | 2,144,543 | | 146,128,147 | |
| Class C | — | | 2,928,375 | |
| Class I | 643,459 | | 19,261,309 | |
| Cost of shares redeemed: | | | | |
| Class A | (775,639,557 | ) | (362,373,315 | ) |
| Class C | (5,648,963 | ) | (8,788,493 | ) |
| Class I | (98,634,591 | ) | (76,966,999 | ) |
| Increase (Decrease) in Net Assets | | | | |
| from Capital Stock Transactions | 440,956,276 | | 39,581,624 | |
| Total Increase (Decrease) in Net Assets | 825,509,097 | | (2,503,048 | ) |
| Net Assets ($): | | | | |
| Beginning of Period | 1,157,375,922 | | 1,159,878,970 | |
| End of Period | 1,982,885,019 | | 1,157,375,922 | |
| Undistributed investment income—net | 1,799,151 | | 2,942,182 | |
The Fund 15
STATEMENT OF CHANGES IN NET ASSETS (continued)
| | | | |
| | Year Ended August 31, | |
| | 2013 | a | 2012 | |
| Capital Share Transactions: | | | | |
| Class Ab | | | | |
| Shares sold | 17,059,067 | | 5,929,326 | |
| Shares issued for dividends reinvested | 67,523 | | 5,708,411 | |
| Shares redeemed | (22,163,606 | ) | (12,297,778 | ) |
| Net Increase (Decrease) in Shares Outstanding | (5,037,016 | ) | (660,041 | ) |
| Class Cb | | | | |
| Shares sold | 659,569 | | 255,770 | |
| Shares issued for dividends reinvested | — | | 118,757 | |
| Shares redeemed | (176,151 | ) | (314,922 | ) |
| Net Increase (Decrease) in Shares Outstanding | 483,418 | | 59,605 | |
| Class I | | | | |
| Shares sold | 19,936,580 | | 4,601,410 | |
| Shares issued for dividends reinvested | 20,369 | | 755,923 | |
| Shares redeemed | (2,763,470 | ) | (2,638,026 | ) |
| Net Increase (Decrease) in Shares Outstanding | 17,193,479 | | 2,719,307 | |
| Class Y | | | | |
| Shares sold | 26.68 | | — | |
|
| a Effective July 1, 2013, the fund commenced offering ClassY shares. |
| b During the period ended August 31, 2013, 11,964 Class C shares representing $429,516 were exchanged for |
| 11,414 Class A shares. |
16
FINANCIAL HIGHLIGHTS
The following tables describe the performance for each share class for the fiscal periods indicated.All information (except portfolio turnover rate) reflects financial results for a single fund share.Total return shows how much your investment in the fund would have increased (or decreased) during each period, assuming you had reinvested all dividends and distributions.These figures have been derived from the fund’s financial statements.
| | | | | | | | | |
| | | | | | Year Ended August 31, | | | |
| Class A Shares | 2013 | | 2012 | | 2011 | 2010 | | 2009 | |
| Per Share Data ($): | | | | | | | | | |
| Net asset value, | | | | | | | | | |
| beginning of period | 29.47 | | 31.19 | | 26.65 | 24.03 | | 25.95 | |
| Investment Operations: | | | | | | | | | |
| Investment income (loss)—neta | .03 | | .07 | | .22 | (.01 | ) | .09 | |
| Net realized and unrealized | | | | | | | | | |
| gain (loss) on investments | 8.83 | | 3.34 | | 4.32 | 2.70 | b | (1.98 | ) |
| Total from Investment Operations | 8.86 | | 3.41 | | 4.54 | 2.69 | | (1.89 | ) |
| Distributions: | | | | | | | | | |
| Dividends from | | | | | | | | | |
| investment income—net | (.06 | ) | (.23 | ) | — | (.07 | ) | (.03 | ) |
| Dividends from net realized | | | | | | | | | |
| gain on investments | — | | (4.90 | ) | — | — | | — | |
| Total Distributions | (.06 | ) | (5.13 | ) | — | (.07 | ) | (.03 | ) |
| Net asset value, end of period | 38.27 | | 29.47 | | 31.19 | 26.65 | | 24.03 | |
| Total Return (%)c | 30.11 | | 13.44 | | 17.03 | 11.20 | | (7.22 | ) |
| Ratios/Supplemental Data (%): | | | | | | | | | |
| Ratio of total expenses | | | | | | | | | |
| to average net assets | 1.18 | | 1.22 | | 1.17 | 1.18 | | 1.23 | |
| Ratio of net expenses | | | | | | | | | |
| to average net assets | 1.18 | | 1.22 | | 1.17 | 1.18 | | 1.22 | |
| Ratio of net investment income | | | | | | | | | |
| (loss) to average net assets | .08 | | .25 | | .64 | (.02 | ) | .48 | |
| Portfolio Turnover Rate | 91.31 | | 71.25 | | 114.02 | 122.17 | | 170.88 | |
| Net Assets, end of period | | | | | | | | | |
| ($ x 1,000) | 1,079,346 | | 979,628 | | 1,057,495 | 1,068,338 | | 947,716 | |
|
| a Based on average shares outstanding at each month end. |
| b Amount includes litigation proceeds received by the fund amounting to $.02 per share. |
| c Exclusive of sales charge. |
See notes to financial statements.
The Fund 17
FINANCIAL HIGHLIGHTS (continued)
| | | | | | | | | | |
| | | | Year Ended August 31, | | | |
| Class C Shares | 2013 | | 2012 | | 2011 | | 2010 | | 2009 | |
| Per Share Data ($): | | | | | | | | | | |
| Net asset value, beginning of period | 28.22 | | 30.24 | | 26.05 | | 23.72 | | 25.89 | |
| Investment Operations: | | | | | | | | | | |
| Investment (loss)—neta | (.24 | ) | (.16 | ) | (.16 | ) | (.23 | ) | (.10 | ) |
| Net realized and unrealized | | | | | | | | | | |
| gain (loss) on investments | 8.46 | | 3.20 | | 4.35 | | 2.67 | b | (1.99 | ) |
| Total from Investment Operations | 8.22 | | 3.04 | | 4.19 | | 2.44 | | (2.09 | ) |
| Distributions: | | | | | | | | | | |
| Dividends from investment income—net | — | | (.16 | ) | — | | (.11 | ) | (.08 | ) |
| Dividends from net realized | | | | | | | | | | |
| gain on investments | — | | (4.90 | ) | — | | — | | — | |
| Total Distributions | — | | (5.06 | ) | — | | (.11 | ) | (.08 | ) |
| Net asset value, end of period | 36.44 | | 28.22 | | 30.24 | | 26.05 | | 23.72 | |
| Total Return (%)c | 29.13 | | 12.48 | | 16.09 | | 10.29 | | (7.98 | ) |
| Ratios/Supplemental Data (%): | | | | | | | | | | |
| Ratio of total expenses | | | | | | | | | | |
| to average net assets | 1.97 | | 2.03 | | 2.00 | | 2.02 | | 1.88 | |
| Ratio of net expenses | | | | | | | | | | |
| to average net assets | 1.97 | | 2.03 | | 2.00 | | 2.02 | | 1.88 | |
| Ratio of net investment (loss) | | | | | | | | | | |
| to average net assets | (.72 | ) | (.56 | ) | (.48 | ) | (.83 | ) | (.48 | ) |
| Portfolio Turnover Rate | 91.31 | | 71.25 | | 114.02 | | 122.17 | | 170.88 | |
| Net Assets, end of period ($ x 1,000) | 46,708 | | 22,538 | | 22,343 | | 5,218 | | 1,398 | |
|
| a Based on average shares outstanding at each month end. |
| b Amount includes litigation proceeds received by the fund amounting to $.02 per share. |
| c Exclusive of sales charge. |
See notes to financial statements.
18
| | | | | | | | | |
| | | | Year Ended August 31, | | | |
| Class I Shares | 2013 | | 2012 | | 2011 | 2010 | | 2009 | |
| Per Share Data ($): | | | | | | | | | |
| Net asset value, beginning of period | 29.38 | | 31.21 | | 26.61 | 23.98 | | 25.95 | |
| Investment Operations: | | | | | | | | | |
| Investment income—neta | .10 | | .14 | | .18 | .10 | | .15 | |
| Net realized and unrealized | | | | | | | | | |
| gain (loss) on investments | 8.77 | | 3.32 | | 4.42 | 2.69 | b | (2.02 | ) |
| Total from Investment Operations | 8.87 | | 3.46 | | 4.60 | 2.79 | | (1.87 | ) |
| Distributions: | | | | | | | | | |
| Dividends from investment income—net | (.13 | ) | (.39 | ) | — | (.16 | ) | (.10 | ) |
| Dividends from net realized | | | | | | | | | |
| gain on investments | — | | (4.90 | ) | — | — | | — | |
| Total Distributions | (.13 | ) | (5.29 | ) | — | (.16 | ) | (.10 | ) |
| Net asset value, end of period | 38.12 | | 29.38 | | 31.21 | 26.61 | | 23.98 | |
| Total Return (%) | 30.26 | | 13.71 | | 17.29 | 11.64 | | (7.05 | ) |
| Ratios/Supplemental Data (%): | | | | | | | | | |
| Ratio of total expenses | | | | | | | | | |
| to average net assets | .97 | | 1.00 | | .96 | .84 | | .84 | |
| Ratio of net expenses | | | | | | | | | |
| to average net assets | .97 | | 1.00 | | .96 | .84 | | .83 | |
| Ratio of net investment income | | | | | | | | | |
| to average net assets | .27 | | .48 | | .53 | .38 | | .69 | |
| Portfolio Turnover Rate | 91.31 | | 71.25 | | 114.02 | 122.17 | | 170.88 | |
| Net Assets, end of period ($ x 1,000) | 856,830 | | 155,210 | | 80,041 | 16,691 | | 10,775 | |
|
| a Based on average shares outstanding at each month end. |
| b Amount includes litigation proceeds received by the fund amounting to $.02 per share. |
See notes to financial statements.
The Fund 19
FINANCIAL HIGHLIGHTS (continued)
| |
| | Period Ended |
| Class Y Shares | August 31, 2013a |
| Per Share Data ($): | |
| Net asset value, beginning of period | 37.48 |
| Investment Operations: | |
| Investment income—netb | .02 |
| Net realized and unrealized gain (loss) on investments | .62 |
| Total from Investment Operations | .64 |
| Net asset value, end of period | 38.12 |
| Total Return (%)c | 1.74 |
| Ratios/Supplemental Data (%): | |
| Ratio of total expenses to average net assetsd | .80 |
| Ratio of net expenses to average net assetsd | .80 |
| Ratio of net investment income to average net assetsd | .33 |
| Portfolio Turnover Rate | 91.31 |
| Net Assets, end of period ($ x 1,000) | 1 |
| |
| a | From July 1, 2013 (commencement of initial offering) to August 31, 2013. |
| b | Based on average shares outstanding. |
| c | Not annualized. |
| d | Annualized. |
See notes to financial statements.
20
NOTES TO FINANCIAL STATEMENTS
NOTE 1—Significant Accounting Policies:
Dreyfus Opportunistic Midcap Value Fund (the “fund”) is a separate diversified series of Advantage Funds, Inc. (the “Company”), which is registered under the Investment Company Act of 1940, as amended (the “Act”), as an open-end management investment company and operates as a series company currently offering twelve series, including the fund.The fund’s investment objective seeks to surpass the performance of the Russell Midcap®Value Index.The Dreyfus Corporation (the “Manager” or “Dreyfus”), a wholly-owned subsidiary of The Bank of New York Mellon Corporation (“BNY Mellon”), serves as the fund’s investment adviser.
At a meeting held on June 18, 2013, the Company’s Board of Directors (the “Board”) approved, effective July 1, 2013: (a) for the fund to offer Class Y shares; and, (b) an increase in the authorized shares of the fund from 600 million to 700 million and authorized 100 million Class Y shares.
MBSC Securities Corporation (the “Distributor”), a wholly-owned subsidiary of the Manager, is the distributor of the fund’s shares.The fund is authorized to issue 700 million shares of $.001 par value Common Stock.The fund currently offers four classes of shares: Class A (350 million shares authorized), Class C (125 million shares authorized), Class I (125 million shares authorized) and ClassY (100 million shares authorized). Class A shares generally are subject to a sales charge imposed at the time of purchase. Class C shares are subject to a contingent deferred sales charge (“CDSC”) imposed on Class C shares redeemed within one year of purchase. Class I shares are sold at net asset value per share only to institutional investors. Class Y shares are sold at net asset value per share to certain investors, including certain institutional investors. Other differences between the classes include the services offered to and the expenses borne by each class, the allocation of certain transfer agency costs and certain voting rights. Income, expenses (other than expenses attributable to a specific class), and realized and unrealized gains or losses on investments are allocated to each class of shares based on its relative net assets.
The Fund 21
NOTES TO FINANCIAL STATEMENTS (continued)
The sales charge may be reduced or waived for certain purchases of Class A shares. Effective April 1, 2013, pursuant to new/modified front-end sales charge waivers, Class A shares of the fund may be purchased at net asset value without payment of a sales charge by (a) investors who participate in a self-directed investment brokerage account program offered by financial intermediaries that have entered into an agreement with the fund’s Distributor (financial intermediaries offering self-directed investment brokerage accounts may or may not charge their customers a transaction fee) and (b) investors who purchase Class A shares directly through the fund’s Distributor, and either (i) have, or whose spouse or minor children have, beneficially owned shares and continuously maintained an open account with the Distributor in a Dreyfus-managed fund since on or before February 28, 2006, or (ii) such purchase is for a self-directed investment account that may or may not be subject to a transaction fee.
As of August 31, 2013, MBC Investments Corp., an indirect subsidiary of BNY Mellon, held all of the outstanding ClassY shares of the fund.
The Company accounts separately for the assets, liabilities and operations of each series. Expenses directly attributable to each series are charged to that series’ operations; expenses which are applicable to all series are allocated among them on a pro rata basis.
The Financial Accounting Standards Board (“FASB”) Accounting Standards Codification is the exclusive reference of authoritative U.S. generally accepted accounting principles (“GAAP”) recognized by the FASB to be applied by nongovernmental entities. Rules and interpretive releases of the Securities and Exchange Commission (“SEC”) under authority of federal laws are also sources of authoritative GAAP for SEC registrants. The fund’s financial statements are prepared in accordance with GAAP, which may require the use of management estimates and assumptions.Actual results could differ from those estimates.
The Company enters into contracts that contain a variety of indemnifications.The fund’s maximum exposure under these arrangements is unknown.The fund does not anticipate recognizing any loss related to these arrangements.
22
(a) Portfolio valuation: The fair value of a financial instrument is the amount that would be received to sell an asset or paid to transfer a liability in an orderly transaction between market participants at the measurement date (i.e., the exit price). GAAP establishes a fair value hierarchy that prioritizes the inputs of valuation techniques used to measure fair value.This hierarchy gives the highest priority to unadjusted quoted prices in active markets for identical assets or liabilities (Level 1 measurements) and the lowest priority to unobservable inputs (Level 3 measurements).
Additionally, GAAP provides guidance on determining whether the volume and activity in a market has decreased significantly and whether such a decrease in activity results in transactions that are not orderly. GAAP requires enhanced disclosures around valuation inputs and techniques used during annual and interim periods.
Various inputs are used in determining the value of the fund’s investments relating to fair value measurements.These inputs are summarized in the three broad levels listed below:
Level 1—unadjusted quoted prices in active markets for identical investments.
Level 2—other significant observable inputs (including quoted prices for similar investments, interest rates, prepayment speeds, credit risk, etc.).
Level 3—significant unobservable inputs (including the fund’s own assumptions in determining the fair value of investments).
The inputs or methodology used for valuing securities are not necessarily an indication of the risk associated with investing in those securities.
Changes in valuation techniques may result in transfers in or out of an assigned level within the disclosure hierarchy. Valuation techniques used to value the fund’s investments are as follows:
Investments in securities are valued at the last sales price on the securities exchange or national securities market on which such securities are primarily traded. Securities listed on the National Market System
The Fund 23
NOTES TO FINANCIAL STATEMENTS (continued)
for which market quotations are available are valued at the official closing price or, if there is no official closing price that day, at the last sales price. Securities not listed on an exchange or the national securities market, or securities for which there were no transactions, are valued at the average of the most recent bid and asked prices, except for open short positions, where the asked price is used for valuation purposes. Bid price is used when no asked price is available. Registered investment companies that are not traded on an exchange are valued at their net asset value. All of the preceding securities are categorized within Level 1 of the fair value hierarchy.
Fair valuing of securities may be determined with the assistance of a pricing service using calculations based on indices of domestic securities and other appropriate indicators, such as prices of relevant American Depository Receipts and financial futures. Utilizing these techniques may result in transfers between Level 1 and Level 2 of the fair value hierarchy.
When market quotations or official closing prices are not readily available, or are determined not to reflect accurately fair value, such as when the value of a security has been significantly affected by events after the close of the exchange or market on which the security is principally traded (for example, a foreign exchange or market), but before the fund calculates its net asset value, the fund may value these investments at fair value as determined in accordance with the procedures approved by the Board. Certain factors may be considered when fair valuing investments such as: fundamental analytical data, the nature and duration of restrictions on disposition, an evaluation of the forces that influence the market in which the securities are purchased and sold, and public trading in similar securities of the issuer or comparable issuers.These securities are either categorized within Level 2 or 3 of the fair value hierarchy depending on the relevant inputs used.
For restricted securities where observable inputs are limited, assumptions about market activity and risk are used and are categorized within Level 3 of the fair value hierarchy.
24
The following is a summary of the inputs used as of August 31, 2013 in valuing the fund's investments:
| | | | |
| | | Level 2—Other | Level 3— | |
| | Level 1— | Significant | Significant | |
| | Unadjusted | Observable | Unobservable | |
| | Quoted Prices | Inputs | Inputs | Total |
| Assets ($) | | | | |
| Investments in Securities: | | | |
| Equity Securities— | | | | |
| Domestic | | | | |
| Common | | | | |
| Stocks† | 1,946,835,233 | — | — | 1,946,835,233 |
| Equity Securities— | | | | |
| Foreign | | | | |
| Common Stocks† | 10,720,823 | — | — | 10,720,823 |
| Exchange- | | | | |
| Traded Funds | 29,372,299 | — | — | 29,372,299 |
| Mutual Funds | 26,838,531 | — | — | 26,838,531 |
| |
| † See Statement of Investments for additional detailed categorizations. | |
At August 31, 2013, there were no transfers between Level 1 and Level 2 of the fair value hierarchy.
(b) Securities transactions and investment income: Securities transactions are recorded on a trade date basis. Realized gains and losses from securities transactions are recorded on the identified cost basis. Dividend income is recognized on the ex-dividend date and interest income, including, where applicable, accretion of discount and amortization of premium on investments, is recognized on the accrual basis.
Pursuant to a securities lending agreement with The Bank of New York Mellon, a subsidiary of BNY Mellon and an affiliate of Dreyfus, the fund may lend securities to qualified institutions. It is the fund’s policy that, at origination, all loans are secured by collateral of at least 102% of the value of U.S. securities loaned and 105% of the value of foreign securities loaned. Collateral equivalent to at least 100% of the market value of securities on loan is maintained at all times. Collateral is either in the form of cash, which can be invested in certain money
The Fund 25
NOTES TO FINANCIAL STATEMENTS (continued)
market mutual funds managed by the Manager or U.S. Government and Agency securities. The fund is entitled to receive all dividends, interest and distributions on securities loaned, in addition to income earned as a result of the lending transaction. Should a borrower fail to return the securities in a timely manner, The Bank of New York Mellon is required to replace the securities for the benefit of the fund or credit the fund with the market value of the unreturned securities and is subrogated to the fund’s rights against the borrower and the collateral. During the period ended August 31, 2013, The Bank of New York Mellon earned $36,132 from lending portfolio securities, pursuant to the securities lending agreement.
(c) Affiliated issuers: Investments in other investment companies advised by Dreyfus are defined as “affiliated” under the Act. Investments in affiliated investment companies during the period ended August 31, 2013 were as follows:
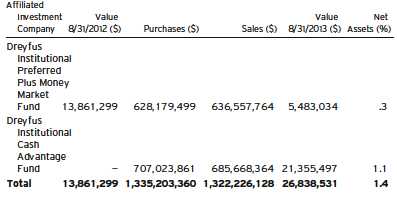
(d) Dividends to shareholders: Dividends are recorded on the ex-dividend date. Dividends from investment income-net and dividends from net realized capital gains, if any, are normally declared and paid annually, but the fund may make distributions on a more frequent basis to comply with the distribution requirements of the Internal Revenue Code of 1986, as amended (the “Code”).To the extent that net realized capital gains can be offset by capital loss carryovers, it is
26
the policy of the fund not to distribute such gains. Income and capital gain distributions are determined in accordance with income tax regulations, which may differ from GAAP.
(e) Federal income taxes: It is the policy of the fund to continue to qualify as a regulated investment company, if such qualification is in the best interests of its shareholders, by complying with the applicable provisions of the Code, and to make distributions of taxable income sufficient to relieve it from substantially all federal income and excise taxes.
As of and during the period ended August 31, 2013, the fund did not have any liabilities for any uncertain tax positions.The fund recognizes interest and penalties, if any, related to uncertain tax positions as income tax expense in the Statement of Operations. During the period, the fund did not incur any interest or penalties.
Each tax year in the four-year period ended August 31, 2013 remains subject to examination by the Internal Revenue Service and state taxing authorities.
At August 31, 2013, the components of accumulated earnings on a tax basis were as follows: undistributed ordinary income $12,638,099, undistributed capital gains $152,403,181 and unrealized appreciation $345,357,803.
The tax character of distributions paid to shareholders during the fiscal periods ended August 31, 2013 and August 31, 2012 were as follows: ordinary income $2,962,790 and $23,015,709, and long-term capital gains $0 and $156,580,737, respectively.
NOTE 2—Bank Lines of Credit:
The fund participates with other Dreyfus-managed funds in a $210 million unsecured credit facility led by Citibank, N.A. and a $300 million unsecured credit facility provided by The Bank of New York Mellon (each, a “Facility”), each to be utilized primarily for temporary or emergency purposes, including the financing of redemptions. Prior
The Fund 27
NOTES TO FINANCIAL STATEMENTS (continued)
to October 10, 2012, the unsecured credit facility with Citibank, N.A. was $225 million. In connection therewith, the fund has agreed to pay its pro rata portion of commitment fees for each Facility. Interest is charged to the fund based on rates determined pursuant to the terms of the respective Facility at the time of borrowing.
The average amount of borrowings outstanding under the Facilities during the period ended August 31, 2013 was approximately $173,700 with a related weighted average annualized interest rate of 1.13%.
NOTE 3—Management Fee and Other Transactions With Affiliates:
(a) Pursuant to a management agreement with the Manager, the management fee is computed at the annual rate of .75% of the value of the fund’s average daily net assets and is payable monthly.
During the period ended August 31, 2013, the Distributor retained $66,543 from commissions earned on sales of the fund’s Class A shares and $3,746 from CDSCs on redemptions of the fund’s Class C shares.
(b) Under the Distribution Plan adopted pursuant to Rule 12b-1 under the Act, Class C shares pay the Distributor for distributing its shares at an annual rate of .75% of the value of its average daily net assets. During the period ended August 31, 2013, Class C shares were charged $229,493 pursuant to the Distribution Plan.
(c) Under the Shareholder Services Plan, Class A and Class C shares pay the Distributor at an annual rate of .25% of the value of their average daily net assets for the provision of certain services.The services provided may include personal services relating to shareholder accounts, such as answering shareholder inquiries regarding the fund and providing reports and other information, and services related to the maintenance of shareholder accounts.The Distributor may make payments to Service Agents (securities dealers, financial institutions or other industry professionals) with respect to these services. The Distributor determines the
28
amounts to be paid to Service Agents. During the period ended August 31, 2013, Class A and Class C shares were charged $2,836,537 and $76,498, respectively, pursuant to the Shareholder Services Plan.
The fund has arrangements with the transfer agent and the custodian whereby the fund may receive earnings credits when positive cash balances are maintained, which are used to offset transfer agency and custody fees. For financial reporting purposes, the fund includes net earnings credits as an expense offset in the Statement of Operations.
The fund compensates DreyfusTransfer, Inc., a wholly-owned subsidiary of the Manager, under a transfer agency agreement for providing transfer agency services for the fund and cash management services related to fund subscriptions and redemptions. During the period ended August 31, 2013, the fund was charged $147,478 for transfer agency services and $7,294 for cash management services. These fees are included in Shareholder servicing costs in the Statement of Operations. Cash management fees were partially offset by earnings credits of $931.
The fund compensatesThe Bank of NewYork Mellon under a custody agreement for providing custodial services for the fund. During the period ended August 31, 2013, the fund was charged $91,641 pursuant to the custody agreement.
The fund compensates The Bank of New York Mellon under a cash management agreement for performing certain cash management services related to fund subscriptions and redemptions. During the period ended August 31, 2013, the fund was charged $4,052 pursuant to the cash management agreement, which is included in Shareholder servicing costs in the Statement of Operations.These fees were partially offset by earnings credits of $28.
During the period ended August 31, 2013, the fund was charged $8,973 for services performed by the Chief Compliance Officer and his staff.
The Fund 29
NOTES TO FINANCIAL STATEMENTS (continued)
The components of “Due to The Dreyfus Corporation and affiliates” in the Statement of Assets and Liabilities consist of: management fees $1,296,280, Distribution Plan fees $29,373, Shareholder Services Plan fees $243,729, custodian fees $40,201, Chief Compliance Officer fees $6,172 and transfer agency fees $38,996.
(d) Each Board member also serves as a Board member of other funds within the Dreyfus complex. Annual retainer fees and attendance fees are allocated to each fund based on net assets.
NOTE 4—Securities Transactions:
The aggregate amount of purchases and sales of investment securities, excluding short-term securities, during the period ended August 31, 2013, amounted to $1,887,165,413 and $1,427,043,243, respectively.
At August 31, 2013, the cost of investments for federal income tax purposes was $1,668,409,083; accordingly, accumulated net unrealized appreciation on investments was $345,357,803, consisting of $377,145,302 gross unrealized appreciation and $31,787,499 gross unrealized depreciation.
30
REPORT OF INDEPENDENT REGISTERED
PUBLIC ACCOUNTING FIRM
Shareholders and Board of Directors Dreyfus Opportunistic Midcap Value Fund
We have audited the accompanying statement of assets and liabilities, including the statement of investments, of Dreyfus Opportunistic Midcap Value Fund (one of the series comprising Advantage Funds, Inc.) as of August 31, 2013, and the related statement of operations for the year then ended, the statement of changes in net assets for each of the two years in the period then ended, and the financial highlights for each of the periods indicated therein. These financial statements and financial highlights are the responsibility of the Fund’s management. Our responsibility is to express an opinion on these financial statements and financial highlights based on our audits.
We conducted our audits in accordance with the standards of the Public Company Accounting Oversight Board (United States). Those standards require that we plan and perform the audit to obtain reasonable assurance about whether the financial statements and financial highlights are free of material misstatement.We were not engaged to perform an audit of the Fund’s internal control over financial reporting. Our audits included consideration of internal control over financial reporting as a basis for designing audit procedures that are appropriate in the circumstances, but not for the purpose of expressing an opinion on the effectiveness of the Fund’s internal control over financial reporting. Accordingly, we express no such opinion. An audit also includes examining, on a test basis, evidence supporting the amounts and disclosures in the financial statements and financial highlights, assessing the accounting principles used and significant estimates made by management, and evaluating the overall financial statement presentation. Our procedures included confirmation of securities owned as of August 31, 2013 by correspondence with the custodian and others.We believe that our audits provide a reasonable basis for our opinion.
In our opinion, the financial statements and financial highlights referred to above present fairly, in all material respects, the financial position of Dreyfus Opportunistic Midcap Value Fund at August 31, 2013, the results of its operations for the year then ended, the changes in its net assets for each of the two years in the period then ended, and the financial highlights for each of the indicated periods, in conformity with U.S. generally accepted accounting principles.
New York, New York
October 28, 2013
The Fund 31
IMPORTANT TAX INFORMATION (Unaudited)
For federal tax purposes, the fund hereby reports 99.98% of the ordinary dividends paid during the fiscal year ended August 31, 2013 as qualifying for the corporate dividends received deduction. Also certain dividends paid by the fund may be subject to a maximum tax rate of 15%, as provided for by the Jobs and GrowthTax Relief Reconciliation Act of 2003. Of the distributions paid during the fiscal year, $2,962,790 represents the maximum amount that may be considered qualified dividend income. Shareholders will receive notification in early 2014 of the percentage applicable to the preparation of their 2013 income tax returns.
32
INFORMATION ABOUT THE RENEWAL OF THE
FUND’S MANAGEMENT AGREEMENT (Unaudited)
At a meeting of the fund’s Board of Directors held on March 4-5, 2013, the Board considered the renewal of the fund’s Management Agreement pursuant to which Dreyfus provides the fund with investment advisory and administrative services (the “Agreement”). The Board members, none of whom are “interested persons” (as defined in the Investment Company Act of 1940, as amended) of the fund, were assisted in their review by independent legal counsel and met with counsel in executive session separate from Dreyfus representatives. In considering the renewal of the Agreement, the Board considered all factors that it believed to be relevant, including those discussed below.The Board did not identify any one factor as dispositive, and each Board member may have attributed different weights to the factors considered.
Analysis of Nature, Extent, and Quality of Services Provided to the Fund. The Board considered information provided to them at the meeting and in previous presentations from Dreyfus representatives regarding the nature, extent, and quality of the services provided to funds in the Dreyfus fund complex. Dreyfus provided the number of open accounts in the fund, the fund’s asset size and the allocation of fund assets among distribution channels. Dreyfus also had previously provided information regarding the diverse intermediary relationships and distribution channels of funds in the Dreyfus fund complex (such as retail direct or intermediary, in which intermediaries typically are paid by the fund and/or Dreyfus) and Dreyfus’ corresponding need for broad, deep, and diverse resources to be able to provide ongoing shareholder services to each intermediary or distribution channel, as applicable to the fund.
The Board also considered research support available to, and portfolio management capabilities of, the fund’s portfolio management personnel and that Dreyfus also provides oversight of day-to-day fund operations, including fund accounting and administration and assistance in meeting legal and regulatory requirements.The Board also considered Dreyfus’ extensive administrative, accounting, and compliance infrastructures.
The Fund 33
INFORMATION ABOUT THE RENEWAL OF THE FUND’S
MANAGEMENT AGREEMENT (Unaudited) (continued)
The Board also considered portfolio management’s brokerage policies and practices (including policies and practices regarding soft dollars) and the standards applied in seeking best execution.
Comparative Analysis of the Fund’s Performance and Management Fee and Expense Ratio. The Board reviewed reports prepared by Lipper, Inc. (“Lipper”), an independent provider of investment company data, which included information comparing (1) the fund’s performance with the performance of a group of comparable funds (the “Performance Group”) and with a broader group of funds (the “Performance Universe”), all for various periods ended December 31, 2012, and (2) the fund’s actual and contractual management fees and total expenses with those of a group of comparable funds (the “Expense Group”) and with a broader group of funds (the “Expense Universe”), the information for which was derived in part from fund financial statements available to Lipper as of the date of its analysis. Dreyfus previously had furnished the Board with a description of the methodology Lipper used to select the Performance Group and Performance Universe and the Expense Group and Expense Universe.
Dreyfus representatives stated that the usefulness of performance comparisons may be affected by a number of factors, including different investment limitations that may be applicable to the fund and comparison funds. The Board discussed the results of the comparisons and noted that the fund’s total return performance was above the Performance Group and Performance Universe medians in all periods, and ranked in the first quartile in the Performance Group and Performance Universe in most of the periods. Dreyfus also provided a comparison of the fund’s calendar year total returns to the returns of the fund’s benchmark index.
The Board also reviewed the range of actual and contractual management fees and total expenses of the Expense Group and Expense Universe funds and discussed the results of the comparisons.The Board noted that the fund’s contractual management fee was below the
34
Expense Group median, the fund’s actual management fee was below the Expense Group median and at the Expense Universe median and the fund’s total expense ratio was slightly above the Expense Group median and below the Expense Universe median.
Dreyfus representatives reviewed with the Board the management or investment advisory fees (1) paid by funds advised or administered by Dreyfus that are in the same Lipper category as the fund and (2) paid to Dreyfus or the Dreyfus-affiliated primary employer of the fund’s primary portfolio manager(s) for advising any separate accounts and/or other types of client portfolios that are considered to have similar investment strategies and policies as the fund (the “Similar Clients”), and explained the nature of the Similar Clients.They discussed differences in fees paid and the relationship of the fees paid in light of any differences in the services provided and other relevant factors. The Board considered the relevance of the fee information provided for the Similar Clients to evaluate the appropriateness and reasonableness of the fund’s management fee.
Analysis of Profitability and Economies of Scale. Dreyfus representatives reviewed the expenses allocated and profit received by Dreyfus and the resulting profitability percentage for managing the fund and the aggregate profitability percentage to Dreyfus of managing the funds in the Dreyfus fund complex, and the method used to determine the expenses and profit. The Board concluded that the profitability results were not unreasonable, given the services rendered and service levels provided by Dreyfus. The Board also had been provided with information prepared by an independent consulting firm regarding Dreyfus’ approach to allocating costs to, and determining the profitability of, individual funds and the entire Dreyfus fund complex.The consulting firm also had analyzed where any economies of scale might emerge in connection with the management of a fund.
The Fund 35
INFORMATION ABOUT THE RENEWAL OF THE FUND’S
MANAGEMENT AGREEMENT (Unaudited) (continued)
The Board’s counsel stated that the Board should consider the profitability analysis (1) as part of the evaluation of whether the fees under the Agreement bear a reasonable relationship to the mix of services provided by Dreyfus, including the nature, extent and quality of such services, and (2) in light of the relevant circumstances for the fund and the extent to which economies of scale would be realized if the fund grows and whether fee levels reflect these economies of scale for the benefit of fund shareholders. Dreyfus representatives also noted that, as a result of shared and allocated costs among funds in the Dreyfus fund complex, the extent of economies of scale could depend substantially on the level of assets in the complex as a whole, so that increases and decreases in complex-wide assets can affect potential economies of scale in a manner that is disproportionate to, or even in the opposite direction from, changes in the fund’s asset level.The Board also considered potential benefits to Dreyfus from acting as investment adviser and noted the soft dollar arrangements in effect for trading the fund’s investments.
At the conclusion of these discussions, the Board agreed that it had been furnished with sufficient information to make an informed business decision with respect to the renewal of the Agreement. Based on the discussions and considerations as described above, the Board concluded and determined as follows.
The Board concluded that the nature, extent and quality of the services provided by Dreyfus are adequate and appropriate.
The Board was satisfied with the fund’s performance.
The Board concluded that the fee paid to Dreyfus was reasonable in light of the considerations described above.
The Board determined that the economies of scale which may accrue to Dreyfus and its affiliates in connection with the management of the fund had been adequately considered by Dreyfus in connection with the fee rate charged to the fund pursuant to the Agreement and that, to the extent in the future it were determined that material economies of scale had not been shared with the fund, the Board would seek to have those economies of scale shared with the fund.
36
In evaluating the Agreement, the Board considered these conclusions and determinations and also relied on its previous knowledge, gained through meetings and other interactions with Dreyfus and its affiliates, of the fund and the services provided to the fund by Dreyfus.The Board also relied on information received on a routine and regular basis throughout the year relating to the operations of the fund and the investment management and other services provided under the Agreement, including information on the investment performance of the fund in comparison to similar mutual funds and benchmark performance indices; general market outlook as applicable to the fund; and compliance reports. In addition, it should be noted that the Board’s consideration of the contractual fee arrangements for this fund had the benefit of a number of years of reviews of prior or similar agreements during which lengthy discussions took place between the Board and Dreyfus representatives. Certain aspects of the arrangements may receive greater scrutiny in some years than in others, and the Board’s conclusions may be based, in part, on their consideration of the same or similar arrangements in prior years. The Board determined that renewal of the Agreement was in the best interests of the fund and its shareholders.
The Fund 37
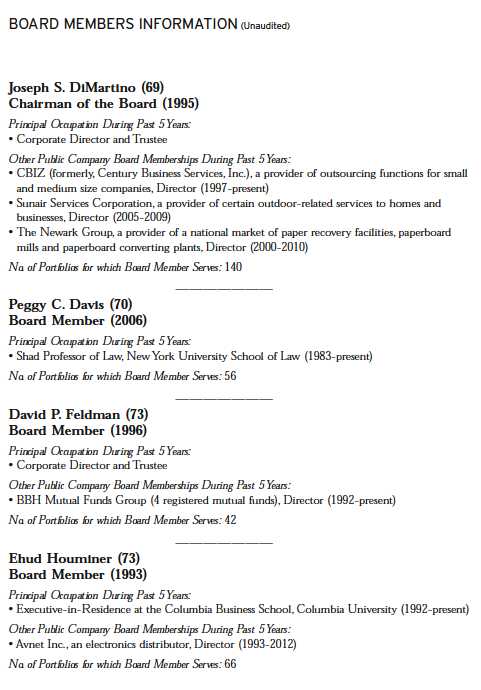
38

The Fund 39
OFFICERS OF THE FUND (Unaudited)
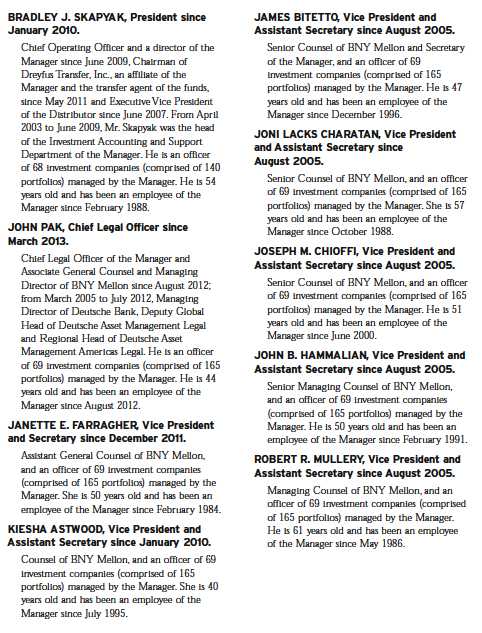
40
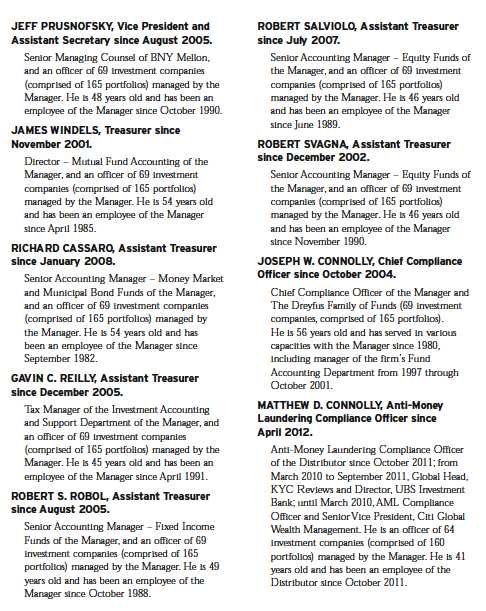
The Fund 41
Save time. Save paper. View your next shareholder report online as soon as it’s available. Log into www.dreyfus.com and sign up for Dreyfus eCommunications. It’s simple and only takes a few minutes.
The views expressed in this report reflect those of the portfolio manager only through the end of the period covered and do not necessarily represent the views of Dreyfus or any other person in the Dreyfus organization. Any such views are subject to change at any time based upon market or other conditions and Dreyfus disclaims any responsibility to update such views.These views may not be relied on as investment advice and, because investment decisions for a Dreyfus fund are based on numerous factors, may not be relied on as an indication of trading intent on behalf of any Dreyfus fund.
| | Contents |
| | THE FUND |
| 2 | A Letter from the President |
| 3 | Discussion of Fund Performance |
| 6 | Fund Performance |
| 7 | UnderstandingYour Fund’s Expenses |
| 7 | ComparingYour Fund’s Expenses With Those of Other Funds |
| 8 | Statement of Investments |
| 12 | Statement of Assets and Liabilities |
| 13 | Statement of Operations |
| 14 | Statement of Changes in Net Assets |
| 15 | Financial Highlights |
| 16 | Notes to Financial Statements |
| 26 | Report of Independent Registered Public Accounting Firm |
| 27 | Information About the Renewal of the Fund’s Management Agreement |
| 32 | Board Members Information |
| 34 | Officers of the Fund |
| | FOR MORE INFORMATION |
| | Back Cover |
Dreyfus
Opportunistic
Small Cap Fund
The Fund
A LETTER FROM THE PRESIDENT
Dear Shareholder:
We are pleased to present this annual report for Dreyfus Opportunistic Small Cap Fund, covering the 12-month period from September 1, 2012, through August 31, 2013. For information about how the fund performed during the reporting period, as well as general market perspectives, we provide a Discussion of Fund Performance on the pages that follow.
U.S. equities fared quite well over the past year, weathering periodic bouts of volatility after setting new record highs in the spring for many broad measures of stock market performance. Low interest rates, muted inflationary pressures, and a strong U.S. dollar helped fuel the market’s gains, as did a declining unemployment rate, rebounding housing markets, and increased production of domestic oil and natural gas.
In our analysis, the U.S. economy is nearing an inflection point to a somewhat faster growth rate.We expect a reduced fiscal drag in 2014 and beyond, and the stimulative monetary policy of the past five years should continue to support economic expansion, particularly in interest rate-sensitive industry groups. For information on how these developments may affect your investments, we urge you to discuss these matters with your financial advisor.
Thank you for your continued confidence and support.
Sincerely,

J. Charles Cardona
President
The Dreyfus Corporation
September 16, 2013
2
DISCUSSION OF FUND PERFORMANCE
For the period of September 1, 2012, through August 31, 2013, as provided by David A. Daglio, Primary Portfolio Manager
Fund and Market Performance Overview
For the 12-month period ended August 31, 2013, Dreyfus Opportunistic Small Cap Fund produced a total return of 33.36%.1 In comparison, the fund’s benchmark, the Russell 2000® Index (the “Index”), produced a total return of 26.27%.The Russell 2000®Value Index returned 24.38% for the same reporting period.2
Small-cap stocks rallied strongly over the reporting period as investors responded positively to improving economic data.The fund produced a higher return than its benchmark, primarily due to the success of its security selection strategy in the consumer discretionary, industrials, financials, and materials sectors.
The Fund’s Investment Approach
The fund seeks capital appreciation.The fund normally invests at least 80% of its assets in the stocks of small-cap companies. Stocks are selected for the fund’s portfolio based primarily on bottom-up fundamental analysis.The fund’s team of portfolio managers uses a disciplined investment process that relies, in general, on proprietary fundamental research and valuation. Generally, elements of the process include analysis of mid-cycle business prospects, estimation of the intrinsic value of the company, and the identification of a revaluation trigger. Intrinsic value is based on the combination of the valuation assessment of the company’s operating divisions with the firm’s economic balance sheet. Mid-cycle estimates, growth prospects and competitive advantages are some of the factors used in the valuation assessment.A company’s stated and hidden liabilities and assets are included in the portfolio manager’s economic balance sheet calculation. Sector overweights and underweights are a function of the relative attractiveness of securities within the fund’s investable universe. The fund’s portfolio managers invest in stocks that they believe have attractive reward to risk opportunities and may actively adjust the fund’s portfolio to reflect new developments.
Recovering Economy Fueled Market Gains
The reporting period began near the outset of a sustained stock market rally driven by better economic fundamentals, most notably improved U.S. employment and housing market data. Investors also were encouraged by the launch of a new round of quanti-
The Fund 3
DISCUSSION OF FUND PERFORMANCE (continued)
tative easing by the Federal Reserve Board (the “Fed”). Improving conditions in overseas markets also contributed to greater investor optimism.
Economic data continued to improve, and stocks generally continued to rally through the spring of 2013, with particular strength among small-cap stocks. Consequently, by mid-May several broad measures of stock market performance reached new record highs. In late May, remarks by Fed Chairman Ben Bernanke were widely interpreted as a signal that U.S. monetary policymakers would back away from their quantitative easing program sooner than expected, sparking heightened volatility in June that erased some of the stock market’s previous gains. Equity markets generally stabilized in July and August when investors realized that an end to quantitative easing would not necessarily portend higher short-term interest rates, and they returned their focus to company and market fundamentals.
Strong Stock Selections in Several Sectors Drove Gains
Attractive mid-cycle fundamentals and large discounts from intrinsic value led the fund to significantly overweight exposure to automotive suppliers in the consumer discretionary sector. American Axle & Manufacturing Holdings proved well positioned for the development of new trucks from General Motors, and Dana Holding benefited from strong sales of imported pickup trucks. The fund also received positive contributions from retailers, as Fifth & Pacific posted favorable same-store sales comparisons and successfully adjusted its mix of brands toward Kate Spade, and Jones Group began engineering a business turnaround that should help boost profit margins.
In the industrials sector, rental car agency Avis Budget Group advanced due to higher rental rates and increased demand. Trucking company Arkansas Best climbed after negotiating a favorable labor contract. Temporary staffing company TrueBlue benefited from robust demand for day laborers in the construction industry. Furniture makers Steelcase and Herman Miller saw orders increase in North America, and industrial conglomerate Trinity Industries responded to healthy orders for specialty railroad cars used to transport domestic crude oil.
As anticipated in our investment theses for the companies, Portfolio Recovery Associates experienced higher than expected cash collections, Nelnet benefited from greater demand for outsourced loan servicing, and commercial banks SVB Financial Group and First Financial Holdings reported better-than-expected loan growth. Real estate manager Jones Lang LaSalle saw steady demand for building maintenance and
4
management services. Our valuation discipline kept most weak performing REITs out of the fund and this assisted returns. By the team’s estimates, most REITs have been trading above their intrinsic values and there has been limited ownership in the fund over time.This positioning has been a headwind to performance when REITs have been strong performers, but our conviction was rewarded in the past twelve months.
Among materials companies, carbon fiber equipment maker Zoltek implemented strategies to enhance shareholder value, and low natural gas prices helped expand profit margins for chemicals manufacturer Axiall.
Disappointments were concentrated mainly in the information technology sector, where mobile advertising solutions provider Velti failed to deliver expected earnings growth, and reservations systems developer MICROS Systems encountered intensifying competitive pressures.
Finding Ample Opportunities Among Individual Stocks
After the strong performance gains over the past two years, the small cap landscape has become more selective. Investor skepticism about near term earning prospects has created meaningful discounts from intrinsic valuations for many companies in the technology, financials and industrial sectors.We believe the pending recovery in CEO business confidence will produce higher levels of discretionary spending which will benefit each of these industries and will be reflected in the fund’s positioning.
On the other hand, market interest for higher yielding stocks has elevated valuations for many stocks in the consumer staples, utilities, telecommunication services and REIT areas to the point where the stocks do not meet our investment disciplines.
September 16, 2013
Please note, the position in any security highlighted with italicized typeface was sold during the reporting period. Equity funds are subject generally to market, market sector, market liquidity, issuer and investment style risks, among other factors, to varying degrees, all of which are more fully described in the fund’s prospectus.
Stocks of small cap companies often experience sharper price fluctuations than stocks of large-cap companies.
|
| 1 Total return includes reinvestment of dividends and any capital gains paid. Past performance is no guarantee of future |
| results. Share price and investment return fluctuate such that upon redemption fund shares may be worth more or less |
| than their original cost. |
| 2 SOURCE: LIPPER INC. — Reflects the reinvestment of dividends and, where applicable, capital gain |
| distributions.The Russell 2000® Index is an unmanaged index of small-cap stock performance and is composed of |
| the 2,000 smallest companies in the Russell 3000® Index.The Russell 3000® Index is composed of the 3,000 |
| largest U.S. companies based on total market capitalization.The Russell 2000® Value Index is an unmanaged |
| index, which measures the performance of those Russell 2000® companies with lower price-to-book ratios and lower |
| forecasted growth values. Investors cannot invest directly in any index. |
The Fund 5
FUND PERFORMANCE

Average Annual Total Returns as of 8/31/13
| | | | | | |
| | 1 Year | | 5 Years | | 10 Years | |
| Fund | 33.36 | % | 15.21 | % | 12.14 | % |
| Russell 2000 Index | 26.27 | % | 7.98 | % | 8.76 | % |
|
| † Source: Lipper Inc. |
| Past performance is not predictive of future performance.The fund’s performance shown in the graph and table does not |
| reflect the deduction of taxes that a shareholder would pay on fund distributions or the redemption of fund shares. |
| The above graph compares a $10,000 investment made in Dreyfus Opportunistic Small Cap Fund on 8/31/03 to a |
| $10,000 investment made in the Russell 2000 Index (the “Index”) on that date.All dividends and capital gain |
| distributions are reinvested. |
| The fund’s performance shown in the line graph above takes into account all applicable fees and expenses.The Index is |
| an unmanaged index and is composed of the 2,000 smallest companies in the Russell 3000 Index.The Russell 3000 |
| Index measures the performance of the largest 3,000 U.S. companies representing approximately 98% of the investable |
| U.S. equity market. Unlike a mutual fund, the Index is not subject to charges, fees and other expenses. Investors cannot |
| invest directly in any index. Further information relating to fund performance, including expense reimbursements, if |
| applicable, is contained in the Financial Highlights section of the prospectus and elsewhere in this report. |
6
UNDERSTANDING YOUR FUND’S EXPENSES (Unaudited)
As a mutual fund investor, you pay ongoing expenses, such as management fees and other expenses. Using the information below, you can estimate how these expenses affect your investment and compare them with the expenses of other funds.You also may pay one-time transaction expenses, including sales charges (loads) and redemption fees, which are not shown in this section and would have resulted in higher total expenses. For more information, see your fund’s prospectus or talk to your financial adviser.
Review your fund’s expenses
The table below shows the expenses you would have paid on a $1,000 investment in Dreyfus Opportunistic Small Cap Fund from March 1, 2013 to August 31, 2013. It also shows how much a $1,000 investment would be worth at the close of the period, assuming actual returns and expenses.
Expenses and Value of a $1,000 Investment
assuming actual returns for the six months ended August 31, 2013
| | |
| Expenses paid per $1,000† | $ | 6.10 |
| Ending value (after expenses) | $ | 1,161.30 |
COMPARING YOUR FUND’S EXPENSES
WITH THOSE OF OTHER FUNDS (Unaudited)
Using the SEC’s method to compare expenses
The Securities and Exchange Commission (SEC) has established guidelines to help
investors assess fund expenses. Per these guidelines, the table below shows your fund’s
expenses based on a $1,000 investment, assuming a hypothetical 5% annualized return.
You can use this information to compare the ongoing expenses (but not transaction
expenses or total cost) of investing in the fund with those of other funds.All mutual fund
shareholder reports will provide this information to help you make this comparison.
Please note that you cannot use this information to estimate your actual ending account
balance and expenses paid during the period.
Expenses and Value of a $1,000 Investment
assuming a hypothetical 5% annualized return for the six months ended August 31, 2013
| | |
| Expenses paid per $1,000† | $ | 5.70 |
| Ending value (after expenses) | $ | 1,019.56 |
|
| † Expenses are equal to the fund’s annualized expense ratio of 1.12%, multiplied by the average account value over |
| the period, multiplied by 184/365 (to reflect the one-half year period). |
The Fund 7
STATEMENT OF INVESTMENTS
August 31, 2013
| | | |
| Common Stocks—99.7% | Shares | | Value ($) |
| Automobiles & Components—6.0% | | | |
| American Axle & Manufacturing Holdings | 768,203 | a | 14,772,544 |
| Dana Holding | 916,140 | | 19,202,294 |
| Tenneco | 223,390 | a | 10,304,981 |
| Tower International | 319,928 | a | 6,552,125 |
| | | | 50,831,944 |
| Banks—12.9% | | | |
| CVB Financial | 669,130 | | 8,524,716 |
| EverBank Financial | 868,990 | | 12,217,999 |
| First Financial Holdings | 314,440 | | 16,926,305 |
| First Niagara Financial Group | 1,318,690 | | 13,318,769 |
| Nationstar Mortgage Holdings | 281,970 | a,b | 14,013,909 |
| Radian Group | 469,450 | | 6,361,048 |
| SVB Financial Group | 290,040 | a | 24,015,312 |
| TCF Financial | 378,490 | | 5,317,785 |
| UMB Financial | 157,458 | | 9,404,966 |
| | | | 110,100,809 |
| Capital Goods—7.5% | | | |
| Brady, Cl. A | 594,890 | | 19,631,370 |
| Commercial Vehicle Group | 186,894 | a | 1,310,127 |
| L.B. Foster, Cl. A | 81,850 | | 3,472,077 |
| Rush Enterprises, Cl. A | 273,653 | a | 6,849,535 |
| Trinity Industries | 103,850 | | 4,384,547 |
| Watts Water Technologies, Cl. A | 356,686 | | 18,479,902 |
| WESCO International | 128,760 | a | 9,498,625 |
| | | | 63,626,183 |
| Commercial & Professional | | | |
| Services—6.7% | | | |
| Herman Miller | 716,163 | | 18,240,672 |
| Knoll | 162,420 | | 2,473,657 |
| Steelcase, Cl. A | 1,722,760 | | 25,014,475 |
| TrueBlue | 452,520 | a | 11,005,286 |
| | | | 56,734,090 |
| Consumer Durables & Apparel—3.9% | | | |
| Jones Group | 1,741,910 | | 25,658,334 |
| Tumi Holdings | 362,120 | a | 7,445,187 |
| | | | 33,103,521 |
8
| | | |
| Common Stocks (continued) | Shares | | Value ($) |
| Diversified Financials—3.7% | | | |
| E*TRADE Financial | 140,810 | a | 1,976,972 |
| Greenhill & Co. | 226,580 | | 10,737,626 |
| Nelnet, Cl. A | 236,626 | | 8,963,393 |
| Portfolio Recovery Associates | 176,949 | a | 9,385,375 |
| | | | 31,063,366 |
| Energy—1.1% | | | |
| Superior Energy Services | 395,440 | a | 9,712,006 |
| Exchange-Traded Funds—2.8% | | | |
| iShares Russell 2000 ETF | 237,710 | b | 23,861,330 |
| Health Care Equipment & | | | |
| Services—5.3% | | | |
| Align Technology | 411,080 | a | 17,902,534 |
| Hanger | 504,801 | a | 15,502,439 |
| Merit Medical Systems | 880,072 | a | 11,264,922 |
| | | | 44,669,895 |
| Insurance—1.0% | | | |
| Brown & Brown | 264,670 | | 8,241,824 |
| Materials—4.2% | | | |
| Chemtura | 731,300 | a | 16,030,096 |
| OMNOVA Solutions | 1,472,010 | a | 11,363,917 |
| Zoltek | 599,651 | a,b | 8,299,170 |
| | | | 35,693,183 |
| Media—.6% | | | |
| AMC Networks, Cl. A | 28,650 | a | 1,775,727 |
| Lamar Advertising, Cl. A | 39,260 | a | 1,651,668 |
| Scripps Networks Interactive, Cl. A | 23,030 | | 1,693,396 |
| | | | 5,120,791 |
| Pharmaceuticals, Biotech & | | | |
| Life Sciences—6.6% | | | |
| Cubist Pharmaceuticals | 77,130 | a | 4,886,957 |
| Emergent BioSolutions | 1,227,806 | a | 21,584,829 |
| Questcor Pharmaceuticals | 222,860 | | 14,860,305 |
| Salix Pharmaceuticals | 220,830 | a | 14,782,360 |
| | | | 56,114,451 |
| Real Estate—1.0% | | | |
| American Residential Properties | 483,110 | a,c | 8,241,857 |
The Fund 9
STATEMENT OF INVESTMENTS (continued)
| | | |
| Common Stocks (continued) | Shares | | Value ($) |
| Retailing—3.8% | | | |
| Office Depot | 2,411,640 | a | 10,104,772 |
| OfficeMax | 925,680 | | 10,062,142 |
| Williams-Sonoma | 221,050 | | 12,469,430 |
| | | | 32,636,344 |
| Semiconductors & Semiconductor | | | |
| Equipment—5.3% | | | |
| Applied Micro Circuits | 1,852,680 | a | 19,934,837 |
| Lattice Semiconductor | 1,525,160 | a | 7,259,762 |
| Microsemi | 597,650 | a | 15,383,511 |
| Xilinx | 59,400 | | 2,579,148 |
| | | | 45,157,258 |
| Software & Services—11.7% | | | |
| Cardtronics | 221,370 | a | 7,679,325 |
| CoreLogic | 316,380 | a | 8,130,966 |
| CSG Systems International | 754,435 | | 17,759,400 |
| DealerTrack Technologies | 740,751 | a | 29,326,332 |
| Ellie Mae | 140,340 | a | 4,075,474 |
| Heartland Payment Systems | 566,910 | b | 20,947,325 |
| WEX | 150,480 | a | 12,042,914 |
| | | | 99,961,736 |
| Technology Hardware & Equipment—12.1% | | | |
| Arrow Electronics | 392,600 | a | 18,224,492 |
| Belden | 145,310 | | 8,241,983 |
| Ciena | 1,336,010 | a | 26,613,319 |
| JDS Uniphase | 1,268,230 | a | 16,271,391 |
| Plexus | 137,987 | a | 4,517,694 |
| ScanSource | 405,230 | a | 12,554,025 |
| Vishay Intertechnology | 1,354,080 | a | 16,587,480 |
| | | | 103,010,384 |
| Transportation—3.5% | | | |
| Arkansas Best | 117,920 | | 2,933,850 |
| Con-way | 105,460 | | 4,387,136 |
| Landstar System | 408,697 | | 22,335,291 |
| | | | 29,656,277 |
| Total Common Stocks | | | |
| (cost $667,715,755) | | | 847,537,249 |
10
| | | | |
| Other Investment—.7% | Shares | | Value ($) | |
| Registered Investment Company; | | | | |
| Dreyfus Institutional Preferred | | | | |
| Plus Money Market Fund | | | | |
| (cost $6,191,257) | 6,191,257 | d | 6,191,257 | |
| |
| Investment of Cash Collateral | | | | |
| for Securities Loaned—5.4% | | | | |
| Registered Investment Company; | | | | |
| Dreyfus Institutional Cash Advantage Fund | | | | |
| (cost $46,083,357) | 46,083,357 | d | 46,083,357 | |
| |
| Total Investments (cost $719,990,369) | 105.8 | % | 899,811,863 | |
| Liabilities, Less Cash and Receivables | (5.8 | %) | (49,126,489 | ) |
| Net Assets | 100.0 | % | 850,685,374 | |
ETF—Exchange-Traded Fund
|
| a Non-income producing security. |
| b Security, or portion thereof, on loan.At August 31, 2013, the value of the fund’s securities on loan was |
| $44,307,983 and the value of the collateral held by the fund was $46,083,357. |
| c Investment in real estate investment trust. |
| d Investment in affiliated money market mutual fund. |
| | | |
| Portfolio Summary (Unaudited)† | | |
| |
| | Value (%) | | Value (%) |
| Banks | 12.9 | Materials | 4.2 |
| Technology Hardware & Equipment | 12.1 | Consumer Durables & Apparel | 3.9 |
| Software & Services | 11.7 | Retailing | 3.8 |
| Capital Goods | 7.5 | Diversified Financials | 3.7 |
| Commercial & Professional Services | 6.7 | Transportation | 3.5 |
| Pharmaceuticals, | | Exchange-Traded Funds | 2.8 |
| Biotech & Life Sciences | 6.6 | Energy | 1.1 |
| Money Market Investments | 6.1 | Insurance | 1.0 |
| Automobiles & Components | 6.0 | Real Estate | 1.0 |
| Health Care Equipment & Services | 5.3 | Media | .6 |
| Semiconductors & | | | |
| Semiconductor Equipment | 5.3 | | 105.8 |
| |
| † Based on net assets. | | | |
| See notes to financial statements. | | | |
The Fund 11
STATEMENT OF ASSETS AND LIABILITIES
August 31, 2013
| | |
| | Cost | Value |
| Assets ($): | | |
| Investments in securities—See Statement of Investments (including | | |
| securities on loan, valued at $44,307,983)—Note 1(b): | | |
| Unaffiliated issuers | 667,715,755 | 847,537,249 |
| Affiliated issuers | 52,274,614 | 52,274,614 |
| Cash | | 1,887,209 |
| Receivable for shares of Common Stock subscribed | | 788,893 |
| Receivable for investment securities sold | | 644,426 |
| Dividends and securities lending income receivable | | 290,530 |
| Prepaid expenses | | 28,087 |
| | | 903,451,008 |
| Liabilities ($): | | |
| Due to The Dreyfus Corporation and affiliates—Note 3(b) | | 829,108 |
| Liability for securities on loan—Note 1(b) | | 46,083,357 |
| Payable for investment securities purchased | | 5,239,992 |
| Payable for shares of Common Stock redeemed | | 421,151 |
| Accrued expenses | | 192,026 |
| | | 52,765,634 |
| Net Assets ($) | | 850,685,374 |
| Composition of Net Assets ($): | | |
| Paid-in capital | | 607,616,439 |
| Accumulated net realized gain (loss) on investments | | 63,247,441 |
| Accumulated net unrealized appreciation | | |
| (depreciation) on investments | | 179,821,494 |
| Net Assets ($) | | 850,685,374 |
| Shares Outstanding | | |
| (200 million shares of $.001 par value Common Stock authorized) | | 24,514,911 |
| Net Asset Value, offering and redemption price per share ($) | | 34.70 |
| |
| See notes to financial statements. | | |
12
| STATEMENT OF OPERATIONS | | |
| Year Ended August 31, 2013 | | |
| |
| |
| Investment Income ($): | | |
| Income: | | |
| Cash dividends: | | |
| Unaffiliated issuers | 5,274,492 | |
| Affiliated issuers | 8,081 | |
| Income from securities lending—Note 1(b) | 727,819 | |
| Total Income | 6,010,392 | |
| Expenses: | | |
| Management fee—Note 3(a) | 5,376,753 | |
| Shareholder servicing costs—Note 3(b) | 2,409,165 | |
| Professional fees | 75,775 | |
| Custodian fees—Note 3(b) | 67,578 | |
| Directors’ fees and expenses—Note 3(c) | 63,373 | |
| Prospectus and shareholders’ reports | 60,944 | |
| Registration fees | 23,915 | |
| Interest expense—Note 2 | 7,653 | |
| Loan commitment fees—Note 2 | 7,403 | |
| Miscellaneous | 22,822 | |
| Total Expenses | 8,115,381 | |
| Less—reduction in fees due to earnings credits—Note 3(b) | (1,135 | ) |
| Net Expenses | 8,114,246 | |
| Investment (Loss)—Net | (2,103,854 | ) |
| Realized and Unrealized Gain (Loss) on Investments—Note 4 ($): | | |
| Net realized gain (loss) on investments | 119,609,338 | |
| Net unrealized appreciation (depreciation) on investments | 85,560,914 | |
| Net Realized and Unrealized Gain (Loss) on Investments | 205,170,252 | |
| Net Increase in Net Assets Resulting from Operations | 203,066,398 | |
| |
| See notes to financial statements. | | |
The Fund 13
STATEMENT OF CHANGES IN NET ASSETS
| | | | |
| | Year Ended August 31, | |
| | 2013 | | 2012 | |
| Operations ($): | | | | |
| Investment (loss)—net | (2,103,854 | ) | (3,022,615 | ) |
| Net realized gain (loss) on investments | 119,609,338 | | (24,260,541 | ) |
| Net unrealized appreciation | | | | |
| (depreciation) on investments | 85,560,914 | | 126,620,523 | |
| Net Increase (Decrease) in Net Assets | | | | |
| Resulting from Operations | 203,066,398 | | 99,337,367 | |
| Dividends to Shareholders from ($): | | | | |
| Net realized gain on investments | — | | (60,726,622 | ) |
| Capital Stock Transactions ($): | | | | |
| Net proceeds from shares sold | 267,552,568 | | 101,890,997 | |
| Net assets received in connection | | | | |
| with reorganization—Note 1 | — | | 93,191,816 | |
| Dividends reinvested | — | | 49,552,789 | |
| Cost of shares redeemed | (215,270,862 | ) | (261,807,519 | ) |
| Increase (Decrease) in Net Assets | | | | |
| from Capital Stock Transactions | 52,281,706 | | (17,171,917 | ) |
| Total Increase (Decrease) in Net Assets | 255,348,104 | | 21,438,828 | |
| Net Assets ($): | | | | |
| Beginning of Period | 595,337,270 | | 573,898,442 | |
| End of Period | 850,685,374 | | 595,337,270 | |
| Capital Share Transactions (Shares): | | | | |
| Shares sold | 8,939,680 | | 4,090,655 | |
| Shares received in connection | | | | |
| with reorganization—Note 1 | — | | 4,283,529 | |
| Shares issued for dividends reinvested | — | | 2,248,324 | |
| Shares redeemed | (7,304,234 | ) | (10,786,839 | ) |
| Net Increase (Decrease) in Shares Outstanding | 1,635,446 | | (164,331 | ) |
| |
| See notes to financial statements. | | | | |
14
FINANCIAL HIGHLIGHTS
The following table describes the performance for the fiscal periods indicated. Total return shows how much your investment in the fund would have increased (or decreased) during each period, assuming you had reinvested all dividends and distributions.These figures have been derived from the fund’s financial statements.
| | | | | | | | | | |
| | | | Year Ended August 31, | | | |
| | 2013 | | 2012 | | 2011 | | 2010 | | 2009 | |
| Per Share Data ($): | | | | | | | | | | |
| Net asset value, beginning of period | 26.02 | | 24.90 | | 22.49 | | 20.65 | | 20.20 | |
| Investment Operations: | | | | | | | | | | |
| Investment (loss)—neta | (.09 | ) | (.13 | ) | (.07 | ) | (.04 | ) | (.00 | )b |
| Net realized and unrealized | | | | | | | | | | |
| gain (loss) on investments | 8.77 | | 4.27 | | 2.97 | | 1.88 | | .73 | |
| Total from Investment Operations | 8.68 | | 4.14 | | 2.90 | | 1.84 | | .73 | |
| Distributions: | | | | | | | | | | |
| Dividends from investment income—net | — | | — | | (.00 | )b | — | | (.16 | ) |
| Dividends from net realized | | | | | | | | | | |
| gain on investments | — | | (3.02 | ) | (.49 | ) | — | | (.12 | ) |
| Total Distributions | — | | (3.02 | ) | (.49 | ) | — | | (.28 | ) |
| Net asset value, end of period | 34.70 | | 26.02 | | 24.90 | | 22.49 | | 20.65 | |
| Total Return (%) | 33.36 | | 18.81 | | 12.57 | | 8.91 | | 4.50 | |
| Ratios/Supplemental Data (%): | | | | | | | | | | |
| Ratio of total expenses | | | | | | | | | | |
| to average net assets | 1.13 | | 1.19 | | 1.16 | | 1.22 | | 1.38 | |
| Ratio of net expenses | | | | | | | | | | |
| to average net assets | 1.13 | | 1.19 | | 1.16 | | 1.22 | | 1.37 | |
| Ratio of net investment (loss) | | | | | | | | | | |
| to average net assets | (.29 | ) | (.52 | ) | (.23 | ) | (.15 | ) | (.00 | )c |
| Portfolio Turnover Rate | 94.62 | | 85.92 | | 123.29 | | 128.47 | | 194.30 | |
| Net Assets, end of period ($ x 1,000) | 850,685 | | 595,337 | | 573,898 | | 476,939 | | 199,399 | |
| |
| a | Based on average shares outstanding at each month end. |
| b | Amount represents less than $.01 per share. |
| c | Amount represents less than .01%. |
See notes to financial statements.
The Fund 15
NOTES TO FINANCIAL STATEMENTS
NOTE 1—Significant Accounting Policies:
Dreyfus Opportunistic Small Cap Fund (the “fund”) is a separate diversified series of Advantage Funds, Inc. (the “Company”), which is registered under the Investment Company Act of 1940, as amended (the “Act”), as an open-end management investment company and operates as a series company currently offering twelve series, including the fund.The fund’s investment objective is to seek capital appreciation. The Dreyfus Corporation (the “Manager” or “Dreyfus”), a wholly-owned subsidiary of The Bank of New York Mellon Corporation (“BNY Mellon”), serves as the fund’s investment adviser. MBSC Securities Corporation (the “Distributor”), a wholly-owned subsidiary of the Manager, is the distributor of the fund’s shares, which are sold to existing shareholders without a sales charge.
As of the close of business on December 15, 2011, pursuant to an Agreement and Plan of Reorganization previously approved by the Company’s Board of Directors (the “Board”), all of the assets, subject to the liabilities, of Dreyfus Emerging Leaders Fund (“Emerging Leaders”) were transferred to the fund in exchange for shares of Common Stock of the fund of equal value.The purpose of the transaction was to combine two funds with comparable investment objectives and strategies. Shareholders of Emerging Leaders received shares of the fund in an amount equal to the aggregate net asset value of their investment in Emerging Leaders at the time of the exchange. The exchange ratio was .79 to 1.The net asset value of the fund’s shares on the close of business December 15, 2011, after the reorganization was $21.75 and a total of 4,283,529 shares were issued to shareholders of Emerging Leaders in the exchange.The exchange was a tax-free event to shareholders of Emerging Leaders.
The Company accounts separately for the assets, liabilities and operations of each series. Expenses directly attributable to each series are
16
charged to that series’ operations; expenses which are applicable to all series are allocated among them on a pro rata basis.
The Financial Accounting Standards Board (“FASB”) Accounting Standards Codification is the exclusive reference of authoritative U.S. generally accepted accounting principles (“GAAP”) recognized by the FASB to be applied by nongovernmental entities. Rules and interpretive releases of the Securities and Exchange Commission (“SEC”) under authority of federal laws are also sources of authoritative GAAP for SEC registrants. The fund’s financial statements are prepared in accordance with GAAP, which may require the use of management estimates and assumptions.Actual results could differ from those estimates.
The Company enters into contracts that contain a variety of indemnifications.The fund’s maximum exposure under these arrangements is unknown.The fund does not anticipate recognizing any loss related to these arrangements.
(a) Portfolio valuation: The fair value of a financial instrument is the amount that would be received to sell an asset or paid to transfer a liability in an orderly transaction between market participants at the measurement date (i.e., the exit price). GAAP establishes a fair value hierarchy that prioritizes the inputs of valuation techniques used to measure fair value.This hierarchy gives the highest priority to unadjusted quoted prices in active markets for identical assets or liabilities (Level 1 measurements) and the lowest priority to unobservable inputs (Level 3 measurements).
Additionally, GAAP provides guidance on determining whether the volume and activity in a market has decreased significantly and whether such a decrease in activity results in transactions that are not orderly. GAAP requires enhanced disclosures around valuation inputs and techniques used during annual and interim periods.
The Fund 17
NOTES TO FINANCIAL STATEMENTS (continued)
Various inputs are used in determining the value of the fund’s investments relating to fair value measurements.These inputs are summarized in the three broad levels listed below:
Level 1—unadjusted quoted prices in active markets for identical investments.
Level 2—other significant observable inputs (including quoted prices for similar investments, interest rates, prepayment speeds, credit risk, etc.).
Level 3—significant unobservable inputs (including the fund’s own assumptions in determining the fair value of investments).
The inputs or methodology used for valuing securities are not necessarily an indication of the risk associated with investing in those securities.
Changes in valuation techniques may result in transfers in or out of an assigned level within the disclosure hierarchy. Valuation techniques used to value the fund’s investments are as follows:
Investments in securities are valued at the last sales price on the securities exchange or national securities market on which such securities are primarily traded. Securities listed on the National Market System for which market quotations are available are valued at the official closing price or, if there is no official closing price that day, at the last sales price. Securities not listed on an exchange or the national securities market, or securities for which there were no transactions, are valued at the average of the most recent bid and asked prices, except for open short positions, where the asked price is used for valuation purposes. Bid price is used when no asked price is available. Registered investment companies that are not traded on an exchange are valued at their net asset value. All of the preceding securities are categorized within Level 1 of the fair value hierarchy.
Fair valuing of securities may be determined with the assistance of a pricing service using calculations based on indices of domestic securities and other appropriate indicators, such as prices of relevant American Depository Receipts and financial futures. Utilizing these techniques may result in transfers between Level 1 and Level 2 of the fair value hierarchy.
18
When market quotations or official closing prices are not readily available, or are determined not to reflect accurately fair value, such as when the value of a security has been significantly affected by events after the close of the exchange or market on which the security is principally traded (for example, a foreign exchange or market), but before the fund calculates its net asset value, the fund may value these investments at fair value as determined in accordance with the procedures approved by the Board. Certain factors may be considered when fair valuing investments such as: fundamental analytical data, the nature and duration of restrictions on disposition, an evaluation of the forces that influence the market in which the securities are purchased and sold, and public trading in similar securities of the issuer or comparable issuers.These securities are either categorized within Level 2 or 3 of the fair value hierarchy depending on the relevant inputs used.
For restricted securities where observable inputs are limited, assumptions about market activity and risk are used and are categorized within Level 3 of the fair value hierarchy.
The following is a summary of the inputs used as of August 31, 2013 in valuing the fund’s investments:
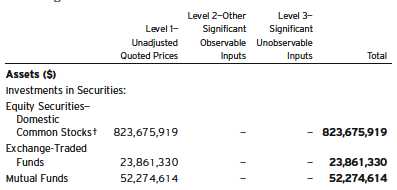
| |
| † | See Statement of Investments for additional detailed categorizations. |
At August 31, 2013, there were no transfers between Level 1 and Level 2 of the fair value hierarchy.
The Fund 19
NOTES TO FINANCIAL STATEMENTS (continued)
(b) Securities transactions and investment income: Securities transactions are recorded on a trade date basis. Realized gains and losses from securities transactions are recorded on the identified cost basis. Dividend income is recognized on the ex-dividend date and interest income, including, where applicable, accretion of discount and amortization of premium on investments, is recognized on the accrual basis.
Pursuant to a securities lending agreement with The Bank of New York Mellon, a subsidiary of BNY Mellon and an affiliate of Dreyfus, the fund may lend securities to qualified institutions. It is the fund’s policy that, at origination, all loans are secured by collateral of at least 102% of the value of U.S. securities loaned and 105% of the value of foreign securities loaned. Collateral equivalent to at least 100% of the market value of securities on loan is maintained at all times. Collateral is either in the form of cash, which can be invested in certain money market mutual funds managed by the Manager or U.S. Government and Agency securities. The fund is entitled to receive all dividends, interest and distributions on securities loaned, in addition to income earned as a result of the lending transaction. Should a borrower fail to return the securities in a timely manner, The Bank of New York Mellon is required to replace the securities for the benefit of the fund or credit the fund with the market value of the unreturned securities and is subrogated to the fund’s rights against the borrower and the collateral. During the period ended August 31, 2013, The Bank of NewYork Mellon earned $238,352 from lending portfolio securities, pursuant to the securities lending agreement.
(c) Affiliated issuers: Investments in other investment companies advised by Dreyfus are defined as “affiliated” under the Act. Investments in affiliated investment companies during the period ended August 31, 2013 were as follows:
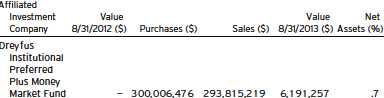
20
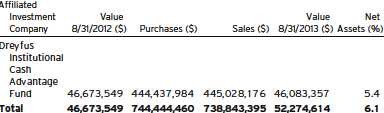
(d) Dividends to shareholders: Dividends are recorded on the ex-dividend date. Dividends from investment income-net and dividends from net realized capital gains, if any, are normally declared and paid annually, but the fund may make distributions on a more frequent basis to comply with the distribution requirements of the Internal Revenue Code of 1986, as amended (the “Code”).To the extent that net realized capital gains can be offset by capital loss carryovers, it is the policy of the fund not to distribute such gains. Income and capital gain distributions are determined in accordance with income tax regulations, which may differ from GAAP.
(e) Federal income taxes: It is the policy of the fund to continue to qualify as a regulated investment company, if such qualification is in the best interests of its shareholders, by complying with the applicable provisions of the Code, and to make distributions of taxable income sufficient to relieve it from substantially all federal income and excise taxes.
As of and during the period ended August 31, 2013, the fund did not have any liabilities for any uncertain tax positions.The fund recognizes interest and penalties, if any, related to uncertain tax positions as income tax expense in the Statement of Operations. During the period, the fund did not incur any interest or penalties.
Each tax year in the four-year period ended August 31, 2013 remains subject to examination by the Internal Revenue Service and state taxing authorities.
At August 31, 2013, the components of accumulated earnings on a tax basis were as follows: undistributed ordinary income $4,182,321, undistributed capital gains $77,969,826, accumulated capital losses $15,497,834 and unrealized appreciation $176,414,622.
The Fund 21
NOTES TO FINANCIAL STATEMENTS (continued)
Under the Regulated Investment Company Modernization Act of 2010 (the “2010 Act”), the fund is permitted to carry forward capital losses incurred in taxable years beginning after December 22, 2010 (“post-enactment losses”) for an unlimited period. Furthermore, post-enactment capital loss carryovers retain their character as either short-term or long-term capital losses rather than short-term as they were under previous statute.The 2010 Act requires post-enactment losses to be utilized before the utilization of losses incurred in taxable years prior to the effective date of the 2010 Act (“pre-enactment losses”).As a result of this ordering rule, pre-enactment losses may be more likely to expire unused.
As a result of the fund’s merger with Dreyfus Emerging Leaders Fund, capital losses of $15,497,834 are available to offset future gains, if any. Based on certain provisions in the Code, the amount of losses which can be utilized in subsequent years is subject to an annual limitation. If not applied, these acquired capital losses expires in fiscal year 2017.
The tax character of distributions paid to shareholders during the fiscal periods ended August 31, 2013 and August 31, 2012 were as follows: ordinary income $0 and $23,935,042, and long-term capital gains $0 and $36,791,580, respectively.
During the period ended August 31, 2013, as a result of permanent book to tax differences, primarily due to the tax treatment for net operating losses and limited partnership adjustments, the fund increased accumulated undistributed investment income-net by $2,103,854, decreased accumulated net realized gain (loss) on investments by $2,119,746 and increased paid-in capital by $15,892. Net assets and net asset value per share were not affected by this reclassification.
NOTE 2—Bank Lines of Credit:
The fund participates with other Dreyfus-managed funds in a $210 million unsecured credit facility led by Citibank, N.A. and a $300 million unsecured credit facility provided by The Bank of New York Mellon (each, a “Facility”), each to be utilized primarily for temporary
22
or emergency purposes, including the financing of redemptions. Prior to October 10, 2012, the unsecured credit facility with Citibank, N.A. was $225 million. In connection therewith, the fund has agreed to pay its pro rata portion of commitment fees for each Facility. Interest is charged to the fund based on rates determined pursuant to the terms of the respective Facility at the time of borrowing.
The average amount of borrowings outstanding under the Facilities during the period ended August 31, 2013 was approximately $673,700 with a related weighted average annualized interest rate of 1.14%.
NOTE 3—Management Fee and Other Transactions With Affiliates:
(a) Pursuant to a management agreement with the Manager, the management fee is computed at the annual rate of .75% of the value of the fund’s average daily net assets and is payable monthly.
(b) Under the Shareholder Services Plan, the fund pays the Distributor at an annual rate of .25% of the value of the fund’s average daily net assets for the provision of certain services. The services provided may include personal services relating to shareholder accounts, such as answering shareholder inquiries regarding the fund and providing reports and other information, and services related to the maintenance of shareholder accounts.The Distributor may make payments to Service Agents (securities dealers, financial institutions or other industry professionals) with respect to these services. The Distributor determines the amounts to be paid to Service Agents. During the period ended August 31, 2013, the fund was charged $1,792,251 pursuant to the Shareholder Services Plan.
The fund has arrangements with the transfer agent and the custodian whereby the fund may receive earnings credits when positive cash balances are maintained, which are used to offset transfer agency and custody fees. For financial reporting purposes, the fund includes net earnings credits as an expense offset in the Statement of Operations.
The Fund 23
NOTES TO FINANCIAL STATEMENTS (continued)
The fund compensates DreyfusTransfer, Inc., a wholly-owned subsidiary of the Manager, under a transfer agency agreement for providing transfer agency services for the fund and cash management services related to fund subscriptions and redemptions. During the period ended August 31, 2013, the fund was charged $179,537 for transfer agency services and $8,436 for cash management services. These fees are included in Shareholder servicing costs in the Statement of Operations. Cash management fees were partially offset by earnings credits of $1,099.
The fund compensates The Bank of New York Mellon under a custody agreement for providing custodial services for the fund. During the period ended August 31, 2013, the fund was charged $67,578 pursuant to the custody agreement.
The fund compensates The Bank of New York Mellon under a cash management agreement for performing certain cash management services related to fund subscriptions and redemptions. During the period ended August 31, 2013, the fund was charged $4,854 pursuant to the cash management agreement, which is included in Shareholder servicing costs in the Statement of Operations.These fees were partially offset by earnings credits of $36.
During the period ended August 31, 2013, the fund was charged $8,973 for services performed by the Chief Compliance Officer and his staff.
The components of “Due to The Dreyfus Corporation and affiliates” in the Statement of Assets and Liabilities consist of: management fees $559,957, Shareholder Services Plan fees $186,652, custodian fees $30,225, Chief Compliance Officer fees $6,172 and transfer agency fees $46,102.
(c) Each Board member also serves as a Board member of other funds within the Dreyfus complex. Annual retainer fees and attendance fees are allocated to each fund based on net assets.
24
NOTE 4—Securities Transactions:
The aggregate amount of purchases and sales of investment securities, excluding short-term securities, during the period ended August 31, 2013 amounted to $719,169,684 and $669,155,778, respectively.
At August 31, 2013, the cost of investments for federal income tax purposes was $723,397,241; accordingly, accumulated net unrealized appreciation on investments was $176,414,622, consisting of $187,918,693 gross unrealized appreciation and $11,504,071 gross unrealized depreciation.
The Fund 25
REPORT OF INDEPENDENT REGISTERED
PUBLIC ACCOUNTING FIRM
Shareholders and Board of Directors Dreyfus Opportunistic Small Cap Fund
We have audited the accompanying statement of assets and liabilities, including the statement of investments, of Dreyfus Opportunistic Small Cap Fund (one of the series comprising Advantage Funds, Inc.) as of August 31, 2013, and the related statement of operations for the year then ended, the statement of changes in net assets for each of the two years in the period then ended, and the financial highlights for each of the five years in the period then ended.These financial statements and financial highlights are the responsibility of the Fund’s management. Our responsibility is to express an opinion on these financial statements and financial highlights based on our audits.
We conducted our audits in accordance with the standards of the Public Company Accounting Oversight Board (United States).Those standards require that we plan and perform the audit to obtain reasonable assurance about whether the financial statements and financial highlights are free of material misstatement.We were not engaged to perform an audit of the Fund’s internal control over financial reporting. Our audits included consideration of internal control over financial reporting as a basis for designing audit procedures that are appropriate in the circumstances, but not for the purpose of expressing an opinion on the effectiveness of the Fund’s internal control over financial reporting.Accordingly, we express no such opinion. An audit also includes examining, on a test basis, evidence supporting the amounts and disclosures in the financial statements and financial highlights, assessing the accounting principles used and significant estimates made by management, and evaluating the overall financial statement presentation. Our procedures included confirmation of securities owned as ofAugust 31, 2013 by correspondence with the custodian and others.We believe that our audits provide a reasonable basis for our opinion.
In our opinion, the financial statements and financial highlights referred to above present fairly, in all material respects, the financial position of Dreyfus Opportunistic Small Cap Fund at August 31, 2013, the results of its operations for the year then ended, the changes in its net assets for each of the two years in the period then ended, and the financial highlights for each of the five years in the period then ended, in conformity with U.S. generally accepted accounting principles.

New York, New York
October 28, 2013
26
INFORMATION ABOUT THE RENEWAL OF THE
FUND’S MANAGEMENT AGREEMENT (Unaudited)
At a meeting of the fund’s Board of Directors held on March 4-5, 2013, the Board considered the renewal of the fund’s Management Agreement pursuant to which Dreyfus provides the fund with investment advisory and administrative services (the “Agreement”). The Board members, none of whom are “interested persons” (as defined in the Investment Company Act of 1940, as amended) of the fund, were assisted in their review by independent legal counsel and met with counsel in executive session separate from Dreyfus representatives. In considering the renewal of the Agreement, the Board considered all factors that it believed to be relevant, including those discussed below.The Board did not identify any one factor as dispositive, and each Board member may have attributed different weights to the factors considered.
Analysis of Nature, Extent, and Quality of Services Provided to the Fund. The Board considered information provided to them at the meeting and in previous presentations from Dreyfus representatives regarding the nature, extent, and quality of the services provided to funds in the Dreyfus fund complex. Dreyfus provided the number of open accounts in the fund, the fund’s asset size and the allocation of fund assets among distribution channels. Dreyfus also had previously provided information regarding the diverse intermediary relationships and distribution channels of funds in the Dreyfus fund complex (such as retail direct or intermediary, in which intermediaries typically are paid by the fund and/or Dreyfus) and Dreyfus’ corresponding need for broad, deep, and diverse resources to be able to provide ongoing shareholder services to each intermediary or distribution channel, as applicable to the fund.
The Board also considered research support available to, and portfolio management capabilities of, the fund’s portfolio management personnel and that Dreyfus also provides oversight of day-to-day fund operations, including fund accounting and administration and assistance in meeting legal and regulatory requirements.The Board also considered Dreyfus’ extensive administrative, accounting, and compliance infrastructures.The
The Fund 27
INFORMATION ABOUT THE RENEWAL OF THE FUND’S
MANAGEMENT AGREEMENT (Unaudited) (continued)
Board also considered portfolio management’s brokerage policies and practices (including policies and practices regarding soft dollars) and the standards applied in seeking best execution.
Comparative Analysis of the Fund’s Performance and Management Fee and Expense Ratio. The Board reviewed reports prepared by Lipper, Inc. (“Lipper”), an independent provider of investment company data, which included information comparing (1) the fund’s performance with the performance of a group of comparable funds (the “Performance Group”) and with a broader group of funds (the “Performance Universe”), all for various periods ended December 31, 2012, and (2) the fund’s actual and contractual management fees and total expenses with those of a group of comparable funds (the “Expense Group”) and with a broader group of funds (the “Expense Universe”), the information for which was derived in part from fund financial statements available to Lipper as of the date of its analysis. Dreyfus previously had furnished the Board with a description of the methodology Lipper used to select the Performance Group and Performance Universe and the Expense Group and Expense Universe.
Dreyfus representatives stated that the usefulness of performance comparisons may be affected by a number of factors, including different investment limitations that may be applicable to the fund and comparison funds. The Board discussed the results of the comparisons and noted that the fund’s total return performance was ranked in the first quartile in the Performance Group and Performance Universe in most of the periods, except for the two- and three-year periods when the fund’s performance was below the Performance Group and Performance Universe medians. Dreyfus representatives noted that three new primary portfolio managers had been appointed in June 2011. Dreyfus also provided a comparison of the fund’s calendar year total returns to the returns of the fund’s benchmark index.
The Board also reviewed the range of actual and contractual management fees and total expenses of the Expense Group and Expense
28
Universe funds and discussed the results of the comparisons.The Board noted that the fund’s contractual management fee was below the Expense Group median, the fund’s actual management fee was below the Expense Group and Expense Universe medians and the fund’s total expense ratio was above the Expense Group median and below the Expense Universe median.
Dreyfus representatives reviewed with the Board the management or investment advisory fees (1) paid by funds advised or administered by Dreyfus that are in the same Lipper category as the fund and (2) paid to Dreyfus or the Dreyfus-affiliated primary employer of the fund’s primary portfolio manager(s) for advising any separate accounts and/or other types of client portfolios that are considered to have similar investment strategies and policies as the fund (the “Similar Clients”), and explained the nature of the Similar Clients.They discussed differences in fees paid and the relationship of the fees paid in light of any differences in the services provided and other relevant factors. The Board considered the relevance of the fee information provided for the Similar Clients to evaluate the appropriateness and reasonableness of the fund’s management fee.
Analysis of Profitability and Economies of Scale. Dreyfus representatives reviewed the expenses allocated and profit received by Dreyfus and the resulting profitability percentage for managing the fund and the aggregate profitability percentage to Dreyfus of managing the funds in the Dreyfus fund complex, and the method used to determine the expenses and profit. The Board concluded that the profitability results were not unreasonable, given the services rendered and service levels provided by Dreyfus. The Board also had been provided with information prepared by an independent consulting firm regarding Dreyfus’ approach to allocating costs to, and determining the profitability of, individual funds and the entire Dreyfus fund complex.The consulting firm also had analyzed where any economies of scale might emerge in connection with the management of a fund.
The Fund 29
INFORMATION ABOUT THE RENEWAL OF THE FUND’S
MANAGEMENT AGREEMENT (Unaudited) (continued)
The Board’s counsel stated that the Board should consider the profitability analysis (1) as part of the evaluation of whether the fees under the Agreement bear a reasonable relationship to the mix of services provided by Dreyfus, including the nature, extent and quality of such services, and (2) in light of the relevant circumstances for the fund and the extent to which economies of scale would be realized if the fund grows and whether fee levels reflect these economies of scale for the benefit of fund shareholders. Dreyfus representatives also noted that, as a result of shared and allocated costs among funds in the Dreyfus fund complex, the extent of economies of scale could depend substantially on the level of assets in the complex as a whole, so that increases and decreases in complex-wide assets can affect potential economies of scale in a manner that is disproportionate to, or even in the opposite direction from, changes in the fund’s asset level.The Board also considered potential benefits to Dreyfus from acting as investment adviser and noted the soft dollar arrangements in effect for trading the fund’s investments.
At the conclusion of these discussions, the Board agreed that it had been furnished with sufficient information to make an informed business decision with respect to the renewal of the Agreement. Based on the discussions and considerations as described above, the Board concluded and determined as follows.
| |
| • | The Board concluded that the nature, extent and quality of the |
| | services provided by Dreyfus are adequate and appropriate. |
| • | The Board generally was satisfied with the fund’s overall performance, |
| | in light of the considerations described above. |
| • | The Board concluded that the fee paid to Dreyfus was reasonable in |
| | light of the considerations described above. |
| • | The Board determined that the economies of scale which may accrue |
| | to Dreyfus and its affiliates in connection with the management of the |
| | fund had been adequately considered by Dreyfus in connection with |
| | the fee rate charged to the fund pursuant to the Agreement and that, |
| | to the extent in the future it were determined that material |
| | economies of scale had not been shared with the fund, the Board |
| | would seek to have those economies of scale shared with the fund. |
30
In evaluating the Agreement, the Board considered these conclusions and determinations and also relied on its previous knowledge, gained through meetings and other interactions with Dreyfus and its affiliates, of the fund and the services provided to the fund by Dreyfus.The Board also relied on information received on a routine and regular basis throughout the year relating to the operations of the fund and the investment management and other services provided under the Agreement, including information on the investment performance of the fund in comparison to similar mutual funds and benchmark performance indices; general market outlook as applicable to the fund; and compliance reports. In addition, it should be noted that the Board’s consideration of the contractual fee arrangements for this fund had the benefit of a number of years of reviews of prior or similar agreements during which lengthy discussions took place between the Board and Dreyfus representatives. Certain aspects of the arrangements may receive greater scrutiny in some years than in others, and the Board’s conclusions may be based, in part, on their consideration of the same or similar arrangements in prior years. The Board determined that renewal of the Agreement was in the best interests of the fund and its shareholders.
The Fund 31
BOARD MEMBERS INFORMATION (Unaudited)

32
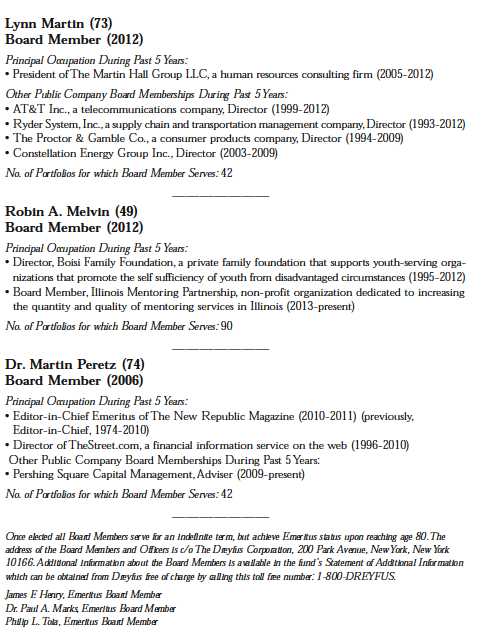
The Fund 33
OFFICERS OF THE FUND (Unaudited)
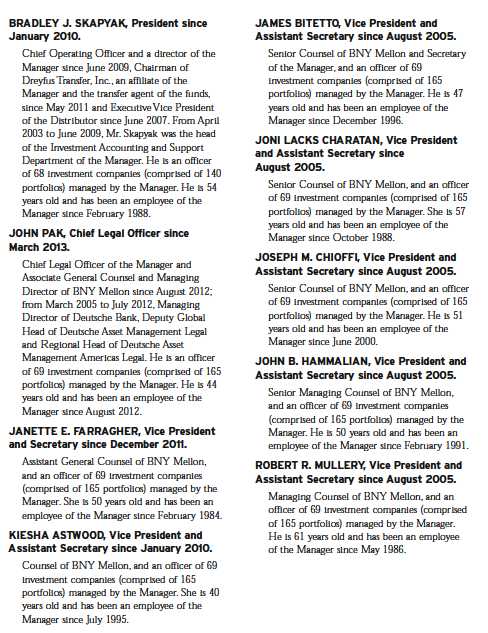
34
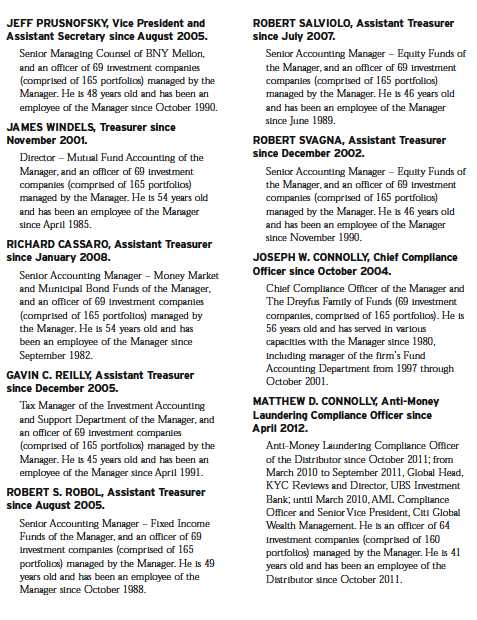
The Fund 35
Save time. Save paper. View your next shareholder report online as soon as it’s available. Log into www.dreyfus.com and sign up for Dreyfus eCommunications. It’s simple and only takes a few minutes.
The views expressed in this report reflect those of the portfolio manager only through the end of the period covered and do not necessarily represent the views of Dreyfus or any other person in the Dreyfus organization. Any such views are subject to change at any time based upon market or other conditions and Dreyfus disclaims any responsibility to update such views.These views may not be relied on as investment advice and, because investment decisions for a Dreyfus fund are based on numerous factors, may not be relied on as an indication of trading intent on behalf of any Dreyfus fund.

| | Contents |
| | THE FUND |
| 2 | A Letter from the President |
| 3 | Discussion of Fund Performance |
| 6 | Fund Performance |
| 8 | UnderstandingYour Fund’s Expenses |
| 8 | ComparingYour Fund’s Expenses With Those of Other Funds |
| 9 | Statement of Investments |
| 12 | Statement of Assets and Liabilities |
| 13 | Statement of Operations |
| 14 | Statement of Changes in Net Assets |
| 16 | Financial Highlights |
| 19 | Notes to Financial Statements |
| 28 | Report of Independent Registered Public Accounting Firm |
| 29 | Important Tax Information |
| 30 | Information About the Renewal of the Fund’s Management Agreement |
| 35 | Board Members Information |
| 37 | Officers of the Fund |
| | FOR MORE INFORMATION |
| | Back Cover |
Dreyfus
Opportunistic
U.S. Stock Fund
The Fund
A LETTER FROM THE PRESIDENT
Dear Shareholder:
We are pleased to present this annual report for Dreyfus Opportunistic U.S. Stock Fund, covering the 12-month period from September 1, 2012, through August 31, 2013. For information about how the fund performed during the reporting period, as well as general market perspectives, we provide a Discussion of Fund Performance on the pages that follow.
U.S. equities fared quite well over the past year, weathering periodic bouts of volatility after setting new record highs in the spring for many broad measures of stock market performance. Low interest rates, muted inflationary pressures, and a strong U.S. dollar helped fuel the market’s gains, as did a declining unemployment rate, rebounding housing markets, and increased production of domestic oil and natural gas.
In our analysis, the U.S. economy is nearing an inflection point to a somewhat faster growth rate.We expect a reduced fiscal drag in 2014 and beyond, and the stimulative monetary policy of the past five years should continue to support economic expansion, particularly in interest rate-sensitive industry groups. For information on how these developments may affect your investments, we urge you to discuss these matters with your financial advisor.
Thank you for your continued confidence and support.
Sincerely,

J. Charles Cardona
President
The Dreyfus Corporation
September 16, 2013
2
DISCUSSION OF FUND PERFORMANCE
For the period of September 1, 2012, through August 31, 2013, as provided by David A. Daglio, Primary Portfolio Manager
Fund and Market Performance Overview
For the 12-month period ended August 31, 2013, Dreyfus Opportunistic U.S. Stock Fund’s Class A shares produced a total return of 29.30%, Class C shares returned 28.12%, and Class I shares returned 29.43%.1 In comparison, the fund’s benchmark, the Russell 3000® Index (the “Index”), produced a total return of 20.32%.2
Equities rallied strongly over the reporting period as investors responded positively to improving economic data.The fund produced higher returns than its benchmark, primarily due to strong stock selections in the small, mid and large cap asset classes.
The Fund’s Investment Approach
The fund seeks long-term capital appreciation. The fund normally invests at least 80% of its assets in the stocks of publicly traded companies located in the United States.The fund may invest in the stocks of companies of any market capitalization and may hold growth or value stocks or a blend of both.
Stocks are selected for the fund’s portfolio based on a combination of fundamental, bottom-up research, macro insights, and risk management.With support from a team of research analysts, we use a disciplined, opportunistic investment approach to identify stocks of companies that we believe to be attractive from a valuation and fundamental standpoint, including those that are trading materially below our estimate of intrinsic market value, those that have strong or improving fundamentals, and those that have a revaluation catalyst.We focus on understanding the current fundamentals driving a company’s profits and cash flow, valuing the liabilities most likely to impact the company’s business and evaluating business conditions most likely to affect the company’s prospects for future growth.
Recovering Economy Fueled Market Gains
The reporting period began near the outset of a sustained stock market rally driven by improving U.S. employment and housing market trends. In addition, investors were encouraged by the launch of a new round of quantitative easing from the Federal Reserve Board (the “Fed”). Economic data continued to improve, and stocks generally continued to rally through the spring of 2013. By mid-May, several
The Fund 3
DISCUSSION OF FUND PERFORMANCE (continued)
broad measures of stock market performance reached new record highs. In late May, remarks by Fed Chairman Ben Bernanke were widely interpreted as a signal that the Fed would back away from its quantitative easing program sooner than expected.As a result, heightened volatility in June erased some of the stock market’s previous gains. Equity markets generally stabilized in July and August when investors realized that an end to quantitative easing would not necessarily portend higher short-term interest rates. In this environment, small- and midcap stocks produced higher returns than their large-cap counterparts.
Strong Stock Selections in Several Sectors Drove Gains
In the financials sector, positive contribution came from all asset classes. Small cap debt collection firm Portfolio Recovery Associates benefited from higher than expected cash collection rates, mid cap commercial bank SVB Financial Group reported better-than-expected loan growth, and large cap Bank of America made progress in its return to profitability. Online brokerage firms TD Ameritrade Holding and E*TRADE Financial reported rising trading volumes as investors shifted assets from fixed-income securities to equities.
Attractive mid-cycle fundamentals and valuations led the fund to significantly overweight exposure to apparel companies in the consumer discretionary sector. Fifth & Pacific Companies (the former Liz Claiborne) successfully transformed itself into a sleek specialty retailer headed by the Kate Spade brand. Jones Group began to engineer a business turnaround that should help boost profit margins. As anticipated, floor coverings manufacturer Mohawk Industries and homebuilder PulteGroup proved well positioned for recovering housing markets and rising home prices. In line with our forecast, automotive supplier American Axle & Manufacturing Holdings proved well positioned for the launch of the truck series from General Motors.
Results from the materials sector were bolstered by chemicals producer LyondellBasell Industries, which benefited from low prices for natural gas used in its manufacturing processes. Among energy companies, exploration-and-production company EOG Resources discovered new North American oil and gas resources and achieved better-than-expected production from existing wells, while oil services provider Halliburton saw increased drilling activity in the Gulf of Mexico.
Disappointments during the reporting period proved relatively mild and were concentrated mainly in the consumer staples sector, where tobacco company Philip Morris International largely sat out the rally due to its substantial presence in sluggish overseas markets.
4
Finding Ample Opportunities Among Individual Stocks
After the strong performance gains over the past two years, the investment landscape has become more selective.We continue to find the long term fundamental prospects of companies benefiting from higher interest rates far more compelling than consensus expects or believes. Our broad exposure to the financials sector reflects this view and we are likely to build additional exposure as opportunities are presented. Investor skepticism about near term earning prospects has created meaningful discounts from intrinsic valuations for many companies in the technology and industrial sectors.We believe the pending recovery in CEO business confidence will produce higher levels of discretionary spending which will benefit these industries and is reflected in the fund’s positioning. In addition, overlooked opportunities have quietly appeared in the health care sector and the fund’s exposure has increased as a result.
On the other hand, market interest for higher yielding stocks has elevated valuations for many stocks in the consumer staples, utilities, telecommunication services and REIT areas to the point where the stocks do not meet our investment disciplines. Our mid-cycle forecasts for most of the companies in the materials sector are far more cautious than consensus, which has produced limited holdings in the area.
September 16, 2013
Please note, the position in any security highlighted with italicized typeface was sold during the reporting period. Equity funds are subject generally to market, market sector, market liquidity, issuer and investment style risks, among other factors, to varying degrees, all of which are more fully described in the fund’s prospectus.
Stocks of small- and/or midcap companies often experience sharper price fluctuations than stocks of large-cap companies. The fund’s performance will be influenced by political, social and economic factors affecting investments in foreign companies. Special risks associated with investments in foreign companies include exposure to currency fluctuations, less liquidity, less developed or less efficient trading markets, lack of comprehensive company information, political instability and differing auditing and legal standards.These risks are enhanced in emerging market countries. Please read the prospectus for further discussion of these risks.
|
| 1 Total return includes reinvestment of dividends and any capital gains paid and does not take into consideration the |
| maximum initial sales charge in the case of Class A shares, or the applicable contingent deferred sales charge imposed |
| on redemptions in the case of Class C shares. Had these charges been reflected, returns would have been lower. Past |
| performance is no guarantee of future results. Share price and investment return fluctuate such that upon redemption |
| fund shares may be worth more or less than their original cost. The fund’s returns reflect the absorption of certain |
| fund expenses by The Dreyfus Corporation pursuant to an agreement in effect through February 1, 2014, at which |
| time it may be extended, terminated or modified. Had these expenses not been absorbed, the fund’s returns would |
| have been lower. |
| 2 SOURCE: LIPPER INC. — Reflects the reinvestment of dividends and, where applicable, capital gain |
| distributions.The Russell 3000® Index is composed of the 3,000 largest U.S. companies based on total market |
| capitalization. Investors cannot invest directly in any index. |
The Fund 5
FUND PERFORMANCE
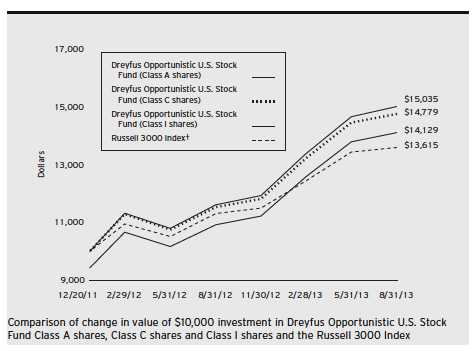
|
| † Source: Lipper Inc. |
| Past performance is not predictive of future performance. |
| The above graph compares a $10,000 investment made in each of the Class A, Class C and Class I shares of Dreyfus |
| Opportunistic U.S. Stock Fund on 12/20/11 (inception date) to a $10,000 investment made in the Russell 3000 |
| Index (the “Index”) on that date.All dividends and capital gain distributions are reinvested. |
| The fund’s performance shown in the line graph above takes into account the maximum initial sales charge on Class A |
| shares and all other applicable fees and expenses on all classes.The Index measures the performance of the largest 3,000 |
| U.S. companies representing approximately 98% of the investable U.S. equity market. Unlike a mutual fund, the Index |
| is not subject to charges, fees and other expenses. Investors cannot invest directly in any index. Further information |
| relating to fund performance, including expense reimbursements, if applicable, is contained in the Financial Highlights |
| section of the prospectus and elsewhere in this report. |
6
Average Annual Total Returns as of 8/31/13
| | | | | |
| | Inception | | | From | |
| | Date | 1 Year | | Inception | |
| Class A shares | | | | | |
| with maximum sales charge (5.75%) | 12/20/11 | 21.90 | % | 22.55 | % |
| without sales charge | 12/20/11 | 29.30 | % | 26.88 | % |
| Class C shares | | | | | |
| with applicable redemption charge † | 12/20/11 | 27.12 | % | 25.83 | % |
| without redemption | 12/20/11 | 28.12 | % | 25.83 | % |
| Class I shares | 12/20/11 | 29.43 | % | 27.11 | % |
| Russell 3000 Index | 12/31/11 | 20.32 | % | 20.34 | %†† |
Past performance is not predictive of future performance.The fund’s performance shown in the graph and table does not reflect the deduction of taxes that a shareholder would pay on fund distributions or the redemption of fund shares.
| |
| † | The maximum contingent deferred sales charge for Class C shares is 1% for shares redeemed within one year of the |
| | date of purchase. |
| †† | For comparative purposes, the value of the Index on 12/31/11 is used as the beginning value on 12/20/11. |
The Fund 7
UNDERSTANDING YOUR FUND’S EXPENSES (Unaudited)
As a mutual fund investor, you pay ongoing expenses, such as management fees and other expenses. Using the information below, you can estimate how these expenses affect your investment and compare them with the expenses of other funds.You also may pay one-time transaction expenses, including sales charges (loads) and redemption fees, which are not shown in this section and would have resulted in higher total expenses. For more information, see your fund’s prospectus or talk to your financial adviser.
Review your fund’s expenses
The table below shows the expenses you would have paid on a $1,000 investment in Dreyfus Opportunistic U.S. Stock Fund from March 1, 2013 to August 31, 2013. It also shows how much a $1,000 investment would be worth at the close of the period, assuming actual returns and expenses.
Expenses and Value of a $1,000 Investment
assuming actual returns for the six months ended August 31, 2013
| | | | | | |
| | | Class A | | Class C | | Class I |
| Expenses paid per $1,000† | $ | 6.42 | $ | 10.41 | $ | 5.08 |
| Ending value (after expenses) | $ | 1,122.60 | $ | 1,117.40 | $ | 1,123.00 |
COMPARING YOUR FUND’S EXPENSES
WITH THOSE OF OTHER FUNDS (Unaudited)
Using the SEC’s method to compare expenses
The Securities and Exchange Commission (SEC) has established guidelines to help
investors assess fund expenses. Per these guidelines, the table below shows your fund’s
expenses based on a $1,000 investment, assuming a hypothetical 5% annualized return.
You can use this information to compare the ongoing expenses (but not transaction
expenses or total cost) of investing in the fund with those of other funds.All mutual fund
shareholder reports will provide this information to help you make this comparison.
Please note that you cannot use this information to estimate your actual ending account
balance and expenses paid during the period.
Expenses and Value of a $1,000 Investment
assuming a hypothetical 5% annualized return for the six months ended August 31, 2013
| | | | | | |
| | | Class A | | Class C | | Class I |
| Expenses paid per $1,000† | $ | 6.11 | $ | 9.91 | $ | 4.84 |
| Ending value (after expenses) | $ | 1,019.16 | $ | 1,015.38 | $ | 1,020.42 |
|
| † Expenses are equal to the fund’s annualized expense ratio of 1.20% for Class A, 1.95% for Class C and .95% |
| for Class I, multiplied by the average account value over the period, multiplied by 184/365 (to reflect the one-half |
| year period). |
8
STATEMENT OF INVESTMENTS
August 31, 2013
| | | |
| Common Stocks—100.3% | Shares | | Value ($) |
| Automobiles & Components—.8% | | | |
| TRW Automotive Holdings | 800 | a | 55,256 |
| Banks—5.7% | | | |
| Comerica | 3,480 | | 142,123 |
| SVB Financial Group | 1,560 | a | 129,168 |
| UMB Financial | 2,540 | | 151,714 |
| | | | 423,005 |
| Capital Goods—8.1% | | | |
| Danaher | 2,730 | | 178,870 |
| MSC Industrial Direct, Cl. A | 1,690 | | 128,440 |
| Parker Hannifin | 1,630 | | 162,919 |
| Regal-Beloit | 2,100 | | 133,770 |
| | | | 603,999 |
| Commercial & Professional Services—2.4% | | | |
| Steelcase, Cl. A | 12,410 | | 180,193 |
| Consumer Durables & Apparel—4.8% | | | |
| Jones Group | 17,290 | | 254,682 |
| Newell Rubbermaid | 3,950 | | 99,935 |
| | | | 354,617 |
| Diversified Financials—19.2% | | | |
| Blackstone Group | 8,850 | | 193,284 |
| Citigroup | 5,650 | | 273,065 |
| CME Group | 2,140 | | 152,175 |
| E*TRADE Financial | 13,570 | a | 190,523 |
| Invesco | 10,680 | | 324,245 |
| TD Ameritrade Holding | 11,310 | | 290,328 |
| | | | 1,423,620 |
| Energy—3.6% | | | |
| Cameron International | 1,240 | a | 70,420 |
| EOG Resources | 600 | | 94,230 |
| Halliburton | 2,150 | | 103,200 |
| | | | 267,850 |
| Exchange-Traded Funds—3.2% | | | |
| Standard & Poor’s Depository | | | |
| Receipts S&P 500 ETF Trust | 1,470 | | 240,566 |
The Fund 9
STATEMENT OF INVESTMENTS (continued)
| | | |
| Common Stocks (continued) | Shares | | Value ($) |
| Food, Beverage & Tobacco—4.5% | | | |
| PepsiCo | 2,410 | | 192,149 |
| Philip Morris International | 1,700 | | 141,848 |
| | | | 333,997 |
| Health Care Equipment & Services—3.9% | | | |
| AmerisourceBergen | 3,020 | | 171,898 |
| HCA Holdings | 3,170 | | 121,062 |
| | | | 292,960 |
| Insurance—2.1% | | | |
| Hartford Financial Services Group | 5,240 | | 155,104 |
| Materials—1.1% | | | |
| LyondellBasell Industries, Cl. A | 1,180 | | 82,777 |
| Pharmaceuticals, Biotech & | | | |
| Life Sciences—10.9% | | | |
| Biogen Idec | 800 | a | 170,416 |
| Covance | 1,920 | a | 155,597 |
| Gilead Sciences | 3,430 | a | 206,726 |
| Perrigo | 1,280 | | 155,584 |
| Vertex Pharmaceuticals | 1,650 | a | 123,998 |
| | | | 812,321 |
| Retailing—3.8% | | | |
| Staples | 11,540 | | 160,521 |
| Tiffany & Co. | 1,610 | | 124,147 |
| | | | 284,668 |
| Semiconductors & Semiconductor | | | |
| Equipment—4.4% | | | |
| Applied Micro Circuits | 11,470 | a | 123,417 |
| Xilinx | 4,740 | | 205,811 |
| | | | 329,228 |
| Software & Services—2.9% | | | |
| DealerTrack Technologies | 2,910 | a | 115,207 |
| Facebook, Cl. A | 2,430 | a | 100,310 |
| | | | 215,517 |
| Technology Hardware & Equipment—17.1% | | | |
| Agilent Technologies | 4,050 | | 188,892 |
| Arrow Electronics | 3,910 | a | 181,502 |
| Ciena | 13,060 | a | 260,155 |
| EMC | 3,860 | | 99,510 |
10
| | | | |
| Common Stocks (continued) | Shares | | Value ($) | |
| Technology Hardware & Equipment (continued) | | | | |
| JDS Uniphase | 15,460 | a | 198,352 | |
| Juniper Networks | 8,310 | a | 157,059 | |
| QUALCOMM | 1,080 | | 71,582 | |
| SanDisk | 2,100 | | 115,878 | |
| | | | 1,272,930 | |
| Transportation—1.8% | | | | |
| Kirby | 1,630 | a | 131,101 | |
| Total Common Stocks | | | | |
| (cost $6,727,515) | | | 7,459,709 | |
| |
| Other Investment—.5% | | | | |
| Registered Investment Company; | | | | |
| Dreyfus Institutional Preferred | | | | |
| Plus Money Market Fund | | | | |
| (cost $36,854) | 36,854 | b | 36,854 | |
| |
| Total Investments (cost $6,764,369) | 100.8 | % | 7,496,563 | |
| Liabilities, Less Cash and Receivables | (.8 | %) | (56,302 | ) |
| Net Assets | 100.0 | % | 7,440,261 | |
ETF—Exchange-Traded Fund
| |
| a | Non-income producing security. |
| b | Investment in affiliated money market mutual fund. |
| | | |
| Portfolio Summary (Unaudited)† | | |
| |
| | Value (%) | | Value (%) |
| Diversified Financials | 19.2 | Retailing | 3.8 |
| Technology Hardware & Equipment | 17.1 | Energy | 3.6 |
| Pharmaceuticals, | | Exchange-Traded Funds | 3.2 |
| Biotech & Life Sciences | 10.9 | Software & Services | 2.9 |
| Capital Goods | 8.1 | Commercial & Professional Services | 2.4 |
| Banks | 5.7 | Insurance | 2.1 |
| Consumer Durables & Apparel | 4.8 | Transportation | 1.8 |
| Food, Beverage & Tobacco | 4.5 | Materials | 1.1 |
| Semiconductors & | | Automobiles & Components | .8 |
| Semiconductor Equipment | 4.4 | Money Market Investment | .5 |
| Health Care Equipment & Services | 3.9 | | 100.8 |
|
| † Based on net assets. |
| See notes to financial statements. |
The Fund 11
STATEMENT OF ASSETS AND LIABILITIES
August 31, 2013
| | | |
| | | Cost | Value |
| Assets ($): | | | |
| Investments in securities—See Statement of Investments: | | |
| Unaffiliated issuers | | 6,727,515 | 7,459,709 |
| Affiliated issuers | | 36,854 | 36,854 |
| Cash | | | 4,345 |
| Receivable for investment securities sold | | | 209,172 |
| Dividends receivable | | | 5,915 |
| Prepaid expenses | | | 7,266 |
| | | | 7,723,261 |
| Liabilities ($): | | | |
| Due to The Dreyfus Corporation and affiliates—Note 3(c) | | 7,752 |
| Payable for investment securities purchased | | | 227,631 |
| Accrued expenses | | | 47,617 |
| | | | 283,000 |
| Net Assets ($) | | | 7,440,261 |
| Composition of Net Assets ($): | | | |
| Paid-in capital | | | 5,993,885 |
| Accumulated undistributed investment income—net | | | 1,248 |
| Accumulated net realized gain (loss) on investments | | | 712,934 |
| Accumulated net unrealized appreciation | | | |
| (depreciation) on investments | | | 732,194 |
| Net Assets ($) | | | 7,440,261 |
| |
| |
| Net Asset Value Per Share | | | |
| | Class A | Class C | Class I |
| Net Assets ($) | 3,117,796 | 49,484 | 4,272,981 |
| Shares Outstanding | 175,606 | 2,810 | 240,038 |
| Net Asset Value Per Share ($) | 17.75 | 17.61 | 17.80 |
See notes to financial statements.
12
STATEMENT OF OPERATIONS
Year Ended August 31, 2013
| | |
| Investment Income ($): | | |
| Income: | | |
| Cash dividends (net of $1,544 foreign taxes withheld at source): | | |
| Unaffiliated issuers | 66,994 | |
| Affiliated issuers | 89 | |
| Total Income | 67,083 | |
| Expenses: | | |
| Management fee—Note 3(a) | 37,871 | |
| Professional fees | 64,326 | |
| Registration fees | 50,476 | |
| Prospectus and shareholders’ reports | 13,454 | |
| Shareholder servicing costs—Note 3(c) | 4,317 | |
| Custodian fees—Note 3(c) | 3,709 | |
| Directors’ fees and expenses—Note 3(d) | 501 | |
| Distribution fees—Note 3(b) | 326 | |
| Loan commitment fees—Note 2 | 24 | |
| Miscellaneous | 17,658 | |
| Total Expenses | 192,662 | |
| Less—reduction in expenses due to undertaking—Note 3(a) | (141,434 | ) |
| Less—reduction in fees due to earnings credits—Note 3(c) | (4 | ) |
| Net Expenses | 51,224 | |
| Investment Income—Net | 15,859 | |
| Realized and Unrealized Gain (Loss) on Investments—Note 4 ($): | | |
| Net realized gain (loss) on investments | 806,528 | |
| Net unrealized appreciation (depreciation) on investments | 345,153 | |
| Net Realized and Unrealized Gain (Loss) on Investments | 1,151,681 | |
| Net Increase in Net Assets Resulting from Operations | 1,167,540 | |
See notes to financial statements.
The Fund 13
STATEMENT OF CHANGES IN NET ASSETS
| | | | |
| | Year Ended August 31, | |
| | 2013 | | 2012 | a |
| Operations ($): | | | | |
| Investment income—net | 15,859 | | 9,274 | |
| Net realized gain (loss) on investments | 806,528 | | 90,604 | |
| Net unrealized appreciation | | | | |
| (depreciation) on investments | 345,153 | | 387,041 | |
| Net Increase (Decrease) in Net Assets | | | | |
| Resulting from Operations | 1,167,540 | | 486,919 | |
| Dividends to Shareholders from ($): | | | | |
| Investment income—net: | | | | |
| Class A | (1,204 | ) | — | |
| Class I | (24,364 | ) | — | |
| Net realized gain on investments: | | | | |
| Class A | (9,879 | ) | — | |
| Class C | (1,858 | ) | — | |
| Class I | (172,461 | ) | — | |
| Total Dividends | (209,766 | ) | — | |
| Capital Stock Transactions ($): | | | | |
| Net proceeds from shares sold: | | | | |
| Class A | 3,122,974 | | 61,471 | |
| Class C | 15,472 | | 31,000 | |
| Class I | 34,240 | | 2,986,500 | |
| Dividends reinvested: | | | | |
| Class A | 10,003 | | — | |
| Class C | 1,281 | | — | |
| Class I | 383 | | — | |
| Cost of shares redeemed: | | | | |
| Class A | (239,371 | ) | (4,858 | ) |
| Class C | (8,486 | ) | — | |
| Class I | (9,953 | ) | (5,088 | ) |
| Increase (Decrease) in Net Assets | | | | |
| from Capital Stock Transactions | 2,926,543 | | 3,069,025 | |
| Total Increase (Decrease) in Net Assets | 3,884,317 | | 3,555,944 | |
| Net Assets ($): | | | | |
| Beginning of Period | 3,555,944 | | — | |
| End of Period | 7,440,261 | | 3,555,944 | |
| Undistributed investment income—net | 1,248 | | 10,957 | |
14
| | | | |
| | Year Ended August 31, | |
| | 2013 | | 2012 | a |
| Capital Share Transactions: | | | | |
| Class Ab | | | | |
| Shares sold | 184,422 | | 4,562 | |
| Shares issued for dividends reinvested | 678 | | — | |
| Shares redeemed | (13,716 | ) | (340 | ) |
| Net Increase (Decrease) in Shares Outstanding | 171,384 | | 4,222 | |
| Class Cb | | | | |
| Shares sold | 949 | | 2,273 | |
| Shares issued for dividends reinvested | 87 | | — | |
| Shares redeemed | (499 | ) | — | |
| Net Increase (Decrease) in Shares Outstanding | 537 | | 2,273 | |
| Class I | | | | |
| Shares sold | 2,183 | | 238,854 | |
| Shares issued for dividends reinvested | 26 | | — | |
| Shares redeemed | (675 | ) | (350 | ) |
| Net Increase (Decrease) in Shares Outstanding | 1,534 | | 238,504 | |
|
| a From December 20, 2011 (commencement of operations) to August 31, 2012. |
| b During the period ended August 31, 2013, 451 Class C shares representing $7,775 were exchanged for 449 |
| Class A shares. |
See notes to financial statements.
The Fund 15
FINANCIAL HIGHLIGHTS
The following tables describe the performance for each share class for the fiscal periods indicated.All information (except portfolio turnover rate) reflects financial results for a single fund share.Total return shows how much your investment in the fund would have increased (or decreased) during each period, assuming you had reinvested all dividends and distributions.These figures have been derived from the fund’s financial statements.
| | | | |
| | Year Ended August 31, | |
| Class A Shares | 2013 | | 2012 | a |
| Per Share Data ($): | | | | |
| Net asset value, beginning of period | 14.49 | | 12.50 | |
| Investment Operations: | | | | |
| Investment income (loss)—netb | (.01 | ) | .02 | |
| Net realized and unrealized | | | | |
| gain (loss) on investments | 4.08 | | 1.97 | |
| Total from Investment Operations | 4.07 | | 1.99 | |
| Distributions: | | | | |
| Dividends from investment income—net | (.09 | ) | — | |
| Dividends from net realized gain on investments | (.72 | ) | — | |
| Total Distributions | (.81 | ) | — | |
| Net asset value, end of period | 17.75 | | 14.49 | |
| Total Return (%)c | 29.30 | | 15.92 | d |
| Ratios/Supplemental Data (%): | | | | |
| Ratio of total expenses to average net assets | 2.93 | | 7.51 | e |
| Ratio of net expenses to average net assets | 1.20 | | 1.20 | e |
| Ratio of net investment income | | | | |
| (loss) to average net assets | (.04 | ) | .18 | e |
| Portfolio Turnover Rate | 142.83 | | 46.51 | d |
| Net Assets, end of period ($ x 1,000) | 3,118 | | 61 | |
| |
| a | From December 20, 2011 (commencement of operations) to August 31, 2012. |
| b | Based on average shares outstanding at each month end. |
| c | Exclusive of sales charge. |
| d | Not annualized. |
| e | Annualized. |
See notes to financial statements.
16
| | | | |
| | Year Ended August 31, | |
| Class C Shares | 2013 | | 2012 | a |
| Per Share Data ($): | | | | |
| Net asset value, beginning of period | 14.42 | | 12.50 | |
| Investment Operations: | | | | |
| Investment (loss)—netb | (.10 | ) | (.05 | ) |
| Net realized and unrealized | | | | |
| gain (loss) on investments | 4.01 | | 1.97 | |
| Total from Investment Operations | 3.91 | | 1.92 | |
| Distributions: | | | | |
| Dividends from net realized gain on investments | (.72 | ) | — | |
| Net asset value, end of period | 17.61 | | 14.42 | |
| Total Return (%)c | 28.12 | | 15.36 | d |
| Ratios/Supplemental Data (%): | | | | |
| Ratio of total expenses to average net assets | 5.44 | | 8.09 | e |
| Ratio of net expenses to average net assets | 1.95 | | 1.95 | e |
| Ratio of net investment (loss) | | | | |
| to average net assets | (.60 | ) | (.53 | )e |
| Portfolio Turnover Rate | 142.83 | | 46.51 | d |
| Net Assets, end of period ($ x 1,000) | 49 | | 33 | |
| |
| a | From December 20, 2011 (commencement of operations) to August 31, 2012. |
| b | Based on average shares outstanding at each month end. |
| c | Exclusive of sales charge. |
| d | Not annualized. |
| e | Annualized. |
See notes to financial statements.
The Fund 17
FINANCIAL HIGHLIGHTS (continued)
| | | | |
| | Year Ended August 31, | |
| Class I Shares | 2013 | | 2012 | a |
| Per Share Data ($): | | | | |
| Net asset value, beginning of period | 14.52 | | 12.50 | |
| Investment Operations: | | | | |
| Investment income—netb | .07 | | .04 | |
| Net realized and unrealized | | | | |
| gain (loss) on investments | 4.03 | | 1.98 | |
| Total from Investment Operations | 4.10 | | 2.02 | |
| Distributions: | | | | |
| Dividends from investment income—net | (.10 | ) | — | |
| Dividends from net realized gain on investments | (.72 | ) | — | |
| Total Distributions | (.82 | ) | — | |
| Net asset value, end of period | 17.80 | | 14.52 | |
| Total Return (%) | 29.43 | | 16.16 | c |
| Ratios/Supplemental Data (%): | | | | |
| Ratio of total expenses to average net assets | 4.05 | | 7.13 | d |
| Ratio of net expenses to average net assets | .95 | | .95 | d |
| Ratio of net investment income | | | | |
| to average net assets | .43 | | .40 | d |
| Portfolio Turnover Rate | 142.83 | | 46.51 | c |
| Net Assets, end of period ($ x 1,000) | 4,273 | | 3,462 | |
| |
| a | From December 20, 2011 (commencement of operations) to August 31, 2012. |
| b | Based on average shares outstanding at each month end. |
| c | Not annualized. |
| d | Annualized. |
See notes to financial statements.
18
NOTES TO FINANCIAL STATEMENTS
NOTE 1—Significant Accounting Policies:
Dreyfus Opportunistic U.S. Stock Fund (the “fund”) is a separate diversified series of Advantage Funds, Inc. (the “Company”), which is registered under the Investment Company Act of 1940, as amended (the “Act”), as an open-end management investment company and operates as a series company currently offering twelve series, including the fund. The fund’s investment objective is to seek long-term capital appreciation. The Dreyfus Corporation (the “Manager” or “Dreyfus”), a wholly-owned subsidiary ofThe Bank of NewYork Mellon Corporation (“BNY Mellon”), serves as the fund’s investment adviser.
MBSC Securities Corporation (the “Distributor”), a wholly-owned subsidiary of the Manager, is the distributor of the fund’s shares.The fund is authorized to issue 100 million shares of $.001 par value Common Stock in each of the following classes of shares: Class A, Class C and Class I. Class A shares generally are subject to a sales charge imposed at the time of purchase. Class C shares are subject to a contingent deferred sales charge (“CDSC”) imposed on Class C shares redeemed within one year of purchase. Class I shares are sold at net asset value per share only to institutional investors. Other differences between the classes include the services offered to and the expenses borne by each class, the allocation of certain transfer agency costs and certain voting rights. Income, expenses (other than expenses attributable to a specific class), and realized and unrealized gains or losses on investments are allocated to each class of shares based on its relative net assets.
The sales charge may be reduced or waived for certain purchases of Class A shares. Effective April 1, 2013, pursuant to new/modified front-end sales charge waivers, Class A shares of the fund may be purchased at net asset value without payment of a sales charge by (a) investors who participate in a self-directed investment brokerage account program offered by financial intermediaries that have entered into an agreement with the fund’s Distributor (financial intermediaries
The Fund 19
NOTES TO FINANCIAL STATEMENTS (continued)
offering self-directed investment brokerage accounts may or may not charge their customers a transaction fee) and (b) investors who purchase Class A shares directly through the fund’s Distributor, and either (i) have, or whose spouse or minor children have, beneficially owned shares and continuously maintained an open account with the Distributor in a Dreyfus-managed fund since on or before February 28, 2006, or (ii) such purchase is for a self-directed investment account that may or may not be subject to a transaction fee.
As of August 31, 2013, MBC Investments Corp., an indirect subsidiary of BNY Mellon, held 800 Class C and 238,400 Class I shares of the fund.
The Company accounts separately for the assets, liabilities and operations of each series. Expenses directly attributable to each series are charged to that series’ operations; expenses which are applicable to all series are allocated among them on a pro rata basis.
The Financial Accounting Standards Board (“FASB”) Accounting Standards Codification is the exclusive reference of authoritative U.S. generally accepted accounting principles (“GAAP”) recognized by the FASB to be applied by nongovernmental entities. Rules and interpretive releases of the Securities and Exchange Commission (“SEC”) under authority of federal laws are also sources of authoritative GAAP for SEC registrants. The fund’s financial statements are prepared in accordance with GAAP, which may require the use of management estimates and assumptions.Actual results could differ from those estimates.
The Company enters into contracts that contain a variety of indemnifications.The fund’s maximum exposure under these arrangements is unknown.The fund does not anticipate recognizing any loss related to these arrangements.
(a) Portfolio valuation: The fair value of a financial instrument is the amount that would be received to sell an asset or paid to transfer a liability in an orderly transaction between market participants at the measurement date (i.e., the exit price). GAAP establishes a fair value
20
hierarchy that prioritizes the inputs of valuation techniques used to measure fair value.This hierarchy gives the highest priority to unadjusted quoted prices in active markets for identical assets or liabilities (Level 1 measurements) and the lowest priority to unobservable inputs (Level 3 measurements).
Additionally, GAAP provides guidance on determining whether the volume and activity in a market has decreased significantly and whether such a decrease in activity results in transactions that are not orderly. GAAP requires enhanced disclosures around valuation inputs and techniques used during annual and interim periods.
Various inputs are used in determining the value of the fund’s investments relating to fair value measurements.These inputs are summarized in the three broad levels listed below:
Level 1—unadjusted quoted prices in active markets for identical investments.
Level 2—other significant observable inputs (including quoted prices for similar investments, interest rates, prepayment speeds, credit risk, etc.).
Level 3—significant unobservable inputs (including the fund’s own assumptions in determining the fair value of investments).
The inputs or methodology used for valuing securities are not necessarily an indication of the risk associated with investing in those securities.
Changes in valuation techniques may result in transfers in or out of an assigned level within the disclosure hierarchy. Valuation techniques used to value the fund’s investments are as follows:
Investments in securities are valued at the last sales price on the securities exchange or national securities market on which such securities are primarily traded. Securities listed on the National Market System for which market quotations are available are valued at the official closing price or, if there is no official closing price that day, at the last sales
The Fund 21
NOTES TO FINANCIAL STATEMENTS (continued)
price. Securities not listed on an exchange or the national securities market, or securities for which there were no transactions, are valued at the average of the most recent bid and asked prices, except for open short positions, where the asked price is used for valuation purposes. Bid price is used when no asked price is available. Registered investment companies that are not traded on an exchange are valued at their net asset value. All of the preceding securities are categorized within Level 1 of the fair value hierarchy.
Fair valuing of securities may be determined with the assistance of a pricing service using calculations based on indices of domestic securities and other appropriate indicators, such as prices of relevant American Depository Receipts and financial futures. Utilizing these techniques may result in transfers between Level 1 and Level 2 of the fair value hierarchy.
When market quotations or official closing prices are not readily available, or are determined not to reflect accurately fair value, such as when the value of a security has been significantly affected by events after the close of the exchange or market on which the security is principally traded (for example, a foreign exchange or market), but before the fund calculates its net asset value, the fund may value these investments at fair value as determined in accordance with the procedures approved by the Company’s Board of Directors (the “Board”). Certain factors may be considered when fair valuing investments such as: fundamental analytical data, the nature and duration of restrictions on disposition, an evaluation of the forces that influence the market in which the securities are purchased and sold, and public trading in similar securities of the issuer or comparable issuers.These securities are either categorized within Level 2 or 3 of the fair value hierarchy depending on the relevant inputs used.
For restricted securities where observable inputs are limited, assumptions about market activity and risk are used and are categorized within Level 3 of the fair value hierarchy.
22
The following is a summary of the inputs used as of August 31, 2013 in valuing the fund’s investments:
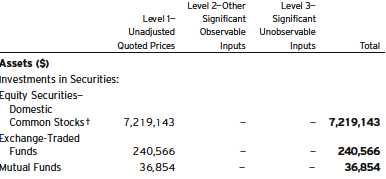
| |
| † | See Statement of Investments for additional detailed categorizations. |
At August 31, 2013, there were no transfers between Level 1 and Level 2 of the fair value hierarchy.
(b) Securities transactions and investment income: Securities transactions are recorded on a trade date basis. Realized gains and losses from securities transactions are recorded on the identified cost basis. Dividend income is recognized on the ex-dividend date and interest income, including, where applicable, accretion of discount and amortization of premium on investments, is recognized on the accrual basis.
(c) Affiliated issuers: Investments in other investment companies advised by Dreyfus are defined as “affiliated” under the Act. Investments in affiliated investment companies during the period ended August 31, 2013 were as follows:
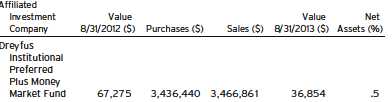
The Fund 23
NOTES TO FINANCIAL STATEMENTS (continued)
(d) Dividends to shareholders: Dividends are recorded on the ex-dividend date. Dividends from investment income-net and dividends from net realized capital gains, if any, are normally declared and paid annually, but the fund may make distributions on a more frequent basis to comply with the distribution requirements of the Internal Revenue Code of 1986, as amended (the “Code”).To the extent that net realized capital gains can be offset by capital loss carryovers, it is the policy of the fund not to distribute such gains. Income and capital gain distributions are determined in accordance with income tax regulations, which may differ from GAAP.
(e) Federal income taxes: It is the policy of the fund to continue to qualify as a regulated investment company, if such qualification is in the best interests of its shareholders, by complying with the applicable provisions of the Code, and to make distributions of taxable income sufficient to relieve it from substantially all federal income and excise taxes.
As of and during the period ended August 31, 2013, the fund did not have any liabilities for any uncertain tax positions.The fund recognizes interest and penalties, if any, related to uncertain tax positions as income tax expense in the Statement of Operations. During the period, the fund did not incur any interest or penalties.
Each tax year in the two-year period ended August 31, 2013 remains subject to examination by the Internal Revenue Service and state taxing authorities.
At August 31, 2013, the components of accumulated earnings on a tax basis were as follows: undistributed ordinary income $492,650, undistributed capital gains $232,445 and unrealized appreciation $721,281.
The tax character of distributions paid to shareholders during the fiscal periods ended August 31, 2013 and August 31, 2012 were as follows: ordinary income $209,766 and $0, respectively.
NOTE 2—Bank Lines of Credit:
The fund participates with other Dreyfus-managed funds in a $210 million unsecured credit facility led by Citibank, N.A. and a $300 mil-
24
lion unsecured credit facility provided by The Bank of New York Mellon, a subsidiary of BNY Mellon and an affiliate of Dreyfus (each, a “Facility”), each to be utilized primarily for temporary or emergency purposes, including the financing of redemptions. Prior to October 10, 2012, the unsecured credit facility with Citibank, N.A. was $225 million. In connection therewith, the fund has agreed to pay its pro rata portion of commitment fees for each Facility. Interest is charged to the fund based on rates determined pursuant to the terms of the respective Facility at the time of borrowing. During the period ended August 31, 2013, the fund did not borrow under the Facilities.
NOTE 3—Management Fee and Other Transactions With Affiliates:
(a) Pursuant to a management agreement with the Manager, the management fee is computed at an annual rate of .75% of the value of the fund’s average daily net assets and is payable monthly.
The Manager has contractually agreed, from September 1, 2012 through February 1, 2014, to waive receipt of its fees and/or assume the expenses of the fund so that the expenses of none of the classes (excluding Rule 12b-1 Distribution Plan fees, Shareholder Services Plan fees, taxes, interest expense, brokerage commissions, commitment fees on borrowings and extraordinary expenses) exceed .95% of the value of the average daily net assets of their class.The reduction in expenses, pursuant to the undertaking, amounted to $141,434 during the period ended August 31, 2013.
During the period ended August 31, 2013, the Distributor retained $1,192 from commissions earned on sales of the fund’s Class A shares.
(b) Under the Distribution Plan adopted pursuant to Rule 12b-1 under the Act, Class C shares pay the Distributor for distributing its shares at an annual rate of .75% of the value of its average daily net assets. During the period ended August 31, 2013, Class C shares were charged $326 pursuant to the Distribution Plan.
The Fund 25
NOTES TO FINANCIAL STATEMENTS (continued)
(c) Under the Shareholder Services Plan, Class A and Class C shares pay the Distributor at an annual rate of .25% of the value of their average daily net assets for the provision of certain services.The services provided may include personal services relating to shareholder accounts, such as answering shareholder inquiries regarding the fund and providing reports and other information, and services related to the maintenance of shareholder accounts.The Distributor may make payments to Service Agents (securities dealers, financial institutions or other industry professionals) with respect to these services.The Distributor determines the amounts to be paid to Service Agents. During the period ended August 31, 2013, Class A and Class C shares were charged $2,795 and $109, respectively, pursuant to the Shareholder Services Plan.
The fund has arrangements with the transfer agent and the custodian whereby the fund may receive earnings credits when positive cash balances are maintained, which are used to offset transfer agency and custody fees. For financial reporting purposes, the fund includes net earnings credits as an expense offset in the Statement of Operations.
The fund compensates Dreyfus Transfer, Inc., a wholly-owned subsidiary of the Manager, under a transfer agency agreement for providing transfer agency services for the fund and cash management services related to fund subscriptions and redemptions. During the period ended August 31, 2013, the fund was charged $1,120 for transfer agency services and $33 for cash management services.These fees are included in Shareholder servicing costs in the Statement of Operations. Cash management fees were partially offset by earnings credits of $4.
The fund compensatesThe Bank of NewYork Mellon under a custody agreement for providing custodial services for the fund. During the period ended August 31, 2013, the fund was charged $3,709 pursuant to the custody agreement.
26
The fund compensates The Bank of New York Mellon under a cash management agreement for performing certain cash management services related to fund subscriptions and redemptions. During the period ended August 31, 2013, the fund was charged $15 pursuant to the cash management agreement, which is included in Shareholder servicing costs in the Statement of Operations.
During the period ended August 31, 2013, the fund was charged $8,973 for services performed by the Chief Compliance Officer and his staff.
The components of “Due to The Dreyfus Corporation and affiliates” in the Statement of Assets and Liabilities consist of: management fees $4,814, Distribution Plan fees $33, Shareholder Services Plan fees $664, custodian fees $1,622, Chief Compliance Officer fees $6,172 and transfer agency fees $419, which are offset against an expense reimbursement currently in effect in the amount of $5,972.
(d) Each Board member also serves as a Board member of other funds within the Dreyfus complex. Annual retainer fees and attendance fees are allocated to each fund based on net assets.
NOTE 4—Securities Transactions:
The aggregate amount of purchases and sales of investment securities, excluding short-term securities, during the period ended August 31, 2013, amounted to $9,929,885 and $7,112,699, respectively.
At August 31, 2013, the cost of investments for federal income tax purposes was $6,775,282; accordingly, accumulated net unrealized appreciation on investments was $721,281, consisting of $871,264 gross unrealized appreciation and $149,983 gross unrealized depreciation.
The Fund 27
REPORT OF INDEPENDENT REGISTERED
PUBLIC ACCOUNTING FIRM
Shareholders and Board of Directors Dreyfus Opportunistic U.S. Stock Fund
We have audited the accompanying statement of assets and liabilities, including the statement of investments, of Dreyfus Opportunistic U.S. Stock Fund (one of the series comprising Advantage Funds, Inc.) as of August 31, 2013, and the related statement of operations for the year then ended, and the statement of changes in net assets and the financial highlights for the year then ended and for the period from December 20, 2011 (commencement of operations) to August 31, 2012. These financial statements and financial highlights are the responsibility of the Fund’s management. Our responsibility is to express an opinion on these financial statements and financial highlights based on our audits.
We conducted our audits in accordance with the standards of the Public Company Accounting Oversight Board (United States).Those standards require that we plan and perform the audit to obtain reasonable assurance about whether the financial statements and financial highlights are free of material misstatement.We were not engaged to perform an audit of the Fund’s internal control over financial reporting. Our audits included consideration of internal control over financial reporting as a basis for designing audit procedures that are appropriate in the circumstances, but not for the purpose of expressing an opinion on the effectiveness of the Fund’s internal control over financial reporting. Accordingly, we express no such opinion. An audit also includes examining, on a test basis, evidence supporting the amounts and disclosures in the financial statements and financial highlights, assessing the accounting principles used and significant estimates made by management, and evaluating the overall financial statement presentation. Our procedures included confirmation of securities owned as of August 31, 2013 by correspondence with the custodian and others.We believe that our audits provide a reasonable basis for our opinion.
In our opinion, the financial statements and financial highlights referred to above present fairly, in all material respects, the financial position of Dreyfus Opportunistic U.S. Stock Fund at August 31, 2013, the results of its operations for the year then ended, and the changes in its net assets and the financial highlights for the year then ended and for the period from December 20, 2011 to August 31, 2012, in conformity with U.S. generally accepted accounting principles.

New York, New York
October 28, 2013
28
IMPORTANT TAX INFORMATION (Unaudited)
For federal tax purposes, the fund hereby reports 18.26% of the ordinary dividends paid during the fiscal year ended August 31, 2013 as qualifying for the corporate dividends received deduction. Also, certain dividends paid by the fund may be subject to a maximum tax rate of 15%, as provided for by the Jobs and Growth Tax Relief Reconciliation Act of 2003. Of the distributions paid during the fiscal year, $97,106 represents the maximum amount that may be considered qualified dividend income.The fund also hereby reports $.7220 per share as a short-term capital gain distribution paid on December 18, 2012. Shareholders will receive notification in early 2014 of the percentage applicable to the preparation of their 2013 income tax returns.
The Fund 29
INFORMATION ABOUT THE RENEWAL OF THE
FUND’S MANAGEMENT AGREEMENT (Unaudited)
At a meeting of the fund’s Board of Directors held on March 4-5, 2013, the Board considered the renewal of the fund’s Management Agreement pursuant to which Dreyfus provides the fund with investment advisory and administrative services (the “Agreement”). The Board members, none of whom are “interested persons” (as defined in the Investment Company Act of 1940, as amended) of the fund, were assisted in their review by independent legal counsel and met with counsel in executive session separate from Dreyfus representatives. In considering the renewal of the Agreement, the Board considered all factors that it believed to be relevant, including those discussed below.The Board did not identify any one factor as dispositive, and each Board member may have attributed different weights to the factors considered.
Analysis of Nature, Extent, and Quality of Services Provided to the Fund. The Board considered information provided to them at the meeting and in previous presentations from Dreyfus representatives regarding the nature, extent, and quality of the services provided to funds in the Dreyfus fund complex. Dreyfus provided the number of open accounts in the fund, the fund’s asset size and the allocation of fund assets among distribution channels. Dreyfus also had previously provided information regarding the diverse intermediary relationships and distribution channels of funds in the Dreyfus fund complex (such as retail direct or intermediary, in which intermediaries typically are paid by the fund and/or Dreyfus) and Dreyfus’ corresponding need for broad, deep, and diverse resources to be able to provide ongoing shareholder services to each intermediary or distribution channel, as applicable to the fund.
The Board also considered research support available to, and portfolio management capabilities of, the fund’s portfolio management personnel and that Dreyfus also provides oversight of day-to-day fund operations, including fund accounting and administration and assistance in meeting legal and regulatory requirements.The Board also considered Dreyfus’ extensive administrative, accounting, and compliance infrastructures.The Board also considered portfolio management’s brokerage policies and
30
practices (including policies and practices regarding soft dollars) and the standards applied in seeking best execution.
Comparative Analysis of the Fund’s Performance and Management Fee and Expense Ratio. The Board reviewed reports prepared by Lipper, Inc. (“Lipper”), an independent provider of investment company data, which included information comparing (1) the fund’s performance with the performance of a group of comparable funds (the “Performance Group”) and with a broader group of funds (the “Performance Universe”), all for various periods ended December 31, 2012, and (2) the fund’s actual and contractual management fees and total expenses with those of a group of comparable funds (the “Expense Group”) and with a broader group of funds (the “Expense Universe”), the information for which was derived in part from fund financial statements available to Lipper as of the date of its analysis. Dreyfus previously had furnished the Board with a description of the methodology Lipper used to select the Performance Group and Performance Universe and the Expense Group and Expense Universe.
Dreyfus representatives stated that the usefulness of performance comparisons may be affected by a number of factors, including different investment limitations that may be applicable to the fund and comparison funds. The Board discussed the results of the comparisons and noted that the fund’s total return performance was ranked in the first quartile in the Performance Group and Performance Universe for the one-year period (the fund had commenced operations on December 20, 2011). Dreyfus also provided a comparison of the fund’s calendar year total returns to the returns of the fund’s benchmark index.
The Board also reviewed the range of actual and contractual management fees and total expenses of the Expense Group and Expense Universe funds and discussed the results of the comparisons.The Board noted that the fund’s contractual management fee was at the Expense Group median and the fund’s actual management fee and total expense ratio were below the Expense Group and Expense Universe medians.
The Fund 31
INFORMATION ABOUT THE RENEWAL OF THE FUND’S
MANAGEMENT AGREEMENT (Unaudited) (continued)
Dreyfus representatives noted that Dreyfus has contractually agreed to waive receipt of its fees and/or assume the expenses of the fund, until February 1, 2014, so that the expenses of none of the classes (excluding Rule 12b-1 Distribution Plan fees, Shareholder Services Plan fees, taxes, interest expense, brokerage commissions, commitment fees on borrowings and extraordinary expenses) exceed .95% of the value of the average daily net assets of their class.
Dreyfus representatives reviewed with the Board the management or investment advisory fees (1) paid by funds advised or administered by Dreyfus that are in the same Lipper category as the fund and (2) paid to Dreyfus or the Dreyfus-affiliated primary employer of the fund’s primary portfolio manager(s) for advising any separate accounts and/or other types of client portfolios that are considered to have similar investment strategies and policies as the fund (the “Similar Clients”), and explained the nature of the Similar Clients.They discussed differences in fees paid and the relationship of the fees paid in light of any differences in the services provided and other relevant factors. The Board considered the relevance of the fee information provided for the Similar Clients to evaluate the appropriateness and reasonableness of the fund’s management fee.
Analysis of Profitability and Economies of Scale. Dreyfus representatives reviewed the expenses allocated and profit received by Dreyfus and the resulting profitability percentage for managing the fund and the aggregate profitability percentage to Dreyfus of managing the funds in the Dreyfus fund complex, and the method used to determine the expenses and profit. The Board concluded that the profitability results were not unreasonable, given the services rendered and service levels provided by Dreyfus. The Board also noted the fee waiver and expense reimbursement arrangement and its effect on Dreyfus’ prof-itability.The Board also had been provided with information prepared by an independent consulting firm regarding Dreyfus’ approach to allocating costs to, and determining the profitability of, individual funds and the entire Dreyfus fund complex.The consulting firm also had analyzed where any economies of scale might emerge in connection with the management of a fund.
32
The Board’s counsel stated that the Board should consider the profitability analysis (1) as part of the evaluation of whether the fees under the Agreement bear a reasonable relationship to the mix of services provided by Dreyfus, including the nature, extent and quality of such services, and (2) in light of the relevant circumstances for the fund and the extent to which economies of scale would be realized if the fund grows and whether fee levels reflect these economies of scale for the benefit of fund shareholders. Dreyfus representatives also noted that, as a result of shared and allocated costs among funds in the Dreyfus fund complex, the extent of economies of scale could depend substantially on the level of assets in the complex as a whole, so that increases and decreases in complex-wide assets can affect potential economies of scale in a manner that is disproportionate to, or even in the opposite direction from, changes in the fund’s asset level.The Board also considered potential benefits to Dreyfus from acting as investment adviser and noted the soft dollar arrangements in effect for trading the fund’s investments.
At the conclusion of these discussions, the Board agreed that it had been furnished with sufficient information to make an informed business decision with respect to the renewal of the Agreement. Based on the discussions and considerations as described above, the Board concluded and determined as follows.
The Board concluded that the nature, extent and quality of the services provided by Dreyfus are adequate and appropriate.
The Board was satisfied with the fund’s performance.
The Board concluded that the fee paid to Dreyfus was reasonable in light of the considerations described above.
The Board determined that the economies of scale which may accrue to Dreyfus and its affiliates in connection with the management of the fund had been adequately considered by Dreyfus in connection with the fee rate charged to the fund pursuant to the Agreement and that, to the extent in the future it were determined that material economies of scale had not been shared with the fund, the Board would seek to have those economies of scale shared with the fund.
The Fund 33
INFORMATION ABOUT THE RENEWAL OF THE FUND’S
MANAGEMENT AGREEMENT (Unaudited) (continued)
In evaluating the Agreement, the Board considered these conclusions and determinations and also relied on its previous knowledge, gained through meetings and other interactions with Dreyfus and its affiliates, of the fund and the services provided to the fund by Dreyfus.The Board also relied on information received on a routine and regular basis throughout the year relating to the operations of the fund and the investment management and other services provided under the Agreement, including information on the investment performance of the fund in comparison to similar mutual funds and benchmark performance indices; general market outlook as applicable to the fund; and compliance reports. In addition, it should be noted that the Board’s consideration of the contractual fee arrangements for this fund had the benefit of a number of years of reviews of prior or similar agreements during which lengthy discussions took place between the Board and Dreyfus representatives. Certain aspects of the arrangements may receive greater scrutiny in some years than in others, and the Board’s conclusions may be based, in part, on their consideration of the same or similar arrangements in prior years. The Board determined that renewal of the Agreement was in the best interests of the fund and its shareholders.
34
BOARD MEMBERS INFORMATION (Unaudited)

The Fund 35
BOARD MEMBERS INFORMATION (Unaudited) (continued)
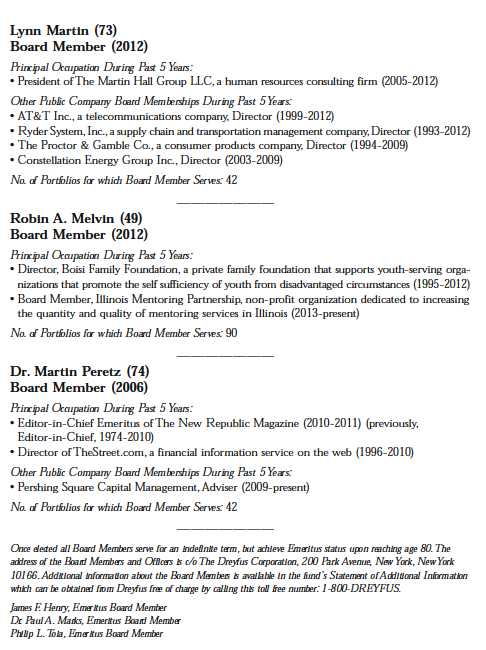
36
OFFICERS OF THE FUND (Unaudited)
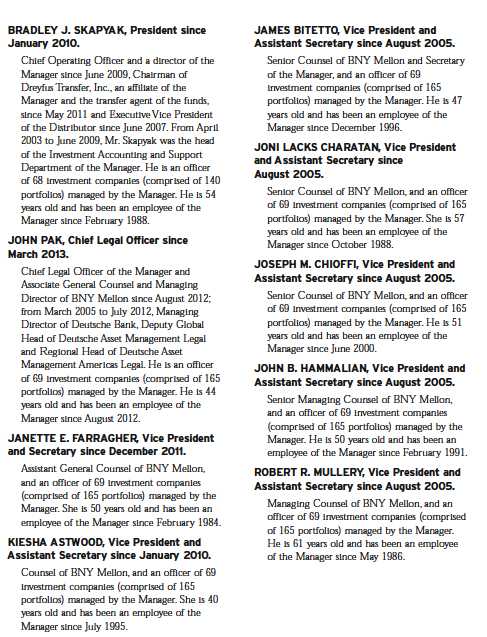
The Fund 37
OFFICERS OF THE FUND (Unaudited) (continued)

38
Save time. Save paper. View your next shareholder report online as soon as it’s available. Log into www.dreyfus.com and sign up for Dreyfus eCommunications. It’s simple and only takes a few minutes.
The views expressed in this report reflect those of the portfolio manager only through the end of the period covered and do not necessarily represent the views of Dreyfus or any other person in the Dreyfus organization. Any such views are subject to change at any time based upon market or other conditions and Dreyfus disclaims any responsibility to update such views.These views may not be relied on as investment advice and, because investment decisions for a Dreyfus fund are based on numerous factors, may not be relied on as an indication of trading intent on behalf of any Dreyfus fund.
| | Contents |
| | THE FUND |
| 2 | A Letter from the President |
| 3 | Discussion of Fund Performance |
| 6 | Fund Performance |
| 8 | Understanding Your Fund’s Expenses |
| 8 | Comparing Your Fund’s Expenses With Those of Other Funds |
| 9 | Statement of Investments |
| 14 | Statement of Assets and Liabilities |
| 15 | Statement of Operations |
| 16 | Statement of Changes in Net Assets |
| 18 | Financial Highlights |
| 22 | Notes to Financial Statements |
| 35 | Report of Independent Registered Public Accounting Firm |
| 36 | Important Tax Information |
| 37 | Information About the Renewal of the Fund’s Management Agreement |
| 42 | Board Members Information |
| 44 | Officers of the Fund |
| | FOR MORE INFORMATION |
| | Back Cover |
Dreyfus
Strategic Value Fund
The Fund
A LETTER FROM THE PRESIDENT
Dear Shareholder:
We are pleased to present this annual report for Dreyfus Strategic Value Fund, covering the 12-month period from September 1, 2012, through August 31, 2013. For information about how the fund performed during the reporting period, as well as general market perspectives, we provide a Discussion of Fund Performance on the pages that follow.
U.S. equities fared quite well over the past year, weathering periodic bouts of volatility after setting new record highs in the spring for many broad measures of stock market performance. Low interest rates, muted inflationary pressures, and a strong U.S. dollar helped fuel the market’s gains, as did a declining unemployment rate, rebounding housing markets, and increased production of domestic oil and natural gas.
In our analysis, the U.S. economy is nearing an inflection point to a somewhat faster growth rate.We expect a reduced fiscal drag in 2014 and beyond, and the stimulative monetary policy of the past five years should continue to support economic expansion, particularly in interest rate-sensitive industry groups. For information on how these developments may affect your investments, we urge you to discuss these matters with your financial advisor.
Thank you for your continued confidence and support.
Sincerely,

J. Charles Cardona
President
The Dreyfus Corporation
September 16, 2013
2
DISCUSSION OF FUND PERFORMANCE
For the period of September 1, 2012, through August 31, 2013, as provided by Brian Ferguson, Portfolio Manager
Fund and Market Performance Overview
For the 12-month period ended August 31, 2013, Dreyfus Strategic Value Fund’s Class A shares produced a total return of 28.82%, Class C shares returned 27.87% and Class I shares returned 29.18%.1 The fund’s benchmark, the Russell 1000® Value Index, produced a total return of 23.10% for the same period.2 The fund’s ClassY shares produced a total return of 1.80% for the period since its inception of July 1, 2013, through August 31, 2013.
Stocks generally rallied over the reporting period in response to improved economic data.The fund produced higher returns than its benchmark over the full reporting period, mainly due to the success of our security selection strategy in the energy, consumer discretionary, and financials sectors.
The Fund’s Investment Approach
The fund seeks capital appreciation.We identify potential investments through extensive quantitative and fundamental research.The fund will focus on individual stock selection (a “bottom-up” approach), emphasizing three key factors: value, quantitative screens track traditional measures, such as price-to-earnings, price-to-book and price-to-sales ratios, which are analyzed and compared against the market; sound business fundamentals, a company’s balance sheet and income data are examined to determine the company’s financial history; and positive business momentum, a company’s earnings and forecast changes are analyzed and sales and earnings trends are reviewed to determine the company’s financial condition or the presence of a catalyst that will trigger a price increase near- to mid-term.
The fund typically sells a stock when we believe there is a more attractive alternative, the stock’s valuation is excessive or there are deteriorating fundamentals, such as a loss of competitive advantage, a failure in management execution, or deteriorating capital structure.
The Fund 3
DISCUSSION OF FUND PERFORMANCE (continued)
Recovering Economy Fueled Equity Market’s Gains
The reporting period began near the outset of a sustained stock market rally driven primarily by improved U.S. employment and housing market trends. Moreover, investors were encouraged by the Federal Reserve Board’s (the “Fed”) launch of a new round of quantitative easing involving monthly purchases of $85 billion of U.S. government securities over an indefinite time frame. Gradually improving conditions in certain overseas markets also contributed to greater investor optimism.
U.S. economic data continued to improve, and stocks generally continued to rally through the spring of 2013. By mid-May, several broad measures of stock market performance reached new record highs. In late May, remarks by Fed Chairman Ben Bernanke were widely interpreted as a signal that U.S. monetary policymakers were likely to back away from their quantitative easing program sooner than many had expected.As a result, most financial markets encountered heightened volatility in June, erasing some of the stock market’s previous gains. Investors began to turn away from relatively conservative, dividend-paying stocks and toward smaller, more speculative stocks, particularly those of companies considered relatively sensitive to economic conditions. Equity markets generally stabilized in July andAugust when investors realized that an end to quantitative easing would not necessarily portend higher short-term interest rates, and they returned their focus to company and market fundamentals.
Stock Selections Fueled Fund Outperformance
The fund’s bottom-up investment approach proved particularly successful in the energy sector, where lower exposure to industry giants ExxonMobil and Chevron enabled the fund to avoid their relative weakness. Instead, we focused on more attractively valued companies such as refiner Valero, which gained value after spinning off its retail operations.We eliminated the fund’s position in Valero when it reached a fuller valuation, helping to avoid subsequent declines in its stock price. In the consumer discretionary sector, overweighted exposure to content creators in the media industry added value when advertising spending increased. In addition, media conglomerates Viacom and TimeWarner distributed excess cash to shareholders, boosting their stocks’ total returns.
Results from the financials sector were bolstered by lack of exposure to real estate investment trusts (“REITs”) and an emphasis on diversified financials, such as Ameriprise Financial and insurer ING US, and investment banks including Goldman Sachs Group. Credit rating agency Moody’s climbed due to increased bond issuance
4
volumes and the resolution of legal issues.The fund also benefited from underweighted exposure to the traditionally defensive utilities and telecommunications services sectors, where few companies met our valuation criteria.
Disappointments during the reporting period were concentrated mainly in the information technology sector. An anticipated increase in technology spending by corporations failed to materialize, hurting enterprise-focused companies such as software developer Oracle and data storage specialist EMC.
A Constructive Outlook for Value
While many stocks have climbed to richer valuations, we have continued to identify ample opportunities among individual stocks, particularly those of companies that tend to be more sensitive to changes in economic conditions. Consequently, as of the reporting period’s end, the fund maintained overweighted exposure in cyclical industry groups and underweighted positions in the traditionally defensive utilities and telecommunications services sectors.
September 16, 2013
Please note, the position in any security highlighted with italicized typeface was sold during the reporting period. Equity funds are subject generally to market, market sector, market liquidity, issuer and investment style risks, among other factors, to varying degrees, all of which are more fully described in the fund’s prospectus.
The fund’s performance will be influenced by political, social and economic factors affecting investments in foreign companies. Special risks associated with investments in foreign companies include exposure to currency fluctuations, less liquidity, less developed or less efficient trading markets, lack of comprehensive company information, political instability and differing auditing and legal standards.These risks are enhanced in emerging market countries. Please read the prospectus for further discussion of these risks.
|
| 1 Total return includes reinvestment of dividends and any capital gains paid and does not take into consideration the |
| maximum initial sales charge in the case of Class A shares, or the applicable contingent deferred sales charges imposed |
| on redemptions in the case of Class C shares. Had these charges been reflected, returns would have been lower. Past |
| performance is no guarantee of future results. Share price and investment return fluctuate such that upon redemption |
| fund shares may be worth more or less than their original cost.The fund’s returns reflect the absorption of certain fund |
| expenses by The Dreyfus Corporation pursuant to an agreement in effect through July 1, 2014, at which time it may |
| be extended, terminated or modified. Had these expenses not been absorbed, the fund’s returns would have been lower. |
| 2 SOURCE: LIPPER INC. — Reflects the reinvestment of dividends and, where applicable, capital gain |
| distributions. The Russell 1000® Value Index is an unmanaged index which measures the performance of those |
| Russell 1000 companies with lower price-to-book ratios and lower forecasted growth values. Investors cannot invest |
| directly in any index. |
The Fund 5
FUND PERFORMANCE
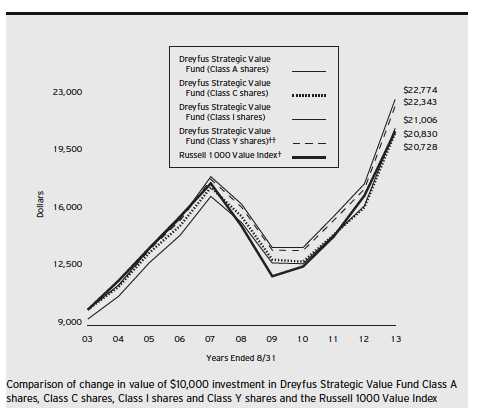
| |
| † | Source: Lipper Inc. |
| †† | The total return figures presented for ClassY shares of the fund reflect the performance of the fund’s Class A shares |
| | for the period prior to 7/1/13 (the inception date for ClassY shares). |
Past performance is not predictive of future performance.
The above graph compares a $10,000 investment made in each of the Class A, Class C, Class I and ClassY shares of Dreyfus Strategic Value Fund on 8/31/03 to a $10,000 investment made in the Russell 1000 Value Index (the “Index”) on that date.All dividends and capital gain distributions are reinvested.
On June 18, 2013, the Board authorized the fund to offer ClassY shares, as a new class of shares, to certain investors, including certain institutional investors. On July 1, 2013, ClassY shares were offered at net asset value and are not subject to certain fees, including Distribution Plan and Shareholder Services Plan fees.
The fund’s performance shown in the line graph above takes into account the maximum initial sales charge on Class A shares and all other applicable fees and expenses on all classes.The Index uses company price-to-book ratios and long-term growth rates to calculate a composite ranking, which is used to determine if a stock is “growth” or “value.” Unlike a mutual fund, the Index is not subject to charges, fees and other expenses. Investors cannot invest directly in any index. Further information relating to fund performance, including expense reimbursements, if applicable, is contained in the Financial Highlights section of the prospectus and elsewhere in this report.
6
Average Annual Total Returns as of 8/31/13
| | | | | | | |
|
| | Inception Date | 1 Year | | 5 Years | | 10 Years | |
| Class A shares | | | | | | | |
| with maximum sales charge (5.75%) | 9/29/95 | 21.39 | % | 5.30 | % | 7.71 | % |
| without sales charge | 9/29/95 | 28.82 | % | 6.55 | % | 8.35 | % |
| Class C shares | | | | | | | |
| with applicable redemption charge † | 5/31/01 | 26.87 | % | 5.76 | % | 7.56 | % |
| without redemption | 5/31/01 | 27.87 | % | 5.76 | % | 7.56 | % |
| Class I shares | 5/31/01 | 29.18 | % | 6.78 | % | 8.58 | % |
| Class Y shares | 7/1/13 | 29.13 | %†† | 6.60 | %†† | 8.37 | %†† |
| Russell 1000 Value Index | | 23.10 | % | 6.69 | % | 7.61 | % |
Past performance is not predictive of future performance.The fund’s performance shown in the graph and table does not reflect the deduction of taxes that a shareholder would pay on fund distributions or the redemption of fund shares.
| |
| † | The maximum contingent deferred sales charge for Class C shares is 1% for shares redeemed within one year of the |
| | date of purchase. |
| †† | The total return performance figures presented for ClassY shares of the fund reflect the performance of the fund’s |
| | Class A shares for the period prior to 7/1/13 (the inception date for ClassY shares). |
The Fund 7
UNDERSTANDING YOUR FUND’S EXPENSES (Unaudited)
As a mutual fund investor, you pay ongoing expenses, such as management fees and other expenses. Using the information below, you can estimate how these expenses affect your investment and compare them with the expenses of other funds.You also may pay one-time transaction expenses, including sales charges (loads) and redemption fees, which are not shown in this section and would have resulted in higher total expenses. For more information, see your fund’s prospectus or talk to your financial adviser.
Review your fund’s expenses
The table below shows the expenses you would have paid on a $1,000 investment in Dreyfus Strategic Value Fund from March 1, 2013 to August 31, 2013. It also shows how much a $1,000 investment would be worth at the close of the period, assuming actual returns and expenses.
Expenses and Value of a $1,000 Investment
assuming actual returns for the six months ended August 31, 2013†
| | | | | | | | |
| | | Class A | | Class C | | Class I | | Class Y |
| Expenses paid per $1,000†† | $ | 5.22 | $ | 9.20 | $ | 3.89 | $ | 1.23 |
| Ending value (after expenses) | $ | 1,113.20 | $ | 1,109.20 | $ | 1,114.90 | $ | 1,018.00 |
COMPARING YOUR FUND’S EXPENSES
WITH THOSE OF OTHER FUNDS (Unaudited)
Using the SEC’s method to compare expenses
The Securities and Exchange Commission (SEC) has established guidelines to help
investors assess fund expenses. Per these guidelines, the table below shows your fund’s
expenses based on a $1,000 investment, assuming a hypothetical 5% annualized return.
You can use this information to compare the ongoing expenses (but not transaction
expenses or total cost) of investing in the fund with those of other funds.All mutual fund
shareholder reports will provide this information to help you make this comparison.
Please note that you cannot use this information to estimate your actual ending account
balance and expenses paid during the period.
Expenses and Value of a $1,000 Investment
assuming a hypothetical 5% annualized return for the six months ended August 31, 2013
| | | | | | | | |
| | | Class A | | Class C | | Class I | | Class Y |
| Expenses paid per $1,000†††† | $ | 4.99 | $ | 8.79 | $ | 3.72 | $ | 3.72 |
| Ending value (after expenses) | $ | 1,020.27 | $ | 1,016.48 | $ | 1,021.53 | $ | 1,021.53 |
| |
| † | From July 1, 2013 (commencement of initial offering) to August 31, 2013 for ClassY shares. |
| †† | Expenses are equal to the fund’s annualized expense ratio of .98% for Class A, 1.73% for Class C and .73% |
| | for Class I, multiplied by the average account value over the period, multiplied by 184/365 (to reflect the one-half |
| | year period). Expenses are equal to the fund’s annualized expense ratio of .73% for ClassY, multiplied by the |
| | average account value over the period, multiplied by 61/365 (to reflect the actual days in the period). |
| ††† | Please note that while ClassY shares commenced operations on July 1, 2013, the hypothetical expenses paid during |
| | the period reflect projected activity for the full six month period for purposes of comparability.This projection assumes |
| | that annualized expense ratios were in effect during the period March 1, 2013 to August 31, 2013. |
| †††† Expenses are equal to the fund’s annualized expense ratio of .98% for Class A, 1.73% for Class C, .73% for |
| | Class I and .73% for ClassY, multiplied by the average account value over the period, multiplied by 184/365 (to |
| | reflect the one-half year period). |
8
STATEMENT OF INVESTMENTS
August 31, 2013
| | | |
| Common Stocks—99.5% | Shares | | Value ($) |
| Automobiles & Components—2.4% | | | |
| Delphi Automotive | 133,960 | | 7,370,479 |
| General Motors | 335,330 | a | 11,428,046 |
| Johnson Controls | 399,320 | | 16,184,440 |
| | | | 34,982,965 |
| Banks—5.3% | | | |
| Comerica | 421,600 | | 17,218,144 |
| Fifth Third Bancorp | 552,715 | | 10,109,157 |
| PNC Financial Services Group | 238,450 | | 17,232,782 |
| Wells Fargo & Co. | 776,490 | | 31,898,209 |
| | | | 76,458,292 |
| Capital Goods—6.4% | | | |
| Cummins | 161,950 | | 19,952,240 |
| Eaton | 294,970 | | 18,677,500 |
| General Electric | 1,432,200 | | 33,141,108 |
| Honeywell International | 247,560 | | 19,698,349 |
| | | | 91,469,197 |
| Commercial & Professional Services—.5% | | | |
| Pitney Bowes | 411,680 | | 6,718,618 |
| Consumer Durables & Apparel—1.0% | | | |
| Newell Rubbermaid | 141,480 | | 3,579,444 |
| PVH | 87,100 | | 11,214,125 |
| | | | 14,793,569 |
| Consumer Services—1.0% | | | |
| Carnival | 400,270 | | 14,445,744 |
| Diversified Financials—15.4% | | | |
| Ameriprise Financial | 230,710 | | 19,875,666 |
| Bank of America | 2,419,010 | | 34,156,421 |
| Capital One Financial | 121,200 | | 7,823,460 |
| Citigroup | 772,010 | | 37,311,243 |
| Discover Financial Services | 143,480 | | 6,779,430 |
| Goldman Sachs Group | 138,450 | | 21,062,399 |
| ING US | 490,080 | | 14,114,304 |
| Invesco | 229,620 | | 6,971,263 |
| JPMorgan Chase & Co. | 892,250 | | 45,085,393 |
The Fund 9
STATEMENT OF INVESTMENTS (continued)
| | | |
| Common Stocks (continued) | Shares | | Value ($) |
| Diversified Financials (continued) | | | |
| Morgan Stanley | 409,640 | | 10,552,326 |
| TD Ameritrade Holding | 653,940 | | 16,786,640 |
| | | | 220,518,545 |
| Energy—12.4% | | | |
| Anadarko Petroleum | 195,650 | | 17,886,323 |
| Apache | 174,590 | | 14,958,871 |
| Cameron International | 258,560 | a | 14,683,622 |
| Chevron | 364,260 | | 43,867,832 |
| EOG Resources | 46,610 | | 7,320,101 |
| Occidental Petroleum | 740,630 | | 65,330,972 |
| Phillips 66 | 247,230 | | 14,116,833 |
| | | | 178,164,554 |
| Exchange-Traded Funds—.5% | | | |
| iShares Russell 1000 Value Index Fund | 84,190 | | 7,111,529 |
| Food & Staples Retailing—1.3% | | | |
| CVS Caremark | 319,700 | | 18,558,585 |
| Food, Beverage & Tobacco—3.5% | | | |
| Archer-Daniels-Midland | 198,360 | | 6,984,256 |
| Coca-Cola Enterprises | 364,530 | | 13,633,422 |
| ConAgra Foods | 595,380 | | 20,135,752 |
| PepsiCo | 120,790 | | 9,630,587 |
| | | | 50,384,017 |
| Health Care Equipment & | | | |
| Services—4.4% | | | |
| Aetna | 166,030 | | 10,524,642 |
| Baxter International | 185,050 | | 12,872,078 |
| Cigna | 265,620 | | 20,901,638 |
| McKesson | 153,800 | | 18,672,858 |
| | | | 62,971,216 |
| Household & Personal Products—.4% | | | |
| Avon Products | 319,700 | | 6,320,469 |
10
| | | |
| Common Stocks (continued) | Shares | | Value ($) |
| Insurance—6.6% | | | |
| American International Group | 409,230 | | 19,012,826 |
| Berkshire Hathaway, Cl. B | 126,220 | a | 14,038,188 |
| Chubb | 173,500 | | 14,429,995 |
| Hartford Financial Services Group | 462,910 | | 13,702,136 |
| MetLife | 437,629 | | 20,214,081 |
| Prudential Financial | 177,720 | | 13,307,674 |
| | | | 94,704,900 |
| Materials—2.6% | | | |
| International Paper | 388,720 | | 18,351,471 |
| LyondellBasell Industries, Cl. A | 274,050 | | 19,224,607 |
| | | | 37,576,078 |
| Media—7.0% | | | |
| News Corp., Cl. A | 229,090 | a | 3,596,713 |
| Omnicom Group | 112,220 | | 6,806,143 |
| Time Warner | 395,426 | | 23,935,136 |
| Twenty-First Century Fox | 324,448 | | 10,164,956 |
| Viacom, Cl. B | 350,680 | | 27,900,101 |
| Walt Disney | 455,300 | | 27,695,899 |
| | | | 100,098,948 |
| Pharmaceuticals, Biotech & | | | |
| Life Sciences—8.5% | | | |
| Amgen | 66,990 | | 7,297,891 |
| Eli Lilly & Co. | 231,520 | | 11,900,128 |
| Johnson & Johnson | 356,027 | | 30,764,293 |
| Merck & Co. | 303,800 | | 14,366,702 |
| Pfizer | 2,052,980 | | 57,914,566 |
| | | | 122,243,580 |
| Retailing—2.2% | | | |
| Best Buy | 425,140 | | 15,305,040 |
| Kohl’s | 303,730 | | 15,584,386 |
| | | | 30,889,426 |
The Fund 11
STATEMENT OF INVESTMENTS (continued)
| | | |
| Common Stocks (continued) | Shares | | Value ($) |
| Semiconductors & Semiconductor | | | |
| Equipment—4.7% | | | |
| Applied Materials | 908,960 | | 13,643,490 |
| Micron Technology | 590,760 | a | 8,016,613 |
| Texas Instruments | 838,310 | | 32,023,442 |
| Xilinx | 324,590 | | 14,093,698 |
| | | | 67,777,243 |
| Software & Services—1.0% | | | |
| Google, Cl. A | 7,740 | a | 6,555,006 |
| Oracle | 228,670 | | 7,285,426 |
| | | | 13,840,432 |
| Technology Hardware & | | | |
| Equipment—7.9% | | | |
| Apple | 37,770 | | 18,395,879 |
| Cisco Systems | 2,098,230 | | 48,909,741 |
| Corning | 500,400 | | 7,025,616 |
| EMC | 683,690 | | 17,625,528 |
| QUALCOMM | 214,940 | | 14,246,223 |
| SanDisk | 127,170 | | 7,017,241 |
| | | | 113,220,228 |
| Transportation—2.0% | | | |
| Delta Air Lines | 424,590 | | 8,377,161 |
| FedEx | 186,010 | | 19,970,034 |
| | | | 28,347,195 |
| Utilities—2.5% | | | |
| NextEra Energy | 175,540 | | 14,106,394 |
| NRG Energy | 826,060 | | 21,684,075 |
| | | | 35,790,469 |
| Total Common Stocks | | | |
| (cost $1,184,004,690) | | | 1,427,385,799 |
12
| | | |
| Other Investment—.4% | Shares | | Value ($) |
| Registered Investment Company; | | | |
| Dreyfus Institutional Preferred | | | |
| Plus Money Market Fund | | | |
| (cost $4,895,169) | 4,895,169 | b | 4,895,169 |
| |
| Total Investments (cost $1,188,899,859) | 99.9 | % | 1,432,280,968 |
| Cash and Receivables (Net) | .1 | % | 1,845,550 |
| Net Assets | 100.0 | % | 1,434,126,518 |
| |
| a | Non-income producing security. |
| b | Investment in affiliated money market mutual fund. |
| | | |
| Portfolio Summary (Unaudited)† | | |
| |
| | Value (%) | | Value (%) |
| Diversified Financials | 15.4 | Utilities | 2.5 |
| Energy | 12.4 | Automobiles & Components | 2.4 |
| Pharmaceuticals, | | Retailing | 2.2 |
| Biotech & Life Sciences | 8.5 | Transportation | 2.0 |
| Technology Hardware & Equipment | 7.9 | Food & Staples Retailing | 1.3 |
| Media | 7.0 | Consumer Durables & Apparel | 1.0 |
| Insurance | 6.6 | Consumer Services | 1.0 |
| Capital Goods | 6.4 | Software & Services | 1.0 |
| Banks | 5.3 | Commercial & Professional Services | .5 |
| Semiconductors & | | Exchange-Traded Funds | .5 |
| Semiconductor Equipment | 4.7 | Household & Personal Products | .4 |
| Health Care Equipment & Services | 4.4 | Money Market Investment | .4 |
| Food, Beverage & Tobacco | 3.5 | | |
| Materials | 2.6 | | 99.9 |
|
| † Based on net assets. |
| See notes to financial statements. |
The Fund 13
STATEMENT OF ASSETS AND LIABILITIES
August 31, 2013
| | | | |
| | | | Cost | Value |
| Assets ($): | | | | |
| Investments in securities—See Statement of Investments: | | |
| Unaffiliated issuers | | | 1,184,004,690 | 1,427,385,799 |
| Affiliated issuers | | | 4,895,169 | 4,895,169 |
| Cash | | | | 999,117 |
| Dividends receivable | | | | 2,859,098 |
| Receivable for shares of Common Stock subscribed | | | 884,564 |
| Prepaid expenses | | | | 67,600 |
| | | | 1,437,091,347 |
| Liabilities ($): | | | | |
| Due to The Dreyfus Corporation and affiliates—Note 3(c) | | 1,103,678 |
| Payable for shares of Common Stock redeemed | | | 1,409,435 |
| Accrued expenses | | | | 451,716 |
| | | | | 2,964,829 |
| Net Assets ($) | | | 1,434,126,518 |
| Composition of Net Assets ($): | | | | |
| Paid-in capital | | | 1,163,270,440 |
| Accumulated undistributed investment income—net | | 7,930,960 |
| Accumulated net realized gain (loss) on investments | 19,544,009 |
| Accumulated net unrealized appreciation | | | |
| (depreciation) on investments | | 243,381,109 |
| Net Assets ($) | | | 1,434,126,518 |
| |
| |
| Net Asset Value Per Share | | | |
| | Class A | Class C | Class I | Class Y |
| Net Assets ($) | 1,065,660,440 | 50,664,627 | 317,800,433 | 1,018 |
| Shares Outstanding | 28,592,481 | 1,425,712 | 8,507,026 | 27.25 |
| Net Asset Value Per Share ($) | 37.27 | 35.54 | 37.36 | 37.36 |
See notes to financial statements.
14
STATEMENT OF OPERATIONS
Year Ended August 31, 2013
| | |
| Investment Income ($): | | |
| Income: | | |
| Cash dividends (net of $125,405 foreign taxes withheld at source): | | |
| Unaffiliated issuers | 26,088,986 | |
| Affiliated issuers | 3,662 | |
| Income from securities lending—Note 1(b) | 32,558 | |
| Interest | 9,346 | |
| Total Income | 26,134,552 | |
| Expenses: | | |
| Management fee—Note 3(a) | 9,013,668 | |
| Shareholder servicing costs—Note 3(c) | 3,788,972 | |
| Distribution fees—Note 3(b) | 379,795 | |
| Prospectus and shareholders’ reports | 121,797 | |
| Directors’ fees and expenses—Note 3(d) | 108,862 | |
| Professional fees | 98,356 | |
| Custodian fees—Note 3(c) | 86,374 | |
| Registration fees | 84,526 | |
| Loan commitment fees—Note 2 | 9,115 | |
| Interest expense—Note 2 | 5,221 | |
| Miscellaneous | 36,120 | |
| Total Expenses | 13,732,806 | |
| Less—reduction in expenses due to undertaking—Note 3(a) | (2,057,229 | ) |
| Less—reduction in fees due to earnings credits—Note 3(c) | (2,054 | ) |
| Net Expenses | 11,673,523 | |
| Investment Income—Net | 14,461,029 | |
| Realized and Unrealized Gain (Loss) on Investments—Note 4 ($): | | |
| Net realized gain (loss) on investments | 78,530,802 | |
| Net realized gain (loss) on financial futures | (126,203 | ) |
| Net Realized Gain (Loss) | 78,404,599 | |
| Net unrealized appreciation (depreciation) on investments | 200,376,811 | |
| Net Realized and Unrealized Gain (Loss) on Investments | 278,781,410 | |
| Net Increase in Net Assets Resulting from Operations | 293,242,439 | |
See notes to financial statements.
The Fund 15
STATEMENT OF CHANGES IN NET ASSETS
| | | | |
| | Year Ended August 31, | |
| | 2013 | a | 2012 | b |
| Operations ($): | | | | |
| Investment income—net | 14,461,029 | | 10,880,133 | |
| Net realized gain (loss) on investments | 78,404,599 | | 50,702,015 | |
| Net unrealized appreciation | | | | |
| (depreciation) on investments | 200,376,811 | | 67,676,661 | |
| Net Increase (Decrease) in Net Assets | | | | |
| Resulting from Operations | 293,242,439 | | 129,258,809 | |
| Dividends to Shareholders from ($): | | | | |
| Investment income—net: | | | | |
| Class A | (10,377,450 | ) | (6,241,886 | ) |
| Class C | (241,268 | ) | — | |
| Class I | (2,683,044 | ) | (1,577,119 | ) |
| Total Dividends | (13,301,762 | ) | (7,819,005 | ) |
| Capital Stock Transactions ($): | | | | |
| Net proceeds from shares sold: | | | | |
| Class A | 177,137,848 | | 128,488,839 | |
| Class B | — | | 1,565 | |
| Class C | 5,439,278 | | 3,786,516 | |
| Class I | 180,872,886 | | 62,326,740 | |
| Class Y | 1,000 | | — | |
| Net assets received in connection | | | | |
| with reorganizations—Note 1 | — | | 353,949,950 | |
| Dividends reinvested: | | | | |
| Class A | 9,589,161 | | 5,700,603 | |
| Class C | 186,217 | | — | |
| Class I | 2,105,267 | | 1,049,597 | |
| Cost of shares redeemed: | | | | |
| Class A | (220,294,063 | ) | (233,145,452 | ) |
| Class B | — | | (2,713,308 | ) |
| Class C | (15,076,115 | ) | (18,582,801 | ) |
| Class I | (89,202,928 | ) | (94,829,486 | ) |
| Increase (Decrease) in Net Assets | | | | |
| from Capital Stock Transactions | 50,758,551 | | 206,032,763 | |
| Total Increase (Decrease) in Net Assets | 330,699,228 | | 327,472,567 | |
| Net Assets ($): | | | | |
| Beginning of Period | 1,103,427,290 | | 775,954,723 | |
| End of Period | 1,434,126,518 | | 1,103,427,290 | |
| Undistributed investment income—net | 7,930,960 | | 6,771,693 | |
16
| | | | |
| | Year Ended August 31, | |
| | 2013 | a | 2012 | b |
| Capital Share Transactions: | | | | |
| Class Ac,d | | | | |
| Shares sold | 5,047,494 | | 4,714,718 | |
| Shares issued in connection | | | | |
| with reorganizations—Note 1 | — | | 10,646,596 | |
| Shares issued for dividends reinvested | 306,755 | | 224,162 | |
| Shares redeemed | (6,673,520 | ) | (8,492,414 | ) |
| Net Increase (Decrease) in Shares Outstanding | (1,319,271 | ) | 7,093,062 | |
| Class Bc | | | | |
| Shares sold | — | | 67 | |
| Shares issued in connection | | | | |
| with reorganizations—Note 1 | — | | 13,936 | |
| Shares redeemed | — | | (102,676 | ) |
| Net Increase (Decrease) in Shares Outstanding | — | | (88,673 | ) |
| Class Cd | | | | |
| Shares sold | 164,904 | | 144,504 | |
| Shares issued in connection | | | | |
| with reorganizations—Note 1 | — | | 250,370 | |
| Shares issued for dividends reinvested | 6,215 | | — | |
| Shares redeemed | (457,883 | ) | (709,697 | ) |
| Net Increase (Decrease) in Shares Outstanding | (286,764 | ) | (314,823 | ) |
| Class I | | | | |
| Shares sold | 4,943,265 | | 2,268,678 | |
| Shares issued in connection | | | | |
| with reorganizations—Note 1 | — | | 2,618,126 | |
| Shares issued for dividends reinvested | 67,304 | | 41,258 | |
| Shares redeemed | (2,634,888 | ) | (3,495,457 | ) |
| Net Increase (Decrease) in Shares Outstanding | 2,375,681 | | 1,432,605 | |
| Class Y | | | | |
| Shares sold | 27.25 | | — | |
|
| a Effective July 1, 2013, the fund commenced offering ClassY shares. |
| b Effective as of the close of business on March 13, 2012, the fund no longer offers Class B shares. |
| c During the period ended August 31, 2012, 54,767 Class B shares representing $1,434,811, were automatically |
| converted to 52,280 Class A shares. |
| d During the period ended August 31, 2013, 141,569 Class C shares representing $5,004,454 were exchanged for |
| 135,292 Class A shares. |
The Fund 17
FINANCIAL HIGHLIGHTS
The following tables describe the performance for each share class for the fiscal periods indicated.All information (except portfolio turnover rate) reflects financial results for a single fund share.Total return shows how much your investment in the fund would have increased (or decreased) during each period, assuming you had reinvested all dividends and distributions.These figures have been derived from the fund’s financial statements.
| | | | | | | | | | |
| | | | Year Ended August 31, | | | |
| Class A Shares | 2013 | | 2012 | | 2011 | | 2010 | | 2009 | |
| Per Share Data ($): | | | | | | | | | | |
| Net asset value, beginning of period | 29.28 | | 26.27 | | 23.30 | | 23.50 | | 28.42 | |
| Investment Operations: | | | | | | | | | | |
| Investment income—neta | .40 | | .30 | | .21 | | .14 | | .22 | |
| Net realized and unrealized | | | | | | | | | | |
| gain (loss) on investments | 7.97 | | 2.91 | | 2.95 | | (.20 | ) | (4.88 | ) |
| Total from Investment Operations | 8.37 | | 3.21 | | 3.16 | | (.06 | ) | (4.66 | ) |
| Distributions: | | | | | | | | | | |
| Dividends from investment income—net | (.38 | ) | (.20 | ) | (.19 | ) | (.14 | ) | (.26 | ) |
| Net asset value, end of period | 37.27 | | 29.28 | | 26.27 | | 23.30 | | 23.50 | |
| Total Return (%)b | 28.82 | | 12.31 | | 13.52 | | (.29 | ) | (16.14 | ) |
| Ratios/Supplemental Data (%): | | | | | | | | | | |
| Ratio of total expenses | | | | | | | | | | |
| to average net assets | 1.14 | | 1.20 | | 1.20 | | 1.22 | | 1.27 | |
| Ratio of net expenses | | | | | | | | | | |
| to average net assets | .98 | | .98 | | .98 | | 1.05 | | 1.26 | |
| Ratio of net investment income | | | | | | | | | | |
| to average net assets | 1.19 | | 1.07 | | .74 | | .56 | | 1.09 | |
| Portfolio Turnover Rate | 76.28 | | 95.38 | | 88.37 | | 91.83 | | 119.48 | |
| Net Assets, end of period ($ x 1,000) | 1,065,660 | | 875,703 | | 599,377 | | 541,877 | | 505,409 | |
| |
| a | Based on average shares outstanding at each month end. |
| b | Exclusive of sales charge. |
See notes to financial statements.
18
| | | | | | | | | |
| | | | Year Ended August 31, | | | |
| Class C Shares | 2013 | | 2012 | 2011 | | 2010 | | 2009 | |
| Per Share Data ($): | | | | | | | | | |
| Net asset value, beginning of period | 27.93 | | 25.05 | 22.24 | | 22.45 | | 27.17 | |
| Investment Operations: | | | | | | | | | |
| Investment income (loss)—neta | .14 | | .08 | (.00) | b | (.05 | ) | .07 | |
| Net realized and unrealized | | | | | | | | | |
| gain (loss) on investments | 7.62 | | 2.80 | 2.81 | | (.16 | ) | (4.67 | ) |
| Total from Investment Operations | 7.76 | | 2.88 | 2.81 | | (.21 | ) | (4.60 | ) |
| Distributions: | | | | | | | | | |
| Dividends from investment income—net | (.15 | ) | — | (.00) | b | — | | (.12 | ) |
| Net asset value, end of period | 35.54 | | 27.93 | 25.05 | | 22.24 | | 22.45 | |
| Total Return (%)c | 27.87 | | 11.50 | 12.64 | | (.94 | ) | (16.83 | ) |
| Ratios/Supplemental Data (%): | | | | | | | | | |
| Ratio of total expenses | | | | | | | | | |
| to average net assets | 1.91 | | 1.97 | 1.93 | | 1.95 | | 2.04 | |
| Ratio of net expenses | | | | | | | | | |
| to average net assets | 1.73 | | 1.73 | 1.73 | | 1.80 | | 2.03 | |
| Ratio of net investment income | | | | | | | | | |
| (loss) to average net assets | .45 | | .32 | (.01 | ) | (.19 | ) | .34 | |
| Portfolio Turnover Rate | 76.28 | | 95.38 | 88.37 | | 91.83 | | 119.48 | |
| Net Assets, end of period ($ x 1,000) | 50,665 | | 47,824 | 50,792 | | 46,986 | | 43,593 | |
| |
| a | Based on average shares outstanding at each month end. |
| b | Amount represents less than $.01 per share. |
| c | Exclusive of sales charge. |
See notes to financial statements.
The Fund 19
FINANCIAL HIGHLIGHTS (continued)
| | | | | | | | | | |
| | | | Year Ended August 31, | | | |
| Class I Shares | 2013 | | 2012 | | 2011 | | 2010 | | 2009 | |
| Per Share Data ($): | | | | | | | | | | |
| Net asset value, beginning of period | 29.34 | | 26.30 | | 23.31 | | 23.48 | | 28.45 | |
| Investment Operations: | | | | | | | | | | |
| Investment income—neta | .48 | | .37 | | .28 | | .21 | | .25 | |
| Net realized and unrealized | | | | | | | | | | |
| gain (loss) on investments | 7.99 | | 2.90 | | 2.94 | | (.21 | ) | (4.91 | ) |
| Total from Investment Operations | 8.47 | | 3.27 | | 3.22 | | — | | (4.66 | ) |
| Distributions: | | | | | | | | | | |
| Dividends from investment income—net | (.45 | ) | (.23 | ) | (.23 | ) | (.17 | ) | (.31 | ) |
| Net asset value, end of period | 37.36 | | 29.34 | | 26.30 | | 23.31 | | 23.48 | |
| Total Return (%) | 29.18 | | 12.57 | | 13.83 | | (.07 | ) | (16.06 | ) |
| Ratios/Supplemental Data (%): | | | | | | | | | | |
| Ratio of total expenses | | | | | | | | | | |
| to average net assets | .95 | | .97 | | 1.10 | | 1.12 | | 1.12 | |
| Ratio of net expenses | | | | | | | | | | |
| to average net assets | .73 | | .73 | | .73 | | .82 | | 1.11 | |
| Ratio of net investment income | | | | | | | | | | |
| to average net assets | 1.45 | | 1.33 | | .98 | | .81 | | 1.25 | |
| Portfolio Turnover Rate | 76.28 | | 95.38 | | 88.37 | | 91.83 | | 119.48 | |
| Net Assets, end of period ($ x 1,000) | 317,800 | | 179,900 | | 123,565 | | 68,071 | | 35,976 | |
|
| a Based on average shares outstanding at each month end. |
| See notes to financial statements. |
20
| |
| | Period Ended |
| Class Y Shares | August 31, 2013 a |
| Per Share Data ($): | |
| Net asset value, beginning of period | 36.70 |
| Investment Operations: | |
| Investment income—netb | .08 |
| Net realized and unrealized | |
| gain (loss) on investments | .58 |
| Total from Investment Operations | .66 |
| Net asset value, end of period | 37.36 |
| Total Return (%)c | 1.80 |
| Ratios/Supplemental Data (%): | |
| Ratio of total expenses to average net assetsd | .83 |
| Ratio of net expenses to average net assetsd | .73 |
| Ratio of net investment income | |
| to average net assetsd | 1.21 |
| Portfolio Turnover Rate | 76.28 |
| Net Assets, end of period ($ x 1,000) | 1 |
| |
| a | From July 1, 2013 (commencement of initial offering) to August 31, 2013. |
| b | Based on average shares outstanding. |
| c | Not annualized. |
| d | Annualized. |
See notes to financial statements.
The Fund 21
NOTES TO FINANCIAL STATEMENTS
NOTE 1—Significant Accounting Policies:
Dreyfus Strategic Value Fund (the “fund”) is a separate diversified series of Advantage Funds, Inc. (the “Company”), which is registered under the Investment Company Act of 1940, as amended (the “Act”), as an open-end management investment company and operates as a series company currently offering twelve series, including the fund. The fund’s investment objective is to seek capital appreciation. The Dreyfus Corporation (the “Manager” or “Dreyfus”), a wholly-owned subsidiary of The Bank of New York Mellon Corporation (“BNY Mellon”), serves as the fund’s investment adviser.
As of the close of business on November 16, 2011, pursuant to an Agreement and Plan of Reorganization previously approved by the Company’s Board of Directors (the “Board”), all of the assets, subject to the liabilities, of The Dreyfus/Laurel Funds Trust–Dreyfus Core Value Fund (“Core Value”) were transferred to the fund in exchange for corresponding classes of shares of Common Stock of the fund of equal value.The purpose of the transaction was to combine two funds with comparable investment objectives and strategies. Shareholders of Class A, Class B, Class C and Class I shares of CoreValue received Class A, Class B, Class C and Class I shares of the fund, respectively, in each case in an amount equal to the aggregate net asset value of their investment in Core Value at the time of the exchange. Shareholders of Institutional shares of Core Value received Class I shares of the fund. The exchange ratio for each class was as follows: Class A–.85 to 1, Class B–.88 to 1, Class C–.88 to 1, Class I–.85 to 1 and Institutional shares–.85 to 1.The net asset value of the fund’s shares on the close of business on November 16, 2011, after the reorganization, was $26.32 for Class A, $25.04 for Class B, $25.06 for Class C and $26.36 for Class I shares, and a total of 10,622,681 Class A shares, 13,936 Class B shares, 248,377 Class C shares and 894,770 Class I shares were issued to shareholders of Core Value in the exchange. The exchange was a tax-free event to the shareholders of Core Value.
As of the close of business on November 21, 2011, pursuant to an Agreement and Plan of Reorganization previously approved by the
22
Board, all of the assets, subject to the liabilities, of Dreyfus Premier Investment Funds–Dreyfus Large CapValue Fund (“Large CapValue”) were transferred to the fund in exchange for corresponding classes of shares of Common Stock of the fund of equal value.The purpose of the transaction was to combine two funds with comparable investment objectives and strategies. Shareholders of Class A, Class C and Class I shares of Large Cap Value received Class A, Class C and Class I shares of the fund, respectively, in each case in an amount equal to the aggregate net asset value of their investment in Large CapValue at the time of the exchange.The exchange ratio for each class was as follows: Class A–.29 to 1, Class C–.30 to 1 and Class I–.29 to 1.The net asset value of the fund’s shares on the close of business on November 21, 2011, after the reorganization, was $25.26 for Class A, $24.05 for Class C and $25.30 for Class I shares, and a total of 23,915 Class A shares, 1,993 Class C shares and 1,723,356 Class I shares were issued to shareholders of Large CapValue in the exchange.The exchange was a tax-free event to the shareholders of Large Cap Value.
At a meeting held on June 18, 2013, the Board approved, effective July 1, 2013: (a) for the fund to offer Class Y shares; and, (b) an increase in the authorized shares of the fund from 600 million to 700 million and authorized 100 million Class Y shares.
MBSC Securities Corporation (the “Distributor”), a wholly-owned subsidiary of the Manager, is the distributor of the fund’s shares.The fund is authorized to issue 700 million shares of $.001 par value Common Stock.The fund currently offers four classes of shares: Class A (300 million shares authorized), Class C (100 million shares authorized), Class I (200 million shares authorized) and ClassY (100 million shares authorized). Class A shares generally are subject to a sales charge imposed at the time of purchase. Class C shares are subject to a contingent deferred sales charge (“CDSC”) imposed on Class C shares redeemed within one year of purchase. Class I shares are sold at net asset value per share only to institutional investors. Class Y shares are sold at net asset value per share to certain investors, including cer-
The Fund 23
NOTES TO FINANCIAL STATEMENTS (continued)
tain institutional investors. Other differences between the classes include the services offered to and the expenses borne by each class, the allocation of certain transfer agency costs and certain voting rights. Income, expenses (other than expenses attributable to a specific class), and realized and unrealized gains or losses on investments are allocated to each class of shares based on its relative net assets.
The sales charge may be reduced or waived for certain purchases of Class A shares. Effective April 1, 2013, pursuant to new/modified front-end sales charge waivers, Class A shares of the fund may be purchased at net asset value without payment of a sales charge by (a) investors who participate in a self-directed investment brokerage account program offered by financial intermediaries that have entered into an agreement with the fund’s Distributor (financial intermediaries offering self-directed investment brokerage accounts may or may not charge their customers a transaction fee) and (b) investors who purchase Class A shares directly through the fund’s Distributor, and either (i) have, or whose spouse or minor children have, beneficially owned shares and continuously maintained an open account with the Distributor in a Dreyfus-managed fund since on or before February 28, 2006, or (ii) such purchase is for a self-directed investment account that may or may not be subject to a transaction fee.
As of August 31, 2013, MBC Investments Corp., an indirect subsidiary of BNY Mellon, held all of the outstanding ClassY shares of the fund.
The Company accounts separately for the assets, liabilities and operations of each series. Expenses directly attributable to each series are charged to that series’ operations; expenses which are applicable to all series are allocated among them on a pro rata basis.
The Financial Accounting Standards Board (“FASB”) Accounting Standards Codification is the exclusive reference of authoritative U.S. generally accepted accounting principles (“GAAP”) recognized by the FASB to be applied by nongovernmental entities. Rules and interpretive releases of the Securities and Exchange Commission (“SEC”) under authority of federal laws are also sources of authoritative GAAP for SEC
24
registrants. The fund’s financial statements are prepared in accordance with GAAP, which may require the use of management estimates and assumptions.Actual results could differ from those estimates.
The Company enters into contracts that contain a variety of indemnifications.The fund’s maximum exposure under these arrangements is unknown.The fund does not anticipate recognizing any loss related to these arrangements.
(a) Portfolio valuation: The fair value of a financial instrument is the amount that would be received to sell an asset or paid to transfer a liability in an orderly transaction between market participants at the measurement date (i.e., the exit price). GAAP establishes a fair value hierarchy that prioritizes the inputs of valuation techniques used to measure fair value.This hierarchy gives the highest priority to unadjusted quoted prices in active markets for identical assets or liabilities (Level 1 measurements) and the lowest priority to unobservable inputs (Level 3 measurements).
Additionally, GAAP provides guidance on determining whether the volume and activity in a market has decreased significantly and whether such a decrease in activity results in transactions that are not orderly. GAAP requires enhanced disclosures around valuation inputs and techniques used during annual and interim periods.
Various inputs are used in determining the value of the fund’s investments relating to fair value measurements.These inputs are summarized in the three broad levels listed below:
Level 1—unadjusted quoted prices in active markets for identical investments.
Level 2—other significant observable inputs (including quoted prices for similar investments, interest rates, prepayment speeds, credit risk, etc.).
Level 3—significant unobservable inputs (including the fund’s own assumptions in determining the fair value of investments).
The Fund 25
NOTES TO FINANCIAL STATEMENTS (continued)
The inputs or methodology used for valuing securities are not necessarily an indication of the risk associated with investing in those securities.
Changes in valuation techniques may result in transfers in or out of an assigned level within the disclosure hierarchy. Valuation techniques used to value the fund’s investments are as follows:
Investments in securities are valued at the last sales price on the securities exchange or national securities market on which such securities are primarily traded. Securities listed on the National Market System for which market quotations are available are valued at the official closing price or, if there is no official closing price that day, at the last sales price. Securities not listed on an exchange or the national securities market, or securities for which there were no transactions, are valued at the average of the most recent bid and asked prices, except for open short positions, where the asked price is used for valuation purposes. Bid price is used when no asked price is available. Registered investment companies that are not traded on an exchange are valued at their net asset value. All of the preceding securities are categorized within Level 1 of the fair value hierarchy.
Fair valuing of securities may be determined with the assistance of a pricing service using calculations based on indices of domestic securities and other appropriate indicators, such as prices of relevant American Depository Receipts and financial futures. Utilizing these techniques may result in transfers between Level 1 and Level 2 of the fair value hierarchy.
When market quotations or official closing prices are not readily available, or are determined not to reflect accurately fair value, such as when the value of a security has been significantly affected by events after the close of the exchange or market on which the security is principally traded (for example, a foreign exchange or market), but before the fund calculates its net asset value, the fund may value these investments at fair value as determined in accordance with the procedures approved by the Board. Certain factors may be considered when fair valuing investments such as: fundamental analytical data, the nature and duration of restrictions on disposition, an evaluation of the forces that influence the market in which the securities are purchased and
26
sold, and public trading in similar securities of the issuer or comparable issuers.These securities are either categorized within Level 2 or 3 of the fair value hierarchy depending on the relevant inputs used.
For restricted securities where observable inputs are limited, assumptions about market activity and risk are used and are categorized within Level 3 of the fair value hierarchy.
Financial futures, which are traded on an exchange, are valued at the last sales price on the securities exchange on which such securities are primarily traded or at the last sales price on the national securities market on each business day and are generally categorized within Level 1 of the fair value hierarchy.
The following is a summary of the inputs used as of August 31, 2013 in valuing the fund's investments:
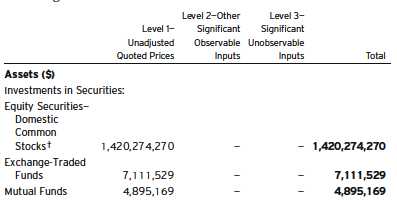
| |
| † | See Statement of Investments for additional detailed categorizations. |
At August 31, 2013, there were no transfers between Level 1 and Level 2 of the fair value hierarchy.
(b) Securities transactions and investment income: Securities transactions are recorded on a trade date basis. Realized gains and losses from securities transactions are recorded on the identified cost basis. Dividend income is recognized on the ex-dividend date and interest income, including, where applicable, accretion of discount and amortization of premium on investments, is recognized on the accrual basis.
The Fund 27
NOTES TO FINANCIAL STATEMENTS (continued)
Pursuant to a securities lending agreement with The Bank of New York Mellon, a subsidiary of BNY Mellon and an affiliate of Dreyfus, the fund may lend securities to qualified institutions. It is the fund’s policy that, at origination, all loans are secured by collateral of at least 102% of the value of U.S. securities loaned and 105% of the value of foreign securities loaned. Collateral equivalent to at least 100% of the market value of securities on loan is maintained at all times. Collateral is either in the form of cash, which can be invested in certain money market mutual funds managed by the Manager or U.S. Government and Agency securities. The fund is entitled to receive all dividends, interest and distributions on securities loaned, in addition to income earned as a result of the lending transaction. Should a borrower fail to return the securities in a timely manner, The Bank of New York Mellon is required to replace the securities for the benefit of the fund or credit the fund with the market value of the unreturned securities and is subrogated to the fund’s rights against the borrower and the collateral. During the period ended August 31, 2013, The Bank of New York Mellon earned $12,752 from lending portfolio securities, pursuant to the securities lending agreement.
(c) Affiliated issuers: Investments in other investment companies advised by Dreyfus are defined as “affiliated” under the Act. Investments in affiliated investment companies during the period ended August 31, 2013 were as follows:
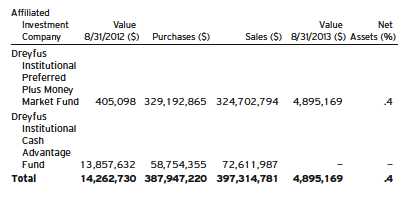
28
(d) Dividends to shareholders: Dividends are recorded on the ex-dividend date. Dividends from investment income-net and dividends from net realized capital gains, if any, are normally declared and paid annually, but the fund may make distributions on a more frequent basis to comply with the distribution requirements of the Internal Revenue Code of 1986, as amended (the “Code”).To the extent that net realized capital gains can be offset by capital loss carryovers, it is the policy of the fund not to distribute such gains. Income and capital gain distributions are determined in accordance with income tax regulations, which may differ from GAAP.
(e) Federal income taxes: It is the policy of the fund to continue to qualify as a regulated investment company, if such qualification is in the best interests of its shareholders, by complying with the applicable provisions of the Code, and to make distributions of taxable income sufficient to relieve it from substantially all federal income and excise taxes.
As of and during the period ended August 31, 2013, the fund did not have any liabilities for any uncertain tax positions.The fund recognizes interest and penalties, if any, related to uncertain tax positions as income tax expense in the Statement of Operations. During the period, the fund did not incur any interest or penalties.
Each tax year in the four-year period ended August 31, 2013 remains subject to examination by the Internal Revenue Service and state taxing authorities.
At August 31, 2013, the components of accumulated earnings on a tax basis were as follows: undistributed ordinary income $24,959,831, undistributed capital gains $40,663,441 accumulated capital losses $32,551,852 and unrealized appreciation $237,784,658.
The tax character of distributions paid to shareholders during the fiscal periods ended August 31, 2013 and August 31, 2012 were as follows: ordinary income $13,301,762 and $7,819,005, respectively.
The Fund 29
NOTES TO FINANCIAL STATEMENTS (continued)
Under the Regulated Investment Company Modernization Act of 2010 (the “2010 Act”), the fund is permitted to carry forward capital losses incurred in taxable years beginning after December 22, 2010 (“post-enactment losses”) for an unlimited period. Furthermore, post-enactment capital loss carryovers retain their character as either short-term or long-term capital losses rather than short-term as they were under previous statute.The 2010 Act requires post-enactment losses to be utilized before the utilization of losses incurred in taxable years prior to the effective date of the 2010 Act (“pre-enactment losses”).As a result of this ordering rule, pre-enactment losses may be more likely to expire unused.
As a result of the fund’s merger with Dreyfus Core Value Fund, capital losses of $24,720,145 are available to offset future gains, if any. Based on certain provisions in the Code, the amount of losses which can be utilized in subsequent years is subject to an annual limitation.This acquired capital loss will expire in fiscal year 2017.As a result of the fund’s merger with Dreyfus Large Cap Value Fund, capital losses of $7,831,707 are available to offset future gains, if any. Based on certain provisions in the Code, the amount of losses which can be utilized in subsequent years is subject to an annual limitation. $6,672,099 of this acquired capital loss will expire in fiscal year 2017 and $1,159,608 will expire in fiscal year 2018.
(f) Accounting Pronouncement: In January 2013, FASB issued Accounting Standards Update No. 2013-01 (“ASU 2013-01”), “Clarifying the Scope of Disclosures about Offsetting Assets and Liabilities”, which replaced Accounting Standards Update No. 2011-11 (“ASU 2011-11”), “Disclosures about Offsetting Assets and Liabilities”. ASU 2013-01 is effective for fiscal years beginning on or after January 1, 2013, and interim periods within those annual periods. ASU 2011-11 was intended to enhance disclosure requirements on the offsetting of financial assets and liabilities.ASU 2013-01 limits the scope of the new balance sheet offsetting disclosures to derivatives, repurchase agreements, and securities lending transactions to the extent that they are (1) offset in the financial statements or (2) subject to enforceable master netting arrangements (“MNA”) or similar agreements. Management is currently evaluating the application of ASU 2013-01 and its impact on the fund’s financial statements.
30
NOTE 2—Bank Lines of Credit:
The fund participates with other Dreyfus-managed funds in a $210 million unsecured credit facility led by Citibank, N.A. and a $300 million unsecured credit facility provided by The Bank of New York Mellon (each, a “Facility”), each to be utilized primarily for temporary or emergency purposes, including the financing of redemptions. Prior to October 10, 2012, the unsecured credit facility with Citibank, N.A. was $225 million. In connection therewith, the fund has agreed to pay its pro rata portion of commitment fees for each Facility. Interest is charged to the fund based on rates determined pursuant to the terms of the respective Facility at the time of borrowing.
The average amount of borrowings outstanding under the Facilities during the period ended August 31, 2013 was approximately $456,400 with a related weighted average annualized interest rate of 1.14%.
NOTE 3—Management Fee and Other Transactions with Affiliates:
(a) Pursuant to a management agreement with the Manager, the management fee is computed at the annual rate of .75% of the value of the fund’s average daily net assets and is payable monthly.The Manager has contractually agreed, from September 1, 2012 through July 1, 2014 for Class A, Class C and Class I shares and from July 1, 2013 through July 1, 2014 for Class Y shares, to waive receipt of its fees and/or assume the expenses of the fund, so that the expenses of Class A, Class C, Class I and ClassY shares (excluding taxes, interest expense, brokerage commissions, commitment fees on borrowings and extraordinary expenses) do not exceed .98%, 1.73%, .73% and .73% of the value of the respective class’ average daily net assets.The reduction in expenses, pursuant to the undertaking, amounted to $2,057,229 during the period ended August 31, 2013.
During the period ended August 31, 2013, the Distributor retained $23,890 from commissions earned on sales of the fund’s Class A shares and $6,237 from CDSCs on redemptions of the fund’s Class C shares.
The Fund 31
NOTES TO FINANCIAL STATEMENTS (continued)
(b) Under the Distribution Plan adopted pursuant to Rule 12b-1 under the Act, Class C shares pay the Distributor for distributing its shares at an annual rate of .75% of the value of its average daily net assets. During the period ended August 31, 2013, Class C shares were charged $379,795 pursuant to the Distribution Plan.
(c) Under the Shareholder Services Plan, Class A and Class C shares pay the Distributor at an annual rate of .25% of the value of their average daily net assets for the provision of certain services.The services provided may include personal services relating to shareholder accounts, such as answering shareholder inquiries regarding the fund and providing reports and other information, and services related to the maintenance of shareholder accounts.The Distributor may make payments to Service Agents (securities dealers, financial institutions or other industry professionals) with respect to these services.The Distributor determines the amounts to be paid to Service Agents. During the period ended August 31, 2013, Class A and Class C shares were charged $2,379,490 and $126,598, respectively, pursuant to the Shareholder Services Plan.
The fund has arrangements with the transfer agent and the custodian whereby the fund may receive earnings credits when positive cash balances are maintained, which are used to offset transfer agency and custody fees. For financial reporting purposes, the fund includes net earnings credits as an expense offset in the Statement of Operations.
The fund compensates DreyfusTransfer, Inc., a wholly-owned subsidiary of the Manager, under a transfer agency agreement for providing transfer agency services for the fund and cash management services related to fund subscriptions and redemptions. During the period ended August 31, 2013, the fund was charged $363,357 for transfer agency services and $15,987 for cash management services. These fees are included in Shareholder servicing costs in the Statement of Operations. Cash management fees were partially offset by earnings credits of $1,996.
32
The fund compensates The Bank of New York Mellon under a custody agreement for providing custodial services for the fund. During the period ended August 31, 2013, the fund was charged $86,374 pursuant to the custody agreement.
The fund compensates The Bank of New York Mellon under a cash management agreement for performing certain cash management services related to fund subscriptions and redemptions. During the period ended August 31, 2013, the fund was charged $8,782 pursuant to the cash management agreement, which is included in Shareholder servicing costs in the Statement of Operations.These fees were partially offset by earnings credits of $58.
During the period ended August 31, 2013, the fund was charged $8,973 for services performed by the Chief Compliance Officer and his staff.
The components of “Due to The Dreyfus Corporation and affiliates” in the Statement of Assets and Liabilities consist of: management fees $898,264, Distribution Plan fees $33,267, Shareholder Services Plan fees $243,280, custodian fees $34,880, Chief Compliance Officer fees $6,172 and transfer agency fees $85,343, which are offset against an expense reimbursement currently in effect in the amount of $197,528.
(d) Each Board member also serves as a Board member of other funds within the Dreyfus complex. Annual retainer fees and attendance fees are allocated to each fund based on net assets.
NOTE 4—Securities Transactions:
The aggregate amount of purchases and sales of investment securities, excluding short-term securities and financial futures, during the period ended August 31, 2013, amounted to $958,996,905 and $910,675,181, respectively.
The Fund 33
NOTES TO FINANCIAL STATEMENTS (continued)
Derivatives: A derivative is a financial instrument whose performance is derived from the performance of another asset. Each type of derivative instrument that was held by the fund during the period ended August 31, 2013 is discussed below.
Financial Futures: In the normal course of pursuing its investment objective, the fund is exposed to market risk, including equity price risk as a result of changes in value of underlying financial instruments.The fund invests in financial futures in order to manage its exposure to or protect against changes in the market.A financial futures contract represents a commitment for the future purchase or a sale of an asset at a specified date. Upon entering into such contracts, these investments require initial margin deposits with a counterparty, which consist of cash or cash equivalents.The amount of these deposits is determined by the exchange or Board of Trade on which the contract is traded and is subject to change.Accordingly, variation margin payments are received or made to reflect daily unrealized gains or losses which are recorded in the Statement of Operations.When the contracts are closed, the fund recognizes a realized gain or loss which is reflected in the Statement of Operations.There is minimal counterparty credit risk to the fund with financial futures since they are exchange traded, and the exchange guarantees the financial futures against default. At August 31, 2013, there were no financial futures outstanding.
At August 31, 2013, the cost of investments for federal income tax purposes was $1,194,496,310; accordingly, accumulated net unrealized appreciation on investments was $237,784,658, consisting of $245,649,869 gross unrealized appreciation and $7,865,211 gross unrealized depreciation.
34
REPORT OF INDEPENDENT REGISTERED
PUBLIC ACCOUNTING FIRM
Shareholders and Board of Directors
Dreyfus Strategic Value Fund
We have audited the accompanying statement of assets and liabilities, including the statement of investments, of Dreyfus StrategicValue Fund (one of the series comprising Advantage Funds, Inc.) as of August 31, 2013, and the related statement of operations for the year then ended, the statement of changes in net assets for each of the two years in the period then ended, and the financial highlights for each of the periods indicated therein.These financial statements and financial highlights are the responsibility of the Fund’s management. Our responsibility is to express an opinion on these financial statements and financial highlights based on our audits.
We conducted our audits in accordance with the standards of the Public Company Accounting Oversight Board (United States).Those standards require that we plan and perform the audit to obtain reasonable assurance about whether the financial statements and financial highlights are free of material misstatement.We were not engaged to perform an audit of the Fund’s internal control over financial reporting. Our audits included consideration of internal control over financial reporting as a basis for designing audit procedures that are appropriate in the circumstances, but not for the purpose of expressing an opinion on the effectiveness of the Fund’s internal control over financial reporting. Accordingly, we express no such opinion. An audit also includes examining, on a test basis, evidence supporting the amounts and disclosures in the financial statements and financial highlights, assessing the accounting principles used and significant estimates made by management, and evaluating the overall financial statement presentation. Our procedures included confirmation of securities owned as of August 31, 2013 by correspondence with the custodian and others.We believe that our audits provide a reasonable basis for our opinion.
In our opinion, the financial statements and financial highlights referred to above present fairly, in all material respects, the financial position of Dreyfus StrategicValue Fund at August 31, 2013, the results of its operations for the year then ended, the changes in its net assets for each of the two years in the period then ended, and the financial highlights for each of the indicated periods, in conformity with U.S. generally accepted accounting principles.

New York, New York
October 28, 2013
The Fund 35
IMPORTANT TAX INFORMATION (Unaudited)
For federal tax purposes, the fund hereby reports 88.27% of the ordinary dividends paid during the fiscal year ended August 31, 2013 as qualifying for the corporate dividends received deduction. Also certain dividends paid by the fund may be subject to a maximum tax rate of 15%, as provided for by the Jobs and GrowthTax Relief Reconciliation Act of 2003. Of the distributions paid during the fiscal year, $13,301,762 represents the maximum amount that may be considered qualified dividend income. Shareholders will receive notification in early 2014 of the percentage applicable to the preparation of their 2013 income tax returns.
36
INFORMATION ABOUT THE RENEWAL OF THE
FUND’S MANAGEMENT AGREEMENT (Unaudited)
At a meeting of the fund’s Board of Directors held on March 4-5, 2013, the Board considered the renewal of the fund’s Management Agreement pursuant to which Dreyfus provides the fund with investment advisory and administrative services (the “Agreement”). The Board members, none of whom are “interested persons” (as defined in the Investment Company Act of 1940, as amended) of the fund, were assisted in their review by independent legal counsel and met with counsel in executive session separate from Dreyfus representatives. In considering the renewal of the Agreement, the Board considered all factors that it believed to be relevant, including those discussed below.The Board did not identify any one factor as dispositive, and each Board member may have attributed different weights to the factors considered.
Analysis of Nature, Extent, and Quality of Services Provided to the Fund.The Board considered information provided to them at the meeting and in previous presentations from Dreyfus representatives regarding the nature, extent, and quality of the services provided to funds in the Dreyfus fund complex. Dreyfus provided the number of open accounts in the fund, the fund’s asset size and the allocation of fund assets among distribution channels. Dreyfus also had previously provided information regarding the diverse intermediary relationships and distribution channels of funds in the Dreyfus fund complex (such as retail direct or intermediary, in which intermediaries typically are paid by the fund and/or Dreyfus) and Dreyfus’ corresponding need for broad, deep, and diverse resources to be able to provide ongoing shareholder services to each intermediary or distribution channel, as applicable to the fund.
The Board also considered research support available to, and portfolio management capabilities of, the fund’s portfolio management personnel and that Dreyfus also provides oversight of day-to-day fund operations, including fund accounting and administration and assistance in meeting legal and regulatory requirements.The Board also considered Dreyfus’ extensive administrative, accounting, and compliance infrastructures.The Board also considered portfolio management’s brokerage policies and practices (including policies and practices regarding soft dollars) and the standards applied in seeking best execution.
The Fund 37
INFORMATION ABOUT THE RENEWAL OF THE FUND’S
MANAGEMENT AGREEMENT (Unaudited) (continued)
Comparative Analysis of the Fund’s Performance and Management Fee and Expense Ratio.The Board reviewed reports prepared by Lipper, Inc. (“Lipper”), an independent provider of investment company data, which included information comparing (1) the fund’s performance with the performance of a group of comparable funds (the “Performance Group”) and with a broader group of funds (the “Performance Universe”), all for various periods ended December 31, 2012, and (2) the fund’s actual and contractual management fees and total expenses with those of a group of comparable funds (the “Expense Group”) and with a broader group of funds (the “Expense Universe”), the information for which was derived in part from fund financial statements available to Lipper as of the date of its analysis. Dreyfus previously had furnished the Board with a description of the methodology Lipper used to select the Performance Group and Performance Universe and the Expense Group and Expense Universe.
Dreyfus representatives stated that the usefulness of performance comparisons may be affected by a number of factors, including different investment limitations that may be applicable to the fund and comparison funds.They also noted that performance generally should be considered over longer periods of time, although it is possible that long-term performance can be adversely affected by even one period of significant underperformance so that a single investment decision or theme has the ability to affect disproportionately long-term perfor-mance.The Board discussed the results of the comparisons and noted that the fund’s total return performance was variously above, at and below the Performance Group and Performance Universe medians for the various periods. Dreyfus also provided a comparison of the fund’s calendar year total returns to the returns of the fund’s benchmark index and noted that the fund’s performance was above the index’s performance in seven of the ten years.
The Board also reviewed the range of actual and contractual management fees and total expenses of the Expense Group and Expense Universe funds and discussed the results of the comparisons.The Board noted that the fund’s contractual management fee was slightly above
38
the Expense Group median and the fund’s actual management fee and total expense ratio were below the Expense Group and Expense Universe medians.
Dreyfus representatives noted that Dreyfus has contractually agreed to waive receipt of its fees and/or assume the expenses of the fund until December 31, 2013, so that the expenses of Class A, Class C and Class I shares (excluding taxes, interest expense, brokerage commissions, commitment fees on borrowings and extraordinary expenses) do not exceed .98%, 1.73% and .73% of the value of the respective class’ average daily net assets.
Dreyfus representatives reviewed with the Board the management or investment advisory fees (1) paid by funds advised or administered by Dreyfus that are in the same Lipper category as the fund and (2) paid to Dreyfus or the Dreyfus-affiliated primary employer of the fund’s primary portfolio manager(s) for advising any separate accounts and/or other types of client portfolios that are considered to have similar investment strategies and policies as the fund (the “Similar Clients”), and explained the nature of the Similar Clients. They discussed differences in fees paid and the relationship of the fees paid in light of any differences in the services provided and other relevant factors. The Board considered the relevance of the fee information provided for the Similar Clients to evaluate the appropriateness and reasonableness of the fund’s management fee.
Analysis of Profitability and Economies of Scale. Dreyfus representatives reviewed the expenses allocated and profit received by Dreyfus and the resulting profitability percentage for managing the fund and the aggregate profitability percentage to Dreyfus of managing the funds in the Dreyfus fund complex, and the method used to determine the expenses and profit.The Board concluded that the profitability results were not unreasonable, given the services rendered and service levels provided by Dreyfus.The Board also noted the expense limitation and its effect on Dreyfus’ profitability.The Board also had been provided with information prepared by an independent consulting firm regarding Dreyfus’
The Fund 39
INFORMATION ABOUT THE RENEWAL OF THE FUND’S
MANAGEMENT AGREEMENT (Unaudited) (continued)
approach to allocating costs to, and determining the profitability of, individual funds and the entire Dreyfus fund complex.The consulting firm also had analyzed where any economies of scale might emerge in connection with the management of a fund.
The Board’s counsel stated that the Board should consider the profitability analysis (1) as part of the evaluation of whether the fees under the Agreement bear a reasonable relationship to the mix of services provided by Dreyfus, including the nature, extent and quality of such services, and (2) in light of the relevant circumstances for the fund and the extent to which economies of scale would be realized if the fund grows and whether fee levels reflect these economies of scale for the benefit of fund shareholders. Dreyfus representatives noted that a discussion of economies of scale is predicated on a fund having achieved a substantial size with increasing assets and that if a fund’s assets had been stable or decreasing, the possibility that Dreyfus may have realized any economies of scale would be less. Dreyfus representatives also noted that, as a result of shared and allocated costs among funds in the Dreyfus fund complex, the extent of economies of scale could depend substantially on the level of assets in the complex as a whole, so that increases and decreases in complex-wide assets can affect potential economies of scale in a manner that is disproportionate to, or even in the opposite direction from, changes in the fund’s asset level. The Board also considered potential benefits to Dreyfus from acting as investment adviser and noted the soft dollar arrangements in effect for trading the fund’s investments.
At the conclusion of these discussions, the Board agreed that it had been furnished with sufficient information to make an informed business decision with respect to the renewal of the Agreement. Based on the discussions and considerations as described above, the Board concluded and determined as follows.
The Board concluded that the nature, extent and quality of the services provided by Dreyfus are adequate and appropriate.
The Board generally was satisfied with the fund’s performance.
The Board concluded that the fee paid to Dreyfus was reasonable in light of the considerations described above.
40
The Board determined that the economies of scale which may accrue to Dreyfus and its affiliates in connection with the management of the fund had been adequately considered by Dreyfus in connection with the fee rate charged to the fund pursuant to the Agreement and that, to the extent in the future it were determined that material economies of scale had not been shared with the fund, the Board would seek to have those economies of scale shared with the fund.
In evaluating the Agreement, the Board considered these conclusions and determinations and also relied on its previous knowledge, gained through meetings and other interactions with Dreyfus and its affiliates, of the fund and the services provided to the fund by Dreyfus.The Board also relied on information received on a routine and regular basis throughout the year relating to the operations of the fund and the investment management and other services provided under the Agreement, including information on the investment performance of the fund in comparison to similar mutual funds and benchmark performance indices; general market outlook as applicable to the fund; and compliance reports. In addition, it should be noted that the Board’s consideration of the contractual fee arrangements for this fund had the benefit of a number of years of reviews of prior or similar agreements during which lengthy discussions took place between the Board and Dreyfus representatives. Certain aspects of the arrangements may receive greater scrutiny in some years than in others, and the Board’s conclusions may be based, in part, on their consideration of the same or similar arrangements in prior years. The Board determined that renewal of the Agreement was in the best interests of the fund and its shareholders.
The Fund 41
BOARD MEMBERS INFORMATION (Unaudited)
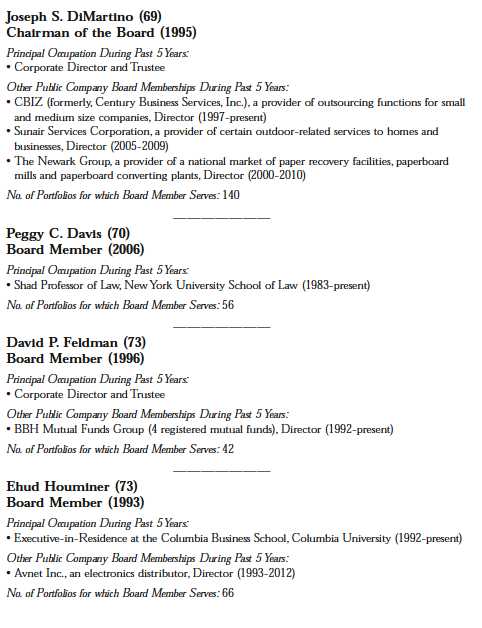
42

The Fund 43
OFFICERS OF THE FUND (Unaudited)

44
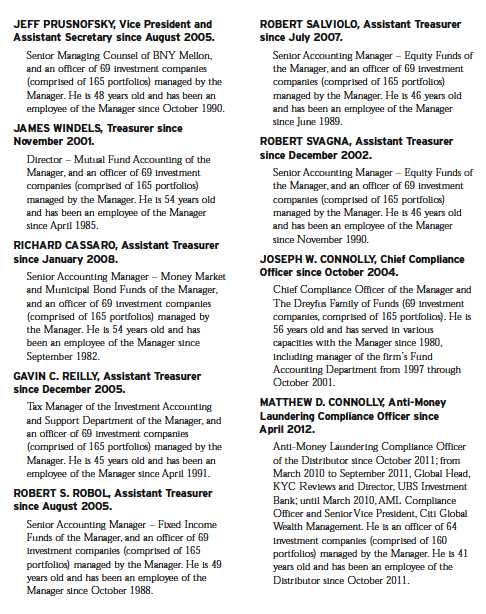
The Fund 45
Save time. Save paper. View your next shareholder report online as soon as it’s available. Log into www.dreyfus.com and sign up for Dreyfus eCommunications. It’s simple and only takes a few minutes.
The views expressed in this report reflect those of the portfolio manager only through the end of the period covered and do not necessarily represent the views of Dreyfus or any other person in the Dreyfus organization. Any such views are subject to change at any time based upon market or other conditions and Dreyfus disclaims any responsibility to update such views.These views may not be relied on as investment advice and, because investment decisions for a Dreyfus fund are based on numerous factors, may not be relied on as an indication of trading intent on behalf of any Dreyfus fund.
| | Contents |
| | THE FUND |
| 2 | A Letter from the President |
| 3 | Discussion of Fund Performance |
| 6 | Fund Performance |
| 8 | UnderstandingYour Fund’s Expenses |
| 8 | ComparingYour Fund’s Expenses With Those of Other Funds |
| 9 | Statement of Investments |
| 15 | Statement of Assets and Liabilities |
| 16 | Statement of Operations |
| 17 | Statement of Changes in Net Assets |
| 19 | Financial Highlights |
| 23 | Notes to Financial Statements |
| 35 | Report of Independent Registered Public Accounting Firm |
| 36 | Important Tax Information |
| 37 | Information About the Renewal of the Fund’s Management and Sub-Investment Advisory Agreements |
| 42 | Board Members Information |
| 44 | Officers of the Fund |
| | FOR MORE INFORMATION |
| | Back Cover |
Dreyfus
Structured Midcap Fund
The Fund
A LETTER FROM THE PRESIDENT
Dear Shareholder:
We are pleased to present this annual report for Dreyfus Structured Midcap Fund, covering the 12-month period from September 1, 2012, through August 31, 2013. For information about how the fund performed during the reporting period, as well as general market perspectives, we provide a Discussion of Fund Performance on the pages that follow.
U.S. equities fared quite well over the past year, weathering periodic bouts of volatility after setting new record highs in the spring for many broad measures of stock market performance. Low interest rates, muted inflationary pressures, and a strong U.S. dollar helped fuel the market’s gains, as did a declining unemployment rate, rebounding housing markets, and increased production of domestic oil and natural gas.
In our analysis, the U.S. economy is nearing an inflection point to a somewhat faster growth rate.We expect a reduced fiscal drag in 2014 and beyond, and the stimulative monetary policy of the past five years should continue to support economic expansion, particularly in interest rate-sensitive industry groups. For information on how these developments may affect your investments, we urge you to discuss these matters with your financial advisor.
Thank you for your continued confidence and support.
Sincerely,
J. Charles Cardona
President
The Dreyfus Corporation
September 16, 2013
2
DISCUSSION OF FUND PERFORMANCE
For the period of September 1, 2012, through August 31, 2013, as provided by Warren Chiang, Ronald Gala and C.Wesley Boggs, Portfolio Managers
Fund and Market Performance Overview
For the 12-month period ended August 31, 2013, Dreyfus Structured Midcap Fund’s Class A shares produced a total return of 24.94%, Class C shares returned 24.06%, and Class I shares returned 25.17%.1 In comparison, the Standard & Poor’s® MidCap 400 Index (“S&P 400 Index”), the fund’s benchmark, produced a total return of 23.71% for the same period.2 The fund’s ClassY shares produced a total return of 2.01% for the period since its inception of July 1, 2013, through August 31, 2013.
Improving economic conditions drove U.S. stocks broadly higher during the reporting period, with midcap stocks outperforming their larger-cap counterparts. The fund produced higher returns than its benchmark, primarily due to strong stock selections in the industrials, information technology, financials, and materials sectors.
The Fund’s Investment Approach
The fund seeks long-term capital growth.To pursue this goal, the fund normally invests at least 80% of its net assets in the stocks of companies included in the S&P 400 Index or the Russell Midcap Index at the time of purchase, plus any borrowings for investment purposes including those purchased in initial public offerings.The fund’s stock investments may include common stocks, preferred stocks, and convertible securities of U.S. and foreign issuers.We construct the portfolio through a “bottom-up” structured approach focusing on stock selection as opposed to making proactive decisions as to industry sector exposure.The approach seeks to identify undervalued securities through a quantitative process that ranks stocks based on value measures, behavioral/momentum factors, and earnings quality metrics.We attempt to maintain a diversified portfolio with industry groups relative to the S&P 400 Index.
Improving Economic Data Drove Market Rally
Strengthening economic fundamentals, including improved U.S. employment and housing market data, sparked a sustained stock market rally near the start of the reporting period. Investors also were encouraged by an aggressively accommodative
The Fund 3
DISCUSSION OF FUND PERFORMANCE (continued)
monetary policy from the Federal Reserve Board (the “Fed”), including the launch of a new round of quantitative easing involving monthly purchases of $85 billion of U.S. government securities over an indefinite time frame. Improving conditions in overseas markets, particularly Europe, further contributed to greater investor optimism.
Economic data continued to improve and stocks generally continued to rally through the spring of 2013, with several broad measures of stock market performance reaching new record highs by mid-May. Concerns that U.S. monetary policymakers might back away from their quantitative easing program sooner than expected gave rise to heightened volatility in June, erasing some of the stock market’s previous gains. Equity markets generally stabilized in July and August as investors returned their focus to company and market fundamentals.
Selection Process Produced Strong Results in Several Sectors
Our quantitatively driven stock selection process led to particularly successful stock picks in the industrials sector. Gains were led by Alaska Air Group, which benefited from its cost advantage over other airlines, and by defense and aerospace contractor AlliantTechsystems, which reported strong earnings momentum while beating analysts’ expectations and raising future guidance. Favorable stock selections enhanced returns in the information technology sector, led by networking equipment supplier Brocade Communications Systems, which surged on better-than-expected third quarter earnings.Among financial stocks, the fund benefited from its holdings of real estate investment trusts (REITs) when income-oriented investors flocked to dividend-paying stocks offering competitive levels of current income in a low interest rate environment. Several holdings in the materials sector further contributed to the fund’s relatively strong performance.
On the other hand, the fund trailed its benchmark’s gains in the consumer staples sector, primarily due to lack of exposure to Green Mountain Coffee Roasters, which gained value after announcing a long-term deal with Starbucks and demonstrating strong quarterly earnings momentum. In the consumer discretionary sector,American Eagle Outfitters declined sharply late in the reporting period due to a second quarter
4
earnings shortfall stemming from reduced traffic and higher promotional costs. However, weakness among the fund’s consumer discretionary holdings was offset to a degree by gains in apparel maker Hanesbrands, one of the fund’s top performers for the reporting period.
Continue to Find Midcap Opportunities
The fund’s stock selection process remains driven by our systematic bottom-up analysis of individual companies.At the same time, we have noted the potential for increased market volatility stemming from geopolitical developments and the Fed’s intention to taper its quantitative easing program, which could create pockets of attractive value among fundamentally strong midcap companies.
Over the longer term, we remain committed to our disciplined approach to identifying a diversified group of carefully selected midcap stocks that, in our analysis, have the potential to deliver above-average gains. As the fund’s holdings reach full valuation, we continually seek opportunities to replace our winners with more attractively valued stocks.
September 16, 2013
Equity funds are subject generally to market, market sector, market liquidity, issuer and investment style risks, among other factors, to varying degrees, all of which are more fully described in the fund’s prospectus.
Stocks of small- and/or midcap companies often experience sharper price fluctuations than stocks of large-cap companies.
|
| 1 Total return includes reinvestment of dividends and any capital gains paid, and does not take into consideration the |
| maximum initial sales charge in the case of Class A shares, or the applicable contingent deferred sales charge imposed |
| on redemptions in the case of Class C shares. Had these charges been reflected, returns would have been lower. Past |
| performance is no guarantee of future results. Share price, yield and investment return fluctuate such that upon |
| redemption fund shares may be worth more or less than their original cost.The fund’s returns reflect the absorption of |
| certain fund expenses by The Dreyfus Corporation pursuant to an agreement in effect through July 1, 2014, at which |
| time it may be extended, terminated or modified. Had these expenses not been absorbed, the fund’s returns would |
| have been lower. |
| 2 SOURCE: LIPPER INC. — Reflects reinvestment of dividends and, where applicable, capital gain distributions. |
| The Standard & Poor’s MidCap 400 Index is a widely accepted, unmanaged total return index measuring the |
| performance of the midsize company segment of the U.S. market. Investors cannot invest directly in any index. |
The Fund 5
FUND PERFORMANCE

| |
| † | Source: Lipper Inc. |
| †† | The total return figures presented for ClassY shares of the fund reflect the performance of the fund’s Class A shares |
| | for the period prior to 7/1/13 (the inception date for ClassY shares). |
Past performance is not predictive of future performance.
The above graph compares a $10,000 investment made in each of the Class A, Class C, Class I and ClassY shares of Dreyfus Structured Midcap Fund on 8/31/03 to a $10,000 investment made in each of the Standard & Poor’s MidCap 400 Index (the “S&P 400 Index”) and the Russell Midcap Index on that date.All dividends and capital gain distributions are reinvested.
On June 18, 2013, the Board authorized the fund to offer ClassY shares, as a new class of shares, to certain investors, including certain institutional investors. On July 1, 2013, ClassY shares were offered at net asset value and are not subject to certain fees, including Distribution Plan and Shareholder Services Plan fees.
The fund’s performance shown in the line graph above takes into account the maximum initial sales charge on Class A shares and all other applicable fees and expenses on all classes.The S&P 400 Index is a widely accepted, unmanaged total return index measuring the performance of the midsize company segment of the U.S. market.The Russell Midcap Index is a widely accepted, unmanaged index of medium-cap stock market performance. Unlike a mutual fund, the indices are not subject to charges, fees and other expenses. Investors cannot invest directly in any index. Further information relating to fund performance, including expense reimbursements, if applicable, is contained in the Financial Highlights section of the prospectus and elsewhere in this report.
6
| | | | | | | |
| Average Annual Total Returns as of 8/31/13 | | | | | | |
|
| | Inception Date | 1 Year | | 5 Years | | 10 Years | |
| Class A shares | | | | | | | |
| with maximum sales charge (5.75%) | 6/29/01 | 17.74 | % | 7.41 | % | 8.49 | % |
| without sales charge | 6/29/01 | 24.94 | % | 8.69 | % | 9.14 | % |
| Class C shares | | | | | | | |
| with applicable redemption charge † | 6/29/01 | 23.06 | % | 7.92 | % | 8.33 | % |
| without redemption | 6/29/01 | 24.06 | % | 7.92 | % | 8.33 | % |
| Class I shares | 6/29/01 | 25.17 | % | 8.95 | % | 9.35 | % |
| Class Y shares | 7/1/13 | 26.87 | %†† | 9.02 | %†† | 9.31 | %†† |
| Standard & Poor’s MidCap 400 Index | | 23.71 | % | 9.43 | % | 10.11 | % |
| Russell Midcap Index | | 24.91 | % | 9.08 | % | 10.14 | % |
Past performance is not predictive of future performance.The fund’s performance shown in the graph and table does not reflect the deduction of taxes that a shareholder would pay on fund distributions or the redemption of fund shares.
| |
| † | The maximum contingent deferred sales charge for Class C shares is 1% for shares redeemed within one year of the |
| | date of purchase. |
| †† | The total return performance figures presented for ClassY shares of the fund reflect the performance of the fund’s |
| | Class A shares for the period prior to 7/1/13 (the inception date for ClassY shares). |
The Fund 7
UNDERSTANDING YOUR FUND’S EXPENSES (Unaudited)
As a mutual fund investor, you pay ongoing expenses, such as management fees and other expenses. Using the information below, you can estimate how these expenses affect your investment and compare them with the expenses of other funds.You also may pay one-time transaction expenses, including sales charges (loads) and redemption fees, which are not shown in this section and would have resulted in higher total expenses. For more information, see your fund’s prospectus or talk to your financial adviser.
Review your fund’s expenses
The table below shows the expenses you would have paid on a $1,000 investment in Dreyfus Structured Midcap Fund from March 1, 2013 to August 31, 2013. It also shows how much a $1,000 investment would be worth at the close of the period, assuming actual returns and expenses.
Expenses and Value of a $1,000 Investment
assuming actual returns for the six months ended August 31, 2013†
| | | | | | | | |
| | | Class A | | Class C | | Class I | | Class Y |
| Expenses paid per $1,000†† | $ | 6.55 | $ | 10.45 | $ | 5.24 | $ | 1.50 |
| Ending value (after expenses) | $ | 1,077.70 | $ | 1,073.60 | $ | 1,078.60 | $ | 1,020.10 |
COMPARING YOUR FUND’S EXPENSES
WITH THOSE OF OTHER FUNDS (Unaudited)
Using the SEC’s method to compare expenses
The Securities and Exchange Commission (SEC) has established guidelines to help
investors assess fund expenses. Per these guidelines, the table below shows your fund’s
expenses based on a $1,000 investment, assuming a hypothetical 5% annualized return.
You can use this information to compare the ongoing expenses (but not transaction
expenses or total cost) of investing in the fund with those of other funds.All mutual fund
shareholder reports will provide this information to help you make this comparison.
Please note that you cannot use this information to estimate your actual ending account
balance and expenses paid during the period.
Expenses and Value of a $1,000 Investment
assuming a hypothetical 5% annualized return for the six months ended August 31, 2013
| | | | | | | | |
| | | Class A | | Class C | | Class I | | Class Y |
| Expenses paid per $1,000†††† | $ | 6.36 | $ | 10.16 | $ | 5.09 | $ | 4.53 |
| Ending value (after expenses) | $ | 1,018.90 | $ | 1,015.12 | $ | 1,020.16 | $ | 1,020.72 |
| |
| † | From July 1, 2013 (commencement of initial offering) to August 31, 2013 for ClassY shares. |
| †† | Expenses are equal to the fund’s annualized expense ratio of 1.25% for Class A, 2.00% for Class C and 1.00% |
| | for Class I, multiplied by the average account value over the period, multiplied by 184/365 (to reflect the one-half |
| | year period). Expenses are equal to the fund’s annualized expense ratio of .89% for ClassY shares, multiplied by the |
| | average account value over the period, multiplied by 61/365 (to reflect the actual days in the period). |
| ††† | Please note that while ClassY shares commenced operations on July 1, 2013, the hypothetical expenses paid during |
| | the period reflect projected activity for the full six month period for purposes of comparability.This projection assumes |
| | that annualized expense ratios were in effect during the period March 1, 2013 to August 31, 2013. |
| †††† Expenses are equal to the fund’s annualized expense ratio of 1.25% for Class A, 2.00% for Class C, 1.00% for |
| | Class I and .89% for Class Y, multiplied by the average account value over the period, multiplied by 184/365 (to |
| | reflect the one-half year period). |
8
STATEMENT OF INVESTMENTS
August 31, 2013
| | | |
| Common Stocks—98.7% | Shares | | Value ($) |
| Automobiles & Components—.5% | | | |
| Thor Industries | 19,100 | | 978,493 |
| Banks—4.5% | | | |
| Associated Banc-Corp | 72,400 | | 1,154,780 |
| Cathay General Bancorp | 27,500 | | 605,550 |
| Comerica | 49,900 | | 2,037,916 |
| Huntington Bancshares | 194,200 | | 1,600,208 |
| Regions Financial | 263,600 | | 2,477,840 |
| SunTrust Banks | 14,200 | | 454,684 |
| Webster Financial | 27,300 | | 722,358 |
| | | | 9,053,336 |
| Capital Goods—12.3% | | | |
| AECOM Technology | 91,200 | a | 2,656,656 |
| Alliant Techsystems | 15,000 | | 1,451,400 |
| Carlisle | 16,100 | | 1,072,260 |
| IDEX | 21,500 | | 1,276,455 |
| ITT | 31,500 | | 1,034,775 |
| Lennox International | 62,400 | | 4,283,760 |
| Lincoln Electric Holdings | 60,900 | | 3,808,077 |
| Oshkosh | 80,800 | a | 3,629,536 |
| Terex | 15,200 | a | 440,800 |
| Valmont Industries | 30,600 | | 4,129,776 |
| WABCO Holdings | 11,800 | a | 920,282 |
| | | | 24,703,777 |
| Commercial & Professional Services—2.0% | | | |
| Deluxe | 103,700 | | 4,080,595 |
| Consumer Durables & Apparel—3.9% | | | |
| Hanesbrands | 91,300 | | 5,430,524 |
| PulteGroup | 157,300 | | 2,420,847 |
| | | | 7,851,371 |
| Consumer Services—2.2% | | | |
| Bally Technologies | 59,800 | a,b | 4,313,374 |
| Wyndham Worldwide | 2,600 | | 154,336 |
| | | | 4,467,710 |
| Diversified Financials—3.8% | | | |
| American Capital | 23,900 | a | 298,272 |
| Greenhill & Co. | 10,400 | | 492,856 |
The Fund 9
STATEMENT OF INVESTMENTS (continued)
| | | |
| Common Stocks (continued) | Shares | | Value ($) |
| Diversified Financials (continued) | | | |
| Moody’s | 2,000 | | 127,120 |
| SEI Investments | 36,000 | | 1,071,360 |
| SLM | 153,700 | | 3,687,263 |
| Waddell & Reed Financial, Cl. A | 42,300 | | 2,014,326 |
| | | | 7,691,197 |
| Energy—3.4% | | | |
| HollyFrontier | 94,200 | | 4,190,016 |
| Marathon Petroleum | 7,400 | | 536,574 |
| RPC | 130,200 | b | 1,859,256 |
| Valero Energy | 8,500 | | 302,005 |
| | | | 6,887,851 |
| Food, Beverage & Tobacco—4.9% | | | |
| Coca-Cola Enterprises | 33,600 | | 1,256,640 |
| Hillshire Brands | 130,500 | | 4,216,455 |
| Ingredion | 11,000 | | 692,340 |
| Tootsie Roll Industries | 14,274 | b | 428,077 |
| Universal | 65,800 | b | 3,225,516 |
| | | | 9,819,028 |
| Health Care Equipment & Services—5.5% | | | |
| Edwards Lifesciences | 27,200 | a | 1,914,336 |
| Owens & Minor | 3,600 | b | 122,796 |
| Patterson | 21,100 | | 841,468 |
| ResMed | 95,600 | b | 4,516,144 |
| STERIS | 16,900 | | 691,041 |
| Thoratec | 57,800 | a | 2,065,194 |
| Universal Health Services, Cl. B | 14,300 | | 968,825 |
| | | | 11,119,804 |
| Household & Personal Products—.8% | | | |
| Energizer Holdings | 17,200 | | 1,699,876 |
| Insurance—2.6% | | | |
| Everest Re Group | 6,400 | | 876,480 |
| First American Financial | 24,200 | | 505,780 |
| Lincoln National | 6,900 | | 290,076 |
| Protective Life | 32,400 | | 1,353,996 |
10
| | | |
| Common Stocks (continued) | Shares | | Value ($) |
| Insurance (continued) | | | |
| Reinsurance Group of America | 27,500 | | 1,782,275 |
| XL Group | 11,200 | | 331,072 |
| | | | 5,139,679 |
| Materials—7.1% | | | |
| Ball | 1,900 | | 84,398 |
| Cytec Industries | 4,000 | | 299,120 |
| Minerals Technologies | 96,500 | | 4,284,600 |
| NewMarket | 4,500 | b | 1,233,810 |
| Packaging Corporation of America | 48,200 | | 2,556,528 |
| Reliance Steel & Aluminum | 24,300 | | 1,620,567 |
| Worthington Industries | 128,300 | | 4,276,239 |
| | | | 14,355,262 |
| Media—2.3% | | | |
| Scholastic | 28,900 | | 852,839 |
| Valassis Communications | 134,100 | b | 3,694,455 |
| | | | 4,547,294 |
| Pharmaceuticals, Biotech & Life Sciences—5.6% | | | |
| Agilent Technologies | 5,500 | | 256,520 |
| Charles River Laboratories International | 39,200 | a | 1,805,160 |
| Mettler-Toledo International | 20,600 | a | 4,536,738 |
| Mylan | 10,200 | a | 360,468 |
| Salix Pharmaceuticals | 7,000 | a | 468,580 |
| Techne | 4,100 | | 317,791 |
| United Therapeutics | 49,500 | a | 3,510,045 |
| | | | 11,255,302 |
| Real Estate—8.5% | | | |
| BRE Properties | 13,300 | c | 638,267 |
| Camden Property Trust | 46,300 | c | 2,860,877 |
| CBL & Associates Properties | 144,300 | c | 2,770,560 |
| Corrections Corporation of America | 115,550 | c | 3,806,217 |
| Extra Space Storage | 6,800 | c | 280,364 |
| Kimco Realty | 5,700 | c | 114,171 |
| Liberty Property Trust | 3,000 | c | 103,800 |
| National Retail Properties | 20,300 | b,c | 621,789 |
The Fund 11
STATEMENT OF INVESTMENTS (continued)
| | | |
| Common Stocks (continued) | Shares | | Value ($) |
| Real Estate (continued) | | | |
| Omega Healthcare Investors | 24,200 | c | 687,280 |
| Potlatch | 52,000 | c | 2,005,120 |
| Weingarten Realty Investors | 111,500 | c | 3,201,165 |
| | | | 17,089,610 |
| Retailing—5.2% | | | |
| Aaron’s | 21,400 | | 579,298 |
| Abercrombie & Fitch, Cl. A | 42,200 | | 1,490,082 |
| American Eagle Outfitters | 189,400 | | 2,740,618 |
| ANN | 38,400 | a | 1,332,480 |
| Chico’s FAS | 43,500 | | 678,600 |
| Dillard’s, Cl. A | 40,400 | | 3,080,904 |
| PetSmart | 8,100 | | 570,483 |
| | | | 10,472,465 |
| Semiconductors & Semiconductor | | | |
| Equipment—.6% | | | |
| Cree | 4,400 | a | 244,156 |
| LSI | 134,800 | | 998,868 |
| | | | 1,243,024 |
| Software & Services—11.0% | | | |
| Broadridge Financial Solutions | 80,000 | | 2,380,800 |
| CA | 31,300 | | 915,525 |
| Cadence Design Systems | 213,700 | a | 2,878,539 |
| CoreLogic | 134,800 | a | 3,464,360 |
| DST Systems | 14,815 | | 1,057,347 |
| FactSet Research Systems | 6,000 | b | 614,100 |
| Fair Isaac | 14,900 | | 746,192 |
| Intuit | 21,900 | | 1,391,307 |
| NeuStar, Cl. A | 41,100 | a | 2,077,194 |
| Rovi | 55,800 | a | 1,000,494 |
12
| | | |
| Common Stocks (continued) | Shares | | Value ($) |
| Software & Services (continued) | | | |
| Synopsys | 29,300 | a | 1,062,418 |
| Total System Services | 95,600 | | 2,645,252 |
| ValueClick | 85,800 | a | 1,815,528 |
| | | | 22,049,056 |
| Technology Hardware & Equipment—4.0% | | | |
| Brocade Communications Systems | 538,400 | a | 3,984,160 |
| Harris | 73,500 | | 4,162,305 |
| | | | 8,146,465 |
| Transportation—1.0% | | | |
| Alaska Air Group | 11,900 | b | 673,778 |
| Matson | 50,800 | | 1,352,804 |
| | | | 2,026,582 |
| Utilities—7.0% | | | |
| Aqua America | 51,100 | | 1,551,907 |
| Edison International | 63,500 | | 2,914,015 |
| IDACORP | 75,100 | | 3,595,037 |
| Pinnacle West Capital | 20,900 | | 1,134,243 |
| PNM Resources | 26,800 | | 587,188 |
| UGI | 28,100 | | 1,101,520 |
| Wisconsin Energy | 75,800 | | 3,110,832 |
| | | | 13,994,742 |
| Total Common Stocks | | | |
| (cost $172,151,086) | | | 198,672,519 |
| |
| Other Investment—1.6% | | | |
| Registered Investment Company; | | | |
| Dreyfus Institutional Preferred | | | |
| Plus Money Market Fund | | | |
| (cost $3,184,015) | 3,184,015 | d | 3,184,015 |
The Fund 13
STATEMENT OF INVESTMENTS (continued)
| | | | |
| Investment of Cash Collateral | | | | |
| for Securities Loaned—6.4% | Shares | | Value ($) | |
| Registered Investment Company; | | | | |
| Dreyfus Institutional Cash | | | | |
| Advantage Fund | | | | |
| (cost $13,044,247) | 13,044,247 | d | 13,044,247 | |
| |
| Total Investments (cost $188,379,348) | 106.7 | % | 214,900,781 | |
| Liabilities, Less Cash and Receivables | (6.7 | %) | (13,578,791 | ) |
| Net Assets | 100.0 | % | 201,321,990 | |
|
| a Non-income producing security. |
| b Security, or portion thereof, on loan.At August 31, 2013, the value of the fund’s securities on loan was |
| $13,103,867 and the value of the collateral held by the fund was $13,674,980, consisting of cash collateral of |
| $13,044,247 and U.S Government & Agency securities valued at $630,733. |
| c Investment in real estate investment trust. |
| d Investment in affiliated money market mutual fund. |
| | | |
| Portfolio Summary (Unaudited)† | | |
| |
| | Value (%) | | Value (%) |
| Capital Goods | 12.3 | Diversified Financials | 3.8 |
| Software & Services | 11.0 | Energy | 3.4 |
| Real Estate | 8.5 | Insurance | 2.6 |
| Money Market Investments | 8.0 | Media | 2.3 |
| Materials | 7.1 | Consumer Services | 2.2 |
| Utilities | 7.0 | Commercial & Professional Services | 2.0 |
| Pharmaceuticals, Biotech & Life Sciences | 5.6 | Transportation | 1.0 |
| Health Care Equipment & Services | 5.5 | Household & Personal Products | .8 |
| Retailing | 5.2 | Semiconductors & Semiconductor | |
| Food, Beverage & Tobacco | 4.9 | Equipment | .6 |
| Banks | 4.5 | Automobiles & Components | .5 |
| Technology Hardware & Equipment | 4.0 | | |
| Consumer Durables & Apparel | 3.9 | | 106.7 |
| |
| † Based on net assets. | | | |
| See notes to financial statements. | | | |
14
STATEMENT OF ASSETS AND LIABILITIES
August 31, 2013
| | | | | |
| | | | Cost | Value | |
| Assets ($): | | | | | |
| Investments in securities—See Statement of Investments (including | | | |
| securities on loan, valued at $13,103,867)—Note 1(b): | | | | |
| Unaffiliated issuers | | | 172,151,086 | 198,672,519 | |
| Affiliated issuers | | | 16,228,262 | 16,228,262 | |
| Cash | | | | 99,892 | |
| Dividends and securities lending income receivable | | | 299,820 | |
| Receivable for shares of Common Stock subscribed | | | 18,935 | |
| Prepaid expenses | | | | 61,127 | |
| | | | 215,380,555 | |
| Liabilities ($): | | | | | |
| Due to The Dreyfus Corporation and affiliates—Note 3(c) | | | 200,245 | |
| Liability for securities on loan—Note 1(b) | | | 13,044,247 | |
| Payable for shares of Common Stock redeemed | | | 669,632 | |
| Accrued expenses | | | | 144,441 | |
| | | | | 14,058,565 | |
| Net Assets ($) | | | 201,321,990 | |
| Composition of Net Assets ($): | | | | | |
| Paid-in capital | | | 203,700,673 | |
| Accumulated undistributed investment income—net | | | 713,537 | |
| Accumulated net realized gain (loss) on investments | | (29,613,653 | ) |
| Accumulated net unrealized appreciation | | | | |
| (depreciation) on investments | | | | 26,521,433 | |
| Net Assets ($) | | | 201,321,990 | |
| |
| |
| Net Asset Value Per Share | | | | | |
| | Class A | Class C | Class I | Class Y | |
| Net Assets ($) | 106,245,453 | 26,061,070 | 69,014,447 | 1,020 | |
| Shares Outstanding | 4,010,106 | 1,064,420 | 2,565,297 | 37.90 | |
| Net Asset Value Per Share ($) | 26.49 | 24.48 | 26.90 | 26.91 | |
See notes to financial statements.
The Fund 15
STATEMENT OF OPERATIONS
Year Ended August 31, 2013
| | |
| Investment Income ($): | | |
| Income: | | |
| Cash dividends (net of $187 foreign taxes withheld at source): | | |
| Unaffiliated issuers | 2,375,415 | |
| Affiliated issuers | 1,587 | |
| Income from securities lending—Note 1(b) | 30,143 | |
| Total Income | 2,407,145 | |
| Expenses: | | |
| Management fee—Note 3(a) | 805,736 | |
| Shareholder servicing costs—Note 3(c) | 396,366 | |
| Distribution fees—Note 3(b) | 111,473 | |
| Professional fees | 82,394 | |
| Registration fees | 46,826 | |
| Prospectus and shareholders’ reports | 38,998 | |
| Directors’ fees and expenses—Note 3(d) | 17,314 | |
| Custodian fees—Note 3(c) | 14,652 | |
| Loan commitment fees—Note 2 | 708 | |
| Miscellaneous | 8,417 | |
| Total Expenses | 1,522,884 | |
| Less—reduction in expenses due to undertaking—Note 3(a) | (156,885 | ) |
| Less—reduction in fees due to earnings credits—Note 3(c) | (142 | ) |
| Net Expenses | 1,365,857 | |
| Investment Income—Net | 1,041,288 | |
| Realized and Unrealized Gain (Loss) on Investments—Note 4 ($): | | |
| Net realized gain (loss) on investments | 10,080,166 | |
| Net unrealized appreciation (depreciation) on investments | 6,065,896 | |
| Net Realized and Unrealized Gain (Loss) on Investments | 16,146,062 | |
| Net Increase in Net Assets Resulting from Operations | 17,187,350 | |
See notes to financial statements.
16
STATEMENT OF CHANGES IN NET ASSETS
| | | | |
| | Year Ended August 31, | |
| | 2013 | a | 2012 | b |
| Operations ($): | | | | |
| Investment income—net | 1,041,288 | | 316,178 | |
| Net realized gain (loss) on investments | 10,080,166 | | 2,218,394 | |
| Net unrealized appreciation | | | | |
| (depreciation) on investments | 6,065,896 | | 5,332,767 | |
| Net Increase (Decrease) in Net Assets | | | | |
| Resulting from Operations | 17,187,350 | | 7,867,339 | |
| Dividends to Shareholders from ($): | | | | |
| Investment income—net: | | | | |
| Class A | (266,836 | ) | — | |
| Class C | (32,069 | ) | — | |
| Class I | (341,480 | ) | — | |
| Total Dividends | (640,385 | ) | — | |
| Capital Stock Transactions ($): | | | | |
| Net proceeds from shares sold: | | | | |
| Class A | 15,864,149 | | 8,549,668 | |
| Class B | — | | 685 | |
| Class C | 1,405,406 | | 922,672 | |
| Class I | 24,417,922 | | 9,549,383 | |
| Class Y | 1,000 | | — | |
| Net assets received in connection | | | | |
| with reorganization—Note 1 | 112,261,207 | | — | |
| Dividends reinvested: | | | | |
| Class A | 249,886 | | — | |
| Class C | 19,807 | | — | |
| Class I | 336,599 | | — | |
| Cost of shares redeemed: | | | | |
| Class A | (13,607,551 | ) | (8,909,071 | ) |
| Class B | — | | (810,709 | ) |
| Class C | (2,652,901 | ) | (2,029,092 | ) |
| Class I | (21,411,400 | ) | (6,228,456 | ) |
| Increase (Decrease) in Net Assets | | | | |
| from Capital Stock Transactions | 116,884,124 | | 1,045,080 | |
| Total Increase (Decrease) in Net Assets | 133,431,089 | | 8,912,419 | |
| Net Assets ($): | | | | |
| Beginning of Period | 67,890,901 | | 58,978,482 | |
| End of Period | 201,321,990 | | 67,890,901 | |
| Undistributed investment income—net | 713,537 | | 312,634 | |
The Fund 17
STATEMENT OF CHANGES IN NET ASSETS (continued)
| | | | |
| | Year Ended August 31, | |
| | 2013 | a | 2012 | b |
| Capital Share Transactions: | | | | |
| Class Ac,d | | | | |
| Shares sold | 643,889 | | 416,867 | |
| Shares issued in connection | | | | |
| with reorganization—Note 1 | 2,653,703 | | — | |
| Shares issued for dividends reinvested | 11,294 | | — | |
| Shares redeemed | (550,149 | ) | (446,624 | ) |
| Net Increase (Decrease) in Shares Outstanding | 2,758,737 | | (29,757 | ) |
| Class Bd | | | | |
| Shares sold | — | | 20 | |
| Shares redeemed | — | | (44,609 | ) |
| Net Increase (Decrease) in Shares Outstanding | — | | (44,589 | ) |
| Class Cc | | | | |
| Shares sold | 60,890 | | 48,653 | |
| Shares issued in connection | | | | |
| with reorganization—Note 1 | 587,537 | | — | |
| Shares issued for dividends reinvested | 954 | | — | |
| Shares redeemed | (113,634 | ) | (108,987 | ) |
| Net Increase (Decrease) in Shares Outstanding | 535,747 | | (60,334 | ) |
| Class I | | | | |
| Shares sold | 950,243 | | 462,837 | |
| Shares issued in connection | | | | |
| with reorganization—Note 1 | 1,038,784 | | — | |
| Shares issued for dividends reinvested | 15,019 | | — | |
| Shares redeemed | (848,913 | ) | (324,158 | ) |
| Net Increase (Decrease) in Shares Outstanding | 1,155,133 | | 138,679 | |
| Class Y | | | | |
| Shares sold | 37.90 | | — | |
|
| a Effective July 1, 2013, the fund commenced offering ClassY shares. |
| b Effective as of the close of business on March 13, 2012, the fund no longer offers Class B shares. |
| c During the period ended August 31, 2013, 10,690 Class C shares representing $265,762 were exchanged for |
| 9,902 Class A shares. |
| d During the period ended August 31, 2012, 12,108 Class B shares representing $223,031 were automatically |
| converted to 11,198 Class A shares. |
See notes to financial statements.
18
FINANCIAL HIGHLIGHTS
The following tables describe the performance for each share class for the fiscal periods indicated.All information (except portfolio turnover rate) reflects financial results for a single fund share.Total return shows how much your investment in the fund would have increased (or decreased) during each period, assuming you had reinvested all dividends and distributions.These figures have been derived from the fund’s financial statements.
| | | | | | | | | |
| | | | Year Ended August 31, | | | |
| Class A Shares | 2013 | | 2012 | 2011 | | 2010 | | 2009 | |
| Per Share Data ($): | | | | | | | | | |
| Net asset value, beginning of period | 21.41 | | 18.67 | 15.20 | | 13.62 | | 17.80 | |
| Investment Operations: | | | | | | | | | |
| Investment income (loss)—neta | .23 | | .11 | (.05 | ) | .04 | | .09 | |
| Net realized and unrealized | | | | | | | | | |
| gain (loss) on investments | 5.06 | | 2.63 | 3.52 | | 1.59 | | (4.20 | ) |
| Total from Investment Operations | 5.29 | | 2.74 | 3.47 | | 1.63 | | (4.11 | ) |
| Distributions: | | | | | | | | | |
| Dividends from | | | | | | | | | |
| investment income—net | (.21 | ) | — | — | | (.05 | ) | (.07 | ) |
| Net asset value, end of period | 26.49 | | 21.41 | 18.67 | | 15.20 | | 13.62 | |
| Total Return (%)b | 24.94 | | 14.68 | 22.83 | | 11.97 | | (23.02 | ) |
| Ratios/Supplemental Data (%): | | | | | | | | | |
| Ratio of total expenses | | | | | | | | | |
| to average net assets | 1.35 | | 1.41 | 1.43 | | 1.36 | | 1.52 | |
| Ratio of net expenses | | | | | | | | | |
| to average net assets | 1.26 | | 1.41 | 1.43 | | 1.36 | | 1.51 | |
| Ratio of net investment income | | | | | | | | | |
| (loss) to average net assets | .92 | | .55 | (.29 | ) | .27 | | .74 | |
| Portfolio Turnover Rate | 57.54 | | 93.44 | 77.12 | | 84.88 | | 102.59 | |
| Net Assets, end of period ($ x 1,000) | 106,245 | | 26,786 | 23,916 | | 34,811 | | 46,780 | |
| |
| a | Based on average shares outstanding at each month end. |
| b | Exclusive of sales charge. |
See notes to financial statements.
The Fund 19
FINANCIAL HIGHLIGHTS (continued)
| | | | | | | | | | |
| | | | Year Ended August 31, | | | |
| Class C Shares | 2013 | | 2012 | | 2011 | | 2010 | | 2009 | |
| Per Share Data ($): | | | | | | | | | | |
| Net asset value, beginning of period | 19.80 | | 17.40 | | 14.25 | | 12.82 | | 16.78 | |
| Investment Operations: | | | | | | | | | | |
| Investment income (loss)—neta | .06 | | (.04 | ) | (.17 | ) | (.07 | ) | .00 | b |
| Net realized and unrealized | | | | | | | | | | |
| gain (loss) on investments | 4.68 | | 2.44 | | 3.32 | | 1.50 | | (3.96 | ) |
| Total from Investment Operations | 4.74 | | 2.40 | | 3.15 | | 1.43 | | (3.96 | ) |
| Distributions: | | | | | | | | | | |
| Dividends from net realized | | | | | | | | | | |
| gain on investments | (.06 | ) | — | | — | | — | | — | |
| Net asset value, end of period | 24.48 | | 19.80 | | 17.40 | | 14.25 | | 12.82 | |
| Total Return (%)c | 24.06 | | 13.79 | | 22.11 | | 11.15 | | (23.60 | ) |
| Ratios/Supplemental Data (%): | | | | | | | | | | |
| Ratio of total expenses | | | | | | | | | | |
| to average net assets | 2.10 | | 2.14 | | 2.09 | | 2.11 | | 2.23 | |
| Ratio of net expenses | | | | | | | | | | |
| to average net assets | 2.01 | | 2.14 | | 2.09 | | 2.11 | | 2.22 | |
| Ratio of net investment income | | | | | | | | | | |
| (loss) to average net assets | .26 | | (.20 | ) | (.95 | ) | (.49 | ) | .01 | |
| Portfolio Turnover Rate | 57.54 | | 93.44 | | 77.12 | | 84.88 | | 102.59 | |
| Net Assets, end of period ($ x 1,000) | 26,061 | | 10,468 | | 10,246 | | 9,764 | | 11,499 | |
| |
| a | Based on average shares outstanding at each month end. |
| b | Amount represents less than $.01 per share. |
| c | Exclusive of sales charge. |
See notes to financial statements.
20
| | | | | | | | | |
| | | | Year Ended August 31, | | | |
| Class I Shares | 2013 | | 2012 | 2011 | | 2010 | | 2009 | |
| Per Share Data ($): | | | | | | | | | |
| Net asset value, beginning of period | 21.73 | | 18.91 | 15.39 | | 13.79 | | 18.05 | |
| Investment Operations: | | | | | | | | | |
| Investment income (loss)—neta | .33 | | .16 | (.02 | ) | .09 | | .12 | |
| Net realized and unrealized | | | | | | | | | |
| gain (loss) on investments | 5.09 | | 2.66 | 3.56 | | 1.61 | | (4.26 | ) |
| Total from Investment Operations | 5.42 | | 2.82 | 3.54 | | 1.70 | | (4.14 | ) |
| Distributions: | | | | | | | | | |
| Dividends from investment income—net | (.25 | ) | — | (.02 | ) | (.10 | ) | (.12 | ) |
| Net asset value, end of period | 26.90 | | 21.73 | 18.91 | | 15.39 | | 13.79 | |
| Total Return (%) | 25.17 | | 14.91 | 22.97 | | 12.37 | | (22.78 | ) |
| Ratios/Supplemental Data (%): | | | | | | | | | |
| Ratio of total expenses | | | | | | | | | |
| to average net assets | 1.26 | | 1.22 | 1.30 | | 1.05 | | 1.18 | |
| Ratio of net expenses | | | | | | | | | |
| to average net assets | 1.03 | | 1.22 | 1.30 | | 1.05 | | 1.17 | |
| Ratio of net investment income | | | | | | | | | |
| (loss) to average net assets | 1.27 | | .78 | (.12 | ) | .57 | | 1.01 | |
| Portfolio Turnover Rate | 57.54 | | 93.44 | 77.12 | | 84.88 | | 102.59 | |
| Net Assets, end of period ($ x 1,000) | 69,014 | | 30,636 | 24,045 | | 46,340 | | 46,124 | |
| |
| a Based on average shares outstanding at each month end. | | | | | | | | |
| See notes to financial statements. | | | | | | | | | |
The Fund 21
FINANCIAL HIGHLIGHTS (continued)
| |
| | Period Ended |
| Class Y Shares | August 31, 2013a |
| Per Share Data ($): | |
| Net asset value, beginning of period | 26.38 |
| Investment Operations: | |
| Investment income—netb | .02 |
| Net realized and unrealized gain (loss) on investments | .51 |
| Total from Investment Operations | .53 |
| Net asset value, end of period | 26.91 |
| Total Return (%)c | 2.01 |
| Ratios/Supplemental Data (%): | |
| Ratio of total expenses to average net assetsd | .97 |
| Ratio of net expenses to average net assetsd | .89 |
| Ratio of net investment income to average net assetsd | .35 |
| Portfolio Turnover Rate | 57.54 |
| Net Assets, end of period ($ x 1,000) | 1 |
| |
| a | From July 1, 2013 (commencement of initial offering) to August 31, 2013. |
| b | Based on average shares outstanding. |
| c | Not annualized. |
| d | Annualized. |
See notes to financial statements.
22
NOTES TO FINANCIAL STATEMENTS
NOTE 1—Significant Accounting Policies:
Dreyfus Structured Midcap Fund (the “fund”) is a separate diversified series of Advantage Funds, Inc. (the “Company”) which is registered under the Investment Company Act of 1940, as amended (the “Act”), as an open-end management investment company and operates as a series company currently offering twelve series, including the fund.The fund’s investment objective is to seek long-term capital growth.The Dreyfus Corporation (the “Manager” or “Dreyfus”), a wholly-owned subsidiary ofThe Bank of NewYork Mellon Corporation (“BNY Mellon”), serves as the fund’s investment adviser. Mellon Capital Management Corporation (“Mellon Capital”), an affiliate of Dreyfus, serves as the fund’s sub-investment adviser.
As of the close of business on June 7, 2013, pursuant to an Agreement and Plan of Reorganization previously approved by the Company’s Board of Directors (the “Board”), all of the assets, subject to the liabilities, of Dreyfus Manager Fund I—Dreyfus MidCap Core Fund (“MidCap Core”) were transferred to the fund in exchange for corresponding classes of shares of Common Stock of the fund of equal value.The purpose of the transaction was to combine two funds with comparable investment objectives and strategies. Shareholders of Class A, Class C and Class I shares of MidCap Core received Class A, Class C and Class I shares of the fund, respectively, in each case in an amount equal to the aggregate net asset value of their investment in MidCap Core at the time of the exchange.The exchange ratio for each class was as follows: Class A—.92 to 1, Class C—.91 to 1 and Class I—.94 to 1.The net asset value of the fund’s shares on the close of business June 7, 2013, after the reorganization was $26.40 for Class A, $24.44 for Class C and $26.79 for Class I shares, and a total of 2,653,703 Class A shares, 587,537 Class C shares and 1,038,784 Class I shares were issued to shareholders of MidCap Core in the exchange.
The Fund 23
NOTES TO FINANCIAL STATEMENTS (continued)
The net unrealized appreciation (depreciation) on investments and net assets prior to the acquisition as of the merger date for MidCap Core and the fund, were as follows:

Assuming the merger had been completed on September 1, 2012, the fund’s pro forma results in the Statement of Operations during the period ended August 31, 2013 would have been as follows:
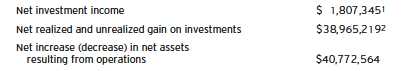
| |
| 1 | $1,041,288 as reported in the Statement of Operations plus $766,057 MidCap Core pre-merger. |
| 2 | $16,146,062 as reported in the Statement of Operations plus $22,819,157 MidCap Core |
| | pre-merger. |
Because the combined funds have been managed as a single integrated fund since the merger was completed, it is not practicable to separate the amounts of revenue and earnings of MidCap Core that have been included in the fund’s Statement of Operations during the period ended August 31, 2013.
At a meeting held on June 18, 2013, the Board approved, effective July 1, 2013: (a) for the fund to offer ClassY shares; and, (b) an increase in the authorized shares of the fund from 500 million to 600 million and authorized 100 million ClassY shares.
MBSC Securities Corporation (the “Distributor”), a wholly-owned subsidiary of Dreyfus, is the distributor of the fund’s shares. The fund is authorized to issue 600 million shares of $.001 par value Common Stock. The fund currently offers four classes of shares: ClassA (200 million shares authorized), Class C (100 million shares authorized) Class I (200 million shares authorized) and Class Y (100 million shares authorized). Class A shares generally are subject to a sales charge imposed at the time of pur-
24
chase. Class C shares are subject to a contingent deferred sales charge (“CDSC”) imposed on Class C shares redeemed within one year of purchase. Class I shares are sold at net asset value per share only to institutional investors. Class Y shares are sold at net asset value per share to certain investors, including certain institutional investors. Other differences between the classes include the services offered to and the expenses borne by each class, the allocation of certain transfer agency costs and certain voting rights. Income, expenses (other than expenses attributable to a specific class), and realized and unrealized gains or losses on investments are allocated to each class of shares based on its relative net assets.
The sales charge may be reduced or waived for certain purchases of Class A shares. Effective April 1, 2013, pursuant to new/modified front-end sales charge waivers, Class A shares of the fund may be purchased at net asset value without payment of a sales charge by (a) investors who participate in a self-directed investment brokerage account program offered by financial intermediaries that have entered into an agreement with the fund’s Distributor (financial intermediaries offering self-directed investment brokerage accounts may or may not charge their customers a transaction fee) and (b) investors who purchase Class A shares directly through the fund’s Distributor, and either (i) have, or whose spouse or minor children have, beneficially owned shares and continuously maintained an open account with the Distributor in a Dreyfus-managed fund since on or before February 28, 2006, or (ii) such purchase is for a self-directed investment account that may or may not be subject to a transaction fee.
As of August 31, 2013, MBC Investments Corp., an indirect subsidiary of BNY Mellon, held all of the outstanding ClassY shares of the fund.
The Company accounts separately for the assets, liabilities and operations of each series. Expenses directly attributable to each series are charged to that series’ operations; expenses which are applicable to all series are allocated among them on a pro rata basis.
The Financial Accounting Standards Board (“FASB”) Accounting Standards Codification is the exclusive reference of authoritative U.S. generally accepted accounting principles (“GAAP”) recognized by the
The Fund 25
NOTES TO FINANCIAL STATEMENTS (continued)
FASB to be applied by nongovernmental entities. Rules and interpretive releases of the Securities and Exchange Commission (“SEC”) under authority of federal laws are also sources of authoritative GAAP for SEC registrants. The fund’s financial statements are prepared in accordance with GAAP, which may require the use of management estimates and assumptions.Actual results could differ from those estimates.
The Company enters into contracts that contain a variety of indemnifications.The fund’s maximum exposure under these arrangements is unknown.The fund does not anticipate recognizing any loss related to these arrangements.
(a) Portfolio valuation: The fair value of a financial instrument is the amount that would be received to sell an asset or paid to transfer a liability in an orderly transaction between market participants at the measurement date (i.e., the exit price). GAAP establishes a fair value hierarchy that prioritizes the inputs of valuation techniques used to measure fair value.This hierarchy gives the highest priority to unadjusted quoted prices in active markets for identical assets or liabilities (Level 1 measurements) and the lowest priority to unobservable inputs (Level 3 measurements).
Additionally, GAAP provides guidance on determining whether the volume and activity in a market has decreased significantly and whether such a decrease in activity results in transactions that are not orderly. GAAP requires enhanced disclosures around valuation inputs and techniques used during annual and interim periods.
Various inputs are used in determining the value of the fund’s investments relating to fair value measurements.These inputs are summarized in the three broad levels listed below:
Level 1—unadjusted quoted prices in active markets for identical investments.
Level 2—other significant observable inputs (including quoted prices for similar investments, interest rates, prepayment speeds, credit risk, etc.).
Level 3—significant unobservable inputs (including the fund’s own assumptions in determining the fair value of investments).
26
The inputs or methodology used for valuing securities are not necessarily an indication of the risk associated with investing in those securities.
Changes in valuation techniques may result in transfers in or out of an assigned level within the disclosure hierarchy. Valuation techniques used to value the fund’s investments are as follows:
Investments in securities are valued at the last sales price on the securities exchange or national securities market on which such securities are primarily traded. Securities listed on the National Market System for which market quotations are available are valued at the official closing price or, if there is no official closing price that day, at the last sales price. Securities not listed on an exchange or the national securities market, or securities for which there were no transactions, are valued at the average of the most recent bid and asked prices, except for open short positions, where the asked price is used for valuation purposes. Bid price is used when no asked price is available. Registered investment companies that are not traded on an exchange are valued at their net asset value. All of the preceding securities are categorized within Level 1 of the fair value hierarchy.
Fair valuing of securities may be determined with the assistance of a pricing service using calculations based on indices of domestic securities and other appropriate indicators, such as prices of relevant American Depository Receipts and financial futures. Utilizing these techniques may result in transfers between Level 1 and Level 2 of the fair value hierarchy.
When market quotations or official closing prices are not readily available, or are determined not to reflect accurately fair value, such as when the value of a security has been significantly affected by events after the close of the exchange or market on which the security is principally traded (for example, a foreign exchange or market), but before the fund calculates its net asset value, the fund may value these investments at fair value as determined in accordance with the procedures approved by the Board. Certain factors may be considered when fair valuing investments such as: fundamental analytical data, the nature
The Fund 27
NOTES TO FINANCIAL STATEMENTS (continued)
and duration of restrictions on disposition, an evaluation of the forces that influence the market in which the securities are purchased and sold, and public trading in similar securities of the issuer or comparable issuers.These securities are either categorized within Level 2 or 3 of the fair value hierarchy depending on the relevant inputs used.
For restricted securities where observable inputs are limited, assumptions about market activity and risk are used and are categorized within Level 3 of the fair value hierarchy.
The following is a summary of the inputs used as of August 31, 2013 in valuing the fund’s investments:
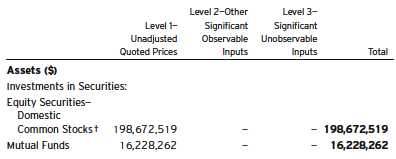
| |
| † | See Statement of Investments for additional detailed categorizations. |
At August 31, 2013, there were no transfers between Level 1 and Level 2 of the fair value hierarchy.
(b) Securities transactions and investment income: Securities transactions are recorded on a trade date basis. Realized gains and losses from securities transactions are recorded on the identified cost basis. Dividend income is recognized on the ex-dividend date and interest income, including, where applicable, accretion of discount and amortization of premium on investments, is recognized on the accrual basis.
Pursuant to a securities lending agreement with The Bank of New York Mellon, a subsidiary of BNY Mellon and an affiliate of Dreyfus, the fund may lend securities to qualified institutions. It is the fund’s policy that, at origination, all loans are secured by collateral of at least
28
102% of the value of U.S. securities loaned and 105% of the value of foreign securities loaned. Collateral equivalent to at least 100% of the market value of securities on loan is maintained at all times. Collateral is either in the form of cash, which can be invested in certain money market mutual funds managed by the Manager or U.S. Government and Agency securities. The fund is entitled to receive all dividends, interest and distributions on securities loaned, in addition to income earned as a result of the lending transaction. Should a borrower fail to return the securities in a timely manner, The Bank of New York Mellon is required to replace the securities for the benefit of the fund or credit the fund with the market value of the unreturned securities and is subrogated to the fund’s rights against the borrower and the collateral. During the period ended August 31, 2013, The Bank of New York Mellon earned $7,706 from lending portfolio securities, pursuant to the securities lending agreement.
(c) Affiliated issuers: Investments in other investment companies advised by Dreyfus are defined as “affiliated” under the Act. Investments in affiliated investment companies during the period ended August 31, 2013 were as follows:
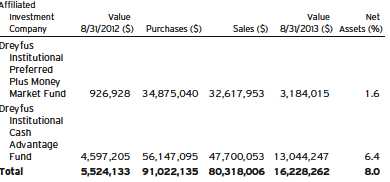
(d) Dividends to shareholders: Dividends are recorded on the ex-dividend date. Dividends from investment income-net and dividends from net realized capital gains, if any, are normally declared and paid annually,
The Fund 29
NOTES TO FINANCIAL STATEMENTS (continued)
but the fund may make distributions on a more frequent basis to comply with the distribution requirements of the Internal Revenue Code of 1986, as amended (the “Code”).To the extent that net realized capital gains can be offset by capital loss carryovers, it is the policy of the fund not to distribute such gains. Income and capital gain distributions are determined in accordance with income tax regulations, which may differ from GAAP.
(e) Federal income taxes: It is the policy of the fund to continue to qualify as a regulated investment company, if such qualification is in the best interests of its shareholders, by complying with the applicable provisions of the Code, and to make distributions of taxable income sufficient to relieve it from substantially all federal income and excise taxes.
As of and during the period ended August 31, 2013, the fund did not have any liabilities for any uncertain tax positions.The fund recognizes interest and penalties, if any, related to uncertain tax positions as income tax expense in the Statement of Operations. During the period, the fund did not incur any interest or penalties.
Each tax year in the four-year period ended August 31, 2013 remains subject to examination by the Internal Revenue Service and state taxing authorities.
At August 31, 2013, the components of accumulated earnings on a tax basis were as follows: undistributed ordinary income $713,537, undistributed capital gains $701,788, accumulated capital losses $30,301,442 and unrealized appreciation $26,507,434.
Under the Regulated Investment Company Modernization Act of 2010 (the “2010 Act”), the fund is permitted to carry forward capital losses incurred in taxable years beginning after December 22, 2010 (“post-enactment losses”) for an unlimited period. Furthermore, post-enactment capital loss carryovers retain their character as either short-term or long-term capital losses rather than short-term as they were under previous statute.The 2010 Act requires post-enactment losses to
30
be utilized before the utilization of losses incurred in taxable years prior to the effective date of the 2010 Act (“pre-enactment losses”).As a result of this ordering rule, pre-enactment losses may be more likely to expire unused.
The accumulated capital loss carryover is available for federal income tax purposes to be applied against future net realized capital gains, if any, realized subsequent to August 31, 2013. If not applied, the carryover of $8,066,540 expires in fiscal year 2018.
As a result of the fund’s merger with Dreyfus MidCap Core Fund, capital losses of $22,234,902 are available to offset future realized gains, if any. Based on certain provisions in the Code, the amount of losses which can be utilized in subsequent years is subject to an annual limitation. If not applied, $372,957 of these acquired capital losses expires in fiscal year 2014, $17,566,726 expires in fiscal year 2015, $3,806,018 expires in fiscal year 2016 and $489,201 expires in fiscal year 2017.
The tax character of distributions paid to shareholders during the fiscal periods ended August 31, 2013 and August 31, 2012 were as follows: ordinary income $640,385 and $0, respectively.
During the period ended August 31, 2013, as a result of permanent book to tax differences, primarily due to the tax treatment for capital loss carryovers and wash sales from the merger, the fund decreased accumulated net realized gain/loss on investments by $22,814,994 and increased paid-in capital by the same amount. Net assets and net asset value per share were not affected by this reclassification.
NOTE 2—Bank Lines of Credit:
The fund participates with other Dreyfus-managed funds in a $210 million unsecured credit facility led by Citibank, N.A. and a $300 million unsecured credit facility provided by The Bank of New York Mellon (each, a “Facility”), each to be utilized primarily for temporary
The Fund 31
NOTES TO FINANCIAL STATEMENTS (continued)
or emergency purposes, including the financing of redemptions. Prior to October 10, 2012, the unsecured credit facility with Citibank, N.A. was $225 million. In connection therewith, the fund has agreed to pay its pro rata portion of commitment fees for each Facility. Interest is charged to the fund based on rates determined pursuant to the terms of the respective Facility at the time of borrowing. During the period ended August 31, 2013, the fund did not borrow under the Facilities.
NOTE 3—Management Fee, Sub-Investment Advisory Fee and Other Transactions With Affiliates:
(a) Pursuant to a management agreement with Dreyfus, the management fee is computed at the annual rate of .75% of the value of the fund’s average daily net assets and is payable monthly. Dreyfus has contractually agreed, from November 1, 2012 through July 1, 2014, for Class A, Class C and Class I shares and from July 1, 2013 through July 1, 2014 for Class Y shares, to waive receipt of its fees and/or assume the direct expenses of the fund so that the expenses of none of the classes (excluding Rule 12b-1 Distribution Plan fees, Shareholder Services Plan fees, interest expense, brokerage commissions, commitment fees on borrowings and extraordinary expenses) exceed 1.00% of the value of the average daily net assets of their class.The reduction in expenses, pursuant to the undertaking, amounted to $156,885 during the period ended August 31, 2013.
Pursuant to a sub-investment advisory agreement between Dreyfus and Mellon Capital, the sub-investment advisory fee is payable monthly by Dreyfus, and is based upon the value of the fund’s average daily net assets, computed at the following annual rates:
| | |
| Average Net Assets | | |
| 0 up to $100 million | .25 | % |
| $100 million up to $1 billion | .20 | % |
| $1 billion up to $1.5 billion | .16 | % |
| In excess of $1.5 billion | .10 | % |
During the period ended August 31, 2013, the Distributor retained $3,770 from commissions earned on sales of the fund’s Class A shares and $264 from CDSCs on redemptions of the fund’s Class C shares.
32
(b) Under the Distribution Plan adopted pursuant to Rule 12b-1 under the Act, Class C shares pay the Distributor for distributing its shares at an annual rate of .75% of the value of its average daily net assets. During the period ended August 31, 2013, Class C shares were charged $111,473 pursuant to the Distribution Plan.
(c) Under the Shareholder Services Plan, Class A and Class C shares pay the Distributor at an annual rate of .25% of the value of their average daily net assets for the provision of certain services.The services provided may include personal services relating to shareholder accounts, such as answering shareholder inquiries regarding the fund and providing reports and other information, and services related to the maintenance of shareholder accounts.The Distributor may make payments to Service Agents (securities dealers, financial institutions or other industry professionals) with respect to these services. The Distributor determines the amounts to be paid to Service Agents. During the period ended August 31, 2013, Class A and Class C shares were charged $122,805 and $37,158, respectively, pursuant to the Shareholder Services Plan.
The fund has arrangements with the transfer agent and the custodian whereby the fund may receive earnings credits when positive cash balances are maintained, which are used to offset transfer agency and custody fees. For financial reporting purposes, the fund includes net earnings credits as an expense offset in the Statement of Operations.
The fund compensates DreyfusTransfer, Inc., a wholly-owned subsidiary of Dreyfus, under a transfer agency agreement for providing transfer agency services for the fund and cash management services related to fund subscriptions and redemptions. During the period ended August 31, 2013, the fund was charged $53,431 for transfer agency services and $1,469 for cash management services. These fees are included in Shareholder servicing costs in the Statement of Operations. Cash management fees were partially offset by earnings credits of $140.
The fund compensatesThe Bank of NewYork Mellon under a custody agreement for providing custodial services for the fund. During the
The Fund 33
NOTES TO FINANCIAL STATEMENTS (continued)
period ended August 31, 2013, the fund was charged $14,652 pursuant to the custody agreement.
The fund compensates The Bank of New York Mellon under a cash management agreement for performing certain cash management services related to fund subscriptions and redemptions. During the period ended August 31, 2013, the fund was charged $578 pursuant to the cash management agreement, which is included in Shareholder servicing costs in the Statement of Operations.These fees were partially offset by earnings credits of $2.
During the period ended August 31, 2013, the fund was charged $8,973 for services performed by the Chief Compliance Officer and his staff.
The components of “Due toThe Dreyfus Corporation and affiliates” in the Statement of Assets and Liabilities consist of: management fees $137,923, Distribution Plan fees $17,226, Shareholder Services Plan fees $29,334, custodian fees $8,601, Chief Compliance Officer fees $6,172 and transfer agency fees $27,124, which are offset against an expense reimbursement currently in effect in the amount of $26,135.
(d) Each Board member also serves as a Board member of other funds within the Dreyfus complex. Annual retainer fees and attendance fees are allocated to each fund based on net assets.
NOTE 4—Securities Transactions:
The aggregate amount of purchases and sales of investment securities, excluding short-term securities, during the period ended August 31, 2013, amounted to $159,611,187 and $60,277,813, respectively.
At August 31, 2013, the cost of investments for federal income tax purposes was $188,393,347; accordingly, accumulated net unrealized appreciation on investments was $26,507,434, consisting of $32,816,467 gross unrealized appreciation and $6,309,033 gross unrealized depreciation.
34
REPORT OF INDEPENDENT REGISTERED
PUBLIC ACCOUNTING FIRM
Shareholders and Board of Directors
Dreyfus Structured Midcap Fund
We have audited the accompanying statement of assets and liabilities, including the statement of investments, of Dreyfus Structured Midcap Fund (one of the series comprising Advantage Funds, Inc.) as of August 31, 2013, and the related statement of operations for the year then ended, the statement of changes in net assets for each of the two years in the period then ended, and the financial highlights for each of the periods indicated therein.These financial statements and financial highlights are the responsibility of the Fund’s management. Our responsibility is to express an opinion on these financial statements and financial highlights based on our audits.
We conducted our audits in accordance with the standards of the Public Company Accounting Oversight Board (United States).Those standards require that we plan and perform the audit to obtain reasonable assurance about whether the financial statements and financial highlights are free of material misstatement.We were not engaged to perform an audit of the Fund’s internal control over financial reporting. Our audits included consideration of internal control over financial reporting as a basis for designing audit procedures that are appropriate in the circumstances, but not for the purpose of expressing an opinion on the effectiveness of the Fund’s internal control over financial reporting. Accordingly, we express no such opinion.An audit also includes examining, on a test basis, evidence supporting the amounts and disclosures in the financial statements and financial highlights, assessing the accounting principles used and significant estimates made by management, and evaluating the overall financial statement presentation. Our procedures included confirmation of securities owned as of August 31, 2013 by correspondence with the custodian and others. We believe that our audits provide a reasonable basis for our opinion.
In our opinion, the financial statements and financial highlights referred to above present fairly, in all material respects, the financial position of Dreyfus Structured Midcap Fund at August 31, 2013, the results of its operations for the year then ended, the changes in its net assets for each of the two years in the period then ended, and the financial highlights for each of the indicated periods, in conformity with U.S. generally accepted accounting principles.

New York, New York
October 28, 2013
The Fund 35
IMPORTANT TAX INFORMATION (Unaudited)
For federal tax purposes, the fund hereby reports 100% of the ordinary dividends paid during the fiscal year ended August 31, 2013 as qualifying for the corporate dividends received deduction. Also, certain dividends paid by the fund may be subject to a maximum tax rate of 15%, as provided for by the Jobs and GrowthTax Relief Reconciliation Act of 2003. Of the distributions paid during the fiscal year, $640,385 represents the maximum amount that may be considered qualified dividend income. Shareholders will receive notification in early 2014 of the percentage applicable to the preparation of their 2013 income tax returns.
36
INFORMATION ABOUT THE RENEWAL OF THE
FUND’S MANAGEMENT AND SUB-INVESTMENT
ADVISORY AGREEMENTS (Unaudited)
At a meeting of the fund’s Board of Directors held on March 4-5, 2013, the Board considered the renewal of the fund’s Management Agreement, pursuant to which Dreyfus provides the fund with investment advisory and administrative services (the “Agreement”), and the Sub-Investment Advisory Agreement (together, the “Agreements”), pursuant to which Mellon Capital Management Corporation (the “Sub-Adviser”) provides day-to-day management of the fund’s investments. The Board members, none of whom are “interested persons” (as defined in the Investment Company Act of 1940, as amended) of the fund, were assisted in their review by independent legal counsel and met with counsel in executive session separate from representatives of Dreyfus and the Sub-Adviser. In considering the renewal of the Agreements, the Board considered all factors that it believed to be relevant, including those discussed below.The Board did not identify any one factor as dispositive, and each Board member may have attributed different weights to the factors considered.
Analysis of Nature, Extent, and Quality of Services Provided to the Fund. The Board considered information provided to them at the meeting and in previous presentations from Dreyfus representatives regarding the nature, extent, and quality of the services provided to funds in the Dreyfus fund complex. Dreyfus provided the number of open accounts in the fund, the fund’s asset size and the allocation of fund assets among distribution channels. Dreyfus also had previously provided information regarding the diverse intermediary relationships and distribution channels of funds in the Dreyfus fund complex (such as retail direct or intermediary, in which intermediaries typically are paid by the fund and/or Dreyfus) and Dreyfus’ corresponding need for broad, deep, and diverse resources to be able to provide ongoing shareholder services to each intermediary or distribution channel, as applicable to the fund.
The Board also considered research support available to, and portfolio management capabilities of, the fund’s portfolio management personnel and that Dreyfus also provides oversight of day-to-day fund operations, including fund accounting and administration and assistance in meeting legal and regulatory requirements.The Board also considered Dreyfus’
The Fund 37
INFORMATION ABOUT THE RENEWAL OF THE FUND’S MANAGEMENT
AND SUB-INVESTMENT ADVISORY AGREEMENTS (Unaudited) (continued)
extensive administrative, accounting, and compliance infrastructures, as well as Dreyfus’ supervisory activities over the Sub-Adviser.The Board also considered portfolio management’s brokerage policies and practices (including policies and practices regarding soft dollars) and the standards applied in seeking best execution.
Comparative Analysis of the Fund’s Performance and Management Fee and Expense Ratio. The Board reviewed reports prepared by Lipper, Inc. (“Lipper”), an independent provider of investment company data, which included information comparing (1) the fund’s performance with the performance of a group of comparable funds (the “Performance Group”) and with a broader group of funds (the “Performance Universe”), all for various periods ended December 31, 2012, and (2) the fund’s actual and contractual management fees and total expenses with those of a group of comparable funds (the “Expense Group”) and with a broader group of funds (the “Expense Universe”), the information for which was derived in part from fund financial statements available to Lipper as of the date of its analysis. Dreyfus previously had furnished the Board with a description of the methodology Lipper used to select the Performance Group and Performance Universe and the Expense Group and Expense Universe.
Dreyfus representatives stated that the usefulness of performance comparisons may be affected by a number of factors, including different investment limitations that may be applicable to the fund and comparison funds.The Board discussed the results of the comparisons and noted that the fund’s total return performance was above the Performance Group and Performance Universe medians for all periods, including several periods in the first quartile. Dreyfus also provided a comparison of the fund’s calendar year total returns to the returns of the fund’s benchmark index.
The Board also reviewed the range of actual and contractual management fees and total expenses of the Expense Group and Expense Universe funds and discussed the results of the comparisons.The Board noted that the fund’s contractual management fee was below the Expense Group median, the fund’s actual management fee was at the
38
Expense Group median and above the Expense Universe median and the fund’s total expense ratio was above the Expense Group and Expense Universe medians.
Dreyfus representatives noted that Dreyfus has contractually agreed to waive receipt of its fees and/or assume the direct expenses of the fund, until January 1, 2014, so that the expenses of none of the classes (excluding Rule 12b-1 Distribution Plan fees, Shareholder Services Plan fees, taxes, interest expense, brokerage commissions, commitment fees on borrowings and extraordinary expenses) exceed 1.00% of the value of the average daily net assets of their class.
Dreyfus representatives reviewed with the Board the management or investment advisory fees (1) paid by funds advised or administered by Dreyfus that are in the same Lipper category as the fund and (2) paid to Dreyfus or the Sub-Adviser or its affiliates for advising any separate accounts and/or other types of client portfolios that are considered to have similar investment strategies and policies as the fund (the “Similar Clients”), and explained the nature of the Similar Clients.They discussed differences in fees paid and the relationship of the fees paid in light of any differences in the services provided and other relevant factors.The Board considered the relevance of the fee information provided for the Similar Clients to evaluate the appropriateness and reasonableness of the fund’s management fee.
The Board considered the fee to the Sub-Adviser in relation to the fee paid to Dreyfus by the fund and the respective services provided by the Sub-Adviser and Dreyfus.The Board also noted the Sub-Adviser’s fee is paid by Dreyfus (out of its fee from the fund) and not the fund.
Analysis of Profitability and Economies of Scale. Dreyfus representatives reviewed the expenses allocated and profit received by Dreyfus and the resulting profitability percentage for managing the fund and the aggregate profitability percentage to Dreyfus of managing the funds in the Dreyfus fund complex, and the method used to determine the expenses and profit. The Board concluded that the profitability results were not unreasonable, given the services rendered and service
The Fund 39
INFORMATION ABOUT THE RENEWAL OF THE FUND’S MANAGEMENT
AND SUB-INVESTMENT ADVISORY AGREEMENTS (Unaudited) (continued)
levels provided by Dreyfus. The Board also had been provided with information prepared by an independent consulting firm regarding Dreyfus’ approach to allocating costs to, and determining the profitability of, individual funds and the entire Dreyfus fund complex.The consulting firm also had analyzed where any economies of scale might emerge in connection with the management of a fund.
The Board’s counsel stated that the Board should consider the profitability analysis (1) as part of the evaluation of whether the fees under the Agreements bear a reasonable relationship to the mix of services provided by Dreyfus and the Sub-Adviser, including the nature, extent and quality of such services, and (2) in light of the relevant circumstances for the fund and the extent to which economies of scale would be realized if the fund grows and whether fee levels reflect these economies of scale for the benefit of fund shareholders. Since Dreyfus, and not the fund, pays the Sub-Adviser pursuant to the Sub-Investment Advisory Agreement, the Board did not consider the Sub-Adviser’s profitability to be relevant to its deliberations. Dreyfus representatives also noted that, as a result of shared and allocated costs among funds in the Dreyfus fund complex, the extent of economies of scale could depend substantially on the level of assets in the complex as a whole, so that increases and decreases in complex-wide assets can affect potential economies of scale in a manner that is disproportionate to, or even in the opposite direction from, changes in the fund’s asset level.The Board also considered potential benefits to Dreyfus and the Sub-Adviser from acting as investment adviser and sub-investment adviser, respectively, and noted the soft dollar arrangements in effect for trading the fund’s investments.
At the conclusion of these discussions, the Board agreed that it had been furnished with sufficient information to make an informed business decision with respect to the renewal of the Agreements. Based on the discussions and considerations as described above, the Board concluded and determined as follows.
40
The Board was satisfied with the fund’s performance.
The Board concluded that the fees paid to Dreyfus and the Sub- Adviser were reasonable in light of the considerations described above.
The Board determined that the economies of scale which may accrue to Dreyfus and its affiliates in connection with the management of the fund had been adequately considered by Dreyfus in connection with the fee rate charged to the fund pursuant to the Agreement and that, to the extent in the future it were determined that material economies of scale had not been shared with the fund, the Board would seek to have those economies of scale shared with the fund.
In evaluating the Agreements, the Board considered these conclusions and determinations and also relied on its previous knowledge, gained through meetings and other interactions with Dreyfus and its affiliates and the Sub-Adviser, of the fund and the services provided to the fund by Dreyfus and the Sub-Adviser.The Board also relied on information received on a routine and regular basis throughout the year relating to the operations of the fund and the investment management and other services provided under the Agreements, including information on the investment performance of the fund in comparison to similar mutual funds and benchmark performance indices; general market outlook as applicable to the fund; and compliance reports. In addition, it should be noted that the Board’s consideration of the contractual fee arrangements for this fund had the benefit of a number of years of reviews of prior or similar agreements during which lengthy discussions took place between the Board and Dreyfus representatives. Certain aspects of the arrangements may receive greater scrutiny in some years than in others, and the Board’s conclusions may be based, in part, on their consideration of the same or similar arrangements in prior years.The Board determined that renewal of the Agreements was in the best interests of the fund and its shareholders.
The Fund 41
BOARD MEMBERS INFORMATION (Unaudited)
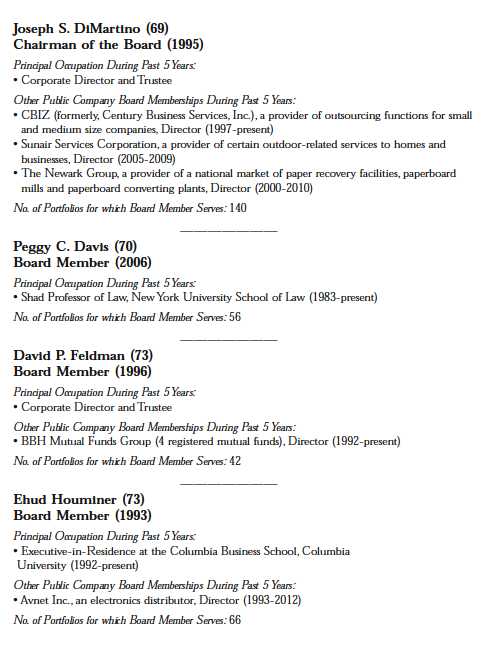
42
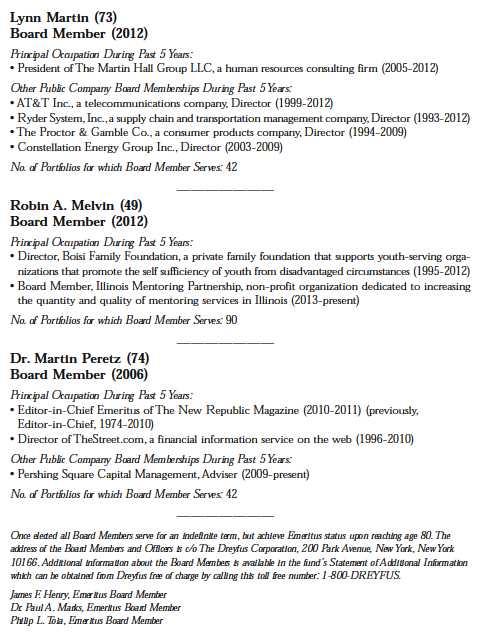
The Fund 43
OFFICERS OF THE FUND (Unaudited)
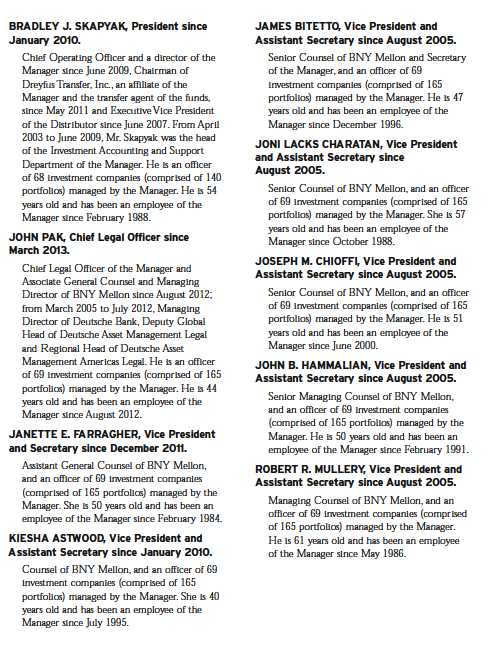
44
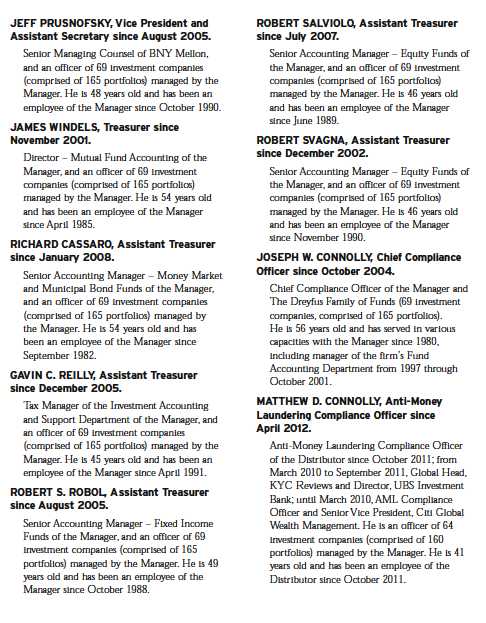
The Fund 45
Save time. Save paper. View your next shareholder report online as soon as it’s available. Log into www.dreyfus.com and sign up for Dreyfus eCommunications. It’s simple and only takes a few minutes.
The views expressed in this report reflect those of the portfolio manager only through the end of the period covered and do not necessarily represent the views of Dreyfus or any other person in the Dreyfus organization. Any such views are subject to change at any time based upon market or other conditions and Dreyfus disclaims any responsibility to update such views.These views may not be relied on as investment advice and, because investment decisions for a Dreyfus fund are based on numerous factors, may not be relied on as an indication of trading intent on behalf of any Dreyfus fund.

| | Contents |
| | THE FUND |
| 2 | A Letter from the President |
| 3 | Discussion of Fund Performance |
| 6 | Fund Performance |
| 8 | Understanding Your Fund’s Expenses |
| 8 | Comparing Your Fund’s Expenses With Those of Other Funds |
| 9 | Statement of Investments |
| 12 | Statement of Assets and Liabilities |
| 13 | Statement of Operations |
| 14 | Statement of Changes in Net Assets |
| 16 | Financial Highlights |
| 19 | Notes to Financial Statements |
| 29 | Report of Independent Registered Public Accounting Firm |
| 30 | Information About the Renewal of the Fund’s Management Agreement |
| 35 | Board Members Information |
| 37 | Officers of the Fund |
| | FOR MORE INFORMATION |
| | Back Cover |
Dreyfus
Technology Growth Fund
The Fund
A LETTER FROM THE PRESIDENT
Dear Shareholder:
We are pleased to present this annual report for Dreyfus Technology Growth Fund, covering the 12-month period from September 1, 2012, through August 31, 2013. For information about how the fund performed during the reporting period, as well as general market perspectives, we provide a Discussion of Fund Performance on the pages that follow.
U.S. equities fared quite well over the past year, weathering periodic bouts of volatility after setting new record highs in the spring for many broad measures of stock market performance. Low interest rates, muted inflationary pressures, and a strong U.S. dollar helped fuel the market’s gains, as did a declining unemployment rate, rebounding housing markets, and increased production of domestic oil and natural gas.
In our analysis, the U.S. economy is nearing an inflection point to a somewhat faster growth rate.We expect a reduced fiscal drag in 2014 and beyond, and the stimulative monetary policy of the past five years should continue to support economic expansion, particularly in interest rate-sensitive industry groups. For information on how these developments may affect your investments, we urge you to discuss these matters with your financial advisor.
Thank you for your continued confidence and support.
Sincerely,

J. Charles Cardona
President
The Dreyfus Corporation
September 16, 2013
2
DISCUSSION OF FUND PERFORMANCE
For the period of September 1, 2012, through August 31, 2013, as provided by Barry K. Mills, CFA, Portfolio Manager
Fund and Market Performance Overview
For the 12-month period ended August 31, 2013, Dreyfus Technology Growth Fund’s Class A shares produced a total return of 10.93%, Class C shares returned 10.02%, and Class I shares returned 11.28%.1 In comparison, the fund’s benchmarks, the Morgan Stanley HighTechnology 35 Index (“MS HighTech 35 Index”) and the Standard & Poor’s 500® Composite Stock Price Index (“S&P 500® Index”), produced total returns of 16.20% and 18.70%, respectively, over the same period.2,3
Stocks generally rallied over the reporting period when investors responded positively to improved economic data, but subdued capital spending by businesses weighed to a degree on the information technology sector.The fund produced lower returns than its benchmarks, mainly due to underweighted exposure to large manufacturers of personal computers and related products.
The Fund’s Investment Approach
The fund seeks capital appreciation by investing in growth companies of any size that we regard as leading producers or beneficiaries of technological innovation. The fund’s investment process centers on a multi-dimensional approach that looks for opportunities across emerging growth, cyclical or stable growth companies.The fund seeks companies that appear to have strong earnings momentum, positive earnings revisions, favorable growth, product or market cycles, and/or favorable valuations.
Recovering U.S. Economy Fueled Market Gains
The reporting period began near the outset of a sustained stock market rally driven by improving U.S. employment and housing market trends. In addition, investors were encouraged by the launch of a new round of quantitative easing from the Federal Reserve Board (the “Fed”). Economic data continued to improve, and stocks generally continued to rally, through the spring of 2013. By mid-May, several broad measures of stock market performance reached new record highs. In late May, remarks by Fed Chairman Ben Bernanke were widely interpreted as a signal that
The Fund 3
DISCUSSION OF FUND PERFORMANCE (continued)
monetary policymakers would back away from their quantitative easing program sooner than expected. As a result, heightened volatility in June erased some of the stock market’s previous gains. Equity markets generally stabilized in July and August when investors realized that an end to quantitative easing would not necessarily portend higher short-term interest rates. In this environment, value stocks produced higher returns than their more growth-oriented counterparts, including those in the information technology sector.
Although information technology stocks participated in most of the broader market’s gains, they generally lagged market averages when expected increases in corporate spending failed to materialize. In addition, pronounced weakness in consumer electronics giant Apple adversely affected companies throughout its supply chain, undermining the sector’s overall results.
Secular Growth Stocks Fell Out of Favor
Throughout the reporting period, the fund maintained its focus on innovative companies that, in our judgment, stand in the vanguard of secular technology trends, such as the increasing adoption of cloud and mobile computing. However, such companies lagged sector averages over the reporting period. Instead, the sector’s relatively mild advance was led by personal computer-related companies that rallied from depressed levels. For example, the fund did not own Internet portal Yahoo! or hardware maker Hewlett-Packard, where investors hoped new management teams would engineer turnarounds.
The fund also received disappointing results from software developers, which generally reported disappointing earnings during the first quarter of 2013. For example, remote access specialist Citrix Systems saw revenues decline along with sales of desktop computers to corporations, and data management specialist Teradata struggled in the weak capital spending environment. Communications semiconductors maker Skyworks Solutions was undermined by industry-wide supply-and-demand concerns and its role as a supplier to Apple.
The fund achieved better results from other segments of the information technology sector. Communications networking provider Ciena benefited from rising order volumes from large telecommunications companies. Business-oriented social media service LinkedIn reported strong growth in subscribers and advertising revenue.
4
Enterprise cloud computing firm salesforce.com advanced along with the popularity of “software as a service,” in which applications are hosted in the cloud rather than on businesses’ servers. The company also benefited from its expansion into digital marketing. Finally, the fund did not own many of the personal computer-oriented companies, such as chip maker Intel, that have been hurt during the transition to mobile computing.
A Constructive Outlook
Despite the technology sector’s lagging performance over the reporting period, we remain optimistic regarding its long-term prospects. We believe that businesses’ reluctance to commit to capital investments is likely to be temporary, and valuations of fundamentally sound technology companies have become more attractive.
We have identified opportunities in a number of sub-sectors that we expect to benefit from a stronger economic recovery and various catalysts for growth.We have found a relatively large number of opportunities among manufacturers of semiconductors and communications equipment, but fewer stocks have met our investment criteria among software developers and enterprise-focused technology service providers.
September 16, 2013
Please note, the position in any security highlighted with italicized typeface was sold during the reporting period. Equity funds are subject generally to market, market sector, market liquidity, issuer and investment style risks, among other factors, to varying degrees, all of which are more fully described in the fund’s prospectus.
The technology sector has been among the most volatile sectors of the stock market.Technology companies involve greater risk because their revenue and/or earnings tend to be less predictable and some companies may be experiencing significant losses.
|
| 1 Total return includes reinvestment of dividends and any capital gains paid, and does not take into consideration the |
| maximum initial sales charge in the case of Class A shares, or the applicable contingent deferred sales charge imposed |
| on redemptions in the case of Class C shares. Had these charges been reflected, returns would have been lower. Past |
| performance is no guarantee of future results. Share price, yield and investment return fluctuate such that upon |
| redemption, fund shares may be worth more or less than their original cost. |
| 2 SOURCE: BLOOMBERG L.P. — Reflects reinvestment of net dividends and, where applicable, capital gain |
| distributions.The Morgan Stanley High Technology 35 Index is an unmanaged, equal dollar-weighted index of 35 |
| stocks from the electronics-based subsectors.The index does not take into account fees and expenses to which the fund |
| is subject. Investors cannot invest directly in any index. |
| 3 SOURCE: LIPPER INC. — Reflects monthly reinvestment of dividends and, where applicable, capital gain |
| distributions.The Standard & Poor’s 500® Composite Stock Price Index is a widely accepted, unmanaged index of |
| U.S. stock market performance.The index does not take into account fees and expenses to which the fund is subject. |
| Investors cannot invest directly in any index. |
The Fund 5
FUND PERFORMANCE
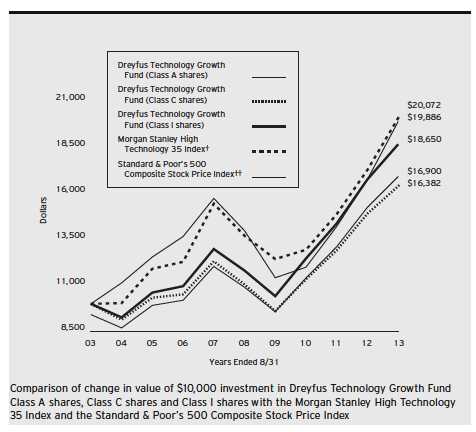
| |
| † | Source: Bloomberg L.P. |
| †† | Source: Lipper Inc. |
Past performance is not predictive of future performance.
The above graph compares a $10,000 investment made in each of the Class A, Class C and Class I shares of Dreyfus Technology Growth Fund on 8/31/03 to a $10,000 investment made in each of the Standard & Poor’s 500 Composite Stock Price Index (the “S&P 500 Index”) and the Morgan Stanley High Technology 35 Index (the “MS High Tech 35 Index”) on that date.All dividends and capital gain distributions are reinvested.
The fund’s performance shown in the line graph above takes into account the maximum initial sales charge on Class A shares and all other applicable fees and expenses on all classes.The S&P 500 Index is a widely accepted, unmanaged index of U.S. stock market performance.The MS High Tech 35 Index reflects reinvestment of net dividends and, where applicable, capital gain distributions.The MS High Tech 35 Index is an unmanaged, equal dollar-weighted index from the electronics-based subsectors. Unlike a mutual fund, the indices are not subject to charges, fees and other expenses. Investors cannot invest directly in any index. Further information relating to fund performance, including expense reimbursements, if applicable, is contained in the Financial Highlights section of the prospectus and elsewhere in this report.
6
| | | | | | |
| Average Annual Total Returns as of 8/31/13 | | | | | | |
| |
| | 1 Year | | 5 Years | | 10 Years | |
| Class A shares | | | | | | |
| with maximum sales charge (5.75%) | 4.55 | % | 7.86 | % | 5.39 | % |
| without sales charge | 10.93 | % | 9.14 | % | 6.01 | % |
| Class C shares | | | | | | |
| with applicable redemption charge † | 9.02 | % | 8.17 | % | 5.06 | % |
| without redemption | 10.02 | % | 8.17 | % | 5.06 | % |
| Class I shares | 11.28 | % | 9.57 | % | 6.43 | % |
| Morgan Stanley | | | | | | |
| High Technology 35 Index | 16.20 | % | 7.93 | % | 7.21 | % |
| Standard & Poor’s 500 | | | | | | |
| Composite Stock Price Index | 18.70 | % | 7.31 | % | 7.12 | % |
Past performance is not predictive of future performance.The fund’s performance shown in the graph and table does not reflect the deduction of taxes that a shareholder would pay on fund distributions or the redemption of fund shares.
|
| † The maximum contingent deferred sales charge for Class C shares is 1% for shares redeemed within one year of the |
| date of purchase. |
The Fund 7
UNDERSTANDING YOUR FUND’S EXPENSES (Unaudited)
As a mutual fund investor, you pay ongoing expenses, such as management fees and other expenses. Using the information below, you can estimate how these expenses affect your investment and compare them with the expenses of other funds.You also may pay one-time transaction expenses, including sales charges (loads) and redemption fees, which are not shown in this section and would have resulted in higher total expenses. For more information, see your fund’s prospectus or talk to your financial adviser.
Review your fund’s expenses
The table below shows the expenses you would have paid on a $1,000 investment in Dreyfus Technology Growth Fund from March 1, 2013 to August 31, 2013. It also shows how much a $1,000 investment would be worth at the close of the period, assuming actual returns and expenses.
Expenses and Value of a $1,000 Investment
assuming actual returns for the six months ended August 31, 2013
| | | | | | |
| | | Class A | | Class C | | Class I |
| Expenses paid per $1,000† | $ | 7.14 | $ | 11.60 | $ | 5.63 |
| Ending value (after expenses) | $ | 1,067.70 | $ | 1,063.00 | $ | 1,069.20 |
COMPARING YOUR FUND’S EXPENSES
WITH THOSE OF OTHER FUNDS (Unaudited)
Using the SEC’s method to compare expenses
The Securities and Exchange Commission (SEC) has established guidelines to help
investors assess fund expenses. Per these guidelines, the table below shows your fund’s
expenses based on a $1,000 investment, assuming a hypothetical 5% annualized return.
You can use this information to compare the ongoing expenses (but not transaction
expenses or total cost) of investing in the fund with those of other funds.All mutual fund
shareholder reports will provide this information to help you make this comparison.
Please note that you cannot use this information to estimate your actual ending account
balance and expenses paid during the period.
Expenses and Value of a $1,000 Investment
assuming a hypothetical 5% annualized return for the six months ended August 31, 2013
| | | | | | |
| | | Class A | | Class C | | Class I |
| Expenses paid per $1,000† | $ | 6.97 | $ | 11.32 | $ | 5.50 |
| Ending value (after expenses) | $ | 1,018.30 | $ | 1,013.96 | $ | 1,019.76 |
|
| † Expenses are equal to the fund’s annualized expense ratio of 1.37% for Class A, 2.23% for Class C and 1.08% |
| for Class I, multiplied by the average account value over the period, multiplied by 184/365 (to reflect the one-half |
| year period). |
8
STATEMENT OF INVESTMENTS
August 31, 2013
| | | |
| Common Stocks—97.9% | Shares | | Value ($) |
| Communications Equipment—16.7% | | | |
| Ciena | 646,650 | a | 12,881,268 |
| JDS Uniphase | 517,370 | a | 6,637,857 |
| Juniper Networks | 583,280 | a | 11,023,992 |
| QUALCOMM | 96,870 | | 6,420,544 |
| T-Mobile US | 203,420 | a | 4,749,857 |
| | | | 41,713,518 |
| Computers & Peripherals—6.0% | | | |
| EMC | 350,570 | | 9,037,695 |
| SanDisk | 109,270 | | 6,029,519 |
| | | | 15,067,214 |
| Electronic Equipment & Instruments—6.8% | | | |
| Amphenol, Cl. A | 85,720 | | 6,495,004 |
| Analog Devices | 225,620 | | 10,441,694 |
| | | | 16,936,698 |
| Internet & Catalog Retail—8.1% | | | |
| Amazon.com | 32,980 | a | 9,266,720 |
| priceline.com | 11,660 | a | 10,943,260 |
| | | | 20,209,980 |
| Internet Software & Services—17.4% | | | |
| Akamai Technologies | 228,660 | a | 10,513,787 |
| Facebook, Cl. A | 386,230 | a | 15,943,574 |
| Google, Cl. A | 11,168 | a | 9,458,179 |
| LinkedIn, Cl. A | 31,120 | a | 7,470,045 |
| | | | 43,385,585 |
| IT Services—11.8% | | | |
| Automatic Data Processing | 144,060 | | 10,251,310 |
| Cognizant Technology Solutions, Cl. A | 95,707 | a | 7,015,323 |
| International Business Machines | 31,890 | | 5,812,590 |
| MasterCard, Cl. A | 10,580 | | 6,412,326 |
| | | | 29,491,549 |
The Fund 9
STATEMENT OF INVESTMENTS (continued)
| | | |
| Common Stocks (continued) | Shares | | Value ($) |
| Semiconductors & Semiconductor | | | |
| Equipment—19.2% | | | |
| Applied Materials | 667,350 | | 10,016,923 |
| Avago Technologies | 139,160 | | 5,359,052 |
| Micron Technology | 375,410 | a | 5,094,314 |
| Taiwan Semiconductor | | | |
| Manufacturing, ADR | 255,170 | | 4,225,615 |
| Texas Instruments | 301,120 | | 11,502,784 |
| Xilinx | 271,840 | | 11,803,293 |
| | | | 48,001,981 |
| Software—11.9% | | | |
| Adobe Systems | 107,410 | a | 4,914,007 |
| Microsoft | 259,190 | | 8,656,946 |
| salesforce.com | 208,900 | a | 10,263,257 |
| ServiceNow | 128,990 | a | 6,047,051 |
| | | | 29,881,261 |
| Total Common Stocks | | | |
| (cost $192,044,918) | | | 244,687,786 |
| |
| Limited Partnership Interests-.2% | | | |
| Semiconductors & | | | |
| Semiconductor Equipment | | | |
| Bluestream Ventures, LPa,c | | | |
| (cost $2,061,175) | | | 548,348 |
10
| | | |
| Other Investment—1.2% | Shares | | Value ($) |
| Registered Investment Company; | | | |
| Dreyfus Institutional Preferred | | | |
| Plus Money Market Fund | | | |
| (cost $3,085,877) | 3,085,877 | b | 3,085,877 |
| |
| Total Investments (cost $197,191,970) | 99.3 | % | 248,322,011 |
| Cash and Receivables (Net) | .7 | % | 1,776,089 |
| Net Assets | 100.0 | % | 250,098,100 |
ADR—American Depository Receipts
|
| a Non-income producing security. |
| b Investment in affiliated money market mutual fund. |
| c Securities restricted as to public resale. Investment in restricted securities with aggregate value of $548,348 |
| representing .2% of net assets (see below). |
| | | | |
| Issuer | Acquisition Date | Cost ($) | Net Assets (%) | Valuation ($)† |
| Bluestream Ventures, LP | 4/28/2005-6/11/2008 | 2,061,175 | .2 | 548,348 |
|
| † The valuation of these securities has been determined in good faith by management under the direction of the |
| Board of Directors. |
| | | |
| Portfolio Summary (Unaudited)†† | | |
| |
| | Value (%) | | Value (%) |
| Semiconductors & | | Internet & Catalog Retail | 8.1 |
| Semiconductor Equipment | 19.4 | Electronic Equipment & Instruments | 6.8 |
| Internet Software & Services | 17.4 | Computers & Peripherals | 6.0 |
| Communications Equipment | 16.7 | Money Market Investment | 1.2 |
| Software | 11.9 | | |
| IT Services | 11.8 | | 99.3 |
|
| †† Based on net assets. |
| See notes to financial statements. |
The Fund 11
STATEMENT OF ASSETS AND LIABILITIES
August 31, 2013
| | | | |
| | | Cost | Value | |
| Assets ($): | | | | |
| Investments in securities—See Statement of Investments: | | | |
| Unaffiliated issuers | | 194,106,093 | 245,236,134 | |
| Affiliated issuers | | 3,085,877 | 3,085,877 | |
| Cash | | | 96,715 | |
| Receivable for investment securities sold | | | 2,237,487 | |
| Dividends receivable | | | 208,139 | |
| Receivable for shares of Common Stock subscribed | | 19,198 | |
| Prepaid expenses | | | 27,223 | |
| | | | 250,910,773 | |
| Liabilities ($): | | | | |
| Due to The Dreyfus Corporation and affiliates—Note 3(c) | | 330,459 | |
| Payable for shares of Common Stock redeemed | | | 265,906 | |
| Accrued expenses | | | 216,308 | |
| | | | 812,673 | |
| Net Assets ($) | | | 250,098,100 | |
| Composition of Net Assets ($): | | | | |
| Paid-in capital | | | 194,677,661 | |
| Accumulated investment (loss)—net | | | (1,063,750 | ) |
| Accumulated net realized gain (loss) on investments | | 5,354,148 | |
| Accumulated net unrealized appreciation | | | | |
| (depreciation) on investments | | | 51,130,041 | |
| Net Assets ($) | | | 250,098,100 | |
| |
| |
| Net Asset Value Per Share | | | | |
| | Class A | Class C | Class I | |
| Net Assets ($) | 212,378,010 | 25,253,437 | 12,466,653 | |
| Shares Outstanding | 5,565,499 | 751,635 | 309,061 | |
| Net Asset Value Per Share ($) | 38.16 | 33.60 | 40.34 | |
See notes to financial statements.
12
STATEMENT OF OPERATIONS
Year Ended August 31, 2013
| | |
| Investment Income ($): | | |
| Income: | | |
| Cash dividends (net of $25,572 foreign taxes withheld at source): | | |
| Unaffiliated issuers | 2,134,999 | |
| Affiliated issuers | 4,949 | |
| Income from securities lending—Note 1(b) | 85,835 | |
| Total Income | 2,225,783 | |
| Expenses: | | |
| Management fee—Note 3(a) | 1,953,020 | |
| Shareholder servicing costs—Note 3(c) | 1,381,227 | |
| Distribution fees—Note 3(b) | 195,997 | |
| Prospectus and shareholders’ reports | 104,705 | |
| Professional fees | 53,337 | |
| Registration fees | 44,226 | |
| Directors’ fees and expenses—Note 3(d) | 24,349 | |
| Custodian fees—Note 3(c) | 19,626 | |
| Loan commitment fees—Note 2 | 1,546 | |
| Interest expense—Note 2 | 756 | |
| Miscellaneous | 22,363 | |
| Total Expenses | 3,801,152 | |
| Less—reduction in fees due to earnings credits—Note 3(c) | (1,610 | ) |
| Net Expenses | 3,799,542 | |
| Investment (Loss)—Net | (1,573,759 | ) |
| Realized and Unrealized Gain (Loss) on Investments—Note 4 ($): | | |
| Net realized gain (loss) on investments | 30,662,333 | |
| Net unrealized appreciation (depreciation) on investments | (3,379,076 | ) |
| Net Realized and Unrealized Gain (Loss) on Investments | 27,283,257 | |
| Net Increase in Net Assets Resulting from Operations | 25,709,498 | |
See notes to financial statements.
The Fund 13
STATEMENT OF CHANGES IN NET ASSETS
| | | | |
| | Year Ended August 31, | |
| | 2013 | | 2012 | a |
| Operations ($): | | | | |
| Investment (loss)—net | (1,573,759 | ) | (2,029,140 | ) |
| Net realized gain (loss) on investments | 30,662,333 | | 10,302,134 | |
| Net unrealized appreciation | | | | |
| (depreciation) on investments | (3,379,076 | ) | 30,650,215 | |
| Net Increase (Decrease) in Net Assets | | | | |
| Resulting from Operations | 25,709,498 | | 38,923,209 | |
| Capital Stock Transactions ($): | | | | |
| Net proceeds from shares sold: | | | | |
| Class A | 19,822,487 | | 40,332,346 | |
| Class B | — | | 16,245 | |
| Class C | 2,406,109 | | 1,540,108 | |
| Class I | 7,517,588 | | 10,088,336 | |
| Cost of shares redeemed: | | | | |
| Class A | (63,928,305 | ) | (64,521,416 | ) |
| Class B | — | | (1,105,881 | ) |
| Class C | (7,001,384 | ) | (5,935,073 | ) |
| Class I | (9,791,035 | ) | (13,857,506 | ) |
| Increase (Decrease) in Net Assets | | | | |
| from Capital Stock Transactions | (50,974,540 | ) | (33,442,841 | ) |
| Total Increase (Decrease) in Net Assets | (25,265,042 | ) | 5,480,368 | |
| Net Assets ($): | | | | |
| Beginning of Period | 275,363,142 | | 269,882,774 | |
| End of Period | 250,098,100 | | 275,363,142 | |
| Accumulated investment (loss)—net | (1,063,750 | ) | — | |
14
| | | | |
| | Year Ended August 31, | |
| | 2013 | | 2012 | a |
| Capital Share Transactions: | | | | |
| Class Ab,c | | | | |
| Shares sold | 558,585 | | 1,191,526 | |
| Shares redeemed | (1,809,000 | ) | (2,016,252 | ) |
| Net Increase (Decrease) in Shares Outstanding | (1,250,415 | ) | (824,726 | ) |
| Class Bb | | | | |
| Shares sold | — | | 394 | |
| Shares redeemed | — | | (37,833 | ) |
| Net Increase (Decrease) in Shares Outstanding | — | | (37,439 | ) |
| Class Cc | | | | |
| Shares sold | 76,596 | | 45,899 | |
| Shares redeemed | (223,036 | ) | (203,519 | ) |
| Net Increase (Decrease) in Shares Outstanding | (146,440 | ) | (157,620 | ) |
| Class I | | | | |
| Shares sold | 199,835 | | 294,207 | |
| Shares redeemed | (262,753 | ) | (403,044 | ) |
| Net Increase (Decrease) in Shares Outstanding | (62,918 | ) | (108,837 | ) |
|
| a Effective as of the close of business on March 13, 2012, the fund no longer offers Class B shares. |
| b During the period ended August 31, 2012, 20,762 Class B shares representing $613,816 were automatically |
| converted to 18,272 Class A shares. |
| c During the period ended August 31, 2013, 52,151 Class C shares representing $1,689,179 were exchanged for |
| 46,027 Class A shares. |
See notes to financial statements.
The Fund 15
FINANCIAL HIGHLIGHTS
The following tables describe the performance for each share class for the fiscal periods indicated.All information (except portfolio turnover rate) reflects financial results for a single fund share.Total return shows how much your investment in the fund would have increased (or decreased) during each period, assuming you had reinvested all dividends and distributions.These figures have been derived from the fund’s financial statements.
| | | | | | | | | | |
| | | | Year Ended August 31, | | | |
| Class A Shares | 2013 | | 2012 | | 2011 | | 2010 | | 2009 | |
| Per Share Data ($): | | | | | | | | | | |
| Net asset value, beginning of period | 34.40 | | 29.58 | | 25.75 | | 21.63 | | 24.63 | |
| Investment Operations: | | | | | | | | | | |
| Investment (loss)—neta | (.19 | ) | (.22 | ) | (.25 | ) | (.27 | ) | (.13 | ) |
| Net realized and unrealized | | | | | | | | | | |
| gain (loss) on investments | 3.95 | | 5.04 | | 4.08 | | 4.39 | | (2.87 | ) |
| Total from Investment Operations | 3.76 | | 4.82 | | 3.83 | | 4.12 | | (3.00 | ) |
| Net asset value, end of period | 38.16 | | 34.40 | | 29.58 | | 25.75 | | 21.63 | |
| Total Return (%)b | 10.93 | | 16.30 | | 14.87 | | 19.05 | | (12.22 | ) |
| Ratios/Supplemental Data (%): | | | | | | | | | | |
| Ratio of total expenses | | | | | | | | | | |
| to average net assets | 1.39 | | 1.45 | | 1.36 | | 1.51 | | 1.70 | |
| Ratio of net expenses | | | | | | | | | | |
| to average net assets | 1.39 | | 1.45 | | 1.36 | | 1.51 | | 1.67 | |
| Ratio of net investment | | | | | | | | | | |
| (loss) to average net assets | (.54 | ) | (.67 | ) | (.79 | ) | (1.09 | ) | (.72 | ) |
| Portfolio Turnover Rate | 54.34 | | 69.20 | | 90.28 | | 110.92 | | 122.48 | |
| Net Assets, end of period ($ x 1,000) | 212,378 | | 234,452 | | 226,016 | | 242,999 | | 214,170 | |
| |
| a | Based on average shares outstanding at each month end. |
| b | Exclusive of sales charge. |
See notes to financial statements.
16
| | | | | | | | | | |
| | | | Year Ended August 31, | | | |
| Class C Shares | 2013 | | 2012 | | 2011 | | 2010 | | 2009 | |
| Per Share Data ($): | | | | | | | | | | |
| Net asset value, beginning of period | 30.54 | | 26.48 | | 23.25 | | 19.71 | | 22.69 | |
| Investment Operations: | | | | | | | | | | |
| Investment (loss)—neta | (.43 | ) | (.43 | ) | (.47 | ) | (.45 | ) | (.29 | ) |
| Net realized and unrealized | | | | | | | | | | |
| gain (loss) on investments | 3.49 | | 4.49 | | 3.70 | | 3.99 | | (2.69 | ) |
| Total from Investment Operations | 3.06 | | 4.06 | | 3.23 | | 3.54 | | (2.98 | ) |
| Net asset value, end of period | 33.60 | | 30.54 | | 26.48 | | 23.25 | | 19.71 | |
| Total Return (%)b | 10.02 | | 15.33 | | 13.89 | | 17.96 | | (13.13 | ) |
| Ratios/Supplemental Data (%): | | | | | | | | | | |
| Ratio of total expenses | | | | | | | | | | |
| to average net assets | 2.23 | | 2.27 | | 2.21 | | 2.44 | | 2.76 | |
| Ratio of net expenses | | | | | | | | | | |
| to average net assets | 2.23 | | 2.27 | | 2.21 | | 2.43 | | 2.73 | |
| Ratio of net investment | | | | | | | | | | |
| (loss) to average net assets | (1.37 | ) | (1.49 | ) | (1.63 | ) | (2.03 | ) | (1.78 | ) |
| Portfolio Turnover Rate | 54.34 | | 69.20 | | 90.28 | | 110.92 | | 122.48 | |
| Net Assets, end of period ($ x 1,000) | 25,253 | | 27,428 | | 27,954 | | 23,274 | | 21,655 | |
| |
| a | Based on average shares outstanding at each month end. |
| b | Exclusive of sales charge. |
See notes to financial statements.
The Fund 17
FINANCIAL HIGHLIGHTS (continued)
| | | | | | | | | | |
| | | | Year Ended August 31, | | | |
| Class I Shares | 2013 | | 2012 | | 2011 | | 2010 | | 2009 | |
| Per Share Data ($): | | | | | | | | | | |
| Net asset value, beginning of period | 36.25 | | 31.06 | | 26.94 | | 22.55 | | 25.54 | |
| Investment Operations: | | | | | | | | | | |
| Investment (loss)—neta | (.08 | ) | (.11 | ) | (.14 | ) | (.20 | ) | (.07 | ) |
| Net realized and unrealized | | | | | | | | | | |
| gain (loss) on investments | 4.17 | | 5.30 | | 4.26 | | 4.59 | | (2.92 | ) |
| Total from Investment Operations | 4.09 | | 5.19 | | 4.12 | | 4.39 | | (2.99 | ) |
| Net asset value, end of period | 40.34 | | 36.25 | | 31.06 | | 26.94 | | 22.55 | |
| Total Return (%) | 11.28 | | 16.71 | | 15.30 | | 19.47 | | (11.71 | ) |
| Ratios/Supplemental Data (%): | | | | | | | | | | |
| Ratio of total expenses | | | | | | | | | | |
| to average net assets | 1.07 | | 1.08 | | 1.01 | | 1.19 | | 1.28 | |
| Ratio of net expenses | | | | | | | | | | |
| to average net assets | 1.07 | | 1.08 | | 1.01 | | 1.19 | | 1.24 | |
| Ratio of net investment | | | | | | | | | | |
| (loss) to average net assets | (.22 | ) | (.32 | ) | (.42 | ) | (.76 | ) | (.39 | ) |
| Portfolio Turnover Rate | 54.34 | | 69.20 | | 90.28 | | 110.92 | | 122.48 | |
| Net Assets, end of period ($ x 1,000) | 12,467 | | 13,483 | | 14,932 | | 3,782 | | 2,350 | |
|
| a Based on average shares outstanding at each month end. |
| See notes to financial statements. |
18
NOTES TO FINANCIAL STATEMENTS
NOTE 1—Significant Accounting Policies:
DreyfusTechnology Growth Fund (the “fund”) is a separate diversified series of Advantage Funds, Inc. (the “Company”), which is registered under the Investment Company Act of 1940, as amended (the “Act”), as an open-end management investment company and operates as a series company currently offering twelve series, including the fund. The fund’s investment objective is to seek capital appreciation. The Dreyfus Corporation (the “Manager” or “Dreyfus”), a wholly-owned subsidiary of The Bank of New York Mellon Corporation (“BNY Mellon”), serves as the fund’s investment adviser.
MBSC Securities Corporation (the “Distributor”), a wholly-owned subsidiary of the Manager, is the distributor of the fund’s shares.The fund is authorized to issue 500 million shares of $.001 par value Common Stock.The fund currently offers three classes of shares: Class A (200 million shares authorized), Class C (100 million shares authorized) and Class I (200 million shares authorized). Class A shares generally are subject to a sales charge imposed at the time of purchase. Class C shares are subject to a contingent deferred sales charge (“CDSC”) imposed on Class C shares redeemed within one year of purchase. Class I shares are sold at net asset value per share only to institutional investors. Other differences between the classes include the services offered to and the expenses borne by each class, the allocation of certain transfer agency costs and certain voting rights. Income, expenses (other than expenses attributable to a specific class), and realized and unrealized gains or losses on investments are allocated to each class of shares based on its relative net assets.
The sales charge may be reduced or waived for certain purchases of Class A shares. Effective April 1, 2013, pursuant to new/modified front-end sales charge waivers, Class A shares of the fund may be purchased at net asset value without payment of a sales charge by (a) investors who participate in a self-directed investment brokerage account program offered by financial intermediaries that have entered into an agreement with the fund’s Distributor (financial intermedi-
The Fund 19
NOTES TO FINANCIAL STATEMENTS (continued)
aries offering self directed investment brokerage accounts may or may not charge their customers a transaction fee) and (b) investors who purchase Class A shares directly through the fund’s Distributor, and either (i) have, or whose spouse or minor children have, beneficially owned shares and continuously maintained an open account with the Distributor in a Dreyfus-managed fund since on or before February 28, 2006, or (ii) such purchase is for a self-directed investment account that may or may not be subject to a transaction fee.
The Company accounts separately for the assets, liabilities and operations of each series. Expenses directly attributable to each series are charged to that series’ operations; expenses which are applicable to all series are allocated among them on a pro rata basis.
The Financial Accounting Standards Board (“FASB”) Accounting Standards Codification is the exclusive reference of authoritative U.S. generally accepted accounting principles (“GAAP”) recognized by the FASB to be applied by nongovernmental entities. Rules and interpretive releases of the Securities and Exchange Commission (“SEC”) under authority of federal laws are also sources of authoritative GAAP for SEC registrants. The fund’s financial statements are prepared in accordance with GAAP, which may require the use of management estimates and assumptions.Actual results could differ from those estimates.
The Company enters into contracts that contain a variety of indemnifications.The fund’s maximum exposure under these arrangements is unknown.The fund does not anticipate recognizing any loss related to these arrangements.
(a) Portfolio valuation: The fair value of a financial instrument is the amount that would be received to sell an asset or paid to transfer a liability in an orderly transaction between market participants at the measurement date (i.e., the exit price). GAAP establishes a fair value hierarchy that prioritizes the inputs of valuation techniques used to measure fair value.This hierarchy gives the highest priority to unadjusted quoted prices in active markets for identical assets or liabilities (Level 1 measurements) and the lowest priority to unobservable inputs (Level 3 measurements).
20
Additionally, GAAP provides guidance on determining whether the volume and activity in a market has decreased significantly and whether such a decrease in activity results in transactions that are not orderly. GAAP requires enhanced disclosures around valuation inputs and techniques used during annual and interim periods.
Various inputs are used in determining the value of the fund’s investments relating to fair value measurements.These inputs are summarized in the three broad levels listed below:
Level 1—unadjusted quoted prices in active markets for identical investments.
Level 2—other significant observable inputs (including quoted prices for similar investments, interest rates, prepayment speeds, credit risk, etc.).
Level 3—significant unobservable inputs (including the fund’s own assumptions in determining the fair value of investments).
The inputs or methodology used for valuing securities are not necessarily an indication of the risk associated with investing in those securities.
Changes in valuation techniques may result in transfers in or out of an assigned level within the disclosure hierarchy. Valuation techniques used to value the fund’s investments are as follows:
Investments in securities are valued at the last sales price on the securities exchange or national securities market on which such securities are primarily traded. Securities listed on the National Market System for which market quotations are available are valued at the official closing price or, if there is no official closing price that day, at the last sales price. Securities not listed on an exchange or the national securities market, or securities for which there were no transactions, are valued at the average of the most recent bid and asked prices, except for open short positions, where the asked price is used for valuation purposes. Bid price is used when no asked price is available. Registered investment companies that are not traded on an exchange are valued at their net asset value. All of the preceding securities are categorized within Level 1 of the fair value hierarchy.
The Fund 21
NOTES TO FINANCIAL STATEMENTS (continued)
Fair valuing of securities may be determined with the assistance of a pricing service using calculations based on indices of domestic securities and other appropriate indicators, such as prices of relevant ADRs and financial futures. Utilizing these techniques may result in transfers between Level 1 and Level 2 of the fair value hierarchy.
When market quotations or official closing prices are not readily available, or are determined not to reflect accurately fair value, such as when the value of a security has been significantly affected by events after the close of the exchange or market on which the security is principally traded (for example, a foreign exchange or market), but before the fund calculates its net asset value, the fund may value these investments at fair value as determined in accordance with the procedures approved by the Company’s Board of Directors (the “Board”). Certain factors may be considered when fair valuing investments such as: fundamental analytical data, the nature and duration of restrictions on disposition, an evaluation of the forces that influence the market in which the securities are purchased and sold, and public trading in similar securities of the issuer or comparable issuers. These securities are either categorized within Level 2 or 3 of the fair value hierarchy depending on the relevant inputs used.
The fair value of the fund’s interest in a limited partnership represents the amount that the fund could reasonably expect to receive from the limited partnership if the fund’s capital was withdrawn from the limited partnership at the time of valuation, based on information available at the time the valuation is made and that the fund believes to be reliable. The valuation utilizes financial information supplied by the limited partnership with adjustments made daily for any underlying exchange traded securities. Limited partnerships are categorized within Level 3 of the fair value hierarchy.
For restricted securities where observable inputs are limited, assumptions about market activity and risk are used and are categorized within Level 3 of the fair value hierarchy.
22
The following is a summary of the inputs used as of August 31, 2013 in valuing the fund’s investments:
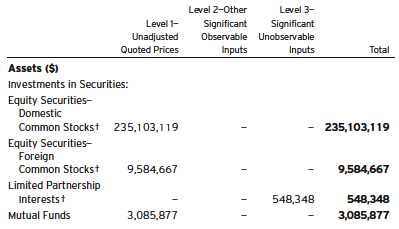
| |
| † | See Statement of Investments for additional detailed categorizations. |
At August 31, 2013, there were no transfers between Level 1 and Level 2 of the fair value hierarchy.
The following is a reconciliation of Level 3 assets for which significant unobservable inputs were used to determine fair value:
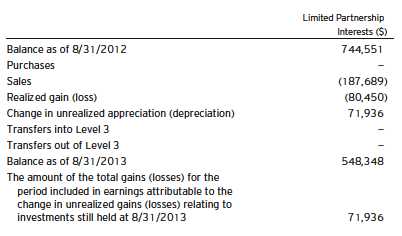
The Fund 23
NOTES TO FINANCIAL STATEMENTS (continued)
(b) Securities transactions and investment income: Securities transactions are recorded on a trade date basis. Realized gains and losses from securities transactions are recorded on the identified cost basis. Dividend income is recognized on the ex-dividend date and interest income, including, where applicable, accretion of discount and amortization of premium on investments, is recognized on the accrual basis.
Pursuant to a securities lending agreement with The Bank of New York Mellon, a subsidiary of BNY Mellon and an affiliate of Dreyfus, the fund may lend securities to qualified institutions. It is the fund’s policy that, at origination, all loans are secured by collateral of at least 102% of the value of U.S. securities loaned and 105% of the value of foreign securities loaned. Collateral equivalent to at least 100% of the market value of securities on loan is maintained at all times. Collateral is either in the form of cash, which can be invested in certain money market mutual funds managed by the Manager or U.S. Government and Agency securities. The fund is entitled to receive all dividends, interest and distributions on securities loaned, in addition to income earned as a result of the lending transaction. Should a borrower fail to return the securities in a timely manner, The Bank of New York Mellon is required to replace the securities for the benefit of the fund or credit the fund with the market value of the unreturned securities and is subrogated to the fund’s rights against the borrower and the collateral. During the period ended August 31, 2013, The Bank of New York Mellon earned $28,009 from lending portfolio securities, pursuant to the securities lending agreement.
(c) Affiliated issuers: Investments in other investment companies advised by Dreyfus are defined as “affiliated” under the Act. Investments in affiliated investment companies during the period ended August 31, 2013 were as follows:
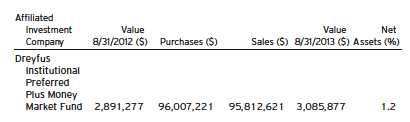
24
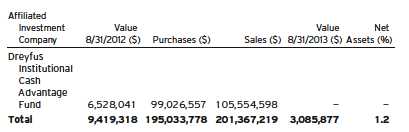
(d) Dividends to shareholders: Dividends are recorded on the ex-dividend date. Dividends from investment income-net and dividends from net realized capital gains, if any, are normally declared and paid annually, but the fund may make distributions on a more frequent basis to comply with the distribution requirements of the Internal Revenue Code of 1986, as amended (the “Code”).To the extent that net realized capital gains can be offset by capital loss carryovers, it is the policy of the fund not to distribute such gains. Income and capital gain distributions are determined in accordance with income tax regulations, which may differ from GAAP.
(e) Federal income taxes: It is the policy of the fund to continue to qualify as a regulated investment company, if such qualification is in the best interests of its shareholders, by complying with the applicable provisions of the Code, and to make distributions of taxable income sufficient to relieve it from substantially all federal income and excise taxes.
As of and during the period ended August 31, 2013, the fund did not have any liabilities for any uncertain tax positions.The fund recognizes interest and penalties, if any, related to uncertain tax positions as income tax expense in the Statement of Operations. During the period, the fund did not incur any interest or penalties.
Each tax year in the four-year period ended August 31, 2013 remains subject to examination by the Internal Revenue Service and state taxing authorities.
At August 31, 2013, the components of accumulated earnings on a tax basis were as follows: undistributed capital gains $5,415,794 and unrealized appreciation $51,068,395. In addition, the fund deferred
The Fund 25
NOTES TO FINANCIAL STATEMENTS (continued)
for tax purposes late year ordinary losses of $1,063,750 to the first day of the following fiscal year.
During the period ended August 31, 2013, as a result of permanent book to tax differences, primarily due to the tax treatment for net operating losses and limited partnerships, the fund increased accumulated undistributed investment income-net by $510,009, decreased accumulated net realized gain (loss) on investments by $58,326 and decreased paid-in capital by $451,683. Net assets and net asset value per share were not affected by this reclassification.
NOTE 2—Bank Lines of Credit:
The fund participates with other Dreyfus-managed funds in a $210 million unsecured credit facility led by Citibank, N.A. and a $300 million unsecured credit facility provided by The Bank of New York Mellon (each, a “Facility”), each to be utilized primarily for temporary or emergency purposes, including the financing of redemptions. Prior to October 10, 2012, the unsecured credit facility with Citibank, N.A. was $225 million. In connection therewith, the fund has agreed to pay its pro rata portion of commitment fees for each Facility. Interest is charged to the fund based on rates determined pursuant to the terms of the respective Facility at the time of borrowing.
The average amount of borrowings outstanding under the Facilities during the period ended August 31, 2013 was approximately $66,600 with a related weighted average annualized interest rate of 1.14%.
NOTE 3—Management Fee and Other Transactions with Affiliates:
(a) Pursuant to a management agreement with the Manager, the management fee is computed at the annual rate of .75% of the value of the fund’s average daily net assets and is payable monthly.
During the period ended August 31, 2013, the Distributor retained $6,916 from commissions earned on sales of the fund’s Class A shares and $1,821 from CDSCs on redemptions of the fund’s Class C shares.
26
(b) Under the Distribution Plan adopted pursuant to Rule 12b-1 under the Act, Class C shares pay the Distributor for distributing its shares at an annual rate of .75% of the value of its average daily net assets. During the period ended August 31, 2013, Class C shares were charged $195,997 pursuant to the Distribution Plan.
(c) Under the Shareholder Services Plan, Class A and Class C shares pay the Distributor at an annual rate of .25% of the value of their average daily net assets for the provision of certain services.The services provided may include personal services relating to shareholder accounts, such as answering shareholder inquiries regarding the fund and providing reports and other information, and services related to the maintenance of shareholder accounts.The Distributor may make payments to Service Agents (securities dealers, financial institutions or other industry professionals) with respect to these services. The Distributor determines the amounts to be paid to Service Agents. During the period ended August 31, 2013, Class A and Class C shares were charged $553,676 and $65,332, respectively, pursuant to the Shareholder Services Plan.
The fund has arrangements with the transfer agent and the custodian whereby the fund may receive earnings credits when positive cash balances are maintained, which are used to offset transfer agency and custody fees. For financial reporting purposes, the fund includes net earnings credits as an expense offset in the Statement of Operations.
The fund compensates DreyfusTransfer, Inc., a wholly-owned subsidiary of the Manager, under a transfer agency agreement for providing transfer agency services for the fund and cash management services related to fund subscriptions and redemptions. During the period ended August 31, 2013, the fund was charged $273,898 for transfer agency services and $12,239 for cash management services. These fees are included in Shareholder servicing costs in the Statement of Operations. Cash management fees were partially offset by earnings credits of $1,562.
The Fund 27
NOTES TO FINANCIAL STATEMENTS (continued)
The fund compensatesThe Bank of NewYork Mellon under a custody agreement for providing custodial services for the fund. During the period ended August 31, 2013, the fund was charged $19,626 pursuant to the custody agreement.
The fund compensates The Bank of New York Mellon under a cash management agreement for performing certain cash management services related to fund subscriptions and redemptions. During the period ended August 31, 2013, the fund was charged $6,885 pursuant to the cash management agreement, which is included in Shareholder servicing costs in the Statement of Operations.These fees were partially offset by earnings credits of $48.
During the period ended August 31, 2013, the fund was charged $8,973 for services performed by the Chief Compliance Officer and his staff.
The components of “Due to The Dreyfus Corporation and affiliates” in the Statement of Assets and Liabilities consist of: management fees $162,673, Distribution Plan fees $16,428, Shareholder Services Plan fees $51,506, custodian fees $8,955, Chief Compliance Officer fees $6,172 and transfer agency fees $84,725.
(d) Each Board member also serves as a Board member of other funds within the Dreyfus complex. Annual retainer fees and attendance fees are allocated to each fund based on net assets.
NOTE 4—Securities Transactions:
The aggregate amount of purchases and sales of investment securities, excluding short-term securities, during the period ended August 31, 2013 amounted to $137,969,418 and $192,954,425, respectively.
At August 31, 2013, the cost of investments for federal income tax purposes was $197,253,616; accordingly, accumulated net unrealized appreciation on investments was $51,068,395, consisting of $55,760,014 gross unrealized appreciation and $4,691,619 gross unrealized depreciation.
28
REPORT OF INDEPENDENT REGISTERED
PUBLIC ACCOUNTING FIRM
Shareholders and Board of Directors
Dreyfus Technology Growth Fund
We have audited the accompanying statement of assets and liabilities, including the statement of investments, of Dreyfus Technology Growth Fund (one of the series comprising Advantage Funds, Inc.) as of August 31, 2013, and the related statement of operations for the year then ended, the statement of changes in net assets for each of the two years in the period then ended, and the financial highlights for each of the five years in the period then ended.These financial statements and financial highlights are the responsibility of the Fund’s management. Our responsibility is to express an opinion on these financial statements and financial highlights based on our audits.
We conducted our audits in accordance with the standards of the Public Company Accounting Oversight Board (United States).Those standards require that we plan and perform the audit to obtain reasonable assurance about whether the financial statements and financial highlights are free of material misstatement.We were not engaged to perform an audit of the Fund’s internal control over financial reporting. Our audits included consideration of internal control over financial reporting as a basis for designing audit procedures that are appropriate in the circumstances, but not for the purpose of expressing an opinion on the effectiveness of the Fund’s internal control over financial reporting. Accordingly, we express no such opinion. An audit also includes examining, on a test basis, evidence supporting the amounts and disclosures in the financial statements and financial highlights, assessing the accounting principles used and significant estimates made by management, and evaluating the overall financial statement presentation. Our procedures included confirmation of securities owned as of August 31, 2013 by correspondence with the custodian and others.We believe that our audits provide a reasonable basis for our opinion.
In our opinion, the financial statements and financial highlights referred to above present fairly, in all material respects, the financial position of Dreyfus Technology Growth Fund at August 31, 2013, the results of its operations for the year then ended, the changes in its net assets for each of the two years in the period then ended, and the financial highlights for each of the five years in the period then ended, in conformity with U.S. generally accepted accounting principles.
New York, New York October 28, 2013
The Fund 29
INFORMATION ABOUT THE RENEWAL OF THE
FUND’S MANAGEMENT AGREEMENT (Unaudited)
At a meeting of the fund’s Board of Directors held on March 4-5, 2013, the Board considered the renewal of the fund’s Management Agreement pursuant to which Dreyfus provides the fund with investment advisory and administrative services (the “Agreement”). The Board members, none of whom are “interested persons” (as defined in the Investment Company Act of 1940, as amended) of the fund, were assisted in their review by independent legal counsel and met with counsel in executive session separate from Dreyfus representatives. In considering the renewal of the Agreement, the Board considered all factors that it believed to be relevant, including those discussed below.The Board did not identify any one factor as dispositive, and each Board member may have attributed different weights to the factors considered.
Analysis of Nature, Extent, and Quality of Services Provided to the Fund. The Board considered information provided to them at the meeting and in previous presentations from Dreyfus representatives regarding the nature, extent, and quality of the services provided to funds in the Dreyfus fund complex. Dreyfus provided the number of open accounts in the fund, the fund’s asset size and the allocation of fund assets among distribution channels. Dreyfus also had previously provided information regarding the diverse intermediary relationships and distribution channels of funds in the Dreyfus fund complex (such as retail direct or intermediary, in which intermediaries typically are paid by the fund and/or Dreyfus) and Dreyfus’ corresponding need for broad, deep, and diverse resources to be able to provide ongoing shareholder services to each intermediary or distribution channel, as applicable to the fund.
The Board also considered research support available to, and portfolio management capabilities of, the fund’s portfolio management personnel and that Dreyfus also provides oversight of day-to-day fund operations, including fund accounting and administration and assistance in meeting legal and regulatory requirements.The Board also considered Dreyfus’ extensive administrative, accounting, and compliance infrastructures.The Board also considered portfolio management’s brokerage policies and practices (including policies and practices regarding soft dollars) and the standards applied in seeking best execution.
30
Comparative Analysis of the Fund’s Performance and Management Fee and Expense Ratio. The Board reviewed reports prepared by Lipper, Inc. (“Lipper”), an independent provider of investment company data, which included information comparing (1) the fund’s performance with the performance of a group of comparable funds (the “Performance Group”) and with a broader group of funds (the “Performance Universe”), all for various periods ended December 31, 2012, and (2) the fund’s actual and contractual management fees and total expenses with those of a group of comparable funds (the “Expense Group”) and with a broader group of funds (the “Expense Universe”), the information for which was derived in part from fund financial statements available to Lipper as of the date of its analysis. Dreyfus previously had furnished the Board with a description of the methodology Lipper used to select the Performance Group and Performance Universe and the Expense Group and Expense Universe.
Dreyfus representatives stated that the usefulness of performance comparisons may be affected by a number of factors, including different investment limitations that may be applicable to the fund and comparison funds. The Board discussed the results of the comparisons and noted that the fund’s total return performance was above the Performance Group and Performance Universe medians, except for the ten-year period when the fund’s performance was below the Performance Group and Performance Universe medians. Dreyfus also provided a comparison of the fund’s calendar year total returns to the returns of the fund’s benchmark index.
The Board also reviewed the range of actual and contractual management fees and total expenses of the Expense Group and Expense Universe funds and discussed the results of the comparisons.The Board noted that the fund’s contractual management fee was below the Expense Group median and the fund’s actual management fee and total expense ratio were below the Expense Group and Expense Universe medians.
The Fund 31
INFORMATION ABOUT THE RENEWAL OF THE FUND’S
MANAGEMENT AGREEMENT (Unaudited) (continued)
Dreyfus representatives reviewed with the Board the management or investment advisory fees (1) paid by funds advised or administered by Dreyfus that are in the same Lipper category as the fund and (2) paid to Dreyfus or the Dreyfus-affiliated primary employer of the fund’s primary portfolio manager(s) for advising any separate accounts and/or other types of client portfolios that are considered to have similar investment strategies and policies as the fund (the “Similar Clients”), and explained the nature of the Similar Clients.They discussed differences in fees paid and the relationship of the fees paid in light of any differences in the services provided and other relevant factors. The Board considered the relevance of the fee information provided for the Similar Clients to evaluate the appropriateness and reasonableness of the fund’s management fee.
Analysis of Profitability and Economies of Scale. Dreyfus representatives reviewed the expenses allocated and profit received by Dreyfus and the resulting profitability percentage for managing the fund and the aggregate profitability percentage to Dreyfus of managing the funds in the Dreyfus fund complex, and the method used to determine the expenses and profit. The Board concluded that the profitability results were not unreasonable, given the services rendered and service levels provided by Dreyfus. The Board also had been provided with information prepared by an independent consulting firm regarding Dreyfus’ approach to allocating costs to, and determining the profitability of, individual funds and the entire Dreyfus fund complex.The consulting firm also had analyzed where any economies of scale might emerge in connection with the management of a fund.
The Board’s counsel stated that the Board should consider the profitability analysis (1) as part of the evaluation of whether the fees under the Agreement bear a reasonable relationship to the mix of services provided by Dreyfus, including the nature, extent and quality of such services, and
32
(2) in light of the relevant circumstances for the fund and the extent to which economies of scale would be realized if the fund grows and whether fee levels reflect these economies of scale for the benefit of fund shareholders. Dreyfus representatives also noted that, as a result of shared and allocated costs among funds in the Dreyfus fund complex, the extent of economies of scale could depend substantially on the level of assets in the complex as a whole, so that increases and decreases in complex-wide assets can affect potential economies of scale in a manner that is disproportionate to, or even in the opposite direction from, changes in the fund’s asset level.The Board also considered potential benefits to Dreyfus from acting as investment adviser and noted the soft dollar arrangements in effect for trading the fund’s investments.
At the conclusion of these discussions, the Board agreed that it had been furnished with sufficient information to make an informed business decision with respect to the renewal of the Agreement. Based on the discussions and considerations as described above, the Board concluded and determined as follows.
The Board concluded that the nature, extent and quality of the services provided by Dreyfus are adequate and appropriate.
The Board generally was satisfied with the fund’s performance.
The Board concluded that the fee paid to Dreyfus was reasonable in light of the considerations described above.
The Board determined that the economies of scale which may accrue to Dreyfus and its affiliates in connection with the management of the fund had been adequately considered by Dreyfus in connection with the fee rate charged to the fund pursuant to the Agreement and that, to the extent in the future it were determined that material economies of scale had not been shared with the fund, the Board would seek to have those economies of scale shared with the fund.
The Fund 33
INFORMATION ABOUT THE RENEWAL OF THE FUND’S
MANAGEMENT AGREEMENT (Unaudited) (continued)
In evaluating the Agreement, the Board considered these conclusions and determinations and also relied on its previous knowledge, gained through meetings and other interactions with Dreyfus and its affiliates, of the fund and the services provided to the fund by Dreyfus.The Board also relied on information received on a routine and regular basis throughout the year relating to the operations of the fund and the investment management and other services provided under the Agreement, including information on the investment performance of the fund in comparison to similar mutual funds and benchmark performance indices; general market outlook as applicable to the fund; and compliance reports. In addition, it should be noted that the Board’s consideration of the contractual fee arrangements for this fund had the benefit of a number of years of reviews of prior or similar agreements during which lengthy discussions took place between the Board and Dreyfus representatives. Certain aspects of the arrangements may receive greater scrutiny in some years than in others, and the Board’s conclusions may be based, in part, on their consideration of the same or similar arrangements in prior years.The Board determined that renewal of the Agreement was in the best interests of the fund and its shareholders.
34
BOARD MEMBERS INFORMATION (Unaudited)

The Fund 35
BOARD MEMBERS INFORMATION (Unaudited) (continued)
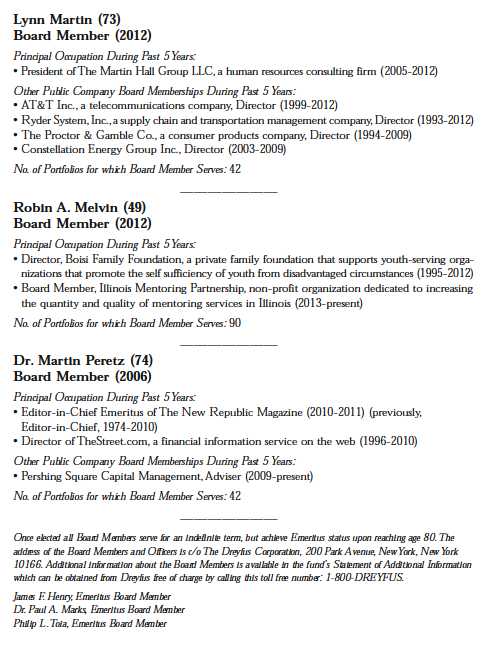
36
OFFICERS OF THE FUND (Unaudited)
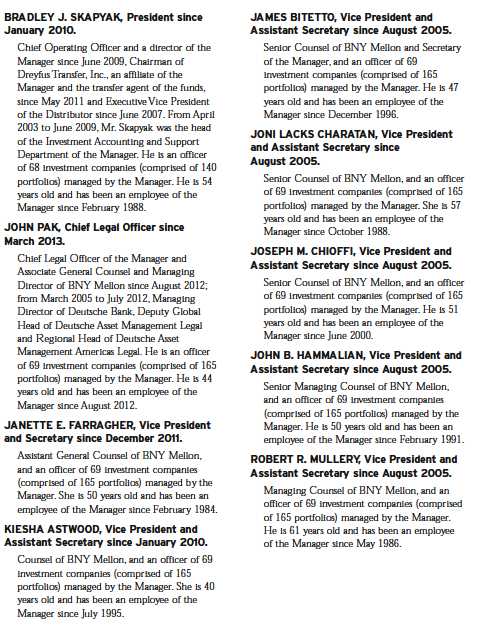
The Fund 37
OFFICERS OF THE FUND (Unaudited) (continued)

38
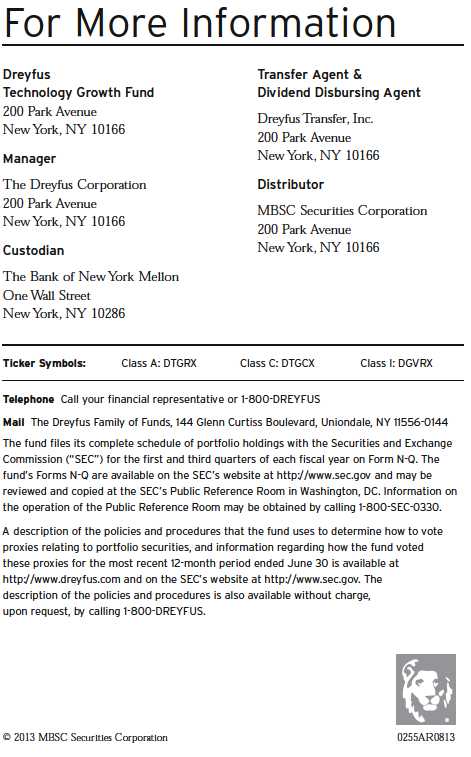
Item 2. Code of Ethics.
The Registrant has adopted a code of ethics that applies to the Registrant's principal executive officer, principal financial officer, principal accounting officer or controller, or persons performing similar functions. There have been no amendments to, or waivers in connection with, the Code of Ethics during the period covered by this Report.
Item 3. Audit Committee Financial Expert.
The Registrant's Board has determined that Mr. David P. Feldman, a member of the Audit Committee of the Board, is an audit committee financial expert as defined by the Securities and Exchange Commission (the "SEC"). Mr. Feldman is "independent" as defined by the SEC for purposes of audit committee financial expert determinations.
Item 4. Principal Accountant Fees and Services.
(a) Audit Fees. The aggregate fees billed for each of the last two fiscal years (the "Reporting Periods") for professional services rendered by the Registrant's principal accountant (the "Auditor") for the audit of the Registrant's annual financial statements or services that are normally provided by the Auditor in connection with the statutory and regulatory filings or engagements for the Reporting Periods, were $226,766 in 2012 and $232,140 in 2013.
(b) Audit-Related Fees. The aggregate fees billed in the Reporting Periods for assurance and related services by the Auditor that are reasonably related to the performance of the audit of the Registrant's financial statements and are not reported under paragraph (a) of this Item 4 were $36,000 in 2012 and $46,601 in 2013. These services consisted of one or more of the following: (i) agreed upon procedures related to compliance with Internal Revenue Code section 817(h), (ii) security counts required by Rule 17f-2 under the Investment Company Act of 1940, as amended, (iii) advisory services as to the accounting or disclosure treatment of Registrant transactions or events and (iv) advisory services to the accounting or disclosure treatment of the actual or potential impact to the Registrant of final or proposed rules, standards or interpretations by the Securities and Exchange Commission, the Financial Accounting Standards Boards or other regulatory or standard-setting bodies.
The aggregate fees billed in the Reporting Periods for non-audit assurance and related services by the Auditor to the Registrant's investment adviser (not including any sub-investment adviser whose role is primarily portfolio management and is subcontracted with or overseen by another investment adviser), and any entity controlling, controlled by or under common control with the investment adviser that provides ongoing services to the Registrant ("Service Affiliates"), that were reasonably related to the performance of the annual audit of the Service Affiliate, which required pre-approval by the Audit Committee were $0 in 2012 and $0 in 2013.
(c) Tax Fees. The aggregate fees billed in the Reporting Periods for professional services rendered by the Auditor for tax compliance, tax advice, and tax planning ("Tax Services") were $31,905 in 2012 and $30,359 in 2013. These services consisted of: (i) review or preparation of U.S. federal, state, local and excise tax returns; (ii) U.S. federal, state and local tax planning, advice and assistance regarding statutory, regulatory or administrative developments; (iii) tax advice regarding tax qualification matters and/or treatment of various financial instruments held or proposed to be acquired or held, and (iv) determination of Passive Foreign Investment Companies. The aggregate fees billed in the Reporting Periods for Tax Services by the Auditor to Service Affiliates, which required pre-approval by the Audit Committee were $0 in 2012 and $0 in 2013.
(d) All Other Fees. The aggregate fees billed in the Reporting Periods for products and services provided by the Auditor, other than the services reported in paragraphs (a) through (c) of this Item, were $6,662 in 2012 and $6,777 in 2013. [These services consisted of a review of the Registrant's anti-money laundering program].
The aggregate fees billed in the Reporting Periods for Non-Audit Services by the Auditor to Service Affiliates, other than the services reported in paragraphs (b) through (c) of this Item, which required pre-approval by the Audit Committee, were $200,000 in 2012 and $0 in 2013.
(e)(1) Audit Committee Pre-Approval Policies and Procedures. The Registrant's Audit Committee has established policies and procedures (the "Policy") for pre-approval (within specified fee limits) of the Auditor's engagements for non-audit services to the Registrant and Service Affiliates without specific case-by-case consideration. The pre-approved services in the Policy can include pre-approved audit services, pre-approved audit-related services, pre-approved tax services and pre-approved all other services. Pre-approval considerations include whether the proposed services are compatible with maintaining the Auditor's independence. Pre-approvals pursuant to the Policy are considered annually.
(e)(2) Note: None of the services described in paragraphs (b) through (d) of this Item 4 were approved by the Audit Committee pursuant to paragraph (c)(7)(i)(C) of Rule 2-01 of Regulation S-X.
(f) None of the hours expended on the principal accountant's engagement to audit the registrant's financial statements for the most recent fiscal year were attributed to work performed by persons other than the principal account's full-time, permanent employees.
Non-Audit Fees. The aggregate non-audit fees billed by the Auditor for services rendered to the Registrant, and rendered to Service Affiliates, for the Reporting Periods were $42,473,667 in 2012 and $51,569,616 in 2013.
Auditor Independence. The Registrant's Audit Committee has considered whether the provision of non-audit services that were rendered to Service Affiliates, which were not pre-approved (not requiring pre-approval), is compatible with maintaining the Auditor's independence.
Item 5. Audit Committee of Listed Registrants.
Not applicable. [CLOSED-END FUNDS ONLY]
Item 6. Investments.
(a) Not applicable.
Item 7. Disclosure of Proxy Voting Policies and Procedures for Closed-End Management Investment Companies.
Not applicable. [CLOSED-END FUNDS ONLY]
Item 8. Portfolio Managers of Closed-End Management Investment Companies.
Not applicable. [CLOSED-END FUNDS ONLY, beginning with reports for periods ended on and after December 31, 2005]
Item 9. Purchases of Equity Securities by Closed-End Management Investment Companies and Affiliated Purchasers.
Not applicable. [CLOSED-END FUNDS ONLY]
Item 10. Submission of Matters to a Vote of Security Holders.
There have been no material changes to the procedures applicable to Item 10.
Item 11. Controls and Procedures.
(a) The Registrant's principal executive and principal financial officers have concluded, based on their evaluation of the Registrant's disclosure controls and procedures as of a date within 90 days of the filing date of this report, that the Registrant's disclosure controls and procedures are reasonably designed to ensure that information required to be disclosed by the Registrant on Form N-CSR is recorded, processed, summarized and reported within the required time periods and that information required to be disclosed by the Registrant in the reports that it files or submits on Form N-CSR is accumulated and communicated to the Registrant's management, including its principal executive and principal financial officers, as appropriate to allow timely decisions regarding required disclosure.
(b) There were no changes to the Registrant's internal control over financial reporting that occurred during the second fiscal quarter of the period covered by this report that have materially affected, or are reasonably likely to materially affect, the Registrant's internal control over financial reporting.
Item 12. Exhibits.
(a)(1) Code of ethics referred to in Item 2.
(a)(2) Certifications of principal executive and principal financial officers as required by Rule 30a-2(a) under the Investment Company Act of 1940.
(a)(3) Not applicable.
(b) Certification of principal executive and principal financial officers as required by Rule 30a-2(b) under the Investment Company Act of 1940.
SIGNATURES
Pursuant to the requirements of the Securities Exchange Act of 1934 and the Investment Company Act of 1940, the Registrant has duly caused this Report to be signed on its behalf by the undersigned, thereunto duly authorized.
Advantage Funds, Inc.
By: /s/ Bradley J. Skapyak |
Bradley J. Skapyak, President |
Date: | October 23, 2014 |
|
Pursuant to the requirements of the Securities Exchange Act of 1934 and the Investment Company Act of 1940, this Report has been signed below by the following persons on behalf of the Registrant and in the capacities and on the dates indicated. |
|
By: /s/Bradley J. Skapyak |
Bradley J. Skapyak, President |
Date: | October 23, 2014 |
|
By: /s/James Windels |
James Windels, Treasurer |
Date: | October 23, 2014 |
|
EXHIBIT INDEX
(a)(1) Code of ethics referred to in Item 2.
(a)(2) Certifications of principal executive and principal financial officers as required by Rule 30a-2(a) under the Investment Company Act of 1940. (EX-99.CERT)
(b) Certification of principal executive and principal financial officers as required by Rule 30a-2(b) under the Investment Company Act of 1940. (EX-99.906CERT)