UNITED STATES
SECURITIES AND EXCHANGE COMMISSION
Washington, D.C. 20549
FORM N-CSR
CERTIFIED SHAREHOLDER REPORT OF REGISTERED MANAGEMENT
INVESTMENT COMPANIES
Investment Company Act file number | 811-07123 |
| |
| Advantage Funds, Inc. | |
| (Exact name of Registrant as specified in charter) | |
| | |
| c/o The Dreyfus Corporation 200 Park Avenue New York, New York 10166 | |
| (Address of principal executive offices) (Zip code) | |
| | |
| Bennett MacDougall, Esq. 200 Park Avenue New York, New York 10166 | |
| (Name and address of agent for service) | |
|
Registrant's telephone number, including area code: | (212) 922-6000 |
| |
Date of fiscal year end: | 8/31 | |
Date of reporting period: | 8/31/2015 | |
| | | | | | | |
FORM N-CSR
Item 1. Reports to Stockholders.

Dreyfus International Value Fund
| | | |

| | ANNUAL REPORT
August 31, 2015 |
| |
Save time. Save paper. View your next shareholder report online as soon as it’s available. Log into www.dreyfus.com and sign up for Dreyfus eCommunications. It’s simple and only takes a few minutes. |
| |
The views expressed in this report reflect those of the portfolio manager only through the end of the period covered and do not necessarily represent the views of Dreyfus or any other person in the Dreyfus organization. Any such views are subject to change at any time based upon market or other conditions and Dreyfus disclaims any responsibility to update such views. These views may not be relied on as investment advice and, because investment decisions for a Dreyfus fund are based on numerous factors, may not be relied on as an indication of trading intent on behalf of any Dreyfus fund. |
| |
Not FDIC-Insured • Not Bank-Guaranteed • May Lose Value |
Contents
T H E F U N D
F O R M O R E I N F O R M AT I O N
Back Cover
| | | | |
| |
Dreyfus International Value Fund
| | The Fund |
A LETTER FROM THE PRESIDENT
Dear Shareholder:
We are pleased to present this annual report for Dreyfus International Value Fund, covering the 12-month period from September 1, 2014, through August 31, 2015. For information about how the fund performed during the reporting period, as well as general market perspectives, we provide a Discussion of Fund Performance on the pages that follow.
Financial markets proved volatile over the reporting period. For much of the year, a recovering U.S. economy enabled stocks to advance, but those gains were more than erased in August when economic concerns in China, falling commodity prices and a stronger U.S. dollar sparked sharp corrections in equity markets throughout the world. The emerging markets were especially hard hit in this environment. U.S. bonds generally fared better, rallying in late 2014 due to robust investor demand before reversing course in the spring as the domestic economy strengthened. Global economic instability in August hurt corporate-backed and inflation-linked bonds, but U.S. government securities held up relatively well.
We expect market uncertainty and volatility to persist over the near term as investors vacillate between hopes that current market turmoil represents a healthy correction and fears that further disappointments could trigger a full-blown bear market. Our investment strategists and portfolio managers are monitoring developments carefully, keeping a close watch on Chinese fiscal and monetary policy, liquidity factors affecting various asset classes, and other developments that could influence investor sentiment. Over the longer term, we remain confident that financial markets are likely to stabilize as the world adjusts to slower Chinese economic growth, abundant energy resources, and the anticipated eventual normalization of monetary policy. In our view, investors will continue to be well served under these circumstances by a long-term perspective and a disciplined investment approach.
Thank you for your continued confidence and support.
Sincerely,

J. Charles Cardona
President
The Dreyfus Corporation
September 15, 2015
2
DISCUSSION OF FUND PERFORMANCE
For the period of September 1, 2014, through August 31, 2015, as provided by D. Kirk Henry, Portfolio Manager
Fund and Market Performance Overview
For the 12-month period ended August 31, 2015, Dreyfus International Value Fund’s Class A shares produced a total return of -9.68%, Class C shares returned -10.31%, and Class I shares returned -9.52%.1 In comparison, the fund’s benchmark, the Morgan Stanley Capital International Europe, Australasia, Far East Index (“MSCI EAFE Index”), produced a total return of -7.47% for the same period.2
Developed equity markets lost ground during the reporting period amid heightened volatility stemming from various global economic developments. The fund produced lower returns than its benchmark, primarily due to stock selection shortfalls in the United Kingdom, France, and Germany.
The Fund’s Investment Approach
The fund seeks long-term capital growth. The fund ordinarily invests most of its assets in securities of foreign companies which Dreyfus considers to be value companies.
The fund’s investment approach is value-oriented and research driven. In selecting stocks, we attempt to identify potential investments through extensive quantitative and fundamental research. Emphasizing individual stock selection over economic or industry trends, the fund focuses on three key factors: value, or how a stock is valued relative to its intrinsic worth based on traditional value measures; business health, or overall efficiency and profitability as measured by return on assets and return on equity; and business momentum, or the presence of a catalyst (such as corporate restructuring, change in management, or spin-off) that will trigger a price increase near term to midterm.
The fund typically sells a stock when it is no longer considered a value company, appears less likely to benefit from the current market and economic environment, shows deteriorating fundamentals or declining momentum, or falls short of our expectations.
International Equities Declined Amid Volatility
International equity markets experienced a series of sharp turns during the reporting period, rising and falling in response to shifting economic trends. The MSCI EAFE Index dropped more than 10% between early September and mid-October 2014. Markets recovered much of that ground in November, then dropped again in December 2014 and early January 2015 amid a steep decline in oil prices. A subsequent recovery through the spring of 2015 was supported by interest rate cuts from several central banks and a short-term agreement with the European Union to extend Greece’s bailout.
At the beginning of June 2015, the MSCI EAFE Index stood at virtually the same level at which it began the reporting period. In late June and early July, share prices fell again after a plunge in the Chinese stock market sparked renewed concerns regarding slowing Chinese economic growth, an important driver of global economic activity. Those concerns were exacerbated when the Chinese central bank devalued the country’s currency in August,
3
DISCUSSION OF FUND PERFORMANCE (continued)
precipitating a further decline in international stocks and energy and commodity prices. Value-oriented stocks significantly underperformed their growth-oriented counterparts in this tumultuous environment.
Stock Selections Hampered Relative Performance
While the fund’s value-oriented tilt detracted from returns relative to the benchmark, disappointing U.K. holdings proved responsible for the greatest share of the fund’s relative underperformance. Banking institutions Standard Chartered and HSBC Holdings lost ground due to their emerging markets exposure, while grocery chain Tesco struggled with declining earnings and margins, and electronics retailer Home Retail Group was hurt by the slow pace of its expansion into Internet sales. In France, utilities Electricite de France and ENGIE (formerly GDF Suez) saw rising costs and increasing debt loads, while energy producer Total fell in sympathy with declining oil prices. A few German holdings also detracted mildly from relative returns, including specialty chemical company LANXESS and machine tool maker Aixtron.
On a more positive note, several holdings in other markets delivered relatively strong returns. In Italy, oil refiner Saras benefited from lower input costs, while aerospace manufacturer Finmeccanica saw shares rise in the wake of the company’s restructuring. In Japan, top performers included East Japan Railway, freight delivery company Nippon Express, Mitsubishi UFJ Financial Group and Nomura Real Estate Holdings. The fund’s performance compared to the benchmark further benefited from our decision to avoid investments in the materials-focused Australian market at a time of declining commodity prices.
Fundamental Outlook Remains Positive
In light of quantitative easing programs implemented by a growing number of central banks around the world and improving economic trends in some areas, many international markets appear poised for growth. If, as we believe likely, the recent market pullback proves temporary, lower equity prices offer attractive entry points. Therefore, the fund has emphasized investments in value-oriented stocks in markets with good recovery prospects. As of the end of the reporting period, we have increased the fund’s exposure to investments in Italy, Singapore, and Spain, and we have trimmed holdings in Germany, China, Brazil, and France.
September 15, 2015
Please note, the position in any security highlighted with italicized typeface was sold during the reporting period.
Equity funds are subject generally to market, market sector, market liquidity, issuer, and investment style risks, among other factors, to varying degrees, all of which are more fully described in the fund’s prospectus.
The fund’s performance will be influenced by political, social, and economic factors affecting investments in foreign companies. Special risks associated with investments in foreign companies include exposure to currency fluctuations, less liquidity, less developed or less efficient trading markets, lack of comprehensive company information, political instability, and differing auditing and legal standards. These risks are enhanced in emerging market countries. Please read the prospectus for further discussion of these risks.
1 Total return includes reinvestment of dividends and any capital gains paid, and does not take into consideration the maximum initial sales charge in the case of Class A shares, or the applicable contingent deferred sales charge imposed on redemptions in the case of Class C shares. Had these charges been reflected, returns would have been lower. Past performance is no guarantee of future results. Share price, yield, and investment return fluctuate such that upon redemption fund shares may be worth more or less than their original cost. The fund’s returns reflect the absorption of certain fund expenses by The Dreyfus Corporation pursuant to an agreement in effect through January 1, 2016. Had these expenses not been absorbed, the fund’s returns would have been lower.
4
2 SOURCE: LIPPER INC. — Reflects reinvestment of net dividends and, where applicable, capital gain distributions. The Morgan Stanley Capital International Europe, Australasia, Far East (MSCI EAFE) Index is an unmanaged index composed of a sample of companies representative of the market structure of European and Pacific Basin countries. The Index does not take into account fees and expenses to which the fund is subject. Investors cannot invest directly in any index.
5
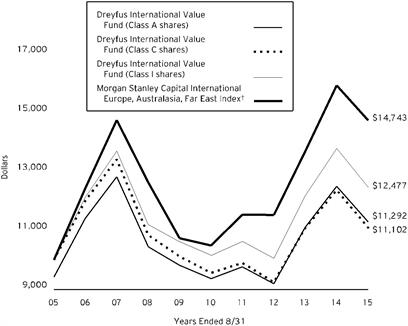
FUND PERFORMANCE
Comparison of change in value of $10,000 investment in Dreyfus International Value Fund Class A shares, Class C shares and Class I shares and the Morgan Stanley Capital International Europe, Australasia, Far East Index
† Source: Lipper Inc.
Past performance is not predictive of future performance.
The above graph compares a $10,000 investment made in each of the Class A, Class C and Class I shares of Dreyfus International Value Fund on 8/31/05 to a $10,000 investment made in the Morgan Stanley Capital International Europe, Australasia, Far East Index (the “Index”) on that date. All dividends and capital gain distributions are reinvested.
The fund’s performance shown in the line graph above takes into account the maximum initial sales charge on Class A shares and all other applicable fees and expenses on all classes. The Index is an unmanaged index composed of a sample of companies representative of the market structure of European and Pacific Basin countries. Unlike a mutual fund, the Index is not subject to charges, fees and other expenses. Investors cannot invest directly in any index. Further information relating to fund performance, including expense reimbursements, if applicable, is contained in the Financial Highlights section of the prospectus and elsewhere in this report.
6
| | | | | |
Average Annual Total Returns as of 8/31/15 | | | |
| 1 Year | 5 Years | 10 Years |
Class A shares | | | |
with maximum sales charge (5.75%) | -14.87% | 2.59% | 1.22% |
without sales charge | -9.68% | 3.81% | 1.83% |
Class C shares | | | |
with applicable redemption charge † | -11.20% | 3.02% | 1.05% |
without redemption | -10.31% | 3.02% | 1.05% |
Class I shares | -9.52% | 4.19% | 2.24% |
Morgan Stanley Capital International Europe, Australasia, Far East Index | -7.47% | 7.05% | 3.96% |
Past performance is not predictive of future performance. The fund’s performance shown in the graph and table does not reflect the deduction of taxes that a shareholder would pay on fund distributions or the redemption of fund shares. In addition to the performance of Class A shares shown with and without a maximum sales charge, the fund’s performance shown in the table takes into account all other applicable fees and expenses on all classes.
† The maximum contingent deferred sales charge for Class C shares is 1% for shares redeemed within one year of the date of purchase.
7
UNDERSTANDING YOUR FUND’S EXPENSES (Unaudited)
As a mutual fund investor, you pay ongoing expenses, such as management fees and other expenses. Using the information below, you can estimate how these expenses affect your investment and compare them with the expenses of other funds. You also may pay one-time transaction expenses, including sales charges (loads) and redemption fees, which are not shown in this section and would have resulted in higher total expenses. For more information, see your fund’s prospectus or talk to your financial adviser.
Review your fund’s expenses
The table below shows the expenses you would have paid on a $1,000 investment in Dreyfus International Value Fund from March 1, 2015 to August 31, 2015. It also shows how much a $1,000 investment would be worth at the close of the period, assuming actual returns and expenses.
| | | | | | | | | | | | |
Expenses and Value of a $1,000 Investment | | |
assuming actual returns for the six months ended August 31, 2015 |
| | | | Class A | | Class C | | Class I | |
Expenses paid per $1,000† | | $ 8.68 | | $ 12.36 | | $ 6.43 | |
Ending value (after expenses) | | $ 933.80 | | $ 930.80 | | $ 934.00 | |
COMPARING YOUR FUND’S EXPENSES
WITH THOSE OF OTHER FUNDS (Unaudited)
Using the SEC’s method to compare expenses
The Securities and Exchange Commission (SEC) has established guidelines to help investors assess fund expenses. Per these guidelines, the table below shows your fund’s expenses based on a $1,000 investment, assuming a hypothetical 5% annualized return. You can use this information to compare the ongoing expenses (but not transaction expenses or total cost) of investing in the fund with those of other funds. All mutual fund shareholder reports will provide this information to help you make this comparison. Please note that you cannot use this information to estimate your actual ending account balance and expenses paid during the period.
| | | | | | | | | | | | | |
Expenses and Value of a $1,000 Investment | | | |
assuming a hypothetical 5% annualized return for the six months ended August 31, 2015 |
| | | | | Class A | | Class C | | Class I | |
Expenses paid per $1,000† | | | $ 9.05 | | $ 12.88 | | $ 6.72 | |
Ending value (after expenses) | | | $ 1,016.23 | | $ 1,012.40 | | $ 1,018.55 | |
† Expenses are equal to the fund’s annualized expense ratio of 1.78% for Class A, 2.54% for Class C and 1.32% for Class I, multiplied by the average account value over the period, multiplied by 184/365 ( to reflect the one-half year period).
8
STATEMENT OF INVESTMENTS
August 31, 2015
| | | | | | | | | |
Common Stocks - 97.9% | | Shares | | Value ($) | |
Australia - 2.5% | | | | | |
Australia & New Zealand Banking Group | | 21,127 | | 419,492 | |
Primary Health Care | | 107,622 | | 315,917 | |
QBE Insurance Group | | 47,697 | | 446,859 | |
| | | | | 1,182,268 | |
Austria - .7% | | | | | |
Erste Group Bank | | 11,246 | a | 333,490 | |
Brazil - .4% | | | | | |
Petroleo Brasileiro, ADR | | 29,858 | a | 174,968 | |
China - 1.6% | | | | | |
CNOOC | | 275,000 | | 345,191 | |
FIH Mobile | | 392,000 | | 173,801 | |
Guangzhou Automobile Group, Cl. H | | 328,000 | | 231,551 | |
| | | | | 750,543 | |
Denmark - .8% | | | | | |
Carlsberg, Cl. B | | 5,300 | | 398,778 | |
France - 8.4% | | | | | |
BNP Paribas | | 10,619 | | 665,679 | |
Casino Guichard Perrachon | | 5,317 | | 335,285 | |
Danone | | 6,355 | | 393,254 | |
Electricite de France | | 27,705 | | 598,773 | |
ENGIE | | 22,537 | | 403,328 | |
Publicis Groupe | | 2,391 | | 169,783 | |
Sanofi | | 8,079 | | 794,447 | |
Total | | 15,141 | | 688,840 | |
| | | | | 4,049,389 | |
Germany - 5.8% | | | | | |
Aixtron | | 41,764 | a | 267,371 | |
Deutsche Bank | | 27,730 | | 818,004 | |
E.ON | | 22,059 | | 250,047 | |
LANXESS | | 8,356 | | 424,766 | |
METRO | | 13,233 | | 386,543 | |
Talanx | | 12,475 | | 375,674 | |
Wacker Chemie | | 3,169 | | 273,546 | |
| | | | | 2,795,951 | |
Hong Kong - 4.7% | | | | | |
CITIC | | 190,000 | | 347,080 | |
COSCO Pacific | | 346,557 | b | 456,111 | |
Esprit Holdings | | 235,074 | | 195,939 | |
9
STATEMENT OF INVESTMENTS (continued)
| | | | | | | | | | | |
Common Stocks - 97.9% (continued) | | Shares | | Value ($) | |
Hong Kong - 4.7% (continued) | | | | | |
Lifestyle International Holdings | | 187,000 | | 288,928 | |
Pacific Basin Shipping | | 440,000 | | 137,911 | |
WH Group | | 641,000 | c | 335,415 | |
Yue Yuen Industrial Holdings | | 131,000 | | 467,179 | |
| | | | | 2,228,563 | |
India - 1.5% | | | | | |
Reliance Industries, GDR | | 15,382 | c | 397,767 | |
State Bank of India, GDR | | 9,139 | | 341,622 | |
| | | | | 739,389 | |
Ireland - .8% | | | | | |
CRH | | 12,190 | | 358,060 | |
Israel - 1.4% | | | | | |
Teva Pharmaceutical Industries, ADR | | 10,700 | | 689,187 | |
Italy - 5.6% | | | | | |
Assicurazioni Generali | | 38,313 | | 698,521 | |
Azimut Holding SpA | | 16,348 | | 358,490 | |
Finmeccanica | | 24,491 | a | 329,823 | |
Saras | | 157,429 | a | 397,885 | |
Telecom Italia | | 444,788 | a | 540,874 | |
UniCredit | | 57,550 | | 376,040 | |
| | | | | 2,701,633 | |
Japan - 21.0% | | | | | |
Aiful Corp | | 98,900 | a | 382,478 | |
Asahi Kasei | | 36,000 | | 286,671 | |
Credit Saison | | 23,700 | | 474,540 | |
Denso | | 8,300 | | 370,204 | |
East Japan Railway | | 5,900 | | 543,522 | |
Ebara | | 107,000 | | 426,179 | |
Fujitsu | | 116,000 | | 573,699 | |
Honda Motor | | 32,300 | | 1,016,233 | |
INPEX | | 33,400 | | 341,171 | |
LIXIL Group | | 29,800 | | 613,758 | |
Mitsubishi UFJ Financial Group | | 99,100 | | 651,462 | |
Nippon Shokubai | | 37,000 | | 568,706 | |
Nippon Telegraph & Telephone | | 15,800 | | 603,472 | |
Nomura Real Estate Holdings | | 26,800 | | 501,364 | |
Ricoh | | 39,700 | | 387,437 | |
Shimamura | | 3,900 | | 359,766 | |
Sumitomo Electric Industries | | 25,600 | | 350,673 | |
10
| | | | | | | | | | | |
Common Stocks - 97.9% (continued) | | Shares | | Value ($) | |
Japan - 21.0% (continued) | | | | | |
Sumitomo Mitsui Financial Group | | 22,600 | | 921,677 | |
Sumitomo Mitsui Trust Holdings | | 66,560 | | 274,131 | |
Yamada Denki | | 108,100 | | 415,496 | |
| | | | | 10,062,639 | |
Netherlands - 5.1% | | | | | |
Aegon | | 54,100 | | 332,196 | |
ING Groep | | 39,371 | | 598,998 | |
Koninklijke Philips | | 44,625 | | 1,145,163 | |
Randstad Holding | | 5,751 | | 362,613 | |
| | | | | 2,438,970 | |
Russia - .3% | | | | | |
Gazprom, ADR | | 33,030 | | 145,662 | |
Singapore - 1.7% | | | | | |
United Overseas Bank | | 40,300 | | 549,481 | |
Wilmar International | | 133,300 | | 269,296 | |
| | | | | 818,777 | |
South Korea - 2.8% | | | | | |
Hyundai Mobis | | 1,622 | | 282,259 | |
KB Financial Group, ADR | | 19,429 | | 581,121 | |
Korea Electric Power | | 5,101 | | 206,125 | |
Samsung Electronics | | 303 | | 278,789 | |
| | | | | 1,348,294 | |
Spain - 2.0% | | | | | |
Banco Popular Espanol | | 71,004 | | 304,057 | |
Banco Santander | | 47,538 | | 289,229 | |
Ebro Foods | | 18,991 | | 382,477 | |
| | | | | 975,763 | |
Sweden - 2.0% | | | | | |
Ericsson, Cl. B | | 51,692 | | 503,525 | |
Getinge, Cl. B | | 21,033 | | 465,634 | |
| | | | | 969,159 | |
Switzerland - 7.4% | | | | | |
ABB | | 30,054 | a | 579,371 | |
Aryzta | | 6,827 | a | 349,619 | |
Credit Suisse Group | | 35,241 | a | 946,584 | |
LafargeHolcim | | 9,315 | a | 589,964 | |
Roche Holding | | 3,899 | | 1,057,711 | |
| | | | | 3,523,249 | |
United Kingdom - 21.4% | | | | | |
Anglo American | | 17,961 | | 201,561 | |
11
STATEMENT OF INVESTMENTS (continued)
| | | | | | | | | | | | | | |
Common Stocks - 97.9% (continued) | | Shares | | Value ($) | |
United Kingdom - 21.4% (continued) | | | | | |
ArcelorMittal | | 36,297 | | 281,021 | |
AstraZeneca | | 8,194 | | 512,031 | |
Aviva | | 54,335 | | 399,450 | |
Barclays | | 109,012 | | 435,627 | |
BHP Billiton | | 18,701 | | 321,052 | |
BP | | 155,451 | | 852,455 | |
esure Group | | 133,500 | | 501,225 | |
GlaxoSmithKline | | 54,585 | | 1,118,228 | |
Home Retail Group | | 183,283 | | 427,034 | |
HSBC Holdings | | 114,018 | | 898,952 | |
Royal Bank of Scotland Group | | 75,724 | a | 387,065 | |
Royal Dutch Shell, Cl. A | | 42,366 | | 1,098,067 | |
Serco Group | | 193,872 | | 335,011 | |
Spire Healthcare Group | | 69,153 | c | 376,665 | |
Standard Chartered | | 75,969 | | 881,542 | |
Tesco | | 245,471 | | 715,231 | |
Unilever | | 13,635 | | 545,597 | |
| | | | | 10,287,814 | |
Total Common Stocks (cost $67,283,823) | | | | 46,972,546 | |
Preferred Stocks - 1.2% | | | | | |
Germany - 1.2% | | | | | |
Volkswagen | | 2,975 | | 565,855 | |
Total Preferred Stocks (cost $740,380) | | | | | |
Other Investments - .9% | | | | | |
Registered Investment Company; | | | | | |
Dreyfus Institutional Preferred Plus Money Market Fund | | 449,157 | d | 449,157 | |
(cost $449,157) | | | | | |
Total Investments (cost $68,473,360) | | 100.0% | | 47,987,558 | |
Cash and Receivables (Net) | | .0% | | 5,923 | |
Net Assets | | 100.0% | | 47,993,481 | |
ADR—American Depository Receipt
GDR—Global Depository Receipt
aNon-income producing security.
bThe valuation of this security has been determined in good faith by management under the direction of the Board of Directors. At August 31, 2015, the value of this security amounted to $456,111, or 1.0% of net assets.
cSecurities exempt from registration pursuant to Rule 144A under the Securities Act of 1933. These securities may be resold in transactions exempt from registration, normally to qualified institutional buyers. At August 31, 2015, these securities were valued at $1,109,847, or 2.3% of net assets.
dInvestment in affiliated money market mutual fund.
12
| | |
Portfolio Summary (Unaudited) † | Value (%) |
Financials | 32.3 |
Industrials | 11.6 |
Health Care | 11.1 |
Consumer Discretionary | 10.7 |
Energy | 9.3 |
Consumer Staples | 8.6 |
Materials | 4.9 |
Information Technology | 3.8 |
Telecommunications | 3.8 |
Utilities | 3.0 |
Money Market Investment | .9 |
| | 100.0 |
†Based on net assets.
See notes to financial statements.
13
STATEMENT OF ASSETS AND LIABILITIES
August 31, 2015
| | | | | | |
| | | Cost | | Value |
Assets ($): | | | |
Investments in securities—See Statement of Investments: | | | | |
Unaffiliated issuers | | 68,024,203 | | 47,538,401 |
Affiliated issuers | | 449,157 | | 449,157 |
Cash | | | | | 76,939 |
Cash denominated in foreign currency | | | 228,457 | | 219,404 |
Dividends and interest receivable | | | | | 291,587 |
Receivable for shares of Common Stock subscribed | | | | | 587 |
Unrealized appreciation on forward foreign
currency exchange contracts—Note 4 | | | | | 2 |
Deferred reorganization costs—Note 5 | | | | | 104,348 |
Prepaid expenses | | | | | 15,261 |
| | | | | 48,695,686 |
Liabilities ($): | | | |
Due to The Dreyfus Corporation and affiliates—Note 3(c) | | | | | 82,073 |
Payable for shares of Common Stock redeemed | | | | | 201,330 |
Payable for investment securities purchased | | | | | 190,123 |
Unrealized depreciation on forward foreign
currency exchange contracts—Note 4 | | | | | 227 |
Accrued expenses | | | | | 228,452 |
| | | | | 702,205 |
Net Assets ($) | | | 47,993,481 |
Composition of Net Assets ($): | | | |
Paid-in capital | | | | | 157,015,773 |
Accumulated undistributed investment income—net | | | | | 817,197 |
Accumulated net realized gain (loss) on investments | | | | | (89,325,080) |
Accumulated net unrealized appreciation (depreciation)
on investments and foreign currency transactions | | | | | (20,514,409) |
Net Assets ($) | | | 47,993,481 |
| | | | |
Net Asset Value Per Share | Class A | Class C | Class I |
Net Assets ($) | 35,592,999 | 5,740,852 | 6,659,630 |
Shares Outstanding | 3,112,797 | 508,077 | 587,535 |
Net Asset Value Per Share ($) | 11.43 | 11.30 | 11.33 |
See notes to financial statements.
14
STATEMENT OF OPERATIONS
Year Ended August 31, 2015
| | | | | | | |
| | | | | | |
| | | | | | |
Investment Income ($): | | | | |
Income: | | | | |
Interest | | | 2,124 | |
Cash dividends (net of $197,511 foreign taxes withheld at source): | | | | |
Unaffliated issuers | | | 2,505,605 | |
Affliated issuers | | | 1,161 | |
Total Income | | | 2,508,890 | |
Expenses: | | | | |
Management fee—Note 3(a) | | | 1,005,944 | |
Shareholder servicing costs—Note 3(c) | | | 210,125 | |
Custodian fees—Note 3(c) | | | 80,479 | |
Professional fees | | | 76,588 | |
Distribution fees—Note 3(b) | | | 47,723 | |
Reorganization expense—Note 5 | | | 45,652 | |
Registration fees | | | 41,928 | |
Prospectus and shareholders’ reports | | | 15,570 | |
Directors' fees and expenses—Note 3(d) | | | 14,853 | |
Loan commitment fees—Note 2 | | | 1,539 | |
Interest expense—Note 2 | | | 60 | |
Miscellaneous | | | 30,288 | |
Total Expenses | | | 1,570,749 | |
Less—reduction in expenses due to undertaking—Note 3(a) | | | (130,678) | |
Less—reduction in fees due to earnings credits—Note 3(c) | | | (35) | |
Net Expenses | | | 1,440,036 | |
Investment Income—Net | | | 1,068,854 | |
Realized and Unrealized Gain (Loss) on Investments—Note 4 ($): | | |
Net realized gain (loss) on investments and foreign currency transactions | | | (7,267,711) | |
Net realized gain (loss) on forward foreign currency exchange contracts | | | 204,601 | |
Net Realized Gain (Loss) | | | (7,063,110) | |
Net unrealized appreciation (depreciation) on investments
and foreign currency transactions | | | (4,024,467) | |
Net unrealized appreciation (depreciation) on
forward foreign currency exchange contracts | | | (62) | |
Net Unrealized Appreciation (Depreciation) | | | (4,024,529) | |
Net Realized and Unrealized Gain (Loss) on Investments | | | (11,087,639) | |
Net (Decrease) in Net Assets Resulting from Operations | | (10,018,785) | |
See notes to financial statements.
15
STATEMENT OF CHANGES IN NET ASSETS
| | | | | | | | | | |
| | | | | | | | | | |
| | | | Year Ended August 31, |
| | | | 2015 | | | | 2014 | |
Operations ($): | | | | | | | | |
Investment income—net | | | 1,068,854 | | | | 1,878,741 | |
Net realized gain (loss) on investments | | (7,063,110) | | | | 9,786,947 | |
Net unrealized appreciation (depreciation)
on investments | | (4,024,529) | | | | 4,341,935 | |
Net Increase (Decrease) in Net Assets
Resulting from Operations | (10,018,785) | | | | 16,007,623 | |
Dividends to Shareholders from ($): | | | | | | | | |
Investment income—net: | | | | | | | | |
Class A | | | (473,489) | | | | (877,464) | |
Class C | | | (15,507) | | | | (70,871) | |
Class I | | | (1,418,077) | | | | (1,320,570) | |
Total Dividends | | | (1,907,073) | | | | (2,268,905) | |
Capital Stock Transactions ($): | | | | | | | | |
Net proceeds from shares sold: | | | | | | | | |
Class A | | | 4,559,236 | | | | 23,744,575 | |
Class C | | | 495,450 | | | | 459,266 | |
Class I | | | 9,570,555 | | | | 24,670,716 | |
Dividends reinvested: | | | | | | | | |
Class A | | | 444,674 | | | | 833,178 | |
Class C | | | 8,879 | | | | 40,444 | |
Class I | | | 1,345,534 | | | | 1,184,689 | |
Cost of shares redeemed: | | | | | | | | |
Class A | | | (12,765,623) | | | | (51,790,279) | |
Class C | | | (1,305,533) | | | | (1,711,841) | |
Class I | | | (83,144,346) | | | | (6,058,957) | |
Increase (Decrease) in Net Assets
from Capital Stock Transactions | (80,791,174) | | | | (8,628,209) | |
Total Increase (Decrease) in Net Assets | (92,717,032) | | | | 5,110,509 | |
Net Assets ($): | | | | | | | | |
Beginning of Period | | | 140,710,513 | | | | 135,600,004 | |
End of Period | | | 47,993,481 | | | | 140,710,513 | |
Undistributed investment income—net | 817,197 | | | | 1,898,353 | |
16
| | | | | | | | | | |
| | | | Year Ended August 31, |
| | | | 2015 | | | | 2014 | |
Capital Share Transactions: | | | | | | | | |
Class A | | | | | | | | |
Shares sold | | | 375,323 | | | | 1,865,718 | |
Shares issued for dividends reinvested | | | 37,653 | | | | 67,464 | |
Shares redeemed | | | (1,054,404) | | | | (4,139,037) | |
Net Increase (Decrease) in Shares Outstanding | (641,428) | | | | (2,205,855) | |
Class C | | | | | | | | |
Shares sold | | | 42,284 | | | | 36,863 | |
Shares issued for dividends reinvested | | | 756 | | | | 3,299 | |
Shares redeemed | | | (111,877) | | | | (135,371) | |
Net Increase (Decrease) in Shares Outstanding | (68,837) | | | | (95,209) | |
Class I | | | | | | | | |
Shares sold | | | 805,180 | | | | 1,948,730 | |
Shares issued for dividends reinvested | | | 115,003 | | | | 96,710 | |
Shares redeemed | | | (7,034,233) | | | | (485,579) | |
Net Increase (Decrease) in Shares Outstanding | (6,114,050) | | | | 1,559,861 | |
See notes to financial statements.
17
FINANCIAL HIGHLIGHTS
The following tables describe the performance for each share class for the fiscal periods indicated. All information (except portfolio turnover rate) reflects financial results for a single fund share. Total return shows how much your investment in the fund would have increased (or decreased) during each period, assuming you had reinvested all dividends and distributions. These figures have been derived from the fund’s financial statements.
| | | | | | | |
| | |
| | Year Ended August 31, |
Class A Shares | | 2015 | 2014 | 2013 | 2012 | 2011 |
Per Share Data ($): | | | | | | |
Net asset value, beginning of period | | 12.80 | 11.54 | 9.76 | 10.69 | 10.37 |
Investment Operations: | | | | | | |
Investment income—neta | | .12 | .15 | .15 | .17 | .20 |
Net realized and unrealized gain (loss) on investments | | (1.35) | 1.30 | 1.85 | (.80) | .26 |
Total from Investment Operations | | (1.23) | 1.45 | 2.00 | (.63) | .46 |
Distributions: | | | | | | |
Dividends from investment income—net | | (.14) | (.19) | (.22) | (.30) | (.14) |
Net asset value, end of period | | 11.43 | 12.80 | 11.54 | 9.76 | 10.69 |
Total Return (%)b | | (9.68) | 12.58 | 20.76 | (5.89) | 4.32 |
Ratios/Supplemental Data (%): | | | | | | |
Ratio of total expenses to average net assets | | 1.80 | 1.59 | 1.61 | 1.63 | 1.54 |
Ratio of net expenses to average net assets | | 1.64 | 1.49 | 1.51 | 1.53 | 1.49 |
Ratio of net investment income to average net assets | | 1.00 | 1.17 | 1.40 | 1.74 | 1.70 |
Portfolio Turnover Rate | | 52.37 | 65.25 | 43.35 | 40.93 | 60.72 |
Net Assets, end of period ($ x 1,000) | | 35,593 | 48,052 | 68,771 | 93,078 | 102,606 |
aBased on average shares outstanding.
b Exclusive of sales charge.
See notes to financial statements.
18
| | | | | | | |
| | | | |
Class C Shares | Year Ended August 31, |
| | 2015 | 2014 | 2013 | 2012 | 2011 |
Per Share Data ($): | | | | | | |
Net asset value, beginning of period | | 12.63 | 11.41 | 9.64 | 10.51 | 10.19 |
Investment Operations: | | | | | | |
Investment income —neta | | .03 | .04 | .06 | .10 | .11 |
Net realized and unrealized gain (loss) on investments | | (1.33) | 1.29 | 1.83 | (.79) | .25 |
Total from Investment Operations | | (1.30) | 1.33 | 1.89 | (.69) | .36 |
Distributions: | | | | | | |
Dividends from investment income—net | | (.03) | (.11) | (.12) | (.18) | (.04) |
Net asset value, end of period | | 11.30 | 12.63 | 11.41 | 9.64 | 10.51 |
Total Return (%)b | | (10.31) | 11.68 | 19.82 | (6.55) | 3.48 |
Ratios/Supplemental Data (%): | | | | | | |
Ratio of total expenses to average net assets | | 2.57 | 2.37 | 2.39 | 2.38 | 2.31 |
Ratio of net expenses to average net assets | | 2.41 | 2.27 | 2.29 | 2.28 | 2.26 |
Ratio of net investment income to average net assets | | .22 | .35 | .60 | .99 | .91 |
Portfolio Turnover Rate | | 52.37 | 65.25 | 43.35 | 40.93 | 60.72 |
Net Assets, end of period ($ x 1,000) | | 5,741 | 7,288 | 7,667 | 7,998 | 11,573 |
aBased on average shares outstanding.
bExclusive of sales charge.
See notes to financial statements.
19
FINANCIAL HIGHLIGHTS (continued)
| | | | | | | |
| | | |
| | | Year Ended August 31, |
Class I Shares | | 2015 | 2014 | 2013 | 2012 | 2011 |
Per Share Data ($): | | | | | | |
Net asset value, beginning of period | | 12.74 | 11.51 | 9.74 | 10.67 | 10.36 |
Investment Operations: | | | | | | |
Investment income—neta | | .15 | .20 | .19 | .23 | .28 |
Net realized and unrealized gain (loss) on investments | | (1.36) | 1.29 | 1.84 | (.81) | .22 |
Total from Investment Operations | | (1.21) | 1.49 | 2.03 | (.58) | .50 |
Distributions: | | | | | | |
Dividends from investment income—net | | (.20) | (.26) | (.26) | (.35) | (.19) |
Net asset value, end of period | | 11.33 | 12.74 | 11.51 | 9.74 | 10.67 |
Total Return (%) | | (9.52) | 13.01 | 21.27 | (5.41) | 4.67 |
Ratios/Supplemental Data (%): | | | | | | |
Ratio of total expenses to average net assets | | 1.25 | 1.20 | 1.21 | 1.19 | 1.15 |
Ratio of net expenses to average net assets | | 1.15 | 1.10 | 1.11 | 1.09 | 1.09 |
Ratio of net investment income to average net assets | | 1.21 | 1.56 | 1.76 | 2.29 | 2.29 |
Portfolio Turnover Rate | | 52.37 | 65.25 | 43.35 | 40.93 | 60.72 |
Net Assets, end of period ($ x 1,000) | | 6,660 | 85,370 | 59,161 | 62,965 | 91,998 |
aBased on average shares outstanding.
See notes to financial statements.
20
NOTES TO FINANCIAL STATEMENTS
NOTE 1—Significant Accounting Policies:
Dreyfus International Value Fund (the “fund”) is a separate diversified series of Advantage Funds, Inc. (the “Company”), which is registered under the Investment Company Act of 1940, as amended (the “Act”), as an open-end management investment company and operates as a series company currently offering eleven series, including the fund. The fund’s investment objective is to seek long-term capital growth. The Dreyfus Corporation (the “Manager” or “Dreyfus”), a wholly-owned subsidiary of The Bank of New York Mellon Corporation (“BNY Mellon”), serves as the fund’s investment adviser.
MBSC Securities Corporation (the “Distributor”), a wholly-owned subsidiary of Dreyfus, is the distributor of the fund’s shares. The fund is authorized to issue 500 million shares of $.001 par value Common Stock. The fund currently offers three classes of shares: Class A (200 million shares authorized), Class C (100 million shares authorized) and Class I (200 million shares authorized). Class A shares generally are subject to a sales charge imposed at the time of purchase. Class C shares are subject to a contingent deferred sales charge (“CDSC”) imposed on Class C shares redeemed within one year of purchase. Class I shares are sold at net asset value per share generally to institutional investors. Other differences between the classes include the services offered to and the expenses borne by each class, the allocation of certain transfer agency costs, and certain voting rights. Income, expenses (other than expenses attributable to a specific class), and realized and unrealized gains or losses on investments are allocated to each class of shares based on its relative net assets.
The Company accounts separately for the assets, liabilities and operations of each series. Expenses directly attributable to each series are charged to that series’ operations; expenses which are applicable to all series are allocated among them on a pro rata basis.
The Financial Accounting Standards Board (“FASB”) Accounting Standards Codification (“ASC”) is the exclusive reference of authoritative U.S. generally accepted accounting principles (“GAAP”) recognized by the FASB to be applied by nongovernmental entities. Rules and interpretive releases of the Securities and Exchange Commission (“SEC”) under authority of federal laws are also sources of authoritative GAAP for SEC registrants. The fund’s financial statements are prepared in accordance with GAAP, which may require the use of management estimates and assumptions. Actual results could differ from those estimates.
The Company enters into contracts that contain a variety of indemnifications. The fund’s maximum exposure under these
21
NOTES TO FINANCIAL STATEMENTS (continued)
arrangements is unknown. The fund does not anticipate recognizing any loss related to these arrangements.
(a) Portfolio valuation: The fair value of a financial instrument is the amount that would be received to sell an asset or paid to transfer a liability in an orderly transaction between market participants at the measurement date (i.e., the exit price). GAAP establishes a fair value hierarchy that prioritizes the inputs of valuation techniques used to measure fair value. This hierarchy gives the highest priority to unadjusted quoted prices in active markets for identical assets or liabilities (Level 1 measurements) and the lowest priority to unobservable inputs (Level 3 measurements).
Additionally, GAAP provides guidance on determining whether the volume and activity in a market has decreased significantly and whether such a decrease in activity results in transactions that are not orderly. GAAP requires enhanced disclosures around valuation inputs and techniques used during annual and interim periods.
Various inputs are used in determining the value of the fund’s investments relating to fair value measurements. These inputs are summarized in the three broad levels listed below:
Level 1—unadjusted quoted prices in active markets for identical investments.
Level 2—other significant observable inputs (including quoted prices for similar investments, interest rates, prepayment speeds, credit risk, etc.).
Level 3—significant unobservable inputs (including the fund’s own assumptions in determining the fair value of investments).
The inputs or methodology used for valuing securities are not necessarily an indication of the risk associated with investing in those securities.
Changes in valuation techniques may result in transfers in or out of an assigned level within the disclosure hierarchy. Valuation techniques used to value the fund’s investments are as follows:
Investments in securities are valued at the last sales price on the securities exchange or national securities market on which such securities are primarily traded. Securities listed on the National Market System for which market quotations are available are valued at the official closing price or, if there is no official closing price that day, at the last sales price. For open short positions, asked prices are used for valuation purposes. Bid price is used when no asked price is available. Registered investment companies that are not traded on an exchange are valued at their net asset value. All of
22
the preceding securities are generally categorized within Level 1 of the fair value hierarchy.
Securities not listed on an exchange or the national securities market, or securities for which there were no transactions, are valued at the average of the most recent bid and asked prices. These securities are generally categorized within Level 2 of the fair value hierarchy.
Fair valuing of securities may be determined with the assistance of a pricing service using calculations based on indices of domestic securities and other appropriate indicators, such as prices of relevant ADRs and financial futures. Utilizing these techniques may result in transfers between Level 1 and Level 2 of the fair value hierarchy.
When market quotations or official closing prices are not readily available, or are determined not to reflect accurately fair value, such as when the value of a security has been significantly affected by events after the close of the exchange or market on which the security is principally traded (for example, a foreign exchange or market), but before the fund calculates its net asset value, the fund may value these investments at fair value as determined in accordance with the procedures approved by the Company's Board of Directors (the “Board”). Certain factors may be considered when fair valuing investments such as: fundamental analytical data, the nature and duration of restrictions on disposition, an evaluation of the forces that influence the market in which the securities are purchased and sold, and public trading in similar securities of the issuer or comparable issuers. These securities are either categorized within Level 2 or 3 of the fair value hierarchy depending on the relevant inputs used.
For restricted securities where observable inputs are limited, assumptions about market activity and risk are used and are generally categorized within Level 3 of the fair value hierarchy.
Investments denominated in foreign currencies are translated to U.S. dollars at the prevailing rates of exchange.
Forward foreign currency exchange contracts (“forward contracts”) are valued at the forward rate and are generally categorized within Level 2 of the fair value hierarchy.
The following is a summary of the inputs used as of August 31, 2015 in valuing the fund’s investments:
23
NOTES TO FINANCIAL STATEMENTS (continued)
| | | | | | |
| | Level 1 - Unadjusted Quoted Prices | Level 2 - Other Significant Observable Inputs | | Level 3 -Significant Unobservable Inputs | Total |
Assets ($) | | | | | |
Investments in Securities: | | | | | |
Equity Securities - Foreign Common Stocks† | 1,590,939 | 45,381,607 | †† | - | 46,972,546 |
Equity Securities - Foreign Preferred Stocks† | - | 565,855 | †† | - | 565,855 |
Mutual Funds | 449,157 | - | | - | 449,157 |
Other Financial Instruments: | | | | | |
Forward Foreign Currency Exchange Contracts††† | - | 2 | | - | 2 |
Liabilities ($) | | | | | |
Other Financial Instruments: | | | | | |
Forward Foreign Currency Exchange Contracts††† | - | (227) | | - | (227) |
† See Statement of Investments for additional detailed categorizations.
†† Securities classified within Level 2 at period end as the values were determined pursuant to the fund's fair valuation procedures. See note above for additional information.
††† Amount shown represents unrealized appreciation (depreciation) at period end.
At August 31, 2014, no exchange traded foreign equity securities were classified within Level 2 of the fair value hierarchy pursuant to the fund’s fair valuation procedures.
(b) Foreign currency transactions: The fund does not isolate that portion of the results of operations resulting from changes in foreign exchange rates on investments from the fluctuations arising from changes in the market prices of securities held. Such fluctuations are included with the net realized and unrealized gain or loss on investments.
Net realized foreign exchange gains or losses arise from sales of foreign currencies, currency gains or losses realized on securities transactions between trade and settlement date, and the difference between the amounts of dividends, interest and foreign withholding taxes recorded on the fund’s books and the U.S. dollar equivalent of the amounts actually received or paid. Net unrealized foreign exchange gains and losses arise from changes in the value of assets and liabilities other than investments resulting from changes in exchange rates. Foreign currency gains and losses on foreign currency transactions are also included with net realized and unrealized gain or loss on investments.
24
(c) Securities transactions and investment income: Securities transactions are recorded on a trade date basis. Realized gains and losses from securities transactions are recorded on the identified cost basis. Dividend income is recognized on the ex-dividend date and interest income, including, where applicable, accretion of discount and amortization of premium on investments, is recognized on the accrual basis.
(d) Affiliated issuers: Investments in other investment companies advised by Dreyfus are defined as “affiliated” under the Act. Investments in affiliated investment companies during the period ended August 31, 2015 were as follows:
| | | | | | |
Affiliated Investment Company | Value 8/31/2014 ($) | Purchases ($) | Sales ($) | Value 8/31/2015 ($) | Net Assets (%) |
Dreyfus Institutional Preferred Plus Money Market Fund | 4,790,000 | 26,957,803 | 31,298,646 | 449,157 | .9 |
(e) Risk: Investing in foreign markets may involve special risks and considerations not typically associated with investing in the U.S. These risks include revaluation of currencies, high rates of inflation, repatriation restrictions on income and capital, and adverse political and economic developments. Moreover, securities issued in these markets may be less liquid, subject to government ownership controls and delayed settlements, and their prices may be more volatile than those of comparable securities in the U.S.
(f) Dividends to shareholders: Dividends are recorded on the ex-dividend date. Dividends from investment income-net and dividends from net realized capital gains, if any, are normally declared and paid annually, but the fund may make distributions on a more frequent basis to comply with the distribution requirements of the Internal Revenue Code of 1986, as amended (the “Code”). To the extent that net realized capital gains can be offset by capital loss carryovers, it is the policy of the fund not to distribute such gains. Income and capital gain distributions are determined in accordance with income tax regulations, which may differ from GAAP.
(g) Federal income taxes: It is the policy of the fund to continue to qualify as a regulated investment company, if such qualification is in the best interests of its shareholders, by complying with the applicable provisions of the Code, and to make distributions of taxable income sufficient to relieve it from substantially all federal income and excise taxes.
25
NOTES TO FINANCIAL STATEMENTS (continued)
As of and during the period ended August 31, 2015, the fund did not have any liabilities for any uncertain tax positions. The fund recognizes interest and penalties, if any, related to uncertain tax positions as income tax expense in the Statement of Operations. During the period ended August 31, 2015, the fund did not incur any interest or penalties.
Each tax year in the four-year period ended August 31, 2015 remains subject to examination by the Internal Revenue Service and state taxing authorities.
At August 31, 2015, the components of accumulated earnings on a tax basis were as follows: undistributed ordinary income $817,197, accumulated capital losses $88,976,827 and unrealized depreciation $20,862,662.
Under the Regulated Investment Company Modernization Act of 2010 (the “2010 Act”), the fund is permitted to carry forward capital losses incurred in taxable years beginning after December 22, 2010 (“post-enactment losses”) for an unlimited period. Furthermore, post-enactment capital loss carryovers retain their character as either short-term or long-term capital losses rather than short-term as they were under previous statute. The 2010 Act requires post-enactment losses to be utilized before the utilization of losses incurred in taxable years prior to the effective date of the 2010 Act (“pre-enactment losses”). As a result of this ordering rule, pre-enactment losses may be more likely to expire unused.
The accumulated capital loss carryover is available for federal income tax purposes to be applied against future net realized capital gains, if any, realized subsequent to August 31, 2015. If not applied, $24,770,979 of the carryover expires in fiscal year 2017 and $41,505,182 expires in fiscal year 2018. The fund has $238,747 of post-enactment short-term capital losses and $22,461,919 of post-enactment long-term capital losses which can be carried forward for an unlimited period.
The tax character of distributions paid to shareholders during the fiscal periods ended August 31, 2015 and August 31, 2014 were as follows: ordinary income $1,907,073 and $2,268,905.
During the period ended August 31, 2015, as a result of permanent book to tax differences, primarily due to the tax treatment for foreign exchange gains and losses and passive foreign investment companies, the fund decreased accumulated undistributed investment income-net by $242,937 and increased accumulated net realized gain (loss) on investments by the same amount. Net assets and net asset value per share were not affected by this reclassification.
26
NOTE 2—Bank Lines of Credit:
The fund participates with other Dreyfus-managed funds in a $430 million unsecured credit facility led by Citibank, N.A. and a $300 million unsecured credit facility provided by The Bank of New York Mellon, a subsidiary of BNY Mellon and an affiliate of Dreyfus (each, a “Facility”), each to be utilized primarily for temporary or emergency purposes, including the financing of redemptions. Prior to October 8, 2014, the unsecured credit facility with Citibank, N.A. was $265 million. In connection therewith, the fund has agreed to pay its pro rata portion of commitment fees for each Facility. Interest is charged to the fund based on rates determined pursuant to the terms of the respective Facility at the time of borrowing.
The average amount of borrowings outstanding under the Facilities during the period ended August 31, 2015, was approximately $5,500 with a related weighted average annualized interest rate of 1.09%.
NOTE 3—Management Fee and Other Transactions with Affiliates:
(a) Pursuant to a management agreement with Dreyfus, the management fee is computed at the annual rate of 1% of the value of the fund’s average daily net assets and is payable monthly. Dreyfus has agreed, from September 1, 2014 through January 1, 2016, to waive receipt of a portion of the fund’s management fee in the amount of .10% of the value of the fund’s average daily net assets. Dreyfus has also contractually agreed, from March 20, 2015 through January 1, 2016, to waive receipt of its fees and/or assume the direct expenses of the fund, so that the expenses of none of its classes (excluding Rule 12b-1 Distribution Plan fees, Shareholder Services plan fees, taxes, interest expense, brokerage commissions, commitment fees on borrowings and extraordinary expenses) exceed 1.37% of the value of the fund’s average daily net assets. The reduction in expenses, pursuant to the undertakings, amounted to $130,678 during the period ended August 31, 2015.
During the period ended August 31, 2015, the Distributor retained $624 from commissions earned on sales of the fund's Class A shares and $18 from CDSCs on redemptions of the fund's Class C shares.
(b) Under the Distribution Plan adopted pursuant to Rule 12b-1 under the Act, Class C shares pay the Distributor for distributing its shares at an annual rate of .75% of the value of its average daily net assets. During the period ended August 31, 2015, Class C shares were charged $47,723 pursuant to the Distribution Plan.
27
NOTES TO FINANCIAL STATEMENTS (continued)
(c) Under the Shareholder Services Plan, Class A and Class C shares pay the Distributor at an annual rate of .25% of the value of their average daily net assets for the provision of certain services. The services provided may include personal services relating to shareholder accounts, such as answering shareholder inquiries regarding the fund and providing reports and other information, and services related to the maintenance of shareholder accounts. The Distributor may make payments to Service Agents (securities dealers, financial institutions or other industry professionals) with respect to these services. The Distributor determines the amounts to be paid to Service Agents. During the period ended August 31, 2015, Class A and Class C shares were charged $103,788 and $15,908, respectively, pursuant to the Shareholder Services Plan.
The fund has arrangements with the transfer agent and the custodian whereby the fund may receive earnings credits when positive cash balances are maintained, which are used to offset transfer agency and custody fees. For financial reporting purposes, the fund includes net earnings credits as an expense offset in the Statement of Operations.
The fund compensates Dreyfus Transfer, Inc., a wholly-owned subsidiary of Dreyfus, under a transfer agency agreement for providing transfer agency and cash management services for the fund. The majority of transfer agency fees are comprised of amounts paid on a per account basis, while cash management fees are related to fund subscriptions and redemptions. During the period ended August 31, 2015, the fund was charged $16,318 for transfer agency services and $878 for cash management services. These fees are included in Shareholder servicing costs in the Statement of Operations. Cash management fees were partially offset by earnings credits of $35.
The fund compensates The Bank of New York Mellon under a custody agreement for providing custodial services for the fund. These fees are determined based on net assets, geographic region and transaction activity. During the period ended August 31, 2015, the fund was charged $80,479 pursuant to the custody agreement.
During the period ended August 31, 2015, the fund was charged $10,965 for services performed by the Chief Compliance Officer and his staff.
The components of “Due to The Dreyfus Corporation and affiliates” in the Statement of Assets and Liabilities consist of: management fees $43,127, Distribution Plan fees $3,888, Shareholder Services Plan fees $9,301, custodian fees $46,722, Chief Compliance Officer fees $1,737 and transfer agency fees $4,249, which are offset against an expense reimbursement currently in effect in the amount of $26,951.
28
(d) Each Board member also serves as a Board member of other funds within the Dreyfus complex. Annual retainer fees and attendance fees are allocated to each fund based on net assets.
NOTE 4—Securities Transactions:
The aggregate amount of purchases and sales of investment securities, excluding short-term securities and forward contracts, during the period ended August 31, 2015, amounted to $51,709,446 and $129,372,695, respectively.
Derivatives: A derivative is a financial instrument whose performance is derived from the performance of another asset. The fund enters into International Swaps and Derivatives Association, Inc. Master Agreements or similar agreements (collectively, “Master Agreements”) with its over-the counter ("OTC") derivative contract counterparties in order to, among other things, reduce its credit risk to counterparties. Master Agreements include provisions for general obligations, representations, collateral and events of default or termination. Under a Master Agreement, the fund may offset with the counterparty certain derivative financial instrument’s payables and/or receivables with collateral held and/or posted and create one single net payment in the event of default or termination.
Each type of derivative instrument that was held by the fund during the period ended August 31, 2015 is discussed below.
Forward Foreign Currency Exchange Contracts: The fund enters into forward contracts in order to hedge its exposure to changes in foreign currency exchange rates on its foreign portfolio holdings, to settle foreign currency transactions or as a part of its investment strategy. When executing forward contracts, the fund is obligated to buy or sell a foreign currency at a specified rate on a certain date in the future. With respect to sales of forward contracts, the fund incurs a loss if the value of the contract increases between the date the forward contract is opened and the date the forward contract is closed. The fund realizes a gain if the value of the contract decreases between those dates. With respect to purchases of forward contracts, the fund incurs a loss if the value of the contract decreases between the date the forward contract is opened and the date the forward contract is closed. The fund realizes a gain if the value of the contract increases between those dates. Any realized or unrealized gains or losses which occurred during the period are reflected in the Statement of Operations. The fund is exposed to foreign currency risk as a result of changes in value of underlying financial instruments. The fund is also exposed to credit risk associated with counterparty nonperformance on these forward contracts, which is generally limited to the unrealized gain
29
NOTES TO FINANCIAL STATEMENTS (continued)
on each open contract. This risk is mitigated by Master Agreements between the fund and the counterparty and the posting of collateral, if any, by the counterparty to the fund to cover the fund’s exposure to the counterparty. The following summarizes open forward contracts at August 31, 2015:
| | | | | |
Forward Foreign Currency Exchange Contracts | Foreign Currency Amounts | Cost ($) | Value ($) | Unrealized Appreciation (Depreciation) ($) |
Purchases: | | | | |
Barclays Bank | | | | |
Euro, | | | | |
Expiring | | | | |
9/1/2015 | 151,272 | 169,976 | 169,749 | (227) |
Morgan Stanley Capital Services | | | | |
Hong Kong Dollar, | | | | |
Expiring | | | | |
9/1/2015 | 157,904 | 20,373 | 20,375 | 2 |
| | | | | |
Gross Unrealized Appreciation | | | | 2 |
| | | | | |
Gross Unrealized Depreciation | | | | (227) |
The provisions of ASC Topic 210 “Disclosures about Offsetting Assets and Liabilities” require disclosure on the offsetting of financial assets and liabilities. These disclosures are required for certain investments, including derivative financial instruments subject to Master Agreements which are eligible for offsetting in the Statement of Assets and Liabilities and require the fund to disclose both gross and net information with respect to such investments. For financial reporting purposes, the fund does not offset derivative assets and derivative liabilities that are subject to Master Agreements in the Statement of Assets and Liabilities.
At August 31, 2015, derivative assets and liabilities (by type) on a gross basis are as follows:
30
| | | | | | |
Derivative Financial Instruments: | | Assets ($) | | Liabilities ($) | |
Forward contracts | | 2 | | (227) | |
Total gross amount of derivative | | | | | |
assets and liabilities in the | | | | | |
Statement of Assets and Liabilities | | 2 | | (227) | |
Derivatives not subject to | | | | | |
Master Agreements | | - | | - | |
Total gross amount of assets | | | | | |
and liabilities subject to | | | | | |
Master Agreements | | 2 | | (227) | |
The following tables present derivative assets and liabilities net of amounts available for offsetting under Master Agreements and net of related collateral received or pledged, if any, as of August 31, 2015:
| | | | | | | |
| | | | Financial | | | |
| | | | Instruments | | | |
| | | | and Derivatives | | | |
| | Gross Amount of | | Available | Collateral | | Net Amount of |
Counterparty | Assets ($) | 1 | for Offset ($) | Received ($) | | Assets ($) |
Morgan Stanley
Capital Services | 2 | | - | - | | 2 |
| | | | | | | |
| | | | Financial | | | |
| | | | Instruments | | | |
| | | | and Derivatives | | | |
| | Gross Amount of | | Available | Collateral | | Net Amount of |
Counterparty | Liabilities ($) | 1 | for Offset ($) | Pledged ($) | | Liabilities ($) |
Barclays Bank | (227) | | - | - | | (227) |
| | | | | | | |
1 Absent a default event or early termination, OTC derivative assets and liabilities are
presented at gross amounts and are not offset in the Statement of Assets and Liabilities. |
The following summarizes the average market value of derivatives outstanding during the period ended August 31, 2015:
| | | | | | |
| | | | | Average Market Value ($) |
Forward contracts | | | | 453,558 |
At August 31, 2015, the cost of investments for federal income tax purposes was $68,821,613; accordingly, accumulated net unrealized depreciation on investments was $20,834,055, consisting of $753,192 gross unrealized appreciation and $21,587,247 gross unrealized depreciation.
NOTE 5—Plan of Reorganization:
At a meeting held on July 27, 2015, the Board of Trustees of Dreyfus Stock Funds, on behalf of Dreyfus International Equity Fund (the “Acquiring Fund”) and at a special meeting held on July 27, 2015, the
31
NOTES TO FINANCIAL STATEMENTS (continued)
Board of Directors of Advantage Funds, Inc. (the “Company”), on behalf of Dreyfus International Value Fund (the “fund”), each approved an Agreement and Plan of Reorganization.
The merger is subject to the approval of the fund shareholders on or about November 19, 2015. If approved, the merger is anticipated to occur on or about January 22, 2016. The merger provides for the fund to transfer all of its assets, subject to its liabilities, to the Acquiring Fund, in exchange for a number of Class A, Class C and Class I shares of the Acquiring Fund equal in value to the assets less liabilities of the fund (the “Exchange”). The Acquiring Fund’s Class A, Class C and Class I shares will then be distributed to the fund’s shareholders on a pro rata basis in liquidation of the fund and subsequent termination as a series of the Company. Shareholders of the fund will receive Class A, Class C and Class I shares of the Acquiring Fund in the Exchange. The fund was closed to new investors on September 2, 2015. Reorganization costs estimated at $150,000 will be paid by the fund and are being amortized from July 27, 2015 through November 19, 2015. During the period ended August 31, 2015, the fund amortized $45,652 of reorganization costs.
32
REPORT OF INDEPENDENT REGISTERED
PUBLIC ACCOUNTING FIRM
Shareholders and Board of Directors
Dreyfus International Value Fund
We have audited the accompanying statement of assets and liabilities, including the statement of investments, of Dreyfus International Value Fund (one of the series comprising Advantage Funds, Inc.) as of August 31, 2015, and the related statement of operations for the year then ended, the statement of changes in net assets for each of the two years in the period then ended, and the financial highlights for each of the five years in the period then ended. These financial statements and financial highlights are the responsibility of the Fund’s management. Our responsibility is to express an opinion on these financial statements and financial highlights based on our audits.
We conducted our audits in accordance with the standards of the Public Company Accounting Oversight Board (United States). Those standards require that we plan and perform the audit to obtain reasonable assurance about whether the financial statements and financial highlights are free of material misstatement. We were not engaged to perform an audit of the Fund’s internal control over financial reporting. Our audits included consideration of internal control over financial reporting as a basis for designing audit procedures that are appropriate in the circumstances, but not for the purpose of expressing an opinion on the effectiveness of the Fund’s internal control over financial reporting. Accordingly, we express no such opinion. An audit also includes examining, on a test basis, evidence supporting the amounts and disclosures in the financial statements and financial highlights, assessing the accounting principles used and significant estimates made by management, and evaluating the overall financial statement presentation. Our procedures included confirmation of securities owned as of August 31, 2015 by correspondence with the custodian and others. We believe that our audits provide a reasonable basis for our opinion.
In our opinion, the financial statements and financial highlights referred to above present fairly, in all material respects, the financial position of Dreyfus International Value Fund at August 31, 2015, the results of its operations for the year then ended, the changes in its net assets for each of the two years in the period then ended, and the financial highlights for each of the five years in the period then ended, in conformity with U.S. generally accepted accounting principles.

New York, New York
October 28, 2015
33
IMPORTANT TAX INFORMATION (Unaudited)
In accordance with federal tax law, the fund elects to provide each shareholder with their portion of the fund’s foreign taxes paid and the income sourced from foreign countries.
Accordingly, the fund hereby reports the following information regarding its fiscal year ended August 31, 2015:
- the total amount of taxes paid to foreign countries was $197,511.
- the total amount of income sourced from foreign countries was $2,684,649.
Where required by federal tax law rules, shareholders will receive notification of their proportionate share of foreign taxes paid and foreign sourced income for the 2015 calendar year with Form 1099-DIV which will be mailed in early 2016. Also, certain dividends paid by the fund may be subject to a maximum tax rate of 15%, as provided for by the Jobs and Growth Tax Relief Reconciliation Act of 2003. Of the distributions paid during the fiscal year, $1,907,073 represents the maximum amount that may be considered qualified dividend income.
34
INFORMATION ABOUT THE RENEWAL OF THE FUND'S MANAGEMENT AGREEMENT (Unaudited)
At a meeting of the fund’s Board of Directors held on March 11-12, 2015, the Board considered the renewal of the fund’s Management Agreement pursuant to which Dreyfus provides the fund with investment advisory and administrative services (the “Agreement”). The Board members, none of whom are “interested persons” (as defined in the Investment Company Act of 1940, as amended) of the fund, were assisted in their review by independent legal counsel and met with counsel in executive session separate from Dreyfus representatives. In considering the renewal of the Agreement, the Board considered all factors that it believed to be relevant, including those discussed below. The Board did not identify any one factor as dispositive, and each Board member may have attributed different weights to the factors considered.
Analysis of Nature, Extent, and Quality of Services Provided to the Fund. The Board considered information provided to them at the meeting and in previous presentations from Dreyfus representatives regarding the nature, extent, and quality of the services provided to funds in the Dreyfus fund complex. Dreyfus provided the number of open accounts in the fund, the fund’s asset size and the allocation of fund assets among distribution channels. Dreyfus also had previously provided information regarding the diverse intermediary relationships and distribution channels of funds in the Dreyfus fund complex (such as retail direct or intermediary, in which intermediaries typically are paid by the fund and/or Dreyfus) and Dreyfus’ corresponding need for broad, deep, and diverse resources to be able to provide ongoing shareholder services to each intermediary or distribution channel, as applicable to the fund.
The Board also considered research support available to, and portfolio management capabilities of, the fund’s portfolio management personnel and that Dreyfus also provides oversight of day-to-day fund operations, including fund accounting and administration and assistance in meeting legal and regulatory requirements. The Board also considered Dreyfus’ extensive administrative, accounting and compliance infrastructures. The Board also considered portfolio management’s brokerage policies and practices (including policies and practices regarding soft dollars) and the standards applied in seeking best execution.
Comparative Analysis of the Fund’s Performance and Management Fee and Expense Ratio. The Board reviewed reports prepared by Lipper, Inc. (“Lipper”), an independent provider of investment company data, which included information comparing (1) the fund’s performance with the performance of a group of comparable funds (the “Performance Group”) and with a broader group of funds (the “Performance Universe”), all for various periods ended December 31, 2014, and (2) the fund’s actual and contractual management fees and total expenses with those of a group of comparable funds (the “Expense Group”) and with a broader group of funds (the “Expense Universe”), the information for which was derived in part from fund financial statements available to Lipper as of the date of its analysis. Dreyfus previously had furnished the Board with a description of the methodology Lipper used to select the
35
INFORMATION ABOUT THE RENEWAL OF THE FUND'S MANAGEMENT AGREEMENT (Unaudited) (continued)
Performance Group and Performance Universe and the Expense Group and Expense Universe.
Dreyfus representatives stated that the usefulness of performance comparisons may be affected by a number of factors, including different investment limitations that may be applicable to the fund and comparison funds. The Board discussed with representatives of Dreyfus and its affiliates the results of the comparisons and noted that the fund’s total return performance was below the Performance Group and Performance Universe medians for all periods, ranking in the fourth quartile of the Performance Group and Performance Universe for all periods (ranking lowest in the Performance Group in the five- and ten- year periods). Dreyfus also provided a comparison of the fund’s calendar year total returns to the returns of the fund’s benchmark index. The representatives of Dreyfus and its affiliates discussed reasons for the fund’s relative underperformance, including specific securities selection issues affecting performance in the most recent one-year period. They also noted the addition of a new lead portfolio manager in 2013.
The Board also reviewed the range of actual and contractual management fees and total expenses of the Expense Group and Expense Universe funds and discussed the results of the comparisons. The Board noted that the fund’s contractual management fee was above the Expense Group median and the fund’s actual management fee and total expenses were above the Expense Group and Expense Universe medians.
Dreyfus representatives noted that Dreyfus has agreed to waive receipt of a portion of the fund’s management fee in the amount of .10% of the value of the fund’s average daily net assets until September 30, 2015.
Dreyfus representatives reviewed with the Board the management or investment advisory fees (1) paid by funds advised or administered by Dreyfus that are in the same Lipper category as the fund and (2) paid to Dreyfus or the Dreyfus-affiliated primary employer of the fund’s primary portfolio manager(s) for advising any separate accounts and/or other types of client portfolios that are considered to have similar investment strategies and policies as the fund (the “Similar Clients”), and explained the nature of the Similar Clients. They discussed differences in fees paid and the relationship of the fees paid in light of any differences in the services provided and other relevant factors. The Board considered the relevance of the fee information provided for the Similar Clients to evaluate the appropriateness and reasonableness of the fund’s management fee.
Analysis of Profitability and Economies of Scale. Dreyfus representatives reviewed the expenses allocated and profit received by Dreyfus and its affiliates and the resulting profitability percentage for managing the fund and the aggregate profitability percentage to Dreyfus and its affiliates for managing the funds in the Dreyfus fund complex, and the method used to determine the expenses and profit. The Board concluded that the profitability results were not unreasonable, given the services rendered and service levels provided by Dreyfus. The Board also noted the fee waiver arrangement and its effect on the profitability of Dreyfus and its affiliates. The Board also had been provided with
36
information prepared by an independent consulting firm regarding Dreyfus’ approach to allocating costs to, and determining the profitability of, individual funds and the entire Dreyfus fund complex. The consulting firm also had analyzed where any economies of scale might emerge in connection with the management of a fund.
The Board considered, on the advice of its counsel, the profitability analysis (1) as part of its evaluation of whether the fees under the Agreement bear a reasonable relationship to the mix of services provided by Dreyfus, including the nature, extent and quality of such services, and (2) in light of the relevant circumstances for the fund and the extent to which economies of scale would be realized if the fund grows and whether fee levels reflect these economies of scale for the benefit of fund shareholders. Dreyfus representatives noted that a discussion of economies of scale is predicated on a fund having achieved a substantial size with increasing assets and that, if a fund’s assets had been stable or decreasing, the possibility that Dreyfus may have realized any economies of scale would be less. Dreyfus representatives also noted that, as a result of shared and allocated costs among funds in the Dreyfus fund complex, the extent of economies of scale could depend substantially on the level of assets in the complex as a whole, so that increases and decreases in complex-wide assets can affect potential economies of scale in a manner that is disproportionate to, or even in the opposite direction from, changes in the fund’s asset level. The Board also considered potential benefits to Dreyfus from acting as investment adviser and noted the soft dollar arrangements in effect for trading the fund’s investments.
At the conclusion of these discussions, the Board agreed that it had been furnished with sufficient information to make an informed business decision with respect to the renewal of the Agreement. Based on the discussions and considerations as described above, the Board concluded and determined as follows:
· The Board concluded that the nature, extent and quality of the services provided by Dreyfus are adequate and appropriate.
· The Board agreed to closely monitor performance and determined to approve renewal of the Agreement only through September 30, 2015.
· The Board concluded that the fee paid to Dreyfus was reasonable in light of the considerations described above.
· The Board determined that the economies of scale which may accrue to Dreyfus and its affiliates in connection with the management of the fund had been adequately considered by Dreyfus in connection with the fee rate charged to the fund pursuant to the Agreement and that, to the extent in the future it were determined that material economies of scale had not been shared with the fund, the Board would seek to have those economies of scale shared with the fund.
37
INFORMATION ABOUT THE RENEWAL OF THE FUND'S MANAGEMENT AGREEMENT (Unaudited) (continued)
In evaluating the Agreement, the Board considered these conclusions and determinations and also relied on its previous knowledge, gained through meetings and other interactions with Dreyfus and its affiliates, of the fund and the services provided to the fund by Dreyfus. The Board also relied on information received on a routine and regular basis throughout the year relating to the operations of the fund and the investment management and other services provided under the Agreement, including information on the investment performance of the fund in comparison to similar mutual funds and benchmark performance indices; general market outlook as applicable to the fund; and compliance reports. In addition, the Board’s consideration of the contractual fee arrangements for this fund had the benefit of a number of years of reviews of prior or similar agreements during which lengthy discussions took place between the Board and Dreyfus representatives. Certain aspects of the arrangements may receive greater scrutiny in some years than in others, and the Board’s conclusions may be based, in part, on their consideration of the same or similar arrangements in prior years. The Board determined to renew the Agreement through September 30, 2015.
38
BOARD MEMBERS INFORMATION (Unaudited)
INDEPENDENT BOARD MEMBERS
Joseph S. DiMartino (71)
Chairman of the Board (1995)
Principal Occupation During Past 5 Years:
· Corporate Director and Trustee (1995-present)
Other Public Company Board Memberships During Past 5 Years:
· CBIZ (formerly, Century Business Services, Inc.), a provider of outsourcing functions for small and medium size companies, Director (1997-present)
· The Newark Group, a provider of a national market of paper recovery facilities, paperboard mills and paperboard converting plants, Director (2000-2010)
No. of Portfolios for which Board Member Serves: 144
———————
Peggy C. Davis (72)
Board Member (2006)
Principal Occupation During Past 5 Years:
· Shad Professor of Law, New York University School of Law (1983-present)
No. of Portfolios for which Board Member Serves: 51
———————
David P. Feldman (75)
Board Member (1996)
Principal Occupation During Past 5 Years:
· Corporate Director and Trustee (1985-present)
Other Public Company Board Memberships During Past 5 Years:
· BBH Mutual Funds Group (5 registered mutual funds), Director (1992-2014)
No. of Portfolios for which Board Member Serves: 37
———————
Ehud Houminer (75)
Board Member (1993)
Principal Occupation During Past 5 Years:
· Executive-in-Residence at the Columbia Business School, Columbia University (1992-present)
Other Public Company Board Memberships During Past 5 Years:
· Avnet, Inc., an electronics distributor, Director (1993-2012)
No. of Portfolios for which Board Member Serves: 62
———————
39
BOARD MEMBERS INFORMATION (Unaudited) (continued)
INDEPENDENT BOARD MEMBERS (continued)
Lynn Martin (75)
Board Member (2012)
Principal Occupation During Past 5 Years:
· President of The Martin Hall Group LLC, a human resources consulting firm (2005-2012)
Other Public Company Board Memberships During Past 5 Years:
· AT&T, Inc., a telecommunications company, Director (1999-2012)
· Ryder System, Inc., a supply chain and transportation management company, Director (1993-2012)
No. of Portfolios for which Board Member Serves: 37
———————
Robin A. Melvin (51)
Board Member (2012)
Principal Occupation During Past 5 Years:
· Co-chairman, Illinois Mentoring Partnership, non-profit organization dedicated to increasing the quantity and quality of mentoring services in Illinois; (2014-present; a board member since 2013)
· Director, Boisi Family Foundation, a private family foundation that supports youth-serving organizations that promote the self sufficiency of youth from disadvantaged circumstances (1995-2012)
No. of Portfolios for which Board Member Serves: 114
———————
Dr. Martin Peretz (76)
Board Member (2006)
Principal Occupation During Past 5 Years:
· Editor-in-Chief Emeritus of The New Republic Magazine (2011-2012) (previously, Editor-in-Chief, 1974-2011)
· Director of TheStreet.com, a financial information service on the web (1996-2010)
· Lecturer at Harvard University (1969-2012)
No. of Portfolios for which Board Member Serves: 37
———————
Once elected all Board Members serve for an indefinite term, but achieve Emeritus status upon reaching age 80. The address of the Board Members and Officers is c/o The Dreyfus Corporation, 200 Park Avenue, New York, New York 10166. Additional information about the Board Members is available in the fund's Statement of Additional Information which can be obtained from Dreyfus free of charge by calling this toll free number: 1-800-DREYFUS.
James F. Henry, Emeritus Board Member
Dr. Paul A. Marks, Emeritus Board Member
Philip L. Toia, Emeritus Board Member
40
OFFICERS OF THE FUND (Unaudited)
BRADLEY J. SKAPYAK, President since January 2010.
Chief Operating Officer and a director of the Manager since June 2009, Chairman of Dreyfus Transfer, Inc., an affiliate of the Manager and the transfer agent of the funds, since May 2011 and Executive Vice President of the Distributor since June 2007. From April 2003 to June 2009, Mr. Skapyak was the head of the Investment Accounting and Support Department of the Manager. He is an officer of 69 investment companies (comprised of 144 portfolios) managed by the Manager. He is 56 years old and has been an employee of the Manager since February 1988.
BENNETT A. MACDOUGALL, Chief Legal Officer since October 2015.
Chief Legal Officer of the Manager since June 2015; from June 2005 to June 2015, Director and Associate General Counsel of Deutsche Bank – Asset & Wealth Management Division, and Chief Legal Officer of Deutsche Investment Management Americas Inc. He is an officer of 70 investment companies (comprised of 169 portfolios) managed by the Manager. He is 44 years old and has been an employee of the Manager since June 2015.
JANETTE E. FARRAGHER, Vice President and Secretary since December 2011.
Assistant General Counsel of BNY Mellon, and an officer of 70 investment companies (comprised of 169 portfolios) managed by the Manager. She is 52 years old and has been an employee of the Manager since February 1984.
JAMES BITETTO, Vice President and Assistant Secretary since August 2005.
Managing Counsel of BNY Mellon and Secretary of the Manager, and an officer of 70 investment companies (comprised of 169 portfolios) managed by the Manager. He is 49 years old and has been an employee of the Manager since December 1996.
JONI LACKS CHARATAN, Vice President and Assistant Secretary since August 2005.
Managing Counsel of BNY Mellon, and an officer of 70 investment companies (comprised of 169 portfolios) managed by the Manager. She is 59 years old and has been an employee of the Manager since October 1988.
JOSEPH M. CHIOFFI, Vice President and Assistant Secretary since August 2005.
Managing Counsel of BNY Mellon, and an officer of 70 investment companies (comprised of 169 portfolios) managed by the Manager. He is 53 years old and has been an employee of the Manager since June 2000.
JOHN B. HAMMALIAN, Vice President and Assistant Secretary since August 2005.
Senior Managing Counsel of BNY Mellon, and an officer of 70 investment companies (comprised of 169 portfolios) managed by the Manager. He is 52 years old and has been an employee of the Manager since February 1991.
MAUREEN E. KANE, Vice President and Assistant Secretary since April 2015.
Managing Counsel of BNY Mellon since July 2014; from October 2004 until July 2014, General Counsel, and from May 2009 until July 2014, Chief Compliance Officer of Century Capital Management. She is an officer of 70 investment companies (comprised of 169 portfolios) managed by the Manager. She is 53 years old and has been an employee of the Manager since July 2014.
SARAH S. KELLEHER, Vice President and Assistant Secretary since April 2014.
Senior Counsel of BNY Mellon, and an officer of 70 investment companies (comprised of 169 portfolios) managed by the Manager; from August 2005 to March 2013, Associate General Counsel of Third Avenue Management. She is 39 years old and has been an employee of the Manager since March 2013.
JEFF PRUSNOFSKY, Vice President and Assistant Secretary since August 2005.
Senior Managing Counsel of BNY Mellon, and an officer of 70 investment companies (comprised of 169 portfolios) managed by the Manager. He is 50 years old and has been an employee of the Manager since October 1990.
JAMES WINDELS, Treasurer since November 2001.
Director – Mutual Fund Accounting of the Manager, and an officer of 70 investment companies (comprised of 169 portfolios) managed by the Manager. He is 56 years old and has been an employee of the Manager since April 1985.
41
OFFICERS OF THE FUND (Unaudited) (continued)
RICHARD CASSARO, Assistant Treasurer since January 2008.
Senior Accounting Manager – Money Market and Municipal Bond Funds of the Manager, and an officer of 70 investment companies (comprised of 169 portfolios) managed by the Manager. He is 56 years old and has been an employee of the Manager since September 1982.
GAVIN C. REILLY, Assistant Treasurer since December 2005.
Tax Manager of the Investment Accounting and Support Department of the Manager, and an officer of 70 investment companies (comprised of 169 portfolios) managed by the Manager. He is 47 years old and has been an employee of the Manager since April 1991.
ROBERT S. ROBOL, Assistant Treasurer since August 2005.
Senior Accounting Manager – Fixed Income Funds of the Manager, and an officer of 70 investment companies (comprised of 169 portfolios) managed by the Manager. He is 51 years old and has been an employee of the Manager since October 1988.
ROBERT SALVIOLO, Assistant Treasurer since July 2007.
Senior Accounting Manager – Equity Funds of the Manager, and an officer of 70 investment companies (comprised of 169 portfolios) managed by the Manager. He is 48 years old and has been an employee of the Manager since June 1989.
ROBERT SVAGNA, Assistant Treasurer since August 2005.
Senior Accounting Manager – Equity Funds of the Manager, and an officer of 70 investment companies (comprised of 169 portfolios) managed by the Manager. He is 48 years old and has been an employee of the Manager since November 1990.
JOSEPH W. CONNOLLY, Chief Compliance Officer since October 2004.
Chief Compliance Officer of the Manager and The Dreyfus Family of Funds (70 investment companies, comprised of 169 portfolios). He is 58 years old and has served in various capacities with the Manager since 1980, including manager of the firm’s Fund Accounting Department from 1997 through October 2001.
42
NOTES
43
NOTES
44
NOTES
45
Dreyfus International Value Fund
200 Park Avenue
New York, NY 10166
Manager
The Dreyfus Corporation
200 Park Avenue
New York, NY 10166
Custodian
The Bank of New York Mellon
225 Liberty Street
New York, NY 10286
Transfer Agent &
Dividend Disbursing Agent
Dreyfus Transfer, Inc.
200 Park Avenue
New York, NY 10166
Distributor
MBSC Securities Corporation
200 Park Avenue
New York, NY 10166
| | |
Ticker Symbols: | Class A: DVLAX Class C: DICVX Class I: DIRVX |
Telephone Call your financial representative or 1-800-DREYFUS
Mail The Dreyfus Family of Funds, 144 Glenn Curtiss Boulevard, Uniondale, NY 11556-0144
E-mail Send your request to info@dreyfus.com
Internet Information can be viewed online or downloaded at www.dreyfus.com
The fund files its complete schedule of portfolio holdings with the Securities and Exchange Commission (“SEC”) for the first and third quarters of each fiscal year on Form N-Q. The fund’s Forms N-Q are available on the SEC’s website at www.sec.gov and may be reviewed and copied at the SEC’s Public Reference Room in Washington, DC. (phone 1-800-SEC-0330 for information).
Information regarding how the fund voted proxies related to portfolio securities for the most recent 12-month period ended June 30 is available at www.dreyfus.com and on the SEC’s website at www.sec.gov and without charge, upon request, by calling 1-800-DREYFUS.
| | |
© 2015 MBSC Securities Corporation | 
0254AR0815 |

Dreyfus Opportunistic Midcap Value Fund
| | | |

| | ANNUAL REPORT
August 31, 2015 |
| |
Save time. Save paper. View your next shareholder report online as soon as it’s available. Log into www.dreyfus.com and sign up for Dreyfus eCommunications. It’s simple and only takes a few minutes. |
| |
The views expressed in this report reflect those of the portfolio manager only through the end of the period covered and do not necessarily represent the views of Dreyfus or any other person in the Dreyfus organization. Any such views are subject to change at any time based upon market or other conditions and Dreyfus disclaims any responsibility to update such views. These views may not be relied on as investment advice and, because investment decisions for a Dreyfus fund are based on numerous factors, may not be relied on as an indication of trading intent on behalf of any Dreyfus fund. |
| |
Not FDIC-Insured • Not Bank-Guaranteed • May Lose Value |
Contents
T H E F U N D
F O R M O R E I N F O R M AT I O N
Back Cover
| | | | |
| |
Dreyfus Opportunistic Midcap Value Fund
| | The Fund |
A LETTER FROM THE PRESIDENT
Dear Shareholder:
We are pleased to present this annual report for Dreyfus Opportunistic Midcap Value Fund, covering the 12-month period from September 1, 2014, through August 31, 2015. For information about how the fund performed during the reporting period, as well as general market perspectives, we provide a Discussion of Fund Performance on the pages that follow.
Financial markets proved volatile over the reporting period. For much of the year, a recovering U.S. economy enabled stocks to advance, but those gains were more than erased in August when economic concerns in China, falling commodity prices and a stronger U.S. dollar sparked sharp corrections in equity markets throughout the world. The emerging markets were especially hard hit in this environment. U.S. bonds generally fared better, rallying in late 2014 due to robust investor demand before reversing course in the spring as the domestic economy strengthened. Global economic instability in August hurt corporate-backed and inflation-linked bonds, but U.S. government securities held up relatively well.
We expect market uncertainty and volatility to persist over the near term as investors vacillate between hopes that current market turmoil represents a healthy correction and fears that further disappointments could trigger a full-blown bear market. Our investment strategists and portfolio managers are monitoring developments carefully, keeping a close watch on Chinese fiscal and monetary policy, liquidity factors affecting various asset classes, and other developments that could influence investor sentiment. Over the longer term, we remain confident that financial markets are likely to stabilize as the world adjusts to slower Chinese economic growth, abundant energy resources, and the anticipated eventual normalization of monetary policy. In our view, investors will continue to be well served under these circumstances by a long-term perspective and a disciplined investment approach.
Thank you for your continued confidence and support.
Sincerely,

J. Charles Cardona
President
The Dreyfus Corporation
September 15, 2015
2
DISCUSSION OF FUND PERFORMANCE
For the period of September 1, 2014, through August 31, 2015, as provided by David A. Daglio, Primary Portfolio Manager
Fund and Market Performance Overview
For the 12-month period ended August 31, 2015, Dreyfus Opportunistic Midcap Value Fund’s Class A shares produced a total return of -4.72%, Class C shares returned -5.41%, Class I shares returned -4.43%, and Class Y shares returned -4.34%.1 In comparison, the fund’s benchmark, the Russell Midcap® Value Index (the “Index”), produced a -2.54% total return for the same period.2
Moderate market gains over much of the reporting period were more than offset by subsequent declines triggered by global economic concerns. The fund lagged its benchmark, mainly due to shortfalls in the materials and industrials sectors.
The Fund’s Investment Approach
The fund seeks to surpass the performance of the Index by investing in midcap companies with market capitalizations between $1 billion and $25 billion at the time of purchase. The fund’s portfolio managers identify potential investments through extensive quantitative and fundamental research conducted by the team’s dedicated sector specialists.
The fund focuses on individual stock selection (a “bottom-up” approach), emphasizing three key factors: relative value, business health, and business momentum.
The portfolio managers use an opportunistic value style in an attempt to benefit from valuation inefficiencies and underappreciated fundamental prospects present in the marketplace. To do this, the portfolio managers use mid-cycle estimates, growth prospects, the identification of a revaluation catalyst, and competitive advantages as some of the factors in the valuation assessment.
Global Economic Concerns Sparked Market Volatility
The reporting period began in the midst of a market downturn in September and early October 2014, but U.S. employment gains, better consumer confidence, and improved business sentiment prompted a quick market recovery. Consequently, some broad market indices climbed to record highs through the end of February 2015.
The rally paused in March amid sluggish economic growth stemming from severe winter weather and an appreciating U.S. dollar. However, the U.S. economy regained traction in the spring, and stocks resumed their advance until uncertainty regarding a debt crisis in Greece and slowing economic growth in China again sent U.S. stock prices lower over the summer.
In this tumultuous environment, midcap stocks generally lagged their large- and small-cap counterparts, and value-oriented stocks trailed more growth-oriented companies, on average.
Fund Strategies Produced Mixed Results
Although the fund successfully navigated the opportunities and pitfalls of heightened market volatility in a number of market sectors over the reporting period, its overall performance compared to the benchmark was undercut by a handful of disappointments in the materials and industrials sectors. Most notably, the fund’s relative performance in the materials sector
3
DISCUSSION OF FUND PERFORMANCE (continued)
was hurt by precious metals producers such as Yamana Gold and Newmont Mining, where turnarounds in company fundamentals have taken longer to materialize than expected despite the relative stability of gold prices. In the industrials sector, transportation services provider Kirby Corp. was hurt by its exposure to the struggling energy sector, as lower oil prices and softer production volumes dampened demand. Likewise, motor manufacturer Regal Beloit and generators maker Generac Holdings encountered unexpected fundamental weakness stemming from global economic concerns.
The fund produced better relative results in several other market sectors. We maintained substantially underweighted exposure to energy stocks, helping cushion the full brunt of the sector’s losses as commodity prices fell. In the health care sector, our focus on undervalued, well established midsize companies enabled the fund to benefit from intensifying mergers-and-acquisitions activity, as Cubist Pharmaceuticals, pharmacy benefits manager Catamaran, and drug development services provider Covance received takeover offers at substantial premiums to their stock prices at the time. In addition, neonatal care specialist MEDNAX rallied from depressed levels as the number of live births in the United States showed year-over-year growth.
Among financial companies, E*TRADE Financial benefited from rising trading volumes, and a recovering housing market helped drive gains in title insurance issuer FNF Group. Finally, in the information technology sector, cybersecurity solutions provider Fortinet benefited from robust enterprise demand in the wake of highly publicized breaches of corporate networks, and cloud computing innovator ServiceNow gained ground when growing numbers of businesses shifted to remote storage of data and applications.
Selectively Positioned for Continued U.S. Economic Growth
Despite ongoing turmoil in overseas markets, the U.S. economy has continued to grow. At the same time, we have been encouraged by positive investor sentiment surrounding U.S.-centric midcap companies that have been relatively insulated from international economic instability.
However, in our judgment, selectivity is likely to be key to investment performance over the months ahead. We have intensified our focus on underlying company fundamentals and attractive intrinsic values. The fund ended the reporting period with overweighted positions in the financials, information technology, and industrials sectors, but we remain cautious regarding the fundamentals prospects of most energy companies. In addition, we have found relatively few companies meeting our investment criteria in the utilities and telecommunications services sectors.
September 15, 2015
Equity funds are subject generally to market, market sector, market liquidity, issuer, and investment style risks, among other factors, to varying degrees, all of which are more fully described in the fund’s prospectus.
Stocks of small- and/or midcap companies often experience sharper price fluctuations than stocks of large-cap companies.
1 Total return includes reinvestment of dividends and any capital gains paid and does not take into consideration the maximum initial sales charge in the case of Class A shares, or the applicable contingent deferred sales charge imposed on redemptions in the case of Class C shares. Had these charges been reflected, returns would have been lower. Past performance is no guarantee of future results. Share price and investment return fluctuate such that upon redemption fund shares may be worth more or less than their original cost.
4
2 SOURCE: LIPPER INC. – Reflects reinvestment of dividends and, where applicable, capital gain distributions. The Russell Midcap® Value Index is a widely accepted, unmanaged index of medium-cap stock market performance and measures the performance of those Russell midcap companies with lower price-to-book ratios and lower forecasted growth values. Investors cannot invest directly in any index.
5
FUND PERFORMANCE

Comparison of change in value of $10,000 investment in Dreyfus Opportunistic Midcap Value Fund Class A shares, Class C shares, Class I shares and Class Y shares and the Russell Midcap Value Index
† Source: Lipper Inc.
†† The total return figures presented for Class C shares of the fund reflect the performance of the fund’s Class A shares for the period prior to 5/30/08 (the inception date for Class C shares), not reflecting the applicable sales charges for Class A shares.
The total return figures presented for Class I shares of the fund reflect the performance of the fund’s Class A shares for the period prior to 5/30/08 (the inception date for Class I shares), not reflecting the applicable sales charges for Class A shares.
The total return figures presented for Class Y shares of the fund reflect the performance of the fund’s Class A shares for the period prior to 7/1/13 (the inception date for Class Y shares), not reflecting the applicable sales charges for Class A shares.
Past performance is not predictive of future performance.
The above graph compares a $10,000 investment made in each of the Class A, Class C, Class I and Class Y shares of Dreyfus Opportunistic Midcap Value Fund on 8/31/05 to a $10,000 investment made in the Russell Midcap Value Index (the “Index”) on that date. All dividends and capital gain distributions are reinvested.
The fund’s performance shown in the line graph above takes into account the maximum initial sales charge on Class A shares and all other applicable fees and expenses on all classes. The Index is a widely accepted, unmanaged index of medium-cap stock market performance and measures the performance of those Russell Midcap companies with lower price-to-book ratios and lower forecasted growth values. Unlike a mutual fund, the Index is not subject to charges, fees and other expenses. Investors cannot invest directly in any index. Further information relating to fund performance, including expense reimbursements, if applicable, is contained in the Financial Highlights section of the prospectus and elsewhere in this report.
6
| | | | | | | | |
Average Annual Total Returns as of 8/31/15 | | | |
| | | Inception | | | | | |
| | Date | 1 Year | 5 Years | | 10 Years | |
Class A shares | | | | | | |
with maximum sales charge (5.75%) | 9/29/95 | -10.19% | 14.22% | | 8.29% | |
without sales charge | 9/29/95 | -4.72% | 15.58% | | 8.93% | |
Class C shares | | | | | | |
with applicable redemption charge † | 5/30/08 | -6.26% | 14.68% | | 8.31% | †† |
without redemption | 5/30/08 | -5.41% | 14.68% | | 8.31% | †† |
Class I shares | | 5/30/08 | -4.43% | 15.84% | | 9.12% | †† |
Class Y shares | | 7/1/13 | -4.34% | 15.72% | †† | 9.00% | †† |
Russell Midcap Value Index | -2.54% | 15.96% | | 7.93% | |
Past performance is not predictive of future performance. The fund’s performance shown in the graph and table does not reflect the deduction of taxes that a shareholder would pay on fund distributions or the redemption of fund shares. In addition to the performance of Class A shares shown with and without a maximum sales charge, the fund’s performance shown in the table takes into account all other applicable fees and expenses on all classes.
† The maximum contingent deferred sales charge for Class C shares is 1% for shares redeemed within one year of the date of purchase.
†† The total return performance figures presented for Class C shares of the fund reflect the performance of the fund’s Class A shares for the period prior to 5/30/08 (the inception date for Class C shares), not reflecting the applicable sales charges for Class A shares.
The total return performance figures presented for Class I shares of the fund reflect the performance of the fund’s Class A shares for the period prior to 5/30/08 (the inception date for Class I shares), not reflecting the applicable sales charges for Class A shares.
The total return performance figures presented for Class Y shares of the fund reflect the performance of the fund’s Class A shares for the period prior to 7/1/13 (the inception date for Class Y shares), not reflecting the applicable sales charges for Class A shares.
7
UNDERSTANDING YOUR FUND’S EXPENSES (Unaudited)
As a mutual fund investor, you pay ongoing expenses, such as management fees and other expenses. Using the information below, you can estimate how these expenses affect your investment and compare them with the expenses of other funds. You also may pay one-time transaction expenses, including sales charges (loads) and redemption fees, which are not shown in this section and would have resulted in higher total expenses. For more information, see your fund’s prospectus or talk to your financial adviser.
Review your fund’s expenses
The table below shows the expenses you would have paid on a $1,000 investment in Dreyfus Opportunistic Midcap Value Fund from March 1, 2015 to August 31, 2015. It also shows how much a $1,000 investment would be worth at the close of the period, assuming actual returns and expenses.
| | | | | | | | |
Expenses and Value of a $1,000 Investment | | |
assuming actual returns for the six months ended August 31, 2015 |
| | | | | | | | |
| | | | Class A | Class C | Class I | Class Y |
Expenses paid per $1,000† | $ 5.59 | $ 9.09 | $ 4.24 | $ 3.76 |
Ending value (after expenses) | $ 911.90 | $ 908.50 | $ 913.20 | $ 913.60 |
COMPARING YOUR FUND’S EXPENSES
WITH THOSE OF OTHER FUNDS (Unaudited)
Using the SEC’s method to compare expenses
The Securities and Exchange Commission (SEC) has established guidelines to help investors assess fund expenses. Per these guidelines, the table below shows your fund’s expenses based on a $1,000 investment, assuming a hypothetical 5% annualized return. You can use this information to compare the ongoing expenses (but not transaction expenses or total cost) of investing in the fund with those of other funds. All mutual fund shareholder reports will provide this information to help you make this comparison. Please note that you cannot use this information to estimate your actual ending account balance and expenses paid during the period.
| | | | | | | | |
Expenses and Value of a $1,000 Investment | | |
assuming a hypothetical 5% annualized return for the six months ended August 31, 2015 |
| | | | | | | | |
| | | | Class A | Class C | Class I | Class Y |
Expenses paid per $1,000† | $ 5.90 | $ 9.60 | $ 4.48 | $ 3.97 |
Ending value (after expenses) | $ 1,019.36 | $ 1,015.68 | $ 1,020.77 | $ 1,021.27 |
† Expenses are equal to the fund’s annualized expense ratio of 1.16% for Class A, 1.89% for Class C, .88% for Class I and .78% for Class Y, multiplied by the average account value over the period, multiplied by 184/365 (to reflect the one-half year period).
8
STATEMENT OF INVESTMENTS
August 31, 2015
||ANAME||
| | | | | | | | | |
Common Stocks - 99.0% | | Shares | | Value ($) | |
Banks - 8.0% | | | | | |
First Republic Bank | | 600,378 | | 36,208,797 | |
Signature Bank | | 265,189 | a | 35,400,080 | |
SLM | | 7,858,759 | a | 66,642,276 | |
SunTrust Banks | | 875,367 | | 35,338,566 | |
| | | | | 173,589,719 | |
Capital Goods - 13.3% | | | | | |
Fluor | | 797,523 | | 36,382,999 | |
Generac Holdings | | 261,873 | a | 8,097,113 | |
HD Supply Holdings | | 1,522,003 | a | 50,226,099 | |
Hubbell, Cl. B | | 424,528 | | 41,888,178 | |
Ingersoll-Rand | | 1,066,356 | | 58,958,823 | |
PACCAR | | 181,484 | | 10,702,112 | |
Regal Beloit | | 852,377 | | 56,827,975 | |
Xylem | | 839,140 | | 27,230,093 | |
| | | | | 290,313,392 | |
Commercial & Professional Services - 1.2% | | | | | |
Equifax | | 276,390 | | 27,058,581 | |
Consumer Durables & Apparel - 2.3% | | | | | |
PVH | | 428,914 | | 51,032,188 | |
Consumer Services - .0% | | | | | |
Houghton Mifflin Harcourt | | 8,266 | a | 186,646 | |
Diversified Financials - 23.5% | | | | | |
Discover Financial Services | | 757,531 | | 40,702,141 | |
E*TRADE Financial | | 2,959,090 | a | 77,794,476 | |
FNFV Group | | 443,283 | a | 6,414,305 | |
Intercontinental Exchange | | 288,547 | | 65,907,020 | |
Invesco | | 1,090,212 | | 37,187,131 | |
Leucadia National | | 3,911,274 | | 83,935,940 | |
Raymond James Financial | | 1,372,792 | | 72,744,248 | |
TD Ameritrade Holding | | 2,543,471 | | 85,104,540 | |
Voya Financial | | 1,009,664 | | 43,496,325 | |
| | | | | 513,286,126 | |
Health Care Equipment & Services - 3.6% | | | | | |
MEDNAX | | 968,208 | a | 77,989,154 | |
Household & Personal Products - .6% | | | | | |
Estee Lauder, Cl. A | | 153,632 | | 12,255,225 | |
Insurance - 2.7% | | | | | |
FNF Group | | 1,595,260 | | 58,083,417 | |
9
STATEMENT OF INVESTMENTS (continued)
| | | | | | | | | | | |
Common Stocks - 99.0% (continued) | | Shares | | Value ($) | |
Materials - 5.7% | | | | | |
New Gold | | 1,684,292 | a | 3,873,872 | |
Newmont Mining | | 2,603,022 | | 44,433,586 | |
Valspar | | 850,449 | | 62,337,912 | |
Yamana Gold | | 7,298,922 | | 13,721,973 | |
| | | | | 124,367,343 | |
Media - 1.5% | | | | | |
CBS, Cl. B | | 723,404 | | 32,726,797 | |
Pharmaceuticals, Biotechnology & Life Sciences - 6.3% | | | | | |
Agilent Technologies | | 616,391 | | 22,381,157 | |
Akorn | | 270,200 | a | 10,751,258 | |
Illumina | | 120,712 | a | 23,853,898 | |
Jazz Pharmaceuticals | | 227,093 | a | 38,337,840 | |
Vertex Pharmaceuticals | | 333,529 | a | 42,531,618 | |
| | | | | 137,855,771 | |
Real Estate - 3.2% | | | | | |
Realogy Holdings | | 1,725,753 | a | 69,547,846 | |
Retailing - 5.0% | | | | | |
LKQ | | 1,015,829 | a | 30,464,712 | |
Staples | | 3,654,287 | | 51,927,418 | |
Williams-Sonoma | | 356,115 | | 27,075,423 | |
| | | | | 109,467,553 | |
Semiconductors & Semiconductor Equipment - .4% | | | | | |
United Microelectronics, ADR | | 5,680,973 | | 9,259,986 | |
Software & Services - 5.5% | | | | | |
Akamai Technologies | | 534,391 | a | 38,107,422 | |
DST Systems | | 193,790 | | 19,847,972 | |
Fortinet | | 952,083 | a | 40,120,778 | |
ServiceNow | | 183,252 | a | 13,003,562 | |
Yahoo! | | 263,895 | a | 8,507,975 | |
| | | | | 119,587,709 | |
Technology Hardware & Equipment - 13.3% | | | | | |
Avnet | | 551,258 | | 23,373,339 | |
FEI | | 391,453 | | 29,546,872 | |
FLIR Systems | | 461,262 | | 13,205,931 | |
Ingram Micro, Cl. A | | 1,083,155 | | 29,310,174 | |
Keysight Technologies | | 1,956,517 | a | 62,686,805 | |
Lumentum Holdings | | 707,956 | a | 13,975,051 | |
Seagate Technology | | 1,430,845 | | 73,545,433 | |
Viavi Solutions | | 3,539,782 | a | 19,008,629 | |
10
| | | | | | | | | | | | | | |
Common Stocks - 99.0% (continued) | | Shares | | Value ($) | |
Technology Hardware & Equipment - 13.3% (continued) | | | | | |
Western Digital | | 300,058 | | 24,592,754 | |
| | | | | 289,244,988 | |
Transportation - 1.8% | | | | | |
Kirby | | 572,672 | a | 40,390,556 | |
Utilities - 1.1% | | | | | |
ITC Holdings | | 729,399 | | 23,851,347 | |
Total Common Stocks (cost $2,021,663,799) | | | | 2,160,094,344 | |
Master Limited Partnerships - .7% | | | | | |
Diversified Financials - .7% | | | | | |
Blackstone Group LP | | 451,290 | | 15,456,683 | |
Total Master Limited Partnerships (cost $9,679,022) | | | | | |
Other Investments - .9% | | | | | |
Registered Investment Company; | | | | | |
Dreyfus Institutional Preferred Plus Money Market Fund | | 18,497,781 | b | 18,497,781 | |
(cost $18,497,781) | | | | | |
Total Investments (cost $2,049,840,602) | | 100.6% | | 2,194,048,808 | |
Liabilities, Less Cash and Receivables | | (0.6%) | | (12,403,656) | |
Net Assets | | 100.0% | | 2,181,645,152 | |
ADR—American Depository Receipt
LP—Limited Partnership
a Non-income producing security.
b Investment in affiliated money market mutual fund.
11
STATEMENT OF INVESTMENTS (continued)
| | |
Portfolio Summary (Unaudited) † | Value (%) |
Diversified Financials | 24.2 |
Capital Goods | 13.3 |
Technology Hardware & Equipment | 13.3 |
Banks | 8.0 |
Pharmaceuticals, Biotechnology & Life Sciences | 6.3 |
Materials | 5.7 |
Software & Services | 5.5 |
Retailing | 5.0 |
Health Care Equipment & Services | 3.6 |
Real Estate | 3.2 |
Insurance | 2.7 |
Consumer Durables & Apparel | 2.3 |
Transportation | 1.8 |
Media | 1.5 |
Commercial & Professional Services | 1.2 |
Utilities | 1.1 |
Money Market Investment | .9 |
Household & Personal Products | .6 |
Semiconductors & Semiconductor Equipment | .4 |
| | 100.6 |
| | |
†Based on net assets.
See notes to financial statements.
12
STATEMENT OF ASSETS AND LIABILITIES
August 31, 2015
| | | | | | |
| | | Cost | | Value |
Assets ($): | | | |
Investments in securities—See Statement of Investments: | | | | |
Unaffiliated issuers | | 2,031,342,821 | | 2,175,551,027 |
Affiliated issuers | | 18,497,781 | | 18,497,781 |
Cash | | | | | 904,004 |
Receivable for investment securities sold | | | | | 11,050,248 |
Dividends receivable | | | | | 1,779,006 |
Receivable for shares of Common Stock subscribed | | | | | 1,066,475 |
Prepaid expenses | | | | | 58,274 |
| | | | | 2,208,906,815 |
Liabilities ($): | | | |
Due to The Dreyfus Corporation and affiliates—Note 3(c) | | | | | 1,898,135 |
Payable for investment securities purchased | | | | | 14,746,437 |
Payable for shares of Common Stock redeemed | | | | | 9,958,295 |
Interest payable—Note 2 | | | | | 2,336 |
Accrued expenses | | | | | 656,460 |
| | | | | 27,261,663 |
Net Assets ($) | | | 2,181,645,152 |
Composition of Net Assets ($): | | | |
Paid-in capital | | | | | 1,756,389,544 |
Accumulated undistributed investment income—net | | | | | 576,363 |
Accumulated net realized gain (loss) on investments | | | | | 280,471,039 |
Accumulated net unrealized appreciation (depreciation)
on investments | | | | | 144,208,206 |
Net Assets ($) | | | 2,181,645,152 |
| | | | | |
Net Asset Value Per Share | Class A | Class C | Class I | Class Y |
Net Assets ($) | 1,071,712,716 | 116,683,402 | 913,852,389 | 79,396,645 |
Shares Outstanding | 28,986,912 | 3,405,686 | 24,813,514 | 2,149,878 |
Net Asset Value Per Share ($) | 36.97 | 34.26 | 36.83 | 36.93 |
See notes to financial statements.
13
STATEMENT OF OPERATIONS
Year Ended August 31, 2015
| | | | | | | |
| | | | | | |
| | | | | | |
Investment Income ($): | | | | |
Income: | | | | |
Cash dividends (net of $219,708 foreign taxes withheld at source): | | | | |
Unaffliated issuers | | | 28,479,666 | |
Affliated issuers | | | 22,648 | |
Income from securities lending—Note 1(b) | | | 19,130 | |
Total Income | | | 28,521,444 | |
Expenses: | | | | |
Management fee—Note 3(a) | | | 19,075,300 | |
Shareholder servicing costs—Note 3(c) | | | 6,716,053 | |
Distribution fees—Note 3(b) | | | 908,173 | |
Directors' fees and expenses—Note 3(d) | | | 185,462 | |
Prospectus and shareholders’ reports | | | 156,709 | |
Registration fees | | | 147,332 | |
Custodian fees—Note 3(c) | | | 132,474 | |
Professional fees | | | 92,373 | |
Loan commitment fees—Note 2 | | | 27,185 | |
Interest expense—Note 2 | | | 22,918 | |
Miscellaneous | | | 48,414 | |
Total Expenses | | | 27,512,393 | |
Less—reduction in fees due to earnings credits—Note 3(c) | | | (321) | |
Net Expenses | | | 27,512,072 | |
Investment Income—Net | | | 1,009,372 | |
Realized and Unrealized Gain (Loss) on Investments—Note 4 ($): | | |
Net realized gain (loss) on investments | | | 364,285,092 | |
Net unrealized appreciation (depreciation) on investments | | | (490,058,264) | |
Net Realized and Unrealized Gain (Loss) on Investments | | | (125,773,172) | |
Net (Decrease) in Net Assets Resulting from Operations | | (124,763,800) | |
See notes to financial statements.
14
STATEMENT OF CHANGES IN NET ASSETS
| | | | | | | | | | |
| | | | | | | | | | |
| | | | Year Ended August 31, |
| | | | 2015 | | | | 2014 | |
Operations ($): | | | | | | | | |
Investment income—net | | | 1,009,372 | | | | 5,135,189 | |
Net realized gain (loss) on investments | | 364,285,092 | | | | 237,409,389 | |
Net unrealized appreciation (depreciation)
on investments | | (490,058,264) | | | | 280,671,141 | |
Net Increase (Decrease) in Net Assets
Resulting from Operations | (124,763,800) | | | | 523,215,719 | |
Dividends to Shareholders from ($): | | | | | | | | |
Investment income—net: | | | | | | | | |
Class A | | | (1,486,128) | | | | - | |
Class I | | | (3,415,093) | | | | (1,802,406) | |
Class Y | | | (95,271) | | | | (3) | |
Net realized gain on investments: | | | | | | | | |
Class A | | | (134,482,192) | | | | (118,254,358) | |
Class C | | | (12,676,901) | | | | (6,774,704) | |
Class I | | | (101,601,362) | | | | (100,906,266) | |
Class Y | | | (2,100,596) | | | | (114) | |
Total Dividends | | | (255,857,543) | | | | (227,737,851) | |
Capital Stock Transactions ($): | | | | | | | | |
Net proceeds from shares sold: | | | | | | | | |
Class A | | | 325,561,801 | | | | 565,392,684 | |
Class C | | | 32,333,148 | | | | 64,484,510 | |
Class I | | | 491,709,342 | | | | 405,469,244 | |
Class Y | | | 74,744,792 | | | | 25,495,371 | |
Dividends reinvested: | | | | | | | | |
Class A | | | 125,099,846 | | | | 108,498,885 | |
Class C | | | 9,693,034 | | | | 5,275,653 | |
Class I | | | 96,450,364 | | | | 96,941,746 | |
Class Y | | | 1,960,207 | | | | - | |
Cost of shares redeemed: | | | | | | | | |
Class A | | | (610,472,279) | | | | (490,387,885) | |
Class C | | | (20,205,410) | | | | (10,847,723) | |
Class I | | | (788,832,838) | | | | (207,643,551) | |
Class Y | | | (15,214,634) | | | | (1,602,699) | |
Increase (Decrease) in Net Assets
from Capital Stock Transactions | (277,172,627) | | | | 561,076,235 | |
Total Increase (Decrease) in Net Assets | (657,793,970) | | | | 856,554,103 | |
Net Assets ($): | | | | | | | | |
Beginning of Period | | | 2,839,439,122 | | | | 1,982,885,019 | |
End of Period | | | 2,181,645,152 | | | | 2,839,439,122 | |
Undistributed investment income—net | 576,363 | | | | 4,982,126 | |
15
STATEMENT OF CHANGES IN NET ASSETS (continued)
| | | | | | | | | | |
| | | | | | | | | | |
| | | | Year Ended August 31, |
| | | | 2015 | | | | 2014 | |
Capital Share Transactions: | | | | | | | | |
Class A | | | | | | | | |
Shares sold | | | 8,137,340 | | | | 13,828,910 | |
Shares issued for dividends reinvested | | | 3,215,108 | | | | 2,823,286 | |
Shares redeemed | | | (15,199,740) | | | | (12,022,981) | |
Net Increase (Decrease) in Shares Outstanding | (3,847,292) | | | | 4,629,215 | |
Class C | | | | | | | | |
Shares sold | | | 866,037 | | | | 1,668,532 | |
Shares issued for dividends reinvested | | | 267,394 | | | | 145,335 | |
Shares redeemed | | | (543,447) | | | | (280,105) | |
Net Increase (Decrease) in Shares Outstanding | 589,984 | | | | 1,533,762 | |
Class Ia | | | | | | | | |
Shares sold | | | 12,271,844 | | | | 9,890,087 | |
Shares issued for dividends reinvested | | | 2,493,547 | | | | 2,537,742 | |
Shares redeemed | | | (19,773,668) | | | | (5,083,013) | |
Net Increase (Decrease) in Shares Outstanding | (5,008,277) | | | | 7,344,816 | |
Class Ya | | | | | | | | |
Shares sold | | | 1,897,175 | | | | 621,470 | |
Shares issued for dividends reinvested | | | 50,573 | | | | - | |
Shares redeemed | | | (380,984) | | | | (38,383) | |
Net Increase (Decrease) in Shares Outstanding | 1,566,764 | | | | 583,087 | |
a During the period ended August 31, 2014, 146,870 Class I shares representing $6,126,885 were exchanged for 146,470 Class Y shares. | | |
See notes to financial statements.
16
FINANCIAL HIGHLIGHTS
The following tables describe the performance for each share class for the fiscal periods indicated. All information (except portfolio turnover rate) reflects financial results for a single fund share. Total return shows how much your investment in the fund would have increased (or decreased) during each period, assuming you had reinvested all dividends and distributions. These figures have been derived from the fund’s financial statements.
| | | | | | | |
| | | | | |
| | | Year Ended August 31, |
Class A Shares | | 2015 | 2014 | 2013 | 2012 | 2011 |
Per Share Data ($): | | | | | | |
Net asset value, beginning of period | | 43.17 | 38.27 | 29.47 | 31.19 | 26.65 |
Investment Operations: | | | | | | |
Investment income (loss)—neta | | (.02) | .05 | .03 | .07 | .22 |
Net realized and unrealized gain (loss) on investments | | (1.79) | 9.10 | 8.83 | 3.34 | 4.32 |
Total from Investment Operations | | (1.81) | 9.15 | 8.86 | 3.41 | 4.54 |
Distributions: | | | | | | |
Dividends from investment income—net | | (.05) | - | (.06) | (.23) | - |
Dividends from net realized gain on investments | | (4.34) | (4.25) | - | (4.90) | - |
Total Distributions | | (4.39) | (4.25) | (.06) | (5.13) | - |
Net asset value, end of period | | 36.97 | 43.17 | 38.27 | 29.47 | 31.19 |
Total Return (%)b | | (4.72) | 25.32 | 30.11 | 13.44 | 17.03 |
Ratios/Supplemental Data (%): | | | | | | |
Ratio of total expenses to average net assets | | 1.18 | 1.15 | 1.18 | 1.22 | 1.17 |
Ratio of net expenses to average net assets | | 1.18 | 1.15 | 1.18 | 1.22 | 1.17 |
Ratio of net investment income (loss) to average net assets | | (.05) | .12 | .08 | .25 | .64 |
Portfolio Turnover Rate | | 74.05 | 67.49 | 91.31 | 71.25 | 114.02 |
Net Assets, end of period ($ x 1,000) | | 1,071,713 | 1,417,535 | 1,079,346 | 979,628 | 1,057,495 |
a Based on average shares outstanding.
b Exclusive of sales charge.
See notes to financial statements.
17
FINANCIAL HIGHLIGHTS (continued)
| | | | | | | |
| | | | | |
| | | Year Ended August 31, |
Class C Shares | | 2015 | 2014 | 2013 | 2012 | 2011 |
Per Share Data ($): | | | | | | |
Net asset value, beginning of period | | 40.55 | 36.44 | 28.22 | 30.24 | 26.05 |
Investment Operations: | | | | | | |
Investment (loss)—neta | | (.29) | (.26) | (.24) | (.16) | (.16) |
Net realized and unrealized gain (loss) on investments | | (1.66) | 8.62 | 8.46 | 3.20 | 4.35 |
Total from Investment Operations | | (1.95) | 8.36 | 8.22 | 3.04 | 4.19 |
Distributions: | | | | | | |
Dividends from investment income—net | | - | - | - | (.16) | - |
Dividends from net realized gain on investments | | (4.34) | (4.25) | - | (4.90) | - |
Total Distributions | | (4.34) | (4.25) | - | (5.06) | - |
Net asset value, end of period | | 34.26 | 40.55 | 36.44 | 28.22 | 30.24 |
Total Return (%)b | | (5.41) | 24.35 | 29.13 | 12.48 | 16.09 |
Ratios/Supplemental Data (%): | | | | | | |
Ratio of total expenses to average net assets | | 1.90 | 1.92 | 1.97 | 2.03 | 2.00 |
Ratio of net expenses to average net assets | | 1.90 | 1.92 | 1.97 | 2.03 | 2.00 |
Ratio of net investment (loss) to average net assets | | (.77) | (.66) | (.72) | (.56) | (.48) |
Portfolio Turnover Rate | | 74.05 | 67.49 | 91.31 | 71.25 | 114.02 |
Net Assets, end of period ($ x 1,000) | | 116,683 | 114,179 | 46,708 | 22,538 | 22,343 |
a Based on average shares outstanding.
b Exclusive of sales charge.
See notes to financial statements.
18
| | | | | | | |
| | | | | |
| | | Year Ended August 31, |
Class I Shares | | 2015 | 2014 | 2013 | 2012 | 2011 |
Per Share Data ($): | | | | | | |
Net asset value, beginning of period | | 43.01 | 38.12 | 29.38 | 31.21 | 26.61 |
Investment Operations: | | | | | | |
Investment income—neta | | .09 | .15 | .10 | .14 | .18 |
Net realized and unrealized gain (loss) on investments | | (1.78) | 9.07 | 8.77 | 3.32 | 4.42 |
Total from Investment Operations | | (1.69) | 9.22 | 8.87 | 3.46 | 4.60 |
Distributions: | | | | | | |
Dividends from investment income—net | | (.15) | (.08) | (.13) | (.39) | - |
Dividends from net realized gain on investments | | (4.34) | (4.25) | - | (4.90) | - |
Total Distributions | | (4.49) | (4.33) | (.13) | (5.29) | - |
Net asset value, end of period | | 36.83 | 43.01 | 38.12 | 29.38 | 31.21 |
Total Return (%) | | (4.43) | 25.62 | 30.26 | 13.71 | 17.29 |
Ratios/Supplemental Data (%): | | | | | | |
Ratio of total expenses to average net assets | | .89 | .90 | .97 | 1.00 | .96 |
Ratio of net expenses to average net assets | | .89 | .90 | .97 | 1.00 | .96 |
Ratio of net investment income to average net assets | | .22 | .37 | .27 | .48 | .53 |
Portfolio Turnover Rate | | 74.05 | 67.49 | 91.31 | 71.25 | 114.02 |
Net Assets, end of period ($ x 1,000) | | 913,852 | 1,282,578 | 856,830 | 155,210 | 80,041 |
a Based on average shares outstanding.
See notes to financial statements.
19
FINANCIAL HIGHLIGHTS (continued)
| | | | | | |
| | | | | |
| | | Year Ended August 31, |
Class Y Shares | | 2015 | 2014 | 2013a |
Per Share Data ($): | | | | |
Net asset value, beginning of period | | 43.12 | 38.12 | 37.48 |
Investment Operations: | | | | |
Investment income—netb | | .13 | .19 | .02 |
Net realized and unrealized gain (loss) on investments | | (1.78) | 9.17 | .62 |
Total from Investment Operations | | (1.65) | 9.36 | .64 |
Distributions: | | | | |
Dividends from investment income—net | | (.20) | (.11) | - |
Dividends from net realized gain on investments | | (4.34) | (4.25) | - |
Total Distributions | | (4.54) | (4.36) | - |
Net asset value, end of period | | 36.93 | 43.12 | 38.12 |
Total Return (%) | | (4.34) | 26.02 | 1.74c |
Ratios/Supplemental Data (%): | | | | |
Ratio of total expenses to average net assets | | .80 | .83 | .80d |
Ratio of net expenses to average net assets | | .80 | .83 | .80d |
Ratio of net investment income to average net assets | | .30 | .50 | .33d |
Portfolio Turnover Rate | | 74.05 | 67.49 | 91.31 |
Net Assets, end of period ($ x 1,000) | | 79,397 | 25,147 | 1 |
a From July 1, 2013 (commencement of initial offering) to August 31, 2013.
b Based on average shares outstanding.
c Not annualized.
d Annualized.
See notes to financial statements.
20
NOTES TO FINANCIAL STATEMENTS
NOTE 1—Significant Accounting Policies:
Dreyfus Opportunistic Midcap Value Fund (the “fund”) is a separate diversified series of Advantage Funds, Inc. (the “Company”), which is registered under the Investment Company Act of 1940, as amended (the “Act”), as an open-end management investment company and operates as a series company currently offering eleven series, including the fund. The fund’s investment objective seeks to surpass the performance of the Russell Midcap® Value Index. The Dreyfus Corporation (the “Manager” or “Dreyfus”), a wholly-owned subsidiary of The Bank of New York Mellon Corporation (“BNY Mellon”), serves as the fund’s investment adviser.
MBSC Securities Corporation (the “Distributor”), a wholly-owned subsidiary of Dreyfus, is the distributor of the fund’s shares. The fund is authorized to issue 700 million shares of $.001 par value Common Stock. The fund currently offers four classes of shares: Class A (350 million shares authorized), Class C (125 million shares authorized), Class I (125 million shares authorized) and Class Y (100 million shares authorized). Class A shares generally are subject to a sales charge imposed at the time of purchase. Class C shares are subject to a contingent deferred sales charge (“CDSC”) imposed on Class C shares redeemed within one year of purchase. Class I and Class Y shares are sold at net asset value per share generally to institutional investors. Other differences between the classes include the services offered to and the expenses borne by each class, the allocation of certain transfer agency costs, and certain voting rights. Income, expenses (other than expenses attributable to a specific class), and realized and unrealized gains or losses on investments are allocated to each class of shares based on its relative net assets.
The Company accounts separately for the assets, liabilities and operations of each series. Expenses directly attributable to each series are charged to that series’ operations; expenses which are applicable to all series are allocated among them on a pro rata basis.
The Financial Accounting Standards Board (“FASB”) Accounting Standards Codification (“ASC”) is the exclusive reference of authoritative U.S. generally accepted accounting principles (“GAAP”) recognized by the FASB to be applied by nongovernmental entities. Rules and interpretive releases of the Securities and Exchange Commission (“SEC”) under authority of federal laws are also sources of authoritative GAAP for SEC registrants. The fund’s financial statements are prepared in accordance with GAAP, which may require the use of management estimates and assumptions. Actual results could differ from those estimates.
21
NOTES TO FINANCIAL STATEMENTS (continued)
The Company enters into contracts that contain a variety of indemnifications. The fund’s maximum exposure under these arrangements is unknown. The fund does not anticipate recognizing any loss related to these arrangements.
(a) Portfolio valuation: The fair value of a financial instrument is the amount that would be received to sell an asset or paid to transfer a liability in an orderly transaction between market participants at the measurement date (i.e., the exit price). GAAP establishes a fair value hierarchy that prioritizes the inputs of valuation techniques used to measure fair value. This hierarchy gives the highest priority to unadjusted quoted prices in active markets for identical assets or liabilities (Level 1 measurements) and the lowest priority to unobservable inputs (Level 3 measurements).
Additionally, GAAP provides guidance on determining whether the volume and activity in a market has decreased significantly and whether such a decrease in activity results in transactions that are not orderly. GAAP requires enhanced disclosures around valuation inputs and techniques used during annual and interim periods.
Various inputs are used in determining the value of the fund’s investments relating to fair value measurements. These inputs are summarized in the three broad levels listed below:
Level 1—unadjusted quoted prices in active markets for identical investments.
Level 2—other significant observable inputs (including quoted prices for similar investments, interest rates, prepayment speeds, credit risk, etc.).
Level 3—significant unobservable inputs (including the fund’s own assumptions in determining the fair value of investments).
The inputs or methodology used for valuing securities are not necessarily an indication of the risk associated with investing in those securities.
Changes in valuation techniques may result in transfers in or out of an assigned level within the disclosure hierarchy. Valuation techniques used to value the fund’s investments are as follows:
Investments in securities are valued at the last sales price on the securities exchange or national securities market on which such securities are primarily traded. Securities listed on the National Market System for which market quotations are available are valued at the official closing price or, if there is no official closing price that day, at the last sales price. For open short positions, asked prices are used for valuation purposes. Bid price is
22
used when no asked price is available. Registered investment companies that are not traded on an exchange are valued at their net asset value. All of the preceding securities are generally categorized within Level 1 of the fair value hierarchy.
Securities not listed on an exchange or the national securities market, or securities for which there were no transactions, are valued at the average of the most recent bid and asked prices. These securities are generally categorized within Level 2 of the fair value hierarchy.
Fair valuing of securities may be determined with the assistance of a pricing service using calculations based on indices of domestic securities and other appropriate indicators, such as prices of relevant ADRs and financial futures. Utilizing these techniques may result in transfers between Level 1 and Level 2 of the fair value hierarchy.
When market quotations or official closing prices are not readily available, or are determined not to reflect accurately fair value, such as when the value of a security has been significantly affected by events after the close of the exchange or market on which the security is principally traded (for example, a foreign exchange or market), but before the fund calculates its net asset value, the fund may value these investments at fair value as determined in accordance with the procedures approved by the Company’s Board of Directors (the “Board”). Certain factors may be considered when fair valuing investments such as: fundamental analytical data, the nature and duration of restrictions on disposition, an evaluation of the forces that influence the market in which the securities are purchased and sold, and public trading in similar securities of the issuer or comparable issuers. These securities are either categorized within Level 2 or 3 of the fair value hierarchy depending on the relevant inputs used.
For restricted securities where observable inputs are limited, assumptions about market activity and risk are used and are generally categorized within Level 3 of the fair value hierarchy.
The following is a summary of the inputs used as of August 31, 2015 in valuing the fund’s investments:
23
NOTES TO FINANCIAL STATEMENTS (continued)
| | | | | |
| | Level 1 - Unadjusted Quoted Prices | Level 2 - Other Significant Observable Inputs | Level 3 -Significant Unobservable Inputs | Total |
Assets ($) | | | | |
Investments in Securities: | | | |
Equity Securities - Domestic Common Stocks† | 2,133,238,513 | - | - | 2,133,238,513 |
Equity Securities - Foreign Common Stocks† | 26,855,831 | - | - | 26,855,831 |
Limited Partnership Interest† | 15,456,683 | - | - | 15,456,683 |
Mutual Funds | 18,497,781 | - | - | 18,497,781 |
† See Statement of Investments for additional detailed categorizations.
At August 31, 2015, there were no transfers between Level 1 and Level 2 of the fair value hierarchy.
(b) Securities transactions and investment income: Securities transactions are recorded on a trade date basis. Realized gains and losses from securities transactions are recorded on the identified cost basis. Dividend income is recognized on the ex-dividend date and interest income, including, where applicable, accretion of discount and amortization of premium on investments, is recognized on the accrual basis.
Pursuant to a securities lending agreement with The Bank of New York Mellon, a subsidiary of BNY Mellon and an affiliate of Dreyfus, the fund may lend securities to qualified institutions. It is the fund’s policy that, at origination, all loans are secured by collateral of at least 102% of the value of U.S. securities loaned and 105% of the value of foreign securities loaned. Collateral equivalent to at least 100% of the market value of securities on loan is maintained at all times. Collateral is either in the form of cash, which can be invested in certain money market mutual funds managed by Dreyfus, or U.S. Government and Agency securities. The fund is entitled to receive all dividends, interest and distributions on securities loaned, in addition to income earned as a result of the lending transaction. Should a borrower fail to return the securities in a timely manner, The Bank of New York Mellon is required to replace the securities for the benefit of the fund or credit the fund with the market value of the unreturned securities and is subrogated to the fund’s rights against the borrower and the collateral. During the period ended August 31, 2015, The
24
Bank of New York Mellon earned $6,376 from lending portfolio securities, pursuant to the securities lending agreement.
(c) Affiliated issuers: Investments in other investment companies advised by Dreyfus are defined as “affiliated” under the Act. Investments in affiliated investment companies during the period ended August 31, 2015 were as follows:
| | | | | | |
Affiliated Investment Company | Value 8/31/2014 ($) | Purchases ($) | Sales ($) | Value 8/31/2015 ($) | Net Assets (%) |
Dreyfus Institutional Preferred Plus Money Market Fund | 21,752,291 | 768,043,852 | 771,298,362 | 18,497,781 | .9 |
Dreyfus Institutional Cash Advantage Fund | - | 149,945,636 | 149,945,636 | - | - |
Total | 21,752,291 | 917,989,488 | 921,243,998 | 18,497,781 | .9 |
(d) Dividends to shareholders: Dividends are recorded on the ex-dividend date. Dividends from investment income-net and dividends from net realized capital gains, if any, are normally declared and paid annually, but the fund may make distributions on a more frequent basis to comply with the distribution requirements of the Internal Revenue Code of 1986, as amended (the “Code”). To the extent that net realized capital gains can be offset by capital loss carryovers, it is the policy of the fund not to distribute such gains. Income and capital gain distributions are determined in accordance with income tax regulations, which may differ from GAAP.
(e) Federal income taxes: It is the policy of the fund to continue to qualify as a regulated investment company, if such qualification is in the best interests of its shareholders, by complying with the applicable provisions of the Code, and to make distributions of taxable income sufficient to relieve it from substantially all federal income and excise taxes.
As of and during the period ended August 31, 2015, the fund did not have any liabilities for any uncertain tax positions. The fund recognizes interest and penalties, if any, related to uncertain tax positions as income tax expense in the Statement of Operations. During the period ended August 31, 2015, the fund did not incur any interest or penalties.
25
NOTES TO FINANCIAL STATEMENTS (continued)
Each tax year in the four-year period ended August 31, 2015 remains subject to examination by the Internal Revenue Service and state taxing authorities.
At August 31, 2015, the components of accumulated earnings on a tax basis were as follows: undistributed ordinary income $27,160,689, undistributed capital gains $263,739,373 and unrealized appreciation $134,355,546.
The tax character of distributions paid to shareholders during the fiscal periods ended August 31, 2015 and August 31, 2014 were as follows: ordinary income $68,462,559 and $27,301,657, and long-term capital gains $187,394,984 and $200,436,194, respectively.
During the period ended August 31, 2015, as a result of permanent book to tax differences, primarily due to the tax treatment for real estate investment trusts and limited partnerships, the fund decreased accumulated undistributed investment income-net by $418,643 and increased accumulated net realized gain (loss) on investments by the same amount. Net assets and net asset value per share were not affected by this reclassification.
NOTE 2—Bank Lines of Credit:
The fund participates with other Dreyfus-managed funds in a $430 million unsecured credit facility led by Citibank, N.A. and a $300 million unsecured credit facility provided by The Bank of New York Mellon (each, a “Facility”), each to be utilized primarily for temporary or emergency purposes, including the financing of redemptions. Prior to October 8, 2014, the unsecured credit facility with Citibank, N.A. was $265 million. In connection therewith, the fund has agreed to pay its pro rata portion of commitment fees for each Facility. Interest is charged to the fund based on rates determined pursuant to the terms of the respective Facility at the time of borrowing.
The average amount of borrowings outstanding under the Facilities during the period ended August 31, 2015, was approximately $2,082,200 with a related weighted average annualized interest rate of 1.10%.
NOTE 3—Management Fee and Other Transactions with Affiliates:
(a) Pursuant to a management agreement with Dreyfus, the management fee is computed at the annual rate of .75% of the value of the fund's average daily net assets and is payable monthly.
26
During the period ended August 31, 2015, the Distributor retained $52,862 from commissions earned on sales of the fund's Class A shares and $41,578 from CDSCs on redemptions of the fund's Class C shares.
(b) Under the Distribution Plan adopted pursuant to Rule 12b-1 under the Act, Class C shares pay the Distributor for distributing its shares at an annual rate of .75% of the value of its average daily net assets. During the period ended August 31, 2015, Class C shares were charged $908,173 pursuant to the Distribution Plan.
(c) Under the Shareholder Services Plan, Class A and Class C shares pay the Distributor at an annual rate of .25% of the value of their average daily net assets for the provision of certain services. The services provided may include personal services relating to shareholder accounts, such as answering shareholder inquiries regarding the fund and providing reports and other information, and services related to the maintenance of shareholder accounts. The Distributor may make payments to Service Agents (securities dealers, financial institutions or other industry professionals) with respect to these services. The Distributor determines the amounts to be paid to Service Agents. During the period ended August 31, 2015, Class A and Class C shares were charged $3,212,472 and $302,724, respectively, pursuant to the Shareholder Services Plan.
The fund has arrangements with the transfer agent and the custodian whereby the fund may receive earnings credits when positive cash balances are maintained, which are used to offset transfer agency and custody fees. For financial reporting purposes, the fund includes net earnings credits as an expense offset in the Statement of Operations.
The fund compensates Dreyfus Transfer, Inc., a wholly-owned subsidiary of Dreyfus, under a transfer agency agreement for providing transfer agency and cash management services for the fund. The majority of transfer agency fees are comprised of amounts paid on a per account basis, while cash management fees are related to fund subscriptions and redemptions. During the period ended August 31, 2015, the fund was charged $123,816 for transfer agency services and $7,947 for cash management services. These fees are included in Shareholder servicing costs in the Statement of Operations. Cash management fees were partially offset by earnings credits of $321.
The fund compensates The Bank of New York Mellon under a custody agreement for providing custodial services for the fund. These fees are determined based on net assets, geographic region and transaction activity. During the period ended August 31, 2015, the fund was charged $132,474 pursuant to the custody agreement.
27
NOTES TO FINANCIAL STATEMENTS (continued)
During the period ended August 31, 2015, the fund was charged $10,965 for services performed by the Chief Compliance Officer and his staff.
The components of “Due to The Dreyfus Corporation and affiliates” in the Statement of Assets and Liabilities consist of: management fees $1,467,519, Distribution Plan fees $77,262, Shareholder Services Plan fees $265,681, custodian fees $60,589, Chief Compliance Officer fees $1,737 and transfer agency fees $25,347.
(d) Each Board member also serves as a Board member of other funds within the Dreyfus complex. Annual retainer fees and attendance fees are allocated to each fund based on net assets.
NOTE 4—Securities Transactions:
The aggregate amount of purchases and sales of investment securities, excluding short-term securities, during the period ended August 31, 2015, amounted to $1,863,460,556 and $2,379,480,479, respectively.
At August 31, 2015, the cost of investments for federal income tax purposes was $2,059,693,262; accordingly, accumulated net unrealized appreciation on investments was $134,355,546, consisting of $282,624,256 gross unrealized appreciation and $148,268,710 gross unrealized depreciation.
28
REPORT OF INDEPENDENT REGISTERED
PUBLIC ACCOUNTING FIRM
Shareholders and Board of Directors
Dreyfus Opportunistic Midcap Value Fund
We have audited the accompanying statement of assets and liabilities, including the statement of investments, of Dreyfus Opportunistic Midcap Value Fund (one of the series comprising Advantage Funds, Inc.) as of August 31, 2015, and the related statement of operations for the year then ended, the statement of changes in net assets for each of the two years in the period then ended, and the financial highlights for each of the periods indicated therein. These financial statements and financial highlights are the responsibility of the Fund’s management. Our responsibility is to express an opinion on these financial statements and financial highlights based on our audits.
We conducted our audits in accordance with the standards of the Public Company Accounting Oversight Board (United States). Those standards require that we plan and perform the audit to obtain reasonable assurance about whether the financial statements and financial highlights are free of material misstatement. We were not engaged to perform an audit of the Fund’s internal control over financial reporting. Our audits included consideration of internal control over financial reporting as a basis for designing audit procedures that are appropriate in the circumstances, but not for the purpose of expressing an opinion on the effectiveness of the Fund’s internal control over financial reporting. Accordingly, we express no such opinion. An audit also includes examining, on a test basis, evidence supporting the amounts and disclosures in the financial statements and financial highlights, assessing the accounting principles used and significant estimates made by management, and evaluating the overall financial statement presentation. Our procedures included confirmation of securities owned as of August 31, 2015 by correspondence with the custodian and others. We believe that our audits provide a reasonable basis for our opinion.
In our opinion, the financial statements and financial highlights referred to above present fairly, in all material respects, the financial position of Dreyfus Opportunistic Midcap Value Fund at August 31, 2015, the results of its operations for the year then ended, the changes in its net assets for each of the two years in the period then ended, and the financial highlights for each of the indicated periods, in conformity with U.S. generally accepted accounting principles.

New York, New York
October 28, 2015
29
IMPORTANT TAX INFORMATION (Unaudited)
For federal tax purposes, the fund hereby reports 32.18% of the ordinary dividends paid during the fiscal year ended August 31, 2015 as qualifying for the corporate dividends received deduction. Also, certain dividends paid by the fund may be subject to a maximum tax rate of 15%, as provided for by the Jobs and Growth Tax Relief Reconciliation Act of 2003. Of the distributions paid during the fiscal year, $16,552,417 represents the maximum amount that may be considered qualified dividend income. The fund also hereby reports $1.0989 per share as a short-term capital gain distribution and $3.2447 per share as a long-term capital gain distribution paid on December 4, 2014. Shareholders will receive notification in early 2016 of the percentage applicable to the preparation of their 2015 income tax returns.
30
INFORMATION ABOUT THE RENEWAL OF THE FUND'S MANAGEMENT AGREEMENT (Unaudited)
At a meeting of the fund’s Board of Directors held on March 11-12, 2015, the Board considered the renewal of the fund’s Management Agreement pursuant to which Dreyfus provides the fund with investment advisory and administrative services (the “Agreement”). The Board members, none of whom are “interested persons” (as defined in the Investment Company Act of 1940, as amended) of the fund, were assisted in their review by independent legal counsel and met with counsel in executive session separate from Dreyfus representatives. In considering the renewal of the Agreement, the Board considered all factors that it believed to be relevant, including those discussed below. The Board did not identify any one factor as dispositive, and each Board member may have attributed different weights to the factors considered.
Analysis of Nature, Extent, and Quality of Services Provided to the Fund. The Board considered information provided to them at the meeting and in previous presentations from Dreyfus representatives regarding the nature, extent, and quality of the services provided to funds in the Dreyfus fund complex. Dreyfus provided the number of open accounts in the fund, the fund’s asset size and the allocation of fund assets among distribution channels. Dreyfus also had previously provided information regarding the diverse intermediary relationships and distribution channels of funds in the Dreyfus fund complex (such as retail direct or intermediary, in which intermediaries typically are paid by the fund and/or Dreyfus) and Dreyfus’ corresponding need for broad, deep, and diverse resources to be able to provide ongoing shareholder services to each intermediary or distribution channel, as applicable to the fund.
The Board also considered research support available to, and portfolio management capabilities of, the fund’s portfolio management personnel and that Dreyfus also provides oversight of day-to-day fund operations, including fund accounting and administration and assistance in meeting legal and regulatory requirements. The Board also considered Dreyfus’ extensive administrative, accounting and compliance infrastructures. The Board also considered portfolio management’s brokerage policies and practices (including policies and practices regarding soft dollars) and the standards applied in seeking best execution.
Comparative Analysis of the Fund’s Performance and Management Fee and Expense Ratio. The Board reviewed reports prepared by Lipper, Inc. (“Lipper”), an independent provider of investment company data, which included information comparing (1) the fund’s performance with the performance of a group of comparable funds (the “Performance Group”) and with a broader group of funds (the “Performance Universe”), all for various periods ended December 31, 2014, and (2) the fund’s actual and contractual management fees and total expenses with those of a group of comparable funds (the “Expense Group”) and with a broader group of funds (the “Expense Universe”), the information for which was derived in part from fund financial statements available to Lipper as of the date of its analysis. Dreyfus previously had furnished the Board with a description of the methodology Lipper used to select the
31
INFORMATION ABOUT THE RENEWAL OF THE FUND'S MANAGEMENT AGREEMENT (Unaudited) (continued)
Performance Group and Performance Universe and the Expense Group and Expense Universe.
Dreyfus representatives stated that the usefulness of performance comparisons may be affected by a number of factors, including different investment limitations that may be applicable to the fund and comparison funds. They also noted that performance generally should be considered over longer periods of time, although it is possible that long-term performance can be adversely affected by even one period of significant underperformance so that a single investment decision or theme has the ability to affect disproportionately long-term performance. The Board discussed the results of the comparisons and noted that the fund’s total return performance was generally above the Performance Group and Performance Universe medians (ranking first in the Performance Group in the five- and ten- year periods), except for the one-year period when performance was below median. Dreyfus also provided a comparison of the fund’s calendar year total returns to the returns of the fund’s benchmark index.
The Board also reviewed the range of actual and contractual management fees and total expenses of the Expense Group and Expense Universe funds and discussed the results of the comparisons. The Board noted that the fund’s contractual management fee was above the Expense Group median, the fund’s actual management fee was above the Expense Group and Expense Universe medians and the fund’s total expenses were above the Expense Group median and below the Expense Universe median.
Dreyfus representatives reviewed with the Board the management or investment advisory fees (1) paid by funds advised or administered by Dreyfus that are in the same Lipper category as the fund and (2) paid to Dreyfus or the Dreyfus-affiliated primary employer of the fund’s primary portfolio manager(s) for advising any separate accounts and/or other types of client portfolios that are considered to have similar investment strategies and policies as the fund (the “Similar Clients”), and explained the nature of the Similar Clients. They discussed differences in fees paid and the relationship of the fees paid in light of any differences in the services provided and other relevant factors. The Board considered the relevance of the fee information provided for the Similar Clients to evaluate the appropriateness and reasonableness of the fund’s management fee.
Analysis of Profitability and Economies of Scale. Dreyfus representatives reviewed the expenses allocated and profit received by Dreyfus and its affiliates and the resulting profitability percentage for managing the fund and the aggregate profitability percentage to Dreyfus and its affiliates for managing the funds in the Dreyfus fund complex, and the method used to determine the expenses and profit. The Board concluded that the profitability results were not unreasonable, given the services rendered and service levels provided by Dreyfus. The Board also had been provided with information prepared by an independent consulting firm regarding Dreyfus’ approach to allocating costs to, and determining the profitability of, individual funds and the entire Dreyfus fund complex. The consulting firm also had analyzed where any economies of scale might emerge in connection with the management of a fund.
32
The Board considered, on the advice of its counsel, the profitability analysis (1) as part of its evaluation of whether the fees under the Agreement bear a reasonable relationship to the mix of services provided by Dreyfus, including the nature, extent and quality of such services, and (2) in light of the relevant circumstances for the fund and the extent to which economies of scale would be realized if the fund grows and whether fee levels reflect these economies of scale for the benefit of fund shareholders. Dreyfus representatives noted that a discussion of economies of scale is predicated on a fund having achieved a substantial size with increasing assets and that, if a fund’s assets had been stable or decreasing, the possibility that Dreyfus may have realized any economies of scale would be less. Dreyfus representatives also noted that, as a result of shared and allocated costs among funds in the Dreyfus fund complex, the extent of economies of scale could depend substantially on the level of assets in the complex as a whole, so that increases and decreases in complex-wide assets can affect potential economies of scale in a manner that is disproportionate to, or even in the opposite direction from, changes in the fund’s asset level. The Board also considered potential benefits to Dreyfus from acting as investment adviser and noted the soft dollar arrangements in effect for trading the fund’s investments.
At the conclusion of these discussions, the Board agreed that it had been furnished with sufficient information to make an informed business decision with respect to the renewal of the Agreement. Based on the discussions and considerations as described above, the Board concluded and determined as follows:
· The Board concluded that the nature, extent and quality of the services provided by Dreyfus are adequate and appropriate.
· The Board was satisfied with the fund’s performance.
· The Board concluded that the fee paid to Dreyfus was reasonable in light of the considerations described above.
· The Board determined that the economies of scale which may accrue to Dreyfus and its affiliates in connection with the management of the fund had been adequately considered by Dreyfus in connection with the fee rate charged to the fund pursuant to the Agreement and that, to the extent in the future it were determined that material economies of scale had not been shared with the fund, the Board would seek to have those economies of scale shared with the fund.
In evaluating the Agreement, the Board considered these conclusions and determinations and also relied on its previous knowledge, gained through meetings and other interactions with Dreyfus and its affiliates, of the fund and the services provided to the fund by Dreyfus. The Board also relied on information received on a routine and regular basis throughout the year relating to the operations of the fund and the investment management and other services provided under the Agreement, including information on the investment performance of the fund in comparison to similar
33
INFORMATION ABOUT THE RENEWAL OF THE FUND'S MANAGEMENT AGREEMENT (Unaudited) (continued)
mutual funds and benchmark performance indices; general market outlook as applicable to the fund; and compliance reports. In addition, the Board’s consideration of the contractual fee arrangements for this fund had the benefit of a number of years of reviews of prior or similar agreements during which lengthy discussions took place between the Board and Dreyfus representatives. Certain aspects of the arrangements may receive greater scrutiny in some years than in others, and the Board’s conclusions may be based, in part, on their consideration of the same or similar arrangements in prior years. The Board determined to renew the Agreement.
34
BOARD MEMBERS INFORMATION (Unaudited)
INDEPENDENT BOARD MEMBERS
Joseph S. DiMartino (71)
Chairman of the Board (1995)
Principal Occupation During Past 5 Years:
· Corporate Director and Trustee (1995-present)
Other Public Company Board Memberships During Past 5 Years:
· CBIZ (formerly, Century Business Services, Inc.), a provider of outsourcing functions for small and medium size companies, Director (1997-present)
· The Newark Group, a provider of a national market of paper recovery facilities, paperboard mills and paperboard converting plants, Director (2000-2010)
No. of Portfolios for which Board Member Serves: 144
———————
Peggy C. Davis (72)
Board Member (2006)
Principal Occupation During Past 5 Years:
· Shad Professor of Law, New York University School of Law (1983-present)
No. of Portfolios for which Board Member Serves: 51
———————
David P. Feldman (75)
Board Member (1996)
Principal Occupation During Past 5 Years:
· Corporate Director and Trustee (1985-present)
Other Public Company Board Memberships During Past 5 Years:
· BBH Mutual Funds Group (5 registered mutual funds), Director (1992-2014)
No. of Portfolios for which Board Member Serves: 37
———————
Ehud Houminer (75)
Board Member (1993)
Principal Occupation During Past 5 Years:
· Executive-in-Residence at the Columbia Business School, Columbia University (1992-present)
Other Public Company Board Memberships During Past 5 Years:
· Avnet, Inc., an electronics distributor, Director (1993-2012)
No. of Portfolios for which Board Member Serves: 62
———————
35
BOARD MEMBERS INFORMATION (Unaudited) (continued)
INDEPENDENT BOARD MEMBERS (continued)
Lynn Martin (75)
Board Member (2012)
Principal Occupation During Past 5 Years:
· President of The Martin Hall Group LLC, a human resources consulting firm (2005-2012)
Other Public Company Board Memberships During Past 5 Years:
· AT&T, Inc., a telecommunications company, Director (1999-2012)
· Ryder System, Inc., a supply chain and transportation management company, Director (1993-2012)
No. of Portfolios for which Board Member Serves: 37
———————
Robin A. Melvin (51)
Board Member (2012)
Principal Occupation During Past 5 Years:
· Co-chairman, Illinois Mentoring Partnership, non-profit organization dedicated to increasing the quantity and quality of mentoring services in Illinois; (2014-present; a board member since 2013)
· Director, Boisi Family Foundation, a private family foundation that supports youth-serving organizations that promote the self sufficiency of youth from disadvantaged circumstances (1995-2012)
No. of Portfolios for which Board Member Serves: 114
———————
Dr. Martin Peretz (76)
Board Member (2006)
Principal Occupation During Past 5 Years:
· Editor-in-Chief Emeritus of The New Republic Magazine (2011-2012) (previously, Editor-in-Chief, 1974-2011)
· Director of TheStreet.com, a financial information service on the web (1996-2010)
· Lecturer at Harvard University (1969-2012)
No. of Portfolios for which Board Member Serves: 37
———————
Once elected all Board Members serve for an indefinite term, but achieve Emeritus status upon reaching age 80. The address of the Board Members and Officers is c/o The Dreyfus Corporation, 200 Park Avenue, New York, New York 10166. Additional information about the Board Members is available in the fund's Statement of Additional Information which can be obtained from Dreyfus free of charge by calling this toll free number: 1-800-DREYFUS.
James F. Henry, Emeritus Board Member
Dr. Paul A. Marks, Emeritus Board Member
Philip L. Toia, Emeritus Board Member
36
OFFICERS OF THE FUND (Unaudited)
BRADLEY J. SKAPYAK, President since January 2010. Chief Operating Officer and a director of the Manager since June 2009, Chairman of Dreyfus Transfer, Inc., an affiliate of the Manager and the transfer agent of the funds, since May 2011 and Executive Vice President of the Distributor since June 2007. From April 2003 to June 2009, Mr. Skapyak was the head of the Investment Accounting and Support Department of the Manager. He is an officer of 69 investment companies (comprised of 144 portfolios) managed by the Manager. He is 56 years old and has been an employee of the Manager since February 1988.
BENNETT A. MACDOUGALL, Chief Legal Officer since October 2015. Chief Legal Officer of the Manager since June 2015; from June 2005 to June 2015, Director and Associate General Counsel of Deutsche Bank – Asset & Wealth Management Division, and Chief Legal Officer of Deutsche Investment Management Americas Inc. He is an officer of 70 investment companies (comprised of 169 portfolios) managed by the Manager. He is 44 years old and has been an employee of the Manager since June 2015.
JANETTE E. FARRAGHER, Vice President and Secretary since December 2011. Assistant General Counsel of BNY Mellon, and an officer of 70 investment companies (comprised of 169 portfolios) managed by the Manager. She is 52 years old and has been an employee of the Manager since February 1984.
JAMES BITETTO, Vice President and Assistant Secretary since August 2005. Managing Counsel of BNY Mellon and Secretary of the Manager, and an officer of 70 investment companies (comprised of 169 portfolios) managed by the Manager. He is 49 years old and has been an employee of the Manager since December 1996.
JONI LACKS CHARATAN, Vice President and Assistant Secretary since August 2005. Managing Counsel of BNY Mellon, and an officer of 70 investment companies (comprised of 169 portfolios) managed by the Manager. She is 59 years old and has been an employee of the Manager since October 1988.
JOSEPH M. CHIOFFI, Vice President and Assistant Secretary since August 2005. Managing Counsel of BNY Mellon, and an officer of 70 investment companies (comprised of 169 portfolios) managed by the Manager. He is 53 years old and has been an employee of the Manager since June 2000.
JOHN B. HAMMALIAN, Vice President and Assistant Secretary since August 2005. Senior Managing Counsel of BNY Mellon, and an officer of 70 investment companies (comprised of 169 portfolios) managed by the Manager. He is 52 years old and has been an employee of the Manager since February 1991.
MAUREEN E. KANE, Vice President and Assistant Secretary since April 2015. Managing Counsel of BNY Mellon since July 2014; from October 2004 until July 2014, General Counsel, and from May 2009 until July 2014, Chief Compliance Officer of Century Capital Management. She is an officer of 70 investment companies (comprised of 169 portfolios) managed by the Manager. She is 53 years old and has been an employee of the Manager since July 2014.
SARAH S. KELLEHER, Vice President and Assistant Secretary since April 2014. Senior Counsel of BNY Mellon, and an officer of 70 investment companies (comprised of 169 portfolios) managed by the Manager; from August 2005 to March 2013, Associate General Counsel of Third Avenue Management. She is 39 years old and has been an employee of the Manager since March 2013.
JEFF PRUSNOFSKY, Vice President and Assistant Secretary since August 2005. Senior Managing Counsel of BNY Mellon, and an officer of 70 investment companies (comprised of 169 portfolios) managed by the Manager. He is 50 years old and has been an employee of the Manager since October 1990.
JAMES WINDELS, Treasurer since November 2001. Director – Mutual Fund Accounting of the Manager, and an officer of 70 investment companies (comprised of 169 portfolios) managed by the Manager. He is 56 years old and has been an employee of the Manager since April 1985.
37
OFFICERS OF THE FUND (Unaudited) (continued)
RICHARD CASSARO, Assistant Treasurer since January 2008. Senior Accounting Manager – Money Market and Municipal Bond Funds of the Manager, and an officer of 70 investment companies (comprised of 169 portfolios) managed by the Manager. He is 56 years old and has been an employee of the Manager since September 1982.
GAVIN C. REILLY, Assistant Treasurer since December 2005. Tax Manager of the Investment Accounting and Support Department of the Manager, and an officer of 70 investment companies (comprised of 169 portfolios) managed by the Manager. He is 47 years old and has been an employee of the Manager since April 1991.
ROBERT S. ROBOL, Assistant Treasurer since August 2005. Senior Accounting Manager – Fixed Income Funds of the Manager, and an officer of 70 investment companies (comprised of 169 portfolios) managed by the Manager. He is 51 years old and has been an employee of the Manager since October 1988.
ROBERT SALVIOLO, Assistant Treasurer since July 2007. Senior Accounting Manager – Equity Funds of the Manager, and an officer of 70 investment companies (comprised of 169 portfolios) managed by the Manager. He is 48 years old and has been an employee of the Manager since June 1989.
ROBERT SVAGNA, Assistant Treasurer since December 2002. Senior Accounting Manager – Equity Funds of the Manager, and an officer of 70 investment companies (comprised of 169 portfolios) managed by the Manager. He is 48 years old and has been an employee of the Manager since November 1990.
JOSEPH W. CONNOLLY, Chief Compliance Officer since October 2004. Chief Compliance Officer of the Manager and The Dreyfus Family of Funds (70 investment companies, comprised of 169 portfolios). He is 58 years old and has served in various capacities with the Manager since 1980, including manager of the firm’s Fund Accounting Department from 1997 through October 2001.
38
NOTES
39
NOTES
40
NOTES
41
Dreyfus Opportunistic Midcap Value Fund
200 Park Avenue
New York, NY 10166
Manager
The Dreyfus Corporation
200 Park Avenue
New York, NY 10166
Custodian
The Bank of New York Mellon
225 Liberty Street
New York, NY 10286
Transfer Agent &
Dividend Disbursing Agent
Dreyfus Transfer, Inc.
200 Park Avenue
New York, NY 10166
Distributor
MBSC Securities Corporation
200 Park Avenue
New York, NY 10166
| | |
Ticker Symbols: | Class A: DMCVX Class C: DVLCX Class I: DVLIX Class Y: DMCYX |
Telephone Call your financial representative or 1-800-DREYFUS
Mail The Dreyfus Family of Funds, 144 Glenn Curtiss Boulevard, Uniondale, NY 11556-0144
E-mail Send your request to info@dreyfus.com
Internet Information can be viewed online or downloaded at www.dreyfus.com
The fund files its complete schedule of portfolio holdings with the Securities and Exchange Commission (“SEC”) for the first and third quarters of each fiscal year on Form N-Q. The fund’s Forms N-Q are available on the SEC’s website at www.sec.gov and may be reviewed and copied at the SEC’s Public Reference Room in Washington, DC. (phone 1-800-SEC-0330 for information).
Information regarding how the fund voted proxies related to portfolio securities for the most recent 12-month period ended June 30 is available at www.dreyfus.com and on the SEC’s website at www.sec.gov and without charge, upon request, by calling 1-800-DREYFUS.
| | |
© 2015 MBSC Securities Corporation | 
0258AR0815 |

Dreyfus Opportunistic Small Cap Fund
| | | |

| | ANNUAL REPORT
August 31, 2015 |
| |
Save time. Save paper. View your next shareholder report online as soon as it’s available. Log into www.dreyfus.com and sign up for Dreyfus eCommunications. It’s simple and only takes a few minutes. |
| |
The views expressed in this report reflect those of the portfolio manager only through the end of the period covered and do not necessarily represent the views of Dreyfus or any other person in the Dreyfus organization. Any such views are subject to change at any time based upon market or other conditions and Dreyfus disclaims any responsibility to update such views. These views may not be relied on as investment advice and, because investment decisions for a Dreyfus fund are based on numerous factors, may not be relied on as an indication of trading intent on behalf of any Dreyfus fund. |
| |
Not FDIC-Insured • Not Bank-Guaranteed • May Lose Value |
Contents
T H E F U N D
F O R M O R E I N F O R M AT I O N
Back Cover
| | | | |
| |
Dreyfus Opportunistic Small Cap Fund
| | The Fund |
A LETTER FROM THE PRESIDENT
Dear Shareholder:
We are pleased to present this annual report for Dreyfus Opportunistic Small Cap Fund, covering the 12-month period from September 1, 2014, through August 31, 2015. For information about how the fund performed during the reporting period, as well as general market perspectives, we provide a Discussion of Fund Performance on the pages that follow.
Financial markets proved volatile over the reporting period. For much of the year, a recovering U.S. economy enabled stocks to advance, but those gains were erased in August when economic concerns in China, falling commodity prices and a stronger U.S. dollar sparked sharp corrections in equity markets throughout the world. The emerging markets were especially hard hit in this environment. U.S. bonds generally fared better, rallying in late 2014 due to robust investor demand before reversing course in the spring as the domestic economy strengthened. Global economic instability in August hurt corporate-backed and inflation-linked bonds, but U.S. government securities held up relatively well.
We expect market uncertainty and volatility to persist over the near term as investors vacillate between hopes that current market turmoil represents a healthy correction and fears that further disappointments could trigger a full-blown bear market. Our investment strategists and portfolio managers are monitoring developments carefully, keeping a close watch on Chinese fiscal and monetary policy, liquidity factors affecting various asset classes, and other developments that could influence investor sentiment. Over the longer term, we remain confident that financial markets are likely to stabilize as the world adjusts to slower Chinese economic growth, abundant energy resources, and the anticipated eventual normalization of monetary policy. In our view, investors will continue to be well served under these circumstances by a long-term perspective and a disciplined investment approach.
Thank you for your continued confidence and support.
Sincerely,

J. Charles Cardona
President
The Dreyfus Corporation
September 15, 2015
2
DISCUSSION OF FUND PERFORMANCE
For the period of September 1, 2014, through August 31, 2015, as provided by David A. Daglio, Primary Portfolio Manager
Fund and Market Performance Overview
For the 12-month period ended August 31, 2015, Dreyfus Opportunistic Small Cap Fund produced a total return of 0.18%.1 In comparison, the fund’s benchmark, the Russell 2000® Index (the “Index”), produced a total return of 0.03%.2
Moderate market gains over much of the reporting period were balanced by subsequent declines triggered by global economic concerns. The fund modestly outperformed its benchmark, mainly due to favorable results in the energy, industrials, and financials sectors.
The Fund’s Investment Approach
The fund seeks capital appreciation. The fund normally invests at least 80% of its assets in the stocks of small-cap companies. The fund currently considers small-cap companies to be those companies with market capitalizations that fall within the range of companies in the Index. Stocks are selected for the fund’s portfolio based primarily on bottom-up fundamental analysis. The fund’s team of portfolio managers uses a disciplined investment process that relies, in general, on proprietary fundamental research and valuation. Generally, elements of the process include analysis of mid-cycle business prospects, estimation of the intrinsic value of the company, and the identification of a revaluation trigger. Intrinsic value is based on the combination of the valuation assessment of the company’s operating divisions with the firm’s economic balance sheet. Mid-cycle estimates, growth prospects, and competitive advantages are some of the factors used in the valuation assessment. A company’s stated and hidden liabilities and assets are included in the portfolio manager’s economic balance sheet calculation. Sector overweights and underweights are a function of the relative attractiveness of securities within the fund’s investable universe. The fund’s portfolio managers invest in stocks that they believe have attractive reward to risk opportunities and may actively adjust the fund’s portfolio to reflect new developments.
Global Economic Concerns Sparked Market Volatility
The reporting period began in the midst of a market downturn in September and early October 2014, but U.S. employment gains, better consumer confidence, and improved business sentiment prompted a quick market recovery. Consequently, some broad market indices climbed to record highs through the end of February 2015.
Investors responded negatively in March to sluggish economic growth stemming from severe winter weather and an appreciating U.S. dollar. However, the U.S. economy regained traction in the spring, and stocks resumed their advance until uncertainty regarding a debt crisis in Greece and slowing economic growth in China again sent U.S. stock prices lower over the summer.
Allocations and Selections Bolstered Relative Performance
The fund outperformed its benchmark on the strength of our security selection and sector allocation strategies, which enabled us to successfully navigate the opportunities and pitfalls of heightened market volatility over the reporting period.
3
DISCUSSION OF FUND PERFORMANCE (continued)
Most notably, we maintained substantially underweighted exposure to the energy sector, which helped cushion the brunt of the sector’s losses as commodity prices fell. Positive results in the industrials sector were driven by company-specific opportunities and broad exposure to the recovery in business spending. For example, employment services provider Korn/Ferry International, office furniture supplier Steelcase, and carpet tiles maker Interface benefited from rising employment and office renovation activity. Among financial companies, overweighted exposure to small- and midcap banks buoyed returns. Investment bank SVB Financial Group benefited from robust financing activity in the information technology sector, and regional bank South State Corp. prospered amid a robust economic recovery in the southeastern United States. Other individual contributors included Office Depot, which announced a merger agreement with Staples, Emergent BioSolutions, which demonstrated better capital management, and Dealertrack Technologies, which agreed to a takeover offer.
On the other hand, the fund’s relative performance was undermined to a degree by the materials sector, where a turnaround in company fundamentals has taken longer to materialize than expected for precious metals producers such as New Gold and Allied Nevada Gold. Results from the consumer discretionary sector were dampened when expectations for fundamental improvement were not met by private education services company Apollo Education Group and identity theft protection services provider Lifelock.
Selectively Positioned for Continued U.S. Economic Growth
Despite ongoing turmoil in overseas markets, the U.S. economy has continued to grow. At the same time, we have been encouraged by positive investor sentiment surrounding U.S.-centric small-cap companies that have been relatively insulated from international economic instability. Therefore, we believe that many small-cap stocks are well positioned for the remainder of 2015 and beyond.
However, in our judgment, selectivity is likely to be key to investment performance over the months ahead. We have intensified our focus on underlying company fundamentals and attractive intrinsic values. The fund ended the reporting period with overweighted positions in the financials, information technology, and industrials sectors, but we remain cautious regarding the fundamental prospects of most energy companies. In addition, we have found relatively few companies meeting our investment criteria in the utilities and telecommunications services sectors.
September 15, 2015
Please note, the position in any security highlighted with italicized typeface was sold during the reporting period.
Equity funds are subject generally to market, market sector, market liquidity, issuer, and investment style risks, among other factors, to varying degrees, all of which are more fully described in the fund’s prospectus.
Stocks of small-cap companies often experience sharper price fluctuations than stocks of large-cap companies.
1 Total return includes reinvestment of dividends and any capital gains paid. Past performance is no guarantee of future results. Share price and investment return fluctuate such that upon redemption fund shares may be worth more or less than their original cost.
2 SOURCE: LIPPER INC. — Reflects the reinvestment of dividends and, where applicable, capital gain distributions. The Russell 2000® Index is an unmanaged index of small-cap stock performance and is composed of the 2,000 smallest companies in the Russell 3000® Index. The Russell 3000® Index is composed of the 3,000 largest U.S. companies based on total market capitalization. Investors cannot invest directly in any index.
4
FUND PERFORMANCE
Comparison of change in value of $10,000 investment in Dreyfus Opportunistic Small Cap Fund with the Russell 2000 Index
| | | | |
Average Annual Total Returns as of 8/31/15 | |
| | | | |
| 1 Year | 5 Years | 10 Years |
Fund | 0.18% | 15.88% | 9.69% |
Russell 2000 Index | 0.03% | 15.55% | 7.12% |
†Source: Lipper Inc.
Past performance is not predictive of future performance. The fund’s performance shown in the graph and table does not reflect the deduction of taxes that a shareholder would pay on fund distributions or the redemption of fund shares.
The above graph compares a $10,000 investment made in Dreyfus Opportunistic Small Cap Fund on 8/31/05 to a $10,000 investment made in the Russell 2000 Index (the “Index”) on that date. All dividends and capital gain distributions are reinvested.
The fund’s performance shown in the line graph above takes into account all applicable fees and expenses. The Index is an unmanaged index and is composed of the 2,000 smallest companies in the Russell 3000 Index. The Russell 3000 Index measures the performance of the largest 3,000 U.S. companies representing approximately 98% of the investable U.S. equity market. Unlike a mutual fund, the Index is not subject to charges, fees and other expenses. Investors cannot invest directly in any index. Further information relating to fund performance, including expense reimbursements, if applicable, is contained in the Financial Highlights section of the prospectus and elsewhere in this report.
5
UNDERSTANDING YOUR FUND’S EXPENSES (Unaudited)
As a mutual fund investor, you pay ongoing expenses, such as management fees and other expenses. Using the information below, you can estimate how these expenses affect your investment and compare them with the expenses of other funds. You also may pay one-time transaction expenses, including sales charges (loads) and redemption fees, which are not shown in this section and would have resulted in higher total expenses. For more information, see your fund’s prospectus or talk to your financial adviser.
Review your fund’s expenses
The table below shows the expenses you would have paid on a $1,000 investment in Dreyfus Opportunistic Small Cap Fund from March 1, 2015 to August 31, 2015. It also shows how much a $1,000 investment would be worth at the close of the period, assuming actual returns and expenses.
| | | | | | | | | |
Expenses and Value of a $1,000 Investment |
assuming actual returns for the six months ended August 31, 2015 | | |
| | | | | | | | | |
Expenses paid per $1,000† | | | $ 5.39 | | | |
Ending value (after expenses) | | | $ 980.40 | | | |
COMPARING YOUR FUND’S EXPENSES
WITH THOSE OF OTHER FUNDS (Unaudited)
Using the SEC’s method to compare expenses
The Securities and Exchange Commission (SEC) has established guidelines to help investors assess fund expenses. Per these guidelines, the table below shows your fund’s expenses based on a $1,000 investment, assuming a hypothetical 5% annualized return. You can use this information to compare the ongoing expenses (but not transaction expenses or total cost) of investing in the fund with those of other funds. All mutual fund shareholder reports will provide this information to help you make this comparison. Please note that you cannot use this information to estimate your actual ending account balance and expenses paid during the period.
| | | | | | | | | |
Expenses and Value of a $1,000 Investment |
assuming a hypothetical 5% annualized return for the six months ended August 31, 2015 |
| | | | | | | | | |
Expenses paid per $1,000† | | | $ 5.50 | | | |
Ending value (after expenses) | | | $ 1,019.76 | | | |
† Expenses are equal to the fund’s annualized expense ratio of 1.08%, multiplied by the average account value over the period, multiplied by 184/365 (to reflect the one-half year period).
6
STATEMENT OF INVESTMENTS
August 31, 2015
||ANAME||
| | | | | | | | | |
Common Stocks - 99.2% | | Shares | | Value ($) | |
Automobiles & Components - 1.0% | | | | | |
Winnebago Industries | | 459,268 | a | 9,405,809 | |
Banks - 16.0% | | | | | |
Ameris Bancorp | | 473,207 | | 12,904,355 | |
BofI Holding | | 99,661 | a,b | 11,544,730 | |
Columbia Banking System | | 357,682 | | 10,841,341 | |
CVB Financial | | 407,537 | | 6,622,476 | |
EverBank Financial | | 1,221,850 | | 24,168,193 | |
Pinnacle Financial Partners | | 192,470 | | 9,126,927 | |
Simmons First National, Cl. A | | 117,686 | | 5,162,885 | |
South State | | 216,570 | | 16,275,236 | |
SVB Financial Group | | 282,852 | b | 35,379,128 | |
Talmer Bancorp, Cl. A | | 847,050 | | 13,764,563 | |
WesBanco | | 157,263 | | 4,842,128 | |
| | | | | 150,631,962 | |
Capital Goods - 6.5% | | | | | |
Altra Industrial Motion | | 162,630 | | 4,067,376 | |
Beacon Roofing Supply | | 91,830 | b | 3,328,838 | |
Encore Wire | | 149,000 | | 4,838,030 | |
Generac Holdings | | 390,694 | a,b | 12,080,259 | |
Simpson Manufacturing | | 502,306 | | 17,535,502 | |
Thermon Group Holdings | | 856,281 | b | 19,591,709 | |
| | | | | 61,441,714 | |
Commercial & Professional Services - 11.0% | | | | | |
Herman Miller | | 343,825 | | 9,321,096 | |
HNI | | 166,073 | | 7,762,252 | |
Huron Consulting Group | | 73,045 | b | 5,287,728 | |
Interface | | 715,642 | | 17,347,162 | |
Knoll | | 247,473 | | 5,919,554 | |
Korn/Ferry International | | 468,617 | | 15,965,781 | |
Steelcase, Cl. A | | 1,282,915 | | 22,617,791 | |
TrueBlue | | 784,560 | b | 18,829,440 | |
| | | | | 103,050,804 | |
Consumer Durables & Apparel - 1.2% | | | | | |
WCI Communities | | 439,588 | b | 10,954,533 | |
Consumer Services - .1% | | | | | |
Fogo De Chao | | 70,300 | a | 1,351,166 | |
Diversified Financials - 3.7% | | | | | |
FNFV Group | | 309,817 | b | 4,483,052 | |
7
STATEMENT OF INVESTMENTS (continued)
| | | | | | | | | | | |
Common Stocks - 99.2% (continued) | | Shares | | Value ($) | |
Diversified Financials - 3.7% (continued) | | | | | |
Raymond James Financial | | 336,585 | | 17,835,639 | |
SLM | | 1,479,435 | b | 12,545,609 | |
| | | | | 34,864,300 | |
Energy - 1.0% | | | | | |
Western Refining | | 213,852 | | 9,199,913 | |
Exchange-Traded Funds - .9% | | | | | |
iShares Russell 2000 ETF | | 71,636 | a | 8,251,034 | |
Health Care Equipment & Services - | | | | | |
HeartWare International | | 263,443 | b | 22,550,721 | |
Insurance - .9% | | | | | |
Primerica | | 201,334 | | 8,554,682 | |
Materials - 4.9% | | | | | |
Chemtura | | 359,754 | b | 9,785,309 | |
New Gold | | 1,137,399 | b | 2,616,018 | |
OMNOVA Solutions | | 1,412,938 | b | 8,887,380 | |
Royal Gold | | 62,075 | | 2,987,049 | |
Trinseo SA | | 446,953 | a,b | 13,024,210 | |
Yamana Gold | | 4,643,013 | | 8,728,864 | |
| | | | | 46,028,830 | |
Media - 4.5% | | | | | |
Entravision Communications, Cl. A | | 450,913 | | 3,629,850 | |
Media General | | 534,644 | b | 6,282,067 | |
Nexstar Broadcasting Group, Cl. A | | 281,777 | | 13,096,995 | |
Sinclair Broadcast Group, Cl. A | | 705,203 | a | 18,885,336 | |
| | | | | 41,894,248 | |
Pharmaceuticals, Biotechnology & Life Sciences - 12.5% | | | | | |
Emergent BioSolutions | | 804,028 | b | 26,766,092 | |
Flamel Technologies, ADR | | 678,136 | b | 15,020,712 | |
GW Pharmaceuticals, ADR | | 214,528 | a,b | 22,815,053 | |
Revance Therapeutics | | 743,363 | a,b | 22,494,164 | |
Sangamo BioSciences | | 570,623 | b | 4,313,910 | |
TherapeuticsMD | | 4,287,927 | a,b | 26,284,993 | |
| | | | | 117,694,924 | |
Real Estate - 4.3% | | | | | |
American Residential Properties | | 740,645 | c | 12,553,933 | |
Ladder Capital, Cl. A | | 783,700 | | 12,210,046 | |
Realogy Holdings | | 388,027 | b | 15,637,488 | |
| | | | | 40,401,467 | |
Retailing - 2.2% | | | | | |
Office Depot | | 2,638,554 | b | 20,923,733 | |
8
| | | | | | | | | | | | | | |
Common Stocks - 99.2% (continued) | | Shares | | Value ($) | |
Semiconductors & Semiconductor Equipment - 6.0% | | | | | |
Applied Micro Circuits | | 1,731,211 | a,b | 10,127,584 | |
Lattice Semiconductor | | 280,653 | b | 1,173,130 | |
Mellanox Technologies | | 276,873 | b | 11,196,744 | |
Microsemi | | 441,646 | b | 14,026,677 | |
Veeco Instruments | | 871,513 | b | 20,105,805 | |
| | | | | 56,629,940 | |
Software & Services - 6.7% | | | | | |
CoreLogic | | 623,668 | b | 23,668,201 | |
Dealertrack Technologies | | 162,402 | b | 10,192,350 | |
Infoblox | | 1,223,345 | b | 23,537,158 | |
Tableau Software, Cl. A | | 55,155 | b | 5,193,946 | |
| | | | | 62,591,655 | |
Technology Hardware & Equipment - 11.6% | | | | | |
Arrow Electronics | | 295,259 | b | 16,510,883 | |
Ciena | | 815,750 | a,b | 18,240,170 | |
FEI | | 125,416 | | 9,466,400 | |
Jabil Circuit | | 162,985 | | 3,153,760 | |
Keysight Technologies | | 164,905 | | 5,283,556 | |
Lumentum Holdings | | 337,261 | | 6,657,532 | |
ScanSource | | 502,245 | b | 19,185,759 | |
Tech Data | | 60,056 | b | 3,918,053 | |
Universal Display | | 475,136 | a,b | 17,504,010 | |
Viavi Solutions | | 1,686,333 | b | 9,055,608 | |
| | | | | 108,975,731 | |
Transportation - 1.8% | | | | | |
ArcBest | | 97,720 | | 2,822,154 | |
Diana Shipping | | 1,325,665 | b | 9,014,522 | |
Scorpio Bulkers | | 3,169,363 | a,b | 5,197,755 | |
| | | | | 17,034,431 | |
Total Common Stocks (cost $831,033,420) | | | | 932,431,597 | |
Other Investments - .6% | | | | | |
Registered Investment Company; | | | | | |
Dreyfus Institutional Preferred Plus Money Market Fund | | 5,945,821 | d | 5,945,821 | |
(cost $5,945,821) | | | | | |
Investment of Cash Collateral for Securities Loaned - 7.4% | | | | | |
Registered Investment Company; | | | | | |
Dreyfus Institutional Cash Advantage Fund | | 69,388,897 | d | 69,388,897 | |
(cost $69,388,897) | | | | | |
Total Investments (cost $906,368,138) | | 107.2% | | 1,007,766,315 | |
9
STATEMENT OF INVESTMENTS (continued)
| | | | | | |
Liabilities, Less Cash and Receivables | | (7.2%) | | (67,530,927) | |
Net Assets | | 100.0% | | 940,235,388 | |
ADR—American Depository Receipt
ETF—Exchange-Traded Fund
aSecurity, or portion thereof, on loan. At August 31, 2015, the value of the fund's securities on loan was $75,071,465 and the value of the collateral held by the fund was $77,136,499, consisting of cash collateral of $69,388,897 and U.S. Government & Agency securities valued at $7,747,602.
bNon-income producing security.
cInvestment in real estate investment trust.
dInvestment in affiliated money market mutual fund.
| | |
Portfolio Summary (Unaudited) † | Value (%) |
Banks | 16.0 |
Pharmaceuticals, Biotechnology & Life Sciences | 12.5 |
Technology Hardware & Equipment | 11.6 |
Commercial & Professional Services | 11.0 |
Money Market Investments | 8.0 |
Software & Services | 6.7 |
Capital Goods | 6.5 |
Semiconductors & Semiconductor Equipment | 6.0 |
Materials | 4.9 |
Media | 4.5 |
Real Estate | 4.3 |
Diversified Financials | 3.7 |
Health Care Equipment & Services | 2.4 |
Retailing | 2.2 |
Transportation | 1.8 |
Consumer Durables & Apparel | 1.2 |
Automobiles & Components | 1.0 |
Energy | 1.0 |
Exchange-Traded Funds | .9 |
Insurance | .9 |
Consumer Services | .1 |
| | 107.2 |
†Based on net assets.
See notes to financial statements.
10
STATEMENT OF ASSETS AND LIABILITIES
August 31, 2015
| | | | | | | |
| | | Cost | | Value |
Assets ($): | | | |
Investments in securities—See Statement of Investments
(including securities on loan, valued at $75,071,465)—Note 1(b): | | | | |
Unaffiliated issuers | | 831,033,420 | | 932,431,597 |
Affiliated issuers | | 75,334,718 | | 75,334,718 |
Cash | | | | | 4,404,710 |
Receivable for investment securities sold | | | | | 2,019,683 |
Receivable for shares of Common Stock subscribed | | | | | 1,197,797 |
Dividends and securities lending income receivable | | | | | 245,680 |
Prepaid expenses | | | | | 13,560 |
| | | | | 1,015,647,745 |
Liabilities ($): | | | |
Due to The Dreyfus Corporation and affiliates—Note 3(b) | | | | | 888,979 |
Liability for securities on loan—Note 1(b) | | | | | 69,388,897 |
Payable for investment securities purchased | | | | | 4,501,695 |
Payable for shares of Common Stock redeemed | | | | | 530,279 |
Accrued expenses | | | | | 102,507 |
| | | | | 75,412,357 |
Net Assets ($) | | | 940,235,388 |
Composition of Net Assets ($): | | | |
Paid-in capital | | | | | 838,337,541 |
Accmulated investment (loss)—net | | | | | (3,847,924) |
Accumulated net realized gain (loss) on investments | | | | | 4,347,594 |
Accumulated net unrealized appreciation (depreciation)
on investments | | | | | 101,398,177 |
Net Assets ($) | | | 940,235,388 |
Shares Outstanding | | |
(200 million shares of $.001 par value Common Stock authorized) | | 30,876,754 |
Net Asset Value Per Share ($) | | 30.45 |
See notes to financial statements.
11
STATEMENT OF OPERATIONS
Year Ended August 31, 2015
| | | | | | | |
| | | | | | |
| | | | | | |
Investment Income ($): | | | | |
Income: | | | | |
Cash dividends (net of $20,854 foreign taxes withheld at source): | | | | |
Unaffliated issuers | | | 6,085,583 | |
Affliated issuers | | | 11,464 | |
Income from securities lending—Note 1(b) | | | 228,621 | |
Total Income | | | 6,325,668 | |
Expenses: | | | | |
Management fee—Note 3(a) | | | 7,007,258 | |
Shareholder servicing costs—Note 3(b) | | | 2,869,418 | |
Custodian fees—Note 3(b) | | | 88,548 | |
Professional fees | | | 59,075 | |
Directors' fees and expenses—Note 3(c) | | | 45,794 | |
Prospectus and shareholders’ reports | | | 34,450 | |
Registration fees | | | 26,526 | |
Loan commitment fees—Note 2 | | | 10,238 | |
Miscellaneous | | | 29,099 | |
Total Expenses | | | 10,170,406 | |
Less—reduction in fees due to earnings credits—Note 3(b) | | | (288) | |
Net Expenses | | | 10,170,118 | |
Investment (Loss)—Net | | | (3,844,450) | |
Realized and Unrealized Gain (Loss) on Investments—Note 4 ($): | | |
Net realized gain (loss) on investments | | | 28,084,691 | a |
Net unrealized appreciation (depreciation) on investments | | | (56,776,643) | |
Net Realized and Unrealized Gain (Loss) on Investments | | | (28,691,952) | |
Net (Decrease) in Net Assets Resulting from Operations | | (32,536,402) | |
a Includes net realized gain of $8,264,606 for securities redeemed-in-kind. | |
See notes to financial statements.
12
STATEMENT OF CHANGES IN NET ASSETS
| | | | | | | | | | |
| | | | | | | | | | |
| | | | Year Ended August 31, |
| | | | 2015 | | | | 2014 | |
Operations ($): | | | | | | | | |
Investment (loss)—net | | | (3,844,450) | | | | (3,818,017) | |
Net realized gain (loss) on investments | | 28,084,691 | | | | 179,007,894 | |
Net unrealized appreciation (depreciation)
on investments | | (56,776,643) | | | | (21,646,674) | |
Net Increase (Decrease) in Net Assets
Resulting from Operations | (32,536,402) | | | | 153,543,203 | |
Dividends to Shareholders from ($): | | | | | | | | |
Net realized gain on investments | | | (136,261,066) | | | | (117,652,217) | |
Capital Stock Transactions ($): | | | | | | | | |
Net proceeds from shares sold | | | 278,711,391 | | | | 409,179,762 | |
Dividends reinvested | | | 110,475,587 | | | | 97,841,528 | |
Cost of shares redeemeda | | | (442,670,410) | | | | (231,081,362) | |
Increase (Decrease) in Net Assets
from Capital Stock Transactions | (53,483,432) | | | | 275,939,928 | |
Total Increase (Decrease) in Net Assets | (222,280,900) | | | | 311,830,914 | |
Net Assets ($): | | | | | | | | |
Beginning of Period | | | 1,162,516,288 | | | | 850,685,374 | |
End of Period | | | 940,235,388 | | | | 1,162,516,288 | |
Accmulated investment (loss)—net | (3,847,924) | | | | - | |
Capital Share Transactions (Shares): | | | | | | | | |
Shares sold | | | 8,621,489 | | | | 11,449,047 | |
Shares issued for dividends reinvested | | | 3,648,467 | | | | 2,911,950 | |
Shares redeemeda | | | (13,799,475) | | | | (6,469,635) | |
Net Increase (Decrease) in Shares Outstanding | (1,529,519) | | | | 7,891,362 | |
a During the period ended August 31, 2015, 7,011,133 shares amounting to $223,795,369 were redeemed-in-kind resulting in a net realized gain on investments of $8,264,606. | | |
See notes to financial statements.
13
FINANCIAL HIGHLIGHTS
The following table describes the performance for the fiscal periods indicated. Total return shows how much your investment in the fund would have increased (or decreased) during each period, assuming you had reinvested all dividends and distributions. These figures have been derived from the fund’s financial statements.
| | | | | | | |
| | | | | |
| | Year Ended August 31, |
| | | 2015 | 2014 | 2013 | 2012 | 2011 |
Per Share Data ($): | | | | | | |
Net asset value, beginning of period | 35.87 | 34.70 | 26.02 | 24.90 | 22.49 |
Investment Operations: | | | | | | |
Investment (loss)—neta | (.13) | (.13) | (.09) | (.13) | (.07) |
Net realized and unrealized gain (loss) on investments | .17 | 5.70 | 8.77 | 4.27 | 2.97 |
Total from Investment Operations | .04 | 5.57 | 8.68 | 4.14 | 2.90 |
Distributions: | | | | | | |
Dividends from investment income—net | | - | - | - | - | (.00)b |
Dividends from net realized gain on investments | (5.46) | (4.40) | - | (3.02) | (.49) |
Total Distributions | (5.46) | (4.40) | - | (3.02) | (.49) |
Net asset value, end of period | 30.45 | 35.87 | 34.70 | 26.02 | 24.90 |
Total Return (%) | .18 | 16.95 | 33.36 | 18.81 | 12.57 |
Ratios/Supplemental Data (%): | | | | | |
Ratio of total expenses to average net assets | 1.09 | 1.10 | 1.13 | 1.19 | 1.16 |
Ratio of net expenses to average net assets | | 1.09 | 1.10 | 1.13 | 1.19 | 1.16 |
Ratio of net investment (loss) to average net assets | (.41) | (.35) | (.29) | (.52) | (.23) |
Portfolio Turnover Rate | 74.06 | 88.69 | 94.62 | 85.92 | 123.29 |
Net Assets, end of period ($ x 1,000) | 940,235 | 1,162,516 | 850,685 | 595,337 | 573,898 |
a Based on average shares outstanding.
b Amount represents less than $.01 per share.
See notes to financial statements.
14
NOTES TO FINANCIAL STATEMENTS
NOTE 1—Significant Accounting Policies:
Dreyfus Opportunistic Small Cap Fund (the “fund”) is a separate diversified series of Advantage Funds, Inc. (the “Company”), which is registered under the Investment Company Act of 1940, as amended (the “Act”), as an open-end management investment company and operates as a series company currently offering eleven series, including the fund. The fund’s investment objective is to seek capital appreciation. The Dreyfus Corporation (the “Manager” or “Dreyfus”), a wholly-owned subsidiary of The Bank of New York Mellon Corporation (“BNY Mellon”), serves as the fund’s investment adviser. MBSC Securities Corporation (the “Distributor”), a wholly-owned subsidiary of Dreyfus, is the distributor of the fund’s shares, which are sold to the public without a sales charge.
The Company accounts separately for the assets, liabilities and operations of each series. Expenses directly attributable to each series are charged to that series’ operations; expenses which are applicable to all series are allocated among them on a pro rata basis.
The Financial Accounting Standards Board (“FASB”) Accounting Standards Codification (“ASC”) is the exclusive reference of authoritative U.S. generally accepted accounting principles (“GAAP”) recognized by the FASB to be applied by nongovernmental entities. Rules and interpretive releases of the Securities and Exchange Commission (“SEC”) under authority of federal laws are also sources of authoritative GAAP for SEC registrants. The fund’s financial statements are prepared in accordance with GAAP, which may require the use of management estimates and assumptions. Actual results could differ from those estimates.
The Company enters into contracts that contain a variety of indemnifications. The fund’s maximum exposure under these arrangements is unknown. The fund does not anticipate recognizing any loss related to these arrangements.
(a) Portfolio valuation: The fair value of a financial instrument is the amount that would be received to sell an asset or paid to transfer a liability in an orderly transaction between market participants at the measurement date (i.e., the exit price). GAAP establishes a fair value hierarchy that prioritizes the inputs of valuation techniques used to measure fair value. This hierarchy gives the highest priority to unadjusted quoted prices in active markets for identical assets or liabilities (Level 1 measurements) and the lowest priority to unobservable inputs (Level 3 measurements).
15
NOTES TO FINANCIAL STATEMENTS (continued)
Additionally, GAAP provides guidance on determining whether the volume and activity in a market has decreased significantly and whether such a decrease in activity results in transactions that are not orderly. GAAP requires enhanced disclosures around valuation inputs and techniques used during annual and interim periods.
Various inputs are used in determining the value of the fund’s investments relating to fair value measurements. These inputs are summarized in the three broad levels listed below:
Level 1—unadjusted quoted prices in active markets for identical investments.
Level 2—other significant observable inputs (including quoted prices for similar investments, interest rates, prepayment speeds, credit risk, etc.).
Level 3—significant unobservable inputs (including the fund’s own assumptions in determining the fair value of investments).
The inputs or methodology used for valuing securities are not necessarily an indication of the risk associated with investing in those securities.
Changes in valuation techniques may result in transfers in or out of an assigned level within the disclosure hierarchy. Valuation techniques used to value the fund’s investments are as follows:
Investments in securities are valued at the last sales price on the securities exchange or national securities market on which such securities are primarily traded. Securities listed on the National Market System for which market quotations are available are valued at the official closing price or, if there is no official closing price that day, at the last sales price. For open short positions, asked prices are used for valuation purposes. Bid price is used when no asked price is available. Registered investment companies that are not traded on an exchange are valued at their net asset value. All of the preceding securities are generally categorized within Level 1 of the fair value hierarchy.
Securities not listed on an exchange or the national securities market, or securities for which there were no transactions, are valued at the average of the most recent bid and asked prices. These securities are generally categorized within Level 2 of the fair value hierarchy.
Fair valuing of securities may be determined with the assistance of a pricing service using calculations based on indices of domestic securities and other appropriate indicators, such as prices of relevant ADRs and
16
financial futures. Utilizing these techniques may result in transfers between Level 1 and Level 2 of the fair value hierarchy.
When market quotations or official closing prices are not readily available, or are determined not to reflect accurately fair value, such as when the value of a security has been significantly affected by events after the close of the exchange or market on which the security is principally traded (for example, a foreign exchange or market), but before the fund calculates its net asset value, the fund may value these investments at fair value as determined in accordance with the procedures approved by the Company’s Board of Directors (the “Board”). Certain factors may be considered when fair valuing investments such as: fundamental analytical data, the nature and duration of restrictions on disposition, an evaluation of the forces that influence the market in which the securities are purchased and sold, and public trading in similar securities of the issuer or comparable issuers. These securities are either categorized within Level 2 or 3 of the fair value hierarchy depending on the relevant inputs used.
For restricted securities where observable inputs are limited, assumptions about market activity and risk are used and are generally categorized within Level 3 of the fair value hierarchy.
The following is a summary of the inputs used as of August 31, 2015 in valuing the fund’s investments:
| | | | | |
| | Level 1 - Unadjusted Quoted Prices | Level 2 - Other Significant Observable Inputs | Level 3 -Significant Unobservable Inputs | Total |
Assets ($) | | | | |
Investments in Securities: | | |
Equity Securities—Domestic Common Stocks† | 865,985,394 | - | - | 865,985,394 |
Equity Securities—Foreign Common Stocks† | 58,195,169 | - | - | 58,195,169 |
Exchange—Traded Funds | 8,251,034 | - | - | 8,251,034 |
Mutual Funds | 75,334,718 | - | - | 75,334,718 |
† See Statement of Investments for additional detailed categorizations.
At August 31, 2015, there were no transfers between Level 1 and Level 2 of the fair value hierarchy.
17
NOTES TO FINANCIAL STATEMENTS (continued)
(b) Securities transactions and investment income: Securities transactions are recorded on a trade date basis. Realized gains and losses from securities transactions are recorded on the identified cost basis. Dividend income is recognized on the ex-dividend date and interest income, including, where applicable, accretion of discount and amortization of premium on investments, is recognized on the accrual basis.
Pursuant to a securities lending agreement with The Bank of New York Mellon, a subsidiary of BNY Mellon and an affiliate of Dreyfus, the fund may lend securities to qualified institutions. It is the fund’s policy that, at origination, all loans are secured by collateral of at least 102% of the value of U.S. securities loaned and 105% of the value of foreign securities loaned. Collateral equivalent to at least 100% of the market value of securities on loan is maintained at all times. Collateral is either in the form of cash, which can be invested in certain money market mutual funds managed by Dreyfus, or U.S. Government and Agency securities. The fund is entitled to receive all dividends, interest and distributions on securities loaned, in addition to income earned as a result of the lending transaction. Should a borrower fail to return the securities in a timely manner, The Bank of New York Mellon is required to replace the securities for the benefit of the fund or credit the fund with the market value of the unreturned securities and is subrogated to the fund’s rights against the borrower and the collateral. During the period ended August 31, 2015, The Bank of New York Mellon earned $59,828 from lending portfolio securities, pursuant to the securities lending agreement.
(c) Affiliated issuers: Investments in other investment companies advised by Dreyfus are defined as “affiliated” under the Act. Investments in affiliated investment companies during the period ended August 31, 2015 were as follows:
| | | | | | |
Affiliated Investment Company | Value 8/31/2014 ($) | Purchases ($) | Sales ($) | Value 8/31/2015 ($) | Net Assets (%) |
Dreyfus Institutional Preferred Plus Money Market Fund | 4,531,480 | 292,993,791 | 291,579,450 | 5,945,821 | .6 |
Dreyfus Institutional Cash Advantage Fund | 42,129,685 | 663,422,050 | 636,162,838 | 69,388,897 | 7.4 |
Total | 46,661,165 | 956,415,841 | 927,742,288 | 75,334,718 | 8.0 |
18
(d) Dividends to shareholders: Dividends are recorded on the ex-dividend date. Dividends from investment income-net and dividends from net realized capital gains, if any, are normally declared and paid annually, but the fund may make distributions on a more frequent basis to comply with the distribution requirements of the Internal Revenue Code of 1986, as amended (the “Code”). To the extent that net realized capital gains can be offset by capital loss carryovers, it is the policy of the fund not to distribute such gains. Income and capital gain distributions are determined in accordance with income tax regulations, which may differ from GAAP.
(e) Federal income taxes: It is the policy of the fund to continue to qualify as a regulated investment company, if such qualification is in the best interests of its shareholders, by complying with the applicable provisions of the Code, and to make distributions of taxable income sufficient to relieve it from substantially all federal income and excise taxes.
As of and during the period ended August 31, 2015, the fund did not have any liabilities for any uncertain tax positions. The fund recognizes interest and penalties, if any, related to uncertain tax positions as income tax expense in the Statement of Operations. During the period ended August 31, 2015, the fund did not incur any interest or penalties.
Each tax year in the four-year period ended August 31, 2015 remains subject to examination by the Internal Revenue Service and state taxing authorities.
At August 31, 2015, the components of accumulated earnings on a tax basis were as follows: undistributed ordinary income $2,919,386, undistributed capital gains $15,905,041, accumulated capital losses $8,881,215 and unrealized appreciation $91,954,635.
Under the Regulated Investment Company Modernization Act of 2010 (the “2010 Act”), the fund is permitted to carry forward capital losses incurred in taxable years beginning after December 22, 2010 (“post-enactment losses”) for an unlimited period. Furthermore, post-enactment capital loss carryovers retain their character as either short-term or long-term capital losses rather than short-term as they were under previous statute. The 2010 Act requires post-enactment losses to be utilized before the utilization of losses incurred in taxable years prior to the effective date of the 2010 Act (“pre-enactment losses”). As a result of this ordering rule, pre-enactment losses may be more likely to expire unused.
As a result of the fund’s merger with Dreyfus Emerging Leaders Fund, capital losses of $8,881,215 are available to offset future gains, if any. Based on certain provisions in the Code, the amount of losses which can
19
NOTES TO FINANCIAL STATEMENTS (continued)
be utilized in subsequent years is subject to an annual limitation. If not applied, these acquired capital losses expire in fiscal year 2017.
The tax character of distributions paid to shareholders during the fiscal periods ended August 31, 2015 and August 31, 2014 were as follows: ordinary income $37,560,707 and $11,212,224, and long-term capital gains $98,700,359 and $106,439,993, respectively.
During the period ended August 31, 2015, as a result of permanent book to tax differences, primarily due to the tax treatment for dividend reclassification, gains from redemptions-in-kind and limited partnership adjustments, the fund decreased accumulated undistributed investment income-net by $3,474, decreased accumulated net realized gain (loss) on investments by $8,261,132 and increased paid-in capital by $8,264,606. Net assets and net asset value per share were not affected by this reclassification.
NOTE 2—Bank Lines of Credit:
The fund participates with other Dreyfus-managed funds in a $430 million unsecured credit facility led by Citibank, N.A. and a $300 million unsecured credit facility provided by The Bank of New York Mellon (each, a “Facility”), each to be utilized primarily for temporary or emergency purposes, including the financing of redemptions. Prior to October 8, 2014, the unsecured credit facility with Citibank, N.A. was $265 million. In connection therewith, the fund has agreed to pay its pro rata portion of commitment fees for each Facility. Interest is charged to the fund based on rates determined pursuant to the terms of the respective Facility at the time of borrowing. During the period ended August 31, 2015, the fund did not borrow under the Facilities.
NOTE 3—Management Fee and Other Transactions with Affiliates:
(a) Pursuant to a management agreement with Dreyfus, the management fee is computed at the annual rate of .75% of the value of the fund’s average daily net assets and is payable monthly.
(b) Under the Shareholder Services Plan, the fund pays the Distributor for the provision of certain services, at an annual rate of .25% of the value of the fund’s average daily net assets for the provision of certain services. The services provided may include personal services relating to shareholder accounts, such as answering shareholder inquiries regarding the fund and providing reports and other information, and services related to the maintenance of shareholder accounts. The Distributor may make payments to Service Agents (securities dealers, financial institutions or other industry
20
professionals) with respect to these services. The Distributor determines the amounts to be paid to Service Agents. During the period ended August 31, 2015, the fund was charged $2,335,753 pursuant to the Shareholder Services Plan.
The fund has arrangements with the transfer agent and the custodian whereby the fund may receive earnings credits when positive cash balances are maintained, which are used to offset transfer agency and custody fees. For financial reporting purposes, the fund includes net earnings credits as an expense offset in the Statement of Operations.
The fund compensates Dreyfus Transfer, Inc., a wholly-owned subsidiary of Dreyfus, under a transfer agency agreement for providing transfer agency and cash management services for the fund. The majority of transfer agency fees are comprised of amounts paid on a per account basis, while cash management fees are related to fund subscriptions and redemptions. During the period ended August 31, 2015, the fund was charged $123,218 for transfer agency services and $7,173 for cash management services. These fees are included in Shareholder servicing costs in the Statement of Operations. Cash management fees were partially offset by earnings credits of $288.
The fund compensates The Bank of New York Mellon under a custody agreement for providing custodial services for the fund. These fees are determined based on net assets, geographic region and transaction activity. During the period ended August 31, 2015, the fund was charged $88,548 pursuant to the custody agreement.
During the period ended August 31, 2015, the fund was charged $10,965 for services performed by the Chief Compliance Officer and his staff.
The components of “Due to The Dreyfus Corporation and affiliates” in the Statement of Assets and Liabilities consist of: management fees $614,492, Shareholder Services Plan fees $204,831, custodian fees $49,019, Chief Compliance Officer fees $1,737 and transfer agency fees $18,900.
(c) Each Board member also serves as a Board member of other funds within the Dreyfus complex. Annual retainer fees and attendance fees are allocated to each fund based on net assets.
NOTE 4—Securities Transactions:
The aggregate amount of purchases and sales of investment securities, excluding short-term securities, during the period ended August 31, 2015, amounted to $684,351,370 and $868,074,201, respectively.
21
NOTES TO FINANCIAL STATEMENTS (continued)
At August 31, 2015, the cost of investments for federal income tax purposes was $915,811,680; accordingly, accumulated net unrealized appreciation on investments was $91,954,635, consisting of $152,795,512 gross unrealized appreciation and $60,840,877 gross unrealized depreciation.
22
REPORT OF INDEPENDENT REGISTERED
PUBLIC ACCOUNTING FIRM
Shareholders and Board of Directors
Dreyfus Opportunistic Small Cap Fund
We have audited the accompanying statement of assets and liabilities, including the statement of investments, of Dreyfus Opportunistic Small Cap Fund (one of the series comprising Advantage Funds, Inc.) as of August 31, 2015, and the related statement of operations for the year then ended, the statement of changes in net assets for each of the two years in the period then ended, and the financial highlights for each of the five years in the period then ended. These financial statements and financial highlights are the responsibility of the Fund’s management. Our responsibility is to express an opinion on these financial statements and financial highlights based on our audits.
We conducted our audits in accordance with the standards of the Public Company Accounting Oversight Board (United States). Those standards require that we plan and perform the audit to obtain reasonable assurance about whether the financial statements and financial highlights are free of material misstatement. We were not engaged to perform an audit of the Fund’s internal control over financial reporting. Our audits included consideration of internal control over financial reporting as a basis for designing audit procedures that are appropriate in the circumstances, but not for the purpose of expressing an opinion on the effectiveness of the Fund’s internal control over financial reporting. Accordingly, we express no such opinion. An audit also includes examining, on a test basis, evidence supporting the amounts and disclosures in the financial statements and financial highlights, assessing the accounting principles used and significant estimates made by management, and evaluating the overall financial statement presentation. Our procedures included confirmation of securities owned as of August 31, 2015 by correspondence with the custodian and others. We believe that our audits provide a reasonable basis for our opinion.
In our opinion, the financial statements and financial highlights referred to above present fairly, in all material respects, the financial position of Dreyfus Opportunistic Small Cap Fund at August 31, 2015, the results of its operations for the year then ended, the changes in its net assets for each of the two years in the period then ended, and the financial highlights for each of the five years in the period then ended, in conformity with U.S. generally accepted accounting principles.

New York, New York
October 28, 2015
23
IMPORTANT TAX INFORMATION (Unaudited)
For federal tax purposes, the fund hereby reports 13.86% of the ordinary dividends paid during the fiscal year ended August 31, 2015 as qualifying for the corporate dividends received deduction. Also, certain dividends paid by the fund may be subject to a maximum tax rate of 15%, as provided for by the Jobs and Growth Tax Relief Reconciliation Act of 2003. Of the distributions paid during the fiscal year, $2,036 represents the maximum amount that may be considered qualified dividend income. The fund also hereby reports $1.5060 per share as a short-term capital gain distribution and $3.9574 per share as a long-term capital gain distribution paid on December 18, 2014. Shareholders will receive notification in early 2016 of the percentage applicable to the preparation of their 2015 income tax returns.
24
INFORMATION ABOUT THE RENEWAL OF THE FUND'S MANAGEMENT AGREEMENT (Unaudited)
At a meeting of the fund’s Board of Directors held on March 11-12, 2015, the Board considered the renewal of the fund’s Management Agreement pursuant to which Dreyfus provides the fund with investment advisory and administrative services (the “Agreement”). The Board members, none of whom are “interested persons” (as defined in the Investment Company Act of 1940, as amended) of the fund, were assisted in their review by independent legal counsel and met with counsel in executive session separate from Dreyfus representatives. In considering the renewal of the Agreement, the Board considered all factors that it believed to be relevant, including those discussed below. The Board did not identify any one factor as dispositive, and each Board member may have attributed different weights to the factors considered.
Analysis of Nature, Extent, and Quality of Services Provided to the Fund. The Board considered information provided to them at the meeting and in previous presentations from Dreyfus representatives regarding the nature, extent, and quality of the services provided to funds in the Dreyfus fund complex. Dreyfus provided the number of open accounts in the fund, the fund’s asset size and the allocation of fund assets among distribution channels. Dreyfus also had previously provided information regarding the diverse intermediary relationships and distribution channels of funds in the Dreyfus fund complex (such as retail direct or intermediary, in which intermediaries typically are paid by the fund and/or Dreyfus) and Dreyfus’ corresponding need for broad, deep, and diverse resources to be able to provide ongoing shareholder services to each intermediary or distribution channel, as applicable to the fund.
The Board also considered research support available to, and portfolio management capabilities of, the fund’s portfolio management personnel and that Dreyfus also provides oversight of day-to-day fund operations, including fund accounting and administration and assistance in meeting legal and regulatory requirements. The Board also considered Dreyfus’ extensive administrative, accounting and compliance infrastructures. The Board also considered portfolio management’s brokerage policies and practices (including policies and practices regarding soft dollars) and the standards applied in seeking best execution.
Comparative Analysis of the Fund’s Performance and Management Fee and Expense Ratio. The Board reviewed reports prepared by Lipper, Inc. (“Lipper”), an independent provider of investment company data, which included information comparing (1) the fund’s performance with the performance of a group of comparable funds (the “Performance Group”) and with a broader group of funds (the “Performance Universe”), all for various periods ended December 31, 2014, and (2) the fund’s actual and contractual management fees and total expenses with those of a group of comparable funds (the “Expense Group”) and with a broader group of funds (the “Expense Universe”), the information for which was derived in part from fund financial statements available to Lipper as of the date of its analysis. Dreyfus previously had furnished the Board with a description of the methodology Lipper used to select the
25
INFORMATION ABOUT THE RENEWAL OF THE FUND'S MANAGEMENT AGREEMENT (Unaudited) (continued)
Performance Group and Performance Universe and the Expense Group and Expense Universe.
Dreyfus representatives stated that the usefulness of performance comparisons may be affected by a number of factors, including different investment limitations that may be applicable to the fund and comparison funds. They also noted that performance generally should be considered over longer periods of time, although it is possible that long-term performance can be adversely affected by even one period of significant underperformance so that a single investment decision or theme has the ability to affect disproportionately long-term performance. The Board discussed the results of the comparisons and noted that the fund’s total return performance was above the Performance Group and Performance Universe medians in four of the six periods shown (ranking highest in the Performance Group in three of the periods). Dreyfus also provided a comparison of the fund’s calendar year total returns to the returns of the fund’s benchmark index.
The Board also reviewed the range of actual and contractual management fees and total expenses of the Expense Group and Expense Universe funds and discussed the results of the comparisons. The Board noted that the fund’s contractual management fee was below the Expense Group median and the fund’s actual management fee and total expenses were below the Expense Group and Expense Universe medians.
Dreyfus representatives reviewed with the Board the management or investment advisory fees (1) paid by funds advised or administered by Dreyfus that are in the same Lipper category as the fund and (2) paid to Dreyfus or the Dreyfus-affiliated primary employer of the fund’s primary portfolio manager(s) for advising any separate accounts and/or other types of client portfolios that are considered to have similar investment strategies and policies as the fund (the “Similar Clients”), and explained the nature of the Similar Clients. They discussed differences in fees paid and the relationship of the fees paid in light of any differences in the services provided and other relevant factors. The Board considered the relevance of the fee information provided for the Similar Clients to evaluate the appropriateness and reasonableness of the fund’s management fee.
Analysis of Profitability and Economies of Scale. Dreyfus representatives reviewed the expenses allocated and profit received by Dreyfus and its affiliates and the resulting profitability percentage for managing the fund and the aggregate profitability percentage to Dreyfus and its affiliates for managing the funds in the Dreyfus fund complex, and the method used to determine the expenses and profit. The Board concluded that the profitability results were not unreasonable, given the services rendered and service levels provided by Dreyfus. The Board also had been provided with information prepared by an independent consulting firm regarding Dreyfus’ approach to allocating costs to, and determining the profitability of, individual funds and the entire Dreyfus fund complex. The consulting firm also had analyzed where any economies of scale might emerge in connection with the management of a fund.
26
The Board considered, on the advice of its counsel, the profitability analysis (1) as part of its evaluation of whether the fees under the Agreement bear a reasonable relationship to the mix of services provided by Dreyfus, including the nature, extent and quality of such services, and (2) in light of the relevant circumstances for the fund and the extent to which economies of scale would be realized if the fund grows and whether fee levels reflect these economies of scale for the benefit of fund shareholders. Dreyfus representatives noted that a discussion of economies of scale is predicated on a fund having achieved a substantial size with increasing assets and that, if a fund’s assets had been stable or decreasing, the possibility that Dreyfus may have realized any economies of scale would be less. Dreyfus representatives also noted that, as a result of shared and allocated costs among funds in the Dreyfus fund complex, the extent of economies of scale could depend substantially on the level of assets in the complex as a whole, so that increases and decreases in complex-wide assets can affect potential economies of scale in a manner that is disproportionate to, or even in the opposite direction from, changes in the fund’s asset level. The Board also considered potential benefits to Dreyfus from acting as investment adviser and noted the soft dollar arrangements in effect for trading the fund’s investments.
At the conclusion of these discussions, the Board agreed that it had been furnished with sufficient information to make an informed business decision with respect to the renewal of the Agreement. Based on the discussions and considerations as described above, the Board concluded and determined as follows:
· The Board concluded that the nature, extent and quality of the services provided by Dreyfus are adequate and appropriate.
· The Board was satisfied with the fund’s performance.
· The Board concluded that the fee paid to Dreyfus was reasonable in light of the considerations described above.
· The Board determined that the economies of scale which may accrue to Dreyfus and its affiliates in connection with the management of the fund had been adequately considered by Dreyfus in connection with the fee rate charged to the fund pursuant to the Agreement and that, to the extent in the future it were determined that material economies of scale had not been shared with the fund, the Board would seek to have those economies of scale shared with the fund.
In evaluating the Agreement, the Board considered these conclusions and determinations and also relied on its previous knowledge, gained through meetings and other interactions with Dreyfus and its affiliates, of the fund and the services provided to the fund by Dreyfus. The Board also relied on information received on a routine and regular basis throughout the year relating to the operations of the fund and the investment management and other services provided under the Agreement, including information on the investment performance of the fund in comparison to similar mutual funds and benchmark performance indices; general market outlook as applicable
27
INFORMATION ABOUT THE RENEWAL OF THE FUND'S MANAGEMENT AGREEMENT (Unaudited) (continued)
to the fund; and compliance reports. In addition, the Board’s consideration of the contractual fee arrangements for this fund had the benefit of a number of years of reviews of prior or similar agreements during which lengthy discussions took place between the Board and Dreyfus representatives. Certain aspects of the arrangements may receive greater scrutiny in some years than in others, and the Board’s conclusions may be based, in part, on their consideration of the same or similar arrangements in prior years. The Board determined to renew the Agreement.
28
BOARD MEMBERS INFORMATION (Unaudited)
INDEPENDENT BOARD MEMBERS
Joseph S. DiMartino (71)
Chairman of the Board (1995)
Principal Occupation During Past 5 Years:
· Corporate Director and Trustee (1995-present)
Other Public Company Board Memberships During Past 5 Years:
· CBIZ (formerly, Century Business Services, Inc.), a provider of outsourcing functions for small and medium size companies, Director (1997-present)
· The Newark Group, a provider of a national market of paper recovery facilities, paperboard mills and paperboard converting plants, Director (2000-2010)
No. of Portfolios for which Board Member Serves: 144
———————
Peggy C. Davis (72)
Board Member (2006)
Principal Occupation During Past 5 Years:
· Shad Professor of Law, New York University School of Law (1983-present)
No. of Portfolios for which Board Member Serves: 51
———————
David P. Feldman (75)
Board Member (1996)
Principal Occupation During Past 5 Years:
· Corporate Director and Trustee (1985-present)
Other Public Company Board Memberships During Past 5 Years:
· BBH Mutual Funds Group (5 registered mutual funds), Director (1992-2014)
No. of Portfolios for which Board Member Serves: 37
———————
Ehud Houminer (75)
Board Member (1993)
Principal Occupation During Past 5 Years:
· Executive-in-Residence at the Columbia Business School, Columbia
University (1992-present)
Other Public Company Board Memberships During Past 5 Years:
· Avnet, Inc., an electronics distributor, Director (1993-2012)
No. of Portfolios for which Board Member Serves: 62
———————
29
BOARD MEMBERS INFORMATION (Unaudited) (continued)
INDEPENDENT BOARD MEMBERS (continued)
Lynn Martin (75)
Board Member (2012)
Principal Occupation During Past 5 Years:
· President of The Martin Hall Group LLC, a human resources consulting firm (2005-2012)
Other Public Company Board Memberships During Past 5 Years:
· AT&T, Inc., a telecommunications company, Director (1999-2012)
· Ryder System, Inc., a supply chain and transportation management company, Director (1993-2012)
No. of Portfolios for which Board Member Serves: 37
———————
Robin A. Melvin (51)
Board Member (2012)
Principal Occupation During Past 5 Years:
· Co-chairman, Illinois Mentoring Partnership, non-profit organization dedicated to increasing the quantity and quality of mentoring services in Illinois; (2014-present; a board member since 2013)
· Director, Boisi Family Foundation, a private family foundation that supports youth-serving organizations that promote the self sufficiency of youth from disadvantaged circumstances (1995-2012)
No. of Portfolios for which Board Member Serves: 114
———————
Dr. Martin Peretz (76)
Board Member (2006)
Principal Occupation During Past 5 Years:
· Editor-in-Chief Emeritus of The New Republic Magazine (2011-2012) (previously, Editor-in-Chief, 1974-2011)
· Director of TheStreet.com, a financial information service on the web (1996-2010)
· Lecturer at Harvard University (1969-2012)
No. of Portfolios for which Board Member Serves: 37
———————
Once elected all Board Members serve for an indefinite term, but achieve Emeritus status upon reaching age 80. The address of the Board Members and Officers is c/o The Dreyfus Corporation, 200 Park Avenue, New York, New York 10166. Additional information about the Board Members is available in the fund's Statement of Additional Information which can be obtained from Dreyfus free of charge by calling this toll free number: 1-800-DREYFUS.
James F. Henry, Emeritus Board Member
Dr. Paul A. Marks, Emeritus Board Member
Philip L. Toia, Emeritus Board Member
30
OFFICERS OF THE FUND (Unaudited)
BRADLEY J. SKAPYAK, President since January 2010.
Chief Operating Officer and a director of the Manager since June 2009, Chairman of Dreyfus Transfer, Inc., an affiliate of the Manager and the transfer agent of the funds, since May 2011 and Executive Vice President of the Distributor since June 2007. From April 2003 to June 2009, Mr. Skapyak was the head of the Investment Accounting and Support Department of the Manager. He is an officer of 69 investment companies (comprised of 144 portfolios) managed by the Manager. He is 56 years old and has been an employee of the Manager since February 1988.
BENNETT A. MACDOUGALL, Chief Legal Officer since October 2015.
Chief Legal Officer of the Manager since June 2015; from June 2005 to June 2015, Director and Associate General Counsel of Deutsche Bank – Asset & Wealth Management Division, and Chief Legal Officer of Deutsche Investment Management Americas Inc. He is an officer of 70 investment companies (comprised of 169 portfolios) managed by the Manager. He is 44 years old and has been an employee of the Manager since June 2015.
JANETTE E. FARRAGHER, Vice President and Secretary since December 2011.
Assistant General Counsel of BNY Mellon, and an officer of 70 investment companies (comprised of 169 portfolios) managed by the Manager. She is 52 years old and has been an employee of the Manager since February 1984.
JAMES BITETTO, Vice President and Assistant Secretary since August 2005.
Managing Counsel of BNY Mellon and Secretary of the Manager, and an officer of 70 investment companies (comprised of 169 portfolios) managed by the Manager. He is 49 years old and has been an employee of the Manager since December 1996.
JONI LACKS CHARATAN, Vice President and Assistant Secretary since August 2005.
Managing Counsel of BNY Mellon, and an officer of 70 investment companies (comprised of 169 portfolios) managed by the Manager. She is 59 years old and has been an employee of the Manager since October 1988.
JOSEPH M. CHIOFFI, Vice President and Assistant Secretary since August 2005.
Managing Counsel of BNY Mellon, and an officer of 70 investment companies (comprised of 169 portfolios) managed by the Manager. He is 53 years old and has been an employee of the Manager since June 2000.
JOHN B. HAMMALIAN, Vice President and Assistant Secretary since August 2005.
Senior Managing Counsel of BNY Mellon, and an officer of 70 investment companies (comprised of 169 portfolios) managed by the Manager. He is 52 years old and has been an employee of the Manager since February 1991.
MAUREEN E. KANE, Vice President and Assistant Secretary since April 2015.
Managing Counsel of BNY Mellon since July 2014; from October 2004 until July 2014, General Counsel, and from May 2009 until July 2014, Chief Compliance Officer of Century Capital Management. She is an officer of 70 investment companies (comprised of 169 portfolios) managed by the Manager. She is 53 years old and has been an employee of the Manager since July 2014.
SARAH S. KELLEHER, Vice President and Assistant Secretary since April 2014.
Senior Counsel of BNY Mellon, and an officer of 70 investment companies (comprised of 169 portfolios) managed by the Manager; from August 2005 to March 2013, Associate General Counsel of Third Avenue Management. She is 39 years old and has been an employee of the Manager since March 2013.
JEFF PRUSNOFSKY, Vice President and Assistant Secretary since August 2005.
Senior Managing Counsel of BNY Mellon, and an officer of 70 investment companies (comprised of 169 portfolios) managed by the Manager. He is 50 years old and has been an employee of the Manager since October 1990.
JAMES WINDELS, Treasurer since November 2001.
Director – Mutual Fund Accounting of the Manager, and an officer of 70 investment companies (comprised of 169 portfolios) managed by the Manager. He is 56 years old and has been an employee of the Manager since April 1985.
31
OFFICERS OF THE FUND (Unaudited) (continued)
RICHARD CASSARO, Assistant Treasurer since January 2008.
Senior Accounting Manager – Money Market and Municipal Bond Funds of the Manager, and an officer of 70 investment companies (comprised of 169 portfolios) managed by the Manager. He is 56 years old and has been an employee of the Manager since September 1982.
GAVIN C. REILLY, Assistant Treasurer since December 2005.
Tax Manager of the Investment Accounting and Support Department of the Manager, and an officer of 70 investment companies (comprised of 169 portfolios) managed by the Manager. He is 47 years old and has been an employee of the Manager since April 1991.
ROBERT S. ROBOL, Assistant Treasurer since August 2005.
Senior Accounting Manager – Fixed Income Funds of the Manager, and an officer of 70 investment companies (comprised of 169 portfolios) managed by the Manager. He is 51 years old and has been an employee of the Manager since October 1988.
ROBERT SALVIOLO, Assistant Treasurer since July 2007.
Senior Accounting Manager – Equity Funds of the Manager, and an officer of 70 investment companies (comprised of 169 portfolios) managed by the Manager. He is 48 years old and has been an employee of the Manager since June 1989.
ROBERT SVAGNA, Assistant Treasurer since December 2002.
Senior Accounting Manager – Equity Funds of the Manager, and an officer of 70 investment companies (comprised of 169 portfolios) managed by the Manager. He is 48 years old and has been an employee of the Manager since November 1990.
JOSEPH W. CONNOLLY, Chief Compliance Officer since October 2004.
Chief Compliance Officer of the Manager and The Dreyfus Family of Funds (70 investment companies, comprised of 169 portfolios). He is 58 years old and has served in various capacities with the Manager since 1980, including manager of the firm’s Fund Accounting Department from 1997 through October 2001.
32
NOTES
33
Dreyfus Opportunistic Small Cap Fund
200 Park Avenue
New York, NY 10166
Manager
The Dreyfus Corporation
200 Park Avenue
New York, NY 10166
Custodian
The Bank of New York Mellon
225 Liberty Street
New York, NY 10286
Transfer Agent &
Dividend Disbursing Agent
Dreyfus Transfer, Inc.
200 Park Avenue
New York, NY 10166
Distributor
MBSC Securities Corporation
200 Park Avenue
New York, NY 10166
Telephone Call your financial representative or 1-800-DREYFUS
Mail The Dreyfus Family of Funds, 144 Glenn Curtiss Boulevard, Uniondale, NY 11556-0144
E-mail Send your request to info@dreyfus.com
Internet Information can be viewed online or downloaded at www.dreyfus.com
The fund files its complete schedule of portfolio holdings with the Securities and Exchange Commission (“SEC”) for the first and third quarters of each fiscal year on Form N-Q. The fund’s Forms N-Q are available on the SEC’s website at www.sec.gov and may be reviewed and copied at the SEC’s Public Reference Room in Washington, DC. (phone 1-800-SEC-0330 for information).
Information regarding how the fund voted proxies related to portfolio securities for the most recent 12-month period ended June 30 is available at www.dreyfus.com and on the SEC’s website at www.sec.gov and without charge, upon request, by calling 1-800-DREYFUS.
| | |
© 2015 MBSC Securities Corporation | 
0253AR0815 |

Dreyfus Opportunistic U.S. Stock Fund
| | | |

| | ANNUAL REPORT
August 31, 2015 |
| |
Save time. Save paper. View your next shareholder report online as soon as it’s available. Log into www.dreyfus.com and sign up for Dreyfus eCommunications. It’s simple and only takes a few minutes. |
| |
The views expressed in this report reflect those of the portfolio manager only through the end of the period covered and do not necessarily represent the views of Dreyfus or any other person in the Dreyfus organization. Any such views are subject to change at any time based upon market or other conditions and Dreyfus disclaims any responsibility to update such views. These views may not be relied on as investment advice and, because investment decisions for a Dreyfus fund are based on numerous factors, may not be relied on as an indication of trading intent on behalf of any Dreyfus fund. |
| |
Not FDIC-Insured • Not Bank-Guaranteed • May Lose Value |
Contents
T H E F U N D
F O R M O R E I N F O R M AT I O N
Back Cover
| | | | |
| |
Dreyfus Opportunistic U.S. Stock Fund
| | The Fund |
A LETTER FROM THE PRESIDENT
Dear Shareholder:
We are pleased to present this annual report for Dreyfus Opportunistic U.S. Stock Fund, covering the 12-month period from September 1, 2014, through August 31, 2015. For information about how the fund performed during the reporting period, as well as general market perspectives, we provide a Discussion of Fund Performance on the pages that follow.
Financial markets proved volatile over the reporting period. For much of the year, a recovering U.S. economy enabled stocks to advance, but those gains were more than erased in August when economic concerns in China, falling commodity prices and a stronger U.S. dollar sparked sharp corrections in equity markets throughout the world. The emerging markets were especially hard hit in this environment. U.S. bonds generally fared better, rallying in late 2014 due to robust investor demand before reversing course in the spring as the domestic economy strengthened. Global economic instability in August hurt corporate-backed and inflation-linked bonds, but U.S. government securities held up relatively well.
We expect market uncertainty and volatility to persist over the near term as investors vacillate between hopes that current market turmoil represents a healthy correction and fears that further disappointments could trigger a full-blown bear market. Our investment strategists and portfolio managers are monitoring developments carefully, keeping a close watch on Chinese fiscal and monetary policy, liquidity factors affecting various asset classes, and other developments that could influence investor sentiment. Over the longer term, we remain confident that financial markets are likely to stabilize as the world adjusts to slower Chinese economic growth, abundant energy resources, and the anticipated eventual normalization of monetary policy. In our view, investors will continue to be well served under these circumstances by a long-term perspective and a disciplined investment approach.
Thank you for your continued confidence and support.
Sincerely,

J. Charles Cardona
President
The Dreyfus Corporation
September 15, 2015
2
DISCUSSION OF FUND PERFORMANCE
For the period of September 1, 2014, through August 31, 2015, as provided by David A. Daglio, Primary Portfolio Manager
Fund and Market Performance Overview
For the 12-month period ended August 31, 2015, Dreyfus Opportunistic U.S. Stock Fund’s Class A shares produced a total return of 1.12%, Class C shares returned 0.37%, and Class I shares returned 1.42%.1 In comparison, the fund’s benchmark, the Russell 3000® Index (the “Index”), produced a total return of 0.36%.2
Moderate market gains over much of the reporting period were balanced by subsequent declines triggered by global economic concerns. The fund outperformed its benchmark, in part due to holdings of small- and midcap companies that derive most of their revenues in the United States.
The Fund’s Investment Approach
The fund seeks long-term capital appreciation. The fund normally invests at least 80% of its assets in the stocks of publicly traded companies located in the United States. The fund may invest in the stocks of companies of any market capitalization and may hold growth or value stocks or a blend of both.
Stocks are selected for the fund’s portfolio based on a combination of fundamental, bottom-up research, macro insights, and risk management. With support from a team of research analysts, we use a disciplined, opportunistic investment approach to identify stocks of companies that we believe to be attractive from a valuation and fundamental standpoint, including those that are trading materially below our estimate of intrinsic market value, those that have strong or improving fundamentals, and those that have a revaluation catalyst. We focus on understanding the current fundamentals driving a company’s profits and cash flow, valuing the liabilities most likely to impact the company’s business, and evaluating business conditions most likely to affect the company’s prospects for future growth.
Global Economic Concerns Sparked Market Turmoil
The reporting period began in the midst of a market downturn in September and early October 2014, but U.S. employment gains, better consumer confidence, and improved business sentiment prompted a quick market recovery. Consequently, some broad market indices climbed to record highs through the end of February 2015.
Investors responded negatively in March to sluggish economic growth stemming from severe winter weather and an appreciating U.S. dollar. However, the U.S. economy regained traction in the spring, and stocks resumed their advance until uncertainty regarding a debt crisis in Greece and slowing economic growth in China again sent U.S. stock prices lower over the summer.
Stock Selections Bolstered Relative Performance
The fund outperformed its benchmark on the strength of our security selection strategy across the market’s various capitalization ranges. Holdings of smaller, U.S.-centric companies helped cushion the impact of economic instability in overseas markets, and we successfully navigated the opportunities and pitfalls presented by heightened market volatility.
3
DISCUSSION OF FUND PERFORMANCE (continued)
Relative results were especially favorable in the energy sector, where we reduced the fund’s exposure as commodity prices plummeted early in the reporting period. As a result, the fund did not participate as fully as its benchmark in the sector’s weakness. Among financial companies, overweighted sector exposure and strong security selections buoyed returns. Top relative contributors included investment firms E*TRADE Financial, Charles Schwab, and Raymond James Financial, which benefited from rising trading volumes. Investment bank Goldman Sachs Group fared well due to intensifying mergers-and-acquisitions activity, and a recovering housing market helped drive gains in title insurance issuer FNF Group.
On the other hand, the fund’s relative performance was undermined to a degree by the materials sector. Questionable management decisions and falling commodity prices hurt the stock price of precious metals producer Yamana Gold, prompting its elimination from the portfolio. Better results from U.S. construction aggregates supplier Martin Marietta Materials were not enough to fully offset lagging results elsewhere in the market sector. Finally, the fund maintained underweighted exposure to the consumer discretionary sector due to generally rich valuations, but the sector continued to gain value in the growing U.S. economy.
Selectively Positioned for Continued U.S. Economic Growth
Despite ongoing turmoil in overseas markets, the U.S. economy has continued to grow. At the same time, equity valuations have become more attractive in the wake of recent market declines. Therefore, we believe that many stocks across the various capitalization ranges are well positioned for the remainder of 2015 and beyond.
However, in our judgment, selectivity is likely to be key to investment performance over the months ahead. We have intensified our focus on underlying company fundamentals, attractive intrinsic values, and U.S.-centric business models. The fund ended the reporting period with overweighted positions in the information technology sector, where demand is expected to remain robust for productivity-enhancing services and cybersecurity solutions. We also have identified an ample number of opportunities among financial companies, especially attractively valued financial institutions poised to benefit from higher short-term interest rates. In contrast, we have found relatively few companies meeting our investment criteria in the energy and consumer discretionary sectors.
September 15, 2015
Please note, the position in any security highlighted with italicized typeface was sold during the reporting period.
Equity funds are subject generally to market, market sector, market liquidity, issuer, and investment style risks, among other factors, to varying degrees, all of which are more fully described in the fund’s prospectus.
Stocks of small- and/or mid-cap companies often experience sharper price fluctuations than stocks of large-cap companies.
The fund’s performance will be influenced by political, social, and economic factors affecting investments in foreign companies. Special risks associated with investments in foreign companies include exposure to currency fluctuations, less liquidity, less developed or less efficient trading markets, lack of comprehensive company information, political instability, and differing auditing and legal standards. These risks are enhanced in emerging market countries. Please read the prospectus for further discussion of these risks.
1 Total return includes reinvestment of dividends and any capital gains paid and does not take into consideration the maximum initial sales charge in the case of Class A shares, or the applicable contingent deferred sales charge imposed on redemptions in the case of Class C shares. Had these charges been reflected, returns would have been lower. Past performance is no guarantee of future results. Share price and investment return fluctuate such that upon redemption fund shares may be worth more or less than their original cost. The fund’s returns reflect the absorption of certain fund expenses by The Dreyfus Corporation pursuant to an agreement in effect through May 1, 2016, at which time it may be extended, terminated, or modified. Had these expenses not been absorbed, the fund’s returns would have been lower.
4
2 SOURCE: LIPPER INC. — Reflects the reinvestment of dividends and, where applicable, capital gain distributions. The Russell 3000 Index is composed of the 3,000 largest U.S. companies based on total market capitalization. Investors cannot invest directly in any index.
5
FUND PERFORMANCE

Comparison of change in value of $10,000 investment in Dreyfus Opportunistic U.S. Stock Fund Class A shares, Class C shares, Class I shares and Class Y shares and the Russell 3000 Index
† Source: Lipper Inc.
†† The total return figures presented for Class Y shares of the fund reflect the performance of the fund’s Class I shares for the period prior to 5/1/15 (the inception date for Class Y shares).
Past performance is not predictive of future performance.
The above graph compares a $10,000 investment made in each of the Class A, Class C, Class I and Class Y shares of Dreyfus Opportunistic U.S. Stock Fund on 12/20/11 (inception date) to a $10,000 investment made in the Russell 3000 Index (the “Index”) on that date. All dividends and capital gain distributions are reinvested.
The fund’s performance shown in the line graph above takes into account the maximum initial sales charge on Class A shares and all other applicable fees and expenses on all classes. The Index measures the performance of the largest 3,000 U.S. companies representing approximately 98% of the investable U.S. equity market. Unlike a mutual fund, the Index is not subject to charges, fees and other expenses. Investors cannot invest directly in any index. Further information relating to fund performance, including expense reimbursements, if applicable, is contained in the Financial Highlights section of the prospectus and elsewhere in this report.
6
| | | | | | |
Average Annual Total Returns as of 8/31/15 | | | |
| | Inception | | | From | |
| Date | 1 Year | | Inception | |
Class A shares | | | | | |
with maximum sales charge (5.75%) | 12/20/11 | -4.70% | | 17.41% | |
without sales charge | 12/20/11 | 1.12% | | 19.29% | |
Class C shares | | | | | |
with applicable redemption charge† | 12/20/11 | -0.58% | | 18.37% | |
without redemption | 12/20/11 | 0.37% | | 18.37% | |
Class I shares | 12/20/11 | 1.42% | | 19.56% | |
Class Y shares | 5/1/15 | 1.47% | †† | 19.57% | †† |
Russell 3000 Index | 12/31/11 | 0.36% | | 15.65% | ††† |
Past performance is not predictive of future performance. The fund’s performance shown in the graph and table does not reflect the deduction of taxes that a shareholder would pay on fund distributions or the redemption of fund shares. In addition to the performance of Class A shares shown with and without a maximum sales charge, the fund’s performance shown in the table takes into account all other applicable fees and expenses on all classes.
† The maximum contingent deferred sales charge for Class C shares is 1% for shares redeemed within one year of the date of purchase.
†† The total return figures presented for Class Y shares of the fund reflect the performance of the fund’s Class I shares for the period prior to 5/1/15 (the inception date for Class Y shares).
††† For comparative purposes, the value of the Index on 12/31/11 is used as the beginning value on 12/20/11.
7
UNDERSTANDING YOUR FUND’S EXPENSES (Unaudited)
As a mutual fund investor, you pay ongoing expenses, such as management fees and other expenses. Using the information below, you can estimate how these expenses affect your investment and compare them with the expenses of other funds. You also may pay one-time transaction expenses, including sales charges (loads) and redemption fees, which are not shown in this section and would have resulted in higher total expenses. For more information, see your fund’s prospectus or talk to your financial adviser.
Review your fund’s expenses
The table below shows the expenses you would have paid on a $1,000 investment in Dreyfus Opportunistic U.S. Stock Fund from March 1, 2015 to August 31, 2015. It also shows how much a $1,000 investment would be worth at the close of the period, assuming actual returns and expenses.
| | | | | | | | | | | | |
Expenses and Value of a $1,000 Investment | | |
assuming actual returns for the six months ended August 31, 2015† |
| | | | | | | | |
| | | | Class A | Class C | Class I | Class Y |
Expenses paid per $1,000†† | | $5.95 | | $9.65 | | $4.71 | | $3.07 |
Ending value (after expenses) | | $966.70 | | $963.00 | | $967.40 | | $967.00 |
COMPARING YOUR FUND’S EXPENSES
WITH THOSE OF OTHER FUNDS (Unaudited)
Using the SEC’s method to compare expenses
The Securities and Exchange Commission (SEC) has established guidelines to help investors assess fund expenses. Per these guidelines, the table below shows your fund’s expenses based on a $1,000 investment, assuming a hypothetical 5% annualized return. You can use this information to compare the ongoing expenses (but not transaction expenses or total cost) of investing in the fund with those of other funds. All mutual fund shareholder reports will provide this information to help you make this comparison. Please note that you cannot use this information to estimate your actual ending account balance and expenses paid during the period.
| | | | | | | | | | | | |
Expenses and Value of a $1,000 Investment | | |
assuming a hypothetical 5% annualized return for the six months ended August 31, 2015††† |
| | | | | | | | |
| | | | Class A | Class C | Class I | Class Y |
Expenses paid per $1,000†††† | | $6.11 | | $9.91 | | $4.84 | | $4.84 |
Ending value (after expenses) | | $1,019.16 | | $1,015.38 | | $1,020.42 | | $1,020.42 |
† From May 1, 2015 (commencement of initial offering) to August 31, 2015 for Class Y.
†† Expenses are equal to the fund’s annualized expense ratio of 1.20% for Class A, 1.95% for Class C and .95% for Class I, multiplied by the average account value over the period, multiplied by 184/365 (to reflect the one-half year period). Expenses are equal to the fund’s annualized expense ratio of .95% for Class Y, multiplied by the average account value over the period, multiplied by 120/365 (to reflect the actual days in the period).
††† Please note that while Class Y shares commenced operations on May 1, 2015, the hypothetical expenses paid during the period reflect projected activity for the full six month period for purposes of comparability. This projection assumes that annualized expense ratios were in effect during the period March 1, 2015 to August 31, 2015.
†††† Expenses are equal to the fund’s annualized expense ratio of 1.20% for Class A, 1.95% for Class C, .95% for Class I and .95% for Class Y, multiplied by the average account value over the period, multiplied by 184/365 (to reflect the one-half year period).
8
STATEMENT OF INVESTMENTS
August 31, 2015
||ANAME||
| | | | | | | | | |
Common Stocks - 99.3% | | Shares | | Value ($) | |
Banks - 12.2% | | | | | |
Citigroup | | 21,226 | | 1,135,166 | |
First Republic Bank | | 9,487 | | 572,161 | |
Signature Bank | | 4,132 | a | 551,581 | |
SVB Financial Group | | 6,142 | a | 768,241 | |
Wells Fargo & Co. | | 14,773 | | 787,844 | |
| | | | | 3,814,993 | |
Capital Goods - 1.7% | | | | | |
Honeywell International | | 5,491 | | 545,092 | |
Commercial & Professional Services - 3.6% | | | | | |
Steelcase, Cl. A | | 63,508 | | 1,119,646 | |
Diversified Financials - 12.4% | | | | | |
Charles Schwab | | 40,326 | | 1,225,104 | |
E*TRADE Financial | | 34,794 | a | 914,734 | |
Goldman Sachs Group | | 5,125 | | 966,575 | |
Intercontinental Exchange | | 3,314 | | 756,951 | |
| | | | | 3,863,364 | |
Energy - 1.3% (continued) | | | | | |
Halliburton | | 10,416 | | 409,870 | |
Exchange-Traded Funds - 6.9% | | | | | |
iShares Russell 1000 ETF | | 5,414 | | 599,005 | |
iShares Russell 3000 ETF | | 3,012 | | 354,994 | |
SPDR S&P 500 ETF Trust | | 3,177 | b | 627,585 | |
Vanguard S&P 500 ETF | | 3,120 | | 565,063 | |
| | | | | 2,146,647 | |
Food, Beverage & Tobacco - 4.7% | | | | | |
Mondelez International, Cl. A | | 18,146 | | 768,665 | |
PepsiCo | | 7,453 | | 692,607 | |
| | | | | 1,461,272 | |
Health Care Equipment & Services - 1.5% | | | | | |
Cardinal Health | | 5,804 | | 477,495 | |
Insurance - 3.0% | | | | | |
FNF Group | | 25,659 | | 934,244 | |
Materials - 3.9% ) | | | | | |
Martin Marietta Materials | | 2,507 | | 420,675 | |
Mosaic | | 9,501 | | 387,926 | |
Valspar | | 5,689 | | 417,004 | |
| | | | | 1,225,605 | |
9
STATEMENT OF INVESTMENTS (continued)
| | | | | | | | | | | |
Common Stocks - 99.3% (continued) | | Shares | | Value ($) | |
Media - 2.5% | | | | | |
AMC Networks, Cl. A | | 6,485 | a | 469,384 | |
CBS, Cl. B | | 6,837 | | 309,306 | |
| | | | | 778,690 | |
Pharmaceuticals, Biotechnology & Life Sciences - 12.4% | | | | | |
Biogen | | 1,631 | a | 484,896 | |
Bristol-Myers Squibb | | 9,867 | | 586,790 | |
Eli Lilly & Co. | | 11,400 | | 938,790 | |
Flamel Technologies, ADR | | 26,146 | a | 579,134 | |
Illumina | | 2,359 | a | 466,162 | |
Jazz Pharmaceuticals | | 4,804 | a | 811,011 | |
| | | | | 3,866,783 | |
Real Estate - 1.8% | | | | | |
Realogy Holdings | | 14,305 | a | 576,492 | |
Retailing - 4.1% | | | | | |
Amazon.com | | 1,429 | a | 732,920 | |
Ulta Salon, Cosmetics & Fragrance | | 3,394 | a | 536,557 | |
| | | | | 1,269,477 | |
Semiconductors & Semiconductor Equipment - 3.0% | | | | | |
Mellanox Technologies | | 8,460 | a | 342,122 | |
Veeco Instruments | | 26,050 | a | 600,974 | |
| | | | | 943,096 | |
Software & Services - 13.3% | | | | | |
Akamai Technologies | | 12,894 | a | 919,471 | |
Fortinet | | 13,392 | a | 564,339 | |
Google, Cl. C | | 1,635 | a | 1,010,839 | |
Infoblox | | 44,402 | a | 854,295 | |
Oracle | | 21,627 | | 802,145 | |
| | | | | 4,151,089 | |
Technology Hardware & Equipment - 9.3% | | | | | |
Amphenol Cl. A | | 9,990 | | 523,076 | |
Apple | | 10,008 | | 1,128,502 | |
Ciena | | 30,214 | a | 675,585 | |
Universal Display | | 15,867 | a | 584,540 | |
| | | | | 2,911,703 | |
Transportation - 1.7% | | | | | |
Kirby | | 7,310 | a | 515,574 | |
Total Common Stocks (cost $30,496,107) | | | | 31,011,132 | |
10
| | | | | | | | | |
Other Investments - .7% | | | | | |
Registered Investment Company; | | | | | |
Dreyfus Institutional Preferred Plus Money Market Fund | | 197,658 | c | 197,658 | |
(cost $197,658) | | | | | |
Total Investments (cost $30,693,765) | | 100.0% | | 31,208,790 | |
Cash and Receivables (Net) | | .0% | | 12,301 | |
Net Assets | | 100.0% | | 31,221,091 | |
ADR—American Depository Receipt
ETF—Exchange-Traded Fund
a Non-income producing security.
b Security, or portion thereof, on loan. At August 31, 2015, the value of the fund's securities on loan was $580,570 and the value of the collateral held by the fund was $597,934, consisting of U.S. Government & Agency securities.
c Investment in affiliated money market mutual fund.
| | |
Portfolio Summary (Unaudited) † | Value (%) |
Software & Services | 13.3 |
Diversified Financials | 12.4 |
Pharmaceuticals, Biotechnology & Life Sciences | 12.4 |
Banks | 12.2 |
Technology Hardware & Equipment | 9.3 |
Exchange-Traded Funds | 6.9 |
Food, Beverage & Tobacco | 4.7 |
Retailing | 4.1 |
Materials | 3.9 |
Commercial & Professional Services | 3.6 |
Insurance | 3.0 |
Semiconductors & Semiconductor Equipment | 3.0 |
Media | 2.5 |
Real Estate | 1.8 |
Capital Goods | 1.7 |
Transportation | 1.7 |
Health Care Equipment & Services | 1.5 |
Energy | 1.3 |
Money Market Investment | .7 |
| | 100.0 |
†Based on net assets.
See notes to financial statements.
11
STATEMENT OF ASSETS AND LIABILITIES
August 31, 2015
| | | | | | |
| | | Cost | | Value |
Assets ($): | | | |
Investments in securities—See Statement of Investments
(including securities on loan, valued at $580,570)—Note 1(b): | | | | |
Unaffiliated issuers | | 30,496,107 | | 31,011,132 |
Affiliated issuers | | 197,658 | | 197,658 |
Cash | | | | | 90,541 |
Receivable for shares of Common Stock subscribed | | | | | 120,035 |
Receivable for investment securities sold | | | | | 107,074 |
Dividends and securities lending income receivable | | | | | 22,165 |
Prepaid expenses | | | | | 16,017 |
| | | | | 31,564,622 |
Liabilities ($): | | | |
Due to The Dreyfus Corporation and affiliates—Note 3(c) | | | | | 23,700 |
Payable for investment securities purchased | | | | | 272,511 |
Payable for shares of Common Stock redeemed | | | | | 5,000 |
Accrued expenses | | | | | 42,320 |
| | | | | 343,531 |
Net Assets ($) | | | 31,221,091 |
Composition of Net Assets ($): | | | |
Paid-in capital | | | | | 29,583,135 |
Accumulated net realized gain (loss) on investments | | | | | 1,122,931 |
Accumulated net unrealized appreciation (depreciation)
on investments | | | | | 515,025 |
Net Assets ($) | | | 31,221,091 |
| | | | | |
Net Asset Value Per Share | Class A | Class C | Class I | Class Y |
Net Assets ($) | 21,175,828 | 1,920,262 | 8,124,035 | 966.79 |
Shares Outstanding | 1,071,903 | 99,663 | 408,434 | 48.59 |
Net Asset Value Per Share ($) | 19.76 | 19.27 | 19.89 | 19.90 |
See notes to financial statements.
12
STATEMENT OF OPERATIONS
Year Ended August 31, 2015
| | | | | | | |
| | | | | | |
| | | | | | |
Investment Income ($): | | | | |
Income: | | | | |
Cash dividends (net of $429 foreign taxes withheld at source): | | | | |
Unaffliated issuers | | | 214,705 | |
Affliated issuers | | | 145 | |
Income from securities lending—Note 1(b) | | | 845 | |
Total Income | | | 215,695 | |
Expenses: | | | | |
Management fee—Note 3(a) | | | 169,019 | |
Shareholder servicing costs—Note 3(c) | | | 57,002 | |
Professional fees | | | 52,006 | |
Registration fees | | | 45,828 | |
Prospectus and shareholders’ reports | | | 9,017 | |
Distribution fees—Note 3(b) | | | 8,392 | |
Custodian fees—Note 3(c) | | | 7,311 | |
Directors' fees and expenses—Note 3(d) | | | 1,268 | |
Interest expense—Note 2 | | | 311 | |
Loan commitment fees—Note 2 | | | 204 | |
Miscellaneous | | | 19,142 | |
Total Expenses | | | 369,500 | |
Less—reduction in expenses due to undertaking—Note 3(a) | | | (106,083) | |
Less—reduction in fees due to earnings credits—Note 3(c) | | | (9) | |
Net Expenses | | | 263,408 | |
Investment (Loss)—Net | | | (47,713) | |
Realized and Unrealized Gain (Loss) on Investments—Note 4 ($): | | |
Net realized gain (loss) on investments | | | 1,270,648 | |
Net unrealized appreciation (depreciation) on investments | | | (1,874,142) | |
Net Realized and Unrealized Gain (Loss) on Investments | | | (603,494) | |
Net (Decrease) in Net Assets Resulting from Operations | | (651,207) | |
See notes to financial statements.
13
STATEMENT OF CHANGES IN NET ASSETS
| | | | | | | | | | |
| | | | | | | | | | |
| | | | Year Ended August 31, |
| | | | 2015a | | | | 2014 | |
Operations ($): | | | | | | | | |
Investment income (loss)—net | | | (47,713) | | | | 514 | |
Net realized gain (loss) on investments | | 1,270,648 | | | | 1,094,609 | |
Net unrealized appreciation (depreciation)
on investments | | (1,874,142) | | | | 1,656,973 | |
Net Increase (Decrease) in Net Assets
Resulting from Operations | (651,207) | | | | 2,752,096 | |
Dividends to Shareholders from ($): | | | | | | | | |
Investment income—net: | | | | | | | | |
Class A | | | - | | | | (632) | |
Class I | | | - | | | | (5,885) | |
Net realized gain on investments: | | | | | | | | |
Class A | | | (675,244) | | | | (501,146) | |
Class C | | | (44,845) | | | | (17,102) | |
Class I | | | (264,021) | | | | (399,816) | |
Total Dividends | | | (984,110) | | | | (924,581) | |
Capital Stock Transactions ($): | | | | | | | | |
Net proceeds from shares sold: | | | | | | | | |
Class A | | | 14,045,615 | | | | 12,319,904 | |
Class C | | | 1,503,448 | | | | 757,405 | |
Class I | | | 3,494,463 | | | | 149,932 | |
Class Y | | | 1,000 | | | | - | |
Dividends reinvested: | | | | | | | | |
Class A | | | 670,979 | | | | 499,163 | |
Class C | | | 43,988 | | | | 15,770 | |
Class I | | | 8,670 | | | | 2,995 | |
Cost of shares redeemed: | | | | | | | | |
Class A | | | (7,702,320) | | | | (1,684,463) | |
Class C | | | (251,226) | | | | (124,668) | |
Class I | | | (152,058) | | | | (9,965) | |
Increase (Decrease) in Net Assets
from Capital Stock Transactions | 11,662,559 | | | | 11,926,073 | |
Total Increase (Decrease) in Net Assets | 10,027,242 | | | | 13,753,588 | |
Net Assets ($): | | | | | | | | |
Beginning of Period | | | 21,193,849 | | | | 7,440,261 | |
End of Period | | | 31,221,091 | | | | 21,193,849 | |
14
| | | | | | | | | | |
| | | | | | | | | | |
| | | | Year Ended August 31, |
| | | | 2015a | | | | 2014 | |
Capital Share Transactions: | | | | | | | | |
Class A | | | | | | | | |
Shares sold | | | 678,661 | | | | 626,885 | |
Shares issued for dividends reinvested | | | 34,604 | | | | 27,412 | |
Shares redeemed | | | (386,173) | | | | (85,092) | |
Net Increase (Decrease) in Shares Outstanding | 327,092 | | | | 569,205 | |
Class C | | | | | | | | |
Shares sold | | | 74,344 | | | | 38,199 | |
Shares issued for dividends reinvested | | | 2,314 | | | | 876 | |
Shares redeemed | | | (12,492) | | | | (6,388) | |
Net Increase (Decrease) in Shares Outstanding | 64,166 | | | | 32,687 | |
Class I | | | | | | | | |
Shares sold | | | 168,114 | | | | 7,605 | |
Shares issued for dividends reinvested | | | 445 | | | | 164 | |
Shares redeemed | | | (7,431) | | | | (501) | |
Net Increase (Decrease) in Shares Outstanding | 161,128 | | | | 7,268 | |
Class Y | | | | | | | | |
Shares sold | | | 48.59 | | | | - | |
a Effective May 1, 2015, the fund commenced offering Class Y shares. | | |
See notes to financial statements.
15
FINANCIAL HIGHLIGHTS
The following tables describe the performance for each share class for the fiscal periods indicated. All information (except portfolio turnover rate) reflects financial results for a single fund share. Total return shows how much your investment in the fund would have increased (or decreased) during each period, assuming you had reinvested all dividends and distributions. These figures have been derived from the fund’s financial statements.
| | | | | | | | |
| | | | | | | | |
| | Year Ended August 31, |
Class A Shares | | 2015 | 2014 | | 2013 | 2012 | a |
Per Share Data ($): | | | | | | | |
Net asset value, beginning of period | | 20.62 | 17.75 | | 14.49 | 12.50 | |
Investment Operations: | | | | | | | |
Investment income (loss)—netb | | (.05) | (.02) | | (.01) | .02 | |
Net realized and unrealized gain (loss) on investments | | .26g | 4.55 | | 4.08 | 1.97 | |
Total from Investment Operations | | .21 | 4.53 | | 4.07 | 1.99 | |
Distributions: | | | | | | | |
Dividends from investment income—net | | - | (.00) | c | (.09) | - | |
Dividends from net realized gain on investments | | (1.07) | (1.66) | | (.72) | - | |
Total Distributions | | (1.07) | (1.66) | | (.81) | - | |
Net asset value, end of period | | 19.76 | 20.62 | | 17.75 | 14.49 | |
Total Return (%)d | | 1.12 | 26.73 | | 29.30 | 15.92 | e |
Ratios/Supplemental Data (%): | | | | | | | |
Ratio of total expenses to average net assets | | 1.69 | 1.86 | | 2.93 | 7.51 | f |
Ratio of net expenses to average net assets | | 1.20 | 1.20 | | 1.20 | 1.20 | f |
Ratio of net investment income (loss) to average net assets | | (.25) | (.09) | | (.04) | .18 | f |
Portfolio Turnover Rate | | 147.86 | 111.14 | | 142.83 | 46.51 | e |
Net Assets, end of period ($x 1,000) | | 21,176 | 15,355 | | 3,118 | 61 | |
a From December 20, 2011 (commencement of operations) to August 31, 2012.
b Based on average shares outstanding.
c Amount represents less than $.01 per share.
d Exclusive of sales charge.
e Not annualized.
f Annualized.
g In addition to net realized and unrealized losses on investments as set forth in the Statement of Operations, this amount includes an
increase in net asset value per share resulting from the timing of issuances and redemptions of shares in relation to fluctuating market
values for the portfolio investments.
See notes to financial statements.
16
| | | | | | | |
| | | | |
Class C Shares | Year Ended August 31, |
| | 2015 | 2014 | 2013 | 2012 | a |
Per Share Data ($): | | | | | | |
Net asset value, beginning of period | | 20.28 | 17.61 | 14.42 | 12.50 | |
Investment Operations: | | | | | | |
Investment (loss)—netb | | (.20) | (.17) | (.10) | (.05) | |
Net realized and unrealized gain (loss) on investments | | .26f | 4.50 | 4.01 | 1.97 | |
Total from Investment Operations | | .06 | 4.33 | 3.91 | 1.92 | |
Distributions: | | | | | | |
Dividends from net realized gain on investments | | (1.07) | (1.66) | (.72) | - | |
Net asset value, end of period | | 19.27 | 20.28 | 17.61 | 14.42 | |
Total Return (%)c | | .37 | 25.81 | 28.12 | 15.36 | d |
Ratios/Supplemental Data (%): | | | | | | |
Ratio of total expenses to average net assets | | 2.54 | 2.75 | 5.44 | 8.09 | e |
Ratio of net expenses to average net assets | | 1.95 | 1.95 | 1.95 | 1.95 | e |
Ratio of net investment (loss) to average net assets | | (1.00) | (.87) | (.60) | (.53) | e |
Portfolio Turnover Rate | | 147.86 | 111.14 | 142.83 | 46.51 | d |
Net Assets, end of period ($x 1,000) | | 1,920 | 720 | 49 | 33 | |
a From December 20, 2011 (commencement of operations) to August 31, 2012.
b Based on average shares outstanding.
c Exclusive of sales charge.
d Not annualized.
e Annualized.
f In addition to net realized and unrealized losses on investments as set forth in the Statement of Operations, this amount includes an
increase in net asset value per share resulting from the timing of issuances and redemptions of shares in relation to fluctuating market
values for the portfolio investments.
See notes to financial statements.
17
FINANCIAL HIGHLIGHTS (continued)
| | | | | | | | | |
| | | | | | | | |
Class I Shares | Year Ended August 31, |
| | 2015 | | 2014 | 2013 | 2012 | a |
Per Share Data ($): | | | | | | | |
Net asset value, beginning of period | | 20.70 | | 17.80 | 14.52 | 12.50 | |
Investment Operations: | | | | | | | |
Investment income—netb | | .00 | c | .05 | .07 | .04 | |
Net realized and unrealized gain (loss) on investments | | .26f | | 4.53 | 4.03 | 1.98 | |
Total from Investment Operations | | .26 | | 4.58 | 4.10 | 2.02 | |
Distributions: | | | | | | | |
Dividends from investment income—net | | - | | (.02) | (.10) | - | |
Dividends from net realized gain on investments | | (1.07) | | (1.66) | (.72) | - | |
Total Distributions | | (1.07) | | (1.68) | (.82) | - | |
Net asset value, end of period | | 19.89 | | 20.70 | 17.80 | 14.52 | |
Total Return (%) | | 1.42 | | 27.00 | 29.43 | 16.16 | d |
Ratios/Supplemental Data (%): | | | | | | | |
Ratio of total expenses to average net assets | | 1.37 | | 1.61 | 4.05 | 7.13 | e |
Ratio of net expenses to average net assets | | .95 | | .95 | .95 | .95 | e |
Ratio of net investment income to average net assets | | .01 | | .24 | .43 | .40 | e |
Portfolio Turnover Rate | | 147.86 | | 111.14 | 142.83 | 46.51 | d |
Net Assets, end of period ($x 1,000) | | 8,124 | | 5,119 | 4,273 | 3,462 | |
a From December 20, 2011 (commencement of operations) to August 31, 2012.
b Based on average shares outstanding.
c Amount represents less than $.01 per share.
d Not annualized.
e Annualized.
f In addition to net realized and unrealized losses on investments as set forth in the Statement of Operations, this amount includes an
increase in net asset value per share resulting from the timing of issuances and redemptions of shares in relation to fluctuating market
values for the portfolio investments.
See notes to financial statements.
18
| | | | |
| | | | |
Class Y Shares | | Year Ended
August 31, 2015 | a |
Per Share Data ($): | | | |
Net asset value, beginning of period | | 20.58 | |
Investment Operations: | | | |
Investment income—netb | | .01 | |
Net realized and unrealized gain (loss) on investments | | (.69) | |
Total from Investment Operations | | (.68) | |
Net asset value, end of period | | 19.90 | |
Total Return (%) | | (3.30) | c |
Ratios/Supplemental Data (%): | | | |
Ratio of total expenses to average net assets | | 2.62 | d |
Ratio of net expenses to average net assets | | .95 | d |
Ratio of net investment income to average net assets | | .12 | d |
Portfolio Turnover Rate | | 147.86 | |
Net Assets, end of period ($x 1,000) | | 1 | |
a From May 1, 2015 (commencement of initial offering) to August 31, 2015.
b Based on average shares outstanding.
c Not annualized.
d Annualized.
See notes to financial statements.
19
NOTES TO FINANCIAL STATEMENTS
NOTE 1—Significant Accounting Policies:
Dreyfus Opportunistic U.S. Stock Fund (the “fund”) is a separate diversified series of Advantage Funds, Inc. (the “Company”), which is registered under the Investment Company Act of 1940, as amended (the “Act”), as an open-end management investment company and operates as a series company currently offering eleven series, including the fund. The fund’s investment objective is to seek long-term capital appreciation. The Dreyfus Corporation (the “Manager” or “Dreyfus”), a wholly-owned subsidiary of The Bank of New York Mellon Corporation (“BNY Mellon”), serves as the fund’s investment adviser.
At a meeting held on March 11-12, 2015, the Company’s Board of Directors (the “Board”) approved, effective May 1, 2015: (a) for the fund to offer Class Y shares; and, (b) an increase in the authorized shares of the fund from 300 million to 400 million and authorized 100 million Class Y shares.
MBSC Securities Corporation (the “Distributor”), a wholly-owned subsidiary of Dreyfus, is the distributor of the fund’s shares. The fund is authorized to issue 100 million shares of $.001 par value Common Stock in each of the following classes of shares: Class A, Class C, Class I and Class Y. Class A shares generally are subject to a sales charge imposed at the time of purchase. Class C shares are subject to a contingent deferred sales charge (“CDSC”) imposed on Class C shares redeemed within one year of purchase. Class I and Class Y shares are sold at net asset value per share generally to institutional investors. Other differences between the classes include the services offered to and the expenses borne by each class, the allocation of certain transfer agency costs, and certain voting rights. Income, expenses (other than expenses attributable to a specific class), and realized and unrealized gains or losses on investments are allocated to each class of shares based on its relative net assets.
As of August 31, 2015, MBC Investments Corp., an indirect subsidiary of BNY Mellon, held 238,400 Class I and all of the outstanding Class Y shares of the fund.
The Company accounts separately for the assets, liabilities and operations of each series. Expenses directly attributable to each series are charged to that series’ operations; expenses which are applicable to all series are allocated among them on a pro rata basis.
The Financial Accounting Standards Board (“FASB”) Accounting Standards Codification (“ASC”) is the exclusive reference of authoritative U.S. generally accepted accounting principles (“GAAP”) recognized by the FASB to be applied by nongovernmental entities. Rules and interpretive
20
releases of the Securities and Exchange Commission (“SEC”) under authority of federal laws are also sources of authoritative GAAP for SEC registrants. The fund’s financial statements are prepared in accordance with GAAP, which may require the use of management estimates and assumptions. Actual results could differ from those estimates.
The Company enters into contracts that contain a variety of indemnifications. The fund’s maximum exposure under these arrangements is unknown. The fund does not anticipate recognizing any loss related to these arrangements.
(a) Portfolio valuation: The fair value of a financial instrument is the amount that would be received to sell an asset or paid to transfer a liability in an orderly transaction between market participants at the measurement date (i.e., the exit price). GAAP establishes a fair value hierarchy that prioritizes the inputs of valuation techniques used to measure fair value. This hierarchy gives the highest priority to unadjusted quoted prices in active markets for identical assets or liabilities (Level 1 measurements) and the lowest priority to unobservable inputs (Level 3 measurements).
Additionally, GAAP provides guidance on determining whether the volume and activity in a market has decreased significantly and whether such a decrease in activity results in transactions that are not orderly. GAAP requires enhanced disclosures around valuation inputs and techniques used during annual and interim periods.
Various inputs are used in determining the value of the fund’s investments relating to fair value measurements. These inputs are summarized in the three broad levels listed below:
Level 1—unadjusted quoted prices in active markets for identical investments.
Level 2—other significant observable inputs (including quoted prices for similar investments, interest rates, prepayment speeds, credit risk, etc.).
Level 3—significant unobservable inputs (including the fund’s own assumptions in determining the fair value of investments).
The inputs or methodology used for valuing securities are not necessarily an indication of the risk associated with investing in those securities.
Changes in valuation techniques may result in transfers in or out of an assigned level within the disclosure hierarchy. Valuation techniques used to value the fund’s investments are as follows:
21
NOTES TO FINANCIAL STATEMENTS (continued)
Investments in securities are valued at the last sales price on the securities exchange or national securities market on which such securities are primarily traded. Securities listed on the National Market System for which market quotations are available are valued at the official closing price or, if there is no official closing price that day, at the last sales price. For open short positions, asked prices are used for valuation purposes. Bid price is used when no asked price is available. Registered investment companies that are not traded on an exchange are valued at their net asset value. All of the preceding securities are generally categorized within Level 1 of the fair value hierarchy.
Securities not listed on an exchange or the national securities market, or securities for which there were no transactions, are valued at the average of the most recent bid and asked prices. These securities are generally categorized within Level 2 of the fair value hierarchy.
Fair valuing of securities may be determined with the assistance of a pricing service using calculations based on indices of domestic securities and other appropriate indicators, such as prices of relevant ADRs and financial futures. Utilizing these techniques may result in transfers between Level 1 and Level 2 of the fair value hierarchy.
When market quotations or official closing prices are not readily available, or are determined not to reflect accurately fair value, such as when the value of a security has been significantly affected by events after the close of the exchange or market on which the security is principally traded (for example, a foreign exchange or market), but before the fund calculates its net asset value, the fund may value these investments at fair value as determined in accordance with the procedures approved by the Board. Certain factors may be considered when fair valuing investments such as: fundamental analytical data, the nature and duration of restrictions on disposition, an evaluation of the forces that influence the market in which the securities are purchased and sold, and public trading in similar securities of the issuer or comparable issuers. These securities are either categorized within Level 2 or 3 of the fair value hierarchy depending on the relevant inputs used.
For restricted securities where observable inputs are limited, assumptions about market activity and risk are used and are generally categorized within Level 3 of the fair value hierarchy.
The following is a summary of the inputs used as of August 31, 2015 in valuing the fund’s investments:
22
| | | | | |
| | Level 1 - Unadjusted Quoted Prices | Level 2 - Other Significant Observable Inputs | Level 3 -Significant Unobservable Inputs | Total |
Assets ($) | | | | |
Investments in Securities: | | | |
Equity Securities - Domestic Common Stocks† | 28,285,351 | - | - | 28,285,351 |
Equity Securities - Foreign Common Stocks† | 579,134 | - | - | 579,134 |
Exchange-Traded Funds | 2,146,647 | - | - | 2,146,647 |
Mutual Funds | 197,658 | - | - | 197,658 |
† See Statement of Investments for additional detailed categorizations.
At August 31, 2015, there were no transfers between Level 1 and Level 2 of the fair value hierarchy.
(b) Securities transactions and investment income: Securities transactions are recorded on a trade date basis. Realized gains and losses from securities transactions are recorded on the identified cost basis. Dividend income is recognized on the ex-dividend date and interest income, including, where applicable, accretion of discount and amortization of premium on investments, is recognized on the accrual basis.
Pursuant to a securities lending agreement with The Bank of New York Mellon, a subsidiary of BNY Mellon and an affiliate of Dreyfus, the fund may lend securities to qualified institutions. It is the fund’s policy that, at origination, all loans are secured by collateral of at least 102% of the value of U.S. securities loaned and 105% of the value of foreign securities loaned. Collateral equivalent to at least 100% of the market value of securities on loan is maintained at all times. Collateral is either in the form of cash, which can be invested in certain money market mutual funds managed by Dreyfus, or U.S. Government and Agency securities. The fund is entitled to receive all dividends, interest and distributions on securities loaned, in addition to income earned as a result of the lending transaction. Should a borrower fail to return the securities in a timely manner, The Bank of New York Mellon is required to replace the securities for the benefit of the fund or credit the fund with the market value of the unreturned securities and is subrogated to the fund’s rights against the borrower and the collateral. During the period ended August 31, 2015, The Bank of New York Mellon earned $242 from lending portfolio securities, pursuant to the securities lending agreement.
23
NOTES TO FINANCIAL STATEMENTS (continued)
(c) Affiliated issuers: Investments in other investment companies advised by Dreyfus are defined as “affiliated” under the Act. Investments in affiliated investment companies during the period ended August 31, 2015 were as follows:
| | | | | | |
Affiliated Investment Company | Value 8/31/2014 ($) | Purchases ($) | Sales ($) | Value 8/31/2015 ($) | Net Assets (%) |
Dreyfus Institutional Preferred Plus Money Market Fund | 83,526 | 10,945,494 | 10,831,362 | 197,658 | .7 |
Dreyfus Institutional Cash Advantage Fund | - | 6,199,292 | 6,199,292 | - | - |
Total | 83,526 | 17,144,786 | 17,030,654 | 197,658 | .7 |
(d) Dividends to shareholders: Dividends are recorded on the ex-dividend date. Dividends from investment income-net and dividends from net realized capital gains, if any, are normally declared and paid annually, but the fund may make distributions on a more frequent basis to comply with the distribution requirements of the Internal Revenue Code of 1986, as amended (the “Code”). To the extent that net realized capital gains can be offset by capital loss carryovers, it is the policy of the fund not to distribute such gains. Income and capital gain distributions are determined in accordance with income tax regulations, which may differ from GAAP.
(e) Federal income taxes: It is the policy of the fund to continue to qualify as a regulated investment company, if such qualification is in the best interests of its shareholders, by complying with the applicable provisions of the Code, and to make distributions of taxable income sufficient to relieve it from substantially all federal income and excise taxes.
As of and during the period ended August 31, 2015, the fund did not have any liabilities for any uncertain tax positions. The fund recognizes interest and penalties, if any, related to uncertain tax positions as income tax expense in the Statement of Operations. During the period ended August 31, 2015, the fund did not incur any interest or penalties.
Each tax year in the four-year period ended August 31, 2015 remains subject to examination by the Internal Revenue Service and state taxing authorities.
24
At August 31, 2015, the components of accumulated earnings on a tax basis were as follows: undistributed ordinary income $55,595, undistributed capital gains $1,092,129 and unrealized appreciation $490,232.
The tax character of distributions paid to shareholders during the fiscal periods ended August 31, 2015 and August 31, 2014 were as follows: ordinary income $515,071 and $554,532, and long-term capital gains $469,039 and $370,049, respectively.
During the period ended August 31, 2015, as a result of permanent book to tax differences, primarily due to the tax treatment for net operating losses and limited partnerships, the fund increased accumulated undistributed investment income-net by $47,713, decreased accumulated net realized gain (loss) on investments by $48,331 and increased paid-in capital by $618. Net assets and net asset value per share were not affected by this reclassification.
NOTE 2—Bank Lines of Credit:
The fund participates with other Dreyfus-managed funds in a $430 million unsecured credit facility led by Citibank, N.A. and a $300 million unsecured credit facility provided by The Bank of New York Mellon (each, a “Facility”), each to be utilized primarily for temporary or emergency purposes, including the financing of redemptions. Prior to October 8, 2014, the unsecured credit facility with Citibank, N.A. was $265 million. In connection therewith, the fund has agreed to pay its pro rata portion of commitment fees for each Facility. Interest is charged to the fund based on rates determined pursuant to the terms of the respective Facility at the time of borrowing.
The average amount of borrowings outstanding under the Facilities during the period ended August 31, 2015, was approximately $28,500 with a related weighted average annualized interest rate of 1.09%.
NOTE 3—Management Fee and Other Transactions with Affiliates:
(a) Pursuant to a management agreement with Dreyfus, the management fee is computed at the annual rate of .75% of the value of the fund's average daily net assets and is payable monthly. Dreyfus has contractually agreed, from September 1, 2014 through May 1, 2016, to waive receipt of its fees and/or assume the direct expenses of the fund, so that the expenses of none of the classes (excluding Rule 12b-1 Distribution Plan fees, Shareholder Services Plan fees, taxes, interest expense, brokerage commissions, commitment fees on borrowings and extraordinary
25
NOTES TO FINANCIAL STATEMENTS (continued)
expenses) exceed .95% of the value of the fund's average daily net assets. The reduction in expenses, pursuant to the undertaking, amounted to $106,083 during the period ended August 31, 2015.
During the period ended August 31, 2015, the Distributor retained $1,832 from commissions earned on sales of the fund's Class A shares.
(b) Under the Distribution Plan adopted pursuant to Rule 12b-1 under the Act, Class C shares pay the Distributor for distributing its shares at an annual rate of .75% of the value of its average daily net assets. During the period ended August 31, 2015, Class C shares were charged $8,392 pursuant to the Distribution Plan.
(c) Under the Shareholder Services Plan, Class A and Class C shares pay the Distributor at an annual rate of .25% of the value of their average daily net assets for the provision of certain services. The services provided may include personal services relating to shareholder accounts, such as answering shareholder inquiries regarding the fund and providing reports and other information, and services related to the maintenance of shareholder accounts. The Distributor may make payments to Service Agents (securities dealers, financial institutions or other industry professionals) with respect to these services. The Distributor determines the amounts to be paid to Service Agents. During the period ended August 31, 2015, Class A and Class C shares were charged $37,614 and $2,797, respectively, pursuant to the Shareholder Services Plan.
The fund has arrangements with the transfer agent and the custodian whereby the fund may receive earnings credits when positive cash balances are maintained, which are used to offset transfer agency and custody fees. For financial reporting purposes, the fund includes net earnings credits as an expense offset in the Statement of Operations.
The fund compensates Dreyfus Transfer, Inc., a wholly-owned subsidiary of Dreyfus, under a transfer agency agreement for providing transfer agency and cash management services for the fund. The majority of transfer agency fees are comprised of amounts paid on a per account basis, while cash management fees are related to fund subscriptions and redemptions. During the period ended August 31, 2015, the fund was charged $5,293 for transfer agency services and $220 for cash management services. These fees are included in Shareholder servicing costs in the Statement of Operations. Cash management fees were partially offset by earnings credits of $9.
The fund compensates The Bank of New York Mellon under a custody agreement for providing custodial services for the fund. These fees are determined based on net assets, geographic region and transaction activity.
26
During the period ended August 31, 2015, the fund was charged $7,311 pursuant to the custody agreement.
During the period ended August 31, 2015, the fund was charged $10,965 for services performed by the Chief Compliance Officer and his staff.
The components of “Due to The Dreyfus Corporation and affiliates” in the Statement of Assets and Liabilities consist of: management fees $19,816, Distribution Plan fees $1,189, Shareholder Services Plan fees $4,840, custodian fees $4,375, Chief Compliance Officer fees $1,737 and transfer agency fees $1,013, which are offset against an expense reimbursement currently in effect in the amount of $9,270.
(d) Each Board member also serves as a Board member of other funds within the Dreyfus complex. Annual retainer fees and attendance fees are allocated to each fund based on net assets.
NOTE 4—Securities Transactions:
The aggregate amount of purchases and sales of investment securities, excluding short-term securities, during the period ended August 31, 2015, amounted to $43,769,026 and $33,315,660, respectively.
At August 31, 2015, the cost of investments for federal income tax purposes was $30,718,558; accordingly, accumulated net unrealized appreciation on investments was $490,232, consisting of $1,717,643 gross unrealized appreciation and $1,227,411 gross unrealized depreciation.
27
REPORT OF INDEPENDENT REGISTERED
PUBLIC ACCOUNTING FIRM
Shareholders and Board of Directors
Dreyfus Opportunistic U.S. Stock Fund
We have audited the accompanying statement of assets and liabilities, including the statement of investments, of Dreyfus Opportunistic U.S. Stock Fund (one of the series comprising Advantage Funds, Inc.) as of August 31, 2015, and the related statement of operations for the year then ended, the statement of changes in net assets for each of the two years in the period then ended, and the financial highlights for the each of the periods indicated therein. These financial statements and financial highlights are the responsibility of the Fund’s management. Our responsibility is to express an opinion on these financial statements and financial highlights based on our audits.
We conducted our audits in accordance with the standards of the Public Company Accounting Oversight Board (United States). Those standards require that we plan and perform the audit to obtain reasonable assurance about whether the financial statements and financial highlights are free of material misstatement. We were not engaged to perform an audit of the Fund’s internal control over financial reporting. Our audits included consideration of internal control over financial reporting as a basis for designing audit procedures that are appropriate in the circumstances, but not for the purpose of expressing an opinion on the effectiveness of the Fund’s internal control over financial reporting. Accordingly, we express no such opinion. An audit also includes examining, on a test basis, evidence supporting the amounts and disclosures in the financial statements and financial highlights, assessing the accounting principles used and significant estimates made by management, and evaluating the overall financial statement presentation. Our procedures included confirmation of securities owned as of August 31, 2015 by correspondence with the custodian and others. We believe that our audits provide a reasonable basis for our opinion.
In our opinion, the financial statements and financial highlights referred to above present fairly, in all material respects, the financial position of Dreyfus Opportunistic U.S. Stock Fund at August 31, 2015, the results of its operations for the year then ended, the changes in its net assets for each of the two years in the period then ended, and the financial highlights for each of the indicated periods, in conformity with U.S. generally accepted accounting principles.
New York, New York
October 28, 2015
28
IMPORTANT TAX INFORMATION (Unaudited)
For federal tax purposes, the fund hereby reports 24.26% of the ordinary dividends paid during the fiscal year ended August 31, 2015 as qualifying for the corporate dividends received deduction. Also, certain dividends paid by the fund may be subject to a maximum tax rate of 15%, as provided for by the Jobs and Growth Tax Relief Reconciliation Act of 2003. Of the distributions paid during the fiscal year, $93,590 represents the maximum amount that may be considered qualified dividend income. The fund also hereby reports $.5606 per share as a short-term capital gain distribution and $.5105 per share as a long-term capital gain distribution paid on December 10, 2014. Shareholders will receive notification in early 2016 of the percentage applicable to the preparation of their 2015 income tax returns.
29
INFORMATION ABOUT THE RENEWAL OF THE FUND'S MANAGEMENT AGREEMENT (Unaudited)
At a meeting of the fund’s Board of Directors held on March 11-12, 2015, the Board considered the renewal of the fund’s Management Agreement pursuant to which Dreyfus provides the fund with investment advisory and administrative services (the “Agreement”). The Board members, none of whom are “interested persons” (as defined in the Investment Company Act of 1940, as amended) of the fund, were assisted in their review by independent legal counsel and met with counsel in executive session separate from Dreyfus representatives. In considering the renewal of the Agreement, the Board considered all factors that it believed to be relevant, including those discussed below. The Board did not identify any one factor as dispositive, and each Board member may have attributed different weights to the factors considered.
Analysis of Nature, Extent, and Quality of Services Provided to the Fund. The Board considered information provided to them at the meeting and in previous presentations from Dreyfus representatives regarding the nature, extent, and quality of the services provided to funds in the Dreyfus fund complex. Dreyfus provided the number of open accounts in the fund, the fund’s asset size and the allocation of fund assets among distribution channels. Dreyfus also had previously provided information regarding the diverse intermediary relationships and distribution channels of funds in the Dreyfus fund complex (such as retail direct or intermediary, in which intermediaries typically are paid by the fund and/or Dreyfus) and Dreyfus’ corresponding need for broad, deep, and diverse resources to be able to provide ongoing shareholder services to each intermediary or distribution channel, as applicable to the fund.
The Board also considered research support available to, and portfolio management capabilities of, the fund’s portfolio management personnel and that Dreyfus also provides oversight of day-to-day fund operations, including fund accounting and administration and assistance in meeting legal and regulatory requirements. The Board also considered Dreyfus’ extensive administrative, accounting and compliance infrastructures. The Board also considered portfolio management’s brokerage policies and practices (including policies and practices regarding soft dollars) and the standards applied in seeking best execution.
Comparative Analysis of the Fund’s Performance and Management Fee and Expense Ratio. The Board reviewed reports prepared by Lipper, Inc. (“Lipper”), an independent provider of investment company data, which included information comparing (1) the fund’s performance with the performance of a group of comparable funds (the “Performance Group”) and with a broader group of funds (the “Performance Universe”), all for various periods ended December 31, 2014, and (2) the fund’s actual and contractual management fees and total expenses with those of a group of comparable funds (the “Expense Group”) and with a broader group of funds (the “Expense Universe”), the information for which was derived in part from fund financial statements available to Lipper as of the date of its analysis. Dreyfus previously had
30
furnished the Board with a description of the methodology Lipper used to select the Performance Group and Performance Universe and the Expense Group and Expense Universe.
Dreyfus representatives stated that the usefulness of performance comparisons may be affected by a number of factors, including different investment limitations that may be applicable to the fund and comparison funds. They also noted that performance generally should be considered over longer periods of time, although it is possible that long-term performance can be adversely affected by even one period of significant underperformance so that a single investment decision or theme has the ability to affect disproportionately long-term performance. The Board discussed the results of the comparisons and noted that the fund’s total return performance was above the Performance Group and Performance Universe medians for the two- and three-year periods (the longest period since the fund’s inception), but below the Performance Group and Performance Universe medians for the one-year period. Dreyfus also provided a comparison of the fund’s calendar year total returns to the returns of the fund’s benchmark index.
The Board also reviewed the range of actual and contractual management fees and total expenses of the Expense Group and Expense Universe funds and discussed the results of the comparisons. The Board noted that the fund’s contractual management fee was below the Expense Group median and the fund’s actual management fee and total expenses were below the Expense Group and the Expense Universe medians.
Dreyfus representatives noted that Dreyfus has contractually agreed to waive receipt of its fees and/or assume the expenses of the fund, until February 1, 2016, so that annual direct fund operating expenses (excluding Rule 12b-1 fees, shareholder services fees, taxes, interest, brokerage commissions, commitment fees on borrowings, acquired fund fees and extraordinary expenses) do not exceed 0.95% of the fund’s average daily net assets.
Dreyfus representatives reviewed with the Board the management or investment advisory fees (1) paid by funds advised or administered by Dreyfus that are in the same Lipper category as the fund and (2) paid to Dreyfus or the Dreyfus-affiliated primary employer of the fund’s primary portfolio manager(s) for advising any separate accounts and/or other types of client portfolios that are considered to have similar investment strategies and policies as the fund (the “Similar Clients”), and explained the nature of the Similar Clients. They discussed differences in fees paid and the relationship of the fees paid in light of any differences in the services provided and other relevant factors. The Board considered the relevance of the fee information provided for the Similar Clients to evaluate the appropriateness and reasonableness of the fund’s management fee.
Analysis of Profitability and Economies of Scale. Dreyfus representatives reviewed the expenses allocated and profit received by Dreyfus and its affiliates and the resulting profitability percentage for managing the fund and the aggregate profitability percentage
31
INFORMATION ABOUT THE RENEWAL OF THE FUND'S MANAGEMENT AGREEMENT (Unaudited) (continued)
to Dreyfus and its affiliates for managing the funds in the Dreyfus fund complex, and the method used to determine the expenses and profit. The Board concluded that the profitability results were not unreasonable, given the services rendered and service levels provided by Dreyfus. The Board also noted the expense limitation arrangement and its effect on the profitability of Dreyfus and its affiliates. The Board also had been provided with information prepared by an independent consulting firm regarding Dreyfus’ approach to allocating costs to, and determining the profitability of, individual funds and the entire Dreyfus fund complex. The consulting firm also had analyzed where any economies of scale might emerge in connection with the management of a fund.
The Board considered, on the advice of its counsel, the profitability analysis (1) as part of its evaluation of whether the fees under the Agreement bear a reasonable relationship to the mix of services provided by Dreyfus, including the nature, extent and quality of such services, and (2) in light of the relevant circumstances for the fund and the extent to which economies of scale would be realized if the fund grows and whether fee levels reflect these economies of scale for the benefit of fund shareholders. Dreyfus representatives noted that a discussion of economies of scale is predicated on a fund having achieved a substantial size with increasing assets and that, if a fund’s assets had been stable or decreasing, the possibility that Dreyfus may have realized any economies of scale would be less. Dreyfus representatives also noted that, as a result of shared and allocated costs among funds in the Dreyfus fund complex, the extent of economies of scale could depend substantially on the level of assets in the complex as a whole, so that increases and decreases in complex-wide assets can affect potential economies of scale in a manner that is disproportionate to, or even in the opposite direction from, changes in the fund’s asset level. The Board also considered potential benefits to Dreyfus from acting as investment adviser and noted the soft dollar arrangements in effect for trading the fund’s investments.
At the conclusion of these discussions, the Board agreed that it had been furnished with sufficient information to make an informed business decision with respect to the renewal of the Agreement. Based on the discussions and considerations as described above, the Board concluded and determined as follows:
· The Board concluded that the nature, extent and quality of the services provided by Dreyfus are adequate and appropriate.
· The Board generally was satisfied with the fund’s performance.
· The Board concluded that the fee paid to Dreyfus was reasonable in light of the considerations described above.
· The Board determined that the economies of scale which may accrue to Dreyfus and its affiliates in connection with the management of the fund had been adequately considered by Dreyfus in connection with the fee rate charged
32
to the fund pursuant to the Agreement and that, to the extent in the future it were determined that material economies of scale had not been shared with the fund, the Board would seek to have those economies of scale shared with the fund.
In evaluating the Agreement, the Board considered these conclusions and determinations and also relied on its previous knowledge, gained through meetings and other interactions with Dreyfus and its affiliates, of the fund and the services provided to the fund by Dreyfus. The Board also relied on information received on a routine and regular basis throughout the year relating to the operations of the fund and the investment management and other services provided under the Agreement, including information on the investment performance of the fund in comparison to similar mutual funds and benchmark performance indices; general market outlook as applicable to the fund; and compliance reports. In addition, the Board’s consideration of the contractual fee arrangements for this fund had the benefit of a number of years of reviews of prior or similar agreements during which lengthy discussions took place between the Board and Dreyfus representatives. Certain aspects of the arrangements may receive greater scrutiny in some years than in others, and the Board’s conclusions may be based, in part, on their consideration of the same or similar arrangements in prior years. The Board determined to renew the Agreement.
33
BOARD MEMBERS INFORMATION (Unaudited)
INDEPENDENT BOARD MEMBERS
Joseph S. DiMartino (71)
Chairman of the Board (1995)
Principal Occupation During Past 5 Years:
· Corporate Director and Trustee (1995-present)
Other Public Company Board Memberships During Past 5 Years:
· CBIZ (formerly, Century Business Services, Inc.), a provider of outsourcing functions for small and medium size companies, Director (1997-present)
· The Newark Group, a provider of a national market of paper recovery facilities, paperboard mills and paperboard converting plants, Director (2000-2010)
No. of Portfolios for which Board Member Serves: 144
———————
Peggy C. Davis (72)
Board Member (2006)
Principal Occupation During Past 5 Years:
· Shad Professor of Law, New York University School of Law (1983-present)
No. of Portfolios for which Board Member Serves: 51
———————
David P. Feldman (75)
Board Member (1996)
Principal Occupation During Past 5 Years:
· Corporate Director and Trustee (1985-present)
Other Public Company Board Memberships During Past 5 Years:
· BBH Mutual Funds Group (5 registered mutual funds), Director (1992-2014)
No. of Portfolios for which Board Member Serves: 37
———————
Ehud Houminer (75)
Board Member (1993)
Principal Occupation During Past 5 Years:
· Executive-in-Residence at the Columbia Business School, Columbia University (1992-present)
Other Public Company Board Memberships During Past 5 Years:
· Avnet, Inc., an electronics distributor, Director (1993-2012)
No. of Portfolios for which Board Member Serves: 62
———————
34
Lynn Martin (75)
Board Member (2012)
Principal Occupation During Past 5 Years:
· President of The Martin Hall Group LLC, a human resources consulting firm (2005-2012)
Other Public Company Board Memberships During Past 5 Years:
· AT&T, Inc., a telecommunications company, Director (1999-2012)
· Ryder System, Inc., a supply chain and transportation management company, Director (1993-2012)
No. of Portfolios for which Board Member Serves: 37
———————
Robin A. Melvin (51)
Board Member (2012)
Principal Occupation During Past 5 Years:
· Co-chairman, Illinois Mentoring Partnership, non-profit organization dedicated to increasing the quantity and quality of mentoring services in Illinois; (2014-present; a board member since 2013)
· Director, Boisi Family Foundation, a private family foundation that supports youth-serving organizations that promote the self sufficiency of youth from disadvantaged circumstances (1995-2012)
No. of Portfolios for which Board Member Serves: 114
———————
Dr. Martin Peretz (76)
Board Member (2006)
Principal Occupation During Past 5 Years:
· Editor-in-Chief Emeritus of The New Republic Magazine (2011-2012) (previously, Editor-in-Chief, 1974-2011)
· Director of TheStreet.com, a financial information service on the web (1996-2010)
· Lecturer at Harvard University (1969-2012)
No. of Portfolios for which Board Member Serves: 37
———————
Once elected all Board Members serve for an indefinite term, but achieve Emeritus status upon reaching age 80. The address of the Board Members and Officers is c/o The Dreyfus Corporation, 200 Park Avenue, New York, New York 10166. Additional information about the Board Members is available in the fund's Statement of Additional Information which can be obtained from Dreyfus free of charge by calling this toll free number: 1-800-DREYFUS.
James F. Henry, Emeritus Board Member
Dr. Paul A. Marks, Emeritus Board Member
Philip L. Toia, Emeritus Board Member
35
OFFICERS OF THE FUND (Unaudited)
BRADLEY J. SKAPYAK, President since January 2010.
Chief Operating Officer and a director of the Manager since June 2009, Chairman of Dreyfus Transfer, Inc., an affiliate of the Manager and the transfer agent of the funds, since May 2011 and Executive Vice President of the Distributor since June 2007. From April 2003 to June 2009, Mr. Skapyak was the head of the Investment Accounting and Support Department of the Manager. He is an officer of 69 investment companies (comprised of 144 portfolios) managed by the Manager. He is 56 years old and has been an employee of the Manager since February 1988.
BENNETT A. MACDOUGALL, Chief Legal Officer since October 2015.
Chief Legal Officer of the Manager since June 2015; from June 2005 to June 2015, Director and Associate General Counsel of Deutsche Bank – Asset & Wealth Management Division, and Chief Legal Officer of Deutsche Investment Management Americas Inc. He is an officer of 70 investment companies (comprised of 169 portfolios) managed by the Manager. He is 44 years old and has been an employee of the Manager since June 2015.
JANETTE E. FARRAGHER, Vice President and Secretary since December 2011.
Assistant General Counsel of BNY Mellon, and an officer of 70 investment companies (comprised of 169 portfolios) managed by the Manager. She is 52 years old and has been an employee of the Manager since February 1984.
JAMES BITETTO, Vice President and Assistant Secretary since August 2005.
Managing Counsel of BNY Mellon and Secretary of the Manager, and an officer of 70 investment companies (comprised of 169 portfolios) managed by the Manager. He is 49 years old and has been an employee of the Manager since December 1996.
JONI LACKS CHARATAN, Vice President and Assistant Secretary since August 2005.
Managing Counsel of BNY Mellon, and an officer of 70 investment companies (comprised of 169 portfolios) managed by the Manager. She is 59 years old and has been an employee of the Manager since October 1988.
JOSEPH M. CHIOFFI, Vice President and Assistant Secretary since August 2005.
Managing Counsel of BNY Mellon, and an officer of 70 investment companies (comprised of 169 portfolios) managed by the Manager. He is 53 years old and has been an employee of the Manager since June 2000.
JOHN B. HAMMALIAN, Vice President and Assistant Secretary since August 2005.
Senior Managing Counsel of BNY Mellon, and an officer of 70 investment companies (comprised of 169 portfolios) managed by the Manager. He is 52 years old and has been an employee of the Manager since February 1991.
MAUREEN E. KANE, Vice President and Assistant Secretary since April 2015.
Managing Counsel of BNY Mellon since July 2014; from October 2004 until July 2014, General Counsel, and from May 2009 until July 2014, Chief Compliance Officer of Century Capital Management. She is an officer of 70 investment companies (comprised of 169 portfolios) managed by the Manager. She is 53 years old and has been an employee of the Manager since July 2014.
SARAH S. KELLEHER, Vice President and Assistant Secretary since April 2014.
Senior Counsel of BNY Mellon, and an officer of 70 investment companies (comprised of 169 portfolios) managed by the Manager; from August 2005 to March 2013, Associate General Counsel of Third Avenue Management. She is 39 years old and has been an employee of the Manager since March 2013.
JEFF PRUSNOFSKY, Vice President and Assistant Secretary since August 2005.
Senior Managing Counsel of BNY Mellon, and an officer of 70 investment companies (comprised of 169 portfolios) managed by the Manager. He is 50 years old and has been an employee of the Manager since October 1990.
JAMES WINDELS, Treasurer since November 2001.
Director – Mutual Fund Accounting of the Manager, and an officer of 70 investment companies (comprised of 169 portfolios) managed by the Manager. He is 56 years old and has been an employee of the Manager since April 1985.
36
RICHARD CASSARO, Assistant Treasurer since January 2008.
Senior Accounting Manager – Money Market and Municipal Bond Funds of the Manager, and an officer of 70 investment companies (comprised of 169 portfolios) managed by the Manager. He is 56 years old and has been an employee of the Manager since September 1982.
GAVIN C. REILLY, Assistant Treasurer since December 2005.
Tax Manager of the Investment Accounting and Support Department of the Manager, and an officer of 70 investment companies (comprised of 169 portfolios) managed by the Manager. He is 47 years old and has been an employee of the Manager since April 1991.
ROBERT S. ROBOL, Assistant Treasurer since August 2005.
Senior Accounting Manager – Fixed Income Funds of the Manager, and an officer of 70 investment companies (comprised of 169 portfolios) managed by the Manager. He is 51 years old and has been an employee of the Manager since October 1988.
ROBERT SALVIOLO, Assistant Treasurer since July 2007.
Senior Accounting Manager – Equity Funds of the Manager, and an officer of 70 investment companies (comprised of 169 portfolios) managed by the Manager. He is 48 years old and has been an employee of the Manager since June 1989.
ROBERT SVAGNA, Assistant Treasurer since August 2005.
Senior Accounting Manager – Equity Funds of the Manager, and an officer of 70 investment companies (comprised of 169 portfolios) managed by the Manager. He is 48 years old and has been an employee of the Manager since November 1990.
JOSEPH W. CONNOLLY, Chief Compliance Officer since October 2004.
Chief Compliance Officer of the Manager and The Dreyfus Family of Funds (70 investment companies, comprised of 169 portfolios). He is 58 years old and has served in various capacities with the Manager since 1980, including manager of the firm’s Fund Accounting Department from 1997 through October 2001.
37
Dreyfus Opportunistic U.S. Stock Fund
200 Park Avenue
New York, NY 10166
Manager
The Dreyfus Corporation
200 Park Avenue
New York, NY 10166
Custodian
The Bank of New York Mellon
225 Liberty Street
New York, NY 10286
Transfer Agent &
Dividend Disbursing Agent
Dreyfus Transfer, Inc.
200 Park Avenue
New York, NY 10166
Distributor
MBSC Securities Corporation
200 Park Avenue
New York, NY 10166
| | |
Ticker Symbols: | Class A: DOSAX Class C: DOSCX Class I: DOSIX Class Y: DOSYX |
Telephone Call your financial representative or 1-800-DREYFUS
Mail The Dreyfus Family of Funds, 144 Glenn Curtiss Boulevard, Uniondale, NY 11556-0144
E-mail Send your request to info@dreyfus.com
Internet Information can be viewed online or downloaded at www.dreyfus.com
The fund files its complete schedule of portfolio holdings with the Securities and Exchange Commission (“SEC”) for the first and third quarters of each fiscal year on Form N-Q. The fund’s Forms N-Q are available on the SEC’s website at www.sec.gov and may be reviewed and copied at the SEC’s Public Reference Room in Washington, DC. (phone 1-800-SEC-0330 for information).
Information regarding how the fund voted proxies related to portfolio securities for the most recent 12-month period ended June 30 is available at www.dreyfus.com and on the SEC’s website at www.sec.gov and without charge, upon request, by calling 1-800-DREYFUS.
| | |
© 2015 MBSC Securities Corporation |
6316AR0815 |

Dreyfus Strategic Value Fund
| | | |

| | ANNUAL REPORT
August 31, 2015 |
| |
Save time. Save paper. View your next shareholder report online as soon as it’s available. Log into www.dreyfus.com and sign up for Dreyfus eCommunications. It’s simple and only takes a few minutes. |
| |
The views expressed in this report reflect those of the portfolio manager only through the end of the period covered and do not necessarily represent the views of Dreyfus or any other person in the Dreyfus organization. Any such views are subject to change at any time based upon market or other conditions and Dreyfus disclaims any responsibility to update such views. These views may not be relied on as investment advice and, because investment decisions for a Dreyfus fund are based on numerous factors, may not be relied on as an indication of trading intent on behalf of any Dreyfus fund. |
| |
Not FDIC-Insured • Not Bank-Guaranteed • May Lose Value |
Contents
T H E F U N D
F O R M O R E I N F O R M AT I O N
Back Cover
| | | | |
| |
Dreyfus Strategic Value Fund
| | The Fund |
A LETTER FROM THE PRESIDENT
Dear Shareholder:
We are pleased to present this annual report for Dreyfus Strategic Value Fund, covering the 12-month period from September 1, 2014, through August 31, 2015. For information about how the fund performed during the reporting period, as well as general market perspectives, we provide a Discussion of Fund Performance on the pages that follow.
Financial markets proved volatile over the reporting period. For much of the year, a recovering U.S. economy enabled stocks to advance, but those gains were more than erased in August when economic concerns in China, falling commodity prices and a stronger U.S. dollar sparked sharp corrections in equity markets throughout the world. The emerging markets were especially hard hit in this environment. U.S. bonds generally fared better, rallying in late 2014 due to robust investor demand before reversing course in the spring as the domestic economy strengthened. Global economic instability in August hurt corporate-backed and inflation-linked bonds, but U.S. government securities held up relatively well.
We expect market uncertainty and volatility to persist over the near term as investors vacillate between hopes that current market turmoil represents a healthy correction and fears that further disappointments could trigger a full-blown bear market. Our investment strategists and portfolio managers are monitoring developments carefully, keeping a close watch on Chinese fiscal and monetary policy, liquidity factors affecting various asset classes, and other developments that could influence investor sentiment. Over the longer term, we remain confident that financial markets are likely to stabilize as the world adjusts to slower Chinese economic growth, abundant energy resources, and the anticipated eventual normalization of monetary policy. In our view, investors will continue to be well served under these circumstances by a long-term perspective and a disciplined investment approach.
Thank you for your continued confidence and support.
Sincerely,

J. Charles Cardona
President
The Dreyfus Corporation
September 15, 2015
2
DISCUSSION OF FUND PERFORMANCE
For the period of September 1, 2014, through August 31, 2015, as provided by Brian Ferguson, Portfolio Manager
Fund and Market Performance Overview
For the 12-month period ended August 31, 2015, Dreyfus Strategic Value Fund’s Class A shares produced a total return of -0.90%, Class C shares returned -1.65%, Class I shares returned -0.66%, and Class Y shares returned -0.66%.1 The fund’s benchmark, the Russell 1000® Value Index, produced a total return of –3.48% for the same period.2
Moderate market gains over much of the reporting period were more than offset by subsequent declines triggered by renewed global economic concerns. The fund outperformed its benchmark, in part due to our focus on companies that derive most of their revenues in the United States.
The Fund’s Investment Approach
The fund seeks capital appreciation. We identify potential investments through extensive quantitative and fundamental research. The fund will focus on individual stock selection (a “bottom-up” approach), emphasizing three key factors: value, quantitative screens tracking traditional measures — such as price-to-earnings, price-to-book and price-to-sales ratios — that are analyzed and compared against the market; sound business fundamentals, in which a company’s balance sheet and income data are examined to determine the company’s financial history; and positive business momentum, where a company’s earnings and forecast changes are analyzed and sales and earnings trends are reviewed to determine the company’s financial condition or the presence of a catalyst that will trigger a price increase near- to mid-term.
The fund typically sells a stock when we believe there is a more attractive alternative, the stock’s valuation is excessive, or there are deteriorating fundamentals, such as a loss of competitive advantage, a failure in management execution, or deteriorating capital structure.
Global Economic Concerns Sparked Market Turmoil
The reporting period began in the midst of a market downturn in September and early October 2014, but U.S. employment gains, better consumer confidence, and improved business sentiment prompted a quick market recovery. Consequently, some broad market indices climbed to record highs through the end of February 2015.
Investors responded negatively in March to sluggish economic growth stemming from severe winter weather and an appreciating U.S. dollar. However, the U.S. economy regained traction in the spring, and stocks resumed their advance until uncertainty regarding a debt crisis in Greece and slowing economic growth in China again sent U.S. stock prices lower over the summer. In mid-August, the Chinese central bank unexpectedly devalued the country’s currency, sending some market indices into negative territory. In this tumultuous environment, value-oriented stocks generally trailed their more growth-oriented counterparts.
3
DISCUSSION OF FUND PERFORMANCE (continued)
Stock Selections Bolstered Relative Performance
Although we are never satisfied with negative absolute returns, we are pleased that the fund outperformed its benchmark on the strength of our security selection strategy. The fund’s focus on U.S.-centric companies helped cushion the impact of economic instability in overseas markets, and we successfully navigated the opportunities and pitfalls presented by heightened market volatility.
Relative results were especially favorable in the consumer staples sector, where we focused on companies engaged in shareholder-friendly activities. For example, packaged food producers ConAgra Foods and Kellogg advanced when activist investors prodded management to enhance shareholder value, and beverage companies Coca-Cola Enterprises and PepsiCo benefited from industry consolidation in Europe. While falling commodity prices generally hurt the materials sector, the fund avoided some of the harder hit metals-and-mining companies. Instead, we focused on domestically oriented construction aggregates producers Martin Marietta Materials and Vulcan Materials. We added to the fund’s holdings in the energy sector in the wake of sharp declines early in the reporting period. We emphasized companies, such as EOG Resources, with strong balance sheets and assets, and refiners, such as Valero Energy and Phillips 66, that benefited from reduced input costs. The fund held no exposure to the struggles of the largest integrated oil companies.
Laggards during the reporting period included the financials sector, where the fund did not participate in some of the better performers among real estate investment trusts and insurance companies. The fund also held no exposure to utilities stocks, which did not meet our valuation criteria but outperformed market averages amid investors’ economic and interest-rate concerns.
Selectively Positioned for Continued U.S. Economic Growth
Despite ongoing turmoil in overseas markets, the U.S. economy has continued to grow. At the same time, equity valuations have become more attractive in the wake of recent market declines. Therefore, we believe that many value-oriented stocks are well positioned for the second half of 2015 and beyond.
However, in our judgment, selectivity is likely to be key to investment performance over the months ahead. We have intensified our focus on underlying company fundamentals, attractive intrinsic values, and shareholder-friendly activities. The fund ended the reporting period with overweighted positions in the consumer staples and materials sectors, but we have identified relatively few opportunities in the utilities and industrials sectors.
September 15, 2015
Please note, the position in any security highlighted with italicized typeface was sold during the reporting period.
Equity funds are subject generally to market, market sector, market liquidity, issuer, and investment style risks, among other factors, to varying degrees, all of which are more fully described in the fund’s prospectus.
The fund’s performance will be influenced by political, social, and economic factors affecting investments in foreign companies. Special risks associated with investments in foreign companies include exposure to currency fluctuations, less liquidity, less developed or less efficient trading markets, lack of comprehensive company information, political instability, and differing auditing and legal standards. These risks are enhanced in emerging market countries. Please read the prospectus for further discussion of these risks.
4
1Total return includes reinvestment of dividends and any capital gains paid and does not take into consideration the maximum initial sales charge in the case of Class A shares, or the applicable contingent deferred sales charges imposed on redemptions in the case of Class C shares. Had these charges been reflected, returns would have been lower. Past performance is no guarantee of future results. Share price and investment return fluctuate such that upon redemption fund shares may be worth more or less than their original cost. The fund’s returns reflect the absorption of certain fund expenses by The Dreyfus Corporation pursuant to an agreement in effect through January 1, 2016, at which time it may be extended, terminated, or modified. Had these expenses not been absorbed, the fund’s returns would have been lower.
2SOURCE: LIPPER INC. – Reflects the reinvestment of dividends and, where applicable, capital gain distributions. The Russell 1000® Value Index is an unmanaged index which measures the performance of those Russell 1000® companies with lower price-to-book ratios and lower forecasted growth values. Investors cannot invest directly in any index.
5
FUND PERFORMANCE
Comparison of change in value of $10,000 investment in Dreyfus Strategic Value Fund Class A shares, Class C shares, Class I shares and Class Y shares and the Russell 1000 Value Index
† Source: Lipper Inc.
†† The total return figures presented for Class Y shares of the fund reflect the performance of the fund’s Class A shares for the period prior to 7/1/13 (the inception date for Class Y shares), not reflecting the applicable sales charges for Class A shares.
Past performance is not predictive of future performance.
The above graph compares a $10,000 investment made in each of the Class A, Class C, Class I and Class Y shares of Dreyfus Strategic Value Fund on 8/31/05 to a $10,000 investment made in the Russell 1000 Value Index (the “Index”) on that date. All dividends and capital gain distributions are reinvested.
The fund’s performance shown in the line graph above takes into account the maximum initial sales charge on Class A shares and all other applicable fees and expenses on all classes. The Index uses company price-to-book ratios and long-term growth rates to calculate a composite ranking, which is used to determine if a stock is “growth” or “value.” Unlike a mutual fund, the Index is not subject to charges, fees and other expenses. Investors cannot invest directly in any index. Further information relating to fund performance, including expense reimbursements, if applicable, is contained in the Financial Highlights section of the prospectus and elsewhere in this report.
6
| | | | | | | | |
Average Annual Total Returns as of 8/31/15 | | | | |
| | | | | | | | |
| | | Inception | | | | | |
| | Date | 1 Year | 5 Years | | 10 Years | |
| | | | | | | | |
Class A shares | | | | | | |
with maximum sales charge (5.75%) without sales charge | 9/29/95 | -6.59% | 13.56% | | 6.51% | |
9/29/95 | -0.90% | 14.91% | | 7.15% | |
Class C shares | | | | | | |
with applicable redemption charge † | 5/31/01 | -2.53% | 14.05% | | 6.35% | |
without redemption | 5/31/01 | -1.65% | 14.05% | | 6.35% | |
Class I shares | 5/31/01 | -0.66% | 15.20% | | 7.39% | |
Class Y shares | 7/1/13 | -0.66% | 15.08% | †† | 7.22% | †† |
Russell 1000 Value Index | | -3.48% | 14.68% | | 6.18% | |
Past performance is not predictive of future performance. The fund’s performance shown in the graph and table does not reflect the deduction of taxes that a shareholder would pay on fund distributions or the redemption of fund shares. In addition to the performance of Class A shares shown with and without a maximum sales charge, the fund’s performance shown in the table takes into account all other applicable fees and expenses on all classes.
† The maximum contingent deferred sales charge for Class C shares is 1% for shares redeemed within one year of the date of purchase.
††The total return performance figures presented for Class Y shares of the fund reflect the performance of the fund’s Class A shares for the period prior to 7/1/13 (the inception date for Class Y shares), not reflecting the applicable sales charges for Class A shares.
7
UNDERSTANDING YOUR FUND’S EXPENSES (Unaudited)
As a mutual fund investor, you pay ongoing expenses, such as management fees and other expenses. Using the information below, you can estimate how these expenses affect your investment and compare them with the expenses of other funds. You also may pay one-time transaction expenses, including sales charges (loads) and redemption fees, which are not shown in this section and would have resulted in higher total expenses. For more information, see your fund’s prospectus or talk to your financial adviser.
Review your fund’s expenses
The table below shows the expenses you would have paid on a $1,000 investment in Dreyfus Strategic Value Fund from March 1, 2015 to August 31, 2015. It also shows how much a $1,000 investment would be worth at the close of the period, assuming actual returns and expenses.
| | | | | | | | |
Expenses and Value of a $1,000 Investment | | |
assuming actual returns for the six months ended August 31, 2015 |
| | | | | | | | |
| | | | Class A | Class C | Class I | Class Y |
Expenses paid per $1,000† | $ 4.79 | $ 8.45 | $ 3.57 | $ 3.57 |
Ending value (after expenses) | $ 941.10 | $ 937.30 | $ 942.10 | $ 942.10 |
COMPARING YOUR FUND’S EXPENSES
WITH THOSE OF OTHER FUNDS (Unaudited)
Using the SEC’s method to compare expenses
The Securities and Exchange Commission (SEC) has established guidelines to help investors assess fund expenses. Per these guidelines, the table below shows your fund’s expenses based on a $1,000 investment, assuming a hypothetical 5% annualized return. You can use this information to compare the ongoing expenses (but not transaction expenses or total cost) of investing in the fund with those of other funds. All mutual fund shareholder reports will provide this information to help you make this comparison. Please note that you cannot use this information to estimate your actual ending account balance and expenses paid during the period.
| | | | | | | | |
Expenses and Value of a $1,000 Investment | | |
assuming a hypothetical 5% annualized return for the six months ended August 31, 2015 |
| | | | | | | | |
| | | | Class A | Class C | Class I | Class Y |
Expenses paid per $1,000† | $ 4.99 | $ 8.79 | $ 3.72 | $ 3.72 |
Ending value (after expenses) | $ 1,020.27 | $ 1,016.48 | $ 1,021.53 | $ 1,021.53 |
† Expenses are equal to the fund’s annualized expense ratio of .98% for Class A, 1.73% for Class C, .73% for Class I and .73% for Class Y, multiplied by the average account value over the period, multiplied by 184/365 (to reflect the one-half year period).
8
STATEMENT OF INVESTMENTS
August 31, 2015
| | | | | | | | | |
Common Stocks - 99.8% | | Shares | | Value ($) | |
Banks - 9.0% | | | | | |
Citigroup | | 979,276 | | 52,371,680 | |
JPMorgan Chase & Co. | | 1,056,374 | | 67,713,573 | |
PNC Financial Services Group | | 203,124 | | 18,508,659 | |
| | | | | 138,593,912 | |
Capital Goods - 6.7% | | | | | |
Honeywell International | | 227,108 | | 22,545,011 | |
Northrop Grumman | | 137,899 | | 22,579,582 | |
Owens Corning | | 269,516 | | 11,936,864 | |
Raytheon | | 190,235 | | 19,510,502 | |
United Technologies | | 285,604 | | 26,164,182 | |
| | | | | 102,736,141 | |
Consumer Durables & Apparel - .8% | | | | | |
PVH | | 108,386 | | 12,895,766 | |
Consumer Services - 1.7% | | | | | |
Carnival | | 528,000 | | 25,993,440 | |
Diversified Financials - 13.0% | | | | | |
Berkshire Hathaway, Cl. B | | 284,261 | a | 38,102,344 | |
Capital One Financial | | 339,305 | | 26,380,964 | |
Charles Schwab | | 551,280 | | 16,747,886 | |
E*TRADE Financial | | 659,927 | a | 17,349,481 | |
Goldman Sachs Group | | 83,584 | | 15,763,942 | |
Leucadia National | | 346,016 | | 7,425,503 | |
Morgan Stanley | | 894,591 | | 30,818,660 | |
TD Ameritrade Holding | | 441,890 | | 14,785,639 | |
Voya Financial | | 755,097 | | 32,529,579 | |
| | | | | 199,903,998 | |
Energy - 12.6% | | | | | |
Anadarko Petroleum | | 166,984 | | 11,952,715 | |
EOG Resources | | 561,557 | | 43,975,529 | |
Occidental Petroleum | | 1,071,570 | | 78,235,326 | |
Phillips 66 | | 414,595 | | 32,782,027 | |
Schlumberger | | 350,841 | | 27,144,568 | |
| | | | | 194,090,165 | |
Exchange-Traded Funds - .5% | | | | | |
iShares Russell 1000 Value Index Fund | | 87,142 | | 8,430,117 | |
Food & Staples Retailing - 2.5% | | | | | |
CVS Health | | 286,094 | | 29,296,026 | |
9
STATEMENT OF INVESTMENTS (continued)
| | | | | | | | | | | |
Common Stocks - 99.8% (continued) | | Shares | | Value ($) | |
Food & Staples Retailing - 2.5% (continued) | | | | | |
Rite Aid | | 1,179,843 | a | 9,733,705 | |
| | | | | 39,029,731 | |
Food, Beverage & Tobacco - 7.7% | | | | | |
Coca-Cola Enterprises | | 223,879 | | 11,527,530 | |
ConAgra Foods | | 398,333 | | 16,602,519 | |
Kellogg | | 297,837 | | 19,740,636 | |
Molson Coors Brewing, Cl. B | | 249,225 | | 16,969,730 | |
Mondelez International, Cl. A | | 366,485 | | 15,524,305 | |
PepsiCo | | 412,129 | | 38,299,148 | |
| | | | | 118,663,868 | |
Health Care Equipment & Services - 4.2% | | | | | |
Anthem | | 79,596 | | 11,227,016 | |
Boston Scientific | | 684,161 | a | 11,452,855 | |
Cardinal Health | | 228,770 | | 18,820,908 | |
Express Scripts Holding | | 136,976 | a | 11,451,194 | |
UnitedHealth Group | | 97,306 | | 11,258,304 | |
| | | | | 64,210,277 | |
Insurance - 7.1% | | | | | |
ACE | | 149,723 | | 15,295,702 | |
American International Group | | 456,950 | | 27,572,363 | |
FNF Group | | 307,852 | | 11,208,891 | |
Hartford Financial Services Group | | 451,031 | | 20,724,874 | |
Prudential Financial | | 419,661 | | 33,866,643 | |
| | | | | 108,668,473 | |
Materials - 6.1% | | | | | |
CF Industries Holdings | | 197,143 | | 11,312,065 | |
Martin Marietta Materials | | 93,731 | | 15,728,062 | |
Mosaic | | 296,138 | | 12,091,314 | |
Newmont Mining | | 691,512 | | 11,804,110 | |
Packaging Corporation of America | | 229,590 | | 15,407,785 | |
Vulcan Materials | | 287,006 | | 26,869,502 | |
| | | | | 93,212,838 | |
Media - 1.9% | | | | | |
CBS, Cl. B | | 249,062 | | 11,267,565 | |
Interpublic Group of Companies | | 957,363 | | 18,075,013 | |
| | | | | 29,342,578 | |
Pharmaceuticals, Biotechnology & Life Sciences - 8.4% | | | | | |
AbbVie | | 182,215 | | 11,372,038 | |
Bristol-Myers Squibb | | 182,203 | | 10,835,612 | |
Eli Lilly & Co. | | 277,583 | | 22,858,960 | |
10
| | | | | | | | | | | | | | |
Common Stocks - 99.8% (continued) | | Shares | | Value ($) | |
Pharmaceuticals, Biotechnology & Life Sciences - 8.4% (continued) | | | | | |
Merck & Co. | | 660,809 | | 35,584,565 | |
Pfizer | | 1,491,971 | | 48,071,306 | |
| | | | | 128,722,481 | |
Real Estate - .7% | | | | | |
Communications Sales & Leasing | | 539,368 | | 10,841,297 | |
Retailing - 1.0% | | | | | |
Liberty Interactive, Cl. A | | 273,599 | a | 7,398,117 | |
Staples | | 554,933 | | 7,885,598 | |
| | | | | 15,283,715 | |
Semiconductors & Semiconductor Equipment - 2.9% | | | | | |
Applied Materials | | 997,138 | | 16,038,965 | |
Microchip Technology | | 286,304 | | 12,167,920 | |
Texas Instruments | | 360,484 | | 17,245,555 | |
| | | | | 45,452,440 | |
Software & Services - 3.8% | | | | | |
Citrix Systems | | 105,748 | a | 7,202,496 | |
Google Cl. A | | 34,874 | a | 22,592,075 | |
Oracle | | 792,134 | | 29,380,250 | |
| | | | | 59,174,821 | |
Technology Hardware & Equipment - 5.0% | | | | | |
Apple | | 69,813 | | 7,872,114 | |
Cisco Systems | | 1,928,453 | | 49,908,364 | |
EMC | | 364,675 | | 9,069,467 | |
Hewlett-Packard | | 344,420 | | 9,664,425 | |
| | | | | 76,514,370 | |
Telecommunication Services - 3.2% | | | | | |
AT&T | | 1,177,293 | | 39,086,128 | |
Verizon Communications | | 224,822 | | 10,344,060 | |
| | | | | 49,430,188 | |
Transportation - 1.0% | | | | | |
Delta Air Lines | | 341,581 | | 14,954,416 | |
Total Common Stocks (cost $1,390,577,933) | | | | 1,536,145,032 | |
Other Investments - .2% | | | | | |
Registered Investment Company; | | | | | |
Dreyfus Institutional Preferred Plus Money Market Fund | | 2,203,251 | b | 2,203,251 | |
(cost $2,203,251) | | | | | |
Total Investments (cost $1,392,781,184) | | 100.0% | | 1,538,348,283 | |
Cash and Receivables (Net) | | .0% | | 389,846 | |
Net Assets | | 100.0% | | 1,538,738,129 | |
11
STATEMENT OF INVESTMENTS (continued)
aNon-income producing security.
bInvestment in affiliated money market mutual fund.
| | |
Portfolio Summary (Unaudited) † | Value (%) |
Diversified Financials | 13.0 |
Energy | 12.6 |
Banks | 9.0 |
Pharmaceuticals, Biotechnology & Life Sciences | 8.4 |
Food, Beverage & Tobacco | 7.7 |
Insurance | 7.1 |
Capital Goods | 6.7 |
Materials | 6.1 |
Technology Hardware & Equipment | 5.0 |
Health Care Equipment & Services | 4.2 |
Software & Services | 3.8 |
Telecommunication Services | 3.2 |
Semiconductors & Semiconductor Equipment | 2.9 |
Food & Staples Retailing | 2.5 |
Media | 1.9 |
Consumer Services | 1.7 |
Retailing | 1.0 |
Transportation | 1.0 |
Consumer Durables & Apparel | .8 |
Real Estate | .7 |
Exchange-Traded Funds | .5 |
Money Market Investment | .2 |
| | 100.0 |
†Based on net assets.
See notes to financial statements.
12
STATEMENT OF ASSETS AND LIABILITIES
August 31, 2015
| | | | | | |
| | | Cost | | Value |
Assets ($): | | | |
Investments in securities—See Statement of Investments: | | | | |
Unaffiliated issuers | | 1,390,577,933 | | 1,536,145,032 |
Affiliated issuers | | 2,203,251 | | 2,203,251 |
Cash | | | | | 217,499 |
Receivable for investment securities sold | | | | | 3,804,936 |
Dividends receivable | | | | | 2,514,182 |
Receivable for shares of Common Stock subscribed | | | | | 582,748 |
Prepaid expenses | | | | | 51,058 |
| | | | | 1,545,518,706 |
Liabilities ($): | | | |
Due to The Dreyfus Corporation and affiliates—Note 3(c) | | | | | 1,194,190 |
Payable for investment securities purchased | | | | | 3,464,335 |
Payable for shares of Common Stock redeemed | | | | | 1,864,165 |
Accrued expenses | | | | | 257,887 |
| | | | | 6,780,577 |
Net Assets ($) | | | 1,538,738,129 |
Composition of Net Assets ($): | | | |
Paid-in capital | | | | | 1,218,523,299 |
Accumulated undistributed investment income—net | | | | | 11,126,296 |
Accumulated net realized gain (loss) on investments | | | | | 163,521,435 |
Accumulated net unrealized appreciation (depreciation)
on investments | | | | | 145,567,099 |
Net Assets ($) | | | 1,538,738,129 |
| | | | | |
Net Asset Value Per Share | Class A | Class C | Class I | Class Y |
Net Assets ($) | 880,116,137 | 53,225,910 | 389,711,433 | 215,684,649 |
Shares Outstanding | 22,867,791 | 1,464,211 | 10,101,548 | 5,590,693 |
Net Asset Value Per Share ($) | 38.49 | 36.35 | 38.58 | 38.58 |
See notes to financial statements.
13
STATEMENT OF OPERATIONS
Year Ended August 31, 2015
| | | | | | | |
| | | | | | |
| | | | | | |
Investment Income ($): | | | | |
Income: | | | | |
Cash dividends: | | | | |
Unaffliated issuers | | | 29,641,272 | |
Affliated issuers | | | 4,106 | |
Income from securities lending—Note 1(b) | | | 2,454 | |
Total Income | | | 29,647,832 | |
Expenses: | | | | |
Management fee—Note 3(a) | | | 12,401,207 | |
Shareholder servicing costs—Note 3(c) | | | 3,665,682 | |
Distribution fees—Note 3(b) | | | 433,657 | |
Directors' fees and expenses—Note 3(d) | | | 118,656 | |
Custodian fees—Note 3(c) | | | 100,476 | |
Prospectus and shareholders’ reports | | | 79,506 | |
Registration fees | | | 72,653 | |
Professional fees | | | 72,231 | |
Loan commitment fees—Note 2 | | | 18,282 | |
Interest expense—Note 2 | | | 6,029 | |
Miscellaneous | | | 36,952 | |
Total Expenses | | | 17,005,331 | |
Less—reduction in expenses due to undertaking—Note 3(a) | | | (1,974,457) | |
Less—reduction in fees due to earnings credits—Note 3(c) | | | (640) | |
Net Expenses | | | 15,030,234 | |
Investment Income—Net | | | 14,617,598 | |
Realized and Unrealized Gain (Loss) on Investments—Note 4 ($): | | |
Net realized gain (loss) on investments | | | 220,703,954 | |
Net unrealized appreciation (depreciation) on investments | | | (244,418,336) | |
Net Realized and Unrealized Gain (Loss) on Investments | | | (23,714,382) | |
Net (Decrease) in Net Assets Resulting from Operations | | (9,096,784) | |
See notes to financial statements.
14
STATEMENT OF CHANGES IN NET ASSETS
| | | | | | | | | | |
| | | | | | | | | | |
| | | | Year Ended August 31, |
| | | | 2015 | | | | 2014 | |
Operations ($): | | | | | | | | |
Investment income—net | | | 14,617,598 | | | | 14,576,961 | |
Net realized gain (loss) on investments | | 220,703,954 | | | | 162,427,563 | |
Net unrealized appreciation (depreciation)
on investments | | (244,418,336) | | | | 146,604,326 | |
Net Increase (Decrease) in Net Assets
Resulting from Operations | (9,096,784) | | | | 323,608,850 | |
Dividends to Shareholders from ($): | | | | | | | | |
Investment income—net: | | | | | | | | |
Class A | | | (7,856,213) | | | | (6,575,324) | |
Class C | | | (95,222) | | | | - | |
Class I | | | (4,941,242) | | | | (3,924,651) | |
Class Y | | | (2,606,561) | | | | (10) | |
Net realized gain on investments: | | | | | | | | |
Class A | | | (90,450,836) | | | | (51,839,906) | |
Class C | | | (5,883,979) | | | | (2,898,515) | |
Class I | | | (43,024,811) | | | | (22,359,910) | |
Class Y | | | (22,696,078) | | | | (56) | |
Total Dividends | | | (177,554,942) | | | | (87,598,372) | |
Capital Stock Transactions ($): | | | | | | | | |
Net proceeds from shares sold: | | | | | | | | |
Class A | | | 68,367,595 | | | | 93,294,127 | |
Class C | | | 4,823,635 | | | | 7,071,130 | |
Class I | | | 172,672,376 | | | | 373,408,183 | |
Class Y | | | 54,092,395 | | | | 230,386,990 | |
Dividends reinvested: | | | | | | | | |
Class A | | | 91,931,813 | | | | 55,175,244 | |
Class C | | | 4,641,705 | | | | 2,210,170 | |
Class I | | | 45,914,899 | | | | 17,180,086 | |
Class Y | | | 9,641,172 | | | | - | |
Cost of shares redeemed: | | | | | | | | |
Class A | | | (145,900,093) | | | | (398,158,894) | |
Class C | | | (8,906,929) | | | | (8,745,938) | |
Class I | | | (172,509,948) | | | | (382,029,658) | |
Class Y | | | (52,419,012) | | | | (6,888,189) | |
Increase (Decrease) in Net Assets
from Capital Stock Transactions | 72,349,608 | | | | (17,096,749) | |
Total Increase (Decrease) in Net Assets | (114,302,118) | | | | 218,913,729 | |
Net Assets ($): | | | | | | | | |
Beginning of Period | | | 1,653,040,247 | | | | 1,434,126,518 | |
End of Period | | | 1,538,738,129 | | | | 1,653,040,247 | |
Undistributed investment income—net | 11,126,296 | | | | 12,007,936 | |
15
STATEMENT OF CHANGES IN NET ASSETS (continued)
| | | | | | | | | | |
| | | | Year Ended August 31, |
| | | | 2015 | | | | 2014 | |
Capital Share Transactions: | | | | | | | | |
Class A | | | | | | | | |
Shares sold | | | 1,672,858 | | | | 2,319,848 | |
Shares issued for dividends reinvested | | | 2,357,831 | | | | 1,401,810 | |
Shares redeemed | | | (3,564,561) | | | | (9,912,476) | |
Net Increase (Decrease) in Shares Outstanding | 466,128 | | | | (6,190,818) | |
Class C | | | | | | | | |
Shares sold | | | 125,361 | | | | 184,889 | |
Shares issued for dividends reinvested | | | 125,350 | | | | 58,781 | |
Shares redeemed | | | (230,203) | | | | (225,679) | |
Net Increase (Decrease) in Shares Outstanding | 20,508 | | | | 17,991 | |
Class Ia | | | | | | | | |
Shares sold | | | 4,172,427 | | | | 9,328,702 | |
Shares issued for dividends reinvested | | | 1,177,003 | | | | 436,154 | |
Shares redeemed | | | (4,276,490) | | | | (9,243,274) | |
Net Increase (Decrease) in Shares Outstanding | 1,072,940 | | | | 521,582 | |
Class Ya | | | | | | | | |
Shares sold | | | 1,321,083 | | | | 5,467,286 | |
Shares issued for dividends reinvested | | | 247,146 | | | | - | |
Shares redeemed | | | (1,283,539) | | | | (161,310) | |
Net Increase (Decrease) in Shares Outstanding | 284,690 | | | | 5,305,976 | |
a During the period ended August 31, 2014, 3,024,991 Class I shares representing $127,810,865 were exchanged for 3,024,991 Class Y shares. | | |
See notes to financial statements.
16
FINANCIAL HIGHLIGHTS
The following tables describe the performance for each share class for the fiscal periods indicated. All information (except portfolio turnover rate) reflects financial results for a single fund share. Total return shows how much your investment in the fund would have increased (or decreased) during each period, assuming you had reinvested all dividends and distributions. These figures have been derived from the fund’s financial statements.
| | | | | | | |
| | | | | |
| | | Year Ended August 31, |
Class A Shares | | 2015 | 2014 | 2013 | 2012 | 2011 |
Per Share Data ($): | | | | | | |
Net asset value, beginning of period | 43.34 | 37.27 | 29.28 | 26.27 | 23.30 |
Investment Operations: | | | | | | |
Investment income—neta | .33 | .35 | .40 | .30 | .21 |
Net realized and unrealized gain (loss) on investments | (.66) | 8.03 | 7.97 | 2.91 | 2.95 |
Total from Investment Operations | (.33) | 8.38 | 8.37 | 3.21 | 3.16 |
Distributions: | | | | | | |
Dividends from investment income—net | (.36) | (.26) | (.38) | (.20) | (.19) |
Dividends from net realized gain on investments | (4.16) | (2.05) | - | - | - |
Total Distributions | (4.52) | (2.31) | (.38) | (.20) | (.19) |
Net asset value, end of period | 38.49 | 43.34 | 37.27 | 29.28 | 26.27 |
Total Return (%)b | (.90) | 23.09 | 28.82 | 12.31 | 13.52 |
Ratios/Supplemental Data (%): | | | | | | |
Ratio of total expenses to average net assets | 1.11 | 1.12 | 1.14 | 1.20 | 1.20 |
Ratio of net expenses to average net assets | .98 | .98 | .98 | .98 | .98 |
Ratio of net investment income to average net assets | .81 | .88 | 1.19 | 1.07 | .74 |
Portfolio Turnover Rate | 96.32 | 67.00 | 76.28 | 95.38 | 88.37 |
Net Assets, end of period ($ x 1,000) | 880,116 | 970,817 | 1,065,660 | 875,703 | 599,377 |
aBased on average shares outstanding.
bExclusive of sales charge.
See notes to financial statements.
17
FINANCIAL HIGHLIGHTS (continued)
| | | | | | | | |
| | | | | | |
| | | | Year Ended August 31, | | |
Class C Shares | | 2015 | 2014 | 2013 | 2012 | 2011 | |
Per Share Data ($): | | | | | | | |
Net asset value, beginning of period | 41.17 | 35.54 | 27.93 | 25.05 | 22.24 | |
Investment Operations: | | | | | | | |
Investment income (loss)—neta | .02 | .05 | .14 | .08 | (.00) | b |
Net realized and unrealized gain (loss) on investments | (.61) | 7.63 | 7.62 | 2.80 | 2.81 | |
Total from Investment Operations | (.59) | 7.68 | 7.76 | 2.88 | 2.81 | |
Distributions: | | | | | | | |
Dividends from investment income—net | (.07) | - | (.15) | - | (.00) | b |
Dividends from net realized gain on investments | (4.16) | (2.05) | - | - | - | |
Total Distributions | (4.23) | (2.05) | (.15) | - | (.00) | b |
Net asset value, end of period | 36.35 | 41.17 | 35.54 | 27.93 | 25.05 | |
Total Return (%)c | (1.65) | 22.17 | 27.87 | 11.50 | 12.64 | |
Ratios/Supplemental Data (%): | | | | | | | |
Ratio of total expenses to average net assets | 1.87 | 1.88 | 1.91 | 1.97 | 1.93 | |
Ratio of net expenses to average net assets | 1.73 | 1.73 | 1.73 | 1.73 | 1.73 | |
Ratio of net investment income (loss) to average net assets | .06 | .12 | .45 | .32 | (.01) | |
Portfolio Turnover Rate | 96.32 | 67.00 | 76.28 | 95.38 | 88.37 | |
Net Assets, end of period ($ x 1,000) | 53,226 | 59,442 | 50,665 | 47,824 | 50,792 | |
aBased on average shares outstanding.
bAmount represents less than $.01 per share.
cExclusive of sales charge.
See notes to financial statements.
18
| | | | | | | |
| | | | | |
| | | | Year Ended August 31, | |
Class I Shares | | 2015 | 2014 | 2013 | 2012 | 2011 |
Per Share Data ($): | | | | | | |
Net asset value, beginning of period | 43.45 | 37.36 | 29.34 | 26.30 | 23.31 |
Investment Operations: | | | | | | |
Investment income—neta | .43 | .47 | .48 | .37 | .28 |
Net realized and unrealized gain (loss) on investments | (.66) | 8.03 | 7.99 | 2.90 | 2.94 |
Total from Investment Operations | (.23) | 8.50 | 8.47 | 3.27 | 3.22 |
Distributions: | | | | | | |
Dividends from investment income—net | (.48) | (.36) | (.45) | (.23) | (.23) |
Dividends from net realized gain on investments | (4.16) | (2.05) | - | - | - |
Total Distributions | (4.64) | (2.41) | (.45) | (.23) | (.23) |
Net asset value, end of period | 38.58 | 43.45 | 37.36 | 29.34 | 26.30 |
Total Return (%) | (.66) | 23.40 | 29.18 | 12.57 | 13.83 |
Ratios/Supplemental Data (%): | | | | | | |
Ratio of total expenses to average net assets | .87 | .84 | .95 | .97 | 1.10 |
Ratio of net expenses to average net assets | .73 | .73 | .73 | .73 | .73 |
Ratio of net investment income to average net assets | 1.05 | 1.14 | 1.45 | 1.33 | .98 |
Portfolio Turnover Rate | 96.32 | 67.00 | 76.28 | 95.38 | 88.37 |
Net Assets, end of period ($ x 1,000) | 389,711 | 392,260 | 317,800 | 179,900 | 123,565 |
aBased on average shares outstanding.
See notes to financial statements.
19
FINANCIAL HIGHLIGHTS (continued)
| | | | | |
| | | |
| | Year Ended August 31, |
Class Y Shares | 2015 | 2014 | 2013 | a |
Per Share Data ($): | | | | |
Net asset value, beginning of period | 43.45 | 37.36 | 36.70 | |
Investment Operations: | | | | |
Investment income—netb | .44 | .32 | .08 | |
Net realized and unrealized gain (loss) on investments | (.67) | 8.18 | .58 | |
Total from Investment Operations | (.23) | 8.50 | .66 | |
Distributions: | | | | |
Dividends from investment income—net | (.48) | (.36) | - | |
Dividends from net realized gain on investments | (4.16) | (2.05) | - | |
Total Distributions | (4.64) | (2.41) | - | |
Net asset value, end of period | 38.58 | 43.45 | 37.36 | |
Total Return (%) | (.66) | 23.40 | 1.80 | c |
Ratios/Supplemental Data (%): | | | | |
Ratio of total expenses to average net assets | .79 | .78 | .83 | d |
Ratio of net expenses to average net assets | .73 | .73 | .73 | d |
Ratio of net investment income to average net assets | 1.07 | .87 | 1.21 | d |
Portfolio Turnover Rate | 96.32 | 67.00 | 76.28 | |
Net Assets, end of period ($ x 1,000) | 215,685 | 230,522 | 1 | |
a From July 1, 2013 (commencement of initial offering) to August 31, 2013.
b Based on average shares outstanding.
c Not annualized.
d Annualized.
See notes to financial statements.20
NOTES TO FINANCIAL STATEMENTS
NOTE 1—Significant Accounting Policies:
Dreyfus Strategic Value Fund (the “fund”) is a separate diversified series of Advantage Funds, Inc. (the “Company”), which is registered under the Investment Company Act of 1940, as amended (the “Act”), as an open-end management investment company and operates as a series company currently offering eleven series, including the fund. The fund’s investment objective is to seek capital appreciation. The Dreyfus Corporation (the “Manager” or “Dreyfus”), a wholly-owned subsidiary of The Bank of New York Mellon Corporation (“BNY Mellon”), serves as the fund’s investment adviser.
MBSC Securities Corporation (the “Distributor”), a wholly-owned subsidiary of Dreyfus, is the distributor of the fund’s shares. The fund is authorized to issue 700 million shares of $.001 par value Common Stock. The fund currently offers four classes of shares: Class A (300 million shares authorized), Class C (100 million shares authorized), Class I (200 million shares authorized) and Class Y (100 million shares authorized). Class A shares generally are subject to a sales charge imposed at the time of purchase. Class C shares are subject to a contingent deferred sales charge (“CDSC”) imposed on Class C shares redeemed within one year of purchase. Class I and Class Y shares are sold at net asset value per share generally to institutional investors. Other differences between the classes include the services offered to and the expenses borne by each class, the allocation of certain transfer agency costs, and certain voting rights. Income, expenses (other than expenses attributable to a specific class), and realized and unrealized gains or losses on investments are allocated to each class of shares based on its relative net assets.
The Company accounts separately for the assets, liabilities and operations of each series. Expenses directly attributable to each series are charged to that series’ operations; expenses which are applicable to all series are allocated among them on a pro rata basis.
The Financial Accounting Standards Board (“FASB”) Accounting Standards Codification (“ASC”) is the exclusive reference of authoritative U.S. generally accepted accounting principles (“GAAP”) recognized by the FASB to be applied by nongovernmental entities. Rules and interpretive releases of the Securities and Exchange Commission (“SEC”) under authority of federal laws are also sources of authoritative GAAP for SEC registrants. The fund’s financial statements are prepared in accordance with GAAP, which may require the use of management estimates and assumptions. Actual results could differ from those estimates.
21
NOTES TO FINANCIAL STATEMENTS (continued)
The Company enters into contracts that contain a variety of indemnifications. The fund’s maximum exposure under these arrangements is unknown. The fund does not anticipate recognizing any loss related to these arrangements.
(a) Portfolio valuation: The fair value of a financial instrument is the amount that would be received to sell an asset or paid to transfer a liability in an orderly transaction between market participants at the measurement date (i.e., the exit price). GAAP establishes a fair value hierarchy that prioritizes the inputs of valuation techniques used to measure fair value. This hierarchy gives the highest priority to unadjusted quoted prices in active markets for identical assets or liabilities (Level 1 measurements) and the lowest priority to unobservable inputs (Level 3 measurements).
Additionally, GAAP provides guidance on determining whether the volume and activity in a market has decreased significantly and whether such a decrease in activity results in transactions that are not orderly. GAAP requires enhanced disclosures around valuation inputs and techniques used during annual and interim periods.
Various inputs are used in determining the value of the fund’s investments relating to fair value measurements. These inputs are summarized in the three broad levels listed below:
Level 1—unadjusted quoted prices in active markets for identical investments.
Level 2—other significant observable inputs (including quoted prices for similar investments, interest rates, prepayment speeds, credit risk, etc.).
Level 3—significant unobservable inputs (including the fund’s own assumptions in determining the fair value of investments).
The inputs or methodology used for valuing securities are not necessarily an indication of the risk associated with investing in those securities.
Changes in valuation techniques may result in transfers in or out of an assigned level within the disclosure hierarchy. Valuation techniques used to value the fund’s investments are as follows:
Investments in securities are valued at the last sales price on the securities exchange or national securities market on which such securities are primarily traded. Securities listed on the National Market System for which market quotations are available are valued at the official closing price or, if there is no official closing price that day, at the last sales price. For open short positions, asked prices are used for valuation purposes. Bid price is
22
used when no asked price is available. Registered investment companies that are not traded on an exchange are valued at their net asset value. All of the preceding securities are generally categorized within Level 1 of the fair value hierarchy.
Securities not listed on an exchange or the national securities market, or securities for which there were no transactions, are valued at the average of the most recent bid and asked prices. These securities are generally categorized within Level 2 of the fair value hierarchy.
Fair valuing of securities may be determined with the assistance of a pricing service using calculations based on indices of domestic securities and other appropriate indicators, such as prices of relevant American Depository Receipts and financial futures. Utilizing these techniques may result in transfers between Level 1 and Level 2 of the fair value hierarchy.
When market quotations or official closing prices are not readily available, or are determined not to reflect accurately fair value, such as when the value of a security has been significantly affected by events after the close of the exchange or market on which the security is principally traded (for example, a foreign exchange or market), but before the fund calculates its net asset value, the fund may value these investments at fair value as determined in accordance with the procedures approved by the Company’s Board of Directors (the “Board”). Certain factors may be considered when fair valuing investments such as: fundamental analytical data, the nature and duration of restrictions on disposition, an evaluation of the forces that influence the market in which the securities are purchased and sold, and public trading in similar securities of the issuer or comparable issuers. These securities are either categorized within Level 2 or 3 of the fair value hierarchy depending on the relevant inputs used.
For restricted securities where observable inputs are limited, assumptions about market activity and risk are used and are generally categorized within Level 3 of the fair value hierarchy.
The following is a summary of the inputs used as of August 31, 2015 in valuing the fund’s investments:
23
NOTES TO FINANCIAL STATEMENTS (continued)
| | | | | |
| | Level 1 - Unadjusted Quoted Prices | Level 2 - Other Significant Observable Inputs | Level 3 -Significant Unobservable Inputs | Total |
Assets ($) | | | | |
Investments in Securities: | | | |
Equity Securities - Domestic Common Stocks† | 1,527,714,915 | - | - | 1,527,714,915 |
Exchange-Traded Funds | 8,430,117 | - | - | 8,430,117 |
Mutual Funds | 2,203,251 | - | - | 2,203,251 |
† See Statement of Investments for additional detailed categorizations.
At August 31, 2015, there were no transfers between Level 1 and Level 2 of the fair value hierarchy.
(b) Securities transactions and investment income: Securities transactions are recorded on a trade date basis. Realized gains and losses from securities transactions are recorded on the identified cost basis. Dividend income is recognized on the ex-dividend date and interest income, including, where applicable, accretion of discount and amortization of premium on investments, is recognized on the accrual basis.
Pursuant to a securities lending agreement with The Bank of New York Mellon, a subsidiary of BNY Mellon and an affiliate of Dreyfus, the fund may lend securities to qualified institutions. It is the fund’s policy that, at origination, all loans are secured by collateral of at least 102% of the value of U.S. securities loaned and 105% of the value of foreign securities loaned. Collateral equivalent to at least 100% of the market value of securities on loan is maintained at all times. Collateral is either in the form of cash, which can be invested in certain money market mutual funds managed by Dreyfus, or U.S. Government and Agency securities. The fund is entitled to receive all dividends, interest and distributions on securities loaned, in addition to income earned as a result of the lending transaction. Should a borrower fail to return the securities in a timely manner, The Bank of New York Mellon is required to replace the securities for the benefit of the fund or credit the fund with the market value of the unreturned securities and is subrogated to the fund’s rights against the borrower and the collateral. During the period ended August 31, 2015, The Bank of New York Mellon earned $797 from lending portfolio securities, pursuant to the securities lending agreement.
(c) Affiliated issuers: Investments in other investment companies advised by Dreyfus are defined as “affiliated” under the Act. Investments in
24
affiliated investment companies during the period ended August 31, 2015 were as follows:
| | | | | | |
Affiliated Investment Company | Value 8/31/2014 ($) | Purchases ($) | Sales ($) | Value 8/31/2015 ($) | Net Assets (%) |
Dreyfus Institutional Preferred Plus Money Market Fund | 3,665,526 | 301,525,647 | 302,987,922 | 2,203,251 | .2 |
Dreyfus Institutional Cash Advantage Fund | - | 12,298,918 | 12,298,918 | - | - |
Total | 3,665,526 | 313,824,565 | 315,286,840 | 2,203,251 | .2 |
(d) Dividends to shareholders: Dividends are recorded on the ex-dividend date. Dividends from investment income-net and dividends from net realized capital gains, if any, are normally declared and paid annually, but the fund may make distributions on a more frequent basis to comply with the distribution requirements of the Internal Revenue Code of 1986, as amended (the “Code”). To the extent that net realized capital gains can be offset by capital loss carryovers, it is the policy of the fund not to distribute such gains. Income and capital gain distributions are determined in accordance with income tax regulations, which may differ from GAAP.
(e) Federal income taxes: It is the policy of the fund to continue to qualify as a regulated investment company, if such qualification is in the best interests of its shareholders, by complying with the applicable provisions of the Code, and to make distributions of taxable income sufficient to relieve it from substantially all federal income and excise taxes.
As of and during the period ended August 31, 2015, the fund did not have any liabilities for any uncertain tax positions. The fund recognizes interest and penalties, if any, related to uncertain tax positions as income tax expense in the Statement of Operations. During the period ended August 31, 2015, the fund did not incur any interest or penalties.
Each tax year in the four-year period ended August 31, 2015 remains subject to examination by the Internal Revenue Service and state taxing authorities.
At August 31, 2015, the components of accumulated earnings on a tax basis were as follows: undistributed ordinary income $19,998,749,
25
NOTES TO FINANCIAL STATEMENTS (continued)
undistributed capital gains $170,077,198, accumulated capital losses $5,864,026 and unrealized appreciation $136,002,909.
Under the Regulated Investment Company Modernization Act of 2010 (the “2010 Act”), the fund is permitted to carry forward capital losses incurred in taxable years beginning after December 22, 2010 (“post-enactment losses”) for an unlimited period. Furthermore, post-enactment capital loss carryovers retain their character as either short-term or long-term capital losses rather than short-term as they were under previous statute. The 2010 Act requires post-enactment losses to be utilized before the utilization of losses incurred in taxable years prior to the effective date of the 2010 Act (“pre-enactment losses”). As a result of this ordering rule, pre-enactment losses may be more likely to expire unused.
As a result of the fund’s merger with Dreyfus Core Value Fund, capital losses of $1,368,369 are available to offset future gains, if any. Based on certain provisions in the Code, the amount of losses which can be utilized in subsequent years is subject to an annual limitation. This acquired capital loss will expire in fiscal year 2017. As a result of the fund’s merger with Dreyfus Large Cap Value Fund, capital losses of $4,495,657 are available to offset future gains, if any. Based on certain provisions in the Code, the amount of losses which can be utilized in subsequent years is subject to an annual limitation. Of this acquired capital loss, $3,336,050 will expire in fiscal year 2017 and $1,159,607 will expire in fiscal year 2018.
The tax character of distributions paid to shareholders during the fiscal periods ended August 31, 2015 and August 31, 2014 were as follows: ordinary income $46,163,797 and $30,943,738, and long-term capital gains $131,391,145 and $56,654,634, respectively.
NOTE 2—Bank Lines of Credit:
The fund participates with other Dreyfus-managed funds in a $430 million unsecured credit facility led by Citibank, N.A. and a $300 million unsecured credit facility provided by The Bank of New York Mellon (each, a “Facility”), each to be utilized primarily for temporary or emergency purposes, including the financing of redemptions. Prior to October 8, 2014, the unsecured credit facility with Citibank, N.A. was $265 million. In connection therewith, the fund has agreed to pay its pro rata portion of commitment fees for each Facility. Interest is charged to the fund based on rates determined pursuant to the terms of the respective Facility at the time of borrowing.
The average amount of borrowings outstanding under the Facilities during the period ended August 31, 2015, was approximately $543,600 with a related weighted average annualized interest rate of 1.11%.
26
NOTE 3—Management Fee and Other Transactions with Affiliates:
(a) Pursuant to a management agreement with Dreyfus, the management fee is computed at the annual rate of .75% of the value of the fund’s average daily net assets and is payable monthly. Dreyfus has contractually agreed, from September 1, 2014 through January 1, 2016 for Class A, Class C, Class I and Class Y shares, to waive receipt of its fees and/or assume the direct expenses of the fund, so that the expenses of Class A, Class C, Class I and Class Y shares (excluding taxes, interest expense, brokerage commissions, commitment fees on borrowings and extraordinary expenses) do not exceed .98%, 1.73%, .73% and .73% of the value of the respective class’ average daily net assets. The reduction in expenses, pursuant to the undertaking, amounted to $1,974,457 during the period ended August 31, 2015.
During the period ended August 31, 2015, the Distributor retained $25,143 from commissions earned on sales of the fund's Class A shares and $2,249 from CDSCs on redemptions of the fund's Class C shares.
(b) Under the Distribution Plan adopted pursuant to Rule 12b-1 under the Act, Class C shares pay the Distributor for distributing its shares at an annual rate of .75% of the value of its average daily net assets. During the period ended August 31, 2015, Class C shares were charged $433,657 pursuant to the Distribution Plan.
(c) Under the Shareholder Services Plan, Class A and Class C shares pay the Distributor at an annual rate of .25% of the value of their average daily net assets for the provision of certain services. The services provided may include personal services relating to shareholder accounts, such as answering shareholder inquiries regarding the fund and providing reports and other information, and services related to the maintenance of shareholder accounts. The Distributor may make payments to Service Agents (securities dealers, financial institutions or other industry professionals) with respect to these services. The Distributor determines the amounts to be paid to Service Agents. During the period ended August 31, 2015, Class A and Class C shares were charged $2,357,205 and $144,552, respectively, pursuant to the Shareholder Services Plan.
The fund has arrangements with the transfer agent and the custodian whereby the fund may receive earnings credits when positive cash balances are maintained, which are used to offset transfer agency and custody fees. For financial reporting purposes, the fund includes net earnings credits as an expense offset in the Statement of Operations.
27
NOTES TO FINANCIAL STATEMENTS (continued)
The fund compensates Dreyfus Transfer, Inc., a wholly-owned subsidiary of Dreyfus, under a transfer agency agreement for providing transfer agency and cash management services for the fund. The majority of transfer agency fees are comprised of amounts paid on a per account basis, while cash management fees are related to fund subscriptions and redemptions. During the period ended August 31, 2015, the fund was charged $264,334 for transfer agency services and $15,943 for cash management services. These fees are included in Shareholder servicing costs in the Statement of Operations. Cash management fees were partially offset by earnings credits of $640.
The fund compensates The Bank of New York Mellon under a custody agreement for providing custodial services for the fund. These fees are determined based on net assets, geographic region and transaction activity. During the period ended August 31, 2015, the fund was charged $100,476 pursuant to the custody agreement.
During the period ended August 31, 2015, the fund was charged $10,965 for services performed by the Chief Compliance Officer and his staff.
The components of “Due to The Dreyfus Corporation and affiliates” in the Statement of Assets and Liabilities consist of: management fees $1,015,099, Distribution Plan fees $35,198, Shareholder Services Plan fees $205,387, custodian fees $49,778, Chief Compliance Officer fees $1,737 and transfer agency fees $44,861, which are offset against an expense reimbursement currently in effect in the amount of $157,870.
(d) Each Board member also serves as a Board member of other funds within the Dreyfus complex. Annual retainer fees and attendance fees are allocated to each fund based on net assets.
NOTE 4—Securities Transactions:
The aggregate amount of purchases and sales of investment securities, excluding short-term securities, during the period ended August 31, 2015, amounted to $1,584,428,862 and $1,673,092,544, respectively.
At August 31, 2015, the cost of investments for federal income tax purposes was $1,402,345,374; accordingly, accumulated net unrealized appreciation on investments was $136,002,909, consisting of $209,551,343 gross unrealized appreciation and $73,548,434 gross unrealized depreciation.
28
REPORT OF INDEPENDENT REGISTERED
PUBLIC ACCOUNTING FIRM
Shareholders and Board of Directors
Dreyfus Strategic Value Fund
We have audited the accompanying statement of assets and liabilities, including the statement of investments, of Dreyfus Strategic Value Fund (one of the series comprising Advantage Funds, Inc.) as of August 31, 2015, and the related statement of operations for the year then ended, the statement of changes in net assets for each of the two years in the period then ended, and the financial highlights for each of the periods indicated therein. These financial statements and financial highlights are the responsibility of the Fund’s management. Our responsibility is to express an opinion on these financial statements and financial highlights based on our audits.
We conducted our audits in accordance with the standards of the Public Company Accounting Oversight Board (United States). Those standards require that we plan and perform the audit to obtain reasonable assurance about whether the financial statements and financial highlights are free of material misstatement. We were not engaged to perform an audit of the Fund’s internal control over financial reporting. Our audits included consideration of internal control over financial reporting as a basis for designing audit procedures that are appropriate in the circumstances, but not for the purpose of expressing an opinion on the effectiveness of the Fund’s internal control over financial reporting. Accordingly, we express no such opinion. An audit also includes examining, on a test basis, evidence supporting the amounts and disclosures in the financial statements and financial highlights, assessing the accounting principles used and significant estimates made by management, and evaluating the overall financial statement presentation. Our procedures included confirmation of securities owned as of August 31, 2015 by correspondence with the custodian and others. We believe that our audits provide a reasonable basis for our opinion.
In our opinion, the financial statements and financial highlights referred to above present fairly, in all material respects, the financial position of Dreyfus Strategic Value Fund at August 31, 2015, the results of its operations for the year then ended, the changes in its net assets for each of the two years in the period then ended, and the financial highlights for each of the indicated periods, in conformity with U.S. generally accepted accounting principles.

New York, New York
October 28, 2015
29
IMPORTANT TAX INFORMATION (Unaudited)
For federal tax purposes, the fund hereby reports 64.43% of the ordinary dividends paid during the fiscal year ended August 31, 2015 as qualifying for the corporate dividends received deduction. Also, certain dividends paid by the fund may be subject to a maximum tax rate of 15%, as provided for by the Jobs and Growth Tax Relief Reconciliation Act of 2003. Of the distributions paid during the fiscal year, $28,049,659 represents the maximum amount that may be considered qualified dividend income. The fund also hereby reports $.7869 per share as a short-term capital gain distribution and $3.3717 per share as a long-term capital gain distribution paid on December 10, 2014. Shareholders will receive notification in early 2016 of the percentage applicable to the preparation of their 2015 income tax returns.
30
INFORMATION ABOUT THE RENEWAL OF THE FUND'S MANAGEMENT AGREEMENT (Unaudited)
At a meeting of the fund’s Board of Directors held on March 11-12, 2015, the Board considered the renewal of the fund’s Management Agreement pursuant to which Dreyfus provides the fund with investment advisory and administrative services (the “Agreement”). The Board members, none of whom are “interested persons” (as defined in the Investment Company Act of 1940, as amended) of the fund, were assisted in their review by independent legal counsel and met with counsel in executive session separate from Dreyfus representatives. In considering the renewal of the Agreement, the Board considered all factors that it believed to be relevant, including those discussed below. The Board did not identify any one factor as dispositive, and each Board member may have attributed different weights to the factors considered.
Analysis of Nature, Extent, and Quality of Services Provided to the Fund. The Board considered information provided to them at the meeting and in previous presentations from Dreyfus representatives regarding the nature, extent, and quality of the services provided to funds in the Dreyfus fund complex. Dreyfus provided the number of open accounts in the fund, the fund’s asset size and the allocation of fund assets among distribution channels. Dreyfus also had previously provided information regarding the diverse intermediary relationships and distribution channels of funds in the Dreyfus fund complex (such as retail direct or intermediary, in which intermediaries typically are paid by the fund and/or Dreyfus) and Dreyfus’ corresponding need for broad, deep, and diverse resources to be able to provide ongoing shareholder services to each intermediary or distribution channel, as applicable to the fund.
The Board also considered research support available to, and portfolio management capabilities of, the fund’s portfolio management personnel and that Dreyfus also provides oversight of day-to-day fund operations, including fund accounting and administration and assistance in meeting legal and regulatory requirements. The Board also considered Dreyfus’ extensive administrative, accounting and compliance infrastructures. The Board also considered portfolio management’s brokerage policies and practices (including policies and practices regarding soft dollars) and the standards applied in seeking best execution.
Comparative Analysis of the Fund’s Performance and Management Fee and Expense Ratio. The Board reviewed reports prepared by Lipper, Inc. (“Lipper”), an independent provider of investment company data, which included information comparing (1) the fund’s performance with the performance of a group of comparable funds (the “Performance Group”) and with a broader group of funds (the “Performance Universe”), all for various periods ended December 31, 2014, and (2) the fund’s actual and contractual management fees and total expenses with those of a group of comparable funds (the “Expense Group”) and with a broader group of funds (the “Expense Universe”), the information for which was derived in part from fund financial statements available to Lipper as of the date of its analysis. Dreyfus previously had furnished the Board with a description of the methodology Lipper used to select the
31
INFORMATION ABOUT THE RENEWAL OF THE FUND'S MANAGEMENT AGREEMENT (Unaudited) (continued)
Performance Group and Performance Universe and the Expense Group and Expense Universe.
Dreyfus representatives stated that the usefulness of performance comparisons may be affected by a number of factors, including different investment limitations that may be applicable to the fund and comparison funds. They also noted that performance generally should be considered over longer periods of time, although it is possible that long-term performance can be adversely affected by even one period of significant underperformance so that a single investment decision or theme has the ability to affect disproportionately long-term performance. The Board discussed the results of the comparisons and noted that the fund’s total return performance was above the Performance Group and Performance Universe medians for all periods, except for the one-year period. Dreyfus also provided a comparison of the fund’s calendar year total returns to the returns of the fund’s benchmark index.
The Board also reviewed the range of actual and contractual management fees and total expenses of the Expense Group and Expense Universe funds and discussed the results of the comparisons. The Board noted that the fund’s contractual management fee was above the Expense Group median and the fund’s actual management fee and total expenses were below the Expense Group and Expense Universe medians.
Dreyfus representatives noted that Dreyfus has contractually agreed to waive receipt of its fees and/or assume the expenses of the fund, until January 1, 2016, so that annual direct fund operating expenses (excluding Rule 12b-1 fees, shareholder services fees, taxes, interest, brokerage commissions, commitment fees on borrowings, acquired fund fees and extraordinary expenses) do not exceed 0.73% of the fund’s average daily net assets.
Dreyfus representatives reviewed with the Board the management or investment advisory fees (1) paid by funds advised or administered by Dreyfus that are in the same Lipper category as the fund and (2) paid to Dreyfus or the Dreyfus-affiliated primary employer of the fund’s primary portfolio manager(s) for advising any separate accounts and/or other types of client portfolios that are considered to have similar investment strategies and policies as the fund (the “Similar Clients”), and explained the nature of the Similar Clients. They discussed differences in fees paid and the relationship of the fees paid in light of any differences in the services provided and other relevant factors. The Board considered the relevance of the fee information provided for the Similar Clients to evaluate the appropriateness and reasonableness of the fund’s management fee.
Analysis of Profitability and Economies of Scale. Dreyfus representatives reviewed the expenses allocated and profit received by Dreyfus and its affiliates and the resulting profitability percentage for managing the fund and the aggregate profitability percentage to Dreyfus and its affiliates for managing the funds in the Dreyfus fund complex, and the method used to determine the expenses and profit. The Board concluded that the profitability results were not unreasonable, given the services rendered and service levels
32
provided by Dreyfus. The Board also noted the expense limitation arrangement and its effect on the profitability of Dreyfus and its affiliates. The Board also had been provided with information prepared by an independent consulting firm regarding Dreyfus’ approach to allocating costs to, and determining the profitability of, individual funds and the entire Dreyfus fund complex. The consulting firm also had analyzed where any economies of scale might emerge in connection with the management of a fund.
The Board considered, on the advice of its counsel, the profitability analysis (1) as part of its evaluation of whether the fees under the Agreement bear a reasonable relationship to the mix of services provided by Dreyfus, including the nature, extent and quality of such services, and (2) in light of the relevant circumstances for the fund and the extent to which economies of scale would be realized if the fund grows and whether fee levels reflect these economies of scale for the benefit of fund shareholders. Dreyfus representatives also noted that, as a result of shared and allocated costs among funds in the Dreyfus fund complex, the extent of economies of scale could depend substantially on the level of assets in the complex as a whole, so that increases and decreases in complex-wide assets can affect potential economies of scale in a manner that is disproportionate to, or even in the opposite direction from, changes in the fund’s asset level. The Board also considered potential benefits to Dreyfus from acting as investment adviser and noted the soft dollar arrangements in effect for trading the fund’s investments.
At the conclusion of these discussions, the Board agreed that it had been furnished with sufficient information to make an informed business decision with respect to the renewal of the Agreement. Based on the discussions and considerations as described above, the Board concluded and determined as follows:
· The Board concluded that the nature, extent and quality of the services provided by Dreyfus are adequate and appropriate.
· The Board was satisfied with the fund’s performance.
· The Board concluded that the fee paid to Dreyfus was reasonable in light of the considerations described above.
· The Board determined that the economies of scale which may accrue to Dreyfus and its affiliates in connection with the management of the fund had been adequately considered by Dreyfus in connection with the fee rate charged to the fund pursuant to the Agreement and that, to the extent in the future it were determined that material economies of scale had not been shared with the fund, the Board would seek to have those economies of scale shared with the fund.
In evaluating the Agreement, the Board considered these conclusions and determinations and also relied on its previous knowledge, gained through meetings and other interactions with Dreyfus and its affiliates, of the fund and the services provided
33
INFORMATION ABOUT THE RENEWAL OF THE FUND'S MANAGEMENT AGREEMENT (Unaudited) (continued)
to the fund by Dreyfus. The Board also relied on information received on a routine and regular basis throughout the year relating to the operations of the fund and the investment management and other services provided under the Agreement, including information on the investment performance of the fund in comparison to similar mutual funds and benchmark performance indices; general market outlook as applicable to the fund; and compliance reports. In addition, the Board’s consideration of the contractual fee arrangements for this fund had the benefit of a number of years of reviews of prior or similar agreements during which lengthy discussions took place between the Board and Dreyfus representatives. Certain aspects of the arrangements may receive greater scrutiny in some years than in others, and the Board’s conclusions may be based, in part, on their consideration of the same or similar arrangements in prior years. The Board determined to renew the Agreement.
34
BOARD MEMBERS INFORMATION (Unaudited)
INDEPENDENT BOARD MEMBERS
Joseph S. DiMartino (71)
Chairman of the Board (1995)
Principal Occupation During Past 5 Years:
· Corporate Director and Trustee (1995-present)
Other Public Company Board Memberships During Past 5 Years:
· CBIZ (formerly, Century Business Services, Inc.), a provider of outsourcing functions for small and medium size companies, Director (1997-present)
· The Newark Group, a provider of a national market of paper recovery facilities, paperboard mills and paperboard converting plants, Director (2000-2010)
No. of Portfolios for which Board Member Serves: 144
———————
Peggy C. Davis (72)
Board Member (2006)
Principal Occupation During Past 5 Years:
· Shad Professor of Law, New York University School of Law (1983-present)
No. of Portfolios for which Board Member Serves: 51
———————
David P. Feldman (75)
Board Member (1996)
Principal Occupation During Past 5 Years:
· Corporate Director and Trustee (1985-present)
Other Public Company Board Memberships During Past 5 Years:
· BBH Mutual Funds Group (5 registered mutual funds), Director (1992-2014)
No. of Portfolios for which Board Member Serves: 37
———————
Ehud Houminer (75)
Board Member (1993)
Principal Occupation During Past 5 Years:
· Executive-in-Residence at the Columbia Business School, Columbia University (1992-present)
Other Public Company Board Memberships During Past 5 Years:
· Avnet, Inc., an electronics distributor, Director (1993-2012)
No. of Portfolios for which Board Member Serves: 62
———————
35
BOARD MEMBERS INFORMATION (Unaudited) (continued)
INDEPENDENT BOARD MEMBERS (continued)
Lynn Martin (75)
Board Member (2012)
Principal Occupation During Past 5 Years:
· President of The Martin Hall Group LLC, a human resources consulting firm (2005-2012)
Other Public Company Board Memberships During Past 5 Years:
· AT&T, Inc., a telecommunications company, Director (1999-2012)
· Ryder System, Inc., a supply chain and transportation management company, Director (1993-2012)
No. of Portfolios for which Board Member Serves: 37
———————
Robin A. Melvin (51)
Board Member (2012)
Principal Occupation During Past 5 Years:
· Co-chairman, Illinois Mentoring Partnership, non-profit organization dedicated to increasing the quantity and quality of mentoring services in Illinois; (2014-present; a board member since 2013)
· Director, Boisi Family Foundation, a private family foundation that supports youth-serving organizations that promote the self sufficiency of youth from disadvantaged circumstances (1995-2012)
No. of Portfolios for which Board Member Serves: 114
———————
Dr. Martin Peretz (76)
Board Member (2006)
Principal Occupation During Past 5 Years:
· Editor-in-Chief Emeritus of The New Republic Magazine (2011-2012) (previously, Editor-in-Chief, 1974-2011)
· Director of TheStreet.com, a financial information service on the web (1996-2010)
· Lecturer at Harvard University (1969-2012)
No. of Portfolios for which Board Member Serves: 37
———————
Once elected all Board Members serve for an indefinite term, but achieve Emeritus status upon reaching age 80. The address of the Board Members and Officers is c/o The Dreyfus Corporation, 200 Park Avenue, New York, New York 10166. Additional information about the Board Members is available in the fund's Statement of Additional Information which can be obtained from Dreyfus free of charge by calling this toll free number: 1-800-DREYFUS.
James F. Henry, Emeritus Board Member
Dr. Paul A. Marks, Emeritus Board Member
Philip L. Toia, Emeritus Board Member
36
OFFICERS OF THE FUND (Unaudited)
BRADLEY J. SKAPYAK, President since January 2010.
Chief Operating Officer and a director of the Manager since June 2009, Chairman of Dreyfus Transfer, Inc., an affiliate of the Manager and the transfer agent of the funds, since May 2011 and Executive Vice President of the Distributor since June 2007. From April 2003 to June 2009, Mr. Skapyak was the head of the Investment Accounting and Support Department of the Manager. He is an officer of 69 investment companies (comprised of 144 portfolios) managed by the Manager. He is 56 years old and has been an employee of the Manager since February 1988.
BENNETT A. MACDOUGALL, Chief Legal Officer since October 2015.
Chief Legal Officer of the Manager since June 2015; from June 2005 to June 2015, Director and Associate General Counsel of Deutsche Bank – Asset & Wealth Management Division, and Chief Legal Officer of Deutsche Investment Management Americas Inc. He is an officer of 70 investment companies (comprised of 169 portfolios) managed by the Manager. He is 44 years old and has been an employee of the Manager since June 2015.
JANETTE E. FARRAGHER, Vice President and Secretary since December 2011.
Assistant General Counsel of BNY Mellon, and an officer of 70 investment companies (comprised of 169 portfolios) managed by the Manager. She is 52 years old and has been an employee of the Manager since February 1984.
JAMES BITETTO, Vice President and Assistant Secretary since August 2005.
Managing Counsel of BNY Mellon and Secretary of the Manager, and an officer of 70 investment companies (comprised of 169 portfolios) managed by the Manager. He is 49 years old and has been an employee of the Manager since December 1996.
JONI LACKS CHARATAN, Vice President and Assistant Secretary since August 2005.
Managing Counsel of BNY Mellon, and an officer of 70 investment companies (comprised of 169 portfolios) managed by the Manager. She is 59 years old and has been an employee of the Manager since October 1988.
JOSEPH M. CHIOFFI, Vice President and Assistant Secretary since August 2005.
Managing Counsel of BNY Mellon, and an officer of 70 investment companies (comprised of 169 portfolios) managed by the Manager. He is 53 years old and has been an employee of the Manager since June 2000.
JOHN B. HAMMALIAN, Vice President and Assistant Secretary since August 2005.
Senior Managing Counsel of BNY Mellon, and an officer of 70 investment companies (comprised of 169 portfolios) managed by the Manager. He is 52 years old and has been an employee of the Manager since February 1991.
MAUREEN E. KANE, Vice President and Assistant Secretary since April 2015.
Managing Counsel of BNY Mellon since July 2014; from October 2004 until July 2014, General Counsel, and from May 2009 until July 2014, Chief Compliance Officer of Century Capital Management. She is an officer of 70 investment companies (comprised of 169 portfolios) managed by the Manager. She is 53 years old and has been an employee of the Manager since July 2014.
SARAH S. KELLEHER, Vice President and Assistant Secretary since April 2014.
Senior Counsel of BNY Mellon, and an officer of 70 investment companies (comprised of 169 portfolios) managed by the Manager; from August 2005 to March 2013, Associate General Counsel of Third Avenue Management. She is 39 years old and has been an employee of the Manager since March 2013.
JEFF PRUSNOFSKY, Vice President and Assistant Secretary since August 2005.
Senior Managing Counsel of BNY Mellon, and an officer of 70 investment companies (comprised of 169 portfolios) managed by the Manager. He is 50 years old and has been an employee of the Manager since October 1990.
JAMES WINDELS, Treasurer since November 2001.
Director – Mutual Fund Accounting of the Manager, and an officer of 70 investment companies (comprised of 169 portfolios) managed by the Manager. He is 56 years old and has been an employee of the Manager since April 1985.
37
OFFICERS OF THE FUND (Unaudited) (continued)
RICHARD CASSARO, Assistant Treasurer since January 2008.
Senior Accounting Manager – Money Market and Municipal Bond Funds of the Manager, and an officer of 70 investment companies (comprised of 169 portfolios) managed by the Manager. He is 56 years old and has been an employee of the Manager since September 1982.
GAVIN C. REILLY, Assistant Treasurer since December 2005.
Tax Manager of the Investment Accounting and Support Department of the Manager, and an officer of 70 investment companies (comprised of 169 portfolios) managed by the Manager. He is 47 years old and has been an employee of the Manager since April 1991.
ROBERT S. ROBOL, Assistant Treasurer since August 2005.
Senior Accounting Manager – Fixed Income Funds of the Manager, and an officer of 70 investment companies (comprised of 169 portfolios) managed by the Manager. He is 51 years old and has been an employee of the Manager since October 1988.
ROBERT SALVIOLO, Assistant Treasurer since July 2007.
Senior Accounting Manager – Equity Funds of the Manager, and an officer of 70 investment companies (comprised of 169 portfolios) managed by the Manager. He is 48 years old and has been an employee of the Manager since June 1989.
ROBERT SVAGNA, Assistant Treasurer since August 2005.
Senior Accounting Manager – Equity Funds of the Manager, and an officer of 70 investment companies (comprised of 169 portfolios) managed by the Manager. He is 48 years old and has been an employee of the Manager since November 1990.
JOSEPH W. CONNOLLY, Chief Compliance Officer since October 2004.
Chief Compliance Officer of the Manager and The Dreyfus Family of Funds (70 investment companies, comprised of 169 portfolios). He is 58 years old and has served in various capacities with the Manager since 1980, including manager of the firm’s Fund Accounting Department from 1997 through October 2001.
38
NOTES
39
NOTES
40
NOTES
41
Dreyfus Strategic Value Fund
200 Park Avenue
New York, NY 10166
Manager
The Dreyfus Corporation
200 Park Avenue
New York, NY 10166
Custodian
The Bank of New York Mellon
225 Liberty Street
New York, NY 10286
Transfer Agent &
Dividend Disbursing Agent
Dreyfus Transfer, Inc.
200 Park Avenue
New York, NY 10166
Distributor
MBSC Securities Corporation
200 Park Avenue
New York, NY 10166
| | |
Ticker Symbols: | Class A: DAGVX Class C: DCGVX Class I:DRGVX Class Y: DRGYX |
Telephone Call your financial representative or 1-800-DREYFUS
Mail The Dreyfus Family of Funds, 144 Glenn Curtiss Boulevard, Uniondale, NY 11556-0144
E-mail Send your request to info@dreyfus.com
Internet Information can be viewed online or downloaded at www.dreyfus.com
The fund files its complete schedule of portfolio holdings with the Securities and Exchange Commission (“SEC”) for the first and third quarters of each fiscal year on Form N-Q. The fund’s Forms N-Q are available on the SEC’s website at www.sec.gov and may be reviewed and copied at the SEC’s Public Reference Room in Washington, DC. (phone 1-800-SEC-0330 for information).
Information regarding how the fund voted proxies related to portfolio securities for the most recent 12-month period ended June 30 is available at www.dreyfus.com and on the SEC’s website at www.sec.gov and without charge, upon request, by calling 1-800-DREYFUS.
| | |
© 2015 MBSC Securities Corporation | 
0257AR0815 |

Dreyfus Structured Midcap Fund
| | | |

| | ANNUAL REPORT
August 31, 2015 |
| |
Save time. Save paper. View your next shareholder report online as soon as it’s available. Log into www.dreyfus.com and sign up for Dreyfus eCommunications. It’s simple and only takes a few minutes. |
| |
The views expressed in this report reflect those of the portfolio manager only through the end of the period covered and do not necessarily represent the views of Dreyfus or any other person in the Dreyfus organization. Any such views are subject to change at any time based upon market or other conditions and Dreyfus disclaims any responsibility to update such views. These views may not be relied on as investment advice and, because investment decisions for a Dreyfus fund are based on numerous factors, may not be relied on as an indication of trading intent on behalf of any Dreyfus fund. |
| |
Not FDIC-Insured • Not Bank-Guaranteed • May Lose Value |
Contents
T H E F U N D
F O R M O R E I N F O R M AT I O N
Back Cover
| | | | |
| |
Dreyfus Structured Midcap Fund
| | The Fund |
A LETTER FROM THE PRESIDENT
Dear Shareholder:
We are pleased to present this annual report for Dreyfus Structured Midcap Fund, covering the 12-month period from September 1, 2014, through August 31, 2015. For information about how the fund performed during the reporting period, as well as general market perspectives, we provide a Discussion of Fund Performance on the pages that follow.
Financial markets proved volatile over the reporting period. For much of the year, a recovering U.S. economy enabled stocks to advance, but those gains were more than erased in August when economic concerns in China, falling commodity prices and a stronger U.S. dollar sparked sharp corrections in equity markets throughout the world. The emerging markets were especially hard hit in this environment. U.S. bonds generally fared better, rallying in late 2014 due to robust investor demand before reversing course in the spring as the domestic economy strengthened. Global economic instability in August hurt corporate-backed and inflation-linked bonds, but U.S. government securities held up relatively well.
We expect market uncertainty and volatility to persist over the near term as investors vacillate between hopes that current market turmoil represents a healthy correction and fears that further disappointments could trigger a full-blown bear market. Our investment strategists and portfolio managers are monitoring developments carefully, keeping a close watch on Chinese fiscal and monetary policy, liquidity factors affecting various asset classes, and other developments that could influence investor sentiment. Over the longer term, we remain confident that financial markets are likely to stabilize as the world adjusts to slower Chinese economic growth, abundant energy resources, and the anticipated eventual normalization of monetary policy. In our view, investors will continue to be well served under these circumstances by a long-term perspective and a disciplined investment approach.
Thank you for your continued confidence and support.
Sincerely,

J. Charles Cardona
President
The Dreyfus Corporation
September 15, 2015
2
DISCUSSION OF FUND PERFORMANCE
For the period of September 1, 2014, through August 31, 2015, as provided by C. Wesley Boggs, William S. Cazalet, CAIA, and Ronald P. Gala, CFA, Portfolio Managers
Fund and Market Performance Overview
For the 12-month period ended August 31, 2015, Dreyfus Structured Midcap Fund’s Class A shares produced a total return of -2.80%, Class C shares returned -3.51%, Class I shares returned -2.59%, and Class Y shares returned -2.43%.1 In comparison, the Standard & Poor’s® MidCap 400 Index, the fund’s benchmark, produced a total return of 0.01%.2
Flat results from the S&P 400 Index for the reporting period overall masked heightened volatility stemming from renewed global economic concerns. The fund underperformed its benchmark, mainly due to security selection shortfalls in the energy, financials, and industrials sectors.
The Fund’s Investment Approach
The fund seeks long-term capital growth. To pursue this goal, the fund normally invests at least 80% of its net assets, plus any borrowings for investment purposes, in the stocks of companies included in the S&P 400 Index or the Russell Midcap® Index. The fund invests principally in common stocks, but the fund’s equity investments may also include preferred stocks, convertible securities of U.S. and foreign issuers, including those purchased in initial public offerings and securities issued by real estate investment trusts (REITs). We construct the portfolio through a “bottom-up” structured approach focusing on stock selection as opposed to making proactive decisions as to industry sector exposure. The approach seeks to identify undervalued securities through a quantitative process that ranks stocks based on value measures, behavioral/momentum factors, and earnings quality metrics.
Global Economic Concerns Sparked Market Turmoil
The reporting period began in the midst of renewed concerns about domestic and global economic growth, which drove U.S. equity markets broadly lower in September and early October 2014. Ongoing employment gains, better consumer confidence, and improved business sentiment prompted a quick market recovery, and some broad market indices climbed to record highs through the end of February 2015.
Investors responded negatively in March to sluggish economic growth stemming from severe winter weather, an appreciating U.S. dollar, and disappointing corporate revenues. Indeed, U.S. GDP expanded at an anemic 0.6% annualized rate during the first quarter of 2015, but the U.S. economy regained traction in the spring with a 3.7% annualized growth rate for the second quarter, and stocks resumed their advance. However, uncertainty regarding a persistent debt crisis in Greece and slowing economic growth in China again sent U.S. stock prices lower over the summer. In mid-August, the Chinese central bank unexpectedly devalued the country’s currency, intensifying concerns that the world’s second-largest economy could be slowing more than anticipated. In response, stocks across all capitalization ranges dipped into negative territory before partially recovering in the closing days of the reporting period.
In this tumultuous environment, midcap stocks generally trailed their large- and small-cap counterparts, and growth-oriented stocks outperformed their more value-oriented counterparts, on average.
3
DISCUSSION OF FUND PERFORMANCE (continued)
Stock Selection Weighed on Relative Performance
The fund’s quantitative investment process produced mixed returns during the volatile reporting period, as relative strength in some market sectors were more than offset by lagging results in others. The hard-hit energy sector proved most disappointing as many companies struggled with falling oil and gas prices. Most notably, exploration-and-production company SM Energy faltered early in the reporting period when operational problems undermined production volumes, leading to its elimination from the portfolio, and international offshore energy services company Helix Energy Solutions lost value after analysts reduced their earnings targets. In the financials sector, the fund’s holdings of real estate investment trusts, especially among companies specializing in hotel properties, underperformed industry averages and detracted from performance. The fund’s performance in the industrials sector was hurt by weakness in machinery producer SPX Corp., which reduced the guidance it provided to securities analysts in the back half of the period.
The fund achieved better relative results in the information technology sector, where semiconductors manufacturer Skyworks Solutions posted better-than-expected earnings and raised future guidance. Results in the health care sector were bolstered by medical devices maker Boston Scientific, which advanced after settling a lawsuit, and health insurer Health Net, which posted strong quarterly earnings and received an acquisition offer at a premium to its stock price at the time.
Focusing on Company Fundamentals
As of the reporting period’s end, our quantitative models have continued to identify what we believe are attractive investment opportunities across a broad spectrum of midcap companies and industry groups. Indeed, recent bouts of volatility have provided opportunities to purchase the stocks of companies ranked highly by our process. To the extent the fund’s holdings reach what we perceive to be fuller valuations, we expect to replace them with high-quality companies that display then-currently attractive valuations in our model. In addition, we continue to maintain a broadly diversified portfolio.
September 15, 2015
Please note, the position in any security highlighted with italicized typeface was sold during the reporting period.
Equity funds are subject generally to market, market sector, market liquidity, issuer, and investment style risks, among other factors, to varying degrees, all of which are more fully described in the fund’s prospectus.
Stocks of small- and/or mid-cap companies often experience sharper price fluctuations than stocks of large-cap companies.
1 Total return includes reinvestment of dividends and any capital gains paid, and does not take into consideration the maximum initial sales charge in the case of Class A shares or the applicable contingent deferred sales charge imposed on redemptions in the case of Class C shares. Had these charges been reflected, returns would have been lower. Past performance is no guarantee of future results. Share price, yield, and investment return fluctuate such that upon redemption fund shares may be worth more or less than their original cost. The fund’s returns reflect the absorption of certain fund expenses by The Dreyfus Corporation pursuant to an agreement in effect through January 1, 2016, at which time it may be extended, terminated or modified. Had these expenses not been absorbed, the fund’s returns would have been lower.
2 SOURCE: LIPPER INC. — Reflects reinvestment of dividends and, where applicable, capital gain distributions. The Standard & Poor’s MidCap 400 Index is a widely accepted, unmanaged total return index measuring the performance of the midsize company segment of the U.S. market. The Russell Midcap Index is a widely accepted, unmanaged index of medium-cap stock market performance. Investors cannot invest directly in any index.
4
FUND PERFORMANCE
Comparison of change in value of $10,000 investment in Dreyfus Structured Midcap Fund Class A shares, Class C shares, Class I shares and Class Y shares with the Standard & Poor's MidCap 400 Index
† Source: Lipper Inc.
†† The total return figures presented for Class Y shares of the fund reflect the performance of the fund’s Class A shares for the period prior to 7/1/13 (the inception date for Class Y shares), not reflecting the applicable sales charges for Class A shares.
Past performance is not predictive of future performance.
The above graph compares a $10,000 investment made in each of the Class A, Class C, Class I and Class Y shares of Dreyfus Structured Midcap Fund on 8/31/05 to a $10,000 investment made in the Standard & Poor’s MidCap 400 Index (the “Index”) on that date. All dividends and capital gain distributions are reinvested.
The fund’s performance shown in the line graph above takes into account the maximum initial sales charge on Class A shares and all other applicable fees and expenses on all classes. The Index is a widely accepted, unmanaged total return index measuring the performance of the midsize company segment of the U.S. market. Unlike a mutual fund, the Index is not subject to charges, fees and other expenses. Investors cannot invest directly in any index. Further information relating to fund performance, including expense reimbursements, if applicable, is contained in the Financial Highlights section of the prospectus and elsewhere in this report.
5
FUND PERFORMANCE (continued)
| | | | | | | | |
Average Annual Total Returns as of 8/31/15 | | |
| | | Inception | | | | | |
| | Date | 1 Year | 5 Years | | 10 Years | |
Class A shares | | | | | | | |
with maximum sales charge (5.75%) | 6/29/01 | -8.38% | 15.45% | | 7.12% | |
without sales charge | 6/29/01 | -2.80% | 16.82% | | 7.75% | |
Class C shares | | | | | | | |
with applicable redemption charge † | 6/29/01 | -4.34% | 15.99% | | 6.96% | |
without redemption | | 6/29/01 | -3.51% | 15.99% | | 6.96% | |
Class I shares | | 6/29/01 | -2.59% | 17.06% | | 7.97% | |
Class Y shares | | 7/1/13 | -2.43% | 17.36% | †† | 8.00% | †† |
Standard & Poor's MidCap 400 Index | | 0.01% | 16.14% | | 8.69% | |
Past performance is not predictive of future performance. The fund’s performance shown in the graph and table does not reflect the deduction of taxes that a shareholder would pay on fund distributions or the redemption of fund shares. In addition to the performance of Class A shares shown with and without a maximum sales charge, the fund’s performance shown in the table takes into account all other applicable fees and expenses on all classes.
† The maximum contingent deferred sales charge for Class C shares is 1% for shares redeemed within one year of the date of purchase.
†† The total return performance figures presented for Class Y shares of the fund reflect the performance of the fund’s Class A shares for the period prior to 7/1/13 (the inception date for Class Y shares), not reflecting the applicable sales charges for Class A shares.
6
UNDERSTANDING YOUR FUND’S EXPENSES (Unaudited)
As a mutual fund investor, you pay ongoing expenses, such as management fees and other expenses. Using the information below, you can estimate how these expenses affect your investment and compare them with the expenses of other funds. You also may pay one-time transaction expenses, including sales charges (loads) and redemption fees, which are not shown in this section and would have resulted in higher total expenses. For more information, see your fund’s prospectus or talk to your financial adviser.
Review your fund’s expenses
The table below shows the expenses you would have paid on a $1,000 investment in Dreyfus Structured Midcap Fund from March 1, 2015 to August 31, 2015. It also shows how much a $1,000 investment would be worth at the close of the period, assuming actual returns and expenses.
| | | | | | | | |
Expenses and Value of a $1,000 Investment | | |
assuming actual returns for the six months ended August 31, 2015 |
| | | | | | | | |
| | | | Class A | Class C | Class I | Class Y |
Expenses paid per $1,000† | $ 5.98 | $ 9.52 | $ 4.87 | $ 4.14 |
Ending value (after expenses) | $ 930.10 | $ 926.40 | $ 931.00 | $ 931.90 |
COMPARING YOUR FUND’S EXPENSES
WITH THOSE OF OTHER FUNDS (Unaudited)
Using the SEC’s method to compare expenses
The Securities and Exchange Commission (SEC) has established guidelines to help investors assess fund expenses. Per these guidelines, the table below shows your fund’s expenses based on a $1,000 investment, assuming a hypothetical 5% annualized return. You can use this information to compare the ongoing expenses (but not transaction expenses or total cost) of investing in the fund with those of other funds. All mutual fund shareholder reports will provide this information to help you make this comparison. Please note that you cannot use this information to estimate your actual ending account balance and expenses paid during the period.
| | | | | | | | |
Expenses and Value of a $1,000 Investment | | |
assuming a hypothetical 5% annualized return for the six months ended August 31, 2015 |
| | | | | | | | |
| | | | Class A | Class C | Class I | Class Y |
Expenses paid per $1,000† | $ 6.26 | $ 9.96 | $ 5.09 | $ 4.33 |
Ending value (after expenses) | $ 1,019.00 | $ 1,015.32 | $ 1,020.16 | $ 1,020.92 |
† Expenses are equal to the fund’s annualized expense ratio of 1.23% for Class A, 1.96% for Class C, 1.00% for Class I and .85% for Class Y, multiplied by the average account value over the period, multiplied by 184/365 (to reflect the one-half year period).
7
STATEMENT OF INVESTMENTS
August 31, 2015
||ANAME||
| | | | | | | | | |
Common Stocks - 99.6% | | Shares | | Value ($) | |
Banks - 5.4% | | | | | |
Associated Banc-Corp | | 74,680 | | 1,371,125 | |
BancorpSouth | | 98,920 | | 2,350,339 | |
Cathay General Bancorp | | 68,470 | | 2,028,766 | |
East West Bancorp | | 120,790 | | 4,881,124 | |
First Horizon National | | 201,800 | a | 2,932,154 | |
| | | | | 13,563,508 | |
Capital Goods - 10.3% | | | | | |
Allison Transmission Holdings | | 108,100 | | 3,091,660 | |
GATX | | 55,500 | | 2,751,135 | |
Huntington Ingalls Industries | | 42,030 | | 4,731,737 | |
Lincoln Electric Holdings | | 85,760 | | 5,029,824 | |
Spirit Aerosystems Holdings, Cl. A | | 79,800 | b | 4,078,578 | |
Timken | | 99,500 | | 3,159,125 | |
Trinity Industries | | 80,790 | | 2,180,522 | |
Wabtec | | 7,400 | | 708,624 | |
| | | | | 25,731,205 | |
Commercial & Professional Services - 1.9% | | | | | |
Deluxe | | 83,360 | | 4,835,714 | |
Consumer Durables & Apparel - 4.8% | | | | | |
Brunswick | | 107,800 | | 5,358,738 | |
Carter's | | 26,800 | | 2,634,708 | |
Kate Spade & Co. | | 62,170 | b | 1,178,743 | |
NVR | | 1,890 | b | 2,872,705 | |
| | | | | 12,044,894 | |
Consumer Services - 4.2% | | | | | |
Darden Restaurants | | 58,700 | | 3,992,187 | |
Jack in the Box | | 60,100 | | 4,698,618 | |
ServiceMaster Global Holdings | | 49,100 | b | 1,727,338 | |
Wyndham Worldwide | | 2,760 | | 211,085 | |
| | | | | 10,629,228 | |
Diversified Financials - 4.1% | | | | | |
Affiliated Managers Group | | 18,130 | b | 3,380,157 | |
Eaton Vance | | 15,000 | | 520,050 | |
Navient | | 22,270 | | 284,833 | |
SEI Investments | | 37,140 | | 1,878,541 | |
T. Rowe Price Group | | 8,370 | | 601,636 | |
Waddell & Reed Financial, Cl. A | | 95,190 | | 3,719,073 | |
| | | | | 10,384,290 | |
8
| | | | | | | | | | | |
Common Stocks - 99.6% (continued) | | Shares | | Value ($) | |
Energy - 5.8% | | | | | |
Cameron International | | 19,800 | b | 1,321,848 | |
HollyFrontier | | 13,200 | | 618,552 | |
Oil States International | | 123,400 | b | 3,500,858 | |
Tesoro | | 7,800 | | 717,678 | |
Western Refining | | 112,000 | | 4,818,240 | |
World Fuel Services | | 91,700 | | 3,544,205 | |
| | | | | 14,521,381 | |
Food & Staples Retailing - 1.2% | | | | | |
SUPERVALU | | 375,400 | b | 3,093,296 | |
Food, Beverage & Tobacco - 4.6% | | | | | |
Bunge | | 55,200 | | 3,999,240 | |
Ingredion | | 63,250 | | 5,461,005 | |
Pilgrim's Pride | | 97,000 | a | 2,034,575 | |
| | | | | 11,494,820 | |
Health Care Equipment & Services - 8.0% | | | | | |
DENTSPLY International | | 80,800 | | 4,234,728 | |
Health Net | | 69,600 | b | 4,458,576 | |
Molina Healthcare | | 46,500 | b | 3,468,435 | |
Teleflex | | 44,360 | | 5,802,288 | |
Universal Health Services, Cl. B | | 14,780 | | 2,026,929 | |
| | | | | 19,990,956 | |
Insurance - 4.0% | | | | | |
Everest Re Group | | 6,600 | | 1,160,346 | |
First American Financial | | 25,700 | | 998,702 | |
Lincoln National | | 7,190 | | 365,180 | |
Primerica | | 28,800 | a | 1,223,712 | |
Reinsurance Group of America | | 24,870 | | 2,260,186 | |
The Hanover Insurance Group | | 32,810 | | 2,588,709 | |
W.R. Berkley | | 27,400 | | 1,487,272 | |
| | | | | 10,084,107 | |
Materials - 4.4% | | | | | |
Ashland | | 2,400 | | 251,928 | |
Cabot | | 48,470 | | 1,641,679 | |
Celanese, Ser. A | | 28,700 | | 1,740,368 | |
Minerals Technologies | | 5,200 | | 279,708 | |
Mosaic | | 93,900 | | 3,833,937 | |
PolyOne | | 63,500 | | 2,061,845 | |
Sealed Air | | 19,600 | | 1,008,420 | |
Steel Dynamics | | 15,300 | | 298,044 | |
| | | | | 11,115,929 | |
9
STATEMENT OF INVESTMENTS (continued)
| | | | | | | | | | | |
Common Stocks - 99.6% (continued) | | Shares | | Value ($) | |
Media - 1.0% | | | | | |
Madison Square Garden, Cl. A | | 24,400 | b | 1,718,736 | |
New York Times, Cl. A | | 56,750 | | 690,080 | |
| | | | | 2,408,816 | |
Pharmaceuticals, Biotechnology & Life Sciences - 4.1% | | | | | |
Charles River Laboratories International | | 44,250 | b | 3,048,382 | |
Mettler-Toledo International | | 20,180 | b | 5,984,379 | |
United Therapeutics | | 8,900 | b | 1,340,518 | |
| | | | | 10,373,279 | |
Real Estate - 9.6% | | | | | |
Corrections Corporation of America | | 119,170 | c | 3,501,215 | |
Highwoods Properties | | 9,600 | c | 364,224 | |
Host Hotels & Resorts | | 111,450 | c | 1,976,008 | |
Lamar Advertising, Cl. A | | 17,300 | | 922,782 | |
LaSalle Hotel Properties | | 138,710 | c | 4,363,817 | |
Post Properties | | 63,000 | c | 3,487,680 | |
Taubman Centers | | 74,260 | c | 5,123,197 | |
Weingarten Realty Investors | | 137,680 | c | 4,356,195 | |
| | | | | 24,095,118 | |
Retailing - 4.2% | | | | | |
Big Lots | | 95,610 | a | 4,588,324 | |
Foot Locker | | 82,580 | | 5,845,838 | |
| | | | | 10,434,162 | |
Semiconductors & Semiconductor Equipment - 2.4% | | | | | |
Integrated Device Technology | | 269,970 | b | 5,126,730 | |
Skyworks Solutions | | 11,070 | | 966,965 | |
| | | | | 6,093,695 | |
Software & Services - 10.0% | | | | | |
Amdocs | | 15,770 | | 902,202 | |
Broadridge Financial Solutions | | 41,480 | | 2,189,729 | |
Computer Sciences | | 17,140 | | 1,062,509 | |
Convergys | | 81,250 | | 1,836,250 | |
DST Systems | | 45,905 | | 4,701,590 | |
FactSet Research Systems | | 7,290 | a | 1,151,237 | |
Mentor Graphics | | 60,890 | | 1,573,398 | |
NeuStar, Cl. A | | 102,270 | a,b | 2,858,446 | |
Rovi | | 137,770 | a,b | 1,525,114 | |
SolarWinds | | 57,500 | b | 2,285,625 | |
VeriSign | | 66,500 | a,b | 4,584,510 | |
WEX | | 2,700 | b | 255,231 | |
| | | | | 24,925,841 | |
10
| | | | | | | | | | | | | | |
Common Stocks - 99.6% (continued) | | Shares | | Value ($) | |
Technology Hardware & Equipment - 3.1% | | | | | |
Arrow Electronics | | 11,200 | b | 626,304 | |
InterDigital | | 66,900 | | 3,309,543 | |
Jabil Circuit | | 13,300 | | 257,355 | |
Polycom | | 232,700 | b | 2,503,852 | |
Vishay Intertechnology | | 107,320 | | 1,060,322 | |
| | | | | 7,757,376 | |
Transportation - 3.3% | | | | | |
Alaska Air Group | | 35,080 | | 2,626,089 | |
Old Dominion Freight Line | | 79,900 | b | 5,312,551 | |
Southwest Airlines | | 6,580 | | 241,486 | |
| | | | | 8,180,126 | |
Utilities - 3.2% | | | | | |
Atmos Energy | | 44,630 | | 2,445,278 | |
IDACORP | | 77,440 | | 4,597,613 | |
PNM Resources | | 34,710 | | 888,923 | |
| | | | | 7,931,814 | |
Total Common Stocks (cost $243,482,881) | | | | 249,689,555 | |
Other Investments - .3% | | | | | |
Registered Investment Company; | | | | | |
Dreyfus Institutional Preferred Plus Money Market Fund | | 665,102 | d | 665,102 | |
(cost $665,102) | | | | | |
Investment of Cash Collateral for Securities Loaned - 3.9% | | | | | |
Registered Investment Company; | | | | | |
Dreyfus Institutional Cash Advantage Fund | | 9,708,336 | d | 9,708,336 | |
(cost $9,708,336) | | | | | |
Total Investments (cost $253,856,319) | | 103.8% | | 260,062,993 | |
Liabilities, Less Cash and Receivables | | (3.8%) | | (9,400,591) | |
Net Assets | | 100.0% | | 250,662,402 | |
a Security, or portion thereof, on loan. At August 31, 2015, the value of the fund's securities on loan was $18,958,866 and the value of the collateral held by the fund was $19,469,771, consisting of cash collateral of $9,708,336 and U.S. Government & Agency securities valued at $9,761,435.
b Non-income producing security.
c Investment in real estate investment trust.
d Investment in affiliated money market mutual fund.
11
STATEMENT OF INVESTMENTS (continued)
| | |
Portfolio Summary (Unaudited) † | Value (%) |
Capital Goods | 10.3 |
Software & Services | 10.0 |
Real Estate | 9.6 |
Health Care Equipment & Services | 8.0 |
Energy | 5.8 |
Banks | 5.4 |
Consumer Durables & Apparel | 4.8 |
Food, Beverage & Tobacco | 4.6 |
Materials | 4.4 |
Consumer Services | 4.2 |
Money Market Investments | 4.2 |
Retailing | 4.2 |
Diversified Financials | 4.1 |
Pharmaceuticals, Biotechnology & Life Sciences | 4.1 |
Insurance | 4.0 |
Transportation | 3.3 |
Utilities | 3.2 |
Technology Hardware & Equipment | 3.1 |
Semiconductors & Semiconductor Equipment | 2.4 |
Commercial & Professional Services | 1.9 |
Food & Staples Retailing | 1.2 |
Media | 1.0 |
| | 103.8 |
†Based on net assets.
See notes to financial statements.
12
STATEMENT OF ASSETS AND LIABILITIES
August 31, 2015
| | | | | | |
| | | Cost | | Value |
Assets ($): | | | |
Investments in securities—See Statement of Investments
(including securities on loan, valued at $18,958,866)—Note 1(b): | | | | |
Unaffiliated issuers | | 243,482,881 | | 249,689,555 |
Affiliated issuers | | 10,373,438 | | 10,373,438 |
Cash | | | | | 191,801 |
Receivable for shares of Common Stock subscribed | | | | | 420,131 |
Dividends and securities lending income receivable | | | | | 267,140 |
Prepaid expenses | | | | | 44,765 |
| | | | | 260,986,830 |
Liabilities ($): | | | |
Due to The Dreyfus Corporation and affiliates—Note 3(c) | | | | | 236,094 |
Liability for securities on loan—Note 1(b) | | | | | 9,708,336 |
Payable for shares of Common Stock redeemed | | | | | 266,774 |
Interest payable—Note 2 | | | | | 274 |
Accrued expenses | | | | | 112,950 |
| | | | | 10,324,428 |
Net Assets ($) | | | 250,662,402 |
Composition of Net Assets ($): | | | |
Paid-in capital | | | | | 228,786,651 |
Accumulated net realized gain (loss) on investments | | | | | 15,669,077 |
Accumulated net unrealized appreciation (depreciation)
on investments | | | | | 6,206,674 |
Net Assets ($) | | | 250,662,402 |
| | | | | |
Net Asset Value Per Share | Class A | Class C | Class I | Class Y |
Net Assets ($) | 118,953,721 | 33,925,949 | 75,779,182 | 22,003,550 |
Shares Outstanding | 4,217,376 | 1,327,699 | 2,637,512 | 765,357 |
Net Asset Value Per Share ($) | 28.21 | 25.55 | 28.73 | 28.75 |
See notes to financial statements.
13
STATEMENT OF OPERATIONS
Year Ended August 31, 2015
| | | | | | | |
| | | | | | |
| | | | | | |
Investment Income ($): | | | | |
Income: | | | | |
Cash dividends: | | | | |
Unaffliated issuers | | | 3,614,956 | |
Affliated issuers | | | 2,322 | |
Income from securities lending—Note 1(b) | | | 122,242 | |
Total Income | | | 3,739,520 | |
Expenses: | | | | |
Management fee—Note 3(a) | | | 1,946,391 | |
Shareholder servicing costs—Note 3(c) | | | 812,384 | |
Distribution fees—Note 3(b) | | | 245,963 | |
Registration fees | | | 64,970 | |
Prospectus and shareholders’ reports | | | 49,018 | |
Professional fees | | | 47,835 | |
Custodian fees—Note 3(c) | | | 21,843 | |
Directors' fees and expenses—Note 3(d) | | | 18,152 | |
Loan commitment fees—Note 2 | | | 2,577 | |
Interest expense—Note 2 | | | 581 | |
Miscellaneous | | | 22,309 | |
Total Expenses | | | 3,232,023 | |
Less—reduction in expenses due to undertaking—Note 3(a) | | | (59,417) | |
Less—reduction in fees due to earnings credits—Note 3(c) | | | (116) | |
Net Expenses | | | 3,172,490 | |
Investment Income—Net | | | 567,030 | |
Realized and Unrealized Gain (Loss) on Investments—Note 4 ($): | | |
Net realized gain (loss) on investments | | | 26,675,022 | |
Net unrealized appreciation (depreciation) on investments | | | (36,072,360) | |
Net Realized and Unrealized Gain (Loss) on Investments | | | (9,397,338) | |
Net (Decrease) in Net Assets Resulting from Operations | | (8,830,308) | |
See notes to financial statements.
14
STATEMENT OF CHANGES IN NET ASSETS
| | | | | | | | | | |
| | | | | | | | | | |
| | | | Year Ended August 31, |
| | | | 2015 | | | | 2014 | |
Operations ($): | | | | | | | | |
Investment income—net | | | 567,030 | | | | 866,322 | |
Net realized gain (loss) on investments | | 26,675,022 | | | | 38,152,410 | |
Net unrealized appreciation (depreciation)
on investments | | (36,072,360) | | | | 15,757,601 | |
Net Increase (Decrease) in Net Assets
Resulting from Operations | (8,830,308) | | | | 54,776,333 | |
Dividends to Shareholders from ($): | | | | | | | | |
Investment income—net: | | | | | | | | |
Class A | | | (513,685) | | | | (381,712) | |
Class I | | | (520,523) | | | | (393,186) | |
Class Y | | | (165,825) | | | | (25,283) | |
Net realized gain on investments: | | | | | | | | |
Class A | | | (14,496,970) | | | | (1,107,667) | |
Class C | | | (4,104,326) | | | | (291,556) | |
Class I | | | (9,421,355) | | | | (759,090) | |
Class Y | | | (2,477,042) | | | | (42,458) | |
Total Dividends | | | (31,699,726) | | | | (3,000,952) | |
Capital Stock Transactions ($): | | | | | | | | |
Net proceeds from shares sold: | | | | | | | | |
Class A | | | 40,574,908 | | | | 14,960,407 | |
Class C | | | 9,017,756 | | | | 1,782,484 | |
Class I | | | 38,164,790 | | | | 30,900,200 | |
Class Y | | | 7,047,076 | | | | 26,873,936 | |
Dividends reinvested: | | | | | | | | |
Class A | | | 14,322,139 | | | | 1,425,377 | |
Class C | | | 3,238,854 | | | | 221,915 | |
Class I | | | 9,397,205 | | | | 1,100,958 | |
Class Y | | | 2,595,452 | | | | 67,724 | |
Cost of shares redeemed: | | | | | | | | |
Class A | | | (39,248,421) | | | | (25,811,227) | |
Class C | | | (3,363,756) | | | | (3,868,671) | |
Class I | | | (32,665,758) | | | | (46,020,290) | |
Class Y | | | (6,370,231) | | | | (6,247,762) | |
Increase (Decrease) in Net Assets
from Capital Stock Transactions | 42,710,014 | | | | (4,614,949) | |
Total Increase (Decrease) in Net Assets | 2,179,980 | | | | 47,160,432 | |
Net Assets ($): | | | | | | | | |
Beginning of Period | | | 248,482,422 | | | | 201,321,990 | |
End of Period | | | 250,662,402 | | | | 248,482,422 | |
Undistributed investment income—net | - | | | | 779,678 | |
15
STATEMENT OF CHANGES IN NET ASSETS (continued)
| | | | | | | | | | |
| | | | | | | | | | |
| | | | Year Ended August 31, |
| | | | 2015 | | | | 2014 | |
Capital Share Transactions: | | | | | | | | |
Class A | | | | | | | | |
Shares sold | | | 1,338,782 | | | | 498,384 | |
Shares issued for dividends reinvested | | | 503,946 | | | | 48,269 | |
Shares redeemed | | | (1,323,459) | | | | (858,652) | |
Net Increase (Decrease) in Shares Outstanding | 519,269 | | | | (311,999) | |
Class C | | | | | | | | |
Shares sold | | | 327,990 | | | | 63,853 | |
Shares issued for dividends reinvested | | | 125,149 | | | | 8,132 | |
Shares redeemed | | | (122,236) | | | | (139,609) | |
Net Increase (Decrease) in Shares Outstanding | 330,903 | | | | (67,624) | |
Class Ia | | | | | | | | |
Shares sold | | | 1,232,159 | | | | 1,021,319 | |
Shares issued for dividends reinvested | | | 325,163 | | | | 36,748 | |
Shares redeemed | | | (1,076,270) | | | | (1,466,904) | |
Net Increase (Decrease) in Shares Outstanding | 481,052 | | | | (408,837) | |
Class Ya | | | | | | | | |
Shares sold | | | 226,251 | | | | 836,599 | |
Shares issued for dividends reinvested | | | 89,839 | | | | 2,260 | |
Shares redeemed | | | (200,076) | | | | (189,554) | |
Net Increase (Decrease) in Shares Outstanding | 116,014 | | | | 649,305 | |
a During the period ended August 31, 2014, 114,784 Class I shares representing $3,626,811 were exchanged for 114,713 Class Y shares. | | |
See notes to financial statements.
16
FINANCIAL HIGHLIGHTS
The following tables describe the performance for each share class for the fiscal periods indicated. All information (except portfolio turnover rate) reflects financial results for a single fund share. Total return shows how much your investment in the fund would have increased (or decreased) during each period, assuming you had reinvested all dividends and distributions. These figures have been derived from the fund’s financial statements.
| | | | | | | | |
| | | | |
| | Year Ended August 31, |
Class A Shares | | 2015 | 2014 | 2013 | 2012 | 2011 |
Per Share Data ($): | | | | | | |
Net asset value, beginning of period | | 33.28 | 26.49 | 21.41 | 18.67 | 15.20 |
Investment Operations: | | | | | | |
Investment income (loss)—neta | | .06 | .11 | .23 | .11 | (.05) |
Net realized and unrealized gain (loss) on investments | | (.96) | 7.06 | 5.06 | 2.63 | 3.52 |
Total from Investment Operations | | (.90) | 7.17 | 5.29 | 2.74 | 3.47 |
Distributions: | | | | | | |
Dividends from investment income—net | | (.14) | (.10) | (.21) | - | - |
Dividends from net realized gain on investments | | (4.03) | (.28) | - | - | - |
Total Distributions | | (4.17) | (.38) | (.21) | - | - |
Net asset value, end of period | | 28.21 | 33.28 | 26.49 | 21.41 | 18.67 |
Total Return (%)b | | (2.80) | 27.21 | 24.94 | 14.68 | 22.83 |
Ratios/Supplemental Data (%): | | | | | | |
Ratio of total expenses to average net assets | | 1.25 | 1.25 | 1.35 | 1.41 | 1.43 |
Ratio of net expenses to average net assets | | 1.23 | 1.24 | 1.26 | 1.41 | 1.43 |
Ratio of net investment income (loss) to average net assets | | .20 | .37 | .92 | .55 | (.29) |
Portfolio Turnover Rate | | 78.09 | 74.66 | 57.54 | 93.44 | 77.12 |
Net Assets, end of period ($ x 1,000) | | 118,954 | 123,057 | 106,245 | 26,786 | 23,916 |
a Based on average shares outstanding.
b Exclusive of sales charge.
See notes to financial statements.
17
FINANCIAL HIGHLIGHTS (continued)
| | | | | | | |
| | | | |
| | Year Ended August 31, |
Class C Shares | | 2015 | 2014 | 2013 | 2012 | 2011 |
Per Share Data ($): | | | | | | |
Net asset value, beginning of period | | 30.60 | 24.48 | 19.80 | 17.40 | 14.25 |
Investment Operations: | | | | | | |
Investment income (loss)—neta | | (.14) | (.10) | .06 | (.04) | (.17) |
Net realized and unrealized gain (loss) on investments | | (.88) | 6.50 | 4.68 | 2.44 | 3.32 |
Total from Investment Operations | | (1.02) | 6.40 | 4.74 | 2.40 | 3.15 |
Distributions: | | | | | | |
Dividends from investment income—net | | - | - | (.06) | - | - |
Dividends from net realized gain on investments | | (4.03) | (.28) | - | - | - |
Total Distributions | | (4.03) | (.28) | (.06) | - | - |
Net asset value, end of period | | 25.55 | 30.60 | 24.48 | 19.80 | 17.40 |
Total Return (%)b | | (3.51) | 26.25 | 24.06 | 13.79 | 22.11 |
Ratios/Supplemental Data (%): | | | | | | |
Ratio of total expenses to average net assets | | 1.96 | 1.98 | 2.10 | 2.14 | 2.09 |
Ratio of net expenses to average net assets | | 1.96 | 1.98 | 2.01 | 2.14 | 2.09 |
Ratio of net investment income (loss) to average net assets | | (.52) | (.37) | .26 | (.20) | (.95) |
Portfolio Turnover Rate | | 78.09 | 74.66 | 57.54 | 93.44 | 77.12 |
Net Assets, end of period ($ x 1,000) | | 33,926 | 30,502 | 26,061 | 10,468 | 10,246 |
a Based on average shares outstanding.
b Exclusive of sales charge.
See notes to financial statements.
18
| | | | | | | | | | |
| | | | | | | |
| | Year Ended August 31, |
Class I Shares | | 2015 | 2014 | 2013 | 2012 | 2011 |
Per Share Data ($): | | | | | | |
Net asset value, beginning of period | | 33.83 | 26.90 | 21.73 | 18.91 | 15.39 |
Investment Operations: | | | | | | |
Investment income (loss)—neta | | .14 | .19 | .33 | .16 | (.02) |
Net realized and unrealized gain (loss) on investments | | (.99) | 7.17 | 5.09 | 2.66 | 3.56 |
Total from Investment Operations | | (.85) | 7.36 | 5.42 | 2.82 | 3.54 |
Distributions: | | | | | | |
Dividends from investment income—net | | (.22) | (.15) | (.25) | - | (.02) |
Dividends from net realized gain on investments | | (4.03) | (.28) | - | - | - |
Total Distributions | | (4.25) | (.43) | (.25) | - | (.02) |
Net asset value, end of period | | 28.73 | 33.83 | 26.90 | 21.73 | 18.91 |
Total Return (%) | | (2.59) | 27.57 | 25.17 | 14.91 | 22.97 |
Ratios/Supplemental Data (%): | | | | | | |
Ratio of total expenses to average net assets | | 1.05 | 1.16 | 1.26 | 1.22 | 1.30 |
Ratio of net expenses to average net assets | | 1.00 | .99 | 1.03 | 1.22 | 1.30 |
Ratio of net investment income (loss) to average net assets | | .46 | .62 | 1.27 | .78 | (.12) |
Portfolio Turnover Rate | | 78.09 | 74.66 | 57.54 | 93.44 | 77.12 |
Net Assets, end of period ($ x 1,000) | | 75,779 | 72,947 | 69,014 | 30,636 | 24,045 |
a Based on average shares outstanding.
See notes to financial statements.
19
FINANCIAL HIGHLIGHTS (continued)
| | | | | |
| | | | |
| | Year Ended August 31, |
Class Y Shares | | 2015 | 2014 | 2013a |
Per Share Data ($): | | | | |
Net asset value, beginning of period | | 33.85 | 26.91 | 26.38 |
Investment Operations: | | | | |
Investment income—netb | | .18 | .19 | .02 |
Net realized and unrealized gain (loss) on investments | | (.98) | 7.20 | .51 |
Total from Investment Operations | | (.80) | 7.39 | .53 |
Distributions: | | | | |
Dividends from investment income—net | | (.27) | (.17) | - |
Dividends from net realized gain on investments | | (4.03) | (.28) | - |
Total Distributions | | (4.30) | (.45) | - |
Net asset value, end of period | | 28.75 | 33.85 | 26.91 |
Total Return (%) | | (2.43) | 27.69 | 2.01c |
Ratios/Supplemental Data (%): | | | | |
Ratio of total expenses to average net assets | | .84 | .87 | .97d |
Ratio of net expenses to average net assets | | .84 | .87 | .89d |
Ratio of net investment income to average net assets | | .59 | .58 | .35d |
Portfolio Turnover Rate | | 78.09 | 74.66 | 57.54 |
Net Assets, end of period ($ x 1,000) | | 22,004 | 21,977 | 1 |
a From July 1, 2013 (commencement of initial offering) to August 31, 2013.
b Based on average shares outstanding.
c Not annualized.
d Annualized.
See notes to financial statements.
20
NOTES TO FINANCIAL STATEMENTS
NOTE 1—Significant Accounting Policies:
Dreyfus Structured Midcap Fund (the “fund”) is a separate diversified series of Advantage Funds, Inc. (the “Company”), which is registered under the Investment Company Act of 1940, as amended (the “Act”), as an open-end management investment company and operates as a series company currently offering eleven series, including the fund. The fund’s investment objective is to seek long-term capital growth. The Dreyfus Corporation (the “Manager” or “Dreyfus”), a wholly-owned subsidiary of The Bank of New York Mellon Corporation (“BNY Mellon”), serves as the fund’s investment adviser. Mellon Capital Management Corporation (“Mellon Capital”), a wholly-owned subsidiary of Dreyfus, serves as the fund’s sub-investment adviser.
MBSC Securities Corporation (the “Distributor”), a wholly-owned subsidiary of Dreyfus, is the distributor of the fund’s shares. The fund is authorized to issue 600 million shares of $.001 par value Common Stock. The fund currently offers four classes of shares: Class A (200 million shares authorized), Class C (100 million shares authorized), Class I (200 million shares authorized) and Class Y (100 million shares authorized). Class A shares generally are subject to a sales charge imposed at the time of purchase. Class C shares are subject to a contingent deferred sales charge (“CDSC”) imposed on Class C shares redeemed within one year of purchase. Class I and Class Y shares are sold at net asset value per share generally to institutional investors. Other differences between the classes include the services offered to and the expenses borne by each class, the allocation of certain transfer agency costs, and certain voting rights. Income, expenses (other than expenses attributable to a specific class), and realized and unrealized gains or losses on investments are allocated to each class of shares based on its relative net assets.
The Company accounts separately for the assets, liabilities and operations of each series. Expenses directly attributable to each series are charged to that series’ operations; expenses which are applicable to all series are allocated among them on a pro rata basis.
The Financial Accounting Standards Board (“FASB”) Accounting Standards Codification (“ASC”) is the exclusive reference of authoritative U.S. generally accepted accounting principles (“GAAP”) recognized by the FASB to be applied by nongovernmental entities. Rules and interpretive releases of the Securities and Exchange Commission (“SEC”) under authority of federal laws are also sources of authoritative GAAP for SEC registrants. The fund’s financial statements are prepared in accordance with GAAP, which may require the use of management estimates and assumptions. Actual results could differ from those estimates.
21
NOTES TO FINANCIAL STATEMENTS (continued)
The Company enters into contracts that contain a variety of indemnifications. The fund’s maximum exposure under these arrangements is unknown. The fund does not anticipate recognizing any loss related to these arrangements.
(a) Portfolio valuation: The fair value of a financial instrument is the amount that would be received to sell an asset or paid to transfer a liability in an orderly transaction between market participants at the measurement date (i.e., the exit price). GAAP establishes a fair value hierarchy that prioritizes the inputs of valuation techniques used to measure fair value. This hierarchy gives the highest priority to unadjusted quoted prices in active markets for identical assets or liabilities (Level 1 measurements) and the lowest priority to unobservable inputs (Level 3 measurements).
Additionally, GAAP provides guidance on determining whether the volume and activity in a market has decreased significantly and whether such a decrease in activity results in transactions that are not orderly. GAAP requires enhanced disclosures around valuation inputs and techniques used during annual and interim periods.
Various inputs are used in determining the value of the fund’s investments relating to fair value measurements. These inputs are summarized in the three broad levels listed below:
Level 1—unadjusted quoted prices in active markets for identical investments.
Level 2—other significant observable inputs (including quoted prices for similar investments, interest rates, prepayment speeds, credit risk, etc.).
Level 3—significant unobservable inputs (including the fund’s own assumptions in determining the fair value of investments).
The inputs or methodology used for valuing securities are not necessarily an indication of the risk associated with investing in those securities.
Changes in valuation techniques may result in transfers in or out of an assigned level within the disclosure hierarchy. Valuation techniques used to value the fund’s investments are as follows:
Investments in securities are valued at the last sales price on the securities exchange or national securities market on which such securities are primarily traded. Securities listed on the National Market System for which market quotations are available are valued at the official closing price or, if there is no official closing price that day, at the last sales price. For open short positions, asked prices are used for valuation purposes. Bid price is
22
used when no asked price is available. Registered investment companies that are not traded on an exchange are valued at their net asset value. All of the preceding securities are generally categorized within Level 1 of the fair value hierarchy.
Securities not listed on an exchange or the national securities market, or securities for which there were no transactions, are valued at the average of the most recent bid and asked prices. These securities are generally categorized within Level 2 of the fair value hierarchy.
Fair valuing of securities may be determined with the assistance of a pricing service using calculations based on indices of domestic securities and other appropriate indicators, such as prices of relevant American Depository Receipts and financial futures. Utilizing these techniques may result in transfers between Level 1 and Level 2 of the fair value hierarchy.
When market quotations or official closing prices are not readily available, or are determined not to reflect accurately fair value, such as when the value of a security has been significantly affected by events after the close of the exchange or market on which the security is principally traded (for example, a foreign exchange or market), but before the fund calculates its net asset value, the fund may value these investments at fair value as determined in accordance with the procedures approved by the Company's Board of Directors (the “Board”). Certain factors may be considered when fair valuing investments such as: fundamental analytical data, the nature and duration of restrictions on disposition, an evaluation of the forces that influence the market in which the securities are purchased and sold, and public trading in similar securities of the issuer or comparable issuers. These securities are either categorized within Level 2 or 3 of the fair value hierarchy depending on the relevant inputs used.
For restricted securities where observable inputs are limited, assumptions about market activity and risk are used and are generally categorized within Level 3 of the fair value hierarchy.
The following is a summary of the inputs used as of August 31, 2015 in valuing the fund’s investments:
23
NOTES TO FINANCIAL STATEMENTS (continued)
| | | | | |
| | Level 1 - Unadjusted Quoted Prices | Level 2 - Other Significant Observable Inputs | Level 3 -Significant Unobservable Inputs | Total |
Assets ($) | | | | |
Investments in Securities: | | | |
Equity Securities - Domestic Common Stocks† | 249,689,555 | - | - | 249,689,555 |
Mutual Funds | 10,373,438 | - | - | 10,373,438 |
† See Statement of Investments for additional detailed categorizations.
At August 31, 2015, there were no transfers between Level 1 and Level 2 of the fair value hierarchy.
(b) Securities transactions and investment income: Securities transactions are recorded on a trade date basis. Realized gains and losses from securities transactions are recorded on the identified cost basis. Dividend income is recognized on the ex-dividend date and interest income, including, where applicable, accretion of discount and amortization of premium on investments, is recognized on the accrual basis.
Pursuant to a securities lending agreement with The Bank of New York Mellon, a subsidiary of BNY Mellon and an affiliate of Dreyfus, the fund may lend securities to qualified institutions. It is the fund’s policy that, at origination, all loans are secured by collateral of at least 102% of the value of U.S. securities loaned and 105% of the value of foreign securities loaned. Collateral equivalent to at least 100% of the market value of securities on loan is maintained at all times. Collateral is either in the form of cash, which can be invested in certain money market mutual funds managed by Dreyfus, or U.S. Government and Agency securities. The fund is entitled to receive all dividends, interest and distributions on securities loaned, in addition to income earned as a result of the lending transaction. Should a borrower fail to return the securities in a timely manner, The Bank of New York Mellon is required to replace the securities for the benefit of the fund or credit the fund with the market value of the unreturned securities and is subrogated to the fund’s rights against the borrower and the collateral. During the period ended August 31, 2015, The Bank of New York Mellon earned $33,806 from lending portfolio securities, pursuant to the securities lending agreement.
(c) Affiliated issuers: Investments in other investment companies advised by Dreyfus are defined as “affiliated” under the Act. Investments in affiliated investment companies during the period ended August 31, 2015 were as follows:
24
| | | | | | |
Affiliated Investment Company | Value 8/31/2014 ($) | Purchases ($) | Sales ($) | Value 8/31/2015 ($) | Net Assets (%) |
Dreyfus Institutional Preferred Plus Money Market Fund | 1,355,057 | 58,810,180 | 59,500,135 | 665,102 | .3 |
Dreyfus Institutional Cash Advantage Fund | - | 49,865,390 | 40,157,054 | 9,708,336 | 3.9 |
Total | 1,355,057 | 108,675,570 | 99,657,189 | 10,373,438 | 4.2 |
(d) Dividends to shareholders: Dividends are recorded on the ex-dividend date. Dividends from investment income-net and dividends from net realized capital gains, if any, are normally declared and paid annually, but the fund may make distributions on a more frequent basis to comply with the distribution requirements of the Internal Revenue Code of 1986, as amended (the “Code”). To the extent that net realized capital gains can be offset by capital loss carryovers, it is the policy of the fund not to distribute such gains. Income and capital gain distributions are determined in accordance with income tax regulations, which may differ from GAAP.
(e) Federal income taxes: It is the policy of the fund to continue to qualify as a regulated investment company, if such qualification is in the best interests of its shareholders, by complying with the applicable provisions of the Code, and to make distributions of taxable income sufficient to relieve it from substantially all federal income and excise taxes.
As of and during the period ended August 31, 2015, the fund did not have any liabilities for any uncertain tax positions. The fund recognizes interest and penalties, if any, related to uncertain tax positions as income tax expense in the Statement of Operations. During the period ended August 31, 2015, the fund did not incur any interest or penalties.
Each tax year in the four-year period ended August 31, 2015 remains subject to examination by the Internal Revenue Service and state taxing authorities.
At August 31, 2015, the components of accumulated earnings on a tax basis were as follows: undistributed capital gains $19,976,401, accumulated capital losses $4,295,219 and unrealized appreciation $6,194,569.
Under the Regulated Investment Company Modernization Act of 2010 (the “2010 Act”), the fund is permitted to carry forward capital losses
25
NOTES TO FINANCIAL STATEMENTS (continued)
incurred in taxable years beginning after December 22, 2010 (“post-enactment losses”) for an unlimited period. Furthermore, post-enactment capital loss carryovers retain their character as either short-term or long-term capital losses rather than short-term as they were under previous statute. The 2010 Act requires post-enactment losses to be utilized before the utilization of losses incurred in taxable years prior to the effective date of the 2010 Act (“pre-enactment losses”). As a result of this ordering rule, pre-enactment losses may be more likely to expire unused.
As a result of the fund’s previous merger with Dreyfus MidCap Core Fund, capital losses of $4,295,219 are available to offset future realized gains, if any. Based on certain provisions in the Code, the amount of losses which can be utilized in subsequent years is subject to an annual limitation. If not applied, $3,806,018 of these acquired capital losses expires in fiscal year 2016 and $489,201 expires in fiscal year 2017.
The tax character of distributions paid to shareholders during the fiscal periods ended August 31, 2015 and August 31, 2014 were as follows: ordinary income $1,346,705 and $800,181, and long-term capital gains $30,353,021 and $2,200,771, respectively.
During the period ended August 31, 2015, as a result of permanent book to tax differences, primarily due to the tax treatment for dividend reclassification and capital loss carryover expiration, the fund decreased accumulated undistributed investment income-net by $146,675, increased accumulated net realized gain (loss) on investments by $13,155,762 and decreased paid-in capital by $13,009,087. Net assets and net asset value per share were not affected by this reclassification.
NOTE 2—Bank Lines of Credit:
The fund participates with other Dreyfus-managed funds in a $430 million unsecured credit facility led by Citibank, N.A. and a $300 million unsecured credit facility provided by The Bank of New York Mellon (each, a “Facility”), each to be utilized primarily for temporary or emergency purposes, including the financing of redemptions. Prior to October 8, 2014, the unsecured credit facility with Citibank, N.A. was $265 million. In connection therewith, the fund has agreed to pay its pro rata portion of commitment fees for each Facility. Interest is charged to the fund based on rates determined pursuant to the terms of the respective Facility at the time of borrowing.
The average amount of borrowings outstanding under the Facilities during the period ended August 31, 2015, was approximately $52,100 with a related weighted average annualized interest rate of 1.12%.
26
NOTE 3—Management Fee, Sub-Investment Advisory Fee and Other Transactions with Affiliates:
(a) Pursuant to a management agreement with Dreyfus, the management fee is computed at the annual rate of .75% of the value of the fund's average daily net assets and is payable monthly. Dreyfus has contractually agreed, from September 1, 2014 through January 1, 2016, to waive receipt of its fees and/or assume the direct expenses of the fund, so that the expenses of none of the classes (excluding Rule 12b-1 Distribution Plan fees, Shareholder Services Plan fees, taxes, interest expense, brokerage commissions, commitment fees on borrowings and extraordinary expenses) exceed 1.00% of the value of the fund’s average daily net assets. The reduction in expenses, pursuant to the undertaking, amounted to $59,417 during the period ended August 31, 2015.
Pursuant to a sub-investment advisory agreement between Dreyfus and Mellon Capital, the sub-investment advisory fee is payable monthly by Dreyfus, and is based upon the value of the fund’s average daily net assets, computed at the following annual rates:
Average Net Assets
0 up to $100 million .25%
$100 million up to $1 billion .20%
$1 billion up to $1.5 billion .16%
In excess of $1.5 billion .10%
During the period ended August 31, 2015, the Distributor retained $7,365 from commissions earned on sales of the fund’s Class A shares and $4,954 from CDSCs on redemptions of the fund's Class C shares.
(b) Under the Distribution Plan adopted pursuant to Rule 12b-1 under the Act, Class C shares pay the Distributor for distributing its shares at an annual rate of .75% of the value of its average daily net assets. During the period ended August 31, 2015, Class C shares were charged $245,963 pursuant to the Distribution Plan.
(c) Under the Shareholder Services Plan, Class A and Class C shares pay the Distributor at an annual rate of .25% of the value of their average daily net assets for the provision of certain services. The services provided may include personal services relating to shareholder accounts, such as answering shareholder inquiries regarding the fund and providing reports and other information, and services related to the maintenance of shareholder accounts. The Distributor may make payments to Service Agents (securities dealers, financial institutions or other industry professionals) with respect to these services. The Distributor determines the amounts to be paid to Service Agents. During the period ended August
27
NOTES TO FINANCIAL STATEMENTS (continued)
31, 2015, Class A and Class C shares were charged $320,050 and $81,988, respectively, pursuant to the Shareholder Services Plan.
The fund has arrangements with the transfer agent and the custodian whereby the fund may receive earnings credits when positive cash balances are maintained, which are used to offset transfer agency and custody fees. For financial reporting purposes, the fund includes net earnings credits as an expense offset in the Statement of Operations.
The fund compensates Dreyfus Transfer, Inc., a wholly-owned subsidiary of Dreyfus, under a transfer agency agreement for providing transfer agency and cash management services for the fund. The majority of transfer agency fees are comprised of amounts paid on a per account basis, while cash management fees are related to fund subscriptions and redemptions. During the period ended August 31, 2015, the fund was charged $68,268 for transfer agency services and $2,862 for cash management services. These fees are included in Shareholder servicing costs in the Statement of Operations. Cash management fees were partially offset by earnings credits of $116.
The fund compensates The Bank of New York Mellon under a custody agreement for providing custodial services for the fund. These fees are determined based on net assets, geographic region and transaction activity. During the period ended August 31, 2015, the fund was charged $21,843 pursuant to the custody agreement.
During the period ended August 31, 2015, the fund was charged $10,965 for services performed by the Chief Compliance Officer and his staff.
The components of “Due to The Dreyfus Corporation and affiliates” in the Statement of Assets and Liabilities consist of: management fees $169,924, Distribution Plan fees $22,290, Shareholder Services Plan fees $35,217, custodian fees $10,855, Chief Compliance Officer fees $1,737 and transfer agency fees $11,143, which are offset against an expense reimbursement currently in effect in the amount of $15,072.
(d) Each Board member also serves as a Board member of other funds within the Dreyfus complex. Annual retainer fees and attendance fees are allocated to each fund based on net assets.
NOTE 4—Securities Transactions:
The aggregate amount of purchases and sales of investment securities, excluding short-term securities, during the period ended August 31, 2015, amounted to $212,981,188 and $199,963,611, respectively.
28
At August 31, 2015, the cost of investments for federal income tax purposes was $253,868,424; accordingly, accumulated net unrealized appreciation on investments was $6,194,569, consisting of $28,959,181 gross unrealized appreciation and $22,764,612 gross unrealized depreciation.
29
REPORT OF INDEPENDENT REGISTERED
PUBLIC ACCOUNTING FIRM
Shareholders and Board of Directors
Dreyfus Structured Midcap Fund
We have audited the accompanying statement of assets and liabilities, including the statement of investments, of Dreyfus Structured Midcap Fund (one of the series comprising Advantage Funds, Inc.) as of August 31, 2015, and the related statement of operations for the year then ended, the statement of changes in net assets for each of the two years in the period then ended, and the financial highlights for each of the periods indicated therein. These financial statements and financial highlights are the responsibility of the Fund’s management. Our responsibility is to express an opinion on these financial statements and financial highlights based on our audits.
We conducted our audits in accordance with the standards of the Public Company Accounting Oversight Board (United States). Those standards require that we plan and perform the audit to obtain reasonable assurance about whether the financial statements and financial highlights are free of material misstatement. We were not engaged to perform an audit of the Fund’s internal control over financial reporting. Our audits included consideration of internal control over financial reporting as a basis for designing audit procedures that are appropriate in the circumstances, but not for the purpose of expressing an opinion on the effectiveness of the Fund’s internal control over financial reporting. Accordingly, we express no such opinion. An audit also includes examining, on a test basis, evidence supporting the amounts and disclosures in the financial statements and financial highlights, assessing the accounting principles used and significant estimates made by management, and evaluating the overall financial statement presentation. Our procedures included confirmation of securities owned as of August 31, 2015 by correspondence with the custodian and others. We believe that our audits provide a reasonable basis for our opinion.
In our opinion, the financial statements and financial highlights referred to above present fairly, in all material respects, the financial position of Dreyfus Structured Midcap Fund at August 31, 2015, the results of its operations for the year then ended, the changes in its net assets for each of the two years in the period then ended, and the financial highlights for each of the indicated periods, in conformity with U.S. generally accepted accounting principles.

New York, New York
October 28, 2015
30
IMPORTANT TAX INFORMATION (Unaudited)
For federal tax purposes, the fund hereby reports 100% of the ordinary dividends paid during the fiscal year ended August 31, 2015 as qualifying for the corporate dividends received deduction. Also, certain dividends paid by the fund may be subject to a maximum tax rate of 15%, as provided for by the Jobs and Growth Tax Relief Reconciliation Act of 2003. Of the distributions paid during the fiscal year, $1,346,705 represents the maximum amount that may be considered qualified dividend income. The fund also hereby reports $.1320 per share as a short-term capital gain distribution and $3.8952 per share as a long-term capital gain distribution paid on December 11, 2014. Shareholders will receive notification in early 2016 of the percentage applicable to the preparation of their 2015 income tax returns.
31
INFORMATION ABOUT THE RENEWAL OF THE FUND'S MANAGEMENT AND SUB-INVESTMENT ADVISORY AGREEMENTS (Unaudited)
At a meeting of the fund’s Board of Directors held on March 11-12, 2015, the Board considered the renewal of the fund’s Management Agreement, pursuant to which Dreyfus provides the fund with investment advisory and administrative services (the “Agreement”), and the Sub-Investment Advisory Agreement (together, the “Agreements”), pursuant to which Mellon Capital Management Corporation (the “Subadviser”) provides day-to-day management of the fund’s investments. The Board members, none of whom are “interested persons” (as defined in the Investment Company Act of 1940, as amended) of the fund, were assisted in their review by independent legal counsel and met with counsel in executive session separate from representatives of Dreyfus and the Subadviser. In considering the renewal of the Agreements, the Board considered all factors that it believed to be relevant, including those discussed below. The Board did not identify any one factor as dispositive, and each Board member may have attributed different weights to the factors considered.
Analysis of Nature, Extent, and Quality of Services Provided to the Fund. The Board considered information provided to them at the meeting and in previous presentations from Dreyfus representatives regarding the nature, extent, and quality of the services provided to funds in the Dreyfus fund complex. Dreyfus provided the number of open accounts in the fund, the fund’s asset size and the allocation of fund assets among distribution channels. Dreyfus also had previously provided information regarding the diverse intermediary relationships and distribution channels of funds in the Dreyfus fund complex (such as retail direct or intermediary, in which intermediaries typically are paid by the fund and/or Dreyfus) and Dreyfus’ corresponding need for broad, deep, and diverse resources to be able to provide ongoing shareholder services to each intermediary or distribution channel, as applicable to the fund.
The Board also considered research support available to, and portfolio management capabilities of, the fund’s portfolio management personnel and that Dreyfus also provides oversight of day-to-day fund operations, including fund accounting and administration and assistance in meeting legal and regulatory requirements. The Board also considered Dreyfus’ extensive administrative, accounting, and compliance infrastructures, as well as Dreyfus’ supervisory activities over the Subadviser. The Board also considered portfolio management’s brokerage policies and practices (including policies and practices regarding soft dollars) and the standards applied in seeking best execution.
Comparative Analysis of the Fund’s Performance and Management Fee and Expense Ratio. The Board reviewed reports prepared by Lipper, Inc. (“Lipper”), an independent provider of investment company data, which included information comparing (1) the fund’s performance with the performance of a group of comparable funds (the “Performance Group”) and with a broader group of funds (the “Performance Universe”), all for various periods ended December 31, 2014, and (2) the fund’s actual and contractual management fees and total expenses with those of a group of
32
comparable funds (the “Expense Group”) and with a broader group of funds (the “Expense Universe”), the information for which was derived in part from fund financial statements available to Lipper as of the date of its analysis. Dreyfus previously had furnished the Board with a description of the methodology Lipper used to select the Performance Group and Performance Universe and the Expense Group and Expense Universe.
Dreyfus representatives stated that the usefulness of performance comparisons may be affected by a number of factors, including different investment limitations that may be applicable to the fund and comparison funds. The Board discussed the results of the comparisons and noted that the fund’s total return performance was above the Performance Group and Performance Universe medians for all periods. Dreyfus also provided a comparison of the fund’s calendar year total returns to the returns of the fund’s benchmark index.
The Board also reviewed the range of actual and contractual management fees and total expenses of the Expense Group and Expense Universe funds and discussed the results of the comparisons. The Board noted that the fund’s contractual management fee was below the Expense Group median and the fund’s actual management fee and total expenses were below the Expense Group and Expense Universe medians.
Dreyfus representatives noted that Dreyfus has contractually agreed to waive receipt of its fees and/or assume the expenses of the fund, until January 1, 2016, so that annual direct fund operating expenses (excluding Rule 12b-1 fees, shareholder services fees, taxes, interest, brokerage commissions, commitment fees on borrowings, acquired fund fees and extraordinary expenses) do not exceed 1.00% of the fund’s average daily net assets.
Dreyfus representatives reviewed with the Board the management or investment advisory fees (1) paid by funds advised or administered by Dreyfus that are in the same Lipper category as the fund and (2) paid to Dreyfus or the Subadviser or its affiliates for advising any separate accounts and/or other types of client portfolios that are considered to have similar investment strategies and policies as the fund (the “Similar Clients”), and explained the nature of the Similar Clients. They discussed differences in fees paid and the relationship of the fees paid in light of any differences in the services provided and other relevant factors. The Board considered the relevance of the fee information provided for the Similar Clients to evaluate the appropriateness and reasonableness of the fund’s management fee.
The Board considered the fee to the Subadviser in relation to the fee paid to Dreyfus by the fund and the respective services provided by the Subadviser and Dreyfus. The Board also noted the Subadviser’s fee is paid by Dreyfus (out of its fee from the fund) and not the fund.
Analysis of Profitability and Economies of Scale. Dreyfus representatives reviewed the expenses allocated and profit received by Dreyfus and its affiliates and the resulting
33
INFORMATION ABOUT THE RENEWAL OF THE FUND'S MANAGEMENT AND SUB-INVESTMENT ADVISORY AGREEMENTS (Unaudited) (continued)
profitability percentage for managing the fund and the aggregate profitability percentage to Dreyfus and its affiliates for managing the funds in the Dreyfus fund complex, and the method used to determine the expenses and profit. The Board concluded that the profitability results were not unreasonable, given the services rendered and service levels provided by Dreyfus. The Board also had been provided with information prepared by an independent consulting firm regarding Dreyfus’ approach to allocating costs to, and determining the profitability of, individual funds and the entire Dreyfus fund complex. The consulting firm also had analyzed where any economies of scale might emerge in connection with the management of a fund.
The Board considered on the advice of its counsel the profitability analysis (1) as part of its evaluation of whether the fees under the Agreements bear a reasonable relationship to the mix of services provided by Dreyfus and the Subadviser, including the nature, extent and quality of such services, and (2) in light of the relevant circumstances for the fund and the extent to which economies of scale would be realized if the fund grows and whether fee levels reflect these economies of scale for the benefit of fund shareholders. Since Dreyfus, and not the fund, pays the Subadviser pursuant to the Sub-Investment Advisory Agreement, the Board did not consider the Subadviser’s profitability to be relevant to its deliberations. Dreyfus representatives noted that a discussion of economies of scale is predicated on a fund having achieved a substantial size with increasing assets and that, if a fund’s assets had been stable or decreasing, the possibility that Dreyfus may have realized any economies of scale would be less. Dreyfus representatives also noted that, as a result of shared and allocated costs among funds in the Dreyfus fund complex, the extent of economies of scale could depend substantially on the level of assets in the complex as a whole, so that increases and decreases in complex-wide assets can affect potential economies of scale in a manner that is disproportionate to, or even in the opposite direction from, changes in the fund’s asset level. The Board also considered potential benefits to Dreyfus and the Subadviser from acting as investment adviser and sub-investment adviser, respectively, and noted the soft dollar arrangements in effect for trading the fund’s investments.
At the conclusion of these discussions, the Board agreed that it had been furnished with sufficient information to make an informed business decision with respect to the renewal of the Agreements. Based on the discussions and considerations as described above, the Board concluded and determined as follows:
· The Board concluded that the nature, extent and quality of the services provided by Dreyfus and the Subadviser are adequate and appropriate.
· The Board was satisfied with the fund’s performance.
· The Board concluded that the fees paid to Dreyfus and the Subadviser were reasonable in light of the considerations described above.
34
· The Board determined that the economies of scale which may accrue to Dreyfus and its affiliates in connection with the management of the fund had been adequately considered by Dreyfus in connection with the fee rate charged to the fund pursuant to the Agreement and that, to the extent in the future it were determined that material economies of scale had not been shared with the fund, the Board would seek to have those economies of scale shared with the fund.
In evaluating the Agreements, the Board considered these conclusions and determinations and also relied on its previous knowledge, gained through meetings and other interactions with Dreyfus and its affiliates and the Subadviser, of the fund and the services provided to the fund by Dreyfus and the Subadviser. The Board also relied on information received on a routine and regular basis throughout the year relating to the operations of the fund and the investment management and other services provided under the Agreements, including information on the investment performance of the fund in comparison to similar mutual funds and benchmark performance indices; general market outlook as applicable to the fund; and compliance reports. In addition, the Board’s consideration of the contractual fee arrangements for this fund had the benefit of a number of years of reviews of prior or similar agreements during which lengthy discussions took place between the Board and Dreyfus representatives. Certain aspects of the arrangements may receive greater scrutiny in some years than in others, and the Board’s conclusions may be based, in part, on their consideration of the same or similar arrangements in prior years. The Board determined to renew the Agreements.
35
BOARD MEMBERS INFORMATION (Unaudited)
INDEPENDENT BOARD MEMBERS
Joseph S. DiMartino (71)
Chairman of the Board (1995)
Principal Occupation During Past 5 Years:
· Corporate Director and Trustee (1995-present)
Other Public Company Board Memberships During Past 5 Years:
· CBIZ (formerly, Century Business Services, Inc.), a provider of outsourcing functions for small and medium size companies, Director (1997-present)
· The Newark Group, a provider of a national market of paper recovery facilities, paperboard mills and paperboard converting plants, Director (2000-2010)
No. of Portfolios for which Board Member Serves: 144
———————
Peggy C. Davis (72)
Board Member (2006)
Principal Occupation During Past 5 Years:
· Shad Professor of Law, New York University School of Law (1983-present)
No. of Portfolios for which Board Member Serves: 51
———————
David P. Feldman (75)
Board Member (1996)
Principal Occupation During Past 5 Years:
· Corporate Director and Trustee (1985-present)
Other Public Company Board Memberships During Past 5 Years:
· BBH Mutual Funds Group (5 registered mutual funds), Director (1992-2014)
No. of Portfolios for which Board Member Serves: 37
———————
Ehud Houminer (75)
Board Member (1993)
Principal Occupation During Past 5 Years:
· Executive-in-Residence at the Columbia Business School, Columbia University (1992-present)
Other Public Company Board Memberships During Past 5 Years:
· Avnet, Inc., an electronics distributor, Director (1993-2012)
No. of Portfolios for which Board Member Serves: 62
———————
36
Lynn Martin (75)
Board Member (2012)
Principal Occupation During Past 5 Years:
· President of The Martin Hall Group LLC, a human resources consulting firm (2005-2012)
Other Public Company Board Memberships During Past 5 Years:
· AT&T, Inc., a telecommunications company, Director (1999-2012)
· Ryder System, Inc., a supply chain and transportation management company, Director (1993-2012)
No. of Portfolios for which Board Member Serves: 37
———————
Robin A. Melvin (51)
Board Member (2012)
Principal Occupation During Past 5 Years:
· Co-chairman, Illinois Mentoring Partnership, non-profit organization dedicated to increasing the quantity and quality of mentoring services in Illinois; (2014-present; a board member since 2013)
· Director, Boisi Family Foundation, a private family foundation that supports youth-serving organizations that promote the self sufficiency of youth from disadvantaged circumstances (1995-2012)
No. of Portfolios for which Board Member Serves: 114
———————
Dr. Martin Peretz (76)
Board Member (2006)
Principal Occupation During Past 5 Years:
· Editor-in-Chief Emeritus of The New Republic Magazine (2011-2012) (previously, Editor-in-Chief, 1974-2011)
· Director of TheStreet.com, a financial information service on the web (1996-2010)
· Lecturer at Harvard University (1969-2012)
No. of Portfolios for which Board Member Serves: 37
———————
Once elected all Board Members serve for an indefinite term, but achieve Emeritus status upon reaching age 80. The address of the Board Members and Officers is c/o The Dreyfus Corporation, 200 Park Avenue, New York, New York 10166. Additional information about the Board Members is available in the fund's Statement of Additional Information which can be obtained from Dreyfus free of charge by calling this toll free number: 1-800-DREYFUS.
James F. Henry, Emeritus Board Member
Dr. Paul A. Marks, Emeritus Board Member
Philip L. Toia, Emeritus Board Member
37
OFFICERS OF THE FUND (Unaudited)
BRADLEY J. SKAPYAK, President since January 2010.
Chief Operating Officer and a director of the Manager since June 2009, Chairman of Dreyfus Transfer, Inc., an affiliate of the Manager and the transfer agent of the funds, since May 2011 and Executive Vice President of the Distributor since June 2007. From April 2003 to June 2009, Mr. Skapyak was the head of the Investment Accounting and Support Department of the Manager. He is an officer of 69 investment companies (comprised of 144 portfolios) managed by the Manager. He is 56 years old and has been an employee of the Manager since February 1988.
BENNETT A. MACDOUGALL, Chief Legal Officer since October 2015.
Chief Legal Officer of the Manager since June 2015; from June 2005 to June 2015, Director and Associate General Counsel of Deutsche Bank – Asset & Wealth Management Division, and Chief Legal Officer of Deutsche Investment Management Americas Inc. He is an officer of 70 investment companies (comprised of 169 portfolios) managed by the Manager. He is 44 years old and has been an employee of the Manager since June 2015.
JANETTE E. FARRAGHER, Vice President and Secretary since December 2011.
Assistant General Counsel of BNY Mellon, and an officer of 70 investment companies (comprised of 169 portfolios) managed by the Manager. She is 52 years old and has been an employee of the Manager since February 1984.
JAMES BITETTO, Vice President and Assistant Secretary since August 2005.
Managing Counsel of BNY Mellon and Secretary of the Manager, and an officer of 70 investment companies (comprised of 169 portfolios) managed by the Manager. He is 49 years old and has been an employee of the Manager since December 1996.
JONI LACKS CHARATAN, Vice President and Assistant Secretary since August 2005.
Managing Counsel of BNY Mellon, and an officer of 70 investment companies (comprised of 169 portfolios) managed by the Manager. She is 59 years old and has been an employee of the Manager since October 1988.
JOSEPH M. CHIOFFI, Vice President and Assistant Secretary since August 2005.
Managing Counsel of BNY Mellon, and an officer of 70 investment companies (comprised of 169 portfolios) managed by the Manager. He is 53 years old and has been an employee of the Manager since June 2000.
JOHN B. HAMMALIAN, Vice President and Assistant Secretary since August 2005.
Senior Managing Counsel of BNY Mellon, and an officer of 70 investment companies (comprised of 169 portfolios) managed by the Manager. He is 52 years old and has been an employee of the Manager since February 1991.
MAUREEN E. KANE, Vice President and Assistant Secretary since April 2015.
Managing Counsel of BNY Mellon since July 2014; from October 2004 until July 2014, General Counsel, and from May 2009 until July 2014, Chief Compliance Officer of Century Capital Management. She is an officer of 70 investment companies (comprised of 169 portfolios) managed by the Manager. She is 53 years old and has been an employee of the Manager since July 2014.
SARAH S. KELLEHER, Vice President and Assistant Secretary since April 2014.
Senior Counsel of BNY Mellon, and an officer of 70 investment companies (comprised of 169 portfolios) managed by the Manager; from August 2005 to March 2013, Associate General Counsel of Third Avenue Management. She is 39 years old and has been an employee of the Manager since March 2013.
JEFF PRUSNOFSKY, Vice President and Assistant Secretary since August 2005.
Senior Managing Counsel of BNY Mellon, and an officer of 70 investment companies (comprised of 169 portfolios) managed by the Manager. He is 50 years old and has been an employee of the Manager since October 1990.
JAMES WINDELS, Treasurer since November 2001.
Director – Mutual Fund Accounting of the Manager, and an officer of 70 investment companies (comprised of 169 portfolios) managed by the Manager. He is 56 years old and has been an employee of the Manager since April 1985.
38
RICHARD CASSARO, Assistant Treasurer since January 2008.
Senior Accounting Manager – Money Market and Municipal Bond Funds of the Manager, and an officer of 70 investment companies (comprised of 169 portfolios) managed by the Manager. He is 56 years old and has been an employee of the Manager since September 1982.
GAVIN C. REILLY, Assistant Treasurer since December 2005.
Tax Manager of the Investment Accounting and Support Department of the Manager, and an officer of 70 investment companies (comprised of 169 portfolios) managed by the Manager. He is 47 years old and has been an employee of the Manager since April 1991.
ROBERT S. ROBOL, Assistant Treasurer since August 2005.
Senior Accounting Manager – Fixed Income Funds of the Manager, and an officer of 70 investment companies (comprised of 169 portfolios) managed by the Manager. He is 51 years old and has been an employee of the Manager since October 1988.
ROBERT SALVIOLO, Assistant Treasurer since July 2007.
Senior Accounting Manager – Equity Funds of the Manager, and an officer of 70 investment companies (comprised of 169 portfolios) managed by the Manager. He is 48 years old and has been an employee of the Manager since June 1989.
ROBERT SVAGNA, Assistant Treasurer since August 2005.
Senior Accounting Manager – Equity Funds of the Manager, and an officer of 70 investment companies (comprised of 169 portfolios) managed by the Manager. He is 48 years old and has been an employee of the Manager since November 1990.
JOSEPH W. CONNOLLY, Chief Compliance Officer since October 2004.
Chief Compliance Officer of the Manager and The Dreyfus Family of Funds (70 investment companies, comprised of 169 portfolios). He is 58 years old and has served in various capacities with the Manager since 1980, including manager of the firm’s Fund Accounting Department from 1997 through October 2001.
39
NOTES
40
NOTES
41
Dreyfus Structured Midcap Fund
200 Park Avenue
New York, NY 10166
Manager
The Dreyfus Corporation
200 Park Avenue
New York, NY 10166
Sub-Investment Adviser
Mellon Capital Management Corporation
50 Fremont Street, Suite 3900
San Francisco, CA 94105
Custodian
The Bank of New York Mellon
225 Liberty Street
New York, NY 10286
Transfer Agent &
Dividend Disbursing Agent
Dreyfus Transfer, Inc.
200 Park Avenue
New York, NY 10166
Distributor
MBSC Securities Corporation
200 Park Avenue
New York, NY 10166
| | |
Ticker Symbols: | Class A: DPSAX Class C: DPSCX Class I: DPSRX Class Y: DPSYX |
Telephone Call your financial representative or 1-800-DREYFUS
Mail The Dreyfus Family of Funds, 144 Glenn Curtiss Boulevard, Uniondale, NY 11556-0144
E-mail Send your request to info@dreyfus.com
Internet Information can be viewed online or downloaded at www.dreyfus.com
The fund files its complete schedule of portfolio holdings with the Securities and Exchange Commission (“SEC”) for the first and third quarters of each fiscal year on Form N-Q. The fund’s Forms N-Q are available on the SEC’s website at www.sec.gov and may be reviewed and copied at the SEC’s Public Reference Room in Washington, DC. (phone 1-800-SEC-0330 for information).
Information regarding how the fund voted proxies related to portfolio securities for the most recent 12-month period ended June 30 is available at www.dreyfus.com and on the SEC’s website at www.sec.gov and without charge, upon request, by calling 1-800-DREYFUS.
| | |
© 2015 MBSC Securities Corporation | 
0936AR0815 |
Dreyfus Technology Growth Fund
| | | |

| | ANNUAL REPORT
August 31, 2015 |
| |
Save time. Save paper. View your next shareholder report online as soon as it’s available. Log into www.dreyfus.com and sign up for Dreyfus eCommunications. It’s simple and only takes a few minutes. |
| |
The views expressed in this report reflect those of the portfolio manager only through the end of the period covered and do not necessarily represent the views of Dreyfus or any other person in the Dreyfus organization. Any such views are subject to change at any time based upon market or other conditions and Dreyfus disclaims any responsibility to update such views. These views may not be relied on as investment advice and, because investment decisions for a Dreyfus fund are based on numerous factors, may not be relied on as an indication of trading intent on behalf of any Dreyfus fund. |
| |
Not FDIC-Insured • Not Bank-Guaranteed • May Lose Value |
Contents
T H E F U N D
F O R M O R E I N F O R M AT I O N
Back Cover
| | | | |
| |
Dreyfus Technology Growth Fund
| | The Fund |
A LETTER FROM THE PRESIDENT
Dear Shareholder:
We are pleased to present this annual report for Dreyfus Technology Growth Fund, covering the 12-month period from September 1, 2014, through August 31, 2015. For information about how the fund performed during the reporting period, as well as general market perspectives, we provide a Discussion of Fund Performance on the pages that follow.
Financial markets proved volatile over the reporting period. For much of the year, a recovering U.S. economy enabled stocks to advance, but those gains were more than erased in August when economic concerns in China, falling commodity prices and a stronger U.S. dollar sparked sharp corrections in equity markets throughout the world. The emerging markets were especially hard hit in this environment. U.S. bonds generally fared better, rallying in late 2014 due to robust investor demand before reversing course in the spring as the domestic economy strengthened. Global economic instability in August hurt corporate-backed and inflation-linked bonds, but U.S. government securities held up relatively well.
We expect market uncertainty and volatility to persist over the near term as investors vacillate between hopes that current market turmoil represents a healthy correction and fears that further disappointments could trigger a full-blown bear market. Our investment strategists and portfolio managers are monitoring developments carefully, keeping a close watch on Chinese fiscal and monetary policy, liquidity factors affecting various asset classes, and other developments that could influence investor sentiment. Over the longer term, we remain confident that financial markets are likely to stabilize as the world adjusts to slower Chinese economic growth, abundant energy resources, and the anticipated eventual normalization of monetary policy. In our view, investors will continue to be well served under these circumstances by a long-term perspective and a disciplined investment approach.
Thank you for your continued confidence and support.
Sincerely,

J. Charles Cardona
President
The Dreyfus Corporation
September 15, 2015
2
DISCUSSION OF FUND PERFORMANCE
For the period of September 1, 2014, through August 31, 2015, as provided by Barry K. Mills, CFA, Portfolio Manager
Fund and Market Performance Overview
For the 12-month period ended August 31, 2015, Dreyfus Technology Growth Fund’s Class A shares produced a total return of 1.40%, Class C shares returned 0.61%, and Class I shares returned 1.69%.1 In comparison, the fund’s benchmarks, the Morgan Stanley High Technology 35 Index (“MS High Tech 35 Index”) and the Standard & Poor’s 500® Composite Stock Price Index (“S&P 500 Index”), produced total returns of 3.11% and 0.48%, respectively, over the same period.2,3
U.S. equities encountered heightened volatility as investors reacted to shifting domestic and global economic developments. Increased corporate spending on software and enterprise services generally helped technology stocks outperform broader market averages. The fund benefited from the technology sector’s relative strength, outperforming the S&P 500 Index. However, the fund lagged the MS High Tech 35 Index, primarily due to disappointing timing of a few key trades.
The Fund’s Investment Approach
The fund seeks capital appreciation by investing in growth companies of any size that we regard as leading producers or beneficiaries of technological innovation. The fund’s investment process centers on a multi-dimensional approach that looks for opportunities across emerging growth, cyclical, or stable growth companies. The fund seeks companies that appear to have strong earnings momentum, positive earnings revisions, favorable growth, product or market cycles, and/or favorable valuations.
Macroeconomic Developments Drove Market Performance
The reporting period began in the midst of renewed concerns about domestic and global economic growth, which drove U.S. equity markets lower in September and early October 2014. Ongoing employment gains, better consumer confidence, and improved business sentiment prompted a quick market recovery, and the S&P 500 Index climbed to a series of new record highs through the end of February 2015.
Investors responded negatively in March to sluggish economic growth stemming from severe winter weather, an appreciating U.S. dollar, and disappointing corporate revenues, but the U.S. economy appeared to regain traction in the spring, and stocks resumed their advance. However, uncertainty regarding a debt crisis in Greece and slowing economic growth in China again sent U.S. stock prices lower over the summer. In mid-August, the Chinese central bank unexpectedly devalued the country’s currency, raising concerns that the world’s second largest economy could be slowing more than anticipated. In response, the S&P 500 Index dipped sharply into negative territory before partially recovering in the closing days of the reporting period.
Although information technology stocks fell more steeply than the broader market in October 2014 and August 2015, they generally outperformed broader market averages for the reporting period overall. Widely publicized security breaches of corporate computer systems put a spotlight on enterprise security spending, while capital spending trends in
3
DISCUSSION OF FUND PERFORMANCE (continued)
other segments of the technology sector proved favorable as businesses sought to upgrade aging software and systems.
Good Stock Selections, But Unfortunate Timing
Security-related holdings — such as Fortinet and Palo Alto Networks — contributed significantly to the fund’s performance, as business customers responded to a wave of security breaches. In the cloud computing area, salesforce.com and ServiceNow gained ground when growing numbers of enterprises shifted to remote storage of important data and applications. Social media leader Facebook advanced as the company continued to make progress in monetizing its user base. Consumer products giant Apple continued to bring highly sought, mobility-enhancing products to market while aggressively buying back its own shares. Other significant contributors to the fund’s performance included business and expense management firm Concur Technologies, which received a takeover bid in early September 2014 at a significant premium to its stock price at the time, and electronic payment processer Visa, which expanded its global market share.
On a more negative note, most of the fund’s underperformance relative to its benchmark was attributable to the unfortunate timing of our trade of media content provider Netflix. We sold the fund’s position after the company reported slower-than-expected global subscriber growth in late 2014, and the fund held no exposure when the stock rebounded in 2015. Likewise, disappointing timing undermined relative returns from networking hardware maker Juniper Networks and database software giant Oracle. Other relatively weak holdings during the reporting period included Google, Amazon.com, and LinkedIn, which were undermined by shifts in market sentiment apparently unrelated to company fundamentals.
Focused on Key Investment Themes
As of the end of the reporting period, the themes of cybersecurity, cloud computing, social networking, and mobility remain central to the fund’s investment strategy. Technology spending trends have remained positive in each of these areas in the United States, with improvements likely in other parts of the world when economic conditions stabilize. At the same time, we are continually reevaluating the fund’s lack of exposure to legacy areas of the technology sector, such as personal computers and communications equipment, where a cyclical bottom may soon set the stage for a potential rebound.
September 15, 2015
Please note, the position in any security highlighted with italicized typeface was sold during the reporting period.
Equity funds are subject generally to market, market sector, market liquidity, issuer, and investment style risks, among other factors, to varying degrees, all of which are more fully described in the fund’s prospectus.
The technology sector has been among the most volatile sectors of the stock market. Technology companies involve greater risk because their revenue and/or earnings tend to be less predictable, and some companies may be experiencing significant losses.
1 Total return includes reinvestment of dividends and any capital gains paid, and does not take into consideration the maximum initial sales charge in the case of Class A shares, or the applicable contingent deferred sales charge imposed on redemptions in the case of Class C shares. Had these charges been reflected, returns would have been lower. Past performance is no guarantee of future results. Share price, yield, and investment return fluctuate such that upon redemption, fund shares may be worth more or less than their original cost.
2 SOURCE: BLOOMBERG L.P. — Reflects reinvestment of net dividends and, where applicable, capital gain distributions. The Morgan Stanley High Technology 35 Index is an unmanaged, equal dollar-weighted index of 35 stocks from the electronics-based subsectors. The index does not take into account fees and expenses to which the fund is subject. Investors cannot invest directly in any index.
4
3 SOURCE: LIPPER INC. — Reflects monthly reinvestment of dividends and, where applicable, capital gain distributions. The Standard & Poor’s 500® Composite Stock Price Index is a widely accepted, unmanaged index of U.S. stock market performance. The index does not take into account fees and expenses to which the fund is subject. Investors cannot invest directly in any index.
5
FUND PERFORMANCE
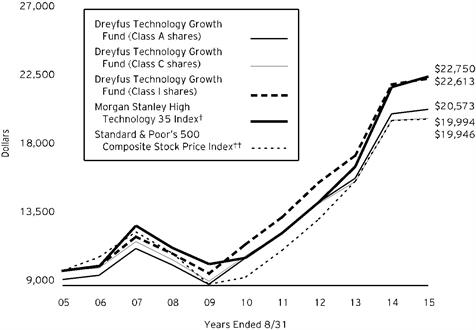
Comparison of change in value of $10,000 investment in Dreyfus Technology Growth Fund Class A shares, Class C shares and Class I shares with the Morgan Stanley High Technology 35 Index and the Standard & Poor's 500 Composite Stock Price Index
† Source: Bloomberg L.P.
†† Source: Lipper Inc.
Past performance is not predictive of future performance.
The above graph compares a $10,000 investment made in each of the Class A, Class C and Class I shares of Dreyfus Technology Growth Fund on 8/31/05 to a $10,000 investment made in each of the Standard & Poor’s 500 Composite Stock Price Index (the “S&P 500 Index”) and the Morgan Stanley High Technology 35 Index (the “MS High Tech 35 Index”) on that date. All dividends and capital gain distributions are reinvested.
The fund’s performance shown in the line graph above takes into account the maximum initial sales charge on Class A shares and all other applicable fees and expenses on all classes. The S&P 500 Index is a widely accepted, unmanaged index of U.S. stock market performance. The MS High Tech 35 Index reflects reinvestment of net dividends and, where applicable, capital gain distributions. The MS High Tech 35 Index is an unmanaged, equal dollar-weighted index from the electronics-based subsectors. Unlike a mutual fund, the indices are not subject to charges, fees and other expenses. Investors cannot invest directly in any index. Further information relating to fund performance, including expense reimbursements, if applicable, is contained in the Financial Highlights section of the prospectus and elsewhere in this report.
6
| | | | |
Average Annual Total Returns as of 8/31/15 | | | |
| 1 Year | 5 Years | 10 Years |
Class A shares | | | |
with maximum sales charge (5.75%) | -4.44% | 12.35% | 7.48% |
without sales charge | 1.40% | 13.69% | 8.12% |
Class C shares | | | |
with applicable redemption charge † | -0.20% | 12.75% | 7.17% |
without redemption | 0.61% | 12.75% | 7.17% |
Class I shares | 1.69% | 14.03% | 8.50% |
Morgan Stanley High Technology 35 Index | 3.11% | 15.94% | 8.56% |
Standard & Poor's 500 Composite Stock Price Index | 0.48% | 15.86% | 7.15% |
Past performance is not predictive of future performance. The fund’s performance shown in the graph and table does not reflect the deduction of taxes that a shareholder would pay on fund distributions or the redemption of fund shares. In addition to the performance of Class A shares shown with and without a maximum sales charge, the fund’s performance shown in the table takes into account all other applicable fees and expenses on all classes.
† The maximum contingent deferred sales charge for Class C shares is 1% for shares redeemed within one year of the date of purchase.
7
UNDERSTANDING YOUR FUND’S EXPENSES (Unaudited)
As a mutual fund investor, you pay ongoing expenses, such as management fees and other expenses. Using the information below, you can estimate how these expenses affect your investment and compare them with the expenses of other funds. You also may pay one-time transaction expenses, including sales charges (loads) and redemption fees, which are not shown in this section and would have resulted in higher total expenses. For more information, see your fund’s prospectus or talk to your financial adviser.
Review your fund’s expenses
The table below shows the expenses you would have paid on a $1,000 investment in Dreyfus Technology Growth Fund from March 1, 2015 to August 31, 2015. It also shows how much a $1,000 investment would be worth at the close of the period, assuming actual returns and expenses.
| | | | | | | | |
Expenses and Value of a $1,000 Investment | | |
assuming actual returns for the six months ended August 31, 2015 |
| | | | | | | | |
| | | | Class A | Class C | Class I | |
Expenses paid per $1,000† | $ 6.24 | $ 10.21 | $ 4.97 | |
Ending value (after expenses) | $950.60 | $946.90 | $952.00 | |
COMPARING YOUR FUND’S EXPENSES
WITH THOSE OF OTHER FUNDS (Unaudited)
Using the SEC’s method to compare expenses
The Securities and Exchange Commission (SEC) has established guidelines to help investors assess fund expenses. Per these guidelines, the table below shows your fund’s expenses based on a $1,000 investment, assuming a hypothetical 5% annualized return. You can use this information to compare the ongoing expenses (but not transaction expenses or total cost) of investing in the fund with those of other funds. All mutual fund shareholder reports will provide this information to help you make this comparison. Please note that you cannot use this information to estimate your actual ending account balance and expenses paid during the period.
| | | | | | | | |
Expenses and Value of a $1,000 Investment | | |
assuming a hypothetical 5% annualized return for the six months ended August 31, 2015 |
| | | | | | | | |
| | | | Class A | Class C | Class I | |
Expenses paid per $1,000† | $ 6.46 | $ 10.56 | $ 5.14 | |
Ending value (after expenses) | $1,018.80 | $1,014.72 | $1,020.11 | |
† Expenses are equal to the fund's annualized expense ratio of 1.27% for Class A, 2.08% for Class C and 1.01% for Class I, multiplied by the average account value over the period, multiplied by 184/365 (to reflect the one-half year period).
8
STATEMENT OF INVESTMENTS
August 31, 2015
||ANAME||
| | | | | | | | | |
Common Stocks - 97.7% | | Shares | | Value ($) | |
Communications Equipment - 11.9% | | | | | |
Apple | | 91,182 | | 10,281,682 | |
Cisco Systems | | 374,890 | | 9,702,153 | |
Fortinet | | 119,737 | a | 5,045,717 | |
Palo Alto Networks | | 36,480 | a | 5,990,746 | |
| | | | | 31,020,298 | |
Electronic Equipment & Instruments - 8.7% | | | | | |
Amphenol Cl. A | | 165,250 | | 8,652,490 | |
Mobileye | | 98,631 | | 5,578,569 | |
Tesla Motors | | 33,303 | a | 8,294,445 | |
| | | | | 22,525,504 | |
Internet & Catalog Retail - 8.8% | | | | | |
Amazon.com | | 29,741 | a | 15,253,862 | |
Priceline Group | | 6,159 | a | 7,690,374 | |
| | | | | 22,944,236 | |
Internet Software & Services - 20.1% | | | | | |
Akamai Technologies | | 120,610 | a | 8,600,699 | |
Facebook, Cl. A | | 167,570 | a | 14,985,785 | |
Google Cl. A | | 10,248 | a | 6,638,859 | |
Google, Cl. C | | 14,715 | a | 9,097,549 | |
LinkedIn, Cl. A | | 45,360 | a | 8,192,016 | |
Tencent Holdings | | 282,200 | | 4,796,685 | |
| | | | | 52,311,593 | |
IT Services - 12.3% | | | | | |
Cognizant Technology Solutions, Cl. A | | 204,830 | a | 12,892,000 | |
Paychex | | 116,330 | | 5,195,298 | |
Visa, Cl. A | | 192,691 | | 13,738,868 | |
| | | | | 31,826,166 | |
Semiconductors & Semiconductor Equipment - 10.9% | | | | | |
Avago Technologies | | 72,337 | | 9,112,292 | |
Cavium | | 75,574 | a | 5,140,543 | |
Microchip Technology | | 124,210 | | 5,278,925 | |
NXP Semiconductors | | 103,612 | a | 8,770,756 | |
| | | | | 28,302,516 | |
Software - 25.0% | | | | | |
Adobe Systems | | 146,550 | a | 11,514,434 | |
Cerner | | 115,026 | a | 7,104,006 | |
Citrix Systems | | 120,334 | a | 8,195,949 | |
Oracle | | 274,747 | | 10,190,366 | |
salesforce.com | | 165,759 | a | 11,497,044 | |
9
STATEMENT OF INVESTMENTS (continued)
| | | | | | | | | | | | | | |
Common Stocks - 97.7% (continued) | | Shares | | Value ($) | |
Software - 25.0% (continued) | | | | | |
ServiceNow | | 73,124 | a | 5,188,879 | |
Splunk | | 86,652 | a | 5,369,824 | |
Workday, Cl. A | | 86,797 | a | 6,098,357 | |
| | | | | 65,158,859 | |
Total Common Stocks (cost $198,999,086) | | | | 254,089,172 | |
Limited Partnership Interests - .2% | | | | | |
Semiconductors & Semiconductor Equipment - .2% | | | | | |
Bluestream Ventures LP a,b,c | | | | 436,594 | |
(cost $1,030,996) | | | | | |
Other Investments - 3.2% | | | | | |
Registered Investment Company; | | | | | |
Dreyfus Institutional Preferred Plus Money Market Fund | | 8,402,620 | d | 8,402,620 | |
(cost $8,402,620) | | | | | |
Total Investments (cost $208,432,702) | | 101.1% | | 262,928,386 | |
Liabilities, Less Cash and Receivables | | (1.1%) | | (2,842,919) | |
Net Assets | | 100.0% | | 260,085,467 | |
aNon-income producing security.
bThe valuation of this security has been determined in good faith by management under the direction of the Board of Directors. At August 31, 2015, the value of this security amounted to $436,594, or .2% of net assets.
cSecurity restricted as to public resale.
dInvestment in affiliated money market mutual fund.
| | |
Portfolio Summary (Unaudited) † | Value (%) |
Software | 25.0 |
Internet Software & Services | 20.1 |
IT Services | 12.3 |
Communications Equipment | 11.9 |
Semiconductors & Semiconductor Equipment | 11.1 |
Internet & Catalog Retail | 8.8 |
Electronic Equipment & Instruments | 8.7 |
Money Market Investment | 3.2 |
| | 101.1 |
†Based on net assets.
See notes to financial statements.
10
STATEMENT OF ASSETS AND LIABILITIES
August 31, 2015
| | | | | | |
| | | Cost | | Value |
Assets ($): | | | |
Investments in securities—See Statement of Investments: | | | | |
Unaffiliated issuers | | 200,030,082 | | 254,525,766 |
Affiliated issuers | | 8,402,620 | | 8,402,620 |
Cash | | | | | 72,908 |
Receivable for investment securities sold | | | | | 7,499,802 |
Dividends receivable | | | | | 23,674 |
Receivable for shares of Common Stock subscribed | | | | | 14,648 |
Prepaid expenses | | | | | 24,343 |
| | | | | 270,563,761 |
Liabilities ($): | | | |
Due to The Dreyfus Corporation and affiliates—Note 3(c) | | | | | 293,971 |
Payable for investment securities purchased | | | | | 9,302,595 |
Payable for shares of Common Stock redeemed | | | | | 731,748 |
Accrued expenses | | | | | 149,980 |
| | | | | 10,478,294 |
Net Assets ($) | | | 260,085,467 |
Composition of Net Assets ($): | | | |
Paid-in capital | | | | | 189,108,440 |
Accumulated net realized gain (loss) on investments | | | | | 16,481,343 |
Accumulated net unrealized appreciation (depreciation)
on investments | | | | | 54,495,684 |
Net Assets ($) | | | 260,085,467 |
| | | | |
Net Asset Value Per Share | Class A | Class C | Class I |
Net Assets ($) | 218,398,431 | 25,028,469 | 16,658,567 |
Shares Outstanding | 5,455,194 | 746,106 | 386,961 |
Net Asset Value Per Share ($) | 40.03 | 33.55 | 43.05 |
See notes to financial statements.
11
STATEMENT OF OPERATIONS
Year Ended August 31, 2015
| | | | | | | |
| | | | | | |
| | | | | | |
Investment Income ($): | | | | |
Income: | | | | |
Cash dividends: | | | | |
Unaffliated issuers | | | 1,822,219 | |
Affliated issuers | | | 7,131 | |
Income from securities lending—Note 1(b) | | | 20,538 | |
Total Income | | | 1,849,888 | |
Expenses: | | | | |
Management fee—Note 3(a) | | | 2,074,426 | |
Shareholder servicing costs—Note 3(c) | | | 1,211,214 | |
Distribution fees—Note 3(b) | | | 204,539 | |
Professional fees | | | 57,959 | |
Prospectus and shareholders’ reports | | | 46,713 | |
Registration fees | | | 45,065 | |
Custodian fees—Note 3(c) | | | 27,009 | |
Directors' fees and expenses—Note 3(d) | | | 19,269 | |
Loan commitment fees—Note 2 | | | 2,799 | |
Miscellaneous | | | 24,328 | |
Total Expenses | | | 3,713,321 | |
Less—reduction in fees due to earnings credits—Note 3(c) | | | (421) | |
Net Expenses | | | 3,712,900 | |
Investment (Loss)—Net | | | (1,863,012) | |
Realized and Unrealized Gain (Loss) on Investments—Note 4 ($): | | |
Net realized gain (loss) on investments | | | 18,566,507 | |
Net unrealized appreciation (depreciation) on investments | | | (12,766,942) | |
Net Realized and Unrealized Gain (Loss) on Investments | | | 5,799,565 | |
Net Increase in Net Assets Resulting from Operations | | 3,936,553 | |
See notes to financial statements.
12
STATEMENT OF CHANGES IN NET ASSETS
| | | | | | | | | | |
| | | | | | | | | | |
| | | | Year Ended August 31, |
| | | | 2015 | | | | 2014 | |
Operations ($): | | | | | | | | |
Investment (loss)—net | | | (1,863,012) | | | | (1,514,292) | |
Net realized gain (loss) on investments | | 18,566,507 | | | | 48,295,958 | |
Net unrealized appreciation (depreciation)
on investments | | (12,766,942) | | | | 16,132,585 | |
Net Increase (Decrease) in Net Assets
Resulting from Operations | 3,936,553 | | | | 62,914,251 | |
Dividends to Shareholders from ($): | | | | | | | | |
Net realized gain on investments: | | | | | | | | |
Class A | | | (37,985,796) | | | | (4,509,258) | |
Class C | | | (5,255,489) | | | | (620,269) | |
Class I | | | (2,538,324) | | | | (286,758) | |
Total Dividends | | | (45,779,609) | | | | (5,416,285) | |
Capital Stock Transactions ($): | | | | | | | | |
Net proceeds from shares sold: | | | | | | | | |
Class A | | | 17,183,919 | | | | 19,102,013 | |
Class C | | | 1,933,628 | | | | 2,382,762 | |
Class I | | | 6,897,339 | | | | 6,674,792 | |
Dividends reinvested: | | | | | | | | |
Class A | | | 35,293,082 | | | | 4,129,324 | |
Class C | | | 3,699,203 | | | | 434,422 | |
Class I | | | 2,110,080 | | | | 227,245 | |
Cost of shares redeemed: | | | | | | | | |
Class A | | | (37,377,667) | | | | (46,747,539) | |
Class C | | | (4,632,843) | | | | (4,576,460) | |
Class I | | | (5,469,413) | | | | (6,931,430) | |
Increase (Decrease) in Net Assets
from Capital Stock Transactions | 19,637,328 | | | | (25,304,871) | |
Total Increase (Decrease) in Net Assets | (22,205,728) | | | | 32,193,095 | |
Net Assets ($): | | | | | | | | |
Beginning of Period | | | 282,291,195 | | | | 250,098,100 | |
End of Period | | | 260,085,467 | | | | 282,291,195 | |
Capital Share Transactions (Shares): | | | | | | | | |
Class A | | | | | | | | |
Shares sold | | | 400,632 | | | | 435,877 | |
Shares issued for dividends reinvested | | | 903,098 | | | | 97,597 | |
Shares redeemed | | | (874,662) | | | | (1,072,847) | |
Net Increase (Decrease) in Shares Outstanding | 429,068 | | | | (539,373) | |
Class C | | | | | | | | |
Shares sold | | | 56,835 | | | | 59,758 | |
Shares issued for dividends reinvested | | | 112,335 | | | | 11,719 | |
Shares redeemed | | | (129,799) | | | | (116,377) | |
Net Increase (Decrease) in Shares Outstanding | 39,371 | | | | (44,900) | |
Class I | | | | | | | | |
Shares sold | | | 149,199 | | | | 141,822 | |
Shares issued for dividends reinvested | | | 50,300 | | | | 5,072 | |
Shares redeemed | | | (122,390) | | | | (146,103) | |
Net Increase (Decrease) in Shares Outstanding | 77,109 | | | | 791 | |
See notes to financial statements.
13
FINANCIAL HIGHLIGHTS
The following tables describe the performance for each share class for the fiscal periods indicated. All information (except portfolio turnover rate) reflects financial results for a single fund share. Total return shows how much your investment in the fund would have increased (or decreased) during each period, assuming you had reinvested all dividends and distributions. These figures have been derived from the fund’s financial statements.
| | | | | | | |
| | | | | |
| | Year Ended August 31, |
Class A Shares | | 2015 | 2014 | 2013 | 2012 | 2011 |
Per Share Data ($): | | | | | | |
Net asset value, beginning of period | 47.28 | 38.16 | 34.40 | 29.58 | 25.75 |
Investment Operations: | | | | | | |
Investment (loss)—neta | (.26) | (.21) | (.19) | (.22) | (.25) |
Net realized and unrealized gain (loss) on investments | .75 | 10.17 | 3.95 | 5.04 | 4.08 |
Total from Investment Operations | .49 | 9.96 | 3.76 | 4.82 | 3.83 |
Distributions: | | | | | | |
Dividends from net realized gain on investments | (7.74) | (.84) | – | – | – |
Net asset value, end of period | 40.03 | 47.28 | 38.16 | 34.40 | 29.58 |
Total Return (%)b | 1.40 | 26.37 | 10.93 | 16.30 | 14.87 |
Ratios/Supplemental Data (%): | | | | | |
Ratio of total expenses to average net assets | 1.28 | 1.26 | 1.39 | 1.45 | 1.36 |
Ratio of net expenses to average net assets | | 1.28 | 1.26 | 1.39 | 1.45 | 1.36 |
Ratio of net investment (loss) to average net assets | (.61) | (.47) | (.54) | (.67) | (.79) |
Portfolio Turnover Rate | 67.23 | 69.81 | 54.34 | 69.20 | 90.28 |
Net Assets, end of period ($ x 1,000) | 218,398 | 237,657 | 212,378 | 234,452 | 226,016 |
a Based on average shares outstanding.
b Exclusive of sales charge.
See notes to financial statements.
14
| | | | | | | |
| | | | | |
| | Year Ended August 31, |
Class C Shares | | 2015 | 2014 | 2013 | 2012 | 2011 |
Per Share Data ($): | | | | | | |
Net asset value, beginning of period | 41.17 | 33.60 | 30.54 | 26.48 | 23.25 |
Investment Operations: | | | | | | |
Investment (loss)—neta | (.52) | (.51) | (.43) | (.43) | (.47) |
Net realized and unrealized gain (loss) on investments | .64 | 8.92 | 3.49 | 4.49 | 3.70 |
Total from Investment Operations | .12 | 8.41 | 3.06 | 4.06 | 3.23 |
Distributions: | | | | | | |
Dividends from net realized gain on investments | (7.74) | (.84) | – | – | – |
Net asset value, end of period | 33.55 | 41.17 | 33.60 | 30.54 | 26.48 |
Total Return (%)b | .61 | 25.33 | 10.02 | 15.33 | 13.89 |
Ratios/Supplemental Data (%): | | | | | |
Ratio of total expenses to average net assets | 2.08 | 2.10 | 2.23 | 2.27 | 2.21 |
Ratio of net expenses to average net assets | 2.08 | 2.10 | 2.23 | 2.27 | 2.21 |
Ratio of net investment (loss) to average net assets | (1.41) | (1.31) | (1.37) | (1.49) | (1.63) |
Portfolio Turnover Rate | 67.23 | 69.81 | 54.34 | 69.20 | 90.28 |
Net Assets, end of period ($ x 1,000) | 25,028 | 29,098 | 25,253 | 27,428 | 27,954 |
a Based on average shares outstanding.
b Exclusive of sales charge.
See notes to financial statements.
15
FINANCIAL HIGHLIGHTS (continued)
| | | | | | | |
| | | | | |
| | Year Ended August 31, |
Class I Shares | | 2015 | 2014 | 2013 | 2012 | 2011 |
Per Share Data ($): | | | | | | |
Net asset value, beginning of period | 50.14 | 40.34 | 36.25 | 31.06 | 26.94 |
Investment Operations: | | | | | | |
Investment (loss)—neta | (.16) | (.12) | (.08) | (.11) | (.14) |
Net realized and unrealized gain (loss) on investments | .81 | 10.76 | 4.17 | 5.30 | 4.26 |
Total from Investment Operations | .65 | 10.64 | 4.09 | 5.19 | 4.12 |
Distributions: | | | | | | |
Dividends from net realized gain on investments | (7.74) | (.84) | – | – | – |
Net asset value, end of period | 43.05 | 50.14 | 40.34 | 36.25 | 31.06 |
Total Return (%) | 1.69 | 26.61 | 11.28 | 16.71 | 15.30 |
Ratios/Supplemental Data (%): | | | | | |
Ratio of total expenses to average net assets | 1.02 | 1.05 | 1.07 | 1.08 | 1.01 |
Ratio of net expenses to average net assets | 1.02 | 1.05 | 1.07 | 1.08 | 1.01 |
Ratio of net investment (loss) to average net assets | (.36) | (.26) | (.22) | (.32) | (.42) |
Portfolio Turnover Rate | 67.23 | 69.81 | 54.34 | 69.20 | 90.28 |
Net Assets, end of period ($ x 1,000) | 16,659 | 15,536 | 12,467 | 13,483 | 14,932 |
a Based on average shares outstanding.
See notes to financial statements.
16
NOTES TO FINANCIAL STATEMENTS
NOTE 1—Significant Accounting Policies:
Dreyfus Technology Growth Fund (the “fund”) is a separate diversified series of Advantage Funds, Inc. (the “Company”), which is registered under the Investment Company Act of 1940, as amended (the “Act”), as an open-end management investment company and operates as a series company currently offering eleven series, including the fund. The fund’s investment objective is to seek capital appreciation. The Dreyfus Corporation (the “Manager” or “Dreyfus”), a wholly-owned subsidiary of The Bank of New York Mellon Corporation (“BNY Mellon”), serves as the fund’s investment adviser.
MBSC Securities Corporation (the “Distributor”), a wholly-owned subsidiary of Dreyfus, is the distributor of the fund’s shares. The fund is authorized to issue 500 million shares of $.001 par value Common Stock. The fund currently offers three classes of shares: Class A (200 million shares authorized), Class C (100 million shares authorized) and Class I (200 million shares authorized). Class A shares generally are subject to a sales charge imposed at the time of purchase. Class C shares are subject to a contingent deferred sales charge (“CDSC”) imposed on Class C shares redeemed within one year of purchase. Class I shares are sold at net asset value per share generally to institutional investors. Other differences between the classes include the services offered to and the expenses borne by each class, the allocation of certain transfer agency costs, and certain voting rights. Income, expenses (other than expenses attributable to a specific class), and realized and unrealized gains or losses on investments are allocated to each class of shares based on its relative net assets.
The Company accounts separately for the assets, liabilities and operations of each series. Expenses directly attributable to each series are charged to that series’ operations; expenses which are applicable to all series are allocated among them on a pro rata basis.
The Financial Accounting Standards Board (“FASB”) Accounting Standards Codification (“ASC”) is the exclusive reference of authoritative U.S. generally accepted accounting principles (“GAAP”) recognized by the FASB to be applied by nongovernmental entities. Rules and interpretive releases of the Securities and Exchange Commission (“SEC”) under authority of federal laws are also sources of authoritative GAAP for SEC registrants. The fund’s financial statements are prepared in accordance with GAAP, which may require the use of management estimates and assumptions. Actual results could differ from those estimates.
17
NOTES TO FINANCIAL STATEMENTS (continued)
The Company enters into contracts that contain a variety of indemnifications. The fund’s maximum exposure under these arrangements is unknown. The fund does not anticipate recognizing any loss related to these arrangements.
(a) Portfolio valuation: The fair value of a financial instrument is the amount that would be received to sell an asset or paid to transfer a liability in an orderly transaction between market participants at the measurement date (i.e., the exit price). GAAP establishes a fair value hierarchy that prioritizes the inputs of valuation techniques used to measure fair value. This hierarchy gives the highest priority to unadjusted quoted prices in active markets for identical assets or liabilities (Level 1 measurements) and the lowest priority to unobservable inputs (Level 3 measurements).
Additionally, GAAP provides guidance on determining whether the volume and activity in a market has decreased significantly and whether such a decrease in activity results in transactions that are not orderly. GAAP requires enhanced disclosures around valuation inputs and techniques used during annual and interim periods.
Various inputs are used in determining the value of the fund’s investments relating to fair value measurements. These inputs are summarized in the three broad levels listed below:
Level 1—unadjusted quoted prices in active markets for identical investments.
Level 2—other significant observable inputs (including quoted prices for similar investments, interest rates, prepayment speeds, credit risk, etc.).
Level 3—significant unobservable inputs (including the fund’s own assumptions in determining the fair value of investments).
The inputs or methodology used for valuing securities are not necessarily an indication of the risk associated with investing in those securities.
Changes in valuation techniques may result in transfers in or out of an assigned level within the disclosure hierarchy. Valuation techniques used to value the fund’s investments are as follows:
Investments in securities are valued at the last sales price on the securities exchange or national securities market on which such securities are primarily traded. Securities listed on the National Market System for which market quotations are available are valued at the official closing price or, if there is no official closing price that day, at the last sales price. For open short positions, asked prices are used for valuation purposes. Bid price is
18
used when no asked price is available. Registered investment companies that are not traded on an exchange are valued at their net asset value. All of the preceding securities are generally categorized within Level 1 of the fair value hierarchy.
Securities not listed on an exchange or the national securities market, or securities for which there were no transactions, are valued at the average of the most recent bid and asked prices. These securities are generally categorized within Level 2 of the fair value hierarchy.
Fair valuing of securities may be determined with the assistance of a pricing service using calculations based on indices of domestic securities and other appropriate indicators, such as prices of relevant American Depository Receipts and financial futures. Utilizing these techniques may result in transfers between Level 1 and Level 2 of the fair value hierarchy.
The fair value of the fund’s interest in a limited partnership represents the amount that the fund could reasonably expect to receive from the limited partnership if the fund’s capital was withdrawn from the limited partnership at the time of valuation, based on information available at the time the valuation is made and that the fund believes to be reliable. The valuation utilizes financial information supplied by the limited partnership with adjustments made daily for any underlying exchange traded securities. limited partnership are generally categorized within Level 3 of the fair value hierarchy.
When market quotations or official closing prices are not readily available, or are determined not to reflect accurately fair value, such as when the value of a security has been significantly affected by events after the close of the exchange or market on which the security is principally traded (for example, a foreign exchange or market), but before the fund calculates its net asset value, the fund may value these investments at fair value as determined in accordance with the procedures approved by the Company's Board of Directors (the “Board”). Certain factors may be considered when fair valuing investments such as: fundamental analytical data, the nature and duration of restrictions on disposition, an evaluation of the forces that influence the market in which the securities are purchased and sold, and public trading in similar securities of the issuer or comparable issuers. These securities are either categorized within Level 2 or 3 of the fair value hierarchy depending on the relevant inputs used.
For restricted securities where observable inputs are limited, assumptions about market activity and risk are used and are generally categorized within Level 3 of the fair value hierarchy.
19
NOTES TO FINANCIAL STATEMENTS (continued)
The following is a summary of the inputs used as of August 31, 2015 in valuing the fund’s investments:
| | | | | | |
Assets ($) | Level 1 - Unadjusted Quoted Prices | Level 2 - Other Significant Observable Inputs | | Level 3 -Significant Unobservable Inputs | Total |
Investments in Securities: | | | | |
Equity Securities - Domestic Common Stocks† | 225,830,870 | - | | - | 225,830,870 |
Equity Securities - Foreign Common Stocks† | 23,461,617 | 4,796,685 | †† | - | 28,258,302 |
Limited Partnership Interest† | - | - | | 436,594 | 436,594 |
Mutual Funds | 8,402,620 | - | | - | 8,402,620 |
†See Statement of Investments for additional detailed categorizations.
††Securities classified within Level 2 at period end as the values were determined pursuant to the fund's fair valuation procedures.
At August 31, 2014, no exchange traded foreign equity securities were classified within Level 2 of the fair value hierarchy pursuant to the fund’s fair valuation procedures.
The following is a reconciliation of Level 3 assets for which significant unobservable inputs were used to determine fair value:
| | |
| Limited Partnership Interest ($) |
Balance as of 8/31/2014 | 621,342 |
Realized gain (loss) | (855,897) |
Change in unrealized apprecition (depreciation) | 845,431 |
Purchases | - |
Sales | (174,282) |
Transfer into Level 3 | - |
Transfer out of Level 3 | - |
Balance as of 8/31/2015 | 436,594 |
The amount of total gains (losses) for the period included in earnings attributable to the change in unrealized gains (losses) relating to investments still held at 8/31/2015 | (845,431) |
(b) Securities transactions and investment income: Securities transactions are recorded on a trade date basis. Realized gains and losses from securities transactions are recorded on the identified cost basis. Dividend income is recognized on the ex-dividend date and interest income, including, where applicable, accretion of discount and amortization of premium on investments, is recognized on the accrual basis.
20
Pursuant to a securities lending agreement with The Bank of New York Mellon, a subsidiary of BNY Mellon and an affiliate of Dreyfus, the fund may lend securities to qualified institutions. It is the fund’s policy that, at origination, all loans are secured by collateral of at least 102% of the value of U.S. securities loaned and 105% of the value of foreign securities loaned. Collateral equivalent to at least 100% of the market value of securities on loan is maintained at all times. Collateral is either in the form of cash, which can be invested in certain money market mutual funds managed by Dreyfus, or U.S. Government and Agency securities. The fund is entitled to receive all dividends, interest and distributions on securities loaned, in addition to income earned as a result of the lending transaction. Should a borrower fail to return the securities in a timely manner, The Bank of New York Mellon is required to replace the securities for the benefit of the fund or credit the fund with the market value of the unreturned securities and is subrogated to the fund’s rights against the borrower and the collateral. During the period ended August 31, 2015, The Bank of New York Mellon earned $6,154 from lending portfolio securities, pursuant to the securities lending agreement.
(c) Affiliated issuers: Investments in other investment companies advised by Dreyfus are defined as “affiliated” under the Act. Investments in affiliated investment companies during the period ended August 31, 2015 were as follows:
| | | | | | |
Affiliated Investment Company | Value 8/31/2014 ($) | Purchases ($) | Sales ($) | Value 8/31/2015 ($) | Net Assets (%) |
Dreyfus Institutional Preferred Plus Money Market Fund | 13,850,664 | 114,007,020 | 119,455,064 | 8,402,620 | 3.2 |
Dreyfus Institutional Cash Advantage Fund | - | 87,207,871 | 87,207,871 | - | - |
Total | 13,850,664 | 201,214,891 | 206,662,935 | 8,402,620 | 3.2 |
(d) Dividends to shareholders: Dividends are recorded on the ex-dividend date. Dividends from investment income-net and dividends from net realized capital gains, if any, are normally declared and paid annually, but the fund may make distributions on a more frequent basis to comply
21
NOTES TO FINANCIAL STATEMENTS (continued)
with the distribution requirements of the Internal Revenue Code of 1986, as amended (the “Code”). To the extent that net realized capital gains can be offset by capital loss carryovers, it is the policy of the fund not to distribute such gains. Income and capital gain distributions are determined in accordance with income tax regulations, which may differ from GAAP.
(e) Federal income taxes: It is the policy of the fund to continue to qualify as a regulated investment company, if such qualification is in the best interests of its shareholders, by complying with the applicable provisions of the Code, and to make distributions of taxable income sufficient to relieve it from substantially all federal income and excise taxes.
As of and during the period ended August 31, 2015, the fund did not have any liabilities for any uncertain tax positions. The fund recognizes interest and penalties, if any, related to uncertain tax positions as income tax expense in the Statement of Operations. During the period ended August 31, 2015, the fund did not incur any interest or penalties.
Each tax year in the four-year period ended August 31, 2015 remains subject to examination by the Internal Revenue Service and state taxing authorities.
At August 31, 2015, the components of accumulated earnings on a tax basis were as follows: undistributed ordinary income $851,052, undistributed capital gains $15,676,521 and unrealized appreciation $54,449,454.
The tax character of distributions paid to shareholders during the fiscal periods ended August 31, 2015 and August 31, 2014 were as follows: ordinary income $7,067,051 and $0, and long-term capital gains $38,712,558 and $5,416,285, respectively.
During the period ended August 31, 2015, as a result of permanent book to tax differences, primarily due to the tax treatment for net operating losses and limited partnerships, the fund increased accumulated undistributed investment income-net by $1,863,012, decreased accumulated net realized gain (loss) on investments by $2,033,956 and increased paid-in capital by $170,944. Net assets and net asset value per share were not affected by this reclassification.
NOTE 2—Bank Lines of Credit:
The fund participates with other Dreyfus-managed funds in a $430 million unsecured credit facility led by Citibank, N.A. and a $300 million unsecured credit facility provided by The Bank of New York Mellon (each, a “Facility”), each to be utilized primarily for temporary or emergency purposes, including the financing of redemptions. Prior to October 8,
22
2014, the unsecured credit facility with Citibank, N.A. was $265 million. In connection therewith, the fund has agreed to pay its pro rata portion of commitment fees for each Facility. Interest is charged to the fund based on rates determined pursuant to the terms of the respective Facility at the time of borrowing. During the period ended August 31, 2015, the fund did not borrow under the Facilities.
NOTE 3—Management Fee and Other Transactions with Affiliates:
(a) Pursuant to a management agreement with Dreyfus, the management fee is computed at the annual rate of .75% of the value of the fund's average daily net assets and is payable monthly.
During the period ended August 31, 2015, the Distributor retained $6,936 from commissions earned on sales of the fund's Class A shares and $310 from CDSCs on redemptions of the fund's Class C shares.
(b) Under the Distribution Plan adopted pursuant to Rule 12b-1 under the Act, Class C shares pay the Distributor for distributing its shares at an annual rate of .75% of the value of its average daily net assets. During the period ended August 31, 2015, Class C shares were charged $204,539 pursuant to the Distribution Plan.
(c) Under the Shareholder Services Plan, Class A and Class C shares pay the Distributor at an annual rate of .25% of the value of their average daily net assets for the provision of certain services. The services provided may include personal services relating to shareholder accounts, such as answering shareholder inquiries regarding the fund and providing reports and other information, and services related to the maintenance of shareholder accounts. The Distributor may make payments to Service Agents (securities dealers, financial institutions or other industry professionals) with respect to these services. The Distributor determines the amounts to be paid to Service Agents. During the period ended August 31, 2015, Class A and Class C shares were charged $581,718 and $68,180, respectively, pursuant to the Shareholder Services Plan.
The fund has arrangements with the transfer agent and the custodian whereby the fund may receive earnings credits when positive cash balances are maintained, which are used to offset transfer agency and custody fees. For financial reporting purposes, the fund includes net earnings credits as an expense offset in the Statement of Operations.
The fund compensates Dreyfus Transfer, Inc., a wholly-owned subsidiary of Dreyfus, under a transfer agency agreement for providing transfer agency and cash management services for the fund. The majority of
23
NOTES TO FINANCIAL STATEMENTS (continued)
transfer agency fees are comprised of amounts paid on a per account basis, while cash management fees are related to fund subscriptions and redemptions. During the period ended August 31, 2015, the fund was charged $157,976 for transfer agency services and $10,486 for cash management services. These fees are included in Shareholder servicing costs in the Statement of Operations. Cash management fees were partially offset by earnings credits of $421.
The fund compensates The Bank of New York Mellon under a custody agreement for providing custodial services for the fund. These fees are determined based on net assets, geographic region and transaction activity. During the period ended August 31, 2015, the fund was charged $27,009 pursuant to the custody agreement.
During the period ended August 31, 2015, the fund was charged $10,965 for services performed by the Chief Compliance Officer and his staff.
The components of “Due to The Dreyfus Corporation and affiliates” in the Statement of Assets and Liabilities consist of: management fees $172,525, Distribution Plan fees $16,581, Shareholder Services Plan fees $53,730, custodian fees $11,462, Chief Compliance Officer fees $1,737 and transfer agency fees $37,936.
(d) Each Board member also serves as a Board member of other funds within the Dreyfus complex. Annual retainer fees and attendance fees are allocated to each fund based on net assets.
NOTE 4—Securities Transactions:
The aggregate amount of purchases and sales of investment securities, excluding short-term securities, during the period ended August 31, 2015, amounted to $181,014,237 and $201,075,535, respectively.
At August 31, 2015, the cost of investments for federal income tax purposes was $208,478,932; accordingly, accumulated net unrealized appreciation on investments was $54,449,454, consisting of $63,707,649 gross unrealized appreciation and $9,258,195 gross unrealized depreciation.
24
REPORT OF INDEPENDENT REGISTERED
PUBLIC ACCOUNTING FIRM
Shareholders and Board of Directors
Dreyfus Technology Growth Fund
We have audited the accompanying statement of assets and liabilities, including the statement of investments, of Dreyfus Technology Growth Fund (one of the series comprising Advantage Funds, Inc.) as of August 31, 2015, and the related statement of operations for the year then ended, the statement of changes in net assets for each of the two years in the period then ended, and the financial highlights for each of the five years in the period then ended. These financial statements and financial highlights are the responsibility of the Fund’s management. Our responsibility is to express an opinion on these financial statements and financial highlights based on our audits.
We conducted our audits in accordance with the standards of the Public Company Accounting Oversight Board (United States).Those standards require that we plan and perform the audit to obtain reasonable assurance about whether the financial statements and financial highlights are free of material misstatement. We were not engaged to perform an audit of the Fund’s internal control over financial reporting. Our audits included consideration of internal control over financial reporting as a basis for designing audit procedures that are appropriate in the circumstances, but not for the purpose of expressing an opinion on the effectiveness of the Fund’s internal control over financial reporting. Accordingly, we express no such opinion. An audit also includes examining, on a test basis, evidence supporting the amounts and disclosures in the financial statements and financial highlights, assessing the accounting principles used and significant estimates made by management, and evaluating the overall financial statement presentation. Our procedures included confirmation of securities owned as of August 31, 2015 by correspondence with the custodian and others. We believe that our audits provide a reasonable basis for our opinion.
In our opinion, the financial statements and financial highlights referred to above present fairly, in all material respects, the financial position of Dreyfus Technology Growth Fund at August 31, 2015, the results of its operations for the year then ended, the changes in its net assets for each of the two years in the period then ended, and the financial highlights for each of the five years in the period then ended, in conformity with U.S. generally accepted accounting principles.

New York, New York
October 28, 2015
25
IMPORTANT TAX INFORMATION (Unaudited)
For federal tax purposes, the fund hereby reports 27.76% of the ordinary dividends paid during the fiscal year ended August 31, 2015 as qualifying for the corporate dividends received deduction. Also certain dividends paid by the fund may be subject to a maximum tax rate of 15%, as provided for by the Jobs and Growth Tax Relief Reconciliation Act of 2003. Of the distributions paid during the fiscal year, $2,116,882 represents the maximum amount that may be considered qualified dividend income. The fund also hereby reports $1.1942 per share as a short-term capital gain distribution and $6.5417 per share as a long-term capital gain distribution paid on December 17, 2014. Shareholders will receive notification in early 2016 of the percentage applicable to the preparation of their 2015 income tax returns.
26
INFORMATION ABOUT THE RENEWAL OF THE FUND'S MANAGEMENT AGREEMENT (Unaudited)
At a meeting of the fund's Board of Directors held on March 11-12, 2015, the Board considered the renewal of the fund's Management Agreement pursuant to which Dreyfus provides the fund with investment advisory and administrative services (the “Agreement”). The Board members, none of whom are “interested persons” (as defined in the Investment Company Act of 1940, as amended) of the fund, were assisted in their review by independent legal counsel and met with counsel in executive session separate from Dreyfus representatives. In considering the renewal of the Agreement, the Board considered all factors that it believed to be relevant, including those discussed below. The Board did not identify any one factor as dispositive, and each Board member may have attributed different weights to the factors considered.
Analysis of Nature, Extent, and Quality of Services Provided to the Fund. The Board considered information provided to them at the meeting and in previous presentations from Dreyfus representatives regarding the nature, extent, and quality of the services provided to funds in the Dreyfus fund complex. Dreyfus provided the number of open accounts in the fund, the fund's asset size and the allocation of fund assets among distribution channels. Dreyfus also had previously provided information regarding the diverse intermediary relationships and distribution channels of funds in the Dreyfus fund complex (such as retail direct or intermediary, in which intermediaries typically are paid by the fund and/or Dreyfus) and Dreyfus' corresponding need for broad, deep, and diverse resources to be able to provide ongoing shareholder services to each intermediary or distribution channel, as applicable to the fund.
The Board also considered research support available to, and portfolio management capabilities of, the fund's portfolio management personnel and that Dreyfus also provides oversight of day-to-day fund operations, including fund accounting and administration and assistance in meeting legal and regulatory requirements. The Board also considered Dreyfus' extensive administrative, accounting and compliance infrastructures. The Board also considered portfolio management's brokerage policies and practices (including policies and practices regarding soft dollars) and the standards applied in seeking best execution.
Comparative Analysis of the Fund's Performance and Management Fee and Expense Ratio. The Board reviewed reports prepared by Lipper, Inc. (“Lipper”), an independent provider of investment company data, which included information comparing (1) the fund's performance with the performance of a group of comparable funds (the “Performance Group”) and with a broader group of funds (the “Performance Universe”), all for various periods ended December 31, 2014, and (2) the fund's actual and contractual management fees and total expenses with those of a group of comparable funds (the “Expense Group”) and with a broader group of funds (the “Expense Universe”), the information for which was derived in part from fund financial statements available to Lipper as of the date of its analysis. Dreyfus previously had furnished the Board with a description of the methodology Lipper used to select the
27
INFORMATION ABOUT THE RENEWAL OF THE FUND'S MANAGEMENT AGREEMENT (Unaudited) (continued)
Performance Group and Performance Universe and the Expense Group and Expense Universe.
Dreyfus representatives stated that the usefulness of performance comparisons may be affected by a number of factors, including different investment limitations that may be applicable to the fund and comparison funds. The Board discussed with representatives of Dreyfus and its affiliates the results of the comparisons and noted that the fund's total return performance was below the Performance Group and Performance Universe medians for all periods, except for the four-year period when the performance was at the Performance Group median and the five-year period when the performance was above the Performance Group median and at the Performance Universe median. Dreyfus also provided a comparison of the fund's calendar year total returns to the returns of the fund's benchmark indexes, and it was noted that the fund's performance was above the return of one or both of the indexes in seven of the ten years shown. The Board discussed the fund's performance with representatives of Dreyfus, who noted that periods of underperformance in 2011 and 2014 were negatively impacting overall performance results. The Dreyfus representatives discussed how the portfolio managers' investment approach relative to peer funds in 2014 (with the fund focused on growth investments and less exposure to semi-conductor companies than peer funds) negatively impacted relative performance. The Dreyfus representatives discussed, in response to questions from Board members, interactions among the portfolio management team members and Dreyfus' plans to more closely examine the investment process.
The Board also reviewed the range of actual and contractual management fees and total expenses of the Expense Group and Expense Universe funds and discussed the results of the comparisons. The Board noted that the fund's contractual management fee was below the Expense Group median and the fund's actual management fee and total expenses were below the Expense Group and Expense Universe medians.
Dreyfus representatives reviewed with the Board the management or investment advisory fees (1) paid by funds advised or administered by Dreyfus that are in the same Lipper category as the fund and (2) paid to Dreyfus or the Dreyfus-affiliated primary employer of the fund's primary portfolio manager(s) for advising any separate accounts and/or other types of client portfolios that are considered to have similar investment strategies and policies as the fund (the “Similar Clients”), and explained the nature of the Similar Clients. They discussed differences in fees paid and the relationship of the fees paid in light of any differences in the services provided and other relevant factors. The Board considered the relevance of the fee information provided for the Similar Clients to evaluate the appropriateness and reasonableness of the fund's management fee.
Analysis of Profitability and Economies of Scale. Dreyfus representatives reviewed the expenses allocated and profit received by Dreyfus and its affiliates and the resulting profitability percentage for managing the fund and the aggregate profitability percentage to Dreyfus and its affiliates for managing the funds in the Dreyfus fund complex, and
28
the method used to determine the expenses and profit. The Board concluded that the profitability results were not unreasonable, given the services rendered and service levels provided by Dreyfus. The Board also had been provided with information prepared by an independent consulting firm regarding Dreyfus' approach to allocating costs to, and determining the profitability of, individual funds and the entire Dreyfus fund complex. The consulting firm also had analyzed where any economies of scale might emerge in connection with the management of a fund.
The Board considered, on the advice of its counsel, the profitability analysis (1) as part of its evaluation of whether the fees under the Agreement bear a reasonable relationship to the mix of services provided by Dreyfus, including the nature, extent and quality of such services, and (2) in light of the relevant circumstances for the fund and the extent to which economies of scale would be realized if the fund grows and whether fee levels reflect these economies of scale for the benefit of fund shareholders. Dreyfus representatives noted that a discussion of economies of scale is predicated on a fund having achieved a substantial size with increasing assets and that, if a fund's assets had been stable or decreasing, the possibility that Dreyfus may have realized any economies of scale would be less. Dreyfus representatives also noted that, as a result of shared and allocated costs among funds in the Dreyfus fund complex, the extent of economies of scale could depend substantially on the level of assets in the complex as a whole, so that increases and decreases in complex-wide assets can affect potential economies of scale in a manner that is disproportionate to, or even in the opposite direction from, changes in the fund's asset level. The Board also considered potential benefits to Dreyfus from acting as investment adviser and noted the soft dollar arrangements in effect for trading the fund's investments.
At the conclusion of these discussions, the Board agreed that it had been furnished with sufficient information to make an informed business decision with respect to the renewal of the Agreement. Based on the discussions and considerations as described above, the Board concluded and determined as follows:
· The Board concluded that the nature, extent and quality of the services provided by Dreyfus are adequate and appropriate.
· The Board noted Dreyfus' discussion of performance and agreed to closely monitor performance.
· The Board concluded that the fee paid to Dreyfus was reasonable in light of the considerations described above.
· The Board determined that the economies of scale which may accrue to Dreyfus and its affiliates in connection with the management of the fund had been adequately considered by Dreyfus in connection with the fee rate charged to the fund pursuant to the Agreement and that, to the extent in the future it were determined that material economies of scale had not been shared with the
29
INFORMATION ABOUT THE RENEWAL OF THE FUND'S MANAGEMENT AGREEMENT (Unaudited) (continued)
fund, the Board would seek to have those economies of scale shared with the fund.
In evaluating the Agreement, the Board considered these conclusions and determinations and also relied on its previous knowledge, gained through meetings and other interactions with Dreyfus and its affiliates, of the fund and the services provided to the fund by Dreyfus. The Board also relied on information received on a routine and regular basis throughout the year relating to the operations of the fund and the investment management and other services provided under the Agreement, including information on the investment performance of the fund in comparison to similar mutual funds and benchmark performance indices; general market outlook as applicable to the fund; and compliance reports. In addition, the Board's consideration of the contractual fee arrangements for this fund had the benefit of a number of years of reviews of prior or similar agreements during which lengthy discussions took place between the Board and Dreyfus representatives. Certain aspects of the arrangements may receive greater scrutiny in some years than in others, and the Board's conclusions may be based, in part, on their consideration of the same or similar arrangements in prior years. The Board determined to renew the Agreement.
30
BOARD MEMBERS INFORMATION (Unaudited)
INDEPENDENT BOARD MEMBERS
Joseph S. DiMartino (71)
Chairman of the Board (1995)
Principal Occupation During Past 5 Years:
· Corporate Director and Trustee (1995-present)
Other Public Company Board Memberships During Past 5 Years:
· CBIZ (formerly, Century Business Services, Inc.), a provider of outsourcing functions for small and medium size companies, Director (1997-present)
· The Newark Group, a provider of a national market of paper recovery facilities, paperboard mills and paperboard converting plants, Director (2000-2010)
No. of Portfolios for which Board Member Serves: 144
———————
Peggy C. Davis (72)
Board Member (2006)
Principal Occupation During Past 5 Years:
· Shad Professor of Law, New York University School of Law (1983-present)
No. of Portfolios for which Board Member Serves: 51
———————
David P. Feldman (75)
Board Member (1996)
Principal Occupation During Past 5 Years:
· Corporate Director and Trustee (1985-present)
Other Public Company Board Memberships During Past 5 Years:
· BBH Mutual Funds Group (5 registered mutual funds), Director (1992-2014)
No. of Portfolios for which Board Member Serves: 37
———————
Ehud Houminer (75)
Board Member (1993)
Principal Occupation During Past 5 Years:
· Executive-in-Residence at the Columbia Business School, Columbia University (1992-present)
Other Public Company Board Memberships During Past 5 Years:
· Avnet, Inc., an electronics distributor, Director (1993-2012)
No. of Portfolios for which Board Member Serves: 62
———————
31
BOARD MEMBERS INFORMATION (Unaudited) (continued)
INDEPENDENT BOARD MEMBERS (continued)
Lynn Martin (75)
Board Member (2012)
Principal Occupation During Past 5 Years:
· President of The Martin Hall Group LLC, a human resources consulting firm (2005-2012)
Other Public Company Board Memberships During Past 5 Years:
· AT&T, Inc., a telecommunications company, Director (1999-2012)
· Ryder System, Inc., a supply chain and transportation management company, Director (1993-2012)
No. of Portfolios for which Board Member Serves: 37
———————
Robin A. Melvin (51)
Board Member (2012)
Principal Occupation During Past 5 Years:
· Co-chairman, Illinois Mentoring Partnership, non-profit organization dedicated to increasing the quantity and quality of mentoring services in Illinois; (2014-present; a board member since 2013)
· Director, Boisi Family Foundation, a private family foundation that supports youth-serving organizations that promote the self sufficiency of youth from disadvantaged circumstances (1995-2012)
No. of Portfolios for which Board Member Serves: 114
———————
Dr. Martin Peretz (76)
Board Member (2006)
Principal Occupation During Past 5 Years:
· Editor-in-Chief Emeritus of The New Republic Magazine (2011-2012) (previously, Editor-in-Chief, 1974-2011)
· Director of TheStreet.com, a financial information service on the web (1996-2010)
· Lecturer at Harvard University (1969-2012)
No. of Portfolios for which Board Member Serves: 37
———————
Once elected all Board Members serve for an indefinite term, but achieve Emeritus status upon reaching age 80. The address of the Board Members and Officers is c/o The Dreyfus Corporation, 200 Park Avenue, New York, New York 10166. Additional information about the Board Members is available in the fund's Statement of Additional Information which can be obtained from Dreyfus free of charge by calling this toll free number: 1-800-DREYFUS.
James F. Henry, Emeritus Board Member
Dr. Paul A. Marks, Emeritus Board Member
Philip L. Toia, Emeritus Board Member
32
OFFICERS OF THE FUND (Unaudited)
BRADLEY J. SKAPYAK, President since January 2010.
Chief Operating Officer and a director of the Manager since June 2009, Chairman of Dreyfus Transfer, Inc., an affiliate of the Manager and the transfer agent of the funds, since May 2011 and Executive Vice President of the Distributor since June 2007. From April 2003 to June 2009, Mr. Skapyak was the head of the Investment Accounting and Support Department of the Manager. He is an officer of 69 investment companies (comprised of 144 portfolios) managed by the Manager. He is 56 years old and has been an employee of the Manager since February 1988.
BENNETT A. MACDOUGALL, Chief Legal Officer since October 2015.
Chief Legal Officer of the Manager since June 2015; from June 2005 to June 2015, Director and Associate General Counsel of Deutsche Bank – Asset & Wealth Management Division, and Chief Legal Officer of Deutsche Investment Management Americas Inc. He is an officer of 70 investment companies (comprised of 169 portfolios) managed by the Manager. He is 44 years old and has been an employee of the Manager since June 2015.
JANETTE E. FARRAGHER, Vice President and Secretary since December 2011.
Assistant General Counsel of BNY Mellon, and an officer of 70 investment companies (comprised of 169 portfolios) managed by the Manager. She is 52 years old and has been an employee of the Manager since February 1984.
JAMES BITETTO, Vice President and Assistant Secretary since August 2005.
Managing Counsel of BNY Mellon and Secretary of the Manager, and an officer of 70 investment companies (comprised of 169 portfolios) managed by the Manager. He is 49 years old and has been an employee of the Manager since December 1996.
JONI LACKS CHARATAN, Vice President and Assistant Secretary since August 2005.
Managing Counsel of BNY Mellon, and an officer of 70 investment companies (comprised of 169 portfolios) managed by the Manager. She is 59 years old and has been an employee of the Manager since October 1988.
JOSEPH M. CHIOFFI, Vice President and Assistant Secretary since August 2005.
Managing Counsel of BNY Mellon, and an officer of 70 investment companies (comprised of 169 portfolios) managed by the Manager. He is 53 years old and has been an employee of the Manager since June 2000.
JOHN B. HAMMALIAN, Vice President and Assistant Secretary since August 2005.
Senior Managing Counsel of BNY Mellon, and an officer of 70 investment companies (comprised of 169 portfolios) managed by the Manager. He is 52 years old and has been an employee of the Manager since February 1991.
MAUREEN E. KANE, Vice President and Assistant Secretary since April 2015.
Managing Counsel of BNY Mellon since July 2014; from October 2004 until July 2014, General Counsel, and from May 2009 until July 2014, Chief Compliance Officer of Century Capital Management. She is an officer of 70 investment companies (comprised of 169 portfolios) managed by the Manager. She is 53 years old and has been an employee of the Manager since July 2014.
SARAH S. KELLEHER, Vice President and Assistant Secretary since April 2014.
Senior Counsel of BNY Mellon, and an officer of 70 investment companies (comprised of 169 portfolios) managed by the Manager; from August 2005 to March 2013, Associate General Counsel of Third Avenue Management. She is 39 years old and has been an employee of the Manager since March 2013.
JEFF PRUSNOFSKY, Vice President and Assistant Secretary since August 2005.
Senior Managing Counsel of BNY Mellon, and an officer of 70 investment companies (comprised of 169 portfolios) managed by the Manager. He is 50 years old and has been an employee of the Manager since October 1990.
JAMES WINDELS, Treasurer since November 2001.
Director – Mutual Fund Accounting of the Manager, and an officer of 70 investment companies (comprised of 169 portfolios) managed by the Manager. He is 56 years old and has been an employee of the Manager since April 1985.
33
OFFICERS OF THE FUND (Unaudited) (continued)
RICHARD CASSARO, Assistant Treasurer since January 2008.
Senior Accounting Manager – Money Market and Municipal Bond Funds of the Manager, and an officer of 70 investment companies (comprised of 169 portfolios) managed by the Manager. He is 56 years old and has been an employee of the Manager since September 1982.
GAVIN C. REILLY, Assistant Treasurer since December 2005.
Tax Manager of the Investment Accounting and Support Department of the Manager, and an officer of 70 investment companies (comprised of 169 portfolios) managed by the Manager. He is 47 years old and has been an employee of the Manager since April 1991.
ROBERT S. ROBOL, Assistant Treasurer since August 2005.
Senior Accounting Manager – Fixed Income Funds of the Manager, and an officer of 70 investment companies (comprised of 169 portfolios) managed by the Manager. He is 51 years old and has been an employee of the Manager since October 1988.
ROBERT SALVIOLO, Assistant Treasurer since July 2007.
Senior Accounting Manager – Equity Funds of the Manager, and an officer of 70 investment companies (comprised of 169 portfolios) managed by the Manager. He is 48 years old and has been an employee of the Manager since June 1989.
ROBERT SVAGNA, Assistant Treasurer since December 2002.
Senior Accounting Manager – Equity Funds of the Manager, and an officer of 70 investment companies (comprised of 169 portfolios) managed by the Manager. He is 48 years old and has been an employee of the Manager since November 1990.
JOSEPH W. CONNOLLY, Chief Compliance Officer since October 2004.
Chief Compliance Officer of the Manager and The Dreyfus Family of Funds (70 investment companies, comprised of 169 portfolios). He is 58 years old and has served in various capacities with the Manager since 1980, including manager of the firm’s Fund Accounting Department from 1997 through October 2001.
34
NOTES
35
NOTES
36
NOTES
37
Dreyfus Technology Growth Fund
200 Park Avenue
New York, NY 10166
Manager
The Dreyfus Corporation
200 Park Avenue
New York, NY 10166
Custodian
The Bank of New York Mellon
225 Liberty Street
New York, NY 10286
Transfer Agent &
Dividend Disbursing Agent
Dreyfus Transfer, Inc.
200 Park Avenue
New York, NY 10166
Distributor
MBSC Securities Corporation
200 Park Avenue
New York, NY 10166
| | |
Ticker Symbols: | Class A: DTGRX Class C: DTGCX Class I: DGVRX |
Telephone Call your financial representative or 1-800-DREYFUS
Mail The Dreyfus Family of Funds, 144 Glenn Curtiss Boulevard, Uniondale, NY 11556-0144
E-mail Send your request to info@dreyfus.com
Internet Information can be viewed online or downloaded at www.dreyfus.com
The fund files its complete schedule of portfolio holdings with the Securities and Exchange Commission (“SEC”) for the first and third quarters of each fiscal year on Form N-Q. The fund’s Forms N-Q are available on the SEC’s website at www.sec.gov and may be reviewed and copied at the SEC’s Public Reference Room in Washington, DC. (phone 1-800-SEC-0330 for information).
Information regarding how the fund voted proxies related to portfolio securities for the most recent 12-month period ended June 30 is available at www.dreyfus.com and on the SEC’s website at www.sec.gov and without charge, upon request, by calling 1-800-DREYFUS.
| | |
© 2015 MBSC Securities Corporation | 
0255AR0815 |
Item 2. Code of Ethics.
The Registrant has adopted a code of ethics that applies to the Registrant's principal executive officer, principal financial officer, principal accounting officer or controller, or persons performing similar functions. There have been no amendments to, or waivers in connection with, the Code of Ethics during the period covered by this Report.
Item 3. Audit Committee Financial Expert.
The Registrant's Board has determined that Mr. David P. Feldman, a member of the Audit Committee of the Board, is an audit committee financial expert as defined by the Securities and Exchange Commission (the "SEC"). Mr. Feldman is "independent" as defined by the SEC for purposes of audit committee financial expert determinations.
Item 4. Principal Accountant Fees and Services.
(a) Audit Fees. The aggregate fees billed for each of the last two fiscal years (the "Reporting Periods") for professional services rendered by the Registrant's principal accountant (the "Auditor") for the audit of the Registrant's annual financial statements or services that are normally provided by the Auditor in connection with the statutory and regulatory filings or engagements for the Reporting Periods, were $236,784 in 2014 and $242,699 in 2015.
(b) Audit-Related Fees. The aggregate fees billed in the Reporting Periods for assurance and related services by the Auditor that are reasonably related to the performance of the audit of the Registrant's financial statements and are not reported under paragraph (a) of this Item 4 were $84,840 in 2014 and $43,914 in 2015. These services consisted of one or more of the following: (i) agreed upon procedures related to compliance with Internal Revenue Code section 817(h), (ii) security counts required by Rule 17f-2 under the Investment Company Act of 1940, as amended, (iii) advisory services as to the accounting or disclosure treatment of Registrant transactions or events and (iv) advisory services to the accounting or disclosure treatment of the actual or potential impact to the Registrant of final or proposed rules, standards or interpretations by the Securities and Exchange Commission, the Financial Accounting Standards Boards or other regulatory or standard-setting bodies.
The aggregate fees billed in the Reporting Periods for non-audit assurance and related services by the Auditor to the Registrant's investment adviser (not including any sub-investment adviser whose role is primarily portfolio management and is subcontracted with or overseen by another investment adviser), and any entity controlling, controlled by or under common control with the investment adviser that provides ongoing services to the Registrant ("Service Affiliates"), that were reasonably related to the performance of the annual audit of the Service Affiliate, which required pre-approval by the Audit Committee were $0 in 2014 and $0 in 2015.
(c) Tax Fees. The aggregate fees billed in the Reporting Periods for professional services rendered by the Auditor for tax compliance, tax advice, and tax planning ("Tax Services") were $26,820 in 2014 and $32,947 in 2015. These services consisted of: (i) review or preparation of U.S. federal, state, local and excise tax returns; (ii) U.S. federal, state and local tax planning, advice and assistance regarding statutory, regulatory or administrative developments; (iii) tax advice regarding tax qualification matters and/or treatment of various financial instruments held or proposed to be acquired or held, and (iv) determination of Passive Foreign Investment Companies. The aggregate fees billed in the Reporting Periods for Tax Services by the Auditor to Service Affiliates, which required pre-approval by the Audit Committee were $0 in 2014 and $0 in 2015.
(d) All Other Fees. The aggregate fees billed in the Reporting Periods for products and services provided by the Auditor, other than the services reported in paragraphs (a) through (c) of this Item, were $3,828 in 2014 and $22,057 in 2015. [These services included a review of the Registrant's anti-money laundering program].
The aggregate fees billed in the Reporting Periods for Non-Audit Services by the Auditor to Service Affiliates, other than the services reported in paragraphs (b) through (c) of this Item, which required pre-approval by the Audit Committee, were $0 in 2014 and $0 in 2015.
(e)(1) Audit Committee Pre-Approval Policies and Procedures. The Registrant's Audit Committee has established policies and procedures (the "Policy") for pre-approval (within specified fee limits) of the Auditor's engagements for non-audit services to the Registrant and Service Affiliates without specific case-by-case consideration. The pre-approved services in the Policy can include pre-approved audit services, pre-approved audit-related services, pre-approved tax services and pre-approved all other services. Pre-approval considerations include whether the proposed services are compatible with maintaining the Auditor's independence. Pre-approvals pursuant to the Policy are considered annually.
(e)(2) Note: None of the services described in paragraphs (b) through (d) of this Item 4 were approved by the Audit Committee pursuant to paragraph (c)(7)(i)(C) of Rule 2-01 of Regulation S-X.
(f) None of the hours expended on the principal accountant's engagement to audit the registrant's financial statements for the most recent fiscal year were attributed to work performed by persons other than the principal account's full-time, permanent employees.
Non-Audit Fees. The aggregate non-audit fees billed by the Auditor for services rendered to the Registrant, and rendered to Service Affiliates, for the Reporting Periods were $32,746,283 in 2014 and $21,000,680 in 2015.
Auditor Independence. The Registrant's Audit Committee has considered whether the provision of non-audit services that were rendered to Service Affiliates, which were not pre-approved (not requiring pre-approval), is compatible with maintaining the Auditor's independence.
Item 5. Audit Committee of Listed Registrants.
Not applicable. [CLOSED-END FUNDS ONLY]
Item 6. Investments.
(a) Not applicable.
Item 7. Disclosure of Proxy Voting Policies and Procedures for Closed-End Management Investment Companies.
Not applicable. [CLOSED-END FUNDS ONLY]
Item 8. Portfolio Managers of Closed-End Management Investment Companies.
Not applicable. [CLOSED-END FUNDS ONLY, beginning with reports for periods ended on and after December 31, 2005]
Item 9. Purchases of Equity Securities by Closed-End Management Investment Companies and Affiliated Purchasers.
Not applicable. [CLOSED-END FUNDS ONLY]
Item 10. Submission of Matters to a Vote of Security Holders.
There have been no material changes to the procedures applicable to Item 10.
Item 11. Controls and Procedures.
(a) The Registrant's principal executive and principal financial officers have concluded, based on their evaluation of the Registrant's disclosure controls and procedures as of a date within 90 days of the filing date of this report, that the Registrant's disclosure controls and procedures are reasonably designed to ensure that information required to be disclosed by the Registrant on Form N-CSR is recorded, processed, summarized and reported within the required time periods and that information required to be disclosed by the Registrant in the reports that it files or submits on Form N-CSR is accumulated and communicated to the Registrant's management, including its principal executive and principal financial officers, as appropriate to allow timely decisions regarding required disclosure.
(b) There were no changes to the Registrant's internal control over financial reporting that occurred during the second fiscal quarter of the period covered by this report that have materially affected, or are reasonably likely to materially affect, the Registrant's internal control over financial reporting.
Item 12. Exhibits.
(a)(1) Code of ethics referred to in Item 2.
(a)(2) Certifications of principal executive and principal financial officers as required by Rule 30a-2(a) under the Investment Company Act of 1940.
(a)(3) Not applicable.
(b) Certification of principal executive and principal financial officers as required by Rule 30a-2(b) under the Investment Company Act of 1940.
SIGNATURES
Pursuant to the requirements of the Securities Exchange Act of 1934 and the Investment Company Act of 1940, the Registrant has duly caused this Report to be signed on its behalf by the undersigned, thereunto duly authorized.
Advantage Funds, Inc.
By: /s/ Bradley J. Skapyak
Bradley J. Skapyak,
President
Date: October 22, 2015
Pursuant to the requirements of the Securities Exchange Act of 1934 and the Investment Company Act of 1940, this Report has been signed below by the following persons on behalf of the Registrant and in the capacities and on the dates indicated.
By: /s/ Bradley J. Skapyak
Bradley J. Skapyak,
President
Date: October 22, 2015
By: /s/ James Windels
James Windels,
Treasurer
Date: October 22, 2015
EXHIBIT INDEX
(a)(1) Code of ethics referred to in Item 2.
(a)(2) Certifications of principal executive and principal financial officers as required by Rule 30a-2(a) under the Investment Company Act of 1940. (EX-99.CERT)
(b) Certification of principal executive and principal financial officers as required by Rule 30a-2(b) under the Investment Company Act of 1940. (EX-99.906CERT)