UNITED STATES
SECURITIES AND EXCHANGE COMMISSION
Washington, D.C. 20549
FORM N-CSR
CERTIFIED SHAREHOLDER REPORT OF REGISTERED MANAGEMENT
INVESTMENT COMPANIES
Investment Company Act file number | 811-07123 |
| |
| Advantage Funds, Inc. | |
| (Exact name of Registrant as specified in charter) | |
| | |
| c/o The Dreyfus Corporation 200 Park Avenue New York, New York 10166 | |
| (Address of principal executive offices) (Zip code) | |
| | |
| Bennett A. MacDougall, Esq. 200 Park Avenue New York, New York 10166 | |
| (Name and address of agent for service) | |
|
Registrant's telephone number, including area code: | (212) 922-6400 |
| |
Date of fiscal year end: | 08/31 | |
Date of reporting period: | 08/31/17 | |
| | | | | | | |
The following N-CSR relates only to the Registrant's series listed below and does not relate to any series of the Registrant with a different fiscal year end and, therefore, different N-CSR reporting requirements. A separate N-CSR will be filed for any series with a different fiscal year end, as appropriate.
Dreyfus Opportunistic Midcap Value Fund
Dreyfus Opportunistic Small Cap Fund
Dreyfus Strategic Value Fund
Dreyfus Structured Midcap Fund
Dreyfus Technology Growth Fund
FORM N-CSR
Item 1. Reports to Stockholders.
Dreyfus Opportunistic Midcap Value Fund
| | | |

| | ANNUAL REPORT
August 31, 2017 |
| |
Save time. Save paper. View your next shareholder report online as soon as it’s available. Log into www.dreyfus.com and sign up for Dreyfus eCommunications. It’s simple and only takes a few minutes. |
| |
The views expressed in this report reflect those of the portfolio manager(s) only through the end of the period covered and do not necessarily represent the views of Dreyfus or any other person in the Dreyfus organization. Any such views are subject to change at any time based upon market or other conditions and Dreyfus disclaims any responsibility to update such views. These views may not be relied on as investment advice and, because investment decisions for a Dreyfus fund are based on numerous factors, may not be relied on as an indication of trading intent on behalf of any Dreyfus fund. |
| |
Not FDIC-Insured • Not Bank-Guaranteed • May Lose Value |
Contents
THE FUND
FOR MORE INFORMATION
Back Cover
| | | | |
| |
Dreyfus Opportunistic Midcap Value Fund
| | The Fund |
A LETTER FROM THE CEO OF DREYFUS
Dear Shareholder:
We are pleased to present this annual report for Dreyfus Opportunistic Midcap Value Fund, covering the 12-month period from September 1, 2016 through August 31, 2017. For information about how the fund performed during the reporting period, as well as general market perspectives, we provide a Discussion of Fund Performance on the pages that follow.
Stocks set a series of new record highs and bonds produced mixed results over the past year in response to changing economic and political conditions. Financial markets during the final months of 2016 were dominated by the election of a new U.S. presidential administration. Equities surged higher in anticipation of more business-friendly regulatory, tax, and fiscal policies, but high-quality bonds generally lost value due to expectations of rising interest rates and accelerating inflation in a stronger economy. Despite a series of short-term interest-rate hikes, bonds recovered over the first eight months of 2017 when it became clearer that major tax and fiscal reforms would take time and political capital to enact. Stocks continued to rally, led by large growth-oriented companies, as corporate earnings grew and global economic conditions improved.
The markets’ recent strong performance has been supported by solid underlying fundamentals. While we currently expect these favorable conditions to persist, we remain watchful for economic and political developments that could derail the rallies. As always, we encourage you to discuss the risks and opportunities of today’s investment environment with your financial advisor.
Thank you for your continued confidence and support.
Sincerely,

Mark D. Santero
Chief Executive Officer
The Dreyfus Corporation
September 15, 2017
2
DISCUSSION OF FUND PERFORMANCE
For the period from September 1, 2016 through August 31, 2017, as provided by David A. Daglio, James Boyd, and Dale Dutile, Primary Portfolio Managers
Market and Fund Performance Overview
For the 12-month period ended August 31, 2017, Dreyfus Opportunistic Midcap Value Fund’s Class A shares produced a total return of 13.28%, Class C shares returned 12.44%, Class I shares returned 13.63%, and Class Y shares returned 13.71%.1 In comparison, the fund’s benchmark, the Russell Midcap® Value Index (the “Index”), produced a 10.82% total return for the same period.2
Stocks gained ground amid better-than-expected corporate earnings, improving economic prospects, and positive investor sentiment in the wake of the U.S. presidential election. Our security selection and sector allocation strategies in the financials, energy, real estate, and information technology sectors enabled the fund to outperform its benchmark.
The Fund’s Investment Approach
The fund seeks to surpass the performance of the Index by investing in mid-cap companies with market capitalizations between $1 billion and $25 billion at the time of purchase. The fund’s portfolio managers identify potential investments through extensive fundamental and quantitative research. The fund focuses on individual stock selection (a “bottom-up” approach), emphasizing three key factors: relative value, business health, and business momentum.
The fund’s portfolio managers use an opportunistic value approach to identify stocks whose current market prices trade at a large discount to their intrinsic value, as calculated by the portfolio managers. The opportunistic value style attempts to benefit from valuation inefficiencies and underappreciated fundamental prospects present in the marketplace. The portfolio managers use mid-cycle estimates, growth prospects, the identification of a revaluation catalyst and competitive advantages as some of the factors in the valuation assessment.
Rising Corporate Earnings Drove Markets Higher
While political uncertainties caused U.S. stocks to dip in the weeks before the 2016 presidential election, equity markets were reenergized in November and December when investors began to anticipate lower corporate taxes, reduced regulatory constraints on business, and increased infrastructure spending from a new presidential administration.
The market’s advance slowed in the spring when it became clearer that tax and fiscal reforms were far from certain, but the rally soon resumed in the midst of strong corporate earnings and encouraging economic data. However, market leadership shifted in the spring from smaller, value-oriented stocks to larger, more growth-oriented industry leaders. In this environment, mid-cap stocks generally produced lower returns than large-cap stocks, and value-oriented stocks lagged growth stocks for the reporting period overall.
Selection and Allocation Strategies Buoyed Fund Results
The fund outperformed the Index over the reporting period due in part to the success of our security selection strategy. In the financials sector, brokerage firms E*TRADE Financial, TD Ameritrade Holdings, and Raymond James Financial advanced after gaining market share. Student loans provider SLM benefited from higher origination volumes. Diversified financial company Leucadia National saw the start of cyclical earning recoveries in its Jefferies investment banking unit and its National Beef segment. Among banks, KeyCorp gained value in anticipation
3
DISCUSSION OF FUND PERFORMANCE (continued)
of a more business-friendly regulatory environment. In the information technology sector, favorable stock selections included commerce-enabling technology provider First Data, where a new management team boosted earnings. Semiconductor equipment maker Teradyne encountered rising demand for testing equipment and new “cobot” products, and Lam Research achieved strong order volumes. Electronic design and test solutions company Keysight Technologies received an acquisition offer at a premium to its stock price at the time.
The fund’s sector allocation strategy proved especially effective in the energy sector, as underweighted exposure to the lagging industry group bolstered relative results. Favorable stock selections—such as refiner Andeavor (formerly Tesoro)—also added value, enabling the fund to produce positive absolute returns in a market segment that weighed on the Index. Underweighted exposure to the real estate sector also helped cushion the impact of a relatively weak industry group.
Disappointments during the reporting period included the industrials sector, as car rental agency Hertz Global Holdings was hurt by declining used car prices, and distributor HD Supply Holdings encountered order handling difficulties. In the consumer discretionary sector, retailer Bed Bath & Beyond failed to execute effectively on its turnaround strategy, and specialty retailers such as Williams-Sonoma struggled in a generally challenging environment for brick-and-mortar stores.
Focusing on Individual Mid-Cap Value Companies
We expect to continue to choose investments one company at a time, according to their individual strengths and future prospects. Nonetheless, it is worth noting that, absent unexpected geopolitical shocks, fundamentals currently appear strong for mid-cap value companies. We recently trimmed holdings in the financials, industrials, and consumer discretionary sectors, and we redeployed those assets to other opportunities among information technology, materials, and health care companies. As of the reporting period’s end, the fund held overweighted exposure to the information technology, financials, materials and health care sectors, but we have identified relatively few opportunities in the energy, utilities, telecommunication services, and consumer discretionary sectors.
September 15, 2017
1 Total return includes reinvestment of dividends and any capital gains paid and does not take into consideration the maximum initial sales charge in the case of Class A shares, or the applicable contingent deferred sales charge imposed on redemptions in the case of Class C shares. Had these charges been reflected, returns would have been lower. Past performance is no guarantee of future results. Share price and investment return fluctuate such that upon redemption, fund shares may be worth more or less than their original cost.
2 Source: Lipper Inc. — The Russell Midcap® Value Index measures the performance of the mid-cap value segment of the U.S. equity universe. It includes those Russell Midcap® Index companies that are considered more value-oriented relative to the overall market as defined by Russell’s leading style methodology. The Russell Midcap® Value Index is constructed to provide a comprehensive and unbiased barometer of the mid-cap value market. The Index is completely reconstituted annually to ensure larger stocks do not distort the performance and characteristics of the true mid-cap value market. Investors cannot invest directly in any index.
Please note: the position in any security highlighted with italicized typeface was sold during the reporting period.
Stocks of small- and/or mid-cap companies often experience sharper price fluctuations than stocks of large-cap companies.
4
FUND PERFORMANCE
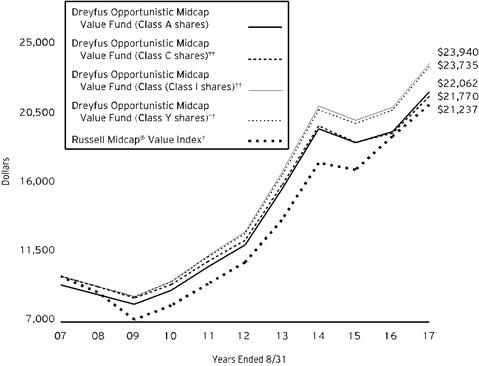
Comparison of change in value of $10,000 investment in Dreyfus Opportunistic Midcap Value Fund Class A shares, Class C shares, Class I shares and Class Y shares and the Russell Midcap® Value Index (the “Index”)
† Source: Lipper Inc.
†† The total return figures presented for Class C shares of the fund reflect the performance of the fund’s Class A shares for the period prior to 5/30/08 (the inception date for Class C shares), not reflecting the applicable sales charges for Class A shares.
The total return figures presented for Class I shares of the fund reflect the performance of the fund’s Class A shares for the period prior to 5/30/08 (the inception date for Class I shares), not reflecting the applicable sales charges for Class A shares.
The total return figures presented for Class Y shares of the fund reflect the performance of the fund’s Class A shares for the period prior to 7/1/13 (the inception date for Class Y shares), not reflecting the applicable sales charges for Class A shares.
Past performance is not predictive of future performance.
The above graph compares a $10,000 investment made in each of the Class A, Class C, Class I and Class Y shares of Dreyfus Opportunistic Midcap Value Fund on 8/31/07 to a $10,000 investment made in the Index on that date. All dividends and capital gain distributions are reinvested.
The fund’s performance shown in the line graph above takes into account the maximum initial sales charge on Class A shares and all other applicable fees and expenses on all classes. The Index measures the performance of the mid-cap value segment of the U.S. equity universe. It includes those Russell Midcap® Index companies that are considered more value-oriented relative to the overall market as defined by Russell’s leading style methodology. The Index is constructed to provide a comprehensive and unbiased barometer of the mid-cap value market. The Index is completely reconstituted annually to ensure larger stocks do not distort the performance and characteristics of the true mid-cap value market. Unlike a mutual fund, the Index is not subject to charges, fees and other expenses. Investors cannot invest directly in any index. Further information relating to fund performance, including expense reimbursements, if applicable, is contained in the Financial Highlights section of the prospectus and elsewhere in this report.
5
FUND PERFORMANCE (continued)
| | | | | | | | |
Average Annual Total Returns as of 8/31/17 | | | |
| | Inception
Date | 1 Year | 5 Years | | 10 Years | |
Class A shares | | | | | | |
with maximum sales charge (5.75%) | 9/29/95 | 6.75% | 11.51% | | 8.23% | |
without sales charge | 9/29/95 | 13.28% | 12.84% | | 8.88% | |
Class C shares | | | | | | |
with applicable redemption charge † | 5/30/08 | 11.44% | 12.00% | | 8.09%†† | |
without redemption | 5/30/08 | 12.44% | 12.00% | | 8.09%†† | |
Class I shares | | 5/30/08 | 13.63% | 13.12% | | 9.12%†† | |
Class Y shares | | 7/1/13 | 13.71% | 13.16%†† | | 9.03%†† | |
Russell Midcap® Value Index | 10.82% | 14.22% | | 7.82% | |
† The maximum contingent deferred sales charge for Class C shares is 1% for shares redeemed within one year of the date of purchase.
†† The total return performance figures presented for Class C shares of the fund reflect the performance of the fund’s Class A shares for the period prior to 5/30/08 (the inception date for Class C shares), not reflecting the applicable sales charges for Class A shares.
The total return performance figures presented for Class I shares of the fund reflect the performance of the fund’s Class A shares for the period prior to 5/30/08 (the inception date for Class I shares), not reflecting the applicable sales charges for Class A shares.
The total return performance figures presented for Class Y shares of the fund reflect the performance of the fund’s Class A shares for the period prior to 7/1/13 (the inception date for Class Y shares), not reflecting the applicable sales charges for Class A shares.
The performance data quoted represents past performance, which is no guarantee of future results. Share price and investment return fluctuate and an investor’s shares may be worth more or less than original cost upon redemption. Current performance may be lower or higher than the performance quoted. Go to Dreyfus.com for the fund’s most recent month-end returns.
The fund’s performance shown in the graph and table does not reflect the deduction of taxes that a shareholder would pay on fund distributions or the redemption of fund shares. In addition to the performance of Class A shares shown with and without a maximum sales charge, the fund’s performance shown in the table takes into account all other applicable fees and expenses on all classes.
6
UNDERSTANDING YOUR FUND’S EXPENSES (Unaudited)
As a mutual fund investor, you pay ongoing expenses, such as management fees and other expenses. Using the information below, you can estimate how these expenses affect your investment and compare them with the expenses of other funds. You also may pay one-time transaction expenses, including sales charges (loads) and redemption fees, which are not shown in this section and would have resulted in higher total expenses. For more information, see your fund’s prospectus or talk to your financial adviser.
Review your fund’s expenses
The table below shows the expenses you would have paid on a $1,000 investment in Dreyfus Opportunistic Midcap Value Fund from March 1, 2017 to August 31, 2017. It also shows how much a $1,000 investment would be worth at the close of the period, assuming actual returns and expenses.
| | | | | | | | | | | | |
Expenses and Value of a $1,000 Investment | | |
assuming actual returns for the six months ended August 31, 2017 |
| | | | | | | | |
| | | | Class A | Class C | Class I | Class Y |
Expenses paid per $1,000† | | $5.82 | | $9.61 | | $4.47 | | $4.02 |
Ending value (after expenses) | | $989.30 | | $985.90 | | $990.70 | | $991.30 |
COMPARING YOUR FUND’S EXPENSES
WITH THOSE OF OTHER FUNDS (Unaudited)
Using the SEC’s method to compare expenses
The Securities and Exchange Commission (SEC) has established guidelines to help investors assess fund expenses. Per these guidelines, the table below shows your fund’s expenses based on a $1,000 investment, assuming a hypothetical 5% annualized return. You can use this information to compare the ongoing expenses (but not transaction expenses or total cost) of investing in the fund with those of other funds. All mutual fund shareholder reports will provide this information to help you make this comparison. Please note that you cannot use this information to estimate your actual ending account balance and expenses paid during the period.
| | | | | | | | | | | | |
Expenses and Value of a $1,000 Investment | | |
assuming a hypothetical 5% annualized return for the six months ended August 31, 2017 |
| | | | | | | | |
| | | | Class A | Class C | Class I | Class Y |
Expenses paid per $1,000† | | $5.90 | | $9.75 | | $4.53 | | $4.08 |
Ending value (after expenses) | | $1,019.36 | | $1,015.53 | | $1,020.72 | | $1,021.17 |
† Expenses are equal to the fund’s annualized expense ratio of 1.16% for Class A, 1.92% for Class C, .89% for Class I and .80% for Class Y, multiplied by the average account value over the period, multiplied by 184/365 (to reflect the one-half year period).
7
STATEMENT OF INVESTMENTS
August 31, 2017
| | | | | | | | |
| |
Description | | | | Shares | | Value ($) | |
Common Stocks - 99.2% | | | | | |
Automobiles & Components - .9% | | | | | |
Visteon | | | | 83,463 | a | 9,634,969 | |
Banks - 2.5% | | | | | |
Huntington Bancshares | | | | 926,641 | | 11,666,410 | |
KeyCorp | | | | 909,959 | | 15,660,394 | |
| | | | | 27,326,804 | |
Capital Goods - 3.4% | | | | | |
Hubbell | | | | 159,830 | | 18,027,226 | |
PACCAR | | | | 278,555 | | 18,476,553 | |
| | | | | 36,503,779 | |
Commercial & Professional Services - 1.4% | | | | | |
Nielsen Holdings | | | | 397,643 | | 15,448,431 | |
Consumer Services - .5% | | | | | |
Caesars Entertainment | | | | 442,583 | a | 5,133,963 | |
Diversified Financials - 23.7% | | | | | |
Capital One Financial | | | | 452,720 | | 36,041,039 | |
E*TRADE Financial | | | | 1,030,918 | a | 42,277,947 | |
Eaton Vance | | | | 199,682 | | 9,500,870 | |
Franklin Resources | | | | 480,732 | | 20,782,044 | |
Leucadia National | | | | 1,491,058 | | 35,308,253 | |
Raymond James Financial | | | | 330,773 | | 25,906,141 | |
SLM | | | | 3,519,972 | a | 35,798,115 | |
Synchrony Financial | | | | 951,149 | | 29,285,878 | |
TD Ameritrade Holding | | | | 506,512 | | 21,942,100 | |
| | | | | 256,842,387 | |
Energy - 3.6% | | | | | |
Andeavor | | | | 241,823 | | 24,218,573 | |
Cheniere Energy | | | | 337,603 | a | 14,446,032 | |
| | | | | 38,664,605 | |
Exchange-Traded Funds - .3% | | | | | |
SPDR S&P MidCap 400 ETF Trust | | | | 10,277 | | 3,243,216 | |
Food & Staples Retailing - 1.2% | | | | | |
US Foods Holding | | | | 472,091 | a | 12,958,898 | |
Food, Beverage & Tobacco - 3.3% | | | | | |
Archer-Daniels-Midland | | | | 865,054 | | 35,744,031 | |
Health Care Equipment & Services - 5.4% | | | | | |
Boston Scientific | | | | 381,157 | a | 10,500,875 | |
8
| | | | | | | | |
| |
Description | | | | Shares | | Value ($) | |
Common Stocks - 99.2% (continued) | | | | | |
Health Care Equipment & Services - 5.4% (continued) | | | | | |
Humana | | | | 69,424 | | 17,885,011 | |
Zimmer Biomet Holdings | | | | 266,980 | | 30,507,805 | |
| | | | | 58,893,691 | |
Insurance - 1.0% | | | | | |
Athene Holding, Cl. A | | | | 203,974 | | 10,914,649 | |
Materials - 12.0% | | | | | |
Freeport-McMoRan | | | | 2,013,723 | a | 29,762,826 | |
International Paper | | | | 581,930 | | 31,348,569 | |
Methanex | | | | 261,551 | | 13,365,256 | |
Newmont Mining | | | | 821,604 | | 31,500,297 | |
Westlake Chemical | | | | 315,610 | | 24,273,565 | |
| | | | | 130,250,513 | |
Media - 2.7% | | | | | |
CBS, Cl. B | | | | 48,388 | | 3,099,735 | |
Sinclair Broadcast Group, Cl. A | | | | 856,439 | | 25,907,280 | |
| | | | | 29,007,015 | |
Pharmaceuticals, Biotechnology & Life Sciences - 7.4% | | | | | |
Alexion Pharmaceuticals | | | | 267,661 | a | 38,117,603 | |
Jazz Pharmaceuticals | | | | 228,369 | a | 34,109,194 | |
Sage Therapeutics | | | | 96,180 | a | 7,910,805 | |
| | | | | 80,137,602 | |
Semiconductors & Semiconductor Equipment - 6.5% | | | | | |
Maxim Integrated Products | | | | 527,026 | | 24,591,033 | |
Microsemi | | | | 314,038 | a | 15,821,234 | |
Teradyne | | | | 749,320 | | 26,683,285 | |
United Microelectronics, ADR | | | | 1,576,067 | | 3,940,168 | |
| | | | | 71,035,720 | |
Software & Services - 10.8% | | | | | |
Broadridge Financial Solutions | | | | 117,920 | | 9,213,090 | |
DXC Technology | | | | 140,895 | | 11,976,075 | |
eBay | | | | 135,015 | a | 4,878,092 | |
First Data, Cl. A | | | | 2,216,477 | a | 40,805,342 | |
Nuance Communications | | | | 1,300,551 | a | 20,899,855 | |
Teradata | | | | 910,792 | a | 29,072,481 | |
| | | | | 116,844,935 | |
Technology Hardware & Equipment - 7.7% | | | | | |
Ciena | | | | 766,662 | a | 16,567,566 | |
Hewlett Packard Enterprise | | | | 870,684 | | 15,724,553 | |
9
STATEMENT OF INVESTMENTS (continued)
| | | | | | | | |
| |
Description | | | | Shares | | Value ($) | |
Common Stocks - 99.2% (continued) | | | | | |
Technology Hardware & Equipment - 7.7% (continued) | | | | | |
Viavi Solutions | | | | 1,937,008 | a | 19,447,560 | |
Xerox | | | | 637,085 | | 20,558,733 | |
Zebra Technologies, Cl. A | | | | 104,437 | a | 10,766,410 | |
| | | | | 83,064,822 | |
Transportation - 4.3% | | | | | |
J.B. Hunt Transport Services | | | | 124,227 | | 12,284,808 | |
Norfolk Southern | | | | 79,448 | | 9,575,073 | |
Swift Transportation | | | | 886,019 | a | 24,852,833 | |
| | | | | 46,712,714 | |
Utilities - .6% | | | | | |
Calpine | | | | 430,234 | a | 6,324,440 | |
Total Common Stocks (cost $908,108,980) | | | | 1,074,687,184 | |
| | | | | | | | |
Other Investment - .2% | | | | | |
Registered Investment Company; | | | | | |
Dreyfus Institutional Preferred Government Plus Money Market Fund
(cost $2,081,600) | | | | 2,081,600 | b | 2,081,600 | |
Total Investments (cost $910,190,580) | | 99.4% | | 1,076,768,784 | |
Cash and Receivables (Net) | | .6% | | 6,558,269 | |
Net Assets | | 100.0% | | 1,083,327,053 | |
ADR—American Depository Receipt
ETF—Exchange-Traded Fund
SPDR—Standard & Poor's Depository Receipt
aNon-income producing security.
bInvestment in affiliated money market mutual fund.
10
| | |
Portfolio Summary (Unaudited) † | Value (%) |
Diversified Financials | 23.7 |
Materials | 12.0 |
Software & Services | 10.8 |
Technology Hardware & Equipment | 7.7 |
Pharmaceuticals, Biotechnology & Life Sciences | 7.4 |
Semiconductors & Semiconductor Equipment | 6.5 |
Health Care Equipment & Services | 5.4 |
Transportation | 4.3 |
Energy | 3.6 |
Capital Goods | 3.4 |
Food, Beverage & Tobacco | 3.3 |
Media | 2.7 |
Banks | 2.5 |
Commercial & Professional Services | 1.4 |
Food & Staples Retailing | 1.2 |
Insurance | 1.0 |
Automobiles & Components | .9 |
Utilities | .6 |
Consumer Services | .5 |
Exchange-Traded Funds | .3 |
Money Market Investment | .2 |
| | 99.4 |
† Based on net assets.
See notes to financial statements.
11
STATEMENT OF INVESTMENTS IN AFFILIATED ISSUERS
| | | | | | | |
Registered Investment Companies | Value
8/31/2016 ($) | Purchases ($) | Sales ($) | Value
8/31/2017 ($) | Net
Assets (%) | Dividends/
Distributions ($) |
Dreyfus Institutional Cash
Advantage Fund,
Institutional Shares | 18,406,000 | 14,777,168 | 33,183,168 | - | - | - |
Dreyfus Institutional Preferred Government Plus Money Market Fund | 3,006,949 | 461,355,858 | 462,281,207 | 2,081,600 | .2 | 52,082 |
Dreyfus Institutional Preferred Government Money Market Fund, Institutional Shares | - | 162,939,590 | 162,939,590 | - | - | - |
Total | 21,412,949 | 639,072,616 | 658,403,965 | 2,081,600 | .2 | 52,082 |
See notes to financial statements.
12
STATEMENT OF ASSETS AND LIABILITIES
August 31, 2017
| | | | | | | |
| | | | | | |
| | | Cost | | Value | |
Assets ($): | | | | |
Investments in securities—See Statement of Investments: | | | | |
Unaffiliated issuers | | 908,108,980 | | 1,074,687,184 | |
Affiliated issuers | | 2,081,600 | | 2,081,600 | |
Cash | | | | | 142,582 | |
Receivable for investment securities sold | | | | | 14,973,938 | |
Dividends receivable | | | | | 1,554,307 | |
Receivable for shares of Common Stock subscribed | | | | | 172,506 | |
Prepaid expenses | | | | | 45,536 | |
| | | | | 1,093,657,653 | |
Liabilities ($): | | | | |
Due to The Dreyfus Corporation and affiliates—Note 3(c) | | | | | 902,193 | |
Payable for investment securities purchased | | | | | 6,638,452 | |
Payable for shares of Common Stock redeemed | | | | | 2,500,038 | |
Interest payable—Note 2 | | | | | 110 | |
Accrued expenses | | | | | 289,807 | |
| | | | | 10,330,600 | |
Net Assets ($) | | | 1,083,327,053 | |
Composition of Net Assets ($): | | | | |
Paid-in capital | | | | | 825,157,931 | |
Accumulated undistributed investment income—net | | | | | 2,115,370 | |
Accumulated net realized gain (loss) on investments | | | | | 89,475,548 | |
Accumulated net unrealized appreciation (depreciation)
on investments | | | | 166,578,204 | |
Net Assets ($) | | | 1,083,327,053 | |
| | | | | | |
Net Asset Value Per Share | Class A | Class C | Class I | Class Y | |
Net Assets ($) | 509,760,936 | 62,608,447 | 501,820,923 | 9,136,747 | |
Shares Outstanding | 14,831,161 | 2,039,450 | 14,644,657 | 266,077 | |
Net Asset Value Per Share ($) | 34.37 | 30.70 | 34.27 | 34.34 | |
| | | | | | |
See notes to financial statements. | | | | | |
13
STATEMENT OF OPERATIONS
Year Ended August 31, 2017
| | | | | | | |
| | | | | | |
| | | | | | |
Investment Income ($): | | | | |
Income: | | | | |
Cash dividends (net of $50,437 foreign taxes withheld at source): | | | | |
Unaffiliated issuers | | | 15,754,115 | |
Affiliated issuers | | | 52,082 | |
Income from securities lending—Note 1(b) | | | 40,802 | |
Total Income | | | 15,846,999 | |
Expenses: | | | | |
Management fee—Note 3(a) | | | 9,226,463 | |
Shareholder servicing costs—Note 3(c) | | | 3,372,924 | |
Distribution fees—Note 3(b) | | | 536,320 | |
Directors’ fees and expenses—Note 3(d) | | | 90,375 | |
Custodian fees—Note 3(c) | | | 87,234 | |
Registration fees | | | 85,360 | |
Professional fees | | | 81,854 | |
Prospectus and shareholders’ reports | | | 77,763 | |
Loan commitment fees—Note 2 | | | 35,460 | |
Interest expense—Note 2 | | | 10,663 | |
Miscellaneous | | | 33,008 | |
Total Expenses | | | 13,637,424 | |
Less—reduction in fees due to earnings credits—Note 3(c) | | | (8,455) | |
Net Expenses | | | 13,628,969 | |
Investment Income—Net | | | 2,218,030 | |
Realized and Unrealized Gain (Loss) on Investments—Note 4 ($): | | |
Net realized gain (loss) on investments | 135,298,858 | |
Net unrealized appreciation (depreciation) on investments | | | 31,898,736 | |
Net Realized and Unrealized Gain (Loss) on Investments | | | 167,197,594 | |
Net Increase in Net Assets Resulting from Operations | | 169,415,624 | |
| | | | | | | |
See notes to financial statements. | | | | | |
14
STATEMENT OF CHANGES IN NET ASSETS
| | | | | | | | | | |
| | | | Year Ended August 31, |
| | | | 2017 | | | | 2016 | |
Operations ($): | | | | | | | | |
Investment income—net | | | 2,218,030 | | | | 2,846,092 | |
Net realized gain (loss) on investments | | 135,298,858 | | | | 33,387,974 | |
Net unrealized appreciation (depreciation)
on investments | | 31,898,736 | | | | (9,528,738) | |
Net Increase (Decrease) in Net Assets
Resulting from Operations | 169,415,624 | | | | 26,705,328 | |
Distributions to Shareholders from ($): | | | | | | | | |
Investment income—net: | | | | | | | | |
Class A | | | (150,447) | | | | - | |
Class I | | | (1,718,638) | | | | (378,487) | |
Class Y | | | (41,145) | | | | (201,480) | |
Net realized gain on investments: | | | | | | | | |
Class A | | | (34,720,829) | | | | (163,514,213) | |
Class C | | | (3,672,816) | | | | (18,133,204) | |
Class I | | | (21,342,132) | | | | (95,819,995) | |
Class Y | | | (376,578) | | | | (12,858,708) | |
Total Distributions | | | (62,022,585) | | | | (290,906,087) | |
Capital Stock Transactions ($): | | | | | | | | |
Net proceeds from shares sold: | | | | | | | | |
Class A | | | 75,094,482 | | | | 144,471,285 | |
Class C | | | 6,613,135 | | | | 9,703,250 | |
Class I | | | 284,476,355 | | | | 141,009,615 | |
Class Y | | | 6,198,203 | | | | 9,901,433 | |
Distributions reinvested: | | | | | | | | |
Class A | | | 32,052,598 | | | | 148,969,232 | |
Class C | | | 3,049,663 | | | | 14,641,322 | |
Class I | | | 22,018,042 | | | | 88,032,264 | |
Class Y | | | 312,777 | | | | 12,714,335 | |
Cost of shares redeemed: | | | | | | | | |
Class A | | | (452,533,679) | | | | (424,844,330) | |
Class C | | | (28,803,314) | | | | (46,692,551) | |
Class I | | | (340,780,615) | | | | (562,111,303) | |
Class Y | | | (15,338,617) | | | | (69,663,961) | |
Increase (Decrease) in Net Assets
from Capital Stock Transactions | (407,640,970) | | | | (533,869,409) | |
Total Increase (Decrease) in Net Assets | (300,247,931) | | | | (798,070,168) | |
Net Assets ($): | | | | | | | | |
Beginning of Period | | | 1,383,574,984 | | | | 2,181,645,152 | |
End of Period | | | 1,083,327,053 | | | | 1,383,574,984 | |
Undistributed investment income—net | 2,115,370 | | | | 1,905,676 | |
15
STATEMENT OF CHANGES IN NET ASSETS (continued)
| | | | | | | | | | |
| | | | Year Ended August 31, |
| | | | 2017 | | | | 2016 | |
Capital Share Transactions (Shares): | | | | | | | | |
Class A | | | | | | | | |
Shares sold | | | 2,248,398 | | | | 4,722,794 | |
Shares issued for distributions reinvested | | | 966,313 | | | | 5,163,578 | |
Shares redeemed | | | (13,502,201) | | | | (13,754,633) | |
Net Increase (Decrease) in Shares Outstanding | (10,287,490) | | | | (3,868,261) | |
Class Ca | | | | | | | | |
Shares sold | | | 218,979 | | | | 346,788 | |
Shares issued for distributions reinvested | | | 102,372 | | | | 558,402 | |
Shares redeemed | | | (963,162) | | | | (1,629,615) | |
Net Increase (Decrease) in Shares Outstanding | (641,811) | | | | (724,425) | |
Class Ia | | | | | | | | |
Shares sold | | | 8,483,733 | | | | 4,618,348 | |
Shares issued for distributions reinvested | | | 667,011 | | | | 3,065,191 | |
Shares redeemedb | | | (10,075,991) | | | | (16,927,149) | |
Net Increase (Decrease) in Shares Outstanding | (925,247) | | | | (9,243,610) | |
Class Y | | | | | | | | |
Shares sold | | | 186,843 | | | | 335,763 | |
Shares issued for distributions reinvested | | | 9,464 | | | | 442,084 | |
Shares redeemed | | | (475,970) | | | | (2,381,985) | |
Net Increase (Decrease) in Shares Outstanding | (279,663) | | | | (1,604,138) | |
| | | | | | | | | | |
a | During the period ended August 31, 2017, 348 Class C shares representing $10,555 were exchanged for 313 Class I shares and during the period ended August 31, 2016, 164 Class C shares representing $5,387 were exchanged for 152 Class I shares. | |
b | During the period ended August 31, 2016, 6,020,293 shares amounting to $216,790,748 were redeemed-in-kind resulting in a net realized gain on investments of $10,278,766.
| |
See notes to financial statements. | | | | | | | | |
16
FINANCIAL HIGHLIGHTS
The following tables describe the performance for each share class for the fiscal periods indicated. All information (except portfolio turnover rate) reflects financial results for a single fund share. Total return shows how much your investment in the fund would have increased (or decreased) during each period, assuming you had reinvested all dividends and distributions. These figures have been derived from the fund’s financial statements.
| | | | | | | | | | | |
| | | | | | |
| | |
| | Year Ended August 31, |
Class A Shares | | 2017 | 2016 | 2015 | 2014 | 2013 |
Per Share Data ($): | | | | | | |
Net asset value, beginning of period | | 31.72 | 36.97 | 43.17 | 38.27 | 29.47 |
Investment Operations: | | | | | | |
Investment income (loss)—net a | | .03 | .03 | (.02) | .05 | .03 |
Net realized and unrealized gain
(loss) on investments | | 4.13 | .82 | (1.79) | 9.10 | 8.83 |
Total from Investment Operations | | 4.16 | .85 | (1.81) | 9.15 | 8.86 |
Distributions: | | | | | �� | |
Dividends from investment
income—net | | (.01) | - | (.05) | - | (.06) |
Dividends from net realized gain
on investments | | (1.50) | (6.10) | (4.34) | (4.25) | - |
Total Distributions | | (1.51) | (6.10) | (4.39) | (4.25) | (.06) |
Net asset value, end of period | | 34.37 | 31.72 | 36.97 | 43.17 | 38.27 |
Total Return (%)b | | 13.28 | 3.95 | (4.72) | 25.32 | 30.11 |
Ratios/Supplemental Data (%): | | | | | | |
Ratio of total expenses to
average net assets | | 1.17 | 1.21 | 1.18 | 1.15 | 1.18 |
Ratio of net expenses to
average net assets | | 1.17 | 1.21 | 1.18 | 1.15 | 1.18 |
Ratio of net investment income (loss)
to average net assets | | .10 | .11 | (.05) | .12 | .08 |
Portfolio Turnover Rate | | 104.51 | 101.68 | 74.05 | 67.49 | 91.31 |
Net Assets, end of period ($ x 1,000) | | 509,761 | 796,686 | 1,071,713 | 1,417,535 | 1,079,346 |
a Based on average shares outstanding.
b Exclusive of sales charge.
See notes to financial statements.
17
FINANCIAL HIGHLIGHTS (continued)
| | | | | | | | | |
| | | | | | |
| | |
| | Year Ended August 31, |
Class C Shares | | | 2017 | 2016 | 2015 | 2014 | 2013 |
Per Share Data ($): | | | | | | | |
Net asset value, beginning of period | | | 28.68 | 34.26 | 40.55 | 36.44 | 28.22 |
Investment Operations: | | | | | | | |
Investment (loss)—net a | | | (.19) | (.18) | (.29) | (.26) | (.24) |
Net realized and unrealized gain
(loss) on investments | | | 3.71 | .70 | (1.66) | 8.62 | 8.46 |
Total from Investment Operations | | | 3.52 | .52 | (1.95) | 8.36 | 8.22 |
Distributions: | | | | | | | |
Dividends from net realized gain
on investments | | | (1.50) | (6.10) | (4.34) | (4.25) | - |
Net asset value, end of period | | | 30.70 | 28.68 | 34.26 | 40.55 | 36.44 |
Total Return (%)b | | | 12.44 | 3.19 | (5.41) | 24.35 | 29.13 |
Ratios/Supplemental Data (%): | | | | | | | |
Ratio of total expenses to
average net assets | | | 1.92 | 1.94 | 1.90 | 1.92 | 1.97 |
Ratio of net expenses to
average net assets | | | 1.92 | 1.94 | 1.90 | 1.92 | 1.97 |
Ratio of net investment (loss)
to average net assets | | | (.65) | (.62) | (.77) | (.66) | (.72) |
Portfolio Turnover Rate | | | 104.51 | 101.68 | 74.05 | 67.49 | 91.31 |
Net Assets, end of period ($ x 1,000) | | | 62,608 | 76,886 | 116,683 | 114,179 | 46,708 |
a Based on average shares outstanding.
b Exclusive of sales charge.
See notes to financial statements.
18
| | | | | | | | | | |
| | | | | | |
| | | | |
| | Year Ended August 31, |
Class I Shares | | | 2017 | 2016 | 2015 | 2014 | 2013 |
Per Share Data ($): | | | | | | | |
Net asset value, beginning of period | | | 31.64 | 36.83 | 43.01 | 38.12 | 29.38 |
Investment Operations: | | | | | | | |
Investment income—neta | | | .14 | .12 | .09 | .15 | .10 |
Net realized and unrealized gain
(loss) on investments | | | 4.11 | .81 | (1.78) | 9.07 | 8.77 |
Total from Investment Operations | | | 4.25 | .93 | (1.69) | 9.22 | 8.87 |
Distributions: | | | | | | | |
Dividends from investment
income—net | | | (.12) | (.02) | (.15) | (.08) | (.13) |
Dividends from net realized gain
on investments | | | (1.50) | (6.10) | (4.34) | (4.25) | - |
Total Distributions | | | (1.62) | (6.12) | (4.49) | (4.33) | (.13) |
Net asset value, end of period | | | 34.27 | 31.64 | 36.83 | 43.01 | 38.12 |
Total Return (%) | | | 13.63 | 4.23 | (4.43) | 25.62 | 30.26 |
Ratios/Supplemental Data (%): | | | | | | | |
Ratio of total expenses to
average net assets | | | .90 | .90 | .89 | .90 | .97 |
Ratio of net expenses to
average net assets | | | .90 | .90 | .89 | .90 | .97 |
Ratio of net investment income
to average net assets | | | .42 | .39 | .22 | .37 | .27 |
Portfolio Turnover Rate | | | 104.51 | 101.68 | 74.05 | 67.49 | 91.31 |
Net Assets, end of period ($ x 1,000) | | | 501,821 | 492,694 | 913,852 | 1,282,578 | 856,830 |
a Based on average shares outstanding.
See notes to financial statements.
19
FINANCIAL HIGHLIGHTS (continued)
| | | | | | | | |
| | | | | | |
| | | | |
| | Year Ended August 31, |
Class Y Shares | 2017 | 2016 | 2015 | 2014 | 2013a |
Per Share Data ($): | | | | | |
Net asset value, beginning of period | 31.72 | 36.93 | 43.12 | 38.12 | 37.48 |
Investment Operations: | | | | | |
Investment income—netb | .15 | .16 | .13 | .19 | .02 |
Net realized and unrealized gain
(loss) on investments | 4.13 | .83 | (1.78) | 9.17 | .62 |
Total from Investment Operations | 4.28 | .99 | (1.65) | 9.36 | .64 |
Distributions: | | | | | |
Dividends from investment
income—net | (.16) | (.10) | (.20) | (.11) | - |
Dividends from net realized gain
on investments | (1.50) | (6.10) | (4.34) | (4.25) | - |
Total Distributions | (1.66) | (6.20) | (4.54) | (4.36) | - |
Net asset value, end of period | 34.34 | 31.72 | 36.93 | 43.12 | 38.12 |
Total Return (%) | 13.71 | 4.40 | (4.34) | 26.02 | 1.74c |
Ratios/Supplemental Data (%): | | | | | |
Ratio of total expenses to
average net assets | .80 | .78 | .80 | .83 | .80d |
Ratio of net expenses to
average net assets | .80 | .78 | .80 | .83 | .80d |
Ratio of net investment income to average net assets | .49 | .53 | .30 | .50 | .33d |
Portfolio Turnover Rate | 104.51 | 101.68 | 74.05 | 67.49 | 91.31 |
Net Assets, end of period ($ x 1,000) | 9,137 | 17,308 | 79,397 | 25,147 | 1 |
a From July 1, 2013 (commencement of initial offering) to August 31, 2013.
b Based on average shares outstanding.
c Not annualized.
d Annualized.
See notes to financial statements.
20
NOTES TO FINANCIAL STATEMENTS
NOTE 1—Significant Accounting Policies:
Dreyfus Opportunistic Midcap Value Fund (the “fund”) is a separate diversified series of Advantage Funds, Inc. (the “Company”), which is registered under the Investment Company Act of 1940, as amended (the “Act”), as an open-end management investment company and operates as a series company currently offering nine series, including the fund. The fund’s investment objective is to seek to surpass the performance of the Russell Midcap® Value Index. The Dreyfus Corporation (the “Manager” or “Dreyfus”), a wholly-owned subsidiary of The Bank of New York Mellon Corporation (“BNY Mellon”), serves as the fund’s investment adviser.
Effective March 31, 2017, the fund authorized the issuance of Class T shares, but, as of the date of this report, the fund did not offer Class T shares for purchase. The fund authorized 100 million Class T shares which resulted in the fund’s total authorized shares increasing from 700 million to 800 million.
MBSC Securities Corporation (the “Distributor”), a wholly-owned subsidiary of Dreyfus, is the distributor of the fund’s shares. The fund is authorized to issue 800 million shares of $.001 par value Common Stock. The fund currently has authorized five classes of shares: Class A (350 million shares authorized), Class C (125 million shares authorized), Class I (125 million shares authorized), Class T (100 million shares authorized) and Class Y (100 million shares authorized). Class A and Class T shares generally are subject to a sales charge imposed at the time of purchase. Class C shares are subject to a contingent deferred sales charge (“CDSC”) imposed on Class C shares redeemed within one year of purchase. Class I and Class Y shares are sold at net asset value per share generally to institutional investors. Other differences between the classes include the services offered to and the expenses borne by each class, the allocation of certain transfer agency costs, and certain voting rights. Income, expenses (other than expenses attributable to a specific class), and realized and unrealized gains or losses on investments are allocated to each class of shares based on its relative net assets.
The Company accounts separately for the assets, liabilities and operations of each series. Expenses directly attributable to each series are charged to that series’ operations; expenses which are applicable to all series are allocated among them on a pro rata basis.
The Financial Accounting Standards Board (“FASB”) Accounting Standards Codification is the exclusive reference of authoritative U.S. generally accepted accounting principles (“GAAP”) recognized by the FASB to be applied by nongovernmental entities. Rules and interpretive
21
NOTES TO FINANCIAL STATEMENTS (continued)
releases of the Securities and Exchange Commission (“SEC”) under authority of federal laws are also sources of authoritative GAAP for SEC registrants. The fund’s financial statements are prepared in accordance with GAAP, which may require the use of management estimates and assumptions. Actual results could differ from those estimates.
The Company enters into contracts that contain a variety of indemnifications. The fund’s maximum exposure under these arrangements is unknown. The fund does not anticipate recognizing any loss related to these arrangements.
(a) Portfolio valuation: The fair value of a financial instrument is the amount that would be received to sell an asset or paid to transfer a liability in an orderly transaction between market participants at the measurement date (i.e., the exit price). GAAP establishes a fair value hierarchy that prioritizes the inputs of valuation techniques used to measure fair value. This hierarchy gives the highest priority to unadjusted quoted prices in active markets for identical assets or liabilities (Level 1 measurements) and the lowest priority to unobservable inputs (Level 3 measurements).
Additionally, GAAP provides guidance on determining whether the volume and activity in a market has decreased significantly and whether such a decrease in activity results in transactions that are not orderly. GAAP requires enhanced disclosures around valuation inputs and techniques used during annual and interim periods.
Various inputs are used in determining the value of the fund’s investments relating to fair value measurements. These inputs are summarized in the three broad levels listed below:
Level 1—unadjusted quoted prices in active markets for identical investments.
Level 2—other significant observable inputs (including quoted prices for similar investments, interest rates, prepayment speeds, credit risk, etc.).
Level 3—significant unobservable inputs (including the fund’s own assumptions in determining the fair value of investments).
The inputs or methodology used for valuing securities are not necessarily an indication of the risk associated with investing in those securities.
Changes in valuation techniques may result in transfers in or out of an assigned level within the disclosure hierarchy. Valuation techniques used to value the fund’s investments are as follows:
22
Investments in securities are valued at the last sales price on the securities exchange or national securities market on which such securities are primarily traded. Securities listed on the National Market System for which market quotations are available are valued at the official closing price or, if there is no official closing price that day, at the last sales price. For open short positions, asked prices are used for valuation purposes. Bid price is used when no asked price is available. Registered investment companies that are not traded on an exchange are valued at their net asset value. All of the preceding securities are generally categorized within Level 1 of the fair value hierarchy.
Securities not listed on an exchange or the national securities market, or securities for which there were no transactions, are valued at the average of the most recent bid and asked prices. These securities are generally categorized within Level 2 of the fair value hierarchy.
Fair valuing of securities may be determined with the assistance of a pricing service using calculations based on indices of domestic securities and other appropriate indicators, such as prices of relevant ADRs and futures. Utilizing these techniques may result in transfers between Level 1 and Level 2 of the fair value hierarchy.
When market quotations or official closing prices are not readily available, or are determined not to reflect accurately fair value, such as when the value of a security has been significantly affected by events after the close of the exchange or market on which the security is principally traded (for example, a foreign exchange or market), but before the fund calculates its net asset value, the fund may value these investments at fair value as determined in accordance with the procedures approved by the Company’s Board of Directors (the “Board”). Certain factors may be considered when fair valuing investments such as: fundamental analytical data, the nature and duration of restrictions on disposition, an evaluation of the forces that influence the market in which the securities are purchased and sold, and public trading in similar securities of the issuer or comparable issuers. These securities are either categorized within Level 2 or 3 of the fair value hierarchy depending on the relevant inputs used.
For restricted securities where observable inputs are limited, assumptions about market activity and risk are used and are generally categorized within Level 3 of the fair value hierarchy.
The following is a summary of the inputs used as of August 31, 2017 in valuing the fund’s investments:
23
NOTES TO FINANCIAL STATEMENTS (continued)
| | | | | | |
| | Level 1 -
Unadjusted
Quoted Prices | Level 2 - Other
Significant
Observable
Inputs | Level 3
-Significant
Unobservable
Inputs | Total |
Assets ($) | | | | |
Investments in Securities: | | | |
Equity Securities - Domestic Common Stocks† | 1,054,138,544 | - | - | 1,054,138,544 |
Equity Securities - Foreign Common Stocks† | 17,305,424 | - | - | 17,305,424 |
Exchange Traded Funds | 3,243,216 | - | - | 3,243,216 |
Registered Investment Company | 2,081,600 | - | - | 2,081,600 |
† See Statement of Investments for additional detailed categorizations.
At August 31, 2017, there were no transfers between levels of the fair value hierarchy.
(b) Securities transactions and investment income: Securities transactions are recorded on a trade date basis. Realized gains and losses from securities transactions are recorded on the identified cost basis. Dividend income is recognized on the ex-dividend date and interest income, including, where applicable, accretion of discount and amortization of premium on investments, is recognized on the accrual basis.
Pursuant to a securities lending agreement with The Bank of New York Mellon, a subsidiary of BNY Mellon and an affiliate of Dreyfus, the fund may lend securities to qualified institutions. It is the fund’s policy that, at origination, all loans are secured by collateral of at least 102% of the value of U.S. securities loaned and 105% of the value of foreign securities loaned. Collateral equivalent to at least 100% of the market value of securities on loan is maintained at all times. Collateral is either in the form of cash, which can be invested in certain money market mutual funds managed by Dreyfus, or U.S. Government and Agency securities. The fund is entitled to receive all dividends, interest and distributions on securities loaned, in addition to income earned as a result of the lending transaction. Should a borrower fail to return the securities in a timely manner, The Bank of New York Mellon is required to replace the securities for the benefit of the fund or credit the fund with the market value of the unreturned securities and is subrogated to the fund’s rights against the borrower and the collateral. Additionally, the contractual maturity of security lending transactions are on an overnight and continuous basis.
24
During the period ended August 31, 2017, The Bank of New York Mellon earned $8,143 from lending portfolio securities, pursuant to the securities lending agreement.
(c) Affiliated issuers: Investments in other investment companies advised by Dreyfus are defined as “affiliated” under the Act.
(d) Dividends and distributions to shareholders: Dividends and distributions are recorded on the ex-dividend date. Dividends from investment income-net and dividends from net realized capital gains, if any, are normally declared and paid annually, but the fund may make distributions on a more frequent basis to comply with the distribution requirements of the Internal Revenue Code of 1986, as amended (the “Code”). To the extent that net realized capital gains can be offset by capital loss carryovers, it is the policy of the fund not to distribute such gains. Income and capital gain distributions are determined in accordance with income tax regulations, which may differ from GAAP.
(e) Federal income taxes: It is the policy of the fund to continue to qualify as a regulated investment company, if such qualification is in the best interests of its shareholders, by complying with the applicable provisions of the Code, and to make distributions of taxable income sufficient to relieve it from substantially all federal income and excise taxes.
As of and during the period ended August 31, 2017, the fund did not have any liabilities for any uncertain tax positions. The fund recognizes interest and penalties, if any, related to uncertain tax positions as income tax expense in the Statement of Operations. During the period ended August 31, 2017, the fund did not incur any interest or penalties.
Each tax year in the four-year period ended August 31, 2017 remains subject to examination by the Internal Revenue Service and state taxing authorities.
At August 31, 2017, the components of accumulated earnings on a tax basis were as follows: undistributed ordinary income $24,844,384, undistributed capital gains $79,794,187 and unrealized appreciation $153,530,551.
The tax character of distributions paid to shareholders during the fiscal periods ended August 31, 2017 and August 31, 2016 were as follows: ordinary income $11,170,930 and $27,165,334, and long-term capital gains $50,851,655 and $263,740,753, respectively.
During the period ended August 31, 2017, as a result of permanent book to tax differences, primarily due to the tax treatment for limited partnerships, the fund decreased accumulated undistributed investment
25
NOTES TO FINANCIAL STATEMENTS (continued)
income-net by $98,106 and increased accumulated net realized gain (loss) on investments by the same amount. Net assets and net asset value per share were not affected by this reclassification.
NOTE 2—Bank Lines of Credit:
The fund participates with other Dreyfus-managed funds in an $810 million unsecured credit facility led by Citibank, N.A. and a $300 million unsecured credit facility provided by The Bank of New York Mellon (each, a “Facility”), each to be utilized primarily for temporary or emergency purposes, including the financing of redemptions. Prior to October 5, 2016, the unsecured credit facility with Citibank, N.A. was $555 million. In connection therewith, the fund has agreed to pay its pro rata portion of commitment fees for each Facility. Interest is charged to the fund based on rates determined pursuant to the terms of the respective Facility at the time of borrowing.
The average amount of borrowings outstanding under the Facilities during the period ended August 31, 2017, was approximately $654,800 with a related weighted average annualized interest rate of 1.63%.
NOTE 3—Management Fee and Other Transactions with Affiliates:
(a) Pursuant to a management agreement with Dreyfus, the management fee is computed at the annual rate of .75% of the value of the fund's average daily net assets and is payable monthly.
During the period ended August 31, 2017, the Distributor retained $19,203 from commissions earned on sales of the fund’s Class A shares and $1,818 from CDSCs on redemptions of the fund’s Class C shares.
(b) Under the Distribution Plan adopted pursuant to Rule 12b-1 under the Act, Class C shares pay the Distributor for distributing its shares at an annual rate of .75% of the value of its average daily net assets. During the period ended August 31, 2017, Class C shares were charged $536,320 pursuant to the Distribution Plan.
(c) Under the Shareholder Services Plan, Class A and Class C shares pay the Distributor at an annual rate of .25% of the value of their average daily net assets for the provision of certain services. The services provided may include personal services relating to shareholder accounts, such as answering shareholder inquiries regarding the fund and providing reports and other information, and services related to the maintenance of shareholder accounts. The Distributor may make payments to Service Agents (securities dealers, financial institutions or other industry professionals) with respect to these services. The Distributor determines
26
the amounts to be paid to Service Agents. During the period ended August 31, 2017, Class A and Class C shares were charged $1,700,463 and $178,773, respectively, pursuant to the Shareholder Services Plan.
The fund has arrangements with the transfer agent and the custodian whereby the fund may receive earnings credits when positive cash balances are maintained, which are used to offset transfer agency and custody fees. For financial reporting purposes, the fund includes net earnings credits as an expense offset in the Statement of Operations.
The fund compensates Dreyfus Transfer, Inc., a wholly-owned subsidiary of Dreyfus, under a transfer agency agreement for providing transfer agency and cash management services for the fund. The majority of transfer agency fees are comprised of amounts paid on a per account basis, while cash management fees are related to fund subscriptions and redemptions. During the period ended August 31, 2017, the fund was charged $103,681 for transfer agency services and $8,513 for cash management services. These fees are included in Shareholder servicing costs in the Statement of Operations. Cash management fees were partially offset by earnings credits of $8,395.
The fund compensates The Bank of New York Mellon under a custody agreement for providing custodial services for the fund. These fees are determined based on net assets, geographic region and transaction activity. During the period ended August 31, 2017, the fund was charged $87,234 pursuant to the custody agreement. These fees were partially offset by earnings credits of $60.
During the period ended August 31, 2017, the fund was charged $11,281 for services performed by the Chief Compliance Officer and his staff.
The components of “Due to The Dreyfus Corporation and affiliates” in the Statement of Assets and Liabilities consist of: management fees $687,883, Distribution Plan fees $40,128, Shareholder Services Plan fees $121,894, custodian fees $28,000, Chief Compliance Officer fees $4,670 and transfer agency fees $19,618.
(d) Each Board member also serves as a Board member of other funds within the Dreyfus complex. Annual retainer fees and attendance fees are allocated to each fund based on net assets.
NOTE 4—Securities Transactions:
The aggregate amount of purchases and sales of investment securities, excluding short-term securities, during the period ended August 31, 2017, amounted to $1,280,677,993 and $1,750,493,984, respectively.
27
NOTES TO FINANCIAL STATEMENTS (continued)
At August 31, 2017, the cost of investments for federal income tax purposes was $923,238,233; accordingly, accumulated net unrealized appreciation on investments was $153,530,551, consisting of $175,853,649 gross unrealized appreciation and $22,323,098 gross unrealized depreciation.
28
REPORT OF INDEPENDENT REGISTERED
PUBLIC ACCOUNTING FIRM
Shareholders and Board of Directors
Dreyfus Opportunistic Midcap Value Fund
We have audited the accompanying statement of assets and liabilities, including the statements of investments and investments in affiliated issuers, of Dreyfus Opportunistic Midcap Value Fund (one of the series comprising Advantage Funds, Inc.) as of August 31, 2017, and the related statement of operations for the year then ended, the statement of changes in net assets for each of the two years in the period then ended, and the financial highlights for each of the periods indicated therein. These financial statements and financial highlights are the responsibility of the Fund’s management. Our responsibility is to express an opinion on these financial statements and financial highlights based on our audits.
We conducted our audits in accordance with the standards of the Public Company Accounting Oversight Board (United States). Those standards require that we plan and perform the audit to obtain reasonable assurance about whether the financial statements and financial highlights are free of material misstatement. We were not engaged to perform an audit of the Fund’s internal control over financial reporting. Our audits included consideration of internal control over financial reporting as a basis for designing audit procedures that are appropriate in the circumstances, but not for the purpose of expressing an opinion on the effectiveness of the Fund’s internal control over financial reporting. Accordingly, we express no such opinion. An audit also includes examining, on a test basis, evidence supporting the amounts and disclosures in the financial statements and financial highlights, assessing the accounting principles used and significant estimates made by management, and evaluating the overall financial statement presentation. Our procedures included confirmation of securities owned as of August 31, 2017 by correspondence with the custodian and others. We believe that our audits provide a reasonable basis for our opinion.
In our opinion, the financial statements and financial highlights referred to above present fairly, in all material respects, the financial position of Dreyfus Opportunistic Midcap Value Fund at August 31, 2017, the results of its operations for the year then ended, the changes in its net assets for each of the two years in the period then ended, and the financial highlights for each of the indicated periods, in conformity with U.S. generally accepted accounting principles.

New York, New York
October 26, 2017
29
IMPORTANT TAX INFORMATION (Unaudited)
For federal tax purposes, the fund hereby reports 52.17% of the ordinary dividends paid during the fiscal year ended August 31, 2017 as qualifying for the corporate dividends received deduction. Also, certain dividends paid by the fund may be subject to a maximum tax rate of 15%, as provided for by the Jobs and Growth Tax Relief Reconciliation Act of 2003. Of the distributions paid during the fiscal year, $11,170,930 represents the maximum amount that may be considered qualified dividend income. The fund also hereby reports $.2311 per share as a short-term capital gain distribution and $1.2690 per share as a long-term capital gain distribution paid on December 13, 2016. Shareholders will receive notification in early 2018 of the percentage applicable to the preparation of their 2017 income tax returns.
30
INFORMATION ABOUT THE RENEWAL OF THE FUND’S MANAGEMENT AGREEMENT (Unaudited)
At a meeting of the fund’s Board of Directors held on March 9-10, 2017, the Board considered the renewal of the fund’s Management Agreement pursuant to which Dreyfus provides the fund with investment advisory and administrative services (the “Agreement”). The Board members, none of whom are “interested persons” (as defined in the Investment Company Act of 1940, as amended) of the fund, were assisted in their review by independent legal counsel and met with counsel in executive session separate from Dreyfus representatives. In considering the renewal of the Agreement, the Board considered all factors that it believed to be relevant, including those discussed below. The Board did not identify any one factor as dispositive, and each Board member may have attributed different weights to the factors considered.
Analysis of Nature, Extent, and Quality of Services Provided to the Fund. The Board considered information provided to them at the meeting and in previous presentations from Dreyfus representatives regarding the nature, extent, and quality of the services provided to funds in the Dreyfus fund complex. Dreyfus provided the number of open accounts in the fund, the fund’s asset size and the allocation of fund assets among distribution channels. Dreyfus also had previously provided information regarding the diverse intermediary relationships and distribution channels of funds in the Dreyfus fund complex (such as retail direct or intermediary, in which intermediaries typically are paid by the fund and/or Dreyfus) and Dreyfus’ corresponding need for broad, deep, and diverse resources to be able to provide ongoing shareholder services to each intermediary or distribution channel, as applicable to the fund.
The Board also considered research support available to, and portfolio management capabilities of, the fund’s portfolio management personnel and that Dreyfus also provides oversight of day-to-day fund operations, including fund accounting and administration and assistance in meeting legal and regulatory requirements. The Board also considered Dreyfus’ extensive administrative, accounting and compliance infrastructures. The Board also considered portfolio management’s brokerage policies and practices (including policies and practices regarding soft dollars) and the standards applied in seeking best execution.
Comparative Analysis of the Fund’s Performance and Management Fee and Expense Ratio. The Board reviewed reports prepared by Broadridge Financial Solutions, Inc. (“Broadridge”), an independent provider of investment company data, which included information comparing (1) the fund’s performance with the performance of a group of comparable funds (the “Performance Group”) and with a broader group of funds (the “Performance Universe”), all for various periods ended January 31, 2017 and (2) the fund’s actual and contractual management fees and total expenses with those of a group of comparable funds (the “Expense Group”) and with a broader group of funds (the “Expense Universe”), the information for which was derived in part from fund financial statements available to Broadridge as of the date of its analysis. Dreyfus previously had furnished the Board with a description of the methodology Broadridge used to select the Performance Group and Performance Universe and the Expense Group and Expense Universe.
31
INFORMATION ABOUT THE RENEWAL OF THE FUND’S MANAGEMENT AGREEMENT (Unaudited) (continued)
Dreyfus representatives stated that the usefulness of performance comparisons may be affected by a number of factors, including different investment limitations that may be applicable to the fund and comparison funds. The Board discussed with representatives of Dreyfus and/or its affiliates the results of the comparisons and considered that the fund’s total return performance was at or above the Performance Group median for all periods (highest in the one- and ten-year periods) except the three- and four- year periods when it was below the median, and the fund’s performance was above or only one basis point below the Performance Universe median for all periods except for the three- and four-year periods when it was below the median. Dreyfus also provided a comparison of the fund’s calendar year total returns to the returns of the fund’s benchmark index.
The Board also reviewed the range of actual and contractual management fees and total expenses of the Expense Group and Expense Universe funds and discussed the results of the comparisons. The Board considered that the fund’s contractual management fee was above the Expense Group median and the fund’s actual management fee and total expenses were above the Expense Group and Expense Universe medians.
Dreyfus representatives reviewed with the Board the management or investment advisory fees (1) paid by funds advised or administered by Dreyfus that are in the same Broadridge category as the fund and (2) paid to Dreyfus or the Dreyfus-affiliated primary employer of the fund’s primary portfolio manager(s) for advising any separate accounts and/or other types of client portfolios that are considered to have similar investment strategies and policies as the fund (the “Similar Clients”), and explained the nature of the Similar Clients. They discussed differences in fees paid and the relationship of the fees paid in light of any differences in the services provided and other relevant factors. The Board considered the relevance of the fee information provided for the Similar Clients to evaluate the appropriateness of the fund’s management fee.
Analysis of Profitability and Economies of Scale. Dreyfus representatives reviewed the expenses allocated and profit received by Dreyfus and its affiliates and the resulting profitability percentage for managing the fund and the aggregate profitability percentage to Dreyfus and its affiliates for managing the funds in the Dreyfus fund complex, and the method used to determine the expenses and profit. The Board concluded that the profitability results were not unreasonable, given the services rendered and service levels provided by Dreyfus. The Board also had been provided with information prepared by an independent consulting firm regarding Dreyfus’ approach to allocating costs to, and determining the profitability of, individual funds and the entire Dreyfus fund complex. The consulting firm also had analyzed where any economies of scale might emerge in connection with the management of a fund.
The Board considered, on the advice of its counsel, the profitability analysis (1) as part of its evaluation of whether the fees under the Agreement, considered in relation to the mix of services provided by Dreyfus, including the nature, extent and quality of such services, supported the renewal of the Agreement and (2) in light of the relevant circumstances for the fund and the extent to which economies of scale would be realized if the fund grows and whether fee levels reflect these economies of scale for the
32
benefit of fund shareholders. Dreyfus representatives stated that a discussion of economies of scale is predicated on a fund having achieved a substantial size with increasing assets and that, if a fund’s assets had been stable or decreasing, the possibility that Dreyfus may have realized any economies of scale would be less. Dreyfus representatives also stated that, as a result of shared and allocated costs among funds in the Dreyfus fund complex, the extent of economies of scale could depend substantially on the level of assets in the complex as a whole, so that increases and decreases in complex-wide assets can affect potential economies of scale in a manner that is disproportionate to, or even in the opposite direction from, changes in the fund’s asset level. The Board also considered potential benefits to Dreyfus from acting as investment adviser and took into consideration the soft dollar arrangements in effect for trading the fund’s investments.
At the conclusion of these discussions, the Board agreed that it had been furnished with sufficient information to make an informed business decision with respect to the renewal of the Agreement. Based on the discussions and considerations as described above, the Board concluded and determined as follows.
· The Board concluded that the nature, extent and quality of the services provided by Dreyfus are adequate and appropriate.
· The Board was satisfied with the fund’s improved performance in recent periods.
· The Board concluded that the fee paid to Dreyfus supported the renewal of the Agreement in light of the considerations described above.
· The Board determined that the economies of scale which may accrue to Dreyfus and its affiliates in connection with the management of the fund had been adequately considered by Dreyfus in connection with the fee rate charged to the fund pursuant to the Agreement and that, to the extent in the future it were determined that material economies of scale had not been shared with the fund, the Board would seek to have those economies of scale shared with the fund.
In evaluating the Agreement, the Board considered these conclusions and determinations and also relied on its previous knowledge, gained through meetings and other interactions with Dreyfus and its affiliates, of Dreyfus and the services provided to the fund by Dreyfus. The Board also relied on information received on a routine and regular basis throughout the year relating to the operations of the fund and the investment management and other services provided under the Agreement, including information on the investment performance of the fund in comparison to similar mutual funds and benchmark performance indices; general market outlook as applicable to the fund; and compliance reports. In addition, the Board’s consideration of the contractual fee arrangements for this fund had the benefit of a number of years of reviews of the Agreement for the fund, or substantially similar agreements for other Dreyfus funds that the Board oversees, during which lengthy discussions took place between the Board and Dreyfus representatives. Certain aspects of the arrangements may receive greater scrutiny in some years than in others, and the Board’s conclusions
33
INFORMATION ABOUT THE RENEWAL OF THE FUND’S MANAGEMENT AGREEMENT (Unaudited) (continued)
may be based, in part, on their consideration of the fund’s arrangements, or similar arrangements for other Dreyfus funds that the Board oversees, in prior years. The Board determined to renew the Agreement.
34
BOARD MEMBERS INFORMATION (Unaudited)
INDEPENDENT BOARD MEMBERS
Joseph S. DiMartino (73)
Chairman of the Board (1995)
Principal Occupation During Past 5 Years:
· Corporate Director and Trustee (1995-present)
Other Public Company Board Memberships During Past 5 Years:
· CBIZ (formerly, Century Business Services, Inc.), a provider of outsourcing functions for small and medium size companies, Director (1997-present)
No. of Portfolios for which Board Member Serves: 130
———————
Peggy C. Davis (74)
Board Member (2006)
Principal Occupation During Past 5 Years:
· Shad Professor of Law, New York University School of Law (1983-present)
No. of Portfolios for which Board Member Serves: 47
———————
David P. Feldman (77)
Board Member (1996)
Principal Occupation During Past 5 Years:
· Corporate Director and Trustee (1985-present)
Other Public Company Board Memberships During Past 5 Years:
· BBH Mutual Funds Group (5 registered mutual funds), Director (1992-2014)
No. of Portfolios for which Board Member Serves: 33
———————
Joan Gulley (69)
Board Member (2017)
Principal Occupation During Past 5 Years:
· PNC Financial Services Group, Inc.(1993-2014)
· Executive Vice President and Chief Human Resources Officer and Executive Committee Member (2008-2014)
No. of Portfolios for which Board Member Serves: 33
———————
35
BOARD MEMBERS INFORMATION (Unaudited) (continued)
INDEPENDENT BOARD MEMBERS (continued)
Ehud Houminer (77)
Board Member (1993)
Principal Occupation During Past 5 Years:
· Board of Overseers at the Columbia Business School, Columbia University (1992-present)
· Trustee, Ben Gurion University
Other Public Company Board Memberships During Past 5 Years:
· Avnet, Inc., an electronics distributor, Director (1993-2012)
No. of Portfolios for which Board Member Serves: 54
———————
Lynn Martin (77)
Board Member (2012)
Principal Occupation During Past 5 Years:
· President of The Martin Hall Group LLC, a human resources consulting firm (2005-2012)
Other Public Company Board Memberships During Past 5 Years:
· AT&T, Inc., a telecommunications company, Director (1999-2012)
· Ryder System, Inc., a supply chain and transportation management company, Director (1993-2012)
No. of Portfolios for which Board Member Serves: 33
———————
Robin A. Melvin (53)
Board Member (2012)
Principal Occupation During Past 5 Years:
· Co-chairman, Illinois Mentoring Partnership, non-profit organization dedicated to increasing the quantity and quality of mentoring services in Illinois; (2014-present; board member since 2013)
· Director, Boisi Family Foundation, a private family foundation that supports youth-serving organizations that promote the self sufficiency of youth from disadvantaged circumstances (1995-2012)
No. of Portfolios for which Board Member Serves: 102
———————
36
Dr. Martin Peretz (78)
Board Member (2006)
Principal Occupation During Past 5 Years:
· Editor-in-Chief Emeritus of The New Republic Magazine (2011-2012) (previously,
Editor-in-Chief, 1974-2011)
· Lecturer at Harvard University (1969-2012)
No. of Portfolios for which Board Member Serves: 33
———————
Once elected all Board Members serve for an indefinite term, but achieve Emeritus status upon reaching age 80. The address of the Board Members and Officers is c/o The Dreyfus Corporation, 200 Park Avenue, New York, New York 10166. Additional information about the Board Members is available in the fund’s Statement of Additional Information which can be obtained from Dreyfus free of charge by calling this toll free number: 1-800-DREYFUS.
James F. Henry, Emeritus Board Member
Philip L. Toia, Emeritus Board Member
37
OFFICERS OF THE FUND (Unaudited)
BRADLEY J. SKAPYAK, President since January 2010.
Chief Operating Officer and a director of the Manager since June 2009, Chairman of Dreyfus Transfer, Inc., an affiliate of the Manager and the transfer agent of the funds, since May 2011 and Chief Executive Officer of MBSC Securities Corporation since August 2016. He is an officer of 63 investment companies (comprised of 130 portfolios) managed by the Manager. He is 58 years old and has been an employee of the Manager since February 1988.
BENNETT A. MACDOUGALL, Chief Legal Officer since October 2015.
Chief Legal Officer of the Manager and Associate General Counsel and Managing Director of BNY Mellon since June 2015; from June 2005 to June 2015, he served in various capacities with Deutsche Bank – Asset & Wealth Management Division, including as Director and Associate General Counsel, and Chief Legal Officer of Deutsche Investment Management Americas Inc. from June 2012 to May 2015. He is an officer of 64 investment companies (comprised of 155 portfolios) managed by the Manager. He is 45 years old and has been an employee of the Manager since June 2015.
JANETTE E. FARRAGHER, Vice President and Secretary since December 2011.
Associate General Counsel of BNY Mellon, and an officer of 64 investment companies (comprised of 155 portfolios) managed by the Manager. She is 54 years old and has been an employee of the Manager since February 1984.
JAMES BITETTO, Vice President and Assistant Secretary since August 2005.
Managing Counsel of BNY Mellon and Secretary of the Manager, and an officer of 64 investment companies (comprised of 155 portfolios) managed by the Manager. He is 51 years old and has been an employee of the Manager since December 1996.
JOSEPH M. CHIOFFI, Vice President and Assistant Secretary since August 2005.
Managing Counsel of BNY Mellon, and an officer of 64 investment companies (comprised of 155 portfolios) managed by the Manager. He is 55 years old and has been an employee of the Manager since June 2000.
MAUREEN E. KANE, Vice President and Assistant Secretary since April 2015.
Managing Counsel of BNY Mellon since July 2014; from October 2004 until July 2014, General Counsel, and from May 2009 until July 2014, Chief Compliance Officer of Century Capital Management. She is an officer of 64 investment companies (comprised of 155 portfolios) managed by the Manager. She is 55 years old and has been an employee of the Manager since July 2014.
SARAH S. KELLEHER, Vice President and Assistant Secretary since April 2014.
Senior Counsel of BNY Mellon since March 2013, from August 2005 to March 2013, Associate General Counsel of Third Avenue Management. She is an officer of 64 investment companies (comprised of 155 portfolios) managed by the Manager. She is 41 years old and has been an employee of the Manager since March 2013.
JEFF PRUSNOFSKY, Vice President and Assistant Secretary since August 2005.
Senior Managing Counsel of BNY Mellon, and an officer of 64 investment companies (comprised of 155 portfolios) managed by the Manager. He is 52 years old and has been an employee of the Manager since October 1990.
NATALYA ZELENSKY, Vice President and Assistant Secretary since March 2017.
Counsel and Vice President of BNY Mellon since May 2016; Attorney at Wildermuth Endowment Strategy Fund/Wildermuth Advisory, LLC from November 2015 until May 2016; Assistant General Counsel at RCS Advisory Services from July 2014 until November 2015; Associate at Sutherland, Asbill & Brennan from January 2013 until January 2014; Associate at K&L Gates from October 2011 until January 2013. She is an officer of 64 investment companies (comprised of 155 portfolios) managed by Dreyfus. She is 32 years old and has been an employee of the Manager since May 2016.
JAMES WINDELS, Treasurer since November 2001.
Director – Mutual Fund Accounting of the Manager, and an officer of 64 investment companies (comprised of 155 portfolios) managed by the Manager. He is 58 years old and has been an employee of the Manager since April 1985.
38
RICHARD CASSARO, Assistant Treasurer since January 2008.
Senior Accounting Manager – Money Market and Municipal Bond Funds of the Manager, and an officer of 64 investment companies (comprised of 155 portfolios) managed by the Manager. He is 58 years old and has been an employee of the Manager since September 1982.
GAVIN C. REILLY, Assistant Treasurer since December 2005.
Tax Manager of the Investment Accounting and Support Department of the Manager, and an officer of 64 investment companies (comprised of 155 portfolios) managed by the Manager. He is 49 years old and has been an employee of the Manager since April 1991.
ROBERT S. ROBOL, Assistant Treasurer since August 2005.
Senior Accounting Manager – Dreyfus Financial Reporting of the Manager, and an officer of 64 investment companies (comprised of 155 portfolios) managed by the Manager. He is 53 years old and has been an employee of the Manager since October 1988.
ROBERT SALVIOLO, Assistant Treasurer since July 2007.
Senior Accounting Manager – Equity Funds of the Manager, and an officer of 64 investment companies (comprised of 155 portfolios) managed by the Manager. He is 50 years old and has been an employee of the Manager since June 1989.
ROBERT SVAGNA, Assistant Treasurer since December 2002.
Senior Accounting Manager – Fixed Income and Equity Funds of the Manager, and an officer of 64 investment companies (comprised of 155 portfolios) managed by the Manager. He is 50 years old and has been an employee of the Manager since November 1990.
JOSEPH W. CONNOLLY, Chief Compliance Officer since October 2004.
Chief Compliance Officer of the Manager and The Dreyfus Family of Funds (64 investment companies, comprised of 155 portfolios). He is 60 years old and has served in various capacities with the Manager since 1980, including manager of the firm’s Fund Accounting Department from 1997 through October 2001.
CARIDAD M. CAROSELLA, Anti-Money Laundering Compliance Officer since January 2016.
Anti-Money Laundering Compliance Officer of the Dreyfus Family of Funds and BNY Mellon Funds Trust since January 2016; from May 2015 to December 2015, Interim Anti-Money Laundering Compliance Officer of the Dreyfus Family of Funds and BNY Mellon Funds Trust and the Distributor; from January 2012 to May 2015, AML Surveillance Officer of the Distributor and from 2007 to December 2011, Financial Processing Manager of the Distributor. She is an officer of 59 investment companies (comprised of 150 portfolios) managed by the Manager. She is 49 years old and has been an employee of the Distributor since 1997.
39
NOTES
40
NOTES
41
Dreyfus Opportunistic Midcap Value Fund
200 Park Avenue
New York, NY 10166
Manager
The Dreyfus Corporation
200 Park Avenue
New York, NY 10166
Custodian
The Bank of New York Mellon
225 Liberty Street
New York, NY 10286
Transfer Agent &
Dividend Disbursing Agent
Dreyfus Transfer, Inc.
200 Park Avenue
New York, NY 10166
Distributor
MBSC Securities Corporation
200 Park Avenue
New York, NY 10166
| | |
Ticker Symbols: | Class A: DMCVX Class C: DVLCX Class I: DVLIX Class Y: DMCYX |
Telephone Call your financial representative or 1-800-DREYFUS
Mail The Dreyfus Family of Funds, 144 Glenn Curtiss Boulevard, Uniondale, NY 11556-0144
E-mail Send your request to info@dreyfus.com
Internet Information can be viewed online or downloaded at www.dreyfus.com
The fund files its complete schedule of portfolio holdings with the Securities and Exchange Commission (“SEC”) for the first and third quarters of each fiscal year on Form N-Q. The fund’s Forms N-Q are available on the SEC’s website at www.sec.gov and may be reviewed and copied at the SEC’s Public Reference Room in Washington, D.C. (phone 1-800-SEC-0330 for information).
A description of the policies and procedures that the fund uses to determine how to vote proxies relating to portfolio securities and information regarding how the fund voted these proxies for the most recent 12-month period ended June 30 is available at www.dreyfus.com and on the SEC’s website at www.sec.gov and without charge, upon request, by calling 1-800-DREYFUS.
| | |
© 2017 MBSC Securities Corporation
0258AR0817 | 
|
Dreyfus Opportunistic Small Cap Fund
| | | |

| | ANNUAL REPORT
August 31, 2017 |
| |
Save time. Save paper. View your next shareholder report online as soon as it’s available. Log into www.dreyfus.com and sign up for Dreyfus eCommunications. It’s simple and only takes a few minutes. |
| |
The views expressed in this report reflect those of the portfolio manager(s) only through the end of the period covered and do not necessarily represent the views of Dreyfus or any other person in the Dreyfus organization. Any such views are subject to change at any time based upon market or other conditions and Dreyfus disclaims any responsibility to update such views. These views may not be relied on as investment advice and, because investment decisions for a Dreyfus fund are based on numerous factors, may not be relied on as an indication of trading intent on behalf of any Dreyfus fund. |
| |
Not FDIC-Insured • Not Bank-Guaranteed • May Lose Value |
Contents
THE FUND
FOR MORE INFORM ATION
Back Cover
| | | | |
| |
Dreyfus Opportunistic Small Cap Fund
| | The Fund |
A LETTER FROM THE CEO OF DREYFUS
Dear Shareholder:
We are pleased to present this annual report for Dreyfus Opportunistic Small Cap Fund, covering the 12-month period from September 1, 2016 through August 31, 2017. For information about how the fund performed during the reporting period, as well as general market perspectives, we provide a Discussion of Fund Performance on the pages that follow.
Stocks set a series of new record highs and bonds produced mixed results over the past year in response to changing economic and political conditions. Financial markets during the final months of 2016 were dominated by the election of a new U.S. presidential administration. Equities surged higher in anticipation of more business-friendly regulatory, tax, and fiscal policies, but high-quality bonds generally lost value due to expectations of rising interest rates and accelerating inflation in a stronger economy. Despite a series of short-term interest-rate hikes, bonds recovered over the first eight months of 2017 when it became clearer that major tax and fiscal reforms would take time and political capital to enact. Stocks continued to rally, led by large growth-oriented companies, as corporate earnings grew and global economic conditions improved.
The markets’ recent strong performance has been supported by solid underlying fundamentals. While we currently expect these favorable conditions to persist, we remain watchful for economic and political developments that could derail the rallies. As always, we encourage you to discuss the risks and opportunities of today’s investment environment with your financial advisor.
Thank you for your continued confidence and support.
Sincerely,

Mark D. Santero
Chief Executive Officer
The Dreyfus Corporation
September 15, 2017
2
DISCUSSION OF FUND PERFORMANCE
For the period from September 1, 2016 through August 31, 2017, as provided by David A. Daglio, James Boyd, and Dale Dutile, Primary Portfolio Managers
Market and Fund Performance Overview
For the 12-month period ended August 31, 2017, Dreyfus Opportunistic Small Cap Fund’s Investor shares returned 23.67%. Between their inception on September 30, 2016 and August 31, 2017, the fund’s Class I shares and Class Y shares produced total returns of 20.02% and 20.02%, respectively.1 In comparison, the fund’s benchmark, the Russell 2000® Index (the “Index”), produced a total return of 14.91% for the 12-month period.2
Small-cap growth stocks gained ground amid better-than-expected corporate earnings, improving domestic growth prospects, and positive investor sentiment in the wake of the U.S. presidential election. The fund produced higher returns than its benchmark, primarily due to strong stock selections in the information technology, financials, and consumer discretionary sectors.
The Fund’s Investment Approach
The fund seeks capital appreciation. The fund normally invests at least 80% of its assets in the stocks of small-cap companies. The fund currently considers small-cap companies to be those companies with market capitalizations that fall within the range of companies in the Index. Stocks are selected for the fund’s portfolio based primarily on bottom-up fundamental analysis. The fund’s team of portfolio managers uses a disciplined investment process that relies, in general, on proprietary fundamental research and valuation. Generally, elements of the process include analysis of mid-cycle business prospects, estimation of the intrinsic value of the company, and the identification of a revaluation trigger. The fund’s portfolio managers invest in securities and sectors that they perceive to be attractive from a valuation and fundamental standpoint.
Rising Corporate Earnings Drove Markets Higher
While political uncertainties caused U.S. stocks to dip in the weeks leading up to the 2016 presidential election, equity markets were reenergized in November and December when investors began to anticipate lower corporate taxes, reduced regulatory constraints on business, and increased infrastructure spending from a new presidential administration.
The market’s advance slowed in the spring when it became clearer that tax and fiscal reforms were far from certain in a contentious political environment, but the rally soon resumed in the midst of strong corporate earnings growth and encouraging global economic data. As a result, the Index advanced to a series of record highs. However, market leadership shifted in the spring from smaller, domestically focused businesses to industry leaders with a robust international presence, and small-cap stocks generally produced lower returns than large-cap stocks for the reporting period overall.
Security Selections Buoyed Fund Results
The fund substantially outperformed the Index over the reporting period due to the success of our security selection strategy across a variety of market sectors. In the information technology sector, payment processor Square posted strong subscriber growth and launched a variety of new services for small and midsized businesses. Semiconductor equipment maker Teradyne encountered rising demand for testing equipment and new “cobot” products. Semiconductor producer Microsemi saw a robust recovery in orders and sales. Sierra Wireless, which supplies Internet connectivity technology to automobile manufacturers, experienced strong demand for a
3
DISCUSSION OF FUND PERFORMANCE (continued)
new product line. Universal Display achieved higher order volumes for its new organic light emitting diode (OLED) technology.
Top performers in the financials sector included student loans provider SLM, where origination volumes increased. Regional bank SVB Financial Group gained value amid optimism about strong loan growth in its West Coast market, and brokerage firm Raymond James Financial reported strong account growth and rising assets under management. Among consumer discretionary companies, retailer Office Depot began to execute on plans to increase operating margins and cash flows by closing underperforming stores. Media companies Gray Television and Nexstar Media Group benefited from expectations of relaxed ownership rules by federal regulators.
The fund also fared well in the materials sector, where chemicals producer Methanex nearly doubled in value in an improving pricing environment. Construction materials supplier U.S. Concrete advanced late in the reporting period in anticipation of rising demand from hurricane-ravaged communities in Texas. The fund further benefited from underweighted exposure to the lagging energy sector, as well as from gains posted by seaborne shipping companies such as Scorpio Tankers.
Disappointments proved relatively modest over the reporting period. In the health care sector, emergency rooms operator Adeptus Health encountered issues related to excessively rapid growth, and Brookdale Senior Living was hurt by an oversupply of newly built independent and assisted living communities.
Focusing on Individual Small-Cap Companies
As always, we expect to continue to choose investments one company at a time, according to their valuations and future prospects. Nonetheless, it is worth noting that, absent unexpected geopolitical shocks, fundamentals currently appear strong for U.S. small-cap companies. As of the reporting period’s end, we have identified a number of attractive opportunities among companies in the financials, information technology, materials, and consumer discretionary sectors, but fewer in the real estate and utilities sectors.
September 15, 2017
1 Total return includes reinvestment of dividends and any capital gains paid. Past performance is no guarantee of future results. Share price and investment return fluctuate such that upon redemption, fund shares may be worth more or less than their original cost.
2 Source: Lipper Inc. — The Russell 2000® Index measures the performance of the small-cap segment of the U.S. equity universe. The Russell 2000® Index is a subset of the Russell 3000® Index representing approximately 10% of the total market capitalization of that index. It includes approximately 2,000 of the smallest securities based on a combination of their market cap and current index membership. The Russell 2000® Index is constructed to provide a comprehensive and unbiased small-cap barometer and is completely reconstituted annually to ensure larger stocks do not distort the performance and characteristics of the true small-cap opportunity set. Investors cannot invest directly in any index.
Please note: the position in any security highlighted with italicized typeface was sold during the reporting period.
Equities are subject generally to market, market sector, market liquidity, issuer, and investment style risks, among other factors, to varying degrees, all of which are more fully described in the fund’s prospectus.
Stocks of small- and/or mid-cap companies often experience sharper price fluctuations than stocks of large-cap companies.
4
FUND PERFORMANCE
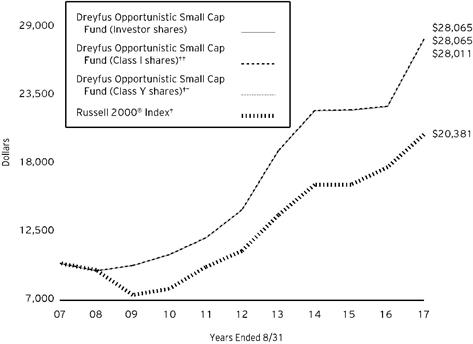
Comparison of change in value of $10,000 investment in Dreyfus Opportunistic Small Cap Fund Investor shares, Class I shares and Class Y shares and the Russell 2000® Index (the “Index’)
† Source: Lipper Inc.
†† The total return figures presented for Class I shares of the fund reflect the performance of the fund’s Investor shares for the period prior to 9/30/16 (the inception date for Class I shares).
The total return figures presented for Class Y shares of the fund reflect the performance of the fund’s Investor shares for the period prior to 9/30/16 (the inception date for Class Y shares).
Past performance is not predictive of future performance.
The above graph compares a $10,000 investment made in each of the Investor, Class I and Class Y shares of Dreyfus Opportunistic Small Cap Fund on 8/31/07 to a $10,000 investment made in the Index on that date. All dividends and capital gain distributions are reinvested.
The fund’s performance shown in the line graph above takes into account all applicable fees and expenses. The Index measures the performance of the small-cap segment of the U.S. equity universe. The Index is a subset of the Russell 3000® Index representing approximately 10% of the total market capitalization of that index. It includes approximately 2,000 of the smallest securities based on a combination of their market cap and current index membership. The Index is constructed to provide a comprehensive and unbiased small-cap barometer and is completely reconstituted annually to ensure larger stocks do not distort the performance and characteristics of the true small-cap opportunity set. Unlike a mutual fund, the Index is not subject to charges, fees and other expenses. Investors cannot invest directly in any index. Further information relating to fund performance, including expense reimbursements, if applicable, is contained in the Financial Highlights section of the prospectus and elsewhere in this report.
5
FUND PERFORMANCE (continued)
| | | | | |
Average Annual Total Returns as of 8/31/17 | |
| Inception
Date | 1 Year | 5 Years | 10 Years |
Investor shares | 11/16/1993 | 23.67% | 14.39% | 10.85% |
Class I shares | 9/30/2016 | 23.90%† | 14.43%† | 10.87%† |
Class Y shares | 9/30/2016 | 23.90%† | 14.43%† | 10.87%† |
Russell 2000® Index | | 14.91% | 13.15% | 7.38% |
† The total return performance figures presented for Class I shares of the fund reflect the performance of the fund’s Investor shares for the period prior to 9/30/16 (the inception date for Class I shares).
The total return performance figures presented for Class Y shares of the fund reflect the performance of the fund’s Investor shares for the period prior to 9/30/16 (the inception date for Class Y shares).
The performance data quoted represents past performance, which is no guarantee of future results. Share price and investment returns fluctuate and an investor’s shares may be worth more or less than original cost upon redemption. Current performance may be lower or higher than the performance quoted. Go to Dreyfus.com for the fund’s most recent month-end returns.
The fund’s performance shown in the graph and table does not reflect the deduction of taxes that a shareholder would pay on fund distributions or the redemption of fund shares.
6
UNDERSTANDING YOUR FUND’S EXPENSES (Unaudited)
As a mutual fund investor, you pay ongoing expenses, such as management fees and other expenses. Using the information below, you can estimate how these expenses affect your investment and compare them with the expenses of other funds. You also may pay one-time transaction expenses, including sales charges (loads) and redemption fees, which are not shown in this section and would have resulted in higher total expenses. For more information, see your fund’s prospectus or talk to your financial adviser.
Review your fund’s expenses
The table below shows the expenses you would have paid on a $1,000 investment in Dreyfus Opportunistic Small Cap Fund from March 1, 2017 to August 31, 2017. It also shows how much a $1,000 investment would be worth at the close of the period, assuming actual returns and expenses.
| | | | | | | | | | |
Expenses and Value of a $1,000 Investment |
assuming actual returns for the six months ended August 31, 2017 | | |
| | | | Investor Shares | | Class I | | Class Y | |
Expenses paid per $1,000† | | $.60 | | $.79 | | $.08 | |
Ending value (after expenses) | | $,021.50 | | $,022.40 | | $,022.60 | |
COMPARING YOUR FUND’S EXPENSES
WITH THOSE OF OTHER FUNDS (Unaudited)
Using the SEC’s method to compare expenses
The Securities and Exchange Commission (SEC) has established guidelines to help investors assess fund expenses. Per these guidelines, the table below shows your fund’s expenses based on a $1,000 investment, assuming a hypothetical 5% annualized return. You can use this information to compare the ongoing expenses (but not transaction expenses or total cost) of investing in the fund with those of other funds. All mutual fund shareholder reports will provide this information to help you make this comparison. Please note that you cannot use this information to estimate your actual ending account balance and expenses paid during the period.
| | | | | | | | | | |
Expenses and Value of a $1,000 Investment |
assuming a hypothetical 5% annualized return for the six months ended August 31, 2017 |
| | | | Investor Shares | | Class I | | Class Y | |
Expenses paid per $1,000† | | $.60 | | $.79 | | $.08 | |
Ending value (after expenses) | | $,019.66 | | $,020.47 | | $,021.17 | |
† Expenses are equal to the fund’s annualized expense ratio of 1.10% for Investor shares, .94% for Class I and .80% for Class Y, multiplied by the average account value over the period, multiplied by 184/365 (to reflect the one-half year period).
7
STATEMENT OF INVESTMENTS
August 31, 2017
| | | | | | | | |
| |
Description | | | | Shares | | Value ($) | |
Common Stocks - 98.8% | | | | | |
Automobiles & Components - 1.0% | | | | | |
Visteon | | | | 88,062 | a | 10,165,877 | |
Banks - 15.1% | | | | | |
Ameris Bancorp | | | | 113,830 | b | 5,014,212 | |
Atlantic Capital Bancshares | | | | 473,591 | a | 8,500,958 | |
Banner | | | | 302,880 | | 16,694,746 | |
FCB Financial Holdings, Cl. A | | | | 288,588 | a | 12,582,437 | |
First Interstate BancSystem, Cl. A | | | | 443,470 | | 15,610,144 | |
First Merchants | | | | 141,657 | b | 5,562,870 | |
Great Western Bancorp | | | | 435,225 | b | 15,633,282 | |
MGIC Investment | | | | 2,087,965 | a | 23,907,199 | |
Midland States Bancorp | | | | 156,710 | | 4,785,923 | |
South State | | | | 85,459 | b | 7,029,003 | |
SVB Financial Group | | | | 105,909 | a | 17,934,630 | |
Union Bankshares | | | | 417,789 | | 13,089,329 | |
Univest Corporation of Pennsylvania | | | | 207,852 | b | 6,058,886 | |
| | | | | 152,403,619 | |
Capital Goods - 2.0% | | | | | |
Simpson Manufacturing | | | | 238,975 | b | 10,462,325 | |
Tennant | | | | 151,815 | b | 9,253,124 | |
| | | | | 19,715,449 | |
Commercial & Professional Services - 1.4% | | | | | |
Deluxe | | | | 146,974 | | 10,192,647 | |
Knoll | | | | 243,235 | | 4,390,392 | |
| | | | | 14,583,039 | |
Consumer Durables & Apparel - 2.7% | | | | | |
G-III Apparel Group | | | | 995,031 | a,b | 27,363,352 | |
Consumer Services - 5.1% | | | | | |
Houghton Mifflin Harcourt | | | | 1,474,974 | a,b | 15,044,735 | |
Pinnacle Entertainment | | | | 346,471 | a,b | 6,756,185 | |
Planet Fitness, Cl. A | | | | 1,070,528 | b | 27,159,295 | |
Zoe's Kitchen | | | | 213,934 | a,b | 2,753,331 | |
| | | | | 51,713,546 | |
Diversified Financials - 10.6% | | | | | |
Capitol Investment Corp. IV | | | | 679,597 | | 6,897,910 | |
Donnelley Financial Solutions | | | | 619,119 | | 13,255,338 | |
FNFV Group | | | | 521,543 | a | 8,788,000 | |
8
| | | | | | | | |
| |
Description | | | | Shares | | Value ($) | |
Common Stocks - 98.8% (continued) | | | | | |
Diversified Financials - 10.6% (continued) | | | | | |
Green Dot, Cl. A | | | | 293,717 | a | 14,151,285 | |
Investment Technology Group | | | | 591,609 | | 11,885,425 | |
Landcadia Holdings | | | | 301,090 | a | 3,230,696 | |
Raymond James Financial | | | | 230,079 | | 18,019,787 | |
SLM | | | | 2,528,749 | a | 25,717,377 | |
TPG Pace Holdings | | | | 471,627 | | 4,857,758 | |
| | | | | 106,803,576 | |
Energy - 3.6% | | | | | |
Arch Coal, Cl. A | | | | 163,984 | b | 13,097,402 | |
Ardmore Shipping | | | | 39,480 | a | 319,788 | |
GasLog | | | | 263,149 | b | 4,420,903 | |
Oasis Petroleum | | | | 594,165 | a,b | 4,337,405 | |
Scorpio Tankers | | | | 609,326 | | 2,479,957 | |
Select Energy Services, Cl. A | | | | 831,293 | b | 11,721,231 | |
| | | | | 36,376,686 | |
Exchange-Traded Funds - .6% | | | | | |
iShares Russell 2000 ETF | | | | 43,167 | b | 6,031,725 | |
Food & Staples Retailing - .5% | | | | | |
US Foods Holding | | | | 177,829 | a | 4,881,406 | |
Health Care Equipment & Services - 1.6% | | | | | |
Brookdale Senior Living | | | | 1,295,958 | a | 15,719,971 | |
Household & Personal Products - .5% | | | | | |
Avon Products | | | | 2,147,916 | a | 5,348,311 | |
Materials - 5.6% | | | | | |
Methanex | | | | 579,507 | b | 29,612,808 | |
OMNOVA Solutions | | | | 1,045,045 | a | 9,091,891 | |
US Concrete | | | | 220,034 | a,b | 17,613,722 | |
| | | | | 56,318,421 | |
Media - 4.5% | | | | | |
Gray Television | | | | 332,433 | a,b | 4,753,792 | |
Nexstar Media Group, Cl. A | | | | 338,122 | b | 20,354,944 | |
Sinclair Broadcast Group, Cl. A | | | | 660,928 | b | 19,993,072 | |
| | | | | 45,101,808 | |
Pharmaceuticals, Biotechnology & Life Sciences - 8.9% | | | | | |
Flexion Therapeutics | | | | 622,892 | a,b | 16,008,324 | |
Revance Therapeutics | | | | 768,367 | a,b | 18,863,410 | |
Sage Therapeutics | | | | 293,215 | a,b | 24,116,934 | |
9
STATEMENT OF INVESTMENTS (continued)
| | | | | | | | |
| |
Description | | | | Shares | | Value ($) | |
Common Stocks - 98.8% (continued) | | | | | |
Pharmaceuticals, Biotechnology & Life Sciences - 8.9% (continued) | | | | | |
TherapeuticsMD | | | | 5,144,575 | a | 30,867,450 | |
| | | | | 89,856,118 | |
Retailing - 2.7% | | | | | |
Lithia Motors, Cl. A | | | | 188,082 | b | 20,312,856 | |
Office Depot | | | | 1,739,131 | | 7,460,872 | |
| | | | | 27,773,728 | |
Semiconductors & Semiconductor Equipment - 3.2% | | | | | |
Microsemi | | | | 271,380 | a | 13,672,124 | |
Teradyne | | | | 524,771 | | 18,687,095 | |
| | | | | 32,359,219 | |
Software & Services - 5.7% | | | | | |
Acxiom | | | | 582,329 | a | 13,562,442 | |
CommVault Systems | | | | 108,750 | a | 6,639,188 | |
Envestnet | | | | 115,694 | a,b | 5,142,598 | |
Silver Spring Networks | | | | 833,942 | a,b | 10,557,706 | |
Square, Cl. A | | | | 629,723 | a | 16,442,068 | |
Teradata | | | | 155,643 | a,b | 4,968,125 | |
| | | | | 57,312,127 | |
Technology Hardware & Equipment - 12.8% | | | | | |
Ciena | | | | 1,286,200 | a | 27,794,782 | |
Infinera | | | | 2,357,154 | a,b | 19,941,523 | |
Methode Electronics | | | | 324,512 | | 13,272,541 | |
Sierra Wireless | | | | 719,308 | a,b | 15,932,672 | |
Universal Display | | | | 40,034 | b | 5,088,321 | |
VeriFone Systems | | | | 851,607 | a | 16,836,270 | |
Viavi Solutions | | | | 3,025,619 | a | 30,377,215 | |
| | | | | 129,243,324 | |
Transportation - 9.4% | | | | | |
Avis Budget Group | | | | 721,095 | a,b | 26,125,272 | |
Covenant Transportation Group, Cl. A | | | | 192,981 | a,b | 4,633,474 | |
Knight Transportation | | | | 701,053 | b | 27,376,120 | |
Swift Transportation | | | | 387,158 | a,b | 10,859,782 | |
Werner Enterprises | | | | 793,133 | | 26,252,702 | |
| | | | | 95,247,350 | |
Utilities - 1.3% | | | | | |
Calpine | | | | 167,116 | a | 2,456,605 | |
10
| | | | | | | | |
| |
Description | | | | Shares | | Value ($) | |
Common Stocks - 98.8% (continued) | | | | | |
Utilities - 1.3% (continued) | | | | | |
Dynegy | | | | 1,093,820 | a | 10,303,784 | |
| | | | | 12,760,389 | |
Total Common Stocks (cost $820,806,232) | | | | 997,079,041 | |
| | | | | | | | |
Other Investment - 1.1% | | | | | |
Registered Investment Company; | | | | | |
Dreyfus Institutional Preferred Government Plus Money Market Fund
(cost $11,747,168) | | | | 11,747,168 | c | 11,747,168 | |
| | | | | | | | |
Investment of Cash Collateral for Securities Loaned - 16.0% | | | | | |
Registered Investment Company; | | | | | |
Dreyfus Institutional Preferred Government Money Market Fund, Institutional Shares
(cost $161,197,475) | | | | 161,197,475 | c | 161,197,475 | |
Total Investments (cost $993,750,875) | | 115.9% | | 1,170,023,684 | |
Liabilities, Less Cash and Receivables | | (15.9%) | | (160,650,041) | |
Net Assets | | 100.0% | | 1,009,373,643 | |
ETF—Exchange-Traded Fund
aNon-income producing security.
b Security, or portion thereof, on loan. At August 31, 2017, the value of the fund’s securities on loan was $198,523,577 and the value of the collateral held by the fund was $202,131,213, consisting of cash collateral of $161,197,475 and U.S. Government & Agency securities valued at $40,933,738.
c Investment in affiliated money market mutual fund.
11
STATEMENT OF INVESTMENTS (continued)
| | |
Portfolio Summary (Unaudited) † | Value (%) |
Money Market Investments | 17.1 |
Banks | 15.1 |
Technology Hardware & Equipment | 12.8 |
Diversified Financials | 10.6 |
Transportation | 9.4 |
Pharmaceuticals, Biotechnology & Life Sciences | 8.9 |
Software & Services | 5.7 |
Materials | 5.6 |
Consumer Services | 5.1 |
Media | 4.5 |
Energy | 3.6 |
Semiconductors & Semiconductor Equipment | 3.2 |
Retailing | 2.7 |
Consumer Durables & Apparel | 2.7 |
Capital Goods | 2.0 |
Health Care Equipment & Services | 1.6 |
Commercial & Professional Services | 1.4 |
Utilities | 1.3 |
Automobiles & Components | 1.0 |
Exchange-Traded Funds | .6 |
Household & Personal Products | .5 |
Food & Staples Retailing | .5 |
| | 115.9 |
† Based on net assets.
See notes to financial statements.
12
STATEMENT OF INVESTMENTS IN AFFILIATED ISSUERS
| | | | | | | |
Registered Investment Companies | Value
8/31/2016 ($) | Purchases ($) | Sales ($) | Value
8/31/2017 ($) | Net
Assets (%) | Dividends/
Distributions ($) |
Dreyfus Institutional Cash
Advantage Fund,
Institutional Shares | 65,913,277 | 76,865,905 | 142,779,182 | – | – | – |
Dreyfus Institutional Preferred Government Plus Money Market Fund | 12,473,420 | 329,338,918 | 330,065,170 | 11,747,168 | 1.1 | 59,898 |
Dreyfus Institutional Preferred Government Money Market Fund, Institutional Shares | – | 1,046,021,295 | 884,823,820 | 161,197,475 | 16.0 | – |
Total | 78,386,697 | 1,452,226,118 | 1,357,668,172 | 172,944,643 | 17.1 | 59,898 |
See notes to financial statements.
13
STATEMENT OF ASSETS AND LIABILITIES
August 31, 2017
| | | | | | | |
| | | | | | |
| | | Cost | | Value | |
Assets ($): | | | | |
Investments in securities—See Statement of Investments
(including securities on loan, valued at $198,523,577)—Note 1(b): | | | | |
Unaffiliated issuers | | 820,806,232 | | 997,079,041 | |
Affiliated issuers | | 172,944,643 | | 172,944,643 | |
Cash | | | | | 142,012 | |
Receivable for investment securities sold | | | | | 1,715,021 | |
Dividends and securities lending income receivable | | | | | 449,075 | |
Receivable for shares of Common Stock subscribed | | | | | 280,781 | |
Prepaid expenses | | | | | 36,329 | |
| | | | | 1,172,646,902 | |
Liabilities ($): | | | | |
Due to The Dreyfus Corporation and affiliates—Note 3(b) | | | | | 793,047 | |
Liability for securities on loan—Note 1(b) | | | | | 161,197,475 | |
Payable for investment securities purchased | | | | | 818,106 | |
Payable for shares of Common Stock redeemed | | | | | 322,390 | |
Accrued expenses | | | | | 142,241 | |
| | | | | 163,273,259 | |
Net Assets ($) | | | 1,009,373,643 | |
Composition of Net Assets ($): | | | | |
Paid-in capital | | | | | 736,206,329 | |
Accumulated net realized gain (loss) on investments | | | | | 96,894,505 | |
Accumulated net unrealized appreciation (depreciation)
on investments | | | | 176,272,809 | |
Net Assets ($) | | | 1,009,373,643 | |
| | | | | |
Net Asset Value Per Share | Investor Shares | Class I | Class Y | |
Net Assets ($) | 488,506,933 | 53,193,951 | 467,672,759 | |
Shares Outstanding | 13,372,331 | 1,453,444 | 12,777,787 | |
Net Asset Value Per Share ($) | 36.53 | 36.60 | 36.60 | |
| | | | | |
See notes to financial statements. | | | | |
14
STATEMENT OF OPERATIONS
Year Ended August 31, 2017
| | | | | | | |
| | | | | | |
| | | | | | |
Investment Income ($): | | | | |
Income: | | | | |
Cash dividends (net of $124,550 foreign taxes withheld at source): | | | | |
Unaffiliated issuers | | | 5,983,322 | |
Affiliated issuers | | | 59,898 | |
Income from securities lending—Note 1(b) | | | 487,292 | |
Total Income | | | 6,530,512 | |
Expenses: | | | | |
Management fee—Note 3(a) | | | 7,313,989 | |
Shareholder servicing costs—Note 3(b) | | | 2,496,063 | |
Professional fees | | | 113,448 | |
Custodian fees—Note 3(b) | | | 96,938 | |
Registration fees | | | 87,827 | |
Directors’ fees and expenses—Note 3(c) | | | 79,440 | |
Prospectus and shareholders’ reports | | | 38,503 | |
Loan commitment fees—Note 2 | | | 19,878 | |
Interest expense—Note 2 | | | 5,963 | |
Miscellaneous | | | 32,644 | |
Total Expenses | | | 10,284,693 | |
Less—reduction in fees due to earnings credits—Note 3(b) | | | (8,529) | |
Net Expenses | | | 10,276,164 | |
Investment (Loss)—Net | | | (3,745,652) | |
Realized and Unrealized Gain (Loss) on Investments—Note 4 ($): | | |
Net realized gain (loss) on investments | 118,409,645 | |
Net unrealized appreciation (depreciation) on investments | | | 83,275,055 | |
Net Realized and Unrealized Gain (Loss) on Investments | | | 201,684,700 | |
Net Increase in Net Assets Resulting from Operations | | 197,939,048 | |
| | | | | | | |
See notes to financial statements. | | | | | |
15
STATEMENT OF CHANGES IN NET ASSETS
| | | | | | | | | | |
| | | | Year Ended August 31, |
| | | | 2017 | a | | 2016 | |
Operations ($): | | | | | | | | |
Investment (loss)—net | | | (3,745,652) | | | | (1,341,271) | |
Net realized gain (loss) on investments | | 118,409,645 | | | | 14,972,795 | |
Net unrealized appreciation (depreciation)
on investments | | 83,275,055 | | | | (8,400,423) | |
Net Increase (Decrease) in Net Assets
Resulting from Operations | 197,939,048 | | | | 5,231,101 | |
Distributions to Shareholders from ($): | | | | | | | | |
Investment income—net: | | | | | | | | |
Investor Shares | | | - | | | | (2,920,964) | |
Net realized gain on investments: | | | | | | | | |
Investor Shares | | | (3,999,748) | | | | (30,554,710) | |
Class I | | | (665) | | | | - | |
Class Y | | | (45) | | | | - | |
Total Distributions | | | (4,000,458) | | | | (33,475,674) | |
Capital Stock Transactions ($): | | | | | | | | |
Net proceeds from shares sold: | | | | | | | | |
Investor Shares | | | 217,081,169 | | | | 158,035,790 | |
Class I | | | 66,561,226 | | | | - | |
Class Y | | | 455,884,195 | | | | - | |
Distributions reinvested: | | | | | | | | |
Investor Shares | | | 3,036,951 | | | | 25,215,603 | |
Class I | | | 620 | | | | - | |
Cost of shares redeemed: | | | | | | | | |
Investor Shares | | | (705,991,264) | | | | (292,501,076) | |
Class I | | | (15,345,775) | | | | - | |
Class Y | | | (8,533,201) | | | | - | |
Increase (Decrease) in Net Assets
from Capital Stock Transactions | 12,693,921 | | | | (109,249,683) | |
Total Increase (Decrease) in Net Assets | 206,632,511 | | | | (137,494,256) | |
Net Assets ($): | | | | | | | | |
Beginning of Period | | | 802,741,132 | | | | 940,235,388 | |
End of Period | | | 1,009,373,643 | | | | 802,741,132 | |
Accumulated investment (loss)—net | - | | | | (3,191,973) | |
Capital Share Transactions (Shares): | | | | | | | | |
Investor Sharesb | | | | | | | | |
Shares sold | | | 6,575,414 | | | | 5,626,484 | |
Shares issued for distributions reinvested | | | 90,709 | | | | 867,410 | |
Shares redeemed | | | (20,354,904) | | | | (10,309,536) | |
Net Increase (Decrease) in Shares Outstanding | (13,688,781) | | | | (3,815,642) | |
Class Ib | | | | | | | | |
Shares sold | | | 1,899,812 | | | | - | |
Shares issued for distributions reinvested | | | 18 | | | | - | |
Shares redeemed | | | (446,386) | | | | - | |
Net Increase (Decrease) in Shares Outstanding | 1,453,444 | | | | - | |
Class Yb | | | | | | | | |
Shares sold | | | 13,014,137 | | | | - | |
Shares redeemed | | | (236,350) | | | | - | |
Net Increase (Decrease) in Shares Outstanding | 12,777,787 | | | | - | |
| | | | | | | | | | |
a On September 30, 2016, the fund redesignated existing shares as Investor shares and commenced offering Class I and Class Y shares. | |
b During the period ended August 31, 2017, 3,150 Investor shares representing $91,861 were exchanged for 3,149 Class I shares, 12,139,913 Investor shares representing $423,925,756 were exchanged for 12,126,023 Class Y shares and 41,076 Class Y shares representing $1,482,175 were exchanged for 41,067 Class I shares. | |
See notes to financial statements.
| | | | | | | | |
16
FINANCIAL HIGHLIGHTS
The following tables describe the performance for each share class for the fiscal periods indicated. All information (except portfolio turnover rate) reflects financial results for a single fund share. Total return shows how much your investment in the fund would have increased (or decreased) during each period, assuming you had reinvested all dividends and distributions. These figures have been derived from the fund’s financial statements.
| | | | | | | | | |
| | | | |
| | |
Investor Shares | | Year Ended August 31, |
| | 2017a | 2016 | 2015 | 2014 | 2013 |
Per Share Data ($): | | | | | | |
Net asset value, beginning of period | | 29.66 | 30.45 | 35.87 | 34.70 | 26.02 |
Investment Operations: | | | | | | |
Investment (loss)—netb | | (.15) | (.05) | (.13) | (.13) | (.09) |
Net realized and unrealized gain
(loss) on investments | | 7.16 | .43 | .17 | 5.70 | 8.77 |
Total from Investment Operations | | 7.01 | .38 | .04 | 5.57 | 8.68 |
Distributions: | | | | | | |
Dividends from
investment income—net | | - | (.10) | - | - | - |
Dividends from net realized
gain on investments | | (.14) | (1.07) | (5.46) | (4.40) | - |
Total Distributions | | (.14) | (1.17) | (5.46) | (4.40) | - |
Net asset value, end of period | | 36.53 | 29.66 | 30.45 | 35.87 | 34.70 |
Total Return (%) | | 23.67 | 1.34 | .18 | 16.95 | 33.36 |
Ratios/Supplemental Data (%): | | | | | | |
Ratio of total expenses
to average net assets | | 1.10 | 1.11 | 1.09 | 1.10 | 1.13 |
Ratio of net expenses
to average net assets | | 1.10 | 1.11 | 1.09 | 1.10 | 1.13 |
Ratio of net investment (loss)
to average net assets | | (.44) | (.17) | (.41) | (.35) | (.29) |
Portfolio Turnover Rate | | 84.96 | 82.01 | 74.06 | 88.69 | 94.62 |
Net Assets, end of period ($ x 1,000) | | 488,507 | 802,741 | 940,235 | 1,162,516 | 850,685 |
a On September 30, 2016, the fund redesignated existing shares as Investor shares.
b Based on average shares outstanding.
See notes to financial statements.
17
FINANCIAL HIGHLIGHTS (continued)
| | | | | | | | | |
| | | | |
| | | |
Class I Shares | | Period Ended | |
| | | | | August 31, 2017a | |
Per Share Data ($): | | | | | | |
Net asset value, beginning of period | | | | | 30.62 | |
Investment Operations: | | | | | | |
Investment (loss)—netb | | | | | (.07) | |
Net realized and unrealized gain
(loss) on investments | | | | | 6.19 | |
Total from Investment Operations | | | | | 6.12 | |
Distributions: | | | | | �� | |
Dividends from net realized
gain on investments | | | | | (.14) | |
Net asset value, end of period | | | | | 36.60 | |
Total Return (%)c | | | | | 20.02 | |
Ratios/Supplemental Data (%): | | | | | | |
Ratio of total expenses
to average net assetsd | | | | | .95 | |
Ratio of net expenses
to average net assetsd | | | | | .95 | |
Ratio of net investment (loss)
to average net assetsd | | | | | (.23) | |
Portfolio Turnover Rate | | | | | 84.96 | |
Net Assets, end of period ($ x 1,000) | | | | | 53,194 | |
a From September 30, 2016 (commencement of initial offering) to August 31, 2017.
b Based on average shares outstanding.
c Not annualized.
d Annualized.
See notes to financial statements.
18
| | | | | | | | | |
| | | | |
| | | |
Class Y Shares | | Period Ended | |
| | | | | August 31, 2017a | |
Per Share Data ($): | | | | | | |
Net asset value, beginning of period | | | | | 30.62 | |
Investment Operations: | | | | | | |
Investment (loss)—netb | | | | | (.01) | |
Net realized and unrealized gain
(loss) on investments | | | | | 6.13 | |
Total from Investment Operations | | | | | 6.12 | |
Distributions: | | | | | | |
Dividends from net realized
gain on investments | | | | | (.14) | |
Net asset value, end of period | | | | | 36.60 | |
Total Return (%)c | | | | | 20.02 | |
Ratios/Supplemental Data (%): | | | | | | |
Ratio of total expenses
to average net assetsd | | | | | .81 | |
Ratio of net expenses
to average net assetsd | | | | | .81 | |
Ratio of net investment (loss)
to average net assetsd | | | | | (.03) | |
Portfolio Turnover Rate | | | | | 84.96 | |
Net Assets, end of period ($ x 1,000) | | | | | 467,673 | |
a From September 30, 2016 (commencement of initial offering) to August 31, 2017.
b Based on average shares outstanding.
c Not annualized.
d Annualized.
See notes to financial statements.
19
NOTES TO FINANCIAL STATEMENTS
NOTE 1—Significant Accounting Policies:
Dreyfus Opportunistic Small Cap Fund (the “fund”) is a separate diversified series of Advantage Funds, Inc. (the “Company”), which is registered under the Investment Company Act of 1940, as amended (the “Act”), as an open-end management investment company and operates as a series company currently offering nine series, including the fund. The fund’s investment objective is to seek capital appreciation. The Dreyfus Corporation (the “Manager” or “Dreyfus”), a wholly-owned subsidiary of The Bank of New York Mellon Corporation (“BNY Mellon”), serves as the fund’s investment adviser.
On September 30, 2016, the fund implemented a multiple class structure in which the fund commenced offering Class I and Class Y shares. The existing fund shares were redesignated as Investor shares. The fund authorized 100 million Class I and Class Y shares which resulted in the fund’s total authorized shares increasing from 200 million to 400 million.
MBSC Securities Corporation (the “Distributor”), a wholly-owned subsidiary of Dreyfus, is the distributor of the fund’s shares, which are sold without a sales charge. The fund is authorized to issue 400 million shares of $.001 par value Common Stock. The fund currently has authorized three classes of shares: Investor (200 million shares authorized), Class I (100 million shares authorized) and Class Y shares (100 million shares authorized). Investor shares are sold primarily to retail investors through financial intermediaries and bear Shareholder Services Plan fees. Class I and Y shares are sold at net asset value per share generally to institutional investors. Other differences between the classes include the services offered to and the expenses borne by each class, the allocation of certain transfer agency costs, and certain voting rights. Income, expenses (other than expenses attributable to a specific class), and realized and unrealized gains or losses on investments are allocated to each class of shares based on its relative net assets.
The Company accounts separately for the assets, liabilities and operations of each series. Expenses directly attributable to each series are charged to that series’ operations; expenses which are applicable to all series are allocated among them on a pro rata basis.
The Financial Accounting Standards Board (“FASB”) Accounting Standards Codification is the exclusive reference of authoritative U.S. generally accepted accounting principles (“GAAP”) recognized by the FASB to be applied by nongovernmental entities. Rules and interpretive
20
releases of the Securities and Exchange Commission (“SEC”) under authority of federal laws are also sources of authoritative GAAP for SEC registrants. The fund’s financial statements are prepared in accordance with GAAP, which may require the use of management estimates and assumptions. Actual results could differ from those estimates.
The Company enters into contracts that contain a variety of indemnifications. The fund’s maximum exposure under these arrangements is unknown. The fund does not anticipate recognizing any loss related to these arrangements.
(a) Portfolio valuation: The fair value of a financial instrument is the amount that would be received to sell an asset or paid to transfer a liability in an orderly transaction between market participants at the measurement date (i.e., the exit price). GAAP establishes a fair value hierarchy that prioritizes the inputs of valuation techniques used to measure fair value. This hierarchy gives the highest priority to unadjusted quoted prices in active markets for identical assets or liabilities (Level 1 measurements) and the lowest priority to unobservable inputs (Level 3 measurements).
Additionally, GAAP provides guidance on determining whether the volume and activity in a market has decreased significantly and whether such a decrease in activity results in transactions that are not orderly. GAAP requires enhanced disclosures around valuation inputs and techniques used during annual and interim periods.
Various inputs are used in determining the value of the fund’s investments relating to fair value measurements. These inputs are summarized in the three broad levels listed below:
Level 1—unadjusted quoted prices in active markets for identical investments.
Level 2—other significant observable inputs (including quoted prices for similar investments, interest rates, prepayment speeds, credit risk, etc.).
Level 3—significant unobservable inputs (including the fund’s own assumptions in determining the fair value of investments).
The inputs or methodology used for valuing securities are not necessarily an indication of the risk associated with investing in those securities.
Changes in valuation techniques may result in transfers in or out of an assigned level within the disclosure hierarchy. Valuation techniques used to value the fund’s investments are as follows:
21
NOTES TO FINANCIAL STATEMENTS (continued)
Investments in securities are valued at the last sales price on the securities exchange or national securities market on which such securities are primarily traded. Securities listed on the National Market System for which market quotations are available are valued at the official closing price or, if there is no official closing price that day, at the last sales price. For open short positions, asked prices are used for valuation purposes. Bid price is used when no asked price is available. Registered investment companies that are not traded on an exchange are valued at their net asset value. All of the preceding securities are generally categorized within Level 1 of the fair value hierarchy.
Securities not listed on an exchange or the national securities market, or securities for which there were no transactions, are valued at the average of the most recent bid and asked prices. These securities are generally categorized within Level 2 of the fair value hierarchy.
Fair valuing of securities may be determined with the assistance of a pricing service using calculations based on indices of domestic securities and other appropriate indicators, such as prices of relevant American Depository Receipts and futures. Utilizing these techniques may result in transfers between Level 1 and Level 2 of the fair value hierarchy.
When market quotations or official closing prices are not readily available, or are determined not to reflect accurately fair value, such as when the value of a security has been significantly affected by events after the close of the exchange or market on which the security is principally traded (for example, a foreign exchange or market), but before the fund calculates its net asset value, the fund may value these investments at fair value as determined in accordance with the procedures approved by the Company’s Board of Directors (the “Board”). Certain factors may be considered when fair valuing investments such as: fundamental analytical data, the nature and duration of restrictions on disposition, an evaluation of the forces that influence the market in which the securities are purchased and sold, and public trading in similar securities of the issuer or comparable issuers. These securities are either categorized within Level 2 or 3 of the fair value hierarchy depending on the relevant inputs used.
For restricted securities where observable inputs are limited, assumptions about market activity and risk are used and are generally categorized within Level 3 of the fair value hierarchy.
The following is a summary of the inputs used as of August 31, 2017 in valuing the fund’s investments:
22
| | | | | | |
| | Level 1 - Unadjusted Quoted Prices | Level 2 - Other Significant Observable Inputs | Level 3 -Significant Unobservable Inputs | Total |
Assets ($) | | | | |
Investments in Securities: | | |
Equity Securities-Domestic Common Stocks† | 940,761,145 | - | - | 940,761,145 |
Equity Securities-Foreign Common Stocks† | 50,286,171 | - | - | 50,286,171 |
Exchange-Traded Funds | 6,031,725 | - | - | 6,031,725 |
Registered Investment Companies | 172,944,643 | - | - | 172,944,643 |
† See Statement of Investments for additional detailed categorizations.
At August 31, 2017, there were no transfers between levels of the fair value hierarchy.
(b) Securities transactions and investment income: Securities transactions are recorded on a trade date basis. Realized gains and losses from securities transactions are recorded on the identified cost basis. Dividend income is recognized on the ex-dividend date and interest income, including, where applicable, accretion of discount and amortization of premium on investments, is recognized on the accrual basis.
Pursuant to a securities lending agreement with The Bank of New York Mellon, a subsidiary of BNY Mellon and an affiliate of Dreyfus, the fund may lend securities to qualified institutions. It is the fund’s policy that, at origination, all loans are secured by collateral of at least 102% of the value of U.S. securities loaned and 105% of the value of foreign securities loaned. Collateral equivalent to at least 100% of the market value of securities on loan is maintained at all times. Collateral is either in the form of cash, which can be invested in certain money market mutual funds managed by Dreyfus, or U.S. Government and Agency securities. The fund is entitled to receive all dividends, interest and distributions on securities loaned, in addition to income earned as a result of the lending transaction. Should a borrower fail to return the securities in a timely manner, The Bank of New York Mellon is required to replace the securities for the benefit of the fund or credit the fund with the market value of the unreturned securities and is subrogated to the fund’s rights against the borrower and the collateral. Additionally, the contractual maturity of security lending transactions are on an overnight and continuous basis.
23
NOTES TO FINANCIAL STATEMENTS (continued)
During the period ended August 31, 2017, The Bank of New York Mellon earned $90,636 from lending portfolio securities, pursuant to the securities lending agreement.
(c) Affiliated issuers: Investments in other investment companies advised by Dreyfus are defined as “affiliated” under the Act.
(d) Dividends and distributions to shareholders: Dividends and distributions are recorded on the ex-dividend date. Dividends from investment income-net and dividends from net realized capital gains, if any, are normally declared and paid annually, but the fund may make distributions on a more frequent basis to comply with the distribution requirements of the Internal Revenue Code of 1986, as amended (the “Code”). To the extent that net realized capital gains can be offset by capital loss carryovers, it is the policy of the fund not to distribute such gains. Income and capital gain distributions are determined in accordance with income tax regulations, which may differ from GAAP.
(e) Federal income taxes: It is the policy of the fund to continue to qualify as a regulated investment company, if such qualification is in the best interests of its shareholders, by complying with the applicable provisions of the Code, and to make distributions of taxable income sufficient to relieve it from substantially all federal income and excise taxes.
As of and during the period ended August 31, 2017, the fund did not have any liabilities for any uncertain tax positions. The fund recognizes interest and penalties, if any, related to uncertain tax positions as income tax expense in the Statement of Operations. During the period ended August 31, 2017, the fund did not incur any interest or penalties.
Each tax year in the four-year period ended August 31, 2017 remains subject to examination by the Internal Revenue Service and state taxing authorities.
At August 31, 2017, the components of accumulated earnings on a tax basis were as follows: undistributed ordinary income $13,570,839, undistributed capital gains $86,320,663 and unrealized appreciation $173,275,812.
The tax character of distributions paid to shareholders during the fiscal periods ended August 31, 2017 and August 31, 2016 were as follows: ordinary income $0 and $2,918,692, and long-term capital gains $4,000,458 and $30,556,982, respectively.
During the period ended August 31, 2017, as a result of permanent book to tax differences, primarily due to the tax treatment for net operating losses, passive foreign investment companies, real estate investment trusts
24
and capital loss carryover expiration, the fund increased accumulated undistributed investment income-net by $6,937,625, decreased accumulated net realized gain (loss) on investments by $4,673,029 and decreased paid-in capital by $2,264,596. Net assets and net asset value per share were not affected by this reclassification.
NOTE 2—Bank Lines of Credit:
The fund participates with other Dreyfus-managed funds in an $810 million unsecured credit facility led by Citibank, N.A. and a $300 million unsecured credit facility provided by The Bank of New York Mellon (each, a “Facility”), each to be utilized primarily for temporary or emergency purposes, including the financing of redemptions. Prior to October 5, 2016, the unsecured credit facility with Citibank, N.A. was $555 million. In connection therewith, the fund has agreed to pay its pro rata portion of commitment fees for each Facility. Interest is charged to the fund based on rates determined pursuant to the terms of the respective Facility at the time of borrowing.
The average amount of borrowings outstanding under the Facilities during the period ended August 31, 2017 was approximately $308,800 with a related weighted average annualized interest rate of 1.93%.
NOTE 3—Management Fee and Other Transactions with Affiliates:
(a) Pursuant to a management agreement with Dreyfus, the management fee is computed at the annual rate of .75% of the value of the fund’s average daily net assets and is payable monthly.
(b) Under the Shareholder Services Plan, Investor shares pay the Distributor at an annual rate of .25% of the value of its average daily net assets for the provision of certain services. The services provided may include personal services relating to shareholder accounts, such as answering shareholder inquiries regarding the fund and providing reports and other information, and services related to the maintenance of shareholder accounts, such as recordkeeping and sub-accounting services. The Distributor may make payments to Service Agents (securities dealers, financial institutions or other industry professionals) with respect to these services. The Distributor determines the amounts to be paid to Service Agents. During the period ended August 31, 2017, the fund was charged $2,054,393 pursuant to the Shareholder Services Plan.
The fund has arrangements with the transfer agent and the custodian whereby the fund may receive earnings credits when positive cash balances are maintained, which are used to offset transfer agency and custody fees.
25
NOTES TO FINANCIAL STATEMENTS (continued)
For financial reporting purposes, the fund includes net earnings credits as an expense offset in the Statement of Operations.
The fund compensates Dreyfus Transfer, Inc., a wholly-owned subsidiary of Dreyfus, under a transfer agency agreement for providing transfer agency and cash management services for the fund. The majority of transfer agency fees are comprised of amounts paid on a per account basis, while cash management fees are related to fund subscriptions and redemptions. During the period ended August 31, 2017, the fund was charged $91,354 for transfer agency services and $8,238 for cash management services. These fees are included in Shareholder servicing costs in the Statement of Operations. Cash management fees were partially offset by earnings credits of $8,139.
The fund compensates The Bank of New York Mellon under a custody agreement for providing custodial services for the fund. These fees are determined based on net assets, geographic region and transaction activity. During the period ended August 31, 2017, the fund was charged $96,938 pursuant to the custody agreement. These fees were partially offset by earnings credits of $390.
During the period ended August 31, 2017, the fund was charged $11,281 for services performed by the Chief Compliance Officer and his staff.
The components of “Due to The Dreyfus Corporation and affiliates” in the Statement of Assets and Liabilities consist of: management fees $635,167, Shareholder Services Plan fees $102,957, custodian fees $32,658, Chief Compliance Officer fees $4,670 and transfer agency fees $17,595.
(c) Each Board member also serves as a Board member of other funds within the Dreyfus complex. Annual retainer fees and attendance fees are allocated to each fund based on net assets.
NOTE 4—Securities Transactions:
The aggregate amount of purchases and sales of investment securities, excluding short-term securities, during the period ended August 31, 2017, amounted to $815,412,486 and $814,038,203, respectively.
At August 31, 2017, the cost of investments for federal income tax purposes was $996,747,872; accordingly, accumulated net unrealized appreciation on investments was $173,275,812, consisting of $197,846,941 gross unrealized appreciation and $24,571,129 gross unrealized depreciation.
26
REPORT OF INDEPENDENT REGISTERED
PUBLIC ACCOUNTING FIRM
Shareholders and Board of Directors
Dreyfus Opportunistic Small Cap Fund
We have audited the accompanying statement of assets and liabilities, including the statements of investments and investments in affiliated issuers, of Dreyfus Opportunistic Small Cap Fund (one of the series comprising Advantage Funds, Inc.) as of August 31, 2017, and the related statement of operations for the year then ended, the statement of changes in net assets for each of the two years in the period then ended, and the financial highlights for each of the periods indicated therein. These financial statements and financial highlights are the responsibility of the Fund’s management. Our responsibility is to express an opinion on these financial statements and financial highlights based on our audits.
We conducted our audits in accordance with the standards of the Public Company Accounting Oversight Board (United States). Those standards require that we plan and perform the audit to obtain reasonable assurance about whether the financial statements and financial highlights are free of material misstatement. We were not engaged to perform an audit of the Fund’s internal control over financial reporting. Our audits included consideration of internal control over financial reporting as a basis for designing audit procedures that are appropriate in the circumstances, but not for the purpose of expressing an opinion on the effectiveness of the Fund’s internal control over financial reporting. Accordingly, we express no such opinion. An audit also includes examining, on a test basis, evidence supporting the amounts and disclosures in the financial statements and financial highlights, assessing the accounting principles used and significant estimates made by management, and evaluating the overall financial statement presentation. Our procedures included confirmation of securities owned as of August 31, 2017 by correspondence with the custodian and others. We believe that our audits provide a reasonable basis for our opinion.
In our opinion, the financial statements and financial highlights referred to above present fairly, in all material respects, the financial position of Dreyfus Opportunistic Small Cap Fund at August 31, 2017, the results of its operations for the year then ended, the changes in its net assets for each of the two years in the period then ended, and the financial highlights for each of the indicated periods, in conformity with U.S. generally accepted accounting principles.

New York, New York
October 26, 2017
27
IMPORTANT TAX INFORMATION (Unaudited)
For federal tax purposes, the fund hereby reports $.1368 per share as a long-term capital gain distribution paid on December 16, 2016.
28
INFORMATION ABOUT THE RENEWAL OF THE FUND’S MANAGEMENT AGREEMENT (Unaudited)
At a meeting of the fund’s Board of Directors held on March 9-10, 2017, the Board considered the renewal of the fund’s Management Agreement pursuant to which Dreyfus provides the fund with investment advisory and administrative services (the “Agreement”). The Board members, none of whom are “interested persons” (as defined in the Investment Company Act of 1940, as amended) of the fund, were assisted in their review by independent legal counsel and met with counsel in executive session separate from Dreyfus representatives. In considering the renewal of the Agreement, the Board considered all factors that it believed to be relevant, including those discussed below. The Board did not identify any one factor as dispositive, and each Board member may have attributed different weights to the factors considered.
Analysis of Nature, Extent, and Quality of Services Provided to the Fund. The Board considered information provided to them at the meeting and in previous presentations from Dreyfus representatives regarding the nature, extent, and quality of the services provided to funds in the Dreyfus fund complex. Dreyfus provided the number of open accounts in the fund, the fund’s asset size and the allocation of fund assets among distribution channels. Dreyfus also had previously provided information regarding the diverse intermediary relationships and distribution channels of funds in the Dreyfus fund complex (such as retail direct or intermediary, in which intermediaries typically are paid by the fund and/or Dreyfus) and Dreyfus’ corresponding need for broad, deep, and diverse resources to be able to provide ongoing shareholder services to each intermediary or distribution channel, as applicable to the fund.
The Board also considered research support available to, and portfolio management capabilities of, the fund’s portfolio management personnel and that Dreyfus also provides oversight of day-to-day fund operations, including fund accounting and administration and assistance in meeting legal and regulatory requirements. The Board also considered Dreyfus’ extensive administrative, accounting and compliance infrastructures. The Board also considered portfolio management’s brokerage policies and practices (including policies and practices regarding soft dollars) and the standards applied in seeking best execution.
Comparative Analysis of the Fund’s Performance and Management Fee and Expense Ratio. The Board reviewed reports prepared by Broadridge Financial Solutions, Inc. (“Broadridge”), an independent provider of investment company data, which included information comparing (1) the fund’s performance with the performance of a group of comparable funds (the “Performance Group”) and with a broader group of funds (the “Performance Universe”), all for various periods ended January 31, 2017, and (2) the fund’s actual and contractual management fees and total expenses with those of a group of comparable funds (the “Expense Group”) and with a broader group of funds (the “Expense Universe”), the information for which was derived in part from fund financial statements available to Broadridge as of the date of its analysis. Dreyfus previously had furnished the Board with a description of the methodology Broadridge used to select the Performance Group and Performance Universe and the Expense Group and Expense Universe.
29
INFORMATION ABOUT THE RENEWAL OF THE FUND’S MANAGEMENT AGREEMENT (Unaudited) (continued)
Dreyfus representatives stated that the usefulness of performance comparisons may be affected by a number of factors, including different investment limitations that may be applicable to the fund and comparison funds. The Board discussed with representatives of Dreyfus and/or its affiliates the results of the comparisons and considered that the fund’s total return performance was above the Performance Group (highest in the Performance Group in the one- and ten-year periods) and Performance Universe medians for all periods except for the three-year period when the fund’s performance was below the Performance Group and Performance Universe medians. Dreyfus also provided a comparison of the fund’s calendar year total returns to the returns of the fund’s benchmark index.
The Board also reviewed the range of actual and contractual management fees and total expenses of the Expense Group and Expense Universe funds and discussed the results of the comparisons. The Board considered that the fund’s contractual management fee was below the Expense Group median and the fund’s actual management fee and total expenses were below the Expense Group and Expense Universe medians.
Dreyfus representatives reviewed with the Board the management or investment advisory fees (1) paid by funds advised or administered by Dreyfus that are in the same Broadridge category as the fund and (2) paid to Dreyfus or the Dreyfus-affiliated primary employer of the fund’s primary portfolio manager(s) for advising any separate accounts and/or other types of client portfolios that are considered to have similar investment strategies and policies as the fund (the “Similar Clients”), and explained the nature of the Similar Clients. They discussed differences in fees paid and the relationship of the fees paid in light of any differences in the services provided and other relevant factors. The Board considered the relevance of the fee information provided for the Similar Clients to evaluate the appropriateness of the fund’s management fee.
Analysis of Profitability and Economies of Scale. Dreyfus representatives reviewed the expenses allocated and profit received by Dreyfus and its affiliates and the resulting profitability percentage for managing the fund and the aggregate profitability percentage to Dreyfus and its affiliates for managing the funds in the Dreyfus fund complex, and the method used to determine the expenses and profit. The Board concluded that the profitability results were not unreasonable, given the services rendered and service levels provided by Dreyfus. The Board also had been provided with information prepared by an independent consulting firm regarding Dreyfus’ approach to allocating costs to, and determining the profitability of, individual funds and the entire Dreyfus fund complex. The consulting firm also had analyzed where any economies of scale might emerge in connection with the management of a fund.
The Board considered, on the advice of its counsel, the profitability analysis (1) as part of its evaluation of whether the fees under the Agreement, considered in relation to the mix of services provided by Dreyfus, including the nature, extent and quality of such services, supported the renewal of the Agreement and (2) in light of the relevant circumstances for the fund and the extent to which economies of scale would be realized if the fund grows and whether fee levels reflect these economies of scale for the benefit of fund shareholders. Dreyfus representatives also stated that, as a result of
30
shared and allocated costs among funds in the Dreyfus fund complex, the extent of economies of scale could depend substantially on the level of assets in the complex as a whole, so that increases and decreases in complex-wide assets can affect potential economies of scale in a manner that is disproportionate to, or even in the opposite direction from, changes in the fund’s asset level. The Board also considered potential benefits to Dreyfus from acting as investment adviser and took into consideration soft dollar arrangements in effect for trading the fund’s investments.
At the conclusion of these discussions, the Board agreed that it had been furnished with sufficient information to make an informed business decision with respect to the renewal of the Agreement. Based on the discussions and considerations as described above, the Board concluded and determined as follows.
· The Board concluded that the nature, extent and quality of the services provided by Dreyfus are adequate and appropriate.
· The Board was satisfied with the fund’s performance.
· The Board concluded that the fee paid to Dreyfus supported the renewal of the Agreement in light of the considerations described above.
· The Board determined that the economies of scale which may accrue to Dreyfus and its affiliates in connection with the management of the fund had been adequately considered by Dreyfus in connection with the fee rate charged to the fund pursuant to the Agreement and that, to the extent in the future it were determined that material economies of scale had not been shared with the fund, the Board would seek to have those economies of scale shared with the fund.
In evaluating the Agreement, the Board considered these conclusions and determinations and also relied on its previous knowledge, gained through meetings and other interactions with Dreyfus and its affiliates, of Dreyfus and the services provided to the fund by Dreyfus. The Board also relied on information received on a routine and regular basis throughout the year relating to the operations of the fund and the investment management and other services provided under the Agreement, including information on the investment performance of the fund in comparison to similar mutual funds and benchmark performance indices; general market outlook as applicable to the fund; and compliance reports. In addition, the Board’s consideration of the contractual fee arrangements for this fund had the benefit of a number of years of reviews of the Agreement for the fund, or substantially similar agreements for other Dreyfus funds that the Board oversees, during which lengthy discussions took place between the Board and Dreyfus representatives. Certain aspects of the arrangements may receive greater scrutiny in some years than in others, and the Board’s conclusions may be based, in part, on their consideration of the fund’s arrangements, or similar arrangements for other Dreyfus funds that the Board oversees, in prior years. The Board determined to renew the Agreement.
31
BOARD MEMBERS INFORMATION (Unaudited)
INDEPENDENT BOARD MEMBERS
Joseph S. DiMartino (73)
Chairman of the Board (1995)
Principal Occupation During Past 5 Years:
· Corporate Director and Trustee (1995-present)
Other Public Company Board Memberships During Past 5 Years:
· CBIZ (formerly, Century Business Services, Inc.), a provider of outsourcing functions for small and medium size companies, Director (1997-present)
No. of Portfolios for which Board Member Serves: 130
———————
Peggy C. Davis (74)
Board Member (2006)
Principal Occupation During Past 5 Years:
· Shad Professor of Law, New York University School of Law (1983-present)
No. of Portfolios for which Board Member Serves: 47
———————
David P. Feldman (77)
Board Member (1996)
Principal Occupation During Past 5 Years:
· Corporate Director and Trustee (1985-present)
Other Public Company Board Memberships During Past 5 Years:
· BBH Mutual Funds Group (5 registered mutual funds), Director (1992-2014)
No. of Portfolios for which Board Member Serves: 33
———————
Joan Gulley (69)
Board Member (2017)
Principal Occupation During Past 5 Years:
· PNC Financial Services Group, Inc.(1993-2014)
· Executive Vice President and Chief Human Resources Officer and Executive Committee Member (2008-2014)
No. of Portfolios for which Board Member Serves: 33
———————
32
Ehud Houminer (77)
Board Member (1993)
Principal Occupation During Past 5 Years:
· Board of Overseers at the Columbia Business School, Columbia University (1992-present)
· Trustee, Ben Gurion University
Other Public Company Board Memberships During Past 5 Years:
· Avnet, Inc., an electronics distributor, Director (1993-2012)
No. of Portfolios for which Board Member Serves: 54
———————
Lynn Martin (77)
Board Member (2012)
Principal Occupation During Past 5 Years:
· President of The Martin Hall Group LLC, a human resources consulting firm (2005-2012)
Other Public Company Board Memberships During Past 5 Years:
· AT&T, Inc., a telecommunications company, Director (1999-2012)
· Ryder System, Inc., a supply chain and transportation management company, Director (1993-2012)
No. of Portfolios for which Board Member Serves: 33
———————
Robin A. Melvin (53)
Board Member (2012)
Principal Occupation During Past 5 Years:
· Co-chairman, Illinois Mentoring Partnership, non-profit organization dedicated to increasing the quantity and quality of mentoring services in Illinois; (2014-present; board member since 2013)
· Director, Boisi Family Foundation, a private family foundation that supports youth-serving organizations that promote the self sufficiency of youth from disadvantaged circumstances (1995-2012)
No. of Portfolios for which Board Member Serves: 102
———————
33
BOARD MEMBERS INFORMATION (Unaudited) (continued)
INDEPENDENT BOARD MEMBERS (continued)
Dr. Martin Peretz (78)
Board Member (2006)
Principal Occupation During Past 5 Years:
· Editor-in-Chief Emeritus of The New Republic Magazine (2011-2012) (previously,
Editor-in-Chief, 1974-2011)
· Lecturer at Harvard University (1969-2012)
No. of Portfolios for which Board Member Serves: 33
———————
Once elected all Board Members serve for an indefinite term, but achieve Emeritus status upon reaching age 80. The address of the Board Members and Officers is c/o The Dreyfus Corporation, 200 Park Avenue, New York, New York 10166. Additional information about the Board Members is available in the fund’s Statement of Additional Information which can be obtained from Dreyfus free of charge by calling this toll free number: 1-800-DREYFUS.
James F. Henry, Emeritus Board Member
Philip L. Toia, Emeritus Board Member
34
OFFICERS OF THE FUND (Unaudited)
BRADLEY J. SKAPYAK, President since January 2010.
Chief Operating Officer and a director of the Manager since June 2009, Chairman of Dreyfus Transfer, Inc., an affiliate of the Manager and the transfer agent of the funds, since May 2011 and Chief Executive Officer of MBSC Securities Corporation since August 2016. He is an officer of 63 investment companies (comprised of 130 portfolios) managed by the Manager. He is 58 years old and has been an employee of the Manager since February 1988.
BENNETT A. MACDOUGALL, Chief Legal Officer since October 2015.
Chief Legal Officer of the Manager and Associate General Counsel and Managing Director of BNY Mellon since June 2015; from June 2005 to June 2015, he served in various capacities with Deutsche Bank – Asset & Wealth Management Division, including as Director and Associate General Counsel, and Chief Legal Officer of Deutsche Investment Management Americas Inc. from June 2012 to May 2015. He is an officer of 64 investment companies (comprised of 155 portfolios) managed by the Manager. He is 45 years old and has been an employee of the Manager since June 2015.
JANETTE E. FARRAGHER, Vice President and Secretary since December 2011.
Associate General Counsel of BNY Mellon, and an officer of 64 investment companies (comprised of 155 portfolios) managed by the Manager. She is 54 years old and has been an employee of the Manager since February 1984.
JAMES BITETTO, Vice President and Assistant Secretary since August 2005.
Managing Counsel of BNY Mellon and Secretary of the Manager, and an officer of 64 investment companies (comprised of 155 portfolios) managed by the Manager. He is 51 years old and has been an employee of the Manager since December 1996.
JOSEPH M. CHIOFFI, Vice President and Assistant Secretary since August 2005.
Managing Counsel of BNY Mellon, and an officer of 64 investment companies (comprised of 155 portfolios) managed by the Manager. He is 55 years old and has been an employee of the Manager since June 2000.
MAUREEN E. KANE, Vice President and Assistant Secretary since April 2015.
Managing Counsel of BNY Mellon since July 2014; from October 2004 until July 2014, General Counsel, and from May 2009 until July 2014, Chief Compliance Officer of Century Capital Management. She is an officer of 64 investment companies (comprised of 155 portfolios) managed by the Manager. She is 55 years old and has been an employee of the Manager since July 2014.
SARAH S. KELLEHER, Vice President and Assistant Secretary since April 2014.
Senior Counsel of BNY Mellon since March 2013, from August 2005 to March 2013, Associate General Counsel of Third Avenue Management. She is an officer of 64 investment companies (comprised of 155 portfolios) managed by the Manager. She is 41 years old and has been an employee of the Manager since March 2013.
JEFF PRUSNOFSKY, Vice President and Assistant Secretary since August 2005.
Senior Managing Counsel of BNY Mellon, and an officer of 64 investment companies (comprised of 155 portfolios) managed by the Manager. He is 52 years old and has been an employee of the Manager since October 1990.
NATALYA ZELENSKY, Vice President and Assistant Secretary since March 2017.
Counsel and Vice President of BNY Mellon since May 2016; Attorney at Wildermuth Endowment Strategy Fund/Wildermuth Advisory, LLC from November 2015 until May 2016; Assistant General Counsel at RCS Advisory Services from July 2014 until November 2015; Associate at Sutherland, Asbill & Brennan from January 2013 until January 2014; Associate at K&L Gates from October 2011 until January 2013. She is an officer of 64 investment companies (comprised of 155 portfolios) managed by Dreyfus. She is 32 years old and has been an employee of the Manager since May 2016.
JAMES WINDELS, Treasurer since November 2001.
Director – Mutual Fund Accounting of the Manager, and an officer of 64 investment companies (comprised of 155 portfolios) managed by the Manager. He is 58 years old and has been an employee of the Manager since April 1985.
35
OFFICERS OF THE FUND (Unaudited) (continued)
RICHARD CASSARO, Assistant Treasurer since January 2008.
Senior Accounting Manager – Money Market and Municipal Bond Funds of the Manager, and an officer of 64 investment companies (comprised of 155 portfolios) managed by the Manager. He is 58 years old and has been an employee of the Manager since September 1982.
GAVIN C. REILLY, Assistant Treasurer since December 2005.
Tax Manager of the Investment Accounting and Support Department of the Manager, and an officer of 64 investment companies (comprised of 155 portfolios) managed by the Manager. He is 49 years old and has been an employee of the Manager since April 1991.
ROBERT S. ROBOL, Assistant Treasurer since August 2005.
Senior Accounting Manager – Dreyfus Financial Reporting of the Manager, and an officer of 64 investment companies (comprised of 155 portfolios) managed by the Manager. He is 53 years old and has been an employee of the Manager since October 1988.
ROBERT SALVIOLO, Assistant Treasurer since July 2007.
Senior Accounting Manager – Equity Funds of the Manager, and an officer of 64 investment companies (comprised of 155 portfolios) managed by the Manager. He is 50 years old and has been an employee of the Manager since June 1989.
ROBERT SVAGNA, Assistant Treasurer since December 2002.
Senior Accounting Manager – Fixed Income and Equity Funds of the Manager, and an officer of 64 investment companies (comprised of 155 portfolios) managed by the Manager. He is 50 years old and has been an employee of the Manager since November 1990.
JOSEPH W. CONNOLLY, Chief Compliance Officer since October 2004.
Chief Compliance Officer of the Manager and The Dreyfus Family of Funds (64 investment companies, comprised of 155 portfolios). He is 60 years old and has served in various capacities with the Manager since 1980, including manager of the firm’s Fund Accounting Department from 1997 through October 2001.
CARIDAD M. CAROSELLA, Anti-Money Laundering Compliance Officer since January 2016.
Anti-Money Laundering Compliance Officer of the Dreyfus Family of Funds and BNY Mellon Funds Trust since January 2016; from May 2015 to December 2015, Interim Anti-Money Laundering Compliance Officer of the Dreyfus Family of Funds and BNY Mellon Funds Trust and the Distributor; from January 2012 to May 2015, AML Surveillance Officer of the Distributor and from 2007 to December 2011, Financial Processing Manager of the Distributor. She is an officer of 59 investment companies (comprised of 150 portfolios) managed by the Manager. She is 49 years old and has been an employee of the Distributor since 1997.
36
NOTES
37
Dreyfus Opportunistic Small Cap Fund
200 Park Avenue
New York, NY 10166
Manager
The Dreyfus Corporation
200 Park Avenue
New York, NY 10166
Custodian
The Bank of New York Mellon
225 Liberty Street
New York, NY 10286
Transfer Agent &
Dividend Disbursing Agent
Dreyfus Transfer, Inc.
200 Park Avenue
New York, NY 10166
Distributor
MBSC Securities Corporation
200 Park Avenue
New York, NY 10166
| | |
Ticker Symbols: Investor: DSCVX Class I: DOPIX Class Y: DSCYX |
Telephone Call your financial representative or 1-800-DREYFUS
Mail The Dreyfus Family of Funds, 144 Glenn Curtiss Boulevard, Uniondale, NY 11556-0144
E-mail Send your request to info@dreyfus.com
Internet Information can be viewed online or downloaded at www.dreyfus.com
The fund files its complete schedule of portfolio holdings with the Securities and Exchange Commission (“SEC”) for the first and third quarters of each fiscal year on Form N-Q. The fund’s Forms N-Q are available on the SEC’s website at www.sec.gov and may be reviewed and copied at the SEC’s Public Reference Room in Washington, D.C. (phone 1-800-SEC-0330 for information).
A description of the policies and procedures that the fund uses to determine how to vote proxies relating to portfolio securities and information regarding how the fund voted these proxies for the most recent 12-month period ended June 30 is available at www.dreyfus.com and on the SEC’s website at www.sec.gov and without charge, upon request, by calling 1-800-DREYFUS.
| | |
© 2017 MBSC Securities Corporation
0253AR0817 | 
|
Dreyfus Strategic Value Fund
| | | |

| | ANNUAL REPORT
August 31, 2017 |
| |
Save time. Save paper. View your next shareholder report online as soon as it’s available. Log into www.dreyfus.com and sign up for Dreyfus eCommunications. It’s simple and only takes a few minutes. |
| |
The views expressed in this report reflect those of the portfolio manager(s) only through the end of the period covered and do not necessarily represent the views of Dreyfus or any other person in the Dreyfus organization. Any such views are subject to change at any time based upon market or other conditions and Dreyfus disclaims any responsibility to update such views. These views may not be relied on as investment advice and, because investment decisions for a Dreyfus fund are based on numerous factors, may not be relied on as an indication of trading intent on behalf of any Dreyfus fund. |
| |
Not FDIC-Insured • Not Bank-Guaranteed • May Lose Value |
Contents
THE FUND
FOR MORE INFORMATION
Back Cover
| | | | |
| |
Dreyfus Strategic Value Fund
| | The Fund |
A LETTER FROM THE CEO OF DREYFUS
Dear Shareholder:
We are pleased to present this annual report for Dreyfus Strategic Value Fund, covering the 12-month period from September 1, 2016 through August 31, 2017. For information about how the fund performed during the reporting period, as well as general market perspectives, we provide a Discussion of Fund Performance on the pages that follow.
Stocks set a series of new record highs and bonds produced mixed results over the past year in response to changing economic and political conditions. Financial markets during the final months of 2016 were dominated by the election of a new U.S. presidential administration. Equities surged higher in anticipation of more business-friendly regulatory, tax, and fiscal policies, but high-quality bonds generally lost value due to expectations of rising interest rates and accelerating inflation in a stronger economy. Despite a series of short-term interest-rate hikes, bonds recovered over the first eight months of 2017 when it became clearer that major tax and fiscal reforms would take time and political capital to enact. Stocks continued to rally, led by large growth-oriented companies, as corporate earnings grew and global economic conditions improved.
The markets’ recent strong performance has been supported by solid underlying fundamentals. While we currently expect these favorable conditions to persist, we remain watchful for economic and political developments that could derail the rallies. As always, we encourage you to discuss the risks and opportunities of today’s investment environment with your financial advisor.
Thank you for your continued confidence and support.
Sincerely,

Mark D. Santero
Chief Executive Officer
The Dreyfus Corporation
September 15, 2017
2
DISCUSSION OF FUND PERFORMANCE
For the period from September 1, 2016 through August 31, 2017, as provided by Brian C. Ferguson, John C. Bailer, and David S. Intoppa, Portfolio Managers
Market and Fund Performance Overview
For the 12-month period ended August 31, 2017, Dreyfus Strategic Value Fund’s Class A shares produced a total return of 14.26%, Class C shares returned 13.39%, Class I shares returned 14.58%, and Class Y shares returned 14.58%.1 The fund’s benchmark, the Russell 1000® Value Index (the “Index”), produced a total return of 11.58% for the same period.2
U.S. equities gained ground amid improving economic growth prospects, rising corporate earnings, and positive investor sentiment in the wake of the U.S. presidential election. The fund outperformed its benchmark, primarily on the strength of favorable sector allocations and successful security selections in the financials, industrials, health care, and materials sectors.
The Fund’s Investment Approach
The fund seeks capital appreciation. To pursue its goal, the fund normally invests at least 80% of its net assets, plus any borrowings for investment purposes, in stocks. The fund may invest up to 30% of its assets in foreign securities. We identify potential investments through extensive quantitative and fundamental research. We focus on individual stock selection (a “bottom-up” approach), emphasizing three key factors: value, sound business fundamentals and positive business momentum.
Strengthening Economic Fundamentals Drove Stocks Higher
U.S. equity markets moved lower in the weeks leading up to the 2016 presidential election amid political uncertainty and expectations that the Federal Reserve Board would raise short-term interest rates before the end of the year. However, the election’s unexpected outcome reenergized stocks as investors began to anticipate lower corporate taxes, reduced regulatory constraints on business, and increased infrastructure spending. Encouraging economic data, including strong GDP growth and a declining unemployment rate, further bolstered investor confidence, driving broad market indices to a series of new highs.
The second half of the reporting period saw growing concerns regarding the new presidential administration’s ability to implement its business-friendly policy proposals. Market sentiment shifted strongly in favor of economically sensitive growth stocks in areas perceived as less leveraged to federal policy changes, such as the information technology sector. The broader market continued to advance over the remainder of the reporting period, bolstered by positive macroeconomic trends and the weakening of the U.S. dollar against most other currencies.
Sector Allocations and Stock Selections Contributed to Gains
The fund outperformed its benchmark in the financials sector, where returns were bolstered by overweighted sector exposure and several good individual stock selections. Top performers included banking institutions such as JPMorgan Chase, Bank of America, and Comerica; capital markets companies such as Goldman Sachs Group, Morgan Stanley, E*TRADE Financial, and Charles Schwab; diversified financial services providers such as Voya
3
DISCUSSION OF FUND PERFORMANCE (continued)
Financial and Berkshire Hathaway; and insurers such as Prudential Financial. Underweighted exposure to the lagging real estate sector further bolstered the fund’s returns compared to the Index, as did a variety of industrial stocks, including air carriers such as Delta Air Lines, conglomerates such as Honeywell International, and aerospace and defense contractors such as Raytheon. Other notably strong holdings included health care plan providers UnitedHealth Group and Aetna, shipping container manufacturer Packaging Corporation of America, and construction materials providers Vulcan Materials and Martin Marietta Materials.
On the other hand, a few investments in other sectors weighed on the fund’s relative performance. Among energy holdings, Occidental Petroleum, Anadarko Petroleum, and a few others were hurt by weak oil prices. Among consumer staples companies, a few food and beverage producers, including Kellogg and Conagra Brands, fell in response to perceived competitive pressures, while Molson Coors Brewing posted disappointing earnings. Other disappointments included advertising agency Omnicom Group and real estate investment trust Uniti Group, both of which lagged their respective sector averages.
An Attractive Environment for Further Gains
Economic trends appear on track for continued, perhaps accelerating, growth, supported by employment gains, pro-growth government policies, and positive global macroeconomic developments. We have positioned the fund to benefit from these conditions by emphasizing investments in market sectors with what we believe are attractive valuations and strong earnings momentum. As of the end of the reporting period, the fund held overweighted exposure to the materials, financials, information technology, and industrials sectors. In contrast, the fund held relatively little exposure to utilities, real estate, consumer-related, and health care stocks.
September 15, 2017
1 Total return includes reinvestment of dividends and any capital gains paid and does not take into consideration the maximum initial sales charge in the case of Class A shares, or the applicable contingent deferred sales charges imposed on redemptions in the case of Class C shares. Had these charges been reflected, returns would have been lower. Past performance is no guarantee of future results. Share price and investment return fluctuate such that upon redemption, fund shares may be worth more or less than their original cost. The fund’s returns reflect the absorption of certain fund expenses by The Dreyfus Corporation pursuant to an agreement in effect through January 1, 2018, at which time it may be extended, terminated, or modified.
2 Source: Lipper Inc. — The Russell 1000® Value Index measures the performance of the large-cap value segment of the U.S. equity universe. It includes those Russell 1000 companies that are considered more value-oriented relative to the overall market as defined by Russell’s leading style methodology. The Russell 1000® Value Index is constructed to provide a comprehensive and unbiased barometer for the large-cap value segment. The index is completely reconstituted annually to ensure new and growing equities are included and that the represented companies continue to reflect value characteristics. Investors cannot invest directly in any index.
Please note: the position in any security highlighted with italicized typeface was sold during the reporting period.
Equities are subject generally to market, market sector, market liquidity, issuer, and investment style risks, among other factors, to varying degrees, all of which are more fully described in the fund’s prospectus.
The fund’s performance will be influenced by political, social, and economic factors affecting investments in foreign companies. Special risks associated with investments in foreign companies include exposure to currency fluctuations, less liquidity, less developed or less efficient trading markets, lack of comprehensive company information, political instability, and differing auditing and legal standards. These risks are enhanced in emerging market countries. Please read the prospectus for further discussion of these risks.
4
FUND PERFORMANCE
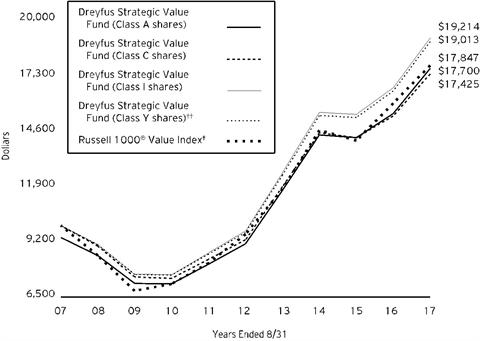
Comparison of change in value of $10,000 investment in Dreyfus Strategic Value Fund Class A shares, Class C shares, Class I shares and Class Y shares and the Russell 1000® Value Index (the “Index”)
† Source: Lipper Inc.
†† The total return figures presented for Class Y shares of the fund reflect the performance of the fund’s Class A shares for the period prior to 7/1/13 (the inception date for Class Y shares), not reflecting the applicable sales charges for Class A shares.
Past performance is not predictive of future performance.
The above graph compares a $10,000 investment made in each of the Class A, Class C, Class I and Class Y shares of Dreyfus Strategic Value Fund on 8/31/07 to a $10,000 investment made in the Index on that date. All dividends and capital gain distributions are reinvested.
The fund’s performance shown in the line graph above takes into account the maximum initial sales charge on Class A shares and all other applicable fees and expenses on all classes. The Index measures the performance of the large-cap value segment of the U.S. equity universe. It includes those Russell 1000 companies that are considered more value-oriented relative to the overall market as defined by Russell’s leading style methodology. The Index is constructed to provide a comprehensive and unbiased barometer for the large-cap value segment. The index is completely reconstituted annually to ensure new and growing equities are included and that the represented companies continue to reflect value characteristics. Unlike a mutual fund, the Index is not subject to charges, fees and other expenses. Investors cannot invest directly in any index. Further information relating to fund performance, including expense reimbursements, if applicable, is contained in the Financial Highlights section of the prospectus and elsewhere in this report.
5
FUND PERFORMANCE (continued)
| | | | | | | | |
Average Annual Total Returns as of 8/31/17 | | | | |
| | | Inception | | | | | |
| | Date | 1 Year | 5 Years | | 10 Years | |
| | | | | | | | |
Class A shares | | | | | | |
with maximum sales charge (5.75%) without sales charge | 9/29/95 | 7.69% | 12.87% | | 5.88% | |
9/29/95 | 14.26% | 14.22% | | 6.50% | |
Class C shares | | | | | | |
with applicable redemption charge † | 5/31/01 | 12.39% | 13.36% | | 5.71% | |
without redemption | 5/31/01 | 13.39% | 13.36% | | 5.71% | |
Class I shares | 5/31/01 | 14.58% | 14.51% | | 6.75% | |
Class Y shares | 7/1/13 | 14.58% | 14.50%†† | | 6.64%†† | |
Russell 1000® Value Index | | 11.58% | 13.25% | | 5.96% | |
† The maximum contingent deferred sales charge for Class C shares is 1% for shares redeemed within one year of the date of purchase.
†† The total return performance figures presented for Class Y shares of the fund reflect the performance of the fund’s Class A shares for the period prior to 7/1/13 (the inception date for Class Y shares), not reflecting the applicable sales charges for Class A shares.
The performance data quoted represents past performance, which is no guarantee of future results. Share price and investment return fluctuate and an investor’s shares may be worth more or less than original cost upon redemption. Current performance may be lower or higher than the performance quoted. Go to Dreyfus.com for the fund’s most recent month-end returns.
The fund’s performance shown in the graph and table does not reflect the deduction of taxes that a shareholder would pay on fund distributions or the redemption of fund shares. In addition to the performance of Class A shares shown with and without a maximum sales charge, the fund’s performance shown in the table takes into account all other applicable fees and expenses on all classes.
6
UNDERSTANDING YOUR FUND’S EXPENSES (Unaudited)
As a mutual fund investor, you pay ongoing expenses, such as management fees and other expenses. Using the information below, you can estimate how these expenses affect your investment and compare them with the expenses of other funds. You also may pay one-time transaction expenses, including sales charges (loads) and redemption fees, which are not shown in this section and would have resulted in higher total expenses. For more information, see your fund’s prospectus or talk to your financial adviser.
Review your fund’s expenses
The table below shows the expenses you would have paid on a $1,000 investment in Dreyfus Strategic Value Fund from March 1, 2017 to August 31, 2017. It also shows how much a $1,000 investment would be worth at the close of the period, assuming actual returns and expenses.
| | | | | | | | | | | | |
Expenses and Value of a $1,000 Investment | | |
assuming actual returns for the six months ended August 31, 2017 | |
| | | Class A | Class C | Class I | Class Y |
Expenses paid per $1,000† | | $4.81 | | $8.56 | | $3.56 | | $3.41 |
Ending value (after expenses) | | $989.20 | | $985.30 | | $990.40 | | $990.40 |
COMPARING YOUR FUND’S EXPENSES
WITH THOSE OF OTHER FUNDS (Unaudited)
Using the SEC’s method to compare expenses
The Securities and Exchange Commission (SEC) has established guidelines to help investors assess fund expenses. Per these guidelines, the table below shows your fund’s expenses based on a $1,000 investment, assuming a hypothetical 5% annualized return. You can use this information to compare the ongoing expenses (but not transaction expenses or total cost) of investing in the fund with those of other funds. All mutual fund shareholder reports will provide this information to help you make this comparison. Please note that you cannot use this information to estimate your actual ending account balance and expenses paid during the period.
| | | | | | | | | | | | |
Expenses and Value of a $1,000 Investment | | |
assuming a hypothetical 5% annualized return for the six months ended August 31, 2017 | |
| | | Class A | Class C | Class I | Class Y |
Expenses paid per $1,000† | | $4.89 | | $8.69 | | $3.62 | | $3.47 |
Ending value (after expenses) | | $1,020.37 | | $1,016.59 | | $1,021.63 | | $1,021.78 |
† Expenses are equal to the fund’s annualized expense ratio of .96% for Class A, 1.71% for Class C, .71% for Class I and .68% for Class Y, multiplied by the average account value over the period, multiplied by 184/365 (to reflect the one-half year period).
7
STATEMENT OF INVESTMENTS
August 31, 2017
| | | | | | | | |
| |
Description | | | | Shares | | Value ($) | |
Common Stocks - 99.7% | | | | | |
Automobiles & Components - 1.0% | | | | | |
Goodyear Tire & Rubber | | | | 591,142 | | 17,911,603 | |
Banks - 11.8% | | | | | |
BB&T | | | | 382,355 | | 17,622,742 | |
Citigroup | | | | 930,680 | | 63,314,160 | |
JPMorgan Chase & Co. | | | | 928,032 | | 84,348,829 | |
PNC Financial Services Group | | | | 217,526 | | 27,279,936 | |
SunTrust Banks | | | | 328,697 | | 18,111,205 | |
| | | | | 210,676,872 | |
Capital Goods - 9.5% | | | | | |
General Dynamics | | | | 110,731 | | 22,295,687 | |
Honeywell International | | | | 181,430 | | 25,086,326 | |
L3 Technologies | | | | 134,153 | | 24,346,086 | |
Quanta Services | | | | 552,643 | a | 19,856,463 | |
Raytheon | | | | 203,106 | | 36,967,323 | |
United Technologies | | | | 343,081 | | 41,073,657 | |
| | | | | 169,625,542 | |
Consumer Services - .7% | | | | | |
Las Vegas Sands | | | | 211,487 | | 13,156,606 | |
Diversified Financials - 12.3% | | | | | |
American Express | | | | 261,188 | | 22,488,287 | |
Ameriprise Financial | | | | 95,362 | | 13,208,591 | |
Berkshire Hathaway, Cl. B | | | | 479,537 | a | 86,872,923 | |
Capital One Financial | | | | 110,302 | | 8,781,142 | |
Goldman Sachs Group | | | | 107,062 | | 23,954,052 | |
Raymond James Financial | | | | 163,962 | | 12,841,504 | |
Synchrony Financial | | | | 892,353 | | 27,475,549 | |
Voya Financial | | | | 653,257 | | 24,974,015 | |
| | | | | 220,596,063 | |
Energy - 10.0% | | | | | |
Anadarko Petroleum | | | | 522,628 | | 21,391,164 | |
EOG Resources | | | | 493,048 | | 41,904,150 | |
Halliburton | | | | 426,333 | | 16,614,197 | |
Hess | | | | 684,185 | | 26,614,797 | |
Occidental Petroleum | | | | 702,077 | | 41,913,997 | |
Phillips 66 | | | | 369,689 | | 30,983,635 | |
| | | | | 179,421,940 | |
8
| | | | | | | | |
| |
Description | | | | Shares | | Value ($) | |
Common Stocks - 99.7% (continued) | | | | | |
Exchange-Traded Funds - .4% | | �� | | | |
iShares Russell 1000 Value ETF | | | | 68,997 | | 7,989,163 | |
Food, Beverage & Tobacco - 6.9% | | | | | |
Coca-Cola | | | | 433,107 | | 19,728,024 | |
Coca-Cola European Partners | | | | 361,500 | | 15,544,500 | |
Conagra Brands | | | | 431,676 | | 14,012,203 | |
Kellogg | | | | 316,328 | | 20,706,831 | |
Kraft Heinz | | | | 206,744 | | 16,694,578 | |
Molson Coors Brewing, Cl. B | | | | 208,891 | | 18,747,967 | |
Mondelez International, Cl. A | | | | 434,170 | | 17,653,352 | |
| | | | | 123,087,455 | |
Health Care Equipment & Services - 5.7% | | | | | |
Abbott Laboratories | | | | 474,930 | | 24,192,934 | |
Aetna | | | | 178,662 | | 28,174,997 | |
AmerisourceBergen | | | | 107,263 | | 8,607,856 | |
Boston Scientific | | | | 319,558 | a | 8,803,823 | |
Humana | | | | 52,263 | | 13,463,994 | |
UnitedHealth Group | | | | 94,690 | | 18,833,841 | |
| | | | | 102,077,445 | |
Insurance - 5.5% | | | | | |
Allstate | | | | 189,924 | | 17,188,122 | |
American International Group | | | | 280,735 | | 16,978,853 | |
Athene Holding, Cl. A | | | | 398,097 | | 21,302,171 | |
Hartford Financial Services Group | | | | 263,578 | | 14,251,663 | |
Prudential Financial | | | | 283,774 | | 28,967,650 | |
| | | | | 98,688,459 | |
Materials - 8.2% | | | | | |
Alcoa | | | | 122,639 | a | 5,381,399 | |
CF Industries Holdings | | | | 739,716 | | 21,444,367 | |
Dow Chemical | | | | 347,263 | | 23,145,079 | |
Freeport-McMoRan | | | | 357,032 | a | 5,276,933 | |
Martin Marietta Materials | | | | 63,495 | | 13,460,305 | |
Newmont Mining | | | | 680,015 | | 26,071,775 | |
Packaging Corporation of America | | | | 270,969 | | 30,459,625 | |
Vulcan Materials | | | | 179,470 | | 21,762,532 | |
| | | | | 147,002,015 | |
Media - 2.2% | | | | | |
Comcast, Cl. A | | | | 652,263 | | 26,488,400 | |
9
STATEMENT OF INVESTMENTS (continued)
| | | | | | | | |
| |
Description | | | | Shares | | Value ($) | |
Common Stocks - 99.7% (continued) | | | | | |
Media - 2.2% (continued) | | | | | |
Omnicom Group | | | | 172,639 | | 12,495,611 | |
| | | | | 38,984,011 | |
Pharmaceuticals, Biotechnology & Life Sciences - 7.1% | | | | | |
Biogen | | | | 17,288 | a | 5,472,689 | |
Bristol-Myers Squibb | | | | 155,046 | | 9,377,182 | |
Eli Lilly & Co. | | | | 110,627 | | 8,992,869 | |
Gilead Sciences | | | | 181,774 | | 15,216,302 | |
Johnson & Johnson | | | | 415,931 | | 55,056,786 | |
Merck & Co. | | | | 523,199 | | 33,411,488 | |
| | | | | 127,527,316 | |
Real Estate - .9% | | | | | |
Uniti Group | | | | 807,620 | b | 15,554,761 | |
Retailing - .4% | | | | | |
Nordstrom | | | | 161,144 | | 7,190,245 | |
Semiconductors & Semiconductor Equipment - 1.3% | | | | | |
Texas Instruments | | | | 275,717 | | 22,834,882 | |
Software & Services - 4.4% | | | | | |
Alphabet, Cl. A | | | | 14,204 | a | 13,568,229 | |
Citrix Systems | | | | 107,783 | a | 8,429,708 | |
eBay | | | | 254,037 | a | 9,178,357 | |
Oracle | | | | 744,363 | | 37,463,790 | |
Teradata | | | | 308,183 | a | 9,837,201 | |
| | | | | 78,477,285 | |
Technology Hardware & Equipment - 6.3% | | | | | |
Apple | | | | 159,043 | | 26,083,052 | |
Cisco Systems | | | | 1,528,045 | | 49,218,329 | |
Corning | | | | 613,082 | | 17,632,238 | |
Harris | | | | 156,667 | | 19,254,374 | |
| | | | | 112,187,993 | |
Telecommunication Services - 3.1% | | | | | |
AT&T | | | | 1,501,008 | | 56,227,760 | |
Transportation - .7% | | | | | |
Delta Air Lines | | | | 278,583 | | 13,146,332 | |
Utilities - 1.3% | | | | | |
FirstEnergy | | | | 700,285 | | 22,815,285 | |
Total Common Stocks (cost $1,524,205,705) | | | | 1,785,179,033 | |
10
| | | | | | | | |
| |
Description | | | | Shares | | Value ($) | |
Other Investment - .3% | | | | | |
Registered Investment Company; | | | | | |
Dreyfus Institutional Preferred Government Plus Money Market Fund
(cost $4,789,111) | | | | 4,789,111 | c | 4,789,111 | |
Total Investments (cost $1,528,994,816) | | 100.0% | | 1,789,968,144 | |
Cash and Receivables (Net) | | .0% | | 538,350 | |
Net Assets | | 100.0% | | 1,790,506,494 | |
ETF—Exchange-Traded Fund
aNon-income producing security.
b Investment in real estate investment trust.
c Investment in affiliated money market mutual fund.
| | |
Portfolio Summary (Unaudited) † | Value (%) |
Diversified Financials | 12.3 |
Banks | 11.8 |
Energy | 10.0 |
Capital Goods | 9.5 |
Materials | 8.2 |
Pharmaceuticals, Biotechnology & Life Sciences | 7.1 |
Food, Beverage & Tobacco | 6.9 |
Technology Hardware & Equipment | 6.3 |
Health Care Equipment & Services | 5.7 |
Insurance | 5.5 |
Software & Services | 4.4 |
Telecommunication Services | 3.1 |
Media | 2.2 |
Semiconductors & Semiconductor Equipment | 1.3 |
Utilities | 1.3 |
Automobiles & Components | 1.0 |
Real Estate | .9 |
Consumer Services | .7 |
Transportation | .7 |
Exchange-Traded Funds | .4 |
Retailing | .4 |
Money Market Investment | .3 |
| | 100.0 |
† Based on net assets.
See notes to financial statements.
11
STATEMENT OF INVESTMENTS IN AFFILIATED ISSUERS
| | | | | | | |
Registered Investment Companies | Value
8/31/2016 ($) | Purchases ($) | Sales ($) | Value
8/31/2017 ($) | Net
Assets (%) | Dividends/
Distributions ($) |
Dreyfus Institutional Cash
Advantage Fund,
Institutional Shares | 15,350,019 | 5,306,829 | 20,656,848 | - | - | - |
Dreyfus Institutional Preferred Government Plus Money Market Fund | 1,363,977 | 338,954,328 | 335,529,194 | 4,789,111 | .3 | 32,736 |
Dreyfus Institutional Preferred Government Money Market Fund, Institutional Shares | - | 174,098,563 | 174,098,563 | - | - | - |
Total | 16,713,996 | 518,359,720 | 530,284,605 | 4,789,111 | .3 | 32,736 |
See notes to financial statements.
12
STATEMENT OF ASSETS AND LIABILITIES
August 31, 2017
| | | | | | | |
| | | | | | |
| | | Cost | | Value | |
Assets ($): | | | | |
Investments in securities—See Statement of Investments: | | | | |
Unaffiliated issuers | | 1,524,205,705 | | 1,785,179,033 | |
Affiliated issuers | | 4,789,111 | | 4,789,111 | |
Cash | | | | | 1,010,971 | |
Receivable for investment securities sold | | | | | 12,634,939 | |
Dividends receivable | | | | | 3,097,236 | |
Receivable for shares of Common Stock subscribed | | | | | 1,103,264 | |
Prepaid expenses | | | | | 85,966 | |
| | | | | 1,807,900,520 | |
Liabilities ($): | | | | |
Due to The Dreyfus Corporation and affiliates—Note 3(c) | | | | | 1,132,419 | |
Payable for investment securities purchased | | | | | 14,755,312 | |
Payable for shares of Common Stock redeemed | | | | | 1,195,865 | |
Interest payable—Note 2 | | | | | 5,414 | |
Accrued expenses | | | | | 305,016 | |
| | | | | 17,394,026 | |
Net Assets ($) | | | 1,790,506,494 | |
Composition of Net Assets ($): | | | | |
Paid-in capital | | | | | 1,372,656,117 | |
Accumulated undistributed investment income—net | | | | | 12,532,274 | |
Accumulated net realized gain (loss) on investments | | | | | 144,344,775 | |
Accumulated net unrealized appreciation (depreciation)
on investments | | | | 260,973,328 | |
Net Assets ($) | | | 1,790,506,494 | |
| | | | | | |
Net Asset Value Per Share | Class A | Class C | Class I | Class Y | |
Net Assets ($) | 818,084,916 | 42,611,110 | 751,934,296 | 177,876,172 | |
Shares Outstanding | 20,391,151 | 1,135,550 | 18,682,568 | 4,418,972 | |
Net Asset Value Per Share ($) | 40.12 | 37.52 | 40.25 | 40.25 | |
| | | | | | |
See notes to financial statements. | | | | | |
13
STATEMENT OF OPERATIONS
Year Ended August 31, 2017
| | | | | | | |
| | | | | | |
| | | | | | |
Investment Income ($): | | | | |
Income: | | | | |
Cash dividends: | | | | |
Unaffiliated issuers | | | 34,301,055 | |
Affiliated issuers | | | 32,736 | |
Income from securities lending—Note 1(b) | | | 24,624 | |
Total Income | | | 34,358,415 | |
Expenses: | | | | |
Management fee—Note 3(a) | | | 12,622,834 | |
Shareholder servicing costs—Note 3(c) | | | 3,593,221 | |
Distribution fees—Note 3(b) | | | 350,240 | |
Directors’ fees and expenses—Note 3(d) | | | 148,856 | |
Prospectus and shareholders’ reports | | | 114,212 | |
Registration fees | | | 113,156 | |
Custodian fees—Note 3(c) | | | 105,939 | |
Professional fees | | | 102,802 | |
Loan commitment fees—Note 2 | | | 44,870 | |
Interest expense—Note 2 | | | 13,865 | |
Miscellaneous | | | 40,759 | |
Total Expenses | | | 17,250,754 | |
Less—reduction in expenses due to undertaking—Note 3(a) | | | (1,812,240) | |
Less—reduction in fees due to earnings credits—Note 3(c) | | | (18,537) | |
Net Expenses | | | 15,419,977 | |
Investment Income—Net | | | 18,938,438 | |
Realized and Unrealized Gain (Loss) on Investments—Note 4 ($): | | |
Net realized gain (loss) on investments | 183,264,325 | |
Net unrealized appreciation (depreciation) on investments | | | 32,839,772 | |
Net Realized and Unrealized Gain (Loss) on Investments | | | 216,104,097 | |
Net Increase in Net Assets Resulting from Operations | | 235,042,535 | |
| | | | | | | |
See notes to financial statements. | | | | | |
14
STATEMENT OF CHANGES IN NET ASSETS
| | | | | | | | | | |
| | | | Year Ended August 31, |
| | | | 2017 | | | | 2016 | |
Operations ($): | | | | | | | | |
Investment income—net | | | 18,938,438 | | | | 22,491,458 | |
Net realized gain (loss) on investments | | 183,264,325 | | | | 19,173,104 | |
Net unrealized appreciation (depreciation)
on investments | | 32,839,772 | | | | 82,566,457 | |
Net Increase (Decrease) in Net Assets
Resulting from Operations | 235,042,535 | | | | 124,231,019 | |
Distributions to Shareholders from ($): | | | | | | | | |
Investment income—net: | | | | | | | | |
Class A | | | (11,206,616) | | | | (8,700,408) | |
Class C | | | (290,055) | | | | (131,423) | |
Class I | | | (9,313,258) | | | | (5,363,362) | |
Class Y | | | (2,700,953) | | | | (2,304,293) | |
Net realized gain on investments: | | | | | | | | |
Class A | | | (12,942,367) | | | | (111,293,637) | |
Class C | | | (742,862) | | | | (7,014,133) | |
Class I | | | (9,421,902) | | | | (54,195,811) | |
Class Y | | | (2,732,461) | | | | (23,284,466) | |
Total Distributions | | | (49,350,474) | | | | (212,287,533) | |
Capital Stock Transactions ($): | | | | | | | | |
Net proceeds from shares sold: | | | | | | | | |
Class A | | | 76,003,545 | | | | 62,929,649 | |
Class C | | | 5,149,906 | | | | 4,750,944 | |
Class I | | | 464,675,655 | | | | 239,127,465 | |
Class Y | | | 40,160,158 | | | | 51,388,951 | |
Distributions reinvested: | | | | | | | | |
Class A | | | 22,422,051 | | | | 111,920,429 | |
Class C | | | 805,366 | | | | 5,546,090 | |
Class I | | | 18,245,284 | | | | 57,225,539 | |
Class Y | | | 1,787,134 | | | | 10,295,602 | |
Cost of shares redeemed: | | | | | | | | |
Class A | | | (215,907,215) | | | | (158,297,103) | |
Class C | | | (15,945,364) | | | | (11,949,165) | |
Class I | | | (308,483,958) | | | | (154,953,764) | |
Class Y | | | (63,440,368) | | | | (89,324,013) | |
Increase (Decrease) in Net Assets
from Capital Stock Transactions | 25,472,194 | | | | 128,660,624 | |
Total Increase (Decrease) in Net Assets | 211,164,255 | | | | 40,604,110 | |
Net Assets ($): | | | | | | | | |
Beginning of Period | | | 1,579,342,239 | | | | 1,538,738,129 | |
End of Period | | | 1,790,506,494 | | | | 1,579,342,239 | |
Undistributed investment income—net | 12,532,274 | | | | 17,104,718 | |
15
STATEMENT OF CHANGES IN NET ASSETS (continued)
| | | | | | | | | | |
| | | | Year Ended August 31, |
| | | | 2017 | | | | 2016 | |
Capital Share Transactions (Shares): | | | | | | | | |
Class Aa | | | | | | | | |
Shares sold | | | 1,967,238 | | | | 1,797,542 | |
Shares issued for distributions reinvested | | | 587,272 | | | | 3,263,943 | |
Shares redeemed | | | (5,518,118) | | | | (4,574,517) | |
Net Increase (Decrease) in Shares Outstanding | (2,963,608) | | | | 486,968 | |
Class C | | | | | | | | |
Shares sold | | | 139,175 | | | | 144,175 | |
Shares issued for distributions reinvested | | | 22,427 | | | | 171,652 | |
Shares redeemed | | | (436,913) | | | | (369,177) | |
Net Increase (Decrease) in Shares Outstanding | (275,311) | | | | (53,350) | |
Class Ia | | | | | | | | |
Shares sold | | | 12,002,506 | | | | 6,926,397 | |
Shares issued for distributions reinvested | | | 477,251 | | | | 1,667,897 | |
Shares redeemed | | | (7,886,248) | | | | (4,606,783) | |
Net Increase (Decrease) in Shares Outstanding | 4,593,509 | | | | 3,987,511 | |
Class Ya | | | | | | | | |
Shares sold | | | 1,017,302 | | | | 1,539,436 | |
Shares issued for distributions reinvested | | | 46,747 | | | | 300,076 | |
Shares redeemed | | | (1,612,375) | | | | (2,462,907) | |
Net Increase (Decrease) in Shares Outstanding | (548,326) | | | | (623,395) | |
| | | | | | | | | | |
a During the period ended August 31, 2017, 14,939 Class A shares representing $603,006 were exchanged for 14,897 Class I shares and 2,348 Class A shares representing $92,439 were exchanged for 2,344 Class Y shares and 59,810 Class Y shares representing $2,352,272 were exchanged for 59,811 Class I shares. During the period ended August 31, 2016, 28,618 Class Y shares representing $996,583 were exchanged for 28,618 Class I shares. | |
See notes to financial statements. | | | | | | | | |
16
FINANCIAL HIGHLIGHTS
The following tables describe the performance for each share class for the fiscal periods indicated. All information (except portfolio turnover rate) reflects financial results for a single fund share. Total return shows how much your investment in the fund would have increased (or decreased) during each period, assuming you had reinvested all dividends and distributions. These figures have been derived from the fund’s financial statements.
| | | | | | | |
| | Year Ended August 31, |
| |
Class A Shares | | 2017 | 2016 | 2015 | 2014 | 2013 |
Per Share Data ($): | | | | | | |
Net asset value, beginning of period | | 36.08 | 38.49 | 43.34 | 37.27 | 29.28 |
Investment Operations: | | | | | | |
Investment income—neta | | .37 | .50 | .33 | .35 | .40 |
Net realized and unrealized gain
(loss) on investments | | 4.72 | 2.41 | (.66) | 8.03 | 7.97 |
Total from Investment Operations | | 5.09 | 2.91 | (.33) | 8.38 | 8.37 |
Distributions: | | | | | | |
Dividends from investment
income—net | | (.49) | (.39) | (.36) | (.26) | (.38) |
Dividends from net realized gain
on investments | | (.56) | (4.93) | (4.16) | (2.05) | - |
Total Distributions | | (1.05) | (5.32) | (4.52) | (2.31) | (.38) |
Net asset value, end of period | | 40.12 | 36.08 | 38.49 | 43.34 | 37.27 |
Total Return (%)b | | 14.26 | 8.26 | (.90) | 23.09 | 28.82 |
Ratios/Supplemental Data (%): | | | | | | |
Ratio of total expenses to
average net assets | | 1.07 | 1.12 | 1.11 | 1.12 | 1.14 |
Ratio of net expenses to
average net assets | | .97 | .98 | .98 | .98 | .98 |
Ratio of net investment income to
average net assets | | .95 | 1.42 | .81 | .88 | 1.19 |
Portfolio Turnover Rate | | 96.39 | 80.82 | 96.32 | 67.00 | 76.28 |
Net Assets, end of period ($ x 1,000) | | 818,085 | 842,532 | 880,116 | 970,817 | 1,065,660 |
a Based on average shares outstanding.
b Exclusive of sales charge.
See notes to financial statements.
17
FINANCIAL HIGHLIGHTS (continued)
| | | | | | | | | | | |
| | | | | | |
| | Year Ended August 31, |
Class C Shares | | 2017 | 2016 | 2015 | 2014 | 2013 |
Per Share Data ($): | | | | | | |
Net asset value, beginning of period | | 33.81 | 36.35 | 41.17 | 35.54 | 27.93 |
Investment Operations: | | | | | | |
Investment income—neta | | .07 | .22 | .02 | .05 | .14 |
Net realized and unrealized gain
(loss) on investments | | 4.42 | 2.26 | (.61) | 7.63 | 7.62 |
Total from Investment Operations | | 4.49 | 2.48 | (.59) | 7.68 | 7.76 |
Distributions: | | | | | | |
Dividends from investment income—net | | (.22) | (.09) | (.07) | - | (.15) |
Dividends from net realized gain
on investments | | (.56) | (4.93) | (4.16) | (2.05) | - |
Total Distributions | | (.78) | (5.02) | (4.23) | (2.05) | (.15) |
Net asset value, end of period | | 37.52 | 33.81 | 36.35 | 41.17 | 35.54 |
Total Return (%)b | | 13.39 | 7.46 | (1.65) | 22.17 | 27.87 |
Ratios/Supplemental Data (%): | | | | | | |
Ratio of total expenses to
average net assets | | 1.84 | 1.89 | 1.87 | 1.88 | 1.91 |
Ratio of net expenses to
average net assets | | 1.72 | 1.73 | 1.73 | 1.73 | 1.73 |
Ratio of net investment income to
average net assets | | .20 | .67 | .06 | .12 | .45 |
Portfolio Turnover Rate | | 96.39 | 80.82 | 96.32 | 67.00 | 76.28 |
Net Assets, end of period ($ x 1,000) | | 42,611 | 47,696 | 53,226 | 59,442 | 50,665 |
a Based on average shares outstanding.
b Exclusive of sales charge.
See notes to financial statements.
18
| | | | | | | |
| | | | |
| | Year Ended August 31, |
Class I Shares | | 2017 | 2016 | 2015 | 2014 | 2013 |
Per Share Data ($): | | | | | | |
Net asset value, beginning of period | | 36.16 | 38.58 | 43.45 | 37.36 | 29.34 |
Investment Operations: | | | | | | |
Investment income—neta | | .48 | .58 | .43 | .47 | .48 |
Net realized and unrealized gain
(loss) on investments | | 4.73 | 2.42 | (.66) | 8.03 | 7.99 |
Total from Investment Operations | | 5.21 | 3.00 | (.23) | 8.50 | 8.47 |
Distributions: | | | | | | |
Dividends from investment income—net | | (.56) | (.49) | (.48) | (.36) | (.45) |
Dividends from net realized gain
on investments | | (.56) | (4.93) | (4.16) | (2.05) | - |
Total Distributions | | (1.12) | (5.42) | (4.64) | (2.41) | (.45) |
Net asset value, end of period | | 40.25 | 36.16 | 38.58 | 43.45 | 37.36 |
Total Return (%) | | 14.58 | 8.52 | (.66) | 23.40 | 29.18 |
Ratios/Supplemental Data (%): | | | | | | |
Ratio of total expenses to
average net assets | | .84 | .89 | .87 | .84 | .95 |
Ratio of net expenses to
average net assets | | .72 | .73 | .73 | .73 | .73 |
Ratio of net investment income to
average net assets | | 1.21 | 1.67 | 1.05 | 1.14 | 1.45 |
Portfolio Turnover Rate | | 96.39 | 80.82 | 96.32 | 67.00 | 76.28 |
Net Assets, end of period ($ x 1,000) | | 751,934 | 509,485 | 389,711 | 392,260 | 317,800 |
a Based on average shares outstanding.
See notes to financial statements.
19
FINANCIAL HIGHLIGHTS (continued)
| | | | | | | |
| | | | |
| | Year Ended August 31, |
Class Y Shares | 2017 | 2016 | 2015 | 2014 | 2013a | |
Per Share Data ($): | | | | | | |
Net asset value, beginning of period | 36.16 | 38.58 | 43.45 | 37.36 | 36.70 | |
Investment Operations: | | | | | | |
Investment income—netb | .48 | .59 | .44 | .32 | .08 | |
Net realized and unrealized gain
(loss) on investments | 4.73 | 2.41 | (.67) | 8.18 | .58 | |
Total from Investment Operations | 5.21 | 3.00 | (.23) | 8.50 | .66 | |
Distributions: | | | | | | |
Dividends from investment income—net | (.56) | (.49) | (.48) | (.36) | - | |
Dividends from net realized gain
on investments | (.56) | (4.93) | (4.16) | (2.05) | - | |
Total Distributions | (1.12) | (5.42) | (4.64) | (2.41) | - | |
Net asset value, end of period | 40.25 | 36.16 | 38.58 | 43.45 | 37.36 | |
Total Return (%) | 14.58 | 8.52 | (.66) | 23.40 | 1.80c | |
Ratios/Supplemental Data (%): | | | | | | |
Ratio of total expenses to
average net assets | .75 | .79 | .79 | .78 | .83d | |
Ratio of net expenses to
average net assets | .71 | .73 | .73 | .73 | .73d | |
Ratio of net investment income to
average net assets | 1.22 | 1.67 | 1.07 | .87 | 1.21d | |
Portfolio Turnover Rate | 96.39 | 80.82 | 96.32 | 67.00 | 76.28 | |
Net Assets, end of period ($ x 1,000) | 177,876 | 179,629 | 215,685 | 230,522 | 1 | |
a From July 1, 2013 (commencement of initial offering) to August 31, 2013.
b Based on average shares outstanding.
c Not annualized.
d Annualized.
See notes to financial statements.
20
NOTES TO FINANCIAL STATEMENTS
NOTE 1—Significant Accounting Policies:
Dreyfus Strategic Value Fund (the “fund”) is a separate diversified series of Advantage Funds, Inc. (the “Company”), which is registered under the Investment Company Act of 1940, as amended (the “Act”), as an open-end management investment company and operates as a series company currently offering nine series, including the fund. The fund’s investment objective is to seek capital appreciation. The Dreyfus Corporation (the “Manager” or “Dreyfus”), a wholly-owned subsidiary of The Bank of New York Mellon Corporation (“BNY Mellon”), serves as the fund’s investment adviser.
Effective March 31, 2017, the fund authorized the issuance of Class T shares, but, as of the date of this report, the fund did not offer Class T shares for purchase. The fund authorized 100 million Class T shares which resulted in the fund’s total authorized shares increasing from 700 million to 800 million.
MBSC Securities Corporation (the “Distributor”), a wholly-owned subsidiary of Dreyfus, is the distributor of the fund’s shares. The fund is authorized to issue 800 million shares of $.001 par value Common Stock. The fund currently has authorized five classes of shares: Class A (300 million shares authorized), Class C (100 million shares authorized), Class I (200 million shares authorized), Class T (100 million shares authorized) and Class Y (100 million shares authorized). Class A and Class T shares generally are subject to a sales charge imposed at the time of purchase. Class C shares are subject to a contingent deferred sales charge (“CDSC”) imposed on Class C shares redeemed within one year of purchase. Class I and Class Y shares are sold at net asset value per share generally to institutional investors. Other differences between the classes include the services offered to and the expenses borne by each class, the allocation of certain transfer agency costs, and certain voting rights. Income, expenses (other than expenses attributable to a specific class), and realized and unrealized gains or losses on investments are allocated to each class of shares based on its relative net assets.
The Company accounts separately for the assets, liabilities and operations of each series. Expenses directly attributable to each series are charged to that series’ operations; expenses which are applicable to all series are allocated among them on a pro rata basis.
The Financial Accounting Standards Board (“FASB”) Accounting Standards Codification is the exclusive reference of authoritative U.S. generally accepted accounting principles (“GAAP”) recognized by the FASB to be applied by nongovernmental entities. Rules and interpretive
21
NOTES TO FINANCIAL STATEMENTS (continued)
releases of the Securities and Exchange Commission (“SEC”) under authority of federal laws are also sources of authoritative GAAP for SEC registrants. The fund’s financial statements are prepared in accordance with GAAP, which may require the use of management estimates and assumptions. Actual results could differ from those estimates.
The Company enters into contracts that contain a variety of indemnifications. The fund’s maximum exposure under these arrangements is unknown. The fund does not anticipate recognizing any loss related to these arrangements.
(a) Portfolio valuation: The fair value of a financial instrument is the amount that would be received to sell an asset or paid to transfer a liability in an orderly transaction between market participants at the measurement date (i.e., the exit price). GAAP establishes a fair value hierarchy that prioritizes the inputs of valuation techniques used to measure fair value. This hierarchy gives the highest priority to unadjusted quoted prices in active markets for identical assets or liabilities (Level 1 measurements) and the lowest priority to unobservable inputs (Level 3 measurements).
Additionally, GAAP provides guidance on determining whether the volume and activity in a market has decreased significantly and whether such a decrease in activity results in transactions that are not orderly. GAAP requires enhanced disclosures around valuation inputs and techniques used during annual and interim periods.
Various inputs are used in determining the value of the fund’s investments relating to fair value measurements. These inputs are summarized in the three broad levels listed below:
Level 1—unadjusted quoted prices in active markets for identical investments.
Level 2—other significant observable inputs (including quoted prices for similar investments, interest rates, prepayment speeds, credit risk, etc.).
Level 3—significant unobservable inputs (including the fund’s own assumptions in determining the fair value of investments).
The inputs or methodology used for valuing securities are not necessarily an indication of the risk associated with investing in those securities.
Changes in valuation techniques may result in transfers in or out of an assigned level within the disclosure hierarchy. Valuation techniques used to value the fund’s investments are as follows:
22
Investments in securities are valued at the last sales price on the securities exchange or national securities market on which such securities are primarily traded. Securities listed on the National Market System for which market quotations are available are valued at the official closing price or, if there is no official closing price that day, at the last sales price. For open short positions, asked prices are used for valuation purposes. Bid price is used when no asked price is available. Registered investment companies that are not traded on an exchange are valued at their net asset value. All of the preceding securities are generally categorized within Level 1 of the fair value hierarchy.
Securities not listed on an exchange or the national securities market, or securities for which there were no transactions, are valued at the average of the most recent bid and asked prices. These securities are generally categorized within Level 2 of the fair value hierarchy.
Fair valuing of securities may be determined with the assistance of a pricing service using calculations based on indices of domestic securities and other appropriate indicators, such as prices of relevant American Depository Receipts and futures. Utilizing these techniques may result in transfers between Level 1 and Level 2 of the fair value hierarchy.
When market quotations or official closing prices are not readily available, or are determined not to reflect accurately fair value, such as when the value of a security has been significantly affected by events after the close of the exchange or market on which the security is principally traded (for example, a foreign exchange or market), but before the fund calculates its net asset value, the fund may value these investments at fair value as determined in accordance with the procedures approved by the Company’s Board of Directors (the “Board”). Certain factors may be considered when fair valuing investments such as: fundamental analytical data, the nature and duration of restrictions on disposition, an evaluation of the forces that influence the market in which the securities are purchased and sold, and public trading in similar securities of the issuer or comparable issuers. These securities are either categorized within Level 2 or 3 of the fair value hierarchy depending on the relevant inputs used.
For restricted securities where observable inputs are limited, assumptions about market activity and risk are used and are generally categorized within Level 3 of the fair value hierarchy.
The following is a summary of the inputs used as of August 31, 2017 in valuing the fund’s investments:
23
NOTES TO FINANCIAL STATEMENTS (continued)
| | | | | |
| | Level 1 - Unadjusted Quoted Prices | Level 2 - Other Significant Observable Inputs | Level 3 -Significant Unobservable Inputs | Total |
Assets ($) | | | | |
Investments in Securities: | | | |
Equity Securities - Domestic Common Stocks† | 1,761,645,370 | - | - | 1,761,645,370 |
Equity Securities -
Foreign Common Stocks† | 15,544,500 | - | - | 15,544,500 |
Exchange-Traded Funds | 7,989,163 | - | - | 7,989,163 |
Registered
Investment
Company | 4,789,111 | - | - | 4,789,111 |
† See Statement of Investments for additional detailed categorizations.
At August 31, 2017, there were no transfers between levels of the fair value hierarchy.
(b) Securities transactions and investment income: Securities transactions are recorded on a trade date basis. Realized gains and losses from securities transactions are recorded on the identified cost basis. Dividend income is recognized on the ex-dividend date and interest income, including, where applicable, accretion of discount and amortization of premium on investments, is recognized on the accrual basis.
Pursuant to a securities lending agreement with The Bank of New York Mellon, a subsidiary of BNY Mellon and an affiliate of Dreyfus, the fund may lend securities to qualified institutions. It is the fund’s policy that, at origination, all loans are secured by collateral of at least 102% of the value of U.S. securities loaned and 105% of the value of foreign securities loaned. Collateral equivalent to at least 100% of the market value of securities on loan is maintained at all times. Collateral is either in the form of cash, which can be invested in certain money market mutual funds managed by Dreyfus, or U.S. Government and Agency securities. The fund is entitled to receive all dividends, interest and distributions on securities loaned, in addition to income earned as a result of the lending transaction. Should a borrower fail to return the securities in a timely manner, The Bank of New York Mellon is required to replace the securities for the benefit of the fund or credit the fund with the market value of the unreturned securities and is subrogated to the fund’s rights against the borrower and the collateral. Additionally, the contractual maturity of security lending transactions are on an overnight and continuous basis.
24
During the period ended August 31, 2017, The Bank of New York Mellon earned $5,068 from lending portfolio securities, pursuant to the securities lending agreement.
(c) Affiliated issuers: Investments in other investment companies advised by Dreyfus are defined as “affiliated” under the Act.
(d) Dividends and distributions to shareholders: Dividends and distributions are recorded on the ex-dividend date. Dividends from investment income-net and dividends from net realized capital gains, if any, are normally declared and paid annually, but the fund may make distributions on a more frequent basis to comply with the distribution requirements of the Internal Revenue Code of 1986, as amended (the “Code”). To the extent that net realized capital gains can be offset by capital loss carryovers, it is the policy of the fund not to distribute such gains. Income and capital gain distributions are determined in accordance with income tax regulations, which may differ from GAAP.
(e) Federal income taxes: It is the policy of the fund to continue to qualify as a regulated investment company, if such qualification is in the best interests of its shareholders, by complying with the applicable provisions of the Code, and to make distributions of taxable income sufficient to relieve it from substantially all federal income and excise taxes.
As of and during the period ended August 31, 2017, the fund did not have any liabilities for any uncertain tax positions. The fund recognizes interest and penalties, if any, related to uncertain tax positions as income tax expense in the Statement of Operations. During the period ended August 31, 2017, the fund did not incur any interest or penalties.
Each tax year in the four-year period ended August 31, 2017 remains subject to examination by the Internal Revenue Service and state taxing authorities.
At August 31, 2017, the components of accumulated earnings on a tax basis were as follows: undistributed ordinary income $66,931,624, undistributed capital gains $104,747,364, accumulated capital losses $1,159,608 and unrealized appreciation $247,330,997.
Under the Regulated Investment Company Modernization Act of 2010 (the “2010 Act”), the fund is permitted to carry forward capital losses incurred in taxable years beginning after December 22, 2010 (“post-enactment losses”) for an unlimited period. Furthermore, post-enactment capital loss carryovers retain their character as either short-term or long-term capital losses rather than short-term as they were under previous statute. The 2010 Act requires post-enactment losses to be utilized before
25
NOTES TO FINANCIAL STATEMENTS (continued)
the utilization of losses incurred in taxable years prior to the effective date of the 2010 Act (“pre-enactment losses”). As a result of this ordering rule, pre-enactment losses may be more likely to expire unused.
As a result of the fund’s merger with Dreyfus Large Cap Value Fund, capital losses of $1,159,608 are available to offset future realized gains, if any. Based on certain provisions in the Code, the amount of losses which can be utilized in subsequent years is subject to an annual limitation. This acquired capital loss will expire in fiscal year 2018.
The tax character of distributions paid to shareholders during the fiscal periods ended August 31, 2017 and August 31, 2016 were as follows: ordinary income $23,510,882 and $25,374,554, and long-term capital gains $25,839,592 and $186,912,979, respectively.
NOTE 2—Bank Lines of Credit:
The fund participates with other Dreyfus-managed funds in an $810 million unsecured credit facility led by Citibank, N.A. and a $300 million unsecured credit facility provided by The Bank of New York Mellon (each, a “Facility”), each to be utilized primarily for temporary or emergency purposes, including the financing of redemptions. Prior to October 5, 2016, the unsecured credit facility with Citibank, N.A. was $555 million. In connection therewith, the fund has agreed to pay its pro rata portion of commitment fees for each Facility. Interest is charged to the fund based on rates determined pursuant to the terms of the respective Facility at the time of borrowing.
The average amount of borrowings outstanding under the Facilities during the period ended August 31, 2017 was approximately $715,600 with a related weighted average annualized interest rate of 1.94%.
NOTE 3—Management Fee and Other Transactions with Affiliates:
(a) Pursuant to a management agreement with Dreyfus in place during the period ended August 31, 2017, the fund had agreed to pay a management fee at the annual rate of .75% of the value of the fund’s average daily net assets and is payable monthly. Effective May 19, 2017, pursuant to a revised management agreement with Dreyfus, the fund has agreed to pay a management fee at the annual rate of .60% of the value of the fund’s average daily net assets. Dreyfus had contractually agreed, from September 1, 2016 through May 18, 2017, to waive receipt of its fees and/or assume the direct expenses of the fund, so that the expenses of Class A, Class C, Class I and Class Y shares (excluding taxes, interest expense, brokerage commissions, commitment fees on borrowings and extraordinary
26
expenses) did not exceed .98%, 1.73%, .73% and .73% of the value of the respective class’ average daily net assets. Dreyfus has contractually agreed, from May 19, 2017 through January 1, 2018, to waive receipt of its fees and/or assume the direct expenses of the fund so that the expenses of none of the classes (excluding Rule 12b-1 Distribution Plan fees, Shareholder Services Plan fees, taxes, interest expense, brokerage commissions, commitment fees on borrowings and extraordinary expenses) exceed .68% of the value of the fund’s average daily net assets. The reduction in expenses, pursuant to the undertaking amounted to $1,812,240 during the period ended August 31, 2017.
During the period ended August 31, 2017, the Distributor retained $20,179 from commissions earned on sales of the fund’s Class A shares and $426 from CDSCs on redemptions of the fund’s Class C shares.
(b) Under the Distribution Plan adopted pursuant to Rule 12b-1 under the Act, Class C shares pay the Distributor for distributing its shares at an annual rate of .75% of the value of its average daily net assets. During the period ended August 31, 2017, Class C shares were charged $350,240 pursuant to the Distribution Plan.
(c) Under the Shareholder Services Plan, Class A and Class C shares pay the Distributor at an annual rate of .25% of the value of their average daily net assets for the provision of certain services. The services provided may include personal services relating to shareholder accounts, such as answering shareholder inquiries regarding the fund and providing reports and other information, and services related to the maintenance of shareholder accounts. The Distributor may make payments to Service Agents (securities dealers, financial institutions or other industry professionals) with respect to these services. The Distributor determines the amounts to be paid to Service Agents. During the period ended August 31, 2017, Class A and Class C shares were charged $2,133,057 and $116,747, respectively, pursuant to the Shareholder Services Plan.
The fund has arrangements with the transfer agent and the custodian whereby the fund may receive earnings credits when positive cash balances are maintained, which are used to offset transfer agency and custody fees. For financial reporting purposes, the fund includes net earnings credits as an expense offset in the Statement of Operations.
The fund compensates Dreyfus Transfer, Inc., a wholly-owned subsidiary of Dreyfus, under a transfer agency agreement for providing transfer agency and cash management services for the fund. The majority of transfer agency fees are comprised of amounts paid on a per account basis, while cash management fees are related to fund subscriptions and
27
NOTES TO FINANCIAL STATEMENTS (continued)
redemptions. During the period ended August 31, 2017, the fund was charged $85,306 for transfer agency services and $18,501 for cash management services. These fees are included in Shareholder servicing costs in the Statement of Operations. Cash management fees were partially offset by earnings credits of $18,288.
The fund compensates The Bank of New York Mellon under a custody agreement for providing custodial services for the fund. These fees are determined based on net assets, geographic region and transaction activity. During the period ended August 31, 2017, the fund was charged $105,939 pursuant to the custody agreement. These fees were partially offset by earnings credits of $249.
During the period ended August 31, 2017, the fund was charged $11,281 for services performed by the Chief Compliance Officer and his staff.
The components of “Due to The Dreyfus Corporation and affiliates” in the Statement of Assets and Liabilities consist of: management fees $917,589, Distribution Plan fees $27,266, Shareholder Services Plan fees $183,385, custodian fees $36,068, Chief Compliance Officer fees $4,670 and transfer agency fees $40,320, which are offset against an expense reimbursement currently in effect in the amount of $76,879.
(d) Each Board member also serves as a Board member of other funds within the Dreyfus complex. Annual retainer fees and attendance fees are allocated to each fund based on net assets.
NOTE 4—Securities Transactions:
The aggregate amount of purchases and sales of investment securities, excluding short-term securities, during the period ended August 31, 2017, amounted to $1,706,100,090 and $1,710,594,220, respectively.
At August 31, 2017, the cost of investments for federal income tax purposes was $1,542,637,147; accordingly, accumulated net unrealized appreciation on investments was $247,330,997, consisting of $301,908,435 gross unrealized appreciation and $54,577,438 gross unrealized depreciation.
28
REPORT OF INDEPENDENT REGISTERED
PUBLIC ACCOUNTING FIRM
Shareholders and Board of Directors
Dreyfus Strategic Value Fund
We have audited the accompanying statement of assets and liabilities, including the statements of investments and investments in affiliated issuers, of Dreyfus Strategic Value Fund (one of the series comprising Advantage Funds, Inc.) as of August 31, 2017, and the related statement of operations for the year then ended, the statement of changes in net assets for each of the two years in the period then ended, and the financial highlights for each of the periods indicated therein. These financial statements and financial highlights are the responsibility of the Fund’s management. Our responsibility is to express an opinion on these financial statements and financial highlights based on our audits.
We conducted our audits in accordance with the standards of the Public Company Accounting Oversight Board (United States). Those standards require that we plan and perform the audit to obtain reasonable assurance about whether the financial statements and financial highlights are free of material misstatement. We were not engaged to perform an audit of the Fund’s internal control over financial reporting. Our audits included consideration of internal control over financial reporting as a basis for designing audit procedures that are appropriate in the circumstances, but not for the purpose of expressing an opinion on the effectiveness of the Fund’s internal control over financial reporting. Accordingly, we express no such opinion. An audit also includes examining, on a test basis, evidence supporting the amounts and disclosures in the financial statements and financial highlights, assessing the accounting principles used and significant estimates made by management, and evaluating the overall financial statement presentation. Our procedures included confirmation of securities owned as of August 31, 2017 by correspondence with the custodian and others. We believe that our audits provide a reasonable basis for our opinion.
In our opinion, the financial statements and financial highlights referred to above present fairly, in all material respects, the financial position of Dreyfus Strategic Value Fund at August 31, 2017, the results of its operations for the year then ended, the changes in its net assets for each of the two years in the period then ended, and the financial highlights for each of the indicated periods, in conformity with U.S. generally accepted accounting principles.

New York, New York
October 26, 2017
29
IMPORTANT TAX INFORMATION (Unaudited)
For federal tax purposes, the fund hereby reports 84.33% of the ordinary dividends paid during the fiscal year ended August 31, 2017 as qualifying for the corporate dividends received deduction. Also, certain dividends paid by the fund may be subject to a maximum tax rate of 15%, as provided for by the Jobs and Growth Tax Relief Reconciliation Act of 2003. Of the distributions paid during the fiscal year, $25,510,882 represents the maximum amount that may be considered qualified dividend income. The fund also hereby reports $.5637 per share as a long-term capital gain distribution paid on December 5, 2016. Shareholders will receive notification in early 2018 of the percentage applicable to the preparation of their 2017 income tax returns.
30
INFORMATION ABOUT THE RENEWAL OF THE FUND’S MANAGEMENT AGREEMENT (Unaudited)
At a meeting of the fund’s Board of Directors held on March 9-10, 2017, the Board considered the renewal of the fund’s Management Agreement pursuant to which Dreyfus provides the fund with investment advisory and administrative services (the “Agreement”). The Board members, none of whom are “interested persons” (as defined in the Investment Company Act of 1940, as amended) of the fund, were assisted in their review by independent legal counsel and met with counsel in executive session separate from Dreyfus representatives. In considering the renewal of the Agreement, the Board considered all factors that it believed to be relevant, including those discussed below. The Board did not identify any one factor as dispositive, and each Board member may have attributed different weights to the factors considered.
Analysis of Nature, Extent, and Quality of Services Provided to the Fund. The Board considered information provided to them at the meeting and in previous presentations from Dreyfus representatives regarding the nature, extent, and quality of the services provided to funds in the Dreyfus fund complex. Dreyfus provided the number of open accounts in the fund, the fund’s asset size and the allocation of fund assets among distribution channels. Dreyfus also had previously provided information regarding the diverse intermediary relationships and distribution channels of funds in the Dreyfus fund complex (such as retail direct or intermediary, in which intermediaries typically are paid by the fund and/or Dreyfus) and Dreyfus’ corresponding need for broad, deep, and diverse resources to be able to provide ongoing shareholder services to each intermediary or distribution channel, as applicable to the fund.
The Board also considered research support available to, and portfolio management capabilities of, the fund’s portfolio management personnel and that Dreyfus also provides oversight of day-to-day fund operations, including fund accounting and administration and assistance in meeting legal and regulatory requirements. The Board also considered Dreyfus’ extensive administrative, accounting and compliance infrastructures. The Board also considered portfolio management’s brokerage policies and practices (including policies and practices regarding soft dollars) and the standards applied in seeking best execution.
Comparative Analysis of the Fund’s Performance and Management Fee and Expense Ratio. The Board reviewed reports prepared by Broadridge Financial Solutions, Inc. (“Broadridge”), an independent provider of investment company data, which included information comparing (1) the fund’s performance with the performance of a group of comparable funds (the “Performance Group”) and with a broader group of funds (the “Performance Universe”), all for various periods ended January 31, 2017, and (2) the fund’s actual and contractual management fees and total expenses with those of a group of comparable funds (the “Expense Group”) and with a broader group of funds (the “Expense Universe”), the information for which was derived in part from fund financial statements available to Broadridge as of the date of its analysis. Dreyfus previously had furnished the Board with a description of the methodology Broadridge used to select the Performance Group and Performance Universe and the Expense Group and Expense Universe.
31
INFORMATION ABOUT THE RENEWAL OF THE FUND’S MANAGEMENT AGREEMENT (Unaudited) (continued)
Dreyfus representatives stated that the usefulness of performance comparisons may be affected by a number of factors, including different investment limitations that may be applicable to the fund and comparison funds. The Board discussed with representatives of Dreyfus and/or its affiliates the results of the comparisons and considered that the fund’s total return performance was above the Performance Group and Performance Universe medians for all periods. Dreyfus also provided a comparison of the fund’s calendar year total returns to the returns of the fund’s benchmark index.
The Board also reviewed the range of actual and contractual management fees and total expenses of the Expense Group and Expense Universe funds and discussed the results of the comparisons. The Board considered that the fund’s contractual management fee was above the Expense Group median and the fund’s actual management fee and total expenses were below the Expense Group and Expense Universe medians.
Dreyfus representatives stated that Dreyfus has contractually agreed to waive receipt of its fees and/or assume the expenses of the fund, until January 1, 2018, so that annual direct fund operating expenses of Class A, Class C, Class I and Class Y shares of the fund (excluding taxes, interest, brokerage commissions, commitment fees on borrowings and extraordinary expenses) do not exceed 0.98%, 1.73%, 0.73% and 0.73%, respectively, of the fund’s average daily net assets.
Dreyfus representatives reviewed with the Board the management or investment advisory fees (1) paid by funds advised or administered by Dreyfus that are in the same Broadridge category as the fund and (2) paid to Dreyfus or the Dreyfus-affiliated primary employer of the fund’s primary portfolio manager(s) for advising any separate accounts and/or other types of client portfolios that are considered to have similar investment strategies and policies as the fund (the “Similar Clients”), and explained the nature of the Similar Clients. They discussed differences in fees paid and the relationship of the fees paid in light of any differences in the services provided and other relevant factors. The Board considered the relevance of the fee information provided for the Similar Clients to evaluate the appropriateness of the fund’s management fee.
Analysis of Profitability and Economies of Scale. Dreyfus representatives reviewed the expenses allocated and profit received by Dreyfus and its affiliates and the resulting profitability percentage for managing the fund and the aggregate profitability percentage to Dreyfus and its affiliates for managing the funds in the Dreyfus fund complex, and the method used to determine the expenses and profit. The Board concluded that the profitability results were not unreasonable, given the services rendered and service levels provided by Dreyfus. The Board also considered the expense limitation arrangement and its effect on the profitability of Dreyfus and its affiliates. The Board also had been provided with information prepared by an independent consulting firm regarding Dreyfus’ approach to allocating costs to, and determining the profitability of, individual funds and the entire Dreyfus fund complex. The consulting firm also had analyzed where any economies of scale might emerge in connection with the management of a fund.
32
The Board considered, on the advice of its counsel, the profitability analysis (1) as part of its evaluation of whether the fees under the Agreement, considered in relation to the mix of services provided by Dreyfus, including the nature, extent and quality of such services, supported the renewal of the Agreement and (2) in light of the relevant circumstances for the fund and the extent to which economies of scale would be realized if the fund grows and whether fee levels reflect these economies of scale for the benefit of fund shareholders. Dreyfus representatives also stated that, as a result of shared and allocated costs among funds in the Dreyfus fund complex, the extent of economies of scale could depend substantially on the level of assets in the complex as a whole, so that increases and decreases in complex-wide assets can affect potential economies of scale in a manner that is disproportionate to, or even in the opposite direction from, changes in the fund’s asset level. The Board also considered potential benefits to Dreyfus from acting as investment adviser and took into consideration the soft dollar arrangements in effect for trading the fund’s investments.
At the conclusion of these discussions, the Board agreed that it had been furnished with sufficient information to make an informed business decision with respect to the renewal of the Agreement. Based on the discussions and considerations as described above, the Board concluded and determined as follows.
· The Board concluded that the nature, extent and quality of the services provided by Dreyfus are adequate and appropriate.
· The Board was satisfied with the fund’s performance.
· The Board concluded that the fee paid to Dreyfus supported the renewal of the Agreement in light of the considerations described above.
· The Board determined that the economies of scale which may accrue to Dreyfus and its affiliates in connection with the management of the fund had been adequately considered by Dreyfus in connection with the fee rate charged to the fund pursuant to the Agreement and that, to the extent in the future it were determined that material economies of scale had not been shared with the fund, the Board would seek to have those economies of scale shared with the fund.
In evaluating the Agreement, the Board considered these conclusions and determinations and also relied on its previous knowledge, gained through meetings and other interactions with Dreyfus and its affiliates, of Dreyfus and the services provided to the fund by Dreyfus. The Board also relied on information received on a routine and regular basis throughout the year relating to the operations of the fund and the investment management and other services provided under the Agreement, including information on the investment performance of the fund in comparison to similar mutual funds and benchmark performance indices; general market outlook as applicable to the fund; and compliance reports. In addition, the Board’s consideration of the contractual fee arrangements for this fund had the benefit of a number of years of reviews of the Agreement for the fund, or substantially similar agreements for other Dreyfus funds that the Board oversees, during which lengthy discussions took place
33
INFORMATION ABOUT THE RENEWAL OF THE FUND’S MANAGEMENT AGREEMENT (Unaudited) (continued)
between the Board and Dreyfus representatives. Certain aspects of the arrangements may receive greater scrutiny in some years than in others, and the Board’s conclusions may be based, in part, on their consideration of the fund’s arrangements, or similar arrangements for other Dreyfus funds that the Board oversees, in prior years. The Board determined to renew the Agreement.
***********
At a meeting of the fund’s Board of Directors held on May 16, 2017, the Board considered the approval of an amendment of the fund’s Management Agreement, pursuant to which Dreyfus provides the fund with investment advisory and administrative services (the “Management Agreement”). Dreyfus proposed to amend the Management Agreement to reduce the management fee payable by the fund from 0.75% of the value of the fund’s average daily net assets to 0.60% of the value of the fund’s average daily net assets, effective as of May 19, 2017. The Board members, none of whom are “interested persons” (as defined in the Investment Company Act of 1940, as amended) of the fund, were assisted in their review by independent legal counsel and met with counsel in executive session separate from representatives of Dreyfus. Since the Board had renewed the Management Agreement at a meeting of the fund’s Board of Directors held on March 9-10, 2017 (the “March Meeting”), and, other than as discussed below, there had been no material changes in the information presented, the Board addressed certain of the relevant considerations by reference to their considerations and determinations at the March Meeting. In considering amendment of the Management Agreement, the Board considered all factors that it believed to be relevant, including those discussed below. The Board did not identify any one factor as dispositive, and each Board member may have attributed different weights to the factors considered.
Analysis of Nature, Extent, and Quality of Services Provided to the Fund. The nature, extent and quality of services provided had been considered at the March Meeting, and there had been no material changes in this information. Dreyfus representatives stated, and the Board considered, that Dreyfus would continue to provide research and portfolio management and that Dreyfus would continue to provide oversight of day-to-day fund operations, including fund accounting and administration and assistance in meeting legal and regulatory requirements. The Board considered Dreyfus’ extensive administrative, accounting and compliance infrastructures. The Board also considered that Dreyfus does not believe that the proposed amendment to the Management Agreement would have any adverse impact on the scope or quality of the services provided to the fund by Dreyfus; and the proposed amendment also would not result in any change to the investment management of the fund.
Comparative Analysis of the Fund’s Performance and Management Fee and Expense Ratio. Dreyfus did not provide the Board with information comparing the fund’s performance with the performance of a group of comparable funds because that information had been reviewed at the March Meeting.
34
The Board reviewed the range of actual and contractual management fees and total expenses of a group of comparable funds (the “Expense Group”) in a report prepared by Broadridge Financial Solutions, Inc. (“Broadridge”), an independent provider of investment company data, for the March Meeting (giving effect to the proposed management fee reduction for the fund) and discussed the results of the comparisons. The Board noted that the fund’s proposed management fee was below the Expense Group median for both contractual and actual management fees and the fund’s total expenses (both the current actual expenses and the proposed expenses after giving effect to the expense limitation described below) were below the Expense Group median.
Dreyfus representatives stated that Dreyfus has contractually agreed, until January 1, 2018 for Class A, C, I and Y shares and until March 31, 2018 for Class T Shares, to waive receipt of its fees and/or assume the direct expenses of the fund so that the expenses of none of the fund’s share classes (excluding Rule 12b-1 fees, shareholder services fees, taxes, interest, brokerage commissions, commitment fees on borrowings and extraordinary expenses) exceed 0.68% of the fund’s average daily net assets.
Dreyfus did not provide the Board with the management or investment advisory fees (1) paid by funds advised or administered by Dreyfus that are in the same Broadridge category as the fund and (2) paid to Dreyfus or its affiliates for advising any separate accounts and/or other types of client portfolios that are considered to have similar investment strategies and policies as the fund because this information had been reviewed at the March Meeting.
Analysis of Profitability and Economies of Scale. The Board had considered profitability, economies of scale and the potential benefits to Dreyfus at the March Meeting. Dreyfus representatives noted that the amendment to the Management Agreement would result in a reduction in Dreyfus’ fee (and therefore negatively impact profitability and economies of scale) and that potential benefits would not change materially as a result of the amendment from those considered at the March Meeting.
At the conclusion of these discussions, the Board agreed that it had been furnished with sufficient information to make an informed business decision with respect to amendment of the Management Agreement. Based on the discussions and considerations as described above, the Board concluded and determined as follows.
· The Board concluded that the nature, extent and quality of the services to be provided by Dreyfus continue to be adequate and appropriate.
· The Board determined that the fee to be paid to Dreyfus was appropriate under the circumstances and in light of the factors and the totality of the services provided as discussed above.
In evaluating the Management Agreement, the Board considered these conclusions and determinations and also relied on its previous knowledge, gained through meetings and other interactions with Dreyfus and its affiliates, of Dreyfus and the services provided to the fund by Dreyfus. The Board also relied on information received on a routine and
35
INFORMATION ABOUT THE RENEWAL OF THE FUND’S MANAGEMENT AGREEMENT (Unaudited) (continued)
regular basis throughout the year relating to the operations of the fund and the investment management and other services provided under the Management Agreement, including information on the investment performance of the fund in comparison to similar mutual funds and benchmark performance indices; general market outlook as applicable to the fund; and compliance reports. In addition, the Board’s consideration of the contractual fee arrangements for this fund had the benefit of a number of years of reviews of the Management Agreement and of prior or similar agreements during which lengthy discussions took place between the Board and Dreyfus representatives. The Board determined to approve amendment of the Management Agreement.
36
BOARD MEMBERS INFORMATION (Unaudited)
INDEPENDENT BOARD MEMBERS
Joseph S. DiMartino (73)
Chairman of the Board (1995)
Principal Occupation During Past 5 Years:
· Corporate Director and Trustee (1995-present)
Other Public Company Board Memberships During Past 5 Years:
· CBIZ (formerly, Century Business Services, Inc.), a provider of outsourcing functions for small and medium size companies, Director (1997-present)
No. of Portfolios for which Board Member Serves: 130
———————
Peggy C. Davis (74)
Board Member (2006)
Principal Occupation During Past 5 Years:
· Shad Professor of Law, New York University School of Law (1983-present)
No. of Portfolios for which Board Member Serves: 47
———————
David P. Feldman (77)
Board Member (1996)
Principal Occupation During Past 5 Years:
· Corporate Director and Trustee (1985-present)
Other Public Company Board Memberships During Past 5 Years:
· BBH Mutual Funds Group (5 registered mutual funds), Director (1992-2014)
No. of Portfolios for which Board Member Serves: 33
———————
Joan Gulley (69)
Board Member (2017)
Principal Occupation During Past 5 Years:
· PNC Financial Services Group, Inc.(1993-2014)
· Executive Vice President and Chief Human Resources Officer and Executive Committee Member (2008-2014)
No. of Portfolios for which Board Member Serves: 33
———————
37
BOARD MEMBERS INFORMATION (Unaudited) (continued)
INDEPENDENT BOARD MEMBERS (continued)
Ehud Houminer (77)
Board Member (1993)
Principal Occupation During Past 5 Years:
· Board of Overseers at the Columbia Business School, Columbia University (1992-present)
· Trustee, Ben Gurion University
Other Public Company Board Memberships During Past 5 Years:
· Avnet, Inc., an electronics distributor, Director (1993-2012)
No. of Portfolios for which Board Member Serves: 54
———————
Lynn Martin (77)
Board Member (2012)
Principal Occupation During Past 5 Years:
· President of The Martin Hall Group LLC, a human resources consulting firm (2005-2012)
Other Public Company Board Memberships During Past 5 Years:
· AT&T, Inc., a telecommunications company, Director (1999-2012)
· Ryder System, Inc., a supply chain and transportation management company, Director (1993-2012)
No. of Portfolios for which Board Member Serves: 33
———————
Robin A. Melvin (53)
Board Member (2012)
Principal Occupation During Past 5 Years:
· Co-chairman, Illinois Mentoring Partnership, non-profit organization dedicated to increasing the quantity and quality of mentoring services in Illinois; (2014-present; board member since 2013)
· Director, Boisi Family Foundation, a private family foundation that supports youth-serving organizations that promote the self sufficiency of youth from disadvantaged circumstances (1995-2012)
No. of Portfolios for which Board Member Serves: 102
———————
38
Dr. Martin Peretz (78)
Board Member (2006)
Principal Occupation During Past 5 Years:
· Editor-in-Chief Emeritus of The New Republic Magazine (2011-2012) (previously,
Editor-in-Chief, 1974-2011)
· Lecturer at Harvard University (1969-2012)
No. of Portfolios for which Board Member Serves: 33
———————
Once elected all Board Members serve for an indefinite term, but achieve Emeritus status upon reaching age 80. The address of the Board Members and Officers is c/o The Dreyfus Corporation, 200 Park Avenue, New York, New York 10166. Additional information about the Board Members is available in the fund’s Statement of Additional Information which can be obtained from Dreyfus free of charge by calling this toll free number: 1-800-DREYFUS.
James F. Henry, Emeritus Board Member
Philip L. Toia, Emeritus Board Member
39
OFFICERS OF THE FUND (Unaudited)
BRADLEY J. SKAPYAK, President since January 2010.
Chief Operating Officer and a director of the Manager since June 2009, Chairman of Dreyfus Transfer, Inc., an affiliate of the Manager and the transfer agent of the funds, since May 2011 and Chief Executive Officer of MBSC Securities Corporation since August 2016. He is an officer of 63 investment companies (comprised of 130 portfolios) managed by the Manager. He is 58 years old and has been an employee of the Manager since February 1988.
BENNETT A. MACDOUGALL, Chief Legal Officer since October 2015.
Chief Legal Officer of the Manager and Associate General Counsel and Managing Director of BNY Mellon since June 2015; from June 2005 to June 2015, he served in various capacities with Deutsche Bank – Asset & Wealth Management Division, including as Director and Associate General Counsel, and Chief Legal Officer of Deutsche Investment Management Americas Inc. from June 2012 to May 2015. He is an officer of 64 investment companies (comprised of 155 portfolios) managed by the Manager. He is 45 years old and has been an employee of the Manager since June 2015.
JANETTE E. FARRAGHER, Vice President and Secretary since December 2011.
Associate General Counsel of BNY Mellon, and an officer of 64 investment companies (comprised of 155 portfolios) managed by the Manager. She is 54 years old and has been an employee of the Manager since February 1984.
JAMES BITETTO, Vice President and Assistant Secretary since August 2005.
Managing Counsel of BNY Mellon and Secretary of the Manager, and an officer of 64 investment companies (comprised of 155 portfolios) managed by the Manager. He is 51 years old and has been an employee of the Manager since December 1996.
JOSEPH M. CHIOFFI, Vice President and Assistant Secretary since August 2005.
Managing Counsel of BNY Mellon, and an officer of 64 investment companies (comprised of 155 portfolios) managed by the Manager. He is 55 years old and has been an employee of the Manager since June 2000.
MAUREEN E. KANE, Vice President and Assistant Secretary since April 2015.
Managing Counsel of BNY Mellon since July 2014; from October 2004 until July 2014, General Counsel, and from May 2009 until July 2014, Chief Compliance Officer of Century Capital Management. She is an officer of 64 investment companies (comprised of 155 portfolios) managed by the Manager. She is 55 years old and has been an employee of the Manager since July 2014.
SARAH S. KELLEHER, Vice President and Assistant Secretary since April 2014.
Senior Counsel of BNY Mellon since March 2013, from August 2005 to March 2013, Associate General Counsel of Third Avenue Management. She is an officer of 64 investment companies (comprised of 155 portfolios) managed by the Manager. She is 41 years old and has been an employee of the Manager since March 2013.
JEFF PRUSNOFSKY, Vice President and Assistant Secretary since August 2005.
Senior Managing Counsel of BNY Mellon, and an officer of 64 investment companies (comprised of 155 portfolios) managed by the Manager. He is 52 years old and has been an employee of the Manager since October 1990.
NATALYA ZELENSKY, Vice President and Assistant Secretary since March 2017.
Counsel and Vice President of BNY Mellon since May 2016; Attorney at Wildermuth Endowment Strategy Fund/Wildermuth Advisory, LLC from November 2015 until May 2016; Assistant General Counsel at RCS Advisory Services from July 2014 until November 2015; Associate at Sutherland, Asbill & Brennan from January 2013 until January 2014; Associate at K&L Gates from October 2011 until January 2013. She is an officer of 64 investment companies (comprised of 155 portfolios) managed by Dreyfus. She is 32 years old and has been an employee of the Manager since May 2016.
JAMES WINDELS, Treasurer since November 2001.
Director – Mutual Fund Accounting of the Manager, and an officer of 64 investment companies (comprised of 155 portfolios) managed by the Manager. He is 58 years old and has been an employee of the Manager since April 1985.
40
RICHARD CASSARO, Assistant Treasurer since January 2008.
Senior Accounting Manager – Money Market and Municipal Bond Funds of the Manager, and an officer of 64 investment companies (comprised of 155 portfolios) managed by the Manager. He is 58 years old and has been an employee of the Manager since September 1982.
GAVIN C. REILLY, Assistant Treasurer since December 2005.
Tax Manager of the Investment Accounting and Support Department of the Manager, and an officer of 64 investment companies (comprised of 155 portfolios) managed by the Manager. He is 49 years old and has been an employee of the Manager since April 1991.
ROBERT S. ROBOL, Assistant Treasurer since August 2005.
Senior Accounting Manager – Dreyfus Financial Reporting of the Manager, and an officer of 64 investment companies (comprised of 155 portfolios) managed by the Manager. He is 53 years old and has been an employee of the Manager since October 1988.
ROBERT SALVIOLO, Assistant Treasurer since July 2007.
Senior Accounting Manager – Equity Funds of the Manager, and an officer of 64 investment companies (comprised of 155 portfolios) managed by the Manager. He is 50 years old and has been an employee of the Manager since June 1989.
ROBERT SVAGNA, Assistant Treasurer since December 2002.
Senior Accounting Manager – Fixed Income and Equity Funds of the Manager, and an officer of 64 investment companies (comprised of 155 portfolios) managed by the Manager. He is 50 years old and has been an employee of the Manager since November 1990.
JOSEPH W. CONNOLLY, Chief Compliance Officer since October 2004.
Chief Compliance Officer of the Manager and The Dreyfus Family of Funds (64 investment companies, comprised of 155 portfolios). He is 60 years old and has served in various capacities with the Manager since 1980, including manager of the firm’s Fund Accounting Department from 1997 through October 2001.
CARIDAD M. CAROSELLA, Anti-Money Laundering Compliance Officer since January 2016.
Anti-Money Laundering Compliance Officer of the Dreyfus Family of Funds and BNY Mellon Funds Trust since January 2016; from May 2015 to December 2015, Interim Anti-Money Laundering Compliance Officer of the Dreyfus Family of Funds and BNY Mellon Funds Trust and the Distributor; from January 2012 to May 2015, AML Surveillance Officer of the Distributor and from 2007 to December 2011, Financial Processing Manager of the Distributor. She is an officer of 59 investment companies (comprised of 150 portfolios) managed by the Manager. She is 49 years old and has been an employee of the Distributor since 1997.
41
Dreyfus Strategic Value Fund
200 Park Avenue
New York, NY 10166
Manager
The Dreyfus Corporation
200 Park Avenue
New York, NY 10166
Custodian
The Bank of New York Mellon
225 Liberty Street
New York, NY 10286
Transfer Agent &
Dividend Disbursing Agent
Dreyfus Transfer, Inc.
200 Park Avenue
New York, NY 10166
Distributor
MBSC Securities Corporation
200 Park Avenue
New York, NY 10166
| | |
Ticker Symbols: | Class A:DAGVX Class C:DCGVX Class I:DRGVX Class Y:DRGYX |
Telephone Call your financial representative or 1-800-DREYFUS
Mail The Dreyfus Family of Funds, 144 Glenn Curtiss Boulevard, Uniondale, NY 11556-0144
E-mail Send your request to info@dreyfus.com
Internet Information can be viewed online or downloaded at www.dreyfus.com
The fund files its complete schedule of portfolio holdings with the Securities and Exchange Commission (“SEC”) for the first and third quarters of each fiscal year on Form N-Q. The fund’s Forms N-Q are available on the SEC’s website at www.sec.gov and may be reviewed and copied at the SEC’s Public Reference Room in Washington, D.C. (phone 1-800-SEC-0330 for information).
A description of the policies and procedures that the fund uses to determine how to vote proxies relating to portfolio securities and information regarding how the fund voted these proxies for the most recent 12-month period ended June 30 is available at www.dreyfus.com and on the SEC’s website at www.sec.gov and without charge, upon request, by calling 1-800-DREYFUS.
| | |
© 2017 MBSC Securities Corporation
0257AR0817 | 
|
Dreyfus Structured Midcap Fund
| | | |

| | ANNUAL REPORT
August 31, 2017 |
| |
Save time. Save paper. View your next shareholder report online as soon as it’s available. Log into www.dreyfus.com and sign up for Dreyfus eCommunications. It’s simple and only takes a few minutes. |
| |
The views expressed in this report reflect those of the portfolio manager(s) only through the end of the period covered and do not necessarily represent the views of Dreyfus or any other person in the Dreyfus organization. Any such views are subject to change at any time based upon market or other conditions and Dreyfus disclaims any responsibility to update such views. These views may not be relied on as investment advice and, because investment decisions for a Dreyfus fund are based on numerous factors, may not be relied on as an indication of trading intent on behalf of any Dreyfus fund. |
| |
Not FDIC-Insured • Not Bank-Guaranteed • May Lose Value |
Contents
THE FUND
FOR MORE INFORMATION
Back Cover
| | | | |
| |
Dreyfus Structured Midcap Fund
| | The Fund |
A LETTER FROM THE CEO OF DREYFUS
Dear Shareholder:
We are pleased to present this annual report for Dreyfus Structured Midcap Fund, covering the 12-month period from September 1, 2016 through August 31, 2017. For information about how the fund performed during the reporting period, as well as general market perspectives, we provide a Discussion of Fund Performance on the pages that follow.
Stocks set a series of new record highs and bonds produced mixed results over the past year in response to changing economic and political conditions. Financial markets during the final months of 2016 were dominated by the election of a new U.S. presidential administration. Equities surged higher in anticipation of more business-friendly regulatory, tax, and fiscal policies, but high-quality bonds generally lost value due to expectations of rising interest rates and accelerating inflation in a stronger economy. Despite a series of short-term interest-rate hikes, bonds recovered over the first eight months of 2017 when it became clearer that major tax and fiscal reforms would take time and political capital to enact. Stocks continued to rally, led by large growth-oriented companies, as corporate earnings grew and global economic conditions improved.
The markets’ recent strong performance has been supported by solid underlying fundamentals. While we currently expect these favorable conditions to persist, we remain watchful for economic and political developments that could derail the rallies. As always, we encourage you to discuss the risks and opportunities of today’s investment environment with your financial advisor.
Thank you for your continued confidence and support.
Sincerely,

Mark D. Santero
Chief Executive Officer
The Dreyfus Corporation
September 15, 2017
2
DISCUSSION OF FUND PERFORMANCE
For the period from September 1, 2016 through August 31, 2017, as provided by the fund’s primary portfolio managers C. Wesley Boggs, William S. Cazalet, CAIA, Ronald P. Gala, CFA, Peter D. Goslin, CFA, and Syed A. Zamil, CFA, of Mellon Capital Management Corporation, Sub-Investment Adviser
Market and Fund Performance Overview
For the 12-month period ended August 31, 2017, Dreyfus Structured Midcap Fund’s Class A shares produced a total return of 13.95%, Class C shares returned 13.14%, Class I shares returned 14.28%, and Class Y shares returned 14.39%.1 In comparison, the S&P MidCap 400® Index (the “Index”), the fund’s benchmark, produced a total return of 12.37%.2
Mid-cap stocks gained ground amid better-than-expected corporate earnings, improving economic prospects, and positive investor sentiment in the wake of the U.S. presidential election. The fund produced higher returns than its benchmark, mainly due to the success of our security selection strategy in the health care, industrials, and consumer discretionary sectors.
The Fund’s Investment Approach
The fund seeks long-term capital growth. To pursue its goal, the fund normally invests at least 80% of its net assets, plus any borrowings for investment purposes, in the stocks of companies included in the Index or the Russell Midcap® Index.
We select stocks through a “bottom-up,” structured approach that seeks to identify undervalued securities using a quantitative screening process. This process is driven by a proprietary quantitative model that measures a diverse set of characteristics of stocks to identify and rank stocks based on relative value, momentum/sentiment, and earnings quality measures.
Next, we construct the portfolio through a risk-controlled process, focusing on stock selection as opposed to making proactive decisions as to industry and sector exposure. The fund seeks to maintain a portfolio that has exposure to industries and market capitalizations that are generally similar to those of the Index. Finally, within each sector and style subset, the fund will seek to overweight the most attractive stocks and underweight or not hold the stocks that have been ranked least attractive.
Rising Corporate Earnings Drove Markets Higher
While political uncertainties caused U.S. stocks to dip in the weeks before the 2016 presidential election, equity markets were reenergized in November and December when investors began to anticipate lower corporate taxes, reduced regulatory constraints on business, and increased infrastructure spending from a new presidential administration.
Mid-cap stocks through August 31, 2017 generally continued to build on gains achieved during the final months of 2016. Consecutive quarters of better-than-expected corporate earnings and encouraging global economic developments drove the Index to a series of new highs in February and early March. While concerns about the new U.S. presidential administration’s ability to implement its business-friendly policy proposals slowed the pace of the market’s advance in the early spring, mid-cap stocks quickly erased those losses and reached new all-time highs in June and July. However, broader market leadership shifted from smaller, value-oriented stocks to larger, more growth-oriented industry leaders. Although all capitalization ranges produced double-digit returns in this environment, mid-cap stocks generally trailed large-cap stocks.
3
DISCUSSION OF FUND PERFORMANCE (continued)
Security Selection Strategy Buoyed Fund Results
The fund outperformed the Index over the reporting period due to the success of our quantitative security selection process. In the health care sector, precision instruments provider Mettler-Toledo International reported better-than-expected earnings and raised the future guidance it provides to analysts. Among industrial companies, aircraft equipment maker Spirit AeroSystems Holdings boosted earnings after the positive resolution of a supply agreement with a major U.S. aircraft manufacturer. Results in the consumer discretionary sector were bolstered by a variety of strong stock selections. In other areas, information technology company Mentor Graphics was acquired at a premium to its stock price at the time, and financial institution East West Bancorp gained value in response to higher earnings and expectations of reduced regulatory burdens.
Disappointments during the reporting period included the information technology and utilities sectors, where a number of holdings trailed sector averages but none ranked among the fund’s weakest individual performers. Instead, the fund’s greatest laggards for the reporting period included bedding producer Tempur Sealy International, which terminated a contract with a major U.S. mattress retailer. Although the fund achieved positive relative returns in the struggling energy sector, exploration-and-production company Newfield Exploration lost considerable value after reducing production guidance. Similarly, while the real estate sector was additive due to an underweight, stock selection was negative and real estate investment trust Weingarten Realty was among the fund’s largest detractors.
A Disciplined Approach to Stock Picking
As of the reporting period’s end, our quantitative models have continued to identify what we believe are attractive investment opportunities across a broad spectrum of mid-cap companies and industry groups. Indeed, recent bouts of volatility have provided opportunities to purchase the stocks of companies ranked highly by our process. When the fund’s holdings reach what we perceive to be fuller valuations, we expect to replace them with high-quality companies that display then-currently attractive valuations in our model. In addition, we continue to maintain a broadly diversified portfolio.
September 15, 2017
1 Total return includes reinvestment of dividends and any capital gains paid, and does not take into consideration the maximum initial sales charge in the case of Class A shares or the applicable contingent deferred sales charge imposed on redemptions in the case of Class C shares. Past performance is no guarantee of future results. Share price, yield, and investment return fluctuate such that upon redemption, fund shares may be worth more or less than their original cost. The fund’s returns reflect the absorption of certain fund expenses by The Dreyfus Corporation pursuant to an agreement in effect through January 1, 2018, at which time it may be extended, terminated, or modified. Had these expenses not been absorbed, the fund’s returns would have been lower.
2 Source: Lipper Inc. — The S&P MidCap 400® Index provides investors with a benchmark for midsized companies. The index measures the performance of midsized companies, reflecting the distinctive risk and return characteristics of this market segment. Investors cannot invest directly in any index.
Please note: the position in any security highlighted with italicized typeface was sold during the reporting period.
Equities are subject generally to market, market sector, market liquidity, issuer, and investment style risks, among other factors, to varying degrees, all of which are more fully described in the fund’s prospectus.
Stocks of small- and/or mid-cap companies often experience sharper price fluctuations than stocks of large-cap companies.
4
FUND PERFORMANCE
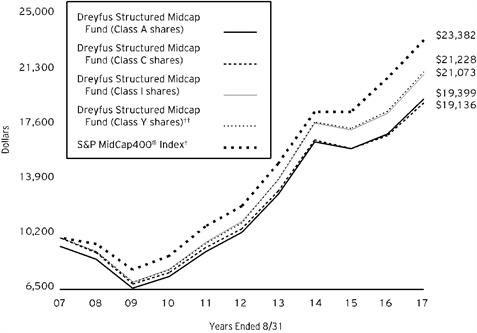
Comparison of change in value of $10,000 investment in Dreyfus Structured Midcap Fund Class A shares, Class C shares, Class I shares and Class Y shares and the S&P MidCap 400® Index (the “Index”)
† Source: Lipper Inc.
†† The total return figures presented for Class Y shares of the fund reflect the performance of the fund’s Class A shares for the period prior to 7/1/13 (the inception date for Class Y shares), not reflecting the applicable sales charges for Class A shares.
Past performance is not predictive of future performance.
The above graph compares a $10,000 investment made in each of the Class A, Class C, Class I and Class Y shares of Dreyfus Structured Midcap Fund on 8/31/07 to a $10,000 investment made in the Index on that date. All dividends and capital gain distributions are reinvested.
The fund’s performance shown in the line graph above takes into account the maximum initial sales charge on Class A shares and all other applicable fees and expenses on all classes. The Index provides investors with a benchmark for mid-sized companies. The index measures the performance of mid-sized companies, reflecting the distinctive risk and return characteristics of this market segment. Unlike a mutual fund, the Index is not subject to charges, fees and other expenses. Investors cannot invest directly in any Index. Further information relating to fund performance, including expense reimbursements, if applicable, is contained in the Financial Highlights section of the prospectus and elsewhere in this report.
5
FUND PERFORMANCE (continued)
| | | | | |
Average Annual Total Returns as of 8/31/17 |
| | Inception
Date | 1 Year | 5 Years | 10 Years |
Class A shares | | | | |
with maximum sales charge (5.75%) | 6/29/01 | 7.41% | 12.01% | 6.85% |
without sales charge | 6/29/01 | 13.95% | 13.35% | 7.49% |
Class C shares | | | | |
with applicable redemption charge † | 6/29/01 | 12.14% | 12.52% | 6.71% |
without redemption | 6/29/01 | 13.14% | 12.52% | 6.71% |
Class I shares | 6/29/01 | 14.28% | 13.63% | 7.74% |
Class Y shares | 7/1/13 | 14.39% | 14.05%†† | 7.82%†† |
S & P MidCap 400® Index | | 12.37% | 13.99% | 8.87% |
† The maximum contingent deferred sales charge for Class C shares is 1% for shares redeemed within one year of the date of purchase.
†† The total return performance figures presented for Class Y shares of the fund reflect the performance of the fund’s Class A shares for the period prior to 7/1/13 (the inception date for Class Y shares), not reflecting the applicable sales charges for Class A shares.
The performance data quoted represents past performance, which is no guarantee of future results. Share price and investment return fluctuate and an investor’s shares may be worth more or less than original cost upon redemption. Current performance may be lower or higher than the performance quoted. Go to Dreyfus.com for the fund’s most recent month-end returns.
The fund’s performance shown in the graph and table does not reflect the deduction of taxes that a shareholder would pay on fund distributions or the redemption of fund shares. In addition to the performance of Class A shares shown with and without a maximum sales charge, the fund’s performance shown in the table takes into account all other applicable fees and expenses on all classes.
6
UNDERSTANDING YOUR FUND’S EXPENSES (Unaudited)
As a mutual fund investor, you pay ongoing expenses, such as management fees and other expenses. Using the information below, you can estimate how these expenses affect your investment and compare them with the expenses of other funds. You also may pay one-time transaction expenses, including sales charges (loads) and redemption fees, which are not shown in this section and would have resulted in higher total expenses. For more information, see your fund’s prospectus or talk to your financial adviser.
Review your fund’s expenses
The table below shows the expenses you would have paid on a $1,000 investment in Dreyfus Structured Midcap Fund from March 1, 2017 to August 31, 2017. It also shows how much a $1,000 investment would be worth at the close of the period, assuming actual returns and expenses.
| | | | | | | | | | | | |
Expenses and Value of a $1,000 Investment | | |
assuming actual returns for the six months ended August 31, 2017 |
| | | | Class A | Class C | Class I | Class Y |
Expenses paid per $1,000† | | $6.33 | | $9.91 | | $4.97 | | $4.36 |
Ending value (after expenses) | | $1,010.40 | | $1,006.90 | | $1,011.80 | | $1,012.30 |
COMPARING YOUR FUND’S EXPENSES
WITH THOSE OF OTHER FUNDS (Unaudited)
Using the SEC’s method to compare expenses
The Securities and Exchange Commission (SEC) has established guidelines to help investors assess fund expenses. Per these guidelines, the table below shows your fund’s expenses based on a $1,000 investment, assuming a hypothetical 5% annualized return. You can use this information to compare the ongoing expenses (but not transaction expenses or total cost) of investing in the fund with those of other funds. All mutual fund shareholder reports will provide this information to help you make this comparison. Please note that you cannot use this information to estimate your actual ending account balance and expenses paid during the period.
| | | | | | | | |
Expenses and Value of a $1,000 Investment | | |
assuming a hypothetical 5% annualized return for the six months ended August 31, 2017 |
| | | | Class A | Class C | Class I | Class Y |
Expenses paid per $1,000† | $ 6.36 | $ 9.96 | $ 4.99 | $ 4.38 |
Ending value (after expenses) | $ 1,018.90 | $ 1,015.32 | $ 1,020.27 | $ 1,020.87 |
† Expenses are equal to the fund’s annualized expense ratio of 1.25% for Class A, 1.96% for Class C, .98% for Class I and .86% for Class Y, multiplied by the average account value over the period, multiplied by 184/365 (to reflect the one-half year period).
7
STATEMENT OF INVESTMENTS
August 31, 2017
| | | | | | | | |
| |
Description | | | | Shares | | Value ($) | |
Common Stocks - 99.6% | | | | | |
Automobiles & Components - 2.3% | | | | | |
Lear | | | | 5,800 | | 867,332 | |
Visteon | | | | 32,395 | a | 3,739,679 | |
| | | | | 4,607,011 | |
Banks - 6.0% | | | | | |
Cathay General Bancorp | | | | 84,110 | | 2,966,560 | |
East West Bancorp | | | | 88,630 | | 4,907,443 | |
First Horizon National | | | | 216,965 | | 3,733,968 | |
UMB Financial | | | | 8,900 | | 597,368 | |
| | | | | 12,205,339 | |
Capital Goods - 14.8% | | | | | |
Curtiss-Wright | | | | 38,900 | | 3,766,298 | |
Donaldson | | | | 82,100 | | 3,879,225 | |
GATX | | | | 4,135 | b | 250,498 | |
Huntington Ingalls Industries | | | | 8,395 | | 1,796,194 | |
Jacobs Engineering Group | | | | 28,900 | | 1,574,761 | |
KLX | | | | 4,100 | a | 196,554 | |
Lennox International | | | | 23,890 | | 3,959,290 | |
Oshkosh | | | | 62,760 | | 4,681,896 | |
Owens Corning | | | | 35,650 | | 2,642,734 | |
Spirit AeroSystems Holdings, Cl. A | | | | 54,155 | | 4,034,547 | |
Toro | | | | 41,430 | b | 2,555,402 | |
Woodward | | | | 12,500 | | 877,625 | |
| | | | | 30,215,024 | |
Commercial & Professional Services - 1.2% | | | | | |
Deluxe | | | | 3,080 | b | 213,598 | |
MSA Safety | | | | 29,600 | | 2,156,656 | |
| | | | | 2,370,254 | |
Consumer Durables & Apparel - 5.4% | | | | | |
Brunswick | | | | 75,920 | | 3,984,282 | |
Deckers Outdoor | | | | 20,800 | a | 1,329,120 | |
KB Home | | | | 74,800 | b | 1,600,720 | |
NVR | | | | 1,540 | a | 4,190,109 | |
| | | | | 11,104,231 | |
Consumer Services - .1% | | | | | |
Darden Restaurants | | | | 2,550 | | 209,330 | |
8
| | | | | | | | |
| |
Description | | | | Shares | | Value ($) | |
Common Stocks - 99.6% (continued) | | | | | |
Diversified Financials - 3.1% | | | | | |
Discover Financial Services | | | | 25,200 | | 1,485,540 | |
Eaton Vance | | | | 95,130 | | 4,526,285 | |
SEI Investments | | | | 6,165 | | 360,406 | |
| | | | | 6,372,231 | |
Energy - 1.1% | | | | | |
Cimarex Energy | | | | 8,300 | | 827,427 | |
Newfield Exploration | | | | 20,700 | a | 540,891 | |
World Fuel Services | | | | 26,920 | | 929,817 | |
| | | | | 2,298,135 | |
Food, Beverage & Tobacco - 2.4% | | | | | |
ConAgra Foods | | | | 94,300 | | 3,060,978 | |
Ingredion | | | | 14,290 | | 1,769,388 | |
| | | | | 4,830,366 | |
Health Care Equipment & Services - 5.9% | | | | | |
Halyard Health | | | | 47,410 | a | 2,147,199 | |
Masimo | | | | 33,500 | a | 2,826,730 | |
Varian Medical Systems | | | | 20,900 | a | 2,220,625 | |
WellCare Health Plans | | | | 28,040 | a | 4,898,027 | |
| | | | | 12,092,581 | |
Household & Personal Products - 1.1% | | | | | |
Church & Dwight | | | | 36,510 | | 1,831,707 | |
Spectrum Brands Holdings | | | | 3,200 | b | 351,872 | |
| | | | | 2,183,579 | |
Insurance - 5.9% | | | | | |
CNO Financial Group | | | | 59,040 | | 1,319,544 | |
Old Republic International | | | | 207,070 | | 3,952,966 | |
Primerica | | | | 52,755 | b | 4,038,395 | |
Reinsurance Group of America | | | | 19,950 | | 2,682,277 | |
| | | | | 11,993,182 | |
Materials - 7.0% | | | | | |
Bemis | | | | 7,565 | b | 322,345 | |
Chemours | | | | 14,400 | | 706,608 | |
Eagle Materials | | | | 11,900 | | 1,157,275 | |
Greif, Cl. A | | | | 16,300 | b | 985,335 | |
Louisiana-Pacific | | | | 116,000 | a | 2,955,680 | |
Owens-Illinois | | | | 81,030 | a | 1,996,579 | |
Reliance Steel & Aluminum | | | | 26,125 | | 1,891,973 | |
Sensient Technologies | | | | 2,700 | | 194,805 | |
9
STATEMENT OF INVESTMENTS (continued)
| | | | | | | | |
| |
Description | | | | Shares | | Value ($) | |
Common Stocks - 99.6% (continued) | | | | | |
Materials - 7.0% (continued) | | | | | |
Worthington Industries | | | | 83,180 | b | 4,155,673 | |
| | | | | 14,366,273 | |
Media - 1.3% | | | | | |
John Wiley & Sons, Cl. A | | | | 25,000 | | 1,348,750 | |
Meredith | | | | 24,200 | b | 1,315,270 | |
| | | | | 2,664,020 | |
Pharmaceuticals, Biotechnology & Life Sciences - 5.7% | | | | | |
Catalent | | | | 9,500 | a | 392,255 | |
Charles River Laboratories International | | | | 35,740 | a | 3,888,512 | |
INC Research Holdings, Cl. A | | | | 7,500 | a | 440,250 | |
Mettler-Toledo International | | | | 6,745 | a | 4,081,332 | |
United Therapeutics | | | | 19,110 | a | 2,499,588 | |
Waters | | | | 2,100 | a | 385,308 | |
| | | | | 11,687,245 | |
Real Estate - 7.0% | | | | | |
First Industrial Realty Trust | | | | 125,210 | c | 3,879,006 | |
Kilroy Realty | | | | 64,860 | c | 4,490,258 | |
Lamar Advertising, Cl. A | | | | 51,715 | b,c | 3,442,150 | |
Tanger Factory Outlet Centers | | | | 70,440 | b,c | 1,648,296 | |
Urban Edge Properties | | | | 8,900 | c | 223,835 | |
Weingarten Realty Investors | | | | 17,995 | c | 576,560 | |
| | | | | 14,260,105 | |
Retailing - 4.6% | | | | | |
Best Buy | | | | 63,700 | | 3,456,362 | |
Big Lots | | | | 76,280 | b | 3,630,928 | |
Burlington Stores | | | | 9,860 | a | 859,102 | |
Chico's FAS | | | | 111,800 | b | 858,624 | |
Office Depot | | | | 38,000 | | 163,020 | |
The Michaels Companies | | | | 22,040 | a | 494,798 | |
| | | | | 9,462,834 | |
Semiconductors & Semiconductor Equipment - 2.5% | | | | | |
Cirrus Logic | | | | 64,300 | a | 3,728,114 | |
ON Semiconductor | | | | 75,900 | a | 1,296,372 | |
| | | | | 5,024,486 | |
Software & Services - 11.1% | | | | | |
CDK Global | | | | 25,050 | | 1,615,725 | |
Citrix Systems | | | | 19,395 | a | 1,516,883 | |
Convergys | | | | 104,090 | | 2,446,115 | |
10
| | | | | | | | |
| |
Description | | | | Shares | | Value ($) | |
Common Stocks - 99.6% (continued) | | | | | |
Software & Services - 11.1% (continued) | | | | | |
CoreLogic | | | | 8,660 | a | 406,760 | |
DST Systems | | | | 54,970 | | 2,821,610 | |
Fair Isaac | | | | 18,720 | b | 2,635,027 | |
Manhattan Associates | | | | 85,100 | a,b | 3,578,455 | |
MAXIMUS | | | | 59,300 | | 3,604,254 | |
Science Applications International | | | | 43,700 | | 3,228,556 | |
VeriSign | | | | 6,580 | a,b | 682,675 | |
| | | | | 22,536,060 | |
Technology Hardware & Equipment - 7.9% | | | | | |
Belden | | | | 18,940 | | 1,459,706 | |
Dolby Laboratories, Cl. A | | | | 29,090 | | 1,467,881 | |
F5 Networks | | | | 7,300 | a | 871,474 | |
Juniper Networks | | | | 125,200 | | 3,471,796 | |
NCR | | | | 96,380 | a | 3,520,761 | |
Tech Data | | | | 3,000 | a | 330,870 | |
Vishay Intertechnology | | | | 148,400 | b | 2,626,680 | |
Western Digital | | | | 27,300 | | 2,409,771 | |
| | | | | 16,158,939 | |
Utilities - 3.2% | | | | | |
FirstEnergy | | | | 60,225 | | 1,962,131 | |
MDU Resources Group | | | | 168,260 | | 4,549,750 | |
| | | | | 6,511,881 | |
Total Common Stocks (cost $174,779,463) | | | | 203,153,106 | |
| | | | | | | | |
Other Investment - .5% | | | | | |
Registered Investment Company; | | | | | |
Dreyfus Institutional Preferred Government Plus Money Market Fund
(cost $1,029,107) | | | | 1,029,107 | d | 1,029,107 | |
11
STATEMENT OF INVESTMENTS (continued)
| | | | | | | | |
| |
Description | | | | Shares | | Value ($) | |
Investment of Cash Collateral for Securities Loaned - 3.6% | | | | | |
Registered Investment Company; | | | | | |
Dreyfus Institutional Preferred Government Money Market Fund, Institutional Shares
(cost $7,231,724) | | | | 7,231,724 | d | 7,231,724 | |
Total Investments (cost $183,040,294) | | 103.7% | | 211,413,937 | |
Liabilities, Less Cash and Receivables | | (3.7%) | | (7,522,052) | |
Net Assets | | 100.0% | | 203,891,885 | |
aNon-income producing security.
b Security, or portion thereof, on loan. At August 31, 2017, the value of the fund’s securities on loan was $21,373,387 and the value of the collateral held by the fund was $21,736,764, consisting of cash collateral of $7,231,724 and U.S. Government & Agency securities valued at $14,505,040.
c Investment in real estate investment trust.
d Investment in affiliated money market mutual fund.
12
| | |
Portfolio Summary (Unaudited) † | Value (%) |
Capital Goods | 14.8 |
Software & Services | 11.1 |
Technology Hardware & Equipment | 7.9 |
Materials | 7.0 |
Real Estate | 7.0 |
Banks | 6.0 |
Health Care Equipment & Services | 5.9 |
Insurance | 5.9 |
Pharmaceuticals, Biotechnology & Life Sciences | 5.7 |
Consumer Durables & Apparel | 5.4 |
Retailing | 4.6 |
Money Market Investments | 4.1 |
Utilities | 3.2 |
Diversified Financials | 3.1 |
Semiconductors & Semiconductor Equipment | 2.5 |
Food, Beverage & Tobacco | 2.4 |
Automobiles & Components | 2.3 |
Media | 1.3 |
Commercial & Professional Services | 1.2 |
Energy | 1.1 |
Household & Personal Products | 1.1 |
Consumer Services | .1 |
| | 103.7 |
† Based on net assets.
See notes to financial statements.
13
STATEMENT OF INVESTMENTS IN AFFILIATED ISSUERS
| | | | | | | |
Registered Investment Companies | Value
8/31/2016 ($) | Purchases ($) | Sales ($) | Value
8/31/2017 ($) | Net
Assets (%) | Dividends/
Distributions ($) |
Dreyfus Institutional Cash
Advantage Fund,
Institutional Shares | 11,407,250 | 21,561,163 | 32,968,413 | – | – | – |
Dreyfus Institutional Preferred Government Plus Money Market Fund | 865,384 | 38,982,675 | 38,818,952 | 1,029,107 | .5 | 5,178 |
Dreyfus Institutional Preferred Government Money Market Fund, Institutional Shares | – | 106,192,077 | 98,960,353 | 7,231,724 | 3.6 | – |
Total | 12,272,634 | 166,735,915 | 170,747,718 | 8,260,831 | 4.1 | 5,178 |
See notes to financial statements.
14
STATEMENT OF ASSETS AND LIABILITIES
August 31, 2017
| | | | | | | |
| | | | | | |
| | | Cost | | Value | |
Assets ($): | | | | |
Investments in securities—See Statement of Investments
(including securities on loan, valued at $21,373,387)—Note 1(b): | | | | |
Unaffiliated issuers | | 174,779,463 | | 203,153,106 | |
Affiliated issuers | | 8,260,831 | | 8,260,831 | |
Cash | | | | | 163,940 | |
Dividends and securities lending income receivable | | | | | 211,053 | |
Receivable for shares of Common Stock subscribed | | | | | 25,193 | |
Prepaid expenses | | | | | 34,597 | |
| | | | | 211,848,720 | |
Liabilities ($): | | | | |
Due to The Dreyfus Corporation and affiliates—Note 3(c) | | | | | 166,867 | |
Liability for securities on loan—Note 1(b) | | | | | 7,231,724 | |
Payable for shares of Common Stock redeemed | | | | | 438,980 | |
Accrued expenses | | | | | 119,264 | |
| | | | | 7,956,835 | |
Net Assets ($) | | | 203,891,885 | |
Composition of Net Assets ($): | | | | |
Paid-in capital | | | | | 159,653,134 | |
Accumulated undistributed investment income—net | | | | | 329,940 | |
Accumulated net realized gain (loss) on investments | | | | | 15,535,168 | |
Accumulated net unrealized appreciation (depreciation)
on investments | | | | | 28,373,643 | |
Net Assets ($) | | | 203,891,885 | |
| | | | | | |
Net Asset Value Per Share | Class A | Class C | Class I | Class Y | |
Net Assets ($) | 98,978,241 | 25,077,104 | 64,571,917 | 15,264,623 | |
Shares Outstanding | 3,189,488 | 908,849 | 2,039,073 | 482,705 | |
Net Asset Value Per Share ($) | 31.03 | 27.59 | 31.67 | 31.62 | |
| | | | | | |
See notes to financial statements. | | | | | |
15
STATEMENT OF OPERATIONS
Year Ended August 31, 2017
| | | | | | | |
| | | | | | |
| | | | | | |
Investment Income ($): | | | | |
Income: | | | | |
Cash dividends: | | | | |
Unaffiliated issuers | | | 2,879,758 | |
Affiliated issuers | | | 5,178 | |
Income from securities lending—Note 1(b) | | | 46,475 | |
Total Income | | | 2,931,411 | |
Expenses: | | | | |
Management fee—Note 3(a) | | | 1,592,739 | |
Shareholder servicing costs—Note 3(c) | | | 708,247 | |
Distribution fees—Note 3(b) | | | 225,569 | |
Registration fees | | | 63,243 | |
Professional fees | | | 53,376 | |
Prospectus and shareholders’ reports | | | 33,006 | |
Custodian fees—Note 3(c) | | | 22,172 | |
Directors’ fees and expenses—Note 3(d) | | | 16,948 | |
Loan commitment fees—Note 2 | | | 4,686 | |
Interest expense—Note 2 | | | 192 | |
Miscellaneous | | | 25,101 | |
Total Expenses | | | 2,745,279 | |
Less—reduction in expenses due to undertaking—Note 3(a) | | | (96,015) | |
Less—reduction in fees due to earnings credits—Note 3(c) | | | (3,475) | |
Net Expenses | | | 2,645,789 | |
Investment Income—Net | | | 285,622 | |
Realized and Unrealized Gain (Loss) on Investments—Note 4 ($): | | |
Net realized gain (loss) on investments | 20,930,553 | |
Net unrealized appreciation (depreciation) on investments | | | 6,855,820 | |
Net Realized and Unrealized Gain (Loss) on Investments | | | 27,786,373 | |
Net Increase in Net Assets Resulting from Operations | | 28,071,995 | |
| | | | | | | |
See notes to financial statements. | | | | | |
16
STATEMENT OF CHANGES IN NET ASSETS
| | | | | | | | | | |
| | | | Year Ended August 31, |
| | | | 2017 | | | | 2016 | |
Operations ($): | | | | | | | | |
Investment income—net | | | 285,622 | | | | 1,910,911 | |
Net realized gain (loss) on investments | | 20,930,553 | | | | (5,046,312) | |
Net unrealized appreciation (depreciation)
on investments | | 6,855,820 | | | | 15,311,149 | |
Net Increase (Decrease) in Net Assets
Resulting from Operations | 28,071,995 | | | | 12,175,748 | |
Distributions to Shareholders from ($): | | | | | | | | |
Investment income—net: | | | | | | | | |
Class A | | | (818,323) | | | | - | |
Class C | | | (46,268) | | | | - | |
Class I | | | (667,751) | | | | (65,423) | |
Class Y | | | (219,963) | | | | (47,554) | |
Net realized gain on investments: | | | | | | | | |
Class A | | | - | | | | (10,139,977) | |
Class C | | | - | | | | (3,261,953) | |
Class I | | | - | | | | (5,295,150) | |
Class Y | | | - | | | | (1,128,399) | |
Total Distributions | | | (1,752,305) | | | | (19,938,456) | |
Capital Stock Transactions ($): | | | | | | | | |
Net proceeds from shares sold: | | | | | | | | |
Class A | | | 16,262,776 | | | | 16,172,587 | |
Class C | | | 1,309,354 | | | | 3,782,240 | |
Class I | | | 32,044,088 | | | | 27,361,227 | |
Class Y | | | 5,171,284 | | | | 2,370,209 | |
Distributions reinvested: | | | | | | | | |
Class A | | | 772,391 | | | | 9,709,012 | |
Class C | | | 38,165 | | | | 2,607,923 | |
Class I | | | 627,913 | | | | 4,953,262 | |
Class Y | | | 219,963 | | | | 1,147,660 | |
Cost of shares redeemed: | | | | | | | | |
Class A | | | (39,836,246) | | | | (32,649,718) | |
Class C | | | (11,930,991) | | | | (6,930,732) | |
Class I | | | (37,562,441) | | | | (43,248,879) | |
Class Y | | | (6,115,371) | | | | (11,603,175) | |
Increase (Decrease) in Net Assets
from Capital Stock Transactions | (38,999,115) | | | | (26,328,384) | |
Total Increase (Decrease) in Net Assets | (12,679,425) | | | | (34,091,092) | |
Net Assets ($): | | | | | | | | |
Beginning of Period | | | 216,571,310 | | | | 250,662,402 | |
End of Period | | | 203,891,885 | | | | 216,571,310 | |
Undistributed investment income—net | 329,940 | | | | 1,796,623 | |
17
STATEMENT OF CHANGES IN NET ASSETS (continued)
| | | | | | | | | | |
| | | | Year Ended August 31, |
| | | | 2017 | | | | 2016 | |
Capital Share Transactions (Shares): | | | | | | | | |
Class Aa | | | | | | | | |
Shares sold | | | 538,993 | | | | 605,504 | |
Shares issued for distributions reinvested | | | 25,789 | | | | 370,172 | |
Shares redeemed | | | (1,333,926) | | | | (1,234,420) | |
Net Increase (Decrease) in Shares Outstanding | (769,144) | | | | (258,744) | |
Class Ca | | | | | | | | |
Shares sold | | | 49,748 | | | | 156,611 | |
Shares issued for distributions reinvested | | | 1,426 | | | | 111,125 | |
Shares redeemed | | | (445,097) | | | | (292,663) | |
Net Increase (Decrease) in Shares Outstanding | (393,923) | | | | (24,927) | |
Class Ia | | | | | | | | |
Shares sold | | | 1,043,977 | | | | 996,832 | |
Shares issued for distributions reinvested | | | 20,509 | | | | 185,005 | |
Shares redeemed | | | (1,241,093) | | | | (1,603,669) | |
Net Increase (Decrease) in Shares Outstanding | (176,607) | | | | (421,832) | |
Class Ya | | | | | | | | |
Shares sold | | | 168,902 | | | | 86,782 | |
Shares issued for distributions reinvested | | | 7,189 | | | | 42,840 | |
Shares redeemed | | | (195,659) | | | | (392,706) | |
Net Increase (Decrease) in Shares Outstanding | (19,568) | | | | (263,084) | |
| | | | | | | | | | |
a During the period ended August 31, 2017, 1,737 Class A shares representing $52,964 were exchanged for 1,704 Class I shares and 1,044 Class C shares representing $25,961 were exchanged for 910 Class I shares and during the period ended August 31, 2016, 1,545 Class A shares representing $37,414 were exchanged for 1,513 Class I shares, 329 Class C shares representing $6,904 were exchanged for 288 Class I shares and 11,035 Class Y shares representing $279,091 were exchanged for 11,049 Class I shares.
| |
See notes to financial statements. | | | | | | | | |
18
FINANCIAL HIGHLIGHTS
The following tables describe the performance for each share class for the fiscal periods indicated. All information (except portfolio turnover rate) reflects financial results for a single fund share. Total return shows how much your investment in the fund would have increased (or decreased) during each period, assuming you had reinvested all dividends and distributions. These figures have been derived from the fund’s financial statements.
| | | | | | | | | |
| | | | |
| | | |
Class A Shares | | Year Ended August 31, |
| | 2017 | 2016 | 2015 | 2014 | 2013 |
Per Share Data ($): | | | | | | |
Net asset value, beginning of period | | 27.43 | 28.21 | 33.28 | 26.49 | 21.41 |
Investment Operations: | | | | | | |
Investment income—neta | | .04 | .23 | .06 | .11 | .23 |
Net realized and unrealized
gain (loss) on investments | | 3.78 | 1.43 | (.96) | 7.06 | 5.06 |
Total from Investment Operations | | 3.82 | 1.66 | (.90) | 7.17 | 5.29 |
Distributions: | | | | | | |
Dividends from
investment income—net | | (.22) | - | (.14) | (.10) | (.21) |
Dividends from net realized
gain on investments | | - | (2.44) | (4.03) | (.28) | - |
Total Distributions | | (.22) | (2.44) | (4.17) | (.38) | (.21) |
Net asset value, end of period | | 31.03 | 27.43 | 28.21 | 33.28 | 26.49 |
Total Return (%)b | | 13.95 | 6.27 | (2.80) | 27.21 | 24.94 |
Ratios/Supplemental Data (%): | | | | | | |
Ratio of total expenses
to average net assets | | 1.32 | 1.29 | 1.25 | 1.25 | 1.35 |
Ratio of net expenses
to average net assets | | 1.25 | 1.25 | 1.23 | 1.24 | 1.26 |
Ratio of net investment income
to average net assets | | .13 | .87 | .20 | .37 | .92 |
Portfolio Turnover Rate | | 63.25 | 71.27 | 78.09 | 74.66 | 57.54 |
Net Assets, end of period ($ x 1,000) | | 98,978 | 108,588 | 118,954 | 123,057 | 106,245 |
a Based on average shares outstanding.
b Exclusive of sales charge.
See notes to financial statements.
19
FINANCIAL HIGHLIGHTS (continued)
| | | | | | | | | |
| | | | |
| | | |
Class C Shares | | Year Ended August 31, |
| | 2017 | 2016 | 2015 | 2014 | 2013 |
Per Share Data ($): | | | | | | |
Net asset value, beginning of period | | 24.42 | 25.55 | 30.60 | 24.48 | 19.80 |
Investment Operations: | | | | | | |
Investment income (loss)—neta | | (.16) | .03 | (.14) | (.10) | .06 |
Net realized and unrealized
gain (loss) on investments | | 3.37 | 1.28 | (.88) | 6.50 | 4.68 |
Total from Investment Operations | | 3.21 | 1.31 | (1.02) | 6.40 | 4.74 |
Distributions: | | | | | | |
Dividends from
investment income—net | | (.04) | - | - | - | (.06) |
Dividends from net realized
gain on investments | | - | (2.44) | (4.03) | (.28) | - |
Total Distributions | | (.04) | (2.44) | (4.03) | (.28) | (.06) |
Net asset value, end of period | | 27.59 | 24.42 | 25.55 | 30.60 | 24.48 |
Total Return (%)b | | 13.14 | 5.50 | (3.51) | 26.25 | 24.06 |
Ratios/Supplemental Data (%): | | | | | | |
Ratio of total expenses
to average net assets | | 1.98 | 2.00 | 1.96 | 1.98 | 2.10 |
Ratio of net expenses
to average net assets | | 1.97 | 1.99 | 1.96 | 1.98 | 2.01 |
Ratio of net investment income
(loss) to average net assets | | (.59) | .13 | (.52) | (.37) | .26 |
Portfolio Turnover Rate | | 63.25 | 71.27 | 78.09 | 74.66 | 57.54 |
Net Assets, end of period ($ x 1,000) | | 25,077 | 31,817 | 33,926 | 30,502 | 26,061 |
a Based on average shares outstanding.
b Exclusive of sales charge.
See notes to financial statements.
20
| | | | | | | | | | | | |
| | | | | | | |
| | | |
Class I Shares | | Year Ended August 31, |
| | 2017 | 2016 | 2015 | 2014 | 2013 |
Per Share Data ($): | | | | | | |
Net asset value, beginning of period | | 28.02 | 28.73 | 33.83 | 26.90 | 21.73 |
Investment Operations: | | | | | | |
Investment income—neta | | .12 | .31 | .14 | .19 | .33 |
Net realized and unrealized
gain (loss) on investments | | 3.87 | 1.45 | (.99) | 7.17 | 5.09 |
Total from Investment Operations | | 3.99 | 1.76 | (.85) | 7.36 | 5.42 |
Distributions: | | | | | | |
Dividends from
investment income—net | | (.34) | (.03) | (.22) | (.15) | (.25) |
Dividends from net realized
gain on investments | | - | (2.44) | (4.03) | (.28) | - |
Total Distributions | | (.34) | (2.47) | (4.25) | (.43) | (.25) |
Net asset value, end of period | | 31.67 | 28.02 | 28.73 | 33.83 | 26.90 |
Total Return (%) | | 14.28 | 6.54 | (2.59) | 27.57 | 25.17 |
Ratios/Supplemental Data (%): | | | | | | |
Ratio of total expenses
to average net assets | | 1.03 | 1.09 | 1.05 | 1.16 | 1.26 |
Ratio of net expenses
to average net assets | | .99 | 1.00 | 1.00 | .99 | 1.03 |
Ratio of net investment income
to average net assets | | .39 | 1.15 | .46 | .62 | 1.27 |
Portfolio Turnover Rate | | 63.25 | 71.27 | 78.09 | 74.66 | 57.54 |
Net Assets, end of period ($ x 1,000) | | 64,572 | 62,094 | 75,779 | 72,947 | 69,014 |
a Based on average shares outstanding.
See notes to financial statements.
21
FINANCIAL HIGHLIGHTS (continued)
| | | | | | | | |
| | | | |
| | | |
Class Y Shares | | Year Ended August 31, |
| | 2017 | 2016 | 2015 | 2014 | 2013a |
Per Share Data ($): | | | | | | |
Net asset value, beginning of period | | 28.02 | 28.75 | 33.85 | 26.91 | 26.38 |
Investment Operations: | | | | | | |
Investment income—netb | | .16 | .33 | .18 | .19 | .02 |
Net realized and unrealized
gain (loss) on investments | | 3.86 | 1.48 | (.98) | 7.20 | .51 |
Total from Investment Operations | | 4.02 | 1.81 | (.80) | 7.39 | .53 |
Distributions: | | | | | | |
Dividends from
investment income—net | | (.42) | (.10) | (.27) | (.17) | - |
Dividends from net realized
gain on investments | | - | (2.44) | (4.03) | (.28) | - |
Total Distributions | | (.42) | (2.54) | (4.30) | (.45) | - |
Net asset value, end of period | | 31.62 | 28.02 | 28.75 | 33.85 | 26.91 |
Total Return (%) | | 14.39 | 6.71 | (2.43) | 27.69 | 2.01c |
Ratios/Supplemental Data (%): | | | | | | |
Ratio of total expenses
to average net assets | | .86 | .87 | .84 | .87 | .97d |
Ratio of net expenses
to average net assets | | .86 | .87 | .84 | .87 | .89d |
Ratio of net investment income
to average net assets | | .52 | 1.24 | .59 | .58 | .35d |
Portfolio Turnover Rate | | 63.25 | 71.27 | 78.09 | 74.66 | 57.54 |
Net Assets, end of period ($ x 1,000) | | 15,265 | 14,073 | 22,004 | 21,977 | 1 |
a From July 1, 2013 (commencement of initial offering) to August 31, 2013.
b Based on average shares outstanding.
c Not annualized.
d Annualized.
See notes to financial statements.
22
NOTES TO FINANCIAL STATEMENTS
NOTE 1—Significant Accounting Policies:
Dreyfus Structured Midcap Fund (the “fund”) is a separate diversified series of Advantage Funds, Inc. (the “Company”), which is registered under the Investment Company Act of 1940, as amended (the “Act”), as an open-end management investment company and operates as a series company currently offering nine series, including the fund. The fund’s investment objective is to seek long-term capital growth. The Dreyfus Corporation (the “Manager” or “Dreyfus”), a wholly-owned subsidiary of The Bank of New York Mellon Corporation (“BNY Mellon”), serves as the fund’s investment adviser. Mellon Capital Management Corporation (“Mellon Capital”), a wholly-owned subsidiary of Dreyfus, serves as the fund’s sub-investment adviser.
Effective March 31, 2017, the fund authorized the issuance of Class T shares, but, as of the date of this report, the fund did not offer Class T shares for purchase. The fund authorized 100 million Class T shares which resulted in the fund’s total authorized shares increasing from 600 million to 700 million.
MBSC Securities Corporation (the “Distributor”), a wholly-owned subsidiary of Dreyfus, is the distributor of the fund’s shares. The fund is authorized to issue 700 million shares of $.001 par value Common Stock. The fund currently has authorized five classes of shares: Class A (200 million shares authorized), Class C (100 million shares authorized), Class I (200 million shares authorized), Class T (100 million shares authorized) and Class Y (100 million shares authorized). Class A and Class T shares generally are subject to a sales charge imposed at the time of purchase. Class C shares are subject to a contingent deferred sales charge (“CDSC”) imposed on Class C shares redeemed within one year of purchase. Class I and Class Y shares are sold at net asset value per share generally to institutional investors. Other differences between the classes include the services offered to and the expenses borne by each class, the allocation of certain transfer agency costs, and certain voting rights. Income, expenses (other than expenses attributable to a specific class), and realized and unrealized gains or losses on investments are allocated to each class of shares based on its relative net assets.
The Company accounts separately for the assets, liabilities and operations of each series. Expenses directly attributable to each series are charged to that series’ operations; expenses which are applicable to all series are allocated among them on a pro rata basis.
The Financial Accounting Standards Board (“FASB”) Accounting Standards Codification is the exclusive reference of authoritative U.S.
23
NOTES TO FINANCIAL STATEMENTS (continued)
generally accepted accounting principles (“GAAP”) recognized by the FASB to be applied by nongovernmental entities. Rules and interpretive releases of the Securities and Exchange Commission (“SEC”) under authority of federal laws are also sources of authoritative GAAP for SEC registrants. The fund’s financial statements are prepared in accordance with GAAP, which may require the use of management estimates and assumptions. Actual results could differ from those estimates.
The Company enters into contracts that contain a variety of indemnifications. The fund’s maximum exposure under these arrangements is unknown. The fund does not anticipate recognizing any loss related to these arrangements.
(a) Portfolio valuation: The fair value of a financial instrument is the amount that would be received to sell an asset or paid to transfer a liability in an orderly transaction between market participants at the measurement date (i.e., the exit price). GAAP establishes a fair value hierarchy that prioritizes the inputs of valuation techniques used to measure fair value. This hierarchy gives the highest priority to unadjusted quoted prices in active markets for identical assets or liabilities (Level 1 measurements) and the lowest priority to unobservable inputs (Level 3 measurements).
Additionally, GAAP provides guidance on determining whether the volume and activity in a market has decreased significantly and whether such a decrease in activity results in transactions that are not orderly. GAAP requires enhanced disclosures around valuation inputs and techniques used during annual and interim periods.
Various inputs are used in determining the value of the fund’s investments relating to fair value measurements. These inputs are summarized in the three broad levels listed below:
Level 1—unadjusted quoted prices in active markets for identical investments.
Level 2—other significant observable inputs (including quoted prices for similar investments, interest rates, prepayment speeds, credit risk, etc.).
Level 3—significant unobservable inputs (including the fund’s own assumptions in determining the fair value of investments).
The inputs or methodology used for valuing securities are not necessarily an indication of the risk associated with investing in those securities.
24
Changes in valuation techniques may result in transfers in or out of an assigned level within the disclosure hierarchy. Valuation techniques used to value the fund’s investments are as follows:
Investments in securities are valued at the last sales price on the securities exchange or national securities market on which such securities are primarily traded. Securities listed on the National Market System for which market quotations are available are valued at the official closing price or, if there is no official closing price that day, at the last sales price. For open short positions, asked prices are used for valuation purposes. Bid price is used when no asked price is available. Registered investment companies that are not traded on an exchange are valued at their net asset value. All of the preceding securities are generally categorized within Level 1 of the fair value hierarchy.
Securities not listed on an exchange or the national securities market, or securities for which there were no transactions, are valued at the average of the most recent bid and asked prices. These securities are generally categorized within Level 2 of the fair value hierarchy.
Fair valuing of securities may be determined with the assistance of a pricing service using calculations based on indices of domestic securities and other appropriate indicators, such as prices of relevant American Depository Receipts and futures. Utilizing these techniques may result in transfers between Level 1 and Level 2 of the fair value hierarchy.
When market quotations or official closing prices are not readily available, or are determined not to reflect accurately fair value, such as when the value of a security has been significantly affected by events after the close of the exchange or market on which the security is principally traded (for example, a foreign exchange or market), but before the fund calculates its net asset value, the fund may value these investments at fair value as determined in accordance with the procedures approved by the Company’s Board of Directors (the “Board”). Certain factors may be considered when fair valuing investments such as: fundamental analytical data, the nature and duration of restrictions on disposition, an evaluation of the forces that influence the market in which the securities are purchased and sold, and public trading in similar securities of the issuer or comparable issuers. These securities are either categorized within Level 2 or 3 of the fair value hierarchy depending on the relevant inputs used.
For restricted securities where observable inputs are limited, assumptions about market activity and risk are used and are generally categorized within Level 3 of the fair value hierarchy.
25
NOTES TO FINANCIAL STATEMENTS (continued)
The following is a summary of the inputs used as of August 31, 2017 in valuing the fund’s investments:
| | | | | |
| | Level 1 - Unadjusted Quoted Prices | Level 2 - Other Significant Observable Inputs | Level 3 -Significant Unobservable Inputs | Total |
Assets ($) | | | | |
Investments in Securities: | | | |
Equity Securities - Domestic Common Stocks† | 203,153,106 | - | - | 203,153,106 |
Registered Investment Companies | 8,260,831 | - | - | 8,260,831 |
† See Statement of Investments for additional detailed categorizations.
At August 31, 2017, there were no transfers between levels of the fair value hierarchy.
(b) Securities transactions and investment income: Securities transactions are recorded on a trade date basis. Realized gains and losses from securities transactions are recorded on the identified cost basis. Dividend income is recognized on the ex-dividend date and interest income, including, where applicable, accretion of discount and amortization of premium on investments, is recognized on the accrual basis.
Pursuant to a securities lending agreement with The Bank of New York Mellon, a subsidiary of BNY Mellon and an affiliate of Dreyfus, the fund may lend securities to qualified institutions. It is the fund’s policy that, at origination, all loans are secured by collateral of at least 102% of the value of U.S. securities loaned and 105% of the value of foreign securities loaned. Collateral equivalent to at least 100% of the market value of securities on loan is maintained at all times. Collateral is either in the form of cash, which can be invested in certain money market mutual funds managed by Dreyfus, or U.S. Government and Agency securities. The fund is entitled to receive all dividends, interest and distributions on securities loaned, in addition to income earned as a result of the lending transaction. Should a borrower fail to return the securities in a timely manner, The Bank of New York Mellon is required to replace the securities for the benefit of the fund or credit the fund with the market value of the unreturned securities and is subrogated to the fund’s rights against the borrower and the collateral. Additionally, the contractual maturity of security lending transactions are on an overnight and continuous basis. During the period ended August 31, 2017, The Bank of New York Mellon
26
earned $9,376 from lending portfolio securities, pursuant to the securities lending agreement.
(c) Affiliated issuers: Investments in other investment companies advised by Dreyfus are defined as “affiliated” under the Act.
(d) Dividends and distributions to shareholders: Dividends and distributions are recorded on the ex-dividend date. Dividends from investment income-net and dividends from net realized capital gains, if any, are normally declared and paid annually, but the fund may make distributions on a more frequent basis to comply with the distribution requirements of the Internal Revenue Code of 1986, as amended (the “Code”). To the extent that net realized capital gains can be offset by capital loss carryovers, it is the policy of the fund not to distribute such gains. Income and capital gain distributions are determined in accordance with income tax regulations, which may differ from GAAP.
(e) Federal income taxes: It is the policy of the fund to continue to qualify as a regulated investment company, if such qualification is in the best interests of its shareholders, by complying with the applicable provisions of the Code, and to make distributions of taxable income sufficient to relieve it from substantially all federal income and excise taxes.
As of and during the period ended August 31, 2017, the fund did not have any liabilities for any uncertain tax positions. The fund recognizes interest and penalties, if any, related to uncertain tax positions as income tax expense in the Statement of Operations. During the period ended August 31, 2017, the fund did not incur any interest or penalties.
Each tax year in the four-year period ended August 31, 2017 remains subject to examination by the Internal Revenue Service and state taxing authorities.
At August 31, 2017, the components of accumulated earnings on a tax basis were as follows: undistributed ordinary income $329,940, undistributed capital gains $15,761,117 and unrealized appreciation $28,147,694.
The tax character of distributions paid to shareholders during the fiscal periods ended August 31, 2017 and August 31, 2016 were as follows: ordinary income $1,752,305 and $114,289, and long-term capital gains $0 and $19,824,167, respectively.
NOTE 2—Bank Lines of Credit:
The fund participates with other Dreyfus-managed funds in an $810 million unsecured credit facility led by Citibank, N.A. and a $300 million
27
NOTES TO FINANCIAL STATEMENTS (continued)
unsecured credit facility provided by The Bank of New York Mellon (each, a “Facility”), each to be utilized primarily for temporary or emergency purposes, including the financing of redemptions. Prior to October 5, 2016, the unsecured credit facility with Citibank, N.A. was $555 million. In connection therewith, the fund has agreed to pay its pro rata portion of commitment fees for each Facility. Interest is charged to the fund based on rates determined pursuant to the terms of the respective Facility at the time of borrowing.
The average amount of borrowings outstanding under the Facilities during the period ended August 31, 2017 was approximately $9,600 with a related weighted average annualized interest rate of 2.00%.
NOTE 3—Management Fee, Sub-Investment Advisory Fee and Other Transactions with Affiliates:
(a) Pursuant to a management agreement with Dreyfus, the management fee is computed at the annual rate of .75% of the value of the fund’s average daily net assets and is payable monthly. Dreyfus has contractually agreed, from September 1, 2016 through January 1, 2018, to waive receipt of its fees and/or assume the direct expenses of the fund, so that the expenses of none of the classes (excluding Rule 12b-1 Distribution Plan fees, Shareholder Services Plan fees, taxes, interest expense, brokerage commissions, commitment fees on borrowings and extraordinary expenses) exceed 1.00% of the value of the fund’s average daily net assets. The reduction in expenses, pursuant to the undertaking, amounted to $96,015 during the period ended August 31, 2017.
Pursuant to a sub-investment advisory agreement between Dreyfus and Mellon Capital, the sub-investment advisory fee is payable monthly by Dreyfus, and is based upon the value of the fund’s average daily net assets, computed at the following annual rates:
Average Net Assets
0 up to $100 million .25%
$100 million up to $1 billion .20%
$1 billion up to $1.5 billion .16%
In excess of $1.5 billion .10%
During the period ended August 31, 2017, the Distributor retained $7,823 from commissions earned on sales of the fund’s Class A shares and $2,806 from CDSCs on redemptions of the fund’s Class C shares.
(b) Under the Distribution Plan adopted pursuant to Rule 12b-1 under the Act, Class C shares pay the Distributor for distributing its shares at an annual rate of .75% of the value of its average daily net assets. During the
28
period ended August 31, 2017, Class C shares were charged $225,569 pursuant to the Distribution Plan.
(c) Under the Shareholder Services Plan, Class A and Class C shares pay the Distributor at an annual rate of .25% of the value of their average daily net assets for the provision of certain services. The services provided may include personal services relating to shareholder accounts, such as answering shareholder inquiries regarding the fund and providing reports and other information, and services related to the maintenance of shareholder accounts. The Distributor may make payments to Service Agents (securities dealers, financial institutions or other industry professionals) with respect to these services. The Distributor determines the amounts to be paid to Service Agents. During the period ended August 31, 2017, Class A and Class C shares were charged $257,520 and $75,190, respectively, pursuant to the Shareholder Services Plan.
The fund has arrangements with the transfer agent and the custodian whereby the fund may receive earnings credits when positive cash balances are maintained, which are used to offset transfer agency and custody fees. For financial reporting purposes, the fund includes net earnings credits as an expense offset in the Statement of Operations.
The fund compensates Dreyfus Transfer, Inc., a wholly-owned subsidiary of Dreyfus, under a transfer agency agreement for providing transfer agency and cash management services for the fund. The majority of transfer agency fees are comprised of amounts paid on a per account basis, while cash management fees are related to fund subscriptions and redemptions. During the period ended August 31, 2017, the fund was charged $50,672 for transfer agency services and $3,357 for cash management services. These fees are included in Shareholder servicing costs in the Statement of Operations. Cash management fees were partially offset by earnings credits of $3,305.
The fund compensates The Bank of New York Mellon under a custody agreement for providing custodial services for the fund. These fees are determined based on net assets, geographic region and transaction activity. During the period ended August 31, 2017, the fund was charged $22,172 pursuant to the custody agreement. These fees were partially offset by earnings credits of $170.
During the period ended August 31, 2017, the fund was charged $11,281 for services performed by the Chief Compliance Officer and his staff.
The components of “Due to The Dreyfus Corporation and affiliates” in the Statement of Assets and Liabilities consist of: management fees $129,366, Distribution Plan fees $16,143, Shareholder Services Plan fees
29
NOTES TO FINANCIAL STATEMENTS (continued)
$26,533, custodian fees $8,360, Chief Compliance Officer fees $4,670 and transfer agency fees $10,694, which are offset against an expense reimbursement currently in effect in the amount of $28,899.
(d) Each Board member also serves as a Board member of other funds within the Dreyfus complex. Annual retainer fees and attendance fees are allocated to each fund based on net assets.
NOTE 4—Securities Transactions:
The aggregate amount of purchases and sales of investment securities, excluding short-term securities, during the period ended August 31, 2017, amounted to $133,580,517 and $173,493,247, respectively.
At August 31, 2017, the cost of investments for federal income tax purposes was $183,266,243; accordingly, accumulated net unrealized appreciation on investments was $28,147,694, consisting of $34,178,070 gross unrealized appreciation and $6,030,376 gross unrealized depreciation.
30
REPORT OF INDEPENDENT REGISTERED
PUBLIC ACCOUNTING FIRM
Shareholders and Board of Directors
Dreyfus Structured Midcap Fund
We have audited the accompanying statement of assets and liabilities, including the statements of investments and investments in affiliated issuers, of Dreyfus Structured Midcap Fund (one of the series comprising Advantage Funds, Inc.) as of August 31, 2017, and the related statement of operations for the year then ended, the statement of changes in net assets for each of the two years in the period then ended, and the financial highlights for each of the five years in the period then ended. These financial statements and financial highlights are the responsibility of the Fund’s management. Our responsibility is to express an opinion on these financial statements and financial highlights based on our audits.
We conducted our audits in accordance with the standards of the Public Company Accounting Oversight Board (United States). Those standards require that we plan and perform the audit to obtain reasonable assurance about whether the financial statements and financial highlights are free of material misstatement. We were not engaged to perform an audit of the Fund’s internal control over financial reporting. Our audits included consideration of internal control over financial reporting as a basis for designing audit procedures that are appropriate in the circumstances, but not for the purpose of expressing an opinion on the effectiveness of the Fund’s internal control over financial reporting. Accordingly, we express no such opinion. An audit also includes examining, on a test basis, evidence supporting the amounts and disclosures in the financial statements and financial highlights, assessing the accounting principles used and significant estimates made by management, and evaluating the overall financial statement presentation. Our procedures included confirmation of securities owned as of August 31, 2017 by correspondence with the custodian and others. We believe that our audits provide a reasonable basis for our opinion.
In our opinion, the financial statements and financial highlights referred to above present fairly, in all material respects, the financial position of Dreyfus Structured Midcap Fund at August 31, 2017, the results of its operations for the year then ended, the changes in its net assets for each of the two years in the period then ended, and the financial highlights for each of the five years in the period then ended, in conformity with U.S. generally accepted accounting principles.

New York, New York
October 26, 2017
31
IMPORTANT TAX INFORMATION (Unaudited)
For federal tax purposes, the fund hereby reports 100% of the ordinary dividends paid during the fiscal year ended August 31, 2017 as qualifying for the corporate dividends received deduction. Also, certain dividends paid by the fund may be subject to a maximum tax rate of 15%, as provided for by the Jobs and Growth Tax Relief Reconciliation Act of 2003. Of the distributions paid during the fiscal year, $1,752,305 represents the maximum amount that may be considered qualified dividend income. Shareholders will receive notification in early 2018 of the percentage applicable to the preparation of their 2017 income tax returns.
32
INFORMATION ABOUT THE RENEWAL OF THE FUND’S MANAGEMENT AND SUB–INVESTMENT ADVISORY AGREEMENTS (Unaudited)
At a meeting of the fund’s Board of Directors held on March 9-10, 2017, the Board considered the renewal of the fund’s Management Agreement, pursuant to which Dreyfus provides the fund with investment advisory and administrative services (the “Agreement”), and the Sub-Investment Advisory Agreement (together, the “Agreements”), pursuant to which Mellon Capital Management Corporation (the “Subadviser”) provides day-to-day management of the fund’s investments. The Board members, none of whom are “interested persons” (as defined in the Investment Company Act of 1940, as amended) of the fund, were assisted in their review by independent legal counsel and met with counsel in executive session separate from representatives of Dreyfus and the Subadviser. In considering the renewal of the Agreements, the Board considered all factors that it believed to be relevant, including those discussed below. The Board did not identify any one factor as dispositive, and each Board member may have attributed different weights to the factors considered.
Analysis of Nature, Extent, and Quality of Services Provided to the Fund. The Board considered information provided to them at the meeting and in previous presentations from Dreyfus representatives regarding the nature, extent, and quality of the services provided to funds in the Dreyfus fund complex. Dreyfus provided the number of open accounts in the fund, the fund’s asset size and the allocation of fund assets among distribution channels. Dreyfus also had previously provided information regarding the diverse intermediary relationships and distribution channels of funds in the Dreyfus fund complex (such as retail direct or intermediary, in which intermediaries typically are paid by the fund and/or Dreyfus) and Dreyfus’ corresponding need for broad, deep, and diverse resources to be able to provide ongoing shareholder services to each intermediary or distribution channel, as applicable to the fund.
The Board also considered research support available to, and portfolio management capabilities of, the fund’s portfolio management personnel and that Dreyfus also provides oversight of day-to-day fund operations, including fund accounting and administration and assistance in meeting legal and regulatory requirements. The Board also considered Dreyfus’ extensive administrative, accounting and compliance infrastructures, as well as Dreyfus’ supervisory activities over the Subadviser. The Board also considered portfolio management’s brokerage policies and practices (including policies and practices regarding soft dollars) and the standards applied in seeking best execution.
Comparative Analysis of the Fund’s Performance and Management Fee and Expense Ratio. The Board reviewed reports prepared by Broadridge Financial Solutions, Inc. (“Broadridge”), an independent provider of investment company data, which included information comparing (1) the fund’s performance with the performance of a group of comparable funds (the “Performance Group”) and with a broader group of funds (the “Performance Universe”), all for various periods ended January 31, 2017, and (2) the fund’s actual and contractual management fees and total expenses with those of a group of comparable funds (the “Expense Group”) and with a broader group of funds (the
33
INFORMATION ABOUT THE RENEWAL OF THE FUND’S MANAGEMENT AND SUB–INVESTMENT ADVISORY AGREEMENTS (Unaudited) (continued)
“Expense Universe”), the information for which was derived in part from fund financial statements available to Broadridge as of the date of its analysis. Dreyfus previously had furnished the Board with a description of the methodology Broadridge used to select the Performance Group and Performance Universe and the Expense Group and Expense Universe.
Dreyfus representatives stated that the usefulness of performance comparisons may be affected by a number of factors, including different investment limitations that may be applicable to the fund and comparison funds. They also considered that performance generally should be considered over longer periods of time, although it is possible that long-term performance can be adversely affected by even one period of significant underperformance so that a single investment decision or theme has the ability to affect disproportionately long-term performance. The Board discussed with representatives of Dreyfus, its affiliates and/or the Sub-Adviser the results of the comparisons and considered that the fund’s total return performance was below the Performance Group median for all periods except for the three- and ten-year periods when it was below the median, and the fund’s performance was above the Performance Universe median for all periods except the one- and two-year periods when it was below the median. The Board considered the proximity of the fund’s performance to the Performance Group and/or Performance Universe median in certain periods when the fund’s performance was below median. Dreyfus also provided a comparison of the fund’s calendar year total returns to the returns of the fund’s benchmark index.
The Board also reviewed the range of actual and contractual management fees and total expenses of the Expense Group and Expense Universe funds and discussed the results of the comparisons. The Board considered that the fund’s contractual management fee was below the Expense Group median, the fund’s actual management fee was below the Expense Group and Expense Universe medians and the fund’s total expenses were below the Expense Group median and slightly above the Expense Universe median.
Dreyfus representatives stated that Dreyfus has contractually agreed to waive receipt of its fees and/or assume the expenses of the fund, until January 1, 2018, so that annual direct fund operating expenses (excluding Rule 12b-1 fees, shareholder services fees, taxes, interest, brokerage commissions, commitment fees on borrowings and extraordinary expenses) do not exceed 1.00% of the fund’s average daily net assets.
Dreyfus representatives reviewed with the Board the management or investment advisory fees (1) paid by funds advised or administered by Dreyfus that are in the same Broadridge category as the fund and (2) paid to Dreyfus or the Subadviser or its affiliates for advising any separate accounts and/or other types of client portfolios that are considered to have similar investment strategies and policies as the fund (the “Similar Clients”), and explained the nature of the Similar Clients. They discussed differences in fees paid and the relationship of the fees paid in light of any differences in the services provided and other relevant factors. The Board considered the relevance of the fee information provided for the Similar Clients to evaluate the appropriateness of the fund’s management fee.
34
The Board considered the fee to the Subadviser in relation to the fee paid to Dreyfus by the fund and the respective services provided by the Subadviser and Dreyfus. The Board also took into consideration that the Subadviser’s fee is paid by Dreyfus (out of its fee from the fund) and not the fund.
Analysis of Profitability and Economies of Scale. Dreyfus representatives reviewed the expenses allocated and profit received by Dreyfus and its affiliates and the resulting profitability percentage for managing the fund and the aggregate profitability percentage to Dreyfus and its affiliates for managing the funds in the Dreyfus fund complex, and the method used to determine the expenses and profit. The Board concluded that the profitability results were not unreasonable, given the services rendered and service levels provided by Dreyfus. The Board also had been provided with information prepared by an independent consulting firm regarding Dreyfus’ approach to allocating costs to, and determining the profitability of, individual funds and the entire Dreyfus fund complex. The consulting firm also had analyzed where any economies of scale might emerge in connection with the management of a fund.
The Board considered on the advice of its counsel the profitability analysis (1) as part of its evaluation of whether the fees under the Agreements, considered in relation to the mix of services provided by Dreyfus and the Subadviser, including the nature, extent and quality of such services, supported the renewal of the Agreements and (2) in light of the relevant circumstances for the fund and the extent to which economies of scale would be realized if the fund grows and whether fee levels reflect these economies of scale for the benefit of fund shareholders. Since Dreyfus, and not the fund, pays the Subadviser pursuant to the Sub-Investment Advisory Agreement, the Board did not consider the Subadviser’s profitability to be relevant to its deliberations. Dreyfus representatives stated that a discussion of economies of scale is predicated on a fund having achieved a substantial size with increasing assets and that, if a fund’s assets had been stable or decreasing, the possibility that Dreyfus may have realized any economies of scale would be less. Dreyfus representatives also stated that, as a result of shared and allocated costs among funds in the Dreyfus fund complex, the extent of economies of scale could depend substantially on the level of assets in the complex as a whole, so that increases and decreases in complex-wide assets can affect potential economies of scale in a manner that is disproportionate to, or even in the opposite direction from, changes in the fund’s asset level. The Board also considered potential benefits to Dreyfus and the Subadviser from acting as investment adviser and sub-investment adviser, respectively, and took into consideration the soft dollar arrangements in effect for trading the fund’s investments.
At the conclusion of these discussions, the Board agreed that it had been furnished with sufficient information to make an informed business decision with respect to the renewal of the Agreements. Based on the discussions and considerations as described above, the Board concluded and determined as follows.
35
INFORMATION ABOUT THE RENEWAL OF THE FUND’S MANAGEMENT AND SUB–INVESTMENT ADVISORY AGREEMENTS (Unaudited) (continued)
· The Board concluded that the nature, extent and quality of the services provided by Dreyfus and the Subadviser are adequate and appropriate.
· The Board expressed concern with the fund’s performance in recent periods and agreed to closely monitor performance.
· The Board concluded that the fees paid to Dreyfus and the Subadviser supported the renewal of the Agreements in light of the considerations described above.
· The Board determined that the economies of scale which may accrue to Dreyfus and its affiliates in connection with the management of the fund had been adequately considered by Dreyfus in connection with the fee rate charged to the fund pursuant to the Agreement and that, to the extent in the future it were determined that material economies of scale had not been shared with the fund, the Board would seek to have those economies of scale shared with the fund.
In evaluating the Agreements, the Board considered these conclusions and determinations and also relied on its previous knowledge, gained through meetings and other interactions with Dreyfus and its affiliates and the Subadviser, of Dreyfus and the Subadviser and the services provided to the fund by Dreyfus and the Subadviser. The Board also relied on information received on a routine and regular basis throughout the year relating to the operations of the fund and the investment management and other services provided under the Agreements, including information on the investment performance of the fund in comparison to similar mutual funds and benchmark performance indices; general market outlook as applicable to the fund; and compliance reports. In addition, the Board’s consideration of the contractual fee arrangements for this fund had the benefit of a number of years of reviews of the Agreements for the fund, or substantially similar agreements for other Dreyfus funds that the Board oversees, during which lengthy discussions took place between the Board and Dreyfus representatives. Certain aspects of the arrangements may receive greater scrutiny in some years than in others, and the Board’s conclusions may be based, in part, on their consideration of the fund’s arrangements, or substantially similar arrangements for other Dreyfus funds that the Board oversees, in prior years. The Board determined to renew the Agreements.
36
BOARD MEMBERS INFORMATION (Unaudited)
INDEPENDENT BOARD MEMBERS
Joseph S. DiMartino (73)
Chairman of the Board (1995)
Principal Occupation During Past 5 Years:
· Corporate Director and Trustee (1995-present)
Other Public Company Board Memberships During Past 5 Years:
· CBIZ (formerly, Century Business Services, Inc.), a provider of outsourcing functions for small and medium size companies, Director (1997-present)
No. of Portfolios for which Board Member Serves: 130
———————
Peggy C. Davis (74)
Board Member (2006)
Principal Occupation During Past 5 Years:
· Shad Professor of Law, New York University School of Law (1983-present)
No. of Portfolios for which Board Member Serves: 47
———————
David P. Feldman (77)
Board Member (1996)
Principal Occupation During Past 5 Years:
· Corporate Director and Trustee (1985-present)
Other Public Company Board Memberships During Past 5 Years:
· BBH Mutual Funds Group (5 registered mutual funds), Director (1992-2014)
No. of Portfolios for which Board Member Serves: 33
———————
Joan Gulley (69)
Board Member (2017)
Principal Occupation During Past 5 Years:
· PNC Financial Services Group, Inc.(1993-2014)
· Executive Vice President and Chief Human Resources Officer and Executive Committee Member (2008-2014)
No. of Portfolios for which Board Member Serves: 33
———————
37
BOARD MEMBERS INFORMATION (Unaudited) (continued)
INDEPENDENT BOARD MEMBERS (continued)
Ehud Houminer (77)
Board Member (1993)
Principal Occupation During Past 5 Years:
· Board of Overseers at the Columbia Business School, Columbia University (1992-present)
· Trustee, Ben Gurion University
Other Public Company Board Memberships During Past 5 Years:
· Avnet, Inc., an electronics distributor, Director (1993-2012)
No. of Portfolios for which Board Member Serves: 54
———————
Lynn Martin (77)
Board Member (2012)
Principal Occupation During Past 5 Years:
· President of The Martin Hall Group LLC, a human resources consulting firm (2005-2012)
Other Public Company Board Memberships During Past 5 Years:
· AT&T, Inc., a telecommunications company, Director (1999-2012)
· Ryder System, Inc., a supply chain and transportation management company, Director (1993-2012)
No. of Portfolios for which Board Member Serves: 33
———————
Robin A. Melvin (53)
Board Member (2012)
Principal Occupation During Past 5 Years:
· Co-chairman, Illinois Mentoring Partnership, non-profit organization dedicated to increasing the quantity and quality of mentoring services in Illinois; (2014-present; board member since 2013)
· Director, Boisi Family Foundation, a private family foundation that supports youth-serving organizations that promote the self sufficiency of youth from disadvantaged circumstances (1995-2012)
No. of Portfolios for which Board Member Serves: 102
———————
38
Dr. Martin Peretz (78)
Board Member (2006)
Principal Occupation During Past 5 Years:
· Editor-in-Chief Emeritus of The New Republic Magazine (2011-2012) (previously,
Editor-in-Chief, 1974-2011)
· Lecturer at Harvard University (1969-2012)
No. of Portfolios for which Board Member Serves: 33
———————
Once elected all Board Members serve for an indefinite term, but achieve Emeritus status upon reaching age 80. The address of the Board Members and Officers is c/o The Dreyfus Corporation, 200 Park Avenue, New York, New York 10166. Additional information about the Board Members is available in the fund’s Statement of Additional Information which can be obtained from Dreyfus free of charge by calling this toll free number: 1-800-DREYFUS.
James F. Henry, Emeritus Board Member
Philip L. Toia, Emeritus Board Member
39
OFFICERS OF THE FUND (Unaudited)
BRADLEY J. SKAPYAK, President since January 2010.
Chief Operating Officer and a director of the Manager since June 2009, Chairman of Dreyfus Transfer, Inc., an affiliate of the Manager and the transfer agent of the funds, since May 2011 and Chief Executive Officer of MBSC Securities Corporation since August 2016. He is an officer of 63 investment companies (comprised of 130 portfolios) managed by the Manager. He is 58 years old and has been an employee of the Manager since February 1988.
BENNETT A. MACDOUGALL, Chief Legal Officer since October 2015.
Chief Legal Officer of the Manager and Associate General Counsel and Managing Director of BNY Mellon since June 2015; from June 2005 to June 2015, he served in various capacities with Deutsche Bank – Asset & Wealth Management Division, including as Director and Associate General Counsel, and Chief Legal Officer of Deutsche Investment Management Americas Inc. from June 2012 to May 2015. He is an officer of 64 investment companies (comprised of 155 portfolios) managed by the Manager. He is 45 years old and has been an employee of the Manager since June 2015.
JANETTE E. FARRAGHER, Vice President and Secretary since December 2011.
Associate General Counsel of BNY Mellon, and an officer of 64 investment companies (comprised of 155 portfolios) managed by the Manager. She is 54 years old and has been an employee of the Manager since February 1984.
JAMES BITETTO, Vice President and Assistant Secretary since August 2005.
Managing Counsel of BNY Mellon and Secretary of the Manager, and an officer of 64 investment companies (comprised of 155 portfolios) managed by the Manager. He is 51 years old and has been an employee of the Manager since December 1996.
JOSEPH M. CHIOFFI, Vice President and Assistant Secretary since August 2005.
Managing Counsel of BNY Mellon, and an officer of 64 investment companies (comprised of 155 portfolios) managed by the Manager. He is 55 years old and has been an employee of the Manager since June 2000.
MAUREEN E. KANE, Vice President and Assistant Secretary since April 2015.
Managing Counsel of BNY Mellon since July 2014; from October 2004 until July 2014, General Counsel, and from May 2009 until July 2014, Chief Compliance Officer of Century Capital Management. She is an officer of 64 investment companies (comprised of 155 portfolios) managed by the Manager. She is 55 years old and has been an employee of the Manager since July 2014.
SARAH S. KELLEHER, Vice President and Assistant Secretary since April 2014.
Senior Counsel of BNY Mellon since March 2013, from August 2005 to March 2013, Associate General Counsel of Third Avenue Management. She is an officer of 64 investment companies (comprised of 155 portfolios) managed by the Manager. She is 41 years old and has been an employee of the Manager since March 2013.
JEFF PRUSNOFSKY, Vice President and Assistant Secretary since August 2005.
Senior Managing Counsel of BNY Mellon, and an officer of 64 investment companies (comprised of 155 portfolios) managed by the Manager. He is 52 years old and has been an employee of the Manager since October 1990.
NATALYA ZELENSKY, Vice President and Assistant Secretary since March 2017.
Counsel and Vice President of BNY Mellon since May 2016; Attorney at Wildermuth Endowment Strategy Fund/Wildermuth Advisory, LLC from November 2015 until May 2016; Assistant General Counsel at RCS Advisory Services from July 2014 until November 2015; Associate at Sutherland, Asbill & Brennan from January 2013 until January 2014; Associate at K&L Gates from October 2011 until January 2013. She is an officer of 64 investment companies (comprised of 155 portfolios) managed by Dreyfus. She is 32 years old and has been an employee of the Manager since May 2016.
JAMES WINDELS, Treasurer since November 2001.
Director – Mutual Fund Accounting of the Manager, and an officer of 64 investment companies (comprised of 155 portfolios) managed by the Manager. He is 58 years old and has been an employee of the Manager since April 1985.
40
RICHARD CASSARO, Assistant Treasurer since January 2008.
Senior Accounting Manager – Money Market and Municipal Bond Funds of the Manager, and an officer of 64 investment companies (comprised of 155 portfolios) managed by the Manager. He is 58 years old and has been an employee of the Manager since September 1982.
GAVIN C. REILLY, Assistant Treasurer since December 2005.
Tax Manager of the Investment Accounting and Support Department of the Manager, and an officer of 64 investment companies (comprised of 155 portfolios) managed by the Manager. He is 49 years old and has been an employee of the Manager since April 1991.
ROBERT S. ROBOL, Assistant Treasurer since August 2005.
Senior Accounting Manager – Dreyfus Financial Reporting of the Manager, and an officer of 64 investment companies (comprised of 155 portfolios) managed by the Manager. He is 53 years old and has been an employee of the Manager since October 1988.
ROBERT SALVIOLO, Assistant Treasurer since July 2007.
Senior Accounting Manager – Equity Funds of the Manager, and an officer of 64 investment companies (comprised of 155 portfolios) managed by the Manager. He is 50 years old and has been an employee of the Manager since June 1989.
ROBERT SVAGNA, Assistant Treasurer since December 2002.
Senior Accounting Manager – Fixed Income and Equity Funds of the Manager, and an officer of 64 investment companies (comprised of 155 portfolios) managed by the Manager. He is 50 years old and has been an employee of the Manager since November 1990.
JOSEPH W. CONNOLLY, Chief Compliance Officer since October 2004.
Chief Compliance Officer of the Manager and The Dreyfus Family of Funds (64 investment companies, comprised of 155 portfolios). He is 60 years old and has served in various capacities with the Manager since 1980, including manager of the firm’s Fund Accounting Department from 1997 through October 2001.
CARIDAD M. CAROSELLA, Anti-Money Laundering Compliance Officer since January 2016.
Anti-Money Laundering Compliance Officer of the Dreyfus Family of Funds and BNY Mellon Funds Trust since January 2016; from May 2015 to December 2015, Interim Anti-Money Laundering Compliance Officer of the Dreyfus Family of Funds and BNY Mellon Funds Trust and the Distributor; from January 2012 to May 2015, AML Surveillance Officer of the Distributor and from 2007 to December 2011, Financial Processing Manager of the Distributor. She is an officer of 59 investment companies (comprised of 150 portfolios) managed by the Manager. She is 49 years old and has been an employee of the Distributor since 1997.
41
Dreyfus Structured Midcap Fund
200 Park Avenue
New York, NY 10166
Manager
The Dreyfus Corporation
200 Park Avenue
New York, NY 10166
Sub-Investment Adviser
Mellon Capital Management
Corporation
50 Fremont Street, Suite 3900
San Francisco, CA 94105
Custodian
The Bank of New York Mellon
225 Liberty Street
New York, NY 10286
Transfer Agent &
Dividend Disbursing Agent
Dreyfus Transfer, Inc.
200 Park Avenue
New York, NY 10166
Distributor
MBSC Securities Corporation
200 Park Avenue
New York, NY 10166
| | |
Ticker Symbols: Class A: DPSAX Class C: DPSCX Class I: DPSRX Class Y: DPSYX |
Telephone Call your financial representative or 1-800-DREYFUS
Mail The Dreyfus Family of Funds, 144 Glenn Curtiss Boulevard, Uniondale, NY 11556-0144
E-mail Send your request to info@dreyfus.com
Internet Information can be viewed online or downloaded at www.dreyfus.com
The fund files its complete schedule of portfolio holdings with the Securities and Exchange Commission (“SEC”) for the first and third quarters of each fiscal year on Form N-Q. The fund’s Forms N-Q are available on the SEC’s website at www.sec.gov and may be reviewed and copied at the SEC’s Public Reference Room in Washington, D.C. (phone 1-800-SEC-0330 for information).
A description of the policies and procedures that the fund uses to determine how to vote proxies relating to portfolio securities and information regarding how the fund voted these proxies for the most recent 12-month period ended June 30 is available at www.dreyfus.com and on the SEC’s website at www.sec.gov and without charge, upon request, by calling 1-800-DREYFUS.
| | |
© 2017 MBSC Securities Corporation
0936AR0817 | 
|
Dreyfus Technology Growth Fund
| | | |

| | ANNUAL REPORT
August 31, 2017 |
| |
Save time. Save paper. View your next shareholder report online as soon as it’s available. Log into www.dreyfus.com and sign up for Dreyfus eCommunications. It’s simple and only takes a few minutes. |
| |
The views expressed in this report reflect those of the portfolio manager(s) only through the end of the period covered and do not necessarily represent the views of Dreyfus or any other person in the Dreyfus organization. Any such views are subject to change at any time based upon market or other conditions and Dreyfus disclaims any responsibility to update such views. These views may not be relied on as investment advice and, because investment decisions for a Dreyfus fund are based on numerous factors, may not be relied on as an indication of trading intent on behalf of any Dreyfus fund. |
| |
Not FDIC-Insured • Not Bank-Guaranteed • May Lose Value |
Contents
THE FUND
FOR MORE INFORMATION
Back Cover
| | | | |
| |
Dreyfus Technology Growth Fund
| | The Fund |
A LETTER FROM THE CEO OF DREYFUS
Dear Shareholder:
We are pleased to present this annual report for Dreyfus Technology Growth Fund, covering the 12-month period from September 1, 2016 through August 31, 2017. For information about how the fund performed during the reporting period, as well as general market perspectives, we provide a Discussion of Fund Performance on the pages that follow.
Stocks set a series of new record highs and bonds produced mixed results over the past year in response to changing economic and political conditions. Financial markets during the final months of 2016 were dominated by the election of a new U.S. presidential administration. Equities surged higher in anticipation of more business-friendly regulatory, tax, and fiscal policies, but high-quality bonds generally lost value due to expectations of rising interest rates and accelerating inflation in a stronger economy. Despite a series of short-term interest-rate hikes, bonds recovered over the first eight months of 2017 when it became clearer that major tax and fiscal reforms would take time and political capital to enact. Stocks continued to rally, led by large growth-oriented companies, as corporate earnings grew and global economic conditions improved.
The markets’ recent strong performance has been supported by solid underlying fundamentals. While we currently expect these favorable conditions to persist, we remain watchful for economic and political developments that could derail the rallies. As always, we encourage you to discuss the risks and opportunities of today’s investment environment with your financial advisor.
Thank you for your continued confidence and support.
Sincerely,

Mark D. Santero
Chief Executive Officer
The Dreyfus Corporation
September 15, 2017
2
DISCUSSION OF FUND PERFORMANCE
For the period from September 1, 2016 through August 31, 2017, as provided by Barry K. Mills, CFA, Matthew Griffin, Erik Swords, and Elizabeth Slover, Portfolio Managers
Market and Fund Performance Overview
For the 12-month period ended August 31, 2017, Dreyfus Technology Growth Fund’s Class A shares produced a total return of 28.34%, Class C shares returned 27.30%, and Class I shares returned 28.69%. Between their inception on September 30, 2016 and August 31, 2017, the fund’s Class Y shares produced a total return of 28.63%.1 In comparison, the fund’s benchmarks, the Morgan Stanley High-Technology 35 Index (the “MS High Tech 35 Index”) and the S&P 500® Index, produced total returns of 33.56% and 16.22%, respectively, over the 12-month period.2,3
U.S. equities posted strong gains during the reporting period, with technology stocks leading the market’s rise. While the fund’s focus on technology stocks positioned it to outperform the broader market, as represented by the S&P 500® Index, overweighted exposure to the lagging software industry and a few disappointing individual stock selections in other areas caused its performance to trail the MS High Tech 35 Index.
The Fund’s Investment Approach
The fund seeks capital appreciation. To pursue its goal, the fund normally invests at least 80% of its net assets, plus any borrowings for investment purposes, in the stocks of growth companies of any size that Dreyfus believes to be leading producers or beneficiaries of technological innovation. Up to 25% of the fund’s assets may be invested in foreign securities. In choosing stocks, the fund looks for technology companies with the potential for strong earnings or revenue growth rates. The fund’s investment process centers on a multidimensional approach that looks for opportunities across emerging growth, cyclical or stable growth companies.
Information Technology Stocks Led Broader Market Higher
U.S. stocks moved lower in the weeks leading up to the 2016 presidential election amid political uncertainty and expectations that the Federal Reserve Board would raise short-term interest rates before the end of the year. However, the election’s unexpected outcome reenergized equity markets as investors began to anticipate lower corporate taxes, reduced regulatory constraints on business, and increased infrastructure spending. Encouraging economic data, including a declining unemployment rate, further bolstered investor confidence, driving the S&P 500 Index to a series of new highs.
During the second half of the reporting period, concerns arose regarding the new U.S. presidential administration’s ability to implement its business-friendly policy proposals. As a result, market sentiment shifted from favoring financial companies, which were perceived as leveraged to federal policy changes, to technology companies, where growth was seen as fueled by innovation. Information technology stocks led the market’s continued advance over the remainder of the reporting period, bolstered by ongoing secular growth trends, positive macroeconomic data, and the weakening of the U.S. dollar compared to most other currencies.
Software Holdings Underperformed
The fund’s stock selections and overweighted exposure to the software industry, which lagged other areas of the information technology sector in late 2016, undermined returns compared to the MS High Tech 35 Index. Most notably, corporate data analysis company Splunk lost value after reporting weak quarterly revenues; data delivery and networking company Citrix Systems
3
DISCUSSION OF FUND PERFORMANCE (continued)
gave back some of its earlier gains after posting a decline in year-over-year sales during the second quarter of 2017; and business management application developer Workday suffered after announcing a relatively weak business outlook. Other software holdings that detracted from relative results included database giant Oracle, which was undermined by the slow pace of the company’s migration to cloud computing, and operating system and application developer Microsoft, which advanced steadily but failed to keep pace with the sector’s rapid rise. Among Internet-related holdings, the fund benefited from its investment in Chinese online advertising firm Tencent Holdings but suffered from lack of exposure to Chinese mobile commerce company Alibaba Group Holding, which rose more sharply.
On the other hand, our security selection strategy in other areas contributed positively to the fund’s relative performance. Among semiconductor makers, the fund avoided Qualcomm, which lagged, focusing instead on some of the industry’s top performers, such as Microchip Technology and NVIDIA. In the hardware segment, the fund’s relative performance benefited from investments in companies such as digital storage company Western Digital and consumer products maker Apple. The fund’s strong relative returns compared to the S&P 500 Index were further supported by exposure to high-flying semiconductor equipment makers, such as Applied Materials and Lam Research, and automotive technology companies, such as Tesla Motors.
Positive Spending Trends in Technology
We believe that information technology stocks are well positioned to continue to gain value as the economy grows. Indeed, in our judgment, the information technology sector is better positioned than many other market segments in today’s environment of uncertain federal tax policy, interest rates, and oil prices, three key challenges currently facing investors. The fund is focused on fast-growing industries that appear poised to benefit from innovations in the areas of social media, artificial intelligence, software as a service, cloud computing, and autonomous vehicles.
September 15, 2017
1 Total return includes reinvestment of dividends and any capital gains paid, and does not take into consideration the maximum initial sales charge in the case of Class A shares, or the applicable contingent deferred sales charge imposed on redemptions in the case of Class C shares. Had these charges been reflected, returns would have been lower. Past performance is no guarantee of future results. Share price, yield, and investment return fluctuate such that upon redemption, fund shares may be worth more or less than their original cost.
2 Source: Bloomberg L.P. — The Morgan Stanley High-Technology 35 Index is an equal dollar-weighted index that measures the performance of 35 stocks from 9 technology subsectors. Investors cannot invest directly in any index.
3 Source: Lipper Inc. — The S&P 500® Index is widely regarded as the best single gauge of large-cap U.S. equities. The index includes 500 leading companies and captures approximately 80% coverage of available market capitalization. Investors cannot invest directly in any index.
Please note: the position in any security highlighted with italicized typeface was sold during the reporting period.
Equities are subject generally to market, market sector, market liquidity, issuer, and investment style risks, among other factors, to varying degrees, all of which are more fully described in the fund’s prospectus.
The technology sector has been among the most volatile sectors of the stock market. Technology companies involve greater risk because their revenue and/or earnings tend to be less predictable, and some companies may be experiencing significant losses.
4
FUND PERFORMANCE
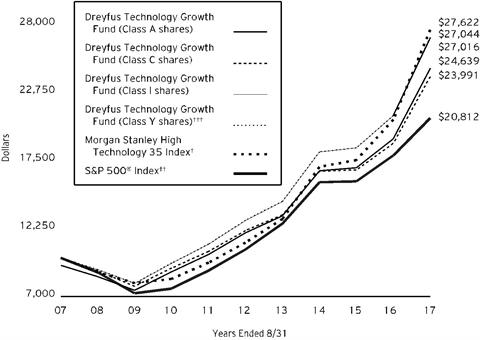
Comparison of change in value of $10,000 investment in Dreyfus Technology Growth Fund Class A shares, Class C shares, Class I shares and Class Y shares and the Morgan Stanley High-Technology 35 Index and S&P 500® Index
†Source: Bloomberg L.P.
††Source: Lipper Inc.
†††The total return figures presented for Class Y shares of the fund reflect the performance of the fund’s Class I shares for the period prior to 9/30/16 (the inception date for Class Y shares).
Past performance is not predictive of future performance.
The above graph compares a $10,000 investment made in each of the Class A, Class C, Class I and Class Y shares of Dreyfus Technology Growth Fund on 8/31/07 to a $10,000 investment made in each of the S&P 500® Index and the Morgan Stanley High-Technology 35 Index on that date. All dividends and capital gain distributions are reinvested.
The fund’s performance shown in the line graph above takes into account the maximum initial sales charge on Class A shares and all other applicable fees and expenses on all classes. The S&P 500® Index is widely regarded as the best single gauge of large-cap U.S. equities. The index includes 500 leading companies and captures approximately 80% coverage of available market capitalization. The Morgan Stanley High-Technology 35 Index is an equal dollar-weighted index that measures the performance of 35 stocks from 9 technology subsectors. Unlike a mutual fund, the indices are not subject to charges, fees and other expenses. Investors cannot invest directly in any index. Further information relating to fund performance, including expense reimbursements, if applicable, is contained in the Financial Highlights section of the prospectus and elsewhere in this report.
5
FUND PERFORMANCE (continued)
| | | | | |
Average Annual Total Returns as of 8/31/17 |
| | Inception Date | 1 Year | 5 Years | 10 Years |
Class A shares | | | | |
with maximum sales charge (5.75%) | 10/13/1997 | 20.95% | 14.25% | 9.44% |
without sales charge | 10/13/1997 | 28.34% | 15.62% | 10.09% |
Class C shares | | | | |
with applicable redemption charge† | 4/15/1999 | 26.30% | 14.67% | 9.15% |
without redemption | 4/15/1999 | 27.30% | 14.67% | 9.15% |
Class I shares | 4/15/1999 | 28.69% | 15.91% | 10.45% |
Class Y shares | 9/30/2016 | 28.83%†† | 15.94%†† | 10.46%†† |
Morgan Stanley High
Technology 35 Index | | 33.56% | 19.80% | 10.69% |
S&Poor 500® Index | | 16.22% | 14.33% | 7.60% |
†The maximum contingent deferred sales charge for Class C shares is 1% for shares redeemed within one year of the date of purchase.
†† The total return performance figures presented for Class Y shares of the fund reflect the performance of the fund’s Class I shares for the period prior to 9/30/16 (the inc/eption date for Class Y shares).
The performance data quoted represents past performance, which is no guarantee of future results. Share price and investment return fluctuate and an investor’s shares may be worth more or less than original cost upon redemption. Current performance may be lower or higher than the performance quoted. Go to Dreyfus.com for the fund’s most recent month-end returns.
The fund’s performance shown in the graph and table does not reflect the deduction of taxes that a shareholder would pay on fund distributions or the redemption of fund shares. In addition to the performance of Class A shares shown with and without a maximum sales charge, the fund’s performance shown in the table takes into account all other applicable fees and expenses on all classes.
6
UNDERSTANDING YOUR FUND’S EXPENSES (Unaudited)
As a mutual fund investor, you pay ongoing expenses, such as management fees and other expenses. Using the information below, you can estimate how these expenses affect your investment and compare them with the expenses of other funds. You also may pay one-time transaction expenses, including sales charges (loads) and redemption fees, which are not shown in this section and would have resulted in higher total expenses. For more information, see your fund’s prospectus or talk to your financial adviser.
Review your fund’s expenses
The table below shows the expenses you would have paid on a $1,000 investment in Dreyfus Technology Growth Fund from March 1, 2017 to August 31, 2017. It also shows how much a $1,000 investment would be worth at the close of the period, assuming actual returns and expenses.
| | | | | | | | | | | | | | | |
Expenses and Value of a $1,000 Investment |
assuming actual returns for the six months ended August 31, 2017 |
| | | | | | | | | | | |
| | | | Class A | Class C | Class I | Class Y |
Expenses paid per $1,000† | | $6.81 | | $11.17 | | $5.38 | | $4.67 |
Ending value (after expenses) | | $1,177.90 | | $1,173.00 | | $1,179.20 | | $1,179.80 |
COMPARING YOUR FUND’S EXPENSES
WITH THOSE OF OTHER FUNDS (Unaudited)
Using the SEC’s method to compare expenses
The Securities and Exchange Commission (SEC) has established guidelines to help investors assess fund expenses. Per these guidelines, the table below shows your fund’s expenses based on a $1,000 investment, assuming a hypothetical 5% annualized return. You can use this information to compare the ongoing expenses (but not transaction expenses or total cost) of investing in the fund with those of other funds. All mutual fund shareholder reports will provide this information to help you make this comparison. Please note that you cannot use this information to estimate your actual ending account balance and expenses paid during the period.
| | | | | | | | | | | | | | | |
Expenses and Value of a $1,000 Investment |
assuming a hypothetical 5% annualized return for the six months ended August 31, 2017 |
| | | | | | | | | | | |
| | | | Class A | Class C | Class I | Class Y |
Expenses paid per $1,000† | | $6.31 | | $10.36 | | $4.99 | | $4.33 |
Ending value (after expenses) | | $1,018.95 | | $1,014.92 | | $1,020.27 | | $1,020.92 |
† Expenses are equal to the fund’s annualized expense ratio of 1.24% for Class A, 2.04% for Class C, .98% for Class I and .85% for Class Y, multiplied by the average account value over the period, multiplied by 184/365 (to reflect the one-half year period).
7
STATEMENT OF INVESTMENTS
August 31, 2017
| | | | | | | | |
| |
Description | | | | Shares | | Value ($) | |
Common Stocks - 98.7% | | | | | |
Communications Equipment - 10.3% | | | | | |
Apple | | | | 106,741 | | 17,505,524 | |
Arista Networks | | | | 21,755 | a,b | 3,832,143 | |
Cisco Systems | | | | 266,843 | | 8,595,013 | |
| | | | | 29,932,680 | |
Electronic Equipment & Instruments - 7.2% | | | | | |
Amphenol, Cl. A | | | | 67,809 | | 5,488,461 | |
Corning | | | | 278,460 | | 8,008,510 | |
Tesla | | | | 21,051 | a,b | 7,492,051 | |
| | | | | 20,989,022 | |
Internet & Catalog Retail - 11.4% | | | | | |
Amazon.com | | | | 13,554 | b | 13,291,052 | |
Netflix | | | | 55,795 | b | 9,747,945 | |
Priceline Group | | | | 5,325 | b | 9,862,326 | |
| | | | | 32,901,323 | |
Internet Software & Services - 15.2% | | | | | |
Alphabet, Cl. A | | | | 4,463 | b | 4,263,236 | |
Alphabet, Cl. C | | | | 13,358 | b | 12,547,570 | |
Facebook, Cl. A | | | | 74,884 | b | 12,877,802 | |
Splunk | | | | 90,233 | a,b | 6,053,732 | |
Tencent Holdings | | | | 195,000 | | 8,285,835 | |
| | | | | 44,028,175 | |
IT Services - 3.8% | | | | | |
Visa, Cl. A | | | | 106,097 | a | 10,983,161 | |
Media - 2.2% | | | | | |
Charter Communications, Cl. A | | | | 16,138 | b | 6,431,639 | |
Semiconductors & Semiconductor Equipment - 17.4% | | | | | |
Applied Materials | | | | 190,686 | | 8,603,752 | |
Broadcom | | | | 45,410 | | 11,446,499 | |
Lam Research | | | | 55,439 | | 9,201,765 | |
Microchip Technology | | | | 69,253 | a | 6,011,160 | |
NVIDIA | | | | 47,101 | | 7,980,793 | |
Texas Instruments | | | | 88,342 | | 7,316,484 | |
| | | | | 50,560,453 | |
Software - 15.6% | | | | | |
Adobe Systems | | | | 65,456 | b | 10,156,153 | |
Citrix Systems | | | | 66,859 | b | 5,229,042 | |
8
| | | | | | | | |
| |
Description | | | | Shares | | Value ($) | |
Common Stocks - 98.7% (continued) | | | | | |
Software - 15.6% (continued) | | | | | |
Oracle | | | | 222,789 | | 11,212,970 | |
salesforce.com | | | | 110,065 | b | 10,510,107 | |
ServiceNow | | | | 69,809 | b | 8,111,108 | |
| | | | | 45,219,380 | |
Software & Services - 15.6% | | | | | |
Activision Blizzard | | | | 92,311 | | 6,051,909 | |
eBay | | | | 193,184 | b | 6,979,738 | |
First Data, Cl. A | | | | 304,338 | b | 5,602,863 | |
HubSpot | | | | 37,446 | b | 2,746,664 | |
Microsoft | | | | 234,547 | | 17,537,079 | |
Square, Cl. A | | | | 134,323 | b | 3,507,174 | |
Twilio, Cl. A | | | | 100,090 | a,b | 2,930,635 | |
| | | | | 45,356,062 | |
Total Common Stocks (cost $183,699,269) | | | | 286,401,895 | |
| | | | | | | | |
Limited Partnership Interests - .0% | | | | | |
Semiconductors & Semiconductor Equipment - .0% | | | | | |
Bluestream Ventures LP
(cost $829,893) | | | | 1,655 | b,c,d | 80,689 | |
| | | | | | | | |
Other Investment - .9% | | | | | |
Registered Investment Company; | | | | | |
Dreyfus Institutional Preferred Government Plus Money Market Fund
(cost $2,724,352) | | | | 2,724,352 | e | 2,724,352 | |
9
STATEMENT OF INVESTMENTS (continued)
| | | | | | | | |
| |
Description | | | | Shares | | Value ($) | |
Investment of Cash Collateral for Securities Loaned - 5.3% | | | | | |
Registered Investment Company; | | | | | |
Dreyfus Institutional Preferred Government Money Market Fund, Institutional Shares
(cost $15,462,961) | | | | 15,462,961 | e | 15,462,961 | |
Total Investments (cost $202,716,475) | | 104.9% | | 304,669,897 | |
Liabilities, Less Cash and Receivables | | (4.9%) | | (14,333,715) | |
Net Assets | | 100.0% | | 290,336,182 | |
LP—Limited Partnership
aSecurity, or portion thereof, on loan. At August 31, 2017, the value of the fund’s securities on loan was $28,922,644 and the value of the collateral held by the fund was $29,386,734, consisting of cash collateral of $15,462,961 and U.S. Government & Agency securities valued at $13,923,773.
b Non-income producing security.
c The fund held securities valued using significant unobservable inputs at August 31, 2017, these securities were valued at $80,689 or .03% of net assets.
d Security restricted as to public resale.
e Investment in affiliated money market mutual fund.
| | |
Portfolio Summary (Unaudited) † | Value (%) |
Semiconductors & Semiconductor Equipment | 17.4 |
Software & Services | 15.6 |
Software | 15.6 |
Internet Software & Services | 15.2 |
Internet & Catalog Retail | 11.4 |
Communications Equipment | 10.3 |
Electronic Equipment & Instruments | 7.2 |
Money Market Investments | 6.2 |
IT Services | 3.8 |
Media | 2.2 |
| | 104.9 |
† Based on net assets.
See notes to financial statements.
10
STATEMENT OF INVESTMENTS IN AFFILIATED ISSUERS
| | | | | | | |
Registered Investment Companies | Value
8/31/2016 ($) | Purchases ($) | Sales ($) | Value
8/31/2017 ($) | Net
Assets (%) | Dividends/
Distributions ($) |
Dreyfus Institutional Cash
Advantage Fund,
Institutional Shares | 10,657,278 | 8,211,019 | 18,868,297 | - | - | - |
Dreyfus Institutional Preferred Government Plus Money Market Fund | 7,617,664 | 83,720,984 | 88,614,296 | 2,724,352 | .9 | 26,551 |
Dreyfus Institutional Preferred Government Money Market Fund, Institutional Shares | - | 134,857,562 | 119,394,601 | 15,462,961 | 5.3 | - |
Total | 18,274,942 | 226,789,565 | 226,877,194 | 18,187,313 | 6.2 | 26,551 |
See notes to financial statements.
11
STATEMENT OF ASSETS AND LIABILITIES
August 31, 2017
| | | | | | | |
| | | | | | |
| | | Cost | | Value | |
Assets ($): | | | | |
Investments in securities—See Statement of Investments
(including securities on loan, valued at $28,922,644)—Note 1(b): | | | | |
Unaffiliated issuers | | 184,529,162 | | 286,482,584 | |
Affiliated issuers | | 18,187,313 | | 18,187,313 | |
Cash | | | | | 72,749 | |
Receivable for investment securities sold | | | | | 3,006,210 | |
Dividends and securities lending income receivable | | | | | 211,111 | |
Receivable for shares of Common Stock subscribed | | | | | 302 | |
Prepaid expenses | | | | | 35,011 | |
| | | | | 307,995,280 | |
Liabilities ($): | | | | |
Due to The Dreyfus Corporation and affiliates—Note 3(c) | | | | | 294,147 | |
Liability for securities on loan—Note 1(b) | | | | | 15,462,961 | |
Payable for shares of Common Stock redeemed | | | | | 1,780,814 | |
Accrued expenses | | | | | 121,176 | |
| | | | | 17,659,098 | |
Net Assets ($) | | | 290,336,182 | |
Composition of Net Assets ($): | | | | |
Paid-in capital | | | | | 160,715,895 | |
Accumulated net realized gain (loss) on investments | | | | | 27,666,865 | |
Accumulated net unrealized appreciation (depreciation)
on investments | | | | 101,953,422 | |
Net Assets ($) | | | 290,336,182 | |
| | | | | | |
Net Asset Value Per Share | Class A | Class C | Class I | Class Y | |
Net Assets ($) | 246,692,735 | 24,059,600 | 19,572,061 | 11,786 | |
Shares Outstanding | 4,967,875 | 608,794 | 360,207 | 216.64 | |
Net Asset Value Per Share ($) | 49.66 | 39.52 | 54.34 | 54.40 | |
| | | | | | |
See notes to financial statements. | | | | | |
12
STATEMENT OF OPERATIONS
Year Ended August 31, 2017
| | | | | | | |
| | | | | | |
| | | | | | |
Investment Income ($): | | | | |
Income: | | | | |
Cash dividends: | | | | |
Unaffiliated issuers | | | 2,040,196 | |
Affiliated issuers | | | 26,551 | |
Income from securities lending—Note 1(b) | | | 185,959 | |
Total Income | | | 2,252,706 | |
Expenses: | | | | |
Management fee—Note 3(a) | | | 1,968,246 | |
Shareholder servicing costs—Note 3(c) | | | 1,065,069 | |
Distribution fees—Note 3(b) | | | 179,890 | |
Professional fees | | | 75,418 | |
Registration fees | | | 65,572 | |
Prospectus and shareholders’ reports | | | 32,419 | |
Custodian fees—Note 3(c) | | | 25,141 | |
Directors’ fees and expenses—Note 3(d) | | | 20,516 | |
Loan commitment fees—Note 2 | | | 7,918 | |
Miscellaneous | | | 22,899 | |
Total Expenses | | | 3,463,088 | |
Less—reduction in fees due to earnings credits—Note 3(c) | | | (10,934) | |
Net Expenses | | | 3,452,154 | |
Investment (Loss)—Net | | | (1,199,448) | |
Realized and Unrealized Gain (Loss) on Investments—Note 4 ($): | | |
Net realized gain (loss) on investments | 43,450,119 | |
Net unrealized appreciation (depreciation) on investments | | | 23,864,865 | |
Net Realized and Unrealized Gain (Loss) on Investments | | | 67,314,984 | |
Net Increase in Net Assets Resulting from Operations | | 66,115,536 | |
| | | | | | | |
See notes to financial statements. | | | | | |
13
STATEMENT OF CHANGES IN NET ASSETS
| | | | | | | | | | |
| | | | Year Ended August 31, |
| | | | 2017a | | | | 2016 | |
Operations ($): | | | | | | | | |
Investment (loss)—net | | | (1,199,448) | | | | (1,486,563) | |
Net realized gain (loss) on investments | | 43,450,119 | | | | 8,975,964 | |
Net unrealized appreciation (depreciation)
on investments | | 23,864,865 | | | | 23,592,873 | |
Net Increase (Decrease) in Net Assets
Resulting from Operations | 66,115,536 | | | | 31,082,274 | |
Distributions to Shareholders from ($): | | | | | | | | |
Net realized gain on investments: | | | | | | | | |
Class A | | | (18,879,916) | | | | (13,683,569) | |
Class C | | | (2,566,583) | | | | (1,892,713) | |
Class I | | | (1,412,768) | | | | (952,935) | |
Class Y | | | (834) | | | | - | |
Total Distributions | | | (22,860,101) | | | | (16,529,217) | |
Capital Stock Transactions ($): | | | | | | | | |
Net proceeds from shares sold: | | | | | | | | |
Class A | | | 16,981,586 | | | | 13,080,834 | |
Class C | | | 1,578,314 | | | | 1,938,583 | |
Class I | | | 11,469,224 | | | | 6,329,676 | |
Class Y | | | 10,000 | | | | - | |
Distributions reinvested: | | | | | | | | |
Class A | | | 17,571,730 | | | | 12,764,547 | |
Class C | | | 2,046,764 | | | | 1,329,495 | |
Class I | | | 1,266,977 | | | | 798,438 | |
Cost of shares redeemed: | | | | | | | | |
Class A | | | (38,651,652) | | | | (42,683,295) | |
Class C | | | (7,411,850) | | | | (4,596,253) | |
Class I | | | (14,183,829) | | | | (7,197,066) | |
Increase (Decrease) in Net Assets
from Capital Stock Transactions | (9,322,736) | | | | (18,235,041) | |
Total Increase (Decrease) in Net Assets | 33,932,699 | | | | (3,681,984) | |
Net Assets ($): | | | | | | | | |
Beginning of Period | | | 256,403,483 | | | | 260,085,467 | |
End of Period | | | 290,336,182 | | | | 256,403,483 | |
Accumulated investment (loss)—net | - | | | | (798,492) | |
14
| | | | | | | | | | |
| | | | Year Ended August 31, |
| | | | 2017a | | | | 2016 | |
Capital Share Transactions (Shares): | | | | | | | | |
Class Ab | | | | | | | | |
Shares sold | | | 383,149 | | | | 334,802 | |
Shares issued for distributions reinvested | | | 455,935 | | | | 320,798 | |
Shares redeemed | | | (904,111) | | | | (1,077,892) | |
Net Increase (Decrease) in Shares Outstanding | (65,027) | | | | (422,292) | |
Class Cb | | | | | | | | |
Shares sold | | | 45,991 | | | | 58,009 | |
Shares issued for distributions reinvested | | | 66,346 | | | | 40,484 | |
Shares redeemed | | | (206,441) | | | | (141,701) | |
Net Increase (Decrease) in Shares Outstanding | (94,104) | | | | (43,208) | |
Class I | | | | | | | | |
Shares sold | | | 244,039 | | | | 147,214 | |
Shares issued for distributions reinvested | | | 30,102 | | | | 18,560 | |
Shares redeemed | | | (297,419) | | | | (169,250) | |
Net Increase (Decrease) in Shares Outstanding | (23,278) | | | | (3,476) | |
Class Y | | | | | | | | |
Shares sold | | | 216.64 | | | | - | |
Net Increase (Decrease) in Shares Outstanding | 216.64 | | | | - | |
| | | | | | | | | | |
a On September 30, 2016, the fund commenced offering Class Y shares. | |
b During the period ended August 31, 2017, 237 Class C shares representing $8,154 were exchanged for 194 Class A shares.
| |
See notes to financial statements. | | | | | | | | |
15
FINANCIAL HIGHLIGHTS
The following tables describe the performance for each share class for the fiscal periods indicated. All information (except portfolio turnover rate) reflects financial results for a single fund share. Total return shows how much your investment in the fund would have increased (or decreased) during each period, assuming you had reinvested all dividends and distributions. These figures have been derived from the fund’s financial statements.
| | | | | | | | | | | |
| | | | | | | |
| | Year Ended August 31, |
Class A Shares | 2017 | 2016 | 2015 | 2014 | 2013 |
Per Share Data ($): | | | | | | |
Net asset value, beginning of period | | 42.56 | 40.03 | 47.28 | 38.16 | 34.40 |
Investment Operations: | | | | | | |
Investment (loss)—neta | | (.18) | (.21) | (.26) | (.21) | (.19) |
Net realized and unrealized
gain (loss) on investments | | 11.13 | 5.32 | .75 | 10.17 | 3.95 |
Total from Investment Operations | | 10.95 | 5.11 | .49 | 9.96 | 3.76 |
Distributions: | | | | | | |
Dividends from net realized
gain on investments | | (3.85) | (2.58) | (7.74) | (.84) | – |
Net asset value, end of period | | 49.66 | 42.56 | 40.03 | 47.28 | 38.16 |
Total Return (%)b | | 28.34 | 13.23 | 1.40 | 26.37 | 10.93 |
Ratios/Supplemental Data (%): | | | | | | |
Ratio of total expenses
to average net assets | | 1.26 | 1.28 | 1.28 | 1.26 | 1.39 |
Ratio of net expenses
to average net assets | | 1.26 | 1.28 | 1.28 | 1.26 | 1.39 |
Ratio of net investment (loss)
to average net assets | | (.40) | (.53) | (.61) | (.47) | (.54) |
Portfolio Turnover Rate | | 58.27 | 37.76 | 67.23 | 69.81 | 54.34 |
Net Assets, end of period ($ x 1,000) | | 246,693 | 214,185 | 218,398 | 237,657 | 212,378 |
a Based on average shares outstanding.
b Exclusive of sales charge.
See notes to financial statements.
16
| | | | | | | | | | | |
| | | | | | | |
| | Year Ended August 31, |
Class C Shares | 2017 | 2016 | 2015 | 2014 | 2013 |
Per Share Data ($): | | | | | | |
Net asset value, beginning of period | | 34.92 | 33.55 | 41.17 | 33.60 | 30.54 |
Investment Operations: | | | | | | |
Investment (loss)—neta | | (.43) | (.44) | (.52) | (.51) | (.43) |
Net realized and unrealized
gain (loss) on investments | | 8.88 | 4.39 | .64 | 8.92 | 3.49 |
Total from Investment Operations | | 8.45 | 3.95 | .12 | 8.41 | 3.06 |
Distributions: | | | | | | |
Dividends from net realized
gain on investments | | (3.85) | (2.58) | (7.74) | (.84) | – |
Net asset value, end of period | | 39.52 | 34.92 | 33.55 | 41.17 | 33.60 |
Total Return (%)b | | 27.30 | 12.27 | .61 | 25.33 | 10.02 |
Ratios/Supplemental Data (%): | | | | | | |
Ratio of total expenses
to average net assets | | 2.07 | 2.10 | 2.08 | 2.10 | 2.23 |
Ratio of net expenses
to average net assets | | 2.07 | 2.09 | 2.08 | 2.10 | 2.23 |
Ratio of net investment (loss)
to average net assets | | (1.21) | (1.34) | (1.41) | (1.31) | (1.37) |
Portfolio Turnover Rate | | 58.27 | 37.76 | 67.23 | 69.81 | 54.34 |
Net Assets, end of period ($ x 1,000) | | 24,060 | 24,544 | 25,028 | 29,098 | 25,253 |
a Based on average shares outstanding.
b Exclusive of sales charge.
See notes to financial statements.
17
FINANCIAL HIGHLIGHTS (continued)
| | | | | | | | | | | |
| | | | | | | |
| | Year Ended August 31, |
Class I Shares | 2017 | 2016 | 2015 | 2014 | 2013 |
Per Share Data ($): | | | | | | |
Net asset value, beginning of period | | 46.09 | 43.05 | 50.14 | 40.34 | 36.25 |
Investment Operations: | | | | | | |
Investment (loss)—net a | | (.06) | (.12) | (.16) | (.12) | (.08) |
Net realized and unrealized
gain (loss) on investments | | 12.16 | 5.74 | .81 | 10.76 | 4.17 |
Total from Investment Operations | | 12.10 | 5.62 | .65 | 10.64 | 4.09 |
Distributions: | | | | | | |
Dividends from net realized
gain on investments | | (3.85) | (2.58) | (7.74) | (.84) | – |
Net asset value, end of period | | 54.34 | 46.09 | 43.05 | 50.14 | 40.34 |
Total Return (%) | | 28.69 | 13.49 | 1.69 | 26.61 | 11.28 |
Ratios/Supplemental Data (%): | | | | | | |
Ratio of total expenses
to average net assets | | 1.00 | 1.03 | 1.02 | 1.05 | 1.07 |
Ratio of net expenses
to average net assets | | 1.00 | 1.03 | 1.02 | 1.05 | 1.07 |
Ratio of net investment
(loss) to average net assets | | (.13) | (.27) | (.36) | (.26) | (.22) |
Portfolio Turnover Rate | | 58.27 | 37.76 | 67.23 | 69.81 | 54.34 |
Net Assets, end of period ($ x 1,000) | | 19,572 | 17,675 | 16,659 | 15,536 | 12,467 |
a Based on average shares outstanding.
See notes to financial statements.
18
| | | | | | | | | |
| | | | | | |
| | |
Class Y Shares | | | | Period Ended |
| | August 31, 2017a |
Per Share Data ($): | | | | | |
Net asset value, beginning of period | | | | | 46.16 |
Investment Operations: | | | | | |
Investment income —netb | | | | | .00c |
Net realized and unrealized
gain (loss) on investments | | | | | 12.09 |
Total from Investment Operations | | | | | 12.09 |
Distributions: | | | | | |
Dividends from net realized
gain on investments | | | | | (3.85) |
Net asset value, end of period | | | | | 54.40 |
Total Return (%)d | | | | | 28.63 |
Ratios/Supplemental Data (%): | | | | | |
Ratio of total expenses
to average net assetse | | | | | .89 |
Ratio of net expenses
to average net assetse | | | | | .89 |
Ratio of net investment income
to average net assetse | | | | | .01 |
Portfolio Turnover Rate | | | | | 58.27 |
Net Assets, end of period ($ x 1,000) | | | | | 12 |
a From September 30, 2016 (commencement of initial offering) to August 31, 2017.
b Based on average shares outstanding.
c Amount represents less than $.01 per share.
d Not annualized.
e Annualized.
See notes to financial statements.
19
NOTES TO FINANCIAL STATEMENTS
NOTE 1—Significant Accounting Policies:
Dreyfus Technology Growth Fund (the “fund”) is a separate diversified series of Advantage Funds, Inc. (the “Company”), which is registered under the Investment Company Act of 1940, as amended (the “Act”), as an open-end management investment company and operates as a series company currently offering nine series, including the fund. The fund’s investment objective is to seek capital appreciation. The Dreyfus Corporation (the “Manager” or “Dreyfus”), a wholly-owned subsidiary of The Bank of New York Mellon Corporation (“BNY Mellon”), serves as the fund’s investment adviser.
On September 30, 2016, the fund commenced offering Class Y shares. The fund’s authorized shares were increased from 500 million to 600 million and 100 million Class Y shares were authorized.
Effective March 31, 2017, the fund authorized the issuance of Class T shares, but, as of the date of this report, the fund did not offer Class T shares for purchase. The fund authorized 100 million Class T shares which resulted in the fund’s total authorized shares increasing from 600 million to 700 million.
MBSC Securities Corporation (the “Distributor”), a wholly-owned subsidiary of Dreyfus, is the distributor of the fund’s shares. The fund is authorized to issue 700 million shares of $.001 par value Common Stock. The fund currently has authorized five classes of shares: Class A (200 million shares authorized), Class C (100 million shares authorized), Class I (200 million shares authorized), Class T (100 million shares authorized), and Class Y (100 million shares authorized). Class A and Class T shares generally are subject to a sales charge imposed at the time of purchase. Class C shares are subject to a contingent deferred sales charge (“CDSC”) imposed on Class C shares redeemed within one year of purchase. Class I and Class Y shares are sold at net asset value per share generally to institutional investors. Other differences between the classes include the services offered to and the expenses borne by each class, the allocation of certain transfer agency costs, and certain voting rights. Income, expenses (other than expenses attributable to a specific class), and realized and unrealized gains or losses on investments are allocated to each class of shares based on its relative net assets.
As of August 31, 2017, MBC Investments Corp., an indirect subsidiary of BNY Mellon, held all of the outstanding Class Y shares of the fund.
20
The Company accounts separately for the assets, liabilities and operations of each series. Expenses directly attributable to each series are charged to that series’ operations; expenses which are applicable to all series are allocated among them on a pro rata basis.
The Financial Accounting Standards Board (“FASB”) Accounting Standards Codification is the exclusive reference of authoritative U.S. generally accepted accounting principles (“GAAP”) recognized by the FASB to be applied by nongovernmental entities. Rules and interpretive releases of the Securities and Exchange Commission (“SEC”) under authority of federal laws are also sources of authoritative GAAP for SEC registrants. The fund’s financial statements are prepared in accordance with GAAP, which may require the use of management estimates and assumptions. Actual results could differ from those estimates.
The Company enters into contracts that contain a variety of indemnifications. The fund’s maximum exposure under these arrangements is unknown. The fund does not anticipate recognizing any loss related to these arrangements.
(a) Portfolio valuation: The fair value of a financial instrument is the amount that would be received to sell an asset or paid to transfer a liability in an orderly transaction between market participants at the measurement date (i.e., the exit price). GAAP establishes a fair value hierarchy that prioritizes the inputs of valuation techniques used to measure fair value. This hierarchy gives the highest priority to unadjusted quoted prices in active markets for identical assets or liabilities (Level 1 measurements) and the lowest priority to unobservable inputs (Level 3 measurements).
Additionally, GAAP provides guidance on determining whether the volume and activity in a market has decreased significantly and whether such a decrease in activity results in transactions that are not orderly. GAAP requires enhanced disclosures around valuation inputs and techniques used during annual and interim periods.
Various inputs are used in determining the value of the fund’s investments relating to fair value measurements. These inputs are summarized in the three broad levels listed below:
Level 1—unadjusted quoted prices in active markets for identical investments.
Level 2—other significant observable inputs (including quoted prices for similar investments, interest rates, prepayment speeds, credit risk, etc.).
21
NOTES TO FINANCIAL STATEMENTS (continued)
Level 3—significant unobservable inputs (including the fund’s own assumptions in determining the fair value of investments).
The inputs or methodology used for valuing securities are not necessarily an indication of the risk associated with investing in those securities.
Changes in valuation techniques may result in transfers in or out of an assigned level within the disclosure hierarchy. Valuation techniques used to value the fund’s investments are as follows:
Investments in securities are valued at the last sales price on the securities exchange or national securities market on which such securities are primarily traded. Securities listed on the National Market System for which market quotations are available are valued at the official closing price or, if there is no official closing price that day, at the last sales price. For open short positions, asked prices are used for valuation purposes. Bid price is used when no asked price is available. Registered investment companies that are not traded on an exchange are valued at their net asset value. All of the preceding securities are generally categorized within Level 1 of the fair value hierarchy.
Securities not listed on an exchange or the national securities market, or securities for which there were no transactions, are valued at the average of the most recent bid and asked prices. These securities are generally categorized within Level 2 of the fair value hierarchy.
Fair valuing of securities may be determined with the assistance of a pricing service using calculations based on indices of domestic securities and other appropriate indicators, such as prices of relevant American Depository Receipts and futures. Utilizing these techniques may result in transfers between Level 1 and Level 2 of the fair value hierarchy.
The fund’s investment in a limited partnership is valued using the “practical expedient” (as defined by the Accounting Standards Update (“ASU”) 2009-12, Investments in Certain Entities that Calculate Net Asset Value per Share), which is based upon the fund’s estimated pro-rata interest in the capital balance of the limited partnership and represents the amount that the fund could reasonably expect to receive from the limited partnership if the fund’s capital was withdrawn from the limited partnership at the time of valuation, based on information available at the time the valuation is made and that the fund believes to be reliable. The valuation utilizes financial information supplied by the limited partnership. Limited partnerships valued using the “practical expedient” are not categorized in the fair value hierarchy.
22
The fund’s investment in the limited partnership cannot be redeemed. Rather, the fund receives distributions upon the liquidation of the underlying assets of the limited partnership. The fund expects to receive final distribution from the limited partnership in December of 2017.
When market quotations or official closing prices are not readily available, or are determined not to reflect accurately fair value, such as when the value of a security has been significantly affected by events after the close of the exchange or market on which the security is principally traded (for example, a foreign exchange or market), but before the fund calculates its net asset value, the fund may value these investments at fair value as determined in accordance with the procedures approved by the Company’s Board of Directors (the “Board”). Certain factors may be considered when fair valuing investments such as: fundamental analytical data, the nature and duration of restrictions on disposition, an evaluation of the forces that influence the market in which the securities are purchased and sold, and public trading in similar securities of the issuer or comparable issuers. These securities are either categorized within Level 2 or 3 of the fair value hierarchy depending on the relevant inputs used.
For restricted securities where observable inputs are limited, assumptions about market activity and risk are used and are generally categorized within Level 3 of the fair value hierarchy.
In May 2015, the FASB issued ASU 2015-07, Disclosures for Investments in Certain Entities That Calculate Net Asset Value per Share (or its Equivalent) (“ASU 2015-07”). ASU 2015-07 amendments remove the requirement to categorize within the fair value hierarchy and to make certain disclosures for all investments for which fair value is measured using the net asset value per share practical expedient. ASU 2015-07 is effective for fiscal years beginning after December 15, 2015. The fund adopted the pronouncement for the current reporting period, therefore the fund excluded its investment in limited partnership from the fair value hierarchy.
The following is a summary of the inputs used as of August 31, 2017 in valuing the fund’s investments:
| | | | | | |
| | Level 1 – Unadjusted
Quoted Prices | Level 2 - Other Significant Observable
Inputs | Level 3 -
Significant Unobservable Inputs | Using Practical Expedient | Total |
Assets ($) |
Investments in Securities: |
Equity Securities - Domestic
Common Stocks† | 266,669,561 | - | - | - | 266,669,561 |
23
NOTES TO FINANCIAL STATEMENTS (continued)
| | | | | | |
| | Level 1 – Unadjusted
Quoted Prices | Level 2 - Other Significant Observable
Inputs | Level 3 -
Significant Unobservable Inputs | Using Practical Expedient | Total |
Assets ($) |
Investments in Securities: |
Equity Securities - Foreign
Common Stocks† | 11,446,499 | 8,285,835†† | - | - | 19,732,334 |
Limited Partnership Interest† | - | - | - | 80,689 | 80,689 |
Registered Investment Companies | 18,187,313 | - | - | - | 18,187,313 |
† See Statement of Investments for additional detailed categorizations.
†† Securities classified within Level 2 at period end as the values were determined pursuant to the fund’s fair valuation procedures.
The amount of securities transferred from Level 1 to Level 2 equals fair value of Level 2 securities in the table above. The Fund’s policy is to recognize transfers at their value date as of the last day of the year.
(b) Securities transactions and investment income: Securities transactions are recorded on a trade date basis. Realized gains and losses from securities transactions are recorded on the identified cost basis. Dividend income is recognized on the ex-dividend date and interest income, including, where applicable, accretion of discount and amortization of premium on investments, is recognized on the accrual basis.
Pursuant to a securities lending agreement with The Bank of New York Mellon, a subsidiary of BNY Mellon and an affiliate of Dreyfus, the fund may lend securities to qualified institutions. It is the fund’s policy that, at origination, all loans are secured by collateral of at least 102% of the value of U.S. securities loaned and 105% of the value of foreign securities loaned. Collateral equivalent to at least 100% of the market value of securities on loan is maintained at all times. Collateral is either in the form of cash, which can be invested in certain money market mutual funds managed by Dreyfus, or U.S. Government and Agency securities. The fund is entitled to receive all dividends, interest and distributions on securities loaned, in addition to income earned as a result of the lending transaction. Should a borrower fail to return the securities in a timely manner, The Bank of New York Mellon is required to replace the securities for the benefit of the fund or credit the fund with the market value of the unreturned securities and is subrogated to the fund’s rights against the borrower and the collateral. Additionally, the contractual maturity of security lending transactions are on an overnight and continuous basis.
24
During the period ended August 31, 2017, The Bank of New York Mellon earned $35,206 from lending portfolio securities, pursuant to the securities lending agreement.
(c) Affiliated issuers: Investments in other investment companies advised by Dreyfus are defined as “affiliated” under the Act.
(d) Dividends and distributions to shareholders: Dividends and distributions are recorded on the ex-dividend date. Dividends from investment income-net and dividends from net realized capital gains, if any, are normally declared and paid annually, but the fund may make distributions on a more frequent basis to comply with the distribution requirements of the Internal Revenue Code of 1986, as amended (the “Code”). To the extent that net realized capital gains can be offset by capital loss carryovers, it is the policy of the fund not to distribute such gains. Income and capital gain distributions are determined in accordance with income tax regulations, which may differ from GAAP.
(e) Federal income taxes: It is the policy of the fund to continue to qualify as a regulated investment company, if such qualification is in the best interests of its shareholders, by complying with the applicable provisions of the Code, and to make distributions of taxable income sufficient to relieve it from substantially all federal income and excise taxes.
As of and during the period ended August 31, 2017, the fund did not have any liabilities for any uncertain tax positions. The fund recognizes interest and penalties, if any, related to uncertain tax positions as income tax expense in the Statement of Operations. During the period ended August 31, 2017, the fund did not incur any interest or penalties.
Each tax year in the four-year period ended August 31, 2017 remains subject to examination by the Internal Revenue Service and state taxing authorities.
At August 31, 2017, the components of accumulated earnings on a tax basis were as follows: undistributed ordinary income $4,851,329, undistributed capital gains $22,861,007, and unrealized appreciation $101,907,951.
The tax character of distributions paid to shareholders during the fiscal periods ended August 31, 2017 and August 31, 2016 were as follows: ordinary income $0 and $851,052, and long-term capital gains $22,860,101 and $15,678,165, respectively.
During the period ended August 31, 2017, as a result of permanent book to tax differences, primarily due to the tax treatment for net operating losses and limited partnerships, the fund increased accumulated
25
NOTES TO FINANCIAL STATEMENTS (continued)
undistributed investment income-net by $1,997,940, decreased accumulated net realized gain (loss) on investments by $2,033,793 and increased paid-in capital by $35,853. Net assets and net asset value per share were not affected by this reclassification.
NOTE 2—Bank Lines of Credit:
The fund participates with other Dreyfus-managed funds in an $810 million unsecured credit facility led by Citibank, N.A. and a $300 million unsecured credit facility provided by The Bank of New York Mellon (each, a “Facility”), each to be utilized primarily for temporary or emergency purposes, including the financing of redemptions. Prior to October 5, 2016, the unsecured credit facility with Citibank, N.A. was $555 million. In connection therewith, the fund has agreed to pay its pro rata portion of commitment fees for each Facility. Interest is charged to the fund based on rates determined pursuant to the terms of the respective Facility at the time of borrowing. During the period ended August 31, 2017, the fund did not borrow under the Facilities.
NOTE 3—Management Fee and Other Transactions with Affiliates:
(a) Pursuant to a management agreement with Dreyfus, the management fee is computed at the annual rate of .75% of the value of the fund’s average daily net assets and is payable monthly.
During the period ended August 31, 2017, the Distributor retained $5,342 from commissions earned on sales of the fund’s Class A shares and $97 from CDSCs on redemptions of the fund’s Class C shares.
(b) Under the Distribution Plan adopted pursuant to Rule 12b-1 under the Act, Class C shares pay the Distributor for distributing its shares at an annual rate of .75% of the value of its average daily net assets. During the period ended August 31, 2017, Class C shares were charged $179,890 pursuant to the Distribution Plan.
(c) Under the Shareholder Services Plan, Class A and Class C shares pay the Distributor at an annual rate of .25% of the value of their average daily net assets for the provision of certain services. The services provided may include personal services relating to shareholder accounts, such as answering shareholder inquiries regarding the fund and providing reports and other information, and services related to the maintenance of shareholder accounts. The Distributor may make payments to Service Agents (securities dealers, financial institutions or other industry professionals) with respect to these services. The Distributor determines the amounts to be paid to Service Agents. During the period ended August
26
31, 2017, Class A and Class C shares were charged $549,877 and $59,963, respectively, pursuant to the Shareholder Services Plan.
The fund has arrangements with the transfer agent and the custodian whereby the fund may receive earnings credits when positive cash balances are maintained, which are used to offset transfer agency and custody fees. For financial reporting purposes, the fund includes net earnings credits as an expense offset in the Statement of Operations.
The fund compensates Dreyfus Transfer, Inc., a wholly-owned subsidiary of Dreyfus, under a transfer agency agreement for providing transfer agency and cash management services for the fund. The majority of transfer agency fees are comprised of amounts paid on a per account basis, while cash management fees are related to fund subscriptions and redemptions. During the period ended August 31, 2017, the fund was charged $129,868 for transfer agency services and $11,087 for cash management services. These fees are included in Shareholder servicing costs in the Statement of Operations. Cash management fees were partially offset by earnings credits of $10,934.
The fund compensates The Bank of New York Mellon under a custody agreement for providing custodial services for the fund. These fees are determined based on net assets, geographic region and transaction activity. During the period ended August 31, 2017, the fund was charged $25,141 pursuant to the custody agreement.
During the period ended August 31, 2017, the fund was charged $11,281 for services performed by the Chief Compliance Officer and his staff.
The components of “Due to The Dreyfus Corporation and affiliates” in the Statement of Assets and Liabilities consist of: management fees $181,757, Distribution Plan fees $15,079, Shareholder Services Plan fees $56,236, custodian fees $7,200, Chief Compliance Officer fees $4,670 and transfer agency fees $29,205.
(d) Each Board member also serves as a Board member of other funds within the Dreyfus complex. Annual retainer fees and attendance fees are allocated to each fund based on net assets.
NOTE 4—Securities Transactions:
The aggregate amount of purchases and sales of investment securities, excluding short-term securities, during the period ended August 31, 2017, amounted to $150,337,499 and $183,902,123, respectively.
At August 31, 2017, the cost of investments for federal income tax purposes was $202,761,946; accordingly, accumulated net unrealized
27
NOTES TO FINANCIAL STATEMENTS (continued)
appreciation on investments was $101,907,951, consisting of $103,127,091 gross unrealized appreciation and $1,219,140 gross unrealized depreciation.
28
REPORT OF INDEPENDENT REGISTERED
PUBLIC ACCOUNTING FIRM
Shareholders and Board of Directors
Dreyfus Technology Growth Fund
We have audited the accompanying statement of assets and liabilities, including the statements of investments and investments in affiliated issuers, of Dreyfus Technology Growth Fund (one of the series comprising Advantage Funds, Inc.) as of August 31, 2017, and the related statement of operations for the year then ended, the statement of changes in net assets for each of the two years in the period then ended, and the financial highlights for each of the periods indicated therein. These financial statements and financial highlights are the responsibility of the Fund’s management. Our responsibility is to express an opinion on these financial statements and financial highlights based on our audits.
We conducted our audits in accordance with the standards of the Public Company Accounting Oversight Board (United States). Those standards require that we plan and perform the audit to obtain reasonable assurance about whether the financial statements and financial highlights are free of material misstatement. We were not engaged to perform an audit of the Fund’s internal control over financial reporting. Our audits included consideration of internal control over financial reporting as a basis for designing audit procedures that are appropriate in the circumstances, but not for the purpose of expressing an opinion on the effectiveness of the Fund’s internal control over financial reporting. Accordingly, we express no such opinion. An audit also includes examining, on a test basis, evidence supporting the amounts and disclosures in the financial statements and financial highlights, assessing the accounting principles used and significant estimates made by management, and evaluating the overall financial statement presentation. Our procedures included confirmation of securities owned as of August 31, 2017 by correspondence with the custodian and others. We believe that our audits provide a reasonable basis for our opinion.
In our opinion, the financial statements and financial highlights referred to above present fairly, in all material respects, the financial position of Dreyfus Technology Growth Fund at August 31, 2017, the results of its operations for the year then ended, the changes in its net assets for each of the two years in the period then ended, and the financial highlights for each of the indicated periods, in conformity with U.S. generally accepted accounting principles.

New York, New York
October 26, 2017
29
IMPORTANT TAX INFORMATION (Unaudited)
For federal tax purposes, the fund hereby reports $3.8502 per share as a long-term capital gain distribution paid on December 13, 2016.
30
INFORMATION ABOUT THE RENEWAL OF THE FUND'S MANAGEMENT AGREEMENT (Unaudited)
At a meeting of the fund’s Board of Directors held on March 9-10, 2017, the Board considered the renewal of the fund’s Management Agreement pursuant to which Dreyfus provides the fund with investment advisory and administrative services (the “Agreement”). The Board members, none of whom are “interested persons” (as defined in the Investment Company Act of 1940, as amended) of the fund, were assisted in their review by independent legal counsel and met with counsel in executive session separate from Dreyfus representatives. In considering the renewal of the Agreement, the Board considered all factors that it believed to be relevant, including those discussed below. The Board did not identify any one factor as dispositive, and each Board member may have attributed different weights to the factors considered.
Analysis of Nature, Extent, and Quality of Services Provided to the Fund. The Board considered information provided to them at the meeting and in previous presentations from Dreyfus representatives regarding the nature, extent, and quality of the services provided to funds in the Dreyfus fund complex. Dreyfus provided the number of open accounts in the fund, the fund’s asset size and the allocation of fund assets among distribution channels. Dreyfus also had previously provided information regarding the diverse intermediary relationships and distribution channels of funds in the Dreyfus fund complex (such as retail direct or intermediary, in which intermediaries typically are paid by the fund and/or Dreyfus) and Dreyfus’ corresponding need for broad, deep, and diverse resources to be able to provide ongoing shareholder services to each intermediary or distribution channel, as applicable to the fund.
The Board also considered research support available to, and portfolio management capabilities of, the fund’s portfolio management personnel and that Dreyfus also provides oversight of day-to-day fund operations, including fund accounting and administration and assistance in meeting legal and regulatory requirements. The Board also considered Dreyfus’ extensive administrative, accounting and compliance infrastructures. The Board also considered portfolio management’s brokerage policies and practices (including policies and practices regarding soft dollars) and the standards applied in seeking best execution.
Comparative Analysis of the Fund’s Performance and Management Fee and Expense Ratio. The Board reviewed reports prepared by Broadridge Financial Solutions, Inc. (“Broadridge”), an independent provider of investment company data, which included information comparing (1) the fund’s performance with the performance of a group of comparable funds (the “Performance Group”) and with a broader group of funds (the “Performance Universe”), all for various periods ended January 31, 2017, and (2) the fund’s actual and contractual management fees and total expenses with those of a group of comparable funds (the “Expense Group”) and with a broader group of funds (the “Expense Universe”), the information for which was derived in part from fund financial statements available to Broadridge as of the date of its analysis. Dreyfus previously had furnished the Board with a description of the methodology Broadridge used to select the Performance Group and Performance Universe and the Expense Group and Expense Universe.
31
INFORMATION ABOUT THE RENEWAL OF THE FUND'S MANAGEMENT AGREEMENT (Unaudited) (continued)
Dreyfus representatives stated that the usefulness of performance comparisons may be affected by a number of factors, including different investment limitations that may be applicable to the fund and comparison funds. The Board discussed with representatives of Dreyfus and/or its affiliates the results of the comparisons and considered that the fund’s total return performance was below the Performance Group and Performance Universe medians for all periods. The Board considered the proximity of the fund’s performance to the Performance Group in recent periods. The Board also considered the positive, and in some periods significant, returns of the fund in the various periods. Dreyfus also provided a comparison of the fund’s calendar year total returns to the returns of the fund’s benchmark indexes and noted that the fund’s return was above the return of one or both of the indexes in seven of the ten calendar years shown.
The Board also reviewed the range of actual and contractual management fees and total expenses of the Expense Group and Expense Universe funds and discussed the results of the comparisons. The Board considered that the fund’s contractual management fee was below the Expense Group median and the fund’s actual management fee and total expenses were below the Expense Group and Expense Universe medians.
Dreyfus representatives reviewed with the Board the management or investment advisory fees (1) paid by funds advised or administered by Dreyfus that are in the same Broadridge category as the fund and (2) paid to Dreyfus or the Dreyfus-affiliated primary employer of the fund’s primary portfolio manager(s) for advising any separate accounts and/or other types of client portfolios that are considered to have similar investment strategies and policies as the fund (the “Similar Clients”), and explained the nature of the Similar Clients. They discussed differences in fees paid and the relationship of the fees paid in light of any differences in the services provided and other relevant factors. The Board considered the relevance of the fee information provided for the Similar Clients to evaluate the appropriateness of the fund’s management fee.
Analysis of Profitability and Economies of Scale. Dreyfus representatives reviewed the expenses allocated and profit received by Dreyfus and its affiliates and the resulting profitability percentage for managing the fund and the aggregate profitability percentage to Dreyfus and its affiliates for managing the funds in the Dreyfus fund complex, and the method used to determine the expenses and profit. The Board concluded that the profitability results were not unreasonable, given the services rendered and service levels provided by Dreyfus. The Board also had been provided with information prepared by an independent consulting firm regarding Dreyfus’ approach to allocating costs to, and determining the profitability of, individual funds and the entire Dreyfus fund complex. The consulting firm also had analyzed where any economies of scale might emerge in connection with the management of a fund.
The Board considered, on the advice of its counsel, the profitability analysis (1) as part of its evaluation of whether the fees under the Agreement, considered in relation to the mix of services provided by Dreyfus, including the nature, extent and quality of such services, supported the renewal of the Agreement and (2) in light of the relevant circumstances for the fund and the extent to which economies of scale would be realized if the fund grows and whether fee levels reflect these economies of scale for the
32
benefit of fund shareholders. Dreyfus representatives stated that a discussion of economies of scale is predicated on a fund having achieved a substantial size with increasing assets and that, if a fund’s assets had been stable or decreasing, the possibility that Dreyfus may have realized any economies of scale would be less. Dreyfus representatives also stated that, as a result of shared and allocated costs among funds in the Dreyfus fund complex, the extent of economies of scale could depend substantially on the level of assets in the complex as a whole, so that increases and decreases in complex-wide assets can affect potential economies of scale in a manner that is disproportionate to, or even in the opposite direction from, changes in the fund’s asset level. The Board also considered potential benefits to Dreyfus from acting as investment adviser and took into consideration the soft dollar arrangements in effect for trading the fund’s investments.
At the conclusion of these discussions, the Board agreed that it had been furnished with sufficient information to make an informed business decision with respect to the renewal of the Agreement. Based on the discussions and considerations as described above, the Board concluded and determined as follows.
· The Board concluded that the nature, extent and quality of the services provided by Dreyfus are adequate and appropriate.
· The Board considered recent performance improvements, but was concerned with the fund’s performance and agreed to closely monitor performance.
· The Board concluded that the fee paid to Dreyfus supported the renewal of the Agreement in light of the considerations described above.
· The Board determined that the economies of scale which may accrue to Dreyfus and its affiliates in connection with the management of the fund had been adequately considered by Dreyfus in connection with the fee rate charged to the fund pursuant to the Agreement and that, to the extent in the future it were determined that material economies of scale had not been shared with the fund, the Board would seek to have those economies of scale shared with the fund.
In evaluating the Agreement, the Board considered these conclusions and determinations and also relied on its previous knowledge, gained through meetings and other interactions with Dreyfus and its affiliates, of Dreyfus and the services provided to the fund by Dreyfus. The Board also relied on information received on a routine and regular basis throughout the year relating to the operations of the fund and the investment management and other services provided under the Agreement, including information on the investment performance of the fund in comparison to similar mutual funds and benchmark performance indices; general market outlook as applicable to the fund; and compliance reports. In addition, the Board’s consideration of the contractual fee arrangements for this fund had the benefit of a number of years of reviews of the Agreement for the fund, or substantially similar agreements for other Dreyfus funds that the Board oversees, during which lengthy discussions took place
33
INFORMATION ABOUT THE RENEWAL OF THE FUND'S MANAGEMENT AGREEMENT (Unaudited) (continued)
between the Board and Dreyfus representatives. Certain aspects of the arrangements may receive greater scrutiny in some years than in others, and the Board’s conclusions may be based, in part, on their consideration of the fund’s arrangements, or similar arrangements for other Dreyfus funds that the Board oversees, in prior years. The Board determined to renew the Agreement.
34
BOARD MEMBERS INFORMATION (Unaudited)
INDEPENDENT BOARD MEMBERS
Joseph S. DiMartino (73)
Chairman of the Board (1995)
Principal Occupation During Past 5 Years:
· Corporate Director and Trustee (1995-present)
Other Public Company Board Memberships During Past 5 Years:
· CBIZ (formerly, Century Business Services, Inc.), a provider of outsourcing functions for small and medium size companies, Director (1997-present)
No. of Portfolios for which Board Member Serves: 130
———————
Peggy C. Davis (74)
Board Member (2006)
Principal Occupation During Past 5 Years:
· Shad Professor of Law, New York University School of Law (1983-present)
No. of Portfolios for which Board Member Serves: 47
———————
David P. Feldman (77)
Board Member (1996)
Principal Occupation During Past 5 Years:
· Corporate Director and Trustee (1985-present)
Other Public Company Board Memberships During Past 5 Years:
· BBH Mutual Funds Group (5 registered mutual funds), Director (1992-2014)
No. of Portfolios for which Board Member Serves: 33
———————
Joan Gulley (70)
Board Member (2017)
Principal Occupation During Past 5 Years:
· PNC Financial Services Group, Inc.(1993-2014)
· Executive Vice President and Chief Human Resources Officer and Executive Committee Member (2008-2014)
No. of Portfolios for which Board Member Serves: 33
———————
35
BOARD MEMBERS INFORMATION (Unaudited) (continued)
INDEPENDENT BOARD MEMBERS (continued)
Ehud Houminer (77)
Board Member (1993)
Principal Occupation During Past 5 Years:
· Board of Overseers at the Columbia Business School, Columbia University (1992-present)
· Trustee, Ben Gurion University
Other Public Company Board Memberships During Past 5 Years:
· Avnet, Inc., an electronics distributor, Director (1993-2012)
No. of Portfolios for which Board Member Serves: 54
———————
Lynn Martin (77)
Board Member (2012)
Principal Occupation During Past 5 Years:
· President of The Martin Hall Group LLC, a human resources consulting firm (2005-2012)
Other Public Company Board Memberships During Past 5 Years:
· AT&T, Inc., a telecommunications company, Director (1999-2012)
· Ryder System, Inc., a supply chain and transportation management company, Director (1993-2012)
No. of Portfolios for which Board Member Serves: 33
———————
Robin A. Melvin (54)
Board Member (2012)
Principal Occupation During Past 5 Years:
· Co-chairman, Illinois Mentoring Partnership, non-profit organization dedicated to increasing the quantity and quality of mentoring services in Illinois; (2014-present; board member since 2013)
· Director, Boisi Family Foundation, a private family foundation that supports youth-serving organizations that promote the self sufficiency of youth from disadvantaged circumstances (1995-2012)
No. of Portfolios for which Board Member Serves: 102
———————
36
Dr. Martin Peretz (78)
Board Member (2006)
Principal Occupation During Past 5 Years:
· Editor-in-Chief Emeritus of The New Republic Magazine (2011-2012) (previously,
Editor-in-Chief, 1974-2011)
· Lecturer at Harvard University (1969-2012)
No. of Portfolios for which Board Member Serves: 33
———————
Once elected all Board Members serve for an indefinite term, but achieve Emeritus status upon reaching age 80. The address of the Board Members and Officers is c/o The Dreyfus Corporation, 200 Park Avenue, New York, New York 10166. Additional information about the Board Members is available in the fund’s Statement of Additional Information which can be obtained from Dreyfus free of charge by calling this toll free number: 1-800-DREYFUS.
James F. Henry, Emeritus Board Member
Philip L. Toia, Emeritus Board Member
37
OFFICERS OF THE FUND (Unaudited)
BRADLEY J. SKAPYAK, President since January 2010.
Chief Operating Officer and a director of the Manager since June 2009, Chairman of Dreyfus Transfer, Inc., an affiliate of the Manager and the transfer agent of the funds, since May 2011 and Chief Executive Officer of MBSC Securities Corporation since August 2016. He is an officer of 63 investment companies (comprised of 130 portfolios) managed by the Manager. He is 58 years old and has been an employee of the Manager since February 1988.
BENNETT A. MACDOUGALL, Chief Legal Officer since October 2015.
Chief Legal Officer of the Manager and Associate General Counsel and Managing Director of BNY Mellon since June 2015; from June 2005 to June 2015, he served in various capacities with Deutsche Bank – Asset & Wealth Management Division, including as Director and Associate General Counsel, and Chief Legal Officer of Deutsche Investment Management Americas Inc. from June 2012 to May 2015. He is an officer of 64 investment companies (comprised of 155 portfolios) managed by the Manager. He is 45 years old and has been an employee of the Manager since June 2015.
JANETTE E. FARRAGHER, Vice President and Secretary since December 2011.
Associate General Counsel of BNY Mellon, and an officer of 64 investment companies (comprised of 155 portfolios) managed by the Manager. She is 54 years old and has been an employee of the Manager since February 1984.
JAMES BITETTO, Vice President and Assistant Secretary since August 2005.
Managing Counsel of BNY Mellon and Secretary of the Manager, and an officer of 64 investment companies (comprised of 155 portfolios) managed by the Manager. He is 51 years old and has been an employee of the Manager since December 1996.
JOSEPH M. CHIOFFI, Vice President and Assistant Secretary since August 2005.
Managing Counsel of BNY Mellon, and an officer of 64 investment companies (comprised of 155 portfolios) managed by the Manager. He is 55 years old and has been an employee of the Manager since June 2000.
MAUREEN E. KANE, Vice President and Assistant Secretary since April 2015.
Managing Counsel of BNY Mellon since July 2014; from October 2004 until July 2014, General Counsel, and from May 2009 until July 2014, Chief Compliance Officer of Century Capital Management. She is an officer of 64 investment companies (comprised of 155 portfolios) managed by the Manager. She is 55 years old and has been an employee of the Manager since July 2014.
SARAH S. KELLEHER, Vice President and Assistant Secretary since April 2014.
Senior Counsel of BNY Mellon since March 2013, from August 2005 to March 2013, Associate General Counsel of Third Avenue Management. She is an officer of 64 investment companies (comprised of 155 portfolios) managed by the Manager. She is 41 years old and has been an employee of the Manager since March 2013.
JEFF PRUSNOFSKY, Vice President and Assistant Secretary since August 2005.
Senior Managing Counsel of BNY Mellon, and an officer of 64 investment companies (comprised of 155 portfolios) managed by the Manager. He is 52 years old and has been an employee of the Manager since October 1990.
NATALYA ZELENSKY, Vice President and Assistant Secretary since March 2017.
Counsel and Vice President of BNY Mellon since May 2016; Attorney at Wildermuth Endowment Strategy Fund/Wildermuth Advisory, LLC from November 2015 until May 2016; Assistant General Counsel at RCS Advisory Services from July 2014 until November 2015; Associate at Sutherland, Asbill & Brennan from January 2013 until January 2014; Associate at K&L Gates from October 2011 until January 2013. She is an officer of 64 investment companies (comprised of 155 portfolios) managed by Dreyfus. She is 32 years old and has been an employee of the Manager since May 2016.
JAMES WINDELS, Treasurer since November 2001.
Director – Mutual Fund Accounting of the Manager, and an officer of 64 investment companies (comprised of 155 portfolios) managed by the Manager. He is 58 years old and has been an employee of the Manager since April 1985.
38
RICHARD CASSARO, Assistant Treasurer since January 2008.
Senior Accounting Manager – Money Market and Municipal Bond Funds of the Manager, and an officer of 64 investment companies (comprised of 155 portfolios) managed by the Manager. He is 58 years old and has been an employee of the Manager since September 1982.
GAVIN C. REILLY, Assistant Treasurer since December 2005.
Tax Manager of the Investment Accounting and Support Department of the Manager, and an officer of 64 investment companies (comprised of 155 portfolios) managed by the Manager. He is 49 years old and has been an employee of the Manager since April 1991.
ROBERT S. ROBOL, Assistant Treasurer since August 2005.
Senior Accounting Manager – Dreyfus Financial Reporting of the Manager, and an officer of 64 investment companies (comprised of 155 portfolios) managed by the Manager. He is 53 years old and has been an employee of the Manager since October 1988.
ROBERT SALVIOLO, Assistant Treasurer since July 2007.
Senior Accounting Manager – Equity Funds of the Manager, and an officer of 64 investment companies (comprised of 155 portfolios) managed by the Manager. He is 50 years old and has been an employee of the Manager since June 1989.
ROBERT SVAGNA, Assistant Treasurer since December 2002.
Senior Accounting Manager – Fixed Income and Equity Funds of the Manager, and an officer of 64 investment companies (comprised of 155 portfolios) managed by the Manager. He is 50 years old and has been an employee of the Manager since November 1990.
JOSEPH W. CONNOLLY, Chief Compliance Officer since October 2004.
Chief Compliance Officer of the Manager and The Dreyfus Family of Funds (64 investment companies, comprised of 155 portfolios). He is 60 years old and has served in various capacities with the Manager since 1980, including manager of the firm’s Fund Accounting Department from 1997 through October 2001.
CARIDAD M. CAROSELLA, Anti-Money Laundering Compliance Officer since January 2016.
Anti-Money Laundering Compliance Officer of the Dreyfus Family of Funds and BNY Mellon Funds Trust since January 2016; from May 2015 to December 2015, Interim Anti-Money Laundering Compliance Officer of the Dreyfus Family of Funds and BNY Mellon Funds Trust and the Distributor; from January 2012 to May 2015, AML Surveillance Officer of the Distributor and from 2007 to December 2011, Financial Processing Manager of the Distributor. She is an officer of 59 investment companies (comprised of 150 portfolios) managed by the Manager. She is 49 years old and has been an employee of the Distributor since 1997.
39
NOTES
40
NOTES
41
Dreyfus Technology Growth Fund
200 Park Avenue
New York, NY 10166
Manager
The Dreyfus Corporation
200 Park Avenue
New York, NY 10166
Custodian
The Bank of New York Mellon
225 Liberty Street
New York, NY 10286
Transfer Agent &
Dividend Disbursing Agent
Dreyfus Transfer, Inc.
200 Park Avenue
New York, NY 10166
Distributor
MBSC Securities Corporation
200 Park Avenue
New York, NY 10166
| | |
Ticker Symbols: Class A: DTGRX Class C: DTGCX Class I: DGVRX Class Y: DTEYX |
Telephone Call your financial representative or 1-800-DREYFUS
Mail The Dreyfus Family of Funds, 144 Glenn Curtiss Boulevard, Uniondale, NY 11556-0144
E-mail Send your request to info@dreyfus.com
Internet Information can be viewed online or downloaded at www.dreyfus.com
The fund files its complete schedule of portfolio holdings with the Securities and Exchange Commission (“SEC”) for the first and third quarters of each fiscal year on Form N-Q. The fund’s Forms N-Q are available on the SEC’s website at www.sec.gov and may be reviewed and copied at the SEC’s Public Reference Room in Washington, D.C. (phone 1-800-SEC-0330 for information).
A description of the policies and procedures that the fund uses to determine how to vote proxies relating to portfolio securities and information regarding how the fund voted these proxies for the most recent 12-month period ended June 30 is available at www.dreyfus.com and on the SEC’s website at www.sec.gov and without charge, upon request, by calling 1-800-DREYFUS.
| | |
© 2017 MBSC Securities Corporation
0255AR0817 | 
|
Item 2. Code of Ethics.
The Registrant has adopted a code of ethics that applies to the Registrant's principal executive officer, principal financial officer, principal accounting officer or controller, or persons performing similar functions. There have been no amendments to, or waivers in connection with, the Code of Ethics during the period covered by this Report.
Item 3. Audit Committee Financial Expert.
The Registrant's Board has determined that Mr. David P. Feldman, a member of the Audit Committee of the Board, is an audit committee financial expert as defined by the Securities and Exchange Commission (the "SEC"). Mr. Feldman is "independent" as defined by the SEC for purposes of audit committee financial expert determinations.
Item 4. Principal Accountant Fees and Services.
(a) Audit Fees. The aggregate fees billed for each of the last two fiscal years (the "Reporting Periods") for professional services rendered by the Registrant's principal accountant (the "Auditor") for the audit of the Registrant's annual financial statements or services that are normally provided by the Auditor in connection with the statutory and regulatory filings or engagements for the Reporting Periods, were $203,136 in 2016 and $173,510 in 2017.
(b) Audit-Related Fees. The aggregate fees billed in the Reporting Periods for assurance and related services by the Auditor that are reasonably related to the performance of the audit of the Registrant's financial statements and are not reported under paragraph (a) of this Item 4 were $38,580 in 2016 and $47,555 in 2017. These services consisted of one or more of the following: (i) agreed upon procedures related to compliance with Internal Revenue Code section 817(h), (ii) security counts required by Rule 17f-2 under the Investment Company Act of 1940, as amended, (iii) advisory services as to the accounting or disclosure treatment of Registrant transactions or events and (iv) advisory services to the accounting or disclosure treatment of the actual or potential impact to the Registrant of final or proposed rules, standards or interpretations by the Securities and Exchange Commission, the Financial Accounting Standards Boards or other regulatory or standard-setting bodies.
The aggregate fees billed in the Reporting Periods for non-audit assurance and related services by the Auditor to the Registrant's investment adviser (not including any sub-investment adviser whose role is primarily portfolio management and is subcontracted with or overseen by another investment adviser), and any entity controlling, controlled by or under common control with the investment adviser that provides ongoing services to the Registrant ("Service Affiliates"), that were reasonably related to the performance of the annual audit of the Service Affiliate, which required pre-approval by the Audit Committee were $0 in 2016 and $0 in 2017.
(c) Tax Fees. The aggregate fees billed in the Reporting Periods for professional services rendered by the Auditor for tax compliance, tax advice, and tax planning ("Tax Services") were $22,871 in 2016 and $14,174 in 2017. These services consisted of: (i) review or preparation of U.S. federal, state, local and excise tax returns; (ii) U.S. federal, state and local tax planning, advice and assistance regarding statutory, regulatory or administrative developments; (iii) tax advice regarding tax qualification matters and/or treatment of various financial instruments held or proposed to be acquired or held, and (iv) determination of Passive Foreign Investment Companies. The aggregate fees billed in the Reporting Periods for Tax Services by the Auditor to Service Affiliates, which required pre-approval by the Audit Committee were $0 in 2016 and $0 in 2017.
(d) All Other Fees. The aggregate fees billed in the Reporting Periods for products and services provided by the Auditor, other than the services reported in paragraphs (a) through (c) of this Item, were $8,262 in 2016 and $8,700 in 2017. These services consisted of a review of the Registrant's anti-money laundering program.
The aggregate fees billed in the Reporting Periods for Non-Audit Services by the Auditor to Service Affiliates, other than the services reported in paragraphs (b) through (c) of this Item, which required pre-approval by the Audit Committee, were $0 in 2016 and $0 in 2017.
(e)(1) Audit Committee Pre-Approval Policies and Procedures. The Registrant's Audit Committee has established policies and procedures (the "Policy") for pre-approval (within specified fee limits) of the Auditor's engagements for non-audit services to the Registrant and Service Affiliates without specific case-by-case consideration. The pre-approved services in the Policy can include pre-approved audit services, pre-approved audit-related services, pre-approved tax services and pre-approved all other services. Pre-approval considerations include whether the proposed services are compatible with maintaining the Auditor's independence. Pre-approvals pursuant to the Policy are considered annually.
(e)(2) Note. None of the services described in paragraphs (b) through (d) of this Item 4 were approved by the Audit Committee pursuant to paragraph (c)(7)(i)(C) of Rule 2-01 of Regulation S-X.
(f) None of the hours expended on the principal accountant's engagement to audit the registrant's financial statements for the most recent fiscal year were attributed to work performed by persons other than the principal account's full-time, permanent employees.
Non-Audit Fees. The aggregate non-audit fees billed by the Auditor for services rendered to the Registrant, and rendered to Service Affiliates, for the Reporting Periods were $20,260,418 in 2016 and $29,586,733 in 2017.
Auditor Independence. The Registrant's Audit Committee has considered whether the provision of non-audit services that were rendered to Service Affiliates, which were not pre-approved (not requiring pre-approval), is compatible with maintaining the Auditor's independence.
Item 5. Audit Committee of Listed Registrants.
Not applicable.
Item 6. Investments.
(a) Not applicable.
Item 7. Disclosure of Proxy Voting Policies and Procedures for Closed-End Management Investment Companies.
Not applicable.
Item 8. Portfolio Managers of Closed-End Management Investment Companies.
Not applicable.
Item 9. Purchases of Equity Securities by Closed-End Management Investment Companies and Affiliated Purchasers.
Not applicable.
Item 10. Submission of Matters to a Vote of Security Holders.
There have been no material changes to the procedures applicable to Item 10.
Item 11. Controls and Procedures.
(a) The Registrant's principal executive and principal financial officers have concluded, based on their evaluation of the Registrant's disclosure controls and procedures as of a date within 90 days of the filing date of this report, that the Registrant's disclosure controls and procedures are reasonably designed to ensure that information required to be disclosed by the Registrant on Form N-CSR is recorded, processed, summarized and reported within the required time periods and that information required to be disclosed by the Registrant in the reports that it files or submits on Form N-CSR is accumulated and communicated to the Registrant's management, including its principal executive and principal financial officers, as appropriate to allow timely decisions regarding required disclosure.
(b) There were no changes to the Registrant's internal control over financial reporting that occurred during the second fiscal quarter of the period covered by this report that have materially affected, or are reasonably likely to materially affect, the Registrant's internal control over financial reporting.
Item 12. Exhibits.
(a)(1) Code of ethics referred to in Item 2.
(a)(2) Certifications of principal executive and principal financial officers as required by Rule 30a-2(a) under the Investment Company Act of 1940.
(a)(3) Not applicable.
(b) Certification of principal executive and principal financial officers as required by Rule 30a-2(b) under the Investment Company Act of 1940.
SIGNATURES
Pursuant to the requirements of the Securities Exchange Act of 1934 and the Investment Company Act of 1940, the Registrant has duly caused this Report to be signed on its behalf by the undersigned, thereunto duly authorized.
Advantage Funds, Inc.
By: /s/ Bradley J. Skapyak
Bradley J. Skapyak
President
Date: October 27, 2017
Pursuant to the requirements of the Securities Exchange Act of 1934 and the Investment Company Act of 1940, this Report has been signed below by the following persons on behalf of the Registrant and in the capacities and on the dates indicated.
By: /s/ Bradley J. Skapyak
Bradley J. Skapyak
President
Date: October 27, 2017
By: /s/ James Windels
James Windels
Treasurer
Date: October 27, 2017
EXHIBIT INDEX
(a)(1) Code of ethics referred to in Item 2.
(a)(2) Certifications of principal executive and principal financial officers as required by Rule 30a-2(a) under the Investment Company Act of 1940. (EX-99.CERT)
(b) Certification of principal executive and principal financial officers as required by Rule 30a-2(b) under the Investment Company Act of 1940. (EX-99.906CERT)


