We are pleased to present this annual report for Dynamic Total Return Fund, covering the 12-month period from November 1, 2016 through October 31, 2017. For information about how the fund performed during the reporting period, as well as general market perspectives, we provide a Discussion of Fund Performance on the pages that follow.
Stocks set a series of new record highs and bonds produced mixed results over the past year in response to changing economic and political conditions. Financial markets at the start of the reporting period were dominated by the election of a new U.S. presidential administration. Equities and corporate-backed bonds surged higher in anticipation of more business-friendly regulatory, tax, and fiscal policies, but high-quality bonds generally lost value due to expectations of rising interest rates and accelerating inflation in a stronger economy. Despite a series of short-term interest-rate hikes, bonds recovered their previous losses over the first 10 months of 2017 when it became clearer that pro-growth legislation would take time and political capital to enact. U.S. and international stocks continued to rally as corporate earnings grew and global economic conditions improved.
The markets’ recent strong performance has been supported by solid underlying fundamentals. While we currently expect these favorable conditions to persist, we remain watchful for economic and political developments that could derail the markets. As always, we encourage you to discuss the risks and opportunities of today’s investment environment with your financial advisor.
Thank you for your continued confidence and support.
DISCUSSION OF FUND PERFORMANCE
For the period from November 1, 2016 through October 31, 2017, as provided by portfolio managers Vassilis Dagioglu, James Stavena, Torrey Zaches, Joseph Miletich, and Sinead Colton, of Mellon Capital Management Corporation, Sub-Investment Adviser
Market and Fund Performance Overview
For the 12-month period ended October 31, 2017, Dynamic Total Return Fund’s Class A shares produced a total return of 5.92%, Class C shares returned 5.14%, Class I shares returned 6.17%, and Class Y shares returned 6.23%.1 In comparison, the fund’s benchmarks, the Citi Three-Month U.S. Treasury Bill Index, the MSCI World Index, and an index comprised of 60% MSCI World Index and 40% Citi World Government Bond Index (the “Hybrid Index”) returned 0.71%, 22.77%, and 13.30%, respectively.2,3,4,5
Stocks rallied over the reporting period amid improving global economic growth, but bonds fared less well due to rising interest rates. The fund produced a solidly positive return, but lagged its equity and hybrid indices due to the underperformance of U.S. Treasury bonds and Australian government bonds compared to their counterparts in Germany and the United Kingdom.
The Fund’s Investment Approach
The fund seeks total return. To pursue its goal, the fund normally invests in instruments that provide investment exposure to global equity, bond, currency and commodity markets, and in fixed-income securities. The fund may invest in instruments that provide economic exposure to developed and, to a limited extent, emerging market issuers.
The fund will seek to achieve investment exposure to global equity, bond, currency and commodity markets primarily through long and short positions in futures, options, forward contracts, swap agreements or exchange-traded funds (ETFs), and normally will use economic leverage as part of its investment strategy. The fund also may invest in fixed-income securities, such as bonds, notes (including structured notes) and money market instruments, and including foreign government obligations and securities of supranational entities, to provide exposure to bond markets and for liquidity and income, as well as hold cash.
The fund’s portfolio managers apply a systematic, analytical investment approach designed to identify and exploit relative misvaluation opportunities across and within global capital markets. The portfolio managers update, monitor, and follow buy or sell recommendations using proprietary investment models. Among equity markets, the portfolio managers employ a bottom-up valuation approach using proprietary models to derive market-level expected returns. For bond markets, the portfolio managers use proprietary models to identify temporary mispricing among global bond markets. For currency markets, the portfolio managers evaluate currencies on a relative valuation basis and overweight exposure to currencies that are undervalued. For commodities, the portfolio managers seek to identify opportunities in commodity markets by measuring and evaluating inventory and term structure, hedging and speculative activity as well as momentum. The investment process combines fundamental and momentum signals in a quantitative framework.
Post-Election Optimism and Synchronized Global Growth
Surprisingly strong economic improvement in Europe, rebounding oil prices, and expectations of U.S. government policy reforms unleashed a wave of investor optimism, causing global equities to surge higher over the reporting period. Other risky assets, such as high yield bonds and emerging market debt, also produced strong gains.
After bottoming in the months before the start of the reporting period, government bond yields rose across the globe, and their prices fell commensurately. Yields of U.S. Treasury bonds were volatile, but rose substantially over the reporting period. Oil prices continued to recover, in part due to production caps imposed by the Organization of the Petroleum Exporting Countries (OPEC).
The Federal Reserve Board (the “Fed”) raised short-term interest rates gradually, implementing rate hikes of 0.25 percentage points in December 2016, March 2017, and June 2017. Many analysts expect an additional rate hike in December 2017 and at least two more in 2018. In addition, in October 2017, the Fed began the process of reducing its balance sheet, and, just days after the reporting period’s end, a new Fed chair was named to replace Janet Yellen. Although other central banks have maintained aggressively accommodative monetary policies, positive economic momentum has led to expectations that they also will begin to wind down their quantitative easing programs.
3
DISCUSSION OF FUND PERFORMANCE (continued)
Bonds and Currencies Dampened Relative Results
The fund’s positive absolute return for the reporting period stemmed largely from broad exposure to global equity markets, particularly long positions in the United States, United Kingdom, Japan, and Germany. However, the fund lagged most growth-oriented indices due to its exposure to global bond markets and a weakening U.S. dollar.
The fund’s exposure to U.S. Treasury bonds and Australian government bonds undermined relative results, and the resulting weakness was insufficiently offset by short positions in U.K. and German government bonds. In addition, a broad weakening of the U.S. dollar later in the reporting period hurt relative performance. The fund hedges almost all foreign currency exposures as a matter of policy, so a strong U.S. dollar typically is positive for the fund while weakening trends tend to be negative. Active currency positioning further weighed on relative results when the euro and British pound gained value against the U.S. dollar throughout 2017.
Throughout the reporting period, the fund employed futures and options contracts to establish its positions in equity, fixed income, currency, and commodities markets.
Positioned for Continued Growth
We continue to expect modest global growth and contained global inflation, which should allow central banks to withdraw gradually from stimulative policies. Moreover, corporate earnings growth could spark further gains in global equity markets.
Most notably, positive economic trends have led us to increase the fund’s international equity exposure, particularly in Europe and Japan. We also have maintained long positions in higher-yielding government bonds in the United States, Australia, and Canada, as well as short positions in U.K. and German bonds. Finally, we have continued to favor the U.S. dollar versus the Japanese yen and British pound.
November 15, 2017
1 Total return includes reinvestment of dividends and any capital gains paid, and does not take into consideration the maximum initial sales charge in the case of Class A shares, or the applicable contingent deferred sales charge imposed on redemptions in the case of Class C shares. Had these charges been reflected, returns would have been lower. Share price, yield, and investment return fluctuate such that upon redemption, fund shares may be worth more or less than their original cost. Past performance is no guarantee of future results. The fund’s returns reflect the absorption of certain fund expenses by The Dreyfus Corporation pursuant to an agreement in effect through March 1, 2018, at which time it may be extended, terminated, or modified.
2 Source: Lipper Inc. — Reflects reinvestment of net dividends and, where applicable, capital gain distributions. The MSCI World Index is a free float-adjusted market capitalization-weighted index that is designed to measure the equity market performance of developed markets. Investors cannot invest directly in any index.
3 Source: Lipper Inc. — The Citi Three-Month U.S. Treasury Bill Index consists of the last Three-month Treasury bill month-end rates. The Citi Three-Month U.S. Treasury Bill Index measures return equivalents of yield averages. The instruments are not marked to market. Investors cannot invest directly in any index.
4 Source: Lipper Inc. — The Citi World Government Bond Index (the “WGB Index”) measures the performance of fixed-rate, local-currency, investment-grade sovereign bonds. The WGB Index is a widely used benchmark that currently comprises sovereign debt from over 20 countries, denominated in a variety of currencies, and has more than 25 years of history available. The WGB Index provides a broad benchmark for the global sovereign fixed-income market. Investors cannot invest directly in any index.
5 Source: FactSet —The Hybrid Index is an unmanaged hybrid index composed of 60% MSCI World Index and 40% WGB Index. Investors cannot invest directly in any index.
Equities are subject generally to market, market sector, market liquidity, issuer, and investment style risks, among other factors, to varying degrees, all of which are more fully described in the fund’s prospectus.
Bonds are subject generally to interest-rate, credit, liquidity, call, sector, and market risks, to varying degrees, all of which are more fully described in the fund’s prospectus.
Investing internationally involves special risks, including changes in currency exchange rates, political, economic, and social instability, a lack of comprehensive company information, differing auditing and legal standards, and less market liquidity. These risks generally are greater with emerging market countries than with more economically and politically established foreign countries.
Investments in foreign currencies are subject to the risk that those currencies will decline in value relative to the U.S. dollar, or, in the case of hedged positions, that the U.S. dollar will decline relative to the currency being hedged.
Exposure to the commodities markets may subject the fund to greater volatility than investments in traditional securities. The values of commodities and commodity-linked investments are affected by events that might have less impact on the values of stocks and bonds. Investments linked to the prices of commodities are considered speculative. Prices of commodities and related contracts may fluctuate significantly over short periods for a variety of factors.
4
FUND PERFORMANCE

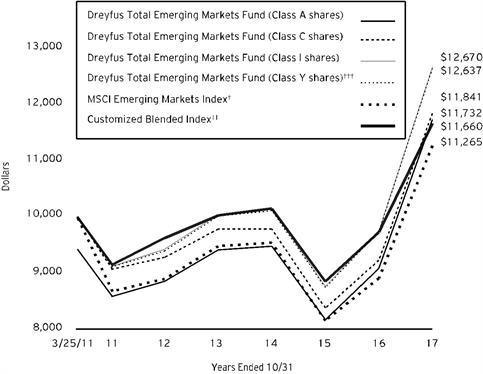
Comparison of change in value of $10,000 investment in Dynamic Total Return Fund Class A shares, Class C shares, Class I shares and Class Y shares and the MSCI World Index, Citi Three-Month U.S. Treasury Bill Index and an index comprised of 60% MSCI World Index and 40% Citi World Government Bond Index (the “Hybrid Index”)
† Source: FactSet
†† Source: Lipper Inc.
††† The total return figures presented for Class Y shares of the fund reflect the performance of the fund’s Class A shares for the period prior to 7/1/13 (inception date for Class Y shares), not reflecting the applicable sales charges for Class A shares.
Past performance is not predictive of future performance.
The above graph compares a $10,000 investment made in each of the Class A, Class C, Class I and Class Y shares of Dynamic Total Return Fund on 10/31/07 to a $10,000 investment made on that date in each of the following: MSCI World Index, Citi Three-Month U.S. Treasury Bill Index and the Hybrid Index. Returns assume all dividends and capital gain distributions are reinvested.
The fund’s performance shown in the line graph above takes into account the maximum initial sales charge on Class A shares and all other applicable fees and expenses on all classes. The MSCI World Index is a free float-adjusted market capitalization-weighted index that is designed to measure the equity market performance of developed markets. The Citi Three-Month U.S. Treasury Bill Index consists of the last three-month Treasury bill month-end rates. The Citi Three-Month U.S. Treasury Bill Index measures returns equivalent of yield averages. The instruments are not marked to market. The Citi World Government Bond Index (the “WGB Index”) measures the performance of fixed-rate, local currency, investment-grade sovereign bonds. The WGB Index is a widely used benchmark that currently comprises sovereign debt from over 20 countries, denominated in a variety of currencies, and has more than 25 years of history available. The WGB Index provides a broad benchmark for the global sovereign fixed income market. Unlike a mutual fund, the indices are not subject to charges, fees and other expenses. Investors cannot invest directly in any index. Further information relating to fund performance, including expense reimbursements, if applicable, is contained in the Financial Highlights section of the prospectus and elsewhere in this report.
5
FUND PERFORMANCE (continued)
| | | | | |
Average Annual Total Returns as of 10/31/17 |
| | Inception | | | |
| | Date | 1 Year | 5 Years | 10 Years |
Class A shares | | | | |
with maximum sales charge (5.75%) | 5/2/06 | -0.17% | 4.71% | 1.75% |
without sales charge | 5/2/06 | 5.92% | 5.95% | 2.35% |
Class C shares | | | | |
with applicable redemption charge † | 5/2/06 | 4.14% | 5.17% | 1.59% |
without redemption | 5/2/06 | 5.14% | 5.17% | 1.59% |
Class I shares | 5/2/06 | 6.17% | 6.23% | 2.69% |
Class Y shares | 7/1/13 | 6.23% | 6.49%†† | 2.62%†† |
MSCI World Index | | 22.77% | 11.56% | 4.10% |
Citi Three-Month U.S. Treasury Bill Index | 0.71% | 0.21% | 0.39% |
Hybrid Index | | 13.30% | 6.76% | 3.88% |
† The maximum contingent deferred sales charge for Class C shares is 1% for shares redeemed within one year of the date of purchase.
†† The total return performance figures presented for Class Y shares of the fund reflect the performance of the fund’s Class A shares for the period prior to 7/1/13 (inception date for Class Y shares), not reflecting the applicable sales charges for class A shares.
The performance data quoted represents past performance, which is no guarantee of future results. Share price and investment return fluctuate and an investor’s shares may be worth more or less than original cost upon redemption. Current performance may be lower or higher than the performance quoted. Go to Dreyfus.com for the fund’s most recent month-end returns.
The fund’s performance shown in the graph and table does not reflect the deduction of taxes that a shareholder would pay on fund distributions or the redemption of fund shares. In addition to the performance of Class A shares shown with and without a maximum sales charge, the fund’s performance shown in the table takes into account all other applicable fees and expenses on all classes.
6
UNDERSTANDING YOUR FUND’S EXPENSES (Unaudited)
As a mutual fund investor, you pay ongoing expenses, such as management fees and other expenses. Using the information below, you can estimate how these expenses affect your investment and compare them with the expenses of other funds. You also may pay one-time transaction expenses, including sales charges (loads) and redemption fees, which are not shown in this section and would have resulted in higher total expenses. For more information, see your fund’s prospectus or talk to your financial adviser.
Review your fund’s expenses
The table below shows the expenses you would have paid on a $1,000 investment in Dynamic Total Return Fund from May 1, 2017 to October 31, 2017. It also shows how much a $1,000 investment would be worth at the close of the period, assuming actual returns and expenses.
| | | | | | | | | | | |
Expenses and Value of a $1,000 Investment | | |
assuming actual returns for the six months ended October 31, 2017 |
| | | Class A | | Class C | | Class I | | Class Y |
Expenses paid per $1,000† | | $7.47 | | $11.31 | | $6.19 | | $5.93 |
Ending value (after expenses) | | $1,044.00 | | $1,040.10 | | $1,045.40 | | $1,045.40 |
COMPARING YOUR FUND’S EXPENSES
WITH THOSE OF OTHER FUNDS (Unaudited)
Using the SEC’s method to compare expenses
The Securities and Exchange Commission (“SEC”) has established guidelines to help investors assess fund expenses. Per these guidelines, the table below shows your fund’s expenses based on a $1,000 investment, assuming a hypothetical 5% annualized return. You can use this information to compare the ongoing expenses (but not transaction expenses or total cost) of investing in the fund with those of other funds. All mutual fund shareholder reports will provide this information to help you make this comparison. Please note that you cannot use this information to estimate your actual ending account balance and expenses paid during the period.
| | | | | | | | | |
Expenses and Value of a $1,000 Investment |
assuming a hypothetical 5% annualized return for the six months ended October 31, 2017 |
| | | Class A | | Class C | | Class I | | Class Y |
Expenses paid per $1,000† | | $7.37 | | $11.17 | | $6.11 | | $5.85 |
Ending value (after expenses) | | $1,017.90 | | $1,014.12 | | $1,019.16 | | $1,019.41 |
† Expenses are equal to the fund’s annualized expense ratio of 1.45% for Class A, 2.20% for Class C, 1.20% for Class I and 1.15% for Class Y, multiplied by the average account value over the period, multiplied by 184/365 (to reflect the one-half year period).
7
CONSOLIDATED STATEMENT OF INVESTMENTS
October 31, 2017
| | | | | | | | | | |
| |
Description | Coupon
Rate (%) | | Maturity
Date | | Principal
Amount ($) | a | Value ($) | |
Bonds and Notes - 4.7% | | | | | |
Consumer Discretionary - 1.2% | | | | | |
Adient Global Holdings,
Gtd. Notes | | 4.88 | | 8/15/26 | | 75,000 | b | 77,531 | |
Allison Transmission,
Gtd. Notes | | 5.00 | | 10/1/24 | | 75,000 | b | 78,375 | |
Altice,
Gtd. Notes | | 7.75 | | 5/15/22 | | 350,000 | b | 371,000 | |
Altice,
Gtd. Notes | | 7.63 | | 2/15/25 | | 75,000 | b | 81,656 | |
Altice Financing,
Sr. Scd. Bonds | | 7.50 | | 5/15/26 | | 150,000 | b | 165,187 | |
Altice Financing,
Sr. Scd. Notes | | 6.63 | | 2/15/23 | | 150,000 | b | 158,490 | |
Altice Financing,
Sr. Unscd. Notes | | 6.50 | | 1/15/22 | | 75,000 | b | 77,813 | |
Altice US Finance I,
Gtd. Notes | | 5.38 | | 7/15/23 | | 75,000 | b | 78,375 | |
AMC Entertainment Holdings,
Gtd. Notes | | 5.75 | | 6/15/25 | | 75,000 | | 73,313 | |
AMC Entertainment Holdings,
Gtd. Notes | | 5.88 | | 11/15/26 | | 75,000 | | 73,406 | |
AMC Networks,
Gtd. Notes | | 4.75 | | 12/15/22 | | 75,000 | | 77,156 | |
AMC Networks,
Gtd. Notes | | 5.00 | | 4/1/24 | | 75,000 | | 76,547 | |
American Axle & Manufacturing,
Gtd. Notes | | 6.63 | | 10/15/22 | | 125,000 | | 129,609 | |
American Tire Distributors,
Sr. Sub. Notes | | 10.25 | | 3/1/22 | | 125,000 | b | 130,937 | |
Aramark Services,
Gtd. Notes | | 4.75 | | 6/1/26 | | 75,000 | | 78,636 | |
Aston Martin Capital Holdings,
Sr. Scd. Notes | | 6.50 | | 4/15/22 | | 50,000 | b | 53,313 | |
AV Homes,
Gtd. Notes | | 6.63 | | 5/15/22 | | 75,000 | | 77,978 | |
Avis Budget Car Rental,
Sr. Unscd. Notes | | 5.50 | | 4/1/23 | | 75,000 | | 76,219 | |
Beazer Homes USA,
Gtd. Notes | | 8.75 | | 3/15/22 | | 125,000 | | 139,212 | |
Boyd Gaming,
Gtd. Notes | | 6.88 | | 5/15/23 | | 75,000 | | 80,812 | |
Boyd Gaming,
Gtd. Notes | | 6.38 | | 4/1/26 | | 75,000 | | 82,500 | |
Cablevision Systems,
Sr. Unscd. Notes | | 8.00 | | 4/15/20 | | 50,000 | | 55,500 | |
8
| | | | | | | | | | |
| |
Description | Coupon
Rate (%) | | Maturity
Date | | Principal
Amount ($) | a | Value ($) | |
Bonds and Notes - 4.7% (continued) | | | | | |
Consumer Discretionary - 1.2% (continued) | | | | | |
Cablevision Systems,
Sr. Unscd. Notes | | 5.88 | | 9/15/22 | | 130,000 | | 134,062 | |
CalAtlantic Group,
Gtd. Notes | | 5.88 | | 11/15/24 | | 100,000 | | 111,750 | |
CCO Holdings,
Sr. Unscd. Notes | | 5.13 | | 2/15/23 | | 200,000 | | 207,000 | |
CCO Holdings,
Sr. Unscd. Notes | | 5.75 | | 9/1/23 | | 120,000 | | 124,650 | |
CCO Holdings,
Sr. Unscd. Notes | | 5.88 | | 4/1/24 | | 75,000 | b | 80,062 | |
CCO Holdings,
Sr. Unscd. Notes | | 5.75 | | 2/15/26 | | 200,000 | b | 209,570 | |
CCO Holdings,
Sr. Unscd. Notes | | 5.50 | | 5/1/26 | | 75,000 | b | 77,063 | |
CCO Holdings,
Sr. Unscd. Notes | | 5.13 | | 5/1/27 | | 200,000 | b | 202,250 | |
Cengage Learning,
Sr. Unscd. Notes | | 9.50 | | 6/15/24 | | 50,000 | b | 45,313 | |
Cequel Communications Holdings I,
Sr. Unscd. Notes | | 5.13 | | 12/15/21 | | 350,000 | b | 357,875 | |
Cinemark USA,
Gtd. Notes | | 4.88 | | 6/1/23 | | 75,000 | | 76,781 | |
Clear Channel Worldwide Holdings,
Gtd. Notes, Ser. B | | 7.63 | | 3/15/20 | | 150,000 | | 150,375 | |
Cooper-Standard Automotive,
Gtd. Notes | | 5.63 | | 11/15/26 | | 50,000 | b | 52,000 | |
CSC Holdings,
Gtd. Notes | | 10.13 | | 1/15/23 | | 200,000 | b | 229,500 | |
CSC Holdings,
Sr. Scd. Notes | | 5.50 | | 4/15/27 | | 75,000 | b | 77,438 | |
CSC Holdings,
Sr. Unscd. Notes | | 6.75 | | 11/15/21 | | 50,000 | | 55,250 | |
Dana,
Sr. Unscd. Notes | | 5.50 | | 12/15/24 | | 100,000 | | 106,000 | |
DISH DBS,
Gtd. Notes | | 7.88 | | 9/1/19 | | 50,000 | | 54,150 | |
DISH DBS,
Gtd. Notes | | 6.75 | | 6/1/21 | | 150,000 | | 157,875 | |
DISH DBS,
Gtd. Notes | | 5.88 | | 7/15/22 | | 300,000 | | 303,000 | |
DISH DBS,
Gtd. Notes | | 7.75 | | 7/1/26 | | 300,000 | | 329,250 | |
Dollar Tree,
Gtd. Notes | | 5.75 | | 3/1/23 | | 300,000 | | 316,875 | |
Fiat Chrysler Automobiles,
Gtd. Notes | | 5.25 | | 4/15/23 | | 75,000 | | 79,875 | |
9
CONSOLIDATED STATEMENT OF INVESTMENTS (continued)
| | | | | | | | | | |
| |
Description | Coupon
Rate (%) | | Maturity
Date | | Principal
Amount ($) | a | Value ($) | |
Bonds and Notes - 4.7% (continued) | | | | | |
Consumer Discretionary - 1.2% (continued) | | | | | |
Fiat Chrysler Automobiles,
Sr. Unscd. Notes | | 4.50 | | 4/15/20 | | 125,000 | | 130,469 | |
GLP Capital,
Gtd. Notes | | 4.38 | | 11/1/18 | | 75,000 | | 75,938 | |
GLP Capital,
Gtd. Notes | | 4.88 | | 11/1/20 | | 50,000 | | 53,119 | |
GLP Capital,
Gtd. Notes | | 4.38 | | 4/15/21 | | 50,000 | | 52,375 | |
GLP Capital,
Gtd. Notes | | 5.38 | | 11/1/23 | | 75,000 | | 81,844 | |
GLP Capital,
Gtd. Notes | | 5.38 | | 4/15/26 | | 75,000 | | 81,375 | |
Golden Nugget,
Sr. Unscd. Notes | | 6.75 | | 10/15/24 | | 75,000 | b | 76,500 | |
Goodyear Tire & Rubber,
Gtd. Notes | | 5.13 | | 11/15/23 | | 75,000 | | 77,531 | |
Goodyear Tire & Rubber,
Gtd. Notes | | 5.00 | | 5/31/26 | | 75,000 | | 77,156 | |
Goodyear Tire & Rubber,
Gtd. Notes | | 4.88 | | 3/15/27 | | 125,000 | | 127,500 | |
Gray Television,
Gtd. Notes | | 5.13 | | 10/15/24 | | 75,000 | b | 74,978 | |
Gray Television,
Sr. Unscd. Notes | | 5.88 | | 7/15/26 | | 75,000 | b | 77,063 | |
Group 1 Automotive,
Gtd. Notes | | 5.00 | | 6/1/22 | | 75,000 | | 77,790 | |
Hanesbrands,
Gtd. Notes | | 4.88 | | 5/15/26 | | 75,000 | b | 77,625 | |
Hilton Domestic Operating,
Gtd. Notes | | 4.25 | | 9/1/24 | | 75,000 | | 76,781 | |
Hilton Worldwide Finance,
Gtd. Notes | | 4.63 | | 4/1/25 | | 250,000 | | 258,437 | |
iHeartCommunications,
Sr. Scd. Notes | | 9.00 | | 12/15/19 | | 125,000 | | 92,812 | |
iHeartCommunications,
Sr. Scd. Notes | | 9.00 | | 3/1/21 | | 300,000 | | 217,125 | |
IHO Verwaltungs,
Sr. Scd. Bonds | | 4.13 | | 9/15/21 | | 50,000 | b | 51,125 | |
International Game Technology,
Sr. Scd. Notes | | 5.63 | | 2/15/20 | | 125,000 | b | 133,344 | |
International Game Technology,
Sr. Scd. Notes | | 6.25 | | 2/15/22 | | 125,000 | b | 138,087 | |
International Game Technology,
Sr. Scd. Notes | | 6.50 | | 2/15/25 | | 75,000 | b | 84,562 | |
J.C. Penney,
Gtd. Notes | | 6.38 | | 10/15/36 | | 100,000 | | 59,250 | |
10
| | | | | | | | | | |
| |
Description | Coupon
Rate (%) | | Maturity
Date | | Principal
Amount ($) | a | Value ($) | |
Bonds and Notes - 4.7% (continued) | | | | | |
Consumer Discretionary - 1.2% (continued) | | | | | |
Jack Ohio Finance,
Sr. Scd. Notes | | 6.75 | | 11/15/21 | | 75,000 | b | 80,250 | |
Jaguar Land Rover Automotive,
Gtd. Notes | | 4.13 | | 12/15/18 | | 75,000 | b | 76,781 | |
Jaguar Land Rover Automotive,
Gtd. Notes | | 4.25 | | 11/15/19 | | 75,000 | b | 77,531 | |
Jaguar Land Rover Automotive,
Gtd. Notes | | 5.63 | | 2/1/23 | | 75,000 | b | 77,531 | |
KFC Holding,
Gtd. Notes | | 5.25 | | 6/1/26 | | 75,000 | b | 79,886 | |
L Brands,
Gtd. Notes | | 8.50 | | 6/15/19 | | 50,000 | | 54,875 | |
L Brands,
Gtd. Notes | | 5.63 | | 2/15/22 | | 200,000 | | 214,900 | |
L Brands,
Gtd. Notes | | 6.88 | | 11/1/35 | | 75,000 | | 74,813 | |
L Brands,
Sr. Unscd. Notes | | 6.75 | | 7/1/36 | | 75,000 | | 73,688 | |
Lamar Media,
Gtd. Notes | | 5.00 | | 5/1/23 | | 75,000 | | 77,822 | |
Lamar Media,
Gtd. Notes | | 5.38 | | 1/15/24 | | 75,000 | | 79,125 | |
Lee Enterprises,
Gtd. Notes | | 9.50 | | 3/15/22 | | 50,000 | b | 51,875 | |
Lennar,
Gtd. Notes | | 4.50 | | 6/15/19 | | 75,000 | | 77,719 | |
Lennar,
Gtd. Notes | | 4.13 | | 1/15/22 | | 125,000 | | 129,375 | |
Lennar,
Gtd. Notes | | 4.75 | | 11/15/22 | | 75,000 | | 79,500 | |
Lions Gate Entertainment,
Gtd. Notes | | 5.88 | | 11/1/24 | | 75,000 | b | 79,875 | |
Live Nation Entertainment,
Gtd. Notes | | 4.88 | | 11/1/24 | | 75,000 | b | 77,788 | |
LKQ,
Sr. Scd. Notes | | 4.75 | | 5/15/23 | | 75,000 | | 77,438 | |
McClatchy,
Gtd. Notes | | 9.00 | | 12/15/22 | | 75,000 | | 78,375 | |
McClatchy,
Sr. Unscd. Debs. | | 6.88 | | 3/15/29 | | 100,000 | | 87,750 | |
MDC Holdings,
Gtd. Notes | | 6.00 | | 1/15/43 | | 100,000 | | 96,445 | |
Men's Wearhouse,
Gtd. Notes | | 7.00 | | 7/1/22 | | 75,000 | | 72,281 | |
MGM Resorts International,
Gtd. Notes | | 6.75 | | 10/1/20 | | 50,000 | | 55,125 | |
11
CONSOLIDATED STATEMENT OF INVESTMENTS (continued)
| | | | | | | | | | |
| |
Description | Coupon
Rate (%) | | Maturity
Date | | Principal
Amount ($) | a | Value ($) | |
Bonds and Notes - 4.7% (continued) | | | | | |
Consumer Discretionary - 1.2% (continued) | | | | | |
MGM Resorts International,
Gtd. Notes | | 6.63 | | 12/15/21 | | 225,000 | | 252,000 | |
MGM Resorts International,
Gtd. Notes | | 7.75 | | 3/15/22 | | 75,000 | | 87,304 | |
MGM Resorts International,
Gtd. Notes | | 6.00 | | 3/15/23 | | 75,000 | | 82,417 | |
Michaels Stores,
Sr. Unscd. Notes | | 5.88 | | 12/15/20 | | 75,000 | b | 76,500 | |
Mohegan Gaming & Entertainment,
Gtd. Notes | | 7.88 | | 10/15/24 | | 75,000 | b | 80,156 | |
Monitronics International,
Gtd. Notes | | 9.13 | | 4/1/20 | | 225,000 | | 196,312 | |
Netflix,
Sr. Unscd. Notes | | 5.50 | | 2/15/22 | | 125,000 | | 135,141 | |
Netflix,
Sr. Unscd. Notes | | 5.88 | | 2/15/25 | | 75,000 | | 81,157 | |
Netflix,
Sr. Unscd. Notes | | 4.38 | | 11/15/26 | | 75,000 | b | 73,688 | |
New Red Finance,
Sr. Scd. Notes | | 4.63 | | 1/15/22 | | 50,000 | b | 51,290 | |
Nexstar Broadcasting,
Gtd. Notes | | 5.63 | | 8/1/24 | | 75,000 | b | 77,156 | |
Nielsen Finance,
Gtd. Notes | | 5.00 | | 4/15/22 | | 350,000 | b | 361,331 | |
Outfront Media Capital,
Gtd. Notes | | 5.25 | | 2/15/22 | | 125,000 | | 129,531 | |
Outfront Media Capital,
Gtd. Notes | | 5.63 | | 2/15/24 | | 75,000 | | 79,219 | |
Penske Automotive Group,
Gtd. Notes | | 5.75 | | 10/1/22 | | 75,000 | | 77,415 | |
Penske Automotive Group,
Gtd. Notes | | 5.50 | | 5/15/26 | | 75,000 | | 77,344 | |
PetSmart,
Gtd. Notes | | 7.13 | | 3/15/23 | | 300,000 | b | 229,500 | |
Pinnacle Entertainment,
Sr. Unscd. Notes | | 5.63 | | 5/1/24 | | 75,000 | | 77,813 | |
Prime Security Services Borrower,
Scd. Notes | | 9.25 | | 5/15/23 | | 300,000 | b | 333,210 | |
PulteGroup,
Gtd. Notes | | 5.50 | | 3/1/26 | | 75,000 | | 82,500 | |
PulteGroup,
Gtd. Notes | | 5.00 | | 1/15/27 | | 75,000 | | 79,312 | |
PulteGroup,
Gtd. Notes | | 7.88 | | 6/15/32 | | 100,000 | | 124,500 | |
Quebecor Media,
Sr. Unscd. Notes | | 5.75 | | 1/15/23 | | 150,000 | | 163,500 | |
12
| | | | | | | | | | |
| |
Description | Coupon
Rate (%) | | Maturity
Date | | Principal
Amount ($) | a | Value ($) | |
Bonds and Notes - 4.7% (continued) | | | | | |
Consumer Discretionary - 1.2% (continued) | | | | | |
Regal Entertainment Group,
Sr. Unscd. Notes | | 5.75 | | 3/15/22 | | 125,000 | | 129,687 | |
RSI Home Products,
Scd. Notes | | 6.50 | | 3/15/23 | | 75,000 | b | 78,937 | |
Sally Holdings,
Gtd. Notes | | 5.63 | | 12/1/25 | | 75,000 | | 74,813 | |
Scientific Games International,
Gtd. Notes | | 6.63 | | 5/15/21 | | 100,000 | | 103,875 | |
Scientific Games International,
Gtd. Notes | | 10.00 | | 12/1/22 | | 150,000 | | 166,312 | |
Scientific Games International,
Sr. Scd. Notes | | 7.00 | | 1/1/22 | | 125,000 | b | 132,500 | |
Service Corporation International,
Sr. Unscd. Notes | | 5.38 | | 5/15/24 | | 75,000 | | 79,406 | |
ServiceMaster,
Sr. Scd. Notes | | 5.13 | | 11/15/24 | | 75,000 | b | 77,438 | |
SFR Group,
Sr. Scd. Bonds | | 6.00 | | 5/15/22 | | 350,000 | b | 365,312 | |
SFR Group,
Sr. Scd. Bonds | | 6.25 | | 5/15/24 | | 75,000 | b | 78,844 | |
SFR Group,
Sr. Scd. Notes | | 7.38 | | 5/1/26 | | 300,000 | b | 323,625 | |
Silversea Cruise Finance,
Gtd. Notes | | 7.25 | | 2/1/25 | | 75,000 | b | 80,812 | |
Sinclair Television Group,
Gtd. Notes | | 5.38 | | 4/1/21 | | 75,000 | | 77,156 | |
Sinclair Television Group,
Gtd. Notes | | 6.13 | | 10/1/22 | | 75,000 | | 77,625 | |
Sinclair Television Group,
Gtd. Notes | | 5.63 | | 8/1/24 | | 75,000 | b | 76,313 | |
Sirius XM Radio,
Gtd. Notes | | 5.38 | | 4/15/25 | | 75,000 | b | 79,219 | |
Sirius XM Radio,
Gtd. Notes | | 5.38 | | 7/15/26 | | 75,000 | b | 79,219 | |
Sirius XM Radio,
Sr. Scd. Notes | | 6.00 | | 7/15/24 | | 75,000 | b | 80,250 | |
Six Flags Entertainment,
Gtd. Notes | | 4.88 | | 7/31/24 | | 150,000 | b | 154,687 | |
Sonic Automotive,
Gtd. Notes | | 5.00 | | 5/15/23 | | 75,000 | | 73,875 | |
Springs Industries,
Sr. Scd. Notes | | 6.25 | | 6/1/21 | | 75,000 | | 77,438 | |
Taylor Morrison Communities,
Gtd. Notes | | 5.25 | | 4/15/21 | | 75,000 | b | 76,687 | |
TEGNA,
Gtd. Notes | | 6.38 | | 10/15/23 | | 250,000 | | 266,250 | |
13
CONSOLIDATED STATEMENT OF INVESTMENTS (continued)
| | | | | | | | | | |
| |
Description | Coupon
Rate (%) | | Maturity
Date | | Principal
Amount ($) | a | Value ($) | |
Bonds and Notes - 4.7% (continued) | | | | | |
Consumer Discretionary - 1.2% (continued) | | | | | |
Tempur Sealy International,
Sr. Scd. Notes | | 5.50 | | 6/15/26 | | 75,000 | | 77,438 | |
Tenneco,
Gtd. Notes | | 5.00 | | 7/15/26 | | 75,000 | | 77,250 | |
Tesla,
Gtd. Notes | | 5.30 | | 8/15/25 | | 100,000 | b | 96,625 | |
Time,
Gtd. Notes | | 5.75 | | 4/15/22 | | 125,000 | b | 126,719 | |
Toll Brothers Finance,
Gtd. Notes | | 4.88 | | 11/15/25 | | 250,000 | | 262,812 | |
Tribune Media,
Gtd. Notes | | 5.88 | | 7/15/22 | | 75,000 | | 78,188 | |
Under Armour,
Sr. Unscd. Notes | | 3.25 | | 6/15/26 | | 75,000 | | 67,545 | |
Unitymedia Hessen,
Gtd. Notes | | 5.00 | | 1/15/25 | | 75,000 | b | 78,563 | |
Unitymedia Hessen,
Sr. Scd. Notes | | 5.50 | | 1/15/23 | | 67,500 | b | 69,525 | |
Univision Communications,
Sr. Scd. Notes | | 6.75 | | 9/15/22 | | 25,000 | b | 25,969 | |
Univision Communications,
Sr. Scd. Notes | | 5.13 | | 2/15/25 | | 75,000 | b | 74,719 | |
Univision Communications,
Sr. Unscd. Notes | | 5.13 | | 5/15/23 | | 75,000 | b | 76,125 | |
Viacom,
Jr. Sub. Notes, 3 Month LIBOR + 3.90% | | 5.88 | | 2/28/57 | | 75,000 | c | 74,340 | |
Viacom,
Jr. Sub. Notes, 3 Month LIBOR + 3.90% | | 6.25 | | 2/28/57 | | 75,000 | c | 74,521 | |
Virgin Media Finance,
Gtd. Notes | | 6.38 | | 4/15/23 | | 75,000 | b | 78,563 | |
Virgin Media Secured Finance,
Sr. Scd. Bonds | | 5.25 | | 1/15/26 | | 75,000 | b | 78,109 | |
Wynn Las Vegas,
Gtd. Notes | | 5.50 | | 3/1/25 | | 300,000 | b | 315,750 | |
Yum! Brands,
Sr. Unscd. Notes | | 3.75 | | 11/1/21 | | 200,000 | | 206,560 | |
ZF North America Capital,
Gtd. Notes | | 4.50 | | 4/29/22 | | 125,000 | b | 131,094 | |
ZF North America Capital,
Gtd. Notes | | 4.75 | | 4/29/25 | | 75,000 | b | 79,125 | |
Ziggo Bond Finance,
Sr. Unscd. Notes | | 6.00 | | 1/15/27 | | 75,000 | b | 76,500 | |
Ziggo Secured Finance,
Sr. Scd. Notes | | 5.50 | | 1/15/27 | | 300,000 | b | 306,750 | |
| | 18,366,429 | |
14
| | | | | | | | | | |
| |
Description | Coupon
Rate (%) | | Maturity
Date | | Principal
Amount ($) | a | Value ($) | |
Bonds and Notes - 4.7% (continued) | | | | | |
Consumer Staples - .2% | | | | | |
Albertsons,
Gtd. Notes | | 6.63 | | 6/15/24 | | 75,000 | | 70,875 | |
Albertsons,
Gtd. Notes | | 5.75 | | 3/15/25 | | 75,000 | | 66,375 | |
Alliance One International,
Scd. Notes | | 9.88 | | 7/15/21 | | 175,000 | | 154,875 | |
Avon Products,
Sr. Unscd. Notes | | 6.60 | | 3/15/20 | | 50,000 | | 49,500 | |
Avon Products,
Sr. Unscd. Notes | | 7.00 | | 3/15/23 | | 150,000 | | 125,625 | |
B&G Foods,
Gtd. Notes | | 4.63 | | 6/1/21 | | 75,000 | | 76,688 | |
Cott Beverages,
Gtd. Notes | | 5.38 | | 7/1/22 | | 75,000 | | 78,188 | |
Dean Foods,
Gtd. Notes | | 6.50 | | 3/15/23 | | 75,000 | b | 75,375 | |
Dole Food,
Sr. Scd. Notes | | 7.25 | | 6/15/25 | | 50,000 | b | 54,250 | |
Edgewell Personal Care,
Gtd. Notes | | 4.70 | | 5/24/22 | | 50,000 | | 53,375 | |
First Quality Finance,
Sr. Unscd. Notes | | 4.63 | | 5/15/21 | | 75,000 | b | 76,125 | |
Fresh Market,
Sr. Scd. Notes | | 9.75 | | 5/1/23 | | 75,000 | b | 42,750 | |
HRG Group,
Sr. Unscd. Notes | | 7.75 | | 1/15/22 | | 125,000 | | 131,860 | |
JBS USA Finance,
Gtd. Notes | | 8.25 | | 2/1/20 | | 50,000 | b | 50,688 | |
JBS USA Finance,
Gtd. Notes | | 7.25 | | 6/1/21 | | 50,000 | b | 51,224 | |
JBS USA Finance,
Gtd. Notes | | 5.88 | | 7/15/24 | | 75,000 | b | 74,063 | |
JBS USA Finance,
Gtd. Notes | | 5.75 | | 6/15/25 | | 100,000 | b | 97,500 | |
Kronos Acquisition Holdings,
Gtd. Notes | | 9.00 | | 8/15/23 | | 75,000 | b | 72,450 | |
Pilgrim's Pride,
Gtd. Notes | | 5.75 | | 3/15/25 | | 75,000 | b | 79,594 | |
Post Holdings,
Gtd. Notes | | 5.50 | | 3/1/25 | | 75,000 | b | 78,188 | |
Post Holdings,
Gtd. Notes | | 5.00 | | 8/15/26 | | 300,000 | b | 302,250 | |
Revlon Consumer Products,
Gtd. Notes | | 5.75 | | 2/15/21 | | 125,000 | | 107,812 | |
Rite Aid,
Gtd. Notes | | 6.13 | | 4/1/23 | | 300,000 | b | 280,875 | |
15
CONSOLIDATED STATEMENT OF INVESTMENTS (continued)
| | | | | | | | | | |
| |
Description | Coupon
Rate (%) | | Maturity
Date | | Principal
Amount ($) | a | Value ($) | |
Bonds and Notes - 4.7% (continued) | | | | | |
Consumer Staples - .2% (continued) | | | | | |
Safeway,
Sr. Unscd. Debs. | | 7.25 | | 2/1/31 | | 50,000 | | 43,500 | |
Spectrum Brands,
Gtd. Notes | | 5.75 | | 7/15/25 | | 75,000 | | 80,038 | |
Tesco,
Sr. Unscd. Notes | | 6.15 | | 11/15/37 | | 100,000 | b | 108,346 | |
TreeHouse Foods,
Gtd. Notes | | 6.00 | | 2/15/24 | | 75,000 | b | 80,625 | |
US Foods,
Gtd. Notes | | 5.88 | | 6/15/24 | | 75,000 | b | 79,594 | |
Vector Group,
Sr. Scd. Notes | | 6.13 | | 2/1/25 | | 75,000 | b | 78,000 | |
| | 2,720,608 | |
Energy - .6% | | | | | |
Andeavor Logistics,
Gtd. Notes | | 5.50 | | 10/15/19 | | 50,000 | | 52,875 | |
Andeavor Logistics,
Gtd. Notes | | 5.25 | | 1/15/25 | | 130,000 | | 140,237 | |
Antero Midstream Partners,
Gtd. Notes | | 5.38 | | 9/15/24 | | 75,000 | | 78,563 | |
Antero Resources,
Gtd. Notes | | 5.13 | | 12/1/22 | | 125,000 | | 129,062 | |
Antero Resources,
Scd. Notes | | 5.63 | | 6/1/23 | | 75,000 | | 78,937 | |
Ascent Resources Utica Holdings,
Sr. Unscd. Notes | | 10.00 | | 4/1/22 | | 50,000 | b | 54,500 | |
Blue Racer Midstream,
Gtd. Notes | | 6.13 | | 11/15/22 | | 75,000 | b | 78,563 | |
Bristow Group,
Gtd. Notes | | 6.25 | | 10/15/22 | | 100,000 | | 71,875 | |
California Resources,
Scd. Notes | | 8.00 | | 12/15/22 | | 150,000 | b | 99,937 | |
Calumet Specialty Products Partners,
Gtd. Notes | | 6.50 | | 4/15/21 | | 125,000 | | 122,969 | |
Carrizo Oil & Gas,
Gtd. Notes | | 7.50 | | 9/15/20 | | 75,000 | | 76,594 | |
Carrizo Oil & Gas,
Gtd. Notes | | 6.25 | | 4/15/23 | | 75,000 | | 76,688 | |
Chesapeake Energy,
Gtd. Notes | | 8.00 | | 1/15/25 | | 75,000 | b | 75,188 | |
Chesapeake Energy,
Gtd. Notes | | 8.00 | | 6/15/27 | | 50,000 | b | 48,688 | |
Chesapeake Energy,
Scd. Notes | | 8.00 | | 12/15/22 | | 139,000 | b | 150,077 | |
CONSOL Energy,
Gtd. Notes | | 5.88 | | 4/15/22 | | 350,000 | | 358,750 | |
16
| | | | | | | | | | |
| |
Description | Coupon
Rate (%) | | Maturity
Date | | Principal
Amount ($) | a | Value ($) | |
Bonds and Notes - 4.7% (continued) | | | | | |
Energy - .6% (continued) | | | | | |
Continental Resources,
Gtd. Notes | | 5.00 | | 9/15/22 | | 300,000 | | 304,500 | |
Continental Resources,
Gtd. Notes | | 3.80 | | 6/1/24 | | 75,000 | | 73,219 | |
Continental Resources,
Gtd. Notes | | 4.90 | | 6/1/44 | | 40,000 | | 37,450 | |
Continental Resources,
Sr. Unscd. Notes | | 4.50 | | 4/15/23 | | 75,000 | | 76,125 | |
Crestwood Midstream Partners,
Gtd. Notes | | 6.25 | | 4/1/23 | | 75,000 | | 78,375 | |
CSI Compressco,
Gtd. Notes | | 7.25 | | 8/15/22 | | 100,000 | | 91,000 | |
DCP Midstream Operating,
Gtd. Notes | | 4.75 | | 9/30/21 | | 170,000 | b | 175,950 | |
DCP Midstream Operating,
Gtd. Notes | | 3.88 | | 3/15/23 | | 130,000 | | 129,675 | |
Denbury Resources,
Gtd. Notes | | 5.50 | | 5/1/22 | | 75,000 | | 47,438 | |
Diamond Offshore Drilling,
Sr. Unscd. Notes | | 4.88 | | 11/1/43 | | 175,000 | | 132,125 | |
Diamondback Energy,
Gtd. Notes | | 4.75 | | 11/1/24 | | 75,000 | | 76,688 | |
Diamondback Energy,
Gtd. Notes | | 5.38 | | 5/31/25 | | 75,000 | | 78,281 | |
Eclipse Resources,
Gtd. Notes | | 8.88 | | 7/15/23 | | 75,000 | | 76,969 | |
Energy Transfer Equity,
Gtd. Notes | | 7.50 | | 10/15/20 | | 50,000 | | 56,500 | |
Energy Transfer Equity,
Gtd. Notes | | 5.50 | | 6/1/27 | | 75,000 | | 79,875 | |
Energy Transfer Equity,
Sr. Scd. Notes | | 5.88 | | 1/15/24 | | 75,000 | | 81,750 | |
Ensco,
Sr. Unscd. Notes | | 4.50 | | 10/1/24 | | 300,000 | | 247,500 | |
Everest Acquisition Finance,
Gtd. Notes | | 6.38 | | 6/15/23 | | 75,000 | | 45,000 | |
Extraction Oil & Gas,
Gtd. Notes | | 7.88 | | 7/15/21 | | 125,000 | b | 133,125 | |
Genesis Energy,
Gtd. Notes | | 6.75 | | 8/1/22 | | 175,000 | | 181,562 | |
Gulfport Energy,
Gtd. Notes | | 6.38 | | 5/15/25 | | 75,000 | | 76,406 | |
Halcon Resources,
Gtd. Notes | | 6.75 | | 2/15/25 | | 18,000 | b | 18,540 | |
Hilcorp Energy I,
Gtd. Notes | | 5.75 | | 10/1/25 | | 75,000 | b | 77,156 | |
17
CONSOLIDATED STATEMENT OF INVESTMENTS (continued)
| | | | | | | | | | |
| |
Description | Coupon
Rate (%) | | Maturity
Date | | Principal
Amount ($) | a | Value ($) | |
Bonds and Notes - 4.7% (continued) | | | | | |
Energy - .6% (continued) | | | | | |
Jupiter Resources,
Sr. Unscd. Notes | | 8.50 | | 10/1/22 | | 75,000 | b | 53,813 | |
KCA Deutag UK Finance,
Sr. Scd. Notes | | 9.88 | | 4/1/22 | | 50,000 | b | 52,563 | |
Laredo Petroleum,
Gtd. Notes | | 5.63 | | 1/15/22 | | 100,000 | | 102,375 | |
Laredo Petroleum,
Gtd. Notes | | 7.38 | | 5/1/22 | | 50,000 | | 52,094 | |
Legacy Reserves Finance,
Gtd. Notes | | 6.63 | | 12/1/21 | | 50,000 | | 32,563 | |
Matador Resources,
Gtd. Notes | | 6.88 | | 4/15/23 | | 150,000 | | 159,375 | |
McDermott International,
Sr. Unscd. Notes | | 8.00 | | 5/1/21 | | 75,000 | b | 77,813 | |
MEG Energy,
Gtd. Notes | | 7.00 | | 3/31/24 | | 75,000 | b | 68,438 | |
MEG Energy,
Scd. Notes | | 6.50 | | 1/15/25 | | 75,000 | b | 74,906 | |
Murphy Oil,
Sr. Unscd. Notes | | 6.88 | | 8/15/24 | | 150,000 | | 161,625 | |
Newfield Exploration,
Sr. Scd. Notes | | 5.75 | | 1/30/22 | | 50,000 | | 54,000 | |
NGL Energy Partners,
Gtd. Notes | | 5.13 | | 7/15/19 | | 150,000 | | 150,375 | |
Niska Gas Storage,
Gtd. Notes | | 6.50 | | 4/1/19 | | 75,000 | | 76,406 | |
Noble Holding International,
Gtd. Notes | | 7.75 | | 1/15/24 | | 75,000 | | 67,500 | |
Noble Holding International,
Gtd. Notes | | 6.05 | | 3/1/41 | | 150,000 | | 100,125 | |
Noble Holding International,
Gtd. Notes | | 5.25 | | 3/15/42 | | 100,000 | | 64,000 | |
Northern Oil and Gas,
Sr. Unscd. Notes | | 8.00 | | 6/1/20 | | 75,000 | | 50,250 | |
Parsley Energy,
Sr. Unscd. Notes | | 5.38 | | 1/15/25 | | 75,000 | b | 76,500 | |
PBF Holding,
Gtd. Notes | | 7.00 | | 11/15/23 | | 75,000 | | 78,375 | |
PDC Energy,
Gtd. Notes | | 7.75 | | 10/15/22 | | 75,000 | | 78,375 | |
Peabody Energy,
Gtd. Notes | | 6.00 | | 3/31/22 | | 75,000 | b | 77,344 | |
Peabody Energy,
Gtd. Notes | | 6.38 | | 3/31/25 | | 75,000 | b | 77,625 | |
Pride International,
Gtd. Notes | | 6.88 | | 8/15/20 | | 50,000 | | 51,625 | |
18
| | | | | | | | | | |
| |
Description | Coupon
Rate (%) | | Maturity
Date | | Principal
Amount ($) | a | Value ($) | |
Bonds and Notes - 4.7% (continued) | | | | | |
Energy - .6% (continued) | | | | | |
QEP Resources,
Sr. Unscd. Notes | | 5.25 | | 5/1/23 | | 75,000 | | 74,438 | |
Range Resources,
Sr. Unscd. Notes | | 5.00 | | 8/15/22 | | 75,000 | | 74,438 | |
Range Resources,
Sr. Unscd. Notes | | 4.88 | | 5/15/25 | | 75,000 | | 72,750 | |
Resolute Energy,
Gtd. Notes | | 8.50 | | 5/1/20 | | 50,000 | | 51,000 | |
Rice Energy,
Gtd. Notes | | 6.25 | | 5/1/22 | | 125,000 | | 130,956 | |
Rockies Express Pipeline,
Sr. Scd. Notes | | 6.00 | | 1/15/19 | | 75,000 | b | 78,000 | |
Rockies Express Pipeline,
Sr. Unscd. Notes | | 5.63 | | 4/15/20 | | 50,000 | b | 53,250 | |
Rose Rock Finance,
Gtd. Notes | | 5.63 | | 7/15/22 | | 75,000 | | 74,250 | |
Rowan Cos.,
Gtd. Notes | | 4.88 | | 6/1/22 | | 125,000 | | 118,437 | |
Rowan Cos.,
Gtd. Notes | | 7.38 | | 6/15/25 | | 75,000 | | 75,936 | |
Rowan Cos.,
Gtd. Notes | | 5.85 | | 1/15/44 | | 20,000 | | 16,200 | |
RSP Permian,
Gtd. Notes | | 6.63 | | 10/1/22 | | 150,000 | | 158,062 | |
Sanchez Energy,
Gtd. Notes | | 7.75 | | 6/15/21 | | 75,000 | | 70,125 | |
SESI,
Sr. Unscd. Notes | | 7.13 | | 12/15/21 | | 75,000 | | 77,063 | |
SM Energy,
Gtd. Notes | | 5.63 | | 6/1/25 | | 75,000 | | 73,313 | |
SM Energy,
Sr. Unscd. Notes | | 6.13 | | 11/15/22 | | 75,000 | | 75,750 | |
Southwestern Energy,
Sr. Unscd. Notes | | 4.10 | | 3/15/22 | | 200,000 | | 197,500 | |
Summit Midstream Holdings,
Gtd. Notes | | 5.75 | | 4/15/25 | | 75,000 | | 76,875 | |
Sunoco Finance,
Gtd. Notes | | 5.50 | | 8/1/20 | | 75,000 | | 77,207 | |
Sunoco Finance,
Sr. Unscd. Notes | | 6.38 | | 4/1/23 | | 75,000 | | 80,062 | |
Targa Resources Partners,
Gtd. Notes | | 4.13 | | 11/15/19 | | 250,000 | | 252,656 | |
Transocean,
Gtd. Bonds | | 6.50 | | 11/15/20 | | 100,000 | | 104,250 | |
Transocean,
Gtd. Notes | | 7.50 | | 4/15/31 | | 75,000 | | 67,313 | |
19
CONSOLIDATED STATEMENT OF INVESTMENTS (continued)
| | | | | | | | | | |
| |
Description | Coupon
Rate (%) | | Maturity
Date | | Principal
Amount ($) | a | Value ($) | |
Bonds and Notes - 4.7% (continued) | | | | | |
Energy - .6% (continued) | | | | | |
Transocean,
Gtd. Notes | | 6.80 | | 3/15/38 | | 150,000 | | 122,625 | |
Transocean Phoenix 2,
Sr. Scd. Notes | | 7.75 | | 10/15/24 | | 67,500 | b | 73,069 | |
Tullow Oil,
Gtd. Notes | | 6.00 | | 11/1/20 | | 50,000 | b | 50,438 | |
Ultra Resources,
Gtd. Notes | | 6.88 | | 4/15/22 | | 50,000 | b | 50,563 | |
Unit,
Gtd. Notes | | 6.63 | | 5/15/21 | | 100,000 | | 100,875 | |
Weatherford International,
Gtd. Notes | | 7.75 | | 6/15/21 | | 75,000 | | 77,531 | |
Weatherford International,
Gtd. Notes | | 4.50 | | 4/15/22 | | 75,000 | | 68,250 | |
Weatherford International,
Gtd. Notes | | 8.25 | | 6/15/23 | | 130,000 | | 130,975 | |
Weatherford International,
Gtd. Notes | | 7.00 | | 3/15/38 | | 100,000 | | 87,500 | |
Whiting Petroleum,
Gtd. Notes | | 5.00 | | 3/15/19 | | 75,000 | | 76,031 | |
Whiting Petroleum,
Sr. Unscd. Notes | | 5.75 | | 3/15/21 | | 75,000 | | 75,750 | |
Williams Cos.,
Gtd. Notes | | 4.55 | | 6/24/24 | | 75,000 | | 78,750 | |
Williams Cos.,
Gtd. Notes | | 5.75 | | 6/24/44 | | 75,000 | | 79,875 | |
Williams Cos.,
Sr. Unscd. Debs., Ser. A | | 7.50 | | 1/15/31 | | 100,000 | | 121,875 | |
Williams Cos.,
Sr. Unscd. Notes | | 3.70 | | 1/15/23 | | 100,000 | | 101,375 | |
WPX Energy,
Sr. Unscd. Notes | | 6.00 | | 1/15/22 | | 50,000 | | 52,313 | |
WPX Energy,
Sr. Unscd. Notes | | 8.25 | | 8/1/23 | | 75,000 | | 84,844 | |
WPX Energy,
Sr. Unscd. Notes | | 5.25 | | 9/15/24 | | 75,000 | | 75,656 | |
| | 9,544,903 | |
Financials - .4% | | | | | |
AerCap Global Aviation Trust,
Gtd. Notes, 3 Month LIBOR + 4.30% | | 6.50 | | 6/15/45 | | 75,000 | b,c | 82,125 | |
Ally Financial,
Gtd. Notes | | 7.50 | | 9/15/20 | | 165,000 | | 186,244 | |
Ally Financial,
Gtd. Notes | | 8.00 | | 11/1/31 | | 200,000 | | 265,500 | |
Ally Financial,
Sr. Unscd. Notes | | 3.75 | | 11/18/19 | | 125,000 | | 127,812 | |
20
| | | | | | | | | | |
| |
Description | Coupon
Rate (%) | | Maturity
Date | | Principal
Amount ($) | a | Value ($) | |
Bonds and Notes - 4.7% (continued) | | | | | |
Financials - .4% (continued) | | | | | |
Ally Financial,
Sr. Unscd. Notes | | 4.13 | | 2/13/22 | | 50,000 | | 52,125 | |
Ally Financial,
Sub. Notes | | 5.75 | | 11/20/25 | | 175,000 | | 194,031 | |
CIT Group,
Sr. Unscd. Notes | | 3.88 | | 2/19/19 | | 50,000 | | 50,875 | |
CIT Group,
Sr. Unscd. Notes | | 5.38 | | 5/15/20 | | 17,000 | | 18,275 | |
CIT Group,
Sr. Unscd. Notes | | 5.00 | | 8/1/23 | | 75,000 | | 81,315 | |
CNH Industrial Capital,
Gtd. Notes | | 4.38 | | 11/6/20 | | 125,000 | | 131,250 | |
CNH Industrial Capital,
Gtd. Notes | | 3.88 | | 10/15/21 | | 100,000 | | 103,500 | |
Credit Acceptance,
Gtd. Notes | | 6.13 | | 2/15/21 | | 100,000 | | 102,250 | |
Deutsche Bank,
Sub. Notes, 3 Month LIBOR + 2.25% | | 4.30 | | 5/24/28 | | 75,000 | c | 74,850 | |
Dresdner Funding Trust I,
Jr. Sub. Notes | | 8.15 | | 6/30/31 | | 130,000 | b | 169,814 | |
E*TRADE Financial,
Jr. Sub. Notes, Ser. A, 3 Month LIBOR + 4.44% | | 5.88 | | 12/15/49 | | 200,000 | c | 214,000 | |
Enova International,
Gtd. Notes | | 9.75 | | 6/1/21 | | 57,000 | | 60,990 | |
FBM Finance,
Gtd. Notes | | 8.25 | | 8/15/21 | | 75,000 | b | 80,156 | |
Genworth Holdings,
Gtd. Notes | | 7.70 | | 6/15/20 | | 200,000 | | 197,986 | |
Genworth Holdings,
Gtd. Notes | | 7.63 | | 9/24/21 | | 50,000 | | 48,500 | |
HUB International,
Sr. Unscd. Notes | | 7.88 | | 10/1/21 | | 125,000 | b | 130,260 | |
Icahn Enterprises,
Gtd. Notes | | 4.88 | | 3/15/19 | | 125,000 | | 125,781 | |
Icahn Enterprises,
Gtd. Notes | | 6.00 | | 8/1/20 | | 125,000 | | 128,984 | |
Icahn Enterprises,
Gtd. Notes | | 5.88 | | 2/1/22 | | 125,000 | | 129,494 | |
Intelsat Connect Finance,
Gtd. Notes | | 12.50 | | 4/1/22 | | 50,000 | b | 47,625 | |
Intesa Sanpaolo,
Sub. Notes | | 5.71 | | 1/15/26 | | 75,000 | b | 79,844 | |
Jefferies Finance,
Sr. Unscd. Notes | | 6.88 | | 4/15/22 | | 50,000 | b | 50,750 | |
MSCI,
Gtd. Notes | | 5.25 | | 11/15/24 | | 75,000 | b | 79,687 | |
21
CONSOLIDATED STATEMENT OF INVESTMENTS (continued)
| | | | | | | | | | |
| |
Description | Coupon
Rate (%) | | Maturity
Date | | Principal
Amount ($) | a | Value ($) | |
Bonds and Notes - 4.7% (continued) | | | | | |
Financials - .4% (continued) | | | | | |
MSCI,
Gtd. Notes | | 5.75 | | 8/15/25 | | 75,000 | b | 81,375 | |
MSCI,
Gtd. Notes | | 4.75 | | 8/1/26 | | 75,000 | b | 78,281 | |
Nationstar Mortgage,
Gtd. Notes | | 6.50 | | 7/1/21 | | 125,000 | | 127,266 | |
Navient,
Gtd. Notes | | 4.88 | | 6/17/19 | | 75,000 | | 77,344 | |
Navient,
Sr. Unscd. Notes | | 5.50 | | 1/15/19 | | 300,000 | | 310,125 | |
Navient,
Sr. Unscd. Notes | | 6.50 | | 6/15/22 | | 190,000 | | 201,875 | |
Navient,
Sr. Unscd. Notes | | 5.50 | | 1/25/23 | | 75,000 | | 76,219 | |
Och-Ziff Finance,
Gtd. Notes | | 4.50 | | 11/20/19 | | 250,000 | b | 245,937 | |
OneMain Financial Holdings,
Gtd. Notes | | 7.25 | | 12/15/21 | | 125,000 | b | 130,156 | |
Park Aerospace Holdings,
Gtd. Notes | | 5.25 | | 8/15/22 | | 300,000 | b | 313,125 | |
Park Aerospace Holdings,
Sr. Scd. Notes | | 5.50 | | 2/15/24 | | 75,000 | b | 78,000 | |
Quicken Loans,
Gtd. Notes | | 5.75 | | 5/1/25 | | 150,000 | b | 159,750 | |
Royal Bank of Scotland Group,
Sub. Bonds | | 6.13 | | 12/15/22 | | 200,000 | | 222,598 | |
Royal Bank of Scotland Group,
Sub. Notes | | 6.00 | | 12/19/23 | | 250,000 | | 278,847 | |
Springleaf Finance,
Gtd. Notes | | 5.25 | | 12/15/19 | | 75,000 | | 77,625 | |
Springleaf Finance,
Gtd. Notes | | 8.25 | | 12/15/20 | | 50,000 | | 56,500 | |
Springleaf Finance,
Gtd. Notes | | 6.13 | | 5/15/22 | | 50,000 | | 52,875 | |
| | 5,581,921 | |
Health Care - .5% | | | | | |
Acadia Healthcare,
Gtd. Notes | | 5.63 | | 2/15/23 | | 75,000 | | 77,400 | |
AMAG Pharmaceuticals,
Gtd. Notes | | 7.88 | | 9/1/23 | | 75,000 | b | 76,688 | |
Avantor,
Sr. Scd. Notes | | 6.00 | | 10/1/24 | | 300,000 | b | 306,375 | |
Centene,
Gtd. Notes | | 4.75 | | 1/15/25 | | 75,000 | | 77,625 | |
Centene,
Sr. Scd. Notes | | 5.63 | | 2/15/21 | | 75,000 | | 78,000 | |
22
| | | | | | | | | | |
| |
Description | Coupon
Rate (%) | | Maturity
Date | | Principal
Amount ($) | a | Value ($) | |
Bonds and Notes - 4.7% (continued) | | | | | |
Health Care - .5% (continued) | | | | | |
Centene,
Sr. Unscd. Notes | | 4.75 | | 5/15/22 | | 125,000 | | 131,562 | |
Change Healthcare Holdings,
Gtd. Notes | | 5.75 | | 3/1/25 | | 75,000 | b | 76,969 | |
CHS/Community Health Systems,
Gtd. Notes | | 8.00 | | 11/15/19 | | 190,000 | | 181,687 | |
CHS/Community Health Systems,
Gtd. Notes | | 6.88 | | 2/1/22 | | 50,000 | | 36,750 | |
CHS/Community Health Systems,
Sr. Scd. Notes | | 5.13 | | 8/1/21 | | 50,000 | | 48,625 | |
CHS/Community Health Systems,
Sr. Scd. Notes | | 6.25 | | 3/31/23 | | 210,000 | | 202,387 | |
DaVita,
Gtd. Notes | | 5.13 | | 7/15/24 | | 300,000 | | 301,312 | |
DaVita,
Gtd. Notes | | 5.00 | | 5/1/25 | | 75,000 | | 74,063 | |
DJO Finco,
Scd. Notes | | 8.13 | | 6/15/21 | | 75,000 | b | 72,000 | |
Endo Finance,
Gtd. Notes | | 5.75 | | 1/15/22 | | 50,000 | b | 44,000 | |
Endo Finance,
Gtd. Notes | | 5.38 | | 1/15/23 | | 75,000 | b | 60,750 | |
Endo Finco,
Gtd. Notes | | 6.00 | | 7/15/23 | | 150,000 | b | 122,250 | |
Endo Finco,
Gtd. Notes | | 6.00 | | 2/1/25 | | 75,000 | b | 60,000 | |
Envision Healthcare,
Gtd. Notes | | 6.25 | | 12/1/24 | | 75,000 | b | 78,094 | |
Greatbatch,
Gtd. Notes | | 9.13 | | 11/1/23 | | 100,000 | b | 108,500 | |
HCA,
Gtd. Notes | | 7.50 | | 2/15/22 | | 300,000 | | 341,250 | |
HCA,
Gtd. Notes | | 5.88 | | 5/1/23 | | 250,000 | | 268,437 | |
HCA,
Gtd. Notes | | 5.38 | | 2/1/25 | | 230,000 | | 237,116 | |
HCA,
Sr. Scd. Bonds | | 4.50 | | 2/15/27 | | 160,000 | | 162,000 | |
HCA,
Sr. Scd. Notes | | 3.75 | | 3/15/19 | | 225,000 | | 228,937 | |
HCA,
Sr. Scd. Notes | | 4.25 | | 10/15/19 | | 120,000 | | 123,900 | |
HCA,
Sr. Scd. Notes | | 6.50 | | 2/15/20 | | 50,000 | | 54,000 | |
HCA,
Sr. Scd. Notes | | 5.00 | | 3/15/24 | | 300,000 | | 316,407 | |
23
CONSOLIDATED STATEMENT OF INVESTMENTS (continued)
| | | | | | | | | | |
| |
Description | Coupon
Rate (%) | | Maturity
Date | | Principal
Amount ($) | a | Value ($) | |
Bonds and Notes - 4.7% (continued) | | | | | |
Health Care - .5% (continued) | | | | | |
HCA,
Sr. Scd. Notes | | 5.50 | | 6/15/47 | | 100,000 | | 102,000 | |
HealthSouth,
Gtd. Notes | | 5.75 | | 11/1/24 | | 75,000 | | 76,922 | |
HealthSouth,
Gtd. Notes | | 5.75 | | 9/15/25 | | 100,000 | | 103,625 | |
Hologic,
Gtd. Notes | | 5.25 | | 7/15/22 | | 75,000 | b | 78,563 | |
inVentiv Group Holdings,
Gtd. Notes | | 7.50 | | 10/1/24 | | 55,000 | b | 60,913 | |
Kindred Healthcare,
Gtd. Notes | | 8.00 | | 1/15/20 | | 50,000 | | 50,728 | |
Kindred Healthcare,
Gtd. Notes | | 6.38 | | 4/15/22 | | 100,000 | | 93,050 | |
Kinetic Concepts,
Gtd. Notes | | 7.88 | | 2/15/21 | | 75,000 | b | 78,375 | |
Kinetic Concepts,
Scd. Notes | | 12.50 | | 11/1/21 | | 125,000 | b | 139,687 | |
LifePoint Health,
Gtd. Notes | | 5.50 | | 12/1/21 | | 125,000 | | 127,500 | |
LifePoint Health,
Gtd. Notes | | 5.88 | | 12/1/23 | | 75,000 | | 77,359 | |
LifePoint Health,
Gtd. Notes | | 5.38 | | 5/1/24 | | 75,000 | | 75,563 | |
Mallinckrodt International Finance,
Gtd. Notes | | 4.88 | | 4/15/20 | | 75,000 | b | 75,281 | |
Mallinckrodt International Finance,
Gtd. Notes | | 5.75 | | 8/1/22 | | 75,000 | b | 73,781 | |
Mallinckrodt International Finance,
Gtd. Notes | | 5.63 | | 10/15/23 | | 75,000 | b | 70,406 | |
MEDNAX,
Gtd. Notes | | 5.25 | | 12/1/23 | | 75,000 | b | 78,188 | |
Molina Healthcare,
Gtd. Notes | | 5.38 | | 11/15/22 | | 75,000 | | 78,413 | |
MPH Acquisition Holdings,
Gtd. Notes | | 7.13 | | 6/1/24 | | 75,000 | b | 80,906 | |
Ortho-Clinical Diagnostics,
Gtd. Notes | | 6.63 | | 5/15/22 | | 125,000 | b | 125,781 | |
Pharmaceutical Product Development,
Gtd. Notes | | 6.38 | | 8/1/23 | | 75,000 | b | 78,469 | |
Quintiles IMS,
Gtd. Notes | | 4.88 | | 5/15/23 | | 75,000 | b | 78,375 | |
Quintiles IMS,
Gtd. Notes | | 5.00 | | 10/15/26 | | 300,000 | b | 319,500 | |
Quorum Health,
Gtd. Notes | | 11.63 | | 4/15/23 | | 100,000 | | 92,000 | |
24
| | | | | | | | | | |
| |
Description | Coupon
Rate (%) | | Maturity
Date | | Principal
Amount ($) | a | Value ($) | |
Bonds and Notes - 4.7% (continued) | | | | | |
Health Care - .5% (continued) | | | | | |
RegionalCare Hospital Partners Holdings,
Gtd. Notes | | 8.25 | | 5/1/23 | | 75,000 | b | 79,125 | |
Select Medical,
Sr. Scd. Notes | | 6.38 | | 6/1/21 | | 75,000 | | 77,438 | |
Team Health Holdings,
Gtd. Notes | | 6.38 | | 2/1/25 | | 75,000 | b | 69,375 | |
Tenet Healthcare,
Scd. Notes | | 7.50 | | 1/1/22 | | 110,000 | b | 116,187 | |
Tenet Healthcare,
Sr. Scd. Notes | | 6.00 | | 10/1/20 | | 300,000 | | 316,125 | |
Tenet Healthcare,
Sr. Scd. Notes | | 4.63 | | 7/15/24 | | 100,000 | b | 98,750 | |
Tenet Healthcare,
Sr. Unscd. Notes | | 8.13 | | 4/1/22 | | 50,000 | | 50,250 | |
Tenet Healthcare,
Sr. Unscd. Notes | | 6.75 | | 6/15/23 | | 300,000 | | 282,750 | |
Universal Hospital Services,
Gtd. Notes | | 7.63 | | 8/15/20 | | 75,000 | | 76,313 | |
Valeant Pharmaceuticals International,
Gtd. Notes | | 5.38 | | 3/15/20 | | 200,000 | b | 197,750 | |
Valeant Pharmaceuticals International,
Gtd. Notes | | 7.50 | | 7/15/21 | | 50,000 | b | 49,438 | |
Valeant Pharmaceuticals International,
Gtd. Notes | | 6.75 | | 8/15/21 | | 175,000 | b | 169,969 | |
Valeant Pharmaceuticals International,
Gtd. Notes | | 5.88 | | 5/15/23 | | 300,000 | b | 253,875 | |
Valeant Pharmaceuticals International,
Gtd. Notes | | 6.13 | | 4/15/25 | | 300,000 | b | 253,125 | |
Vizient,
Sr. Unscd. Notes | | 10.38 | | 3/1/24 | | 75,000 | b | 85,687 | |
WellCare Health Plans,
Sr. Unscd. Notes | | 5.25 | | 4/1/25 | | 150,000 | | 158,250 | |
West Street Merger Sub,
Sr. Unscd. Notes | | 6.38 | | 9/1/25 | | 100,000 | b | 101,875 | |
| | 8,598,751 | |
Industrials - .4% | | | | | |
ADT,
Sr. Scd. Notes | | 6.25 | | 10/15/21 | | 225,000 | | 250,060 | |
AECOM,
Gtd. Notes | | 5.75 | | 10/15/22 | | 75,000 | | 78,656 | |
AECOM,
Gtd. Notes | | 5.88 | | 10/15/24 | | 75,000 | | 83,137 | |
AECOM,
Gtd. Notes | | 5.13 | | 3/15/27 | | 75,000 | | 77,344 | |
Agco,
Sr. Unscd. Notes | | 5.88 | | 12/1/21 | | 90,000 | | 98,379 | |
25
CONSOLIDATED STATEMENT OF INVESTMENTS (continued)
| | | | | | | | | | |
| |
Description | Coupon
Rate (%) | | Maturity
Date | | Principal
Amount ($) | a | Value ($) | |
Bonds and Notes - 4.7% (continued) | | | | | |
Industrials - .4% (continued) | | | | | |
Ahern Rentals,
Gtd. Notes | | 7.38 | | 5/15/23 | | 75,000 | b | 69,000 | |
Air Canada,
Gtd. Notes | | 7.75 | | 4/15/21 | | 50,000 | b | 57,375 | |
Aircastle,
Gtd. Notes | | 5.13 | | 3/15/21 | | 75,000 | | 79,875 | |
Aircastle,
Gtd. Notes | | 5.00 | | 4/1/23 | | 75,000 | | 79,500 | |
Aircastle,
Sr. Unscd. Notes | | 6.25 | | 12/1/19 | | 125,000 | | 134,062 | |
Algeco Scotsman Global Finance,
Sr. Scd. Notes | | 8.50 | | 10/15/18 | | 125,000 | b | 123,125 | |
Allegiant Travel,
Gtd. Notes | | 5.50 | | 7/15/19 | | 50,000 | | 51,875 | |
American Airlines Group,
Gtd. Notes | | 5.50 | | 10/1/19 | | 75,000 | b | 78,375 | |
American Airlines Group,
Gtd. Notes | | 4.63 | | 3/1/20 | | 125,000 | b | 129,531 | |
APX Group,
Gtd. Notes | | 8.75 | | 12/1/20 | | 125,000 | | 128,437 | |
APX Group,
Sr. Scd. Notes | | 7.88 | | 12/1/22 | | 75,000 | | 81,094 | |
Arconic,
Sr. Unscd. Notes | | 5.13 | | 10/1/24 | | 275,000 | | 295,998 | |
Arconic,
Sr. Unscd. Notes | | 5.95 | | 2/1/37 | | 100,000 | | 108,250 | |
Ashtead Capital,
Scd. Notes | | 5.63 | | 10/1/24 | | 75,000 | b | 80,179 | |
BCD Acquisition,
Sr. Unscd. Notes | | 9.63 | | 9/15/23 | | 75,000 | b | 82,312 | |
Blueline Rental,
Sr. Scd. Notes | | 9.25 | | 3/15/24 | | 75,000 | b | 81,750 | |
Bombardier,
Sr. Unscd. Notes | | 7.75 | | 3/15/20 | | 50,000 | b | 53,813 | |
Bombardier,
Sr. Unscd. Notes | | 8.75 | | 12/1/21 | | 350,000 | b | 391,125 | |
Bombardier,
Sr. Unscd. Notes | | 6.13 | | 1/15/23 | | 75,000 | b | 75,141 | |
Builders Firstsource,
Gtd. Notes | | 5.63 | | 9/1/24 | | 75,000 | b | 79,500 | |
Cenveo,
Sr. Scd. Notes | | 6.00 | | 8/1/19 | | 100,000 | b | 69,500 | |
Ceridian HCM Holding,
Gtd. Notes | | 11.00 | | 3/15/21 | | 50,000 | b | 52,875 | |
Clean Harbors,
Gtd. Notes | | 5.13 | | 6/1/21 | | 125,000 | | 127,031 | |
26
| | | | | | | | | | |
| |
Description | Coupon
Rate (%) | | Maturity
Date | | Principal
Amount ($) | a | Value ($) | |
Bonds and Notes - 4.7% (continued) | | | | | |
Industrials - .4% (continued) | | | | | |
CNH Industrial,
Gtd. Notes | | 4.50 | | 8/15/23 | | 75,000 | | 79,500 | |
CNH Industrial Capital,
Gtd. Notes | | 4.38 | | 4/5/22 | | 50,000 | | 53,188 | |
Gates Global,
Gtd. Notes | | 6.00 | | 7/15/22 | | 75,000 | b | 77,531 | |
General Cable,
Gtd. Notes | | 5.75 | | 10/1/22 | | 75,000 | | 77,250 | |
GFL Environmental,
Gtd. Notes | | 9.88 | | 2/1/21 | | 75,000 | b | 80,156 | |
Great Lakes Dredge & Dock Corp,
Gtd. Notes | | 8.00 | | 5/15/22 | | 75,000 | | 79,125 | |
Griffon,
Gtd. Notes | | 5.25 | | 3/1/22 | | 75,000 | | 76,478 | |
Grinding Media,
Sr. Scd. Notes | | 7.38 | | 12/15/23 | | 75,000 | b | 81,750 | |
HD Supply,
Sr. Scd. Notes | | 5.75 | | 4/15/24 | | 75,000 | b | 81,094 | |
Hertz,
Gtd. Notes | | 5.88 | | 10/15/20 | | 75,000 | | 74,888 | |
Hertz,
Gtd. Notes | | 6.25 | | 10/15/22 | | 75,000 | | 72,281 | |
Hertz,
Gtd. Notes | | 5.50 | | 10/15/24 | | 75,000 | b | 67,875 | |
Hornbeck Offshore Service,
Gtd. Notes | | 5.00 | | 3/1/21 | | 75,000 | | 40,125 | |
Huntington Ingalls Industries,
Gtd. Notes | | 5.00 | | 11/15/25 | | 75,000 | b | 81,426 | |
IHS Markit,
Gtd. Notes | | 4.75 | | 2/15/25 | | 75,000 | b | 79,500 | |
KLX,
Gtd. Notes | | 5.88 | | 12/1/22 | | 75,000 | b | 78,750 | |
Kratos Defense & Security Solutions,
Sr. Scd. Notes | | 7.00 | | 5/15/19 | | 36,000 | | 36,765 | |
Navios Maritime Holdings,
Sr. Scd. Notes | | 7.38 | | 1/15/22 | | 75,000 | b | 61,875 | |
Ply Gem Industries,
Gtd. Notes | | 6.50 | | 2/1/22 | | 75,000 | | 78,094 | |
Rent-A-Center,
Gtd. Notes | | 6.63 | | 11/15/20 | | 50,000 | | 46,188 | |
Ritchie Bros Auctioneers,
Gtd. Notes | | 5.38 | | 1/15/25 | | 75,000 | b | 79,125 | |
Sensata Technologies,
Gtd. Notes | | 4.88 | | 10/15/23 | | 75,000 | b | 79,031 | |
Sensata Technologies UK Financing,
Gtd. Notes | | 6.25 | | 2/15/26 | | 75,000 | b | 82,687 | |
27
CONSOLIDATED STATEMENT OF INVESTMENTS (continued)
| | | | | | | | | | |
| |
Description | Coupon
Rate (%) | | Maturity
Date | | Principal
Amount ($) | a | Value ($) | |
Bonds and Notes - 4.7% (continued) | | | | | |
Industrials - .4% (continued) | | | | | |
Standard Industries,
Sr. Unscd. Notes | | 6.00 | | 10/15/25 | | 75,000 | b | 81,469 | |
Stena,
Sr. Unscd. Notes | | 7.00 | | 2/1/24 | | 75,000 | b | 72,750 | |
Terex,
Gtd. Notes | | 5.63 | | 2/1/25 | | 125,000 | b | 133,281 | |
TransDigm,
Gtd. Notes | | 6.00 | | 7/15/22 | | 125,000 | | 130,600 | |
TransDigm,
Gtd. Notes | | 6.50 | | 7/15/24 | | 75,000 | | 77,625 | |
TransDigm,
Gtd. Notes | | 6.38 | | 6/15/26 | | 75,000 | | 76,688 | |
Triumph Group,
Gtd. Notes | | 4.88 | | 4/1/21 | | 100,000 | | 99,500 | |
United Rentals North America,
Gtd. Notes | | 5.50 | | 5/15/27 | | 200,000 | | 214,500 | |
United Rentals North America,
Scd. Notes | | 4.63 | | 7/15/23 | | 75,000 | | 78,703 | |
US Concrete,
Sr. Unscd. Notes | | 6.38 | | 6/1/24 | | 75,000 | | 81,000 | |
Vertiv Group,
Gtd. Notes | | 9.25 | | 10/15/24 | | 75,000 | b | 82,500 | |
Virgin Australia Holdings,
Gtd. Notes | | 7.88 | | 10/15/21 | | 50,000 | b | 51,875 | |
WESCO Distribution,
Gtd. Notes | | 5.38 | | 12/15/21 | | 75,000 | | 77,576 | |
Xerium Technologies,
Sr. Scd. Notes | | 9.50 | | 8/15/21 | | 100,000 | | 102,970 | |
XPO Logistics,
Gtd. Notes | | 6.50 | | 6/15/22 | | 50,000 | b | 52,697 | |
XPO Logistics,
Gtd. Notes | | 6.13 | | 9/1/23 | | 300,000 | b | 316,875 | |
| | 6,472,590 | |
Information Technology - .3% | | | | | |
Advanced Micro Devices,
Sr. Unscd. Notes | | 7.50 | | 8/15/22 | | 150,000 | | 170,062 | |
Amkor Technology,
Gtd. Notes | | 6.38 | | 10/1/22 | | 75,000 | | 77,625 | |
BMC Software Finance,
Gtd. Notes | | 8.13 | | 7/15/21 | | 125,000 | b | 128,594 | |
Boxer Parent,
Sr. Unscd. Notes | | 9.00 | | 10/15/19 | | 75,000 | b | 75,235 | |
Camelot Finance,
Gtd. Notes | | 7.88 | | 10/15/24 | | 75,000 | b | 80,812 | |
CDW,
Gtd. Notes | | 5.50 | | 12/1/24 | | 75,000 | | 83,437 | |
28
| | | | | | | | | | |
| |
Description | Coupon
Rate (%) | | Maturity
Date | | Principal
Amount ($) | a | Value ($) | |
Bonds and Notes - 4.7% (continued) | | | | | |
Information Technology - .3% (continued) | | | | | |
CDW,
Sr. Scd. Bonds | | 5.00 | | 9/1/25 | | 75,000 | | 78,844 | |
Conduent Finance,
Gtd. Notes | | 10.50 | | 12/15/24 | | 75,000 | b | 88,500 | |
Dell International,
Gtd. Notes | | 5.88 | | 6/15/21 | | 350,000 | b | 367,413 | |
EMC,
Sr. Unscd. Notes | | 2.65 | | 6/1/20 | | 350,000 | | 345,955 | |
Everi Payments,
Gtd. Notes | | 10.00 | | 1/15/22 | | 100,000 | | 109,250 | |
First Data,
Scd. Notes | | 5.75 | | 1/15/24 | | 300,000 | b | 315,000 | |
First Data,
Sr. Scd. Notes | | 5.38 | | 8/15/23 | | 250,000 | b | 260,625 | |
Genesys Telecommunications Laboratories,
Sr. Unscd. Notes | | 10.00 | | 11/30/24 | | 75,000 | b | 84,844 | |
Harland Clarke Holdings,
Sr. Scd. Bonds | | 9.25 | | 3/1/21 | | 50,000 | b | 51,125 | |
Infor Software Parent,
Gtd. Notes | | 7.13 | | 5/1/21 | | 125,000 | b | 129,062 | |
Infor US,
Gtd. Notes | | 6.50 | | 5/15/22 | | 50,000 | | 52,490 | |
Informatica,
Gtd. Notes | | 7.13 | | 7/15/23 | | 75,000 | b | 76,688 | |
Ingram Micro,
Sr. Unscd. Notes | | 5.45 | | 12/15/24 | | 75,000 | | 76,769 | |
Micron Technology,
Sr. Unscd. Notes | | 5.25 | | 8/1/23 | | 75,000 | b | 78,878 | |
NCR,
Gtd. Notes | | 4.63 | | 2/15/21 | | 75,000 | | 76,313 | |
NCR,
Sr. Unscd. Notes | | 4.75 | | 12/15/21 | | 125,000 | b | 130,000 | |
NCR,
Sr. Unscd. Notes | | 5.00 | | 7/15/22 | | 75,000 | | 77,063 | |
Netflix,
Sr. Unscd. Notes | | 4.88 | | 4/15/28 | | 100,000 | b | 99,520 | |
Nuance Communications,
Sr. Unscd. Notes | | 5.63 | | 12/15/26 | | 75,000 | b | 80,062 | |
NXP Funding,
Gtd. Notes | | 4.63 | | 6/15/22 | | 50,000 | b | 53,688 | |
NXP Funding,
Gtd. Notes | | 3.88 | | 9/1/22 | | 75,000 | b | 78,094 | |
NXP Funding,
Sr. Sub. Notes | | 4.13 | | 6/1/21 | | 125,000 | b | 130,937 | |
Open Text,
Sr. Scd. Bonds | | 5.63 | | 1/15/23 | | 75,000 | b | 78,844 | |
29
CONSOLIDATED STATEMENT OF INVESTMENTS (continued)
| | | | | | | | | | |
| |
Description | Coupon
Rate (%) | | Maturity
Date | | Principal
Amount ($) | a | Value ($) | |
Bonds and Notes - 4.7% (continued) | | | | | |
Information Technology - .3% (continued) | | | | | |
Open Text,
Sr. Unscd. Notes | | 5.88 | | 6/1/26 | | 75,000 | b | 81,469 | |
Rackspace Hosting,
Gtd. Notes | | 8.63 | | 11/15/24 | | 75,000 | b | 79,172 | |
Riverbed Technology,
Gtd. Notes | | 8.88 | | 3/1/23 | | 75,000 | b | 67,406 | |
Sabre Global,
Scd. Notes | | 5.25 | | 11/15/23 | | 75,000 | b | 78,938 | |
Solera Finance,
Sr. Unscd. Notes | | 10.50 | | 3/1/24 | | 75,000 | b | 85,875 | |
Sungard Availability Services Capital,
Sr. Scd. Notes | | 8.75 | | 4/1/22 | | 100,000 | b | 69,500 | |
Symantec,
Gtd. Notes | | 5.00 | | 4/15/25 | | 75,000 | b | 78,563 | |
TIBCO Software,
Sr. Unscd. Notes | | 11.38 | | 12/1/21 | | 125,000 | b | 136,875 | |
Veritas US,
Sr. Scd. Notes | | 10.50 | | 2/1/24 | | 75,000 | b | 80,250 | |
Western Digital,
Gtd. Notes | | 10.50 | | 4/1/24 | | 300,000 | | 352,800 | |
Zebra Technologies,
Sr. Unscd. Bonds | | 7.25 | | 10/15/22 | | 21,000 | | 22,221 | |
| | 4,668,798 | |
Materials - .5% | | | | | |
Alcoa Nederland Holding,
Gtd. Notes | | 6.75 | | 9/30/24 | | 75,000 | b | 83,739 | |
Alcoa Nederland Holding,
Sr. Unscd. Notes | | 7.00 | | 9/30/26 | | 75,000 | b | 85,875 | |
Aleris International,
Gtd. Notes | | 7.88 | | 11/1/20 | | 100,000 | | 100,308 | |
Aleris International,
Sr. Scd. Notes | | 9.50 | | 4/1/21 | | 75,000 | b | 80,344 | |
Allegheny Technologies,
Gtd. Notes | | 5.95 | | 1/15/21 | | 75,000 | | 77,531 | |
Allegheny Technologies,
Sr. Unscd. Notes | | 7.88 | | 8/15/23 | | 75,000 | | 82,312 | |
American Builders & Contractors Supply,
Sr. Unscd. Notes | | 5.63 | | 4/15/21 | | 27,000 | b | 27,844 | |
Arcelormittal,
Sr. Unscd. Bonds | | 6.13 | | 6/1/25 | | 75,000 | | 86,885 | |
ArcelorMittal,
Sr. Unscd. Notes | | 5.75 | | 8/5/20 | | 70,000 | | 76,300 | |
ArcelorMittal,
Sr. Unscd. Notes | | 6.00 | | 3/1/21 | | 50,000 | | 55,000 | |
ARD Finance,
Sr. Unscd. Notes | | 7.13 | | 9/15/23 | | 75,000 | | 80,062 | |
30
| | | | | | | | | | |
| |
Description | Coupon
Rate (%) | | Maturity
Date | | Principal
Amount ($) | a | Value ($) | |
Bonds and Notes - 4.7% (continued) | | | | | |
Materials - .5% (continued) | | | | | |
Ardagh Packaging Finance,
Gtd. Notes | | 6.00 | | 6/30/21 | | 50,000 | b | 51,625 | |
Ardagh Packaging Finance,
Gtd. Notes | | 4.63 | | 5/15/23 | | 75,000 | b | 77,344 | |
Ardagh Packaging Finance,
Gtd. Notes | | 7.25 | | 5/15/24 | | 75,000 | b | 82,687 | |
Ashland,
Gtd. Notes | | 4.75 | | 8/15/22 | | 135,000 | | 142,789 | |
Ashland,
Gtd. Notes | | 6.88 | | 5/15/43 | | 50,000 | | 56,250 | |
Axalta Coating Systems,
Gtd. Notes | | 4.88 | | 8/15/24 | | 75,000 | b | 78,563 | |
Ball,
Gtd. Bonds | | 5.00 | | 3/15/22 | | 350,000 | | 379,312 | |
Ball,
Gtd. Notes | | 4.38 | | 12/15/20 | | 50,000 | | 52,688 | |
Ball,
Gtd. Notes | | 4.00 | | 11/15/23 | | 75,000 | | 77,344 | |
Ball,
Gtd. Notes | | 5.25 | | 7/1/25 | | 75,000 | | 82,687 | |
Berry Global,
Gtd. Notes | | 5.13 | | 7/15/23 | | 75,000 | | 79,031 | |
Berry Global,
Scd. Notes | | 5.50 | | 5/15/22 | | 75,000 | | 77,906 | |
Blue Cube Spinco,
Gtd. Notes | | 9.75 | | 10/15/23 | | 75,000 | | 90,187 | |
Blue Cube Spinco,
Gtd. Notes | | 10.00 | | 10/15/25 | | 75,000 | | 91,687 | |
BlueScope Steel Finance,
Sr. Sub. Notes | | 6.50 | | 5/15/21 | | 125,000 | b | 130,937 | |
Cascades,
Gtd. Notes | | 5.50 | | 7/15/22 | | 75,000 | b | 77,625 | |
Century Aluminum Co,
Scd. Notes | | 7.50 | | 6/1/21 | | 50,000 | b | 51,500 | |
CF Industries,
Gtd. Notes | | 7.13 | | 5/1/20 | | 50,000 | | 55,125 | |
CF Industries,
Gtd. Notes | | 3.45 | | 6/1/23 | | 75,000 | | 74,250 | |
CF Industries,
Gtd. Notes | | 4.95 | | 6/1/43 | | 75,000 | | 69,000 | |
CF Industries,
Gtd. Notes | | 5.38 | | 3/15/44 | | 75,000 | | 72,281 | |
Chemours,
Gtd. Notes | | 6.63 | | 5/15/23 | | 75,000 | | 79,875 | |
Chemours,
Gtd. Notes | | 7.00 | | 5/15/25 | | 75,000 | | 84,000 | |
31
CONSOLIDATED STATEMENT OF INVESTMENTS (continued)
| | | | | | | | | | |
| |
Description | Coupon
Rate (%) | | Maturity
Date | | Principal
Amount ($) | a | Value ($) | |
Bonds and Notes - 4.7% (continued) | | | | | |
Materials - .5% (continued) | | | | | |
CIMPOR Financial Operations,
Gtd. Notes | | 5.75 | | 7/17/24 | | 75,000 | b | 71,906 | |
Cleveland-Cliffs,
Gtd. Notes | | 5.75 | | 3/1/25 | | 75,000 | b | 73,219 | |
Consolidated Energy Finance,
Gtd. Notes | | 6.75 | | 10/15/19 | | 75,000 | b | 76,406 | |
Constellium,
Sr. Scd. Notes | | 6.63 | | 3/1/25 | | 75,000 | b | 78,000 | |
Coveris Holdings,
Gtd. Notes | | 7.88 | | 11/1/19 | | 125,000 | b | 122,500 | |
Crown Americas,
Gtd. Notes | | 4.50 | | 1/15/23 | | 75,000 | | 78,270 | |
CVR Partners,
Gtd. Notes | | 9.25 | | 6/15/23 | | 75,000 | b | 80,156 | |
Flex Acquisition,
Sr. Unscd. Notes | | 6.88 | | 1/15/25 | | 75,000 | b | 77,672 | |
FMG Resources August 2006,
Gtd. Notes | | 4.75 | | 5/15/22 | | 50,000 | b | 51,250 | |
Freeport-McMoRan,
Gtd. Notes | | 4.00 | | 11/14/21 | | 50,000 | | 50,625 | |
Freeport-McMoRan,
Gtd. Notes | | 3.55 | | 3/1/22 | | 350,000 | | 347,375 | |
Freeport-McMoRan,
Gtd. Notes | | 3.88 | | 3/15/23 | | 300,000 | | 297,375 | |
Freeport-McMoRan,
Gtd. Notes | | 5.40 | | 11/14/34 | | 75,000 | | 73,500 | |
GCP Applied Technologies,
Gtd. Notes | | 9.50 | | 2/1/23 | | 75,000 | b | 84,187 | |
H.B. Fuller,
Sr. Unscd. Notes | | 4.00 | | 2/15/27 | | 60,000 | | 57,000 | |
Hexion,
Sr. Scd. Notes | | 6.63 | | 4/15/20 | | 250,000 | | 223,750 | |
Hudbay Minerals,
Gtd. Notes | | 7.25 | | 1/15/23 | | 75,000 | b | 81,187 | |
Hudbay Minerals,
Gtd. Notes | | 7.63 | | 1/15/25 | | 75,000 | b | 83,062 | |
Huntsman International,
Gtd. Notes | | 4.88 | | 11/15/20 | | 125,000 | | 131,875 | |
Imperial Metals,
Gtd. Notes | | 7.00 | | 3/15/19 | | 135,000 | b | 125,212 | |
INEOS Group Holdings,
Gtd. Notes | | 5.63 | | 8/1/24 | | 75,000 | b | 78,375 | |
Kinross Gold,
Sr. Unscd. Notes | | 5.13 | | 9/1/21 | | 75,000 | | 80,062 | |
Koppers,
Gtd. Notes | | 6.00 | | 2/15/25 | | 75,000 | b | 80,625 | |
32
| | | | | | | | | | |
| |
Description | Coupon
Rate (%) | | Maturity
Date | | Principal
Amount ($) | a | Value ($) | |
Bonds and Notes - 4.7% (continued) | | | | | |
Materials - .5% (continued) | | | | | |
Lundin Mining,
Sr. Scd. Notes | | 7.50 | | 11/1/20 | | 75,000 | b | 78,015 | |
Momentive Performance Materials,
Sr. Scd. Notes | | 3.88 | | 10/24/21 | | 75,000 | | 78,765 | |
Novelis,
Gtd. Notes | | 6.25 | | 8/15/24 | | 75,000 | b | 79,312 | |
Novelis,
Gtd. Notes | | 5.88 | | 9/30/26 | | 75,000 | b | 77,484 | |
Owens-Brockway Glass Container,
Gtd. Notes | | 5.00 | | 1/15/22 | | 300,000 | b | 318,375 | |
Platform Specialty Products,
Sr. Unscd. Notes | | 10.38 | | 5/1/21 | | 125,000 | b | 135,937 | |
Platform Specialty Products,
Sr. Unscd. Notes | | 6.50 | | 2/1/22 | | 125,000 | b | 129,844 | |
PolyOne,
Sr. Unscd. Notes | | 5.25 | | 3/15/23 | | 75,000 | | 81,000 | |
PQ,
Gtd. Notes | | 6.75 | | 11/15/22 | | 75,000 | b | 81,375 | |
Rayonier AM Products,
Gtd. Notes | | 5.50 | | 6/1/24 | | 75,000 | b | 73,125 | |
Resolute Forest Products,
Gtd. Notes | | 5.88 | | 5/15/23 | | 75,000 | | 76,031 | |
Reynolds Group Issuer,
Gtd. Notes | | 5.13 | | 7/15/23 | | 75,000 | b | 78,188 | |
Reynolds Group Issuer,
Gtd. Notes | | 7.00 | | 7/15/24 | | 75,000 | b | 80,203 | |
Sealed Air,
Gtd. Notes | | 6.50 | | 12/1/20 | | 50,000 | b | 55,438 | |
Signode Industrial Group,
Gtd. Notes | | 6.38 | | 5/1/22 | | 75,000 | b | 78,281 | |
Silgan Holdings,
Gtd. Notes | | 5.00 | | 4/1/20 | | 75,000 | | 76,031 | |
St. Marys Cement,
Gtd. Notes | | 5.75 | | 1/28/27 | | 75,000 | b | 79,421 | |
Standard Industries,
Gtd. Notes | | 5.13 | | 2/15/21 | | 125,000 | b | 129,531 | |
Standard Industries,
Gtd. Notes | | 5.50 | | 2/15/23 | | 75,000 | b | 79,312 | |
Steel Dynamics,
Gtd. Notes | | 5.13 | | 10/1/21 | | 125,000 | | 128,594 | |
Steel Dynamics,
Gtd. Notes | | 5.00 | | 12/15/26 | | 75,000 | | 79,500 | |
Taseko Mines,
Sr. Scd. Notes | | 8.75 | | 6/15/22 | | 100,000 | b | 101,750 | |
Teck Resources,
Gtd. Notes | | 4.75 | | 1/15/22 | | 50,000 | | 53,000 | |
33
CONSOLIDATED STATEMENT OF INVESTMENTS (continued)
| | | | | | | | | | |
| |
Description | Coupon
Rate (%) | | Maturity
Date | | Principal
Amount ($) | a | Value ($) | |
Bonds and Notes - 4.7% (continued) | | | | | |
Materials - .5% (continued) | | | | | |
Teck Resources,
Gtd. Notes | | 3.75 | | 2/1/23 | | 75,000 | | 75,985 | |
Teck Resources,
Gtd. Notes | | 8.50 | | 6/1/24 | | 75,000 | b | 86,062 | |
Teck Resources,
Gtd. Notes | | 5.40 | | 2/1/43 | | 100,000 | | 102,500 | |
TPC Group,
Sr. Scd. Notes | | 8.75 | | 12/15/20 | | 50,000 | b | 49,125 | |
Tronox Finance,
Gtd. Notes | | 7.50 | | 3/15/22 | | 125,000 | b | 131,719 | |
United States Steel,
Sr. Scd. Notes | | 8.38 | | 7/1/21 | | 75,000 | b | 82,031 | |
United States Steel,
Sr. Unscd. Notes | | 6.88 | | 8/15/25 | | 100,000 | | 101,937 | |
WR Grace & Co-Conn,
Gtd. Notes | | 5.13 | | 10/1/21 | | 75,000 | b | 80,812 | |
| | 8,393,165 | |
Real Estate - .1% | | | | | |
Equinix,
Sr. Unscd. Notes | | 5.38 | | 4/1/23 | | 75,000 | | 77,813 | |
Equinix,
Sr. Unscd. Notes | | 5.88 | | 1/15/26 | | 275,000 | | 298,719 | |
ESH Hospitality,
Gtd. Notes | | 5.25 | | 5/1/25 | | 75,000 | b | 77,719 | |
FelCor Lodging,
Scd. Notes | | 5.63 | | 3/1/23 | | 75,000 | | 77,906 | |
GEO Group,
Gtd. Notes | | 6.00 | | 4/15/26 | | 100,000 | | 105,000 | |
Iron Mountain,
Gtd. Notes | | 6.00 | | 8/15/23 | | 75,000 | | 79,312 | |
Iron Mountain,
Gtd. Notes | | 5.75 | | 8/15/24 | | 125,000 | | 128,750 | |
iStar,
Gtd. Bonds | | 6.00 | | 4/1/22 | | 100,000 | | 104,250 | |
iStar,
Sr. Unscd. Notes | | 5.00 | | 7/1/19 | | 150,000 | | 151,594 | |
MPT Operating Partnership,
Gtd. Notes | | 5.25 | | 8/1/26 | | 75,000 | | 78,464 | |
Realogy Group,
Gtd. Notes | | 5.25 | | 12/1/21 | | 50,000 | b | 51,813 | |
Realogy Group,
Gtd. Notes | | 4.88 | | 6/1/23 | | 75,000 | b | 77,603 | |
SBA Communications,
Sr. Unscd. Notes | | 4.88 | | 7/15/22 | | 200,000 | | 207,000 | |
Starwood Property Trust,
Gtd. Notes | | 5.00 | | 12/15/21 | | 75,000 | | 78,750 | |
34
| | | | | | | | | | |
| |
Description | Coupon
Rate (%) | | Maturity
Date | | Principal
Amount ($) | a | Value ($) | |
Bonds and Notes - 4.7% (continued) | | | | | |
Real Estate - .1% (continued) | | | | | |
Uniti Group,
Gtd. Notes | | 6.00 | | 4/15/23 | | 75,000 | b | 75,281 | |
Uniti Group,
Gtd. Notes | | 8.25 | | 10/15/23 | | 300,000 | | 289,500 | |
| | 1,959,474 | |
Telecommunications - .4% | | | | | |
CenturyLink,
Sr. Unscd. Bonds, Ser. P | | 7.60 | | 9/15/39 | | 120,000 | | 111,300 | |
CenturyLink,
Sr. Unscd. Notes, Ser. S | | 6.45 | | 6/15/21 | | 75,000 | | 79,508 | |
CenturyLink,
Sr. Unscd. Notes, Ser. T | | 5.80 | | 3/15/22 | | 125,000 | | 127,344 | |
CenturyLink,
Sr. Unscd. Notes, Ser. V | | 5.63 | | 4/1/20 | | 125,000 | | 130,781 | |
CenturyLink,
Sr. Unscd. Notes, Ser. Y | | 7.50 | | 4/1/24 | | 175,000 | | 186,375 | |
Cincinnati Bell,
Gtd. Notes | | 7.00 | | 7/15/24 | | 75,000 | b | 75,000 | |
CommScope,
Gtd. Notes | | 5.00 | | 6/15/21 | | 75,000 | b | 76,781 | |
CommScope,
Gtd. Notes | | 5.50 | | 6/15/24 | | 75,000 | b | 78,375 | |
CommScope Technologies,
Gtd. Notes | | 6.00 | | 6/15/25 | | 75,000 | b | 79,500 | |
Consolidated Communications,
Gtd. Notes | | 6.50 | | 10/1/22 | | 75,000 | | 73,875 | |
Frontier Communications,
Sr. Unscd. Notes | | 10.50 | | 9/15/22 | | 300,000 | | 263,910 | |
Frontier Communications,
Sr. Unscd. Notes | | 7.63 | | 4/15/24 | | 100,000 | | 77,000 | |
Frontier Communications,
Sr. Unscd. Notes | | 11.00 | | 9/15/25 | | 300,000 | | 255,375 | |
GCI,
Gtd. Notes | | 6.75 | | 6/1/21 | | 75,000 | | 76,969 | |
Hughes Satellite Systems,
Gtd. Notes | | 7.63 | | 6/15/21 | | 180,000 | | 202,702 | |
Hughes Satellite Systems,
Sr. Scd. Notes | | 6.50 | | 6/15/19 | | 190,000 | | 202,326 | |
Inmarsat Finance,
Gtd. Notes | | 4.88 | | 5/15/22 | | 125,000 | b | 128,150 | |
Intelsat Jackson Holding,
Gtd. Notes | | 9.75 | | 7/15/25 | | 150,000 | b | 151,500 | |
Intelsat Jackson Holdings,
Gtd. Notes | | 7.25 | | 10/15/20 | | 210,000 | | 203,112 | |
Intelsat Jackson Holdings,
Gtd. Notes | | 7.50 | | 4/1/21 | | 200,000 | | 190,500 | |
35
CONSOLIDATED STATEMENT OF INVESTMENTS (continued)
| | | | | | | | | | |
| |
Description | Coupon
Rate (%) | | Maturity
Date | | Principal
Amount ($) | a | Value ($) | |
Bonds and Notes - 4.7% (continued) | | | | | |
Telecommunications - .4% (continued) | | | | | |
Intelsat Jackson Holdings,
Gtd. Notes | | 5.50 | | 8/1/23 | | 150,000 | | 128,437 | |
Intelsat Jackson Holdings,
Sr. Unscd. Notes | | 8.00 | | 2/15/24 | | 75,000 | b | 80,062 | |
Level 3 Financing,
Gtd. Notes | | 5.38 | | 8/15/22 | | 300,000 | | 309,834 | |
Nokia,
Sr. Unscd. Notes | | 3.38 | | 6/12/22 | | 50,000 | | 49,938 | |
Sable International Finance,
Gtd. Notes | | 6.88 | | 8/1/22 | | 75,000 | b | 80,625 | |
SoftBank Group,
Gtd. Notes | | 4.50 | | 4/15/20 | | 50,000 | b | 51,765 | |
Sprint,
Gtd. Notes | | 7.88 | | 9/15/23 | | 300,000 | | 336,000 | |
Sprint,
Gtd. Notes | | 7.13 | | 6/15/24 | | 300,000 | | 325,032 | |
Sprint Capital,
Gtd. Notes | | 6.88 | | 11/15/28 | | 100,000 | | 106,937 | |
Sprint Capital,
Gtd. Notes | | 8.75 | | 3/15/32 | | 100,000 | | 121,500 | |
Sprint Communications,
Gtd. Notes | | 9.00 | | 11/15/18 | | 56,000 | b | 59,430 | |
Sprint Communications,
Gtd. Notes | | 7.00 | | 3/1/20 | | 100,000 | b | 108,750 | |
Sprint Communications,
Gtd. Notes | | 6.00 | | 11/15/22 | | 300,000 | | 315,750 | |
Telecom Italia,
Sr. Scd. Notes | | 5.30 | | 5/30/24 | | 75,000 | b | 81,094 | |
Telecom Italia Capital,
Gtd. Notes | | 7.18 | | 6/18/19 | | 150,000 | | 162,187 | |
Telecom Italia Capital,
Gtd. Notes | | 6.38 | | 11/15/33 | | 100,000 | | 116,500 | |
Telecom Italia Capital,
Gtd. Notes | | 7.20 | | 7/18/36 | | 150,000 | | 186,600 | |
Telesat,
Gtd. Notes | | 8.88 | | 11/15/24 | | 75,000 | b | 84,187 | |
T-Mobile USA,
Gtd. Notes | | 4.00 | | 4/15/22 | | 50,000 | | 51,844 | |
T-Mobile USA,
Gtd. Notes | | 6.63 | | 4/1/23 | | 225,000 | | 236,812 | |
T-Mobile USA,
Gtd. Notes | | 6.38 | | 3/1/25 | | 250,000 | | 270,625 | |
T-Mobile USA,
Gtd. Notes | | 5.38 | | 4/15/27 | | 200,000 | | 217,000 | |
T-Mobile USA,
Sr. Unscd. Notes | | 6.13 | | 1/15/22 | | 50,000 | | 52,125 | |
36
| | | | | | | | | | |
| |
Description | Coupon
Rate (%) | | Maturity
Date | | Principal
Amount ($) | a | Value ($) | |
Bonds and Notes - 4.7% (continued) | | | | | |
Telecommunications - .4% (continued) | | | | | |
West,
Sr. Scd. Notes | | 4.75 | | 7/15/21 | | 50,000 | b | 50,938 | |
Wind Acquisition Finance,
Sr. Scd. Notes | | 6.50 | | 4/30/20 | | 125,000 | b | 129,419 | |
Wind Acquisition Finance,
Sr. Scd. Notes | | 4.75 | | 7/15/20 | | 50,000 | b | 50,720 | |
Windstream Services,
Gtd. Notes | | 6.38 | | 8/1/23 | | 75,000 | | 54,938 | |
Zayo Group,
Gtd. Notes | | 6.00 | | 4/1/23 | | 75,000 | | 79,219 | |
Zayo Group,
Gtd. Notes | | 6.38 | | 5/15/25 | | 75,000 | | 81,008 | |
Zayo Group,
Gtd. Notes | | 5.75 | | 1/15/27 | | 75,000 | b | 79,219 | |
| | 6,828,878 | |
Utilities - .1% | | | | | |
AES,
Sr. Unscd. Notes | | 4.88 | | 5/15/23 | | 300,000 | | 308,250 | |
AmeriGas Partners,
Gtd. Notes | | 5.88 | | 8/20/26 | | 75,000 | | 78,375 | |
AmeriGas Partners,
Sr. Unscd. Notes | | 5.63 | | 5/20/24 | | 75,000 | | 79,406 | |
Calpine,
Sr. Scd. Notes | | 6.00 | | 1/15/22 | | 200,000 | b | 207,250 | |
Calpine,
Sr. Scd. Notes | | 5.25 | | 6/1/26 | | 130,000 | b | 130,812 | |
Dynegy,
Gtd. Notes | | 7.38 | | 11/1/22 | | 150,000 | | 161,062 | |
Dynegy,
Gtd. Notes | | 8.13 | | 1/30/26 | | 120,000 | b | 133,350 | |
Dynegy,
Sr. Unscd. Notes | | 7.63 | | 11/1/24 | | 75,000 | | 82,312 | |
Enel,
Sr. Scd. Notes, 3 Month LIBOR + 5.88% | | 8.75 | | 9/24/73 | | 75,000 | b,c | 92,812 | |
FirstEnergy Solutions,
Gtd. Notes | | 6.80 | | 8/15/39 | | 70,000 | | 35,700 | |
InterGen,
Gtd. Notes | | 7.00 | | 6/30/23 | | 75,000 | b | 73,125 | |
NGL Energy Partners,
Gtd. Notes | | 6.13 | | 3/1/25 | | 75,000 | | 71,438 | |
NRG Energy,
Gtd. Notes | | 6.25 | | 7/15/22 | | 75,000 | | 79,125 | |
NRG Energy,
Gtd. Notes | | 6.63 | | 3/15/23 | | 150,000 | | 155,625 | |
NRG Energy,
Gtd. Notes | | 7.25 | | 5/15/26 | | 75,000 | | 81,656 | |
37
CONSOLIDATED STATEMENT OF INVESTMENTS (continued)
| | | | | | | | | | |
| |
Description | Coupon
Rate (%) | | Maturity
Date | | Principal
Amount ($) | a | Value ($) | |
Bonds and Notes - 4.7% (continued) | | | | | |
Utilities - .1% (continued) | | | | | |
NRG Energy,
Sr. Scd. Notes | | 6.63 | | 1/15/27 | | 75,000 | | 80,250 | |
NRG Yield Operating,
Gtd. Notes | | 5.38 | | 8/15/24 | | 75,000 | | 78,563 | |
Talen Energy Supply,
Gtd. Notes | | 6.50 | | 9/15/24 | | 75,000 | b | 63,750 | |
Talen Energy Supply,
Sr. Unscd. Notes | | 4.63 | | 7/15/19 | | 14,000 | b | 14,210 | |
Talen Energy Supply,
Sr. Unscd. Notes | | 7.00 | | 10/15/27 | | 50,000 | | 32,750 | |
TerraForm Power Operating,
Gtd. Notes | | 9.75 | | 8/15/22 | | 75,000 | b | 83,437 | |
TerraForm Power Operating,
Gtd. Notes, 3 Month U.S. T-BILL + 4.28% | | 6.38 | | 2/1/23 | | 150,000 | b,c | 157,875 | |
| | 2,281,133 | |
Total Bonds and Notes
(cost $75,137,081) | | 75,416,650 | |
Description | | | | | Shares | | Value ($) | |
Common Stocks - 4.6% | | | | | |
Exchange-Traded Funds - 4.6% | | | | | |
iShares TIPS Bond ETF
(cost $71,064,443) | | | | | | 645,668 | | 73,477,018 | |
Description /Number of Contracts/Counterparty | Exercise
Price | | Expiration Date | | Notional Amount ($) | | Value ($) | |
Options Purchased - .2% | | | | | |
Call Options - .1% | | | | | |
Swiss Market Index,
Contracts 3,980 Goldman Sachs International | | 9,123 | | 12/2017 | | 36,311,013 | | 777,846 | |
Swiss Market Index,
Contracts 1,890 Goldman Sachs International | | 9,246 | | 12/2017 | | 17,474,241 | | 216,316 | |
| | 994,162 | |
Put Options - .1% | | | | | |
S&P E-Mini Index,
Contracts 2,240 Morgan Stanley Capital Services | | 1,975 | | 6/2018 | | 221,200,000 | | 1,400,000 | |
S&P E-Mini Index,
Contracts 2,240 Morgan Stanley Capital Services | | 1,950 | | 3/2018 | | 218,400,000 | | 498,400 | |
| | 1,898,400 | |
Total Options Purchased
(cost $6,787,435) | | 2,892,562 | |
38
| | | | | | | | | | |
| |
Description | Coupon
Rate (%) | | Maturity
Date | | Principal
Amount ($) | a | Value ($) | |
Short-Term Investments - 74.3% | | | | | |
U. S. Treasury Bills | | 1.08 | | 12/7/17 | | 82,215,000 | d | 82,134,429 | |
U. S. Treasury Bills | | 0.99 | | 12/14/17 | | 1,104,243,000 | | 1,102,970,228 | |
Total Short-Term Investments
(cost $1,185,062,781) | | 1,185,104,657 | |
Description | | | | | Shares | | Value ($) | |
Other Investment - 13.3% | | | | | |
Registered Investment Company; | | | | | |
Dreyfus Institutional Preferred Government Plus Money Market Fund
(cost $213,024,668) | | | | | | 213,024,668 | e | 213,024,668 | |
Total Investments (cost $1,551,076,408) | | 97.1% | 1,549,915,555 | |
Cash and Receivables (Net) | | 2.9% | 46,036,838 | |
Net Assets | | 100.0% | 1,595,952,393 | |
ETF—Exchange-Traded Fund
LIBOR—London Interbank Offered Rate
TIPS—Treasury Inflation Protected Securities
a Amount stated in U.S. Dollars unless otherwise noted above.
b Security exempt from registration pursuant to Rule 144A under the Securities Act of 1933. These securities may be resold in transactions exempt from registration, normally to qualified institutional buyers. At October 31, 2017, these securities were valued at $30,636,743 or 1.92% of net assets.
c Variable rate security—rate shown is the interest rate in effect at period end.
d Held by a counterparty for open futures contracts.
e Investment in affiliated money market mutual fund.
| | |
Portfolio Summary (Unaudited) † | Value (%) |
Short-Term/Money Market Investments | 87.6 |
Corporate Bonds | 4.7 |
Exchange-Traded Funds | 4.6 |
Options Purchased | .2 |
| | 97.1 |
† Based on net assets.
See notes to consolidated financial statements.
39
CONSOLIDATED STATEMENT OF INVESTMENTS IN AFFILIATED ISSUERS
| | | | | | | |
Registered Investment Company | Value
10/31/16 ($) | Purchases ($) | Sales ($) | Value
10/31/17 ($) | Net
Assets (%) | Dividends/
Distributions ($) |
Dreyfus Institutional Preferred Government Plus Money Market Fund | 175,712,091 | 587,389,121 | 550,076,544 | 213,024,668 | 13.3 | 1,298,113 |
See notes to consolidated financial statements.
40
CONSOLIDATED STATEMENT OF FUTURES
October 31, 2017
| | | | | | | |
Description | Number of
Contracts | Expiration | Notional
Value ($) | Value ($) | Unrealized Appreciation (Depreciation) ($) | |
Futures Long | | |
Australian 10 Year Bond | 3,870 | 12/2017 | 377,575,026a | 381,650,908 | 4,075,882 | |
Brent Crude | 112 | 6/2018 | 6,264,688b | 6,702,080 | 437,392 | |
CAC 40 10 Euro | 661 | 11/2017 | 41,486,303a | 42,359,653 | 873,350 | |
Canadian 10 year Bond | 2,280 | 12/2017 | 239,386,399a | 242,880,707 | 3,494,308 | |
Cocoa | 192 | 3/2018 | 4,039,349b | 4,010,880 | (28,469) | |
Cotton No.2 | 424 | 12/2017 | 15,094,480b | 14,496,560 | (597,920) | |
Crude Soybean Oil | 567 | 1/2018 | 11,207,307b | 11,879,784 | 672,477 | |
DAX | 222 | 12/2017 | 81,452,752a | 85,479,102 | 4,026,350 | |
Euro-Bund Option Put 175 | 1,081 | 12/2017 | 15,767,227a | 15,425,228 | (341,999) | |
FTSE 100 | 1,860 | 12/2017 | 182,688,476a | 184,473,324 | 1,784,848 | |
FTSE/MIB Index | 228 | 12/2017 | 29,378,526a | 30,242,242 | 863,716 | |
Gasoline | 132 | 2/2018 | 9,207,258b | 9,501,307 | 294,049 | |
Gold 100 oz | 151 | 12/2017 | 18,663,010b | 19,184,550 | 521,540 | |
Hang Seng | 90 | 11/2017 | 16,284,712a | 16,266,311 | (18,401) | |
IBEX 35 Index | 580 | 11/2017 | 68,448,759a | 71,246,065 | 2,797,306 | |
Live Cattle | 15 | 12/2017 | 681,824b | 753,750 | 71,926 | |
LME Primary Aluminum | 29 | 1/2018 | 1,555,937b | 1,564,913 | 8,976 | |
LME Primary Nickel | 11 | 1/2018 | 703,485b | 811,536 | 108,051 | |
LME Refined Pig Lead | 4 | 1/2018 | 256,024b | 241,300 | (14,724) | |
LME Zinc | 7 | 1/2018 | 574,196b | 573,300 | (896) | |
Low Sulphur Gas oil | 281 | 1/2018 | 14,426,616b | 15,363,675 | 937,059 | |
NY Harbor ULSD | 53 | 2/2018 | 3,880,895b | 4,175,308 | 294,413 | |
Platinum | 56 | 1/2018 | 2,761,414b | 2,574,880 | (186,534) | |
S&P/Toronto Stock Exchange 60 Index | 82 | 12/2017 | 11,494,365a | 12,016,836 | 522,471 | |
Soybean | 113 | 1/2018 | 5,468,023b | 5,563,837 | 95,814 | |
Soybean Meal | 85 | 1/2018 | 2,691,144b | 2,667,300 | (23,844) | |
Standard & Poor's 500 E-mini | 3,251 | 12/2017 | 404,848,196 | 418,192,385 | 13,344,189 | |
Topix | 1,354 | 12/2017 | 197,077,525a | 209,938,173 | 12,860,648 | |
U.S. Treasury 10 Year Notes | 8,596 | 12/2017 | 1,081,718,487 | 1,073,962,750 | (7,755,737) | |
Futures Short | | |
Amsterdam Exchange Index | 115 | 11/2017 | (14,535,110)a | (14,779,552) | (244,442) | |
ASX SPI 200 | 114 | 12/2017 | (12,806,149)a | (12,843,202) | (37,053) | |
Chicago SRW Wheat | 428 | 3/2018 | (9,964,734)b | (9,330,400) | 634,334 | |
Coffee "C" | 171 | 3/2018 | (8,149,995)b | (8,246,475) | (96,480) | |
Copper | 24 | 3/2018 | (1,826,016)b | (1,872,600) | (46,584) | |
Corn No.2 Yellow | 642 | 3/2018 | (11,647,577)b | (11,539,950) | 107,627 | |
41
CONSOLIDATED STATEMENT OF FUTURES (continued)
| | | | | | | |
Description | Number of
Contracts | Expiration | Notional
Value ($) | Value ($) | Unrealized Appreciation (Depreciation) ($) | |
Futures Short (continued) | | |
Crude Oil | 141 | 6/2018 | (7,367,617)b | (7,664,760) | (297,143) | |
Euro-Bond | 1,460 | 12/2017 | (275,773,135)a | (276,785,714) | (1,012,579) | |
Hard Red Winter Wheat | 366 | 3/2018 | (8,293,790)b | (7,951,350) | 342,440 | |
Lean Hog | 27 | 2/2018 | (691,137)b | (788,400) | (97,263) | |
Long Gilt | 2,308 | 12/2017 | (388,675,279)a | (381,115,959) | 7,559,320 | |
Natural Gas | 306 | 3/2018 | (9,779,401)b | (9,180,000) | 599,401 | |
NYMEX Palladium | 31 | 12/2017 | (2,728,407)b | (3,035,365) | (306,958) | |
Silver | 6 | 12/2017 | (501,839)b | (500,790) | 1,049 | |
Sugar No.11 | 393 | 3/2018 | (6,450,893)b | (6,487,958) | (37,065) | |
Gross Unrealized Appreciation | | 57,328,936 | |
Gross Unrealized Depreciation | | (11,144,091) | |
a Notional amounts in foreign currency have been converted to USD using relevant foreign exchange rates.
b These securities are wholly-owned by the Subsidiary referenced in Note 1.
See notes to consolidated financial statements.
42
CONSOLIDATED STATEMENT OF OPTIONS WRITTEN
October 31, 2017
| | | | | | | |
Description/ Expiration Date/ Exercise Price | Counterparty | Number of Contracts | Notional Amount | | Value ($) | |
Call Options: | | | | | | |
S&P 500 E-mini Index
November 2017 @ 2,610 | Morgan Stanley Capital Services | 4,472 | 583,596,000 | | (536,640) | |
Put Options: | | | | | | |
Swiss Market Index
December 2017 @ 9,123 | Goldman Sachs International | 3,980 | 36,311,013 | | (335,644) | |
Swiss Market Index
December 2017 @ 9,246 | Goldman Sachs International | 1,890 | 17,474,241 | | (239,659) | |
Total Options Written (premiums received $1,612,885) | | | | (1,111,943) | |
See notes to consolidated financial statements.
43
CONSOLIDATED STATEMENT OF FORWARD FOREIGN CURRENCY EXCHANGE CONTRACTS October 31, 2017
| | | | | | |
Counterparty/ Purchased
Currency | Purchased Currency
Amounts | Currency
Sold | Sold
Currency
Amounts | Settlement Date | Unrealized Appreciation (Depreciation)($) |
Bank of America | | | |
Australian Dollar | 7,639,000 | United States Dollar | 5,844,523 | 12/20/17 | (794) |
British Pound | 21,924,000 | United States Dollar | 28,780,271 | 12/20/17 | 385,240 |
Japanese Yen | 3,753,706,000 | United States Dollar | 33,210,016 | 12/20/17 | (110,809) |
Norwegian Krone | 27,954,000 | United States Dollar | 3,419,513 | 12/20/17 | 7,449 |
New Zealand Dollar | 20,078,000 | United States Dollar | 14,105,448 | 12/20/17 | (378,652) |
Swedish Krona | 81,569,000 | United States Dollar | 9,767,046 | 12/20/17 | 7,924 |
United States Dollar | 18,716,336 | Canadian Dollar | 24,116,000 | 12/20/17 | 13,547 |
United States Dollar | 64,860,795 | Euro | 55,776,000 | 12/20/17 | (303,215) |
United States Dollar | 22,795,950 | Norwegian Krone | 181,543,000 | 12/20/17 | 540,069 |
Bank of Montreal | | | |
Australian Dollar | 13,764,800 | United States Dollar | 10,593,803 | 12/20/17 | (63,922) |
Canadian Dollar | 40,753,459 | United States Dollar | 33,254,945 | 12/20/17 | (1,649,233) |
Swiss Franc | 50,341,229 | United States Dollar | 52,829,706 | 12/20/17 | (2,187,494) |
Euro | 19,865,547 | United States Dollar | 23,884,446 | 12/20/17 | (675,204) |
New Zealand Dollar | 32,130,230 | United States Dollar | 22,355,881 | 12/20/17 | (389,296) |
Swedish Krona | 176,238,780 | United States Dollar | 21,614,342 | 12/20/17 | (494,445) |
United States Dollar | 26,477,551 | Canadian Dollar | 33,858,300 | 12/20/17 | 219,272 |
United States Dollar | 2,465,964 | Swiss Franc | 2,432,500 | 12/20/17 | 18,920 |
United States Dollar | 4,665,158 | Euro | 3,940,300 | 12/20/17 | 61,641 |
United States Dollar | 24,724,673 | British Pound | 18,909,450 | 12/20/17 | (430,580) |
United States Dollar | 47,439,691 | Japanese Yen | 5,339,214,104 | 12/20/17 | 359,885 |
Citigroup | | | |
Australian Dollar | 19,499,800 | United States Dollar | 15,300,924 | 12/20/17 | (383,848) |
Canadian Dollar | 24,677,157 | United States Dollar | 20,212,547 | 12/20/17 | (1,074,561) |
44
| | | | | | |
Counterparty/ Purchased
Currency | Purchased Currency
Amounts | Currency
Sold | Sold
Currency
Amounts | Settlement Date | Unrealized Appreciation (Depreciation)($) |
Citigroup (continued) |
Swiss Franc | 19,693,114 | United States Dollar | 20,648,271 | 12/20/17 | (837,415) |
British Pound | 13,452,000 | United States Dollar | 18,080,755 | 12/20/17 | (185,551) |
Japanese Yen | 5,502,054,289 | United States Dollar | 49,001,456 | 12/20/17 | (485,767) |
New Zealand Dollar | 6,558,310 | United States Dollar | 4,699,540 | 12/20/17 | (215,798) |
Swedish Krona | 96,435,775 | United States Dollar | 11,864,631 | 12/20/17 | (308,073) |
United States Dollar | 42,946,769 | Australian Dollar | 54,221,382 | 12/20/17 | 1,468,166 |
United States Dollar | 20,452,851 | Canadian Dollar | 25,481,000 | 12/20/17 | 691,457 |
United States Dollar | 41,208,487 | Euro | 34,699,232 | 12/20/17 | 668,809 |
United States Dollar | 79,067,406 | British Pound | 59,558,587 | 12/20/17 | (163,419) |
United States Dollar | 99,272,653 | Japanese Yen | 10,897,500,009 | 12/20/17 | 3,181,322 |
United States Dollar | 6,685,061 | Norwegian Krone | 52,859,832 | 12/20/17 | 204,822 |
United States Dollar | 12,447,381 | Swedish Krona | 100,555,016 | 12/20/17 | 397,187 |
Credit Suisse International | | | |
Euro | 33,109,244 | United States Dollar | 39,763,043 | 12/20/17 | (1,080,974) |
United States Dollar | 33,774,108 | British Pound | 25,402,852 | 12/20/17 | (19,322) |
United States Dollar | 5,346,488 | New Zealand Dollar | 7,366,713 | 12/20/17 | 310,062 |
United States Dollar | 22,756,246 | Swedish Krona | 181,192,170 | 12/20/17 | 1,042,751 |
Goldman Sachs International | | | |
Australian Dollar | 71,852,400 | United States Dollar | 56,808,936 | 12/20/17 | (1,842,849) |
Canadian Dollar | 28,567,662 | United States Dollar | 23,482,194 | 12/20/17 | (1,326,987) |
Swiss Franc | 16,020,216 | United States Dollar | 16,590,670 | 12/20/17 | (474,671) |
Euro | 44,145,659 | United States Dollar | 53,014,213 | 12/20/17 | (1,438,120) |
British Pound | 42,910,000 | United States Dollar | 57,538,910 | 12/20/17 | (455,710) |
Japanese Yen | 761,646,711 | United States Dollar | 6,782,238 | 12/20/17 | (66,235) |
New Zealand Dollar | 60,348,460 | United States Dollar | 43,335,594 | 12/20/17 | (2,076,954) |
45
CONSOLIDATED STATEMENT OF FORWARD FOREIGN CURRENCY EXCHANGE CONTRACTS (continued)
| | | | | | |
Counterparty/ Purchased
Currency | Purchased Currency
Amounts | Currency
Sold | Sold
Currency
Amounts | Settlement Date | Unrealized Appreciation (Depreciation)($) |
Goldman Sachs International (continued) |
Swedish Krona | 127,056,445 | United States Dollar | 15,587,726 | 12/20/17 | (361,684) |
United States Dollar | 49,262,244 | Australian Dollar | 61,968,971 | 12/20/17 | 1,856,843 |
United States Dollar | 36,121,319 | Canadian Dollar | 45,321,700 | 12/20/17 | 972,778 |
United States Dollar | 8,207,925 | Swiss Franc | 7,868,500 | 12/20/17 | 292,380 |
United States Dollar | 78,060,210 | Euro | 65,551,468 | 12/20/17 | 1,475,362 |
United States Dollar | 81,376,263 | British Pound | 61,080,182 | 12/20/17 | 121,259 |
United States Dollar | 32,111,614 | Japanese Yen | 3,622,566,000 | 12/20/17 | 168,766 |
United States Dollar | 12,961,923 | Norwegian Krone | 102,318,168 | 12/20/17 | 418,443 |
United States Dollar | 12,476,925 | New Zealand Dollar | 17,188,996 | 12/20/17 | 725,265 |
United States Dollar | 27,819,564 | Swedish Krona | 221,166,984 | 12/20/17 | 1,315,614 |
HSBC | | | |
Euro | 46,352,941 | United States Dollar | 55,698,621 | 12/20/17 | (1,543,724) |
British Pound | 34,716,000 | United States Dollar | 46,422,780 | 12/20/17 | (240,064) |
Japanese Yen | 1,405,379,000 | United States Dollar | 12,758,080 | 12/20/17 | (365,812) |
United States Dollar | 13,977,585 | Canadian Dollar | 17,024,000 | 12/20/17 | 774,886 |
United States Dollar | 41,709,566 | Euro | 34,920,000 | 12/20/17 | 911,961 |
United States Dollar | 42,287,331 | Swedish Krona | 336,499,745 | 12/20/17 | 1,962,268 |
Morgan Stanley Capital Services | | | |
Canadian Dollar | 54,563,209 | United States Dollar | 44,913,441 | 12/20/17 | (2,597,791) |
Swiss Franc | 12,367,000 | United States Dollar | 13,070,770 | 12/20/17 | (629,829) |
Euro | 33,109,244 | United States Dollar | 39,754,765 | 12/20/17 | (1,072,696) |
Norwegian Krone | 91,390,665 | United States Dollar | 11,668,508 | 12/20/17 | (464,662) |
United States Dollar | 29,818,723 | Australian Dollar | 37,539,521 | 12/20/17 | 1,101,512 |
United States Dollar | 30,265,252 | British Pound | 22,768,000 | 12/20/17 | (23,033) |
United States Dollar | 37,242,424 | Japanese Yen | 4,133,611,872 | 12/20/17 | 793,306 |
46
| | | | | | |
Counterparty/ Purchased
Currency | Purchased Currency
Amounts | Currency
Sold | Sold
Currency
Amounts | Settlement Date | Unrealized Appreciation (Depreciation)($) |
Morgan Stanley Capital Services (continued) |
United States Dollar | 12,978,855 | Norwegian Krone | 101,637,000 | 12/20/17 | 518,882 |
United States Dollar | 22,411,182 | New Zealand Dollar | 30,892,474 | 12/20/17 | 1,290,817 |
United States Dollar | 20,482,012 | Swedish Krona | 163,093,000 | 12/20/17 | 937,464 |
Royal Bank of Canada | | | |
Swiss Franc | 24,204,000 | United States Dollar | 25,003,357 | 12/20/17 | (654,645) |
Euro | 15,278,000 | United States Dollar | 17,957,761 | 12/20/17 | (108,225) |
Norwegian Krone | 99,006,553 | United States Dollar | 12,653,468 | 12/20/17 | (515,969) |
United States Dollar | 65,887,969 | Canadian Dollar | 81,847,000 | 12/20/17 | 2,412,799 |
United States Dollar | 76,341,047 | British Pound | 57,678,278 | 12/20/17 | (388,402) |
United States Dollar | 13,254,576 | Japanese Yen | 1,483,704,000 | 12/20/17 | 171,659 |
Gross Unrealized Appreciation | | | 27,800,787 |
Gross Unrealized Depreciation | | | (28,086,434) |
See notes to consolidated financial statements.
47
CONSOLIDATED STATEMENT OF SWAP AGREEMENTS
October 31, 2017
| | | | | | |
Centrally Cleared Credit Default Swaps | |
| | | | | | |
Reference
Obligation ($)† | Notional
Amount 1 | (Pay)
Receive
Fixed
Rate (%) | Market
Value ($) | Upfront
Premiums
Received
(Paid) ($) | Unrealized Appreciation ($) |
Sold Contracts:2 | |
Bank of America | | |
Markit CDX North America High Yield Series 29 | | | | | |
12/20/2022†† | 7,000,000 | 5.00 | 669,607 | (525,373) | 144,234 |
Gross Unrealized Appreciation | 144,234 |
† Clearing House-Chicago Mercantile Exchange
†† Expiration Date
1 The maximum potential amount the fund could be required to pay as a seller of credit protection or receive as a buyer of credit protection if a credit event occurs as defined under the terms of the swap agreement.
2 If the fund is a seller of protection and a credit event occurs, as defined under the terms of the swap agreement, the fund will either (i) pay to the buyer of protection an amount equal to the notional amount of the swap and take delivery of the reference obligation or (ii) pay a net settlement amount in the form of cash or securities equal to the notional amount of the swap less the recovery value of the reference obligation.
See notes to consolidated financial statements.
48
CONSOLIDATED STATEMENT OF ASSETS AND LIABILITIES
October 31, 2017
| | | | | | | |
| | | | | | |
| | | Cost | | Value | |
Assets ($): | | | | |
Investments in securities—See Consolidated
Statement of Investments: | | | |
Unaffiliated issuers | 1,338,051,740 | | 1,336,890,887 | |
Affiliated issuers | | 213,024,668 | | 213,024,668 | |
Cash | | | | | 21,231,188 | |
Cash denominated in foreign currency | | | 494,855 | | 480,473 | |
Unrealized appreciation on forward foreign
currency exchange contracts—Note 4 | | 27,800,787 | |
Cash collateral held by broker—Note 4 | | 22,889,734 | |
Receivable for futures variation margin—Note 4 | | 3,180,423 | |
Dividends and interest receivable | | 1,380,199 | |
Receivable for shares of Common Stock subscribed | | 811,053 | |
Swap premium paid—Note 4 | | 525,373 | |
Receivable for swap variation margin—Note 4 | | 146,344 | |
Prepaid expenses | | | | | 55,805 | |
| | | | | 1,628,416,934 | |
Liabilities ($): | | | | |
Due to The Dreyfus Corporation and affiliates—Note 3(c) | | | | | 1,579,679 | |
Unrealized depreciation on forward foreign
currency exchange contracts—Note 4 | | 28,086,434 | |
Payable for shares of Common Stock redeemed | | 1,118,403 | |
Outstanding options written, at value
(premiums received $1,612,885)—Note 4 | | 1,111,943 | |
Payable for investment securities purchased | | 158,395 | |
Payable to broker for swap agreements—Note 4 | | 133,697 | |
Accrued expenses | | | | | 275,990 | |
| | | | | 32,464,541 | |
Net Assets ($) | | | 1,595,952,393 | |
Composition of Net Assets ($): | | | | |
Paid-in capital | | | | | 1,497,208,767 | |
Accumulated investment (loss)—net | | (1,757,232) | |
Accumulated net realized gain (loss) on investments | | | | | 55,573,195 | |
Accumulated net unrealized appreciation (depreciation)
on investments, options transactions and foreign currency
transactions (including $46,184,845 net unrealized
appreciation on futures and $144,234
net unrealized appreciation on centrally cleared swap
agreements) | | | | 44,927,663 | |
Net Assets ($) | | | 1,595,952,393 | |
| | | | | | |
Net Asset Value Per Share | Class A | Class C | Class I | Class Y | |
Net Assets ($) | 73,457,802 | 80,833,931 | 653,751,654 | 787,909,006 | |
Shares Outstanding | 4,417,790 | 5,195,133 | 38,368,691 | 46,227,842 | |
Net Asset Value Per Share ($) | 16.63 | 15.56 | 17.04 | 17.04 | |
| | | | | | |
See notes to consolidated financial statements. | | | | | |
49
CONSOLIDATED STATEMENT OF OPERATIONS
Year Ended October 31, 2017
| | | | | | | |
| | | | | | |
| | | | | | |
Investment Income ($): | | | | |
Income: | | | | |
Interest | | | 10,547,807 | |
Dividends: | |
Unaffiliated issuers | | | 2,741,134 | |
Affiliated issuers | | | 1,298,113 | |
Total Income | | | 14,587,054 | |
Expenses: | | | | |
Management fee—Note 3(a) | | | 15,879,916 | |
Shareholder servicing costs—Note 3(c) | | | 1,161,930 | |
Subsidiary management fee—Note 3(a) | | | 930,454 | |
Distribution fees—Note 3(b) | | | 751,192 | |
Professional fees | | | 160,619 | |
Registration fees | | | 132,509 | |
Directors’ fees and expenses—Note 3(d) | | | 131,012 | |
Prospectus and shareholders’ reports | | | 87,198 | |
Custodian fees—Note 3(c) | | | 78,061 | |
Loan commitment fees—Note 2 | | | 32,353 | |
Miscellaneous | | | 85,336 | |
Total Expenses | | | 19,430,580 | |
Less—reduction in expenses due to undertaking—Note 3(a) | | | (1,106,110) | |
Less—reduction in fees due to earnings credits—Note 3(c) | | | (20,658) | |
Net Expenses | | | 18,303,812 | |
Investment (Loss)—Net | | | (3,716,758) | |
Realized and Unrealized Gain (Loss) on Investments—Note 4 ($): | | |
Net realized gain (loss) on investments and foreign currency transactions | 4,532,297 | |
Net realized gain (loss) on options transactions | (30,010,255) | |
Net realized gain (loss) on futures | 95,029,998 | |
Net realized gain (loss) on swap agreements | 90,745 | |
Net realized gain (loss) on forward foreign currency exchange contracts | 10,515,297 | |
Net Realized Gain (Loss) | | | 80,158,082 | |
Net unrealized appreciation (depreciation) on investments
and foreign currency transactions | | | (5,109,344) | |
Net unrealized appreciation (depreciation) on options transactions | 10,986,295 | |
Net unrealized appreciation (depreciation) on futures | | | 25,531,169 | |
Net unrealized appreciation (depreciation) on swap agreements | | | 144,234 | |
Net unrealized appreciation (depreciation) on
forward foreign currency exchange contracts | | | (19,997,214) | |
Net Unrealized Appreciation (Depreciation) | | | 11,555,140 | |
Net Realized and Unrealized Gain (Loss) on Investments | | | 91,713,222 | |
Net Increase in Net Assets Resulting from Operations | | 87,996,464 | |
| | | | | | | |
See notes to consolidated financial statements. | | | | | |
50
CONSOLIDATED STATEMENT OF CHANGES IN NET ASSETS
| | | | | | | | | | |
| | | | Year Ended October 31, |
| | | | 2017 | | 2016 | |
Operations ($): | | | | | | | | |
Investment (loss)—net | | | (3,716,758) | | | | (13,274,277) | |
Net realized gain (loss) on investments | | 80,158,082 | | | | 25,754,545 | |
Net unrealized appreciation (depreciation)
on investments | | 11,555,140 | | | | (2,661,420) | |
Net Increase (Decrease) in Net Assets
Resulting from Operations | 87,996,464 | | | | 9,818,848 | |
Distributions to Shareholders from ($): | |
Net realized gain on investments: | | | | | | | | |
Class A | | | (341,762) | | | | - | |
Class C | | | (237,196) | | | | - | |
Class I | | | (775,856) | | | | - | |
Class Y | | | (1,271,510) | | | | - | |
Total Distributions | | | (2,626,324) | | | | - | |
Capital Stock Transactions ($): | |
Net proceeds from shares sold: | | | | | | | | |
Class A | | | 15,191,131 | | | | 85,425,288 | |
Class C | | | 5,013,783 | | | | 46,807,391 | |
Class I | | | 467,890,826 | | | | 299,261,521 | |
Class Y | | | 217,849,128 | | | | 230,391,741 | |
Distributions reinvested: | | | | | | | | |
Class A | | | 325,546 | | | | - | |
Class C | | | 181,423 | | | | - | |
Class I | | | 590,605 | | | | - | |
Class Y | | | 721,951 | | | | - | |
Cost of shares redeemed: | | | | | | | | |
Class A | | | (151,909,545) | | | | (148,416,191) | |
Class C | | | (59,663,859) | | | | (57,090,576) | |
Class I | | | (294,198,094) | | | | (343,046,982) | |
Class Y | | | (130,888,867) | | | | (66,580,605) | |
Increase (Decrease) in Net Assets
from Capital Stock Transactions | 71,104,028 | | | | 46,751,587 | |
Total Increase (Decrease) in Net Assets | 156,474,168 | | | | 56,570,435 | |
Net Assets ($): | |
Beginning of Period | | | 1,439,478,225 | | | | 1,382,907,790 | |
End of Period | | | 1,595,952,393 | | | | 1,439,478,225 | |
Accumulated investment (loss)—net | (1,757,232) | | | | (2,748,744) | |
51
CONSOLIDATED STATEMENT OF CHANGES IN NET ASSETS (continued)
| | | | | | | | | | |
| | | | Year Ended October 31, |
| | | | 2017 | | 2016 | |
Capital Share Transactions (Shares): | |
Class Aa | | | | | | | | |
Shares sold | | | 955,739 | | | | 5,592,205 | |
Shares issued for distributions reinvested | | | 21,139 | | | | - | |
Shares redeemed | | | (9,643,628) | | | | (9,694,240) | |
Net Increase (Decrease) in Shares Outstanding | (8,666,750) | | | | (4,102,035) | |
Class Ca | | | | | | | | |
Shares sold | | | 337,106 | | | | 3,221,954 | |
Shares issued for distributions reinvested | | | 12,512 | | | | - | |
Shares redeemed | | | (4,009,428) | | | | (3,925,165) | |
Net Increase (Decrease) in Shares Outstanding | (3,659,810) | | | | (703,211) | |
Class Ia | | | | | | | | |
Shares sold | | | 28,694,862 | | | | 19,107,885 | |
Shares issued for distributions reinvested | | | 37,522 | | | | - | |
Shares redeemed | | | (18,147,833) | | | | (22,047,720) | |
Net Increase (Decrease) in Shares Outstanding | 10,584,551 | | | | (2,939,835) | |
Class Ya | | | | | | | | |
Shares sold | | | 13,453,316 | | | | 14,699,682 | |
Shares issued for distributions reinvested | | | 45,867 | | | | - | |
Shares redeemed | | | (8,067,592) | | | | (4,261,697) | |
Net Increase (Decrease) in Shares Outstanding | 5,431,591 | | | | 10,437,985 | |
| | | | | | | | | | |
a During the period ended October 31, 2017, 2,183 Class A shares representing $34,879 were exchanged for 2,132 Class I shares, 2,736 Class C shares representing $40,409 were exchanged for 2,518 Class I shares, 638,261 Class Y shares representing $10,378,341 were exchanged for 638,253 Class I shares and during the period ended October 31, 2016, 369,275 Class Y shares representing $5,809,635 were exchanged for 369,082 Class I shares. | |
See notes to consolidated financial statements. | | | | | | | | |
52
CONSOLIDATED FINANCIAL HIGHLIGHTS
The following tables describe the performance for each share class for the fiscal periods indicated. All information (except portfolio turnover rate) reflects financial results for a single fund share. Total return shows how much your investment in the fund would have increased (or decreased) during each period, assuming you had reinvested all dividends and distributions. These figures have been derived from the fund’s financial statements.
| | | | | | | |
| | | |
| | | Year Ended October 31, |
Class A Shares | | 2017 | 2016 | 2015 | 2014 | 2013 |
Per Share Data ($): | | | | | | |
Net asset value, beginning of period | | 15.73 | 15.63 | 15.36 | 14.18 | 12.49 |
Investment Operations: | | | | | | |
Investment (loss)—neta | | (.09) | (.17) | (.22) | (.19) | (.01) |
Net realized and unrealized
gain (loss) on investments | | 1.02 | .27 | .49b | 1.38 | 1.65 |
Payment by affiliate | | – | – | – | – | .05 |
Total from
Investment Operations | | .93 | .10 | .27 | 1.19 | 1.69 |
Distributions: | | | | | | |
Dividends from
investment income—net | | – | – | – | (.01) | – |
Dividends from
net realized gain on investments | | (.03) | – | – | – | – |
Total Distributions | | (.03) | – | – | (.01) | – |
Net asset value, end of period | | 16.63 | 15.73 | 15.63 | 15.36 | 14.18 |
Total Return (%)c | | 5.92 | .70 | 1.69 | 8.42 | 13.53d |
Ratios/Supplemental Data (%): | | | | | | |
Ratio of total expenses
to average net assets | | 1.55 | 1.51 | 1.49 | 1.54 | 1.65 |
Ratio of net expenses
to average net assets | | 1.47 | 1.50 | 1.49 | 1.50 | 1.50 |
Ratio of net investment (loss)
to average net assets | | (.56) | (1.13) | (1.41) | (1.30) | (.04) |
Portfolio Turnover Rate | | 69.80 | 10.66 | 165.55 | 124.10 | 1.74 |
Net Assets, end of period ($ x 1,000) | | 73,458 | 205,832 | 268,600 | 54,798 | 23,462 |
a Based on average shares outstanding.
b In addition to net realized and unrealized losses on investments, this amount includes an increase in net asset value per share resulting from the timing of issuances and redemptions of shares in relation to fluctuating market values for the portfolio investments.
c Exclusive of sales charge.
d The total return would have been 13.13% had a reimbursement for a trade error not been made by Mellon Capital.
See notes to consolidated financial statements.
53
CONSOLIDATED FINANCIAL HIGHLIGHTS (continued)
| | | | | | | |
| | | |
| | | Year Ended October 31, |
Class C Shares | | 2017 | 2016 | 2015 | 2014 | 2013 |
Per Share Data ($): | | | | | | |
Net asset value, beginning of period | | 14.83 | 14.85 | 14.70 | 13.66 | 12.12 |
Investment Operations: | | | | | | |
Investment (loss)—neta | | (.19) | (.27) | (.33) | (.29) | (.10) |
Net realized and unrealized
gain (loss) on investments | | .95 | .25 | .48b | 1.33 | 1.59 |
Payment by affiliate | | – | – | – | – | .05 |
Total from
Investment Operations | | .76 | (.02) | .15 | 1.04 | 1.54 |
Distributions: | | | | | | |
Dividends from
net realized gain on investments | | (.03) | – | – | – | – |
Net asset value, end of period | | 15.56 | 14.83 | 14.85 | 14.70 | 13.66 |
Total Return (%)c | | 5.14 | (.07) | .95 | 7.61 | 12.71d |
Ratios/Supplemental Data (%): | | | | | | |
Ratio of total expenses
to average net assets | | 2.32 | 2.26 | 2.24 | 2.30 | 2.44 |
Ratio of net expenses
to average net assets | | 2.23 | 2.25 | 2.24 | 2.25 | 2.25 |
Ratio of net investment (loss)
to average net assets | | (1.26) | (1.82) | (2.16) | (2.08) | (.78) |
Portfolio Turnover Rate | | 69.80 | 10.66 | 165.55 | 124.10 | 1.74 |
Net Assets, end of period ($ x 1,000) | | 80,834 | 131,341 | 141,904 | 23,672 | 9,409 |
a Based on average shares outstanding.
b In addition to net realized and unrealized losses on investments, this amount includes an increase in net asset value per share resulting from the timing of issuances and redemptions of shares in relation to fluctuating market values for the portfolio investments.
c Exclusive of sales charge.
d The total return would have been 12.29% had a reimbursement for a trade error not been made by Mellon Capital.
See notes to consolidated financial statements.
54
| | | | | | | |
| | | |
| | | Year Ended October 31, |
Class I Shares | | 2017 | 2016 | 2015 | 2014 | 2013 |
Per Share Data ($): | | | | | | |
Net asset value, beginning of period | | 16.08 | 15.93 | 15.61 | 14.39 | 12.65 |
Investment Operations: | | | | | | |
Investment income (loss)—neta | | (.03) | (.13) | (.19) | (.14) | .03 |
Net realized and unrealized
gain (loss) on investments | | 1.02 | .28 | .51b | 1.39 | 1.67 |
Payment by affiliate | | – | – | – | – | .05 |
Total from
Investment Operations | | .99 | .15 | .32 | 1.25 | 1.75 |
Distributions: | | | | | | |
Dividends from
investment income—net | | – | – | – | (.03) | (.01) |
Dividends from
net realized gain on investments | | (.03) | – | – | – | – |
Total Distributions | | (.03) | – | – | (.03) | (.01) |
Net asset value, end of period | | 17.04 | 16.08 | 15.93 | 15.61 | 14.39 |
Total Return (%) | | 6.17 | 1.01 | 1.92 | 8.77 | 13.82c |
Ratios/Supplemental Data (%): | | | | | | |
Ratio of total expenses
to average net assets | | 1.30 | 1.25 | 1.22 | 1.21 | 1.29 |
Ratio of net expenses
to average net assets | | 1.21 | 1.24 | 1.22 | 1.21 | 1.25 |
Ratio of net investment income
(loss) to average net assets | | (.17) | (.86) | (1.15) | (.94) | .20 |
Portfolio Turnover Rate | | 69.80 | 10.66 | 165.55 | 124.10 | 1.74 |
Net Assets, end of period ($ x 1,000) | | 653,752 | 446,643 | 489,361 | 71,731 | 253,971 |
a Based on average shares outstanding.
b In addition to net realized and unrealized losses on investments, this amount includes an increase in net asset value per share resulting from the timing of issuances and redemptions of shares in relation to fluctuating market values for the portfolio investments.
c The total return would have been 13.42% had a reimbursement for a trade error not been made by Mellon Capital.
See notes to consolidated financial statements.
55
CONSOLIDATED FINANCIAL HIGHLIGHTS (continued)
| | | | | | | |
| | | |
| | | Year Ended October 31, |
Class Y Shares | | 2017 | 2016 | 2015 | 2014 | 2013a |
Per Share Data ($): | | | | | | |
Net asset value, beginning of period | | 16.07 | 15.91 | 15.59 | 14.39 | 13.45 |
Investment Operations: | | | | | | |
Investment (loss)—netb | | (.02) | (.11) | (.15) | (.17) | (.01) |
Net realized and unrealized
gain (loss) on investments | | 1.02 | .27 | .47c | 1.40 | .90 |
Payment by affiliate | | – | – | – | – | .05 |
Total from
Investment Operations | | 1.00 | .16 | .32 | 1.23 | .94 |
Distributions: | | | | | | |
Dividends from
investment income—net | | – | – | – | (.03) | – |
Dividends from
net realized gain on investments | | (.03) | – | – | – | – |
Total Distributions | | (.03) | – | – | (.03) | – |
Net asset value, end of period | | 17.04 | 16.07 | 15.91 | 15.59 | 14.39 |
Total Return (%) | | 6.23 | 1.01 | 2.05 | 8.56 | 6.99d,e |
Ratios/Supplemental Data (%): | | | | | |
Ratio of total expenses
to average net assets | | 1.21 | 1.18 | 1.14 | 1.16 | 1.31f |
Ratio of net expenses
to average net assets | | 1.15 | 1.16 | 1.14 | 1.16 | 1.25f |
Ratio of net investment (loss)
to average net assets | | (.14) | (.68) | (.96) | (1.14) | (.18)f |
Portfolio Turnover Rate | | 69.80 | 10.66 | 165.55 | 124.10 | 1.74 |
Net Assets, end of period ($ x 1,000) | | 787,909 | 655,662 | 483,043 | 387,629 | 1 |
a From July 1, 2013 (commencement of initial offering) to October 31, 2013.
b Based on average shares outstanding.
c In addition to net realized and unrealized losses on investments, this amount includes an increase in net asset value per share resulting from the timing of issuances and redemptions of shares in relation to fluctuating market values for the portfolio investments.
d Not annualized.
e The total return would have been 6.62% had a reimbursement for a trade error not been made by Mellon Capital.
f Annualized.
See notes to consolidated financial statements.
56
NOTES TO CONSOLIDATED FINANCIAL STATEMENTS
NOTE 1—Significant Accounting Policies:
Dynamic Total Return Fund (the “fund”) is a separate non-diversified series of Advantage Funds, Inc. (the “Company”), which is registered under the Investment Company Act of 1940, as amended (the “Act”), as an open-end management investment company and operates as a series company currently offering nine series, including the fund. The fund’s investment objective is to seek total return. The Dreyfus Corporation (the “Manager” or “Dreyfus”), a wholly-owned subsidiary of The Bank of New York Mellon Corporation (“BNY Mellon”), serves as the fund’s investment adviser. Mellon Capital Management Corporation (“Mellon Capital”), a wholly-owned subsidiary of BNY Mellon and an affiliate of Dreyfus, serves as the fund’s sub-investment adviser.
The fund may invest in certain commodities through its investment in DTR Commodity Fund Ltd., (the “Subsidiary”), a wholly-owned and controlled subsidiary of the fund organized under the laws of the Cayman Islands. The Subsidiary has the ability to invest in commodities and securities consistent with the investment objective of the fund. Dreyfus serves as investment adviser for the Subsidiary, Mellon Capital serves as the Subsidiary’s sub-investment advisor and Citibank N.A. serves as the Subsidiary’s custodian. The financial statements have been consolidated and include the accounts of the fund and the Subsidiary. Accordingly, all inter-company transactions and balances have been eliminated. A subscription agreement was entered into between the fund and the Subsidiary, comprising the entire issued share capital of the Subsidiary, with the intent that the fund will remain the sole shareholder and retain all rights. Under the Amended and Restated Memorandum and Articles of Association, shares issued by the Subsidiary confer upon a shareholder the right to receive notice of, to attend and to vote at general meetings of the Subsidiary and shall confer upon the shareholder rights in a winding-up or repayment of capital and the right to participate in the profits or assets of the Subsidiary. The following summarizes the structure and relationship of the Subsidiary at October 31, 2017:
57
NOTES TO CONSOLIDATED FINANCIAL STATEMENTS (continued)
| | | | |
| | Subsidiary Activity |
Consolidated fund Net Assets ($) | | 1,595,952,393 | |
Subsidiary Percentage of fund Net Assets | | 6.28% | |
Subsidiary Financial Statement Information ($) | | | |
Total assets | | 100,294,134 | |
Total liabilities | | 140,585 | |
Net assets | | 100,153,549 | |
Total income | | 370,266 | |
Investment income (loss)—net | | (633,622) | |
Net realized gain (loss) | | (6,816,684) | |
Net unrealized appreciation (depreciation) | | 3,895,922 | |
Net increase (decrease) in net assets resulting from operations | | (3,554,384) | |
Effective March 31, 2017, the fund authorized the issuance of Class T shares, but, as of the date of this report, the fund did not offer Class T shares for purchase. The fund authorized 100 million Class T shares which resulted in the fund’s total authorized shares increased from 500 million to 600 million.
MBSC Securities Corporation (the “Distributor”), a wholly-owned subsidiary of Dreyfus, is the distributor of the fund’s shares. The fund is authorized to issue 600 million shares of $.001 par value Common Stock. The fund currently has authorized five classes of shares: Class A (200 million shares authorized), Class C (100 million shares authorized), Class I (100 million shares authorized), Class T (100 million shares authorized) and Class Y (100 million shares authorized). Class A and Class T shares generally are subject to a sales charge imposed at the time of purchase. Class C shares are subject to a contingent deferred sales charge (“CDSC”) imposed on Class C shares redeemed within one year of purchase. Class I and Class Y shares are sold at net asset value per share generally to institutional investors. Other differences between the classes include the services offered to and the expenses borne by each class, the allocation of certain transfer agency costs, and certain voting rights. Income, expenses (other than expenses attributable to a specific class), and realized and unrealized gains or losses on investments are allocated to each class of shares based on its relative net assets.
The Company accounts separately for the assets, liabilities and operations of each series. Expenses directly attributable to each series are charged to that series’ operations; expenses which are applicable to all series are allocated among them on a pro rata basis.
The Financial Accounting Standards Board (“FASB”) Accounting Standards Codification (“ASC”) is the exclusive reference of authoritative U.S. generally accepted accounting principles (“GAAP”) recognized by the FASB to be applied by nongovernmental entities. Rules and interpretive releases of the Securities and Exchange Commission (“SEC”) under
58
authority of federal laws are also sources of authoritative GAAP for SEC registrants. The fund’s financial statements are prepared in accordance with GAAP, which may require the use of management estimates and assumptions. Actual results could differ from those estimates.
The Company enters into contracts that contain a variety of indemnifications. The fund’s maximum exposure under these arrangements is unknown. The fund does not anticipate recognizing any loss related to these arrangements.
(a) Portfolio valuation: The fair value of a financial instrument is the amount that would be received to sell an asset or paid to transfer a liability in an orderly transaction between market participants at the measurement date (i.e., the exit price). GAAP establishes a fair value hierarchy that prioritizes the inputs of valuation techniques used to measure fair value. This hierarchy gives the highest priority to unadjusted quoted prices in active markets for identical assets or liabilities (Level 1 measurements) and the lowest priority to unobservable inputs (Level 3 measurements).
Additionally, GAAP provides guidance on determining whether the volume and activity in a market has decreased significantly and whether such a decrease in activity results in transactions that are not orderly. GAAP requires enhanced disclosures around valuation inputs and techniques used during annual and interim periods.
Various inputs are used in determining the value of the fund’s investments relating to fair value measurements. These inputs are summarized in the three broad levels listed below:
Level 1—unadjusted quoted prices in active markets for identical investments.
Level 2—other significant observable inputs (including quoted prices for similar investments, interest rates, prepayment speeds, credit risk, etc.).
Level 3—significant unobservable inputs (including the fund’s own assumptions in determining the fair value of investments).
The inputs or methodology used for valuing securities are not necessarily an indication of the risk associated with investing in those securities.
Changes in valuation techniques may result in transfers in or out of an assigned level within the disclosure hierarchy. Valuation techniques used to value the fund’s investments are as follows:
Investments in debt securities, excluding short-term investments (other than U.S. Treasury Bills), futures, options and forward foreign currency
59
NOTES TO CONSOLIDATED FINANCIAL STATEMENTS (continued)
exchange contracts (“forward contracts”) are valued each business day by an independent pricing service (the “Service”) approved by the Company’s Board of Directors (the “Board”). Investments for which quoted bid prices are readily available and are representative of the bid side of the market in the judgment of the Service are valued at the mean between the quoted bid prices (as obtained by the Service from dealers in such securities) and asked prices (as calculated by the Service based upon its evaluation of the market for such securities). Other investments (which constitute a majority of portfolio securities) are valued as determined by the Service, based on methods which include consideration of the following: yields or prices of securities of comparable quality, coupon, maturity and type; indications as to values from dealers; and general market conditions. These securities are generally categorized within Level 2 of the fair value hierarchy.
Investments in equity securities are valued at the last sales price on the securities exchange or national securities market on which such securities are primarily traded. Securities listed on the National Market System for which market quotations are available are valued at the official closing price or, if there is no official closing price that day, at the last sales price. For open short positions, asked prices are used for valuation purposes. Bid price is used when no asked price is available. Registered investment companies that are not traded on an exchange are valued at their net asset value. All of the preceding securities are generally categorized within Level 1 of the fair value hierarchy.
Securities not listed on an exchange or the national securities market, or securities for which there were no transactions, are valued at the average of the most recent bid and asked prices. U.S. Treasury Bills are valued at the mean price between quoted bid prices and asked prices by the Service approved by the Board. These securities are generally categorized within Level 2 of the fair value hierarchy.
The Service is engaged under the general supervision of the Board.
Fair valuing of securities may be determined with the assistance of a pricing service using calculations based on indices of domestic securities and other appropriate indicators, such as prices of relevant American Depository Receipts and futures. Utilizing these techniques may result in transfers between Level 1 and Level 2 of the fair value hierarchy.
When market quotations or official closing prices are not readily available, or are determined to not accurately reflect fair value, such as when the value of a security has been significantly affected by events after the close of the exchange or market on which the security is principally traded (for example, a foreign exchange or market), but before the fund calculates its
60
net asset value, the fund may value these investments at fair value as determined in accordance with the procedures approved by the Board. Certain factors may be considered when fair valuing investments such as: fundamental analytical data, the nature and duration of restrictions on disposition, an evaluation of the forces that influence the market in which the securities are purchased and sold, and public trading in similar securities of the issuer or comparable issuers. These securities are either categorized within Level 2 or 3 of the fair value hierarchy depending on the relevant inputs used.
For restricted securities where observable inputs are limited, assumptions about market activity and risk are used and are generally categorized within Level 3 of the fair value hierarchy.
Investments denominated in foreign currencies are translated to U.S. dollars at the prevailing rates of exchange.
Futures and options, which are traded on an exchange, are valued at the last sales price on the securities exchange on which such securities are primarily traded or at the last sales price on the national securities market on each business day and are generally categorized within Level 1 of the fair value hierarchy. Options traded over-the-counter (“OTC”) are valued at the mean between the bid and asked price and are generally categorized within Level 2 of the fair value hierarchy. Investments in swap agreements are valued each business day by the Service. Swaps are valued by the Service by using a swap pricing model which incorporates among other factors, default probabilities, recovery rates, credit curves of the underlying issuer and swap spreads on interest rates and are generally categorized within Level 2 of the fair value hierarchy. Forward contracts are valued at the forward rate and are generally categorized within Level 2 of the fair value hierarchy.
The following is a summary of the inputs used as of October 31, 2017 in valuing the fund’s investments:
| | | | | |
| | Level 1 - Unadjusted Quoted Prices | Level 2 - Other Significant Observable Inputs | Level 3 -Significant Unobservable Inputs | Total |
Assets ($) | | | |
Investments in Securities: | | | |
Corporate Bonds† | – | 75,416,650 | – | 75,416,650 |
Exchange-Traded Funds | 73,477,018 | – | – | 73,477,018 |
Registered Investment Company | 213,024,668 | – | – | 213,024,668 |
61
NOTES TO CONSOLIDATED FINANCIAL STATEMENTS (continued)
| | | | | |
| | Level 1 - Unadjusted Quoted Prices | Level 2 - Other Significant Observable Inputs | Level 3 -Significant Unobservable Inputs | Total |
U.S. Treasury | – | 1,185,104,657 | – | 1,185,104,657 |
Other Financial Instruments: | | | |
Futures†† | 57,328,936 | – | – | 57,328,936 |
Forward Foreign Currency Exchange Contracts†† | – | 27,800,787 | – | 27,800,787 |
Options Purchased | 1,898,400 | 994,162 | – | 2,892,562 |
Swaps†† | – | 144,234 | – | 144,234 |
Liabilities ($) | | | | |
Other Financial Instruments: | | | |
Futures†† | (11,144,091) | – | – | (11,144,091) |
Forward Foreign Currency Exchange Contracts†† | – | (28,086,434) | – | (28,086,434) |
Options Written | (536,640) | (575,303) | – | (1,111,943) |
† See Consolidated Statement of Investments for additional detailed categorizations.
†† Amount shown represents unrealized appreciation (depreciation) at period end.
(b) Foreign currency transactions: The fund does not isolate that portion of the results of operations resulting from changes in foreign exchange rates on investments from the fluctuations arising from changes in the market prices of securities held. Such fluctuations are included with the net realized and unrealized gain or loss on investments.
Net realized foreign exchange gains or losses arise from sales of foreign currencies, currency gains or losses realized on securities transactions between trade and settlement date, and the difference between the amounts of dividends, interest and foreign withholding taxes recorded on the fund’s books and the U.S. dollar equivalent of the amounts actually received or paid. Net unrealized foreign exchange gains and losses arise from changes in the value of assets and liabilities other than investments resulting from changes in exchange rates. Foreign currency gains and losses on foreign currency transactions are also included with net realized and unrealized gain or loss on investments.
(c) Securities transactions and investment income: Securities transactions are recorded on a trade date basis. Realized gains and losses from securities transactions are recorded on the identified cost basis. Dividend income is recognized on the ex-dividend date and interest income, including, where applicable, accretion of discount and
62
amortization of premium on investments, is recognized on the accrual basis.
(d) Affiliated issuers: Investments in other investment companies advised by Dreyfus are defined as “affiliated” under the Act.
(e) Risk: Investing in foreign markets may involve special risks and considerations not typically associated with investing in the U.S. These risks include revaluation of currencies, high rates of inflation, repatriation restrictions on income and capital, and adverse political and economic developments. Moreover, securities issued in these markets may be less liquid, subject to government ownership controls and delayed settlements, and their prices may be more volatile than those of comparable securities in the U.S.
The fund’s investments in commodity-linked financial derivatives instruments may subject the fund to greater market price volatility than investments in traditional securities. The value of commodity-linked financial derivative instruments may be affected by changes in overall market movements, commodity index volatility, changes in interest rates, or factors affecting a particular industry or commodity, such as drought, floods, weather, livestock disease, embargoes, tariffs and international economic, political and regulatory developments.
(f) Dividends and distributions to shareholders: Dividends and distributions are recorded on the ex-dividend date. Dividends from investment income-net and dividends from net realized capital gains, if any, are normally declared and paid annually, but the fund may make distributions on a more frequent basis to comply with the distribution requirements of the Internal Revenue Code of 1986, as amended (the “Code”). To the extent that net realized capital gains can be offset by capital loss carryovers, it is the policy of the fund not to distribute such gains. Income and capital gain distributions are determined in accordance with income tax regulations, which may differ from GAAP.
(g) Federal income taxes: It is the policy of the fund to continue to qualify as a regulated investment company, if such qualification is in the best interests of its shareholders, by complying with the applicable provisions of the Code, and to make distributions of taxable income sufficient to relieve it from substantially all federal income and excise taxes.
The Subsidiary is classified as a controlled foreign corporation under Subchapter N of the Code. Therefore, the fund is required to increase its taxable income by its share of the Subsidiary’s income. Net investment losses of the Subsidiary cannot be deducted by the fund in the current period nor carried forward to offset taxable income in future periods.
63
NOTES TO CONSOLIDATED FINANCIAL STATEMENTS (continued)
As of and during the period ended October 31, 2017, the fund did not have any liabilities for any uncertain tax positions. The fund recognizes interest and penalties, if any, related to uncertain tax positions as income tax expense in the Consolidated Statement of Operations. During the period ended October 31, 2017, the fund did not incur any interest or penalties.
Each tax year in the four-year period ended October 31, 2017 remains subject to examination by the Internal Revenue Service and state taxing authorities.
At October 31, 2017, the components of accumulated earnings on a tax basis were as follows: undistributed ordinary income $44,205,438, undistributed capital gains $29,444,143 and unrealized appreciation $26,707,043. In addition, the fund deferred for tax purposes late year ordinary losses of $1,612,998 to the first day of the following fiscal year.
The tax character of distributions paid to shareholders during the fiscal periods ended October 31, 2017 and October 31, 2016 were as follows: long-term capital gains $2,626,324 and $0, respectively.
During the period ended October 31, 2017, as a result of permanent book to tax differences, primarily due to the tax treatment for foreign currency transactions, net operating losses and swap periodic payments, the fund increased accumulated undistributed investment income-net by $4,708,270, increased accumulated net realized gain (loss) on investments by $2,742,037 and decreased paid-in capital by $7,450,307. Net assets and net asset value per share were not affected by this reclassification.
NOTE 2—Bank Lines of Credit:
The fund participates with other Dreyfus-managed funds in an $830 million unsecured credit facility led by Citibank, N.A. and a $300 million unsecured credit facility provided by The Bank of New York Mellon, a subsidiary of BNY Mellon and an affiliate of Dreyfus (each, a “Facility”), each to be utilized primarily for temporary or emergency purposes, including the financing of redemptions. Prior to October 4, 2017, the unsecured credit facility with Citibank, N.A. was $810 million. In connection therewith, the fund has agreed to pay its pro rata portion of commitment fees for each Facility. Interest is charged to the fund based on rates determined pursuant to the terms of the respective Facility at the time of borrowing. During the period ended October 31, 2017, the fund did not borrow under the Facilities.
64
NOTE 3— Management Fee, Sub-Investment Advisory Fee and Other Transactions with Affiliates:
(a) Dreyfus has entered into separate management agreements with the fund and the Subsidiary pursuant to which Dreyfus receives a management fee computed at the annual rate of 1.10% of the value of the average daily net assets of each of the fund and the Subsidiary which is payable monthly. In addition, Dreyfus has contractually agreed for as long as the fund invests in the Subsidiary, to waive the management fee it receives from the fund in an amount equal to the management fee paid to Dreyfus by the Subsidiary. The reduction in expenses, pursuant to the undertaking amounted to $930,454 during the period ended October 31, 2017.
Dreyfus has contractually agreed, from April 21, 2017 through March 1, 2018, to waive receipt of its fees and/or assume the direct expenses of the fund, so that the annual fund operating expenses for Class A, C, I and Y shares (excluding Rule 12b-1 Distribution Plan fees, Shareholder Services Plan fees, taxes, interest expense, brokerage commissions, commitment fees on borrowings and extraordinary expenses) do not exceed 1.19% of the value of the fund’s average daily net assets. The reduction in expenses, pursuant to the undertaking, amounted to $175,656 during the period ended October 31, 2017.
Pursuant to separate sub-investment advisory agreements between Dreyfus and Mellon Capital with respect to the fund and the Subsidiary, Dreyfus pays Mellon Capital an annual fee of .65% of the value of the average daily net assets of each of the fund and the Subsidiary which is payable monthly.
During the period ended October 31, 2017, the Distributor retained $10,211 from commissions earned on sales of the fund’s Class A shares and $30,795 from CDSCs on redemptions of the fund’s Class C shares.
(b) Under the Distribution Plan adopted pursuant to Rule 12b-1 under the Act, Class C shares pay the Distributor for distributing its shares at an annual rate of .75% of the value of its average daily net assets. During the period ended October 31, 2017, Class C shares were charged $751,192 pursuant to the Distribution Plan.
(c) Under the Shareholder Services Plan, Class A and Class C shares pay the Distributor at an annual rate of .25% of the value of their average daily net assets for the provision of certain services. The services provided may include personal services relating to shareholder accounts, such as answering shareholder inquiries regarding the fund and providing reports and other information, and services related to the maintenance of shareholder accounts. The Distributor may make payments to Service Agents (securities dealers, financial institutions or other industry
65
NOTES TO CONSOLIDATED FINANCIAL STATEMENTS (continued)
professionals) with respect to these services. The Distributor determines the amounts to be paid to Service Agents. During the period ended October 31, 2017, Class A and Class C shares were charged $263,836 and $250,397, respectively, pursuant to the Shareholder Services Plan.
The fund has arrangements with the transfer agent and the custodian whereby the fund may receive earnings credits when positive cash balances are maintained, which are used to offset transfer agency and custody fees. For financial reporting purposes, the fund includes net earnings credits as an expense offset in the Consolidated Statement of Operations.
The fund compensates Dreyfus Transfer, Inc., a wholly-owned subsidiary of Dreyfus, under a transfer agency agreement for providing transfer agency and cash management services for the fund. The majority of transfer agency fees are comprised of amounts paid on a per account basis, while cash management fees are related to fund subscriptions and redemptions. During the period ended October 31, 2017, the fund was charged $17,766 for transfer agency services and $1,089 for cash management services. These fees are included in Shareholder servicing costs in the Consolidated Statement of Operations. Cash management fees were offset by earnings credits of $1,089.
The fund compensates The Bank of New York Mellon under a custody agreement for providing custodial services for the fund. These fees are determined based on net assets, geographic region and transaction activity. During the period ended October 31, 2017, the fund was charged $78,061 pursuant to the custody agreement. These fees were partially offset by earnings credits of $19,569.
During the period ended October 31, 2017, the fund was charged $11,224 for services performed by the Chief Compliance Officer and his staff.
The components of “Due to The Dreyfus Corporation and affiliates” in the Consolidated Statement of Assets and Liabilities consist of: management fees $1,568,564, Distribution Plan fees $52,151, Shareholder Services Plan fees $32,934, custodian fees $17,435, Chief Compliance Officer fees $6,538 and transfer agency fees $2,190, which are offset against an expense reimbursement currently in effect in the amount of $100,133.
(d) Each Board member also serves as a Board member of other funds within the Dreyfus complex. Annual retainer fees and attendance fees are allocated to each fund based on net assets.
66
NOTE 4—Securities Transactions:
The aggregate amount of purchases and sales of investment securities, excluding short-term securities, futures, options transactions, forward contracts and swap agreements, during the period ended October 31, 2017, amounted to $109,352,731 and $97,187,034, respectively.
Derivatives: A derivative is a financial instrument whose performance is derived from the performance of another asset. The fund enters into International Swaps and Derivatives Association, Inc. Master Agreements or similar agreements (collectively, “Master Agreements”) with its OTC derivative contract counterparties in order to, among other things, reduce its credit risk to counterparties. Master Agreements include provisions for general obligations, representations, collateral and events of default or termination. Under a Master Agreement, the fund may offset with the counterparty certain derivative financial instrument’s payables and/or receivables with collateral held and/or posted and create one single net payment in the event of default or termination.
Each type of derivative instrument that was held by the fund during the period ended October 31, 2017 is discussed below.
Futures: In the normal course of pursuing its investment objective, the fund is exposed to market risk, including equity price risk, interest rate risk and commodity risk, as a result of changes in value of underlying financial instruments. The fund invests in futures in order to manage its exposure to or protect against changes in the market. A futures contract represents a commitment for the future purchase or a sale of an asset at a specified date. Upon entering into such contracts, these investments require initial margin deposits with a counterparty, which consist of cash or cash equivalents. The amount of these deposits is determined by the exchange or Board of Trade on which the contract is traded and is subject to change. Accordingly, variation margin payments are received or made to reflect daily unrealized gains or losses which are recorded in the Consolidated Statement of Operations. When the contracts are closed, the fund recognizes a realized gain or loss which is reflected in the Consolidated Statement of Operations. There is minimal counterparty credit risk to the fund with futures since they are exchange traded, and the exchange guarantees the futures against default. Futures open at October 31, 2017 are set forth in the Consolidated Statement of Futures.
Options Transactions: The fund purchases and writes (sells) put and call options to hedge against changes in the values of values of equities, interest rates or as a substitute for an investment. The fund is subject to market risk and interest rate risk in the course of pursuing its investment
67
NOTES TO CONSOLIDATED FINANCIAL STATEMENTS (continued)
objectives through its investments in options contracts. A call option gives the purchaser of the option the right (but not the obligation) to buy, and obligates the writer to sell, the underlying financial instrument at the exercise price at any time during the option period, or at a specified date. Conversely, a put option gives the purchaser of the option the right (but not the obligation) to sell, and obligates the writer to buy the underlying financial instrument at the exercise price at any time during the option period, or at a specified date.
As a writer of call options, the fund receives a premium at the outset and then bears the market risk of unfavorable changes in the price of the financial instrument underlying the option. Generally, the fund realizes a gain, to the extent of the premium, if the price of the underlying financial instrument decreases between the date the option is written and the date on which the option is terminated. Generally, the fund incurs a loss if the price of the financial instrument increases between those dates.
As a writer of put options, the fund receives a premium at the outset and then bears the market risk of unfavorable changes in the price of the financial instrument underlying the option. Generally, the fund realizes a gain, to the extent of the premium, if the price of the underlying financial instrument increases between the date the option is written and the date on which the option is terminated. Generally, the fund incurs a loss if the price of the financial instrument decreases between those dates. The maximum payout for those contracts is limited to the number of put option contracts written and the related strike prices, respectively.
As a writer of an option, the fund has no control over whether the underlying financial instrument may be sold (call) or purchased (put) and as a result bears the market risk of an unfavorable change in the price of the financial instrument underlying the written option. There is a risk of loss from a change in value of such options which may exceed the related premiums received. This risk may be mitigated by Master Agreements, if any, between the fund and the counterparty and the posting of collateral, if any, by the counterparty to the fund to cover the fund’s exposure to the counterparty. The Consolidated Statement of Operations reflects any unrealized gains or losses which occurred during the period as well as any realized gains or losses which occurred upon the expiration or closing of the option transaction. Options written open at October 31, 2017 are set forth in Consolidated Statement of Options Written.
Forward Foreign Currency Exchange Contracts: The fund enters into forward contracts in order to hedge its exposure to changes in foreign currency exchange rates on its foreign portfolio holdings, to settle foreign currency transactions or as a part of its investment strategy. When
68
executing forward contracts, the fund is obligated to buy or sell a foreign currency at a specified rate on a certain date in the future. With respect to sales of forward contracts, the fund incurs a loss if the value of the contract increases between the date the forward contract is opened and the date the forward contract is closed. The fund realizes a gain if the value of the contract decreases between those dates. With respect to purchases of forward contracts, the fund incurs a loss if the value of the contract decreases between the date the forward contract is opened and the date the forward contract is closed. The fund realizes a gain if the value of the contract increases between those dates. Any realized or unrealized gains or losses which occurred during the period are reflected in the Consolidated Statement of Operations. The fund is exposed to foreign currency risk as a result of changes in value of underlying financial instruments. The fund is also exposed to credit risk associated with counterparty nonperformance on these forward contracts, which is generally limited to the unrealized gain on each open contract. This risk may be mitigated by Master Agreements, if any, between the fund and the counterparty and the posting of collateral, if any, by the counterparty to the fund to cover the fund’s exposure to the counterparty. Forward contracts open at October 31, 2017 are set forth in the Consolidated Statement of Forward Foreign Currency Exchange Contracts.
Swap Agreements: The fund enters into swap agreements to exchange the interest rate on, or return generated by, one nominal instrument for the return generated by another nominal instrument. Swap agreements are privately negotiated in the OTC market or centrally cleared. The fund enters into these agreements to hedge certain market or interest rate risks, to manage the interest rate sensitivity (sometimes called duration) of fixed income securities, to provide a substitute for purchasing or selling particular securities or to increase potential returns.
For OTC swaps, the fund accrues for interim payments on a daily basis, with the net amount recorded within unrealized appreciation (depreciation) on swap agreements in the Consolidated Statement of Assets and Liabilities. Once the interim payments are settled in cash, the net amount is recorded as a realized gain (loss) on swaps, in addition to realized gain (loss) recorded upon the termination of swap agreements in the Consolidated Statement of Operations. Upfront payments made and/or received by the fund, are recorded as an asset and/or liability in the Consolidated Statement of Assets and Liabilities and are recorded as a realized gain or loss ratably over the agreement’s term/event with the exception of forward starting interest rate swaps which are recorded as realized gains or losses on the termination date.
69
NOTES TO CONSOLIDATED FINANCIAL STATEMENTS (continued)
Upon entering into centrally cleared swap agreements, an initial margin deposit is required with a counterparty, which consists of cash or cash equivalents. The amount of these deposits is determined by the exchange on which the agreement is traded and is subject to change. The change in valuation of centrally cleared swaps is recorded as a receivable or payable for variation margin in the Statement of Assets and Liabilities. Payments received from (paid to) the counterparty, including upon termination, are recorded as realized gain (loss) in the Statement of Operations.
Fluctuations in the value of swap agreements are recorded for financial statement purposes as unrealized appreciation or depreciation on swap agreements.
Credit Default Swaps: Credit default swaps involve commitments to pay a fixed interest rate in exchange for payment if a credit event affecting a third party (the referenced obligation or index) occurs. Credit events may include a failure to pay interest or principal, bankruptcy, or restructuring. The fund enters into these agreements to manage its exposure to the market or certain sectors of the market, to reduce its risk exposure to defaults of corporate and sovereign issuers, or to create exposure to corporate or sovereign issuers to which it is not otherwise exposed. For those credit default swaps in which the fund is paying a fixed rate, the fund is buying credit protection on the instrument. In the event of a credit event, the fund would receive the full notional amount for the reference obligation. For those credit default swaps in which the fund is receiving a fixed rate, the fund is selling credit protection on the underlying instrument. The maximum payouts for these agreements are limited to the notional amount of each swap. Credit default swaps may involve greater risks than if the fund had invested in the reference obligation directly and are subject to general market risk, liquidity risk, counterparty risk and credit risk. This risk may be mitigated by Master Agreements, if any, between the fund and the counterparty and the posting of collateral, if any, by the counterparty to the fund to cover the fund’s exposure to the counterparty. Credit default swaps open at October 31, 2017 are set forth in the Consolidated Statement of Swap Agreements.
The maximum potential amount of future payments (undiscounted) that a fund as a seller of protection could be required to make under a credit default swap agreement would be an amount equal to the notional amount of the agreement which may exceed the amount of unrealized appreciation or depreciation reflected in the Statement of Assets and Liabilities. Notional amounts of all credit default swap agreements are disclosed in the following chart, which summarizes open credit default swaps entered into by the fund. These potential amounts would be partially offset by any
70
recovery values of the respective referenced obligations, underlying securities comprising the referenced index, upfront payments received upon entering into the agreement, or net amounts received from the settlement of buy protection credit default swap agreements entered into by the fund for the same referenced entity or entities. Credit default swaps open at October 31, 2017 are set forth in the Statement of Swap Agreements:
The following tables show the fund’s exposure to different types of market risk as it relates to the Consolidated Statement of Assets and Liabilities and the Consolidated Statement of Operations, respectively.
Fair value of derivative instruments as of October 31, 2017 is shown below:
| | | | | | | | |
| | Derivative
Assets ($) | | | | Derivative
Liabilities ($) | |
Interest rate risk | 15,129,510 | 1 | Interest rate risk | | (9,110,315) | 1 |
Equity risk | 39,965,440 | 1,2 | Equity risk | | (1,411,839) | 1,3 |
Foreign exchange risk | 27,800,787 | 4 | Foreign exchange risk | | (28,086,434) | 4 |
Credit risk | 144,234 | 5 | Credit risk | | - | |
Commodity risk | 5,126,548 | 1 | Commodity risk | | (1,733,880) | 1 |
Gross fair value of
derivative contracts | 88,166,519 | | | | (40,342,468) | |
| | | | | | | |
| | Consolidated Statement of Assets and Liabilities location: | |
1 | Includes cumulative appreciation (depreciation) on futures as reported in the Consolidated Statement of Futures, but only the unpaid variation margin is reported in the Consolidated Statement of Assets and Liabilities. |
2 | Options purchased are included in Investments in securities—Unaffiliated issuers, at value. |
3 | Outstanding options written, at value. | |
4 | Unrealized appreciation (depreciation) on forward foreign currency exchange contracts. |
5 | Includes cumulative appreciation (depreciation) on swap agreements as reported in the Consolidated Statement of Swap Agreements. Unrealized appreciation (depreciation) on OTC swap agreements and only unpaid variation margin on cleared swap agreements, are reported in the Consolidated Statement of Assets and Liabilities. |
71
NOTES TO CONSOLIDATED FINANCIAL STATEMENTS (continued)
The effect of derivative instruments in the Consolidated Statement of Operations during the period ended October 31, 2017 is shown below:
| | | | | | | | | | | | |
Amount of realized gain (loss) on derivatives recognized in income ($) | |
Underlying
risk | Futures | 1 | Options
Transactions | 2 | Forward
Contracts | 3 | Swap
Agreements | 4 | Total | |
Interest
rate | (48,979,081) | | (5,094,545) | | - | | - | | (54,073,626) | |
Equity | 150,825,926 | | (24,915,710) | | - | | - | | 125,910,216 | |
Foreign
exchange | - | | - | | 10,515,297 | | - | | 10,515,297 | |
Credit | - | | - | | - | | 90,745 | | 90,745 | |
Commodity | (6,816,847) | | - | | - | | - | | (6,816,847) | |
Total | 95,029,998 | | (30,010,255) | | 10,515,297 | | 90,745 | | 75,625,785 | |
| | | | | | | | | | | |
Change in unrealized appreciation (depreciation)
on derivatives recognized in income ($) | |
Underlying
risk | Futures | 5 | Options
Transactions | 6 | Forward
Contracts | 7 | Swap
Agreements | 8 | Total | |
Interest
rate | (2,429,671) | | 5,821,210 | | - | | - | | 3,391,539 | |
Equity | 24,064,916 | | 5,165,085 | | - | | - | | 29,230,001 | |
Foreign
exchange | - | | - | | (19,997,214) | | - | | (19,997,214) | |
Credit | - | | - | | - | | 144,234 | | 144,234 | |
Commodity | 3,895,924 | | - | | - | | - | | 3,895,924 | |
Total | 25,531,169 | | 10,986,295 | | (19,997,214) | | 144,234 | | 16,664,484 | |
| | | | | | | | | | | | |
| | Consolidated Statement of Operations location: | |
1 | Net realized gain (loss) on futures. | | |
2 | Net realized gain (loss) on options transactions. |
3 | Net realized gain (loss) on forward foreign currency exchange contracts. | | |
4 | Net realized gain (loss) on swap agreements. | | |
5 | Net unrealized appreciation (depreciation) on futures. | | |
6 | Net unrealized appreciation (depreciation) on options transactions. | | |
7 | Net unrealized appreciation (depreciation) on forward foreign currency exchange contracts. | |
8 | Net unrealized appreciation (depreciation) on swap agreements. | | |
The provisions of ASC Topic 210 “Disclosures about Offsetting Assets and Liabilities” require disclosure on the offsetting of financial assets and liabilities. These disclosures are required for certain investments, including derivative financial instruments subject to Master Agreements which are eligible for offsetting in the Consolidated Statement of Assets and Liabilities and require the fund to disclose both gross and net information with respect to such investments. For financial reporting purposes, the fund does not offset derivative assets and derivative liabilities that are subject to Master Agreements in the Consolidated Statement of Assets and Liabilities.
72
At October 31, 2017, derivative assets and liabilities (by type) on a gross basis are as follows:
| | | | | | |
Derivative Financial Instruments: | | Assets ($) | | Liabilities ($) | |
Futures | | 57,328,936 | | (11,144,091) | |
Options | | 2,892,562 | | (1,111,943) | |
Forward contracts | | 27,800,787 | | (28,086,434) | |
Swaps | | 144,234 | | - | |
Total gross amount of derivative | | | | | |
assets and liabilities in the | | | | | |
Consolidated Statement of
Assets and Liabilities | | 88,166,519 | | (40,342,468) | |
Derivatives not subject to | | | | | |
Master Agreements | | (60,724,383) | | 12,781,027 | |
Total gross amount of assets | | | | | |
and liabilities subject to | | | | | |
Master Agreements | | 27,442,136 | | (27,561,441) | |
The following tables present derivative assets and liabilities net of amounts available for offsetting under Master Agreements and net of related collateral received or pledged, if any, as of October 31, 2017:†
| | | | | | | |
| | | | Financial | | | |
| | | | Instruments | | | |
| | | | and Derivatives | | | |
| | Gross Amount of | | Available | Collateral | | Net Amount of |
Counterparty | Assets ($) | 1 | for Offset ($) | Received ($) | 2 | Assets ($) |
Bank of America | 954,229 | | (793,470) | - | | 160,759 |
Bank of Montreal | 659,718 | | (659,718) | - | | - |
Citigroup | 6,611,763 | | (3,654,432) | - | | 2,957,331 |
Goldman Sachs
International | 8,340,872 | | (8,340,872) | - | | - |
HSBC | 3,649,115 | | (2,149,600) | - | | 1,499,515 |
Morgan Stanley
Capital Services | 4,641,981 | | (4,641,981) | - | | - |
Royal Bank
of Canada | 2,584,458 | | (1,667,241) | - | | 917,217 |
Total | 27,442,136 | | (21,907,314) | - | | 5,534,822 |
73
NOTES TO CONSOLIDATED FINANCIAL STATEMENTS (continued)
| | | | | | | |
| | | | | | | |
| | | | Financial | | | |
| | | | Instruments | | | |
| | | | and Derivatives | | | |
| | Gross Amount of | | Available | Collateral | | Net Amount of |
Counterparty | Liabilities ($) | 1 | for Offset ($) | Pledged ($) | 2 | Liabilities ($) |
Bank of America | (793,470) | | 793,470 | - | | - |
Bank of Montreal | (5,890,174) | | 659,718 | 4,680,000 | | (550,456) |
Citigroup | (3,654,432) | | 3,654,432 | - | | - |
Goldman Sachs
International | (8,618,513) | | 8,340,872 | 277,641 | | - |
HSBC | (2,149,600) | | 2,149,600 | - | | - |
Morgan Stanley
Capital Services | (4,788,011) | | 4,641,981 | - | | (146,030) |
Royal Bank
of Canada | (1,667,241) | | 1,667,241 | - | | - |
Total | (27,561,441) | | 21,907,314 | 4,957,641 | | (696,486) |
| | | | | | | |
1 Absent a default event or early termination, OTC derivative assets and liabilities are presented at gross amounts and are not offset in the Consolidated Statement of Assets and Liabilities. |
2 In some instances, the actual collateral received and/or pledged may be more than the amount shown due to over collateralization. |
† See Consolidated Statement of Investments for detailed information regarding collateral held for open futures contracts. |
The following summarizes the average market value of derivatives outstanding during the period ended October 31, 2017:
| | | |
| | Average Market Value ($) |
Equity futures | | 969,344,317 |
Equity options contracts | | 4,380,635 |
Interest rate futures | | 2,112,306,358 |
Interest rate options contracts | | 3,970,077 |
Forward contracts | | 1,720,653,801 |
Commodity futures | | 144,317,520 |
| | | |
The following summarizes the average notional value of swap agreements outstanding during the period ended October 31, 2017:
| | | |
| | Average Notional Value ($) |
Credit default swap agreements | | 2,921,538 |
| | | |
At October 31, 2017, the cost of investments for federal income tax purposes was $1,547,427,347; accordingly, accumulated net unrealized appreciation on investments inclusive of derivative contracts was
74
$27,162,902, consisting of $28,372,231 gross unrealized appreciation and $1,209,329 gross unrealized depreciation.
NOTE 5—Pending Legal Matters:
The fund and dozens of other entities and individuals have been named as defendants in an adversary proceeding pending in the United States Bankruptcy Court for the Southern District of New York (Weisfelner, as Trustee of the LB Creditor Trust v. Fund 1, et al., Adv. Pro. No. 10-04609 the “Creditor Trust Action”). In addition, two separate adversary proceedings have been brought in the same Bankruptcy Court against putative defendant classes ( Weisfeiner, as Trustee of the LB Litigation Trust v. Hofman, at al., Adv. Pro No. 10-05525, the “Litigation Trust Action ”; Weisfelner, as Trustee of the LB Creditor Trust v. Reichman, et al., Adv. Pro. No. 12-1570; the “Reichman Action” and collectively with the Creditor Trust Action and the Litigation Trust Action, the “Shareholder Actions”), the fund was not specifically named as a defendant in these putative class actions.
In the Shareholder Actions, plaintiffs allege that payments made to shareholders of Lyondell Chemical Company (“Lyondell”) in connection with the acquisition of Lyondell by Basell AF S.C.A. in a cash-out merger (the “Merger”) on December 20, 2007 constitute “fraudulent transfers” under applicable law, and seek to recover from the former Lyondell shareholders the merger consideration received for their shares. The Creditor Trust and Reichman Actions assert state law claims for both intentional and constructive fraudulent transfer, while the Litigation Trust Action asserts a single claim for intentional fraudulent transfer.
On April 21, 2017, following a trial in a companion litigation brought by the Trustee of the LB Litigation Trust against Len Blavatnik and other purchasers involved in the Merger (the “Blavatnik Action”), the Bankruptcy Court granted judgment for the Blavatnik Action Defendants on the intentional and constructive fraudulent transfer claims, concluding that plaintiff had not established that the Merger left Lyondell insolvent or that Lyondell's CEO intended the merger to hinder, delay or defraud Lyondell’s creditors. Given that the Bankruptcy Court’s findings of fact in the related Blavatnik Action appeared inconsistent with plaintiffs’ allegations in the Shareholder Actions, and that plaintiffs would therefore likely be precluded from re-litigating these issues in the Shareholder Actions, plaintiffs agreed to dismiss these lawsuits.
Accordingly, on September 5, 2017, the Bankruptcy Court dismissed all three Shareholder Actions, with prejudice, and against all named and unnamed defendants. Plaintiffs consented to these dismissals, and these litigations have therefore now concluded.
75
REPORT OF INDEPENDENT REGISTERED
PUBLIC ACCOUNTING FIRM
Shareholders and Board of Directors
Dynamic Total Return Fund
We have audited the accompanying consolidated statement of assets and liabilities, including the consolidated statements of investments, investments in affiliated issuers, futures, options written, forward foreign currency exchange contracts and swap agreements, of Dynamic Total Return Fund (one of the series comprising Advantage Funds, Inc.) (the Fund) as of October 31, 2017, and the related consolidated statement of operations for the year then ended, the consolidated statement of changes in net assets for each of the two years in the period then ended, and the consolidated financial highlights for each of the periods indicated therein. These financial statements and financial highlights are the responsibility of the Fund’s management. Our responsibility is to express an opinion on these financial statements and financial highlights based on our audits.
We conducted our audits in accordance with the standards of the Public Company Accounting Oversight Board (United States). Those standards require that we plan and perform the audit to obtain reasonable assurance about whether the financial statements and financial highlights are free of material misstatement. We were not engaged to perform an audit of the Fund’s internal control over financial reporting. Our audits included consideration of internal control over financial reporting as a basis for designing audit procedures that are appropriate in the circumstances, but not for the purpose of expressing an opinion on the effectiveness of the Fund’s internal control over financial reporting. Accordingly, we express no such opinion. An audit also includes examining, on a test basis, evidence supporting the amounts and disclosures in the financial statements and financial highlights, assessing the accounting principles used and significant estimates made by management, and evaluating the overall financial statement presentation. Our procedures included confirmation of securities owned as of October 31, 2017 by correspondence with the custodian and others or by other appropriate auditing procedures where replies were not received. We believe that our audits provide a reasonable basis for our opinion.
In our opinion, the financial statements and financial highlights referred to above present fairly, in all material respects, the consolidated financial position of Dynamic Total Return Fund at October 31, 2017, the consolidated results of its operations for the year then ended, the consolidated changes in its net assets for each of the two years in the period then ended, and the consolidated financial highlights for each of the indicated periods in conformity with U.S. generally accepted accounting principles.

New York, New York
December 28, 2017
76
IMPORTANT TAX INFORMATION (Unaudited)
For federal tax purposes, the fund hereby reports $.0294 per share as a long-term capital gain distribution paid on December 23, 2016.
77
BOARD MEMBERS INFORMATION (Unaudited)
INDEPENDENT BOARD MEMBERS
Joseph S. DiMartino (74)
Chairman of the Board (1995)
Principal Occupation During Past 5 Years:
· Corporate Director and Trustee (1995-present)
Other Public Company Board Memberships During Past 5 Years:
· CBIZ (formerly, Century Business Services, Inc.), a provider of outsourcing functions for small and medium size companies, Director (1997-present)
No. of Portfolios for which Board Member Serves: 126
———————
Peggy C. Davis (74)
Board Member (2006)
Principal Occupation During Past 5 Years:
· Shad Professor of Law, New York University School of Law (1983-present)
No. of Portfolios for which Board Member Serves: 45
———————
David P. Feldman (77)
Board Member (1996)
Principal Occupation During Past 5 Years:
· Corporate Director and Trustee (1985-present)
Other Public Company Board Memberships During Past 5 Years:
· BBH Mutual Funds Group (5 registered mutual funds), Director (1992-2014)
No. of Portfolios for which Board Member Serves: 31
———————
Joan Gulley (70)
Board Member (2017)
Principal Occupation During Past 5 Years:
· PNC Financial Services Group, Inc.(1993-2014)
· Executive Vice President and Chief Human Resources Officer and Executive Committee Member (2008-2014)
No. of Portfolios for which Board Member Serves: 52
———————
78
Ehud Houminer (77)
Board Member (1993)
Principal Occupation During Past 5 Years:
· Board of Overseers at the Columbia Business School, Columbia University (1992-present)
· Trustee, Ben Gurion University
Other Public Company Board Memberships During Past 5 Years:
· Avnet, Inc., an electronics distributor, Director (1993-2012)
No. of Portfolios for which Board Member Serves: 52
———————
Lynn Martin (77)
Board Member (2012)
Principal Occupation During Past 5 Years:
· President of The Martin Hall Group LLC, a human resources consulting firm (2005-2012)
Other Public Company Board Memberships During Past 5 Years:
· AT&T, Inc., a telecommunications company, Director (1999-2012)
· Ryder System, Inc., a supply chain and transportation management company, Director (1993-2012)
No. of Portfolios for which Board Member Serves: 31
———————
Robin A. Melvin (54)
Board Member (2012)
Principal Occupation During Past 5 Years:
· Co-chairman, Illinois Mentoring Partnership, non-profit organization dedicated to increasing the quantity and quality of mentoring services in Illinois; (2014-present; board member since 2013)
· Director, Boisi Family Foundation, a private family foundation that supports youth-serving organizations that promote the self sufficiency of youth from disadvantaged circumstances (1995-2012)
No. of Portfolios for which Board Member Serves: 98
———————
79
BOARD MEMBERS INFORMATION (Unaudited) (continued)
INDEPENDENT BOARD MEMBERS (continued)
Dr. Martin Peretz (78)
Board Member (2006)
Principal Occupation During Past 5 Years:
· Editor-in-Chief Emeritus of The New Republic Magazine (2011-2012) (previously,
Editor-in-Chief, 1974-2011)
· Lecturer at Harvard University (1969-2012)
No. of Portfolios for which Board Member Serves: 31
———————
Once elected all Board Members serve for an indefinite term, but achieve Emeritus status upon reaching age 80. The address of the Board Members and Officers is c/o The Dreyfus Corporation, 200 Park Avenue, New York, New York 10166. Additional information about the Board Members is available in the fund’s Statement of Additional Information which can be obtained from Dreyfus free of charge by calling this toll free number: 1-800-DREYFUS.
James F. Henry, Emeritus Board Member
Philip L. Toia, Emeritus Board Member
80
OFFICERS OF THE FUND (Unaudited)
BRADLEY J. SKAPYAK, President since January 2010.
Chief Operating Officer and a director of the Manager since June 2009, Chairman of Dreyfus Transfer, Inc., an affiliate of the Manager and the transfer agent of the funds, since May 2011 and Chief Executive Officer of MBSC Securities Corporation since August 2016. He is an officer of 62 investment companies (comprised of 126 portfolios) managed by the Manager. He is 58 years old and has been an employee of the Manager since February 1988.
BENNETT A. MACDOUGALL, Chief Legal Officer since October 2015.
Chief Legal Officer of the Manager and Associate General Counsel and Managing Director of BNY Mellon since June 2015; from June 2005 to June 2015, he served in various capacities with Deutsche Bank – Asset & Wealth Management Division, including as Director and Associate General Counsel, and Chief Legal Officer of Deutsche Investment Management Americas Inc. from June 2012 to May 2015. He is an officer of 63 investment companies (comprised of 151 portfolios) managed by the Manager. He is 46 years old and has been an employee of the Manager since June 2015.
JANETTE E. FARRAGHER, Vice President and Secretary since December 2011.
Associate General Counsel of BNY Mellon, and an officer of 63 investment companies (comprised of 151 portfolios) managed by the Manager. She is 54 years old and has been an employee of the Manager since February 1984.
JAMES BITETTO, Vice President and Assistant Secretary since August 2005.
Managing Counsel of BNY Mellon and Secretary of the Manager, and an officer of 63 investment companies (comprised of 151 portfolios) managed by the Manager. He is 51 years old and has been an employee of the Manager since December 1996.
JOSEPH M. CHIOFFI, Vice President and Assistant Secretary since August 2005.
Managing Counsel of BNY Mellon, and an officer of 63 investment companies (comprised of 151 portfolios) managed by the Manager. He is 55 years old and has been an employee of the Manager since June 2000.
MAUREEN E. KANE, Vice President and Assistant Secretary since April 2015.
Managing Counsel of BNY Mellon since July 2014; from October 2004 until July 2014, General Counsel, and from May 2009 until July 2014, Chief Compliance Officer of Century Capital Management. She is an officer of 63 investment companies (comprised of 151 portfolios) managed by the Manager. She is 55 years old and has been an employee of the Manager since July 2014.
SARAH S. KELLEHER, Vice President and Assistant Secretary since April 2014.
Senior Counsel of BNY Mellon since March 2013, from August 2005 to March 2013, Associate General Counsel of Third Avenue Management. She is an officer of 63 investment companies (comprised of 151 portfolios) managed by the Manager. She is 42 years old and has been an employee of the Manager since March 2013.
JEFF PRUSNOFSKY, Vice President and Assistant Secretary since August 2005.
Senior Managing Counsel of BNY Mellon, and an officer of 63 investment companies (comprised of 151 portfolios) managed by the Manager. He is 52 years old and has been an employee of the Manager since October 1990.
NATALYA ZELENSKY, Vice President and Assistant Secretary since March 2017.
Counsel and Vice President of BNY Mellon since May 2016; Attorney at Wildermuth Endowment Strategy Fund/Wildermuth Advisory, LLC from November 2015 until May 2016; Assistant General Counsel at RCS Advisory Services from July 2014 until November 2015; Associate at Sutherland, Asbill & Brennan from January 2013 until January 2014; Associate at K&L Gates from October 2011 until January 2013. She is an officer of 63 investment companies (comprised of 151 portfolios) managed by Dreyfus. She is 32 years old and has been an employee of the Manager since May 2016.
JAMES WINDELS, Treasurer since November 2001.
Director – Mutual Fund Accounting of the Manager, and an officer of 63 investment companies (comprised of 151 portfolios) managed by the Manager. He is 59 years old and has been an employee of the Manager since April 1985.
81
OFFICERS OF THE FUND (Unaudited) (continued)
RICHARD CASSARO, Assistant Treasurer since January 2008.
Senior Accounting Manager – Money Market and Municipal Bond Funds of the Manager, and an officer of 63 investment companies (comprised of 151 portfolios) managed by the Manager. He is 58 years old and has been an employee of the Manager since September 1982.
GAVIN C. REILLY, Assistant Treasurer since December 2005.
Tax Manager of the Investment Accounting and Support Department of the Manager, and an officer of 63 investment companies (comprised of 151 portfolios) managed by the Manager. He is 49 years old and has been an employee of the Manager since April 1991.
ROBERT S. ROBOL, Assistant Treasurer since December 2005.
Senior Accounting Manager – Dreyfus Financial Reporting of the Manager, and an officer of 63 investment companies (comprised of 151 portfolios) managed by the Manager. He is 53 years old and has been an employee of the Manager since October 1988.
ROBERT SALVIOLO, Assistant Treasurer since July 2007.
Senior Accounting Manager – Equity Funds of the Manager, and an officer of 63 investment companies (comprised of 151 portfolios) managed by the Manager. He is 50 years old and has been an employee of the Manager since June 1989.
ROBERT SVAGNA, Assistant Treasurer since December 2002.
Senior Accounting Manager – Fixed Income and Equity Funds of the Manager, and an officer of 63 investment companies (comprised of 151 portfolios) managed by the Manager. He is 50 years old and has been an employee of the Manager since November 1990.
JOSEPH W. CONNOLLY, Chief Compliance Officer since October 2004.
Chief Compliance Officer of the Manager and The Dreyfus Family of Funds (63 investment companies, comprised of 151 portfolios). He is 60 years old and has served in various capacities with the Manager since 1980, including manager of the firm’s Fund Accounting Department from 1997 through October 2001.
CARIDAD M. CAROSELLA, Anti-Money Laundering Compliance Officer since January 2016.
Anti-Money Laundering Compliance Officer of the Dreyfus Family of Funds and BNY Mellon Funds Trust since January 2016; from May 2015 to December 2015, Interim Anti-Money Laundering Compliance Officer of the Dreyfus Family of Funds and BNY Mellon Funds Trust and the Distributor; from January 2012 to May 2015, AML Surveillance Officer of the Distributor and from 2007 to December 2011, Financial Processing Manager of the Distributor. She is an officer of 57 investment companies (comprised of 145 portfolios) managed by the Manager. She is 49 years old and has been an employee of the Distributor since 1997.
82
NOTES
83
NOTES
84
NOTES
85
Dynamic Total Return Fund
200 Park Avenue
New York, NY 10166
Manager
The Dreyfus Corporation
200 Park Avenue
New York, NY 10166
Sub-Investment Adviser
Mellon Capital Management
Corporation
50 Fremont Street, Suite 3900
San Francisco, CA 94105
Custodian
The Bank of New York Mellon
225 Liberty Street
New York, NY 10286
Transfer Agent &
Dividend Disbursing Agent
Dreyfus Transfer, Inc.
200 Park Avenue
New York, NY 10166
Distributor
MBSC Securities Corporation
200 Park Avenue
New York, NY 10166
| | |
Ticker Symbols: | Class A: AVGAX Class C: AVGCX Class I: AVGRX Class Y: AVGYX |
Telephone Call your financial representative or 1-800-DREYFUS
Mail The Dreyfus Family of Funds, 144 Glenn Curtiss Boulevard, Uniondale, NY 11556-0144
E-mail Send your request to info@dreyfus.com
Internet Information can be viewed online or downloaded at www.dreyfus.com
The fund files its complete schedule of portfolio holdings with the Securities and Exchange Commission (“SEC”) for the first and third quarters of each fiscal year on Form N-Q. The fund’s Forms N-Q are available on the SEC’s website at www.sec.gov and may be reviewed and copied at the SEC’s Public Reference Room in Washington, D.C. (phone 1-800-SEC-0330 for information).
A description of the policies and procedures that the fund uses to determine how to vote proxies relating to portfolio securities and information regarding how the fund voted these proxies for the most recent 12-month period ended June 30 is available at www.dreyfus.com and on the SEC’s website at www.sec.gov and without charge, upon request, by calling 1-800-DREYFUS.
| | |
© 2017 MBSC Securities Corporation
6140AR1017 | 
|