UNITED STATES
SECURITIES AND EXCHANGE COMMISSION
Washington, D.C. 20549
FORM N-CSR
CERTIFIED SHAREHOLDER REPORT OF REGISTERED MANAGEMENT
INVESTMENT COMPANIES
Investment Company Act file number | 811-07123 |
| |
| BNY Mellon Advantage Funds, Inc. | |
| (Exact name of Registrant as specified in charter) | |
| | |
| c/o BNY Mellon Investment Adviser, Inc. 240 Greenwich Street New York, New York 10286 | |
| (Address of principal executive offices) (Zip code) | |
| | |
| Bennett A. MacDougall, Esq. 240 Greenwich Street New York, New York 10286 | |
| (Name and address of agent for service) | |
|
Registrant's telephone number, including area code: | (212) 922-6400 |
| |
Date of fiscal year end: | 08/31 | |
Date of reporting period: | 08/31/19 | |
| | | | | | | |
The following N-CSR relates only to the Registrant's series listed below and does not relate to any series of the Registrant with a different fiscal year end and, therefore, different N-CSR reporting requirements. A separate N-CSR will be filed for any series with a different fiscal year end, as appropriate.
BNY Mellon Dynamic Value Fund
BNY Mellon Opportunistic Midcap Value Fund
BNY Mellon Opportunistic Small Cap Fund
BNY Mellon Structured Midcap Fund
BNY Mellon Technology Growth Fund
FORM N-CSR
Item 1. Reports to Stockholders.
BNY Mellon Dynamic Value Fund
| |
ANNUAL REPORT August 31, 2019 |
| |
Save time. Save paper. View your next shareholder report online as soon as it’s available. Log into www.bnymellonim.com/us and sign up for eCommunications. It’s simple and only takes a few minutes. |
| |
The views expressed in this report reflect those of the portfolio manager(s) only through the end of the period covered and do not necessarily represent the views of BNY Mellon Investment Adviser, Inc. or any other person in the BNY Mellon Investment Adviser, Inc. organization. Any such views are subject to change at any time based upon market or other conditions and BNY Mellon Investment Adviser, Inc. disclaims any responsibility to update such views. These views may not be relied on as investment advice and, because investment decisions for a fund in the BNY Mellon Family of Funds are based on numerous factors, may not be relied on as an indication of trading intent on behalf of any fund in the BNY Mellon Family of Funds. |
| |
Not FDIC-Insured • Not Bank-Guaranteed • May Lose Value |
Contents
THE FUND
FOR MORE INFORMATION
Back Cover
| | | | |
| |
BNY Mellon Dynamic Value Fund
| | The Fund |
A LETTER FROM THE PRESIDENT OF BNY MELLON INVESTMENT ADVISER, INC.
Dear Shareholder:
We are pleased to present this annual report for BNY Mellon Dynamic Value Fund (formerly, Dreyfus Strategic Value Fund), covering the 12-month period from September 1, 2018 through August 31, 2019. For information about how the fund performed during the reporting period, as well as general market perspectives, we provide a Discussion of Fund Performance on the pages that follow.
After a strong summer, equity markets weakened in the fourth quarter of 2018, as concerns about rising interest rates, trade tensions and slowing global growth provided downward pressure on returns. In December 2018, stocks experienced a sharp sell-off, as it appeared that the U.S. Federal Reserve (the “Fed”) would maintain its hawkish stance on monetary policy. In January 2019, the Fed commented that it would slow the pace of interest-rate increases, which helped stimulate a rebound across equity markets that continued into the second quarter. Escalating trade tensions disrupted equity markets again in May. The dip was short-lived, as markets rose once again in June. However, despite continued supportive central bank policies, pockets of volatility persisted through the end of the period.
In fixed-income markets, returns were hampered early in the reporting period by rising interest rates and accelerating inflation. With the return of stock market volatility in October 2018, a flight to quality led to a rise in prices for U.S. Treasuries that continued through the end of the year, leading to a flattening yield curve. After the Fed’s supportive statements in January 2019, other developed market central banks followed suit and reiterated their abilities to bolster flagging growth by continuing supportive policies. This helped to further buoy fixed-income instrument prices. At the end of July, the Fed cut the federal funds rate by 25 basis points. Both the U.S. and Global Bloomberg Barclays Aggregate Bond indices produced strong returns for the 12 months.
We believe that over the near term, the outlook for the U.S. remains positive, but we will monitor relevant data for any signs of a change. As always, we encourage you to discuss the risks and opportunities in today’s investment environment with your financial advisor.
Thank you for your continued confidence and support.
Sincerely,

Renee LaRoche-Morris
President
BNY Mellon Investment Adviser, Inc.
September 16, 2019
2
DISCUSSION OF FUND PERFORMANCE(Unaudited)
For the period from September 1, 2018 through August 31, 2019, as provided by Brian C. Ferguson, John C. Bailer, and David S. Intoppa, Portfolio Managers
Market and Fund Performance Overview
For the 12-month period ended August 31, 2019, BNY Mellon Dynamic Value Fund’s (formerly, Dreyfus Strategic Value Fund) Class A shares produced a total return of -4.40%, Class C shares returned -5.12%, Class I shares returned -4.16% and Class Y shares returned -4.13%.1 The fund’s benchmark, the Russell 1000® Value Index (the “Index”), produced a total return of 0.62% for the same period.2
U.S. equity markets rose modestly during the reporting period amid steady corporate earnings and economic growth. The fund underperformed its benchmark, primarily due to unfavorable sector allocations and unsuccessful security selections in the energy and materials sectors.
The Fund’s Investment Approach
The fund seeks capital appreciation. To pursue its goal, the fund normally invests at least 80% of its net assets, plus any borrowings for investment purposes, in stocks. The fund may invest up to 30% of its assets in foreign securities. We identify potential investments through extensive quantitative and fundamental research. We focus on individual stock selection (a “bottom-up” approach), emphasizing three key factors: value, sound business fundamentals, and positive business momentum.
Weakening Economic Conditions Hindered Stocks Late in the Reporting Period
Stock markets declined early in the reporting period as the U.S. Federal Reserve (the “Fed”) maintained a hawkish stance on interest rates despite growing concerns about the sustainability of growth in the U.S. economy. Late in 2018, when the Fed signaled a shift in its stance, stocks rebounded sharply, and they remained buoyant in 2019 in anticipation of interest-rate cuts in response to concerns about U.S.-China trade relations and the possibility of slower U.S. economic growth.
The rebound produced a strong performance in the first half of 2019, but markets pulled back later, as trade fears ramped up and nervousness about the outlook increased. In June, stocks rebounded again on expectations of Fed rate cuts. Renewed hopes of a truce between the U.S. and China in late June also helped to lift sentiment.
Globally, stocks received support from central banks, which tended toward looser monetary policy, and from China, which implemented more stimulative fiscal policies. Nevertheless, late in the reporting period, the late-cycle nature of the U.S. expansion, weakening global economic indicators, and worries about whether a trade agreement between the U.S. and China could be reached weighed on markets, producing losses.
Performance Hindered by Sector Allocations and Stock Selections
The fund’s performance versus the Index was hindered by an underweight of the real estate and utilities sectors, which, as bond proxies, gained favor in light of falling interest rates. Overweights to the energy and materials sectors also detracted from performance, as did stock selection. In the energy sector, shares of oil refiners Marathon Petroleum and Valero Energy declined on demand concerns and short-term weakness in refining margins. Exploration and production companiesAnadarko Petroleum and Occidental Petroleum declined as well in part due to late-2018 weakness in energy prices. In addition, the acquisition ofAnadarko Petroleum by Occidental Petroleum weighed on Occidental Petroleum shares. In the oil field services industry, Apergy declined in sympathy with weakness in the energy sector generally. Stock selections in health care and consumer staples also hampered performance. In health care,CVS Healthdeclined on a weakening outlook and on political rhetoric regarding the sector. In the consumer staples sector, the fund’s performance was hindered by a
3
DISCUSSION OF FUND PERFORMANCE(Unaudited) (continued)
decision not to own Procter & Gamble, which gained due to its status as a bond proxy. In addition, a position in Conagra Brands declined as the company experienced integration difficulty with its acquisition of Pinnacle Foods. Other positions that detracted from performance included Mosaic, an agricultural chemicals company, and PVH, a clothing company. The decision not to own shares of McDonald’s, which performed well, also hurt the fund’s returns.
On the positive side, stock selections in the communication services, materials, industrials and financials sectors proved beneficial. In communication services, shares ofVerizon Communications and AT&T gained. Both companies benefited from their attractive dividends, as well as from less intense competition in the wireless industry. In the materials sector, positions in Martin Marietta Materials and Vulcan Materials were advantageous, as both companies benefited from infrastructure spending. In the industrials sector, L3Harris Technologies, an aerospace and defense company, gained on strong defense spending, while shares of Honeywell International rose on particularly strong execution. In the financials sector, shares of Assurant, an insurance company, contributed positively to the fund’s performance as did a position in Hartford Financial Services Group, which benefited in part from recent acquisitions. Other top-performing selections included Newmont Goldcorp, Qualcomm and Merck & Co. A decision not to own ExxonMobil also proved beneficial.
Investment Environment Remains Supportive
Our outlook remains optimistic, given that the Fed has become more accommodative and consumer spending remains strong. But we also see risks on the horizon. In the short term, the performance of the markets may depend on whether the U.S. and China achieve a trade agreement. In addition, the outcome of the Brexit conflict may also pose a risk. As of the end of the reporting period, we have continued to find the most attractive investment opportunities in the financials, materials, information technology and energy sectors. In contrast, we are finding relatively few opportunities in the real estate, utilities, consumer staples, health care, consumer discretionary, communication services and industrials sectors.
September 16, 2019
1 Total return includes reinvestment of dividends and any capital gains paid and does not take into consideration the maximum initial sales charge in the case of Class A shares, or the applicable contingent deferred sales charges imposed on redemptions in the case of Class C shares. Had these charges been reflected, returns would have been lower. Past performance is no guarantee of future results. Share price and investment return fluctuate such that upon redemption, fund shares may be worth more or less than their original cost. The fund’s returns reflect the absorption of certain fund expenses by the fund’s investment adviser, BNY Mellon Investment Adviser, Inc., pursuant to an agreement in effect through December 31, 2019, at which time it may be extended, terminated, or modified. Had these expenses not been absorbed, the fund’s returns would have been lower.
2 Source: Lipper Inc. — The Russell 1000® Value Index measures the performance of the large-cap value segment of the U.S. equity universe. It includes those Russell 1000 companies that are considered more value-oriented relative to the overall market as defined by Russell’s leading style methodology. The Russell 1000® Value Index is constructed to provide a comprehensive and unbiased barometer for the large-cap value segment. The index is completely reconstituted annually to ensure new and growing equities are included and that the represented companies continue to reflect value characteristics. Investors cannot invest directly in any index.
Please note: the position in any security highlighted with italicized typeface was sold during the reporting period.
Equities are subject generally to market, market sector, market liquidity, issuer, and investment style risks, among other factors, to varying degrees, all of which are more fully described in the fund’s prospectus.
The fund’s performance will be influenced by political, social, and economic factors affecting investments in foreign companies. Special risks associated with investments in foreign companies include exposure to currency fluctuations, less liquidity, less developed or less efficient trading markets, lack of comprehensive company information, political instability, and differing auditing and legal standards. These risks are enhanced in emerging market countries. Please read the prospectus for further discussion of these risks.
4
FUND PERFORMANCE(Unaudited)
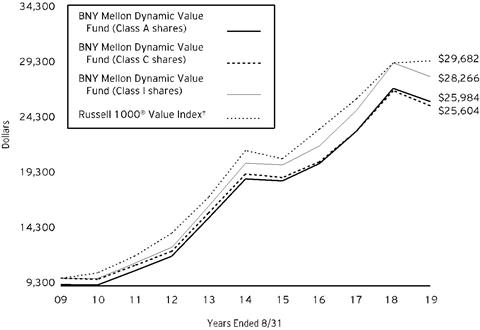
Comparison of change in value of a $10,000 investment in Class A shares, Class C shares, and Class I shares of BNY Mellon Dynamic Value Fund with a hypothetical investment of $10,000 in the Russell 1000® Value Index (the “Index”)
† Source: Lipper Inc.
Past performance is not predictive of future performance.
The above graph compares a hypothetical $10,000 investment made in each of the Class A, Class C, and Class I shares of BNY Mellon Dynamic Value Fund on 8/31/09 to a hypothetical investment of $10,000 made in the Index on that date. All dividends and capital gain distributions are reinvested.
The fund’s performance shown in the line graph above takes into account the maximum initial sales charge on Class A shares and all other applicable fees and expenses on all classes. The Index measures the performance of the large-cap value segment of the U.S. equity universe. It includes those Russell 1000 companies that are considered more value-oriented relative to the overall market as defined by Russell’s leading style methodology. The Russell 1000® Value Index is constructed to provide a comprehensive and unbiased barometer for the large-cap value segment. The index is completely reconstituted annually to ensure new and growing equities are included and that the represented companies continue to reflect value characteristics. Unlike a mutual fund, the Index is not subject to charges, fees and other expenses. Investors cannot invest directly in any index. Further information relating to fund performance, including expense reimbursements, if applicable, is contained in the Financial Highlights section of the prospectus and elsewhere in this report.
5
FUND PERFORMANCE(Unaudited) (continued)

Comparison of change in value of a $1,000,000 investment in Class Y shares of BNY Mellon Dynamic Value Fund with a hypothetical investment of $1,000,000 in the Russell 1000® Value Index (the “Index”)
† Source: Lipper Inc.
†† The total return figures presented for Class Y shares of the fund reflect the performance of the fund’s Class A shares for the period prior to 7/1/13 (the inception date for Class Y shares), not reflecting the applicable sales charges for Class A shares.
Past performance is not predictive of future performance.
The above graph compares a hypothetical $1,000,000 investment made in Class Y shares of BNY Mellon Dynamic Value Fund on 8/31/09 to a hypothetical investment of $1,000,000 made in the Index on that date. All dividends and capital gain distributions are reinvested.
The fund’s performance shown in the line graph above takes into account the maximum initial sales charge on Class Y shares and all other applicable fees and expenses on all classes. The Index measures the performance of the large-cap value segment of the U.S. equity universe. It includes those Russell 1000 companies that are considered more value-oriented relative to the overall market as defined by Russell’s leading style methodology. The Russell 1000® Value Index is constructed to provide a comprehensive and unbiased barometer for the large-cap value segment. The index is completely reconstituted annually to ensure new and growing equities are included and that the represented companies continue to reflect value characteristics. Unlike a mutual fund, the Index is not subject to charges, fees and other expenses. Investors cannot invest directly in any index. Further information relating to fund performance, including expense reimbursements, if applicable, is contained in the Financial Highlights section of the prospectus and elsewhere in this report.
6
| | | | | | | | |
Average Annual Total Returns as of 8/31/19 | | | | |
| | | Inception | | | | | |
| | Date | 1 Year | 5 Years | | 10 Years | |
| | | | | | | | |
Class A shares | | | | | | |
with maximum sales charge (5.75%) without sales charge | 9/29/95 | -9.89% | 5.21% | | 10.02% | |
9/29/95 | -4.40% | 6.46% | | 10.67% | |
Class C shares | | | | | | |
with applicable redemption charge† | 5/31/01 | -5.94% | 5.67% | | 9.86% | |
without redemption | 5/31/01 | -5.12% | 5.67% | | 9.86% | |
Class I shares | 5/31/01 | -4.16% | 6.73% | | 10.95% | |
Class Y shares | 7/1/13 | -4.13% | 6.75% | | 10.87%†† | |
Russell 1000® Value Index | | 0.62% | 6.59% | | 11.49% | |
† The maximum contingent deferred sales charge for Class C shares is 1% for shares redeemed within one year of the date of purchase.
†† The total return performance figures presented for Class Y shares of the fund reflect the performance of the fund’s Class A shares for the period prior to 7/1/13 (the inception date for Class Y shares), not reflecting the applicable sales charges for Class A shares.
The performance data quoted represents past performance, which is no guarantee of future results. Share price and investment return fluctuate and an investor’s shares may be worth more or less than original cost upon redemption. Current performance may be lower or higher than the performance quoted. Go to im.bnymellon.com for the fund’s most recent month-end returns.
The fund’s performance shown in the graphs and table does not reflect the deduction of taxes that a shareholder would pay on fund distributions or the redemption of fund shares. In addition to the performance of Class A shares shown with and without a maximum sales charge, the fund’s performance shown in the table takes into account all other applicable fees and expenses on all classes.
7
UNDERSTANDING YOUR FUND’S EXPENSES(Unaudited)
As a mutual fund investor, you pay ongoing expenses, such as management fees and other expenses. Using the information below, you can estimate how these expenses affect your investment and compare them with the expenses of other funds. You also may pay one-time transaction expenses, including sales charges (loads) and redemption fees, which are not shown in this section and would have resulted in higher total expenses. For more information, see your fund’s prospectus or talk to your financial adviser.
Review your fund’s expenses
The table below shows the expenses you would have paid on a $1,000 investment in BNY Mellon Dynamic Value Fund from March 1, 2019 to August 31, 2019. It also shows how much a $1,000 investment would be worth at the close of the period, assuming actual returns and expenses.
| | | | | | | |
Expenses and Value of a $1,000 Investment | |
Assume actual returns for the six months ended August 31, 2019 | |
| | | | | | |
| | Class A | Class C | Class I | Class Y | |
Expense paid per $1,000† | $4.74 | $8.54 | $3.47 | $3.31 | |
Ending value (after expenses) | $1,021.90 | $1,017.90 | $1,023.20 | $1,023.30 | |
COMPARING YOUR FUND’S EXPENSES
WITH THOSE OF OTHER FUNDS(Unaudited)
Using the SEC’s method to compare expenses
The Securities and Exchange Commission (“SEC”) has established guidelines to help investors assess fund expenses. Per these guidelines, the table below shows your fund’s expenses based on a $1,000 investment, assuming a hypothetical 5% annualized return. You can use this information to compare the ongoing expenses (but not transaction expenses or total cost) of investing in the fund with those of other funds. All mutual fund shareholder reports will provide this information to help you make this comparison. Please note that you cannot use this information to estimate your actual ending account balance and expenses paid during the period.
| | | | | | | |
Expenses and Value of a $1,000 Investment | |
Assuming a hypothetical 5% annualized return for the six months ended August 31, 2019 | |
| | | | | | |
| | Class A | Class C | Class I | Class Y | |
Expense paid per $1,000† | $4.74 | $8.54 | $3.47 | $3.31 | |
Ending value (after expenses) | $1,020.52 | $1,016.74 | $1,021.78 | $1,021.93 | |
† Expenses are equal to the fund‘s annualized expense ratio of .93% for Class A, 1.68% for Class C, .68% for Class I and .65% for Class Y, multiplied by the average account value over the period, multiplied by 184/365 (to reflect the one-half year period). |
8
STATEMENT OF INVESTMENTS
August 31, 2019
| | | | | | | | |
| |
Description | | | | Shares | | Value ($) | |
Common Stocks - 99.7% | | | | | |
Automobiles & Components - 1.0% | | | | | |
General Motors | | | | 378,443 | | 14,036,451 | |
Banks - 12.0% | | | | | |
Bank of America | | | | 1,268,482 | | 34,895,940 | |
Citigroup | | | | 686,780 | | 44,194,293 | |
JPMorgan Chase & Co. | | | | 532,145 | | 58,461,450 | |
U.S. Bancorp | | | | 461,307 | | 24,306,266 | |
Wells Fargo & Co. | | | | 236,552 | | 11,016,227 | |
| | | | | 172,874,176 | |
Capital Goods - 6.4% | | | | | |
Honeywell International | | | | 165,678 | | 27,273,912 | |
L3Harris Technologies | | | | 83,511 | | 17,655,060 | |
Northrop Grumman | | | | 29,190 | | 10,738,125 | |
Quanta Services | | | | 321,059 | | 10,883,900 | |
United Technologies | | | | 195,049 | | 25,403,182 | |
| | | | | 91,954,179 | |
Consumer Durables & Apparel - 1.9% | | | | | |
Lennar, Cl. A | | | | 318,821 | | 16,259,871 | |
PVH | | | | 142,575 | | 10,807,185 | |
| | | | | 27,067,056 | |
Diversified Financials - 12.3% | | | | | |
American Express | | | | 57,342 | | 6,902,257 | |
Ameriprise Financial | | | | 56,568 | | 7,296,141 | |
Berkshire Hathaway, Cl. B | | | | 336,348 | a | 68,416,547 | |
Capital One Financial | | | | 76,884 | | 6,659,692 | |
LPL Financial Holdings | | | | 99,844 | | 7,483,308 | |
Morgan Stanley | | | | 464,229 | | 19,260,861 | |
Raymond James Financial | | | | 91,451 | | 7,179,818 | |
The Goldman Sachs Group | | | | 158,482 | | 32,316,065 | |
Voya Financial | | | | 444,190 | | 21,907,451 | |
| | | | | 177,422,140 | |
Energy - 9.6% | | | | | |
Apergy | | | | 328,806 | a | 8,542,380 | |
Concho Resources | | | | 79,389 | | 5,807,305 | |
Hess | | | | 519,058 | | 32,674,701 | |
Marathon Petroleum | | | | 594,736 | | 29,266,959 | |
Occidental Petroleum | | | | 161,015 | | 7,000,932 | |
Phillips 66 | | | | 292,330 | | 28,832,508 | |
Pioneer Natural Resources | | | | 60,223 | | 7,432,723 | |
Valero Energy | | | | 238,844 | | 17,980,176 | |
| | | | | 137,537,684 | |
9
STATEMENT OF INVESTMENTS (continued)
| | | | | | | | |
| |
Description | | | | Shares | | Value ($) | |
Common Stocks - 99.7% (continued) | | | | | |
Food, Beverage & Tobacco - 4.1% | | | | | |
Archer-Daniels-Midland | | | | 194,206 | | 7,389,538 | |
Conagra Brands | | | | 953,802 | | 27,049,825 | |
Mondelez International, Cl. A | | | | 131,034 | | 7,235,697 | |
PepsiCo | | | | 131,032 | | 17,916,005 | |
| | | | | 59,591,065 | |
Health Care Equipment & Services - 6.8% | | | | | |
Anthem | | | | 48,201 | | 12,605,525 | |
Becton Dickinson & Company | | | | 65,543 | | 16,642,679 | |
Boston Scientific | | | | 251,617 | a | 10,751,594 | |
Cigna | | | | 46,255 | | 7,121,882 | |
Humana | | | | 24,076 | | 6,818,564 | |
Medtronic | | | | 405,704 | | 43,771,405 | |
| | | | | 97,711,649 | |
Household & Personal Products - 1.5% | | | | | |
Colgate-Palmolive | | | | 287,258 | | 21,300,181 | |
Insurance - 6.1% | | | | | |
American International Group | | | | 548,093 | | 28,522,760 | |
Arthur J. Gallagher & Co. | | | | 596 | | 54,063 | |
Assurant | | | | 177,910 | | 21,882,930 | |
Chubb | | | | 93,782 | | 14,656,251 | |
The Hartford Financial Services Group | | | | 321,453 | | 18,734,281 | |
Willis Towers Watson | | | | 17,948 | | 3,553,166 | |
| | | | | 87,403,451 | |
Materials - 10.7% | | | | | |
CF Industries Holdings | | | | 748,859 | | 36,087,515 | |
Dow | | | | 153,993 | | 6,564,722 | |
DuPont de Nemours | | | | 104,010 | | 7,065,399 | |
Freeport-McMoRan | | | | 754,587 | | 6,934,655 | |
Martin Marietta Materials | | | | 129,036 | | 32,745,466 | |
Newmont Goldcorp | | | | 552,723 | | 22,048,120 | |
The Mosaic Company | | | | 600,751 | | 11,047,811 | |
Vulcan Materials | | | | 220,029 | | 31,079,096 | |
| | | | | 153,572,784 | |
Media & Entertainment - 3.2% | | | | | |
Alphabet, Cl. A | | | | 18,131 | a | 21,585,499 | |
Comcast, Cl. A | | | | 242,826 | | 10,747,479 | |
Omnicom Group | | | | 174,462 | b | 13,269,580 | |
| | | | | 45,602,558 | |
Pharmaceuticals Biotechnology & Life Sciences - 3.3% | | | | | |
Merck & Co. | | | | 286,774 | | 24,797,348 | |
Pfizer | | | | 617,099 | | 21,937,869 | |
| | | | | 46,735,217 | |
10
| | | | | | | | |
| |
Description | | | | Shares | | Value ($) | |
Common Stocks - 99.7% (continued) | | | | | |
Retailing - 1.0% | | | | | |
Target | | | | 133,189 | | 14,256,551 | |
Semiconductors & Semiconductor Equipment - 5.3% | | | | | |
Applied Materials | | | | 154,803 | | 7,433,640 | |
Broadcom | | | | 59,953 | | 16,945,116 | |
Microchip Technology | | | | 122,684 | b | 10,591,310 | |
Micron Technology | | | | 164,115 | a | 7,429,486 | |
Qualcomm | | | | 305,580 | | 23,764,957 | |
Texas Instruments | | | | 86,629 | | 10,720,339 | |
| | | | | 76,884,848 | |
Software & Services - 3.3% | | | | | |
Fiserv | | | | 99,943 | a | 10,687,904 | |
International Business Machines | | | | 122,886 | | 16,654,740 | |
Oracle | | | | 121,439 | | 6,322,114 | |
Palo Alto Networks | | | | 33,577 | a | 6,836,949 | |
Teradata | | | | 237,696 | a,b | 7,337,675 | |
| | | | | 47,839,382 | |
Technology Hardware & Equipment - 3.5% | | | | | |
Cisco Systems | | | | 507,552 | | 23,758,509 | |
Corning | | | | 662,197 | | 18,442,186 | |
Western Digital | | | | 129,501 | | 7,416,522 | |
| | | | | 49,617,217 | |
Telecommunication Services - 3.4% | | | | | |
AT&T | | | | 1,369,667 | | 48,294,458 | |
Transportation - 1.6% | | | | | |
Delta Air Lines | | | | 233,986 | | 13,538,430 | |
Union Pacific | | | | 62,887 | | 10,185,178 | |
| | | | | 23,723,608 | |
Utilities - 2.7% | | | | | |
Edison International | | | | 345,555 | | 24,973,260 | |
PPL | | | | 475,331 | | 14,046,031 | |
| | | | | 39,019,291 | |
Total Common Stocks(cost $1,225,994,888) | | | | 1,432,443,946 | |
11
STATEMENT OF INVESTMENTS (continued)
| | | | | | | | |
| |
Description | | 1-Day
Yield (%) | | Shares | | Value ($) | |
Investment Companies - .1% | | | | | |
Registered Investment Companies - .1% | | | | | |
Dreyfus Institutional Preferred Government Plus Money Market Fund
(cost $1,749,947) | | 2.09 | | 1,749,947 | c | 1,749,947 | |
| | | | | | | | |
Investment of Cash Collateral for Securities Loaned - .1% | | | | | |
Registered Investment Companies - .1% | | | | | |
Dreyfus Institutional Preferred Government Plus Money Market Fund
(cost $1,131,190) | | 2.09 | | 1,131,190 | c | 1,131,190 | |
Total Investments(cost $1,228,876,025) | | 99.9% | | 1,435,325,083 | |
Cash and Receivables (Net) | | .1% | | 2,030,989 | |
Net Assets | | 100.0% | | 1,437,356,072 | |
a Non-income producing security.
b Security, or portion thereof, on loan. At August 31, 2019, the value of the fund’s securities on loan was $25,519,111 and the value of the collateral was $25,930,324, consisting of cash collateral of $1,131,190 and U.S. Government & Agency securities valued at $24,799,134.
c Investment in affiliated issuer. The investment objective of this investment company is publicly available and can be found within the investment company’s prospectus.
| | |
Portfolio Summary (Unaudited)† | Value (%) |
Financials | 30.5 |
Information Technology | 12.1 |
Materials | 10.7 |
Health Care | 10.1 |
Energy | 9.6 |
Industrials | 8.0 |
Communication Services | 6.5 |
Consumer Staples | 5.6 |
Consumer Discretionary | 3.9 |
Utilities | 2.7 |
Investment Companies | .2 |
| | 99.9 |
† Based on net assets.
See notes to financial statements.
12
STATEMENT OF INVESTMENTS IN AFFILIATED ISSUERS
| | | | | | | |
Investment Companies | Value
8/31/18 ($) | Purchases ($) | Sales ($) | Value
8/31/19 ($) | Net
Assets (%) | Dividends/
Distributions ($) |
Registered Investment Companies; | | | | |
Dreyfus Institutional Preferred Government Plus Money Market Fund | 2,944,397 | 304,535,450 | 305,729,900 | 1,749,947 | .1 | 71,693 |
Investment of Cash Collateral for Securities Loaned;† | | | |
Dreyfus Institutional Preferred Government Money Market Fund, Institutional Shares | - | 241,183 | 241,183 | - | - | - |
Dreyfus Institutional Preferred Government Plus Money Market Fund | - | 17,906,260 | 16,775,070 | 1,131,190 | .1 | - |
Total | 2,944,397 | 322,682,893 | 322,746,153 | 2,881,137 | .2 | 71,693 |
† Effective January 2, 2019, cash collateral for securities lending was transferred from Dreyfus Institutional Preferred Government Money Market Fund, Institutional Shares to Dreyfus Institutional Preferred Government Plus Money Market Fund.
See notes to financial statements.
13
STATEMENT OF ASSETS AND LIABILITIES
August 31, 2019
| | | | | | | |
| | | | | | |
| | | Cost | | Value | |
Assets ($): | | | | |
Investments in securities—See Statement of Investments
(including securities on loan, valued at $25,519,111)—Note 1(c): | | | |
Unaffiliated issuers | 1,225,994,888 | | 1,432,443,946 | |
Affiliated issuers | | 2,881,137 | | 2,881,137 | |
Receivable for investment securities sold | | 15,072,610 | |
Dividends, interest and securities lending income receivable | | 2,856,946 | |
Receivable for shares of Common Stock subscribed | | 666,769 | |
Prepaid expenses | | | | | 73,613 | |
| | | | | 1,453,995,021 | |
Liabilities ($): | | | | |
Due to BNY Mellon Investment Adviser, Inc. and affiliates—Note 3(c) | | 953,894 | |
Payable for investment securities purchased | | 11,810,378 | |
Payable for shares of Common Stock redeemed | | 2,493,233 | |
Liability for securities on loan—Note 1(c) | | 1,131,190 | |
Directors fees and expenses payable | | 25,770 | |
Interest payable—Note 2 | | 1,236 | |
Other accrued expenses | | | | | 223,248 | |
| | | | | 16,638,949 | |
Net Assets ($) | | | 1,437,356,072 | |
Composition of Net Assets ($): | | | | |
Paid-in capital | | | | | 1,232,360,053 | |
Total distributable earnings (loss) | | | | | 204,996,019 | |
Net Assets ($) | | | 1,437,356,072 | |
| | | | | | |
Net Asset Value Per Share | Class A | Class C | Class I | Class Y | |
Net Assets ($) | 728,145,937 | 16,615,170 | 452,431,599 | 240,163,366 | |
Shares Outstanding | 21,039,394 | 521,903 | 13,000,842 | 6,912,840 | |
Net Asset Value Per Share ($) | 34.61 | 31.84 | 34.80 | 34.74 | |
| | | | | |
See notes to financial statements. | | | | | |
14
STATEMENT OF OPERATIONS
Year Ended August 31, 2019
| | | | | | | |
| | | | | | |
| | | | | | |
Investment Income ($): | | | | |
Income: | | | | |
Cash dividends: | |
Unaffiliated issuers | | | 39,389,198 | |
Affiliated issuers | | | 71,693 | |
Income from securities lending—Note 1(c) | | | 57,442 | |
Total Income | | | 39,518,333 | |
Expenses: | | | | |
Management fee—Note 3(a) | | | 9,457,199 | |
Shareholder servicing costs—Note 3(c) | | | 2,915,833 | |
Distribution fees—Note 3(b) | | | 166,237 | |
Directors’ fees and expenses—Note 3(d) | | | 137,478 | |
Registration fees | | | 112,965 | |
Prospectus and shareholders’ reports | | | 85,184 | |
Professional fees | | | 77,357 | |
Interest expense—Note 2 | | | 38,431 | |
Loan commitment fees—Note 2 | | | 34,717 | |
Custodian fees—Note 3(c) | | | 31,934 | |
Miscellaneous | | | 35,350 | |
Total Expenses | | | 13,092,685 | |
Less—reduction in expenses due to undertaking—Note 3(a) | | | (326,870) | |
Net Expenses | | | 12,765,815 | |
Investment Income—Net | | | 26,752,518 | |
Realized and Unrealized Gain (Loss) on Investments—Note 4 ($): | | |
Net realized gain (loss) on investments and foreign currency transactions | 34,123,743 | |
Net change in unrealized appreciation (depreciation) on investments | (151,536,950) | |
Net Realized and Unrealized Gain (Loss) on Investments | | | (117,413,207) | |
Net (Decrease) in Net Assets Resulting from Operations | | (90,660,689) | |
| | | | | | |
See notes to financial statements. | | | | | |
15
STATEMENT OF CHANGES IN NET ASSETS
| | | | | | | | | | |
| | | | Year Ended August 31, |
| | | | 2019 | | 2018a | |
Operations ($): | | | | | | | | |
Investment income—net | | | 26,752,518 | | | | 24,677,962 | |
Net realized gain (loss) on investments | | 34,123,743 | | | | 169,560,018 | |
Net change in unrealized appreciation
(depreciation) on investments | | (151,536,950) | | | | 97,012,680 | |
Net Increase (Decrease) in Net Assets
Resulting from Operations | (90,660,689) | | | | 291,250,660 | |
Distributions ($): | |
Distributions to shareholders: | | | | | | | | |
Class A | | | (108,639,666) | | | | (85,579,735) | |
Class C | | | (3,576,184) | | | | (4,295,592) | |
Class I | | | (65,779,162) | | | | (81,291,791) | |
Class Y | | | (45,439,104) | | | | (18,843,095) | |
Total Distributions | | | (223,434,116) | | | | (190,010,213) | |
Capital Stock Transactions ($): | |
Net proceeds from shares sold: | | | | | | | | |
Class A | | | 40,244,563 | | | | 48,320,387 | |
Class C | | | 2,701,564 | | | | 3,321,433 | |
Class I | | | 178,906,342 | | | | 142,902,762 | |
Class Y | | | 57,818,315 | | | | 377,670,606 | |
Distributions reinvested: | | | | | | | | |
Class A | | | 100,531,970 | | | | 79,361,240 | |
Class C | | | 2,692,043 | | | | 3,574,080 | |
Class I | | | 61,306,599 | | | | 78,055,760 | |
Class Y | | | 31,824,011 | | | | 7,462,513 | |
Cost of shares redeemed: | | | | | | | | |
Class A | | | (120,669,500) | | | | (135,670,924) | |
Class C | | | (13,021,841) | | | | (21,318,372) | |
Class I | | | (208,767,777) | | | | (497,825,804) | |
Class Y | | | (307,036,796) | | | | (52,679,238) | |
Increase (Decrease) in Net Assets
from Capital Stock Transactions | (173,470,507) | | | | 33,174,443 | |
Total Increase (Decrease) in Net Assets | (487,565,312) | | | | 134,414,890 | |
Net Assets ($): | |
Beginning of Period | | | 1,924,921,384 | | | | 1,790,506,494 | |
End of Period | | | 1,437,356,072 | | | | 1,924,921,384 | |
16
| | | | | | | | | | |
| | | | Year Ended August 31, |
| | | | 2019 | | 2018a | |
Capital Share Transactions (Shares): | |
Class Ab,c | | | | | | | | |
Shares sold | | | 1,177,556 | | | | 1,193,614 | |
Shares issued for distributions reinvested | | | 3,032,531 | | | | 2,030,221 | |
Shares redeemed | | | (3,467,994) | | | | (3,317,685) | |
Net Increase (Decrease) in Shares Outstanding | 742,093 | | | | (93,850) | |
Class Cb | | | | | | | | |
Shares sold | | | 87,814 | | | | 88,204 | |
Shares issued for distributions reinvested | | | 87,814 | | | | 97,866 | |
Shares redeemed | | | (405,903) | | | | (569,442) | |
Net Increase (Decrease) in Shares Outstanding | (230,275) | | | | (383,372) | |
Class Ic | | | | | | | | |
Shares sold | | | 5,145,410 | | | | 3,497,874 | |
Shares issued for distributions reinvested | | | 1,842,704 | | | | 1,993,252 | |
Shares redeemed | | | (6,035,248) | | | | (12,125,718) | |
Net Increase (Decrease) in Shares Outstanding | 952,866 | | | | (6,634,592) | |
Class Yc | | | | | | | | |
Shares sold | | | 1,763,701 | | | | 9,177,640 | |
Shares issued for distributions reinvested | | | 958,559 | | | | 190,564 | |
Shares redeemed | | | (8,304,875) | | | | (1,291,721) | |
Net Increase (Decrease) in Shares Outstanding | (5,582,615) | | | | 8,076,483 | |
| | | | | | | | | |
a Distributions to shareholders include $7,698,049 Class A, $78,380 Class C, $9,103,468 Class I and $2,118,510 Class Y distributions from net investment income and $77,881,686 Class A, $4,217,212 Class C, $72,188,323 Class I and $16,724,585 Class Y distributions from net realized gains. Undistributed investment income—net was $18,211,818 in 2018 and is no longer presented as a result of the adoption of SEC’s Disclosure Update and Simplification Rule. | |
b During the period ended August 31, 2019, 1,897 Class C shares representing $64,313 were automatically converted to 1,755 Class A shares and during the period ended August 31, 2018, 36,406 Class C shares representing $1,345,388 were automatically converted to 34,003 Class A shares. | |
c During the period ended August 31, 2019, 13,830 Class Y shares representing $510,754 were exchanged for 13,814 Class I shares and during the period ended August 31, 2018, 1,793 Class Y shares representing $72,237 were exchanged for 1,798 Class A shares and 29,580 Class Y shares representing $1,218,740 were exchanged for 29,590 Class I shares. | |
See notes to financial statements.
| | | | | | | | |
17
FINANCIAL HIGHLIGHTS
The following tables describe the performance for each share class for the fiscal periods indicated. All information (except portfolio turnover rate) reflects financial results for a single fund share. Total return shows how much your investment in the fund would have increased (or decreased) during each period, assuming you had reinvested all dividends and distributions. These figures have been derived from the fund’s financial statements.
| | | | | | | | |
| | Year Ended August 31, |
| |
Class A Shares | | 2019 | 2018 | 2017 | 2016 | 2015 |
Per Share Data ($): | | | | | | |
Net asset value, beginning of period | | 42.18 | 40.12 | 36.08 | 38.49 | 43.34 |
Investment Operations: | | | | | | |
Investment income—neta | | .57 | .49 | .37 | .50 | .33 |
Net realized and unrealized gain
(loss) on investments | | (2.67) | 5.86 | 4.72 | 2.41 | (.66) |
Total from Investment Operations | | (2.10) | 6.35 | 5.09 | 2.91 | (.33) |
Distributions: | | | | | | |
Dividends from investment
income—net | | (.63) | (.39) | (.49) | (.39) | (.36) |
Dividends from net realized gain
on investments | | (4.84) | (3.90) | (.56) | (4.93) | (4.16) |
Total Distributions | | (5.47) | (4.29) | (1.05) | (5.32) | (4.52) |
Net asset value, end of period | | 34.61 | 42.18 | 40.12 | 36.08 | 38.49 |
Total Return (%)b | | (4.40) | 16.68 | 14.26 | 8.26 | (.90) |
Ratios/Supplemental Data (%): | | | | | | |
Ratio of total expenses to
average net assets | | .96 | .95 | 1.07 | 1.12 | 1.11 |
Ratio of net expenses to
average net assets | | .93 | .93 | .97 | .98 | .98 |
Ratio of net investment income to
average net assets | | 1.58 | 1.19 | .95 | 1.42 | .81 |
Portfolio Turnover Rate | | 97.03 | 105.82 | 96.39 | 80.82 | 96.32 |
Net Assets, end of period ($ x 1,000) | | 728,146 | 856,213 | 818,085 | 842,532 | 880,116 |
a Based on average shares outstanding.
b Exclusive of sales charge.
See notes to financial statements.
18
| | | | | | | | | | | | |
| | | | | | |
| | Year Ended August 31, |
Class C Shares | | 2019 | 2018 | 2017 | 2016 | 2015 |
Per Share Data ($): | | | | | | |
Net asset value, beginning of period | | 39.20 | 37.52 | 33.81 | 36.35 | 41.17 |
Investment Operations: | | | | | | |
Investment income—neta | | .27 | .17 | .07 | .22 | .02 |
Net realized and unrealized gain
(loss) on investments | | (2.48) | 5.48 | 4.42 | 2.26 | (.61) |
Total from Investment Operations | | (2.21) | 5.65 | 4.49 | 2.48 | (.59) |
Distributions: | | | | | | |
Dividends from investment
income—net | | (.31) | (.07) | (.22) | (.09) | (.07) |
Dividends from net realized gain
on investments | | (4.84) | (3.90) | (.56) | (4.93) | (4.16) |
Total Distributions | | (5.15) | (3.97) | (.78) | (5.02) | (4.23) |
Net asset value, end of period | | 31.84 | 39.20 | 37.52 | 33.81 | 36.35 |
Total Return (%)b | | (5.12) | 15.86 | 13.39 | 7.46 | (1.65) |
Ratios/Supplemental Data (%): | | | | | | |
Ratio of total expenses to
average net assets | | 1.71 | 1.71 | 1.84 | 1.89 | 1.87 |
Ratio of net expenses to
average net assets | | 1.68 | 1.68 | 1.72 | 1.73 | 1.73 |
Ratio of net investment income to
average net assets | | .83 | .45 | .20 | .67 | .06 |
Portfolio Turnover Rate | | 97.03 | 105.82 | 96.39 | 80.82 | 96.32 |
Net Assets, end of period ($ x 1,000) | | 16,615 | 29,482 | 42,611 | 47,696 | 53,226 |
a Based on average shares outstanding.
b Exclusive of sales charge.
See notes to financial statements.
19
FINANCIAL HIGHLIGHTS (continued)
| | | | | | | | | |
| | | | |
| | Year Ended August 31, |
Class I Shares | | 2019 | 2018 | 2017 | 2016 | 2015 |
Per Share Data ($): | | | | | | |
Net asset value, beginning of period | | 42.33 | 40.25 | 36.16 | 38.58 | 43.45 |
Investment Operations: | | | | | | |
Investment income—neta | | .66 | .59 | .48 | .58 | .43 |
Net realized and unrealized gain
(loss) on investments | | (2.68) | 5.88 | 4.73 | 2.42 | (.66) |
Total from Investment Operations | | (2.02) | 6.47 | 5.21 | 3.00 | (.23) |
Distributions: | | | | | | |
Dividends from investment
income—net | | (.67) | (.49) | (.56) | (.49) | (.48) |
Dividends from net realized gain
on investments | | (4.84) | (3.90) | (.56) | (4.93) | (4.16) |
Total Distributions | | (5.51) | (4.39) | (1.12) | (5.42) | (4.64) |
Net asset value, end of period | | 34.80 | 42.33 | 40.25 | 36.16 | 38.58 |
Total Return (%) | | (4.16) | 16.99 | 14.58 | 8.52 | (.66) |
Ratios/Supplemental Data (%): | | | | | | |
Ratio of total expenses to
average net assets | | .71 | .72 | .84 | .89 | .87 |
Ratio of net expenses to
average net assets | | .68 | .68 | .72 | .73 | .73 |
Ratio of net investment income to
average net assets | | 1.83 | 1.44 | 1.21 | 1.67 | 1.05 |
Portfolio Turnover Rate | | 97.03 | 105.82 | 96.39 | 80.82 | 96.32 |
Net Assets, end of period ($ x 1,000) | | 452,432 | 510,020 | 751,934 | 509,485 | 389,711 |
a Based on average shares outstanding.
See notes to financial statements.
20
| | | | | | | | | | |
| | | | |
| | Year Ended August 31, |
Class Y Shares | | 2019 | 2018 | 2017 | 2016 | 2015 |
Per Share Data ($): | | | | | | |
Net asset value, beginning of period | | 42.35 | 40.25 | 36.16 | 38.58 | 43.45 |
Investment Operations: | | | | | | |
Investment income—neta | | .67 | .62 | .48 | .59 | .44 |
Net realized and unrealized gain
(loss) on investments | | (2.68) | 5.87 | 4.73 | 2.41 | (.67) |
Total from Investment Operations | | (2.01) | 6.49 | 5.21 | 3.00 | (.23) |
Distributions: | | | | | | |
Dividends from investment
income—net | | (.76) | (.49) | (.56) | (.49) | (.48) |
Dividends from net realized gain
on investments | | (4.84) | (3.90) | (.56) | (4.93) | (4.16) |
Total Distributions | | (5.60) | (4.39) | (1.12) | (5.42) | (4.64) |
Net asset value, end of period | | 34.74 | 42.35 | 40.25 | 36.16 | 38.58 |
Total Return (%) | | (4.13) | 17.05 | 14.58 | 8.52 | (.66) |
Ratios/Supplemental Data (%): | | | | | | |
Ratio of total expenses to
average net assets | | .65 | .64 | .75 | .79 | .79 |
Ratio of net expenses to
average net assets | | .65 | .64 | .71 | .73 | .73 |
Ratio of net investment income to
average net assets | | 1.84 | 1.50 | 1.22 | 1.67 | 1.07 |
Portfolio Turnover Rate | | 97.03 | 105.82 | 96.39 | 80.82 | 96.32 |
Net Assets, end of period ($ x 1,000) | | 240,163 | 529,206 | 177,876 | 179,629 | 215,685 |
a Based on average shares outstanding.
See notes to financial statements.
21
NOTES TO FINANCIAL STATEMENTS
NOTE 1—Significant Accounting Policies:
BNY Mellon Dynamic Value Fund (the “fund”) is a separate diversified series of BNY Mellon Advantage Funds, Inc. (the “Company”), which is registered under the Investment Company Act of 1940, as amended (the “Act”), as an open-end management investment company and operates as a series company currently offering nine series, including the fund. The fund’s investment objective is to seek capital appreciation. BNY Mellon Investment Adviser, Inc. (the “Adviser”), a wholly-owned subsidiary of The Bank of New York Mellon Corporation (“BNY Mellon”), serves as the fund’s investment adviser.
Effective June 3, 2019, the fund changed its name from Dreyfus Strategic Value Fund to BNY Mellon Dynamic Value Fund and the Company changed its name from Advantage Funds, Inc. to BNY Mellon Advantage Funds, Inc. In addition, The Dreyfus Corporation, the fund’s investment adviser, changed its name to “BNY Mellon Investment Adviser, Inc.”, MBSC Securities Corporation, the fund’s distributor, changed its name to “BNY Mellon Securities Corporation” and Dreyfus Transfer, Inc., the fund’s transfer agent, changed its name to “BNY Mellon Transfer, Inc.”
BNY Mellon Securities Corporation (the “Distributor”), a wholly-owned subsidiary of the Adviser, is the distributor of the fund’s shares. The fund is authorized to issue 800 million shares of $.001 par value Common Stock. The fund currently has authorized five classes of shares: Class A (300 million shares authorized), Class C (100 million shares authorized), Class I (200 million shares authorized), Class T (100 million shares authorized) and Class Y (100 million shares authorized). Class A and Class T shares generally are subject to a sales charge imposed at the time of purchase. Class C shares are subject to a contingent deferred sales charge (“CDSC”) imposed on Class C shares redeemed within one year of purchase. Class C shares automatically convert to Class A shares ten years after the date of purchase, without the imposition of a sales charge. Class I and Class Y shares are sold at net asset value per share generally to institutional investors. As of the date of this report, the fund did not offer Class T shares for purchase. Other differences between the classes include the services offered to and the expenses borne by each class, the allocation of certain transfer agency costs, and certain voting rights. Income, expenses (other than expenses attributable to a specific class), and realized and unrealized gains or losses on investments are allocated to each class of shares based on its relative net assets.
The Company accounts separately for the assets, liabilities and operations of each series. Expenses directly attributable to each series are charged to
22
that series’ operations; expenses which are applicable to all series are allocated among them on a pro rata basis.
The Financial Accounting Standards Board (“FASB”) Accounting Standards Codification (“ASC”) is the exclusive reference of authoritative U.S. generally accepted accounting principles (“GAAP”) recognized by the FASB to be applied by nongovernmental entities. Rules and interpretive releases of the Securities and Exchange Commission (“SEC”) under authority of federal laws are also sources of authoritative GAAP for SEC registrants. The fund is an investment company and applies the accounting and reporting guidance of the FASB ASC Topic 946 Financial Services-Investment Companies. The fund’s financial statements are prepared in accordance with GAAP, which may require the use of management estimates and assumptions. Actual results could differ from those estimates.
The Companyenters into contracts that contain a variety of indemnifications. The fund’s maximum exposure under these arrangements is unknown. The fund does not anticipate recognizing any loss related to these arrangements.
(a) Portfolio valuation: The fair value of a financial instrument is the amount that would be received to sell an asset or paid to transfer a liability in an orderly transaction between market participants at the measurement date (i.e., the exit price). GAAP establishes a fair value hierarchy that prioritizes the inputs of valuation techniques used to measure fair value. This hierarchy gives the highest priority to unadjusted quoted prices in active markets for identical assets or liabilities (Level 1 measurements) and the lowest priority to unobservable inputs (Level 3 measurements).
Additionally, GAAP provides guidance on determining whether the volume and activity in a market has decreased significantly and whether such a decrease in activity results in transactions that are not orderly. GAAP requires enhanced disclosures around valuation inputs and techniques used during annual and interim periods.
Various inputs are used in determining the value of the fund’s investments relating to fair value measurements. These inputs are summarized in the three broad levels listed below:
Level 1—unadjusted quoted prices in active markets for identical investments.
Level 2—other significant observable inputs (including quoted prices for similar investments, interest rates, prepayment speeds, credit risk, etc.).
23
NOTES TO FINANCIAL STATEMENTS(continued)
Level 3—significant unobservable inputs (including the fund’s own assumptions in determining the fair value of investments).
The inputs or methodology used for valuing securities are not necessarily an indication of the risk associated with investing in those securities.
Changes in valuation techniques may result in transfers in or out of an assigned level within the disclosure hierarchy. Valuation techniques used to value the fund’s investments are as follows:
Investments in securities are valued at the last sales price on the securities exchange or national securities market on which such securities are primarily traded. Securities listed on the National Market System for which market quotations are available are valued at the official closing price or, if there is no official closing price that day, at the last sales price. For open short positions, asked prices are used for valuation purposes. Bid price is used when no asked price is available. Registered investment companies that are not traded on an exchange are valued at their net asset value. All of the preceding securities are generally categorized within Level 1 of the fair value hierarchy.
Securities not listed on an exchange or the national securities market, or securities for which there were no transactions, are valued at the average of the most recent bid and asked prices. These securities are generally categorized within Level 2 of the fair value hierarchy.
Fair valuing of securities may be determined with the assistance of a pricing service using calculations based on indices of domestic securities and other appropriate indicators, such as prices of relevant American Depository Receipts and futures. Utilizing these techniques may result in transfers between Level 1 and Level 2 of the fair value hierarchy.
When market quotations or official closing prices are not readily available, or are determined not to accurately reflect fair value, such as when the value of a security has been significantly affected by events after the close of the exchange or market on which the security is principally traded (for example, a foreign exchange or market), but before the fund calculates its net asset value, the fund may value these investments at fair value as determined in accordance with the procedures approved by the Company’s Board of Directors (the “Board”). Certain factors may be considered when fair valuing investments such as: fundamental analytical data, the nature and duration of restrictions on disposition, an evaluation of the forces that influence the market in which the securities are purchased and sold, and public trading in similar securities of the issuer or comparable issuers. These securities are either categorized within Level 2 or 3 of the fair value hierarchy depending on the relevant inputs used.
24
For restricted securities where observable inputs are limited, assumptions about market activity and risk are used and such securities are generally categorized within Level 3 of the fair value hierarchy.
Investments denominated in foreign currencies are translated to U.S. dollars at the prevailing rates of exchange.
The following is a summary of the inputs used as of August 31, 2019in valuing the fund’s investments:
| | | | | |
| | Level 1 - Unadjusted Quoted Prices | Level 2 - Other Significant Observable Inputs | Level 3 -Significant Unobservable Inputs | Total |
Assets ($) | | | | |
Investments in Securities:† | | | |
Equity Securities - Common Stocks | 1,432,443,946 | - | - | 1,432,443,946 |
Investment Companies | 2,881,137 | - | - | 2,881,137 |
† See Statement of Investments for additional detailed categorizations, if any.
(b) Foreign currency transactions: The fund does not isolate that portion of the results of operations resulting from changes in foreign exchange rates on investments from the fluctuations arising from changes in the market prices of securities held. Such fluctuations are included with the net realized and unrealized gain or loss on investments.
Net realized foreign exchange gains or losses arise from sales of foreign currencies, currency gains or losses realized on securities transactions between trade and settlement date, and the difference between the amounts of dividends, interest and foreign withholding taxes recorded on the fund’s books and the U.S. dollar equivalent of the amounts actually received or paid. Net unrealized foreign exchange gains and losses arise from changes in the value of assets and liabilities other than investments resulting from changes in exchange rates. Foreign currency gains and losses on foreign currency transactions are also included with net realized and unrealized gain or loss on investments.
(c)Securities transactions and investment income: Securities transactions are recorded on a trade date basis. Realized gains and losses from securities transactions are recorded on the identified cost basis. Dividend income is recognized on the ex-dividend date and interest income, including, where applicable, accretion of discount and amortization of premium on investments, is recognized on the accrual basis.
25
NOTES TO FINANCIAL STATEMENTS(continued)
Pursuant to a securities lending agreement with The Bank of New York Mellon, a subsidiary of BNY Mellon and an affiliate of the Adviser, the fund may lend securities to qualified institutions. It is the fund’s policy that, at origination, all loans are secured by collateral of at least 102% of the value of U.S. securities loaned and 105% of the value of foreign securities loaned. Collateral equivalent to at least 100% of the market value of securities on loan is maintained at all times. Collateral is either in the form of cash, which can be invested in certain money market mutual funds managed by the Adviser, or U.S. Government and Agency securities. The fund is entitled to receive all dividends, interest and distributions on securities loaned, in addition to income earned as a result of the lending transaction. Should a borrower fail to return the securities in a timely manner, The Bank of New York Mellon is required to replace the securities for the benefit of the fund or credit the fund with the market value of the unreturned securities and is subrogated to the fund’s rights against the borrower and the collateral. Additionally, the contractual maturity of security lending transactions are on an overnight and continuous basis. During the period ended August 31, 2019, The Bank of New York Mellon earned $11,272 from lending portfolio securities, pursuant to the securities lending agreement.
(d) Affiliated issuers: Investments in other investment companies advised by the Adviser are considered “affiliated” under the Act.
(e) Dividends and distributions to shareholders: Dividends and distributions are recorded on the ex-dividend date. Dividends from investment income-net and dividends from net realized capital gains, if any, are normally declared and paid annually, but the fund may make distributions on a more frequent basis to comply with the distribution requirements of the Internal Revenue Code of 1986, as amended (the “Code”). To the extent that net realized capital gains can be offset by capital loss carryovers, it is the policy of the fund not to distribute such gains. Income and capital gain distributions are determined in accordance with income tax regulations, which may differ from GAAP.
(f) Federal income taxes: It is the policy of the fund to continue to qualify as a regulated investment company, if such qualification is in the best interests of its shareholders, by complying with the applicable provisions of the Code, and to make distributions of taxable income and net realized capital gain sufficient to relieve it from substantially all federal income and excise taxes.
As of and during the period ended August 31, 2019, the fund did not have any liabilities for any uncertain tax positions. The fund recognizes interest and penalties, if any, related to uncertain tax positions as income tax
26
expense in the Statement of Operations. During the period ended August 31, 2019, the fund did not incur any interest or penalties.
Each tax year in the four-year period ended August 31, 2019 remains subject to examination by the Internal Revenue Service and state taxing authorities.
At August 31, 2019, the components of accumulated earnings on a tax basis were as follows: undistributed ordinary income $17,955,664, undistributed capital gains $7,437,470 and unrealized appreciation $179,602,885.
The tax character of distributions paid to shareholders during the fiscal periods ended August 31, 2019 and August 31, 2018 were as follows: ordinary income $61,100,906 and $73,398,974, and long-term capital gains $162,333,210 and $116,611,239, respectively.
(g) New Accounting Pronouncements: Effective June 1, 2019, the fund adopted Accounting Standards Update 2018-13, Fair Value Measurement (Topic 820): Disclosure Framework—Changes to the Disclosure Requirements for Fair Value Measurement (“ASU 2018-13”). The update provides guidance that eliminates, adds and modifies certain disclosure requirements for fair value measurements. The adoption of ASU 2018-13 had no impact on the operations of the fund for the period ended August 31, 2019.
NOTE 2—Bank Lines of Credit:
The fund participates with other long-term open-end funds managed by the Adviser in a $1.030 billion unsecured credit facility led by Citibank, N.A. (the “Citibank Credit Facility”) and a $300 million unsecured credit facility provided by The Bank of New York Mellon (the “BNYM Credit Facility”), each to be utilized primarily for temporary or emergency purposes, including the financing of redemptions (each, a “Facility”). The Citibank Credit Facility is available in two tranches: (i) Tranche A is in an amount equal to $830 million and is available to all long-term open-ended funds, including the fund, and (ii) Tranche B is in amount equal to $200 million and is available only to BNY Mellon Floating Rate Income Fund, a series of BNY Mellon Investment Funds IV, Inc. Prior to October 3, 2018, the unsecured credit facility with Citibank, N.A. was $830 million. In connection therewith, the fund has agreed to pay its pro rata portion of commitment fees for Tranche A of the Citibank Credit Facility and the BNYM Credit Facility. Interest is charged to the fund based on rates determined pursuant to the terms of the respective Facility at the time of borrowing.
27
NOTES TO FINANCIAL STATEMENTS(continued)
The average amount of borrowings outstanding under the Facilities during the period ended August 31, 2019 was approximately $1,176,200 with a related weighted average annualized interest rate of 3.27%.
NOTE 3—Management Fee and Other Transactions with Affiliates:
(a)Pursuant to a management agreement with the Adviser the management fee is computed at the annual rate of .60% of the value of the fund’s average daily net assets and is payable monthly. The Adviser has contractually agreed, from September 1, 2018 through December 31, 2019, to waive receipt of its fees and/or assume the direct expenses of the fund, so that the total annual fund operating expenses of none of the classes (excluding Rule 12b-1 Distribution Plan fees, Shareholder Services Plan fees, taxes, interest expense, brokerage commissions, commitment fees on borrowings and extraordinary expenses) exceed .68% of the value of the fund’s average daily net assets. The reduction in expenses, pursuant to the undertaking amounted to $326,870 during the period ended August 31, 2019.
During the period ended August 31, 2019, the Distributor retained $11,204 from commissions earned on sales of the fund’s Class A shares and $621 from CDSC fees on redemptions of the fund’s Class C shares.
(b) Under the Distribution Plan adopted pursuant to Rule 12b-1 under the Act, Class C shares pay the Distributor for distributing its shares at an annual rate of .75% of the value of its average daily net assets. During the period ended August 31, 2019, Class C shares were charged $166,237 pursuant to the Distribution Plan.
(c)Under the Shareholder Services Plan, Class A and Class C shares pay the Distributor at an annual rate of .25% of the value of their average daily net assets for the provision of certain services. The services provided may include personal services relating to shareholder accounts, such as answering shareholder inquiries regarding the fund and providing reports and other information, and services related to the maintenance of shareholder accounts. The Distributor may make payments to Service Agents (securities dealers, financial institutions or other industry professionals) with respect to these services. The Distributor determines the amounts to be paid to Service Agents. During the period ended August 31, 2019, Class A and Class C shares were charged $1,906,475and $55,412, respectively, pursuant to the Shareholder Services Plan.
The fund has an arrangement with the transfer agent whereby the fund may receive earnings credits when positive cash balances are maintained, which are used to offset transfer agency fees. The fund had an
28
arrangement with the custodian to receive earnings credits when positive cash balances were maintained, which were used to offset custody fees. Effective February 1, 2019, the arrangement with the custodian changed whereby the fund will no longer receive earnings credits to offset its custody fees and will receive interest income or overdraft fees going forward. For financial reporting purposes, the fund includes net earnings credits, if any, as an expense offset in the Statement of Operations.
The fund compensates BNY Mellon Transfer, Inc., a wholly-owned subsidiary of the Adviser, under a transfer agency agreement for providing transfer agency and cash management services for the fund. The majority of transfer agency fees are comprised of amounts paid on a per account basis, while cash management fees are related to fund subscriptions and redemptions. During the period ended August 31, 2019, the fund was charged $175,139 for transfer agency services. These fees are included in Shareholder servicing costs in the Statement of Operations.
The fund compensates The Bank of New York Mellon under a custody agreement for providing custodial services for the fund. These fees are determined based on net assets, geographic region and transaction activity. During the period ended August 31, 2019, the fund was charged $31,934 pursuant to the custody agreement.
During the period ended August 31, 2019, the fund was charged $11,539 for services performed by the Chief Compliance Officer and his staff. These fees are included in Miscellaneous in the Statement of Operations.
The components of “Due to BNY Mellon Investment Adviser, Inc. and affiliates” in the Statement of Assets and Liabilities consist of: management fees $734,001, Distribution Plan fees $10,715, Shareholder Services Plan fees $158,327, custodian fees $11,216, Chief Compliance Officer fees $2,252 and transfer agency fees $46,408, which are offset against an expense reimbursement currently in effect in the amount of $9,025.
(d) Each Board member also serves as a Board member of other funds in the BNY Mellon Family of Funds complex. Annual retainer fees and attendance fees are allocated to each fund based on net assets.
NOTE 4—Securities Transactions:
The aggregate amount of purchases and sales of investment securities, excluding short-term securities, during the period ended August 31, 2019, amounted to $1,532,313,031 and $1,902,078,851, respectively.
At August 31, 2019, the cost of investments for federal income tax purposes was $1,255,722,198 accordingly, accumulated net unrealized appreciation on investments was $179,602,885, consisting of $264,149,292
29
NOTES TO FINANCIAL STATEMENTS(continued)
gross unrealized appreciation and $84,546,407 gross unrealized depreciation.
30
REPORT OF INDEPENDENT REGISTERED PUBLIC ACCOUNTING FIRM
To the Shareholders and the Board of Directors of BNY Mellon Dynamic Value Fund (formerly, Dreyfus Strategic Value Fund)
Opinion on the Financial Statements
We have audited the accompanying statement of assets and liabilities of BNY Mellon Dynamic Value Fund (the “Fund”) (formerly, Dreyfus Strategic Value Fund) (one of the funds constituting BNY Mellon Advantage Funds, Inc.), including the statements of investments and investments in affiliated issuers, as of August 31, 2019, and the related statement of operations for the year then ended, the statement of changes in net assets for each of the two years in the period then ended, the financial highlights for each of the five years in the period then ended and the related notes (collectively referred to as the “financial statements”). In our opinion, the financial statements present fairly, in all material respects, the financial position of the Fund (one of the funds constituting BNY Mellon Advantage Funds, Inc.) at August 31, 2019, the results of its operations for the year then ended, the changes in its net assets for each of the two years in the period then ended and its financial highlights for each of the five years in the period then ended, in conformity with U.S. generally accepted accounting principles.
Basis for Opinion
These financial statements are the responsibility of the Fund’s management. Our responsibility is to express an opinion on the Fund’s financial statements based on our audits. We are a public accounting firm registered with the Public Company Accounting Oversight Board (United States) (“PCAOB”) and are required to be independent with respect to the Fund in accordance with the U.S. federal securities laws and the applicable rules and regulations of the Securities and Exchange Commission and the PCAOB.
We conducted our audits in accordance with the standards of the PCAOB. Those standards require that we plan and perform the audit to obtain reasonable assurance about whether the financial statements are free of material misstatement, whether due to error or fraud. The Fund is not required to have, nor were we engaged to perform, an audit of the Fund’s internal control over financial reporting. As part of our audits, we are required to obtain an understanding of internal control over financial reporting, but not for the purpose of expressing an opinion on the effectiveness of the Fund’s internal control over financial reporting. Accordingly, we express no such opinion.
Our audits included performing procedures to assess the risks of material misstatement of the financial statements, whether due to error or fraud, and performing procedures that respond to those risks. Such procedures included examining, on a test basis, evidence regarding the amounts and disclosures in the financial statements. Our procedures included confirmation of securities owned as of August 31, 2019, by correspondence with the custodian and others or by other appropriate auditing procedures where replies from others were not received. Our audits also included evaluating the accounting principles used and significant estimates made by management, as well as evaluating the overall presentation of the financial statements. We believe that our audits provide a reasonable basis for our opinion.

We have served as the auditor of one or more investment companies in the BNY Mellon Family of Funds since at least 1957, but we are unable to determine the specific year.
New York, New York
October 24, 2019
31
IMPORTANT TAX INFORMATION(Unaudited)
For federal tax purposes, the fund hereby reports 71.41% of the ordinary dividends paid during the fiscal year ended August 31, 2019 as qualifying for the corporate dividends received deduction. Also certain dividends paid by the fund may be subject to a maximum tax rate of 15%, as provided for by the Jobs and Growth Tax Relief Reconciliation Act of 2003. Of the distributions paid during the fiscal year, $40,930,617 represents the maximum amount that may be considered qualified dividend income. The fund also hereby reports $.8404 per share as a short-term capital gain distribution and $4.0008 per share as a long-term capital gain distribution paid on December 6, 2018. Shareholders will receive notification in early 2020 of the percentage applicable to the preparation of their 2019 income tax returns.
32
INFORMATION ABOUT THE RENEWAL OF THE FUND’S MANAGEMENT AGREEMENT (Unaudited)
At a meeting of the fund’s Board of Directors held on March 12-13, 2019, the Board considered the renewalof the fund’s Management Agreement pursuant to which the Adviser provides the fund with investment advisory and administrative services (the “Agreement”). The Board members, none of whom are “interested persons” (as defined in the Investment Company Act of 1940, as amended) of the fund, were assisted in their review by independent legal counsel and met with counsel in executive session separate from representatives of the Adviser. In considering the renewal of the Agreement, the Board considered all factors that it believed to be relevant, including those discussed below. The Board did not identify any one factor as dispositive, and each Board member may have attributed different weights to the factors considered.
Analysis of Nature, Extent, and Quality of Services Provided to the Fund. The Board considered information provided to it at the meeting and in previous presentations from representatives of the Adviser regarding the nature, extent, and quality of the services provided to funds in the BNY Mellon fund complex. The Adviser provided the number of open accounts in the fund, the fund’s asset size and the allocation of fund assets among distribution channels. The Adviser also had previously provided information regarding the diverse intermediary relationships and distribution channels of funds in the BNY Mellon fund complex (such as retail direct or intermediary, in which intermediaries typically are paid by the fund and/or the Adviser) and the Adviser’s corresponding need for broad, deep, and diverse resources to be able to provide ongoing shareholder services to each intermediary or distribution channel, as applicable to the fund.
The Board also considered research support available to, and portfolio management capabilities of, the fund’s portfolio management personnel and that the Adviser also provides oversight of day-to-day fund operations, including fund accounting and administration and assistance in meeting legal and regulatory requirements. The Board also considered the Adviser’s extensive administrative, accounting and compliance infrastructures. The Board also considered portfolio management’s brokerage policies and practices (including policies and practices regarding soft dollars) and the standards applied in seeking best execution.
Comparative Analysis of the Fund’s Performance and Management Fee and Expense Ratio. The Board reviewed reports prepared by Broadridge Financial Solutions, Inc. (“Broadridge”), an independent provider of investment company data, which included information comparing (1) the fund’s performance with the performance of a group of comparable funds (the “Performance Group”) and with a broader group of funds (the “Performance Universe”), all for various periods ended January 31, 2019, and (2) the fund’s actual and contractual management fees and total expenses with those of a group of comparable funds (the “Expense Group”) and with a broader group of funds (the “Expense Universe”), the information for which was derived in part from fund financial statements available to Broadridge as of the date of its analysis. The Adviser previously had furnished the Board with a description of the methodology Broadridge used to
33
INFORMATION ABOUT THE RENEWAL OF THE FUND’S MANAGEMENT AGREEMENT (Unaudited) (continued)
select the Performance Group and Performance Universe and the Expense Group and Expense Universe.
Representatives of the Adviser stated that the usefulness of performance comparisons may be affected by a number of factors, including different investment limitations and policies that may be applicable to the fund and comparison funds. They also considered that performance generally should be considered over longer periods of time, although it is possible that long-term performance can be adversely affected by even one period of significant underperformance so that a single investment decision or theme has the ability to affect disproportionately long-term performance. The Board discussed with representatives of the Adviser and/or its affiliates the results of the comparisons and considered that the fund’s total return performance was above the Performance Group and Performance Universe medians for all periods, except the one- and two-year periods when the fund’s performance was below the medians. The Adviser also provided a comparison of the fund’s calendar year total returns to the returns of the fund’s benchmark index.
The Board also reviewed the range of actual and contractual management fees and total expenses of the Expense Group and Expense Universe funds and discussed the results of the comparisons. The Board considered that the fund’s contractual management fee was below the Expense Group median and the fund’s actual management fee and total expenses were below the Expense Group and Expense Universe medians.
Representatives of the Adviser stated that the Adviser has contractually agreed, until December 31, 2019, to waive receipt of its fees and/or assume the direct expenses of the fund so that the direct expenses of none of its classes (excluding Rule 12b-1 fees, shareholder services fees, taxes, interest, brokerage commissions, commitment fees on borrowings and extraordinary expenses) exceed .68% of the fund’s average daily net assets.
Representatives of the Adviser reviewed with the Board the management or investment advisory fees (1) paid by funds advised or administered by the Adviser that are in the same Lipper category as the fund and (2) paid to the Adviser, or the primary employer of the fund’s primary portfolio manager(s) that is affiliated with the Adviser, for advising any separate accounts and/or other types of client portfolios that are considered to have similar investment strategies and policies as the fund (the “Similar Clients”), and explained the nature of the Similar Clients. They discussed differences in fees paid and the relationship of the fees paid in light of any differences in the services provided and other relevant factors. The Board considered the relevance of the fee information provided for the Similar Clients to evaluate the appropriateness of the fund’s management fee.
Analysis of Profitability and Economies of Scale. Representatives of the Adviser reviewed the expenses allocated and profit received by the Adviser and its affiliates and the resulting profitability percentage for managing the fund and the aggregate profitability percentage to the Adviser and its affiliates for managing the funds in the BNY Mellon fund complex, and the method used to determine the expenses and profit.
34
The Board concluded that the profitability results were not unreasonable, given the services rendered and service levels provided by the Adviser. The Board also had been provided with information prepared by an independent consulting firm regarding the Adviser’s approach to allocating costs to, and determining the profitability of, individual funds and the entire BNY Mellon fund complex. The consulting firm also had analyzed where any economies of scale might emerge in connection with the management of a fund.
The Board considered, on the advice of its counsel, the profitability analysis (1) as part of its evaluation of whether the fees under the Agreement, considered in relation to the mix of services provided by the Adviser, including the nature, extent and quality of such services, supported the renewal of the Agreement and (2) in light of the relevant circumstances for the fund and the extent to which economies of scale would be realized if the fund grows and whether fee levels reflect these economies of scale for the benefit of fund shareholders. Representatives of the Adviser stated that a discussion of economies of scale is predicated on a fund having achieved a substantial size with increasing assets and that, if a fund’s assets had been stable or decreasing, the possibility that the Adviser may have realized any economies of scale would be less. Representatives of the Adviser also stated that, as a result of shared and allocated costs among funds in the BNY Mellon fund complex, the extent of economies of scale could depend substantially on the level of assets in the complex as a whole, so that increases and decreases in complex-wide assets can affect potential economies of scale in a manner that is disproportionate to, or even in the opposite direction from, changes in the fund’s asset level. The Board also considered potential benefits to the Adviser from acting as investment adviser and took into consideration the soft dollar arrangements in effect for trading the fund’s investments.
At the conclusion of these discussions, the Board agreed that it had been furnished with sufficient information to make an informed business decision with respect to the renewal of the Agreement. Based on the discussions and considerations as described above, the Board concluded and determined as follows.
· The Board concluded that the nature, extent and quality of the services provided by the Adviser are adequate and appropriate.
· While the Board was satisfied with the fund’s longer-term performance, it was concerned about performance in the one- and two-year periods and agreed to closely monitor performance.
· The Board concluded that the fee paid to the Adviser continued to be appropriate under the circumstances and in light of the factors and the totality of the services provided as discussed above.
· The Board determined that the economies of scale which may accrue to the Adviser and its affiliates in connection with the management of the fund had been adequately considered by the Adviser in connection with the fee rate charged to the fund pursuant to the Agreement and that, to the extent in the future it were
35
INFORMATION ABOUT THE RENEWAL OF THE FUND’S MANAGEMENT AGREEMENT (Unaudited) (continued)
determined that material economies of scale had not been shared with the fund, the Board would seek to have those economies of scale shared with the fund.
In evaluating the Agreement, the Board considered these conclusions and determinations and also relied on its previous knowledge, gained through meetings and other interactions with the Adviser and its affiliates, of the Adviser and the services provided to the fund by the Adviser. The Board also relied on information received on a routine and regular basis throughout the year relating to the operations of the fund and the investment management and other services provided under the Agreement, including information on the investment performance of the fund in comparison to similar mutual funds and benchmark performance indices; general market outlook as applicable to the fund; and compliance reports. In addition, the Board’s consideration of the contractual fee arrangements for this fund had the benefit of a number of years of reviews of the Agreement for the fund, or substantially similar agreements for other BNY Mellon funds that the Board oversees, during which lengthy discussions took place between the Board and representatives of the Adviser. Certain aspects of the arrangements may receive greater scrutiny in some years than in others, and the Board’s conclusions may be based, in part, on their consideration of the fund’s arrangements, or substantially similar arrangements for other BNY Mellon funds that the Board oversees, in prior years. The Board determined to renew the Agreement.
36
BOARD MEMBERS INFORMATION(Unaudited)
INDEPENDENT BOARD MEMBERS
Joseph S. DiMartino (75)
Chairman of the Board (1995)
Principal Occupation During Past 5 Years:
· Corporate Director and Trustee (1995-present)
Other Public Company Board Memberships During Past 5 Years:
· CBIZ (formerly, Century Business Services, Inc.), a provider of outsourcing functions for small and medium size companies, Director (1997-present)
No. of Portfolios for which Board Member Serves:120
———————
Peggy C. Davis (76)
Board Member (2006)
Principal Occupation During Past 5 Years:
· Shad Professor of Law, New York University School of Law (1983-present)
No. of Portfolios for which Board Member Serves: 44
———————
David P. Feldman (79)
Board Member (1996)
Principal Occupation During Past 5 Years:
· Corporate Director and Trustee (1985-present)
Other Public Company Board Memberships During Past 5 Years:
· BBH Mutual Funds Group (5 registered mutual funds), Director (1992-2014)
No. of Portfolios for which Board Member Serves:30
———————
37
BOARD MEMBERS INFORMATION (Unaudited) (continued)
INDEPENDENT BOARD MEMBERS (continued)
Gina D. France (61)
Board Member (2019)
Principal Occupation During Past 5 Years:
· Founder, President and Chief Executive Officer, France Strategic Partners, a strategy and advisory firm serving corporate clients across the United States (2003 –present)
· Corporate Director and Trustee (2004 – current)
Other Public Company Board Memberships During Past 5 Years:
· Huntington Bancshares, a bank holding company headquartered in Columbus, Ohio, Director (2016 – present)
· Cedar Fair, L.P., a publicly-traded partnership that owns and operates amusement parks and hotels in the U.S. and Canada, Director (2011 – present)
· CBIZ (formerly, Century Business Services, Inc.), a provider of outsourcing functions for small and medium size companies, Director (2015 – present)
· FirstMerit Corporation, a diversified financial services company, Director (2004 – 2016)
No. of Portfolios for which Board Member Serves:30
———————
Joan Gulley (72)
Board Member (2017)
Principal Occupation During Past 5 Years:
· PNC Financial Services Group, Inc.(1993-2014), Executive Vice President and Chief Human Resources Officer and Executive Committee Member (2008-2014)
No. of Portfolios for which Board Member Serves:50
———————
Ehud Houminer (79)
Board Member (1993)
Principal Occupation During Past 5 Years:
· Board of Overseers at the Columbia Business School, Columbia University (1992-present)
· Trustee, Ben Gurion University
No. of Portfolios for which Board Member Serves: 50
———————
Lynn Martin (79)
Board Member (2012)
Principal Occupation During Past 5 Years:
· President of The Martin Hall Group LLC, a human resources consulting firm (2005-2012)
No. of Portfolios for which Board Member Serves:30
———————
38
Robin A. Melvin (56)
Board Member (2012)
Principal Occupation During Past 5 Years:
· Co-chairman, Illinois Mentoring Partnership, non-profit organization dedicated to increasing the quantity and quality of mentoring services in Illinois; (2014-present; board member since 2013)
No. of Portfolios for which Board Member Serves:97
———————
Once elected all Board Members serve for an indefinite term, but achieve Emeritus status upon reaching age 80. The address of the Board Members and Officers is c/o BNY Mellon Investment Adviser, Inc. 240 Greenwich Street, New York, New York 10166. Additional information about the Board Members is available in the fund’s Statement of Additional Information which can be obtained from the Adviser free of charge by calling this toll free number: 1-800-373-9387.
James F. Henry, Emeritus Board Member
Dr. Martin Peretz, Emeritus Board Member
Philip L. Toia, Emeritus Board Member
39
OFFICERS OF THE FUND(Unaudited)
RENEE LAROCHE-MORRIS, President since May 2019.
President and a director of BNY Mellon Investment Adviser, Inc. since January 2018. She is an officer of 63 investment companies (comprised of 120 portfolios) managed by the Adviser. She is 48 years old and has been an employee of BNY Mellon since 2003.
JAMES WINDELS, Treasurer since November 2001.
Director- BNY Mellon Fund Administration, and an officer of 64 investment companies (comprised of 143 portfolios) managed by the Adviser. He is 61 years old and has been an employee of the Adviser since April 1985.
BENNETT A. MACDOUGALL, Chief Legal Officer since October 2015.
Chief Legal Officer of the Adviser and Associate General Counsel and Managing Director of BNY Mellon since June 2015; Director and Associate General Counsel of Deutsche Bank – Asset & Wealth Management Division from June 2005 to June 2015, and as Chief Legal Officer of Deutsche Investment Management Americas Inc. from June 2012 to May 2015. He is an officer of 64 investment companies (comprised of 143 portfolios) managed by the Adviser. He is 48 years old and has been an employee of the Adviser since June 2015.
DAVID DIPETRILLO, Vice President since January 2018.
Head of North America Product, BNY Mellon Investment Management since January 2018, Director of Product Strategy, BNY Mellon Investment Management from January 2016 to December 2017; Head of US Retail Product and Channel Marketing, BNY Mellon Investment Management from January 2014 to December 2015. He is an officer of 63 investment companies (comprised of 120 portfolios) managed by the Adviser. He is 41 years old and has been an employee of BNY Mellon since 2005.
JAMES BITETTO, Vice President since August 2005 and Secretary since February 2018.
Managing Counsel of BNY Mellon and Secretary of the Adviser, and an officer of 64 investment companies (comprised of 143 portfolios) managed by the Adviser. He is 53 years old and has been an employee of the Adviser since December 1996.
SONALEE CROSS, Vice President and Assistant Secretary since March 2018.
Counsel of BNY Mellon since October 2016; Associate at Proskauer Rose LLP from April 2016 to September 2016; Attorney at EnTrust Capital from August 2015 to February 2016; Associate at Sidley Austin LLP from September 2013 to August 2015. She is an officer of 64 investment companies (comprised of 143 portfolios) managed by the Adviser. She is 31 years old and has been an employee of the Adviser since October 2016.
DEIRDRE CUNNANE, Vice President and Assistant Secretary since March 2019.
Counsel of BNY Mellon since August 2018; Senior Regulatory Specialist at BNY Mellon Investment Management Services from February 2016 to August 2018; Trustee Associate at BNY Mellon Trust Company (Ireland) Limited from August 2013 to February 2016. She is an officer of 64 investment companies (comprised of 143 portfolios) managed by the Adviser. She is 29 years old and has been an employee of the Adviser since August 2018.
SARAH S. KELLEHER, Vice President and Assistant Secretary since April 2014.
Managing Counsel of BNY Mellon since December 2017, Senior Counsel of BNY Mellon from March 2013 to December 2017. She is an officer of 64 investment companies (comprised of 143 portfolios) managed by the Adviser. She is 44 years old and has been an employee of the Adviser since March 2013.
JEFF PRUSNOFSKY, Vice President and Assistant Secretary since August 2005.
Senior Managing Counsel of BNY Mellon, and an officer of 64 investment companies (comprised of 143 portfolios) managed by the Adviser. He is 54 years old and has been an employee of the Adviser since October 1990.
PETER M. SULLIVAN, Vice President and Assistant Secretary since March 2019.
Managing Counsel of BNY Mellon, and an officer of 64 investment companies (comprised of 143 portfolios) managed by the Adviser. He is 51 years old and has been an employee of the Adviser since April 2004.
40
NATALYA ZELENSKY, Vice President and Assistant Secretary since March 2017.
Counsel of BNY Mellon since May 2016; Attorney at Wildermuth Endowment Strategy Fund/Wildermuth Advisory, LLC from November 2015 to May 2016 and Assistant General Counsel at RCS Advisory Services from July 2014 to November 2015. She is an officer of 64 investment companies (comprised of 143 portfolios) managed by the Adviser. She is 34 years old and has been an employee of the Adviser since May 2016.
GAVIN C. REILLY, Assistant Treasurer since December 2005.
Tax Manager - BNY Mellon Fund Administration, and an officer of 64 investment companies (comprised of 143 portfolios) managed by the Adviser. He is 51 years old and has been an employee of the Adviser since April 1991.
ROBERT S. ROBOL, Assistant Treasurer since August 2005.
Senior Accounting Manager- BNY Mellon Fund Administration, and an officer of 64 investment companies (comprised of 143 portfolios) managed by the Adviser. He is 55 years old and has been an employee of the Adviser since October 1988.
ROBERT SALVIOLO, Assistant Treasurer since July 2007.
Senior Accounting Manager – BNY Mellon Fund Administration, and an officer of 64 investment companies (comprised of 143 portfolios) managed by the Adviser. He is 52 years old and has been an employee of the Adviser since June 1989.
ROBERT SVAGNA, Assistant Treasurer since December 2002.
Senior Accounting Manager – BNY Mellon Fund Administration, and an officer of 64 investment companies (comprised of 143 portfolios) managed by the Adviser. He is 52 years old and has been an employee of the Adviser since November 1990.
JOSEPH W. CONNOLLY, Chief Compliance Officer since October 2004.
Chief Compliance Officer of the Adviser, the BNY Mellon Family of Funds and BNY Mellon Funds Trust (64 investment companies, comprised of 143 portfolios). He is 62 years old and has served in various capacities with the Adviser since 1980, including manager of the firm’s Fund Accounting Department from 1997 through October 2001.
CARIDAD M. CAROSELLA, Anti-Money Laundering Compliance Officer since January 2016.
Anti-Money Laundering Compliance Officer of the BNY Mellon Family of Funds and BNY Mellon Funds Trust since January 2016; from May 2015 to December 2015, Interim Anti-Money Laundering Compliance Officer of the BNY Mellon Family of Funds and BNY Mellon Funds Trust and the Distributor; from January 2012 to May 2015, AML Surveillance Officer of the Distributor. She is an officer of 57 investment companies (comprised of 136 portfolios) managed by the Adviser. She is 51 years old and has been an employee of the Distributor since 1997.
41
BNY Mellon Dynamic Value Fund
240 Greenwich Street
New York, NY 10286
Adviser
BNY Mellon Investment Adviser, Inc.
240 Greenwich Street
New York, NY 10286
Custodian
The Bank of New York Mellon
240 Greenwich Street
New York, NY 10286
Transfer Agent &
Dividend Disbursing Agent
BNY Mellon Transfer, Inc.
240 Greenwich Street
New York, NY 10286
Distributor
BNY Mellon Securities Corporation
240 Greenwich Street
New York, NY 10286
| | |
Ticker Symbols: | Class A:DAGVX Class C:DCGVX Class I:DRGVX Class Y:DRGYX |
Telephone Call your financial representative or 1-800-373-9387
Mail The BNY Mellon Family of Funds, 144 Glenn Curtiss Boulevard, Uniondale, NY 11556-0144
E-mailSend your request toinfo@bnymellon.com
InternetInformation can be viewed online or downloaded atwww.bnymellonim.com/us
The fund files its complete schedule of portfolio holdings with the Securities and Exchange Commission (“SEC”) for the first and third quarters of each fiscal year on Form N-PORT. The fund’s Forms N-PORT are available on the SEC’s website atwww.sec.gov.
A description of the policies and procedures that the fund uses to determine how to vote proxies relating to portfolio securities and information regarding how the fund voted these proxies for the most recent 12-month period ended June 30 is available atwww.bnymellonim.com/us and on the SEC’s website atwww.sec.gov and without charge, upon request, by calling 1-800-373-9387.
| | |
© 2019 BNY Mellon Securities Corporation
0257AR0819 | 
|
BNY Mellon Opportunistic Midcap Value Fund
| |
ANNUAL REPORT August 31, 2019 |
| |
Save time. Save paper. View your next shareholder report online as soon as it’s available. Log into www.bnymellonim.com/us and sign up for eCommunications. It’s simple and only takes a few minutes. |
| |
The views expressed in this report reflect those of the portfolio manager(s) only through the end of the period covered and do not necessarily represent the views of BNY Mellon Investment Adviser, Inc. or any other person in the BNY Mellon Investment Adviser, Inc. organization. Any such views are subject to change at any time based upon market or other conditions and BNY Mellon Investment Adviser, Inc. disclaims any responsibility to update such views. These views may not be relied on as investment advice and, because investment decisions for a fund in the BNY Mellon Family of Funds are based on numerous factors, may not be relied on as an indication of trading intent on behalf of any fund in the BNY Mellon Family of Funds. |
| |
Not FDIC-Insured • Not Bank-Guaranteed • May Lose Value |
Contents
THE FUND
FOR MORE INFORMATION
Back Cover
| | | | |
| |
BNY Mellon Opportunistic Midcap Value Fund
| | The Fund |
A LETTER FROM THE PRESIDENT OF BNY MELLON INVESTMENT ADVISER, INC.
Dear Shareholder:
We are pleased to present this annual report for BNY Mellon Opportunistic Midcap Value Fund (formerly, Dreyfus Opportunistic Midcap Fund), covering the 12-month period from September 1, 2018 through August 31, 2019. For information about how the fund performed during the reporting period, as well as general market perspectives, we provide a Discussion of Fund Performance on the pages that follow.
After a strong summer, equity markets weakened in the fourth quarter of 2018, as concerns about rising interest rates, trade tensions and slowing global growth provided downward pressure on returns. In December 2018, stocks experienced a sharp sell-off, as it appeared that the U.S. Federal Reserve (the “Fed”) would maintain its hawkish stance on monetary policy. In January 2019, the Fed commented that it would slow the pace of interest-rate increases, which helped stimulate a rebound across equity markets that continued into the second quarter. Escalating trade tensions disrupted equity markets again in May. The dip was short-lived, as markets rose once again in June. However, despite continued supportive central bank policies, pockets of volatility persisted through the end of the period.
In fixed-income markets, returns were hampered early in the reporting period by rising interest rates and accelerating inflation. With the return of stock market volatility in October 2018, a flight to quality led to a rise in prices for U.S. Treasuries that continued through the end of the year, leading to a flattening yield curve. After the Fed’s supportive statements in January 2019, other developed market central banks followed suit and reiterated their abilities to bolster flagging growth by continuing supportive policies. This helped to further buoy fixed-income instrument prices. At the end of July, the Fed cut the federal funds rate by 25 basis points. Both the U.S. and Global Bloomberg Barclays Aggregate Bond indices produced strong returns for the 12 months.
We believe that over the near term, the outlook for the U.S. remains positive, but we will monitor relevant data for any signs of a change. As always, we encourage you to discuss the risks and opportunities in today’s investment environment with your financial advisor.
Thank you for your continued confidence and support.
Sincerely,

Renee LaRoche-Morris
President
BNY Mellon Investment Adviser, Inc.
September 16, 2019
2
DISCUSSION OF FUND PERFORMANCE(Unaudited)
For the period from September 1, 2018 through August 31, 2019, as provided by Patrick Kent, James Boyd, Brian R. Duncan, and Dale Dutile, portfolio managers
Market and Fund Performance Overview
For the 12-month period ended August 31, 2019, BNY Mellon Opportunistic Midcap Value Fund’s (formerly, Dreyfus Opportunistic Midcap Value Fund) Class A shares produced a total return of -10.64%, Class C shares returned -11.34%, Class I shares returned -10.42% and Class Y shares returned -10.34%.1 In comparison, the fund’s benchmark, the Russell Midcap® Value Index (the “Index”), produced a -3.13% total return for the same period.2
Mid-cap stocks lost ground over the reporting period, despite steady corporate earnings and economic conditions, and ongoing tailwinds from business-friendly tax-reform legislation. The fund produced lower returns than the Index, mainly due to the unfavorable security selection and asset allocation strategies in the financials, utilities and industrials sectors.
The Fund’s Investment Approach
The fund seeks to surpass the performance of the Index. To pursue its goal, the fund normally invests at least 80% of its net assets, plus any borrowings for investment purposes, in equity securities of mid-cap companies. The fund currently considers mid-cap companies to be those with market capitalizations, at the time of purchase, within the market capitalization range of companies comprising the Index.
The fund’s portfolio managers identify potential investments through extensive fundamental and quantitative research. The fund focuses on individual stock selection (a “bottom-up” approach), emphasizing three key factors: relative value, business health and business momentum.
The fund’s portfolio managers use an opportunistic value approach to identify stocks whose current market prices trade at a large discount to their intrinsic value, as calculated by the portfolio managers. The opportunistic value style attempts to benefit from valuation inefficiencies and underappreciated fundamental prospects present in the marketplace. The portfolio managers use mid-cycle estimates, growth prospects, the identification of a revaluation catalyst and competitive advantages as some of the factors in the valuation assessment.
Market Volatility During Reporting Period
Early in the reporting period, rising U.S. interest rates and a sudden escalation in U.S.-China trade tensions triggered a sharp decline in U.S. equities. The October-to-late-December time period experienced a challenging investment environment in which many historical relationships between style and asset class performance temporarily broke down. In the past, valuation-sensitive strategies have outperformed during sharp market drawdowns. Unfortunately, exaggerated fears over a severe slowdown global growth caused indiscriminate selling across nearly all asset classes.
Market performance in 2019 has been heavily influence by U.S.-China tariff rhetoric. In months where tensions appeared to be stable to improving, markets responded favorably and posted gains. However, as witnessed in the months of May and August, unexpected escalations in tariff tensions produced a quick, negative response in equity markets.
Importantly, a pivot by the Federal Reserve Board (the “Fed”) to a lowering interest-rate policy and investor recognition that the majority of companies would see profit gains in 2019 helped boost stock rallies and mitigate market drawdowns.
3
DISCUSSION OF FUND PERFORMANCE(Unaudited) (continued)
Asset Allocation and Security Selection Hindered Performance
The fund lagged the Index over the reporting period, hindered by our security selection and asset allocation strategies across several segments. In the financials sector, positions in Silicon Valley-based SVB Financial Group, online bank E*TRADE Financial andEast West Bancorp dampened returns, as all three were hurt by lower interest rates, which depressed their net interest income and profit margins. In the utilities sector, shares of American Electric Power surged 30%, but the fund’s underweighted position in the sector offset this performance. In the industrials sector, a position in Fluor, an engineering and construction company, was hurt by a large write-down of contracts in the company’s backlog. In addition, shares of Southwest Airlines declined, as the grounding of the Boeing Max 737 airliner increased operating costs and limited capacity growth.
On the plus side, selections in the information technology, energy and consumer discretionary sectors contributed positively to fund performance. In the information technology sector, shares of Advanced Micro Devices benefited from a strong competitive position in the desktop market. In addition, Keysight Technologies, an electronic equipment and software company with exposure to 5G telecommunications, gained due to strong orders. In the payments processing industry, the fund’s position in Total System Services, Global Payments andFirst Data also contributed positively to fund performance. In the energy sector, the fund’s overweight hurt performance, but stock selection enabled the fund to outperform the benchmark in this sector. Holdings of Cheniere Energy,Cabot Oil& Gas and Pioneer Natural Resources accounted for the bulk of the fund’s performance in this sector. In the consumer discretionary sector, the fund’s position in Dollar General soared nearly 50%, adding to returns while homebuilder D.R. Horton was also advantageous, due to strong performance in the lower-priced housing market. Shoe company Skechers USA also contributed positively, posting gains due to profitability and demand increases.
Finding Opportunities Amid Modest Economic Growth
We believe the economy will continue to grow at a moderate pace, and we expect that the Fed’s new more accommodative stance on interest rates will provide support to markets over the short term. Barring a severe escalation in trade tensions, we remain cautiously positive, and we have continued to identify what we believe to be attractive mid-cap investment opportunities.
We have increased exposure to the information technology, consumer discretionary and materials sectors and reduced exposure to the health care, financials and consumer staples sectors. We are particularly excited about our investment themes in homebuilding, payments processing, precious metals mining and trucking.
September 16, 2019
1 Total return includes reinvestment of dividends and any capital gains paid and does not take into consideration the maximum initial sales charge in the case of Class A shares, or the applicable contingent deferred sales charge imposed on redemptions in the case of Class C shares. Had these charges been reflected, returns would have been lower. Past performance is no guarantee of future results. Share price and investment return fluctuate such that upon redemption, fund shares may be worth more or less than their original cost.
2 Source: Lipper Inc. — The Russell Midcap® Value Index measures the performance of the mid-cap value segment of the U.S. equity universe. It includes those Russell Midcap® Index companies that are considered more value-oriented relative to the overall market as defined by Russell’s leading style methodology. The Index is constructed to provide a comprehensive and unbiased barometer of the mid-cap value market. The Index is completely reconstituted annually to ensure larger stocks do not distort the performance and characteristics of the true mid-cap value market. Investors cannot invest directly in any index.
Please note: the position in any security highlighted with italicized typeface was sold during the reporting period.
Equities are subject generally to market, market sector, market liquidity, issuer and investment style risks, among other factors, to varying degrees, all of which are more fully described in the fund’s prospectus.
Stocks of small- and/or mid-cap companies often experience sharper price fluctuations than stocks of large-cap companies.
4
FUND PERFORMANCE(Unaudited)
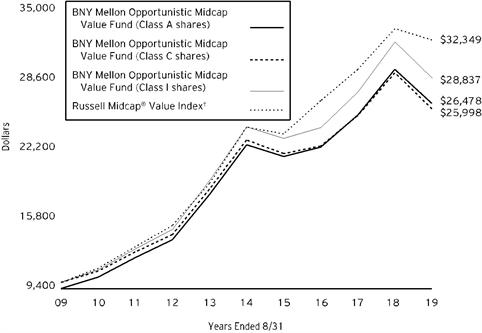
Comparison of change in value of a $10,000 investment in Class A shares, Class C shares, and Class I shares of BNY Mellon Opportunistic Midcap Value Fund with a hypothetical investment of $10,000 in the Russell Midcap® Value Index (the “Index”)
† Source: Lipper Inc.
Past performance is not predictive of future performance.
The above graph compares a hypothetical $10,000 investment made in each of the Class A, Class C, and Class I shares of BNY Mellon Opportunistic Midcap Value Fund on8/31/09 to a hypothetical investment of $10,000 made in the Index on that date. All dividends and capital gain distributions are reinvested.
The fund’s performance shown in the line graph above takes into account the maximum initial sales charge on Class A shares and all other applicable fees and expenses on all classes. The Index measures the performance of the mid-cap value segment of the U.S. equity universe. It includes those Russell Midcap®Index companies that are considered more value-oriented relative to the overall market as defined by Russell’s leading style methodology. The Index is constructed to provide a comprehensive and unbiased barometer of the mid-cap value market. The Index is completely reconstituted annually to ensure larger stocks do not distort the performance and characteristics of the true mid-cap value market. Unlike a mutual fund, the Index is not subject to charges, fees and other expenses. Investors cannot invest directly in any index. Further information relating to fund performance, including expense reimbursements, if applicable, is contained in the Financial Highlights section of the prospectus and elsewhere in this report.
5
FUND PERFORMANCE(Unaudited) (continued)
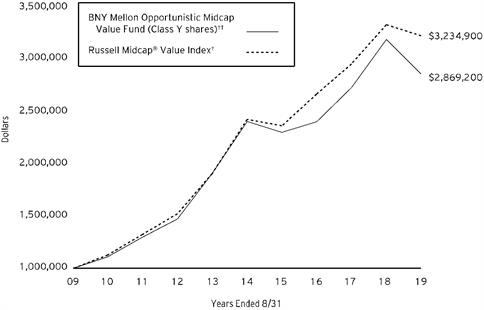
Comparison of change in value of a $1,000,000 investment in Class Y shares of BNY Mellon Opportunistic Midcap Value Fund with a hypothetical investment of $1,000,000 in the Russell Midcap® Value Index (the “Index”)
† Source: Lipper Inc.
†† The total return figures presented for Class Y shares of the fund reflect the performance of the fund’s Class A shares for the period prior to 7/1/13 (the inception date for Class Y shares), not reflecting the applicable sales charges for Class A shares.
Past performance is not predictive of future performance.
The above graph compares a hypothetical $1,000,000 investment made in Class Y shares of BNY Mellon Opportunistic Midcap Value Fund on8/31/09 to a hypothetical investment of $1,000,000 made in the Index on that date. All dividends and capital gain distributions are reinvested.
The fund’s performance shown in the line graph above takes into account the maximum initial sales charge on Class Y shares and all other applicable fees and expenses on all classes. The Index measures the performance of the mid-cap value segment of the U.S. equity universe. It includes those Russell Midcap®Index companies that are considered more value-oriented relative to the overall market as defined by Russell’s leading style methodology. The Index is constructed to provide a comprehensive and unbiased barometer of the mid-cap value market. The Index is completely reconstituted annually to ensure larger stocks do not distort the performance and characteristics of the true mid-cap value market. Unlike a mutual fund, the Index is not subject to charges, fees and other expenses. Investors cannot invest directly in any index. Further information relating to fund performance, including expense reimbursements, if applicable, is contained in the Financial Highlights section of the prospectus and elsewhere in this report.
6
| | | | | | | |
Average Annual Total Returns as of 8/31/19 | |
| | Inception
Date | 1 Year | 5 Years | 10 Years | |
Class A shares | | | | | |
with maximum sales charge (5.75%) | 9/29/95 | -15.77% | 1.93% | 10.23% | |
without sales charge | 9/29/95 | -10.64% | 3.14% | 10.88% | |
Class C shares | | | | | |
with applicable redemption charge† | 5/30/08 | -11.99% | 2.37% | 10.03% | |
without redemption | 5/30/08 | -11.34% | 2.37% | 10.03% | |
Class I shares | 5/30/08 | -10.42% | 3.43% | 11.17% | |
Class Y shares | 7/1/13 | -10.34% | 3.53% | 11.12%†† | |
Russell Midcap® Value Index | | -3.13% | 5.88% | 12.46% | |
† The maximum contingent deferred sales charge for Class C shares is 1% for shares redeemed within one year of the date of purchase.
†† The total return performance figures presented for Class Y shares of the fund reflect the performance of the fund’s Class A shares for the period prior to 7/1/13 (the inception date for Class Y shares), not reflecting the applicable sales charges for Class A shares.
The performance data quoted represents past performance, which is no guarantee of future results. Share price and investment return fluctuate and an investor’s shares may be worth more or less than original cost upon redemption. Current performance may be lower or higher than the performance quoted. Go to im.bnymellon.com for the fund’s most recent month-end returns.
The fund’s performance shown in the graphs and table does not reflect the deduction of taxes that a shareholder would pay on fund distributions or the redemption of fund shares. In addition to the performance of Class A shares shown with and without a maximum sales charge, the fund’s performance shown in the table takes into account all other applicable fees and expenses on all classes.
7
UNDERSTANDING YOUR FUND’S EXPENSES(Unaudited)
As a mutual fund investor, you pay ongoing expenses, such as management fees and other expenses. Using the information below, you can estimate how these expenses affect your investment and compare them with the expenses of other funds. You also may pay one-time transaction expenses, including sales charges (loads) and redemption fees, which are not shown in this section and would have resulted in higher total expenses. For more information, see your fund’s prospectus or talk to your financial adviser.
Review your fund’s expenses
The table below shows the expenses you would have paid on a $1,000 investment in BNY Mellon Opportunistic Midcap Value Fund from March 1, 2019 to August 31, 2019. It also shows how much a $1,000 investment would be worth at the close of the period, assuming actual returns and expenses.
| | | | | | | |
Expenses and Value of a $1,000 Investment | | | |
Assume actual returns for the six months ended August 31, 2019 | | | |
| | | | | | |
| | Class A | Class C | Class I | Class Y | |
Expense paid per $1,000† | $5.77 | $9.58 | $4.53 | $4.03 | |
Ending value (after expenses) | $972.60 | $968.30 | $973.60 | $974.10 | |
COMPARING YOUR FUND’S EXPENSES
WITH THOSE OF OTHER FUNDS(Unaudited)
Using the SEC’s method to compare expenses
The Securities and Exchange Commission (“SEC”) has established guidelines to help investors assess fund expenses. Per these guidelines, the table below shows your fund’s expenses based on a $1,000 investment, assuming a hypothetical 5% annualized return. You can use this information to compare the ongoing expenses (but not transaction expenses or total cost) of investing in the fund with those of other funds. All mutual fund shareholder reports will provide this information to help you make this comparison. Please note that you cannot use this information to estimate your actual ending account balance and expenses paid during the period.
| | | | | | | |
Expenses and Value of a $1,000 Investment | | | |
Assuming a hypothetical 5% annualized return for the six months ended August 31, 2019 | |
| | | | | | |
| | Class A | Class C | Class I | Class Y | |
Expense paid per $1,000† | $5.90 | $9.80 | $4.63 | $4.13 | |
Ending value (after expenses) | $1,019.36 | $1,015.48 | $1,020.62 | $1,021.12 | |
† Expenses are equal to the fund‘s annualized expense ratio of 1.16% for Class A, 1.93% for Class C, .91% for Class I and .81% for Class Y, multiplied by the average account value over the period, multiplied by 184/365 (to reflect the one-half year period). | |
8
STATEMENT OF INVESTMENTS
August 31, 2019
| | | | | | | | |
| |
Description | | | | Shares | | Value ($) | |
Common Stocks - 97.9% | | | | | |
Banks - 2.6% | | | | | |
Popular | | | | 190,239 | | 10,000,864 | |
SVB Financial Group | | | | 25,312 | a | 4,926,221 | |
| | | | | 14,927,085 | |
Capital Goods - 2.4% | | | | | |
Deere & Co. | | | | 18,805 | | 2,913,082 | |
Fluor | | | | 85,968 | | 1,519,055 | |
Quanta Services | | | | 165,471 | | 5,609,467 | |
Spirit AeroSystems Holdings, Cl. A | | | | 50,038 | | 4,033,063 | |
| | | | | 14,074,667 | |
Commercial & Professional Services - 3.9% | | | | | |
Equifax | | | | 126,370 | | 18,498,041 | |
Nielsen Holdings | | | | 189,243 | | 3,928,685 | |
| | | | | 22,426,726 | |
Consumer Durables & Apparel - 4.5% | | | | | |
D.R. Horton | | | | 286,206 | | 14,158,611 | |
Skechers USA, Cl. A | | | | 379,721 | a | 12,021,967 | |
| | | | | 26,180,578 | |
Consumer Services - 3.0% | | | | | |
Boyd Gaming | | | | 142,649 | b | 3,429,282 | |
Norwegian Cruise Line Holdings | | | | 226,950 | a | 11,517,712 | |
Royal Caribbean Cruises | | | | 24,693 | | 2,574,986 | |
| | | | | 17,521,980 | |
Diversified Financials - 4.0% | | | | | |
Ally Financial | | | | 222,862 | | 6,986,724 | |
E*TRADE Financial | | | | 102,191 | | 4,265,452 | |
Voya Financial | | | | 238,865 | | 11,780,822 | |
| | | | | 23,032,998 | |
Energy - 5.6% | | | | | |
Cheniere Energy | | | | 137,524 | a | 8,211,558 | |
Parsley Energy, Cl. A | | | | 392,440 | | 7,028,600 | |
Pioneer Natural Resources | | | | 44,409 | | 5,480,959 | |
Valero Energy | | | | 152,793 | | 11,502,257 | |
| | | | | 32,223,374 | |
Food, Beverage & Tobacco - 1.8% | | | | | |
Ingredion | | | | 132,295 | | 10,222,435 | |
Health Care Equipment & Services - 2.4% | | | | | |
Zimmer Biomet Holdings | | | | 101,711 | | 14,158,171 | |
Insurance - 2.0% | | | | | |
Willis Towers Watson | | | | 59,977 | | 11,873,647 | |
Materials - 11.2% | | | | | |
Eagle Materials | | | | 111,611 | b | 9,396,530 | |
9
STATEMENT OF INVESTMENTS (continued)
| | | | | | | | |
| |
Description | | | | Shares | | Value ($) | |
Common Stocks - 97.9% (continued) | | | | | |
Materials - 11.2% (continued) | | | | | |
FMC | | | | 156,079 | | 13,474,300 | |
Freeport-McMoRan | | | | 804,585 | | 7,394,136 | |
Huntsman | | | | 499,306 | | 9,946,175 | |
Louisiana-Pacific | | | | 409,825 | b | 9,852,193 | |
Newmont Goldcorp | | | | 368,973 | | 14,718,333 | |
| | | | | 64,781,667 | |
Media & Entertainment - 3.3% | | | | | |
Activision Blizzard | | | | 328,425 | | 16,618,305 | |
Zillow Group, Cl. C | | | | 74,486 | a,b | 2,564,553 | |
| | | | | 19,182,858 | |
Pharmaceuticals Biotechnology & Life Sciences - 7.8% | | | | | |
Jazz Pharmaceuticals | | | | 99,653 | a | 12,770,532 | |
Mylan | | | | 445,863 | a | 8,680,953 | |
PRA Health Sciences | | | | 141,963 | a | 14,031,623 | |
Sage Therapeutics | | | | 56,274 | a,b | 9,660,558 | |
| | | | | 45,143,666 | |
Real Estate - 6.9% | | | | | |
Alexandria Real Estate Equities | | | | 64,254 | c | 9,627,819 | |
Boston Properties | | | | 95,890 | c | 12,314,194 | |
CBRE Group, Cl. A | | | | 93,489 | a | 4,886,670 | |
Digital Realty Trust | | | | 105,249 | b,c | 13,011,934 | |
| | | | | 39,840,617 | |
Retailing - 4.6% | | | | | |
Dollar General | | | | 77,248 | | 12,057,640 | |
Grubhub | | | | 89,097 | a,b | 5,287,016 | |
The Gap | | | | 608,435 | b | 9,607,189 | |
| | | | | 26,951,845 | |
Semiconductors & Semiconductor Equipment - 5.4% | | | | | |
Advanced Micro Devices | | | | 176,857 | a,b | 5,562,153 | |
First Solar | | | | 150,345 | a,b | 9,331,914 | |
ON Semiconductor | | | | 201,130 | a | 3,580,114 | |
Teradyne | | | | 240,799 | | 12,755,123 | |
| | | | | 31,229,304 | |
Software & Services - 15.1% | | | | | |
DocuSign | | | | 64,377 | a,b | 3,005,762 | |
DXC Technology | | | | 148,237 | | 4,924,433 | |
Euronet Worldwide | | | | 38,123 | a | 5,838,156 | |
Fiserv | | | | 115,041 | a | 12,302,484 | |
Global Payments | | | | 43,758 | | 7,262,953 | |
Jack Henry & Associates | | | | 91,173 | | 13,216,438 | |
Leidos Holdings | | | | 48,574 | | 4,243,425 | |
Nuance Communications | | | | 810,899 | a | 13,631,212 | |
RealPage | | | | 125,001 | a,b | 7,958,814 | |
10
| | | | | | | | |
| |
Description | | | | Shares | | Value ($) | |
Common Stocks - 97.9% (continued) | | | | | |
Software & Services - 15.1% (continued) | | | | | |
Teradata | | | | 225,334 | a,b | 6,956,061 | |
Total System Services | | | | 60,774 | | 8,157,086 | |
| | | | | 87,496,824 | |
Technology Hardware & Equipment - 4.3% | | | | | |
FLIR Systems | | | | 115,276 | | 5,679,648 | |
Keysight Technologies | | | | 102,701 | a | 9,947,619 | |
Western Digital | | | | 162,839 | | 9,325,789 | |
| | | | | 24,953,056 | |
Transportation - 3.2% | | | | | |
Knight-Swift Transportation Holdings | | | | 345,573 | b | 11,797,862 | |
Southwest Airlines | | | | 127,731 | | 6,682,886 | |
| | | | | 18,480,748 | |
Utilities - 3.9% | | | | | |
American Electric Power | | | | 35,712 | | 3,255,149 | |
Edison International | | | | 197,531 | | 14,275,565 | |
PPL | | | | 180,751 | | 5,341,192 | |
| | | | | 22,871,906 | |
Total Common Stocks(cost $541,944,293) | | | | 567,574,152 | |
| | | | | | | | |
Exchange-Traded Funds - 1.6% | | | | | |
Registered Investment Companies - 1.6% | | | | | |
SPDR S&P MidCap 400 ETF Trust
(cost $9,600,285) | | | | 27,769 | | 9,528,655 | |
| | | 1-Day
Yield (%) | | | | | |
Investment Companies - .6% | | | | | |
Registered Investment Companies - .6% | | | | | |
Dreyfus Institutional Preferred Government Plus Money Market Fund
(cost $3,248,008) | | 2.09 | | 3,248,008 | d | 3,248,008 | |
11
STATEMENT OF INVESTMENTS (continued)
| | | | | | | | |
| |
Description | | 1-Day
Yield (%) | | Shares | | Value ($) | |
Investment of Cash Collateral for Securities Loaned - .6% | | | | | |
Registered Investment Companies - .6% | | | | | |
Dreyfus Institutional Preferred Government Plus Money Market Fund
(cost $3,567,020) | | 2.09 | | 3,567,020 | d | 3,567,020 | |
Total Investments(cost $558,359,606) | | 100.7% | | 583,917,835 | |
Liabilities, Less Cash and Receivables | | (.7%) | | (3,886,937) | |
Net Assets | | 100.0% | | 580,030,898 | |
ETF—Exchange-Traded Fund
a Non-income producing security.
b Security, or portion thereof, on loan. At August 31, 2019, the value of the fund’s securities on loan was $67,294,800 and the value of the collateral was $68,352,588, consisting of cash collateral of $3,567,020 and U.S. Government & Agency securities valued at $64,785,568.
c Investment in real estate investment trust within the United States.
d Investment in affiliated issuer. The investment objective of this investment company is publicly available and can be found within the investment company’s prospectus.
| | |
Portfolio Summary (Unaudited)† | Value (%) |
Information Technology | 24.8 |
Consumer Discretionary | 12.2 |
Materials | 11.2 |
Health Care | 10.2 |
Industrials | 9.5 |
Financials | 8.6 |
Real Estate | 6.9 |
Energy | 5.5 |
Utilities | 3.9 |
Communication Services | 3.3 |
Investment Companies | 2.8 |
Consumer Staples | 1.8 |
| | 100.7 |
† Based on net assets.
See notes to financial statements.
12
STATEMENT OF INVESTMENTS IN AFFILIATED ISSUERS
| | | | | | | |
Investment Companies | Value
8/31/18 ($) | Purchases ($) | Sales ($) | Value
8/31/19 ($) | Net
Assets (%) | Dividends/
Distributions ($) |
Registered Investment Companies: |
Dreyfus Institutional Preferred Government Plus Money Market Fund | 14,732,681 | 263,792,546 | 275,277,219 | 3,248,008 | .6 | 132,957 |
Investment of Cash Collateral for Securities Loaned:† |
Dreyfus Institutional Preferred Government Money Market Fund, Institutional Shares | - | 22,848,729 | 22,848,729 | - | - | - |
Dreyfus Institutional Preferred Government Plus Money Market Fund | - | 18,438,812 | 14,871,792 | 3,567,020 | .6 | - |
Total | 14,732,681 | 305,080,087 | 312,997,740 | 6,815,028 | 1.2 | 132,957 |
† Effective January 2, 2019, cash collateral for securities lending was transferred from Dreyfus Institutional Preferred Government Money Market Fund, Institutional Shares to Dreyfus Institutional Preferred Government Plus Money Market Fund.
See notes to financial statements.
13
STATEMENT OF ASSETS AND LIABILITIES
August 31, 2019
| | | | | | | |
| | | | | | |
| | | Cost | | Value | |
Assets ($): | | | | |
Investments in securities—See Statement of Investments
(including securities on loan, valued at $67,294,800)—Note 1(b): | | | |
Unaffiliated issuers | 551,544,578 | | 577,102,807 | |
Affiliated issuers | | 6,815,028 | | 6,815,028 | |
Receivable for investment securities sold | | 2,377,848 | |
Dividends, interest and securities lending income receivable | | 443,534 | |
Receivable for shares of Common Stock subscribed | | 129,993 | |
Prepaid expenses | | | | | 79,991 | |
| | | | | 586,949,201 | |
Liabilities ($): | | | | |
Due to BNY Mellon Investment Adviser, Inc. and affiliates—Note 3(c) | | 495,493 | |
Liability for securities on loan—Note 1(b) | | 3,567,020 | |
Payable for shares of Common Stock redeemed | | 1,328,756 | |
Payable for investment securities purchased | | 1,305,404 | |
Directors fees and expenses payable | | 16,738 | |
Interest payable—Note 2 | | 144 | |
Other accrued expenses | | | | | 204,748 | |
| | | | | 6,918,303 | |
Net Assets ($) | | | 580,030,898 | |
Composition of Net Assets ($): | | | | |
Paid-in capital | | | | | 602,878,474 | |
Total distributable earnings (loss) | | | | | (22,847,576) | |
Net Assets ($) | | | 580,030,898 | |
| | | | | | |
Net Asset Value Per Share | Class A | Class C | Class I | Class Y | |
Net Assets ($) | 343,672,786 | 29,892,073 | 197,290,339 | 9,175,700 | |
Shares Outstanding | 14,259,835 | 1,502,604 | 8,221,068 | 381,524 | |
Net Asset Value Per Share ($) | 24.10 | 19.89 | 24.00 | 24.05 | |
| | | | | |
See notes to financial statements. | | | | | |
14
STATEMENT OF OPERATIONS
Year Ended August 31, 2019
| | | | | | | |
| | | | | | |
| | | | | | |
Investment Income ($): | | | | |
Income: | | | | |
Cash dividends (net of $15,129 foreign taxes withheld at source): | |
Unaffiliated issuers | | | 9,885,486 | |
Affiliated issuers | | | 132,957 | |
Income from securities lending—Note 1(b) | | | 93,017 | |
Total Income | | | 10,111,460 | |
Expenses: | | | | |
Management fee—Note 3(a) | | | 5,938,547 | |
Shareholder servicing costs—Note 3(c) | | | 1,824,548 | |
Distribution fees—Note 3(b) | | | 281,314 | |
Professional fees | | | 92,711 | |
Registration fees | | | 83,507 | |
Directors’ fees and expenses—Note 3(d) | | | 78,394 | |
Prospectus and shareholders’ reports | | | 59,016 | |
Interest expense—Note 2 | | | 21,449 | |
Custodian fees—Note 3(c) | | | 14,641 | |
Loan commitment fees—Note 2 | | | 14,125 | |
Miscellaneous | | | 26,359 | |
Total Expenses | | | 8,434,611 | |
Investment Income—Net | | | 1,676,849 | |
Realized and Unrealized Gain (Loss) on Investments—Note 4 ($): | | |
Net realized gain (loss) on investments | (3,479,590) | |
Net change in unrealized appreciation (depreciation) on investments | (109,890,127) | |
Net Realized and Unrealized Gain (Loss) on Investments | | | (113,369,717) | |
Net (Decrease) in Net Assets Resulting from Operations | | (111,692,868) | |
| | | | | | |
See notes to financial statements. | | | | | |
15
STATEMENT OF CHANGES IN NET ASSETS
| | | | | | | | | | |
| | | | Year Ended August 31, |
| | | | 2019 | | 2018a | |
Operations ($): | | | | | | | | |
Investment income—net | | | 1,676,849 | | | | 125,166 | |
Net realized gain (loss) on investments | | (3,479,590) | | | | 197,859,216 | |
Net change in unrealized appreciation
(depreciation) on investments | | (109,890,127) | | | | (31,129,848) | |
Net Increase (Decrease) in Net Assets
Resulting from Operations | (111,692,868) | | | | 166,854,534 | |
Distributions ($): | |
Distributions to shareholders: | | | | | | | | |
Class A | | | (89,325,514) | | | | (61,344,461) | |
Class C | | | (10,375,746) | | | | (8,165,849) | |
Class I | | | (80,239,051) | | | | (63,759,043) | |
Class Y | | | (2,340,142) | | | | (1,632,511) | |
Total Distributions | | | (182,280,453) | | | | (134,901,864) | |
Capital Stock Transactions ($): | |
Net proceeds from shares sold: | | | | | | | | |
Class A | | | 30,692,805 | | | | 46,347,977 | |
Class C | | | 3,001,837 | | | | 5,109,170 | |
Class I | | | 75,738,264 | | | | 97,483,340 | |
Class Y | | | 1,932,209 | | | | 7,988,741 | |
Distributions reinvested: | | | | | | | | |
Class A | | | 83,230,860 | | | | 55,122,682 | |
Class C | | | 9,141,082 | | | | 7,103,712 | |
Class I | | | 77,500,604 | | | | 61,433,975 | |
Class Y | | | 1,604,933 | | | | 1,270,067 | |
Cost of shares redeemed: | | | | | | | | |
Class A | | | (113,695,003) | | | | (143,015,105) | |
Class C | | | (16,238,435) | | | | (24,872,704) | |
Class I | | | (330,412,765) | | | | (168,762,845) | |
Class Y | | | (5,706,302) | | | | (3,274,603) | |
Increase (Decrease) in Net Assets
from Capital Stock Transactions | (183,209,911) | | | | (58,065,593) | |
Total Increase (Decrease) in Net Assets | (477,183,232) | | | | (26,112,923) | |
Net Assets ($): | |
Beginning of Period | | | 1,057,214,130 | | | | 1,083,327,053 | |
End of Period | | | 580,030,898 | | | | 1,057,214,130 | |
16
| | | | | | | | | | |
| | | | Year Ended August 31, |
| | | | 2019 | | 2018a | |
Capital Share Transactions (Shares): | |
Class Ab | | | | | | | | |
Shares sold | | | 1,224,755 | | | | 1,352,924 | |
Shares issued for distributions reinvested | | | 3,718,983 | | | | 1,676,481 | |
Shares redeemed | | | (4,392,166) | | | | (4,152,303) | |
Net Increase (Decrease) in Shares Outstanding | 551,572 | | | | (1,122,898) | |
Class Cb | | | | | | | | |
Shares sold | | | 149,055 | | | | 169,785 | |
Shares issued for distributions reinvested | | | 492,005 | | | | 246,485 | |
Shares redeemed | | | (768,689) | | | | (825,487) | |
Net Increase (Decrease) in Shares Outstanding | (127,629) | | | | (409,217) | |
Class Ib | | | | | | | | |
Shares sold | | | 3,046,526 | | | | 2,848,509 | |
Shares issued for distributions reinvested | | | 3,483,169 | | | | 1,881,592 | |
Shares redeemed | | | (12,746,365) | | | | (4,937,020) | |
Net Increase (Decrease) in Shares Outstanding | (6,216,670) | | | | (206,919) | |
Class Y | | | | | | | | |
Shares sold | | | 75,370 | | | | 230,669 | |
Shares issued for distributions reinvested | | | 72,034 | | | | 38,840 | |
Shares redeemed | | | (207,052) | | | | (94,414) | |
Net Increase (Decrease) in Shares Outstanding | (59,648) | | | | 175,095 | |
| | | | | | | | | |
a Distributions to shareholders include $2,056,470 Class I and $63,829 Class Y distributions from net investment income and $61,344,461 Class A, $8,165,849 Class C, $61,702,573 Class I and $1,568,682 Class Y distributions from net realized gains. Undistributed investment income—net was $70,644 in 2018 and is no longer presented as a result of the adoption of SEC’s Disclosure Update and Simplification Rule. | |
b During the period ended August 31, 2019, 1,152 Class A shares representing $27,563 were exchanged for 1,158 Class I shares, 299 Class C shares representing $5,964 were automatically converted to 247 Class A shares and during the period ended August 31, 2018, 8,403 Class C shares representing $242,093 were automatically converted to 7,367 Class A shares. | |
See notes to financial statements.
| | | | | | | | |
17
FINANCIAL HIGHLIGHTS
The following tables describe the performance for each share class for the fiscal periods indicated. All information (except portfolio turnover rate) reflects financial results for a single fund share. Total return shows how much your investment in the fund would have increased (or decreased) during each period, assuming you had reinvested all dividends and distributions. These figures have been derived from the fund’s financial statements.
| | | | | | | | |
| | |
| | |
| | Year Ended August 31, |
Class A Shares | | 2019 | 2018 | 2017 | 2016 | 2015 |
Per Share Data ($): | | | | | | |
Net asset value,
beginning of period | | 35.32 | 34.37 | 31.72 | 36.97 | 43.17 |
Investment Operations: | | | | | | |
Investment income (loss)—neta | | .03 | (.03) | .03 | .03 | (.02) |
Net realized and unrealized gain
(loss) on investments | | (4.32) | 5.35 | 4.13 | .82 | (1.79) |
Total from Investment Operations | | (4.29) | 5.32 | 4.16 | .85 | (1.81) |
Distributions: | | | | | | |
Dividends from investment
income—net | | - | - | (.01) | - | (.05) |
Dividends from net realized gain
on investments | | (6.93) | (4.37) | (1.50) | (6.10) | (4.34) |
Total Distributions | | (6.93) | (4.37) | (1.51) | (6.10) | (4.39) |
Net asset value, end of period | | 24.10 | 35.32 | 34.37 | 31.72 | 36.97 |
Total Return (%)b | | (10.64) | 16.44 | 13.28 | 3.95 | (4.72) |
Ratios/Supplemental Data (%): | | | | | | |
Ratio of total expenses to
average net assets | | 1.15 | 1.16 | 1.17 | 1.21 | 1.18 |
Ratio of net expenses to
average net assets | | 1.15 | 1.16 | 1.17 | 1.21 | 1.18 |
Ratio of net investment income
(loss) to average net assets | | .12 | (.08) | .10 | .11 | (.05) |
Portfolio Turnover Rate | | 98.59 | 100.55 | 104.51 | 101.68 | 74.05 |
Net Assets, end of period
($ x 1,000) | | 343,673 | 484,169 | 509,761 | 796,686 | 1,071,713 |
a Based on average shares outstanding.
b Exclusive of sales charge.
See notes to financial statements.
18
| | | | | | | | | |
| | |
| | |
| | Year Ended August 31, |
Class C Shares | | 2019 | 2018 | 2017 | 2016 | 2015 |
Per Share Data ($): | | | | | | | |
Net asset value, beginning of period | | | 30.80 | 30.70 | 28.68 | 34.26 | 40.55 |
Investment Operations: | | | | | | | |
Investment (loss)—neta | | | (.14) | (.25) | (.19) | (.18) | (.29) |
Net realized and unrealized gain
(loss) on investments | | | (3.84) | 4.72 | 3.71 | .70 | (1.66) |
Total from Investment Operations | | | (3.98) | 4.47 | 3.52 | .52 | (1.95) |
Distributions: | | | | | | | |
Dividends from net realized gain
on investments | | | (6.93) | (4.37) | (1.50) | (6.10) | (4.34) |
Net asset value, end of period | | | 19.89 | 30.80 | 30.70 | 28.68 | 34.26 |
Total Return (%)b | | | (11.34) | 15.55 | 12.44 | 3.19 | (5.41) |
Ratios/Supplemental Data (%): | | | | | | | |
Ratio of total expenses to
average net assets | | | 1.91 | 1.91 | 1.92 | 1.94 | 1.90 |
Ratio of net expenses to
average net assets | | | 1.91 | 1.91 | 1.92 | 1.94 | 1.90 |
Ratio of net investment (loss)
to average net assets | | | (.65) | (.84) | (.65) | (.62) | (.77) |
Portfolio Turnover Rate | | | 98.59 | 100.55 | 104.51 | 101.68 | 74.05 |
Net Assets, end of period ($ x 1,000) | | | 29,892 | 50,210 | 62,608 | 76,886 | 116,683 |
a Based on average shares outstanding.
b Exclusive of sales charge.
See notes to financial statements.
19
FINANCIAL HIGHLIGHTS (continued)
| | | | | | | | | | |
| | | | |
| | | | |
| | Year Ended August 31, |
Class I Shares | | 2019 | 2018 | 2017 | 2016 | 2015 |
Per Share Data ($): | | | | | | |
Net asset value, beginning of period | | 35.14 | 34.27 | 31.64 | 36.83 | 43.01 |
Investment Operations: | | | | | | |
Investment income—neta | | .11 | .07 | .14 | .12 | .09 |
Net realized and unrealized gain
(loss) on investments | | (4.32) | 5.32 | 4.11 | .81 | (1.78) |
Total from Investment Operations | | (4.21) | 5.39 | 4.25 | .93 | (1.69) |
Distributions: | | | | | | |
Dividends from investment
income—net | | (.00)b | (.15) | (.12) | (.02) | (.15) |
Dividends from net realized gain
on investments | | (6.93) | (4.37) | (1.50) | (6.10) | (4.34) |
Total Distributions | | (6.93) | (4.52) | (1.62) | (6.12) | (4.49) |
Net asset value, end of period | | 24.00 | 35.14 | 34.27 | 31.64 | 36.83 |
Total Return (%) | | (10.42) | 16.74 | 13.63 | 4.23 | (4.43) |
Ratios/Supplemental Data (%): | | | | | | |
Ratio of total expenses to
average net assets | | .90 | .89 | .90 | .90 | .89 |
Ratio of net expenses to
average net assets | | .90 | .89 | .90 | .90 | .89 |
Ratio of net investment income
to average net assets | | .40 | .19 | .42 | .39 | .22 |
Portfolio Turnover Rate | | 98.59 | 100.55 | 104.51 | 101.68 | 74.05 |
Net Assets, end of period ($ x 1,000) | | 197,290 | 507,298 | 501,821 | 492,694 | 913,852 |
a Based on average shares outstanding.
b Amount is less than $.00 per share.
See notes to financial statements.
20
| | | | | | | | | |
| | | |
| | | |
| | Year Ended August 31, |
Class Y Shares | | 2019 | 2018 | 2017 | 2016 | 2015 |
Per Share Data ($): | | | | | | |
Net asset value, beginning of period | | 35.22 | 34.34 | 31.72 | 36.93 | 43.12 |
Investment Operations: | | | | | | |
Investment income—neta | | .12 | .10 | .15 | .16 | .13 |
Net realized and unrealized gain
(loss) on investments | | (4.31) | 5.33 | 4.13 | .83 | (1.78) |
Total from Investment Operations | | (4.19) | 5.43 | 4.28 | .99 | (1.65) |
Distributions: | | | | | | |
Dividends from investment
income—net | | (.05) | (.18) | (.16) | (.10) | (.20) |
Dividends from net realized gain
on investments | | (6.93) | (4.37) | (1.50) | (6.10) | (4.34) |
Total Distributions | | (6.98) | (4.55) | (1.66) | (6.20) | (4.54) |
Net asset value, end of period | | 24.05 | 35.22 | 34.34 | 31.72 | 36.93 |
Total Return (%) | | (10.34) | 16.84 | 13.71 | 4.40 | (4.34) |
Ratios/Supplemental Data (%): | | | | | | |
Ratio of total expenses to
average net assets | | .81 | .79 | .80 | .78 | .80 |
Ratio of net expenses to
average net assets | | .81 | .79 | .80 | .78 | .80 |
Ratio of net investment income to average net assets | | .45 | .30 | .49 | .53 | .30 |
Portfolio Turnover Rate | | 98.59 | 100.55 | 104.51 | 101.68 | 74.05 |
Net Assets, end of period ($ x 1,000) | | 9,176 | 15,538 | 9,137 | 17,308 | 79,397 |
a Based on average shares outstanding.
See notes to financial statements.
21
NOTES TO FINANCIAL STATEMENTS
NOTE 1—Significant Accounting Policies:
BNY Mellon Opportunistic Midcap Value Fund (the “fund”) is a separate diversified series of BNY Mellon Advantage Funds, Inc. (the “Company”), which is registered under the Investment Company Act of 1940, as amended (the “Act”), as an open-end management investment company and operates as a series company currently offering nine series, including the fund. The fund’s investment objective is to seek to surpass the performance of the Russell Midcap® Value Index. BNY Mellon Investment Adviser, Inc. (the “Adviser”), a wholly-owned subsidiary of The Bank of New York Mellon Corporation (“BNY Mellon”), serves as the fund’s investment adviser.
Effective June 3, 2019, the fund changed its name from Dreyfus Opportunistic Midcap Value Fund to BNY Mellon Opportunistic Midcap Value Fund and the Company changed its name from Advantage Funds, Inc. to BNY Mellon Advantage Funds, Inc. In addition, The Dreyfus Corporation, the fund’s investment adviser, changed its name to “BNY Mellon Investment Adviser, Inc.”, MBSC Securities Corporation, the fund’s distributor, changed its name to “BNY Mellon Securities Corporation” and Dreyfus Transfer, Inc., the fund’s transfer agent, changed its name to “BNY Mellon Transfer, Inc.”
BNY Mellon Securities Corporation (the “Distributor”), a wholly-owned subsidiary of the Adviser, is the distributor of the fund’s shares. The fund is authorized to issue 800 million shares of $.001 par value Common Stock. The fund currently has authorized five classes of shares: Class A (350 million shares authorized), Class C (125 million shares authorized), Class I (125 million shares authorized), Class T (100 million shares authorized) and Class Y (100 million shares authorized). Class A and Class T shares generally are subject to a sales charge imposed at the time of purchase. Class C shares are subject to a contingent deferred sales charge (“CDSC”) imposed on Class C shares redeemed within one year of purchase. Class C shares automatically convert to Class A shares ten years after the date of purchase, without the imposition of a sales charge. Class I and Class Y shares are sold at net asset value per share generally to institutional investors. As of the date of this report, the fund did not offer Class T shares for purchase. Other differences between the classes include the services offered to and the expenses borne by each class, the allocation of certain transfer agency costs, and certain voting rights. Income, expenses (other than expenses attributable to a specific class), and realized and unrealized gains or losses on investments are allocated to each class of shares based on its relative net assets.
22
The Company accounts separately for the assets, liabilities and operations of each series. Expenses directly attributable to each series are charged to that series’ operations; expenses which are applicable to all series are allocated among them on a pro rata basis.
The Financial Accounting Standards Board (“FASB”) Accounting Standards Codification (“ASC”) is the exclusive reference of authoritative U.S. generally accepted accounting principles (“GAAP”) recognized by the FASB to be applied by nongovernmental entities. Rules and interpretive releases of the Securities and Exchange Commission (“SEC”) under authority of federal laws are also sources of authoritative GAAP for SEC registrants. The fund is an investment company and applies the accounting and reporting guidance of the FASB ASC Topic 946 Financial Services-Investment Companies. The fund’s financial statements are prepared in accordance with GAAP, which may require the use of management estimates and assumptions. Actual results could differ from those estimates.
The Companyenters into contracts that contain a variety of indemnifications. The fund’s maximum exposure under these arrangements is unknown. The fund does not anticipate recognizing any loss related to these arrangements.
(a) Portfolio valuation: The fair value of a financial instrument is the amount that would be received to sell an asset or paid to transfer a liability in an orderly transaction between market participants at the measurement date (i.e., the exit price). GAAP establishes a fair value hierarchy that prioritizes the inputs of valuation techniques used to measure fair value. This hierarchy gives the highest priority to unadjusted quoted prices in active markets for identical assets or liabilities (Level 1 measurements) and the lowest priority to unobservable inputs (Level 3 measurements).
Additionally, GAAP provides guidance on determining whether the volume and activity in a market has decreased significantly and whether such a decrease in activity results in transactions that are not orderly. GAAP requires enhanced disclosures around valuation inputs and techniques used during annual and interim periods.
Various inputs are used in determining the value of the fund’s investments relating to fair value measurements. These inputs are summarized in the three broad levels listed below:
Level 1—unadjusted quoted prices in active markets for identical investments.
23
NOTES TO FINANCIAL STATEMENTS(continued)
Level 2—other significant observable inputs (including quoted prices for similar investments, interest rates, prepayment speeds, credit risk, etc.).
Level 3—significant unobservable inputs (including the fund’s own assumptions in determining the fair value of investments).
The inputs or methodology used for valuing securities are not necessarily an indication of the risk associated with investing in those securities.
Changes in valuation techniques may result in transfers in or out of an assigned level within the disclosure hierarchy. Valuation techniques used to value the fund’s investments are as follows:
Investments in securities are valued at the last sales price on the securities exchange or national securities market on which such securities are primarily traded. Securities listed on the National Market System for which market quotations are available are valued at the official closing price or, if there is no official closing price that day, at the last sales price. For open short positions, asked prices are used for valuation purposes. Bid price is used when no asked price is available. Registered investment companies that are not traded on an exchange are valued at their net asset value. All of the preceding securities are generally categorized within Level 1 of the fair value hierarchy.
Securities not listed on an exchange or the national securities market, or securities for which there were no transactions, are valued at the average of the most recent bid and asked prices. These securities are generally categorized within Level 2 of the fair value hierarchy.
Fair valuing of securities may be determined with the assistance of a pricing service using calculations based on indices of domestic securities and other appropriate indicators, such as prices of relevant American Depository Receipts and futures. Utilizing these techniques may result in transfers between Level 1 and Level 2 of the fair value hierarchy.
When market quotations or official closing prices are not readily available, or are determined not to accurately reflect fair value, such as when the value of a security has been significantly affected by events after the close of the exchange or market on which the security is principally traded (for example, a foreign exchange or market), but before the fund calculates its net asset value, the fund may value these investments at fair value as determined in accordance with the procedures approved by the Company’s Board of Directors (the “Board”). Certain factors may be considered when fair valuing investments such as: fundamental analytical data, the nature and duration of restrictions on disposition, an evaluation of the forces that
24
influence the market in which the securities are purchased and sold, and public trading in similar securities of the issuer or comparable issuers. These securities are either categorized within Level 2 or 3 of the fair value hierarchy depending on the relevant inputs used.
For restricted securities where observable inputs are limited, assumptions about market activity and risk are used and such securities are generally categorized within Level 3 of the fair value hierarchy.
The following is a summary of the inputs used as of August 31, 2019in valuing the fund’s investments:
| | | | | | |
| | Level 1 -
Unadjusted
Quoted Prices | Level 2 -
Other
Significant
Observable
Inputs | Level 3 -
Significant
Unobservable
Inputs | Total |
Assets ($) | | | | |
Investments in Securities:† | | | |
Equity Securities - Common Stocks | 567,574,152 | - | - | 567,574,152 |
Exchange-Traded Funds | 9,528,655 | - | - | 9,528,655 |
Investment Companies | 6,815,028 | - | - | 6,815,028 |
† See Statement of Investments for additional detailed categorizations, if any.
(b)Securities transactions and investment income: Securities transactions are recorded on a trade date basis. Realized gains and losses from securities transactions are recorded on the identified cost basis. Dividend income is recognized on the ex-dividend date and interest income, including, where applicable, accretion of discount and amortization of premium on investments, is recognized on the accrual basis.
Pursuant to a securities lending agreement with The Bank of New York Mellon, a subsidiary of BNY Mellon and an affiliate of the Adviser, the fund may lend securities to qualified institutions. It is the fund’s policy that, at origination, all loans are secured by collateral of at least 102% of the value of U.S. securities loaned and 105% of the value of foreign securities loaned. Collateral equivalent to at least 100% of the market value of securities on loan is maintained at all times. Collateral is either in the form of cash, which can be invested in certain money market mutual funds managed by the Adviser, or U.S. Government and Agency securities. The
25
NOTES TO FINANCIAL STATEMENTS(continued)
fund is entitled to receive all dividends, interest and distributions on securities loaned, in addition to income earned as a result of the lending transaction. Should a borrower fail to return the securities in a timely manner, The Bank of New York Mellon is required to replace the securities for the benefit of the fund or credit the fund with the market value of the unreturned securities and is subrogated to the fund’s rights against the borrower and the collateral. Additionally, the contractual maturity of security lending transactions are on an overnight and continuous basis. During the period ended August 31, 2019, The Bank of New York Mellon earned $18,113 from lending portfolio securities, pursuant to the securities lending agreement.
(c) Affiliated issuers: Investments in other investment companies advised by the Adviser are considered “affiliated” under the Act.
(d) Dividends and distributions to shareholders: Dividends and distributions are recorded on the ex-dividend date. Dividends from investment income-net and dividends from net realized capital gains, if any, are normally declared and paid annually, but the fund may make distributions on a more frequent basis to comply with the distribution requirements of the Internal Revenue Code of 1986, as amended (the “Code”). To the extent that net realized capital gains can be offset by capital loss carryovers, it is the policy of the fund not to distribute such gains. Income and capital gain distributions are determined in accordance with income tax regulations, which may differ from GAAP.
(e) Federal income taxes: It is the policy of the fund to continue to qualify as a regulated investment company, if such qualification is in the best interests of its shareholders, by complying with the applicable provisions of the Code, and to make distributions of taxable income and net realized capital gain sufficient to relieve it from substantially all federal income and excise taxes.
As of and during the period ended August 31, 2019, the fund did not have any liabilities for any uncertain tax positions. The fund recognizes interest and penalties, if any, related to uncertain tax positions as income tax expense in the Statement of Operations. During the period ended August 31, 2019, the fund did not incur any interest or penalties.
Each tax year in the four-year period ended August 31, 2019 remains subject to examination by the Internal Revenue Service and state taxing authorities.
At August 31, 2019, the components of accumulated earnings on a tax basis were as follows: undistributed ordinary income $1,671,474 and unrealized appreciation $17,110,186. In addition, the fund had $41,629,236
26
of capital losses realized after October 31, 2018, which were deferred for tax purposes to the first day of the following fiscal year.
The tax character of distributions paid to shareholders during the fiscal periods ended August 31, 2019 and August 31, 2018 were as follows: ordinary income $84,381,884 and $37,250,668 , and long-term capital gains $97,898,569 and $97,651,196 , respectively.
During the period ended August 31, 2019, as a result of permanent book to tax differences, primarily due to the tax treatment for treating a portion of the proceeds from redemptions as a distribution for tax purposes, the fund decreased total distributable earnings (loss) by $18,996,047 and increased paid-in capital by the same amount. Net assets and net asset value per share were not affected by this reclassification.
(f) New Accounting Pronouncements: Effective June 1, 2019, the fund adopted Accounting Standards Update 2018-13, Fair Value Measurement (Topic 820): Disclosure Framework—Changes to the Disclosure Requirements for Fair Value Measurement (“ASU 2018-13”). The update provides guidance that eliminates, adds and modifies certain disclosure requirements for fair value measurements. The adoption of ASU 2018-13 had no impact on the operations of the fund for the period ended August 31, 2019.
NOTE 2—Bank Lines of Credit:
The fund participates with other long-term open-end funds managed by the Adviser in a $1.030 billion unsecured credit facility led by Citibank, N.A. (the “Citibank Credit Facility”) and a $300 million unsecured credit facility provided by The Bank of New York Mellon (the “BNYM Credit Facility”), each to be utilized primarily for temporary or emergency purposes, including the financing of redemptions (each, a “Facility”). The Citibank Credit Facility is available in two tranches: (i) Tranche A is in an amount equal to $830 million and is available to all long-term open-ended funds, including the fund, and (ii) Tranche B is in amount equal to $200 million and is available only to BNY Mellon Floating Rate Income Fund, a series of BNY Mellon Investment Funds IV, Inc. Prior to October 3, 2018, the unsecured credit facility with Citibank, N.A. was $830 million. In connection therewith, the fund has agreed to pay its pro rata portion of commitment fees for Tranche A of the Citibank Credit Facility and the BNYM Credit Facility. Interest is charged to the fund based on rates determined pursuant to the terms of the respective Facility at the time of borrowing.
27
NOTES TO FINANCIAL STATEMENTS(continued)
The average amount of borrowings outstanding under the Facilities during the period ended August 31, 2019, was approximately $752,600 with a related weighted average annualized interest rate of 2.85%.
NOTE 3—Management Fee and Other Transactions with Affiliates:
(a)Pursuant to a management agreement with the Adviser, the management fee is computed at the annual rate of .75% of the value of the fund's average daily net assets and is payable monthly.
During the period ended August 31, 2019, the Distributor retained $6,925 from commissions earned on sales of the fund’s Class A shares and $1,066 from CDSC fees on redemptions of the fund’s Class C shares.
(b) Under the Distribution Plan adopted pursuant to Rule 12b-1 under the Act, Class C shares pay the Distributor for distributing its shares at an annual rate of .75% of the value of its average daily net assets. During the period ended August 31, 2019, Class C shares were charged $281,314 pursuant to the Distribution Plan.
(c)Under the Shareholder Services Plan, Class A and Class C shares pay the Distributor at an annual rate of .25% of the value of their average daily net assets for the provision of certain services. The services provided may include personal services relating to shareholder accounts, such as answering shareholder inquiries regarding the fund and providing reports and other information, and services related to the maintenance of shareholder accounts. The Distributor may make payments to Service Agents (securities dealers, financial institutions or other industry professionals) with respect to these services. The Distributor determines the amounts to be paid to Service Agents. During the period ended August 31, 2019, Class A and Class C shares were charged $972,070and $93,771, respectively, pursuant to the Shareholder Services Plan.
The fund has an arrangement with the transfer agent whereby the fund may receive earnings credits when positive cash balances are maintained, which are used to offset transfer agency fees. The fund had an arrangement with the custodian to receive earnings credits when positive cash balances were maintained, which were used to offset custody fees. Effective February 1, 2019, the arrangement with the custodian changed whereby the fund will no longer receive earnings credits to offset its custody fees and will receive interest income or overdraft fees going forward. For financial reporting purposes, the fund includes net earnings credits, if any, as an expense offset in the Statement of Operations.
28
The fund compensates BNY Mellon Transfer, Inc., a wholly-owned subsidiary of the Adviser, under a transfer agency agreement for providing transfer agency and cash management services for the fund. The majority of transfer agency fees are comprised of amounts paid on a per account basis, while cash management fees are related to fund subscriptions and redemptions. During the period ended August 31, 2019, the fund was charged $84,639 for transfer agency services. These fees are included in Shareholder servicing costs in the Statement of Operations.
The fund compensates The Bank of New York Mellon under a custody agreement for providing custodial services for the fund. These fees are determined based on net assets, geographic region and transaction activity. During the period ended August 31, 2019, the fund was charged $14,641 pursuant to the custody agreement.
During the period ended August 31, 2019, the fund was charged $11,539 for services performed by the Chief Compliance Officer and his staff. These fees are included in Miscellaneous in the Statement of Operations.
The components of “Due to BNY Mellon Investment Adviser, Inc. and affiliates” in the Statement of Assets and Liabilities consist of: management fees $369,909, Distribution Plan fees $19,092, Shareholder Services Plan fees $79,074, custodian fees $6,044, Chief Compliance Officer fees $2,252 and transfer agency fees $19,122.
(d) Each Board member also serves as a Board member of other funds in the BNY Mellon Family of Funds complex. Annual retainer fees and attendance fees are allocated to each fund based on net assets.
NOTE 4—Securities Transactions:
The aggregate amount of purchases and sales of investment securities, excluding short-term securities, during the period ended August 31, 2019, amounted to $777,553,218 and $1,125,655,954, respectively.
At August 31, 2019, the cost of investments for federal income tax purposes was $566,807,649; accordingly, accumulated net unrealized appreciation on investments was $17,110,186, consisting of $66,994,082 gross unrealized appreciation and $49,883,896 gross unrealized depreciation.
29
REPORT OF INDEPENDENT REGISTERED PUBLIC ACCOUNTING FIRM
To the Shareholders and the Board of Directors of BNY Mellon Opportunistic Midcap Value Fund (formerly, Dreyfus Opportunistic Midcap Value Fund)
Opinion on the Financial Statements
We have audited the accompanying statement of assets and liabilities of BNY Mellon Opportunistic Midcap Value Fund (the “Fund”) (formerly, Dreyfus Opportunistic Midcap Value Fund) (one of the funds constituting BNY Mellon Advantage Funds, Inc.), including the statements of investments and investments in affiliated issuers, as of August 31, 2019, and the related statement of operations for the year then ended, the statement of changes in net assets for each of the two years in the period then ended, the financial highlights for each of the five years in the period then ended and the related notes (collectively referred to as the “financial statements”). In our opinion, the financial statements present fairly, in all material respects, the financial position of the Fund (one of the funds constituting BNY Mellon Advantage Funds, Inc.) at August 31, 2019, the results of its operations for the year then ended, the changes in its net assets for each of the two years in the period then ended and its financial highlights for each of the five years in the period then ended, in conformity with U.S. generally accepted accounting principles.
Basis for Opinion
These financial statements are the responsibility of the Fund’s management. Our responsibility is to express an opinion on the Fund’s financial statements based on our audits. We are a public accounting firm registered with the Public Company Accounting Oversight Board (United States) (“PCAOB”) and are required to be independent with respect to the Fund in accordance with the U.S. federal securities laws and the applicable rules and regulations of the Securities and Exchange Commission and the PCAOB.
We conducted our audits in accordance with the standards of the PCAOB. Those standards require that we plan and perform the audit to obtain reasonable assurance about whether the financial statements are free of material misstatement, whether due to error or fraud. The Fund is not required to have, nor were we engaged to perform, an audit of the Fund’s internal control over financial reporting. As part of our audits, we are required to obtain an understanding of internal control over financial reporting, but not for the purpose of expressing an opinion on the effectiveness of the Fund’s internal control over financial reporting. Accordingly, we express no such opinion.
Our audits included performing procedures to assess the risks of material misstatement of the financial statements, whether due to error or fraud, and performing procedures that respond to those risks. Such procedures included examining, on a test basis, evidence regarding the amounts and disclosures in the financial statements. Our procedures included confirmation of securities owned as of August 31, 2019, by correspondence with the custodian and others or by other appropriate auditing procedures where replies from others were not received. Our audits also included evaluating the accounting principles used and significant estimates made by management, as well as evaluating the overall presentation of the financial statements. We believe that our audits provide a reasonable basis for our opinion.

We have served as the auditor of one or more investment companies in the BNY Mellon Family of Funds since at least 1957, but we are unable to determine the specific year.
New York, New York
October 24, 2019
30
IMPORTANT TAX INFORMATION(Unaudited)
For federal tax purposes, the fund hereby reports 18.69% of the ordinary dividends paid during the fiscal year ended August 31, 2019 as qualifying for the corporate dividends received deduction. Also certain dividends paid by the fund may be subject to a maximum tax rate of 15%, as provided for by the Jobs and Growth Tax Relief Reconciliation Act of 2003. Of the distributions paid during the fiscal year, $7,876,247 represents the maximum amount that may be considered qualified dividend income. The fund also hereby reports $3.2054 per share as a short-term capital gain distribution and $3.7221 per share as a long-term capital gain distribution paid on December 11, 2018. Shareholders will receive notification in early 2020 of the percentage applicable to the preparation of their 2019 income tax returns.
31
INFORMATION ABOUT THE RENEWAL OF THE FUND’S MANAGEMENT AGREEMENT (Unaudited)
At a meeting of the fund’s Board of Directors held on March 12-13, 2019, the Board considered the renewalof the fund’s Management Agreement pursuant to which the Adviser provides the fund with investment advisory and administrative services (the “Agreement”). The Board members, none of whom are “interested persons” (as defined in the Investment Company Act of 1940, as amended) of the fund, were assisted in their review by independent legal counsel and met with counsel in executive session separate from representatives of the Adviser. In considering the renewal of the Agreement, the Board considered all factors that it believed to be relevant, including those discussed below. The Board did not identify any one factor as dispositive, and each Board member may have attributed different weights to the factors considered.
Analysis of Nature, Extent, and Quality of Services Provided to the Fund. The Board considered information provided to it at the meeting and in previous presentations from representatives of the Adviser regarding the nature, extent, and quality of the services provided to funds in the BNY Mellon fund complex. The Adviser provided the number of open accounts in the fund, the fund’s asset size and the allocation of fund assets among distribution channels. The Adviser also had previously provided information regarding the diverse intermediary relationships and distribution channels of funds in the BNY Mellon fund complex (such as retail direct or intermediary, in which intermediaries typically are paid by the fund and/or the Adviser) and the Adviser’s corresponding need for broad, deep, and diverse resources to be able to provide ongoing shareholder services to each intermediary or distribution channel, as applicable to the fund.
The Board also considered research support available to, and portfolio management capabilities of, the fund’s portfolio management personnel and that the Adviser also provides oversight of day-to-day fund operations, including fund accounting and administration and assistance in meeting legal and regulatory requirements. The Board also considered the Adviser’s extensive administrative, accounting and compliance infrastructures. The Board also considered portfolio management’s brokerage policies and practices (including policies and practices regarding soft dollars) and the standards applied in seeking best execution.
Comparative Analysis of the Fund’s Performance and Management Fee and Expense Ratio. The Board reviewed reports prepared by Broadridge Financial Solutions, Inc. (“Broadridge”), an independent provider of investment company data, which included information comparing (1) the fund’s performance with the performance of a group of comparable funds (the “Performance Group”) and with a broader group of funds (the “Performance Universe”), all for various periods ended January 31, 2019, and (2) the fund’s actual and contractual management fees and total expenses with those of a group of comparable funds (the “Expense Group”) and with a broader group of funds (the “Expense Universe”), the information for which was derived in part from fund financial statements available to Broadridge as of the date of its analysis. The Adviser previously had furnished the Board with a description of the methodology Broadridge used to
32
select the Performance Group and Performance Universe and the Expense Group and Expense Universe.
Representatives of the Adviser stated that the usefulness of performance comparisons may be affected by a number of factors, including different investment limitations and policies that may be applicable to the fund and comparison funds. The Board discussed with representatives of the Adviser and/or its affiliates the results of the comparisons and considered that the fund’s total return performance was above the Performance Group median for all periods, except the four- and five-year periods when performance was below the median, and below the Performance Universe median for all periods, except the three- and ten-year periods when performance was above the median. The Board considered the relative proximity of the fund’s performance to the Performance Group median in certain periods when performance was below median. The Adviser also provided a comparison of the fund’s calendar year total returns to the returns of the fund’s benchmark index.
The Board also reviewed the range of actual and contractual management fees and total expenses of the Expense Group and Expense Universe funds and discussed the results of the comparisons. The Board considered that the fund’s contractual management fee was below the Expense Group median, the fund’s actual management fee was slightly above the Expense Group and Expense Universe medians and the fund’s total expenses were below the Expense Group and Expense Universe medians (lowest total expenses in the Expense Group).
Representatives of the Adviser reviewed with the Board the management or investment advisory fees (1) paid by funds advised or administered by the Adviser that are in the same Lipper category as the fund and (2) paid to the Adviser, or the primary employer of the fund’s primary portfolio manager(s) that is affiliated with the Adviser, for advising any separate accounts and/or other types of client portfolios that are considered to have similar investment strategies and policies as the fund (the “Similar Clients”), and explained the nature of the Similar Clients. They discussed differences in fees paid and the relationship of the fees paid in light of any differences in the services provided and other relevant factors. The Board considered the relevance of the fee information provided for the Similar Clients to evaluate the appropriateness of the fund’s management fee.
Analysis of Profitability and Economies of Scale. Representatives of the Adviser reviewed the expenses allocated and profit received by the Adviser and its affiliates and the resulting profitability percentage for managing the fund and the aggregate profitability percentage to the Adviser and its affiliates for managing the funds in the BNY Mellon fund complex, and the method used to determine the expenses and profit. The Board concluded that the profitability results were not unreasonable, given the services rendered and service levels provided by the Adviser. The Board also had been provided with information prepared by an independent consulting firm regarding the Adviser’s approach to allocating costs to, and determining the profitability of, individual funds and the entire BNY Mellon fund complex. The consulting firm also had analyzed
33
INFORMATION ABOUT THE RENEWAL OF THE FUND’S MANAGEMENT AGREEMENT (Unaudited) (continued)
where any economies of scale might emerge in connection with the management of a fund.
The Board considered, on the advice of its counsel, the profitability analysis (1) as part of its evaluation of whether the fees under the Agreement, considered in relation to the mix of services provided by the Adviser, including the nature, extent and quality of such services, supported the renewal of the Agreement and (2) in light of the relevant circumstances for the fund and the extent to which economies of scale would be realized if the fund grows and whether fee levels reflect these economies of scale for the benefit of fund shareholders. Representatives of the Adviser stated that a discussion of economies of scale is predicated on a fund having achieved a substantial size with increasing assets and that, if a fund’s assets had been stable or decreasing, the possibility that the Adviser may have realized any economies of scale would be less. Representatives of the Adviser also stated that, as a result of shared and allocated costs among funds in the BNY Mellon fund complex, the extent of economies of scale could depend substantially on the level of assets in the complex as a whole, so that increases and decreases in complex-wide assets can affect potential economies of scale in a manner that is disproportionate to, or even in the opposite direction from, changes in the fund’s asset level. The Board also considered potential benefits to the Adviser from acting as investment adviser and took into consideration the soft dollar arrangements in effect for trading the fund’s investments.
At the conclusion of these discussions, the Board agreed that it had been furnished with sufficient information to make an informed business decision with respect to the renewal of the Agreement. Based on the discussions and considerations as described above, the Board concluded and determined as follows.
· The Board concluded that the nature, extent and quality of the services provided by the Adviser are adequate and appropriate.
· The Board generally was satisfied with the fund’s overall performance.
· The Board concluded that the fee paid to the Adviser continued to be appropriate under the circumstances and in light of the factors and the totality of the services provided as discussed above.
· The Board determined that the economies of scale which may accrue to the Adviser and its affiliates in connection with the management of the fund had been adequately considered by the Adviser in connection with the fee rate charged to the fund pursuant to the Agreement and that, to the extent in the future it were determined that material economies of scale had not been shared with the fund, the Board would seek to have those economies of scale shared with the fund.
In evaluating the Agreement, the Board considered these conclusions and determinations and also relied on its previous knowledge, gained through meetings and other interactions with the Adviser and its affiliates, of the Adviser and the services provided to the fund by the Adviser. The Board also relied on information received on
34
a routine and regular basis throughout the year relating to the operations of the fund and the investment management and other services provided under the Agreement, including information on the investment performance of the fund in comparison to similar mutual funds and benchmark performance indices; general market outlook as applicable to the fund; and compliance reports. In addition, the Board’s consideration of the contractual fee arrangements for this fund had the benefit of a number of years of reviews of the Agreement for the fund, or substantially similar agreements for other BNY Mellon funds that the Board oversees, during which lengthy discussions took place between the Board and representatives of the Adviser. Certain aspects of the arrangements may receive greater scrutiny in some years than in others, and the Board’s conclusions may be based, in part, on their consideration of the fund’s arrangements, or substantially similar arrangements for other BNY Mellon funds that the Board oversees, in prior years. The Board determined to renew the Agreement.
35
BOARD MEMBERS INFORMATION(Unaudited)
INDEPENDENT BOARD MEMBERS
Joseph S. DiMartino (75)
Chairman of the Board (1995)
Principal Occupation During Past 5 Years:
· Corporate Director and Trustee (1995-present)
Other Public Company Board Memberships During Past 5 Years:
· CBIZ (formerly, Century Business Services, Inc.), a provider of outsourcing functions for small and medium size companies, Director (1997-present)
No. of Portfolios for which Board Member Serves:120
———————
Peggy C. Davis (76)
Board Member (2006)
Principal Occupation During Past 5 Years:
· Shad Professor of Law, New York University School of Law (1983-present)
No. of Portfolios for which Board Member Serves: 44
———————
David P. Feldman (79)
Board Member (1996)
Principal Occupation During Past 5 Years:
· Corporate Director and Trustee (1985-present)
Other Public Company Board Memberships During Past 5 Years:
· BBH Mutual Funds Group (5 registered mutual funds), Director (1992-2014)
No. of Portfolios for which Board Member Serves:30
———————
36
Gina D. France (61)
Board Member (2019)
Principal Occupation During Past 5 Years:
· Founder, President and Chief Executive Officer, France Strategic Partners, a strategy and advisory firm serving corporate clients across the United States (2003 –present)
· Corporate Director and Trustee (2004 – current)
Other Public Company Board Memberships During Past 5 Years:
· Huntington Bancshares, a bank holding company headquartered in Columbus, Ohio, Director (2016 – present)
· Cedar Fair, L.P., a publicly-traded partnership that owns and operates amusement parks and hotels in the U.S. and Canada, Director (2011 – present)
· CBIZ (formerly, Century Business Services, Inc.), a provider of outsourcing functions for small and medium size companies, Director (2015 – present)
· FirstMerit Corporation, a diversified financial services company, Director (2004 – 2016)
No. of Portfolios for which Board Member Serves:30
———————
Joan Gulley (72)
Board Member (2017)
Principal Occupation During Past 5 Years:
· PNC Financial Services Group, Inc.(1993-2014), Executive Vice President and Chief Human Resources Officer and Executive Committee Member (2008-2014)
No. of Portfolios for which Board Member Serves:50
———————
Ehud Houminer (79)
Board Member (1993)
Principal Occupation During Past 5 Years:
· Board of Overseers at the Columbia Business School, Columbia University (1992-present)
· Trustee, Ben Gurion University
No. of Portfolios for which Board Member Serves: 50
———————
Lynn Martin (79)
Board Member (2012)
Principal Occupation During Past 5 Years:
· President of The Martin Hall Group LLC, a human resources consulting firm (2005-2012)
No. of Portfolios for which Board Member Serves:30
———————
37
BOARD MEMBERS INFORMATION (Unaudited) (continued)
INDEPENDENT BOARD MEMBERS (continued)
Robin A. Melvin (56)
Board Member (2012)
Principal Occupation During Past 5 Years:
· Co-chairman, Illinois Mentoring Partnership, non-profit organization dedicated to increasing the quantity and quality of mentoring services in Illinois; (2014-present; board member since 2013)
No. of Portfolios for which Board Member Serves:97
———————
Once elected all Board Members serve for an indefinite term, but achieve Emeritus status upon reaching age 80. The address of the Board Members and Officers is c/o BNY Mellon Investment Adviser, Inc. 240 Greenwich Street, New York, New York 10166. Additional information about the Board Members is available in the fund’s Statement of Additional Information which can be obtained from the Adviser free of charge by calling this toll free number: 1-800-373-9387.
James F. Henry, Emeritus Board Member
Dr. Martin Peretz, Emeritus Board Member
Philip L. Toia, Emeritus Board Member
38
OFFICERS OF THE FUND(Unaudited)
RENEE LAROCHE-MORRIS, President since May 2019.
President and a director of BNY Mellon Investment Adviser, Inc. since January 2018. She is an officer of 63 investment companies (comprised of 120 portfolios) managed by the Adviser. She is 48 years old and has been an employee of BNY Mellon since 2003.
JAMES WINDELS, Treasurer since November 2001.
Director- BNY Mellon Fund Administration, and an officer of 64 investment companies (comprised of 143 portfolios) managed by the Adviser. He is 61 years old and has been an employee of the Adviser since April 1985.
BENNETT A. MACDOUGALL, Chief Legal Officer since October 2015.
Chief Legal Officer of the Adviser and Associate General Counsel and Managing Director of BNY Mellon since June 2015; Director and Associate General Counsel of Deutsche Bank – Asset & Wealth Management Division from June 2005 to June 2015, and as Chief Legal Officer of Deutsche Investment Management Americas Inc. from June 2012 to May 2015. He is an officer of 64 investment companies (comprised of 143 portfolios) managed by the Adviser. He is 48 years old and has been an employee of the Adviser since June 2015.
DAVID DIPETRILLO, Vice President since January 2018.
Head of North America Product, BNY Mellon Investment Management since January 2018, Director of Product Strategy, BNY Mellon Investment Management from January 2016 to December 2017; Head of US Retail Product and Channel Marketing, BNY Mellon Investment Management from January 2014 to December 2015. He is an officer of 63 investment companies (comprised of 120 portfolios) managed by the Adviser. He is 41 years old and has been an employee of BNY Mellon since 2005.
JAMES BITETTO, Vice President since August 2005 and Secretary since February 2018.
Managing Counsel of BNY Mellon and Secretary of the Adviser, and an officer of 64 investment companies (comprised of 143 portfolios) managed by the Adviser. He is 53 years old and has been an employee of the Adviser since December 1996.
SONALEE CROSS, Vice President and Assistant Secretary since March 2018.
Counsel of BNY Mellon since October 2016; Associate at Proskauer Rose LLP from April 2016 to September 2016; Attorney at EnTrust Capital from August 2015 to February 2016; Associate at Sidley Austin LLP from September 2013 to August 2015. She is an officer of 64 investment companies (comprised of 143 portfolios) managed by the Adviser. She is 31 years old and has been an employee of the Adviser since October 2016.
DEIRDRE CUNNANE, Vice President and Assistant Secretary since March 2019.
Counsel of BNY Mellon since August 2018; Senior Regulatory Specialist at BNY Mellon Investment Management Services from February 2016 to August 2018; Trustee Associate at BNY Mellon Trust Company (Ireland) Limited from August 2013 to February 2016. She is an officer of 64 investment companies (comprised of 143 portfolios) managed by the Adviser. She is 29 years old and has been an employee of the Adviser since August 2018.
SARAH S. KELLEHER, Vice President and Assistant Secretary since April 2014.
Managing Counsel of BNY Mellon since December 2017, Senior Counsel of BNY Mellon from March 2013 to December 2017. She is an officer of 64 investment companies (comprised of 143 portfolios) managed by the Adviser. She is 44 years old and has been an employee of the Adviser since March 2013.
JEFF PRUSNOFSKY, Vice President and Assistant Secretary since August 2005.
Senior Managing Counsel of BNY Mellon, and an officer of 64 investment companies (comprised of 143 portfolios) managed by the Adviser. He is 54 years old and has been an employee of the Adviser since October 1990.
PETER M. SULLIVAN, Vice President and Assistant Secretary since March 2019.
Managing Counsel of BNY Mellon, and an officer of 64 investment companies (comprised of 143 portfolios) managed by the Adviser. He is 51 years old and has been an employee of the Adviser since April 2004.
39
OFFICERS OF THE FUND (Unaudited)(continued)
NATALYA ZELENSKY, Vice President and Assistant Secretary since March 2017.
Counsel of BNY Mellon since May 2016; Attorney at Wildermuth Endowment Strategy Fund/Wildermuth Advisory, LLC from November 2015 to May 2016 and Assistant General Counsel at RCS Advisory Services from July 2014 to November 2015. She is an officer of 64 investment companies (comprised of 143 portfolios) managed by the Adviser. She is 34 years old and has been an employee of the Adviser since May 2016.
GAVIN C. REILLY, Assistant Treasurer since December 2005.
Tax Manager - BNY Mellon Fund Administration, and an officer of 64 investment companies (comprised of 143 portfolios) managed by the Adviser. He is 51 years old and has been an employee of the Adviser since April 1991.
ROBERT S. ROBOL, Assistant Treasurer since August 2005.
Senior Accounting Manager- BNY Mellon Fund Administration, and an officer of 64 investment companies (comprised of 143 portfolios) managed by the Adviser. He is 55 years old and has been an employee of the Adviser since October 1988.
ROBERT SALVIOLO, Assistant Treasurer since July 2007.
Senior Accounting Manager – BNY Mellon Fund Administration, and an officer of 64 investment companies (comprised of 143 portfolios) managed by the Adviser. He is 52 years old and has been an employee of the Adviser since June 1989.
ROBERT SVAGNA, Assistant Treasurer since December 2002.
Senior Accounting Manager – BNY Mellon Fund Administration, and an officer of 64 investment companies (comprised of 143 portfolios) managed by the Adviser. He is 52 years old and has been an employee of the Adviser since November 1990.
JOSEPH W. CONNOLLY, Chief Compliance Officer since October 2004.
Chief Compliance Officer of the Adviser, the BNY Mellon Family of Funds and BNY Mellon Funds Trust (64 investment companies, comprised of 143 portfolios). He is 62 years old and has served in various capacities with the Adviser since 1980, including manager of the firm’s Fund Accounting Department from 1997 through October 2001.
CARIDAD M. CAROSELLA, Anti-Money Laundering Compliance Officer since January 2016.
Anti-Money Laundering Compliance Officer of the BNY Mellon Family of Funds and BNY Mellon Funds Trust since January 2016; from May 2015 to December 2015, Interim Anti-Money Laundering Compliance Officer of the BNY Mellon Family of Funds and BNY Mellon Funds Trust and the Distributor; from January 2012 to May 2015, AML Surveillance Officer of the Distributor. She is an officer of 57 investment companies (comprised of 136 portfolios) managed by the Adviser. She is 51 years old and has been an employee of the Distributor since 1997.
40
NOTES
41
BNY Mellon Opportunistic Midcap Value Fund
240 Greenwich Street
New York, NY 10286
Adviser
BNY Mellon Investment Adviser, Inc.
240 Greenwich Street
New York, NY 10286
Custodian
The Bank of New York Mellon
240 Greenwich Street
New York, NY 10286
Transfer Agent &
Dividend Disbursing Agent
BNY Mellon Transfer, Inc.
240 Greenwich Street
New York, NY 10286
Distributor
BNY Mellon Securities Corporation
240 Greenwich Street
New York, NY 10286
| | |
Ticker Symbols: | Class A: DMCVX Class C: DVLCX Class I: DVLIX Class Y: DMCYX |
Telephone Call your financial representative or 1-800-373-9387
Mail The BNY Mellon Family of Funds, 144 Glenn Curtiss Boulevard, Uniondale, NY 11556-0144
E-mailSend your request toinfo@bnymellon.com
InternetInformation can be viewed online or downloaded atwww.bnymellonim.com/us
The fund files its complete schedule of portfolio holdings with the Securities and Exchange Commission (“SEC”) for the first and third quarters of each fiscal year on Form N-PORT. The fund’s Forms N-PORT are available on the SEC’s website atwww.sec.gov.
A description of the policies and procedures that the fund uses to determine how to vote proxies relating to portfolio securities and information regarding how the fund voted these proxies for the most recent 12-month period ended June 30 is available atwww.bnymellonim.com/us and on the SEC’s website atwww.sec.gov and without charge, upon request, by calling 1-800-373-9387.
| | |
© 2019 BNY Mellon Securities Corporation
0258AR0819 | 
|
BNY Mellon Opportunistic Small Cap Fund
| |
ANNUAL REPORT August 31, 2019 |
| |
Save time. Save paper. View your next shareholder report online as soon as it’s available. Log into www.bnymellonim.com/us and sign up for eCommunications. It’s simple and only takes a few minutes. |
| |
The views expressed in this report reflect those of the portfolio manager(s) only through the end of the period covered and do not necessarily represent the views of BNY Mellon Investment Adviser, Inc. or any other person in the BNY Mellon Investment Adviser, Inc. organization. Any such views are subject to change at any time based upon market or other conditions and BNY Mellon Investment Adviser, Inc. disclaims any responsibility to update such views. These views may not be relied on as investment advice and, because investment decisions for a fund in the BNY Mellon Family of Funds are based on numerous factors, may not be relied on as an indication of trading intent on behalf of any fund in the BNY Mellon Family of Funds. |
| |
Not FDIC-Insured • Not Bank-Guaranteed • May Lose Value |
Contents
THE FUND
FOR MORE INFORMATION
Back Cover
| | | | |
| |
BNY Mellon Opportunistic Small Cap Fund
| | The Fund |
A LETTER FROM THE PRESIDENT OF BNY MELLON INVESTMENT ADVISER, INC.
Dear Shareholder:
We are pleased to present this annual report for BNY Mellon Opportunistic Small Cap Fund (formerly Dreyfus Opportunistic Small Cap Fund), covering the 12-month period from September 1, 2018 through August 31, 2019. For information about how the fund performed during the reporting period, as well as general market perspectives, we provide a Discussion of Fund Performance on the pages that follow.
After a strong summer, equity markets weakened in the fourth quarter of 2018, as concerns about rising interest rates, trade tensions and slowing global growth provided downward pressure on returns. In December 2018, stocks experienced a sharp sell-off, as it appeared that the U.S. Federal Reserve (the “Fed”) would maintain its hawkish stance on monetary policy. In January 2019, the Fed commented that it would slow the pace of interest-rate increases, which helped stimulate a rebound across equity markets that continued into the second quarter. Escalating trade tensions disrupted equity markets again in May. The dip was short-lived, as markets rose once again in June. However, despite continued supportive central bank policies, pockets of volatility persisted through the end of the period.
In fixed-income markets, returns were hampered early in the reporting period by rising interest rates and accelerating inflation. With the return of stock market volatility in October 2018, a flight to quality led to a rise in prices for U.S. Treasuries that continued through the end of the year, leading to a flattening yield curve. After the Fed’s supportive statements in January 2019, other developed market central banks followed suit and reiterated their abilities to bolster flagging growth by continuing supportive policies. This helped to further buoy fixed-income instrument prices. At the end of July, the Fed cut the federal funds rate by 25 basis points. Both the U.S. and Global Bloomberg Barclays Aggregate Bond indices produced strong returns for the 12 months.
We believe that over the near term, the outlook for the U.S. remains positive, but we will monitor relevant data for any signs of a change. As always, we encourage you to discuss the risks and opportunities in today’s investment environment with your financial advisor.
Thank you for your continued confidence and support.
Sincerely,

Renee LaRoche-Morris
President
BNY Mellon Investment Adviser, Inc.
September 16, 2019
2
DISCUSSION OF FUND PERFORMANCE(Unaudited)
For the period from September 1, 2018 through August 31, 2019, as provided by Patrick Kent, CFA, CMT, James Boyd, Brian R. Duncan, and Dale Dutile, portfolio managers
Market and Fund Performance Overview
For the 12-month period ended August 31, 2019, BNY Mellon Opportunistic Small Cap Fund’s (formerly, Dreyfus Opportunistic Small Cap Fund) Investor shares achieved a total return of -19.47%, Class I shares returned -19.31% and Class Y shares returned -19.23%.1 In comparison, the fund’s benchmark, the Russell 2000® Index (the “Index”), produced a total return of -12.89% for the same period.2
Small-cap stocks lost ground over the reporting period despite steady economic conditions and corporate earnings. The fund trailed the Index, mainly due to asset allocation and stock selection decisions in the health care, information technology and utilities sectors.
The Fund’s Investment Approach
The fund seeks capital appreciation. The fund normally invests at least 80% of its net assets in the stocks of small-cap companies. The fund currently considers small-cap companies to be those companies with market capitalizations that fall within the range of companies in the Index. Stocks are selected for the fund’s portfolio based primarily on bottom-up fundamental analysis. The fund’s team of portfolio managers uses a disciplined investment process that relies, in general, on proprietary fundamental research and valuation. Generally, elements of the process include analysis of mid-cycle business prospects, estimation of the intrinsic value of the company, and the identification of a revaluation trigger. The fund’s portfolio managers invest in securities and sectors that they perceive to be attractive from a valuation and fundamental standpoint.
Market Volatility During Reporting Period
Early in the reporting period, rising U.S. interest rates and a sudden escalation in U.S.-China trade tensions triggered a sharp decline in U.S. equities. The October-to-late-December time period experienced a challenging investment environment in which many historical relationships between style and asset class performance temporarily broke down. In the past, valuation-sensitive strategies have outperformed during sharp market drawdowns. Unfortunately, exaggerated fears over a severe slowdown of global growth caused indiscriminate selling across nearly all asset classes.
Market performance in 2019 has been heavily influence by U.S.-China tariff rhetoric. In months where tensions appeared to be stable to improving, markets responded favorably and posted gains. However, as witnessed in the months of May and August, unexpected escalations in tariff tensions produced a quick, negative response in equity markets.
Importantly, a pivot by the Federal Reserve Board (the “Fed”) to a lowering interest-rate policy and investor recognition that the majority of companies would see profit gains in 2019 helped boost stock rallies and mitigate market drawdowns.
Performance Hindered Largely by Stock Selection
The fund’s underperformance versus the benchmark stemmed primarily from stock selections in the health care and information technology sectors, as well as an underweighted
3
DISCUSSION OF FUND PERFORMANCE(Unaudited) (continued)
position in the utilities sector. In the health care sector, initial sales of novel new drugs from TherapeuticsMD and Aerie Pharmaceuticals were hurt by low reimbursement coverage, causing the shares to temporarily underperform. In the information technology sector, Cloudera experienced a short-term delay in its new product cycle, Talend adjusted its sales growth rate to 20% while Commvault Systems embarked on a new sales strategy. All these developments were treated harshly by investors. In the utilities sector, a strong performance by Clearway Energy, an independent power producer, was not enough to offset the effect of the fund’s underweighted position, which hindered returns.
On the positive side, the fund benefited from our security selection and asset allocation strategies across several market segments. The fund fared especially well in the communication services, materials and consumer discretionary sectors. In the communication services sector, our position in Sinclair Broadcast Group was advantageous because the company’s acquisition of a regional sports network from Disney added shareholder value. In addition, our position in Nexstar Media Group, a telecommunications company, gained due to strength in the advertising market. In the materials sector, shares of Alamos Gold gained due to higher gold prices and improved operating efficiency at its mines. Also, our position inOMNOVA Solutions, a specialty chemical company, gained as the firm was taken private at a premium over recent trading prices. In the consumer discretionary sector, the fund’s position in three housing-related companies, Skyline Champion, Taylor Morrison Home and KB Home, gained due to strength in the low-end housing market. In addition, shares of OneSpaWorld Holdings, which operates spas on cruise ships, benefited from an increase in capacity and from improving volumes.
Finding Opportunities Amid Moderate Economic Growth
Barring an escalation in trade tensions between the U.S. and China, we believe the economy will continue to grow at a moderate pace. We also expect the Fed’s new more accommodative stance on interest rates to provide support to markets over the short term. We believe the fund’s recent performance is an aberration and not a reflection of the team’s capabilities. We remain cautiously positive, and we have continued to identify what we believe to be attractive, small-cap investment opportunities.
We have increased our exposure to the real estate, industrials and consumer discretionary sectors and reduced our exposure to the information technology, financials and health care sectors. We are particularly excited about our investment themes in homebuilding, novel therapeutics, precious metals mining and trucking.
September 16, 2019
1 Total return includes reinvestment of dividends and any capital gains paid. Past performance is no guarantee of future results. Share price and investment return fluctuate such that upon redemption, fund shares may be worth more or less than their original cost.
2 Source: Lipper Inc. — The Russell 2000® Index measures the performance of the small-cap segment of the U.S. equity universe. The Russell 2000® Index is a subset of the Russell 3000® Index representing approximately 10% of the total market capitalization of that index. It includes approximately 2,000 of the smallest securities based on a combination of their market cap and current index membership. The Russell 2000 is constructed to provide a comprehensive and unbiased small-cap barometer and is completely reconstituted annually to ensure larger stocks do not distort the performance and characteristics of the true small-cap opportunity set. Investors cannot invest directly in any index.
Please note: the position in any security highlighted with italicized typeface was sold during the reporting period.
Equities are subject generally to market, market sector, market liquidity, issuer and investment style risks, among other factors, to varying degrees, all of which are more fully described in the fund’s prospectus.
Stocks of small- and/or mid-cap companies often experience sharper price fluctuations than stocks of large-cap companies.
4
FUND PERFORMANCE(Unaudited)
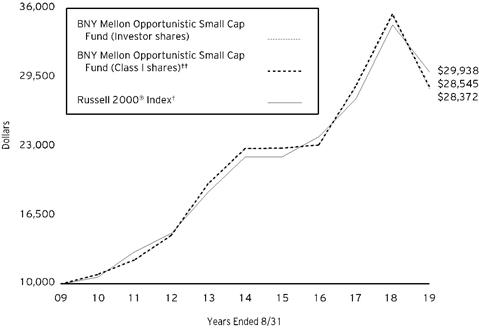
Comparison of change in value of a $10,000 investment in Investor shares, and Class I shares of BNY Mellon Opportunistic Small Cap Fund with a hypothetical investment of $10,000 in the Russell 2000® Index (the “Index’)
† Source: Lipper Inc.
†† The total return figures presented for Class I shares of the fund reflect the performance of the fund’s Investor Class shares for the period prior to 9/30/16 (the inception date for Class I shares).
Past performance is not predictive of future performance.
The above graph compares a hypothetical $10,000 investment made in each of the Investor and Class I shares of BNY Mellon Opportunistic Small Cap Fund on 8/31/09 to a hypothetical investment of $10,000 made in the Index on that date. All dividends and capital gain distributions are reinvested.
The fund’s performance shown in the line graph above takes into account all applicable fees and expenses. The Index measures the performance of the small-cap segment of the U.S. equity universe. The Index is a subset of the Russell 3000® Index representing approximately 10% of the total market capitalization of that index. It includes approximately 2,000 of the smallest securities based on a combination of their market cap and current index membership. The Index is constructed to provide a comprehensive and unbiased small-cap barometer and is completely reconstituted annually to ensure larger stocks do not distort the performance and characteristics of the true small-cap opportunity set. Unlike a mutual fund, the Index is not subject to charges, fees and other expenses. Investors cannot invest directly in any index. Further information relating to fund performance, including expense reimbursements, if applicable, is contained in the Financial Highlights section of the prospectus and elsewhere in this report.
5
FUND PERFORMANCE(Unaudited) (continued)
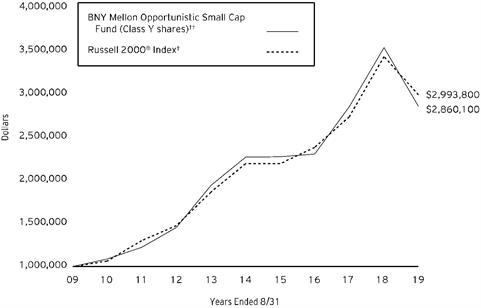
Comparison of change in value of a $1,000,000 investment in Class Y shares of BNY Mellon Opportunistic Small Cap Fund with a hypothetical investment of $1,000,000 in the Russell 2000® Index (the “Index’)
† Source: Lipper Inc.
†† The total return figures presented for Class Y shares of the fund reflect the performance of the fund’s Investor Class shares for the period prior to 9/30/16 (the inception date for Class Y shares).
Past performance is not predictive of future performance.
The above graph compares a hypothetical $1,000,000 investment made in Class Y shares of BNY Mellon Opportunistic Small Cap Fund on 8/31/09 to a hypothetical investment of $1,000,000 made in the Index on that date. All dividends and capital gain distributions are reinvested.
The fund’s performance shown in the line graph above takes into account all applicable fees and expenses. The Index measures the performance of the small-cap segment of the U.S. equity universe. The Index is a subset of the Russell 3000® Index representing approximately 10% of the total market capitalization of that index. It includes approximately 2,000 of the smallest securities based on a combination of their market cap and current index membership. The Index is constructed to provide a comprehensive and unbiased small-cap barometer and is completely reconstituted annually to ensure larger stocks do not distort the performance and characteristics of the true small-cap opportunity set. Unlike a mutual fund, the Index is not subject to charges, fees and other expenses. Investors cannot invest directly in any index. Further information relating to fund performance, including expense reimbursements, if applicable, is contained in the Financial Highlights section of the prospectus and elsewhere in this report.
6
| | | | | |
Average Annual Total Returns as of 8/31/19 | |
| Inception
Date | 1 Year | 5 Years | 10 Years |
Investor shares | 11/16/1993 | -19.47% | 4.54% | 10.99% |
Class I shares | 9/30/2016 | -19.31% | 4.67%† | 11.06%† |
Class Y shares | 9/30/2016 | -19.23% | 4.71%† | 11.08%† |
Russell 2000® Index | | -12.89% | 6.41% | 11.59% |
† The total return figures presented for Class I shares of the fund reflect the performance of the fund’s Investor Class shares for the period prior to 9/30/16 (the inception date for Class I shares).
The total return performance figures presented for Class Y shares of the fund reflect the performance of the fund’s Investor Class shares for the period prior to 9/30/16 (the inception date for Class Y shares).
The performance data quoted represents past performance, which is no guarantee of future results. Share price and investment return fluctuate and an investor’s shares may be worth more or less than original cost upon redemption. Current performance may be lower or higher than the performance quoted. Go to im.bnymellon.com for the fund’s most recent month-end returns.
The fund’s performance shown in the graphs and table does not reflect the deduction of taxes that a shareholder would pay on fund distributions or the redemption of fund shares.
7
UNDERSTANDING YOUR FUND’S EXPENSES(Unaudited)
As a mutual fund investor, you pay ongoing expenses, such as management fees and other expenses. Using the information below, you can estimate how these expenses affect your investment and compare them with the expenses of other funds. You also may pay one-time transaction expenses, including sales charges (loads) and redemption fees, which are not shown in this section and would have resulted in higher total expenses. For more information, see your fund’s prospectus or talk to your financial adviser.
Review your fund’s expenses
The table below shows the expenses you would have paid on a $1,000 investment in BNY Mellon Opportunistic Small Cap Fund from March 1, 2019 to August 31, 2019. It also shows how much a $1,000 investment would be worth at the close of the period, assuming actual returns and expenses.
| | | | | | |
Expenses and Value of a $1,000 Investment | | |
Assume actual returns for the six months ended August,31,2019 | | |
| | | | | |
| | Investor Shares | Class I | Class Y | |
Expense paid per $1,000† | $5.60 | $4.73 | $4.00 | |
Ending value (after expenses) | $932.20 | $933.10 | $933.60 | |
COMPARING YOUR FUND’S EXPENSES
WITH THOSE OF OTHER FUNDS(Unaudited)
Using the SEC’s method to compare expenses
The Securities and Exchange Commission (“SEC”) has established guidelines to help investors assess fund expenses. Per these guidelines, the table below shows your fund’s expenses based on a $1,000 investment, assuming a hypothetical 5% annualized return. You can use this information to compare the ongoing expenses (but not transaction expenses or total cost) of investing in the fund with those of other funds. All mutual fund shareholder reports will provide this information to help you make this comparison. Please note that you cannot use this information to estimate your actual ending account balance and expenses paid during the period.
| | | | | | |
Expenses and Value of a $1,000 Investment | | |
Assuming a hypothetical 5% annualized return for the six months ended August,31,2019 | |
| | | | | |
| | Investor Shares | Class I | Class Y | |
Expense paid per $1,000† | $5.85 | $4.94 | $4.18 | |
Ending value (after expenses) | $1,019.41 | $1,020.32 | $1,021.07 | |
† Expenses are equal to the fund‘s annualized expense ratio of 1.15% for Investor Shares, .97% for Class I and .82% for Class Y, multiplied by the average account value over the period, multiplied by 184/365 (to reflect the one-half year period). |
8
STATEMENT OF INVESTMENTS
August 31, 2019
| | | | | | | | |
| |
Description | | | | Shares | | Value ($) | |
Common Stocks - 97.6% | | | | | |
Automobiles & Components - .6% | | | | | |
Delphi Technologies | | | | 228,511 | a | 3,023,201 | |
Banks - 6.1% | | | | | |
Ameris Bancorp | | | | 107,646 | | 3,788,063 | |
Atlantic Union Bankshares | | | | 192,237 | a | 6,941,678 | |
First BanCorp | | | | 1,132,001 | | 10,844,570 | |
First Interstate BancSystem, Cl. A | | | | 170,867 | | 6,663,813 | |
First Merchants | | | | 103,651 | | 3,702,414 | |
| | | | | 31,940,538 | |
Capital Goods - 5.4% | | | | | |
Masonite International | | | | 86,819 | b | 4,635,266 | |
Nesco Holdings | | | | 509,252 | b | 3,198,103 | |
Quanta Services | | | | 95,513 | | 3,237,891 | |
Simpson Manufacturing | | | | 53,277 | a | 3,420,383 | |
Tennant | | | | 72,811 | | 4,979,544 | |
TPI Composites | | | | 248,859 | a,b | 4,389,873 | |
Wesco Aircraft Holdings | | | | 396,716 | b | 4,363,876 | |
| | | | | 28,224,936 | |
Commercial & Professional Services - 3.5% | | | | | |
Clarivate Analytics | | | | 398,789 | a,b | 7,026,662 | |
Covanta Holding | | | | 666,021 | | 11,455,561 | |
| | | | | 18,482,223 | |
Consumer Durables & Apparel - 6.1% | | | | | |
Century Communities | | | | 177,881 | a,b | 5,012,687 | |
KB Home | | | | 270,703 | | 7,604,047 | |
Skyline Champion | | | | 232,259 | b | 6,503,252 | |
Taylor Morrison Home | | | | 351,241 | b | 8,380,610 | |
TopBuild | | | | 50,218 | b | 4,651,191 | |
| | | | | 32,151,787 | |
Consumer Services - 6.8% | | | | | |
Adtalem Global Education | | | | 227,784 | b | 9,730,932 | |
Dave & Buster's Entertainment | | | | 274,553 | a | 11,819,507 | |
OneSpaWorld Holdings | | | | 509,232 | a,b | 7,994,942 | |
Penn National Gaming | | | | 326,258 | a,b | 6,254,366 | |
| | | | | 35,799,747 | |
Diversified Financials - 5.3% | | | | | |
Green Dot, Cl. A | | | | 149,649 | b | 4,576,266 | |
OneMain Holdings | | | | 256,531 | | 9,196,636 | |
PJT Partners, Cl. A | | | | 228,900 | | 9,524,529 | |
TPG Pace Holdings | | | | 401,706 | b | 4,298,254 | |
| | | | | 27,595,685 | |
9
STATEMENT OF INVESTMENTS (continued)
| | | | | | | | |
| |
Description | | | | Shares | | Value ($) | |
Common Stocks - 97.6% (continued) | | | | | |
Energy - 7.8% | | | | | |
Ardmore Shipping | | | | 403,452 | b | 2,517,540 | |
Delek US Holdings | | | | 248,916 | a | 8,151,999 | |
Euronav | | | | 290,577 | | 2,359,485 | |
Green Plains | | | | 477,269 | a | 3,918,379 | |
Laredo Petroleum | | | | 1,005,047 | a,b | 2,492,517 | |
Navigator Holdings | | | | 128,189 | b | 1,203,695 | |
PBF Energy, Cl. A | | | | 350,013 | | 8,295,308 | |
Scorpio Tankers | | | | 252,798 | a | 6,646,059 | |
Select Energy Services, Cl. A | | | | 615,576 | b | 5,023,100 | |
| | | | | 40,608,082 | |
Food, Beverage & Tobacco - 2.0% | | | | | |
Darling Ingredients | | | | 557,467 | b | 10,368,886 | |
Health Care Equipment & Services - 1.2% | | | | | |
AxoGen | | | | 393,723 | b | 6,240,510 | |
Materials - 12.2% | | | | | |
Alamos Gold, Cl. A | | | | 2,034,284 | | 14,341,702 | |
Cabot | | | | 337,917 | | 13,516,680 | |
Eagle Materials | | | | 100,806 | | 8,486,857 | |
IAMGOLD | | | | 1,882,257 | b | 7,001,996 | |
Louisiana-Pacific | | | | 469,309 | | 11,282,188 | |
US Concrete | | | | 234,619 | b | 9,506,762 | |
| | | | | 64,136,185 | |
Media & Entertainment - 3.4% | | | | | |
Criteo, ADR | | | | 373,048 | b | 7,244,592 | |
Nexstar Media Group, Cl. A | | | | 58,582 | | 5,793,174 | |
Sinclair Broadcast Group, Cl. A | | | | 109,469 | | 4,879,033 | |
| | | | | 17,916,799 | |
Pharmaceuticals Biotechnology & Life Sciences - 7.3% | | | | | |
Aerie Pharmaceuticals | | | | 225,017 | a,b | 4,873,868 | |
Flexion Therapeutics | | | | 586,324 | a,b | 7,721,887 | |
Revance Therapeutics | | | | 507,698 | b | 5,381,599 | |
Sage Therapeutics | | | | 40,929 | a,b | 7,026,281 | |
TherapeuticsMD | | | | 3,486,351 | a,b | 10,075,554 | |
Zogenix | | | | 76,818 | a,b | 3,279,360 | |
| | | | | 38,358,549 | |
Real Estate - 5.5% | | | | | |
Colliers International Group | | | | 76,501 | | 5,163,818 | |
CoreSite Realty | | | | 58,625 | c | 6,811,053 | |
Douglas Emmett | | | | 204,909 | c | 8,647,160 | |
Kilroy Realty | | | | 101,669 | c | 7,915,948 | |
| | | | | 28,537,979 | |
Software & Services - 8.9% | | | | | |
Cardtronics, Cl. A | | | | 383,330 | a,b | 11,354,235 | |
10
| | | | | | | | |
| |
Description | | | | Shares | | Value ($) | |
Common Stocks - 97.6% (continued) | | | | | |
Software & Services - 8.9% (continued) | | | | | |
Cloudera | | | | 659,646 | a,b | 4,709,872 | |
Commvault Systems | | | | 103,496 | b | 4,488,622 | |
Everbridge | | | | 29,996 | b | 2,585,655 | |
EVERTEC | | | | 213,156 | | 7,430,618 | |
Perspecta | | | | 118,426 | | 3,073,155 | |
Talend, ADR | | | | 312,192 | a,b | 12,703,093 | |
| | | | | 46,345,250 | |
Technology Hardware & Equipment - 4.2% | | | | | |
Ciena | | | | 333,293 | b | 13,641,683 | |
Itron | | | | 117,186 | b | 8,138,568 | |
| | | | | 21,780,251 | |
Transportation - 9.0% | | | | | |
Knight-Swift Transportation Holdings | | | | 321,532 | a | 10,977,103 | |
Mesa Air Group | | | | 268,158 | b | 1,732,301 | |
Scorpio Bulkers | | | | 735,522 | a | 4,655,854 | |
SkyWest | | | | 265,170 | | 15,183,634 | |
Werner Enterprises | | | | 447,669 | a | 14,629,823 | |
| | | | | 47,178,715 | |
Utilities - 2.3% | | | | | |
AquaVenture Holdings | | | | 378,059 | a,b | 6,684,083 | |
Clearway Energy, Cl. C | | | | 312,093 | a | 5,524,046 | |
| | | | | 12,208,129 | |
Total Common Stocks(cost $508,709,940) | | | | 510,897,452 | |
| | | | | | | | |
Exchange-Traded Funds - 1.7% | | | | | |
Registered Investment Companies - 1.7% | | | | | |
iShares Russell 2000 ETF
(cost $8,849,649) | | | | 59,501 | a | 8,856,129 | |
| | | Maturity
Date | | Number of Warrants | | | |
Warrants - .0% | | | | | |
Capital Goods - .0% | | | | | |
Nesco Holdings
(cost $202,770) | | 1/01/25 | | 172,384 | | 145,664 | |
| | | 1-Day
Yield (%) | | Shares | | | |
Investment Companies - .3% | | | | | |
Registered Investment Companies - .3% | | | | | |
Dreyfus Institutional Preferred Government Plus Money Market Fund
(cost $1,828,720) | | 2.09 | | 1,828,720 | d | 1,828,720 | |
11
STATEMENT OF INVESTMENTS (continued)
| | | | | | | | |
| |
Description | | 1-Day
Yield (%) | | Shares | | Value ($) | |
Investment of Cash Collateral for Securities Loaned - 7.5% | | | | | |
Registered Investment Companies - 7.5% | | | | | |
Dreyfus Institutional Preferred Government Plus Money Market Fund
(cost $39,073,059) | | 2.09 | | 39,073,059 | d | 39,073,059 | |
Total Investments(cost $558,664,138) | | 107.1% | | 560,801,024 | |
Liabilities, Less Cash and Receivables | | (7.1%) | | (37,236,393) | |
Net Assets | | 100.0% | | 523,564,631 | |
ADR—American Depository Receipt
ETF—Exchange-Traded Fund
a Security, or portion thereof, on loan. At August 31, 2019, the value of the fund’s securities on loan was $144,346,655 and the value of the collateral was $146,263,780, consisting of cash collateral of $39,073,059 and U.S. Government & Agency securities valued at $107,190,721.
b Non-income producing security.
c Investment in real estate investment trust within the United States.
d Investment in affiliated issuer. The investment objective of this investment company is publicly available and can be found within the investment company’s prospectus.
| | |
Portfolio Summary (Unaudited)† | Value (%) |
Industrials | 18.0 |
Consumer Discretionary | 13.6 |
Information Technology | 13.0 |
Materials | 12.2 |
Financials | 11.4 |
Investment Companies | 9.5 |
Health Care | 8.5 |
Energy | 7.8 |
Real Estate | 5.4 |
Communication Services | 3.4 |
Utilities | 2.3 |
Consumer Staples | 2.0 |
| | 107.1 |
† Based on net assets.
See notes to financial statements.
12
STATEMENT OF INVESTMENTS IN AFFILIATED ISSUERS
| | | | | | | |
Investment Companies | Value
8/31/18($) | Purchases($) | Sales ($) | Value
8/31/19($) | Net
Assets(%) | Dividends/
Distributions($) |
Registered Investment
Company; | | | | |
Dreyfus Institutional Preferred Government Plus Money Market Fund | 42,131,453 | 256,583,229 | 296,885,962 | 1,828,720 | .3 | 224,230 |
Investment
of Cash
Collateral
for Securities
Loaned;† | | |
Dreyfus Institutional Preferred Government Money Market Fund, Institutional Shares | 47,435,457 | 93,321,905 | 140,757,362 | - | - | - |
Dreyfus Institutional Preferred Government Plus Money Market Fund | - | 197,464,562 | 158,391,503 | 39,073,059 | 7.5 | - |
Total | 89,566,910 | 547,369,696 | 596,034,827 | 40,901,779 | 7.8 | 224,230 |
† Effective January 2, 2019, cash collateral for securities lending was transferred from Dreyfus Institutional Preferred Government Money Market Fund, Institutional Shares to Dreyfus Institutional Preferred Government Plus Money Market Fund.
See notes to financial statements.
13
STATEMENT OF ASSETS AND LIABILITIES
August 31, 2019
| | | | | | | |
| | | | | | |
| | | Cost | | Value | |
Assets ($): | | | | |
Investments in securities—See Statement of Investments
(including securities on loan, valued at $144,346,655)—Note 1(b): | | | |
Unaffiliated issuers | 517,762,359 | | 519,899,245 | |
Affiliated issuers | | 40,901,779 | | 40,901,779 | |
Receivable for investment securities sold | | 2,225,745 | |
Dividends, interest and securities lending income receivable | | 1,076,277 | |
Receivable for shares of Common Stock subscribed | | 99,714 | |
Prepaid expenses | | | | | 48,505 | |
| | | | | 564,251,265 | |
Liabilities ($): | | | | |
Due to BNY Mellon Investment Adviser, Inc. and affiliates—Note 3(b) | | 428,603 | |
Liability for securities on loan—Note 1(b) | | 39,073,059 | |
Payable for shares of Common Stock redeemed | | 631,363 | |
Payable for investment securities purchased | | 437,883 | |
Directors fees and expenses payable | | 7,905 | |
Other accrued expenses | | | | | 107,821 | |
| | | | | 40,686,634 | |
Net Assets ($) | | | 523,564,631 | |
Composition of Net Assets ($): | | | | |
Paid-in capital | | | | | 574,179,568 | |
Total distributable earnings (loss) | | | | | (50,614,937) | |
Net Assets ($) | | | 523,564,631 | |
| | | | | |
Net Asset Value Per Share | Investor Shares | Class I | Class Y | |
Net Assets ($) | 285,687,934 | 28,585,744 | 209,290,953 | |
Shares Outstanding | 11,346,311 | 1,126,394 | 8,225,591 | |
Net Asset Value Per Share ($) | 25.18 | 25.38 | 25.44 | |
| | | | |
See notes to financial statements. | | | | |
14
STATEMENT OF OPERATIONS
Year Ended August 31, 2019
| | | | | | | |
| | | | | | |
| | | | | | |
Investment Income ($): | | | | |
Income: | | | | |
Cash dividends (net of $69,556 foreign taxes withheld at source): | |
Unaffiliated issuers | | | 8,965,051 | |
Affiliated issuers | | | 224,230 | |
Income from securities lending—Note 1(b) | | | 251,371 | |
Interest | | | 1,610 | |
Total Income | | | 9,442,262 | |
Expenses: | | | | |
Management fee—Note 3(a) | | | 5,812,962 | |
Shareholder servicing costs—Note 3(b) | | | 1,434,398 | |
Professional fees | | | 82,897 | |
Custodian fees—Note 3(b) | | | 70,463 | |
Directors’ fees and expenses—Note 3(c) | | | 69,019 | |
Registration fees | | | 54,854 | |
Interest expense—Note 2 | | | 44,262 | |
Prospectus and shareholders’ reports | | | 35,638 | |
Loan commitment fees—Note 2 | | | 18,394 | |
Miscellaneous | | | 31,460 | |
Total Expenses | | | 7,654,347 | |
Investment Income—Net | | | 1,787,915 | |
Realized and Unrealized Gain (Loss) on Investments—Note 4 ($): | | |
Net realized gain (loss) on investments | (16,185,991) | |
Net change in unrealized appreciation (depreciation) on investments | | | (233,328,921) | |
Net Realized and Unrealized Gain (Loss) on Investments | | | (249,514,912) | |
Net (Decrease) in Net Assets Resulting from Operations | | (247,726,997) | |
| | | | | | |
See notes to financial statements. | | | | | |
15
STATEMENT OF CHANGES IN NET ASSETS
| | | | | | | | | | |
| | | | Year Ended August 31, |
| | | | 2019 | | 2018a | |
Operations ($): | | | | | | | | |
Investment income (loss)—net | | | 1,787,915 | | | | (3,133,556) | |
Net realized gain (loss) on investments | | (16,185,991) | | | | 182,469,411 | |
Net change in unrealized appreciation
(depreciation) on investments | | (233,328,921) | | | | 59,192,998 | |
Net Increase (Decrease) in Net Assets
Resulting from Operations | (247,726,997) | | | | 238,528,853 | |
Distributions ($): | |
Distributions to shareholders: | | | | | | | | |
Investor Shares | | | (86,926,217) | | | | (56,618,655) | |
Class I | | | (11,657,022) | | | | (7,439,198) | |
Class Y | | | (80,115,063) | | | | (60,129,762) | |
Total Distributions | | | (178,698,302) | | | | (124,187,615) | |
Capital Stock Transactions ($): | |
Net proceeds from shares sold: | | | | | | | | |
Investor Shares | | | 19,199,291 | | | | 144,162,912 | |
Class I | | | 14,069,728 | | | | 32,244,708 | |
Class Y | | | 47,811,478 | | | | 104,740,380 | |
Distributions reinvested: | | | | | | | | |
Investor Shares | | | 83,831,912 | | | | 54,909,530 | |
Class I | | | 11,244,679 | | | | 6,496,612 | |
Class Y | | | 35,893,606 | | | | 25,950,112 | |
Cost of shares redeemed: | | | | | | | | |
Investor Shares | | | (251,420,986) | | | | (106,539,619) | |
Class I | | | (44,124,433) | | | | (25,655,205) | |
Class Y | | | (260,267,336) | | | | (66,272,320) | |
Increase (Decrease) in Net Assets
from Capital Stock Transactions | (343,762,061) | | | | 170,037,110 | |
Total Increase (Decrease) in Net Assets | (770,187,360) | | | | 284,378,348 | |
Net Assets ($): | |
Beginning of Period | | | 1,293,751,991 | | | | 1,009,373,643 | |
End of Period | | | 523,564,631 | | | | 1,293,751,991 | |
16
| | | | | | | | | | |
| | | | Year Ended August 31, |
| | | | 2019 | | 2018a | |
Capital Share Transactions (Shares): | |
Investor Sharesb | | | | | | | | |
Shares sold | | | 638,235 | | | | 3,784,355 | |
Shares issued for distributions reinvested | | | 3,488,633 | | | | 1,508,504 | |
Shares redeemed | | | (8,620,024) | | | | (2,825,723) | |
Net Increase (Decrease) in Shares Outstanding | (4,493,156) | | | | 2,467,136 | |
Class Ib | | | | | | | | |
Shares sold | | | 496,288 | | | | 845,857 | |
Shares issued for distributions reinvested | | | 464,848 | | | | 177,941 | |
Shares redeemed | | | (1,643,184) | | | | (668,800) | |
Net Increase (Decrease) in Shares Outstanding | (682,048) | | | | 354,998 | |
Class Yb | | | | | | | | |
Shares sold | | | 1,757,757 | | | | 2,759,859 | |
Shares issued for distributions reinvested | | | 1,481,371 | | | | 710,572 | |
Shares redeemed | | | (9,539,980) | | | | (1,721,775) | |
Net Increase (Decrease) in Shares Outstanding | (6,300,852) | | | | 1,748,656 | |
| | | | | | | | | |
a Distributions to shareholders include only distributions from net realized gain on investments. Accumulated investment (loss)—net was $512,648 in 2018 and is no longer presented as a result of the adoption of SEC’s Disclosure Update and Simplification Rule. | |
b During the period ended August 31, 2019, 117,362 Class Y shares representing $3,601,116 were exchanged for 115,955 Class I shares and 14,594 class Y shares representing $514,778 were exchanged for 14,686 Investor shares and during the period ended August 31, 2018, 301,212 Investor shares representing $11,313,310 were exchanged for 300,505 Class Y shares and 108,847 Class Y shares representing $4,225,876 were exchanged for 108,913 Class I shares. | |
See notes to financial statements.
| | | | | | | | |
17
FINANCIAL HIGHLIGHTS
The following tables describe the performance for each share class for the fiscal periods indicated. All information (except portfolio turnover rate) reflects financial results for a single fund share. Total return shows how much your investment in the fund would have increased (or decreased) during each period, assuming you had reinvested all dividends and distributions. These figures have been derived from the fund’s financial statements.
| | | | | | | | | | |
| | | | |
| | |
Investor Shares | | Year Ended August 31, |
| | 2019 | 2018 | 2017a | 2016 | 2015 |
Per Share Data ($): | | | | | | |
Net asset value, beginning of period | | 40.10 | 36.53 | 29.66 | 30.45 | 35.87 |
Investment Operations: | | | | | | |
Investment income (loss)—netb | | .03 | (.16) | (.15) | (.05) | (.13) |
Net realized and unrealized gain
(loss) on investments | | (8.16) | 8.29 | 7.16 | .43 | .17 |
Total from Investment Operations | | (8.13) | 8.13 | 7.01 | .38 | .04 |
Distributions: | | | | | | |
Dividends from
investment income—net | | - | - | - | (.10) | - |
Dividends from net realized
gain on investments | | (6.79) | (4.56) | (.14) | (1.07) | (5.46) |
Total Distributions | | (6.79) | (4.56) | (.14) | (1.17) | (5.46) |
Net asset value, end of period | | 25.18 | 40.10 | 36.53 | 29.66 | 30.45 |
Total Return (%) | | (19.47) | 23.51 | 23.67 | 1.34 | .18 |
Ratios/Supplemental Data (%): | | | | | | |
Ratio of total expenses
to average net assets | | 1.13 | 1.09 | 1.10 | 1.11 | 1.09 |
Ratio of net expenses
to average net assets | | 1.13 | 1.09 | 1.10 | 1.11 | 1.09 |
Ratio of net investment income
(loss) to average net assets | | .12 | (.43) | (.44) | (.17) | (.41) |
Portfolio Turnover Rate | | 83.97 | 74.02 | 84.96 | 82.01 | 74.06 |
Net Assets, end of period ($ x 1,000) | | 285,688 | 635,221 | 488,507 | 802,741 | 940,235 |
a On September 30, 2016, the fund redesignated existing shares as Investor shares.
b Based on average shares outstanding.
See notes to financial statements.
18
| | | | | | | | | | |
| | | | |
| | | |
Class I Shares | | | | Year Ended August 31, |
| | | | 2019 | 2018 | 2017a |
Per Share Data ($): | | | | | | |
Net asset value, beginning of period | | | | 40.28 | 36.60 | 30.62 |
Investment Operations: | | | | | | |
Investment income (loss)—netb | | | | .08 | (.08) | (.07) |
Net realized and unrealized gain
(loss) on investments | | | | (8.19) | 8.32 | 6.19 |
Total from Investment Operations | | | | (8.11) | 8.24 | 6.12 |
Distributions: | | | | | | |
Dividends from net realized
gain on investments | | | | (6.79) | (4.56) | (.14) |
Net asset value, end of period | | | | 25.38 | 40.28 | 36.60 |
Total Return (%) | | | | (19.31) | 23.78 | 20.02c |
Ratios/Supplemental Data (%): | | | | | | |
Ratio of total expenses
to average net assets | | | | .93 | .87 | .95d |
Ratio of net expenses
to average net assets | | | | .93 | .87 | .95d |
Ratio of net investment income
(loss) to average net assets | | | | .26 | (.20) | (.23)d |
Portfolio Turnover Rate | | | | 83.97 | 74.02 | 84.96 |
Net Assets, end of period ($ x 1,000) | | | | 28,586 | 72,845 | 53,194 |
a From September 30, 2016 (commencement of initial offering) to August 31, 2017.
b Based on average shares outstanding.
c Not annualized.
d Annualized.
See notes to financial statements.
19
FINANCIAL HIGHLIGHTS (continued)
| | | | | | | | | | |
| | | | |
| | | |
Class Y Shares | | | | Year Ended August 31, |
| | | | 2019 | 2018 | 2017a |
Per Share Data ($): | | | | | | |
Net asset value, beginning of period | | | | 40.32 | 36.60 | 30.62 |
Investment Operations: | | | | | | |
Investment income (loss)—netb | | | | .11 | (.04) | (.01) |
Net realized and unrealized gain
(loss) on investments | | | | (8.20) | 8.32 | 6.13 |
Total from Investment Operations | | | | (8.09) | 8.28 | 6.12 |
Distributions: | | | | | | |
Dividends from net realized
gain on investments | | | | (6.79) | (4.56) | (.14) |
Net asset value, end of period | | | | 25.44 | 40.32 | 36.60 |
Total Return (%) | | | | (19.23) | 23.90 | 20.02c |
Ratios/Supplemental Data (%): | | | | | | |
Ratio of total expenses
to average net assets | | | | .81 | .79 | .81d |
Ratio of net expenses
to average net assets | | | | .81 | .79 | .81d |
Ratio of net investment income
(loss) to average net assets | | | | .38 | (.12) | (.03)d |
Portfolio Turnover Rate | | | | 83.97 | 74.02 | 84.96 |
Net Assets, end of period ($ x 1,000) | | | | 209,291 | 585,686 | 467,673 |
a From September 30, 2016 (commencement of initial offering) to August 31, 2017.
b Based on average shares outstanding.
c Not annualized.
d Annualized.
See notes to financial statements.
20
NOTES TO FINANCIAL STATEMENTS
NOTE 1—Significant Accounting Policies:
BNY Mellon Opportunistic Small Cap Fund (the “fund”) is a separate diversified series of BNY Mellon Advantage Funds, Inc. (the “Company”), which is registered under the Investment Company Act of 1940, as amended (the “Act”), as an open-end management investment company and operates as a series company currently offering nine series, including the fund. The fund’s investment objective is to seek capital appreciation. BNY Mellon Investment Adviser, Inc. (the “Adviser”), a wholly-owned subsidiary of The Bank of New York Mellon Corporation (“BNY Mellon”), serves as the fund’s investment adviser. Effective April 15, 2019, the fund was reopened to new investors.
Effective June 3, 2019, the fund changed its name from Dreyfus Opportunistic Small Cap Fund to BNY Mellon Opportunistic Small Cap Fund and the Company changed its name from Advantage Funds, Inc. to BNY Mellon Advantage Funds, Inc. In addition, The Dreyfus Corporation, the fund’s investment adviser, changed its name to “BNY Mellon Investment Adviser, Inc.”, MBSC Securities Corporation, the fund’s distributor, changed its name to “BNY Mellon Securities Corporation” and Dreyfus Transfer, Inc., the fund’s transfer agent, changed its name to “BNY Mellon Transfer, Inc.”
BNY Mellon Securities Corporation (the “Distributor”), a wholly-owned subsidiary of the Adviser, is the distributor of the fund’s shares, which are sold without a sales charge. The fund is authorized to issue 400 million shares of $.001 par value Common Stock. The fund currently has authorized three classes of shares: Investor (200 million shares authorized), Class I (100 million shares authorized) and Class Y shares (100 million shares authorized). Investor shares are sold primarily to retail investors through financial intermediaries and bear Shareholder Services Plan fees. Class I and Y shares are sold at net asset value per share generally to institutional investors. Other differences between the classes include the services offered to and the expenses borne by each class, the allocation of certain transfer agency costs, and certain voting rights. Income, expenses (other than expenses attributable to a specific class), and realized and unrealized gains or losses on investments are allocated to each class of shares based on its relative net assets.
The Company accounts separately for the assets, liabilities and operations of each series. Expenses directly attributable to each series are charged to that series’ operations; expenses which are applicable to all series are allocated among them on a pro rata basis.
21
NOTES TO FINANCIAL STATEMENTS(continued)
The Financial Accounting Standards Board (“FASB”) Accounting Standards Codification (“ASC”) is the exclusive reference of authoritative U.S. generally accepted accounting principles (“GAAP”) recognized by the FASB to be applied by nongovernmental entities. Rules and interpretive releases of the Securities and Exchange Commission (“SEC”) under authority of federal laws are also sources of authoritative GAAP for SEC registrants. The fund is an investment company and applies the accounting and reporting guidance of the FASB ASC Topic 946 Financial Services-Investment Companies. The fund’s financial statements are prepared in accordance with GAAP, which may require the use of management estimates and assumptions. Actual results could differ from those estimates.
The Companyenters into contracts that contain a variety of indemnifications. The fund’s maximum exposure under these arrangements is unknown. The fund does not anticipate recognizing any loss related to these arrangements.
(a) Portfolio valuation: The fair value of a financial instrument is the amount that would be received to sell an asset or paid to transfer a liability in an orderly transaction between market participants at the measurement date (i.e., the exit price). GAAP establishes a fair value hierarchy that prioritizes the inputs of valuation techniques used to measure fair value. This hierarchy gives the highest priority to unadjusted quoted prices in active markets for identical assets or liabilities (Level 1 measurements) and the lowest priority to unobservable inputs (Level 3 measurements).
Additionally, GAAP provides guidance on determining whether the volume and activity in a market has decreased significantly and whether such a decrease in activity results in transactions that are not orderly. GAAP requires enhanced disclosures around valuation inputs and techniques used during annual and interim periods.
Various inputs are used in determining the value of the fund’s investments relating to fair value measurements. These inputs are summarized in the three broad levels listed below:
Level 1—unadjusted quoted prices in active markets for identical investments.
Level 2—other significant observable inputs (including quoted prices for similar investments, interest rates, prepayment speeds, credit risk, etc.).
Level 3—significant unobservable inputs (including the fund’s own assumptions in determining the fair value of investments).
22
The inputs or methodology used for valuing securities are not necessarily an indication of the risk associated with investing in those securities.
Changes in valuation techniques may result in transfers in or out of an assigned level within the disclosure hierarchy. Valuation techniques used to value the fund’s investments are as follows:
Investments in securities are valued at the last sales price on the securities exchange or national securities market on which such securities are primarily traded. Securities listed on the National Market System for which market quotations are available are valued at the official closing price or, if there is no official closing price that day, at the last sales price. For open short positions, asked prices are used for valuation purposes. Bid price is used when no asked price is available. Registered investment companies that are not traded on an exchange are valued at their net asset value. All of the preceding securities are generally categorized within Level 1 of the fair value hierarchy.
Securities not listed on an exchange or the national securities market, or securities for which there were no transactions, are valued at the average of the most recent bid and asked prices. These securities are generally categorized within Level 2 of the fair value hierarchy.
Fair valuing of securities may be determined with the assistance of a pricing service using calculations based on indices of domestic securities and other appropriate indicators, such as prices of relevant ADRs and futures. Utilizing these techniques may result in transfers between Level 1 and Level 2 of the fair value hierarchy.
When market quotations or official closing prices are not readily available, or are determined not to accurately reflect fair value, such as when the value of a security has been significantly affected by events after the close of the exchange or market on which the security is principally traded (for example, a foreign exchange or market), but before the fund calculates its net asset value, the fund may value these investments at fair value as determined in accordance with the procedures approved by the Company’s Board of Directors (the “Board”). Certain factors may be considered when fair valuing investments such as: fundamental analytical data, the nature and duration of restrictions on disposition, an evaluation of the forces that influence the market in which the securities are purchased and sold, and public trading in similar securities of the issuer or comparable issuers. These securities are either categorized within Level 2 or 3 of the fair value hierarchy depending on the relevant inputs used.
23
NOTES TO FINANCIAL STATEMENTS(continued)
For restricted securities where observable inputs are limited, assumptions about market activity and risk are used and such securities are generally categorized within Level 3 of the fair value hierarchy.
The following is a summary of the inputs used as of August 31, 2019in valuing the fund’s investments:
| | | | | |
| | Level 1 - Unadjusted Quoted Prices | Level 2 - Other Significant Observable Inputs | Level 3 -Significant Unobservable Inputs | Total |
Assets ($) | | | | |
Investments in Securities:† | | |
Equity Securities- Common Stocks | 510,897,452 | - | - | 510,897,452 |
Exchange-Traded Funds | 8,856,129 | - | - | 8,856,129 |
Investment Companies | 40,901,779 | - | - | 40,901,779 |
Warrants | 145,664 | - | - | 145,664 |
† See Statement of Investments for additional detailed categorizations, if any.
(b)Securities transactions and investment income: Securities transactions are recorded on a trade date basis. Realized gains and losses from securities transactions are recorded on the identified cost basis. Dividend income is recognized on the ex-dividend date and interest income, including, where applicable, accretion of discount and amortization of premium on investments, is recognized on the accrual basis.
Pursuant to a securities lending agreement with The Bank of New York Mellon, a subsidiary of BNY Mellon and an affiliate of the Adviser, the fund may lend securities to qualified institutions. It is the fund’s policy that, at origination, all loans are secured by collateral of at least 102% of the value of U.S. securities loaned and 105% of the value of foreign securities loaned. Collateral equivalent to at least 100% of the market value of securities on loan is maintained at all times. Collateral is either in the form of cash, which can be invested in certain money market mutual funds managed by the Adviser, or U.S. Government and Agency securities. The fund is entitled to receive all dividends, interest and distributions on securities loaned, in addition to income earned as a result of the lending transaction. Should a borrower fail to return the securities in a timely manner, The Bank of New York Mellon is required to replace the securities for the benefit of the fund or credit the fund with the market value of the unreturned securities and is subrogated to the fund’s rights against the borrower and the collateral. Additionally, the contractual
24
maturity of security lending transactions are on an overnight and continuous basis. During the period ended August 31, 2019, The Bank of New York Mellon earned $47,745 from lending portfolio securities, pursuant to the securities lending agreement.
(c) Affiliated issuers: Investments in other investment companies advised by the Adviser are considered “affiliated” under the Act.
(d) Dividends and distributions to shareholders: Dividends and distributions are recorded on the ex-dividend date. Dividends from investment income-net and dividends from net realized capital gains, if any, are normally declared and paid annually, but the fund may make distributions on a more frequent basis to comply with the distribution requirements of the Internal Revenue Code of 1986, as amended (the “Code”). To the extent that net realized capital gains can be offset by capital loss carryovers, it is the policy of the fund not to distribute such gains. Income and capital gain distributions are determined in accordance with income tax regulations, which may differ from GAAP.
(e) Federal income taxes: It is the policy of the fund to continue to qualify as a regulated investment company, if such qualification is in the best interests of its shareholders, by complying with the applicable provisions of the Code, and to make distributions of taxable income and net realized capital gain sufficient to relieve it from substantially all federal income and excise taxes.
As of and during the period ended August 31, 2019, the fund did not have any liabilities for any uncertain tax positions. The fund recognizes interest and penalties, if any, related to uncertain tax positions as income tax expense in the Statement of Operations. During the period ended August 31, 2019, the fund did not incur any interest or penalties.
Each tax year in the four-year period ended August 31, 2019 remains subject to examination by the Internal Revenue Service and state taxing authorities.
At August 31, 2019, the components of accumulated earnings on a tax basis were as follows: undistributed ordinary income $1,869,421 and unrealized depreciation $10,803,383. In addition, the fund had $41,680,975 of capital losses realized after October 31, 2018, which were deferred for tax purposes to the first day of the following fiscal year.
The tax character of distributions paid to shareholders during the fiscal periods ended August 31, 2019 and August 31, 2018 were as follows: ordinary income $40,691,332 and $13,576,887, and long-term capital gains $138,006,970 and $110,610,728, respectively.
25
NOTES TO FINANCIAL STATEMENTS(continued)
During the period ended August 31, 2019, as a result of permanent book to tax differences, primarily due to the tax treatment for treating a portion of the proceeds from redemptions as a distribution for tax purposes, the fund decreased total distributable earnings (loss) by $11,698,190 and increased paid-in capital by the same amount. Net assets and net asset value per share were not affected by this reclassification.
(f) New Accounting Pronouncements: Effective June 1, 2019, the fund adopted Accounting Standards Update 2018-13, Fair Value Measurement (Topic 820): Disclosure Framework—Changes to the Disclosure Requirements for Fair Value Measurement (“ASU 2018-13”). The update provides guidance that eliminates, adds and modifies certain disclosure requirements for fair value measurements. The adoption of ASU 2018-13 had no impact on the operations of the fund for the period ended August 31, 2019.
NOTE 2—Bank Lines of Credit:
The fund participates with other long-term open-end funds managed by the Adviser in a $1.030 billion unsecured credit facility led by Citibank, N.A. (the “Citibank Credit Facility”) and a $300 million unsecured credit facility provided by The Bank of New York Mellon (the “BNYM Credit Facility”), each to be utilized primarily for temporary or emergency purposes, including the financing of redemptions (each, a “Facility”). The Citibank Credit Facility is available in two tranches: (i) Tranche A is in an amount equal to $830 million and is available to all long-term open-ended funds, including the fund, and (ii) Tranche B is in amount equal to $200 million and is available only to BNY Mellon Floating Rate Income Fund, a series of BNY Mellon Investment Funds IV, Inc. Prior to October 3, 2018, the unsecured credit facility with Citibank, N.A. was $830 million. In connection therewith, the fund has agreed to pay its pro rata portion of commitment fees for Tranche A of the Citibank Credit Facility and the BNYM Credit Facility. Interest is charged to the fund based on rates determined pursuant to the terms of the respective Facility at the time of borrowing.
The average amount of borrowings outstanding under the Facilities during the period ended August 31, 2019 was approximately $1,334,500 with a related weighted average annualized interest rate of 3.32%.
NOTE 3—Management Fee and Other Transactions with Affiliates:
(a)Pursuant to a management agreement with the Adviser, the management fee is computed at the annual rate of .75% of the value of the fund’s average daily net assets and is payable monthly.
26
(b)Under the Shareholder Services Plan, Investor shares pay the Distributor at an annual rate of .25% of the value of its average daily net assets for the provision of certain services. The services provided may include personal services relating to shareholder accounts, such as answering shareholder inquiries regarding the fund and providing reports and other information, and services related to the maintenance of shareholder accounts, such as recordkeeping and sub-accounting services. The Distributor may make payments to Service Agents (securities dealers, financial institutions or other industry professionals) with respect to these services. The Distributor determines the amounts to be paid to Service Agents. During the period ended August 31, 2019,the fund was charged $1,031,377 pursuant to the Shareholder Services Plan.
The fund has an arrangement with the transfer agent whereby the fund may receive earnings credits when positive cash balances are maintained, which are used to offset transfer agency fees. The fund had an arrangement with the custodian to receive earnings credits when positive cash balances were maintained, which were used to offset custody fees. Effective February 1, 2019, the arrangement with the custodian changed whereby the fund will no longer receive earnings credits to offset its custody fees and will receive interest income or overdraft fees going forward. For financial reporting purposes, the fund includes net earnings credits, if any, as an expense offset in the Statement of Operations.
The fund compensates BNY Mellon Transfer, Inc., a wholly-owned subsidiary of the Adviser, under a transfer agency agreement for providing transfer agency and cash management services for the fund. The majority of transfer agency fees are comprised of amounts paid on a per account basis, while cash management fees are related to fund subscriptions and redemptions. During the period ended August 31, 2019, the fund was charged $80,279 for transfer agency services. These fees are included in Shareholder servicing costs in the Statement of Operations.
The fund compensates The Bank of New York Mellon under a custody agreement for providing custodial services for the fund. These fees are determined based on net assets, geographic region and transaction activity. During the period ended August 31, 2019, the fund was charged $70,463 pursuant to the custody agreement.
During the period ended August 31, 2019, the fund was charged $11,539 for services performed by the Chief Compliance Officer and his staff. These fees are included in Miscellaneous in the Statement of Operations.
The components of “Due to BNY Mellon Investment Adviser, Inc. and affiliates” in the Statement of Assets and Liabilities consist of: management
27
NOTES TO FINANCIAL STATEMENTS(continued)
fees $335,599, Shareholder Services Plan fees $61,072, custodian fees $9,700, Chief Compliance Officer fees $2,252 and transfer agency fees $19,980.
(c) Each Board member also serves as a Board member of other funds in the BNY Mellon Family of Funds complex. Annual retainer fees and attendance fees are allocated to each fund based on net assets.
NOTE 4—Securities Transactions:
The aggregate amount of purchases and sales of investment securities, excluding short-term securities, during the period ended August 31, 2019, amounted to $652,625,051 and $1,135,053,534, respectively.
At August 31, 2019, the cost of investments for federal income tax purposes was $571,604,407; accordingly, accumulated net unrealized depreciation on investments was $10,803,383, consisting of $64,284,763 gross unrealized appreciation and $75,088,146 gross unrealized depreciation.
28
REPORT OF INDEPENDENT REGISTERED PUBLIC ACCOUNTING FIRM
To the Shareholders and the Board of Directors of BNY Mellon Opportunistic Small Cap Fund (formerly, Dreyfus Opportunistic Small Cap Fund)
Opinion on the Financial Statements
We have audited the accompanying statement of assets and liabilities of BNY Mellon Opportunistic Small Cap Fund (the “Fund”) (formerly, Dreyfus Opportunistic Small Cap Fund) (one of the funds constituting BNY Mellon Advantage Funds, Inc.), including the statements of investments and investments in affiliated issuers, as of August 31, 2019, and the related statement of operations for the year then ended, the statement of changes in net assets for each of the two years in the period then ended, the financial highlights for each of the five years in the period then ended and the related notes (collectively referred to as the “financial statements”). In our opinion, the financial statements present fairly, in all material respects, the financial position of the Fund (one of the funds constituting BNY Mellon Advantage Funds, Inc.) at August 31, 2019, the results of its operations for the year then ended, the changes in its net assets for each of the two years in the period then ended and its financial highlights for each of the five years in the period then ended, in conformity with U.S. generally accepted accounting principles.
Basis for Opinion
These financial statements are the responsibility of the Fund’s management. Our responsibility is to express an opinion on the Fund’s financial statements based on our audits. We are a public accounting firm registered with the Public Company Accounting Oversight Board (United States) (“PCAOB”) and are required to be independent with respect to the Fund in accordance with the U.S. federal securities laws and the applicable rules and regulations of the Securities and Exchange Commission and the PCAOB.
We conducted our audits in accordance with the standards of the PCAOB. Those standards require that we plan and perform the audit to obtain reasonable assurance about whether the financial statements are free of material misstatement, whether due to error or fraud. The Fund is not required to have, nor were we engaged to perform, an audit of the Fund’s internal control over financial reporting. As part of our audits, we are required to obtain an understanding of internal control over financial reporting, but not for the purpose of expressing an opinion on the effectiveness of the Fund’s internal control over financial reporting. Accordingly, we express no such opinion.
Our audits included performing procedures to assess the risks of material misstatement of the financial statements, whether due to error or fraud, and performing procedures that respond to those risks. Such procedures included examining, on a test basis, evidence regarding the amounts and disclosures in the financial statements. Our procedures included confirmation of securities owned as of August 31, 2019, by correspondence with the custodian and others or by other appropriate auditing procedures where replies from others were not received. Our audits also included evaluating the accounting principles used and significant estimates made by management, as well as evaluating the overall presentation of the financial statements. We believe that our audits provide a reasonable basis for our opinion.

We have served as the auditor of one or more investment companies in the BNY Mellon Family of Funds since at least 1957, but we are unable to determine the specific year.
New York, New York
October 24, 2019
29
IMPORTANT TAX INFORMATION(Unaudited)
For federal tax purposes, the fund hereby reports 22.33% of the ordinary dividends paid during the fiscal year ended August 31, 2019 as qualifying for the corporate dividends received deduction. Also, certain dividends paid by the fund may be subject to a maximum tax rate of 15%, as provided for by the Jobs and Growth Tax Relief Reconciliation Act of 2003. Of the distributions paid during the fiscal year, $9,069,329 represents the maximum amount that may be considered qualified dividend income. The fund also hereby reports $1.5453 per share as a short-term capital gain distribution and $5.2419 per share as a long-term capital gain distribution paid on December 14, 2018. Shareholders will receive notification in early 2020 of the percentage applicable to the preparation of their 2019 income tax returns.
30
INFORMATION ABOUT THE RENEWAL OF THE FUND’S MANAGEMENT AGREEMENT (Unaudited)
At a meeting of the fund’s Board of Directors held on March 12-13, 2019, the Board considered the renewal of the fund’s Management Agreement pursuant to which the Adviser provides the fund with investment advisory and administrative services (the “Agreement”). The Board members, none of whom are “interested persons” (as defined in the Investment Company Act of 1940, as amended) of the fund, were assisted in their review by independent legal counsel and met with counsel in executive session separate from representatives of the Adviser. In considering the renewal of the Agreement, the Board considered all factors that it believed to be relevant, including those discussed below. The Board did not identify any one factor as dispositive, and each Board member may have attributed different weights to the factors considered.
Analysis of Nature, Extent, and Quality of Services Provided to the Fund. The Board considered information provided to it at the meeting and in previous presentations from representatives of the Adviser regarding the nature, extent, and quality of the services provided to funds in the BNY Mellon fund complex. The Adviser provided the number of open accounts in the fund, the fund’s asset size and the allocation of fund assets among distribution channels. The Adviser also had previously provided information regarding the diverse intermediary relationships and distribution channels of funds in the BNY Mellon fund complex (such as retail direct or intermediary, in which intermediaries typically are paid by the fund and/or the Adviser) and the Adviser’s corresponding need for broad, deep, and diverse resources to be able to provide ongoing shareholder services to each intermediary or distribution channel, as applicable to the fund.
The Board also considered research support available to, and portfolio management capabilities of, the fund’s portfolio management personnel and that the Adviser also provides oversight of day-to-day fund operations, including fund accounting and administration and assistance in meeting legal and regulatory requirements. The Board also considered the Adviser’s extensive administrative, accounting and compliance infrastructures. The Board also considered portfolio management’s brokerage policies and practices (including policies and practices regarding soft dollars) and the standards applied in seeking best execution.
Comparative Analysis of the Fund’s Performance and Management Fee and Expense Ratio. The Board reviewed reports prepared by Broadridge Financial Solutions, Inc. (“Broadridge”), an independent provider of investment company data, which included information comparing (1) the fund’s performance with the performance of a group of comparable funds (the “Performance Group”) and with a broader group of funds (the “Performance Universe”), all for various periods ended January 31, 2019, and (2) the fund’s actual and contractual management fees and total expenses with those of a group of comparable funds (the “Expense Group”) and with a broader group of funds (the “Expense Universe”), the information for which was derived in part from fund financial statements available to Broadridge as of the date of its analysis. The Adviser previously had furnished the Board with a description of the methodology Broadridge used to
31
INFORMATION ABOUT THE RENEWAL OF THE FUND’S MANAGEMENT AGREEMENT (Unaudited) (continued)
select the Performance Group and Performance Universe and the Expense Group and Expense Universe.
Representatives of the Adviser stated that the usefulness of performance comparisons may be affected by a number of factors, including different investment limitations and policies that may be applicable to the fund and comparison funds. The Board discussed with representatives of the Adviser and/or its affiliates the results of the comparisons and considered that the fund’s total return performance was below the Performance Group and Performance Universe medians for all periods, except the three- and four-year periods when performance was above the Performance Group and Performance Universe medians and the ten-year period when performance was at the Performance Universe median. The Board considered the relative proximity of the fund’s performance to the Performance Group and/or Performance Universe median in certain periods when performance was below median. The Adviser also provided a comparison of the fund’s calendar year total returns to the returns of the fund’s benchmark index, and it was considered that the fund’s returns were above the returns of the index in five of the ten calendar years shown.
The Board also reviewed the range of actual and contractual management fees and total expenses of the Expense Group and Expense Universe funds and discussed the results of the comparisons. The Board considered that the fund’s contractual management fee was below the Expense Group median, the fund’s actual management fee was at the Expense Group median and below the Expense Universe median and the fund’s total expenses were slightly above the Expense Group median and below the Expense Universe median.
Representatives of the Adviser reviewed with the Board the management or investment advisory fees (1) paid by funds advised or administered by the Adviser that are in the same Lipper category as the fund and (2) paid to the Adviser, or the primary employer of the fund’s primary portfolio manager(s) that is affiliated with the Adviser, for advising any separate accounts and/or other types of client portfolios that are considered to have similar investment strategies and policies as the fund (the “Similar Clients”), and explained the nature of the Similar Clients. They discussed differences in fees paid and the relationship of the fees paid in light of any differences in the services provided and other relevant factors. The Board considered the relevance of the fee information provided for the Similar Clients to evaluate the appropriateness of the fund’s management fee.
Analysis of Profitability and Economies of Scale. Representatives of the Adviser reviewed the expenses allocated and profit received by the Adviser and its affiliates and the resulting profitability percentage for managing the fund and the aggregate profitability percentage to the Adviser and its affiliates for managing the funds in the BNY Mellon fund complex, and the method used to determine the expenses and profit. The Board concluded that the profitability results were not unreasonable, given the services rendered and service levels provided by the Adviser. The Board also had been provided with information prepared by an independent consulting firm regarding the Adviser’s approach to allocating costs to, and determining the profitability of, individual
32
funds and the entire BNY Mellon fund complex. The consulting firm also had analyzed where any economies of scale might emerge in connection with the management of a fund.
The Board considered, on the advice of its counsel, the profitability analysis (1) as part of its evaluation of whether the fees under the Agreement, considered in relation to the mix of services provided by the Adviser, including the nature, extent and quality of such services, supported the renewal of the Agreement and (2) in light of the relevant circumstances for the fund and the extent to which economies of scale would be realized if the fund grows and whether fee levels reflect these economies of scale for the benefit of fund shareholders. Representatives of the Adviser stated that a discussion of economies of scale is predicated on a fund having achieved a substantial size with increasing assets and that, if a fund’s assets had been stable or decreasing, the possibility that the Adviser may have realized any economies of scale would be less. Representatives of the Adviser also stated that, as a result of shared and allocated costs among funds in the BNY Mellon fund complex, the extent of economies of scale could depend substantially on the level of assets in the complex as a whole, so that increases and decreases in complex-wide assets can affect potential economies of scale in a manner that is disproportionate to, or even in the opposite direction from, changes in the fund’s asset level. The Board also considered potential benefits to the Adviser from acting as investment adviser and took into consideration the soft dollar arrangements in effect for trading the fund’s investments.
At the conclusion of these discussions, the Board agreed that it had been furnished with sufficient information to make an informed business decision with respect to the renewal of the Agreement. Based on the discussions and considerations as described above, the Board concluded and determined as follows.
· The Board concluded that the nature, extent and quality of the services provided by the Adviser are adequate and appropriate.
· The Board noted the fund’s variable performance over the various periods, including declining relative performance in the two most recent years, and agreed to closely monitor performance.
· The Board concluded that the fee paid to the Adviser continued to be appropriate under the circumstances and in light of the factors and the totality of the services provided as discussed above.
· The Board determined that the economies of scale which may accrue to the Adviser and its affiliates in connection with the management of the fund had been adequately considered by the Adviser in connection with the fee rate charged to the fund pursuant to the Agreement and that, to the extent in the future it were determined that material economies of scale had not been shared with the fund, the Board would seek to have those economies of scale shared with the fund.
33
INFORMATION ABOUT THE RENEWAL OF THE FUND’S MANAGEMENT AGREEMENT (Unaudited) (continued)
In evaluating the Agreement, the Board considered these conclusions and determinations and also relied on its previous knowledge, gained through meetings and other interactions with the Adviser and its affiliates, of the Adviser and the services provided to the fund by the Adviser. The Board also relied on information received on a routine and regular basis throughout the year relating to the operations of the fund and the investment management and other services provided under the Agreement, including information on the investment performance of the fund in comparison to similar mutual funds and benchmark performance indices; general market outlook as applicable to the fund; and compliance reports. In addition, the Board’s consideration of the contractual fee arrangements for this fund had the benefit of a number of years of reviews of the Agreement for the fund, or substantially similar agreements for other BNY Mellon funds that the Board oversees, during which lengthy discussions took place between the Board and representatives of the Adviser. Certain aspects of the arrangements may receive greater scrutiny in some years than in others, and the Board’s conclusions may be based, in part, on their consideration of the fund’s arrangements, or substantially similar arrangements for other BNY Mellon funds that the Board oversees, in prior years. The Board determined to renew the Agreement.
34
BOARD MEMBERS INFORMATION(Unaudited)
INDEPENDENT BOARD MEMBERS
Joseph S. DiMartino (75)
Chairman of the Board (1995)
Principal Occupation During Past 5 Years:
· Corporate Director and Trustee (1995-present)
Other Public Company Board Memberships During Past 5 Years:
· CBIZ (formerly, Century Business Services, Inc.), a provider of outsourcing functions for small and medium size companies, Director (1997-present)
No. of Portfolios for which Board Member Serves:120
———————
Peggy C. Davis (76)
Board Member (2006)
Principal Occupation During Past 5 Years:
· Shad Professor of Law, New York University School of Law (1983-present)
No. of Portfolios for which Board Member Serves: 44
———————
David P. Feldman (79)
Board Member (1996)
Principal Occupation During Past 5 Years:
· Corporate Director and Trustee (1985-present)
Other Public Company Board Memberships During Past 5 Years:
· BBH Mutual Funds Group (5 registered mutual funds), Director (1992-2014)
No. of Portfolios for which Board Member Serves:30
———————
35
BOARD MEMBERS INFORMATION (Unaudited) (continued)
INDEPENDENT BOARD MEMBERS (continued)
Gina D. France (61)
Board Member (2019)
Principal Occupation During Past 5 Years:
· Founder, President and Chief Executive Officer, France Strategic Partners, a strategy and advisory firm serving corporate clients across the United States (2003 –present)
· Corporate Director and Trustee (2004 – current)
Other Public Company Board Memberships During Past 5 Years:
· Huntington Bancshares, a bank holding company headquartered in Columbus, Ohio, Director (2016 – present)
· Cedar Fair, L.P., a publicly-traded partnership that owns and operates amusement parks and hotels in the U.S. and Canada, Director (2011 – present)
· CBIZ (formerly, Century Business Services, Inc.), a provider of outsourcing functions for small and medium size companies, Director (2015 – present)
· FirstMerit Corporation, a diversified financial services company, Director (2004 – 2016)
No. of Portfolios for which Board Member Serves:30
———————
Joan Gulley (72)
Board Member (2017)
Principal Occupation During Past 5 Years:
· PNC Financial Services Group, Inc.(1993-2014), Executive Vice President and Chief Human Resources Officer and Executive Committee Member (2008-2014)
No. of Portfolios for which Board Member Serves:50
———————
Ehud Houminer (79)
Board Member (1993)
Principal Occupation During Past 5 Years:
· Board of Overseers at the Columbia Business School, Columbia University (1992-present)
· Trustee, Ben Gurion University
No. of Portfolios for which Board Member Serves: 50
———————
Lynn Martin (79)
Board Member (2012)
Principal Occupation During Past 5 Years:
· President of The Martin Hall Group LLC, a human resources consulting firm (2005-2012)
No. of Portfolios for which Board Member Serves:30
———————
36
Robin A. Melvin (56)
Board Member (2012)
Principal Occupation During Past 5 Years:
· Co-chairman, Illinois Mentoring Partnership, non-profit organization dedicated to increasing the quantity and quality of mentoring services in Illinois; (2014-present; board member since 2013)
No. of Portfolios for which Board Member Serves:97
———————
Once elected all Board Members serve for an indefinite term, but achieve Emeritus status upon reaching age 80. The address of the Board Members and Officers is c/o BNY Mellon Investment Adviser, Inc. 240 Greenwich Street, New York, New York 10166. Additional information about the Board Members is available in the fund’s Statement of Additional Information which can be obtained from the Adviser free of charge by calling this toll free number: 1-800-373-9387.
James F. Henry, Emeritus Board Member
Dr. Martin Peretz, Emeritus Board Member
Philip L. Toia, Emeritus Board Member
37
OFFICERS OF THE FUND(Unaudited)
RENEE LAROCHE-MORRIS, President since May 2019.
President and a director of BNY Mellon Investment Adviser, Inc. since January 2018. She is an officer of 63 investment companies (comprised of 120 portfolios) managed by the Adviser. She is 48 years old and has been an employee of BNY Mellon since 2003.
JAMES WINDELS, Treasurer since November 2001.
Director- BNY Mellon Fund Administration, and an officer of 64 investment companies (comprised of 143 portfolios) managed by the Adviser. He is 61 years old and has been an employee of the Adviser since April 1985.
BENNETT A. MACDOUGALL, Chief Legal Officer since October 2015.
Chief Legal Officer of the Adviser and Associate General Counsel and Managing Director of BNY Mellon since June 2015; Director and Associate General Counsel of Deutsche Bank – Asset & Wealth Management Division from June 2005 to June 2015, and as Chief Legal Officer of Deutsche Investment Management Americas Inc. from June 2012 to May 2015. He is an officer of 64 investment companies (comprised of 143 portfolios) managed by the Adviser. He is 48 years old and has been an employee of the Adviser since June 2015.
DAVID DIPETRILLO, Vice President since January 2018.
Head of North America Product, BNY Mellon Investment Management since January 2018, Director of Product Strategy, BNY Mellon Investment Management from January 2016 to December 2017; Head of US Retail Product and Channel Marketing, BNY Mellon Investment Management from January 2014 to December 2015. He is an officer of 63 investment companies (comprised of 120 portfolios) managed by the Adviser. He is 41 years old and has been an employee of BNY Mellon since 2005.
JAMES BITETTO, Vice President since August 2005 and Secretary since February 2018.
Managing Counsel of BNY Mellon and Secretary of the Adviser, and an officer of 64 investment companies (comprised of 143 portfolios) managed by the Adviser. He is 53 years old and has been an employee of the Adviser since December 1996.
SONALEE CROSS, Vice President and Assistant Secretary since March 2018.
Counsel of BNY Mellon since October 2016; Associate at Proskauer Rose LLP from April 2016 to September 2016; Attorney at EnTrust Capital from August 2015 to February 2016; Associate at Sidley Austin LLP from September 2013 to August 2015. She is an officer of 64 investment companies (comprised of 143 portfolios) managed by the Adviser. She is 31 years old and has been an employee of the Adviser since October 2016.
DEIRDRE CUNNANE, Vice President and Assistant Secretary since March 2019.
Counsel of BNY Mellon since August 2018; Senior Regulatory Specialist at BNY Mellon Investment Management Services from February 2016 to August 2018; Trustee Associate at BNY Mellon Trust Company (Ireland) Limited from August 2013 to February 2016. She is an officer of 64 investment companies (comprised of 143 portfolios) managed by the Adviser. She is 29 years old and has been an employee of the Adviser since August 2018.
SARAH S. KELLEHER, Vice President and Assistant Secretary since April 2014.
Managing Counsel of BNY Mellon since December 2017, Senior Counsel of BNY Mellon from March 2013 to December 2017. She is an officer of 64 investment companies (comprised of 143 portfolios) managed by the Adviser. She is 44 years old and has been an employee of the Adviser since March 2013.
JEFF PRUSNOFSKY, Vice President and Assistant Secretary since August 2005.
Senior Managing Counsel of BNY Mellon, and an officer of 64 investment companies (comprised of 143 portfolios) managed by the Adviser. He is 54 years old and has been an employee of the Adviser since October 1990.
PETER M. SULLIVAN, Vice President and Assistant Secretary since March 2019.
Managing Counsel of BNY Mellon, and an officer of 64 investment companies (comprised of 143 portfolios) managed by the Adviser. He is 51 years old and has been an employee of the Adviser since April 2004.
38
NATALYA ZELENSKY, Vice President and Assistant Secretary since March 2017.
Counsel of BNY Mellon since May 2016; Attorney at Wildermuth Endowment Strategy Fund/Wildermuth Advisory, LLC from November 2015 to May 2016 and Assistant General Counsel at RCS Advisory Services from July 2014 to November 2015. She is an officer of 64 investment companies (comprised of 143 portfolios) managed by the Adviser. She is 34 years old and has been an employee of the Adviser since May 2016.
GAVIN C. REILLY, Assistant Treasurer since December 2005.
Tax Manager - BNY Mellon Fund Administration, and an officer of 64 investment companies (comprised of 143 portfolios) managed by the Adviser. He is 51 years old and has been an employee of the Adviser since April 1991.
ROBERT S. ROBOL, Assistant Treasurer since August 2005.
Senior Accounting Manager- BNY Mellon Fund Administration, and an officer of 64 investment companies (comprised of 143 portfolios) managed by the Adviser. He is 55 years old and has been an employee of the Adviser since October 1988.
ROBERT SALVIOLO, Assistant Treasurer since July 2007.
Senior Accounting Manager – BNY Mellon Fund Administration, and an officer of 64 investment companies (comprised of 143 portfolios) managed by the Adviser. He is 52 years old and has been an employee of the Adviser since June 1989.
ROBERT SVAGNA, Assistant Treasurer since December 2002.
Senior Accounting Manager – BNY Mellon Fund Administration, and an officer of 64 investment companies (comprised of 143 portfolios) managed by the Adviser. He is 52 years old and has been an employee of the Adviser since November 1990.
JOSEPH W. CONNOLLY, Chief Compliance Officer since October 2004.
Chief Compliance Officer of the Adviser, the BNY Mellon Family of Funds and BNY Mellon Funds Trust (64 investment companies, comprised of 143 portfolios). He is 62 years old and has served in various capacities with the Adviser since 1980, including manager of the firm’s Fund Accounting Department from 1997 through October 2001.
CARIDAD M. CAROSELLA, Anti-Money Laundering Compliance Officer since January 2016.
Anti-Money Laundering Compliance Officer of the BNY Mellon Family of Funds and BNY Mellon Funds Trust since January 2016; from May 2015 to December 2015, Interim Anti-Money Laundering Compliance Officer of the BNY Mellon Family of Funds and BNY Mellon Funds Trust and the Distributor; from January 2012 to May 2015, AML Surveillance Officer of the Distributor. She is an officer of 57 investment companies (comprised of 136 portfolios) managed by the Adviser. She is 51 years old and has been an employee of the Distributor since 1997.
39
NOTES
40
NOTES
41
BNY Mellon Opportunistic Small Cap Fund
240 Greenwich Street
New York, NY 10286
Adviser
BNY Mellon Investment Adviser, Inc.
240 Greenwich Street
New York, NY 10286
Custodian
The Bank of New York Mellon
240 Greenwich Street
New York, NY 10286
Transfer Agent &
Dividend Disbursing Agent
BNY Mellon Transfer, Inc.
240 Greenwich Street
New York, NY 10286
Distributor
BNY Mellon Securities Corporation
240 Greenwich Street
New York, NY 10286
| | |
Ticker Symbols: | Investor: DSCVX Class I: DOPIX Class Y: DSCYX |
Telephone Call your financial representative or 1-800-373-9387
Mail The BNY Mellon Family of Funds, 144 Glenn Curtiss Boulevard, Uniondale, NY 11556-0144
E-mailSend your request toinfo@bnymellon.com
InternetInformation can be viewed online or downloaded atwww.bnymellonim.com/us
The fund files its complete schedule of portfolio holdings with the Securities and Exchange Commission (“SEC”) for the first and third quarters of each fiscal year on Form N-PORT. The fund’s Forms N-PORT are available on the SEC’s website atwww.sec.gov.
A description of the policies and procedures that the fund uses to determine how to vote proxies relating to portfolio securities and information regarding how the fund voted these proxies for the most recent 12-month period ended June 30 is available atwww.bnymellonim.com/us and on the SEC’s website atwww.sec.gov and without charge, upon request, by calling 1-800-373-9387.
| | |
© 2019 BNY Mellon Securities Corporation
0253AR0819 | 
|
BNY Mellon Structured Midcap Fund
| |
ANNUAL REPORT August 31, 2019 |
| |
Save time. Save paper. View your next shareholder report online as soon as it’s available. Log into www.bnymellonim.com/us and sign up for eCommunications. It’s simple and only takes a few minutes. |
| |
The views expressed in this report reflect those of the portfolio manager(s) only through the end of the period covered and do not necessarily represent the views of BNY Mellon Investment Adviser, Inc. or any other person in the BNY Mellon Investment Adviser, Inc. organization. Any such views are subject to change at any time based upon market or other conditions and BNY Mellon Investment Adviser, Inc. disclaims any responsibility to update such views. These views may not be relied on as investment advice and, because investment decisions for a fund in the BNY Mellon Family of Funds are based on numerous factors, may not be relied on as an indication of trading intent on behalf of any fund in the BNY Mellon Family of Funds. |
| |
Not FDIC-Insured • Not Bank-Guaranteed • May Lose Value |
Contents
THE FUND
FOR MORE INFORMATION
Back Cover
| | | | |
| |
BNY Mellon Structured Midcap Fund
| | The Fund |
A LETTER FROM THE PRESIDENT OF BNY MELLON INVESTMENT ADVISER, INC.
Dear Shareholder:
We are pleased to present this annual report for BNY Mellon Structured Midcap Fund (formerly, Dreyfus Structured Midcap Fund), covering the 12-month period from September 1, 2018 through August 31, 2019. For information about how the fund performed during the reporting period, as well as general market perspectives, we provide a Discussion of Fund Performance on the pages that follow.
After a strong summer, equity markets weakened in the fourth quarter of 2018, as concerns about rising interest rates, trade tensions and slowing global growth provided downward pressure on returns. In December 2018, stocks experienced a sharp sell-off, as it appeared that the U.S. Federal Reserve (the “Fed”) would maintain its hawkish stance on monetary policy. In January 2019, the Fed commented that it would slow the pace of interest-rate increases, which helped stimulate a rebound across equity markets that continued into the second quarter. Escalating trade tensions disrupted equity markets again in May. The dip was short-lived, as markets rose once again in June. However, despite continued supportive central bank policies, pockets of volatility persisted through the end of the period.
In fixed-income markets, returns were hampered early in the reporting period by rising interest rates and accelerating inflation. With the return of stock market volatility in October 2018, a flight to quality led to a rise in prices for U.S. Treasuries that continued through the end of the year, leading to a flattening yield curve. After the Fed’s supportive statements in January 2019, other developed market central banks followed suit and reiterated their abilities to bolster flagging growth by continuing supportive policies. This helped to further buoy fixed-income instrument prices. At the end of July, the Fed cut the federal funds rate by 25 basis points. Both the U.S. and Global Bloomberg Barclays Aggregate Bond indices produced strong returns for the 12 months.
We believe that over the near term, the outlook for the U.S. remains positive, but we will monitor relevant data for any signs of a change. As always, we encourage you to discuss the risks and opportunities in today’s investment environment with your financial advisor.
Thank you for your continued confidence and support.
Sincerely,

Renee LaRoche-Morris
President
BNY Mellon Investment Adviser, Inc.
September 16, 2019
2
DISCUSSION OF FUND PERFORMANCE(Unaudited)
For the period from September 1, 2018 through August 31, 2019, as provided by the fund’s primary portfolio managers, C. Wesley Boggs, William S. Cazalet, CAIA, Peter D. Goslin, CFA, and Syed A. Zamil, CFA, of BNY Mellon Investments Corporation, Sub-Investment Adviser
Market and Fund Performance Overview
For the 12-month period ended August 31, 2019, BNY Mellon Structured Midcap Fund’s (formerly Dreyfus Structured Midcap Fund) Class A shares produced a total return of -11.12%, Class C shares returned -11.76%, Class I shares returned -10.88% and Class Y shares returned -10.82%.1 In comparison, the fund’s benchmark, the S&P MidCap 400® Index (the “Index”), posted a total return of -6.43% for the same period.2
Mid-cap stocks lost ground over the reporting period, amid pockets of volatility fueled by investor concerns over U.S. Federal Reserve (the “Fed”) policy, slowing global growth and geopolitical uncertainty. The fund trailed the Index, mainly due to security selection shortfalls.
The Fund’s Investment Approach
The fund seeks long-term capital growth. To pursue its goal, the fund normally invests at least 80% of its net assets, plus any borrowings for investment purposes, in the stocks of companies included in the Index or the Russell Midcap® Index.
We select stocks through a “bottom-up,” structured approach that seeks to identify undervalued securities using a quantitative screening process. This process is driven by a proprietary quantitative model that measures a diverse set of characteristics of stocks to identify and rank stocks based on relative value, momentum/sentiment and earnings quality measures.
Next, we construct the portfolio through a risk-controlled process, focusing on stock selection as opposed to making proactive decisions as to industry and sector exposure. The fund seeks to maintain a portfolio that has exposure to industries and market capitalizations that are generally similar to those of the Index. Finally, within each sector and style subset, the fund will seek to overweight the most attractive stocks and underweight or not hold the stocks that have been ranked least attractive.
Markets pivot on central bank and trade activity
U.S. mid cap equities began the period under pressure from slowing global growth, escalating trade issues between U.S. and China, Brexit difficulties, and additional geopolitical issues elsewhere in Europe and the emerging markets. Renewed articulation of hawkish narratives by Fed officials alarmed investors and stoked volatility. In December, equities reached new lows for the year, as economic and political news continued to unnerve investors. Investors also feared the European Central Bank (ECB) would proceed with its plan to conclude stimulus measures in January, despite moderating growth rates.
January marked a turnaround in the markets. Talk of a potential trade deal between the U.S. and China helped fuel investor optimism, as equity prices recovered. The ECB
3
DISCUSSION OF FUND PERFORMANCE(Unaudited) (continued)
announced it would provide additional stimulus to support the eurozone economy. China also announced plans to stoke its slowing economic growth rate. At its first meeting of the year, the Fed emphasized its focus on data, as a primary driver for rate-hike decisions, and its ability to suspend additional rate increases when the data is not supportive. These sentiments reassured investors of central bankers’ commitments to support flagging growth. The rebound continued throughout the month of January, and equity markets maintained an upward trajectory through April. However, renewed trade tensions between the U.S. and China in May caused stocks to pull back once again. The dip was short-lived, as markets rose once again in June. At the end of July, the Fed cut the federal funds rate by 25 basis points.However, despite continued supportive central bank policies, pockets of volatility persisted through the end of the period and the market declined again during August.
In this environment, large-cap stocks generally outperformed their mid- and small-cap counterparts.
Security Selections Impact Fund Performance
Stock choices in the materials, communication services, consumer staples and financials sectors detracted from relative returns. In materials, the environment was generally challenging and the fund witnessed poor selection within the entire sector. Selection within the media industry weighed on the results in communication services. Within consumer staples, the largest detractor was Edgewell Personal Care, which saw its stock price fall after investors reacted negatively to an acquisition announcement. In the financials sector, Comerica also provided a headwind to results. The bank’s stock trended downward during the period after missing earnings and reporting quarterly results in July that were below consensus expectations. Within the energy sector, refining companiesPBF Energy andHollyFrontier were two of the largest individual detractors from returns during the 12 months. We have since exited both of these positions. In addition, Cabot Oil & Gas declined at the end of the period after the exploration and production company reduced production guidance. While the energy sector did not detract from the fund’s performance on a relative basis, the sector was the worst performing group during the period on an absolute basis.
Conversely, the fund’s relative performance was helped by successful security selection in the health care sector. Selection in the health care equipment and supplies industry was particularly beneficial. A position in pharmaceuticals company Zoetis was among the top contributors to the sector and overall portfolio results. The stock rose on the back of positive earnings announcements throughout the reporting period. Another top contributing sector was real estate, where selection within real estate investment trusts (REITs) also boosted performance. Other top contributor included apparel and shoe manufacturer Deckers Outdoor, which beat expectations and raised guidance during the period. Zebra Technologies, which designs and manufactures identification devices such as barcode scanners, also beat expectations and raised guidance during the period, increasing its stock price and benefiting portfolio returns. Software company Manhattan Associates was also among the top individual contributors.
4
Fund Outlook
In recent months, we have observed the portfolio’s exposure to Value to be higher than the level implied in our model. This has prompted much research and discussion amongst our investment teams, especially given the recent poor performance of Value in general. As a result, we have made some modest adjustments to the construction of the portfolio. We have reduced the exposure to Value more in line with model expectations and have increased its exposure to Behavioral / Momentum and Growth characteristics. In addition, we have marginally boosted diversification by holding slightly more names to lower idiosyncratic risk. We will continue to monitor all portfolio factor exposures versus model expectations and make further adjustments accordingly.
September 16, 2019
1 Total return includes reinvestment of dividends and any capital gains paid and does not take into consideration the maximum initial sales charge in the case of Class A shares or the applicable contingent deferred sales charge imposed on redemptions in the case of Class C shares. Past performance is no guarantee of future results. Share price, yield and investment return fluctuate such that upon redemption, fund shares may be worth more or less than their original cost. The fund’s returns reflect the absorption of certain fund expenses by the fund’s investment adviser, pursuant to an agreement in effect through December 31, 2019, at which time it may be extended, terminated, or modified. Had these expenses not been absorbed, the fund’s returns would have been lower.
2 Source: Lipper Inc. — The S&P MidCap 400® Index provides investors with a benchmark for midsized companies. The index measures the performance of midsized companies, reflecting the distinctive risk and return characteristics of this market segment. Investors cannot invest directly in any index.
Please note: the position in any security highlighted with italicized typeface was sold during the reporting period.
Equities are subject generally to market, market sector, market liquidity, issuer and investment style risks, among other factors, to varying degrees, all of which are more fully described in the fund’s prospectus.
Stocks of small- and/or mid-cap companies often experience sharper price fluctuations than stocks of large-cap companies.
5
FUND PERFORMANCE(Unaudited)

Comparison of change in value of a $10,000 investment in Class A shares, Class C shares, and Class I shares of BNY Mellon Structured Midcap Fund with a hypothetical investment of $10,000 in the S&P MidCap 400® Index (the “Index”)
† Source: Lipper Inc.
Past performance is not predictive of future performance.
The above graph compares a hypothetical $10,000 investment made in each of the Class A, Class C, and Class I shares of BNY Mellon Structured Midcap Fund on 8/31/09 to a hypothetical investment of $10,000 made in the Index on that date. All dividends and capital gain distributions are reinvested.
The fund’s performance shown in the line graph above takes into account the maximum initial sales charge on Class A shares and all other applicable fees and expenses on all classes. The Index provides investors with a benchmark for mid-sized companies. The index measures the performance of mid-sized companies, reflecting the distinctive risk and return characteristics of this market segment. Unlike a mutual fund, the Index is not subject to charges, fees and other expenses. Investors cannot invest directly in any index. Further information relating to fund performance, including expense reimbursements, if applicable, is contained in the Financial Highlights section of the prospectus and elsewhere in this report.
6
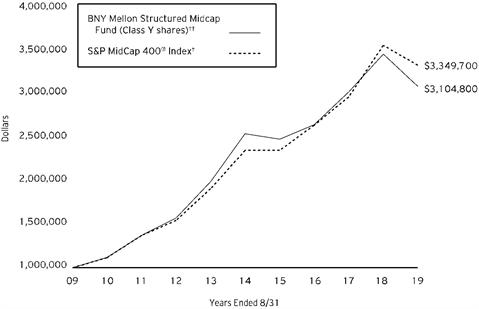
Comparison of change in value of a $1,000,000 investment in class Y shares of BNY Mellon Structured Midcap Fund with a hypothetical investment of $1,000,000 in the S&P MidCap 400® Index (the “Index”)
† Source: Lipper Inc.
†† The total return figures presented for Class Y shares of the fund reflect the performance of the fund’s Class A shares for the period prior to 7/1/13 (the inception date for Class Y shares), not reflecting the applicable sales charges for Class A shares.
Past performance is not predictive of future performance.
The above graph compares a hypothetical $1,000,000 investment made in Class Y shares of BNY Mellon Structured Midcap Fund on 8/31/09 to a hypothetical investment of $1,000,000 made in the Index on that date. All dividends and capital gain distributions are reinvested.
The fund’s performance shown in the line graph above takes into account the maximum initial sales charge on Class Y shares and all other applicable fees and expenses on all classes. The Index provides investors with a benchmark for mid-sized companies. The index measures the performance of mid-sized companies, reflecting the distinctive risk and return characteristics of this market segment. Unlike a mutual fund, the Index is not subject to charges, fees and other expenses. Investors cannot invest directly in any index. Further information relating to fund performance, including expense reimbursements, if applicable, is contained in the Financial Highlights section of the prospectus and elsewhere in this report.
7
FUND PERFORMANCE(Unaudited) (continued)
| | | | | |
Average Annual Total Returns as of 8/31/19 |
| | Inception
Date | 1 Year | 5 Years | 10 Years |
Class A shares | | | | |
with maximum sales charge (5.75%) | 6/29/01 | -16.22% | 2.36% | 10.91% |
without sales charge | 6/29/01 | -11.12% | 3.58% | 11.57% |
Class C shares | | | | |
with applicable redemption charge† | 6/29/01 | -12.52% | 2.83% | 10.77% |
without redemption | 6/29/01 | -11.76% | 2.83% | 10.77% |
Class I shares | 6/29/01 | -10.88% | 3.84% | 11.84% |
Class Y shares | 7/1/13 | -10.82% | 3.98% | 12.00%†† |
S & P MidCap 400® Index | | -6.43% | 7.22% | 12.85% |
† The maximum contingent deferred sales charge for Class C shares is 1% for shares redeemed within one year of the date of purchase.
†† The total return performance figures presented for Class Y shares of the fund reflect the performance of the fund’s Class A shares for the period prior to 7/1/13 (the inception date for Class Y shares), not reflecting the applicable sales charges for Class A shares.
The performance data quoted represents past performance, which is no guarantee of future results. Share price and investment return fluctuate and an investor’s shares may be worth more or less than original cost upon redemption. Current performance may be lower or higher than the performance quoted. Go to im.bnymellon.com for the fund’s most recent month-end returns.
The fund’s performance shown in the graphs and table does not reflect the deduction of taxes that a shareholder would pay on fund distributions or the redemption of fund shares. In addition to the performance of Class A shares shown with and without a maximum sales charge, the fund’s performance shown in the table takes into account all other applicable fees and expenses on all classes.
8
UNDERSTANDING YOUR FUND’S EXPENSES(Unaudited)
As a mutual fund investor, you pay ongoing expenses, such as management fees and other expenses. Using the information below, you can estimate how these expenses affect your investment and compare them with the expenses of other funds. You also may pay one-time transaction expenses, including sales charges (loads) and redemption fees, which are not shown in this section and would have resulted in higher total expenses. For more information, see your fund’s prospectus or talk to your financial adviser.
Review your fund’s expenses
The table below shows the expenses you would have paid on a $1,000 investment in BNY Mellon Structured Midcap Fund from March 1, 2019 to August 31, 2019. It also shows how much a $1,000 investment would be worth at the close of the period, assuming actual returns and expenses.
| | | | | | | |
Expenses and Value of a $1,000 Investment | |
Assume actual returns for the six months ended August 31, 2019 | |
| | | | | | |
| | Class A | Class C | Class I | Class Y | |
Expense paid per $1,000† | $6.13 | $9.79 | $4.91 | $4.46 | |
Ending value (after expenses) | $945.10 | $941.80 | $946.40 | $946.60 | |
COMPARING YOUR FUND’S EXPENSES
WITH THOSE OF OTHER FUNDS(Unaudited)
Using the SEC’s method to compare expenses
The Securities and Exchange Commission (“SEC”) has established guidelines to help investors assess fund expenses. Per these guidelines, the table below shows your fund’s expenses based on a $1,000 investment, assuming a hypothetical 5% annualized return. You can use this information to compare the ongoing expenses (but not transaction expenses or total cost) of investing in the fund with those of other funds. All mutual fund shareholder reports will provide this information to help you make this comparison. Please note that you cannot use this information to estimate your actual ending account balance and expenses paid during the period.
| | | | | | | |
Expenses and Value of a $1,000 Investment | |
Assuming a hypothetical 5% annualized return for the six months ended August 31, 2019 | |
| | | | | | |
| | Class A | Class C | Class I | Class Y | |
Expense paid per $1,000† | $6.36 | $10.16 | $5.09 | $4.63 | |
Ending value (after expenses) | $1,018.90 | $1,015.12 | $1,020.16 | $1,020.62 | |
† Expenses are equal to the fund‘s annualized expense ratio of 1.25% for Class A, 2.00% for Class C, 1.00% for Class I and .91% for Class Y, multiplied by the average account value over the period, multiplied by 184/365 (to reflect the one-half year period). |
9
STATEMENT OF INVESTMENTS
August 31, 2019
| | | | | | | | |
| |
Description | | | | Shares | | Value ($) | |
Common Stocks - 99.9% | | | | | |
Automobiles & Components - 2.1% | | | | | |
Dana | | | | 60,780 | | 773,729 | |
Gentex | | | | 78,710 | | 2,093,686 | |
| | | | | 2,867,415 | |
Banks - 6.5% | | | | | |
Cathay General Bancorp | | | | 55,600 | | 1,845,364 | |
Comerica | | | | 14,110 | | 869,882 | |
East West Bancorp | | | | 42,250 | | 1,737,743 | |
LendingTree | | | | 4,430 | a,b | 1,373,699 | |
MGIC Investment | | | | 96,280 | | 1,217,942 | |
Popular | | | | 29,790 | | 1,566,060 | |
TCF Financial | | | | 3,600 | | 138,816 | |
| | | | | 8,749,506 | |
Capital Goods - 11.8% | | | | | |
Allison Transmission Holdings | | | | 35,890 | | 1,594,593 | |
Carlisle | | | | 2,180 | | 316,013 | |
Curtiss-Wright | | | | 16,780 | | 2,057,899 | |
EMCOR Group | | | | 24,300 | | 2,124,792 | |
ITT | | | | 8,860 | | 504,311 | |
MasTec | | | | 24,700 | b | 1,552,889 | |
Oshkosh | | | | 21,340 | | 1,499,562 | |
Pentair | | | | 44,550 | | 1,600,236 | |
Spirit AeroSystems Holdings, Cl. A | | | | 2,175 | | 175,305 | |
Teledyne Technologies | | | | 2,050 | b | 632,610 | |
The Timken Company | | | | 44,030 | | 1,769,125 | |
The Toro Company | | | | 29,540 | | 2,127,175 | |
| | | | | 15,954,510 | |
Commercial & Professional Services - 1.1% | | | | | |
HNI | | | | 17,550 | | 547,385 | |
Insperity | | | | 6,530 | | 646,862 | |
Manpowergroup | | | | 3,760 | | 307,342 | |
| | | | | 1,501,589 | |
Consumer Durables & Apparel - 2.8% | | | | | |
Deckers Outdoor | | | | 12,330 | b | 1,818,058 | |
Tempur Sealy International | | | | 9,520 | a,b | 734,182 | |
Under Armour, Cl. A | | | | 32,330 | b | 601,661 | |
Under Armour, Cl. C | | | | 37,750 | a,b | 638,730 | |
| | | | | 3,792,631 | |
Consumer Services - 2.1% | | | | | |
International Speedway, Cl. A | | | | 12,780 | | 575,356 | |
Jack in the Box | | | | 14,260 | a | 1,216,663 | |
10
| | | | | | | | |
| |
Description | | | | Shares | | Value ($) | |
Common Stocks - 99.9% (continued) | | | | | |
Consumer Services - 2.1% (continued) | | | | | |
The Wendy's Company | | | | 45,470 | a | 1,000,340 | |
| | | | | 2,792,359 | |
Diversified Financials - 4.2% | | | | | |
Evercore, Cl. A | | | | 15,130 | a | 1,206,769 | |
FactSet Research Systems | | | | 3,840 | a | 1,044,826 | |
Federated Investors, Cl. B | | | | 43,870 | a | 1,405,595 | |
OneMain Holdings | | | | 36,390 | | 1,304,582 | |
SEI Investments | | | | 11,835 | | 680,631 | |
| | | | | 5,642,403 | |
Energy - 4.5% | | | | | |
Apergy | | | | 29,330 | b | 761,993 | |
Cabot Oil & Gas | | | | 80,050 | | 1,370,456 | |
Equitrans Midstream | | | | 91,680 | a | 1,236,763 | |
The Williams Companies | | | | 40,360 | | 952,496 | |
World Fuel Services | | | | 46,460 | | 1,784,064 | |
| | | | | 6,105,772 | |
Food & Staples Retailing - 1.5% | | | | | |
Casey's General Stores | | | | 12,150 | a | 2,039,377 | |
Food, Beverage & Tobacco - .6% | | | | | |
Ingredion | | | | 10,840 | | 837,607 | |
Health Care Equipment & Services - 5.3% | | | | | |
Amedisys | | | | 1,380 | b | 177,620 | |
Haemonetics | | | | 15,760 | b | 2,104,433 | |
Masimo | | | | 7,310 | b | 1,120,258 | |
Patterson | | | | 8,980 | a | 150,146 | |
STERIS | | | | 15,980 | | 2,467,312 | |
Veeva Systems, Cl. A | | | | 7,410 | b | 1,188,416 | |
| | | | | 7,208,185 | |
Household & Personal Products - 1.1% | | | | | |
Edgewell Personal Care | | | | 54,710 | b | 1,523,126 | |
Insurance - 4.7% | | | | | |
Brown & Brown | | | | 61,670 | | 2,275,006 | |
Globe Life | | | | 6,630 | | 591,794 | |
Kemper | | | | 19,900 | | 1,392,602 | |
Primerica | | | | 17,365 | | 2,069,387 | |
| | | | | 6,328,789 | |
Materials - 4.2% | | | | | |
Allegheny Technologies | | | | 85,550 | a,b | 1,695,601 | |
The Scotts Miracle-Gro Company | | | | 14,740 | | 1,567,157 | |
Valvoline | | | | 77,270 | | 1,746,302 | |
Worthington Industries | | | | 18,690 | | 648,543 | |
| | | | | 5,657,603 | |
11
STATEMENT OF INVESTMENTS (continued)
| | | | | | | | |
| |
Description | | | | Shares | | Value ($) | |
Common Stocks - 99.9% (continued) | | | | | |
Media & Entertainment - 3.5% | | | | | |
AMC Networks, Cl. A | | | | 37,000 | a,b | 1,794,500 | |
John Wiley & Sons, Cl. A | | | | 3,100 | | 137,950 | |
Sinclair Broadcast Group, Cl. A | | | | 7,250 | | 323,133 | |
TEGNA | | | | 62,730 | a | 897,666 | |
The New York Times Company, Cl. A | | | | 56,600 | a | 1,652,720 | |
| | | | | 4,805,969 | |
Pharmaceuticals Biotechnology & Life Sciences - 7.2% | | | | | |
Bio-Rad Laboratories, Cl. A | | | | 5,750 | b | 1,941,832 | |
Bruker | | | | 13,270 | | 572,866 | |
Charles River Laboratories International | | | | 14,500 | b | 1,902,400 | |
Exelixis | | | | 104,650 | b | 2,077,302 | |
Incyte | | | | 3,180 | b | 260,188 | |
Mettler-Toledo International | | | | 285 | b | 187,185 | |
PRA Health Sciences | | | | 5,120 | b | 506,061 | |
Waters | | | | 3,610 | b | 764,923 | |
Zoetis | | | | 12,330 | | 1,558,759 | |
| | | | | 9,771,516 | |
Real Estate - 8.7% | | | | | |
EastGroup Properties | | | | 14,230 | c | 1,771,920 | |
First Industrial Realty Trust | | | | 52,340 | c | 2,038,643 | |
Highwoods Properties | | | | 5,460 | c | 235,927 | |
Lamar Advertising, Cl. A | | | | 26,995 | c | 2,069,167 | |
Medical Properties Trust | | | | 57,450 | c | 1,067,996 | |
Omega Healthcare Investors | | | | 11,750 | c | 477,990 | |
Piedmont Office Realty Trust, Cl. A | | | | 22,440 | a,c | 442,966 | |
PS Business Parks | | | | 8,510 | c | 1,528,481 | |
VICI Properties | | | | 10,290 | a,c | 228,026 | |
Weingarten Realty Investors | | | | 70,305 | c | 1,862,379 | |
| | | | | 11,723,495 | |
Retailing - 3.5% | | | | | |
AutoZone | | | | 320 | b | 352,541 | |
Bed Bath & Beyond | | | | 20,500 | a | 198,235 | |
Dick's Sporting Goods | | | | 50,160 | a | 1,707,446 | |
Etsy | | | | 14,570 | b | 769,150 | |
Floor & Decor Holdings, Cl. A | | | | 25,510 | b | 1,255,602 | |
Murphy USA | | | | 5,160 | b | 461,304 | |
| | | | | 4,744,278 | |
Semiconductors & Semiconductor Equipment - 3.4% | | | | | |
Cirrus Logic | | | | 25,560 | b | 1,371,038 | |
Semtech | | | | 25,920 | b | 1,087,862 | |
Silicon Laboratories | | | | 2,940 | b | 320,460 | |
Teradyne | | | | 14,900 | | 789,253 | |
Universal Display | | | | 3,800 | | 780,786 | |
12
| | | | | | | | |
| |
Description | | | | Shares | | Value ($) | |
Common Stocks - 99.9% (continued) | | | | | |
Semiconductors & Semiconductor Equipment - 3.4% (continued) | | | | | |
Xilinx | | | | 2,870 | | 298,652 | |
| | | | | 4,648,051 | |
Software & Services - 8.1% | | | | | |
CACI International, Cl. A | | | | 9,120 | b | 2,027,285 | |
CDK Global | | | | 4,930 | | 212,779 | |
Citrix Systems | | | | 6,240 | | 580,195 | |
Fair Isaac | | | | 3,290 | b | 1,160,449 | |
j2 Global | | | | 18,150 | a | 1,535,490 | |
KBR | | | | 14,360 | | 366,467 | |
Leidos Holdings | | | | 11,840 | | 1,034,342 | |
Manhattan Associates | | | | 24,410 | b | 2,016,998 | |
MAXIMUS | | | | 25,790 | | 1,984,283 | |
| | | | | 10,918,288 | |
Technology Hardware & Equipment - 6.4% | | | | | |
Ciena | | | | 41,940 | b | 1,716,604 | |
National Instruments | | | | 40,240 | | 1,690,080 | |
Tech Data | | | | 16,170 | b | 1,499,444 | |
Xerox Holdings | | | | 41,440 | | 1,201,346 | |
Zebra Technologies, Cl. A | | | | 12,510 | b | 2,564,925 | |
| | | | | 8,672,399 | |
Telecommunication Services - .3% | | | | | |
Telephone & Data Systems | | | | 17,990 | | 453,348 | |
Transportation - 2.8% | | | | | |
Landstar System | | | | 10,790 | | 1,203,301 | |
Old Dominion Freight Line | | | | 3,920 | a | 641,939 | |
United Airlines Holdings | | | | 18,520 | b | 1,561,421 | |
Werner Enterprises | | | | 10,250 | a | 334,970 | |
| | | | | 3,741,631 | |
Utilities - 3.5% | | | | | |
IDACORP | | | | 10,160 | | 1,115,670 | |
MDU Resources Group | | | | 50,060 | | 1,346,113 | |
OGE Energy | | | | 51,790 | | 2,220,237 | |
| | | | | 4,682,020 | |
Total Common Stocks(cost $127,412,307) | | | | 135,161,867 | |
13
STATEMENT OF INVESTMENTS (continued)
| | | | | | | | |
| |
Description | | 1-Day
Yield (%) | | Shares | | Value ($) | |
Investment Companies - .5% | | | | | |
Registered Investment Companies - .5% | | | | | |
Dreyfus Institutional Preferred Government Plus Money Market Fund
(cost $673,884) | | 2.09 | | 673,884 | d | 673,884 | |
| | | | | | | | |
Investment of Cash Collateral for Securities Loaned - .9% | | | | | |
Registered Investment Companies - .9% | | | | | |
Dreyfus Institutional Preferred Government Plus Money Market Fund
(cost $1,205,834) | | 2.09 | | 1,205,834 | d | 1,205,834 | |
Total Investments(cost $129,292,025) | | 101.3% | | 137,041,585 | |
Liabilities, Less Cash and Receivables | | (1.3%) | | (1,709,709) | |
Net Assets | | 100.0% | | 135,331,876 | |
a Security, or portion thereof, on loan. At August 31, 2019, the value of the fund’s securities on loan was $21,393,285 and the value of the collateral was $23,485,125, consisting of cash collateral of $1,205,834 and U.S. Government & Agency securities valued at $22,279,291.
b Non-income producing security.
c Investment in real estate investment trust within the United States.
d Investment in affiliated issuer. The investment objective of this investment company is publicly available and can be found within the investment company’s prospectus.
| | |
Portfolio Summary (Unaudited)† | Value (%) |
Information Technology | 17.9 |
Industrials | 15.7 |
Financials | 15.3 |
Health Care | 12.5 |
Consumer Discretionary | 10.5 |
Real Estate | 8.7 |
Energy | 4.5 |
Materials | 4.2 |
Communication Services | 3.9 |
Utilities | 3.5 |
Consumer Staples | 3.2 |
Investment Companies | 1.4 |
| | 101.3 |
† Based on net assets.
See notes to financial statements.
14
STATEMENT OF INVESTMENTS IN AFFILIATED ISSUERS
| | | | | | | |
Investment Companies | Value
8/31/18($) | Purchases($) | Sales ($) | Value
8/31/19($) | Net
Assets(%) | Dividends/
Distributions($) |
Registered Investment Companies; | | | | |
Dreyfus Institutional Preferred Government Plus Money Market Fund | 923,258 | 25,700,032 | 25,949,406 | 673,884 | .5 | 9,277 |
Investment of Cash Collateral for Securities Loaned;† | | |
Dreyfus Institutional Preferred Government Money Market Fund, Institutional Shares | 2,151,644 | 4,241,296 | 6,392,940 | - | - | - |
Dreyfus Institutional Preferred Government Plus Money Market Fund | - | 4,953,858 | 3,748,024 | 1,205,834 | .9 | - |
Total | 3,074,902 | 34,895,186 | 36,090,370 | 1,879,718 | 1.4 | 9,277 |
† Effective January 2, 2019, cash collateral for securities lending was transferred from Dreyfus Institutional Preferred Government Money Market Fund, Institutional Shares to Dreyfus Institutional Preferred Government Plus Money Market Fund.
See notes to financial statements.
15
STATEMENT OF ASSETS AND LIABILITIES
August 31, 2019
| | | | | | | |
| | | | | | |
| | | Cost | | Value | |
Assets ($): | | | | |
Investments in securities—See Statement of Investments
(including securities on loan, valued at $21,393,285)—Note 1(b): | | | |
Unaffiliated issuers | 127,412,307 | | 135,161,867 | |
Affiliated issuers | | 1,879,718 | | 1,879,718 | |
Receivable for investment securities sold | | 1,771,285 | |
Dividends, interest and securities lending income receivable | | 210,281 | |
Receivable for shares of Common Stock subscribed | | 78,344 | |
Prepaid expenses | | | | | 40,030 | |
| | | | | 139,141,525 | |
Liabilities ($): | | | | |
Due to BNY Mellon Investment Adviser, Inc. and affiliates—Note 3(c) | | 129,735 | |
Cash overdraft due to Custodian | | | | | 1,771,285 | |
Liability for securities on loan—Note 1(b) | | 1,205,834 | |
Payable for shares of Common Stock redeemed | | 568,094 | |
Directors fees and expenses payable | | 1,866 | |
Other accrued expenses | | | | | 132,835 | |
| | | | | 3,809,649 | |
Net Assets ($) | | | 135,331,876 | |
Composition of Net Assets ($): | | | | |
Paid-in capital | | | | | 123,166,054 | |
Total distributable earnings (loss) | | | | | 12,165,822 | |
Net Assets ($) | | | 135,331,876 | |
| | | | | | |
Net Asset Value Per Share | Class A | Class C | Class I | Class Y | |
Net Assets ($) | 77,249,348 | 6,422,327 | 48,673,846 | 2,986,355 | |
Shares Outstanding | 3,049,168 | 298,415 | 1,875,921 | 115,336 | |
Net Asset Value Per Share ($) | 25.33 | 21.52 | 25.95 | 25.89 | |
| | | | | |
See notes to financial statements. | | | | | |
16
STATEMENT OF OPERATIONS
Year Ended August 31, 2019
| | | | | | | |
| | | | | | |
| | | | | | |
Investment Income ($): | | | | |
Income: | | | | |
Cash dividends (net of $4,326 foreign taxes withheld at source): | |
Unaffiliated issuers | | | 2,444,820 | |
Affiliated issuers | | | 9,277 | |
Income from securities lending—Note 1(b) | | | 20,181 | |
Interest | | | 1,965 | |
Total Income | | | 2,476,243 | |
Expenses: | | | | |
Management fee—Note 3(a) | | | 1,200,415 | |
Shareholder servicing costs—Note 3(c) | | | 522,598 | |
Professional fees | | | 78,797 | |
Registration fees | | | 62,055 | |
Distribution fees—Note 3(b) | | | 61,172 | |
Prospectus and shareholders’ reports | | | 30,959 | |
Directors’ fees and expenses—Note 3(d) | | | 13,630 | |
Custodian fees—Note 3(c) | | | 8,269 | |
Loan commitment fees—Note 2 | | | 4,093 | |
Interest expense—Note 2 | | | 476 | |
Miscellaneous | | | 27,525 | |
Total Expenses | | | 2,009,989 | |
Less—reduction in expenses due to undertaking—Note 3(a) | | | (110,328) | |
Net Expenses | | | 1,899,661 | |
Investment Income—Net | | | 576,582 | |
Realized and Unrealized Gain (Loss) on Investments—Note 4 ($): | | |
Net realized gain (loss) on investments | 7,195,927 | |
Net change in unrealized appreciation (depreciation) on investments | (29,460,488) | |
Net Realized and Unrealized Gain (Loss) on Investments | | | (22,264,561) | |
Net (Decrease) in Net Assets Resulting from Operations | | (21,687,979) | |
| | | | | | |
See notes to financial statements. | | | | | |
17
STATEMENT OF CHANGES IN NET ASSETS
| | | | | | | | | | |
| | | | Year Ended August 31, |
| | | | 2019 | | 2018a | |
Operations ($): | | | | | | | | |
Investment income—net | | | 576,582 | | | | 241,625 | |
Net realized gain (loss) on investments | | 7,195,927 | | | | 18,178,762 | |
Net change in unrealized appreciation
(depreciation) on investments | | (29,460,488) | | | | 8,836,405 | |
Net Increase (Decrease) in Net Assets
Resulting from Operations | (21,687,979) | | | | 27,256,792 | |
Distributions ($): | |
Distributions to shareholders: | | | | | | | | |
Class A | | | (9,315,569) | | | | (10,582,741) | |
Class C | | | (1,059,498) | | | | (1,486,325) | |
Class I | | | (6,774,294) | | | | (7,084,155) | |
Class Y | | | (492,156) | | | | (847,004) | |
Total Distributions | | | (17,641,517) | | | | (20,000,225) | |
Capital Stock Transactions ($): | |
Net proceeds from shares sold: | | | | | | | | |
Class A | | | 5,440,433 | | | | 20,292,443 | |
Class C | | | 560,296 | | | | 758,112 | |
Class I | | | 11,104,539 | | | | 34,251,103 | |
Class Y | | | 2,023,064 | | | | 5,877,281 | |
Distributions reinvested: | | | | | | | | |
Class A | | | 8,609,378 | | | | 9,723,569 | |
Class C | | | 945,517 | | | | 1,356,335 | |
Class I | | | 6,535,000 | | | | 6,852,347 | |
Class Y | | | 341,035 | | | | 36,219 | |
Cost of shares redeemed: | | | | | | | | |
Class A | | | (22,001,004) | | | | (25,954,176) | |
Class C | | | (3,737,211) | | | | (17,520,593) | |
Class I | | | (34,538,004) | | | | (27,411,263) | |
Class Y | | | (3,191,107) | | | | (16,840,393) | |
Increase (Decrease) in Net Assets
from Capital Stock Transactions | (27,908,064) | | | | (8,579,016) | |
Total Increase (Decrease) in Net Assets | (67,237,560) | | | | (1,322,449) | |
Net Assets ($): | |
Beginning of Period | | | 202,569,436 | | | | 203,891,885 | |
End of Period | | | 135,331,876 | | | | 202,569,436 | |
18
| | | | | | | | | | |
| | | | Year Ended August 31, |
| | | | 2019 | | 2018a | |
Capital Share Transactions (Shares): | |
Class Ab,c | | | | | | | | |
Shares sold | | | 206,493 | | | | 613,775 | |
Shares issued for distributions reinvested | | | 369,501 | | | | 309,668 | |
Shares redeemed | | | (819,354) | | | | (820,403) | |
Net Increase (Decrease) in Shares Outstanding | (243,360) | | | | 103,040 | |
Class Cb | | | | | | | | |
Shares sold | | | 24,407 | | | | 27,006 | |
Shares issued for distributions reinvested | | | 47,514 | | | | 49,285 | |
Shares redeemed | | | (163,717) | | | | (594,929) | |
Net Increase (Decrease) in Shares Outstanding | (91,796) | | | | (518,638) | |
Class Ic | | | | | | | | |
Shares sold | | | 398,792 | | | | 1,054,051 | |
Shares issued for distributions reinvested | | | 274,349 | | | | 213,802 | |
Shares redeemed | | | (1,254,024) | | | | (850,122) | |
Net Increase (Decrease) in Shares Outstanding | (580,883) | | | | 417,731 | |
Class Y | | | | | | | | |
Shares sold | | | 70,164 | | | | 183,083 | |
Shares issued for distributions reinvested | | | 14,359 | | | | 1,132 | |
Shares redeemed | | | (116,824) | | | | (519,283) | |
Net Increase (Decrease) in Shares Outstanding | (32,301) | | | | (335,068) | |
| | | | | | | | | |
a Distributions to shareholders include $69,326 Class A, $224,609 Class I and $36,219 Class Y of distributions from net investment income and $10,513,415 Class A, $1,486,325 Class C, $6,859,546 Class I and $810,785 Class Y distributions from net realized gains. Undistributed investment income—net was $241,411 in 2018 and is no longer presented as a result of the adoption of SEC’s Disclosure Update and Simplification Rule. | |
b During the period ended August 31, 2019, 2,361 Class C shares representing $55,506 were automatically converted to 2,028 Class A shares and during the period ended August 31, 2018, 44,686 Class C shares representing $1,347,556 were automatically converted to 39,613 Class A shares. | |
c During the period ended August 31, 2018, 7,976 Class A shares representing $248,936 were exchanged for 7,804 Class I shares. | |
See notes to financial statements.
| | | | | | | | |
19
FINANCIAL HIGHLIGHTS
The following tables describe the performance for each share class for the fiscal periods indicated. All information (except portfolio turnover rate) reflects financial results for a single fund share. Total return shows how much your investment in the fund would have increased (or decreased) during each period, assuming you had reinvested all dividends and distributions. These figures have been derived from the fund’s financial statements.
| | | | | | | | |
| | | | |
| | | |
Class A Shares | | Year Ended August 31, |
| | 2019 | 2018 | 2017 | 2016 | 2015 |
Per Share Data ($): | | | | | | |
Net asset value, beginning of period | | 32.17 | 31.03 | 27.43 | 28.21 | 33.28 |
Investment Operations: | | | | | | |
Investment income—neta | | .08 | .02 | .04 | .23 | .06 |
Net realized and unrealized
gain (loss) on investments | | (3.92) | 4.23 | 3.78 | 1.43 | (.96) |
Total from Investment Operations | | (3.84) | 4.25 | 3.82 | 1.66 | (.90) |
Distributions: | | | | | | |
Dividends from
investment income—net | | (.01) | (.02) | (.22) | - | (.14) |
Dividends from net realized
gain on investments | | (2.99) | (3.09) | - | (2.44) | (4.03) |
Total Distributions | | (3.00) | (3.11) | (.22) | (2.44) | (4.17) |
Net asset value, end of period | | 25.33 | 32.17 | 31.03 | 27.43 | 28.21 |
Total Return (%)b | | (11.12) | 13.96 | 13.95 | 6.27 | (2.80) |
Ratios/Supplemental Data (%): | | | | | | |
Ratio of total expenses
to average net assets | | 1.36 | 1.42 | 1.32 | 1.29 | 1.25 |
Ratio of net expenses
to average net assets | | 1.25 | 1.25 | 1.25 | 1.25 | 1.23 |
Ratio of net investment income
to average net assets | | .29 | .07 | .13 | .87 | .20 |
Portfolio Turnover Rate | | 78.15 | 66.61 | 63.25 | 71.27 | 78.09 |
Net Assets, end of period ($ x 1,000) | | 77,249 | 105,934 | 98,978 | 108,588 | 118,954 |
a Based on average shares outstanding.
b Exclusive of sales charge.
See notes to financial statements.
20
| | | | | | | | | |
| | | | |
| | | |
Class C Shares | | Year Ended August 31, |
| | 2019 | 2018 | 2017 | 2016 | 2015 |
Per Share Data ($): | | | | | | |
Net asset value, beginning of period | | 28.06 | 27.59 | 24.42 | 25.55 | 30.60 |
Investment Operations: | | | | | | |
Investment income (loss)—neta | | (.10) | (.17) | (.16) | .03 | (.14) |
Net realized and unrealized
gain (loss) on investments | | (3.45) | 3.73 | 3.37 | 1.28 | (.88) |
Total from Investment Operations | | (3.55) | 3.56 | 3.21 | 1.31 | (1.02) |
Distributions: | | | | | | |
Dividends from
investment income—net | | - | - | (.04) | - | - |
Dividends from net realized
gain on investments | | (2.99) | (3.09) | - | (2.44) | (4.03) |
Total Distributions | | (2.99) | (3.09) | (.04) | (2.44) | (4.03) |
Net asset value, end of period | | 21.52 | 28.06 | 27.59 | 24.42 | 25.55 |
Total Return (%)b | | (11.76) | 13.14 | 13.14 | 5.50 | (3.51) |
Ratios/Supplemental Data (%): | | | | | | |
Ratio of total expenses
to average net assets | | 2.09 | 1.99 | 1.98 | 2.00 | 1.96 |
Ratio of net expenses
to average net assets | | 2.00 | 1.97 | 1.97 | 1.99 | 1.96 |
Ratio of net investment income
(loss) to average net assets | | (.44) | (.62) | (.59) | .13 | (.52) |
Portfolio Turnover Rate | | 78.15 | 66.61 | 63.25 | 71.27 | 78.09 |
Net Assets, end of period ($ x 1,000) | | 6,422 | 10,949 | 25,077 | 31,817 | 33,926 |
a Based on average shares outstanding.
b Exclusive of sales charge.
See notes to financial statements.
21
FINANCIAL HIGHLIGHTS (continued)
| | | | | | | | | | | | |
| | | | | | | |
| | | |
Class I Shares | | Year Ended August 31, |
| | 2019 | 2018 | 2017 | 2016 | 2015 |
Per Share Data ($): | | | | | | |
Net asset value, beginning of period | | 32.90 | 31.67 | 28.02 | 28.73 | 33.83 |
Investment Operations: | | | | | | |
Investment income—neta | | .15 | .10 | .12 | .31 | .14 |
Net realized and unrealized
gain (loss) on investments | | (4.00) | 4.32 | 3.87 | 1.45 | (.99) |
Total from Investment Operations | | (3.85) | 4.42 | 3.99 | 1.76 | (.85) |
Distributions: | | | | | | |
Dividends from
investment income—net | | (.11) | (.10) | (.34) | (.03) | (.22) |
Dividends from net realized
gain on investments | | (2.99) | (3.09) | - | (2.44) | (4.03) |
Total Distributions | | (3.10) | (3.19) | (.34) | (2.47) | (4.25) |
Net asset value, end of period | | 25.95 | 32.90 | 31.67 | 28.02 | 28.73 |
Total Return (%) | | (10.88) | 14.24 | 14.28 | 6.54 | (2.59) |
Ratios/Supplemental Data (%): | | | | | | |
Ratio of total expenses
to average net assets | | 1.01 | 1.06 | 1.03 | 1.09 | 1.05 |
Ratio of net expenses
to average net assets | | 1.00 | 1.00 | .99 | 1.00 | 1.00 |
Ratio of net investment income
to average net assets | | .55 | .31 | .39 | 1.15 | .46 |
Portfolio Turnover Rate | | 78.15 | 66.61 | 63.25 | 71.27 | 78.09 |
Net Assets, end of period ($ x 1,000) | | 48,674 | 80,835 | 64,572 | 62,094 | 75,779 |
a Based on average shares outstanding.
See notes to financial statements.
22
| | | | | | | | | |
| | | | |
| | | |
Class Y Shares | | Year Ended August 31, |
| | 2019 | 2018 | 2017 | 2016 | 2015 |
Per Share Data ($): | | | | | | |
Net asset value, beginning of period | | 32.86 | 31.62 | 28.02 | 28.75 | 33.85 |
Investment Operations: | | | | | | |
Investment income—neta | | .19 | .15 | .16 | .33 | .18 |
Net realized and unrealized
gain (loss) on investments | | (4.02) | 4.32 | 3.86 | 1.48 | (.98) |
Total from Investment Operations | | (3.83) | 4.47 | 4.02 | 1.81 | (.80) |
Distributions: | | | | | | |
Dividends from
investment income—net | | (.15) | (.14) | (.42) | (.10) | (.27) |
Dividends from net realized
gain on investments | | (2.99) | (3.09) | - | (2.44) | (4.03) |
Total Distributions | | (3.14) | (3.23) | (.42) | (2.54) | (4.30) |
Net asset value, end of period | | 25.89 | 32.86 | 31.62 | 28.02 | 28.75 |
Total Return (%) | | (10.82) | 14.43 | 14.39 | 6.71 | (2.43) |
Ratios/Supplemental Data (%): | | | | | | |
Ratio of total expenses
to average net assets | | .90 | .86 | .86 | .87 | .84 |
Ratio of net expenses
to average net assets | | .90 | .86 | .86 | .87 | .84 |
Ratio of net investment income
to average net assets | | .66 | .47 | .52 | 1.24 | .59 |
Portfolio Turnover Rate | | 78.15 | 66.61 | 63.25 | 71.27 | 78.09 |
Net Assets, end of period ($ x 1,000) | | 2,986 | 4,851 | 15,265 | 14,073 | 22,004 |
a Based on average shares outstanding.
See notes to financial statements.
23
NOTES TO FINANCIAL STATEMENTS
NOTE 1—Significant Accounting Policies:
BNY Mellon Structured Midcap Fund (the “fund”) is a separate diversified series of BNY Mellon Advantage Funds, Inc. (the “Company”), which is registered under the Investment Company Act of 1940, as amended (the “Act”), as an open-end management investment company and operates as a series company currently offering nine series, including the fund. The fund’s investment objective is to seek long-term capital growth. BNY Mellon Investment Adviser, Inc. (the “Adviser”), a wholly-owned subsidiary of The Bank of New York Mellon Corporation (“BNY Mellon”), serves as the fund’s investment adviser. Effective January 2, 2019, BNY Mellon Asset Management North America Corporation was renamed Mellon Investments Corporation (the “Sub-Adviser”), a wholly-owned subsidiary of BNY Mellon and an affiliate of the Adviser, serves as the fund’s sub-investment adviser.
Effective June 3, 2019, the fund changed its name from Dreyfus Structured Midcap Fund to BNY Mellon Structured Midcap Fund and the Company changed its name from Advantage Funds, Inc. to BNY Mellon Advantage Funds, Inc. In addition, The Dreyfus Corporation, the fund’s investment adviser, changed its name to “BNY Mellon Investment Adviser, Inc.”, MBSC Securities Corporation, the fund’s distributor, changed its name to “BNY Mellon Securities Corporation” and Dreyfus Transfer, Inc., the fund’s transfer agent, changed its name to “BNY Mellon Transfer, Inc.”
BNY Mellon Securities Corporation (the “Distributor”), a wholly-owned subsidiary of the Adviser, is the distributor of the fund’s shares. The fund is authorized to issue 700 million shares of $.001 par value Common Stock. The fund currently has authorized five classes of shares: Class A (200 million shares authorized), Class C (100 million shares authorized), Class I (200 million shares authorized), Class T (100 million shares authorized) and Class Y (100 million shares authorized). Class A and Class T shares generally are subject to a sales charge imposed at the time of purchase. Class C shares are subject to a contingent deferred sales charge (“CDSC”) imposed on Class C shares redeemed within one year of purchase. Class C shares automatically convert to Class A shares ten years after the date of purchase, without the imposition of a sales charge. Class I and Class Y shares are sold at net asset value per share generally to institutional investors. As of the date of this report, the fund did not offer Class T shares for purchase. Other differences between the classes include the services offered to and the expenses borne by each class, the allocation of certain transfer agency costs, and certain voting rights. Income, expenses (other than expenses attributable to a specific class), and realized
24
and unrealized gains or losses on investments are allocated to each class of shares based on its relative net assets.
The Company accounts separately for the assets, liabilities and operations of each series. Expenses directly attributable to each series are charged to that series’ operations; expenses which are applicable to all series are allocated among them on a pro rata basis.
The Financial Accounting Standards Board (“FASB”) Accounting Standards Codification (“ASC”) is the exclusive reference of authoritative U.S. generally accepted accounting principles (“GAAP”) recognized by the FASB to be applied by nongovernmental entities. Rules and interpretive releases of the Securities and Exchange Commission (“SEC”) under authority of federal laws are also sources of authoritative GAAP for SEC registrants. The fund is an investment company and applies the accounting and reporting guidance of the FASB ASC Topic 946 Financial Services-Investment Companies. The fund’s financial statements are prepared in accordance with GAAP, which may require the use of management estimates and assumptions. Actual results could differ from those estimates.
The Companyenters into contracts that contain a variety of indemnifications. The fund’s maximum exposure under these arrangements is unknown. The fund does not anticipate recognizing any loss related to these arrangements.
(a) Portfolio valuation: The fair value of a financial instrument is the amount that would be received to sell an asset or paid to transfer a liability in an orderly transaction between market participants at the measurement date (i.e., the exit price). GAAP establishes a fair value hierarchy that prioritizes the inputs of valuation techniques used to measure fair value. This hierarchy gives the highest priority to unadjusted quoted prices in active markets for identical assets or liabilities (Level 1 measurements) and the lowest priority to unobservable inputs (Level 3 measurements).
Additionally, GAAP provides guidance on determining whether the volume and activity in a market has decreased significantly and whether such a decrease in activity results in transactions that are not orderly. GAAP requires enhanced disclosures around valuation inputs and techniques used during annual and interim periods.
Various inputs are used in determining the value of the fund’s investments relating to fair value measurements. These inputs are summarized in the three broad levels listed below:
25
NOTES TO FINANCIAL STATEMENTS(continued)
Level 1—unadjusted quoted prices in active markets for identical investments.
Level 2—other significant observable inputs (including quoted prices for similar investments, interest rates, prepayment speeds, credit risk, etc.).
Level 3—significant unobservable inputs (including the fund’s own assumptions in determining the fair value of investments).
The inputs or methodology used for valuing securities are not necessarily an indication of the risk associated with investing in those securities.
Changes in valuation techniques may result in transfers in or out of an assigned level within the disclosure hierarchy. Valuation techniques used to value the fund’s investments are as follows:
Investments in securities are valued at the last sales price on the securities exchange or national securities market on which such securities are primarily traded. Securities listed on the National Market System for which market quotations are available are valued at the official closing price or, if there is no official closing price that day, at the last sales price. For open short positions, asked prices are used for valuation purposes. Bid price is used when no asked price is available. Registered investment companies that are not traded on an exchange are valued at their net asset value. All of the preceding securities are generally categorized within Level 1 of the fair value hierarchy.
Securities not listed on an exchange or the national securities market, or securities for which there were no transactions, are valued at the average of the most recent bid and asked prices. These securities are generally categorized within Level 2 of the fair value hierarchy.
Fair valuing of securities may be determined with the assistance of a pricing service using calculations based on indices of domestic securities and other appropriate indicators, such as prices of relevant American Depository Receipts and futures. Utilizing these techniques may result in transfers between Level 1 and Level 2 of the fair value hierarchy.
When market quotations or official closing prices are not readily available, or are determined not to accurately reflect fair value, such as when the value of a security has been significantly affected by events after the close of the exchange or market on which the security is principally traded (for example, a foreign exchange or market), but before the fund calculates its net asset value, the fund may value these investments at fair value as determined in accordance with the procedures approved by the Company’s Board of Directors (the “Board”). Certain factors may be considered when
26
fair valuing investments such as: fundamental analytical data, the nature and duration of restrictions on disposition, an evaluation of the forces that influence the market in which the securities are purchased and sold, and public trading in similar securities of the issuer or comparable issuers. These securities are either categorized within Level 2 or 3 of the fair value hierarchy depending on the relevant inputs used.
For restricted securities where observable inputs are limited, assumptions about market activity and risk are used and such securities are generally categorized within Level 3 of the fair value hierarchy.
The following is a summary of the inputs used as of August 31, 2019in valuing the fund’s investments:
| | | | | |
| | Level 1 - Unadjusted Quoted Prices | Level 2 - Other Significant Observable Inputs | Level 3 -Significant Unobservable Inputs | Total |
Assets ($) | | | | |
Investments in Securities:† | | | |
Equity Securities - Common Stocks | 135,161,867 | - | - | 135,161,867 |
Investment Companies | 1,879,718 | - | - | 1,879,718 |
† See Statement of Investments for additional detailed categorizations, if any.
(b)Securities transactions and investment income: Securities transactions are recorded on a trade date basis. Realized gains and losses from securities transactions are recorded on the identified cost basis. Dividend income is recognized on the ex-dividend date and interest income, including, where applicable, accretion of discount and amortization of premium on investments, is recognized on the accrual basis.
Pursuant to a securities lending agreement with The Bank of New York Mellon, a subsidiary of BNY Mellon and an affiliate of the Adviser, the fund may lend securities to qualified institutions. It is the fund’s policy that, at origination, all loans are secured by collateral of at least 102% of the value of U.S. securities loaned and 105% of the value of foreign securities loaned. Collateral equivalent to at least 100% of the market value of securities on loan is maintained at all times. Collateral is either in the form of cash, which can be invested in certain money market mutual funds managed by the Adviser, or U.S. Government and Agency securities. The fund is entitled to receive all dividends, interest and distributions on securities loaned, in addition to income earned as a result of the lending transaction. Should a borrower fail to return the securities in a timely manner, The Bank of New York Mellon is required to replace the
27
NOTES TO FINANCIAL STATEMENTS(continued)
securities for the benefit of the fund or credit the fund with the market value of the unreturned securities and is subrogated to the fund’s rights against the borrower and the collateral. Additionally, the contractual maturity of security lending transactions are on an overnight and continuous basis. During the period ended August 31, 2019, The Bank of New York Mellon earned $3,917 from lending portfolio securities, pursuant to the securities lending agreement.
(c) Affiliated issuers: Investments in other investment companies advised by the Adviser are considered “affiliated” under the Act.
(d) Dividends and distributions to shareholders: Dividends and distributions are recorded on the ex-dividend date. Dividends from investment income-net and dividends from net realized capital gains, if any, are normally declared and paid annually, but the fund may make distributions on a more frequent basis to comply with the distribution requirements of the Internal Revenue Code of 1986, as amended (the “Code”). To the extent that net realized capital gains can be offset by capital loss carryovers, it is the policy of the fund not to distribute such gains. Income and capital gain distributions are determined in accordance with income tax regulations, which may differ from GAAP.
(e) Federal income taxes: It is the policy of the fund to continue to qualify as a regulated investment company, if such qualification is in the best interests of its shareholders, by complying with the applicable provisions of the Code, and to make distributions of taxable income and net realized capital gain sufficient to relieve it from substantially all federal income and excise taxes.
As of and during the period ended August 31, 2019, the fund did not have any liabilities for any uncertain tax positions. The fund recognizes interest and penalties, if any, related to uncertain tax positions as income tax expense in the Statement of Operations. During the period ended August 31, 2019, the fund did not incur any interest or penalties.
Each tax year in the four-year period ended August 31, 2019 remains subject to examination by the Internal Revenue Service and state taxing authorities.
At August 31, 2019, the components of accumulated earnings on a tax basis were as follows: undistributed ordinary income $514,186, undistributed capital gains $3,978,440 and unrealized appreciation $7,673,196.
The tax character of distributions paid to shareholders during the fiscal periods ended August 31, 2019 and August 31, 2018 were as follows:
28
ordinary income $921,333 and $330,154, and long-term capital gains $16,720,184 and $19,670,071, respectively.
(f) New Accounting Pronouncements: Effective June 1, 2019, the fund adopted Accounting Standards Update 2018-13, Fair Value Measurement (Topic 820): Disclosure Framework—Changes to the Disclosure Requirements for Fair Value Measurement (“ASU 2018-13”). The update provides guidance that eliminates, adds and modifies certain disclosure requirements for fair value measurements. The adoption of ASU 2018-13 had no impact on the operations of the fund for the period ended August 31, 2019.
NOTE 2—Bank Lines of Credit:
The fund participates with other long-term open-end funds managed by the Adviser in a $1.030 billion unsecured credit facility led by Citibank, N.A. (the “Citibank Credit Facility”) and a $300 million unsecured credit facility provided by The Bank of New York Mellon (the “BNYM Credit Facility”), each to be utilized primarily for temporary or emergency purposes, including the financing of redemptions (each, a “Facility”). The Citibank Credit Facility is available in two tranches: (i) Tranche A is in an amount equal to $830 million and is available to all long-term open-ended funds, including the fund, and (ii) Tranche B is in amount equal to $200 million and is available only to BNY Mellon Floating Rate Income Fund, a series of BNY Mellon Investment Funds IV, Inc. Prior to October 3, 2018, the unsecured credit facility with Citibank, N.A. was $830 million. In connection therewith, the fund has agreed to pay its pro rata portion of commitment fees for Tranche A of the Citibank Credit Facility and the BNYM Credit Facility. Interest is charged to the fund based on rates determined pursuant to the terms of the respective Facility at the time of borrowing.
The average amount of borrowings outstanding under the Facilities during the period ended August 31, 2019 was approximately $14,250 with a related weighted average annualized interest rate of 3.34%.
NOTE 3—Management Fee, Sub-Investment Advisory Fee and Other Transactions with Affiliates:
(a)Pursuant to a management agreement with the Adviser, the management fee is computed at the annual rate of .75% of the value of the fund’s average daily net assets and is payable monthly. The Adviser has contractually agreed, from September 1, 2018 through December 31, 2019, to waive receipt of its fees and/or assume the direct expenses of the fund, so that the direct expenses of none of the classes (excluding Rule 12b-1 Distribution Plan fees, Shareholder Services Plan fees, taxes, interest
29
NOTES TO FINANCIAL STATEMENTS(continued)
expense, brokerage commissions, commitment fees on borrowings and extraordinary expenses) exceed 1.00% of the fund’s average daily net assets. On or after December 31, 2019, the Adviser may terminate this expense limitation at any time. The reduction in expenses, pursuant to the undertaking, amounted to $110,328 during the period ended August 31, 2019.
Pursuant to a sub-investment advisory agreement between the Adviser and the Sub-Adviser, the sub-investment advisory fee is payable monthly by the Adviser, and is based upon the value of the fund’s average daily net assets, computed at the following annual rates:
Average Net Assets
0 up to $100 million .25%
$100 million up to $1 billion .20%
$1 billion up to $1.5 billion .16%
In excess of $1.5 billion .10%
During the period ended August 31, 2019, the Distributor retained $1,269 from commissions earned on sales of the fund’s Class A shares and $159 from CDSC fees on redemptions of the fund’s Class C shares.
(b) Under the Distribution Plan adopted pursuant to Rule 12b-1 under the Act, Class C shares pay the Distributor for distributing its shares at an annual rate of .75% of the value of its average daily net assets. During the period ended August 31, 2019, Class C shares were charged $61,172 pursuant to the Distribution Plan.
(c)Under the Shareholder Services Plan, Class A and Class C shares pay the Distributor at an annual rate of .25% of the value of their average daily net assets for the provision of certain services. The services provided may include personal services relating to shareholder accounts, such as answering shareholder inquiries regarding the fund and providing reports and other information, and services related to the maintenance of shareholder accounts. The Distributor may make payments to Service Agents (securities dealers, financial institutions or other industry professionals) with respect to these services. The Distributor determines the amounts to be paid to Service Agents. During the period ended August 31, 2019, Class A and Class C shares were charged $217,843and $20,391, respectively, pursuant to the Shareholder Services Plan.
The fund has an arrangement with the transfer agent whereby the fund may receive earnings credits when positive cash balances are maintained, which are used to offset transfer agency fees. The fund had an arrangement with the custodian to receive earnings credits when positive cash balances were maintained, which were used to offset custody fees.
30
Effective February 1, 2019, the arrangement with the custodian changed whereby the fund will no longer receive earnings credits to offset its custody fees and will receive interest income or overdraft fees going forward. For financial reporting purposes, the fund includes net earnings credits, if any, as an expense offset in the Statement of Operations.
The fund compensates BNY Mellon Transfer, Inc., a wholly-owned subsidiary of the Adviser, under a transfer agency agreement for providing transfer agency and cash management services for the fund. The majority of transfer agency fees are comprised of amounts paid on a per account basis, while cash management fees are related to fund subscriptions and redemptions. During the period ended August 31, 2019, the fund was charged $22,593 for transfer agency services. These fees are included in Shareholder servicing costs in the Statement of Operations.
The fund compensates The Bank of New York Mellon under a custody agreement for providing custodial services for the fund. These fees are determined based on net assets, geographic region and transaction activity. During the period ended August 31, 2019, the fund was charged $8,269 pursuant to the custody agreement.
During the period ended August 31, 2019, the fund was charged $11,539 for services performed by the Chief Compliance Officer and his staff. These fees are included in Miscellaneous in the Statement of Operations.
The components of “Due to BNY Mellon Investment Adviser, Inc. and affiliates” in the Statement of Assets and Liabilities consist of: management fees $93,102, Distribution Plan fees $4,099, Shareholder Services Plan fees $17,917, custodian fees $2,879, Chief Compliance Officer fees $2,252 and transfer agency fees $9,486.
(d) Each Board member also serves as a Board member of other funds in the BNY Mellon Family of Funds complex. Annual retainer fees and attendance fees are allocated to each fund based on net assets.
NOTE 4—Securities Transactions:
The aggregate amount of purchases and sales of investment securities, excluding short-term securities, during the period ended August 31, 2019, amounted to $126,060,820 and $170,252,824, respectively.
At August 31, 2019, the cost of investments for federal income tax purposes was $129,368,389; accordingly, accumulated net unrealized appreciation on investments was $7,673,196, consisting of $17,304,192 gross unrealized appreciation and $9,630,996 gross unrealized depreciation.
31
REPORT OF INDEPENDENT REGISTERED PUBLIC ACCOUNTING FIRM
To the Shareholders and the Board of Directors of BNY Mellon Structured Midcap Fund (formerly, Dreyfus Structured Midcap Fund)
Opinion on the Financial Statements
We have audited the accompanying statement of assets and liabilities of BNY Mellon Structured Midcap Fund (the “Fund”) (formerly, Dreyfus Structured Midcap Fund) (one of the funds constituting BNY Mellon Advantage Funds, Inc.), including the statements of investments and investments in affiliated issuers, as of August 31, 2019, and the related statement of operations for the year then ended, the statement of changes in net assets for each of the two years in the period then ended, the financial highlights for each of the five years in the period then ended and the related notes (collectively referred to as the “financial statements”). In our opinion, the financial statements present fairly, in all material respects, the financial position of the Fund (one of the funds constituting BNY Mellon Advantage Funds, Inc.) at August 31, 2019, the results of its operations for the year then ended, the changes in its net assets for each of the two years in the period then ended and its financial highlights for each of the five years in the period then ended, in conformity with U.S. generally accepted accounting principles.
Basis for Opinion
These financial statements are the responsibility of the Fund’s management. Our responsibility is to express an opinion on the Fund’s financial statements based on our audits. We are a public accounting firm registered with the Public Company Accounting Oversight Board (United States) (“PCAOB”) and are required to be independent with respect to the Fund in accordance with the U.S. federal securities laws and the applicable rules and regulations of the Securities and Exchange Commission and the PCAOB.
We conducted our audits in accordance with the standards of the PCAOB. Those standards require that we plan and perform the audit to obtain reasonable assurance about whether the financial statements are free of material misstatement, whether due to error or fraud. The Fund is not required to have, nor were we engaged to perform, an audit of the Fund’s internal control over financial reporting. As part of our audits, we are required to obtain an understanding of internal control over financial reporting, but not for the purpose of expressing an opinion on the effectiveness of the Fund’s internal control over financial reporting. Accordingly, we express no such opinion.
Our audits included performing procedures to assess the risks of material misstatement of the financial statements, whether due to error or fraud, and performing procedures that respond to those risks. Such procedures included examining, on a test basis, evidence regarding the amounts and disclosures in the financial statements. Our procedures included confirmation of securities owned as of August 31, 2019, by correspondence with the custodian and others or by other appropriate auditing procedures where replies from others were not received. Our audits also included evaluating the accounting principles used and significant estimates made by management, as well as evaluating the overall presentation of the financial statements. We believe that our audits provide a reasonable basis for our opinion.

We have served as the auditor of one or more investment companies in the BNY Mellon Family of Funds since at least 1957, but we are unable to determine the specific year.
New York, New York
October 24, 2019
32
IMPORTANT TAX INFORMATION(Unaudited)
For federal tax purposes, the fund hereby reports 100% of the ordinary dividends paid during the fiscal year ended August 31, 2019 as qualifying for the corporate dividends received deduction. Also certain dividends paid by the fund may be subject to a maximum tax rate of 15%, as provided for by the Jobs and Growth Tax Relief Reconciliation Act of 2003. Of the distributions paid during the fiscal year, $921,333 represents the maximum amount that may be considered qualified dividend income. The fund also hereby reports $.1069 per share as a short-term capital gain distribution and $2.8804 per share as a long-term capital gain distribution paid on December 19, 2018. Shareholders will receive notification in early 2020 of the percentage applicable to the preparation of their 2019 income tax returns.
33
INFORMATION ABOUT THE RENEWAL OF THE FUND’S MANAGEMENT AND SUB–INVESTMENT ADVISORY AGREEMENTS (Unaudited)
At a meeting of the fund’s Board of Directors held on March 12-13, 2019, the Board considered the renewalof the fund’s Management Agreement, pursuant to which the Adviser provides the fund with investment advisory and administrative services (the “Agreement”), and the Sub-Investment Advisory Agreement (together, the “Agreements”), pursuant to which Mellon Investments Corporation (the “Subadviser”) provides day-to-day management of the fund’s investments. The Board members, none of whom are “interested persons” (as defined in the Investment Company Act of 1940, as amended) of the fund, were assisted in their review by independent legal counsel and met with counsel in executive session separate from representatives of the Adviser and the Subadviser. In considering the renewal of the Agreements, the Board considered all factors that it believed to be relevant, including those discussed below. The Board did not identify any one factor as dispositive, and each Board member may have attributed different weights to the factors considered.
Analysis of Nature, Extent, and Quality of Services Provided to the Fund. The Board considered information provided to it at the meeting and in previous presentations from representatives of the Adviser regarding the nature, extent, and quality of the services provided to funds in the BNY Mellon fund complex. The Adviser provided the number of open accounts in the fund, the fund’s asset size and the allocation of fund assets among distribution channels. The Adviser also had previously provided information regarding the diverse intermediary relationships and distribution channels of funds in the BNY Mellon fund complex (such as retail direct or intermediary, in which intermediaries typically are paid by the fund and/or the Adviser) and the Adviser’s corresponding need for broad, deep, and diverse resources to be able to provide ongoing shareholder services to each intermediary or distribution channel, as applicable to the fund.
The Board also considered research support available to, and portfolio management capabilities of, the fund’s portfolio management personnel and that the Adviser also provides oversight of day-to-day fund operations, including fund accounting and administration and assistance in meeting legal and regulatory requirements. The Board also considered the Adviser’s extensive administrative, accounting and compliance infrastructures, as well as the Adviser’s supervisory activities over the Subadviser. The Board also considered portfolio management’s brokerage policies and practices (including policies and practices regarding soft dollars) and the standards applied in seeking best execution.
Comparative Analysis of the Fund’s Performance and Management Fee and Expense Ratio. The Board reviewed reports prepared by Broadridge Financial Solutions, Inc. (“Broadridge”), an independent provider of investment company data, which included information comparing (1) the fund’s performance with the performance of a group of comparable funds (the “Performance Group”) and with a broader group of funds (the “Performance Universe”), all for various periods ended January 31, 2019, and (2) the fund’s actual and contractual management fees and total expenses with those of a group of comparable funds (the “Expense Group”) and with a broader group of funds (the
34
“Expense Universe”), the information for which was derived in part from fund financial statements available to Broadridge as of the date of its analysis. The Adviser previously had furnished the Board with a description of the methodology Broadridge used to select the Performance Group and Performance Universe and the Expense Group and Expense Universe.
Representatives of the Adviser stated that the usefulness of performance comparisons may be affected by a number of factors, including different investment limitations and policies that may be applicable to the fund and comparison funds. They also considered that performance generally should be considered over longer periods of time, although it is possible that long-term performance can be adversely affected by even one period of significant underperformance so that a single investment decision or theme has the ability to affect disproportionately long-term performance. The Board discussed with representatives of the Adviser, its affiliates and/or the Subadviser the results of the comparisons and considered that the fund’s total return performance was above the Performance Group and Performance Universe medians the five- and ten-year periods but was below medians in more recent periods. The Adviser also provided a comparison of the fund’s calendar year total returns to the returns of the fund’s benchmark index, and it was considered that the fund’s returns were above the returns of the index in five of the ten calendar years shown.
The Board also reviewed the range of actual and contractual management fees and total expenses of the Expense Group and Expense Universe funds and discussed the results of the comparisons. The Board considered that the fund’s contractual management fee was below the Expense Group median, the fund’s actual management fee was below the Expense Group and Expense Universe medians and the fund’s total expenses were approximately equal to the Expense Group median and slightly above the Expense Universe median.
Representatives of the Adviser stated that the Adviser has contractually agreed, until December 31, 2019, to waive receipt of its fees and/or assume the direct expenses of the fund so that the direct expenses of none of its classes (excluding Rule 12b-1 fees, shareholder services fees, taxes, interest, brokerage commissions, commitment fees on borrowings and extraordinary expenses) exceed 1.00% of the fund’s average daily net assets.
Representatives of the Adviser reviewed with the Board the management or investment advisory fees (1) paid by funds advised or administered by the Adviser that are in the same Lipper category as the fund and (2) paid to the Adviser or the Subadviser or its affiliates for advising any separate accounts and/or other types of client portfolios that are considered to have similar investment strategies and policies as the fund (the “Similar Clients”), and explained the nature of the Similar Clients. They discussed differences in fees paid and the relationship of the fees paid in light of any differences in the services provided and other relevant factors. The Board considered the relevance of the fee information provided for the Similar Clients to evaluate the appropriateness of the fund’s management fee.
35
INFORMATION ABOUT THE RENEWAL OF THE FUND’S MANAGEMENT AND SUB–INVESTMENT ADVISORY AGREEMENTS (Unaudited) (continued)
The Board considered the fee to the Subadviser in relation to the fee paid to the Adviser by the fund and the respective services provided by the Subadviser and the Adviser. The Board also took into consideration that the Subadviser’s fee is paid by the Adviser (out of its fee from the fund) and not the fund.
Analysis of Profitability and Economies of Scale. Representatives of the Adviser reviewed the expenses allocated and profit received by the Adviser and its affiliates and the resulting profitability percentage for managing the fund and the aggregate profitability percentage to the Adviser and its affiliates for managing the funds in the BNY Mellon fund complex, and the method used to determine the expenses and profit. The Board concluded that the profitability results were not unreasonable, given the services rendered and service levels provided by the Adviser. The Board also considered the expense limitation arrangement and its effect on the profitability of the Adviser and its affiliates. The Board also had been provided with information prepared by an independent consulting firm regarding the Adviser’s approach to allocating costs to, and determining the profitability of, individual funds and the entire BNY Mellon fund complex. The consulting firm also had analyzed where any economies of scale might emerge in connection with the management of a fund.
The Board considered on the advice of its counsel the profitability analysis (1) as part of its evaluation of whether the fees under the Agreements, considered in relation to the mix of services provided by the Adviser and the Subadviser, including the nature, extent and quality of such services, supported the renewal of the Agreements and (2) in light of the relevant circumstances for the fund and the extent to which economies of scale would be realized if the fund grows and whether fee levels reflect these economies of scale for the benefit of fund shareholders. Since the Adviser, and not the fund, pays the Subadviser pursuant to the Sub-Investment Advisory Agreement, the Board did not consider the Subadviser’s profitability to be relevant to its deliberations. Representatives of the Adviser stated that a discussion of economies of scale is predicated on a fund having achieved a substantial size with increasing assets and that, if a fund’s assets had been stable or decreasing, the possibility that the Adviser may have realized any economies of scale would be less. Representatives of the Adviser also stated that, as a result of shared and allocated costs among funds in the BNY Mellon fund complex, the extent of economies of scale could depend substantially on the level of assets in the complex as a whole, so that increases and decreases in complex-wide assets can affect potential economies of scale in a manner that is disproportionate to, or even in the opposite direction from, changes in the fund’s asset level. The Board also considered potential benefits to the Adviser and the Subadviser from acting as investment adviser and sub-investment adviser, respectively, and took into consideration the soft dollar arrangements in effect for trading the fund’s investments.
At the conclusion of these discussions, the Board agreed that it had been furnished with sufficient information to make an informed business decision with respect to the renewal of the Agreements. Based on the discussions and considerations as described above, the Board concluded and determined as follows.
36
· The Board concluded that the nature, extent and quality of the services provided by the Adviser and the Subadviser are adequate and appropriate.
· The Board was concerned above the fund’s relative total return performance in recent periods, and agreed to closely monitor performance.
· The Board concluded that the fees paid to the Adviser and the Subadviser continued to be appropriate under the circumstances and in light of the factors and the totality of the services provided as discussed above.
· The Board determined that the economies of scale which may accrue to the Adviser and its affiliates in connection with the management of the fund had been adequately considered by the Adviser in connection with the fee rate charged to the fund pursuant to the Agreement and that, to the extent in the future it were determined that material economies of scale had not been shared with the fund, the Board would seek to have those economies of scale shared with the fund.
In evaluating the Agreements, the Board considered these conclusions and determinations and also relied on its previous knowledge, gained through meetings and other interactions with the Adviser and its affiliates and the Subadviser, of the Adviser and the Subadviser and the services provided to the fund by the Adviser and the Subadviser. The Board also relied on information received on a routine and regular basis throughout the year relating to the operations of the fund and the investment management and other services provided under the Agreements, including information on the investment performance of the fund in comparison to similar mutual funds and benchmark performance indices; general market outlook as applicable to the fund; and compliance reports. In addition, the Board’s consideration of the contractual fee arrangements for this fund had the benefit of a number of years of reviews of the Agreements for the fund, or substantially similar agreements for other BNY Mellon funds that the Board oversees, during which lengthy discussions took place between the Board and representatives of the Adviser. Certain aspects of the arrangements may receive greater scrutiny in some years than in others, and the Board’s conclusions may be based, in part, on their consideration of the fund’s arrangements, or substantially similar arrangements for other BNY Mellon funds that the Board oversees, in prior years. The Board determined to renew the Agreements.
37
BOARD MEMBERS INFORMATION(Unaudited)
INDEPENDENT BOARD MEMBERS
Joseph S. DiMartino (75)
Chairman of the Board (1995)
Principal Occupation During Past 5 Years:
· Corporate Director and Trustee (1995-present)
Other Public Company Board Memberships During Past 5 Years:
· CBIZ (formerly, Century Business Services, Inc.), a provider of outsourcing functions for small and medium size companies, Director (1997-present)
No. of Portfolios for which Board Member Serves:120
———————
Peggy C. Davis (76)
Board Member (2006)
Principal Occupation During Past 5 Years:
· Shad Professor of Law, New York University School of Law (1983-present)
No. of Portfolios for which Board Member Serves: 44
———————
David P. Feldman (79)
Board Member (1996)
Principal Occupation During Past 5 Years:
· Corporate Director and Trustee (1985-present)
Other Public Company Board Memberships During Past 5 Years:
· BBH Mutual Funds Group (5 registered mutual funds), Director (1992-2014)
No. of Portfolios for which Board Member Serves:30
———————
38
Gina D. France (61)
Board Member (2019)
Principal Occupation During Past 5 Years:
· Founder, President and Chief Executive Officer, France Strategic Partners, a strategy and advisory firm serving corporate clients across the United States (2003 –present)
· Corporate Director and Trustee (2004 – current)
Other Public Company Board Memberships During Past 5 Years:
· Huntington Bancshares, a bank holding company headquartered in Columbus, Ohio, Director (2016 – present)
· Cedar Fair, L.P., a publicly-traded partnership that owns and operates amusement parks and hotels in the U.S. and Canada, Director (2011 – present)
· CBIZ (formerly, Century Business Services, Inc.), a provider of outsourcing functions for small and medium size companies, Director (2015 – present)
· FirstMerit Corporation, a diversified financial services company, Director (2004 – 2016)
No. of Portfolios for which Board Member Serves:30
———————
Joan Gulley (72)
Board Member (2017)
Principal Occupation During Past 5 Years:
· PNC Financial Services Group, Inc.(1993-2014), Executive Vice President and Chief Human Resources Officer and Executive Committee Member (2008-2014)
No. of Portfolios for which Board Member Serves:50
———————
Ehud Houminer (79)
Board Member (1993)
Principal Occupation During Past 5 Years:
· Board of Overseers at the Columbia Business School, Columbia University (1992-present)
· Trustee, Ben Gurion University
No. of Portfolios for which Board Member Serves: 50
———————
Lynn Martin (79)
Board Member (2012)
Principal Occupation During Past 5 Years:
· President of The Martin Hall Group LLC, a human resources consulting firm (2005-2012)
No. of Portfolios for which Board Member Serves:30
———————
39
BOARD MEMBERS INFORMATION (Unaudited) (continued)
INDEPENDENT BOARD MEMBERS (continued)
Robin A. Melvin (56)
Board Member (2012)
Principal Occupation During Past 5 Years:
· Co-chairman, Illinois Mentoring Partnership, non-profit organization dedicated to increasing the quantity and quality of mentoring services in Illinois; (2014-present; board member since 2013)
No. of Portfolios for which Board Member Serves:97
———————
Once elected all Board Members serve for an indefinite term, but achieve Emeritus status upon reaching age 80. The address of the Board Members and Officers is c/o BNY Mellon Investment Adviser, Inc. 240 Greenwich Street, New York, New York 10166. Additional information about the Board Members is available in the fund’s Statement of Additional Information which can be obtained from the Adviser free of charge by calling this toll free number: 1-800-373-9387.
James F. Henry, Emeritus Board Member
Dr. Martin Peretz, Emeritus Board Member
Philip L. Toia, Emeritus Board Member
40
OFFICERS OF THE FUND(Unaudited)
RENEE LAROCHE-MORRIS, President since May 2019.
President and a director of BNY Mellon Investment Adviser, Inc. since January 2018. She is an officer of 63 investment companies (comprised of 120 portfolios) managed by the Adviser. She is 48 years old and has been an employee of BNY Mellon since 2003.
JAMES WINDELS, Treasurer since November 2001.
Director- BNY Mellon Fund Administration, and an officer of 64 investment companies (comprised of 143 portfolios) managed by the Adviser. He is 61 years old and has been an employee of the Adviser since April 1985.
BENNETT A. MACDOUGALL, Chief Legal Officer since October 2015.
Chief Legal Officer of the Adviser and Associate General Counsel and Managing Director of BNY Mellon since June 2015; Director and Associate General Counsel of Deutsche Bank – Asset & Wealth Management Division from June 2005 to June 2015, and as Chief Legal Officer of Deutsche Investment Management Americas Inc. from June 2012 to May 2015. He is an officer of 64 investment companies (comprised of 143 portfolios) managed by the Adviser. He is 48 years old and has been an employee of the Adviser since June 2015.
DAVID DIPETRILLO, Vice President since January 2018.
Head of North America Product, BNY Mellon Investment Management since January 2018, Director of Product Strategy, BNY Mellon Investment Management from January 2016 to December 2017; Head of US Retail Product and Channel Marketing, BNY Mellon Investment Management from January 2014 to December 2015. He is an officer of 63 investment companies (comprised of 120 portfolios) managed by the Adviser. He is 41 years old and has been an employee of BNY Mellon since 2005.
JAMES BITETTO, Vice President since August 2005 and Secretary since February 2018.
Managing Counsel of BNY Mellon and Secretary of the Adviser, and an officer of 64 investment companies (comprised of 143 portfolios) managed by the Adviser. He is 53 years old and has been an employee of the Adviser since December 1996.
SONALEE CROSS, Vice President and Assistant Secretary since March 2018.
Counsel of BNY Mellon since October 2016; Associate at Proskauer Rose LLP from April 2016 to September 2016; Attorney at EnTrust Capital from August 2015 to February 2016; Associate at Sidley Austin LLP from September 2013 to August 2015. She is an officer of 64 investment companies (comprised of 143 portfolios) managed by the Adviser. She is 31 years old and has been an employee of the Adviser since October 2016.
DEIRDRE CUNNANE, Vice President and Assistant Secretary since March 2019.
Counsel of BNY Mellon since August 2018; Senior Regulatory Specialist at BNY Mellon Investment Management Services from February 2016 to August 2018; Trustee Associate at BNY Mellon Trust Company (Ireland) Limited from August 2013 to February 2016. She is an officer of 64 investment companies (comprised of 143 portfolios) managed by the Adviser. She is 29 years old and has been an employee of the Adviser since August 2018.
SARAH S. KELLEHER, Vice President and Assistant Secretary since April 2014.
Managing Counsel of BNY Mellon since December 2017, Senior Counsel of BNY Mellon from March 2013 to December 2017. She is an officer of 64 investment companies (comprised of 143 portfolios) managed by the Adviser. She is 44 years old and has been an employee of the Adviser since March 2013.
JEFF PRUSNOFSKY, Vice President and Assistant Secretary since August 2005.
Senior Managing Counsel of BNY Mellon, and an officer of 64 investment companies (comprised of 143 portfolios) managed by the Adviser. He is 54 years old and has been an employee of the Adviser since October 1990.
PETER M. SULLIVAN, Vice President and Assistant Secretary since March 2019.
Managing Counsel of BNY Mellon, and an officer of 64 investment companies (comprised of 143 portfolios) managed by the Adviser. He is 51 years old and has been an employee of the Adviser since April 2004.
41
OFFICERS OF THE FUND (Unaudited)(continued)
NATALYA ZELENSKY, Vice President and Assistant Secretary since March 2017.
Counsel of BNY Mellon since May 2016; Attorney at Wildermuth Endowment Strategy Fund/Wildermuth Advisory, LLC from November 2015 to May 2016 and Assistant General Counsel at RCS Advisory Services from July 2014 to November 2015. She is an officer of 64 investment companies (comprised of 143 portfolios) managed by the Adviser. She is 34 years old and has been an employee of the Adviser since May 2016.
GAVIN C. REILLY, Assistant Treasurer since December 2005.
Tax Manager - BNY Mellon Fund Administration, and an officer of 64 investment companies (comprised of 143 portfolios) managed by the Adviser. He is 51 years old and has been an employee of the Adviser since April 1991.
ROBERT S. ROBOL, Assistant Treasurer since August 2005.
Senior Accounting Manager- BNY Mellon Fund Administration, and an officer of 64 investment companies (comprised of 143 portfolios) managed by the Adviser. He is 55 years old and has been an employee of the Adviser since October 1988.
ROBERT SALVIOLO, Assistant Treasurer since July 2007.
Senior Accounting Manager – BNY Mellon Fund Administration, and an officer of 64 investment companies (comprised of 143 portfolios) managed by the Adviser. He is 52 years old and has been an employee of the Adviser since June 1989.
ROBERT SVAGNA, Assistant Treasurer since December 2002.
Senior Accounting Manager – BNY Mellon Fund Administration, and an officer of 64 investment companies (comprised of 143 portfolios) managed by the Adviser. He is 52 years old and has been an employee of the Adviser since November 1990.
JOSEPH W. CONNOLLY, Chief Compliance Officer since October 2004.
Chief Compliance Officer of the Adviser, the BNY Mellon Family of Funds and BNY Mellon Funds Trust (64 investment companies, comprised of 143 portfolios). He is 62 years old and has served in various capacities with the Adviser since 1980, including manager of the firm’s Fund Accounting Department from 1997 through October 2001.
CARIDAD M. CAROSELLA, Anti-Money Laundering Compliance Officer since January 2016.
Anti-Money Laundering Compliance Officer of the BNY Mellon Family of Funds and BNY Mellon Funds Trust since January 2016; from May 2015 to December 2015, Interim Anti-Money Laundering Compliance Officer of the BNY Mellon Family of Funds and BNY Mellon Funds Trust and the Distributor; from January 2012 to May 2015, AML Surveillance Officer of the Distributor. She is an officer of 57 investment companies (comprised of 136 portfolios) managed by the Adviser. She is 51 years old and has been an employee of the Distributor since 1997.
42
NOTES
43
NOTES
44
NOTES
45
BNY Mellon Structured Midcap Fund
240 Greenwich Street
New York, NY 10286
Adviser
BNY Mellon Investment Adviser, Inc.
240 Greenwich Street
New York, NY 10286
Sub-Adviser
Mellon Investments Corporation
BNY Mellon Center
One Boston Place
Boston, MA 02108-4408
Custodian
The Bank of New York Mellon
240 Greenwich Street
New York, NY 10286
Transfer Agent &
Dividend Disbursing Agent
BNY Mellon Transfer, Inc.
240 Greenwich Street
New York, NY 10286
Distributor
BNY Mellon Securities Corporation
240 Greenwich Street
New York, NY 10286
| | |
Ticker Symbols: | Class A: DPSAX Class C: DPSCX Class I: DPSRX Class Y: DPSYX |
Telephone Call your financial representative or 1-800-373-9387
Mail The BNY Mellon Family of Funds, 144 Glenn Curtiss Boulevard, Uniondale, NY 11556-0144
E-mailSend your request toinfo@bnymellon.com
InternetInformation can be viewed online or downloaded atwww.bnymellonim.com/us
The fund files its complete schedule of portfolio holdings with the Securities and Exchange Commission (“SEC”) for the first and third quarters of each fiscal year on Form N-PORT. The fund’s Forms N-PORT are available on the SEC’s website atwww.sec.gov.
A description of the policies and procedures that the fund uses to determine how to vote proxies relating to portfolio securities and information regarding how the fund voted these proxies for the most recent 12-month period ended June 30 is available atwww.bnymellonim.com/us and on the SEC’s website atwww.sec.gov and without charge, upon request, by calling 1-800-373-9387.
| | |
© 2019 BNY Mellon Securities Corporation
0936AR0819 | 
|
BNY Mellon Technology Growth Fund
| |
ANNUAL REPORT August 31, 2019 |
| |
Save time. Save paper. View your next shareholder report online as soon as it’s available. Log into www.bnymellonim.com/us and sign up for eCommunications. It’s simple and only takes a few minutes. |
| |
The views expressed in this report reflect those of the portfolio manager(s) only through the end of the period covered and do not necessarily represent the views of BNY Mellon Investment Adviser, Inc. or any other person in the BNY Mellon Investment Adviser, Inc. organization. Any such views are subject to change at any time based upon market or other conditions and BNY Mellon Investment Adviser, Inc. disclaims any responsibility to update such views. These views may not be relied on as investment advice and, because investment decisions for a fund in the BNY Mellon Family of Funds are based on numerous factors, may not be relied on as an indication of trading intent on behalf of any fund in the BNY Mellon Family of Funds. |
| |
Not FDIC-Insured • Not Bank-Guaranteed • May Lose Value |
Contents
THE FUND
FOR MORE INFORMATION
Back Cover
| | | | |
| |
BNY Mellon Technology Growth Fund
| | The Fund |
A LETTER FROM THE PRESIDENT OF BNY MELLON INVESTMENT ADVISER, INC.
Dear Shareholder:
We are pleased to present this annual report for BNY Mellon Technology Growth Fund (formerly, Dreyfus Technology Growth Fund), covering the 12-month period from September 1, 2018 through August 31, 2019. For information about how the fund performed during the reporting period, as well as general market perspectives, we provide a Discussion of Fund Performance on the pages that follow.
After a strong summer, equity markets weakened in the fourth quarter of 2018, as concerns about rising interest rates, trade tensions and slowing global growth provided downward pressure on returns. In December 2018, stocks experienced a sharp sell-off, as it appeared that the U.S. Federal Reserve (the “Fed”) would maintain its hawkish stance on monetary policy. In January 2019, the Fed commented that it would slow the pace of interest-rate increases, which helped stimulate a rebound across equity markets that continued into the second quarter. Escalating trade tensions disrupted equity markets again in May. The dip was short-lived, as markets rose once again in June. However, despite continued supportive central bank policies, pockets of volatility persisted through the end of the period.
In fixed-income markets, returns were hampered early in the reporting period by rising interest rates and accelerating inflation. With the return of stock market volatility in October 2018, a flight to quality led to a rise in prices for U.S. Treasuries that continued through the end of the year, leading to a flattening yield curve. After the Fed’s supportive statements in January 2019, other developed market central banks followed suit and reiterated their abilities to bolster flagging growth by continuing supportive policies. This helped to further buoy fixed-income instrument prices. At the end of July, the Fed cut the federal funds rate by 25 basis points. Both the U.S. and Global Bloomberg Barclays Aggregate Bond indices produced strong returns for the 12 months.
We believe that over the near term, the outlook for the U.S. remains positive, but we will monitor relevant data for any signs of a change. As always, we encourage you to discuss the risks and opportunities in today’s investment environment with your financial advisor.
Thank you for your continued confidence and support.
Sincerely,

Renee LaRoche-Morris
President
BNY Mellon Investment Adviser, Inc.
September 16, 2019
2
DISCUSSION OF FUND PERFORMANCE(Unaudited)
For the period from September 1, 2018 through August 31, 2019, as provided by Barry K. Mills, and Erik Swords, portfolio managers
Market and Fund Performance Overview
For the 12-month period ended August 31, 2019, BNY Mellon Technology Growth Fund’s (formerly, Dreyfus Technology Growth Fund) Class A shares produced a total return of -4.38%, Class C shares returned -5.10%, Class I shares returned -4.16% and Class Y shares returned -4.11%.1 In comparison, the fund’s benchmarks, the NYSE® Technology Index and the S&P 500® Index, produced total returns of 0.97% and 2.92%, respectively, over the same period.2,3
Equities gained ground during the reporting period amid steady economic growth. The fund’s focus on technology stocks caused it to lag the broader market, but security selection also detracted from returns.
The Fund’s Investment Approach
The fund seeks capital appreciation. To pursue its goal, the fund normally invests at least 80% of its net assets, plus any borrowings for investment purposes, in the stocks of growth companies of any size that BNY Mellon Investment Adviser, Inc., the fund’s investment adviser, believes to be leading producers or beneficiaries of technological innovation. Up to 25% of the fund’s assets may be invested in foreign securities. In choosing stocks, the fund looks for technology companies with the potential for strong earnings or revenue growth rates. The fund’s investment process centers on a multidimensional approach that looks for opportunities across emerging growth, cyclical or stable growth companies.
Information Technology Stocks Continue to Benefit from Capital Spending
Despite some concerns about trade relations, economic momentum continued through the reporting period. Buoyant levels of consumer and business confidence provided further support for stocks, and corporate earnings continued to benefit from tax cuts passed late in 2017. Technology stocks benefited from high levels of capital expenditures and from stock buybacks.
But the market’s performance early in the reporting period was constrained by concerns about trade tensions and aggressive interest-rate hikes by the Federal Reserve (the “Fed”). These factors, combined with high market valuations, disappointing earnings reports and concerns about future earnings growth, resulted in a sharp sell-off early in December, particularly among technology companies.
The Fed’s decision after its mid-December meeting to back off its aggressive tightening stance led to a rebound that persisted into early 2019, reversing the early December sell-off despite ongoing concerns about the global economy. But the rebound in 2019 merely retraced the December sell-off.
Growth-oriented technology stocks performed well during the first quarter of 2019, while more cyclical sectors, semiconductors in particular, surged despite the approaching bottom of the industry’s normal cycle and concern about geopolitical risks arising in China. In the second quarter of 2019, growth stocks in technology began to underperform, perhaps due to elevated valuations or due to increased supply resulting from a number of initial public offerings. The semiconductor industry, on the other hand, continued to perform well despite a downturn among its primary customers, including makers of personal computers and autos. As a result, though technology stocks were essentially flat for the 12-month reporting period, they posted strong returns through the first eight months of 2019.
Stock Selection Hindered Performance
Returns were hampered primarily by an underweight to the semiconductor industry and by unfavorable stock selections. As for stock selection, the fund’s decision to sellFacebookdetracted from performance, as the stock rebounded strongly after Congressional hearings about privacy concerns late
3
DISCUSSION OF FUND PERFORMANCE(Unaudited) (continued)
in 2018 had depressed returns early in the reporting period. Similarly, competitive pressures resulted in a poor financial report byRoku, a manufacturer of streaming media devices, in the fourth quarter of 2018, which led the fund to sell its position, but the stock bounced back strongly in 2019. A position inGrubhub, a restaurant meal delivery service, also was a drag on the fund’s returns, as the company experienced competitive and regulatory pressures.
On a more positive note, the fund’s overweight to the software sector benefited performance, as did certain stock picks. A position in Visa, for example, performed well on the company’s continued dominance in the electronic payments industry. A position inCoStar Group, a provider of software for the management of commercial real estate, benefited as the company continued to report strong results. In information technology, the fund’s position in Xilinx, a chipmaker, continued to benefit from ongoing trends in artificial intelligence and 5G communications. The fund’s holding ofCisco Systems, a communications technology company, hurt performance because the stock reached the fund’s target price, leading the fund to sell it late in 2018. But the stock continued to perform well in 2019, as the company continued to achieve success with its move to a more subscription-based business model.
Economic Conditions Bode Well for Technology
Many technology companies appear well positioned to benefit from the ongoing surge in capital spending. Much of this spending is being driven by an acceleration in digital transformation, a multi-year trend that encompasses artificial intelligence, 5G telecommunications, blockchain, the Internet of Things, social media and next-generation payments, among other themes. Therefore, we remain optimistic regarding the sector’s prospects. At the end of the reporting period, we continued to find attractive opportunities in fast-growing industries, such as telecommunications equipment, enterprise software, robotics and gene analysis.
September 16, 2019
1 Total return includes reinvestment of dividends and any capital gains paid and does not take into consideration the maximum initial sales charge in the case of Class A shares, or the applicable contingent deferred sales charge imposed on redemptions in the case of Class C shares. Had these charges been reflected, returns would have been lower. Past performance is no guarantee of future results. Share price, yield, and investment return fluctuate such that upon redemption, fund shares may be worth more or less than their original cost.
2 Source: Bloomberg L.P. — The NYSE® Technology Index is an equal-dollar-weighted index designed to objectively represent the technology sector by holding 35 of the leading U.S. technology-related companies. Investors cannot invest directly in any index.
3 Source: Lipper Inc. — The S&P 500® Index is widely regarded as the best single gauge of large-cap U.S. equities. The index includes 500 leading companies and captures approximately 80% coverage of available market capitalization. Investors cannot invest directly in any index.
Please note: the position in any security highlighted with italicized typeface was sold during the reporting period.
Equities are subject generally to market, market sector, market liquidity, issuer and investment style risks, among other factors, to varying degrees, all of which are more fully described in the fund’s prospectus.
The technology sector has been among the most volatile sectors of the stock market. Technology companies involve greater risk because their revenue and/or earnings tend to be less predictable, and some companies may be experiencing significant losses.
4
FUND PERFORMANCE(Unaudited)
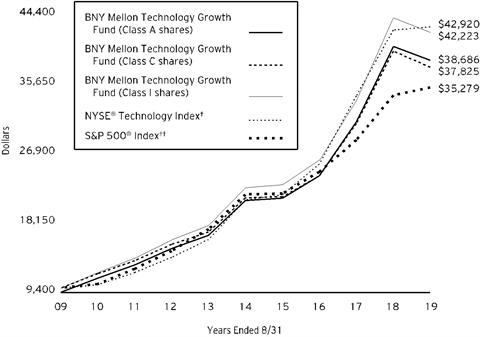
Comparison of change in value of a $10,000 investment in Class A shares, Class C shares, and Class I shares of BNY Mellon Technology Growth Fund with a hypothetical investment of $10,000 in the NYSE® Technology Index and the S&P 500® Index.
† Source: Bloomberg L.P.
†† Source: Lipper Inc.
Past performance is not predictive of future performance.
The above graph compares a hypothetical $10,000 investment made in each of the Class A, Class C, and Class I shares of BNY Mellon Technology Growth Fund on 8/31/09 to a hypothetical investment of $10,000 made in each of the S&P 500® Index and the NYSE®Technology Index on that date. All dividends and capital gain distributions are reinvested.
The fund’s performance shown in the line graph above takes into account the maximum initial sales charge on Class A shares and all other applicable fees and expenses on all classes. The NYSE® Technology Index is an equal-dollar weighted index designed to objectively represent the technology sector by holding 35 of the leading U.S. technology-related companies. The S&P 500® Index is widely regarded as the best single gauge of large-cap U.S. equities. The index includes 500 leading companies and captures approximately 80% coverage of available market capitalization. Unlike a mutual fund, the indices are not subject to charges, fees and other expenses. Investors cannot invest directly in any index. Further information relating to fund performance, including expense reimbursements, if applicable, is contained in the Financial Highlights section of the prospectus and elsewhere in this report.
5
FUND PERFORMANCE(Unaudited) (continued)
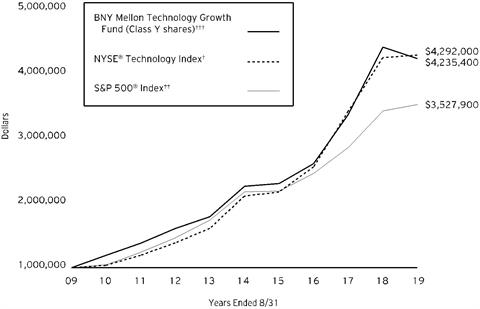
Comparison of change in value of a $1,000,000 investment in Class Y shares of BNY Mellon Technology Growth Fund with a hypothetical investment of $1,000,000 in the NYSE® Technology Index and S&P 500® Index.
† Source: Bloomberg L.P.
†† Source: Lipper Inc.
††† The total return figures presented for Class Y shares of the fund reflect the performance of the fund’s Class I shares for the period prior to 9/30/16 (the inception date for Class Y shares).
Past performance is not predictive of future performance.
The above graph compares a hypothetical $1,000,000 investment made in Class Y shares of BNY Mellon Technology Growth Fund on 8/31/09 to a hypothetical investment of $1,000,000 made in each of the S&P 500® Index and the NYSE®Technology Index on that date. All dividends and capital gain distributions are reinvested.
The fund’s performance shown in the line graph above takes into account the maximum initial sales charge on Class A shares and all other applicable fees and expenses on all classes. The NYSE® Technology Index is an equal-dollar weighted index designed to objectively represent the technology sector by holding 35 of the leading U.S. technology-related companies. The S&P 500® Index is widely regarded as the best single gauge of large-cap U.S. equities. The index includes 500 leading companies and captures approximately 80% coverage of available market capitalization. Unlike a mutual fund, the indices are not subject to charges, fees and other expenses. Investors cannot invest directly in any index. Further information relating to fund performance, including expense reimbursements, if applicable, is contained in the Financial Highlights section of the prospectus and elsewhere in this report.
6
| | | | | |
Average Annual Total Returns as of 8/31/19 |
| | Inception Date | 1 Year | 5 Years | 10 Years |
Class A shares | | | | |
with maximum sales charge (5.75%) | 10/13/1997 | -9.88% | 11.65% | 14.49% |
without sales charge | 10/13/1997 | -4.38% | 12.98% | 15.17% |
Class C shares | | | | |
with applicable redemption charge† | 4/15/1999 | -5.77% | 12.10% | 14.23% |
without redemption | 4/15/1999 | -5.10% | 12.10% | 14.23% |
Class I shares | 4/15/1999 | -4.16% | 13.27% | 15.49% |
Class Y shares | 9/30/2016 | -4.11% | 13.34%†† | 15.53%†† |
NYSE® Technology Index | | 0.97% | 15.26% | 15.68% |
S&P 500® Index | | 2.92% | 10.11% | 13.44% |
† The maximum contingent deferred sales charge for Class C shares is 1% for shares redeemed within one year of the date of purchase.
†† The total return performance figures presented for Class Y shares of the fund reflect the performance of the fund’s Class I shares for the period prior to 9/30/16 (the inception date for Class Y shares).
The performance data quoted represents past performance, which is no guarantee of future results. Share price and investment return fluctuate and an investor’s shares may be worth more or less than original cost upon redemption. Current performance may be lower or higher than the performance quoted. Go to im.bnymellon.com for the fund’s most recent month-end returns.
The fund’s performance shown in the graphs and table does not reflect the deduction of taxes that a shareholder would pay on fund distributions or the redemption of fund shares. In addition to the performance of Class A shares shown with and without a maximum sales charge, the fund’s performance shown in the table takes into account all other applicable fees and expenses on all classes.
7
UNDERSTANDING YOUR FUND’S EXPENSES(Unaudited)
As a mutual fund investor, you pay ongoing expenses, such as management fees and other expenses. Using the information below, you can estimate how these expenses affect your investment and compare them with the expenses of other funds. You also may pay one-time transaction expenses, including sales charges (loads) and redemption fees, which are not shown in this section and would have resulted in higher total expenses. For more information, see your fund’s prospectus or talk to your financial adviser.
Review your fund’s expenses
The table below shows the expenses you would have paid on a $1,000 investment in BNY Mellon Technology Growth Fund from March 1, 2019 to August 31, 2019. It also shows how much a $1,000 investment would be worth at the close of the period, assuming actual returns and expenses.
| | | | | | | |
Expenses and Value of a $1,000 Investment | |
Assume actual returns for the six months ended August 31, 2019 | |
| | | | | | |
| | Class A | Class C | Class I | Class Y | |
Expense paid per $1,000† | $6.15 | $9.89 | $4.98 | $4.52 | |
Ending value (after expenses) | $1,015.30 | $1,011.30 | $1,016.30 | $1,016.90 | |
COMPARING YOUR FUND’S EXPENSES
WITH THOSE OF OTHER FUNDS(Unaudited)
Using the SEC’s method to compare expenses
The Securities and Exchange Commission (“SEC”) has established guidelines to help investors assess fund expenses. Per these guidelines, the table below shows your fund’s expenses based on a $1,000 investment, assuming a hypothetical 5% annualized return. You can use this information to compare the ongoing expenses (but not transaction expenses or total cost) of investing in the fund with those of other funds. All mutual fund shareholder reports will provide this information to help you make this comparison. Please note that you cannot use this information to estimate your actual ending account balance and expenses paid during the period.
| | | | | | | |
Expenses and Value of a $1,000 Investment | |
Assuming a hypothetical 5% annualized return for the six months ended August 31, 2019 | |
| | | | | | |
| | Class A | Class C | Class I | Class Y | |
Expense paid per $1,000† | $6.16 | $9.91 | $4.99 | $4.53 | |
Ending value (after expenses) | $1,019.11 | $1,015.38 | $1,020.27 | $1,020.72 | |
† Expenses are equal to the fund‘s annualized expense ratio of 1.21% for Class A, 1.95% for Class C, .98% for Class I and .89% for Class Y, multiplied by the average account value over the period, multiplied by 184/365 (to reflect the one-half year period). |
8
STATEMENT OF INVESTMENTS
August 31, 2019
| | | | | | | | |
| |
Description | | | | Shares | | Value ($) | |
Common Stocks - 98.7% | | | | | |
Media & Entertainment - 7.8% | | | | | |
Spotify Technology | | | | 20,971 | a,b | 2,830,036 | |
Tencent Holdings | | | | 207,300 | | 8,587,705 | |
Twitter | | | | 273,041 | b | 11,645,199 | |
| | | | | 23,062,940 | |
Retailing - 9.1% | | | | | |
Alibaba Group Holding, ADR | | | | 68,400 | b | 11,972,052 | |
Amazon.com | | | | 8,429 | b | 14,972,348 | |
| | | | | 26,944,400 | |
Semiconductors & Semiconductor Equipment - 23.5% | | | | | |
Advanced Micro Devices | | | | 236,417 | a,b | 7,435,315 | |
Broadcom | | | | 35,165 | | 9,939,035 | |
Cree | | | | 75,434 | b | 3,238,382 | |
KLA | | | | 34,646 | | 5,124,143 | |
Microchip Technology | | | | 126,206 | a | 10,895,364 | |
Qualcomm | | | | 176,221 | | 13,704,707 | |
Taiwan Semiconductor Manufacturing, ADR | | | | 247,258 | | 10,540,609 | |
Xilinx | | | | 83,028 | | 8,639,894 | |
| | | | | 69,517,449 | |
Software & Services - 51.7% | | | | | |
Adobe | | | | 46,271 | b | 13,164,562 | |
DocuSign | | | | 61,655 | a,b | 2,878,672 | |
Everbridge | | | | 52,227 | b | 4,501,967 | |
HubSpot | | | | 43,895 | b | 8,764,954 | |
International Business Machines | | | | 82,622 | | 11,197,760 | |
Microsoft | | | | 89,332 | | 12,315,310 | |
Palo Alto Networks | | | | 29,403 | b | 5,987,039 | |
PayPal Holdings | | | | 119,379 | b | 13,018,280 | |
Rapid7 | | | | 57,104 | b | 3,065,914 | |
Salesforce.com | | | | 94,149 | b | 14,693,834 | |
ServiceNow | | | | 49,250 | b | 12,895,620 | |
Shopify, Cl. A | | | | 15,230 | b | 5,869,490 | |
Slack Technologies, Cl. A | | | | 197,632 | a,b | 5,660,180 | |
Splunk | | | | 88,741 | b | 9,923,019 | |
Square, Cl. A | | | | 204,024 | a,b | 12,616,844 | |
Twilio, Cl. A | | | | 46,020 | a,b | 6,004,229 | |
Visa, Cl. A | | | | 33,167 | a | 5,997,257 | |
Zendesk | | | | 53,117 | b | 4,259,983 | |
| | | | | 152,814,914 | |
Technology Hardware & Equipment - 5.7% | | | | | |
Cognex | | | | 53,953 | | 2,432,201 | |
9
STATEMENT OF INVESTMENTS (continued)
| | | | | | | | |
| |
Description | | | | Shares | | Value ($) | |
Common Stocks - 98.7% (continued) | | | | | |
Technology Hardware & Equipment - 5.7% (continued) | | | | | |
Corning | | | | 107,292 | | 2,988,082 | |
FLIR Systems | | | | 106,330 | | 5,238,879 | |
Western Digital | | | | 104,481 | | 5,983,627 | |
| | | | | 16,642,789 | |
Telecommunication Services - .9% | | | | | |
Bandwidth, Cl. A | | | | 30,697 | b | 2,676,471 | |
Total Common Stocks(cost $234,437,961) | | | | 291,658,963 | |
| | | 1-Day
Yield (%) | | | | | |
Investment Companies - .8% | | | | | |
Registered Investment Companies - .8% | | | | | |
Dreyfus Institutional Preferred Government Plus Money Market Fund
(cost $2,339,842) | | 2.09 | | 2,339,842 | c | 2,339,842 | |
| | | | | | | | |
Investment of Cash Collateral for Securities Loaned - 2.0% | | | | | |
Registered Investment Companies - 2.0% | | | | | |
Dreyfus Institutional Preferred Government Plus Money Market Fund
(cost $6,016,391) | | 2.09 | | 6,016,391 | c | 6,016,391 | |
Total Investments(cost $242,794,194) | | 101.5% | | 300,015,196 | |
Liabilities, Less Cash and Receivables | | (1.5%) | | (4,501,710) | |
Net Assets | | 100.0% | | 295,513,486 | |
ADR—American Depository Receipt
a Security, or portion thereof, on loan. At August 31, 2019, the value of the fund’s securities on loan was $45,360,299 and the value of the collateral was $46,885,516, consisting of cash collateral of $6,016,391 and U.S. Government & Agency securities valued at $40,869,125.
b Non-income producing security.
c Investment in affiliated issuer. The investment objective of this investment company is publicly available and can be found within the investment company’s prospectus.
| | |
Portfolio Summary (Unaudited)† | Value (%) |
Information Technology | 80.9 |
Consumer Discretionary | 9.1 |
Communication Services | 8.7 |
Investment Companies | 2.8 |
| | 101.5 |
† Based on net assets.
See notes to financial statements.
10
STATEMENT OF INVESTMENTS IN AFFILIATED ISSUERS
| | | | | | | |
Investment Companies | Value
8/31/18 ($) | Purchases ($) | Sales ($) | Value
8/31/19 ($) | Net
Assets (%) | Dividends/
Distributions ($) |
Registered Investment Companies: |
Dreyfus Institutional Preferred Government Plus Money Market Fund | 9,671,575 | 83,145,488 | 90,477,221 | 2,339,842 | .8 | 123,350 |
Investment of Cash Collateral for Securities Loaned:† |
Dreyfus Institutional Preferred Government Money Market Fund, Institutional Shares | 3,057,267 | 8,477,588 | 11,534,855 | - | - | - |
Dreyfus Institutional Preferred Government Plus Money Market Fund | - | 17,411,236 | 11,394,845 | 6,016,391 | 2.0 | - |
Total | 12,728,842 | 109,034,312 | 113,406,921 | 8,356,233 | 2.8 | 123,350 |
† Effective January 2, 2019, cash collateral for securities lending was transferred from Dreyfus Institutional Preferred Government Money Market Fund, Institutional Shares to Dreyfus Institutional Preferred Government Plus Money Market Fund.
See notes to financial statements.
11
STATEMENT OF ASSETS AND LIABILITIES
August 31, 2019
| | | | | | | |
| | | | | | |
| | | Cost | | Value | |
Assets ($): | | | | |
Investments in securities—See Statement of Investments
(including securities on loan, valued at $45,360,299)—Note 1(c): | | | |
Unaffiliated issuers | 234,437,961 | | 291,658,963 | |
Affiliated issuers | | 8,356,233 | | 8,356,233 | |
Cash denominated in foreign currency | | | 46,448 | | 46,264 | |
Receivable for investment securities sold | | 5,721,202 | |
Dividends, interest and securities lending income receivable | | 310,292 | |
Receivable for shares of Common Stock subscribed | | 31,730 | |
Prepaid expenses | | | | | 63,059 | |
| | | | | 306,187,743 | |
Liabilities ($): | | | | |
Due to BNY Mellon Investment Adviser, Inc. and affiliates—Note 3(c) | | 284,403 | |
Liability for securities on loan—Note 1(c) | | 6,016,391 | |
Payable for investment securities purchased | | 3,903,777 | |
Payable for shares of Common Stock redeemed | | 354,349 | |
Directors fees and expenses payable | | 8,403 | |
Other accrued expenses | | | | | 106,934 | |
| | | | | 10,674,257 | |
Net Assets ($) | | | 295,513,486 | |
Composition of Net Assets ($): | | | | |
Paid-in capital | | | | | 194,655,316 | |
Total distributable earnings (loss) | | | | | 100,858,170 | |
Net Assets ($) | | | 295,513,486 | |
| | | | | | |
Net Asset Value Per Share | Class A | Class C | Class I | Class Y | |
Net Assets ($) | 263,227,278 | 8,754,129 | 23,366,644 | 165,435 | |
Shares Outstanding | 6,016,169 | 286,892 | 468,499 | 3,303.55 | |
Net Asset Value Per Share ($) | 43.75 | 30.51 | 49.88 | 50.08 | |
| | | | | |
See notes to financial statements. | | | | | |
12
STATEMENT OF OPERATIONS
Year Ended August 31, 2019
| | | | | | | |
| | | | | | |
| | | | | | |
Investment Income ($): | | | | |
Income: | | | | |
Cash dividends (net of $67,962 foreign taxes withheld at source): | |
Unaffiliated issuers | | | 3,092,978 | |
Affiliated issuers | | | 123,350 | |
Income from securities lending—Note 1(c) | | | 30,147 | |
Total Income | | | 3,246,475 | |
Expenses: | | | | |
Management fee—Note 3(a) | | | 2,318,614 | |
Shareholder servicing costs—Note 3(c) | | | 1,066,497 | |
Professional fees | | | 91,363 | |
Distribution fees—Note 3(b) | | | 78,986 | |
Registration fees | | | 73,681 | |
Prospectus and shareholders’ reports | | | 34,431 | |
Directors’ fees and expenses—Note 3(d) | | | 31,600 | |
Custodian fees—Note 3(c) | | | 6,407 | |
Loan commitment fees—Note 2 | | | 5,821 | |
Miscellaneous | | | 12,676 | |
Total Expenses | | | 3,720,076 | |
Investment (Loss)—Net | | | (473,601) | |
Realized and Unrealized Gain (Loss) on Investments—Note 4 ($): | | |
Net realized gain (loss) on investments and foreign currency transactions | 66,517,652 | |
Net change in unrealized appreciation (depreciation) on investments
and foreign currency transactions | (83,415,357) | |
Net Realized and Unrealized Gain (Loss) on Investments | | | (16,897,705) | |
Net (Decrease) in Net Assets Resulting from Operations | | (17,371,306) | |
| | | | | | |
See notes to financial statements. | | | | | |
13
STATEMENT OF CHANGES IN NET ASSETS
| | | | | | | | | | |
| | | | Year Ended August 31, |
| | | | 2019 | | 2018a | |
Operations ($): | | | | | | | | |
Investment (loss)—net | | | (473,601) | | | | (1,176,572) | |
Net realized gain (loss) on investments | | 66,517,652 | | | | 47,539,757 | |
Net change in unrealized appreciation
(depreciation) on investments | | (83,415,357) | | | | 38,682,753 | |
Net Increase (Decrease) in Net Assets
Resulting from Operations | (17,371,306) | | | | 85,045,938 | |
Distributions ($): | |
Distributions to shareholders: | | | | | | | | |
Class A | | | (57,320,868) | | | | (23,004,524) | |
Class C | | | (3,167,730) | | | | (2,842,926) | |
Class I | | | (5,279,305) | | | | (1,868,874) | |
Class Y | | | (2,445) | | | | (1,051) | |
Total Distributions | | | (65,770,348) | | | | (27,717,375) | |
Capital Stock Transactions ($): | |
Net proceeds from shares sold: | | | | | | | | |
Class A | | | 18,810,054 | | | | 34,790,832 | |
Class C | | | 961,447 | | | | 2,052,576 | |
Class I | | | 8,131,915 | | | | 24,973,003 | |
Class Y | | | 152,987 | | | | - | |
Distributions reinvested: | | | | | | | | |
Class A | | | 53,076,388 | | | | 21,160,000 | |
Class C | | | 2,756,294 | | | | 2,656,571 | |
Class I | | | 5,172,566 | | | | 1,616,707 | |
Cost of shares redeemed: | | | | | | | | |
Class A | | | (46,362,030) | | | | (43,499,300) | |
Class C | | | (4,723,199) | | | | (16,682,659) | |
Class I | | | (17,879,087) | | | | (16,174,670) | |
Increase (Decrease) in Net Assets
from Capital Stock Transactions | 20,097,335 | | | | 10,893,060 | |
Total Increase (Decrease) in Net Assets | (63,044,319) | | | | 68,221,623 | |
Net Assets ($): | |
Beginning of Period | | | 358,557,805 | | | | 290,336,182 | |
End of Period | | | 295,513,486 | | | | 358,557,805 | |
14
| | | | | | | | | | |
| | | | Year Ended August 31, |
| | | | 2019 | | 2018a | |
Capital Share Transactions (Shares): | |
Class Ab,c | | | | | | | | |
Shares sold | | | 417,502 | | | | 665,564 | |
Shares issued for distributions reinvested | | | 1,363,379 | | | | 432,720 | |
Shares redeemed | | | (1,018,096) | | | | (812,775) | |
Net Increase (Decrease) in Shares Outstanding | 762,785 | | | | 285,509 | |
Class Cc | | | | | | | | |
Shares sold | | | 31,320 | | | | 49,529 | |
Shares issued for distributions reinvested | | | 101,002 | | | | 70,224 | |
Shares redeemed | | | (146,739) | | | | (427,238) | |
Net Increase (Decrease) in Shares Outstanding | (14,417) | | | | (307,485) | |
Class Ib | | | | | | | | |
Shares sold | | | 151,559 | | | | 415,708 | |
Shares issued for distributions reinvested | | | 116,741 | | | | 29,933 | |
Shares redeemed | | | (331,836) | | | | (273,813) | |
Net Increase (Decrease) in Shares Outstanding | (63,536) | | | | 171,828 | |
Class Y | | | | | | | | |
Shares sold | | | 3,087 | | | | - | |
Net Increase (Decrease) in Shares Outstanding | 3,087 | | | | - | |
| | | | | | | | | |
a Distributions fto shareholders include only distributions from net realized gain on investments. | |
b During the period ended August 31, 2019, 803 Class A shares representing $47,184 were exchanged for 726 Class I shares and during the period ended August 31, 2018, 135 Class A shares representing $7,362 were exchanged for 123 Class I shares. | |
c During the period ended August 31, 2019, 2,526 Class C shares representing $82,170 were automatically converted to 1,798 Class A shares and during the period ended August 31, 2018, 30,167 Class C shares representing $1,500,791 were automatically converted to 39,000 Class A shares. | |
See notes to financial statements.
| | | | | | | | |
15
FINANCIAL HIGHLIGHTS
The following tables describe the performance for each share class for the fiscal periods indicated. All information (except portfolio turnover rate) reflects financial results for a single fund share. Total return shows how much your investment in the fund would have increased (or decreased) during each period, assuming you had reinvested all dividends and distributions. These figures have been derived from the fund’s financial statements.
| | | | | | | |
| | |
| | Year Ended August 31, |
Class A Shares | | 2019 | 2018 | 2017 | 2016 | 2015 |
Per Share Data ($): | | | | | | |
Net asset value, beginning of period | | 59.03 | 49.66 | 42.56 | 40.03 | 47.28 |
Investment Operations: | | | | | | |
Investment (loss)—neta | | (.07) | (.18) | (.18) | (.21) | (.26) |
Net realized and unrealized
gain (loss) on investments | | (3.93) | 14.40 | 11.13 | 5.32 | .75 |
Total from Investment Operations | | (4.00) | 14.22 | 10.95 | 5.11 | .49 |
Distributions: | | | | | | |
Dividends from net realized
gain on investments | | (11.28) | (4.85) | (3.85) | (2.58) | (7.74) |
Net asset value, end of period | | 43.75 | 59.03 | 49.66 | 42.56 | 40.03 |
Total Return (%)b | | (4.38) | 30.67 | 28.34 | 13.23 | 1.40 |
Ratios/Supplemental Data (%): | | | | | | |
Ratio of total expenses
to average net assets | | 1.20 | 1.22 | 1.26 | 1.28 | 1.28 |
Ratio of net expenses
to average net assets | | 1.20 | 1.22 | 1.26 | 1.28 | 1.28 |
Ratio of net investment (loss)
to average net assets | | (.15) | (.34) | (.40) | (.53) | (.61) |
Portfolio Turnover Rate | | 69.92 | 49.14 | 58.27 | 37.76 | 67.23 |
Net Assets, end of period ($ x 1,000) | | 263,227 | 310,110 | 246,693 | 214,185 | 218,398 |
a Based on average shares outstanding.
b Exclusive of sales charge.
See notes to financial statements.
16
| | | | | | | |
| | | |
| | | Year Ended August 31, |
Class C Shares | | 2019 | 2018 | 2017 | 2016 | 2015 |
Per Share Data ($): | | | | | | |
Net asset value, beginning of period | | 45.44 | 39.52 | 34.92 | 33.55 | 41.17 |
Investment Operations: | | | | | | |
Investment (loss)—neta | | (.29) | (.47) | (.43) | (.44) | (.52) |
Net realized and unrealized
gain (loss) on investments | | (3.36) | 11.24 | 8.88 | 4.39 | .64 |
Total from Investment Operations | | (3.65) | 10.77 | 8.45 | 3.95 | .12 |
Distributions: | | | | | | |
Dividends from net realized
gain on investments | | (11.28) | (4.85) | (3.85) | (2.58) | (7.74) |
Net asset value, end of period | | 30.51 | 45.44 | 39.52 | 34.92 | 33.55 |
Total Return (%)b | | (5.10) | 29.74 | 27.30 | 12.27 | .61 |
Ratios/Supplemental Data (%): | | | | | | |
Ratio of total expenses
to average net assets | | 1.92 | 1.96 | 2.07 | 2.10 | 2.08 |
Ratio of net expenses
to average net assets | | 1.92 | 1.96 | 2.07 | 2.09 | 2.08 |
Ratio of net investment (loss)
to average net assets | | (.88) | (1.14) | (1.21) | (1.34) | (1.41) |
Portfolio Turnover Rate | | 69.92 | 49.14 | 58.27 | 37.76 | 67.23 |
Net Assets, end of period ($ x 1,000) | | 8,754 | 13,692 | 24,060 | 24,544 | 25,028 |
a Based on average shares outstanding.
b Exclusive of sales charge.
See notes to financial statements.
17
FINANCIAL HIGHLIGHTS (continued)
| | | | | | | |
| | | |
| | | Year Ended August 31, |
Class I Shares | | 2019 | 2018 | 2017 | 2016 | 2015 |
Per Share Data ($): | | | | | | |
Net asset value, beginning of period | | 65.30 | 54.34 | 46.09 | 43.05 | 50.14 |
Investment Operations: | | | | | | |
Investment income (loss)—neta | | .04 | (.07) | (.06) | (.12) | (.16) |
Net realized and unrealized
gain (loss) on investments | | (4.18) | 15.88 | 12.16 | 5.74 | .81 |
Total from Investment Operations | | (4.14) | 15.81 | 12.10 | 5.62 | .65 |
Distributions: | | | | | | |
Dividends from net realized
gain on investments | | (11.28) | (4.85) | (3.85) | (2.58) | (7.74) |
Net asset value, end of period | | 49.88 | 65.30 | 54.34 | 46.09 | 43.05 |
Total Return (%) | | (4.16) | 30.97 | 28.69 | 13.49 | 1.69 |
Ratios/Supplemental Data (%): | | | | | | |
Ratio of total expenses
to average net assets | | .96 | .99 | 1.00 | 1.03 | 1.02 |
Ratio of net expenses
to average net assets | | .96 | .99 | 1.00 | 1.03 | 1.02 |
Ratio of net investment
income (loss) to average net assets | | .08 | (.11) | (.13) | (.27) | (.36) |
Portfolio Turnover Rate | | 69.92 | 49.14 | 58.27 | 37.76 | 67.23 |
Net Assets, end of period ($ x 1,000) | | 23,367 | 34,742 | 19,572 | 17,675 | 16,659 |
a Based on average shares outstanding.
See notes to financial statements.
18
| | | | | |
| | | |
| | | Year Ended August 31, |
Class Y Shares | | 2019 | 2018 | 2017a |
Per Share Data ($): | | | | |
Net asset value, beginning of period | | 65.48 | 54.40 | 46.16 |
Investment Operations: | | | | |
Investment income—netb | | .14 | .01 | .00c |
Net realized and unrealized
gain (loss) on investments | | (4.26) | 15.92 | 12.09 |
Total from Investment Operations | | (4.12) | 15.93 | 12.09 |
Distributions: | | | | |
Dividends from net realized
gain on investments | | (11.28) | (4.85) | (3.85) |
Net asset value, end of period | | 50.08 | 65.48 | 54.40 |
Total Return (%) | | (4.11) | 31.16 | 28.63d |
Ratios/Supplemental Data (%): | | | | |
Ratio of total expenses
to average net assets | | .89 | .85 | .89e |
Ratio of net expenses
to average net assets | | .89 | .85 | .89e |
Ratio of net investment income
to average net assets | | .26 | .02 | .01e |
Portfolio Turnover Rate | | 69.92 | 49.14 | 58.27 |
Net Assets, end of period ($ x 1,000) | | 165 | 14 | 12 |
a From September 30, 2016 (commencement of initial offering) to August 31, 2017.
b Based on average shares outstanding.
c Amount represents less than $.01 per share.
d Not annualized.
e Annualized.
See notes to financial statements.
19
NOTES TO FINANCIAL STATEMENTS
NOTE 1—Significant Accounting Policies:
BNY Mellon Technology Growth Fund (the “fund”) is a separate diversified series of BNY Mellon Advantage Funds, Inc. (the “Company”), which is registered under the Investment Company Act of 1940, as amended (the “Act”), as an open-end management investment company and operates as a series company currently offering nine series, including the fund. The fund’s investment objective is to seek capital appreciation. BNY Mellon Investment Adviser, Inc. (the “Adviser”), a wholly-owned subsidiary of The Bank of New York Mellon Corporation (“BNY Mellon”), serves as the fund’s investment adviser.
Effective June 3, 2019, the fund changed its name from Dreyfus Technology Growth Fund to BNY Mellon Technology Growth Fund and the Company changed its name from Advantage Funds, Inc. to BNY Mellon Advantage Funds, Inc. In addition, The Dreyfus Corporation, the fund’s investment adviser, changed its name to “BNY Mellon Investment Adviser, Inc.”, MBSC Securities Corporation, the fund’s distributor, changed its name to “BNY Mellon Securities Corporation” and Dreyfus Transfer, Inc., the fund’s transfer agent, changed its name to “BNY Mellon Transfer, Inc.”
BNY Mellon Securities Corporation (the “Distributor”), a wholly-owned subsidiary of the Adviser, is the distributor of the fund’s shares. The fund is authorized to issue 700 million shares of $.001 par value Common Stock. The fund currently has authorized five classes of shares: Class A (200 million shares authorized), Class C (100 million shares authorized), Class I (200 million shares authorized), Class T (100 million shares authorized), and Class Y (100 million shares authorized). Class A and Class T shares generally are subject to a sales charge imposed at the time of purchase. Class C shares are subject to a contingent deferred sales charge (“CDSC”) imposed on Class C shares redeemed within one year of purchase. Class C shares automatically convert to Class A shares ten years after the date of purchase, without the imposition of a sales charge. Class I and Class Y shares are sold at net asset value per share generally to institutional investors. As of the date of this report, the fund did not offer Class T shares for purchase. Other differences between the classes include the services offered to and the expenses borne by each class, the allocation of certain transfer agency costs and certain voting rights. Income, expenses (other than expenses attributable to a specific class), and realized and unrealized gains or losses on investments are allocated to each class of shares based on its relative net assets.
20
As of August 31, 2019, MBC Investments Corp., an indirect subsidiary of BNY Mellon, held 217 of Class Y shares of the fund.
The Company accounts separately for the assets, liabilities and operations of each series. Expenses directly attributable to each series are charged to that series’ operations; expenses which are applicable to all series are allocated among them on a pro rata basis.
The Financial Accounting Standards Board (“FASB”) Accounting Standards Codification (“ASC”) is the exclusive reference of authoritative U.S. generally accepted accounting principles (“GAAP”) recognized by the FASB to be applied by nongovernmental entities. Rules and interpretive releases of the Securities and Exchange Commission (“SEC”) under authority of federal laws are also sources of authoritative GAAP for SEC registrants. The fund is an investment company and applies the accounting and reporting guidance of the FASB ASC Topic 946 Financial Services-Investment Companies. The fund’s financial statements are prepared in accordance with GAAP, which may require the use of management estimates and assumptions. Actual results could differ from those estimates.
The Companyenters into contracts that contain a variety of indemnifications. The fund’s maximum exposure under these arrangements is unknown. The fund does not anticipate recognizing any loss related to these arrangements.
(a) Portfolio valuation: The fair value of a financial instrument is the amount that would be received to sell an asset or paid to transfer a liability in an orderly transaction between market participants at the measurement date (i.e., the exit price). GAAP establishes a fair value hierarchy that prioritizes the inputs of valuation techniques used to measure fair value. This hierarchy gives the highest priority to unadjusted quoted prices in active markets for identical assets or liabilities (Level 1 measurements) and the lowest priority to unobservable inputs (Level 3 measurements).
Additionally, GAAP provides guidance on determining whether the volume and activity in a market has decreased significantly and whether such a decrease in activity results in transactions that are not orderly. GAAP requires enhanced disclosures around valuation inputs and techniques used during annual and interim periods.
Various inputs are used in determining the value of the fund’s investments relating to fair value measurements. These inputs are summarized in the three broad levels listed below:
21
NOTES TO FINANCIAL STATEMENTS(continued)
Level 1—unadjusted quoted prices in active markets for identical investments.
Level 2—other significant observable inputs (including quoted prices for similar investments, interest rates, prepayment speeds, credit risk, etc.).
Level 3—significant unobservable inputs (including the fund’s own assumptions in determining the fair value of investments).
The inputs or methodology used for valuing securities are not necessarily an indication of the risk associated with investing in those securities.
Changes in valuation techniques may result in transfers in or out of an assigned level within the disclosure hierarchy. Valuation techniques used to value the fund’s investments are as follows:
Investments in securities are valued at the last sales price on the securities exchange or national securities market on which such securities are primarily traded. Securities listed on the National Market System for which market quotations are available are valued at the official closing price or, if there is no official closing price that day, at the last sales price. For open short positions, asked prices are used for valuation purposes. Bid price is used when no asked price is available. Registered investment companies that are not traded on an exchange are valued at their net asset value. All of the preceding securities are generally categorized within Level 1 of the fair value hierarchy.
Securities not listed on an exchange or the national securities market, or securities for which there were no transactions, are valued at the average of the most recent bid and asked prices. These securities are generally categorized within Level 2 of the fair value hierarchy.
Fair valuing of securities may be determined with the assistance of a pricing service using calculations based on indices of domestic securities and other appropriate indicators, such as prices of relevant American Depository Receipts and futures. Utilizing these techniques may result in transfers between Level 1 and Level 2 of the fair value hierarchy.
When market quotations or official closing prices are not readily available, or are determined not to accurately reflect fair value, such as when the value of a security has been significantly affected by events after the close of the exchange or market on which the security is principally traded (for example, a foreign exchange or market), but before the fund calculates its net asset value, the fund may value these investments at fair value as determined in accordance with the procedures approved by the Company’s Board of Directors (the “Board”). Certain factors may be considered when
22
fair valuing investments such as: fundamental analytical data, the nature and duration of restrictions on disposition, an evaluation of the forces that influence the market in which the securities are purchased and sold, and public trading in similar securities of the issuer or comparable issuers. These securities are either categorized within Level 2 or 3 of the fair value hierarchy depending on the relevant inputs used.
For restricted securities where observable inputs are limited, assumptions about market activity and risk are used and such securities are generally categorized within Level 3 of the fair value hierarchy.
Investments denominated in foreign currencies are translated to U.S. dollars at the prevailing rates of exchange.
The following is a summary of the inputs used as of August 31, 2019in valuing the fund’s investments:
| | | | | |
| | Level 1 – Unadjusted
Quoted Prices | Level 2 - Other Significant Observable
Inputs | Level 3 -
Significant Unobservable Inputs | Total |
Investment in Securities:† | | | | |
Equity Securities -
Common Stocks | 291,658,963 | - | - | 291,658,963 |
Investment Companies | 8,356,233 | - | - | 8,356,233 |
† See Statement of Investments for additional detailed categorizations, if any.
(b) Foreign currency transactions: The fund does not isolate that portion of the results of operations resulting from changes in foreign exchange rates on investments from the fluctuations arising from changes in the market prices of securities held. Such fluctuations are included with the net realized and unrealized gain or loss on investments.
Net realized foreign exchange gains or losses arise from sales of foreign currencies, currency gains or losses realized on securities transactions between trade and settlement date, and the difference between the amounts of dividends, interest and foreign withholding taxes recorded on the fund’s books and the U.S. dollar equivalent of the amounts actually received or paid. Net unrealized foreign exchange gains and losses arise from changes in the value of assets and liabilities other than investments resulting from changes in exchange rates. Foreign currency gains and losses on foreign currency transactions are also included with net realized and unrealized gain or loss on investments.
(c)Securities transactions and investment income: Securities transactions are recorded on a trade date basis. Realized gains and losses
23
NOTES TO FINANCIAL STATEMENTS(continued)
from securities transactions are recorded on the identified cost basis. Dividend income is recognized on the ex-dividend date and interest income, including, where applicable, accretion of discount and amortization of premium on investments, is recognized on the accrual basis.
Pursuant to a securities lending agreement with The Bank of New York Mellon, a subsidiary of BNY Mellon and an affiliate of the Adviser, the fund may lend securities to qualified institutions. It is the fund’s policy that, at origination, all loans are secured by collateral of at least 102% of the value of U.S. securities loaned and 105% of the value of foreign securities loaned. Collateral equivalent to at least 100% of the market value of securities on loan is maintained at all times. Collateral is either in the form of cash, which can be invested in certain money market mutual funds managed by the Adviser, or U.S. Government and Agency securities. The fund is entitled to receive all dividends, interest and distributions on securities loaned, in addition to income earned as a result of the lending transaction. Should a borrower fail to return the securities in a timely manner, The Bank of New York Mellon is required to replace the securities for the benefit of the fund or credit the fund with the market value of the unreturned securities and is subrogated to the fund’s rights against the borrower and the collateral. Additionally, the contractual maturity of security lending transactions are on an overnight and continuous basis. During the period ended August 31, 2019, The Bank of New York Mellon earned $5,925 from lending portfolio securities, pursuant to the securities lending agreement.
(d) Affiliated issuers: Investments in other investment companies advised by the Adviser are considered “affiliated” under the Act.
(e) Dividends and distributions to shareholders: Dividends and distributions are recorded on the ex-dividend date. Dividends from investment income-net and dividends from net realized capital gains, if any, are normally declared and paid annually, but the fund may make distributions on a more frequent basis to comply with the distribution requirements of the Internal Revenue Code of 1986, as amended (the “Code”). To the extent that net realized capital gains can be offset by capital loss carryovers, it is the policy of the fund not to distribute such gains. Income and capital gain distributions are determined in accordance with income tax regulations, which may differ from GAAP.
(f) Federal income taxes: It is the policy of the fund to continue to qualify as a regulated investment company, if such qualification is in the best interests of its shareholders, by complying with the applicable provisions of the Code, and to make distributions of taxable income and
24
net realized capital gain sufficient to relieve it from substantially all federal income and excise taxes.
As of and during the period ended August 31, 2019, the fund did not have any liabilities for any uncertain tax positions. The fund recognizes interest and penalties, if any, related to uncertain tax positions as income tax expense in the Statement of Operations. During the period ended August 31, 2019, the fund did not incur any interest or penalties.
Each tax year in the four-year period ended August 31, 2019 remains subject to examination by the Internal Revenue Service and state taxing authorities.
At August 31, 2019, the components of accumulated earnings on a tax basis were as follows: undistributed capital gains $43,923,521 and unrealized appreciation $57,021,377. In addition, the fund deferred for tax purposes late year ordinary losses of $86,728 to the first day of the following fiscal year.
The tax character of distributions paid to shareholders during the fiscal periods ended August 31, 2019 and August 31, 2018 were as follows: ordinary income $4,457,131 and $4,853,688, and long-term capital gains $61,313,217 and $22,863,687, respectively.
During the period ended August 31, 2019, as a result of permanent book to tax differences, primarily due to the tax treatment for treating a portion of the proceeds from redemptions as a distribution for tax purposes and foreign currency gains and losses, the fund decreased total distributable earnings (loss) by $5,674,065 and increased paid-in capital by the same amount. Net assets and net asset value per share were not affected by this reclassification.
(g) New Accounting Pronouncements: Effective June 1, 2019, the fund adopted Accounting Standards Update 2018-13, Fair Value Measurement (Topic 820): Disclosure Framework—Changes to the Disclosure Requirements for Fair Value Measurement (“ASU 2018-13”). The update provides guidance that eliminates, adds and modifies certain disclosure requirements for fair value measurements. The adoption of ASU 2018-13 had no impact on the operations of the fund for the period ended August 31, 2019.
NOTE 2—Bank Lines of Credit:
The fund participates with other long-term open-end funds managed by the Adviser in a $1.030 billion unsecured credit facility led by Citibank, N.A. (the “Citibank Credit Facility”) and a $300 million unsecured credit facility provided by The Bank of New York Mellon (the “BNYM Credit
25
NOTES TO FINANCIAL STATEMENTS(continued)
Facility”), each to be utilized primarily for temporary or emergency purposes, including the financing of redemptions (each, a “Facility”). The Citibank Credit Facility is available in two tranches: (i) Tranche A is in an amount equal to $830 million and is available to all long-term open-ended funds, including the fund, and (ii) Tranche B is in amount equal to $200 million and is available only to BNY Mellon Floating Rate Income Fund, a series of BNY Mellon Investment Funds IV, Inc. Prior to October 3, 2018, the unsecured credit facility with Citibank, N.A. was $830 million. In connection therewith, the fund has agreed to pay its pro rata portion of commitment fees for Tranche A of the Citibank Credit Facility and the BNYM Credit Facility. Interest is charged to the fund based on rates determined pursuant to the terms of the respective Facility at the time of borrowing. During the period ended August 31, 2019, the fund did not borrow under the Facilities.
NOTE 3—Management Fee and Other Transactions with Affiliates:
(a)Pursuant to a management agreement with the Adviser, the management fee is computed at the annual rate of .75% of the value of the fund’s average daily net assets and is payable monthly.
During the period ended August 31, 2019, the Distributor retained $7,514 from commissions earned on sales of the fund’s Class A shares and $362 from CDSC fees on redemptions of the fund’s Class C shares.
(b) Under the Distribution Plan adopted pursuant to Rule 12b-1 under the Act, Class C shares pay the Distributor for distributing its shares at an annual rate of .75% of the value of its average daily net assets. During the period ended August 31, 2019, Class C shares were charged $78,986 pursuant to the Distribution Plan.
(c)Under the Shareholder Services Plan, Class A and Class C shares pay the Distributor at an annual rate of .25% of the value of their average daily net assets for the provision of certain services. The services provided may include personal services relating to shareholder accounts, such as answering shareholder inquiries regarding the fund and providing reports and other information, and services related to the maintenance of shareholder accounts. The Distributor may make payments to Service Agents (securities dealers, financial institutions or other industry professionals) with respect to these services. The Distributor determines the amounts to be paid to Service Agents. During the period ended August 31, 2019, Class A and Class C shares were charged $679,001and $26,329, respectively, pursuant to the Shareholder Services Plan.
26
The fund has an arrangement with the transfer agent whereby the fund may receive earnings credits when positive cash balances are maintained, which are used to offset transfer agency fees. The fund had an arrangement with the custodian to receive earnings credits when positive cash balances were maintained, which were used to offset custody fees. Effective February 1, 2019, the arrangement with the custodian changed whereby the fund will no longer receive earnings credits to offset its custody fees and will receive interest income or overdraft fees going forward. For financial reporting purposes, the fund includes net earnings credits, if any, as an expense offset in the Statement of Operations.
The fund compensates BNY Mellon Transfer, Inc., a wholly-owned subsidiary of the Adviser, under a transfer agency agreement for providing transfer agency and cash management services for the fund. The majority of transfer agency fees are comprised of amounts paid on a per account basis, while cash management fees are related to fund subscriptions and redemptions. During the period ended August 31, 2019, the fund was charged $106,328 for transfer agency services. These fees are included in Shareholder servicing costs in the Statement of Operations.
The fund compensates The Bank of New York Mellon under a custody agreement for providing custodial services for the fund. These fees are determined based on net assets, geographic region and transaction activity. During the period ended August 31, 2019, the fund was charged $6,407 pursuant to the custody agreement.
During the period ended August 31, 2019, the fund was charged $11,539 for services performed by the Chief Compliance Officer and his staff. These fees are included in Miscellaneous in the Statement of Operations.
The components of “Due to BNY Mellon Investment Adviser, Inc. and affiliates” in the Statement of Assets and Liabilities consist of: management fees $189,346, Distribution Plan fees $5,574, Shareholder Services Plan fees $57,851, custodian fees $2,910, Chief Compliance Officer fees $2,252 and transfer agency fees $26,470.
(d) Each Board member also serves as a Board member of other funds in the BNY Mellon Family of Funds complex. Annual retainer fees and attendance fees are allocated to each fund based on net assets.
NOTE 4—Securities Transactions:
The aggregate amount of purchases and sales of investment securities, excluding short-term securities, during the period ended August 31, 2019, amounted to $214,600,415 and $253,907,786, respectively.
27
NOTES TO FINANCIAL STATEMENTS(continued)
At August 31, 2019, the cost of investments for federal income tax purposes was $242,993,635; accordingly, accumulated net unrealized appreciation on investments was $57,021,561, consisting of $67,428,455 gross unrealized appreciation and $10,406,894 gross unrealized depreciation.
28
REPORT OF INDEPENDENT REGISTERED PUBLIC ACCOUNTING FIRM
To the Shareholders and the Board of Directors of BNY Mellon Technology Growth Fund (formerly, Dreyfus Technology Growth Fund)
Opinion on the Financial Statements
We have audited the accompanying statement of assets and liabilities of BNY Mellon Technology Growth Fund (the “Fund”) (formerly, Dreyfus Technology Growth Fund) (one of the funds constituting BNY Mellon Advantage Funds, Inc.), including the statements of investments and investments in affiliated issuers, as of August 31, 2019, and the related statement of operations for the year then ended, the statement of changes in net assets for each of the two years in the period then ended, the financial highlights for each of the five years in the period then ended and the related notes (collectively referred to as the “financial statements”). In our opinion, the financial statements present fairly, in all material respects, the financial position of the Fund (one of the funds constituting BNY Mellon Advantage Funds, Inc.) at August 31, 2019, the results of its operations for the year then ended, the changes in its net assets for each of the two years in the period then ended and its financial highlights for each of the five years in the period then ended, in conformity with U.S. generally accepted accounting principles.
Basis for Opinion
These financial statements are the responsibility of the Fund’s management. Our responsibility is to express an opinion on the Fund’s financial statements based on our audits. We are a public accounting firm registered with the Public Company Accounting Oversight Board (United States) (“PCAOB”) and are required to be independent with respect to the Fund in accordance with the U.S. federal securities laws and the applicable rules and regulations of the Securities and Exchange Commission and the PCAOB.
We conducted our audits in accordance with the standards of the PCAOB. Those standards require that we plan and perform the audit to obtain reasonable assurance about whether the financial statements are free of material misstatement, whether due to error or fraud. The Fund is not required to have, nor were we engaged to perform, an audit of the Fund’s internal control over financial reporting. As part of our audits, we are required to obtain an understanding of internal control over financial reporting, but not for the purpose of expressing an opinion on the effectiveness of the Fund’s internal control over financial reporting. Accordingly, we express no such opinion.
Our audits included performing procedures to assess the risks of material misstatement of the financial statements, whether due to error or fraud, and performing procedures that respond to those risks. Such procedures included examining, on a test basis, evidence regarding the amounts and disclosures in the financial statements. Our procedures included confirmation of securities owned as of August 31, 2019, by correspondence with the custodian and others or by other appropriate auditing procedures where replies from others were not received. Our audits also included evaluating the accounting principles used and significant estimates made by management, as well as evaluating the overall presentation of the financial statements. We believe that our audits provide a reasonable basis for our opinion.

We have served as the auditor of one or more investment companies in the BNY Mellon Family of Funds since at least 1957, but we are unable to determine the specific year.
New York, New York
October 24, 2019
29
IMPORTANT TAX INFORMATION(Unaudited)
For federal tax purposes, the fund hereby reports 58.49% of the ordinary dividends paid during the fiscal year ended August 31, 2019 as qualifying for the corporate dividends received deduction. Also certain dividends paid by the fund may be subject to a maximum tax rate of 15%, as provided for by the Jobs and Growth Tax Relief Reconciliation Act of 2003. Of the distributions paid during the fiscal year, $2,604,310 represents the maximum amount that may be considered qualified dividend income. The fund also hereby reports $.7652 per share as a short-term capital gain distribution and $10.5182 per share as a long-term capital gain distribution paid on December 11, 2018. Shareholders will receive notification in early 2020 of the percentage applicable to the preparation of their 2019 income tax returns.
30
INFORMATION ABOUT THE RENEWAL OF THE FUND'S MANAGEMENT AGREEMENT (Unaudited)
At a meeting of the fund’s Board of Directors held on March 12-13, 2019, the Board considered the renewal of the fund’s Management Agreement pursuant to which the Adviser provides the fund with investment advisory and administrative services (the “Agreement”). The Board members, none of whom are “interested persons” (as defined in the Investment Company Act of 1940, as amended) of the fund, were assisted in their review by independent legal counsel and met with counsel in executive session separate from representatives of the Adviser. In considering the renewal of the Agreement, the Board considered all factors that it believed to be relevant, including those discussed below. The Board did not identify any one factor as dispositive, and each Board member may have attributed different weights to the factors considered.
Analysis of Nature, Extent, and Quality of Services Provided to the Fund. The Board considered information provided to it at the meeting and in previous presentations from representatives of the Adviser regarding the nature, extent, and quality of the services provided to funds in the BNY Mellon fund complex. The Adviser provided the number of open accounts in the fund, the fund’s asset size and the allocation of fund assets among distribution channels. The Adviser also had previously provided information regarding the diverse intermediary relationships and distribution channels of funds in the BNY Mellon fund complex (such as retail direct or intermediary, in which intermediaries typically are paid by the fund and/or the Adviser) and the Adviser’s corresponding need for broad, deep, and diverse resources to be able to provide ongoing shareholder services to each intermediary or distribution channel, as applicable to the fund.
The Board also considered research support available to, and portfolio management capabilities of, the fund’s portfolio management personnel and that the Adviser also provides oversight of day-to-day fund operations, including fund accounting and administration and assistance in meeting legal and regulatory requirements. The Board also considered the Adviser’s extensive administrative, accounting and compliance infrastructures. The Board also considered portfolio management’s brokerage policies and practices (including policies and practices regarding soft dollars) and the standards applied in seeking best execution.
Comparative Analysis of the Fund’s Performance and Management Fee and Expense Ratio. The Board reviewed reports prepared by Broadridge Financial Solutions, Inc. (“Broadridge”), an independent provider of investment company data, which included information comparing (1) the fund’s performance with the performance of a group of comparable funds (the “Performance Group”) and with a broader group of funds (the “Performance Universe”), all for various periods ended January 31, 2019, and (2) the fund’s actual and contractual management fees and total expenses with those of a group of comparable funds (the “Expense Group”) and with a broader group of funds (the “Expense Universe”), the information for which was derived in part from fund financial statements available to Broadridge as of the date of its analysis. The Adviser previously had furnished the Board with a description of the methodology Broadridge used to
31
INFORMATION ABOUT THE RENEWAL OF THE FUND'S MANAGEMENT AGREEMENT (Unaudited) (continued)
select the Performance Group and Performance Universe and the Expense Group and Expense Universe.
Representatives of the Adviser stated that the usefulness of performance comparisons may be affected by a number of factors, including different investment limitations and policies that may be applicable to the fund and comparison funds. The Board discussed with representatives of the Adviser and/or its affiliates the results of the comparisons and considered that the fund’s total return performance was below the Performance Group and Performance Universe medians for all periods, except for the two-year period when it was at the Performance Group median and above the Performance Universe median. The Board considered the relative proximity of the fund’s performance to the Performance Group and/or Performance Universe median in certain periods when performance was below median. The Adviser also provided a comparison of the fund’s calendar year total returns to the returns of the fund’s benchmark index, and it was considered that the fund’s returns were above the returns of the index in four of the ten calendar years shown.
The Board also reviewed the range of actual and contractual management fees and total expenses of the Expense Group and Expense Universe funds and discussed the results of the comparisons. The Board considered that the fund’s contractual management fee was below the Expense Group median and the fund’s actual management fee and total expenses were below the Expense Group and Expense Universe medians.
Representatives of the Adviser reviewed with the Board the management or investment advisory fees (1) paid by funds advised or administered by the Adviser that are in the same Lipper category as the fund and (2) paid to the Adviser, or the primary employer of the fund’s primary portfolio manager(s) that is affiliated with the Adviser, for advising any separate accounts and/or other types of client portfolios that are considered to have similar investment strategies and policies as the fund (the “Similar Clients”), and explained the nature of the Similar Clients. They discussed differences in fees paid and the relationship of the fees paid in light of any differences in the services provided and other relevant factors. The Board considered the relevance of the fee information provided for the Similar Clients to evaluate the appropriateness of the fund’s management fee.
Analysis of Profitability and Economies of Scale. Representatives of the Adviser reviewed the expenses allocated and profit received by the Adviser and its affiliates and the resulting profitability percentage for managing the fund and the aggregate profitability percentage to the Adviser and its affiliates for managing the funds in the BNY Mellon fund complex, and the method used to determine the expenses and profit. The Board concluded that the profitability results were not unreasonable, given the services rendered and service levels provided by the Adviser. The Board also had been provided with information prepared by an independent consulting firm regarding the Adviser’s approach to allocating costs to, and determining the profitability of, individual funds and the entire BNY Mellon fund complex. The consulting firm also had analyzed where any economies of scale might emerge in connection with the management of a fund.
32
The Board considered, on the advice of its counsel, the profitability analysis (1) as part of its evaluation of whether the fees under the Agreement, considered in relation to the mix of services provided by the Adviser, including the nature, extent and quality of such services, supported the renewal of the Agreement and (2) in light of the relevant circumstances for the fund and the extent to which economies of scale would be realized if the fund grows and whether fee levels reflect these economies of scale for the benefit of fund shareholders. Representatives of the Adviser stated that a discussion of economies of scale is predicated on a fund having achieved a substantial size with increasing assets and that, if a fund’s assets had been stable or decreasing, the possibility that the Adviser may have realized any economies of scale would be less. Representatives of the Adviser also stated that, as a result of shared and allocated costs among funds in the BNY Mellon fund complex, the extent of economies of scale could depend substantially on the level of assets in the complex as a whole, so that increases and decreases in complex-wide assets can affect potential economies of scale in a manner that is disproportionate to, or even in the opposite direction from, changes in the fund’s asset level. The Board also considered potential benefits to the Adviser from acting as investment adviser and took into consideration the soft dollar arrangements in effect for trading the fund’s investments.
At the conclusion of these discussions, the Board agreed that it had been furnished with sufficient information to make an informed business decision with respect to the renewal of the Agreement. Based on the discussions and considerations as described above, the Board concluded and determined as follows.
· The Board concluded that the nature, extent and quality of the services provided by the Adviser are adequate and appropriate.
· The Board expressed concern about the fund’s relative performance and agreed to closely monitor performance.
· The Board concluded that the fee paid to the Adviser continued to be appropriate under the circumstances and in light of the factors and the totality of the services provided as discussed above.
· The Board determined that the economies of scale which may accrue to the Adviser and its affiliates in connection with the management of the fund had been adequately considered by the Adviser in connection with the fee rate charged to the fund pursuant to the Agreement and that, to the extent in the future it were determined that material economies of scale had not been shared with the fund, the Board would seek to have those economies of scale shared with the fund.
In evaluating the Agreement, the Board considered these conclusions and determinations and also relied on its previous knowledge, gained through meetings and other interactions with the Adviser and its affiliates, of the Adviser and the services provided to the fund by the Adviser. The Board also relied on information received on a routine and regular basis throughout the year relating to the operations of the fund and the investment management and other services provided under the Agreement,
33
INFORMATION ABOUT THE RENEWAL OF THE FUND'S MANAGEMENT AGREEMENT (Unaudited) (continued)
including information on the investment performance of the fund in comparison to similar mutual funds and benchmark performance indices; general market outlook as applicable to the fund; and compliance reports. In addition, the Board’s consideration of the contractual fee arrangements for this fund had the benefit of a number of years of reviews of the Agreement for the fund, or substantially similar agreements for other BNY Mellon funds that the Board oversees, during which lengthy discussions took place between the Board and representatives of the Adviser. Certain aspects of the arrangements may receive greater scrutiny in some years than in others, and the Board’s conclusions may be based, in part, on their consideration of the fund’s arrangements, or substantially similar arrangements for other BNY Mellon funds that the Board oversees, in prior years. The Board determined to renew the Agreement.
34
BOARD MEMBERS INFORMATION(Unaudited)
INDEPENDENT BOARD MEMBERS
Joseph S. DiMartino (75)
Chairman of the Board (1995)
Principal Occupation During Past 5 Years:
· Corporate Director and Trustee (1995-present)
Other Public Company Board Memberships During Past 5 Years:
· CBIZ (formerly, Century Business Services, Inc.), a provider of outsourcing functions for small and medium size companies, Director (1997-present)
No. of Portfolios for which Board Member Serves:120
———————
Peggy C. Davis (76)
Board Member (2006)
Principal Occupation During Past 5 Years:
· Shad Professor of Law, New York University School of Law (1983-present)
No. of Portfolios for which Board Member Serves: 44
———————
David P. Feldman (79)
Board Member (1996)
Principal Occupation During Past 5 Years:
· Corporate Director and Trustee (1985-present)
Other Public Company Board Memberships During Past 5 Years:
· BBH Mutual Funds Group (5 registered mutual funds), Director (1992-2014)
No. of Portfolios for which Board Member Serves:30
———————
35
BOARD MEMBERS INFORMATION (Unaudited) (continued)
INDEPENDENT BOARD MEMBERS (continued)
Gina D. France (61)
Board Member (2019)
Principal Occupation During Past 5 Years:
· Founder, President and Chief Executive Officer, France Strategic Partners, a strategy and advisory firm serving corporate clients across the United States (2003 –present)
· Corporate Director and Trustee (2004 – current)
Other Public Company Board Memberships During Past 5 Years:
· Huntington Bancshares, a bank holding company headquartered in Columbus, Ohio, Director (2016 – present)
· Cedar Fair, L.P., a publicly-traded partnership that owns and operates amusement parks and hotels in the U.S. and Canada, Director (2011 – present)
· CBIZ (formerly, Century Business Services, Inc.), a provider of outsourcing functions for small and medium size companies, Director (2015 – present)
· FirstMerit Corporation, a diversified financial services company, Director (2004 – 2016)
No. of Portfolios for which Board Member Serves:30
———————
Joan Gulley (72)
Board Member (2017)
Principal Occupation During Past 5 Years:
· PNC Financial Services Group, Inc.(1993-2014), Executive Vice President and Chief Human Resources Officer and Executive Committee Member (2008-2014)
No. of Portfolios for which Board Member Serves:50
———————
Ehud Houminer (79)
Board Member (1993)
Principal Occupation During Past 5 Years:
· Board of Overseers at the Columbia Business School, Columbia University (1992-present)
· Trustee, Ben Gurion University
No. of Portfolios for which Board Member Serves: 50
———————
Lynn Martin (79)
Board Member (2012)
Principal Occupation During Past 5 Years:
· President of The Martin Hall Group LLC, a human resources consulting firm (2005-2012)
No. of Portfolios for which Board Member Serves:30
———————
36
Robin A. Melvin (56)
Board Member (2012)
Principal Occupation During Past 5 Years:
· Co-chairman, Illinois Mentoring Partnership, non-profit organization dedicated to increasing the quantity and quality of mentoring services in Illinois; (2014-present; board member since 2013)
No. of Portfolios for which Board Member Serves:97
———————
Once elected all Board Members serve for an indefinite term, but achieve Emeritus status upon reaching age 80. The address of the Board Members and Officers is c/o BNY Mellon Investment Adviser, Inc. 240 Greenwich Street, New York, New York 10166. Additional information about the Board Members is available in the fund’s Statement of Additional Information which can be obtained from the Adviser free of charge by calling this toll free number: 1-800-373-9387.
James F. Henry, Emeritus Board Member
Dr. Martin Peretz, Emeritus Board Member
Philip L. Toia, Emeritus Board Member
37
OFFICERS OF THE FUND(Unaudited)
RENEE LAROCHE-MORRIS, President since May 2019.
President and a director of BNY Mellon Investment Adviser, Inc. since January 2018. She is an officer of 63 investment companies (comprised of 120 portfolios) managed by the Adviser. She is 48 years old and has been an employee of BNY Mellon since 2003.
JAMES WINDELS, Treasurer since November 2001.
Director- BNY Mellon Fund Administration, and an officer of 64 investment companies (comprised of 143 portfolios) managed by the Adviser. He is 61 years old and has been an employee of the Adviser since April 1985.
BENNETT A. MACDOUGALL, Chief Legal Officer since October 2015.
Chief Legal Officer of the Adviser and Associate General Counsel and Managing Director of BNY Mellon since June 2015; Director and Associate General Counsel of Deutsche Bank – Asset & Wealth Management Division from June 2005 to June 2015, and as Chief Legal Officer of Deutsche Investment Management Americas Inc. from June 2012 to May 2015. He is an officer of 64 investment companies (comprised of 143 portfolios) managed by the Adviser. He is 48 years old and has been an employee of the Adviser since June 2015.
DAVID DIPETRILLO, Vice President since January 2018.
Head of North America Product, BNY Mellon Investment Management since January 2018, Director of Product Strategy, BNY Mellon Investment Management from January 2016 to December 2017; Head of US Retail Product and Channel Marketing, BNY Mellon Investment Management from January 2014 to December 2015. He is an officer of 63 investment companies (comprised of 120 portfolios) managed by the Adviser. He is 41 years old and has been an employee of BNY Mellon since 2005.
JAMES BITETTO, Vice President since August 2005 and Secretary since February 2018.
Managing Counsel of BNY Mellon and Secretary of the Adviser, and an officer of 64 investment companies (comprised of 143 portfolios) managed by the Adviser. He is 53 years old and has been an employee of the Adviser since December 1996.
SONALEE CROSS, Vice President and Assistant Secretary since March 2018.
Counsel of BNY Mellon since October 2016; Associate at Proskauer Rose LLP from April 2016 to September 2016; Attorney at EnTrust Capital from August 2015 to February 2016; Associate at Sidley Austin LLP from September 2013 to August 2015. She is an officer of 64 investment companies (comprised of 143 portfolios) managed by the Adviser. She is 31 years old and has been an employee of the Adviser since October 2016.
DEIRDRE CUNNANE, Vice President and Assistant Secretary since March 2019.
Counsel of BNY Mellon since August 2018; Senior Regulatory Specialist at BNY Mellon Investment Management Services from February 2016 to August 2018; Trustee Associate at BNY Mellon Trust Company (Ireland) Limited from August 2013 to February 2016. She is an officer of 64 investment companies (comprised of 143 portfolios) managed by the Adviser. She is 29 years old and has been an employee of the Adviser since August 2018.
SARAH S. KELLEHER, Vice President and Assistant Secretary since April 2014.
Managing Counsel of BNY Mellon since December 2017, Senior Counsel of BNY Mellon from March 2013 to December 2017. She is an officer of 64 investment companies (comprised of 143 portfolios) managed by the Adviser. She is 44 years old and has been an employee of the Adviser since March 2013.
JEFF PRUSNOFSKY, Vice President and Assistant Secretary since August 2005.
Senior Managing Counsel of BNY Mellon, and an officer of 64 investment companies (comprised of 143 portfolios) managed by the Adviser. He is 54 years old and has been an employee of the Adviser since October 1990.
PETER M. SULLIVAN, Vice President and Assistant Secretary since March 2019.
Managing Counsel of BNY Mellon, and an officer of 64 investment companies (comprised of 143 portfolios) managed by the Adviser. He is 51 years old and has been an employee of the Adviser since April 2004.
38
NATALYA ZELENSKY, Vice President and Assistant Secretary since March 2017.
Counsel of BNY Mellon since May 2016; Attorney at Wildermuth Endowment Strategy Fund/Wildermuth Advisory, LLC from November 2015 to May 2016 and Assistant General Counsel at RCS Advisory Services from July 2014 to November 2015. She is an officer of 64 investment companies (comprised of 143 portfolios) managed by the Adviser. She is 34 years old and has been an employee of the Adviser since May 2016.
GAVIN C. REILLY, Assistant Treasurer since December 2005.
Tax Manager - BNY Mellon Fund Administration, and an officer of 64 investment companies (comprised of 143 portfolios) managed by the Adviser. He is 51 years old and has been an employee of the Adviser since April 1991.
ROBERT S. ROBOL, Assistant Treasurer since August 2005.
Senior Accounting Manager- BNY Mellon Fund Administration, and an officer of 64 investment companies (comprised of 143 portfolios) managed by the Adviser. He is 55 years old and has been an employee of the Adviser since October 1988.
ROBERT SALVIOLO, Assistant Treasurer since July 2007.
Senior Accounting Manager – BNY Mellon Fund Administration, and an officer of 64 investment companies (comprised of 143 portfolios) managed by the Adviser. He is 52 years old and has been an employee of the Adviser since June 1989.
ROBERT SVAGNA, Assistant Treasurer since December 2002.
Senior Accounting Manager – BNY Mellon Fund Administration, and an officer of 64 investment companies (comprised of 143 portfolios) managed by the Adviser. He is 52 years old and has been an employee of the Adviser since November 1990.
JOSEPH W. CONNOLLY, Chief Compliance Officer since October 2004.
Chief Compliance Officer of the Adviser, the BNY Mellon Family of Funds and BNY Mellon Funds Trust (64 investment companies, comprised of 143 portfolios). He is 62 years old and has served in various capacities with the Adviser since 1980, including manager of the firm’s Fund Accounting Department from 1997 through October 2001.
CARIDAD M. CAROSELLA, Anti-Money Laundering Compliance Officer since January 2016.
Anti-Money Laundering Compliance Officer of the BNY Mellon Family of Funds and BNY Mellon Funds Trust since January 2016; from May 2015 to December 2015, Interim Anti-Money Laundering Compliance Officer of the BNY Mellon Family of Funds and BNY Mellon Funds Trust and the Distributor; from January 2012 to May 2015, AML Surveillance Officer of the Distributor. She is an officer of 57 investment companies (comprised of 136 portfolios) managed by the Adviser. She is 51 years old and has been an employee of the Distributor since 1997.
39
NOTES
40
NOTES
41
BNY Mellon Technology Growth Fund
240 Greenwich Street
New York, NY 10286
Adviser
BNY Mellon Investment Adviser, Inc.
240 Greenwich Street
New York, NY 10286
Custodian
The Bank of New York Mellon
240 Greenwich Street
New York, NY 10286
Transfer Agent &
Dividend Disbursing Agent
BNY Mellon Transfer, Inc.
240 Greenwich Street
New York, NY 10286
Distributor
BNY Mellon Securities Corporation
240 Greenwich Street
New York, NY 10286
| | |
Ticker Symbols: | Class A: DTGRX Class C: DTGCX Class I: DGVRX Class Y: DTEYX |
Telephone Call your financial representative or 1-800-373-9387
Mail The BNY Mellon Family of Funds, 144 Glenn Curtiss Boulevard, Uniondale, NY 11556-0144
E-mailSend your request toinfo@bnymellon.com
InternetInformation can be viewed online or downloaded atwww.bnymellonim.com/us
The fund files its complete schedule of portfolio holdings with the Securities and Exchange Commission (“SEC”) for the first and third quarters of each fiscal year on Form N-PORT. The fund’s Forms N-PORT are available on the SEC’s website atwww.sec.gov.
A description of the policies and procedures that the fund uses to determine how to vote proxies relating to portfolio securities and information regarding how the fund voted these proxies for the most recent 12-month period ended June 30 is available atwww.bnymellonim.com/us and on the SEC’s website atwww.sec.gov and without charge, upon request, by calling 1-800-373-9387.
| | |
© 2019 BNY Mellon Securities Corporation
0255AR0819 | 
|
Item 2. Code of Ethics.
The Registrant has adopted a code of ethics that applies to the Registrant's principal executive officer, principal financial officer, principal accounting officer or controller, or persons performing similar functions. There have been no amendments to, or waivers in connection with, the Code of Ethics during the period covered by this Report.
Item 3. Audit Committee Financial Expert.
The Registrant's Board has determined that David P. Feldman, a member of the Audit Committee of the Board, is an audit committee financial expert as defined by the Securities and Exchange Commission (the "SEC"). Mr. Feldman is "independent" as defined by the SEC for purposes of audit committee financial expert determinations.
Item 4. Principal Accountant Fees and Services.
(a) Audit Fees. The aggregate fees billed for each of the last two fiscal years (the "Reporting Periods") for professional services rendered by the Registrant's principal accountant (the "Auditor") for the audit of the Registrant's annual financial statements or services that are normally provided by the Auditor in connection with the statutory and regulatory filings or engagements for the Reporting Periods, were $176,110 in 2018 and $181,690 in 2019.
(b) Audit-Related Fees. The aggregate fees billed in the Reporting Periods for assurance and related services by the Auditor that are reasonably related to the performance of the audit of the Registrant's financial statements and are not reported under paragraph (a) of this Item 4 were $34,695 in 2018 and $35,776 in 2019. These services consisted of one or more of the following: (i) agreed upon procedures related to compliance with Internal Revenue Code section 817(h), (ii) security counts required by Rule 17f-2 under the Investment Company Act of 1940, as amended, (iii) advisory services as to the accounting or disclosure treatment of Registrant transactions or events and (iv) advisory services to the accounting or disclosure treatment of the actual or potential impact to the Registrant of final or proposed rules, standards or interpretations by the Securities and Exchange Commission, the Financial Accounting Standards Boards or other regulatory or standard-setting bodies.
The aggregate fees billed in the Reporting Periods for non-audit assurance and related services by the Auditor to the Registrant's investment adviser (not including any sub-investment adviser whose role is primarily portfolio management and is subcontracted with or overseen by another investment adviser), and any entity controlling, controlled by or under common control with the investment adviser that provides ongoing services to the Registrant ("Service Affiliates"), that were reasonably related to the performance of the annual audit of the Service Affiliate, which required pre-approval by the Audit Committee were $0 in 2018 and $0 in 2019.
(c) Tax Fees. The aggregate fees billed in the Reporting Periods for professional services rendered by the Auditor for tax compliance, tax advice, and tax planning ("Tax Services") were $22,629 in 2018 and $17,271 in 2019. These services consisted of: (i) review or preparation of U.S. federal, state, local and excise tax returns; (ii) U.S. federal, state and local tax planning, advice and assistance regarding statutory, regulatory or administrative developments, and (iii) tax advice regarding tax qualification matters and/or treatment of various financial instruments held or proposed to be acquired or held. The aggregate fees billed in the Reporting Periods for Tax Services by the Auditor to Service Affiliates, which required pre-approval by the Audit Committee were $0 in 2018 and $0 in 2019.
(d) All Other Fees. The aggregate fees billed in the Reporting Periods for products and services provided by the Auditor, other than the services reported in paragraphs (a) through (c) of this Item, were $9,006 in 2018 and $9,291 in 2019. These services consisted of a review of the Registrant's anti-money laundering program.
The aggregate fees billed in the Reporting Periods for Non-Audit Services by the Auditor to Service Affiliates, other than the services reported in paragraphs (b) through (c) of this Item, which required pre-approval by the Audit Committee, were $0 in 2018 and $0 in 2019.
(e)(1) Audit Committee Pre-Approval Policies and Procedures. The Registrant's Audit Committee has established policies and procedures (the "Policy") for pre-approval (within specified fee limits) of the Auditor's engagements for non-audit services to the Registrant and Service Affiliates without specific case-by-case consideration. The pre-approved services in the Policy can include pre-approved audit services, pre-approved audit-related services, pre-approved tax services and pre-approved all other services. Pre-approval considerations include whether the proposed services are compatible with maintaining the Auditor's independence. Pre-approvals pursuant to the Policy are considered annually.
(e)(2) Note. None of the services described in paragraphs (b) through (d) of this Item 4 were approved by the Audit Committee pursuant to paragraph (c)(7)(i)(C) of Rule 2-01 of Regulation S-X.
(f) None of the hours expended on the principal accountant's engagement to audit the registrant's financial statements for the most recent fiscal year were attributed to work performed by persons other than the principal account's full-time, permanent employees.
Non-Audit Fees. The aggregate non-audit fees billed by the Auditor for services rendered to the Registrant, and rendered to Service Affiliates, for the Reporting Periods were $19,579,325 in 2018 and $21,511,200 in 2019.
Auditor Independence. The Registrant's Audit Committee has considered whether the provision of non-audit services that were rendered to Service Affiliates, which were not pre-approved (not requiring pre-approval), is compatible with maintaining the Auditor's independence.
Item 5. Audit Committee of Listed Registrants.
Not applicable.
Item 6. Investments.
(a) Not applicable.
Item 7. Disclosure of Proxy Voting Policies and Procedures for Closed-End Management Investment Companies.
Not applicable.
Item 8. Portfolio Managers of Closed-End Management Investment Companies.
Not applicable.
Item 9. Purchases of Equity Securities by Closed-End Management Investment Companies and Affiliated Purchasers.
Not applicable.
Item 10. Submission of Matters to a Vote of Security Holders.
There have been no material changes to the procedures applicable to Item 10.
Item 11. Controls and Procedures.
(a) The Registrant's principal executive and principal financial officers have concluded, based on their evaluation of the Registrant's disclosure controls and procedures as of a date within 90 days of the filing date of this report, that the Registrant's disclosure controls and procedures are reasonably designed to ensure that information required to be disclosed by the Registrant on Form N-CSR is recorded, processed, summarized and reported within the required time periods and that information required to be disclosed by the Registrant in the reports that it files or submits on Form N-CSR is accumulated and communicated to the Registrant's management, including its principal executive and principal financial officers, as appropriate to allow timely decisions regarding required disclosure.
(b) There were no changes to the Registrant's internal control over financial reporting that occurred during the second fiscal quarter of the period covered by this report that have materially affected, or are reasonably likely to materially affect, the Registrant's internal control over financial reporting.
Item 12. Disclosure of Securities Lending Activities for Closed-End Management Investment Companies.
Not applicable.
Item 13. Exhibits.
(a)(1) Code of ethics referred to in Item 2.
(a)(2) Certifications of principal executive and principal financial officers as required by Rule 30a-2(a) under the Investment Company Act of 1940.
(a)(3) Not applicable.
(b) Certification of principal executive and principal financial officers as required by Rule 30a-2(b) under the Investment Company Act of 1940.
SIGNATURES
Pursuant to the requirements of the Securities Exchange Act of 1934 and the Investment Company Act of 1940, the Registrant has duly caused this Report to be signed on its behalf by the undersigned, thereunto duly authorized.
BNY Mellon Advantage Funds, Inc.
By: /s/ Renee LaRoche-Morris
Renee LaRoche-Morris
President (Principal Executive Officer)
Date: October 25, 2019
Pursuant to the requirements of the Securities Exchange Act of 1934 and the Investment Company Act of 1940, this Report has been signed below by the following persons on behalf of the Registrant and in the capacities and on the dates indicated.
By: /s/ Renee LaRoche-Morris
Renee LaRoche-Morris
President (Principal Executive Officer)
Date: October 25, 2019
By: /s/ James Windels
James Windels
Treasurer (Principal Financial Officer)
Date: October 25, 2019
EXHIBIT INDEX
(a)(1) Code of ethics referred to in Item 2.
(a)(2) Certifications of principal executive and principal financial officers as required by Rule 30a-2(a) under the Investment Company Act of 1940. (EX-99.CERT)
(b) Certification of principal executive and principal financial officers as required by Rule 30a-2(b) under the Investment Company Act of 1940. (EX-99.906CERT)