UNITED STATES
SECURITIES AND EXCHANGE COMMISSION
Washington, D.C. 20549
FORM N-CSR
CERTIFIED SHAREHOLDER REPORT OF REGISTERED MANAGEMENT
INVESTMENT COMPANIES
Investment Company Act file number | 811-07123 |
| |
| Advantage Funds, Inc. | |
| (Exact name of Registrant as specified in charter) | |
| | |
| c/o The Dreyfus Corporation 200 Park Avenue New York, New York 10166 | |
| (Address of principal executive offices) (Zip code) | |
| | |
| Bennett A. MacDougall, Esq. 200 Park Avenue New York, New York 10166 | |
| (Name and address of agent for service) | |
|
Registrant's telephone number, including area code: | (212) 922-6400 |
| |
Date of fiscal year end: | 10/31 | |
Date of reporting period: | 10/31/18 | |
| | | | | | | |
The following N-CSR relates only to the Registrant's series listed below and does not relate to any series of the Registrant with a different fiscal year end and, therefore, different N-CSR reporting requirements. A separate N-CSR will be filed for any series with a different fiscal year end, as appropriate.
Dreyfus Global Dynamic Bond Income Fund
Dreyfus Global Multi-Asset Income Fund
Dreyfus Global Real Return Fund
Dreyfus Total Emerging Markets Fund
Dynamic Total Return Fund
FORM N-CSR
Item 1. Reports to Stockholders.
Dreyfus Global Real Return Fund
| | | |

| | ANNUAL REPORT October 31, 2018 |
| |
Save time. Save paper. View your next shareholder report online as soon as it’s available. Log into www.dreyfus.com and sign up for Dreyfus eCommunications. It’s simple and only takes a few minutes. |
| |
The views expressed in this report reflect those of the portfolio manager(s) only through the end of the period covered and do not necessarily represent the views of Dreyfus or any other person in the Dreyfus organization. Any such views are subject to change at any time based upon market or other conditions and Dreyfus disclaims any responsibility to update such views. These views may not be relied on as investment advice and, because investment decisions for a Dreyfus fund are based on numerous factors, may not be relied on as an indication of trading intent on behalf of any Dreyfus fund. |
| |
Not FDIC-Insured • Not Bank-Guaranteed • May Lose Value |
Contents
THE FUND
FOR MORE INFORMATION
Back Cover
| | | | |
| |
Dreyfus Global Real Return Fund
| | The Fund |
A LETTER FROM THE PRESIDENT OF DREYFUS
Dear Shareholder:
We are pleased to present this annual report for Dreyfus Global Real Return Fund, covering the 12-month period from November 1, 2017 through October 31, 2018. For information about how the fund performed during the reporting period, as well as general market perspectives, we provide a Discussion of Fund Performance on the pages that follow.
Markets began the reporting period on solid footing as major global economies experienced above-trend growth across the board. In the United States, the Federal Reserve continued to move away from its accommodative monetary policy while other major central banks also began to consider monetary tightening. In the equity markets, both U.S. and non-U.S. markets enjoyed an upward trend, though investor concerns about volatility and inflation later began to weigh on returns. Interest rates rose across the curve, putting pressure on bond prices.
Later in the reporting period, global growth trends began to diverge. While a strong economic performance continued to bolster U.S. equity markets, slower growth and political concerns pressured markets in the Eurozone. Emerging markets also came under pressure as weakness in their currencies added to investors’ uneasiness. Fixed income markets continued to struggle as interest rates rose; the yield on the benchmark 10-year Treasury bond surged late in the reporting period, but growing investor concerns about global growth helped keep it from rising further.
Despite continuing doubts regarding trade, U.S. inflationary pressures, and global growth, we are optimistic that the U.S. economy will remain strong in the near term. However, we will stay attentive to signs that signal potential changes on the horizon. As always, we encourage you to discuss the risks and opportunities of today’s investment environment with your financial advisor.
Thank you for your continued confidence and support.
Sincerely,

Renee Laroche-Morris
President
The Dreyfus Corporation
November 15, 2018
2
DISCUSSION OF FUND PERFORMANCE (Unaudited)
For the period from November 1, 2017 through October 31, 2018, as provided by portfolio managers Suzanne Hutchins (Lead) and Aron Pataki, of Newton Investment Management (North America) Limited, Sub-Investment Adviser
Market and Fund Performance Overview
For the 12-month period ended October 31, 2018, Dreyfus Global Real Return Fund’s Class A shares produced a total return of -0.05%, Class C shares returned -0.86%, Class I shares returned 0.11%, and Class Y shares returned 0.24%.1 In comparison, the fund’s benchmark, the FTSE One-Month U.S. Treasury Bill Index, and the fund’s performance baseline benchmark, the USD 1-Month LIBOR Index, produced total returns of 1.62% and 1.81%, respectively, for the same period.2,3
Some global stock and bond indices rose modestly over the reporting period, despite an environment of slowing growth, a strong dollar, trade tensions, and geopolitical issues. The fund lagged its benchmark largely due to its more cautious stance, in keeping with the team’s views on the risks associated with the market backdrop.
On July 31, 2018, the Citi One-Month U.S. Treasury Bill Index was renamed FTSE One-Month U.S. Treasury Bill Index.
The Fund’s Investment Approach
The fund seeks total return (consisting of capital appreciation and income). To pursue its goal, the fund uses an actively managed multi-asset strategy to produce absolute or real returns with less volatility than major equity markets over a complete market cycle, typically a period of five years. Rather than managing to track a benchmark index, the fund seeks to provide returns that are largely independent of market moves.
The fund allocates its investments among global equities, bonds and cash, and, generally to a lesser extent, other asset classes, including real estate, commodities, currencies, and alternative or non-traditional asset classes and strategies, primarily those accessed through derivative instruments.
The fund’s portfolio managers combine a top-down approach, emphasizing economic trends and current investment themes on a global basis, with bottom-up security selection, based on fundamental research, to allocate the fund’s investments among and within asset classes. In choosing investments, the portfolio managers consider key trends in global economic variables, such as gross domestic product, inflation and interest rates; investment themes, such as changing demographics, the impact of new technologies, and the globalization of industries and brands; relative valuations of equity securities, bonds, and cash; long-term trends in currency movements; and company fundamentals.
Volatility Returned to Global Markets
The reporting period proved to be something of a roller coaster ride for global equity markets. Although the period started strong, as the S&P 500 registered robust gains from November 2017 through January 2018, February 2018 marked the return of volatility to markets. Worries prompted by stronger-than-expected inflation data and subsequently higher bond yields caused a sell-off across most asset classes. Towards the middle of the
3
DISCUSSION OF FUND PERFORMANCE (Unaudited) (continued)
reporting period, equity markets recouped some of their earlier losses, as investors chose to focus on a positive outlook for economic growth.
As risk assets regained their poise, more cautious moods prevailed, spurred by slowing economic growth in non-U.S. developed markets. Volatility soon resurfaced, notably in emerging markets, which had previously been major beneficiaries of monetary policy largesse. The U.S. market continued to outperform on a relative basis, enjoying strong gains that were largely attributable to robust corporate earnings. The reporting period closed with risk assets resuming broad-based declines as a result of several factors weighing upon stock markets, such as Brexit uncertainties, geopolitical issues and trade tensions.
Stabilizing Layer Dampened Fund Performance
The portfolio’s stabilizing layer detracted from performance over the reporting period, as risk assets ground higher and the protective insurance was a cost. The derivative protection through short equity futures has been progressively reduced in favor of indirect hedges and diversified into a range of different equity indices. Gold was the other noteworthy detractor, as it struggled in an environment of rising real interest rates. We continue to maintain a small exposure within the stabilizing layer of the portfolio, based on the attraction of holding a real asset that cannot be manipulated by central banks and that also serves as a hedge against monetary-policy error. Within the return-seeking core, some weakness was seen from the portfolio’s emerging-market debt holdings, as sentiment toward this asset class succumbed to a range of macroeconomic and political factors which were exacerbated by the U.S. dollar’s appreciation and the rise in U.S. interest rates.
The main driver of returns over the reporting period was the return-seeking core, particularly its equities. The fund’s technology holdings were the top contributors, led by Cisco Systems, which continued to deliver strong results. CA Technologies also featured within the top contributors, benefiting from being the subject of a takeover bid from Broadcom, the latter attracted by the computer company’s recurring revenues. We subsequently sold the position, as the price approached the offer level. Publishing company Wolters Kluwer was another positive contributor, rebounding in the latter half of the period after having exerted a drag on stock selection earlier in 2018. Finally, energy company Royal Dutch Shell delivered gains as the oil price climbed, reflecting a tightening between supply and demand, coupled with a relatively constructive outcome to June’s Organization of the Petroleum Exporting Countries (OPEC) meeting.
A More Cautious Investment Posture
Our relatively cautious outlook remains broadly unchanged, and the recent volatility we have seen in markets makes an even stronger case for prioritizing capital preservation. We believe we may be past peak momentum in the U.S. economy, where the positive effects of last year’s tax cuts are set to wane, while higher interest rates take their toll upon demand in areas such as housing. We believe hopes of a synchronized global upturn, advanced at the start of 2018, are likely to remain unfulfilled, with Europe showing clear signs of deceleration and strains now visible in the Chinese economy. Nevertheless, the Federal Reserve continues to employ a hawkish tone, meaning a reversal of monetary tightening is some way off. Despite recent declines, aggregate valuations of the major risk asset classes remain stretched, and we therefore await better opportunities to meaningfully increase the portfolio’s commitment to return-seeking assets. We think the probability of a disinflationary/deflationary outcome has
4
increased in the rest of the world, which is problematic for equity markets. As risk assets start to come under pressure, we are likely to see increased demand for safe-haven government bonds, hence our recent decision to marginally increase the strategy’s duration in recent quarters.
Within the return-seeking core, the gross equity weighting fell by approximately 12% over the reporting period. However, on a net basis, it ended the period higher, as we progressively reduced the level of protection employed through equity-index futures with the aim of enabling the portfolio to benefit more fully from stock selection into year-end. The aim of the fund’s equity protection is to cushion the portfolio against a likely sell-off in risk assets, and this is coupled with indirect hedges in the form of a substantial cash position. We also continue to have significant exposure to government bonds within our stabilizing layer, primarily in the U.S. and Australasia.
November 15, 2018
1 Total return includes reinvestment of dividends and any capital gains paid, and does not take into consideration the maximum initial sales charge in the case of Class A shares, or the applicable contingent deferred sales charge imposed on redemptions in the case of Class C shares. Share price and investment return fluctuate such that upon redemption, fund shares may be worth more or less than their original cost. Return figures provided reflect the absorption of certain fund expenses by The Dreyfus Corporation pursuant to an agreement in effect through March 1, 2019, at which time it may be extended, modified, or terminated. Had these expenses not been absorbed, the fund’s returns would have been lower. Past performance is no guarantee of future results.
2 Source: FactSet — The London Interbank Offered Rate (LIBOR) is the average interest rate at which leading banks borrow funds of a sizable amount from other banks in the London market. LIBOR is the most widely used “benchmark” or reference rate for short-term interest rates. Investors cannot invest directly in any index.
3 Source: Lipper, Inc. — The FTSE One-Month U.S. Treasury Bill Index consists of the last one-month Treasury bill month-end rates. The FTSE One-Month U.S. Treasury Bill Index measures return equivalents of yield averages. The instruments are not marked to market. Investors cannot invest directly in any index.
Please note: the position in any security highlighted with italicized typeface was sold during the reporting period.
Equities are subject generally to market, market sector, market liquidity, issuer, and investment style risks, among other factors, to varying degrees, all of which are more fully described in the fund’s prospectus.
Bonds are subject generally to interest-rate, credit, liquidity, and market risks, to varying degrees, all of which are more fully described in the fund’s prospectus. Generally, all other factors being equal, bond prices are inversely related to interest-rate changes, and rate increases can cause price declines.
The fund’s performance will be influenced by political, social, and economic factors affecting investments in foreign companies. Special risks associated with such companies include exposure to currency fluctuations, less liquidity, less developed or less efficient trading markets, lack of comprehensive company information, political instability, and differing auditing and legal standards.
Because the fund seeks to provide exposure to alternative or non-traditional (i.e., satellite) asset categories or investment strategies, the fund’s performance will be linked to the performance of these highly volatile asset categories and strategies. Accordingly, investors should consider purchasing shares of the fund only as part of an overall diversified portfolio and should be willing to assume the risks of potentially significant fluctuations in the value of fund shares.
The fund may, but is not required to, use derivative instruments, such as options, futures, options on futures, forward contracts, and other credit derivatives. A small investment in derivatives could have a potentially large impact on the fund’s performance. The use of derivatives involves risks different from, or possibly greater than, the risks associated with investing directly in the underlying assets.
5
FUND PERFORMANCE (Unaudited)

Comparison of change in value of $10,000 investment in Dreyfus Global Real Return Fund Class A shares, Class C shares, Class I shares and Class Y shares and the FTSE One-Month U.S. Treasury Bill Index and USD 1-Month LIBOR
† Source: FactSet
†† Source: Lipper Inc.
††† The total return figures presented for Class Y shares of the fund reflect the performance of the fund’s Class A shares for the period prior to 7/1/13 (the inception date for Class Y shares), not reflecting the applicable sales charges for Class A shares.
Past performance is not predictive of future performance.
The above graph compares a $10,000 investment made in each of the Class A, Class C, Class I and Class Y shares of Dreyfus Global Real Return Fund on 5/12/10 (inception date) to a $10,000 investment made in the FTSE One-Month U.S. Treasury Bill Index and USD 1-Month LIBOR on that date. All dividends and capital gain distributions are reinvested.
The fund’s performance shown in the line graph above takes into account the maximum initial sales charge on Class A shares and all other applicable fees and expenses on all classes. The FTSE One-Month U.S. Treasury Bill Index consists of the last one-month Treasury bill month-end rates. The FTSE One-Month U.S. Treasury Bill Index measures returns equivalent of yield averages. The instruments are not marked to market. The London Interbank Offered Rate (LIBOR) is the average interest rate at which leading banks borrow funds of a sizable amount from other banks in the London market. LIBOR is the most widely used "benchmark" or reference rate for short-term interest rates. Unlike a mutual fund, the indices are not subject to charges, fees and other expenses. Investors cannot invest directly in any index. Further information relating to fund performance, including expense reimbursements, if applicable, is contained in the Financial Highlights section of the prospectus and elsewhere in this report.
6
| | | | | |
Average Annual Total Returns as of 10/31/18 |
| Inception
Date | 1 Year | 5 Years | From
Inception |
Class A shares | | | | |
with maximum sales charge (5.75%) | 5/12/10 | -5.81% | 0.81% | 2.65% |
without sales charge | 5/12/10 | -0.05% | 2.01% | 3.37% |
Class C shares | | | | |
with applicable redemption charge† | 5/12/10 | -1.85% | 1.26% | 2.60% |
without redemption | 5/12/10 | -0.86% | 1.26% | 2.60% |
Class I shares | 5/12/10 | 0.11% | 2.27% | 3.65% |
Class Y shares | 7/1/13 | 0.24% | 2.34% | 3.61%†† |
USD 1-Month LIBOR Index | 4/30/10 | 1.81% | 0.70% | 0.51%††† |
FTSE One-Month U.S. Treasury
Bill Index | 4/30/10 | 1.62% | 0.50% | 0.32%††† |
† The maximum contingent deferred sales charge for Class C shares is 1% for shares redeemed within one year of the date of purchase.
†† The total return performance figures presented for Class Y shares of the fund reflect the performance of the fund’s Class A shares for the period prior to 7/1/13 (the inception date for Class Y shares), not reflecting the applicable sales charges for Class A shares.
††† For comparative purposes, the value of each Index as of 4/30/10 is used as the beginning value on 5/12/10.
The performance data quoted represents past performance, which is no guarantee of future results. Share price and investment return fluctuate and an investor’s shares may be worth more or less than original cost upon redemption. Current performance may be lower or higher than the performance quoted. Go to Dreyfus.com for the fund’s most recent month-end returns.
The fund’s performance shown in the graph and table does not reflect the deduction of taxes that a shareholder would pay on fund distributions or the redemption of fund shares. In addition to the performance of Class A shares shown with and without a maximum sales charge, the fund’s performance shown in the table takes into account all other applicable fees and expenses on all classes.
7
UNDERSTANDING YOUR FUND’S EXPENSES (Unaudited)
As a mutual fund investor, you pay ongoing expenses, such as management fees and other expenses. Using the information below, you can estimate how these expenses affect your investment and compare them with the expenses of other funds. You also may pay one-time transaction expenses, including sales charges (loads) and redemption fees, which are not shown in this section and would have resulted in higher total expenses. For more information, see your fund’s prospectus or talk to your financial adviser.
Review your fund’s expenses
The table below shows the expenses you would have paid on a $1,000 investment in Dreyfus Global Real Return Fund from May 1, 2018 to October 31, 2018. It also shows how much a $1,000 investment would be worth at the close of the period, assuming actual returns and expenses.
| | | | | | | | | |
Expenses and Value of a $1,000 Investment |
assuming actual returns for the six months ended October 31, 2018 |
| | | | | |
| | Class A | Class C | Class I | Class Y |
Expenses paid per $1,000† | | $5.70 | | $9.51 | | $4.54 | | $4.04 |
Ending value (after expenses) | | $1,000.00 | | $995.70 | | $1,000.70 | | $1,001.40 |
COMPARING YOUR FUND’S EXPENSES
WITH THOSE OF OTHER FUNDS (Unaudited)
Using the SEC’s method to compare expenses
The Securities and Exchange Commission (“SEC”) has established guidelines to help investors assess fund expenses. Per these guidelines, the table below shows your fund’s expenses based on a $1,000 investment, assuming a hypothetical 5% annualized return. You can use this information to compare the ongoing expenses (but not transaction expenses or total cost) of investing in the fund with those of other funds. All mutual fund shareholder reports will provide this information to help you make this comparison. Please note that you cannot use this information to estimate your actual ending account balance and expenses paid during the period.
| | | | | | | | | |
Expenses and Value of a $1,000 Investment |
assuming a hypothetical 5% annualized return for the six months ended October 31, 2018 |
| | | | | |
| | Class A | Class C | Class I | Class Y |
Expenses paid per $1,000† | | $5.75 | | $9.60 | | $4.58 | | $4.08 |
Ending value (after expenses) | | $1,019.51 | | $1,015.68 | | $1,020.67 | | $1,021.17 |
† Expenses are equal to the fund’s annualized expense ratio of 1.13% for Class A, 1.89% for Class C, .90% for Class I and .80% for Class Y, multiplied by the average account value over the period, multiplied by 184/365 (to reflect the one-half year period).
8
STATEMENT OF INVESTMENTS
October 31, 2018
| | | | | | | | | | |
| |
Description | Coupon
Rate (%) | | Maturity
Date | | Principal
Amount ($) | a | Value ($) | |
Bonds and Notes - 39.8% | | | | | |
Australia - 5.3% | | | | | |
Australia Government Bond,
Sr. Unscd. Bonds | AUD | 3.00 | | 3/21/2047 | | 46,252,000 | | 32,043,327 | |
Australia Government Bond,
Sr. Unscd. Bonds | AUD | 3.25 | | 6/21/2039 | | 15,146,000 | | 11,106,336 | |
Australian Government,
Sr. Unscd. Bonds, Ser. 144 | AUD | 3.75 | | 4/21/2037 | | 29,956,000 | | 23,598,548 | |
New South Wales Treasury,
Govt. Gtd. Notes | AUD | 3.52 | | 11/20/2025 | | 6,226,300 | | 6,435,249 | |
Treasury Corp. of Victoria,
Govt. Gtd. Notes | AUD | 4.25 | | 12/20/2032 | | 6,399,000 | | 5,062,062 | |
Treasury Corp. of Victoria,
Govt. Gtd. Notes | AUD | 5.50 | | 11/17/2026 | | 4,023,000 | | 3,406,640 | |
| | 81,652,162 | |
Brazil - 1.3% | | | | | |
Brazilian Government,
Sr. Unscd. Bonds | | 4.88 | | 1/22/2021 | | 15,737,000 | | 16,020,266 | |
Brazilian Government,
Sr. Unscd. Bonds | | 5.00 | | 1/27/2045 | | 4,599,000 | | 3,854,537 | |
| | 19,874,803 | |
Canada - 1.7% | | | | | |
Canada Housing Trust No 1,
Govt. Gtd. Bonds | CAD | 2.35 | | 6/15/2027 | | 37,015,000 | b | 27,034,207 | |
Cayman Islands - .2% | | | | | |
Dwr Cymru Financing,
Asset Backed Bonds | GBP | 1.86 | | 3/31/2048 | | 195,638 | c | 421,676 | |
Sable International Finance,
Gtd. Notes | | 6.88 | | 8/1/2022 | | 2,029,000 | b | 2,122,841 | |
| | 2,544,517 | |
Ecuador - .1% | | | | | |
Ecuadorian Government,
Sr. Unscd. Notes | | 8.88 | | 10/23/2027 | | 2,435,000 | | 2,149,496 | |
Germany - 1.2% | | | | | |
Bundesrepublik Deutschland Bundesanleihe,
Bonds | EUR | 0.25 | | 8/15/2028 | | 16,282,703 | | 18,209,729 | |
India - .1% | | | | | |
National Highways Authority of India,
Sr. Unscd. Bonds | INR | 7.30 | | 5/18/2022 | | 120,000,000 | | 1,522,159 | |
Indonesia - .1% | | | | | |
Indonesian Government,
Sr. Unscd. Bonds | IDR | 8.25 | | 5/15/2036 | | 15,462,000,000 | | 955,791 | |
9
STATEMENT OF INVESTMENTS (continued)
| | | | | | | | | | |
| |
Description | Coupon
Rate (%) | | Maturity
Date | | Principal
Amount ($) | a | Value ($) | |
Bonds and Notes - 39.8% (continued) | | | | | |
Italy - .3% | | | | | |
Italian Government,
Bonds | EUR | 0.35 | | 6/15/2020 | | 485,000 | | 543,282 | |
Nexi Capital,
Sr. Scd. Bonds | EUR | 4.13 | | 11/1/2023 | | 2,970,000 | | 3,378,089 | |
| | 3,921,371 | |
Japan - .2% | | | | | |
SoftBank Group Corp,
Sub. Notes | | 6.00 | | 12/31/2049 | | 2,935,000 | | 2,579,146 | |
Jersey - .1% | | | | | |
CPUK Finance,
Scd. Bonds | GBP | 4.25 | | 2/28/2047 | | 1,795,000 | | 2,311,678 | |
Mexico - .9% | | | | | |
Mexican Government,
Bonds | MXN | 7.50 | | 6/3/2027 | | 76,956,600 | | 3,488,785 | |
Mexican Government,
Bonds | MXN | 7.75 | | 5/29/2031 | | 77,244,000 | | 3,469,986 | |
Mexican Government,
Bonds | MXN | 8.00 | | 11/7/2047 | | 14,557,300 | | 643,513 | |
Mexican Government,
Bonds, Ser. M 20 | MXN | 10.00 | | 12/5/2024 | | 116,860,600 | | 6,101,149 | |
| | 13,703,433 | |
Netherlands - .5% | | | | | |
InterXion Holding,
Gtd. Notes | EUR | 4.75 | | 6/15/2025 | | 2,702,000 | | 3,198,139 | |
Petrobras Global Finance,
Gtd. Notes | | 7.38 | | 1/17/2027 | | 648,000 | | 673,823 | |
Telefonica Europe,
Gtd. Bonds | EUR | 3.00 | | 12/4/2023 | | 1,300,000 | | 1,415,344 | |
Teva Pharmaceuticals,
Gtd. Notes | | 2.20 | | 7/21/2021 | | 3,348,000 | | 3,127,995 | |
| | 8,415,301 | |
New Zealand - 2.0% | | | | | |
New Zealand Government,
Sr. Unscd. Bonds | NZD | 2.54 | | 9/20/2040 | | 5,000,000 | | 3,865,396 | |
New Zealand Government,
Sr. Unscd. Bonds, Ser. 0427 | NZD | 4.50 | | 4/15/2027 | | 24,372,000 | | 18,477,573 | |
New Zealand Government,
Sr. Unscd. Bonds, Ser. 0437 | NZD | 2.75 | | 4/15/2037 | | 13,529,000 | | 8,708,522 | |
| | 31,051,491 | |
United Kingdom - 1.4% | | | | | |
Anglian Water Services Financing,
Sr. Scd. Notes, Ser. A8 | GBP | 3.67 | | 7/30/2024 | | 151,000 | | 389,071 | |
British Telecommunications,
Sr. Unscd. Notes | GBP | 3.50 | | 4/25/2025 | | 533,000 | | 1,424,033 | |
High Speed Rail Finance 1,
Sr. Scd. Notes | GBP | 1.57 | | 11/1/2038 | | 309,419 | c | 530,478 | |
10
| | | | | | | | | | |
| |
Description | Coupon
Rate (%) | | Maturity
Date | | Principal
Amount ($) | a | Value ($) | |
Bonds and Notes - 39.8% (continued) | | | | | |
United Kingdom - 1.4% (continued) | | | | | |
Network Rail Infrastructure Finance,
Govt. Gtd. Notes, Ser. RPI | GBP | 1.75 | | 11/22/2027 | | 1,197,826 | c | 2,030,804 | |
Scotland Gas Networks,
Sr. Unscd. Notes | GBP | 2.13 | | 10/21/2022 | | 300,000 | | 635,167 | |
TESCO,
Sr. Unscd. Notes | GBP | 3.32 | | 11/5/2025 | | 3,960,000 | | 9,980,726 | |
TESCO,
Sr. Unscd. Notes | GBP | 6.13 | | 2/24/2022 | | 147,000 | | 212,336 | |
Tesco Property Finance 3,
Sr. Scd. Bonds | GBP | 5.74 | | 4/13/2040 | | 2,743,703 | | 4,143,726 | |
Thames Water Kemble Finance,
Sr. Scd. Notes | GBP | 7.75 | | 4/1/2019 | | 922,000 | | 1,207,053 | |
Vodafone Group,
Jr. Sub. Bonds | GBP | 4.88 | | 10/3/2078 | | 1,169,000 | | 1,462,501 | |
| | 22,015,895 | |
United States - 24.4% | | | | | |
CCO Holdings,
Sr. Unscd. Notes | | 5.50 | | 5/1/2026 | | 2,727,000 | b | 2,662,234 | |
CEMEX Finance,
Sr. Scd. Notes | | 6.00 | | 4/1/2024 | | 5,760,000 | | 5,761,440 | |
Chesapeake Energy,
Gtd. Notes | | 7.00 | | 10/1/2024 | | 1,412,000 | | 1,381,995 | |
Netflix,
Sr. Unscd. Notes | EUR | 4.63 | | 5/15/2029 | | 1,769,000 | | 2,013,426 | |
Post Holdings,
Gtd. Notes | | 5.50 | | 3/1/2025 | | 3,029,000 | b | 2,940,023 | |
Refinitiv US Holdings,
Sr. Unscd. Notes | EUR | 6.88 | | 11/15/2026 | | 1,182,000 | | 1,334,776 | |
Reynolds Group,
Sr. Scd. Notes | | 5.75 | | 10/15/2020 | | 4,435,606 | | 4,441,151 | |
Spectrum Brands,
Gtd. Notes | | 6.63 | | 11/15/2022 | | 3,458,000 | | 3,540,127 | |
Sprint,
Gtd. Notes | | 7.13 | | 6/15/2024 | | 3,548,000 | | 3,636,700 | |
Sprint Capital,
Gtd. Notes | | 8.75 | | 3/15/2032 | | 5,395,000 | | 5,881,089 | |
T-Mobile USA,
Gtd. Notes | | 6.00 | | 3/1/2023 | | 2,563,000 | | 2,627,331 | |
T-Mobile USA,
Gtd. Notes | | 6.00 | | 4/15/2024 | | 3,236,000 | | 3,324,990 | |
U.S. Treasury Notes | | 2.25 | | 11/15/2027 | | 203,247,600 | | 189,151,267 | |
U.S. Treasury Notes | | 2.75 | | 9/30/2020 | | 148,205,200 | | 147,886,790 | |
| | 376,583,339 | |
Total Bonds and Notes
(cost $627,802,639) | | 614,524,518 | |
11
STATEMENT OF INVESTMENTS (continued)
| | | | | | | | | | |
| |
Description | | | | | Shares | | Value ($) | |
Common Stocks - 43.1% | | | | | |
Australia - 1.0% | | | | | |
Dexus | | | | | | 1,576,362 | d | 11,415,542 | |
Newcrest Mining | | | | | | 231,132 | | 3,394,310 | |
OceanaGold | | | | | | 354,357 | | 1,020,178 | |
| | 15,830,030 | |
Canada - 1.9% | | | | | |
Agnico-Eagle Mines | | | | | | 28,516 | | 1,007,250 | |
Alamos Gold | | | | | | 198,666 | | 793,789 | |
Eldorado Gold | | | | | | 536,382 | e | 358,552 | |
Intact Financial | | | | | | 161,573 | | 12,765,550 | |
Kinross Gold | | | | | | 143,262 | e | 372,180 | |
New Gold | | | | | | 505,377 | e | 403,088 | |
Suncor Energy | | | | | | 276,929 | | 9,289,517 | |
Wheaton Precious Metals | | | | | | 253,651 | | 4,169,553 | |
| | 29,159,479 | |
Denmark - 1.1% | | | | | |
Orsted | | | | | | 258,091 | b | 16,397,387 | |
France - 2.0% | | | | | |
Thales | | | | | | 63,443 | | 8,099,881 | |
Total | | | | | | 165,864 | | 9,734,422 | |
Vivendi | | | | | | 521,961 | | 12,611,294 | |
| | 30,445,597 | |
Germany - 4.1% | | | | | |
Bayer | | | | | | 103,541 | | 7,949,480 | |
Deutsche Wohnen-BR | | | | | | 330,083 | | 15,115,191 | |
Infineon Technologies | | | | | | 406,632 | | 8,151,815 | |
LEG Immobilien | | | | | | 137,137 | | 15,012,750 | |
SAP | | | | | | 95,119 | | 10,193,914 | |
Telefonica Deutschland Holding | | | | | | 1,637,213 | | 6,368,044 | |
| | 62,791,194 | |
Guernsey - .3% | | | | | |
Amedeo Air Four Plus | | | | | | 3,691,487 | | 5,024,978 | |
Hong Kong - 2.7% | | | | | |
AIA Group | | | | | | 3,508,800 | | 26,688,007 | |
Link REIT | | | | | | 1,597,500 | | 14,139,641 | |
| | 40,827,648 | |
India - .4% | | | | | |
ITC | | | | | | 1,596,638 | e | 6,035,292 | |
Ireland - 3.1% | | | | | |
Accenture | | | | | | 110,642 | | 17,439,392 | |
AIB Group | | | | | | 718,979 | | 3,476,506 | |
CRH | | | | | | 325,199 | | 9,753,997 | |
Linde | | | | | | 65,400 | | 10,821,738 | |
12
| | | | | | | | | | |
| |
Description | | | | | Shares | | Value ($) | |
Common Stocks - 43.1% (continued) | | | | | |
Ireland - 3.1% (continued) | | | | | |
Smurfit Kappa Group | | | | | | 200,368 | | 6,569,545 | |
| | 48,061,178 | |
Japan - .9% | | | | | |
Suzuki Motor | | | | | | 282,200 | | 14,079,890 | |
Jersey - .0% | | | | | |
Randgold Resources | | | | | | 7,772 | | 611,244 | |
Mexico - .4% | | | | | |
Fresnillo | | | | | | 99,012 | | 1,073,519 | |
Wal-Mart de Mexico | | | | | | 2,148,400 | | 5,493,355 | |
| | 6,566,874 | |
Netherlands - 2.2% | | | | | |
Royal Dutch Shell, Cl. B | | | | | | 525,431 | | 17,107,862 | |
Wolters Kluwer | | | | | | 308,211 | | 17,500,091 | |
| | 34,607,953 | |
South Africa - .0% | | | | | |
Gold Fields | | | | | | 201,714 | | 532,493 | |
South Korea - 1.8% | | | | | |
Macquarie Korea Infrastructure Fund | | | | | | 1,467,077 | | 11,667,050 | |
Samsung SDI | | | | | | 77,894 | | 16,027,671 | |
| | 27,694,721 | |
Switzerland - 4.9% | | | | | |
ABB | | | | | | 618,676 | | 12,437,241 | |
Ferguson | | | | | | 193,617 | | 13,064,040 | |
Novartis | | | | | | 349,369 | | 30,509,064 | |
Roche Holding | | | | | | 42,839 | | 10,394,804 | |
Zurich Insurance Group | | | | | | 30,425 | e | 9,440,560 | |
| | 75,845,709 | |
Taiwan - .9% | | | | | |
Taiwan Semiconductor Manufacturing, ADR | | | | | | 347,252 | | 13,230,301 | |
United Kingdom - 5.7% | | | | | |
Associated British Foods | | | | | | 301,926 | | 9,206,280 | |
BAE Systems | | | | | | 1,995,922 | | 13,407,249 | |
Cobham | | | | | | 4,501,868 | e | 6,191,994 | |
Diageo | | | | | | 334,491 | | 11,569,093 | |
Informa | | | | | | 1,211,285 | | 11,038,781 | |
Prudential | | | | | | 531,906 | | 10,670,034 | |
RELX | | | | | | 670,216 | e | 13,261,829 | |
Unilever | | | | | | 248,916 | | 13,401,077 | |
| | 88,746,337 | |
United States - 9.7% | | | | | |
Abbott Laboratories | | | | | | 118,638 | | 8,178,904 | |
Alacer Gold | | | | | | 831,193 | e | 1,357,488 | |
13
STATEMENT OF INVESTMENTS (continued)
| | | | | | | | | | |
| |
Description | | | | | Shares | | Value ($) | |
Common Stocks - 43.1% (continued) | | | | | |
United States - 9.7% (continued) | | | | | |
Albemarle | | | | | | 114,130 | | 11,323,979 | |
Applied Materials | | | | | | 254,829 | | 8,378,778 | |
Cisco Systems | | | | | | 664,057 | | 30,380,608 | |
Citigroup | | | | | | 109,055 | | 7,138,740 | |
CMS Energy | | | | | | 271,738 | | 13,456,466 | |
Ecolab | | | | | | 51,769 | | 7,928,422 | |
Eversource Energy | | | | | | 264,729 | | 16,746,757 | |
General Electric | | | | | | 686,380 | | 6,932,438 | |
Maxim Integrated Products | | | | | | 108,446 | | 5,424,469 | |
Microsoft | | | | | | 125,528 | | 13,407,646 | |
Newmont Mining | | | | | | 16,261 | | 502,790 | |
PepsiCo | | | | | | 90,981 | | 10,224,445 | |
Schlumberger | | | | | | 167,774 | | 8,608,484 | |
| | 149,990,414 | |
Total Common Stocks
(cost $587,640,570) | | 666,478,719 | |
Description /Number of Contracts | Exercise
Price | | Expiration Date | | Notional Amount ($) | a | | |
Options Purchased - .0% | | | | | |
Call Options - .0% | | | | | |
Euro Stoxx 50
Contracts 1,948 | EUR | 3,400 | | 11/16/2018 | | 33,456,000 | | 24,269 | |
S&P 500 Index
Contracts 311 | | 3,000 | | 1/18/2019 | | 93,300,000 | | 161,720 | |
Total Options Purchased
(cost $1,473,886) | | 185,989 | |
| | Preferred Dividend
Yield (%) | | | | Shares | | | |
Preferred Stocks - 1.2% | | | | | |
Germany - .7% | | | | | |
Volkswagen | | 2.70 | | | | 67,535 | | 11,374,305 | |
South Korea - .5% | | | | | |
Samsung Electronics | | 3.29 | | | | 238,243 | | 7,507,517 | |
Total Preferred Stocks
(cost $22,037,075) | | 18,881,822 | |
| | | | | | | | | |
Exchange-Traded Funds - 1.3% | | | | | |
United States - 1.3% | | | | | |
Invesco DB Gold Fund
(cost $21,569,887) | | | | | | 509,414 | e,f | 19,464,709 | |
14
| | | | | | | | | | |
| |
Description | Yield at
Date of
Purchase (%) | | Maturity Date | | Principal Amount ($) | | Value ($) | |
Short-Term Investments - 9.3% | | | | | |
U.S. Government Securities | | | | | |
U.S. Treasury Bills
(cost $144,337,738) | | 2.43 | | 4/4/2019 | | 145,816,700 | g | 144,332,124 | |
Description | 7-Day
Yield (%) | | | | Shares | | | |
Investment Companies - 3.8% | | | | | |
Registered Investment Companies - 3.8% | | | | | |
Dreyfus Institutional Preferred Government Plus Money Market Fund
(cost $59,322,564) | | 2.21 | | | | 59,322,564 | h | 59,322,564 | |
Total Investments (cost $1,464,184,359) | | 98.5% | 1,523,190,445 | |
Cash and Receivables (Net) | | 1.5% | 22,988,051 | |
Net Assets | | 100.0% | 1,546,178,496 | |
ADR—American Depository Receipt
BR—Bearer Certificate
ETF—Exchange-Traded Fund
GDR—Global Depository Receipt
AUD—Australian Dollar
CAD—Canadian Dollar
CHF—Swiss Franc
EUR—Euro
GBP—British Pound
HKD—Hong Kong Dollar
IDR—Indonesian Rupiah
INR—Indian Rupee
JPY—Japanese Yen
KRW—South Korean Won
MXN—Mexican Peso
NZD—New Zealand Dollar
a Amount stated in U.S. Dollars unless otherwise noted above.
b Security exempt from registration pursuant to Rule 144A under the Securities Act of 1933. These securities may be resold in transactions exempt from registration, normally to qualified institutional buyers. At October 31, 2018, these securities were valued at $51,156,692 or 3.31% of net assets.
c Principal amount for accrual purposes is periodically adjusted based on changes in the Consumer Price Index.
d Investment in real estate investment trust.
e Non-income producing security.
f Investment in non-controlled affiliates (cost $21,569,887).
g Security is a discount security. Income is recognized through the accretion of discount.
h Investment in affiliated issuer. The investment objective of this investment company is publicly available and can be found within the investment company’s prospectus.
15
STATEMENT OF INVESTMENTS (continued)
| | |
Portfolio Summary (Unaudited) † | Value (%) |
U.S. Government Securities | 31.1 |
Foreign/Governmental | 12.7 |
Registered Investment Companies | 5.1 |
Health Care | 3.9 |
Real Estate | 3.9 |
Insurance | 3.9 |
Utilities | 3.2 |
Technology Hardware & Equipment | 3.1 |
Telecommunication Services | 3.0 |
Energy | 3.0 |
Media | 2.8 |
Semiconductors & Semiconductor Equipment | 2.3 |
Information Technology | 2.2 |
Aerospace & Defense | 1.8 |
Commercial & Professional Services | 1.7 |
Automobiles & Components | 1.6 |
Food Products | 1.4 |
Chemicals | 1.4 |
Beverage Products | 1.4 |
Industrials | 1.3 |
Consumer Staples | 1.1 |
Financials | 1.1 |
Metals & Mining | 1.0 |
Building Materials | 1.0 |
Consumer Discretionary | 1.0 |
Banks | .7 |
Forest Products & Other | .4 |
Agriculture | .4 |
Retailing | .4 |
Materials | .3 |
Transportation | .2 |
Internet Software & Services | .1 |
Options Purchased | .0 |
| | 98.5 |
† Based on net assets.
See notes to financial statements.
16
STATEMENT OF INVESTMENTS IN AFFILIATED ISSUERS
| | | | | | | |
Registered Investment Company | Value
10/31/17($) | Purchases($) | Sales($) | Value
10/31/18($) | Net
Assets(%) | Dividends/
Distributions($) |
Dreyfus Institutional Preferred Government Plus Money Market Fund | 74,279,655 | 1,232,266,296 | 1,247,223,387 | 59,322,564 | 3.8 | 1,072,324 |
See notes to financial statements.
In addition, an affiliated company is a company in which the fund has ownership of at least 5% of the voting securities. Investments in affiliated companies during the period ended October 31, 2018 were as follows:
| | | | | |
Affiliated
Company | Value
10/31/17($) | Purchases($) | Sales($) | Net Realized
Gain (Loss)($) |
Invesco DB
Gold Fund | 20,585,420 | - | - | - |
| | | | | |
Affiliated
Company | Change in Net Unrealized Appreciation
(Depreciation)($) | Value
10/31/18($) | Net
Assets(%) | Dividends/
Distributions($) |
Invesco DB
Gold Fund | (1,120,711) | 19,464,709 | 1.3 | - |
See notes to financial statements.
17
STATEMENT OF FUTURES
October 31, 2018
| | | | | | | |
Description | Number of
Contracts | Expiration | Notional
Value ($) | Value ($) | Unrealized Appreciation ($) | |
Futures Short | | |
DJ Euro Stoxx 50 | 284 | 12/18 | 10,719,097a | 10,274,223 | 444,874 | |
E-mini Russell 2000 | 192 | 12/18 | 16,031,979 | 14,514,240 | 1,517,739 | |
FTSE 100 | 257 | 12/18 | 23,831,702a | 23,359,450 | 472,252 | |
Standard & Poor's 500 | 13 | 12/18 | 9,412,149 | 8,811,075 | 601,074 | |
Standard & Poor's 500 E-mini | 361 | 12/18 | 50,807,458 | 48,935,355 | 1,872,103 | |
Gross Unrealized Appreciation | | 4,908,042 | |
a Notional amounts in foreign currency have been converted to USD using relevant foreign exchange rates.
See notes to financial statements.
18
STATEMENT OF OPTIONS WRITTEN
October 31, 2018
| | | | | | | |
Description/ Contracts | Exercise Price | Expiration Date | Notional Amount | | Value ($) | |
Call Options: | | | | | | |
S&P 500 Index
Contracts 311 | 3,150 | 1/18/19 | 97,965,000 | | (24,103) | |
Total Options Written (premiums received $248,489) | | | | (24,103) | |
See notes to financial statements.
19
STATEMENT OF FORWARD FOREIGN CURRENCY EXCHANGE CONTRACTS October 31, 2018
| | | | | | |
Counterparty/ Purchased
Currency | Purchased Currency
Amounts | Currency
Sold | Sold
Currency
Amounts | Settlement Date | Unrealized Appreciation (Depreciation)($) |
CIBC World Markets Corp. | | | |
Canadian Dollar | 229,082 | United States Dollar | 175,316 | 11/14/18 | (1,260) |
British Pound | 302,055 | United States Dollar | 401,399 | 1/16/19 | (13,695) |
Citigroup | | | |
United States Dollar | 627,870 | Canadian Dollar | 826,472 | 11/14/18 | (82) |
United States Dollar | 1,227,376 | British Pound | 945,204 | 1/16/19 | 14,157 |
Australian Dollar | 645,919 | United States Dollar | 459,763 | 12/13/18 | (2,140) |
United States Dollar | 5,516,000 | Australian Dollar | 7,840,367 | 12/13/18 | (38,781) |
United States Dollar | 41,931,546 | Hong Kong Dollar | 328,758,000 | 11/14/18 | (13,980) |
Canadian Dollar | 1,177,060 | United States Dollar | 907,715 | 11/14/18 | (13,387) |
United States Dollar | 117,008 | Euro | 100,008 | 1/16/19 | 2,907 |
United States Dollar | 76,893,098 | Canadian Dollar | 100,369,083 | 11/14/18 | 632,885 |
J.P. Morgan Securities | | | |
Canadian Dollar | 816,773 | United States Dollar | 627,443 | 11/14/18 | (6,861) |
Euro | 107,444 | United States Dollar | 122,970 | 1/16/19 | (385) |
Australian Dollar | 977,451 | United States Dollar | 697,851 | 12/13/18 | (5,342) |
United States Dollar | 1,518,147 | Canadian Dollar | 1,943,573 | 11/14/18 | 41,425 |
British Pound | 5,841,000 | United States Dollar | 7,648,665 | 1/16/19 | (151,434) |
British Pound | 39,835 | United States Dollar | 50,812 | 11/1/18 | 107 |
Australian Dollar | 324,462 | United States Dollar | 230,604 | 12/13/18 | (728) |
United States Dollar | 10,847 | Canadian Dollar | 14,247 | 11/1/18 | 25 |
United States Dollar | 135,883 | Euro | 119,614 | 11/1/18 | 392 |
Swiss Franc | 1,546,624 | United States Dollar | 1,565,809 | 11/14/18 | (28,253) |
United States Dollar | 62,374,037 | Swiss Franc | 61,579,143 | 11/14/18 | 1,155,948 |
RBS Securities | | | |
Australian Dollar | 451,439 | United States Dollar | 321,554 | 12/13/18 | (1,716) |
20
| | | | | | |
Counterparty/ Purchased
Currency | Purchased Currency
Amounts | Currency
Sold | Sold
Currency
Amounts | Settlement Date | Unrealized Appreciation (Depreciation)($) |
RBS Securities (continued) |
United States Dollar | 30,448,449 | New Zealand Dollar | 45,146,268 | 11/14/18 | 983,757 |
United States Dollar | 191,903,693 | Euro | 165,788,892 | 1/16/19 | 2,751,837 |
State Street Bank and Trust Company | | | |
Australian Dollar | 3,452,635 | United States Dollar | 2,460,737 | 12/13/18 | (14,598) |
United States Dollar | 132,843,858 | Australian Dollar | 184,573,520 | 12/13/18 | 2,076,322 |
United States Dollar | 3,214,595 | Canadian Dollar | 4,217,164 | 11/14/18 | 10,403 |
Mexican Peso | 121,126,000 | United States Dollar | 6,062,392 | 11/5/18 | (104,933) |
Canadian Dollar | 812,955 | United States Dollar | 624,020 | 11/14/18 | (6,338) |
United States Dollar | 1,993,179 | Hong Kong Dollar | 15,605,710 | 11/14/18 | 2,080 |
Hong Kong Dollar | 951,394 | United States Dollar | 121,630 | 11/14/18 | (244) |
United States Dollar | 31,485,006 | South Korean Won | 35,181,188,605 | 11/14/18 | 600,745 |
New Zealand Dollar | 734,394 | United States Dollar | 480,174 | 11/14/18 | (872) |
British Pound | 448,465 | United States Dollar | 578,741 | 1/16/19 | (3,113) |
United States Dollar | 147,160,355 | British Pound | 112,134,033 | 1/16/19 | 3,230,413 |
Swiss Franc | 2,957,416 | United States Dollar | 2,992,710 | 11/14/18 | (52,634) |
Euro | 4,613,126 | United States Dollar | 5,322,060 | 1/16/19 | (58,852) |
United States Dollar | 20,183,444 | Euro | 17,331,010 | 1/16/19 | 410,149 |
United States Dollar | 2,329,205 | Swiss Franc | 2,260,429 | 11/14/18 | 82,029 |
UBS Securities | | | |
Swiss Franc | 3,013,954 | United States Dollar | 3,064,370 | 11/14/18 | (68,087) |
British Pound | 1,372,091 | United States Dollar | 1,808,042 | 1/16/19 | (46,891) |
United States Dollar | 652,966 | British Pound | 506,290 | 1/16/19 | 3,116 |
Euro | 1,074,576 | United States Dollar | 1,243,611 | 1/16/19 | (17,606) |
United States Dollar | 2,654,619 | Euro | 2,305,421 | 1/16/19 | 24,318 |
Canadian Dollar | 204,738 | United States Dollar | 155,845 | 11/14/18 | (285) |
21
STATEMENT OF FORWARD FOREIGN CURRENCY EXCHANGE CONTRACTS (continued)
| | | | | | |
Counterparty/ Purchased
Currency | Purchased Currency
Amounts | Currency
Sold | Sold
Currency
Amounts | Settlement Date | Unrealized Appreciation (Depreciation)($) |
UBS Securities (continued) |
United States Dollar | 2,036,182 | Canadian Dollar | 2,647,874 | 11/14/18 | 24,333 |
Australian Dollar | 2,073,003 | United States Dollar | 1,480,503 | 12/13/18 | (11,812) |
United States Dollar | 15,131 | Euro | 13,364 | 11/1/18 | (7) |
Gross Unrealized Appreciation | | | 12,047,348 |
Gross Unrealized Depreciation | | | (664,316) |
See notes to financial statements.
22
STATEMENT OF ASSETS AND LIABILITIES
October 31, 2018
| | | | | | | |
| | | | | | |
| | | Cost | | Value | |
Assets ($): | | | | |
Investments in securities—See Statement of Investments: | | | |
Unaffiliated issuers | 1,383,291,908 | | 1,444,403,172 | |
Affiliated issuers | | 80,892,451 | | 78,787,273 | |
Cash | | | | | 414,253 | |
Cash denominated in foreign currency | | | 115,291 | | 115,531 | |
Unrealized appreciation on forward foreign
currency exchange contracts—Note 4 | | 12,047,348 | |
Receivable for shares of Common Stock subscribed | | 9,200,884 | |
Dividends and interest receivable | | 8,228,390 | |
Receivable for investment securities sold | | 7,094,458 | |
Cash collateral held by broker—Note 4 | | 4,313,281 | |
Prepaid expenses | | | | | 37,779 | |
| | | | | 1,564,642,369 | |
Liabilities ($): | | | | |
Due to The Dreyfus Corporation and affiliates—Note 3(c) | | | | 1,132,385 | |
Payable for investment securities purchased | | 13,045,192 | |
Payable for shares of Common Stock redeemed | | 2,593,518 | |
Payable for futures variation margin—Note 4 | | 754,609 | |
Unrealized depreciation on forward foreign
currency exchange contracts—Note 4 | | 664,316 | |
Unrealized depreciation on foreign currency transactions | | 39,902 | |
Outstanding options written, at value
(premiums received $248,489)—Note 4 | | 24,103 | |
Directors fees and expenses payable | | 15,972 | |
Accrued expenses | | | | | 193,876 | |
| | | | | 18,463,873 | |
Net Assets ($) | | | 1,546,178,496 | |
Composition of Net Assets ($): | | | | |
Paid-in capital | | | | | 1,586,765,377 | |
Total distributable earnings (loss) | | | | | (40,586,881) | |
Net Assets ($) | | | 1,546,178,496 | |
| | | | | | |
Net Asset Value Per Share | Class A | Class C | Class I | Class Y | |
Net Assets ($) | 26,380,156 | 27,738,981 | 688,369,194 | 803,690,165 | |
Shares Outstanding | 1,842,642 | 2,000,036 | 47,920,551 | 55,861,840 | |
Net Asset Value Per Share ($) | 14.32 | 13.87 | 14.36 | 14.39 | |
| | | | | | |
See notes to financial statements. | | | | | |
23
STATEMENT OF OPERATIONS
Year Ended October 31, 2018
| | | | | | | |
| | | | | | |
| | | | | | |
Investment Income ($): | | | | |
Income: | | | | |
Dividends (net of $1,545,628 foreign taxes withheld at source): | |
Unaffiliated issuers | | | 21,883,416 | |
Affiliated issuers | | | 1,072,324 | |
Interest (net of $82,580 foreign taxes withheld at source) | | | 19,017,296 | |
Total Income | | | 41,973,036 | |
Expenses: | | | | |
Management fee—Note 3(a) | | | 11,598,223 | |
Shareholder servicing costs—Note 3(c) | | | 924,210 | |
Distribution fees—Note 3(b) | | | 227,648 | |
Custodian fees—Note 3(c) | | | 197,328 | |
Directors’ fees and expenses—Note 3(d) | | | 123,574 | |
Professional fees | | | 122,376 | |
Registration fees | | | 105,501 | |
Prospectus and shareholders’ reports | | | 80,385 | |
Loan commitment fees—Note 2 | | | 25,332 | |
Miscellaneous | | | 82,015 | |
Total Expenses | | | 13,486,592 | |
Less—reduction in expenses due to undertaking—Note 3(a) | | | (42,349) | |
Less—reduction in fees due to earnings credits—Note 3(c) | | | (10,822) | |
Net Expenses | | | 13,433,421 | |
Investment Income—Net | | | 28,539,615 | |
Realized and Unrealized Gain (Loss) on Investments—Note 4 ($): | | |
Net realized gain (loss) on investments and foreign currency transactions | 19,717,526 | |
Net realized gain (loss) on options transactions | 4,983,673 | |
Net realized gain (loss) on futures | (30,468,374) | |
Net realized gain (loss) on forward foreign currency exchange contracts | 27,318,509 | |
Net Realized Gain (Loss) | | | 21,551,334 | |
Net unrealized appreciation (depreciation) on investments
and foreign currency transactions | | | (63,979,805) | |
Net unrealized appreciation (depreciation) on options transactions | (1,047,396) | |
Net unrealized appreciation (depreciation) on futures | | | 17,654,645 | |
Net unrealized appreciation (depreciation) on
forward foreign currency exchange contracts | | | (1,634,962) | |
Net Unrealized Appreciation (Depreciation) | | | (49,007,518) | |
Net Realized and Unrealized Gain (Loss) on Investments | | | (27,456,184) | |
Net Increase in Net Assets Resulting from Operations | | 1,083,431 | |
| | | | | | | |
See notes to financial statements. | | | | | |
24
STATEMENT OF CHANGES IN NET ASSETS
| | | | | | | | | | |
| | | | Year Ended October 31, |
| | | | 2018 | | 2017 | a |
Operations ($): | | | | | | | | |
Investment income—net | | | 28,539,615 | | | | 22,698,537 | |
Net realized gain (loss) on investments | | 21,551,334 | | | | (102,805,726) | |
Net unrealized appreciation (depreciation)
on investments | | (49,007,518) | | | | 91,835,518 | |
Net Increase (Decrease) in Net Assets
Resulting from Operations | 1,083,431 | | | | 11,728,329 | |
Distributions ($): | |
Distributions to shareholders: | | | | | | | | |
Class A | | | (160,339) | | | | (4,042,893) | |
Class C | | | - | | | | (793,954) | |
Class I | | | (6,085,615) | | | | (15,224,045) | |
Class Y | | | (7,357,475) | | | | (21,341,116) | |
Total Distributions | | | (13,603,429) | | | | (41,402,008) | |
Capital Stock Transactions ($): | |
Net proceeds from shares sold: | | | | | | | | |
Class A | | | 9,949,354 | | | | 46,710,000 | |
Class C | | | 5,779,933 | | | | 10,975,522 | |
Class I | | | 294,435,285 | | | | 627,749,307 | |
Class Y | | | 163,135,257 | | | | 258,887,594 | |
Distributions reinvested: | | | | | | | | |
Class A | | | 156,257 | | | | 3,988,624 | |
Class C | | | - | | | | 792,979 | |
Class I | | | 5,903,112 | | | | 14,782,332 | |
Class Y | | | 3,854,558 | | | | 10,697,251 | |
Cost of shares redeemed: | | | | | | | | |
Class A | | | (24,352,906) | | | | (160,619,601) | |
Class C | | | (12,015,519) | | | | (12,483,540) | |
Class I | | | (307,725,100) | | | | (441,168,901) | |
Class Y | | | (147,251,356) | | | | (174,731,954) | |
Increase (Decrease) in Net Assets
from Capital Stock Transactions | (8,131,125) | | | | 185,579,613 | |
Total Increase (Decrease) in Net Assets | (20,651,123) | | | | 155,905,934 | |
Net Assets ($): | |
Beginning of Period | | | 1,566,829,619 | | | | 1,410,923,685 | |
End of Period | | | 1,546,178,496 | | | | 1,566,829,619 | |
25
STATEMENT OF CHANGES IN NET ASSETS (continued)
| | | | | | | | | | |
| | | | Year Ended October 31, |
| | | | 2018 | | 2017 | a |
Capital Share Transactions (Shares): | |
Class Ab,c | | | | | | | | |
Shares sold | | | 691,964 | | | | 3,299,172 | |
Shares issued for distributions reinvested | | | 10,889 | | | | 287,158 | |
Shares redeemed | | | (1,709,260) | | | | (11,443,331) | |
Net Increase (Decrease) in Shares Outstanding | (1,006,407) | | | | (7,857,001) | |
Class Cb,c | | | | | | | | |
Shares sold | | | 415,213 | | | | 789,435 | |
Shares issued for distributions reinvested | | | - | | | | 58,393 | |
Shares redeemed | | | (862,746) | | | | (901,640) | |
Net Increase (Decrease) in Shares Outstanding | (447,533) | | | | (53,812) | |
Class Ic | | | | | | | | |
Shares sold | | | 20,426,413 | | | | 43,906,268 | |
Shares issued for distributions reinvested | | | 410,794 | | | | 1,061,187 | |
Shares redeemed | | | (21,397,769) | | | | (30,962,659) | |
Net Increase (Decrease) in Shares Outstanding | (560,562) | | | | 14,004,796 | |
Class Yc | | | | | | | | |
Shares sold | | | 11,301,935 | | | | 18,211,714 | |
Shares issued for distributions reinvested | | | 268,050 | | | | 767,929 | |
Shares redeemed | | | (10,234,190) | | | | (12,290,862) | |
Net Increase (Decrease) in Shares Outstanding | 1,335,795 | | | | 6,688,781 | |
| | | | | | | | | | |
a Distributions to shareholders include only distributions from net investment income. Distributions in excess of investment income—net was $17,991,058 in 2017 and is no longer presented as a result of the adoption of SEC’s Disclosure Update and Simplification Rule. | |
b During the period ended October 31, 2018, 307 Class C shares representing $4,204 were automatically converted to 298 Class A shares. | |
c During the period ended October 31, 2018, 21,357 Class A shares representing $306,692 were exchanged for 21,283 Class Y shares, 381,014 Class Y shares representing $5,512,575 were exchanged for 381,466 Class I shares and during the period ended October 31, 2017, 79,620 Class A shares representing $1,101,947 were exchanged for 79,391 Class I shares, 355 Class C shares representing $4,844 were exchanged for 346 Class I shares and 479,116 Class Y shares representing $6,867,173 were exchanged for 479,484 Class I shares. | |
See notes to financial statements.
| | | | | | | | |
26
FINANCIAL HIGHLIGHTS
The following tables describe the performance for each share class for the fiscal periods indicated. All information (except portfolio turnover rate) reflects financial results for a single fund share. Total return shows how much your investment in the fund would have increased (or decreased) during each period, assuming you had reinvested all dividends and distributions. These figures have been derived from the fund’s financial statements.
| | | | | | | |
| | | |
| | | Year Ended October 31, |
Class A Shares | | 2018 | 2017 | 2016 | 2015 | 2014 |
Per Share Data ($): | | | | | | |
Net asset value, beginning of period | | 14.39 | 14.72 | 14.61 | 15.11 | 14.75 |
Investment Operations: | | | | | | |
Investment income—neta | | .22 | .15 | .17 | .17 | .36 |
Net realized and unrealized
gain (loss) on investments | | (.23) | (.09) | .51 | .01b | .17 |
Total from Investment Operations | | (.01) | .06 | .68 | .18 | .53 |
Distributions: | | | | | | |
Dividends from
investment income—net | | (.06) | (.39) | (.57) | (.68) | (.04) |
Dividends from net realized
gain on investments | | - | - | - | - | (.13) |
Total Distributions | | (.06) | (.39) | (.57) | (.68) | (.17) |
Net asset value, end of period | | 14.32 | 14.39 | 14.72 | 14.61 | 15.11 |
Total Return (%)c | | (.05) | .47 | 4.87 | 1.22 | 3.63 |
Ratios/Supplemental Data (%): | | | | | | |
Ratio of total expenses
to average net assets | | 1.13 | 1.17 | 1.16 | 1.15 | 1.20 |
Ratio of net expenses to
average net assets | | 1.13 | 1.15 | 1.15 | 1.15 | 1.15 |
Ratio of net investment income
to average net assets | | 1.55 | 1.09 | 1.15 | 1.16 | 2.38 |
Portfolio Turnover Rate | | 85.64 | 79.00 | 57.17 | 68.92 | 47.01 |
Net Assets, end of period ($ x 1,000) | | 26,380 | 41,008 | 157,624 | 49,672 | 56,501 |
a Based on average shares outstanding.
b In addition to net realized and unrealized losses on investments, this amount includes an increase in net asset value per share resulting from the timing of issuances and redemptions of shares in relation to fluctuating market values for the portfolio investments.
c Exclusive of sales charge.
See notes to financial statements.
27
FINANCIAL HIGHLIGHTS (continued)
| | | | | | | |
| | | |
| | | Year Ended October 31, |
Class C Shares | | 2018 | 2017 | 2016 | 2015 | 2014 |
Per Share Data ($): | | | | | | |
Net asset value, beginning of period | | 13.99 | 14.34 | 14.26 | 14.79 | 14.51 |
Investment Operations: | | | | | | |
Investment income—neta | | .11 | .08 | .06 | .06 | .21 |
Net realized and unrealized
gain (loss) on investments | | (.23) | (.12) | .50 | .02b | .20 |
Total from Investment Operations | | (.12) | (.04) | .56 | .08 | .41 |
Distributions: | | | | | | |
Dividends from
investment income—net | | - | (.31) | (.48) | (.61) | - |
Dividends from net realized
gain on investments | | - | - | - | - | (.13) |
Total Distributions | | - | (.31) | (.48) | (.61) | (.13) |
Net asset value, end of period | | 13.87 | 13.99 | 14.34 | 14.26 | 14.79 |
Total Return (%)c | | (.86) | (.23) | 4.12 | .49 | 2.87 |
Ratios/Supplemental Data (%): | | | | | | |
Ratio of total expenses
to average net assets | | 1.90 | 1.92 | 1.90 | 1.91 | 1.96 |
Ratio of net expenses
to average net assets | | 1.89 | 1.90 | 1.90 | 1.90 | 1.90 |
Ratio of net investment income
to average net assets | | .82 | .58 | .44 | .39 | 1.41 |
Portfolio Turnover Rate | | 85.64 | 79.00 | 57.17 | 68.92 | 47.01 |
Net Assets, end of period ($ x 1,000) | | 27,739 | 34,240 | 35,861 | 16,470 | 11,969 |
a Based on average shares outstanding.
b In addition to net realized and unrealized losses on investments, this amount includes an increase in net asset value per share resulting from the timing of issuances and redemptions of shares in relation to fluctuating market values for the portfolio investments.
c Exclusive of sales charge.
See notes to financial statements.
28
| | | | | | | |
| | | |
| | | Year Ended October 31, |
Class I Shares | | 2018 | 2017 | 2016 | 2015 | 2014 |
Per Share Data ($): | | | | | | |
Net asset value, beginning of period | | 14.47 | 14.78 | 14.68 | 15.18 | 14.81 |
Investment Operations: | | | | | | |
Investment income—neta | | .26 | .23 | .20 | .21 | .38 |
Net realized and unrealized
gain (loss) on investments | | (.24) | (.13) | .52 | .01b | .19 |
Total from Investment Operations | | .02 | .10 | .72 | .22 | .57 |
Distributions: | | | | | | |
Dividends from
investment income—net | | (.13) | (.41) | (.62) | (.72) | (.07) |
Dividends from net realized
gain on investments | | - | - | - | - | (.13) |
Total Distributions | | (.13) | (.41) | (.62) | (.72) | (.20) |
Net asset value, end of period | | 14.36 | 14.47 | 14.78 | 14.68 | 15.18 |
Total Return (%) | | .11 | .82 | 5.16 | 1.49 | 3.89 |
Ratios/Supplemental Data (%): | | | | | | |
Ratio of total expenses
to average net assets | | .90 | .90 | .88 | .86 | .90 |
Ratio of net expenses
to average net assets | | .90 | .90 | .88 | .86 | .90 |
Ratio of net investment income
to average net assets | | 1.81 | 1.61 | 1.36 | 1.40 | 2.51 |
Portfolio Turnover Rate | | 85.64 | 79.00 | 57.17 | 68.92 | 47.01 |
Net Assets, end of period ($ x 1,000) | | 688,369 | 701,598 | 509,712 | 104,057 | 74,438 |
a Based on average shares outstanding.
b In addition to net realized and unrealized losses on investments, this amount includes an increase in net asset value per share resulting from the timing of issuances and redemptions of shares in relation to fluctuating market values for the portfolio investments.
See notes to financial statements.
29
FINANCIAL HIGHLIGHTS (continued)
| | | | | | | |
| | | |
| | | Year Ended October 31, |
Class Y Shares | | 2018 | 2017 | 2016 | 2015 | 2014 |
Per Share Data ($): | | | | | | |
Net asset value, beginning of period | | 14.49 | 14.79 | 14.69 | 15.18 | 14.81 |
Investment Operations: | | | | | | |
Investment income—neta | | .28 | .24 | .22 | .22 | .26 |
Net realized and unrealized
gain (loss) on investments | | (.25) | (.12) | .51 | .02b | .31 |
Total from Investment Operations | | .03 | .12 | .73 | .24 | .57 |
Distributions: | | | | | | |
Dividends from
investment income—net | | (.13) | (.42) | (.63) | (.73) | (.07) |
Dividends from net realized
gain on investments | | - | - | - | - | (.13) |
Total Distributions | | (.13) | (.42) | (.63) | (.73) | (.20) |
Net asset value, end of period | | 14.39 | 14.49 | 14.79 | 14.69 | 15.18 |
Total Return (%) | | .24 | .92 | 5.18 | 1.57 | 3.89 |
Ratios/Supplemental Data (%): | | | | | | |
Ratio of total expenses
to average net assets | | .80 | .82 | .81 | .83 | .88 |
Ratio of net expenses
to average net assets | | .80 | .82 | .81 | .83 | .88 |
Ratio of net investment income
to average net assets | | 1.92 | 1.67 | 1.53 | 1.45 | 1.77 |
Portfolio Turnover Rate | | 85.64 | 79.00 | 57.17 | 68.92 | 47.01 |
Net Assets, end of period ($ x 1,000) | | 803,690 | 789,983 | 707,727 | 407,642 | 243,251 |
a Based on average shares outstanding.
b In addition to net realized and unrealized losses on investments, this amount includes an increase in net asset value per share resulting from the timing of issuances and redemptions of shares in relation to fluctuating market values for the portfolio investments.
See notes to financial statements.
30
NOTES TO FINANCIAL STATEMENTS
NOTE 1—Significant Accounting Policies:
Dreyfus Global Real Return Fund (the “fund”) is a separate diversified series of Advantage Funds, Inc. (the “Company”), which is registered under the Investment Company Act of 1940, as amended (the “Act”), as an open-end management investment company and operates as a series company currently offering ten series, including the fund. The fund’s investment objective is to seek total return (consisting of capital appreciation and income). The Dreyfus Corporation (the “Manager” or “Dreyfus”), a wholly-owned subsidiary of The Bank of New York Mellon Corporation (“BNY Mellon”), serves as the fund’s investment adviser. Newton Investment Management (North America) Limited (“Newton”), a wholly-owned subsidiary of BNY Mellon and an affiliate of Dreyfus, serves as the fund’s sub-investment adviser.
MBSC Securities Corporation (the “Distributor”), a wholly-owned subsidiary of Dreyfus, is the distributor of the fund’s shares. The fund is authorized to issue 100 million shares of $.001 par value Common Stock in each of the following classes of shares: Class A, Class C, Class I, Class T and Class Y. As of the date of this report, the fund did not offer Class T shares for purchase. Class A and Class T shares generally are subject to a sales charge imposed at the time of purchase. Class C shares are subject to a contingent deferred sales charge (“CDSC”) imposed on Class C shares redeemed within one year of purchase. Class C shares automatically convert to Class A shares ten years after the date of purchase, without the imposition of a sales charge. Class I and Class Y shares are sold at net asset value per share generally to institutional investors. Other differences between the classes include the services offered to and the expenses borne by each class, the allocation of certain transfer agency costs and certain voting rights. Income, expenses (other than expenses attributable to a specific class), and realized and unrealized gains or losses on investments are allocated to each class of shares based on its relative net assets.
The Company accounts separately for the assets, liabilities and operations of each series. Expenses directly attributable to each series are charged to that series’ operations; expenses which are applicable to all series are allocated among them on a pro rata basis.
The Financial Accounting Standards Board (“FASB”) Accounting Standards Codification (“ASC”) is the exclusive reference of authoritative U.S. generally accepted accounting principles (“GAAP”) recognized by the FASB to be applied by nongovernmental entities. Rules and interpretive releases of the Securities and Exchange Commission (“SEC”) under
31
NOTES TO FINANCIAL STATEMENTS (continued)
authority of federal laws are also sources of authoritative GAAP for SEC registrants. The fund’s financial statements are prepared in accordance with GAAP, which may require the use of management estimates and assumptions. Actual results could differ from those estimates.
The Company enters into contracts that contain a variety of indemnifications. The fund’s maximum exposure under these arrangements is unknown. The fund does not anticipate recognizing any loss related to these arrangements.
(a) Portfolio valuation: The fair value of a financial instrument is the amount that would be received to sell an asset or paid to transfer a liability in an orderly transaction between market participants at the measurement date (i.e., the exit price). GAAP establishes a fair value hierarchy that prioritizes the inputs of valuation techniques used to measure fair value. This hierarchy gives the highest priority to unadjusted quoted prices in active markets for identical assets or liabilities (Level 1 measurements) and the lowest priority to unobservable inputs (Level 3 measurements).
Additionally, GAAP provides guidance on determining whether the volume and activity in a market has decreased significantly and whether such a decrease in activity results in transactions that are not orderly. GAAP requires enhanced disclosures around valuation inputs and techniques used during annual and interim periods.
Various inputs are used in determining the value of the fund’s investments relating to fair value measurements. These inputs are summarized in the three broad levels listed below:
Level 1—unadjusted quoted prices in active markets for identical investments.
Level 2—other significant observable inputs (including quoted prices for similar investments, interest rates, prepayment speeds, credit risk, etc.).
Level 3—significant unobservable inputs (including the fund’s own assumptions in determining the fair value of investments).
The inputs or methodology used for valuing securities are not necessarily an indication of the risk associated with investing in those securities.
Changes in valuation techniques may result in transfers in or out of an assigned level within the disclosure hierarchy. Valuation techniques used to value the fund’s investments are as follows:
Investments in debt securities, excluding short-term investments (other than U.S. Treasury Bills), futures, options and forward foreign currency
32
exchange contracts (“forward contracts”), are valued each business day by an independent pricing service (the “Service”) approved by the Company’s Board of Directors (the “Board”). Investments for which quoted bid prices are readily available and are representative of the bid side of the market in the judgment of the Service are valued at the mean between the quoted bid prices (as obtained by the Service from dealers in such securities) and asked prices (as calculated by the Service based upon its evaluation of the market for such securities). Other investments are valued as determined by the Service, based on methods which include consideration of the following: yields or prices of securities of comparable quality, coupon, maturity and type; indications as to values from dealers; and general market conditions. These securities are generally categorized within Level 2 of the fair value hierarchy.
Investments in equity securities are valued at the last sales price on the securities exchange or national securities market on which such securities are primarily traded. Securities listed on the National Market System for which market quotations are available are valued at the official closing price or, if there is no official closing price that day, at the last sales price. For open short positions, asked prices are used for valuation purposes. Bid price is used when no asked price is available. Registered investment companies that are not traded on an exchange are valued at their net asset value. All of the preceding securities are generally categorized within Level 1 of the fair value hierarchy.
Securities not listed on an exchange or the national securities market, or securities for which there were no transactions, are valued at the average of the most recent bid and asked prices. U.S. Treasury Bills are valued at the mean price between quoted bid prices and asked prices by the Service approved by the Board. These securities are generally categorized within Level 2 of the fair value hierarchy.
The Service is engaged under the general supervision of the Board.
Fair valuing of securities may be determined with the assistance of a pricing service using calculations based on indices of domestic securities and other appropriate indicators, such as prices of relevant ADRs and futures. Utilizing these techniques may result in transfers between Level 1 and Level 2 of the fair value hierarchy.
When market quotations or official closing prices are not readily available, or are determined not to accurately reflect fair value, such as when the value of a security has been significantly affected by events after the close of the exchange or market on which the security is principally traded (for example, a foreign exchange or market), but before the fund calculates its
33
NOTES TO FINANCIAL STATEMENTS (continued)
net asset value, the fund may value these investments at fair value as determined in accordance with the procedures approved by the Board. Certain factors may be considered when fair valuing investments such as: fundamental analytical data, the nature and duration of restrictions on disposition, an evaluation of the forces that influence the market in which the securities are purchased and sold, and public trading in similar securities of the issuer or comparable issuers. These securities are either categorized within Level 2 or 3 of the fair value hierarchy depending on the relevant inputs used.
For restricted securities where observable inputs are limited, assumptions about market activity and risk are used and such securities are generally categorized within Level 3 of the fair value hierarchy.
Investments denominated in foreign currencies are translated to U.S. dollars at the prevailing rates of exchange.
Futures and options, which are traded on an exchange, are valued at the last sales price on the securities exchange on which such securities are primarily traded or at the last sales price on the national securities market on each business day and are generally categorized within Level 1 of the fair value hierarchy. Options traded over-the-counter (“OTC”) are valued at the mean between the bid and asked price and are generally categorized within Level 2 of the fair value hierarchy. Forward contracts are valued at the forward rate and are generally categorized within Level 2 of the fair value hierarchy.
The following is a summary of the inputs used as of October 31, 2018 in valuing the fund’s investments:
| | | | | | |
| | Level 1 - Unadjusted Quoted Prices | Level 2 - Other Significant Observable Inputs | Level 3 -Significant Unobservable Inputs | Total |
Assets ($) | | | |
Investments in Securities: | | | |
Corporate Bonds | - | 80,789,908 | - | 80,789,908 |
Equity Securities –Preferred Stocks | - | 18,881,822† | - | 18,881,822 |
Equity Securities –Foreign
Common Stocks | 216,333,119 | 450,145,600† | - | 666,478,719 |
Exchange –Traded Fund | 19,464,709 | - | - | 19,464,709 |
Foreign Government | - | 196,696,553 | - | 196,696,553 |
Investment Company | 59,322,564 | - | - | 59,322,564 |
U.S. Treasury | - | 481,370,181 | - | 481,370,181 |
34
| | | | | |
| | Level 1 - Unadjusted Quoted Prices | Level 2 - Other Significant Observable Inputs | Level 3 -Significant Unobservable Inputs | Total |
Assets ($) (continued) Other Financial Instruments: | | | |
Futures†† | 4,908,042 | - | - | 4,908,042 |
Forward Foreign Currency
Exchange Contracts†† | - | 12,047,348 | - | 12,047,348 |
Options Purchased | 185,989 | - | - | 185,989 |
Liabilities ($) | | | | |
Other Financial Instruments: | | | |
Forward Foreign Currency
Exchange Contracts†† | - | (664,316) | - | (664,316) |
Options Written | (24,103) | - | - | (24,103) |
† Securities classified within Level 2 at period end as the values were determined pursuant to the fund’s fair valuation procedures.
†† Amount shown represents unrealized appreciation (depreciation) at period end, but only variation margin on exchanged traded and centrally cleared derivatives are reported in the Statement of Assets and Liabilities.
At October 31, 2018, the amount of securities transferred between levels equals fair value of exchange traded equity securities reported as Level 2 in the table above. At October 31, 2017, there were no transfers between levels of the fair value hierarchy. It is the fund’s policy to recognize transfers between levels at the end of the reporting period.
(b) Foreign currency transactions: The fund does not isolate that portion of the results of operations resulting from changes in foreign exchange rates on investments from the fluctuations arising from changes in the market prices of securities held. Such fluctuations are included with the net realized and unrealized gain or loss on investments.
Net realized foreign exchange gains or losses arise from sales of foreign currencies, currency gains or losses realized on securities transactions between trade and settlement date, and the difference between the amounts of dividends, interest and foreign withholding taxes recorded on the fund’s books and the U.S. dollar equivalent of the amounts actually received or paid. Net unrealized foreign exchange gains and losses arise from changes in the value of assets and liabilities other than investments resulting from changes in exchange rates. Foreign currency gains and losses on foreign currency transactions are also included with net realized and unrealized gain or loss on investments.
(c) Securities transactions and investment income: Securities transactions are recorded on a trade date basis. Realized gains and losses from securities transactions are recorded on the identified cost basis.
35
NOTES TO FINANCIAL STATEMENTS (continued)
Dividend income is recognized on the ex-dividend date and interest income, including, where applicable, accretion of discount and amortization of premium on investments, is recognized on the accrual basis.
(d) Affiliated issuers: Investments in other investment companies advised by Dreyfus are considered “affiliated” under the Act.
(e) Risk: Investing in foreign markets may involve special risks and considerations not typically associated with investing in the U.S. These risks include revaluation of currencies, high rates of inflation, repatriation restrictions on income and capital, and adverse political and economic developments. Moreover, securities issued in these markets may be less liquid, subject to government ownership controls and delayed settlements, and their prices may be more volatile than those of comparable securities in the U.S.
(f) Dividends and distributions to shareholders: Dividends and distributions are recorded on the ex-dividend date. Dividends from investment income-net and dividends from net realized capital gains, if any, are normally declared and paid annually, but the fund may make distributions on a more frequent basis to comply with the distribution requirements of the Internal Revenue Code of 1986, as amended (the “Code”). To the extent that net realized capital gains can be offset by capital loss carryovers, it is the policy of the fund not to distribute such gains. Income and capital gain distributions are determined in accordance with income tax regulations, which may differ from GAAP.
(g) Federal income taxes: It is the policy of the fund to continue to qualify as a regulated investment company, if such qualification is in the best interests of its shareholders, by complying with the applicable provisions of the Code, and to make distributions of taxable income and net realized capital gain sufficient to relieve it from substantially all federal income and excise taxes.
As of and during the period ended October 31, 2018, the fund did not have any liabilities for any uncertain tax positions. The fund recognizes interest and penalties, if any, related to uncertain tax positions as income tax expense in the Statement of Operations. During the period ended October 31, 2018, the fund did not incur any interest or penalties.
Each tax year in the four-year period ended October 31, 2018 remains subject to examination by the Internal Revenue Service and state taxing authorities.
36
At October 31, 2018, the components of accumulated earnings on a tax basis were as follows: undistributed ordinary income $52,359,999, accumulated capital losses $134,508,454 and unrealized appreciation $41,561,574.
The fund is permitted to carry forward capital losses for an unlimited period. Furthermore, capital loss carryovers retain their character as either short-term or long-term capital losses.
The accumulated capital loss carryover is available for federal income tax purposes to be applied against future net realized capital gains, if any, realized subsequent to October 31, 2018. If not applied, the fund has $59,076,685 of short-term capital losses and $75,431,769 of long-term capital losses which can be carried forward for an unlimited period.
The tax character of distributions paid to shareholders during the fiscal periods ended October 31, 2018 and October 31, 2017 were as follows: ordinary income $13,603,429 and $41,402,008, respectively.
(h) New Accounting Pronouncements: In March 2017, the FASB issued Accounting Standards Update 2017-08, Receivables—Nonrefundable Fees and Other Costs (Subtopic 310-20): Premium Amortization On Purchased Callable Debt Securities (“ASU 2017-08”). The update shortens the amortization period for the premium on certain purchased callable debt securities to the earliest call date. ASU 2017-08 will be effective for annual periods beginning after December 15, 2018.
Also in August 2018, the FASB issued Accounting Standards Update 2018-13, Fair Value Measurement (Topic 820): Disclosure Framework—Changes to the Disclosure Requirements for Fair Value Measurement (“ASU 2018-13”). The update provides guidance that eliminates, adds and modifies certain disclosure requirements for fair value measurements. ASU 2018-13 will be effective for annual periods beginning after December 15, 2019. Management is currently assessing the potential impact of these changes to future financial statements.
NOTE 2—Bank Lines of Credit:
The fund participates with other Dreyfus-managed funds in an $830 million unsecured credit facility led by Citibank, N.A. and a $300 million unsecured credit facility provided by The Bank of New York Mellon, a subsidiary of BNY Mellon and an affiliate of Dreyfus (each, a “Facility”), each to be utilized primarily for temporary or emergency purposes, including the financing of redemptions. In connection therewith, the fund has agreed to pay its pro rata portion of commitment fees for each Facility. Interest is charged to the fund based on rates determined pursuant to the
37
NOTES TO FINANCIAL STATEMENTS (continued)
terms of the respective Facility at the time of borrowing. During the period ended October 31, 2018, the fund did not borrow under the Facilities.
NOTE 3—Management Fee, Sub-Investment Advisory Fee and Other Transactions with Affiliates:
(a) Pursuant to a management agreement with Dreyfus, the management fee is computed at the annual rate of .75% of the value of the fund’s average daily net assets and is payable monthly. Dreyfus has contractually agreed, from November 1, 2017 through March 1, 2019, to waive receipt of its fees and/or assume the direct expenses of the fund, so that the direct expenses of none of classes (excluding Rule 12b-1 Distribution Plan fees, Shareholder Services Plan fees, taxes, interest expense, brokerage commissions, commitment fees on borrowings and extraordinary expenses) exceed .90% of the value of the fund’s average daily net assets. On or after March 1, 2019, Dreyfus Corporation may terminate this expense limitation at any time. The reduction in expenses, pursuant to the undertaking, amounted to $42,349 during the period ended October 31, 2018.
Pursuant to a sub-investment advisory agreement between Dreyfus and Newton, Dreyfus pays Newton an annual fee of .36% of the value of the fund’s average daily net assets.
During the period ended October 31, 2018, the Distributor retained $6,340 from commissions earned on sales of the fund’s Class A shares and $8,073 from CDSC fees on redemptions of the fund’s Class C shares.
(b) Under the Distribution Plan adopted pursuant to Rule 12b-1 under the Act, Class C shares pay the Distributor for distributing its shares at an annual rate of .75% of the value of its average daily net assets. During the period ended October 31, 2018, Class C shares were charged $227,648 pursuant to the Distribution Plan.
(c) Under the Shareholder Services Plan, Class A and Class C shares pay the Distributor at an annual rate of .25% of the value of their average daily net assets for the provision of certain services. The services provided may include personal services relating to shareholder accounts, such as answering shareholder inquiries regarding the fund and providing reports and other information, and services related to the maintenance of shareholder accounts. The Distributor may make payments to Service Agents (securities dealers, financial institutions or other industry professionals) with respect to these services. The Distributor determines the amounts to be paid to Service Agents. During the period ended October 31, 2018, Class A and Class C shares were charged $73,582 and $75,882, respectively, pursuant to the Shareholder Services Plan.
38
The fund has arrangements with the transfer agent and the custodian whereby the fund may receive earnings credits when positive cash balances are maintained, which are used to offset transfer agency and custody fees. For financial reporting purposes, the fund includes net earnings credits, if any, as an expense offset in the Statement of Operations.
The fund compensates Dreyfus Transfer, Inc., a wholly-owned subsidiary of Dreyfus, under a transfer agency agreement for providing transfer agency and cash management services for the fund. The majority of transfer agency fees are comprised of amounts paid on a per account basis, while cash management fees are related to fund subscriptions and redemptions. During the period ended October 31, 2018, the fund was charged $12,616 for transfer agency services. These fees are included in Shareholder servicing costs in the Statement of Operations.
The fund compensates The Bank of New York Mellon under a custody agreement for providing custodial services for the fund. These fees are determined based on net assets, geographic region and transaction activity. During the period ended October 31, 2018, the fund was charged $197,328 pursuant to the custody agreement. These fees were partially offset by earnings credits of $10,822.
During the period ended October 31, 2018, the fund was charged $12,797 for services performed by the Chief Compliance Officer and his staff. These fees are included in Miscellaneous in the Statement of Operations.
The components of “Due to The Dreyfus Corporation and affiliates” in the Statement of Assets and Liabilities consist of: management fees $992,317, Distribution Plan fees $17,852, Shareholder Services Plan fees $11,440, custodian fees $104,741, Chief Compliance Officer fees $4,193 and transfer agency fees $1,842.
(d) Each Board member also serves as a Board member of other funds within the Dreyfus complex. Annual retainer fees and attendance fees are allocated to each fund based on net assets.
NOTE 4—Securities Transactions:
The aggregate amount of purchases and sales of investment securities, excluding short-term securities, futures, options transactions and forward contracts, during the period ended October 31, 2018, amounted to $1,127,471,484 and $1,211,154,656, respectively.
Derivatives: A derivative is a financial instrument whose performance is derived from the performance of another asset. The fund enters into International Swaps and Derivatives Association, Inc. Master Agreements or similar agreements (collectively, “Master Agreements”) with its OTC
39
NOTES TO FINANCIAL STATEMENTS (continued)
derivative contract counterparties in order to, among other things, reduce its credit risk to counterparties. Master Agreements include provisions for general obligations, representations, collateral and events of default or termination. Under a Master Agreement, the fund may offset with the counterparty certain derivative financial instrument’s payables and/or receivables with collateral held and/or posted and create one single net payment in the event of default or termination.
Each type of derivative instrument that was held by the fund during the period ended October 31, 2018 is discussed below.
Futures: In the normal course of pursuing its investment objective, the fund is exposed to market risk, including equity risk and interest risk, as a result of changes in value of underlying financial instruments. The fund invests in futures in order to manage its exposure to or protect against changes in the market. A futures contract represents a commitment for the future purchase or a sale of an asset at a specified date. Upon entering into such contracts, these investments require initial margin deposits with a counterparty, which consist of cash or cash equivalents. The amount of these deposits is determined by the exchange or Board of Trade on which the contract is traded and is subject to change. Accordingly, variation margin payments are received or made to reflect daily unrealized gains or losses which are recorded in the Statement of Operations. When the contracts are closed, the fund recognizes a realized gain or loss which is reflected in the Statement of Operations. There is minimal counterparty credit risk to the fund with futures since they are exchange traded, and the exchange guarantees the futures against default. Futures open at October 31, 2018 are set forth in the Statement of Futures.
Options Transactions: The fund purchases and writes (sells) put and call options to hedge against changes in the values of equities and interest or as a substitute for an investment. The fund is subject to market risk and interest risk in the course of pursuing its investment objectives through its investments in options contracts. A call option gives the purchaser of the option the right (but not the obligation) to buy, and obligates the writer to sell, the underlying financial instrument at the exercise price at any time during the option period, or at a specified date. Conversely, a put option gives the purchaser of the option the right (but not the obligation) to sell, and obligates the writer to buy the underlying financial instrument at the exercise price at any time during the option period, or at a specified date.
As a writer of call options, the fund receives a premium at the outset and then bears the market risk of unfavorable changes in the price of the financial instrument underlying the option. Generally, the fund realizes a gain, to the extent of the premium, if the price of the underlying financial
40
instrument decreases between the date the option is written and the date on which the option is terminated. Generally, the fund incurs a loss if the price of the financial instrument increases between those dates. The maximum payout for those contracts is limited to the number of call option contracts written and the related strike prices, respectively.
As a writer of put options, the fund receives a premium at the outset and then bears the market risk of unfavorable changes in the price of the financial instrument underlying the option. Generally, the fund realizes a gain, to the extent of the premium, if the price of the underlying financial instrument increases between the date the option is written and the date on which the option is terminated. Generally, the fund incurs a loss if the price of the financial instrument decreases between those dates. The maximum payout for those contracts is limited to the number of put option contracts written and the related strike prices, respectively.
As a writer of an option, the fund has no control over whether the underlying financial instrument may be sold (call) or purchased (put) and as a result bears the market risk of an unfavorable change in the price of the financial instrument underlying the written option. There is a risk of loss from a change in value of such options which may exceed the related premiums received. This risk may be mitigated by Master Agreements, if any, between the fund and the counterparty and the posting of collateral, if any, by the counterparty to the fund to cover the fund’s exposure to the counterparty. The Statement of Operations reflects any unrealized gains or losses which occurred during the period as well as any realized gains or losses which occurred upon the expiration or closing of the option transaction. Options written open at October 31, 2018 are set forth in Statement of Options Written.
Forward Foreign Currency Exchange Contracts: The fund enters into forward contracts in order to hedge its exposure to changes in foreign currency exchange rates on its foreign portfolio holdings, to settle foreign currency transactions or as a part of its investment strategy. When executing forward contracts, the fund is obligated to buy or sell a foreign currency at a specified rate on a certain date in the future. With respect to sales of forward contracts, the fund incurs a loss if the value of the contract increases between the date the forward contract is opened and the date the forward contract is closed. The fund realizes a gain if the value of the contract decreases between those dates. With respect to purchases of forward contracts, the fund incurs a loss if the value of the contract decreases between the date the forward contract is opened and the date the forward contract is closed. The fund realizes a gain if the value of the contract increases between those dates. Any realized or unrealized gains or
41
NOTES TO FINANCIAL STATEMENTS (continued)
losses which occurred during the period are reflected in the Statement of Operations. The fund is exposed to foreign currency risk as a result of changes in value of underlying financial instruments. The fund is also exposed to credit risk associated with counterparty nonperformance on these forward contracts, which is generally limited to the unrealized gain on each open contract. This risk may be mitigated by Master Agreements, if any, between the fund and the counterparty and the posting of collateral, if any, by the counterparty to the fund to cover the fund’s exposure to the counterparty. Forward contracts open at October 31, 2018 are set forth in the Statement of Forward Foreign Currency Exchange Contracts.
The following tables show the fund’s exposure to different types of market risk as it relates to the Statement of Assets and Liabilities and the Statement of Operations, respectively.
Fair value of derivative instruments as of October 31, 2018 is shown below:
| | | | | | | | |
| | Derivative
Assets ($) | | | | Derivative
Liabilities ($) | |
Equity risk | 5,094,031 | 1,2 | Equity risk | (24,103) | 3 |
Foreign exchange risk | 12,047,348 | 4 | Foreign exchange risk | (664,316) | 4 |
Gross fair value of
derivative contracts | 17,141,379 | | | | (688,419) | |
| | | | | | | |
| | Statement of Assets and Liabilities location: | |
1 | Includes cumulative appreciation (depreciation) on futures as reported in the Statement of Futures, but only the
unpaid variation margin is reported in the Statement of Assets and Liabilities. |
2 | Options purchased are included in Investments in securities—Unaffiliated issuers, at value. |
3 | Outstanding options written, at value. | |
4 | Unrealized appreciation (depreciation) on forward foreign currency exchange contracts. |
The effect of derivative instruments in the Statement of Operations during the period ended October 31, 2018 is shown below:
| | | | | | | | | | |
Amount of realized gain (loss) on derivatives recognized in income ($) | |
Underlying
risk | Futures | 1 | Options
Transactions | 2 | Forward
Contracts | 3 | Total | | |
Interest
rate | 490,149 | | (453,459) | | - | | 36,690 | | |
Equity | (30,958,523) | | 5,437,132 | | - | | (25,521,391) | | |
Foreign
exchange | - | | - | | 27,318,509 | | 27,318,509 | | |
Total | (30,468,374) | | 4,983,673 | | 27,318,509 | | 1,833,808 | | |
| | | | | | | | | | |
42
| | | | | | | | | | | |
Change in unrealized appreciation (depreciation)
on derivatives recognized in income ($) | |
Underlying
risk | Futures | 4 | Options
Transactions | 5 | Forward
Contracts | 6 | Total | | |
Interest
rate | 135,825 | | - | | - | | 135,825 | | |
Equity | 17,518,820 | | (1,047,396) | | - | | 16,471,424 | | |
Foreign
exchange | - | | - | | (1,634,962) | | (1,634,962) | | |
Total | 17,654,645 | | (1,047,396) | | (1,634,962) | | 14,972,287 | | |
| | | | | | | | | | | |
Statement of Operations location: | |
1 Net realized gain (loss) on futures. | |
2 Net realized gain (loss) on options transactions. |
3 Net realized gain (loss) on forward foreign currency exchange contracts. | |
4 Net unrealized appreciation (depreciation) on futures. | |
5 Net unrealized appreciation (depreciation) on options transactions. | |
6 Net unrealized appreciation (depreciation) on forward foreign currency exchange contracts. |
The provisions of ASC Topic 210 “Disclosures about Offsetting Assets and Liabilities” require disclosure on the offsetting of financial assets and liabilities. These disclosures are required for certain investments, including derivative financial instruments subject to Master Agreements which are eligible for offsetting in the Statement of Assets and Liabilities and require the fund to disclose both gross and net information with respect to such investments. For financial reporting purposes, the fund does not offset derivative assets and derivative liabilities that are subject to Master Agreements in the Statement of Assets and Liabilities.
At October 31, 2018, derivative assets and liabilities (by type) on a gross basis are as follows:
| | | | | | |
Derivative Financial Instruments: | | Assets ($) | | Liabilities ($) | |
Futures | | 4,908,042 | | - | |
Options | | 185,989 | | (24,103) | |
Forward contracts | | 12,047,348 | | (664,316) | |
Total gross amount of derivative | | | | | |
assets and liabilities in the | | | | | |
Statement of Assets and Liabilities | | 17,141,379 | | (688,419) | |
Derivatives not subject to | | | | | |
Master Agreements | | (5,094,031) | | 24,103 | |
Total gross amount of assets | | | | | |
and liabilities subject to | | | | | |
Master Agreements | | 12,047,348 | | (664,316) | |
43
NOTES TO FINANCIAL STATEMENTS (continued)
The following tables present derivative assets and liabilities net of amounts available for offsetting under Master Agreements and net of related collateral received or pledged, if any, as of October 31, 2018:
| | | | | | | |
| | | | Financial | | | |
| | | | Instruments | | | |
| | | | and Derivatives | | | |
| | Gross Amount of | | Available | Collateral | | Net Amount of |
Counterparty | Assets ($) | 1 | for Offset ($) | Received ($) | 2 | Assets ($) |
Citigroup | 649,949 | | (68,370) | (310,000) | | 271,579 |
J.P. Morgan Securities | 1,197,897 | | (193,003) | - | | 1,004,894 |
RBS Securities | 3,735,594 | | (1,716) | (2,900,000) | | 833,878 |
State Street Bank
and Trust Company | 6,412,141 | | (241,584) | (280,000) | | 5,890,557 |
UBS Securities | 51,767 | | (51,767) | - | | - |
Total | 12,047,348 | | (556,440) | (3,490,000) | | 8,000,908 |
| | | | | | | |
| | | | Financial | | | |
| | | | Instruments | | | |
| | | | and Derivatives | | | |
| | Gross Amount of | | Available | Collateral | | Net Amount of |
Counterparty | Liabilities ($) | 1 | for Offset ($) | Pledged ($) | 2 | Liabilities ($) |
CIBC World Markets Corp. | (14,955) | | - | - | | (14,955) |
Citigroup | (68,370) | | 68,370 | - | | - |
J.P. Morgan Securities | (193,003) | | 193,003 | - | | - |
RBS Securities | (1,716) | | 1,716 | - | | - |
State Street Bank
and Trust Company | (241,584) | | 241,584 | - | | - |
UBS Securities | (144,688) | | 51,767 | 50,000 | | (42,921) |
Total | (664,316) | | 556,440 | 50,000 | | (57,876) |
| | | | | | | |
1 Absent a default event or early termination, OTC derivative assets and liabilities are presented at gross amounts and are not offset in the Statement of Assets and Liabilities. |
2 In some instances, the actual collateral received and/or pledged may be more than the amount shown due to over collateralization. |
The following summarizes the average market value of derivatives outstanding during the period ended October 31, 2018:
| | | |
| | Average Market Value ($) |
Equity futures | | 202,926,821 |
Equity options contracts | | 1,115,265 |
Interest rate futures | | 44,029,405 |
Interest rate options contracts | | 2,019 |
Forward contracts | | 853,735,472 |
| | | |
44
At October 31, 2018, the cost of investments for federal income tax purposes was $1,481,573,385; accordingly, accumulated net unrealized appreciation on investments inclusive of derivative contracts was $41,829,302, consisting of $110,215,544 gross unrealized appreciation and $68,386,242 gross unrealized depreciation.
45
REPORT OF INDEPENDENT REGISTERED PUBLIC ACCOUNTING FIRM
To the Shareholders and the Board of Directors of Dreyfus Global Real Return Fund
Opinion on the Financial Statements
We have audited the accompanying statement of assets and liabilities of Dreyfus Global Real Return Fund (the “Fund”) (one of the funds constituting Advantage Funds, Inc.), including the statements of investments, investments in affiliated issuers, futures, options written and forward foreign currency exchange contracts, as of October 31, 2018, and the related statement of operations for the year then ended, the statements of changes in net assets for each of the two years in the period then ended, the financial highlights for each of the five years in the period then ended and the related notes (collectively referred to as the “financial statements”). In our opinion, the financial statements present fairly, in all material respects, the financial position of the Fund (one of the funds constituting Advantage Funds, Inc.) at October 31, 2018, the results of its operations for the year then ended, the changes in its net assets for each of the two years in the period then ended and its financial highlights for each of the five years in the period then ended, in conformity with U.S. generally accepted accounting principles.
Basis for Opinion
These financial statements are the responsibility of the Fund’s management. Our responsibility is to express an opinion on the Fund’s financial statements based on our audits. We are a public accounting firm registered with the Public Company Accounting Oversight Board (United States) (“PCAOB”) and are required to be independent with respect to the Fund in accordance with the U.S. federal securities laws and the applicable rules and regulations of the Securities and Exchange Commission and the PCAOB.
We conducted our audits in accordance with the standards of the PCAOB. Those standards require that we plan and perform the audit to obtain reasonable assurance about whether the financial statements are free of material misstatement, whether due to error or fraud. The Fund is not required to have, nor were we engaged to perform, an audit of the Fund’s internal control over financial reporting. As part of our audits, we are required to obtain an understanding of internal control over financial reporting, but not for the purpose of expressing an opinion on the effectiveness of the Fund’s internal control over financial reporting. Accordingly, we express no such opinion.
Our audits included performing procedures to assess the risks of material misstatement of the financial statements, whether due to error or fraud, and performing procedures that respond to those risks. Such procedures included examining, on a test basis, evidence regarding the amounts and disclosures in the financial statements. Our procedures included confirmation of securities owned as of October 31, 2018, by correspondence with the custodian and others or by other appropriate auditing procedures where replies from others were not received. Our audits also included evaluating the accounting principles used and significant estimates made by management, as well as evaluating the overall presentation of the financial statements. We believe that our audits provide a reasonable basis for our opinion.

We have served as the auditor of one or more Dreyfus investment companies since at least 1957, but we are unable to determine the specific year.
New York, New York
December 28, 2018
46
IMPORTANT TAX INFORMATION (Unaudited)
In accordance with federal tax law, the fund elects to provide each shareholder with their portion of the fund’s foreign taxes paid and the income sourced from foreign countries. Accordingly, the fund hereby reports the following information regarding its fiscal year ended October 31, 2018:
- the total amount of taxes paid to foreign countries was $1,613,481
- the total amount of income sourced from foreign countries was $26,999,404
Where required by Federal tax law rules, shareholders will receive notification of their proportionate share of foreign taxes paid and foreign sourced income for the 2018 calendar year with Form 1099-DIV which will be mailed in early 2019. For the fiscal year ended October 31, 2018, certain dividends paid by the fund may be subject to a maximum tax rate of 15%, as provided for by the Jobs and Growth Tax Relief Reconciliation Act of 2003. Of the distributions paid during the fiscal year, $13,603,429 represents the maximum amount that may be considered qualified dividend income.
47
BOARD MEMBERS INFORMATION (Unaudited)
INDEPENDENT BOARD MEMBERS
Joseph S. DiMartino (75)
Chairman of the Board (1995)
Principal Occupation During Past 5 Years:
· Corporate Director and Trustee (1995-present)
Other Public Company Board Memberships During Past 5 Years:
· CBIZ (formerly, Century Business Services, Inc.), a provider of outsourcing functions for small and medium size companies, Director (1997-present)
No. of Portfolios for which Board Member Serves: 124
———————
Peggy C. Davis (75)
Board Member (2006)
Principal Occupation During Past 5 Years:
· Shad Professor of Law, New York University School of Law (1983-present)
No. of Portfolios for which Board Member Serves: 45
———————
David P. Feldman (78)
Board Member (1996)
Principal Occupation During Past 5 Years:
· Corporate Director and Trustee (1985-present)
Other Public Company Board Memberships During Past 5 Years:
· BBH Mutual Funds Group (5 registered mutual funds), Director (1992-2014)
No. of Portfolios for which Board Member Serves: 31
———————
Joan Gulley (71)
Board Member (2017)
Principal Occupation During Past 5 Years:
· PNC Financial Services Group, Inc.(1993-2014), Executive Vice President and Chief Human Resources Officer and Executive Committee Member (2008-2014)
No. of Portfolios for which Board Member Serves: 52
———————
48
Ehud Houminer (78)
Board Member (1993)
Principal Occupation During Past 5 Years:
· Board of Overseers at the Columbia Business School, Columbia University (1992-present)
· Trustee, Ben Gurion University
No. of Portfolios for which Board Member Serves: 52
———————
Lynn Martin (78)
Board Member (2012)
Principal Occupation During Past 5 Years:
· President of The Martin Hall Group LLC, a human resources consulting firm (2005-2012)
No. of Portfolios for which Board Member Serves: 31
———————
Robin A. Melvin (55)
Board Member (2012)
Principal Occupation During Past 5 Years:
· Co-chairman, Illinois Mentoring Partnership, non-profit organization dedicated to increasing the quantity and quality of mentoring services in Illinois; (2014-present; board member since 2013)
No. of Portfolios for which Board Member Serves: 99
———————
Dr. Martin Peretz (79)
Board Member (2006)
Principal Occupation During Past 5 Years:
· Editor-in-Chief Emeritus of The New Republic Magazine (2011-2012) (previously,
Editor-in-Chief, 1974-2011)
· Lecturer at Harvard University (1968-2010)
No. of Portfolios for which Board Member Serves: 31
———————
Once elected all Board Members serve for an indefinite term, but achieve Emeritus status upon reaching age 80. The address of the Board Members and Officers is c/o The Dreyfus Corporation, 200 Park Avenue, New York, New York 10166. Additional information about the Board Members is available in the fund’s Statement of Additional Information which can be obtained from Dreyfus free of charge by calling this toll free number: 1-800-DREYFUS.
James F. Henry, Emeritus Board Member
Philip L. Toia, Emeritus Board Member
49
OFFICERS OF THE FUND (Unaudited)
BRADLEY J. SKAPYAK, President since January 2010.
Chief Operating Officer and a director of the Manager since June 2009, Chairman of Dreyfus Transfer, Inc., an affiliate of the Manager and the transfer agent of the funds, since May 2011 and Chief Executive Officer of MBSC Securities Corporation since August 2016. He is an officer of 62 investment companies (comprised of 124 portfolios) managed by the Manager. He is 59 years old and has been an employee of the Manager since February 1988.
BENNETT A. MACDOUGALL, Chief Legal Officer since October 2015.
Chief Legal Officer of the Manager and Associate General Counsel and Managing Director of BNY Mellon since June 2015; from June 2005 to June 2015, he served in various capacities with Deutsche Bank – Asset & Wealth Management Division, including as Director and Associate General Counsel, and Chief Legal Officer of Deutsche Investment Management Americas Inc. from June 2012 to May 2015. He is an officer of 63 investment companies (comprised of 149 portfolios) managed by the Manager. He is 47 years old and has been an employee of the Manager since June 2015.
JAMES BITETTO, Vice President since August 2005 and Secretary since February 2018.
Managing Counsel of BNY Mellon and Secretary of the Manager, and an officer of 63 investment companies (comprised of 149 portfolios) managed by the Manager. He is 52 years old and has been an employee of the Manager since December 1996.
JOSEPH M. CHIOFFI, Vice President and Assistant Secretary since August 2005.
Managing Counsel of BNY Mellon, and an officer of 63 investment companies (comprised of 149 portfolios) managed by the Manager. He is 56 years old and has been an employee of the Manager since June 2000.
SONALEE CROSS, Vice President and Assistant Secretary since March 2018.
Counsel of BNY Mellon since October 2016; Associate at Proskauer Rose LLP from April 2016 to September 2016; Attorney at EnTrust Capital from August 2015 to February 2016; Associate at Sidley Austin LLP from September 2013 until August 2015. She is an officer of 63 investment companies (comprised of 149 portfolios) managed by Dreyfus. She is 31 years old and has been an employee of the Manager since October 2016.
MAUREEN E. KANE, Vice President and Assistant Secretary since April 2015.
Managing Counsel of BNY Mellon since July 2014; from October 2004 until July 2014, General Counsel, and from May 2009 until July 2014, Chief Compliance Officer of Century Capital Management. She is an officer of 63 investment companies (comprised of 149 portfolios) managed by the Manager. She is 56 years old and has been an employee of the Manager since July 2014.
SARAH S. KELLEHER, Vice President and Assistant Secretary since April 2014.
Managing Counsel of BNY Mellon since December 2017, from March 2013 to December 2017, Senior Counsel of BNY Mellon. She is an officer of 63 investment companies (comprised of 149 portfolios) managed by the Manager. She is 43 years old and has been an employee of the Manager since March 2013.
JEFF PRUSNOFSKY, Vice President and Assistant Secretary since August 2005.
Senior Managing Counsel of BNY Mellon, and an officer of 63 investment companies (comprised of 149 portfolios) managed by the Manager. He is 53 years old and has been an employee of the Manager since October 1990.
NATALYA ZELENSKY, Vice President and Assistant Secretary since March 2017.
Counsel of BNY Mellon since May 2016; Attorney at Wildermuth Endowment Strategy Fund/Wildermuth Advisory, LLC from November 2015 until May 2016; Assistant General Counsel at RCS Advisory Services from July 2014 until November 2015; Associate at Sutherland, Asbill & Brennan from January 2013 until January 2014. She is an officer of 63 investment companies (comprised of 149 portfolios) managed by Dreyfus. She is 33 years old and has been an employee of the Manager since May 2016.
JAMES WINDELS, Treasurer since November 2001.
Director – Mutual Fund Accounting of the Manager, and an officer of 63 investment companies (comprised of 149 portfolios) managed by the Manager. He is 60 years old and has been an employee of the Manager since April 1985.
50
GAVIN C. REILLY, Assistant Treasurer since December 2005.
Tax Manager of the Investment Accounting and Support Department of the Manager, and an officer of 63 investment companies (comprised of 149 portfolios) managed by the Manager. He is 50 years old and has been an employee of the Manager since April 1991.
ROBERT S. ROBOL, Assistant Treasurer since December 2005.
Senior Accounting Manager – Dreyfus Financial Reporting of the Manager, and an officer of 63 investment companies (comprised of 149 portfolios) managed by the Manager. He is 54 years old and has been an employee of the Manager since October 1988.
ROBERT SALVIOLO, Assistant Treasurer since July 2007.
Senior Accounting Manager – Equity Funds of the Manager, and an officer of 63 investment companies (comprised of 149 portfolios) managed by the Manager. He is 51 years old and has been an employee of the Manager since June 1989.
ROBERT SVAGNA, Assistant Treasurer since December 2002.
Senior Accounting Manager – Fixed Income and Equity Funds of the Manager, and an officer of 63 investment companies (comprised of 149 portfolios) managed by the Manager. He is 51 years old and has been an employee of the Manager since November 1990.
JOSEPH W. CONNOLLY, Chief Compliance Officer since October 2004.
Chief Compliance Officer of the Manager, the Dreyfus Family of Funds and BNY Mellon Funds Trust (63 investment companies, comprised of 149 portfolios). He is 61 years old and has served in various capacities with the Manager since 1980, including manager of the firm’s Fund Accounting Department from 1997 through October 2001.
CARIDAD M. CAROSELLA, Anti-Money Laundering Compliance Officer since January 2016.
Anti-Money Laundering Compliance Officer of the Dreyfus Family of Funds and BNY Mellon Funds Trust since January 2016; from May 2015 to December 2015, Interim Anti-Money Laundering Compliance Officer of the Dreyfus Family of Funds and BNY Mellon Funds Trust and the Distributor; from January 2012 to May 2015, AML Surveillance Officer of the Distributor and from 2007 to December 2011, Financial Processing Manager of the Distributor. She is an officer of 57 investment companies (comprised of 143 portfolios) managed by the Manager. She is 50 years old and has been an employee of the Distributor since 1997.
51
NOTES
52
NOTES
53
Dreyfus Global Real Return Fund
200 Park Avenue
New York, NY 10166
Manager
The Dreyfus Corporation
200 Park Avenue
New York, NY 10166
Sub-Investment Adviser
Newton Investment Management
(North America) Limited
160 Queen Victoria Street
London, EC4V, 4LA, UK
Custodian
The Bank of New York Mellon
240 Greenwich Street
New York, NY 10286
Transfer Agent &
Dividend Disbursing Agent
Dreyfus Transfer, Inc.
200 Park Avenue
New York, NY 10166
Distributor
MBSC Securities Corporation
200 Park Avenue
New York, NY 10166
| | |
Ticker Symbols: | Class A: DRRAX Class C: DRRCX Class I: DRRIX Class Y: DRRYX |
Telephone Call your financial representative or 1-800-DREYFUS
Mail The Dreyfus Family of Funds, 144 Glenn Curtiss Boulevard, Uniondale, NY 11556-0144
E-mail Send your request to info@dreyfus.com
Internet Information can be viewed online or downloaded at www.dreyfus.com
The fund files its complete schedule of portfolio holdings with the Securities and Exchange Commission (“SEC”) for the first and third quarters of each fiscal year on Form N-Q. The fund’s Forms N-Q are available on the SEC’s website at www.sec.gov.
A description of the policies and procedures that the fund uses to determine how to vote proxies relating to portfolio securities and information regarding how the fund voted these proxies for the most recent 12-month period ended June 30 is available at www.dreyfus.com and on the SEC’s website at www.sec.gov and without charge, upon request, by calling 1-800-DREYFUS.
| | |
© 2018 MBSC Securities Corporation
6278AR1018 | 
|
Dreyfus Global Multi-Asset Income Fund
| | | |

| | ANNUAL REPORT October 31, 2018 |
| |
Save time. Save paper. View your next shareholder report online as soon as it’s available. Log into www.dreyfus.com and sign up for Dreyfus eCommunications. It’s simple and only takes a few minutes. |
| |
The views expressed in this report reflect those of the portfolio manager(s) only through the end of the period covered and do not necessarily represent the views of Dreyfus or any other person in the Dreyfus organization. Any such views are subject to change at any time based upon market or other conditions and Dreyfus disclaims any responsibility to update such views. These views may not be relied on as investment advice and, because investment decisions for a Dreyfus fund are based on numerous factors, may not be relied on as an indication of trading intent on behalf of any Dreyfus fund. |
| |
Not FDIC-Insured • Not Bank-Guaranteed • May Lose Value |
Contents
THE FUND
FOR MORE INFORMATION
Back Cover
| | | | |
| |
Dreyfus Global Multi-Asset Income Fund
| | The Fund |
A LETTER FROM THE PRESIDENT OF DREYFUS
Dear Shareholder:
We are pleased to present this annual report for Dreyfus Global Multi-Asset Income Fund, covering the 12-month period from November 30, 2017 through October 31, 2018. For information about how the fund performed during the reporting period, as well as general market perspectives, we provide a Discussion of Fund Performance on the pages that follow.
Markets began the reporting period on solid footing as major global economies experienced above-trend growth across the board. In the United States, the Federal Reserve continued to move away from its accommodative monetary policy while other major central banks also began to consider monetary tightening. In the equity markets, both U.S. and non-U.S. markets enjoyed an upward trend, though investor concerns about volatility and inflation later began to weigh on returns. Interest rates rose across the curve, putting pressure on bond prices.
Later in the reporting period, global growth trends began to diverge. While a strong economic performance continued to bolster U.S. equity markets, slower growth and political concerns pressured markets in the Eurozone. Emerging markets also came under pressure as weakness in their currencies added to investors’ uneasiness. Fixed income markets continued to struggle as interest rates rose; the yield on the benchmark 10-year Treasury bond surged late in the reporting period, but growing investor concerns about global growth helped keep it from rising further.
Despite continuing doubts regarding trade, U.S. inflationary pressures, and global growth, we are optimistic that the U.S. economy will remain strong in the near term. However, we will stay attentive to signs that signal potential changes on the horizon. As always, we encourage you to discuss the risks and opportunities of today’s investment environment with your financial advisor.
Thank you for your continued confidence and support.
Sincerely,

Renee Laroche-Morris
President
The Dreyfus Corporation
November 15, 2018
2
DISCUSSION OF FUND PERFORMANCE (Unaudited)
For the period from the fund’s inception on November 30, 2017 through October 31, 2018, as provided by primary portfolio managers Paul Flood and Bhavin Shah of Newton Investment Management (North America) Limited, Sub-Investment Adviser
Market and Fund Performance Overview
For the period between the fund’s inception on November 30, 2017 and October 31, 2018, Dreyfus Global Multi-Asset Income Fund’s Class A shares produced a total return of
-5.79%, Class C shares returned -6.42%, Class I shares returned -5.64%, and Class Y shares returned -5.64%.1 In comparison, the fund’s benchmark, the MSCI ACWI Index, and its performance baseline benchmark, a blend of 60% MSCI ACWI Index/40% ICE BofA Merrill Lynch Global Broad Market Index (USD Hedged), produced total returns of -2.41% and -1.33%, respectively, for the same period.2,3
Some global stock and bond indices rose modestly over the reporting period despite an environment of slowing growth, a strong dollar, trade tensions, and geopolitical issues. The fund lagged its primary benchmark and baseline benchmark over the period, due in part to equity performance, particularly in the consumer, industrials, and financials sectors.
The Fund’s Investment Approach
The fund seeks current income, while maintaining the potential for long-term capital appreciation. To pursue its goal, the fund uses an actively managed global multi-asset strategy that focuses on income generation. The fund’s sub-adviser allocates the fund’s investments among equity and equity-related securities, debt, and debt-related securities, and to a lesser extent, real estate, commodities, and infrastructure in developed and emerging markets. The fund will seek to gain exposure to various asset classes principally through direct investments in securities, but the fund also may use derivative instruments and investments in other investment companies, including exchange-traded funds (ETFs), and real estate investment trusts (REITs) for such exposure.
Volatility Returned to Global Markets
The reporting period proved to be something of a roller coaster ride for global equity markets. Although the period started strong, as the S&P 500 registered robust gains from November 2017 through January 2018, February 2018 marked the return of volatility to markets. Worries prompted by stronger-than-expected inflation data and subsequently higher bond yields caused a sell-off across most asset classes. Towards the middle of the reporting period, equity markets recouped some of their earlier losses, as investors chose to focus on a positive outlook for economic growth.
As risk assets regained their poise, more cautious moods prevailed, spurred by slowing economic growth in non-U.S. developed markets. Meanwhile, the world’s major central banks, led by the U.S. Federal Reserve (the “Fed”), continued to tighten policy throughout 2018. Concurrently, Beijing reined in support for the Chinese economy, with the focus shifting towards the maintenance of financial stability. The slowdown of the global economy since the start of the year could be seen as a result of this continued policy tightening. Volatility soon resurfaced, notably in emerging markets, which had previously been major beneficiaries of monetary policy largesse. The U.S. market continued to outperform on a
3
DISCUSSION OF FUND PERFORMANCE (Unaudited) (continued)
relative basis, fueled by easy fiscal policy at the expense of the government balance sheet, easy financial conditions, a tax cut which is financing leveraged buyouts in the equity market, and financial-capital inflows from the offshore-dollar financial system. The reporting period closed with non-U.S. risk assets declining as a result of several factors weighing upon stock markets, such as Brexit uncertainties, geopolitical issues and trade tensions.
Consumer, Industrials, and Financials Stocks Dampened Results
Equities were the largest detracting asset class over the reporting period. Consumer goods, industrials, and financials were the weakest sectors. Elsewhere, with Asian and emerging markets underperforming North America, the fund’s performance was hindered by its higher weighting to these regions, which were negatively affected by U.S.-dollar strength and the prospect of further interest-rate hikes in the U.S. Key detractors included Asian consumer brands Samsonite International, Man Wah Holdings, and China Harmony New Energy Auto. The fund’s performance from its alternatives exposure was tempered by unfortunate events in the Italian city of Genoa, as a motorway bridge owned by economic infrastructure company Atlantia collapsed in August, resulting in multiple fatalities. With the newly formed Italian government threatening to revoke Atlantia’s operating concession, the company’s share price declined heavily and detracted significantly from fund performance.
Conversely, positioning within the health care and utilities sectors made positive contributions over the reporting period. Within health care, Hikma Pharmaceuticals contributed strongly to performance due to relief that pricing of generic pharmaceuticals appeared to be bottoming out, and we reduced the position as a result. In technology, Apple performed particularly well alongside Microsoft. In addition, the portfolio benefited from its sale of the UBM position, after the stock of the business-to-business events organizer performed strongly upon receiving a takeover offer from competitor Informa. The expanded group is expected to benefit from improved efficiencies and economies of scale. Offshore wind-farm specialist Ørsted (formerly DONG Energy) performed strongly and is well positioned to benefit from the growth in global offshore wind projects. While we continue to favor its long-term prospects, we believed that the medium-term prospects had largely been priced in after a revaluation and exited the position as a result.
Finding Opportunities in a Changing Landscape
While there are a number of disruptive and structural changes occurring in the global economy, largely driven by new and improved technologies, the outlook for global growth rates, relative currency valuations, and returns from financial markets is increasingly dependent on how countries interact and trade with each other. In the short term, the outcome of the Brexit negotiations and resolution of the U.S.-China trade dispute are likely to be key drivers of market confidence and returns.
In this environment, we continue to follow our investment process of searching for sustainable income through a focus on the underlying cash flows of the companies and securities we invest in. By selecting companies that we believe can continue paying their coupons and growing their dividends throughout the cycle, we aim to ensure the fund can pay a sustainable income on an ongoing basis. By focusing on the sustainability of income, we seek to ensure that the capital will look after itself over the longer term. We believe such an approach should help us to meet our objective of providing not only an attractive and growing income, but also an attractive total return over the cycle. Specifically, we continue to
4
favor renewable energy and infrastructure assets, where returns are higher and economic sensitivity lower than the high yield bond market. We find the contractual, inflation-linked revenues of such assets highly attractive in the current environment alongside the well-covered dividends, which should provide a more sustainable income irrespective of the economic backdrop. We will look to add to this area as opportunities arise.
November 15, 2018
1 Total return includes reinvestment of dividends and any capital gains paid and does not take into consideration the maximum initial sales charge in the case of Class A shares, or the applicable contingent deferred sales charge imposed on redemptions in the case of Class C shares. Had these charges been reflected, returns would have been lower. Share price and investment return fluctuate such that upon redemption, fund shares may be worth more or less than their original cost. Return figures provided reflect the absorption of certain fund expenses by The Dreyfus Corporation pursuant to an agreement in effect through March 1, 2019, at which time it may be extended, modified, or terminated. Past performance is no guarantee of future results.
2 Source: Lipper Inc. — The MSCI ACWI Index captures large- and mid-cap representation across Developed Market (DM) countries and Emerging Market (EM) countries. It reflects reinvestment of net dividends and, where applicable, capital gain distributions. Investors cannot invest directly in any index.
3 Source: FactSet — The ICE BofA Merrill Lynch Global Broad Market Index tracks the performance of investment-grade public debt issued in the major domestic and eurobond markets, including “global” bonds.
Please note: the position in any security highlighted with italicized typeface was sold during the reporting period.
Equities are subject generally to market, market sector, market liquidity, issuer, and investment style risks, among other factors, to varying degrees, all of which are more fully described in the fund’s prospectus.
The fund’s performance will be influenced by political, social, and economic factors affecting investments in foreign companies. Special risks associated with investments in foreign companies include exposure to currency fluctuations, less liquidity, less developed or less efficient trading markets, lack of comprehensive company information, political instability, and differing auditing and legal standards. These risks generally are greater with emerging market countries than with more economically and politically established foreign countries.
Bonds are subject generally to interest-rate, credit, liquidity, and market risks, to varying degrees, all of which are more fully described in the fund’s prospectus. Generally, all other factors being equal, bond prices are inversely related to interest-rate changes, and rate increases can cause price declines.
High yield bonds are subject to increased credit risk and are considered speculative in terms of the issuer’s perceived ability to continue making interest payments on a timely basis and to repay principal upon maturity.
Foreign bonds are subject to special risks, including exposure to currency fluctuations, changing political and economic conditions, and potentially less liquidity. These risks are generally greater with emerging market countries than with more economically and politically established foreign countries.
The use of derivatives involves risks different from, or possibly greater than, the risks associated with investing directly in the underlying assets. Derivatives can be highly volatile, illiquid, and difficult to value, and there is the risk that changes in the value of a derivative held by the fund will not correlate with the underlying instruments or the fund’s other investments.
Investments in foreign currencies are subject to the risk that those currencies will decline in value relative to the U.S. dollar, or, in the case of hedged positions, that the U.S. dollar will decline relative to the currency being hedged. Currency rates in foreign countries may fluctuate significantly over short periods of time. A decline in the value of foreign currencies relative to the U.S. dollar will reduce the value of securities held by the fund and denominated in those currencies. The use of leverage may magnify the fund’s gains or losses. For derivatives with a leveraging component, adverse changes in the value or level of the underlying asset can result in a loss that is much greater than the original investment in the derivative.
5
FUND PERFORMANCE (Unaudited)

Comparison of change in value of $10,000 investment in Dreyfus Global Multi-Asset Income Fund Class A shares, Class C shares, Class I shares and Class Y shares and the MSCI ACWI Index (the “Index”) and 60% MSCI ACWI Index and 40% ICE BofA Merrill Lynch Global Broad Market Index (USD Hedged) (the “Baseline Benchmark”)
† Source: Lipper Inc.
†† Source: FactSet
Past performance is not predictive of future performance.
The above graph compares a $10,000 investment made in each of the Class A, Class C, Class I and Class Y shares of Dreyfus Global Multi-Asset Income Fund on 11/30/17 (inception date) to a $10,000 investment made in the Index and Baseline Benchmark on that date. All dividends and capital gain distributions are reinvested.
The fund’s performance shown in the line graph above takes into account the maximum initial sales charge on Class A shares and all other applicable fees and expenses on all classes. The MSCI ACWI Index captures large- and mid-cap representation across Developed Market (DM) countries and Emerging Market (EM) countries. The ICE BofA Merrill Lynch Global Broad Market Index (USD Hedged) tracks the performance of U.S. dollar-denominated investment-grade debt publicly issued in the U.S. domestic market, including U.S. Treasury, quasi-government, corporate, securitized and collateralized securities. Unlike a mutual fund, indices are not subject to charges, fees and other expenses. Investors cannot invest directly in any indices. Further information relating to fund performance, including expense reimbursements, if applicable, is contained in the Fees and Expenses section of the prospectus and elsewhere in this report.
6
| | | | | |
Average Annual Total Returns as of 10/31/18 |
| Inception
Date | | | From
Inception |
Class A shares | | | | |
with maximum sales charge (5.75%) | 11/30/17 | | | -11.19% |
without sales charge | 11/30/17 | | | -5.79% |
Class C shares | | | | |
with applicable redemption charge† | 11/30/17 | | | -7.34% |
without redemption | 11/30/17 | | | -6.42% |
Class I shares | 11/30/17 | | | -5.64% |
Class Y shares | 11/30/17 | | | -5.64% |
MSCI ACWI Index | | | | -2.41% |
Baseline Benchmark | | | | -1.33% |
† The maximum contingent deferred sales charge for Class C shares is 1% for shares redeemed within one year of the date of purchase.
The performance data quoted represents past performance, which is no guarantee of future results. Share price and investment return fluctuate and an investor’s shares may be worth more or less than original cost upon redemption. Current performance may be lower or higher than the performance quoted. Go to Dreyfus.com for the fund’s most recent month-end returns.
The fund’s performance shown in the graph and table does not reflect the deduction of taxes that a shareholder would pay on fund distributions or the redemption of fund shares. In addition to the performance of Class A shares shown with and without a maximum sales charge, the fund’s performance shown in the table takes into account all other applicable fees and expenses on all classes.
7
UNDERSTANDING YOUR FUND’S EXPENSES (Unaudited)
As a mutual fund investor, you pay ongoing expenses, such as management fees and other expenses. Using the information below, you can estimate how these expenses affect your investment and compare them with the expenses of other funds. You also may pay one-time transaction expenses, including sales charges (loads) and redemption fees, which are not shown in this section and would have resulted in higher total expenses. For more information, see your fund’s prospectus or talk to your financial adviser.
Review your fund’s expenses
The table below shows the expenses you would have paid on a $1,000 investment in Dreyfus Global Multi-Asset Income Fund from May 1, 2018 to October 31, 2018. It also shows how much a $1,000 investment would be worth at the close of the period, assuming actual returns and expenses.
| | | | | | | | | | | | | |
Expenses and Value of a $1,000 Investment | | |
assuming actual returns for the six months ended October 31, 2018 |
| | | | | | | | |
| | | | Class A | Class C | Class I | Class Y |
Expenses paid per $1,000† | | $4.60 | | $8.22 | | $3.39 | | $3.39 |
Ending value (after expenses) | $ | $923.10 | | $919.50 | | $922.80 | | $922.80 |
COMPARING YOUR FUND’S EXPENSES
WITH THOSE OF OTHER FUNDS (Unaudited)
Using the SEC’s method to compare expenses
The Securities and Exchange Commission (“SEC”) has established guidelines to help investors assess fund expenses. Per these guidelines, the table below shows your fund’s expenses based on a $1,000 investment, assuming a hypothetical 5% annualized return. You can use this information to compare the ongoing expenses (but not transaction expenses or total cost) of investing in the fund with those of other funds. All mutual fund shareholder reports will provide this information to help you make this comparison. Please note that you cannot use this information to estimate your actual ending account balance and expenses paid during the period.
| | | | | | | | | | | | |
Expenses and Value of a $1,000 Investment | | |
assuming a hypothetical 5% annualized return for the six months ended October 31, 2018 |
| | | | | | | | |
| | | | Class A | Class C | Class I | Class Y |
Expenses paid per $1,000† | | $4.84 | | $8.64 | | $3.57 | | $3.57 |
Ending value (after expenses) | | $1,020.42 | | $1,016.64 | | $1,021.68 | | $1,021.68 |
† Expenses are equal to the fund’s annualized expense ratio of .95% for Class A, 1.70% for Class C, .70% for Class I and .70% for Class Y, multiplied by the average account value over the period, multiplied by 184/365 (to reflect the one-half year period).
8
STATEMENT OF INVESTMENTS
October 31, 2018
| | | | | | | | | | |
| |
Description | Coupon
Rate (%) | | Maturity
Date | | Principal
Amount ($) | a | Value ($) | |
Bonds and Notes - 20.9% | | | | | |
Australia - 2.6% | | | | | |
Australian Government,
Bonds, Ser. 138 | AUD | 3.25 | | 4/21/2029 | | 161,000 | | 120,453 | |
New South Wales Treasury,
Bonds | AUD | 3.00 | | 3/20/2028 | | 260,000 | | 184,093 | |
| | 304,546 | |
Ecuador - 1.5% | | | | | |
Ecuadorian Government,
Sr. Unscd. Notes | | 8.88 | | 10/23/2027 | | 200,000 | | 176,550 | |
Guatemala - 1.7% | | | | | |
Guatemalan Government,
Bonds | | 5.75 | | 6/6/2022 | | 200,000 | | 205,360 | |
Indonesia - .8% | | | | | |
Indonesian Treasury,
Sr. Unscd. Bonds, Ser. FR72 | IDR | 8.25 | | 5/15/2036 | | 1,500,000,000 | | 92,723 | |
Mexico - 2.9% | | | | | |
Mexican Bonos,
Bonds, Ser. M | MXN | 6.50 | | 6/9/2022 | | 1,886,800 | | 86,810 | |
Mexican Bonos,
Bonds, Ser. M | MXN | 8.00 | | 11/7/2047 | | 4,725,700 | | 208,902 | |
Mexican Bonos,
Bonds, Ser. M 20 | MXN | 8.50 | | 5/31/2029 | | 1,000,600 | | 47,965 | |
| | 343,677 | |
Netherlands - .9% | | | | | |
Petrobras Global Finance,
Gtd. Notes | | 6.88 | | 1/20/2040 | | 64,000 | | 61,232 | |
Teva Pharmaceuticals,
Gtd. Notes | | 2.20 | | 7/21/2021 | | 46,000 | | 42,977 | |
| | 104,209 | |
United Kingdom - 3.5% | | | | | |
Nationwide Building Society,
Jr. Sub. Notes | GBP | 6.88 | | 6/20/2019 | | 100,000 | | 130,038 | |
Tesco Property Finance 3,
Sr. Scd. Bonds | GBP | 5.74 | | 4/13/2040 | | 97,088 | | 146,629 | |
Virgin Media Secured Finance | GBP | 6.25 | | 3/28/2029 | | 100,000 | | 132,911 | |
| | 409,578 | |
United States - 7.0% | | | | | |
CCO Holdings,
Sr. Unscd. Notes | | 5.50 | | 5/1/2026 | | 44,000 | b | 42,955 | |
Sprint,
Gtd. Notes | | 7.13 | | 6/15/2024 | | 129,000 | | 132,225 | |
Sprint Capital,
Gtd. Notes | | 8.75 | | 3/15/2032 | | 61,000 | | 66,496 | |
9
STATEMENT OF INVESTMENTS (continued)
| | | | | | | | | | |
| |
Description | Coupon
Rate (%) | | Maturity
Date | | Principal
Amount ($) | a | Value ($) | |
Bonds and Notes - 20.9% (continued) | | | | | |
United States - 7.0% (continued) | | | | | |
T-Mobile USA,
Gtd. Notes | | 6.00 | | 3/1/2023 | | 48,000 | | 49,205 | |
U.S. Treasury Inflation Protected Securities,
Bonds | | 2.38 | | 1/15/2025 | | 194,229 | c | 209,351 | |
U.S. Treasury Notes | | 2.00 | | 2/15/2025 | | 341,300 | | 320,822 | |
| | 821,054 | |
Total Bonds and Notes
(cost $2,658,988) | | 2,457,697 | |
| | | | | | | | | |
Convertible Bonds - 3.3% | | | | | |
Cayman Islands - 1.6% | | | | | |
Ctrip.com International | | 1.99 | | 7/1/2025 | | 184,000 | | 183,043 | |
United States - 1.7% | | | | | |
Redwood Trust | | 4.75 | | 8/15/2023 | | 214,000 | | 204,312 | |
Total Convertible Bonds
(cost $419,966) | | 387,355 | |
Description | | | | | Shares | | Value ($) | |
Common Stocks - 63.3% | | | | | |
Australia - 4.2% | | | | | |
Dexus | | | | | | 18,099 | d | 131,067 | |
Insurance Australia Group | | | | | | 23,308 | e | 112,907 | |
Sydney Airport | | | | | | 28,902 | | 132,022 | |
Transurban Group | | | | | | 14,537 | | 116,671 | |
| | 492,667 | |
Brazil - .5% | | | | | |
Ambev, ADR | | | | | | 13,454 | | 58,256 | |
Canada - 1.1% | | | | | |
Suncor Energy | | | | | | 3,686 | | 123,646 | |
China - 1.8% | | | | | |
China Harmony New Energy Auto Holding | | | | | | 315,500 | | 124,979 | |
Hollysys Automation Technologies | | | | | | 4,124 | | 79,263 | |
| | 204,242 | |
Georgia - 2.4% | | | | | |
Bank of Georgia Group | | | | | | 3,383 | | 67,428 | |
Georgia Capital | | | | | | 3,383 | e | 50,575 | |
TBC Bank Group | | | | | | 7,634 | | 164,827 | |
| | 282,830 | |
Germany - 4.3% | | | | | |
HeidelbergCement | | | | | | 914 | | 62,099 | |
Hella KGaA Hueck & Co. | | | | | | 1,599 | | 74,976 | |
Infineon Technologies | | | | | | 4,562 | | 91,455 | |
10
| | | | | | | | | | |
| |
Description | | | | | Shares | | Value ($) | |
Common Stocks - 63.3% (continued) | | | | | |
Germany - 4.3% (continued) | | | | | |
Telefonica Deutschland Holding | | | | | | 71,152 | | 276,750 | |
| | 505,280 | |
Guernsey - 2.1% | | | | | |
Hipgnosis Songs Fund | | | | | | 182,504 | | 248,996 | |
Hong Kong - 4.0% | | | | | |
AIA Group | | | | | | 36,800 | | 279,902 | |
Link REIT | | | | | | 14,500 | | 128,341 | |
Man Wah Holdings | | | | | | 132,400 | | 60,876 | |
| | 469,119 | |
Ireland - 1.4% | | | | | |
AIB Group | | | | | | 16,581 | | 80,175 | |
CRH | | | | | | 2,967 | | 88,655 | |
| | 168,830 | |
Israel - 1.3% | | | | | |
Bank Hapoalim | | | | | | 19,007 | | 128,382 | |
Teva Pharmaceutical Industries, ADR | | | | | | 1,199 | e | 23,956 | |
| | 152,338 | |
Italy - 2.0% | | | | | |
Atlantia | | | | | | 11,798 | | 236,923 | |
Japan - 1.5% | | | | | |
Ebara | | | | | | 2,200 | | 63,964 | |
Japan Tobacco | | | | | | 4,100 | | 105,428 | |
| | 169,392 | |
Jordan - .5% | | | | | |
Hikma Pharmaceuticals | | | | | | 2,536 | | 61,589 | |
Macau - .7% | | | | | |
Sands China | | | | | | 20,400 | | 80,907 | |
Mexico - 1.8% | | | | | |
Kimberly-Clark de Mexico, Cl. A | | | | | | 35,261 | e | 50,809 | |
Wal-Mart de Mexico | | | | | | 63,300 | | 161,855 | |
| | 212,664 | |
New Zealand - 2.2% | | | | | |
SKYCITY Entertainment Group | | | | | | 71,370 | | 178,392 | |
Spark New Zealand | | | | | | 32,144 | | 83,026 | |
| | 261,418 | |
Norway - 1.3% | | | | | |
Entra | | | | | | 11,474 | b | 155,122 | |
Singapore - 2.4% | | | | | |
Mapletree Greater China Commercial Trust | | | | | | 148,100 | | 120,775 | |
Parkway Life Real Estate Investment Trust | | | | | | 87,300 | | 163,842 | |
| | 284,617 | |
11
STATEMENT OF INVESTMENTS (continued)
| | | | | | | | | | |
| |
Description | | | | | Shares | | Value ($) | |
Common Stocks - 63.3% (continued) | | | | | |
Switzerland - 4.1% | | | | | |
ABB | | | | | | 5,562 | | 111,813 | |
Ferguson | | | | | | 2,171 | | 146,485 | |
Novartis | | | | | | 1,104 | | 96,408 | |
Zurich Insurance Group | | | | | | 400 | e | 124,116 | |
| | 478,822 | |
United Kingdom - 11.6% | | | | | |
Ascential | | | | | | 19,958 | | 96,092 | |
B&M European Value Retail | | | | | | 22,627 | | 120,524 | |
BAE Systems | | | | | | 22,206 | | 149,165 | |
British American Tobacco | | | | | | 1,565 | | 67,911 | |
Diageo | | | | | | 3,665 | | 126,762 | |
Dixons Carphone | | | | | | 31,937 | | 69,124 | |
Informa | | | | | | 18,664 | | 170,090 | |
Lloyds Banking Group | | | | | | 121,841 | | 89,077 | |
Prudential | | | | | | 7,912 | | 158,715 | |
Royal Bank of Scotland Group | | | | | | 27,555 | | 83,187 | |
Royal Dutch Shell, Cl. B | | | | | | 2,990 | | 97,353 | |
Whitbread | | | | | | 2,420 | | 136,015 | |
| | 1,364,015 | |
United States - 12.1% | | | | | |
Albemarle | | | | | | 1,442 | | 143,075 | |
American Homes 4 Rent, Cl. A | | | | | | 5,667 | d | 119,404 | |
Apple | | | | | | 927 | | 202,883 | |
Applied Materials | | | | | | 2,219 | | 72,961 | |
CA | | | | | | 1,746 | | 77,453 | |
Citigroup | | | | | | 2,417 | | 158,217 | |
General Electric | | | | | | 6,860 | | 69,286 | |
Gilead Sciences | | | | | | 535 | | 36,476 | |
Las Vegas Sands | | | | | | 895 | | 45,672 | |
Microsoft | | | | | | 1,091 | | 116,530 | |
Redwood Trust | | | | | | 12,137 | d | 199,289 | |
Samsonite International | | | | | | 24,591 | b,e | 70,451 | |
Schlumberger | | | | | | 2,032 | | 104,262 | |
| | 1,415,959 | |
Total Common Stocks
(cost $8,369,045) | | 7,427,632 | |
| | | | | | | | | |
Preferred Stocks - 2.2% | | | | | |
Germany - 1.2% | | | | | |
Volkswagen | | 2.67 | | | | 873 | | 147,031 | |
South Korea - 1.0% | | | | | |
Samsung Electronics | | 4.40 | | | | 3,554 | | 111,994 | |
Total Preferred Stocks
(cost $317,720) | | 259,025 | |
12
| | | | | | | | | | |
| |
Description | | | | | Shares | | Value ($) | |
Investment Companies - 9.4% | | | | | |
Guernsey - 3.4% | | | | | |
International Public Partnerships | | | | | | 149,226 | | 290,290 | |
Tufton Oceanic Assets | | | | | | 106,687 | | 111,488 | |
| | 401,778 | |
United Kingdom - 6.0% | | | | | |
Greencoat UK Wind | | | | | | 230,852 | | 381,770 | |
John Laing Environmental Assets Group | | | | | | 241,671 | | 322,783 | |
| | 704,553 | |
Total Investment Companies
(cost $1,085,228) | | 1,106,331 | |
Total Investments (cost $12,850,947) | | 99.1% | 11,638,040 | |
Cash and Receivables (Net) | | 0.9% | 108,257 | |
Net Assets | | 100.0% | 11,746,297 | |
ADR—American Depository Receipt
AUD—Australian Dollar
CAD—Canadian Dollar
CHF—Swiss Franc
EUR—Euro
GBP—British Pound
HKD—Hong Kong Dollar
IDR—Indonesian Rupiah
JPY—Japanese Yen
MXN—Mexican Peso
NOK—Norwegian Krone
NZD—New Zealand Dollar
SGD—Singapore Dollar
a Amount stated in U.S. Dollars unless otherwise noted above.
b Security exempt from registration pursuant to Rule 144A under the Securities Act of 1933. These securities may be resold in transactions exempt from registration, normally to qualified institutional buyers. At October 31, 2018, these securities were valued at $268,528 or 2.29% of net assets.
c Principal amount for accrual purposes is periodically adjusted based on changes in the Consumer Price Index.
d Investment in real estate investment trust.
e Non-income producing security.
13
STATEMENT OF INVESTMENTS (continued)
| | |
Portfolio Summary (Unaudited) † | Value (%) |
Real Estate | 11.7 |
Foreign/Governmental | 9.6 |
Closed-End Investment Companies | 9.4 |
Banks | 7.7 |
Insurance | 5.7 |
Telecommunication Services | 5.2 |
Consumer Discretionary | 5.0 |
Retailing | 4.6 |
U.S. Government Securities | 4.5 |
Industrials | 3.9 |
Commercial & Professional Services | 3.8 |
Energy | 3.3 |
Media | 2.9 |
Information Technology | 2.6 |
Diversified Financials | 2.5 |
Health Care | 2.2 |
Automobiles & Components | 1.9 |
Technology Hardware & Equipment | 1.7 |
Beverage Products | 1.6 |
Internet Software & Services | 1.6 |
Agriculture | 1.5 |
Semiconductors & Semiconductor Equipment | 1.4 |
Building Materials | 1.3 |
Aerospace & Defense | 1.3 |
Chemicals | 1.2 |
Consumer Durables & Apparel | .6 |
Consumer Staples | .4 |
| | 99.1 |
† Based on net assets.
See notes to financial statements.
14
STATEMENT OF INVESTMENTS IN AFFILIATED ISSUERS
| | | | | | | |
Registered Investment Company | Value
11/30/17($) | Purchases($) | Sales($) | Value
10/31/18($) | Net
Assets(%) | Dividends/
Distributions($) |
Dreyfus Institutional Preferred Government Plus Money Market Fund | - | 42,017,124 | 42,017,124 | - | - | 12,619 |
See notes to financial statements.
15
STATEMENT OF FORWARD FOREIGN CURRENCY EXCHANGE CONTRACTS October 31, 2018
| | | | | | |
Counterparty/ Purchased
Currency | Purchased Currency
Amounts | Currency
Sold | Sold
Currency
Amounts | Settlement Date | Unrealized Appreciation (Depreciation)($) |
State Street Bank and Trust Company | | | |
United States Dollar | 174,305 | Japanese Yen | 19,206,000 | 11/14/18 | 3,922 |
Euro | 420,000 | United States Dollar | 485,259 | 11/14/18 | (9,022) |
United States Dollar | 481,452 | Euro | 412,176 | 11/14/18 | 14,086 |
United States Dollar | 17,911 | Euro | 15,819 | 11/2/18 | (9) |
Australian Dollar | 190,000 | United States Dollar | 138,224 | 11/14/18 | (3,654) |
United States Dollar | 193,810 | Australian Dollar | 265,388 | 11/14/18 | 5,846 |
Japanese Yen | 10,935,000 | United States Dollar | 99,519 | 11/14/18 | (2,511) |
United States Dollar | 732,013 | Australian Dollar | 987,000 | 11/14/18 | 32,959 |
United States Dollar | 1,121,998 | British Pound | 856,601 | 1/16/19 | 22,505 |
Australian Dollar | 250,221 | United States Dollar | 178,297 | 11/14/18 | (1,075) |
Gross Unrealized Appreciation | | | 79,318 |
Gross Unrealized Depreciation | | | (16,271) |
See notes to financial statements.
16
STATEMENT OF ASSETS AND LIABILITIES
October 31, 2018
| | | | | | | |
| | | | | | |
| | | Cost | | Value | |
Assets ($): | | | | |
Investments in securities—See Statement of Investments | 12,850,947 | | 11,638,040 | |
Unrealized appreciation on forward foreign
currency exchange contracts—Note 4 | | 79,318 | |
Dividends and interest receivable | | 67,479 | |
Receivable for investment securities sold | | 30,836 | |
Due from The Dreyfus Corporation and affiliates—Note 3(c) | | 8,799 | |
Prepaid expenses | | | | | 30,704 | |
| | | | | 11,855,176 | |
Liabilities ($): | | | | |
Cash overdraft due to Custodian | | | | | 4,370 | |
Payable for investment securities purchased | | 18,321 | |
Unrealized depreciation on forward foreign
currency exchange contracts—Note 4 | | 16,271 | |
Unrealized depreciation on foreign currency transactions | | 1,827 | |
Directors fees and expenses payable | | 1,665 | |
Accrued expenses | | | | | 66,425 | |
| | | | | 108,879 | |
Net Assets ($) | | | 11,746,297 | |
Composition of Net Assets ($): | | | | |
Paid-in capital | | | | | 12,986,801 | |
Total distributable earnings (loss) | | | | | (1,240,504) | |
Net Assets ($) | | | 11,746,297 | |
| | | | | | |
Net Asset Value Per Share | Class A | Class C | Class I | Class Y | |
Net Assets ($) | 925,175 | 923,625 | 4,485,609 | 5,411,888 | |
Shares Outstanding | 80,000 | 80,000 | 387,793 | 467,793 | |
Net Asset Value Per Share ($) | 11.56 | 11.55 | 11.57 | 11.57 | |
| | | | | | |
See notes to financial statements. | | | | | |
17
STATEMENT OF OPERATIONS
From November 30, 2017 (commencement of operations) to October 31, 2018
| | | | | | | |
| | | | | | |
| | | | | | |
Investment Income ($): | | | | |
Income: | | | | |
Dividends (net of $31,402 foreign taxes withheld at source): | |
Unaffiliated issuers | | | 463,429 | |
Affiliated issuers | | | 12,619 | |
Interest | | | 306,934 | |
Total Income | | | 782,982 | |
Expenses: | | | | |
Management fee—Note 3(a) | | | 112,950 | |
Professional fees | | | 194,900 | |
Registration fees | | | 82,545 | |
Custodian fees—Note 3(c) | | | 11,106 | |
Prospectus and shareholders’ reports | | | 7,283 | |
Distribution fees—Note 3(b) | | | 6,873 | |
Shareholder servicing costs—Note 3(c) | | | 4,989 | |
Directors’ fees and expenses—Note 3(d) | | | 3,028 | |
Loan commitment fees—Note 2 | | | 463 | |
Miscellaneous | | | 38,200 | |
Total Expenses | | | 462,337 | |
Less—reduction in expenses due to undertaking—Note 3(a) | | | (304,782) | |
Less—reduction in fees due to earnings credits—Note 3(c) | | | (38) | |
Net Expenses | | | 157,517 | |
Investment Income—Net | | | 625,465 | |
Realized and Unrealized Gain (Loss) on Investments—Note 4 ($): | | |
Net realized gain (loss) on investments and foreign currency transactions | (375,593) | |
Net realized gain (loss) on forward foreign currency exchange contracts | 105,060 | |
Net Realized Gain (Loss) | | | (270,533) | |
Net unrealized appreciation (depreciation) on investments
and foreign currency transactions | | | (1,214,734) | |
Net unrealized appreciation (depreciation) on
forward foreign currency exchange contracts | | | 63,047 | |
Net Unrealized Appreciation (Depreciation) | | | (1,151,687) | |
Net Realized and Unrealized Gain (Loss) on Investments | | | (1,422,220) | |
Net (Decrease) in Net Assets Resulting from Operations | | (796,755) | |
| | | | | | | |
See notes to financial statements. | | | | | |
18
STATEMENT OF CHANGES IN NET ASSETS
From November 30, 2017 (commencement of operations) to October 31, 2018
| | | | | | | |
| | | | Year Ended October 31, |
| | | | 2018 | |
Operations ($): | | | | | |
Investment income—net | | | 625,465 | | |
Net realized gain (loss) on investments | | (270,533) | | |
Net unrealized appreciation (depreciation)
on investments | | (1,151,687) | | |
Net Increase (Decrease) in Net Assets
Resulting from Operations | (796,755) | | |
Distributions ($): |
Distributions to shareholders: | | | | | |
Class A | | | (18,544) | | |
Class C | | | (13,544) | | |
Class I | | | (202,370) | | |
Class Y | | | (222,490) | | |
Total Distributions | | | (456,948) | | |
Capital Stock Transactions ($): |
Net proceeds from shares sold: | | | | | |
Class A | | | 1,000,000 | | |
Class C | | | 1,000,000 | | |
Class I | | | 11,000,000 | | |
Class Y | | | 12,000,000 | | |
Cost of shares redeemed | | | | | |
Class I | | | (6,000,000) | | |
Class Y | | | (6,000,000) | | |
Increase (Decrease) in Net Assets
from Capital Stock Transactions | 13,000,000 | | |
Total Increase (Decrease) in Net Assets | 11,746,297 | | |
Net Assets ($): |
Beginning of Period | | | - | | |
End of Period | | | 11,746,297 | | |
Capital Share Transactions (Shares): |
Class A | | | | | |
Shares sold | | | 80,000 | | |
Net Increase (Decrease) in Shares Outstanding | 80,000 | | |
Class C | | | | | |
Shares sold | | | 80,000 | | |
Net Increase (Decrease) in Shares Outstanding | 80,000 | | |
Class I | | | | | |
Shares sold | | | 880,000 | | |
Shares redeemed | | | (492,207) | | |
Net Increase (Decrease) in Shares Outstanding | 387,793 | | |
Class Y | | | | | |
Shares sold | | | 960,000 | | |
Shares redeemed | | | (492,207) | | |
Net Increase (Decrease) in Shares Outstanding | 467,793 | | |
| | | | | | | |
See notes to financial statements. | | | | | |
19
FINANCIAL HIGHLIGHTS
The following tables describe the performance for each share class for the fiscal periods indicated. All information (except portfolio turnover rate) reflects financial results for a single fund share. Total return shows how much your investment in the fund would have increased (or decreased) during each period, assuming you had reinvested all dividends and distributions. These figures have been derived from the fund’s financial statements.
| | | | | | | |
| | | | | | | |
| | | | | Period Ended October 31, |
Class A Shares | | | | | 2018a | |
Per Share Data ($): | | | | | | |
Net asset value, beginning of period | | | | | 12.50 | |
Investment Operations: | | | | | | |
Investment income—netb | | | | | .32 | |
Net realized and unrealized
gain (loss) on investments | | | | | (1.03) | |
Total from Investment Operations | | | | | (.71) | |
Distributions: | | | | | | |
Dividends from
investment income—net | | | | | (.23) | |
Net asset value, end of period | | | | | 11.56 | |
Total Return (%)c | | | | | (5.79)d | |
Ratios/Supplemental Data (%): | | | | | | |
Ratio of total expenses
to average net assets | | | | | 2.56e | |
Ratio of net expenses
to average net assets | | | | | .96e | |
Ratio of net investment income
to average net assets | | | | | 2.78e | |
Portfolio Turnover Rate | | | | | 81.07d | |
Net Assets, end of period ($ x 1,000) | | | | | 925 | |
a From November 30, 2017 (commencement of operations) to October 31, 2018.
b Based on average shares outstanding.
c Exclusive of sales charge.
d Not annualized.
e Annualized.
See notes to financial statements.
20
| | | | | | | |
| | | | | | | |
| | | | | Period Ended October 31, |
Class C Shares | | | | | 2018a | |
Per Share Data ($): | | | | | | |
Net asset value, beginning of period | | | | | 12.50 | |
Investment Operations: | | | | | | |
Investment income—netb | | | | | .23 | |
Net realized and unrealized
gain (loss) on investments | | | | | (1.01) | |
Total from Investment Operations | | | | | (.78) | |
Distributions: | | | | | | |
Dividends from
investment income—net | | | | | (.17) | |
Net asset value, end of period | | | | | 11.55 | |
Total Return (%)c | | | | | (6.42)d | |
Ratios/Supplemental Data (%): | | | | | | |
Ratio of total expenses
to average net assets | | | | | 3.29e | |
Ratio of net expenses
to average net assets | | | | | 1.71e | |
Ratio of net investment income
to average net assets | | | | | 2.03e | |
Portfolio Turnover Rate | | | | | 81.07d | |
Net Assets, end of period ($ x 1,000) | | | | | 924 | |
a From November 30, 2017 (commencement of operations) to October 31, 2018.
b Based on average shares outstanding.
c Exclusive of sales charge.
d Not annualized.
e Annualized.
See notes to financial statements.
21
FINANCIAL HIGHLIGHTS (continued)
| | | | | | | |
| | | | | | | |
| | | | | Period Ended October 31, |
Class I Shares | | | | | 2018a | |
Per Share Data ($): | | | | | | |
Net asset value, beginning of period | | | | | 12.50 | |
Investment Operations: | | | | | | |
Investment income—netb | | | | | .37 | |
Net realized and unrealized
gain (loss) on investments | | | | | (1.05) | |
Total from Investment Operations | | | | | (.68) | |
Distributions: | | | | | | |
Dividends from
investment income—net | | | | | (.25) | |
Net asset value, end of period | | | | | 11.57 | |
Total Return (%) | | | | | (5.64)c | |
Ratios/Supplemental Data (%): | | | | | | |
Ratio of total expenses
to average net assets | | | | | 2.18d | |
Ratio of net expenses
to average net assets | | | | | .71d | |
Ratio of net investment income
to average net assets | | | | | 3.11d | |
Portfolio Turnover Rate | | | | | 81.07c | |
Net Assets, end of period ($ x 1,000) | | | | | 4,486 | |
a From November 30, 2017 (commencement of operations) to October 31, 2018.
b Based on average shares outstanding.
c Not annualized.
d Annualized.
See notes to financial statements.
22
| | | | | | | |
| | | | | | | |
| | | | | Period Ended October 31, |
Class Y Shares | | | | | 2018a | |
Per Share Data ($): | | | | | | |
Net asset value, beginning of period | | | | | 12.50 | |
Investment Operations: | | | | | | |
Investment income—netb | | | | | .37 | |
Net realized and unrealized
gain (loss) on investments | | | | | (1.05) | |
Total from Investment Operations | | | | | (.68) | |
Distributions: | | | | | | |
Dividends from
investment income—net | | | | | (.25) | |
Net asset value, end of period | | | | | 11.57 | |
Total Return (%) | | | | | (5.64)c | |
Ratios/Supplemental Data (%): | | | | | | |
Ratio of total expenses
to average net assets | | | | | 2.19d | |
Ratio of net expenses
to average net assets | | | | | .71d | |
Ratio of net investment income
to average net assets | | | | | 3.10d | |
Portfolio Turnover Rate | | | | | 81.07c | |
Net Assets, end of period ($ x 1,000) | | | | | 5,412 | |
a From November 30, 2017 (commencement of operations) to October 31, 2018.
b Based on average shares outstanding.
c Not annualized.
d Annualized.
See notes to financial statements.
23
NOTES TO FINANCIAL STATEMENTS
NOTE 1—Significant Accounting Policies:
Dreyfus Global Multi-Asset Income Fund (the “fund”) is a separate diversified series of Advantage Funds, Inc. (the “Company”), which is registered under the Investment Company Act of 1940, as amended (the “Act”), as an open-end management investment company and operates as a series company currently offering ten series, including the fund. The fund had no operations until November 30, 2017 (commencement of operations), other than matters relating to its organization and registration under the Act. The fund’s investment objective is to seek total return (consisting of capital appreciation and income). The Dreyfus Corporation (the “Manager” or “Dreyfus”), a wholly-owned subsidiary of The Bank of New York Mellon Corporation (“BNY Mellon”), serves as the fund’s investment adviser. Newton Investment Management (North America) Limited (“Newton”), a wholly-owned subsidiary of BNY Mellon and an affiliate of Dreyfus, serves as the fund’s sub-investment adviser.
MBSC Securities Corporation (the “Distributor”), a wholly-owned subsidiary of Dreyfus, is the distributor of the fund’s shares. The fund is authorized to issue 100 million shares of $.001 par value Common Stock in each of the following classes of shares: Class A, Class C, Class I and Class Y. Class A shares generally are subject to a sales charge imposed at the time of purchase. Class C shares are subject to a contingent deferred sales charge (“CDSC”) imposed on Class C shares redeemed within one year of purchase. Class C shares automatically convert to Class A shares ten years after the date of purchase, without the imposition of a sales charge. Class I and Class Y shares are sold at net asset value per share generally to institutional investors. Other differences between the classes include the services offered to and the expenses borne by each class, the allocation of certain transfer agency costs, and certain voting rights. Income, expenses (other than expenses attributable to a specific class), and realized and unrealized gains or losses on investments are allocated to each class of shares based on its relative net assets.
As of October 31, 2018, MBC Investments Corp., an indirect subsidiary of BNY Mellon, held all of the outstanding Class A, Class C, Class I and Class Y shares of the fund.
The Company accounts separately for the assets, liabilities and operations of each series. Expenses directly attributable to each series are charged to that series’ operations; expenses which are applicable to all series are allocated among them on a pro rata basis.
24
The Financial Accounting Standards Board (“FASB”) Accounting Standards Codification (“ASC”) is the exclusive reference of authoritative U.S. generally accepted accounting principles (“GAAP”) recognized by the FASB to be applied by nongovernmental entities. Rules and interpretive releases of the Securities and Exchange Commission (“SEC”) under authority of federal laws are also sources of authoritative GAAP for SEC registrants. The fund’s financial statements are prepared in accordance with GAAP, which may require the use of management estimates and assumptions. Actual results could differ from those estimates.
The Company enters into contracts that contain a variety of indemnifications. The fund’s maximum exposure under these arrangements is unknown. The fund does not anticipate recognizing any loss related to these arrangements.
(a) Portfolio valuation: The fair value of a financial instrument is the amount that would be received to sell an asset or paid to transfer a liability in an orderly transaction between market participants at the measurement date (i.e., the exit price). GAAP establishes a fair value hierarchy that prioritizes the inputs of valuation techniques used to measure fair value. This hierarchy gives the highest priority to unadjusted quoted prices in active markets for identical assets or liabilities (Level 1 measurements) and the lowest priority to unobservable inputs (Level 3 measurements).
Additionally, GAAP provides guidance on determining whether the volume and activity in a market has decreased significantly and whether such a decrease in activity results in transactions that are not orderly. GAAP requires enhanced disclosures around valuation inputs and techniques used during annual and interim periods.
Various inputs are used in determining the value of the fund’s investments relating to fair value measurements. These inputs are summarized in the three broad levels listed below:
Level 1—unadjusted quoted prices in active markets for identical investments.
Level 2—other significant observable inputs (including quoted prices for similar investments, interest rates, prepayment speeds, credit risk, etc.).
Level 3—significant unobservable inputs (including the fund’s own assumptions in determining the fair value of investments).
The inputs or methodology used for valuing securities are not necessarily an indication of the risk associated with investing in those securities.
25
NOTES TO FINANCIAL STATEMENTS (continued)
Changes in valuation techniques may result in transfers in or out of an assigned level within the disclosure hierarchy. Valuation techniques used to value the fund’s investments are as follows:
Investments in debt securities, excluding short-term investments (other than U.S. Treasury Bills), and forward foreign currency exchange contracts (“forward contracts”) are valued each business day by an independent pricing service (the “Service”) approved by the Company’s Board of Directors (the “Board”). Investments for which quoted bid prices are readily available and are representative of the bid side of the market in the judgment of the Service are valued at the mean between the quoted bid prices (as obtained by the Service from dealers in such securities) and asked prices (as calculated by the Service based upon its evaluation of the market for such securities). Other investments are valued as determined by the Service, based on methods which include consideration of the following: yields or prices of securities of comparable quality, coupon, maturity and type; indications as to values from dealers; and general market conditions. These securities are generally categorized within Level 2 of the fair value hierarchy.
Investments in equity securities are valued at the last sales price on the securities exchange or national securities market on which such securities are primarily traded. Securities listed on the National Market System for which market quotations are available are valued at the official closing price or, if there is no official closing price that day, at the last sales price. For open short positions, asked prices are used for valuation purposes. Bid price is used when no asked price is available. Registered investment companies that are not traded on an exchange are valued at their net asset value. All of the preceding securities are generally categorized within Level 1 of the fair value hierarchy.
Securities not listed on an exchange or the national securities market, or securities for which there were no transactions, are valued at the average of the most recent bid and asked prices. U.S. Treasury Bills are valued at the mean price between quoted bid prices and asked prices by the Service approved by the Board. These securities are generally categorized within Level 2 of the fair value hierarchy.
The Service is engaged under the general supervision of the Board.
Fair valuing of securities may be determined with the assistance of a pricing service using calculations based on indices of domestic securities and other appropriate indicators, such as prices of relevant ADRs and futures. Utilizing these techniques may result in transfers between Level 1 and Level 2 of the fair value hierarchy.
26
When market quotations or official closing prices are not readily available, or are determined not to accurately reflect fair value, such as when the value of a security has been significantly affected by events after the close of the exchange or market on which the security is principally traded (for example, a foreign exchange or market), but before the fund calculates its net asset value, the fund may value these investments at fair value as determined in accordance with the procedures approved by the Board. Certain factors may be considered when fair valuing investments such as: fundamental analytical data, the nature and duration of restrictions on disposition, an evaluation of the forces that influence the market in which the securities are purchased and sold, and public trading in similar securities of the issuer or comparable issuers. These securities are either categorized within Level 2 or 3 of the fair value hierarchy depending on the relevant inputs used.
For restricted securities where observable inputs are limited, assumptions about market activity and risk are used and such securities are generally categorized within Level 3 of the fair value hierarchy.
Investments denominated in foreign currencies are translated to U.S. dollars at the prevailing rates of exchange.
Forward contracts are valued at the forward rate and are generally categorized within Level 2 of the fair value hierarchy.
The following is a summary of the inputs used as of October 31, 2018 in valuing the fund’s investments:
| | | | | | |
| | Level 1 - Unadjusted Quoted Prices | Level 2 - Other Significant Observable Inputs | Level 3 -Significant Unobservable Inputs | Total |
Assets ($) | | | |
Investments in Securities: | | | |
Corporate Bonds | - | 804,668 | - | 804,668 |
Convertible Bonds | - | 387,355 | - | 387,355 |
Equity Securities –Common
Stocks | 1,843,293 | 5,584,339† | - | 7,427,632 |
Equity Securities –Preferred
Stocks | - | 259,025† | - | 259,025 |
Foreign Government | - | 1,122,856 | - | 1,122,856 |
Investment Companies | - | 1,106,331† | - | 1,106,331 |
U.S. Treasury | - | 530,173 | - | 530,173 |
Other Financial Instruments: | | | |
Forward Foreign Currency
Exchange Contracts†† | - | 79,318 | - | 79,318 |
27
NOTES TO FINANCIAL STATEMENTS (continued)
| | | | | |
| | Level 1 - Unadjusted Quoted Prices | Level 2 - Other Significant Observable Inputs | Level 3 -Significant Unobservable Inputs | Total |
Liabilitiess ($) | | | |
Other Financial Instruments: | | | |
Forward Foreign Currency
Exchange Contracts†† | - | (16,271) | - | (16,271) |
† Securities classified within Level 2 at period end as the values were determined pursuant to the fund’s fair valuation procedures.
†† Amount shown represents unrealized appreciation (depreciation) at period end.
At October 31, 2018, the amount of securities transferred between levels equals fair value of exchange traded equity securities reported as Level 2 in the table above. It is the fund’s policy to recognize transfers between levels at the end of the reporting period.
(b) Foreign currency transactions: The fund does not isolate that portion of the results of operations resulting from changes in foreign exchange rates on investments from the fluctuations arising from changes in the market prices of securities held. Such fluctuations are included with the net realized and unrealized gain or loss on investments.
Net realized foreign exchange gains or losses arise from sales of foreign currencies, currency gains or losses realized on securities transactions between trade and settlement date, and the difference between the amounts of dividends, interest and foreign withholding taxes recorded on the fund’s books and the U.S. dollar equivalent of the amounts actually received or paid. Net unrealized foreign exchange gains and losses arise from changes in the value of assets and liabilities other than investments resulting from changes in exchange rates. Foreign currency gains and losses on foreign currency transactions are also included with net realized and unrealized gain or loss on investments.
(c) Securities transactions and investment income: Securities transactions are recorded on a trade date basis. Realized gains and losses from securities transactions are recorded on the identified cost basis. Dividend income is recognized on the ex-dividend date and interest income, including, where applicable, accretion of discount and amortization of premium on investments, is recognized on the accrual basis.
(d) Affiliated issuers: Investments in other investment companies advised by Dreyfus are considered “affiliated” under the Act.
28
(e) Risk: Investing in foreign markets may involve special risks and considerations not typically associated with investing in the U.S. These risks include revaluation of currencies, high rates of inflation, repatriation restrictions on income and capital, and adverse political and economic developments. Moreover, securities issued in these markets may be less liquid, subject to government ownership controls and delayed settlements, and their prices may be more volatile than those of comparable securities in the U.S.
(f) Dividends and distributions to shareholders: Dividends and distributions are recorded on the ex-dividend date. Dividends from investment income-net are normally declared and paid on a monthly basis. Dividends from net realized capital gains, if any, are normally declared and paid annually, but the fund may make distributions on a more frequent basis to comply with the distribution requirements of the Internal Revenue Code of 1986, as amended (the “Code”). To the extent that net realized capital gains can be offset by capital loss carryovers, it is the policy of the fund not to distribute such gains. Income and capital gain distributions are determined in accordance with income tax regulations, which may differ from GAAP.
(g) Federal income taxes: It is the policy of the fund to continue to qualify as a regulated investment company, if such qualification is in the best interests of its shareholders, by complying with the applicable provisions of the Code, and to make distributions of taxable income and net realized capital gain sufficient to relieve it from substantially all federal income and excise taxes.
As of and during the period ended October 31, 2018, the fund did not have any liabilities for any uncertain tax positions. The fund recognizes interest and penalties, if any, related to uncertain tax positions as income tax expense in the Statement of Operations. During the period ended October 31, 2018, the fund did not incur any interest or penalties.
The tax year in the period ended October 31, 2018 remains subject to examination by the Internal Revenue Service and state taxing authorities.
At October 31, 2018, the components of accumulated earnings on a tax basis were as follows: undistributed ordinary income $170,106, accumulated capital losses $166,069 and unrealized depreciation $1,244,541.
The tax character of distributions paid to shareholders during the fiscal period ended October 31, 2018 was as follows: ordinary income $456,948.
29
NOTES TO FINANCIAL STATEMENTS (continued)
During the period ended October 31, 2018, as a result of permanent book to tax differences, primarily due to the tax treatment for foreign currency gains and losses, passive foreign investment companies, consent fees and fund start-up costs, the fund increased total distributable earnings (loss) by $13,199 and decreased paid-in capital by the same amount. Net assets and net asset value per share were not affected by this reclassification.
(h) New Accounting Pronouncements: In March 2017, the FASB issued Accounting Standards Update 2017-08, Receivables—Nonrefundable Fees and Other Costs (Subtopic 310-20): Premium Amortization On Purchased Callable Debt Securities (“ASU 2017-08”). The update shortens the amortization period for the premium on certain purchased callable debt securities to the earliest call date. ASU 2017-08 will be effective for annual periods beginning after December 15, 2018.
Also in August 2018, the FASB issued Accounting Standards Update 2018-13, Fair Value Measurement (Topic 820): Disclosure Framework—Changes to the Disclosure Requirements for Fair Value Measurement (“ASU 2018-13”). The update provides guidance that eliminates, adds and modifies certain disclosure requirements for fair value measurements. ASU 2018-13 will be effective for annual periods beginning after December 15, 2019. Management is currently assessing the potential impact of these changes to future financial statements.
NOTE 2—Bank Lines of Credit:
The fund participates with other Dreyfus-managed funds in an $830 million unsecured credit facility led by Citibank, N.A. and a $300 million unsecured credit facility provided by The Bank of New York Mellon, a subsidiary of BNY Mellon and an affiliate of Dreyfus (each, a “Facility”), each to be utilized primarily for temporary or emergency purposes, including the financing of redemptions. In connection therewith, the fund has agreed to pay its pro rata portion of commitment fees for each Facility. Interest is charged to the fund based on rates determined pursuant to the terms of the respective Facility at the time of borrowing. During the period ended October 31, 2018, the fund did not borrow under the Facilities.
NOTE 3—Management Fee, Sub-Investment Advisory Fee and Other Transactions with Affiliates:
(a) Pursuant to a management agreement with Dreyfus, the management fee is computed at the annual rate of .55% of the value of the fund’s average daily net assets and is payable monthly. Dreyfus has contractually agreed, from November 30, 2017 through December 1, 2018, to waive receipt of its fees and/or assume the direct expenses of the fund, so that the expenses of none of the classes (excluding Rule 12b-1 Distribution
30
Plan fees, Shareholder Services Plan fees, taxes, interest expense, brokerage commissions, commitment fees on borrowings and extraordinary expenses) exceed .70% of the value of the fund’s average daily net assets. The reduction in expenses, pursuant to the undertaking, amounted to $304,782 during the period ended October 31, 2018.
Pursuant to a sub-investment advisory agreement between Dreyfus and Newton, Newton serves as the fund’s sub-investment adviser responsible for the day-to-day management of the fund’s portfolio. Dreyfus pays Newton a monthly fee at an annual percentage of the value of the fund’s average daily net assets. Dreyfus has obtained an exemptive order from the SEC (the “Order”), upon which the fund may rely, to use a manager of managers approach that permits Dreyfus, subject to certain conditions and approval by the Board, to enter into and materially amend sub-investment advisory agreements with one or more sub-investment advisers who are either unaffiliated with Dreyfus or are wholly-owned subsidiaries (as defined under the Act) of Dreyfus’ ultimate parent company, BNY Mellon, without obtaining shareholder approval. The Order also allows the fund to disclose the sub-investment advisory fee paid by Dreyfus to any unaffiliated sub-investment adviser in the aggregate with other unaffiliated sub-investment advisers in documents filed with the SEC and provided to shareholders. In addition, pursuant to the Order, it is not necessary to disclose the sub-investment advisory fee payable by Dreyfus separately to a sub-investment adviser that is a wholly-owned subsidiary of BNY Mellon in documents filed with the SEC and provided to shareholders; such fees are to be aggregated with fees payable to Dreyfus. Dreyfus has ultimate responsibility (subject to oversight by the Board) to supervise any sub-investment adviser and recommend the hiring, termination, and replacement of any sub-investment adviser to the Board.
(b) Under the Distribution Plan adopted pursuant to Rule 12b-1 under the Act, Class C shares pay the Distributor for distributing its shares at an annual rate of .75% of the value of its average daily net assets. During the period ended October 31, 2018, Class C shares were charged $6,873 pursuant to the Distribution Plan.
(c) Under the Shareholder Services Plan, Class A and Class C shares pay the Distributor at an annual rate of .25% of the value of their average daily net assets for the provision of certain services. The services provided may include personal services relating to shareholder accounts, such as answering shareholder inquiries regarding the fund and providing reports and other information, and services related to the maintenance of shareholder accounts. The Distributor may make payments to Service Agents (securities dealers, financial institutions or other industry
31
NOTES TO FINANCIAL STATEMENTS (continued)
professionals) with respect to these services. The Distributor determines the amounts to be paid to Service Agents. During the period ended October 31, 2018, Class A and Class C shares were charged $2,307 and $2,291, respectively, pursuant to the Shareholder Services Plan.
The fund has arrangements with the transfer agent and the custodian whereby the fund may receive earnings credits when positive cash balances are maintained, which are used to offset transfer agency and custody fees. For financial reporting purposes, the fund includes net earnings credits, if any, as an expense offset in the Statement of Operations.
The fund compensates Dreyfus Transfer, Inc., a wholly-owned subsidiary of Dreyfus, under a transfer agency agreement for providing transfer agency and cash management services for the fund. The majority of transfer agency fees are comprised of amounts paid on a per account basis, while cash management fees are related to fund subscriptions and redemptions. During the period ended October 31, 2018, the fund was charged $391 for transfer agency services. These fees are included in Shareholder servicing costs in the Statement of Operations.
The fund compensates The Bank of New York Mellon under a custody agreement for providing custodial services for the fund. These fees are determined based on net assets, geographic region and transaction activity. During the period ended October 31, 2018, the fund was charged $11,106 pursuant to the custody agreement. These fees were partially offset by earnings credits of $38.
During the period ended October 31, 2018, the fund was charged $11,731 for services performed by the Chief Compliance Officer and his staff. These fees are included in Miscellaneous in the Statement of Operations.
The components of “Due from The Dreyfus Corporation and affiliates” in the Statement of Assets and Liabilities consist of: management fees $5,608, Distribution Plan fees $601, Shareholder Services Plan fees $401, custodian fees $5,000, Chief Compliance Officer fees $4,193 and transfer agency fees $158, which are offset against an expense reimbursement currently in effect in the amount of $24,760.
(d) Each Board member also serves as a Board member of other funds within the Dreyfus complex. Annual retainer fees and attendance fees are allocated to each fund based on net assets.
NOTE 4—Securities Transactions:
The aggregate amount of purchases and sales of investment securities, excluding short-term securities and forward contracts, during the period
32
ended October 31, 2018, amounted to $30,311,018 and $17,065,984, respectively.
Derivatives: A derivative is a financial instrument whose performance is derived from the performance of another asset. The fund enters into International Swaps and Derivatives Association, Inc. Master Agreements or similar agreements (collectively, “Master Agreements”) with its OTC derivative contract counterparties in order to, among other things, reduce its credit risk to counterparties. Master Agreements include provisions for general obligations, representations, collateral and events of default or termination. Under a Master Agreement, the fund may offset with the counterparty certain derivative financial instrument’s payables and/or receivables with collateral held and/or posted and create one single net payment in the event of default or termination.
Each type of derivative instrument that was held by the fund during the period ended October 31, 2018 is discussed below.
Forward Foreign Currency Exchange Contracts: The fund enters into forward contracts in order to hedge its exposure to changes in foreign currency exchange rates on its foreign portfolio holdings, to settle foreign currency transactions or as a part of its investment strategy. When executing forward contracts, the fund is obligated to buy or sell a foreign currency at a specified rate on a certain date in the future. With respect to sales of forward contracts, the fund incurs a loss if the value of the contract increases between the date the forward contract is opened and the date the forward contract is closed. The fund realizes a gain if the value of the contract decreases between those dates. With respect to purchases of forward contracts, the fund incurs a loss if the value of the contract decreases between the date the forward contract is opened and the date the forward contract is closed. The fund realizes a gain if the value of the contract increases between those dates. Any realized or unrealized gains or losses which occurred during the period are reflected in the Statement of Operations. The fund is exposed to foreign currency risk as a result of changes in value of underlying financial instruments. The fund is also exposed to credit risk associated with counterparty nonperformance on these forward contracts, which is generally limited to the unrealized gain on each open contract. This risk may be mitigated by Master Agreements, if any, between the fund and the counterparty and the posting of collateral, if any, by the counterparty to the fund to cover the fund’s exposure to the counterparty. Forward contracts open at October 31, 2018 are set forth in the Statement of Forward Foreign Currency Exchange Contracts.
The provisions of ASC Topic 210 “Disclosures about Offsetting Assets and Liabilities” require disclosure on the offsetting of financial assets and
33
NOTES TO FINANCIAL STATEMENTS (continued)
liabilities. These disclosures are required for certain investments, including derivative financial instruments subject to Master Agreements which are eligible for offsetting in the Statement of Assets and Liabilities and require the fund to disclose both gross and net information with respect to such investments. For financial reporting purposes, the fund does not offset derivative assets and derivative liabilities that are subject to Master Agreements in the Statement of Assets and Liabilities.
At October 31, 2018, derivative assets and liabilities (by type) on a gross basis are as follows:
| | | | | | |
Derivative Financial Instruments: | | Assets ($) | | Liabilities ($) | |
Forward contracts | | 79,318 | | (16,271) | |
Total gross amount of derivative | | | | | |
assets and liabilities in the | | | | | |
Statement of Assets and Liabilities | | 79,318 | | (16,271) | |
Derivatives not subject to | | | | | |
Master Agreements | | - | | - | |
Total gross amount of assets | | | | | |
and liabilities subject to | | | | | |
Master Agreements | | 79,318 | | (16,271) | |
The following tables present derivative assets and liabilities net of amounts available for offsetting under Master Agreements and net of related collateral received or pledged, if any, as of October 31, 2018:
| | | | | | | |
| | | | Financial | | | |
| | | | Instruments | | | |
| | | | and Derivatives | | | |
| | Gross Amount of | | Available | Collateral | | Net Amount of |
Counterparty | Assets ($) | 1 | for Offset ($) | Received ($) | | Assets ($) |
State Street Bank
and Trust Company | 79,318 | | (16,271) | - | | 63,047 |
Total | 79,318 | | (16,271) | - | | 63,047 |
| | | | | | | |
| | | | Financial | | | |
| | | | Instruments | | | |
| | | | and Derivatives | | | |
| | Gross Amount of | | Available | Collateral | | Net Amount of |
Counterparty | Liabilities ($) | 1 | for Offset ($) | Pledged ($) | | Liabilities ($) |
State Street Bank
and Trust Company | (16,271) | | 16,271 | - | | - |
Total | (16,271) | | 16,271 | - | | - |
| | | | | | | |
1 Absent a default event or early termination, OTC derivative assets and liabilities are presented at gross amounts
and are not offset in the Statement of Assets and Liabilities. |
34
The following summarizes the average market value of derivatives outstanding during the period ended October 31, 2018:
| | | |
| | Average Market Value ($) |
Forward contracts | | 2,843,902 |
| | | |
At October 31, 2018, the cost of investments for federal income tax purposes was $12,880,754; accordingly, accumulated net unrealized depreciation on investments inclusive of derivative contracts was $1,242,714, consisting of $191,158 gross unrealized appreciation and $1,433,872 gross unrealized depreciation.
35
REPORT OF INDEPENDENT REGISTERED PUBLIC ACCOUNTING FIRM
To the Shareholders and the Board of Directors of Dreyfus Global Multi-Asset Income Fund
Opinion on the Financial Statements
We have audited the accompanying statement of assets and liabilities of Dreyfus Global Multi-Asset Income Fund (the “Fund”) (one of the funds constituting Advantage Funds, Inc.), including the statement of investments, investments in affiliated issuers and forward foreign currency exchange contracts, as of October 31, 2018, and the related statements of operations and changes in net assets for the period from November 30, 2017 (commencement of operations) through October 31, 2018, the financial highlights for the period from November 30, 2017 (commencement of operations) through October 31, 2018 and the related notes (collectively referred to as the “financial statements”). In our opinion, the financial statements present fairly, in all material respects, the financial position of the Fund (one of the funds constituting Advantage Funds, Inc.) at October 31, 2018, the results of its operations, the changes in its net assets and its financial highlights for the period from November 30, 2017 (commencement of operations) through October 31, 2018, in conformity with U.S. generally accepted accounting principles.
Basis for Opinion
These financial statements are the responsibility of the Fund’s management. Our responsibility is to express an opinion on the Fund’s financial statements based on our audits. We are a public accounting firm registered with the Public Company Accounting Oversight Board (United States) (“PCAOB”) and are required to be independent with respect to the Fund in accordance with the U.S. federal securities laws and the applicable rules and regulations of the Securities and Exchange Commission and the PCAOB.
We conducted our audit in accordance with the standards of the PCAOB. Those standards require that we plan and perform the audit to obtain reasonable assurance about whether the financial statements are free of material misstatement, whether due to error or fraud. The Fund is not required to have, nor were we engaged to perform, an audit of the Fund’s internal control over financial reporting. As part of our audit, we are required to obtain an understanding of internal control over financial reporting, but not for the purpose of expressing an opinion on the effectiveness of the Fund’s internal control over financial reporting. Accordingly, we express no such opinion.
Our audit included performing procedures to assess the risks of material misstatement of the financial statements, whether due to error or fraud, and performing procedures that respond to those risks. Such procedures included examining, on a test basis, evidence regarding the amounts and disclosures in the financial statements. Our procedures included confirmation of securities owned as of October 31, 2018, by correspondence with the custodian and others or by other appropriate auditing procedures where replies from others were not received. Our audit also included evaluating the accounting principles used and significant estimates made by management, as well as evaluating the overall presentation of the financial statements. We believe that our audit provides a reasonable basis for our opinion.

We have served as the auditor of one or more Dreyfus investment companies since at least 1957, but we are unable to determine the specific year.
New York, New York
December 28, 2018
36
IMPORTANT TAX INFORMATION (Unaudited)
In accordance with federal tax law, the fund elects to provide each shareholder with their portion of the fund’s foreign taxes paid and the income sourced from foreign countries. Accordingly, the fund hereby reports the following information regarding its fiscal year ended October 31, 2018:
- the total amount of taxes paid to foreign countries was $25,861
- the total amount of income sourced from foreign countries was $623,495.
Where required by federal tax law rules, shareholders will receive notification of their proportionate share of foreign taxes paid and foreign sourced income for the 2018 calendar year with Form 1099-DIV which will be mailed in early 2019.
For the fiscal year ended October 31, 2018, certain dividends paid by the fund may be subject to a maximum tax rate of 15%, as provided for by the Jobs and Growth Tax Relief Reconciliation Act of 2003. Of the distributions paid during the fiscal year, $343,754 represents the maximum amount that may be considered qualified dividend income.
37
BOARD MEMBERS INFORMATION (Unaudited)
INDEPENDENT BOARD MEMBERS
Joseph S. DiMartino (75)
Chairman of the Board (1995)
Principal Occupation During Past 5 Years:
· Corporate Director and Trustee (1995-present)
Other Public Company Board Memberships During Past 5 Years:
· CBIZ (formerly, Century Business Services, Inc.), a provider of outsourcing functions for small and medium size companies, Director (1997-present)
No. of Portfolios for which Board Member Serves: 124
———————
Peggy C. Davis (75)
Board Member (2006)
Principal Occupation During Past 5 Years:
· Shad Professor of Law, New York University School of Law (1983-present)
No. of Portfolios for which Board Member Serves: 45
———————
David P. Feldman (78)
Board Member (1996)
Principal Occupation During Past 5 Years:
· Corporate Director and Trustee (1985-present)
Other Public Company Board Memberships During Past 5 Years:
· BBH Mutual Funds Group (5 registered mutual funds), Director (1992-2014)
No. of Portfolios for which Board Member Serves: 31
———————
Joan Gulley (71)
Board Member (2017)
Principal Occupation During Past 5 Years:
· PNC Financial Services Group, Inc.(1993-2014), Executive Vice President and Chief Human Resources Officer and Executive Committee Member (2008-2014)
No. of Portfolios for which Board Member Serves: 52
———————
38
Ehud Houminer (78)
Board Member (1993)
Principal Occupation During Past 5 Years:
· Board of Overseers at the Columbia Business School, Columbia University (1992-present)
· Trustee, Ben Gurion University
No. of Portfolios for which Board Member Serves: 52
———————
Lynn Martin (78)
Board Member (2012)
Principal Occupation During Past 5 Years:
· President of The Martin Hall Group LLC, a human resources consulting firm (2005-2012)
No. of Portfolios for which Board Member Serves: 31
———————
Robin A. Melvin (55)
Board Member (2012)
Principal Occupation During Past 5 Years:
· Co-chairman, Illinois Mentoring Partnership, non-profit organization dedicated to increasing the quantity and quality of mentoring services in Illinois; (2014-present; board member since 2013)
No. of Portfolios for which Board Member Serves: 99
———————
Dr. Martin Peretz (79)
Board Member (2006)
Principal Occupation During Past 5 Years:
· Editor-in-Chief Emeritus of The New Republic Magazine (2011-2012) (previously,
Editor-in-Chief, 1974-2011)
· Lecturer at Harvard University (1968-2010)
No. of Portfolios for which Board Member Serves: 31
———————
Once elected all Board Members serve for an indefinite term, but achieve Emeritus status upon reaching age 80. The address of the Board Members and Officers is c/o The Dreyfus Corporation, 200 Park Avenue, New York, New York 10166. Additional information about the Board Members is available in the fund’s Statement of Additional Information which can be obtained from Dreyfus free of charge by calling this toll free number: 1-800-DREYFUS.
James F. Henry, Emeritus Board Member
Philip L. Toia, Emeritus Board Member
39
OFFICERS OF THE FUND (Unaudited)
BRADLEY J. SKAPYAK, President since January 2010.
Chief Operating Officer and a director of the Manager since June 2009, Chairman of Dreyfus Transfer, Inc., an affiliate of the Manager and the transfer agent of the funds, since May 2011 and Chief Executive Officer of MBSC Securities Corporation since August 2016. He is an officer of 62 investment companies (comprised of 124 portfolios) managed by the Manager. He is 59 years old and has been an employee of the Manager since February 1988.
BENNETT A. MACDOUGALL, Chief Legal Officer since October 2015.
Chief Legal Officer of the Manager and Associate General Counsel and Managing Director of BNY Mellon since June 2015; from June 2005 to June 2015, he served in various capacities with Deutsche Bank – Asset & Wealth Management Division, including as Director and Associate General Counsel, and Chief Legal Officer of Deutsche Investment Management Americas Inc. from June 2012 to May 2015. He is an officer of 63 investment companies (comprised of 149 portfolios) managed by the Manager. He is 47 years old and has been an employee of the Manager since June 2015.
JAMES BITETTO, Vice President since August 2005 and Secretary since February 2018.
Managing Counsel of BNY Mellon and Secretary of the Manager, and an officer of 63 investment companies (comprised of 149 portfolios) managed by the Manager. He is 52 years old and has been an employee of the Manager since December 1996.
JOSEPH M. CHIOFFI, Vice President and Assistant Secretary since August 2005.
Managing Counsel of BNY Mellon, and an officer of 63 investment companies (comprised of 149 portfolios) managed by the Manager. He is 56 years old and has been an employee of the Manager since June 2000.
SONALEE CROSS, Vice President and Assistant Secretary since March 2018.
Counsel of BNY Mellon since October 2016; Associate at Proskauer Rose LLP from April 2016 to September 2016; Attorney at EnTrust Capital from August 2015 to February 2016; Associate at Sidley Austin LLP from September 2013 until August 2015. She is an officer of 63 investment companies (comprised of 149 portfolios) managed by Dreyfus. She is 31 years old and has been an employee of the Manager since October 2016.
MAUREEN E. KANE, Vice President and Assistant Secretary since April 2015.
Managing Counsel of BNY Mellon since July 2014; from October 2004 until July 2014, General Counsel, and from May 2009 until July 2014, Chief Compliance Officer of Century Capital Management. She is an officer of 63 investment companies (comprised of 149 portfolios) managed by the Manager. She is 56 years old and has been an employee of the Manager since July 2014.
SARAH S. KELLEHER, Vice President and Assistant Secretary since April 2014.
Managing Counsel of BNY Mellon since December 2017, from March 2013 to December 2017, Senior Counsel of BNY Mellon. She is an officer of 63 investment companies (comprised of 149 portfolios) managed by the Manager. She is 43 years old and has been an employee of the Manager since March 2013.
JEFF PRUSNOFSKY, Vice President and Assistant Secretary since August 2005.
Senior Managing Counsel of BNY Mellon, and an officer of 63 investment companies (comprised of 149 portfolios) managed by the Manager. He is 53 years old and has been an employee of the Manager since October 1990.
NATALYA ZELENSKY, Vice President and Assistant Secretary since March 2017.
Counsel of BNY Mellon since May 2016; Attorney at Wildermuth Endowment Strategy Fund/Wildermuth Advisory, LLC from November 2015 until May 2016; Assistant General Counsel at RCS Advisory Services from July 2014 until November 2015; Associate at Sutherland, Asbill & Brennan from January 2013 until January 2014. She is an officer of 63 investment companies (comprised of 149 portfolios) managed by Dreyfus. She is 33 years old and has been an employee of the Manager since May 2016.
JAMES WINDELS, Treasurer since November 2001.
Director – Mutual Fund Accounting of the Manager, and an officer of 63 investment companies (comprised of 149 portfolios) managed by the Manager. He is 60 years old and has been an employee of the Manager since April 1985.
40
GAVIN C. REILLY, Assistant Treasurer since December 2005.
Tax Manager of the Investment Accounting and Support Department of the Manager, and an officer of 63 investment companies (comprised of 149 portfolios) managed by the Manager. He is 50 years old and has been an employee of the Manager since April 1991.
ROBERT S. ROBOL, Assistant Treasurer since December 2005.
Senior Accounting Manager – Dreyfus Financial Reporting of the Manager, and an officer of 63 investment companies (comprised of 149 portfolios) managed by the Manager. He is 54 years old and has been an employee of the Manager since October 1988.
ROBERT SALVIOLO, Assistant Treasurer since July 2007.
Senior Accounting Manager – Equity Funds of the Manager, and an officer of 63 investment companies (comprised of 149 portfolios) managed by the Manager. He is 51 years old and has been an employee of the Manager since June 1989.
ROBERT SVAGNA, Assistant Treasurer since December 2002.
Senior Accounting Manager – Fixed Income and Equity Funds of the Manager, and an officer of 63 investment companies (comprised of 149 portfolios) managed by the Manager. He is 51 years old and has been an employee of the Manager since November 1990.
JOSEPH W. CONNOLLY, Chief Compliance Officer since October 2004.
Chief Compliance Officer of the Manager, the Dreyfus Family of Funds and BNY Mellon Funds Trust (63 investment companies, comprised of 149 portfolios). He is 61 years old and has served in various capacities with the Manager since 1980, including manager of the firm’s Fund Accounting Department from 1997 through October 2001.
CARIDAD M. CAROSELLA, Anti-Money Laundering Compliance Officer since January 2016.
Anti-Money Laundering Compliance Officer of the Dreyfus Family of Funds and BNY Mellon Funds Trust since January 2016; from May 2015 to December 2015, Interim Anti-Money Laundering Compliance Officer of the Dreyfus Family of Funds and BNY Mellon Funds Trust and the Distributor; from January 2012 to May 2015, AML Surveillance Officer of the Distributor and from 2007 to December 2011, Financial Processing Manager of the Distributor. She is an officer of 57 investment companies (comprised of 143 portfolios) managed by the Manager. She is 50 years old and has been an employee of the Distributor since 1997.
41
Dreyfus Global Multi-Asset Income Fund
200 Park Avenue
New York, NY 10166
Manager
The Dreyfus Corporation
200 Park Avenue
New York, NY 10166
Sub-Investment Adviser
Newton Investment Management
(North America) Limited
160 Queen Victoria Street
London, EC4V, 4LA, UK
Custodian
The Bank of New York Mellon
240 Greenwich Street
New York, NY 10286
Transfer Agent &
Dividend Disbursing Agent
Dreyfus Transfer, Inc.
200 Park Avenue
New York, NY 10166
Distributor
MBSC Securities Corporation
200 Park Avenue
New York, NY 10166
| | |
Ticker Symbols: | Class A: DRAAX Class C: DRACX Class I: DRAIX Class Y: DRAYX |
Telephone Call your financial representative or 1-800-DREYFUS
Mail The Dreyfus Family of Funds, 144 Glenn Curtiss Boulevard, Uniondale, NY 11556-0144
E-mail Send your request to info@dreyfus.com
Internet Information can be viewed online or downloaded at www.dreyfus.com
The fund files its complete schedule of portfolio holdings with the Securities and Exchange Commission (“SEC”) for the first and third quarters of each fiscal year on Form N-Q. The fund’s Forms N-Q are available on the SEC’s website at www.sec.gov.
A description of the policies and procedures that the fund uses to determine how to vote proxies relating to portfolio securities and information regarding how the fund voted these proxies for the most recent 12-month period ended June 30 is available at www.dreyfus.com and on the SEC’s website at www.sec.gov and without charge, upon request, by calling 1-800-DREYFUS.
| | |
© 2018 MBSC Securities Corporation
4120AR1018 | 
|
Dreyfus Global Dynamic Bond Income Fund
| | | |

| | ANNUAL REPORT October 31, 2018 |
| |
Save time. Save paper. View your next shareholder report online as soon as it’s available. Log into www.dreyfus.com and sign up for Dreyfus eCommunications. It’s simple and only takes a few minutes. |
| |
The views expressed in this report reflect those of the portfolio manager(s) only through the end of the period covered and do not necessarily represent the views of Dreyfus or any other person in the Dreyfus organization. Any such views are subject to change at any time based upon market or other conditions and Dreyfus disclaims any responsibility to update such views. These views may not be relied on as investment advice and, because investment decisions for a Dreyfus fund are based on numerous factors, may not be relied on as an indication of trading intent on behalf of any Dreyfus fund. |
| |
Not FDIC-Insured • Not Bank-Guaranteed • May Lose Value |
Contents
THE FUND
FOR MORE INFORMATION
Back Cover
| | | | |
| |
Dreyfus Global Dynamic Bond Income Fund
| | The Fund |
A LETTER FROM THE PRESIDENT OF DREYFUS
Dear Shareholder:
We are pleased to present this annual report for Dreyfus Global Dynamic Bond Income Fund, covering the 12-month period from November 1, 2017 through October 31, 2018. For information about how the fund performed during the reporting period, as well as general market perspectives, we provide a Discussion of Fund Performance on the pages that follow.
Markets began the reporting period on solid footing as major global economies experienced above-trend growth across the board. In the United States, the Federal Reserve continued to move away from its accommodative monetary policy while other major central banks also began to consider monetary tightening. In the equity markets, both U.S. and non-U.S. markets enjoyed an upward trend, though investor concerns about volatility and inflation later began to weigh on returns. Interest rates rose across the curve, putting pressure on bond prices.
Later in the reporting period, global growth trends began to diverge. While a strong economic performance continued to bolster U.S. equity markets, slower growth and political concerns pressured markets in the Eurozone. Emerging markets also came under pressure as weakness in their currencies added to investors’ uneasiness. Fixed income markets continued to struggle as interest rates rose; the yield on the benchmark 10-year Treasury bond surged late in the reporting period, but growing investor concerns about global growth helped keep it from rising further.
Despite continuing doubts regarding trade, U.S. inflationary pressures, and global growth, we are optimistic that the U.S. economy will remain strong in the near term. However, we will stay attentive to signs that signal potential changes on the horizon. As always, we encourage you to discuss the risks and opportunities of today’s investment environment with your financial advisor.
Thank you for your continued confidence and support.
Sincerely,

Renee Laroche-Morris
President
The Dreyfus Corporation
November 15, 2018
2
DISCUSSION OF FUND PERFORMANCE (Unaudited)
For the period from November 1, 2017 through October 31, 2018, as provided by portfolio managers Paul Brain, Howard Cunningham, and Parmeshwar Chadha, of Newton Investment Management (North America) Limited, Sub-Investment Adviser
Market and Fund Performance Overview
For the 12-month period ended October 31, 2018, Dreyfus Global Dynamic Bond Income Fund’s Class A shares produced a total return of 0.08%, Class C shares returned -0.64%, Class I shares returned 0.38%, and Class Y shares returned 0.30%.1 In comparison, the fund’s benchmark, the FTSE One-Month U.S. Treasury Bill Index (the “Index”), produced a total return of 1.62% for the same period.2
Global bond markets encountered heightened volatility during the reporting period, stemming from rising interest rates and less accommodative monetary policies from some major central banks. The fund underperformed the Index, partly due to its exposure to longer-term sovereign bonds from emerging markets.
On July 31, 2018, the Citi One-Month U.S. Treasury Bill Index was renamed FTSE One-Month U.S. Treasury Bill Index.
The Fund’s Investment Approach
The fund seeks total return (consisting of income and capital appreciation). To pursue its goal, the fund normally invests at least 80% of its net assets, plus any borrowings for investment purposes, in bonds and other instruments that provide investment exposure to global bond markets. The fund normally invests opportunistically in bonds and derivatives and other instruments that provide investment exposure to global bond and currency markets in seeking to produce absolute or real returns across economic cycles. The fund’s investments will be focused globally among the developed and emerging capital markets of the world. The fund ordinarily invests in at least three countries, and, at times, may invest a substantial portion of its assets in a single country.
The fund’s portfolio managers employ a dynamic, unconstrained approach in allocating the fund’s assets globally, principally among government bonds, emerging-market sovereign debt, investment grade and high yield corporate instruments, and currencies. The fund’s portfolio managers combine a top-down approach, emphasizing economic trends and current investment themes on a global basis, with bottom-up security selection based on fundamental research to allocate the fund’s investments among and within asset classes. In choosing investments, the portfolio managers consider: key trends in global economic variables, such as gross domestic product, inflation, and interest rates; investment themes, such as changing demographics, the impact of new technologies, and the globalization of industries and brands; relative valuations of equity securities, bonds and cash; long-term trends in currency movements; and company fundamentals.
Interest-Rate Volatility, Growth Disparities, and a Strong Dollar Drive Markets
In general, bond market performance was modestly negative during the reporting period. In late 2017, the U.S. Federal Reserve (The “Fed”) began to unwind its balance sheet by selling mortgage-backed securities. It also began down a path of well-projected and predictable 25-
3
DISCUSSION OF FUND PERFORMANCE (Unaudited) (continued)
basis-point interest rate hikes. Longer-term rates also rose during this time. The Eurozone and Japan were reporting positive economic advances and discussing winding down their stimulus programs. U.S. corporate and emerging-market debt outperformed. The globe was still in its period of synchronized, strong growth.
A shift occurred in February of 2018. U.S. inflationary pressures began to mount, and while the U.S. economy continued to strengthen, other developed countries started to slow. Corporates and emerging-market debt gave up much of their earlier returns. The volatility sparked concern, triggering a flight to quality, which reduced rates on long-term U.S. Treasuries. However, the concern was short-lived and “risk-on” asset classes, such as corporate, high yield debt, recovered and outperformed significantly during the second half of the reporting period. At the end of the 12 months, investment-grade, corporate debt lagged Treasuries. Emerging-market debt did not rebound after the February volatility and continued to deteriorate throughout the period, spurred on by a strengthening U.S. dollar, concerns over trade disputes, and financial upheaval in Turkey and Argentina. Concerns around Brexit, Italy, and U.S. midterm elections put downward pressure on global bond prices, despite strong corporate earnings and reasonable growth.
Emerging-Market Exposure Hurt Relative Performance
In the first few months of the reporting period, the lower-rated corporate bonds and higher yield issues generally outperformed, with spreads tightening over the period. Debt instruments issued by emerging-market governments and corporate bonds were also strong, on the back of improving economic momentum. However, the favorable environment changed during 2018. Bond market weakness affected performance, although the fund’s focus on shorter-maturity, shorter-duration bonds served to lessen its effect. A spike in volatility in February also impacted the Fund’s high yield bond exposure. Certain investment-grade, corporate bonds delivered positive returns.
Local currency, emerging-market government bonds weighed on performance, as yields rose and currencies came under pressure. Ecuador and Brazil’s hard currency, emerging-market bonds also incurred losses as spreads widened. The fund also realized a small loss on selling Russian government bonds in April, fearing further sanctions after the poisoning incident in Salisbury, England. Government bonds ultimately made a negative contribution.
In terms of activity, the fund participated in a variety of new, corporate bond issues. New corporate issue participation included asset manager Investec, Brazil-based utility company Light Servicos De Electricidade, and Italy-based technology firm Nexi Capital.
Among major sales, the manager disposed of AA (British motoring association) subordinated debt, after a profit warning.
Longer-dated, emerging-market exposure, such as Mexico, Brazil, and Peru, was reduced, while holdings in Russia were sold. In terms of currency, Mexican peso exposure was reduced amid rising NAFTA risks, while profits were taken on the fund’s Malaysian ringgit position over the period.
A More Cautious Investment Posture
We believe divergence in "core" market interest rates is likely to continue, with subdued inflation offering relative support to bond prices in Europe and Japan, while fiscal and
4
monetary policy dynamics in the U.S. should ensure Treasuries remain under pressure. That said, all central banks are not moving at the same pace, or even in the same hawkish direction, and we believe this divergence should continue to create opportunities in selected geographies such as Australia. We remain cautious on credit markets, as we believe this current, elongated credit cycle might finally be turning.
Given this environment, our credit exposure remains conservative, with investment-grade, credit exposure biased towards short-duration and floating-rate note positions, limiting the vulnerability to tight spreads and rising interest rates. Widening rate differentials between the U.S. and other developed markets, coupled with near-term macroeconomic risks, including trade tensions between the U.S. and China, warrant a continued U.S.-dollar bias for the time being.
November 15, 2018
1 Total return includes reinvestment of dividends and any capital gains paid and does not take into consideration the maximum initial sales charge in the case of Class A shares or the applicable contingent deferred sales charge imposed on redemptions in the case of Class C shares. Had these charges been reflected, returns would have been lower. Class I and Class Y shares are not subject to any initial or deferred sales charge. Past performance is no guarantee of future results. Share price and investment return fluctuate such that upon redemption, fund shares may be worth more or less than their original cost. Return figures reflect the absorption of certain fund expenses by The Dreyfus Corporation pursuant to an agreement in effect through March 1, 2019, at which time it may be extended, terminated, or modified. Had these expenses not been absorbed, the returns would have been lower.
2 Source: Lipper Inc. — The FTSE One-Month U.S. Treasury Bill Index consists of the last one-month Treasury bill month-end rates. The FTSE One-Month U.S. Treasury Bill Index measures return equivalents of yield averages. The instruments are not marked to market. Investors cannot invest directly in any index.
Bonds are subject generally to interest-rate, credit, liquidity, and market risks, to varying degrees, all of which are more fully described in the fund’s prospectus. Generally, all other factors being equal, bond prices are inversely related to interest-rate changes, and rate increases can cause price declines.
High yield bonds are subject to increased credit risk and are considered speculative in terms of the issuer’s perceived ability to continue making interest payments on a timely basis and to repay principal upon maturity.
Foreign bonds are subject to special risks, including exposure to currency fluctuations, changing political and economic conditions, and potentially less liquidity.
Investments in foreign currencies are subject to the risk that those currencies will decline in value relative to the U.S. dollar, or, in the case of hedged positions, that the U.S. dollar will decline relative to the currency being hedged. Currency rates in foreign countries may fluctuate significantly over short periods of time. A decline in the value of foreign currencies relative to the U.S. dollar will reduce the value of securities held by the fund and denominated in those currencies. The use of leverage may magnify the fund’s gains or losses. For derivatives with a leveraging component, adverse changes in the value or level of the underlying asset can result in a loss that is much greater than the original investment in the derivative.
The fund is non-diversified, which means that the fund may invest a relatively high percentage of its assets in a limited number of issuers. Therefore, the fund’s performance may be more vulnerable to changes in the market value of a single issuer or group of issuers and more susceptible to risks associated with a single economic, political or regulatory occurrence than a diversified fund.
5
FUND PERFORMANCE (Unaudited)
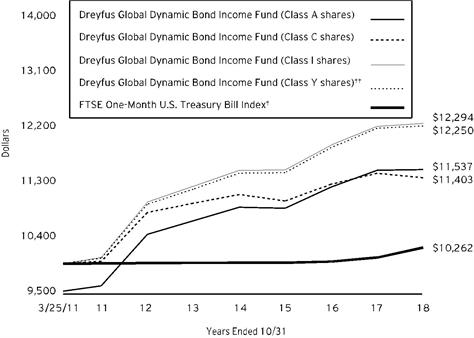
Comparison of change in value of $10,000 investment in Dreyfus Global Dynamic Bond Income Fund Class A shares, Class C shares, Class I shares and Class Y shares and the FTSE One-Month U.S. Treasury Bill Index (the “Index”)
† Source: Lipper Inc.
†† The total return figures presented for Class Y shares of the fund reflect the performance of the fund’s Class A shares for the period prior to 7/1/13 (the inception date for Class Y shares), not reflecting the applicable sales charges for Class A shares.
Past performance is not predictive of future performance.
The above graph compares a $10,000 investment made in each of the Class A, Class C, Class I and Class Y shares of Dreyfus Global Dynamic Bond Fund on 3/25/11 (inception date) to a $10,000 investment made in the Index on that date. All dividends and capital gain distributions are reinvested.
The fund’s performance shown in the line graph above takes into account the maximum initial sales charge on Class A shares and all other applicable fees and expenses on all classes. The Index consists of the last one-month Treasury bill month-end rates. The FTSE One-Month U.S. Treasury Bill Index measures returns equivalent of yield averages. The instruments are not marked to market. Unlike a mutual fund, the Index is not subject to charges, fees and other expenses. Investors cannot invest directly in any index. Further information relating to fund performance, including expense reimbursements, if applicable, is contained in the Financial Highlights section of the prospectus and elsewhere in this report.
6
| | | | | | |
Average Annual Total Returns as of 10/31/18 |
| Inception
Date | 1 Year | 5 Years | From
Inception | |
Class A shares | | | | | |
with maximum sales charge (4.5%) | 3/25/11 | -4.45% | 0.60% | 1.90% | |
without sales charge | 3/25/11 | 0.08% | 1.52% | 2.52% | |
Class C shares | | | | | |
with applicable redemption charge † | 3/25/11 | -1.62% | 0.75% | 1.74% | |
without redemption | 3/25/11 | -0.64% | 0.75% | 1.74% | |
Class I shares | 3/25/11 | 0.38% | 1.76% | 2.76% | |
Class Y shares | 7/1/13 | 0.30% | 1.78% | 2.71%†† | |
FTSE One-Month U.S. Treasury Bill Index | 3/31/11 | 1.62% | 0.50% | 0.34%††† | |
† The maximum contingent deferred sales charge for Class C shares is 1% for shares redeemed within one year of the date of purchase.
†† The total return performance figures presented for Class Y shares of the fund reflect the performance of the fund’s Class A shares for the period prior to 7/1/13 (the inception date for Class Y shares), not reflecting the applicable sales charges for Class A shares.
††† For comparative purposes, the value of the Index as of 3/31/11 is used as the beginning value on 3/25/11.
The performance data quoted represents past performance, which is no guarantee of future results. Share price and investment return fluctuate and an investor’s shares may be worth more or less than original cost upon redemption. Current performance may be lower or higher than the performance quoted. Go to Dreyfus.com for the fund’s most recent month-end returns.
The fund’s performance shown in the graph and table does not reflect the deduction of taxes that a shareholder would pay on fund distributions or the redemption of fund shares. In addition to the performance of Class A shares shown with and without a maximum sales charge, the fund’s performance shown in the table takes into account all other applicable fees and expenses on all classes.
7
UNDERSTANDING YOUR FUND’S EXPENSES (Unaudited)
As a mutual fund investor, you pay ongoing expenses, such as management fees and other expenses. Using the information below, you can estimate how these expenses affect your investment and compare them with the expenses of other funds. You also may pay one-time transaction expenses, including sales charges (loads) and redemption fees, which are not shown in this section and would have resulted in higher total expenses. For more information, see your fund’s prospectus or talk to your financial adviser.
Review your fund’s expenses
The table below shows the expenses you would have paid on a $1,000 investment in Dreyfus Global Dynamic Bond Income Fund from May 1, 2018 to October 31, 2018. It also shows how much a $1,000 investment would be worth at the close of the period, assuming actual returns and expenses.
| | | | | | | | | | | | |
Expenses and Value of a $1,000 Investment | | |
assuming actual returns for the six months ended October 31, 2018 |
| | | | Class A | Class C | Class I | Class Y |
Expenses paid per $1,000† | | $3.78 | | $7.55 | | $2.52 | | $2.52 |
Ending value (after expenses) | | $1,001.00 | | $997.00 | | $1,002.20 | | $1,002.20 |
COMPARING YOUR FUND’S EXPENSES
WITH THOSE OF OTHER FUNDS (Unaudited)
Using the SEC’s method to compare expenses
The Securities and Exchange Commission (“SEC”) has established guidelines to help investors assess fund expenses. Per these guidelines, the table below shows your fund’s expenses based on a $1,000 investment, assuming a hypothetical 5% annualized return. You can use this information to compare the ongoing expenses (but not transaction expenses or total cost) of investing in the fund with those of other funds. All mutual fund shareholder reports will provide this information to help you make this comparison. Please note that you cannot use this information to estimate your actual ending account balance and expenses paid during the period.
| | | | | | | | | | | | |
Expenses and Value of a $1,000 Investment | | |
assuming a hypothetical 5% annualized return for the six months ended October 31, 2018 |
| | | | Class A | Class C | Class I | Class Y |
Expenses paid per $1,000† | | $3.82 | | $7.63 | | $2.55 | | $2.55 |
Ending value (after expenses) | | $1,021.42 | | $1,017.64 | | $1,022.68 | | $1,022.68 |
† Expenses are equal to the fund’s annualized expense ratio of .75% for Class A, 1.50% for Class C, .50% for Class I and .50% for Class Y, multiplied by the average account value over the period, multiplied by 184/365 (to reflect the one-half year period).
8
STATEMENT OF INVESTMENTS
October 31, 2018
| | | | | | | | | | |
| |
Description | Coupon
Rate (%) | | Maturity
Date | | Principal
Amount ($) | a | Value ($) | |
Bonds and Notes - 96.5% | | | | | |
Argentina - .2% | | | | | |
Argentine Government,
Sr. Unscd. Bonds | | 6.88 | | 4/22/2021 | | 150,000 | | 144,187 | |
Australia - 3.1% | | | | | |
Australian Government,
Sr. Unscd. Bonds, Ser. 150 | AUD | 3.00 | | 3/21/2047 | | 1,045,000 | | 723,975 | |
Commonwealth Bank of Australia,
Covered Bonds | | 2.13 | | 7/22/2020 | | 250,000 | | 245,621 | |
Queensland Treasury,
Govt. Gtd. Bonds, Ser. 27 | AUD | 2.75 | | 8/20/2027 | | 540,000 | b | 374,620 | |
Treasury Corporation of Victoria,
Govt. Gtd. Notes | AUD | 4.25 | | 12/20/2032 | | 957,000 | | 757,055 | |
| | 2,101,271 | |
Austria - 1.7% | | | | | |
JBS Investments,
Gtd. Notes | | 7.25 | | 4/3/2024 | | 200,000 | | 202,650 | |
Oesterreichische Kontrollbank,
Govt. Gtd. Bonds | | 2.88 | | 9/7/2021 | | 580,000 | | 576,482 | |
Oesterreichische Kontrollbank,
Govt. Gtd. Notes, 3 Month LIBOR + 0.01% | | 2.34 | | 9/15/2020 | | 400,000 | c | 400,060 | |
| | 1,179,192 | |
Belgium - .2% | | | | | |
Anheuser-Busch InBev,
Gtd. Notes | GBP | 2.25 | | 5/24/2029 | | 130,000 | | 155,893 | |
Brazil - .4% | | | | | |
Light Servicos De Eletricidade,
Gtd. Notes | | 7.25 | | 5/3/2023 | | 249,000 | | 244,020 | |
Canada - 3.2% | | | | | |
Canada Housing Trust No 1,
Govt. Gtd. Bonds | CAD | 2.00 | | 12/15/2019 | | 1,520,000 | b | 1,151,838 | |
Province of British Columbia Canada,
Sr. Unscd. Bonds | | 2.25 | | 6/2/2026 | | 400,000 | | 370,053 | |
Province of British Columbia Canada,
Sr. Unscd. Notes | EUR | 0.88 | | 10/8/2025 | | 328,000 | | 380,166 | |
Royal Bank of Canada,
Covered Bonds | | 1.88 | | 2/5/2020 | | 280,000 | | 275,859 | |
| | 2,177,916 | |
Cayman Islands - .4% | | | | | |
Sable International Finance,
Gtd. Notes | | 6.88 | | 8/1/2022 | | 234,000 | b | 244,822 | |
Colombia - .7% | | | | | |
Ecopetrol,
Sr. Unscd. Notes | | 5.88 | | 9/18/2023 | | 480,000 | | 503,040 | |
9
STATEMENT OF INVESTMENTS (continued)
| | | | | | | | | | |
| |
Description | Coupon
Rate (%) | | Maturity
Date | | Principal
Amount ($) | a | Value ($) | |
Bonds and Notes - 96.5% (continued) | | | | | |
Czech Republic - .8% | | | | | |
Czech Republic Government,
Bonds, Ser. 52 | CZK | 4.70 | | 9/12/2022 | | 10,820,000 | | 525,088 | |
Denmark - 1.7% | | | | | |
Jyske Realkredit,
Covered Bonds, Ser. 321E | DKK | 1.00 | | 4/1/2021 | | 3,600,000 | | 562,363 | |
Kommunekredit,
Sr. Unscd. Notes | | 1.63 | | 6/1/2021 | | 410,000 | | 395,260 | |
Orsted,
Sr. Unscd. Notes | GBP | 4.88 | | 1/12/2032 | | 116,000 | | 179,224 | |
| | 1,136,847 | |
Dominican Republic - .7% | | | | | |
Dominican Government,
Sr. Unscd. Notes | DOP | 8.90 | | 2/15/2023 | | 24,100,000 | | 481,020 | |
Ecuador - .8% | | | | | |
Ecuadorian Government,
Sr. Unscd. Bonds | | 10.50 | | 3/24/2020 | | 200,000 | | 205,750 | |
Ecuadorian Government,
Sr. Unscd. Notes | | 8.88 | | 10/23/2027 | | 400,000 | | 353,100 | |
| | 558,850 | |
El Salvador - .3% | | | | | |
Salvadoran Government,
Sr. Unscd. Notes | | 7.38 | | 12/1/2019 | | 200,000 | | 200,450 | |
Ethiopia - .3% | | | | | |
Ethiopian Government,
Sr. Unscd. Notes | | 6.63 | | 12/11/2024 | | 200,000 | | 194,802 | |
France - 2.3% | | | | | |
Caisse des Depots et Consignations,
Sr. Unscd. Notes | | 1.25 | | 5/17/2019 | | 400,000 | | 397,140 | |
Electricite de France,
Jr. Sub. Notes | GBP | 6.00 | | 1/28/2049 | | 100,000 | | 128,117 | |
Orange,
Jr. Sub. Notes | EUR | 4.00 | | 10/29/2049 | | 200,000 | | 241,651 | |
Societe Generale,
Jr. Sub. Notes | EUR | 6.75 | | 4/7/2049 | | 243,000 | | 291,053 | |
Societe Generale,
Jr. Sub. Notes | | 8.25 | | 11/29/2049 | | 400,000 | | 401,504 | |
Valeo,
Sr. Unscd. Notes | EUR | 1.50 | | 6/18/2025 | | 100,000 | | 110,339 | |
| | 1,569,804 | |
Germany - 3.7% | | | | | |
DEMIRE Deutsche Mittelstand Real Estate,
Sr. Unscd. Bonds | EUR | 2.88 | | 7/15/2022 | | 220,000 | | 254,075 | |
FMS Wertmanagement,
Govt. Gtd. Notes, 3 Month LIBOR + 0.10% | | 2.41 | | 11/27/2019 | | 600,000 | c | 600,872 | |
10
| | | | | | | | | | |
| |
Description | Coupon
Rate (%) | | Maturity
Date | | Principal
Amount ($) | a | Value ($) | |
Bonds and Notes - 96.5% (continued) | | | | | |
Germany - 3.7% (continued) | | | | | |
FMS Wertmanagement,
Gtd. Bonds | | 2.75 | | 3/6/2023 | | 700,000 | | 689,465 | |
HELLA Finance International,
Gtd. Notes | EUR | 1.00 | | 5/17/2024 | | 184,000 | | 209,127 | |
Kreditanstalt fuer Wiederaufbau,
Govt. Gtd. Notes | | 1.50 | | 4/20/2020 | | 520,000 | | 509,326 | |
ProGroup,
Sr. Scd. Notes | EUR | 3.00 | | 3/31/2026 | | 110,000 | | 125,773 | |
Unitymedia Hessen,
Sr. Scd. Bonds | EUR | 6.25 | | 1/15/2029 | | 90,000 | | 114,928 | |
| | 2,503,566 | |
Ghana - .3% | | | | | |
Ghanaian Government,
Sr. Unscd. Notes | | 7.88 | | 8/7/2023 | | 200,000 | | 204,583 | |
Guatemala - .3% | | | | | |
Guatemalan Government,
Sr. Unscd. Notes | | 5.75 | | 6/6/2022 | | 200,000 | | 205,360 | |
Guernsey - .2% | | | | | |
Summit Germany,
Sr. Unscd. Bonds | EUR | 2.00 | | 1/31/2025 | | 122,000 | | 131,847 | |
India - 1.3% | | | | | |
ECL Finance,
Sr. Scd. Notes | INR | 9.05 | | 12/28/2019 | | 14,500,000 | | 195,466 | |
GMR Hyderabad International Airport,
Sr. Scd. Notes | | 4.25 | | 10/27/2027 | | 200,000 | | 166,729 | |
Housing Development Finance,
Sr. Unscd. Notes | INR | 7.88 | | 8/21/2019 | | 20,000,000 | | 267,223 | |
National Highways Authority of India,
Sr. Unscd. Bonds | INR | 7.30 | | 5/18/2022 | | 20,000,000 | | 253,693 | |
| | 883,111 | |
Ireland - 2.2% | | | | | |
Allied Irish Banks,
Sub. Notes | EUR | 4.13 | | 11/26/2025 | | 181,000 | | 214,617 | |
Bank of Ireland Group,
Sub. Notes | GBP | 3.13 | | 9/19/2027 | | 100,000 | | 123,338 | |
German Postal Pensions Securitisation,
Govt. Gtd. Bonds, Ser. 3 | EUR | 3.75 | | 1/18/2021 | | 550,000 | | 676,654 | |
Silverback Finance,
Sr. Scd. Bonds | EUR | 3.13 | | 2/25/2037 | | 187,846 | | 221,239 | |
Virgin Media Receivables Financing Notes I,
Sr. Scd. Bonds | GBP | 5.50 | | 9/15/2024 | | 208,000 | | 265,042 | |
| | 1,500,890 | |
Israel - .3% | | | | | |
Israel Electric,
Sr. Scd. Notes | | 4.25 | | 8/14/2028 | | 200,000 | b | 190,134 | |
11
STATEMENT OF INVESTMENTS (continued)
| | | | | | | | | | |
| |
Description | Coupon
Rate (%) | | Maturity
Date | | Principal
Amount ($) | a | Value ($) | |
Bonds and Notes - 96.5% (continued) | | | | | |
Italy - 2.6% | | | | | |
Italian Government,
Bonds | EUR | 0.35 | | 6/15/2020 | | 410,000 | | 459,269 | |
Italian Government,
Bonds | EUR | 3.75 | | 3/1/2021 | | 680,000 | | 807,903 | |
Nexi Capital,
Sr. Scd. Bonds | EUR | 4.13 | | 11/1/2023 | | 139,000 | | 158,099 | |
Pro-Gest,
Sr. Unscd. Bonds | EUR | 3.25 | | 12/15/2024 | | 120,000 | | 127,814 | |
Telecom Italia,
Sr. Unscd. Notes | | 5.30 | | 5/30/2024 | | 200,000 | b | 189,250 | |
| | 1,742,335 | |
Japan - .8% | | | | | |
Japanese Government,
Sr. Unscd. Bonds, Ser. 387 | JPY | 0.10 | | 4/15/2020 | | 64,150,000 | | 570,515 | |
Jersey - 1.0% | | | | | |
AA Bond Co.,
Sr. Scd. Notes | GBP | 4.25 | | 7/31/2043 | | 100,000 | | 131,511 | |
AA Bond Co.,
Sr. Scd. Notes | GBP | 4.88 | | 7/31/2024 | | 100,000 | | 127,911 | |
CPUK Finance,
Scd. Bonds | GBP | 4.25 | | 2/28/2047 | | 100,000 | | 128,784 | |
CPUK Finance,
Sr. Scd. Notes | GBP | 2.67 | | 2/28/2020 | | 200,000 | | 258,881 | |
| | 647,087 | |
Kuwait - 1.2% | | | | | |
Kuwaiti Government,
Sr. Unscd. Bonds | | 2.75 | | 3/20/2022 | | 830,000 | | 808,222 | |
Luxembourg - 1.0% | | | | | |
4finance,
Gtd. Notes | | 10.75 | | 5/1/2022 | | 200,000 | | 196,748 | |
Amigo Luxembourg,
Sr. Scd. Notes | GBP | 7.63 | | 1/15/2024 | | 100,000 | | 129,330 | |
AnaCap Financial Europe,
Sr. Scd. Notes, 3 Month EURIBOR + 5% @ Floor | EUR | 5.00 | | 8/1/2024 | | 200,000 | c | 199,777 | |
SELP Finance,
Gtd. Bonds | EUR | 1.25 | | 10/25/2023 | | 150,000 | | 168,980 | |
| | 694,835 | |
Mexico - 1.3% | | | | | |
Mexican Government,
Bonds, Ser. M | MXN | 8.00 | | 11/7/2047 | | 6,730,000 | | 297,503 | |
Mexican Government,
Bonds, Ser. M20 | MXN | 7.50 | | 6/3/2027 | | 13,350,000 | | 605,215 | |
| | 902,718 | |
12
| | | | | | | | | | |
| |
Description | Coupon
Rate (%) | | Maturity
Date | | Principal
Amount ($) | a | Value ($) | |
Bonds and Notes - 96.5% (continued) | | | | | |
Mongolia - .6% | | | | | |
Mongolian Government,
Sr. Unscd. Notes | | 5.63 | | 5/1/2023 | | 450,000 | | 429,980 | |
Netherlands - 3.7% | | | | | |
Enel Finance International,
Gtd. Notes | | 2.75 | | 4/6/2023 | | 325,000 | | 299,624 | |
InterXion Holding,
Gtd. Notes | EUR | 4.75 | | 6/15/2025 | | 147,000 | | 173,992 | |
JAB Holdings,
Gtd. Bonds | EUR | 1.25 | | 5/22/2024 | | 100,000 | | 114,236 | |
Nederlandse Financierings-Maatschappij voor Ontwikkelingslanden,
Sr. Unscd. Bonds, 3 Month LIBOR + 0.04% | | 2.36 | | 9/7/2021 | | 400,000 | c | 401,128 | |
Netherlands Development Finance Company,
Sr. Unscd. Notes, 3 Month LIBOR + 0.14% | | 2.61 | | 10/21/2019 | | 192,000 | c | 192,321 | |
Petrobras Global Finance,
Gtd. Notes | | 7.38 | | 1/17/2027 | | 30,000 | | 31,196 | |
Promontoria Holding 264,
Sr. Scd. Notes | EUR | 6.75 | | 8/15/2023 | | 200,000 | | 230,331 | |
Shell International Finance,
Gtd. Notes, 3 Month LIBOR + 0.45% | | 2.79 | | 5/11/2020 | | 287,000 | c | 288,812 | |
Sigma Finance Netherlands,
Gtd. Notes | | 4.88 | | 3/27/2028 | | 200,000 | | 189,000 | |
Telefonica Europe,
Gtd. Bonds | EUR | 4.20 | | 12/29/2049 | | 100,000 | | 116,874 | |
Teva Pharmaceutical Finance Netherlands II,
Gtd. Notes | EUR | 1.13 | | 10/15/2024 | | 100,000 | | 99,576 | |
Teva Pharmaceuticals,
Gtd. Notes | | 2.20 | | 7/21/2021 | | 98,000 | | 91,560 | |
Vonovia Finance,
Gtd. Notes | EUR | 1.50 | | 3/31/2025 | | 242,000 | | 274,101 | |
| | 2,502,751 | |
New Zealand - .9% | | | | | |
New Zealand Government,
Sr. Unscd. Bonds | NZD | 4.50 | | 4/15/2027 | | 900,000 | | 641,698 | |
Norway - .7% | | | | | |
DNB Boligkreditt,
Covered Bonds | | 2.50 | | 3/28/2022 | | 255,000 | | 247,276 | |
SpareBank 1 Boligkreditt,
Covered Bonds | | 1.75 | | 11/15/2019 | | 260,000 | b | 256,279 | |
| | 503,555 | |
13
STATEMENT OF INVESTMENTS (continued)
| | | | | | | | | | |
| |
Description | Coupon
Rate (%) | | Maturity
Date | | Principal
Amount ($) | a | Value ($) | |
Bonds and Notes - 96.5% (continued) | | | | | |
Singapore - .3% | | | | | |
Mulhacen Pte.,
Sr. Scd. Bonds | EUR | 6.50 | | 8/1/2023 | | 167,000 | | 189,208 | |
South Korea - 1.1% | | | | | |
Export-Import Bank of Korea,
Sr. Unscd. Notes, 3 Month LIBOR + 0.46% | | 2.93 | | 10/21/2019 | | 401,000 | c | 401,696 | |
Export-Import Bank of Korea,
Sr. Unscd. Notes, Ser. 5FRN, 3 Month LIBOR + 0.88% | | 3.36 | | 1/25/2022 | | 309,000 | c | 310,296 | |
| | 711,992 | |
Spain - 1.0% | | | | | |
Banco Bilbao Vizcaya Argentaria,
Jr. Sub. Bonds | EUR | 5.88 | | 5/24/2022 | | 200,000 | | 225,937 | |
Banco Santander,
Jr. Sub. Bonds | EUR | 5.25 | | 9/29/2023 | | 400,000 | | 441,352 | |
| | 667,289 | |
Sri Lanka - .6% | | | | | |
Sri Lankan Government,
Sr. Unscd. Bonds | | 6.00 | | 1/14/2019 | | 400,000 | | 396,716 | |
Supranational - 5.1% | | | | | |
Asian Development Bank,
Sr. Unscd. Notes, 3 Month LIBOR + 0.19% | | 2.52 | | 6/16/2021 | | 400,000 | c | 401,313 | |
Eagle Intermediate Global Holding,
Sr. Scd. Bonds | EUR | 5.38 | | 5/1/2023 | | 100,000 | | 110,620 | |
Eagle Super Global Holding,
Sr. Scd. Bonds | | 7.50 | | 5/1/2025 | | 150,000 | b | 145,500 | |
European Bank for Reconstruction & Development,
Sr. Unscd. Notes | | 2.75 | | 3/7/2023 | | 400,000 | | 393,754 | |
European Bank for Reconstruction & Development,
Sr. Unscd. Notes, 3 Month LIBOR + 0.01% | | 2.35 | | 5/11/2022 | | 510,000 | c | 509,705 | |
European Bank for Reconstruction & Development,
Sr. Unscd. Notes, 3 Month LIBOR + FLAT | | 2.37 | | 3/23/2020 | | 292,000 | c | 291,844 | |
European Investment Bank,
Sr. Unscd. Notes | IDR | 7.20 | | 7/9/2019 | | 4,650,000,000 | | 303,240 | |
Inter-American Development Bank,
Unscd. Notes | GBP | 5.25 | | 6/7/2021 | | 220,000 | | 311,465 | |
International Bank for Reconstruction & Development,
Sr. Unscd. Bonds, 3 Month LIBOR + 0.28% | | 2.62 | | 2/11/2021 | | 410,000 | c | 412,904 | |
14
| | | | | | | | | | |
| |
Description | Coupon
Rate (%) | | Maturity
Date | | Principal
Amount ($) | a | Value ($) | |
Bonds and Notes - 96.5% (continued) | | | | | |
Supranational - 5.1% (continued) | | | | | |
Nordic Investment Bank,
Sr. Unscd. Notes | | 1.25 | | 8/2/2021 | | 600,000 | | 571,390 | |
| | 3,451,735 | |
Sweden - .7% | | | | | |
Stadshypotek,
Covered Bonds | | 2.50 | | 4/5/2022 | | 307,000 | | 298,488 | |
Svensk Exportkredit,
Sub. Notes | | 2.88 | | 11/14/2023 | | 200,000 | b | 199,990 | |
| | 498,478 | |
Switzerland - .4% | | | | | |
UBS,
Sub. Notes | EUR | 4.75 | | 2/12/2026 | | 235,000 | | 285,582 | |
United Kingdom - 16.3% | | | | | |
Anglian Water Services Financing,
Sr. Scd. Notes | GBP | 1.63 | | 8/10/2025 | | 215,000 | | 266,452 | |
Bank of England Euro Note,
Unscd. Notes | | 2.50 | | 3/5/2021 | | 396,000 | | 391,190 | |
BP Capital Markets,
Gtd. Notes | GBP | 4.33 | | 12/10/2018 | | 100,000 | | 128,226 | |
Bunzl Finance,
Gtd. Bonds | GBP | 2.25 | | 6/11/2025 | | 242,000 | | 303,347 | |
BUPA Finance,
Gtd. Bonds | GBP | 6.13 | | 12/29/2049 | | 130,000 | | 174,987 | |
Cadent Finance,
Gtd. Notes | GBP | 1.13 | | 9/22/2021 | | 264,000 | | 333,869 | |
Close Brothers Finance,
Gtd. Notes | GBP | 2.75 | | 10/19/2026 | | 141,000 | | 179,451 | |
Coca-Cola European Partners,
Gtd. Notes | EUR | 1.13 | | 5/26/2024 | | 160,000 | | 184,373 | |
Coventry Building Society,
Covered Bonds, 3 Month LIBOR + 0.30% | GBP | 1.10 | | 3/17/2020 | | 100,000 | c | 128,067 | |
Coventry Building Society,
Jr. Sub. Bonds | GBP | 6.38 | | 12/29/2049 | | 200,000 | | 258,383 | |
Coventry Building Society,
Sr. Unscd. Notes | EUR | 2.50 | | 11/18/2020 | | 200,000 | | 237,574 | |
CYBG,
Sr. Unscd. Notes | GBP | 3.13 | | 6/22/2025 | | 280,000 | | 345,445 | |
EI Group,
First Mortgage Bonds | GBP | 6.38 | | 2/15/2022 | | 100,000 | | 132,201 | |
EI Group,
First Mortgage Bonds | GBP | 6.50 | | 12/6/2018 | | 16,000 | | 20,595 | |
Firstgroup,
Gtd. Bonds | GBP | 6.13 | | 1/18/2019 | | 275,000 | | 354,765 | |
HSBC Bank,
Sub. Notes | GBP | 5.38 | | 11/4/2030 | | 195,000 | | 284,800 | |
15
STATEMENT OF INVESTMENTS (continued)
| | | | | | | | | | |
| |
Description | Coupon
Rate (%) | | Maturity
Date | | Principal
Amount ($) | a | Value ($) | |
Bonds and Notes - 96.5% (continued) | | | | | |
United Kingdom - 16.3% (continued) | | | | | |
Iceland Bondco,
Sr. Scd. Notes | GBP | 4.63 | | 3/15/2025 | | 100,000 | | 115,038 | |
Informa,
Gtd. Notes | GBP | 3.13 | | 7/5/2026 | | 190,000 | | 244,874 | |
Investec,
Jr. Sub. Notes | GBP | 6.75 | | 12/5/2049 | | 200,000 | | 250,367 | |
Iron Mountain UK,
Gtd. Notes | GBP | 3.88 | | 11/15/2025 | | 210,000 | | 253,494 | |
Jerrold Finco,
Sr. Scd. Bonds | GBP | 6.13 | | 1/15/2024 | | 108,000 | | 138,623 | |
John Lewis,
Sr. Unscd. Notes | GBP | 8.38 | | 4/8/2019 | | 175,000 | | 229,850 | |
KCA Deutag UK Finance,
Sr. Scd. Notes | | 7.25 | | 5/15/2021 | | 200,000 | b | 185,500 | |
Lloyds Bank,
Jr. Sub. Notes | EUR | 13.00 | | 1/29/2049 | | 66,000 | | 96,808 | |
Lloyds Banking Group,
Jr. Sub. Bonds | GBP | 7.00 | | 12/29/2049 | | 200,000 | | 260,445 | |
London & Quadrant Housing Trust,
Sr. Scd. Bonds | GBP | 2.63 | | 5/5/2026 | | 142,000 | | 184,614 | |
Matalan Finance,
Sr. Scd. Bonds | GBP | 6.75 | | 1/31/2023 | | 130,000 | | 150,101 | |
Mclaren Finance,
Sr. Scd. Bonds | GBP | 5.00 | | 8/1/2022 | | 133,000 | | 161,182 | |
Mitchells & Butlers Finance,
Scd. Bonds, Ser. B2 | GBP | 6.01 | | 12/15/2028 | | 166,847 | | 244,307 | |
Motability Operations Group,
Gtd. Notes | EUR | 1.63 | | 6/9/2023 | | 200,000 | | 238,145 | |
Nationwide Building Society,
Jr. Sub. Notes | GBP | 6.88 | | 3/11/2049 | | 200,000 | | 260,076 | |
Neptune Energy Bondco,
Sr. Unscd. Notes | | 6.63 | | 5/15/2025 | | 200,000 | | 195,250 | |
NIE Finance,
Gtd. Bonds | GBP | 2.50 | | 10/27/2025 | | 117,000 | | 150,880 | |
Prudential,
Sr. Unscd. Bonds | GBP | 5.88 | | 5/11/2029 | | 205,000 | | 344,250 | |
Royal Bank of Scotland Group,
Jr. Sub. Bonds | | 7.50 | | 12/29/2049 | | 400,000 | | 407,600 | |
Saga,
Gtd. Bonds | GBP | 3.38 | | 5/12/2024 | | 128,000 | | 153,672 | |
Skipton Building Society,
Covered Bonds, 3 Month LIBOR + 0.31% | GBP | 1.12 | | 5/2/2023 | | 133,000 | c | 170,192 | |
Southern Gas Networks,
Sr. Unscd. Notes | GBP | 5.13 | | 11/2/2018 | | 250,000 | | 319,550 | |
Tesco Property Finance 3,
Sr. Scd. Bonds | GBP | 5.74 | | 4/13/2040 | | 72,815 | | 109,970 | |
16
| | | | | | | | | | |
| |
Description | Coupon
Rate (%) | | Maturity
Date | | Principal
Amount ($) | a | Value ($) | |
Bonds and Notes - 96.5% (continued) | | | | | |
United Kingdom - 16.3% (continued) | | | | | |
Thames Water Kemble Finance,
Sr. Scd. Notes | GBP | 7.75 | | 4/1/2019 | | 248,000 | | 324,674 | |
TP ICAP,
Gtd. Notes | GBP | 5.25 | | 1/26/2024 | | 190,000 | | 233,118 | |
UNITE USAF II,
Sr. Scd. Notes | GBP | 3.37 | | 6/30/2023 | | 200,000 | | 272,445 | |
United Kingdom Gilt,
Bonds | GBP | 4.25 | | 12/7/2027 | | 800,000 | | 1,280,791 | |
Vodafone Group,
Jr. Sub. Bonds | GBP | 4.88 | | 10/3/2078 | | 194,000 | | 242,708 | |
Wagamama Finance,
Sr. Scd. Notes | GBP | 4.13 | | 7/1/2022 | | 100,000 | | 128,299 | |
| | 11,070,548 | |
United States - 30.9% | | | | | |
Anheuser-Busch InBev Worldwide,
Gtd. Notes | | 4.00 | | 4/13/2028 | | 200,000 | | 192,198 | |
Anheuser-Busch InBev Worldwide,
Gtd. Notes, Ser. 5FRN, 3 Month LIBOR + 0.74% | | 3.17 | | 1/12/2024 | | 400,000 | c | 400,065 | |
Antero Resources,
Gtd. Notes | | 5.63 | | 6/1/2023 | | 197,000 | | 197,492 | |
AT&T,
Sr. Unscd. Notes, 3 Month LIBOR + 1.18% | | 3.51 | | 6/12/2024 | | 410,000 | c | 411,448 | |
Best Buy,
Sr. Unscd. Bonds | | 5.50 | | 3/15/2021 | | 210,000 | | 217,930 | |
Best Buy,
Sr. Unscd. Notes | | 4.45 | | 10/1/2028 | | 248,000 | | 238,817 | |
BWAY Holding Co.,
Sr. Scd. Bonds | EUR | 4.75 | | 4/15/2024 | | 119,000 | | 136,146 | |
CCO Holdings,
Sr. Unscd. Notes | | 5.50 | | 5/1/2026 | | 70,000 | b | 68,337 | |
CCO Holdings,
Sr. Unscd. Notes | | 5.75 | | 1/15/2024 | | 121,000 | | 122,512 | |
CEMEX Finance,
Sr. Scd. Notes | | 6.00 | | 4/1/2024 | | 220,000 | | 220,055 | |
Chesapeake Energy,
Gtd. Notes | | 7.00 | | 10/1/2024 | | 147,000 | | 143,876 | |
Chesapeake Energy,
Gtd. Notes, 3 Month LIBOR + 3.25% | | 5.69 | | 4/15/2019 | | 155,000 | c | 155,775 | |
Citigroup,
Sub. Notes | | 5.50 | | 9/13/2025 | | 300,000 | | 315,116 | |
Comcast,
Gtd. Notes, 3 Month LIBOR + 0.33% | | 2.74 | | 10/1/2020 | | 116,000 | c | 116,052 | |
Dollar General,
Sr. Unscd. Notes | | 4.15 | | 11/1/2025 | | 208,000 | | 205,971 | |
17
STATEMENT OF INVESTMENTS (continued)
| | | | | | | | | | |
| |
Description | Coupon
Rate (%) | | Maturity
Date | | Principal
Amount ($) | a | Value ($) | |
Bonds and Notes - 96.5% (continued) | | | | | |
United States - 30.9% (continued) | | | | | |
eBay,
Sr. Unscd. Notes, 3 Month LIBOR + 0.48% | | 3.02 | | 8/1/2019 | | 329,000 | c | 329,678 | |
Equinix,
Sr. Unscd. Notes | EUR | 2.88 | | 2/1/2026 | | 110,000 | | 121,891 | |
First Data,
Sr. Scd. Notes | | 5.38 | | 8/15/2023 | | 200,000 | b | 202,250 | |
General Electric Capital,
Sr. Unscd. Notes | GBP | 6.44 | | 11/15/2022 | | 23,099 | | 31,759 | |
HCA,
Sr. Scd. Notes | | 6.50 | | 2/15/2020 | | 190,000 | | 196,650 | |
JPMorgan Chase & Co.,
Sr. Unscd. Notes, 3 Month LIBOR + 1.21% | | 3.71 | | 10/29/2020 | | 323,000 | c | 328,675 | |
JPMorgan Chase Bank,
Sr. Unscd. Notes, 3 Month LIBOR + 0.25% | | 2.59 | | 2/13/2020 | | 460,000 | c | 460,165 | |
Microsoft,
Sr. Unscd. Bonds | | 2.00 | | 8/8/2023 | | 250,000 | | 234,731 | |
Neptune Finco,
Sr. Unscd. Notes | | 10.13 | | 1/15/2023 | | 200,000 | b | 217,594 | |
Netflix,
Sr. Unscd. Notes | EUR | 4.63 | | 5/15/2029 | | 290,000 | | 330,070 | |
New York Life Global Funding,
Scd. Notes | | 1.70 | | 9/14/2021 | | 270,000 | | 257,797 | |
NextEra Energy Capital Holdings,
Gtd. Notes, 3 Month LIBOR + 0.32% | | 2.64 | | 9/3/2019 | | 300,000 | c | 300,393 | |
Packaging Corporation of America,
Sr. Unscd. Notes | | 2.45 | | 12/15/2020 | | 71,000 | | 69,525 | |
Pizza Hut Holdings,
Gtd. Notes | | 5.00 | | 6/1/2024 | | 119,000 | | 117,661 | |
Post Holdings,
Gtd. Notes | | 5.50 | | 3/1/2025 | | 134,000 | b | 130,064 | |
PSPC Escrow,
Sr. Unscd. Notes | EUR | 6.00 | | 2/1/2023 | | 210,000 | | 247,270 | |
Range Resources,
Gtd. Notes | | 5.00 | | 3/15/2023 | | 264,000 | | 256,080 | |
RWT Holdings,
Gtd. Bonds | | 5.63 | | 11/15/2019 | | 148,000 | | 150,121 | |
Spectrum Brands,
Gtd. Bonds | EUR | 4.00 | | 10/1/2026 | | 100,000 | | 114,412 | |
Spectrum Brands,
Gtd. Notes | | 6.63 | | 11/15/2022 | | 120,000 | | 122,850 | |
Sprint Capital,
Gtd. Notes | | 8.75 | | 3/15/2032 | | 153,000 | | 166,785 | |
T-Mobile USA,
Gtd. Notes | | 6.00 | | 4/15/2024 | | 90,000 | | 92,475 | |
18
| | | | | | | | | | |
| |
Description | Coupon
Rate (%) | | Maturity
Date | | Principal
Amount ($) | a | Value ($) | |
Bonds and Notes - 96.5% (continued) | | | | | |
United States - 30.9% (continued) | | | | | |
T-Mobile USA,
Gtd. Notes | | 6.00 | | 3/1/2023 | | 129,000 | | 132,238 | |
U.S. Treasury Bonds | | 2.88 | | 5/15/2043 | | 1,750,000 | | 1,600,669 | |
U.S. Treasury Bonds | | 3.00 | | 11/15/2045 | | 800,000 | | 745,125 | |
U.S. Treasury Inflation Protected Securities,
Bonds | | 2.38 | | 1/15/2025 | | 1,645,334 | d | 1,773,425 | |
U.S. Treasury Inflation Protected Securities,
Notes | | 0.13 | | 4/15/2020 | | 232,033 | d | 228,066 | |
U.S. Treasury Notes | | 1.63 | | 8/15/2022 | | 1,360,000 | | 1,295,214 | |
U.S. Treasury Notes | | 2.13 | | 7/31/2024 | | 885,000 | | 843,153 | |
U.S. Treasury Notes | | 2.25 | | 11/15/2027 | | 1,415,000 | | 1,316,862 | |
U.S. Treasury Notes | | 2.50 | | 5/31/2020 | | 4,350,000 | | 4,327,400 | |
U.S. Treasury Notes | | 3.50 | | 5/15/2020 | | 650,000 | | 656,602 | |
US Bank,
Sr. Unscd. Notes, 3 Month LIBOR + 0.32% | | 2.83 | | 4/26/2021 | | 250,000 | c | 250,466 | |
Verizon Communications,
Sr. Unscd. Notes, 3 Month LIBOR + 1% | | 3.33 | | 3/16/2022 | | 103,000 | c | 104,703 | |
Whiting Petroleum,
Sr. Unscd. Notes | | 6.63 | | 1/15/2026 | | 75,000 | | 75,375 | |
Zayo Group,
Gtd. Notes | | 6.00 | | 4/1/2023 | | 50,000 | | 51,250 | |
| | 21,021,234 | |
Vietnam - 1.2% | | | | | |
Vietnamese Government,
Sr. Unscd. Bonds | | 6.75 | | 1/29/2020 | | 800,000 | | 825,190 | |
Total Bonds and Notes
(cost $67,587,180) | | 65,598,361 | |
Description /Number of Contracts | Exercise
Price | | Expiration Date | | Notional Amount | | | |
Options Purchased - .0% | | | | | |
Put Options - .0% | | | | | |
30-Year U.S. Treasury Bonds
Contracts 144
(cost $68,715) | | 135.00 | | 11/23/2018 | | 2,100,000 | | 31,500 | |
19
STATEMENT OF INVESTMENTS (continued)
| | | | | | | | | | |
| |
Description | 7-Day
Yield (%) | | | | Shares | | Value ($) | |
Investment Companies - .4% | | | | | |
Registered Investment Companies - .4% | | | | | |
Dreyfus Institutional Preferred Government Plus Money Market Fund
(cost $236,153) | | 2.21 | | | | 236,153 | e | 236,153 | |
Total Investments (cost $67,892,048) | | 96.9% | 65,866,014 | |
Cash and Receivables (Net) | | 3.1% | 2,126,272 | |
Net Assets | | 100.0% | 67,992,286 | |
EURIBOR—Euro Interbank Offered Rate
LIBOR—London Interbank Offered Rate
AUD—Australian Dollar
CAD—Canadian Dollar
CZK—Czech Koruna
DKK—Danish Krone
EUR—Euro
GBP—British Pound
INR—Indian Rupee
JPY—Japanese Yen
MXN—Mexican Peso
NZD—New Zealand Dollar
a Amount stated in U.S. Dollars unless otherwise noted above.
b Security exempt from registration pursuant to Rule 144A under the Securities Act of 1933. These securities may be resold in transactions exempt from registration, normally to qualified institutional buyers. At October 31, 2018, these securities were valued at $3,556,178 or 5.23% of net assets.
c Variable rate security—rate shown is the interest rate in effect at period end.
d Principal amount for accrual purposes is periodically adjusted based on changes in the Consumer Price Index.
e Investment in affiliated issuer. The investment objective of this investment company is publicly available and can be found within the investment company’s prospectus.
20
| | |
Portfolio Summary (Unaudited) † | Value (%) |
Foreign/Governmental | 30.2 |
U.S. Government Securities | 18.8 |
Banks | 14.5 |
Utilities | 4.0 |
Diversified Financials | 4.0 |
Energy | 3.2 |
Telecommunication Services | 2.9 |
Retailing | 2.3 |
Real Estate | 1.8 |
Media | 1.7 |
Consumer Discretionary | 1.6 |
Beverage Products | 1.4 |
Industrials | 1.1 |
Insurance | 1.1 |
Internet Software & Services | 1.0 |
Commercial & Professional Services | 1.0 |
Food Products | .9 |
Information Technology | .9 |
Health Care | .8 |
Materials | .8 |
Transportation | .8 |
Automobiles & Components | .7 |
Chemicals | .4 |
Consumer Staples | .3 |
Investment Companies | .3 |
Financials | .3 |
Options Purchased | .1 |
| | 96.9 |
† Based on net assets.
See notes to financial statements.
21
STATEMENT OF INVESTMENTS IN AFFILIATED ISSUERS
| | | | | | | |
Registered Investment Company | Value
10/31/17 ($) | Purchases ($) | Sales ($) | Value
10/31/18 ($) | Net
Assets (%) | Dividends/
Distributions ($) |
Dreyfus Institutional Preferred Government Plus Money Market Fund | 94,681 | 42,333,163 | 42,191,691 | 236,153 | .3 | 26,073 |
See notes to financial statements.
22
STATEMENT OF FUTURES
October 31, 2018
| | | | | | | |
Description | Number of
Contracts | Expiration | Notional
Value ($) | Value ($) | Unrealized (Depreciation) ($) | |
Futures Short | | |
Euro-Bobl | 47 | 12/18 | 6,989,849a | 6,997,149 | (7,300) | |
Long Gilt | 6 | 12/18 | 937,245a | 938,787 | (1,542) | |
Gross Unrealized Depreciation | | (8,842) | |
a Notional amounts in foreign currency have been converted to USD using relevant foreign exchange rates.
See notes to financial statements.
23
STATEMENT OF FORWARD FOREIGN CURRENCY EXCHANGE CONTRACTS October 31, 2018
| | | | | | |
Counterparty/ Purchased
Currency | Purchased Currency
Amounts | Currency
Sold | Sold
Currency
Amounts | Settlement Date | Unrealized Appreciation (Depreciation)($) |
CIBC World Markets Corp. | | | |
United States Dollar | 783,643 | Australian Dollar | 1,106,000 | 11/14/18 | 305 |
United States Dollar | 1,479,235 | Euro | 1,293,000 | 11/14/18 | 13,104 |
United States Dollar | 581,612 | Euro | 496,881 | 11/14/18 | 18,200 |
Japanese Yen | 149,193,000 | United States Dollar | 1,325,531 | 11/14/18 | (1,987) |
United States Dollar | 180,426 | British Pound | 138,179 | 11/14/18 | 3,698 |
Hungarian Forint | 174,122,000 | United States Dollar | 609,325 | 11/14/18 | (1,354) |
United States Dollar | 589,104 | Colombian Peso | 1,799,714,000 | 11/14/18 | 30,448 |
Citigroup | | | |
United States Dollar | 94,639 | Canadian Dollar | 122,000 | 11/14/18 | 1,944 |
Swiss Franc | 158,000 | United States Dollar | 159,753 | 11/14/18 | (2,679) |
Mexican Peso | 8,574,813 | United States Dollar | 428,580 | 11/14/18 | (7,468) |
United States Dollar | 348,707 | Australian Dollar | 479,991 | 11/14/18 | 8,747 |
Mexican Peso | 9,890,842 | United States Dollar | 520,711 | 11/14/18 | (34,968) |
United States Dollar | 830,754 | Mexican Peso | 15,693,993 | 11/14/18 | 60,016 |
British Pound | 90,000 | United States Dollar | 117,219 | 11/14/18 | (2,111) |
New Zealand Dollar | 953,912 | United States Dollar | 635,675 | 11/14/18 | (13,105) |
United States Dollar | 76,067 | Japanese Yen | 8,383,313 | 11/14/18 | 1,696 |
Canadian Dollar | 808,000 | United States Dollar | 620,834 | 11/14/18 | (6,917) |
United States Dollar | 586,670 | Danish Krone | 3,729,408 | 11/14/18 | 19,824 |
RBS Securities | | | |
United States Dollar | 1,259,956 | New Zealand Dollar | 1,893,791 | 11/14/18 | 23,974 |
Czech Koruna | 1,847,349 | United States Dollar | 83,989 | 11/14/18 | (3,295) |
United States Dollar | 117,140 | Euro | 102,115 | 11/14/18 | 1,352 |
Philippine Peso | 15,485,000 | United States Dollar | 287,809 | 11/14/18 | 1,358 |
24
| | | | | | |
Counterparty/ Purchased
Currency | Purchased Currency
Amounts | Currency
Sold | Sold
Currency
Amounts | Settlement Date | Unrealized Appreciation (Depreciation)($) |
RBS Securities (continued) |
United States Dollar | 1,299,684 | Philippine Peso | 70,773,000 | 11/14/18 | (21,931) |
United States Dollar | 631,517 | Hungarian Forint | 174,122,000 | 11/14/18 | 23,546 |
British Pound | 489,000 | United States Dollar | 644,520 | 11/14/18 | (19,102) |
United States Dollar | 676,522 | British Pound | 521,884 | 11/14/18 | 9,046 |
United States Dollar | 229,010 | Brazilian Real | 941,000 | 11/14/18 | (23,445) |
United States Dollar | 1,697,433 | Australian Dollar | 2,299,402 | 11/14/18 | 68,854 |
United States Dollar | 550,614 | Indian Rupee | 39,223,000 | 11/14/18 | 21,108 |
Russian Ruble | 31,826,000 | United States Dollar | 476,737 | 11/14/18 | 5,534 |
United States Dollar | 466,281 | Russian Ruble | 31,826,000 | 11/14/18 | (15,990) |
Chilean Peso | 331,408,000 | United States Dollar | 487,917 | 11/14/18 | (11,691) |
United States Dollar | 515,088 | Chilean Peso | 331,408,000 | 11/14/18 | 38,862 |
State Street Bank and Trust Company | | | |
Colombian Peso | 1,799,714,000 | United States Dollar | 600,273 | 11/14/18 | (41,617) |
Euro | 219,739 | United States Dollar | 252,083 | 11/14/18 | (2,921) |
United States Dollar | 813,470 | Euro | 705,943 | 11/14/18 | 13,003 |
United States Dollar | 653,000 | British Pound | 496,110 | 11/14/18 | 18,488 |
Euro | 322,000 | United States Dollar | 378,102 | 11/14/18 | (12,987) |
United States Dollar | 10,781,442 | Euro | 9,235,627 | 11/14/18 | 309,181 |
United States Dollar | 48,507 | Mexican Peso | 933,116 | 11/14/18 | 2,681 |
Euro | 1,896 | United States Dollar | 2,149 | 11/1/18 | (1) |
United States Dollar | 489,377 | Australian Dollar | 670,394 | 11/14/18 | 14,562 |
British Pound | 27,291 | United States Dollar | 35,240 | 11/14/18 | (336) |
United States Dollar | 11,114,486 | British Pound | 8,584,001 | 11/14/18 | 135,767 |
United States Dollar | 18,200 | British Pound | 14,269 | 11/1/18 | (39) |
25
STATEMENT OF FORWARD FOREIGN CURRENCY EXCHANGE CONTRACTS (continued)
| | | | | | |
Counterparty/ Purchased
Currency | Purchased Currency
Amounts | Currency
Sold | Sold
Currency
Amounts | Settlement Date | Unrealized Appreciation (Depreciation)($) |
State Street Bank and Trust Company (continued) |
United States Dollar | 502,437 | Japanese Yen | 55,834,629 | 11/14/18 | 7,108 |
United States Dollar | 290,335 | Philippine Peso | 15,485,000 | 11/14/18 | 1,168 |
Brazilian Real | 941,000 | United States Dollar | 253,093 | 11/14/18 | (638) |
United States Dollar | 221,751 | Indian Rupee | 15,394,000 | 11/14/18 | 13,934 |
UBS Securities | | | |
Mexican Peso | 1,505,258 | United States Dollar | 79,159 | 11/14/18 | (5,235) |
United States Dollar | 172,764 | Mexican Peso | 3,343,804 | 11/14/18 | 8,549 |
Swiss Franc | 502,292 | United States Dollar | 509,633 | 11/14/18 | (10,287) |
British Pound | 187,834 | United States Dollar | 240,273 | 11/14/18 | (38) |
United States Dollar | 453,843 | British Pound | 351,584 | 11/14/18 | 4,177 |
United States Dollar | 188,118 | British Pound | 147,000 | 11/1/18 | 215 |
United States Dollar | 1,702,611 | Canadian Dollar | 2,215,263 | 11/14/18 | 19,459 |
United States Dollar | 620,044 | Czech Koruna | 13,878,014 | 11/14/18 | 13,840 |
Euro | 108,994 | United States Dollar | 125,736 | 11/14/18 | (2,148) |
Gross Unrealized Appreciation | | | 913,748 |
Gross Unrealized Depreciation | | | (242,290) |
See notes to financial statements.
26
STATEMENT OF ASSETS AND LIABILITIES
October 31, 2018
| | | | | | | |
| | | | | | |
| | | Cost | | Value | |
Assets ($): | | | | |
Investments in securities—See Statement of Investments: | | | |
Unaffiliated issuers | 67,655,895 | | 65,629,861 | |
Affiliated issuers | | 236,153 | | 236,153 | |
Cash denominated in foreign currency | | | 209,645 | | 209,120 | |
Unrealized appreciation on forward foreign
currency exchange contracts—Note 4 | | 913,748 | |
Interest receivable | | 756,787 | |
Receivable for shares of Common Stock subscribed | | 268,615 | |
Receivable for investment securities sold | | 228,373 | |
Cash collateral held by broker—Note 4 | | 73,313 | |
Receivable for futures variation margin—Note 4 | | 7,403 | |
Prepaid expenses | | | | | 17,144 | |
| | | | | 68,340,517 | |
Liabilities ($): | | | | |
Due to The Dreyfus Corporation and affiliates—Note 3(c) | | | | 11,910 | |
Unrealized depreciation on forward foreign
currency exchange contracts—Note 4 | | 242,290 | |
Unrealized depreciation on foreign currency transactions | | 12,943 | |
Payable for shares of Common Stock redeemed | | 4,552 | |
Directors fees and expenses payable | | 719 | |
Accrued expenses and other liabilities | | | | | 75,817 | |
| | | | | 348,231 | |
Net Assets ($) | | | 67,992,286 | |
Composition of Net Assets ($): | | | | |
Paid-in capital | | | | | 68,938,272 | |
Total distributable earnings (loss) | | | | | (945,986) | |
Net Assets ($) | | | 67,992,286 | |
| | | | | | |
Net Asset Value Per Share | Class A | Class C | Class I | Class Y | |
Net Assets ($) | 857,741 | 428,196 | 2,555,168 | 64,151,181 | |
Shares Outstanding | 71,228 | 36,099 | 211,359 | 5,305,362 | |
Net Asset Value Per Share ($) | 12.04 | 11.86 | 12.09 | 12.09 | |
| | | | | | |
See notes to financial statements. | | | | | |
27
STATEMENT OF OPERATIONS
Year Ended October 31, 2018
| | | | | | | |
| | | | | | |
| | | | | | |
Investment Income ($): | | | | |
Income: | | | | |
Interest (net of $3,996 foreign taxes withheld at source) | | | 1,631,910 | |
Dividends: | |
Unaffiliated issuers | | | 16,595 | |
Affiliated issuers | | | 26,073 | |
Total Income | | | 1,674,578 | |
Expenses: | | | | |
Management fee—Note 3(a) | | | 207,965 | |
Professional fees | | | 136,040 | |
Registration fees | | | 61,514 | |
Custodian fees—Note 3(c) | | | 16,276 | |
Shareholder servicing costs—Note 3(c) | | | 11,306 | |
Prospectus and shareholders’ reports | | | 10,450 | |
Distribution fees—Note 3(b) | | | 4,240 | |
Directors’ fees and expenses—Note 3(d) | | | 4,193 | |
Loan commitment fees—Note 2 | | | 945 | |
Miscellaneous | | | 60,762 | |
Total Expenses | | | 513,691 | |
Less—reduction in expenses due to undertaking—Note 3(a) | | | (248,996) | |
Net Expenses | | | 264,695 | |
Investment Income—Net | | | 1,409,883 | |
Realized and Unrealized Gain (Loss) on Investments—Note 4 ($): | | |
Net realized gain (loss) on investments and foreign currency transactions | (511,341) | |
Net realized gain (loss) on options transactions | 113,860 | |
Net realized gain (loss) on futures | (44,600) | |
Net realized gain (loss) on forward foreign currency exchange contracts | 1,032,299 | |
Net Realized Gain (Loss) | | | 590,218 | |
Net unrealized appreciation (depreciation) on investments
and foreign currency transactions | | | (2,356,157) | |
Net unrealized appreciation (depreciation) on options transactions | (49,068) | |
Net unrealized appreciation (depreciation) on futures | | | 14,037 | |
Net unrealized appreciation (depreciation) on
forward foreign currency exchange contracts | | | 491,417 | |
Net Unrealized Appreciation (Depreciation) | | | (1,899,771) | |
Net Realized and Unrealized Gain (Loss) on Investments | | | (1,309,553) | |
Net Increase in Net Assets Resulting from Operations | | 100,330 | |
| | | | | | | |
See notes to financial statements. | | | | | |
28
STATEMENT OF CHANGES IN NET ASSETS
| | | | | | | | | | |
| | | | Year Ended October 31, |
| | | | 2018 | | 2017 | a |
Operations ($): | | | | | | | | |
Investment income—net | | | 1,409,883 | | | | 790,126 | |
Net realized gain (loss) on investments | | 590,218 | | | | (520,086) | |
Net unrealized appreciation (depreciation)
on investments | | (1,899,771) | | | | 852,575 | |
Net Increase (Decrease) in Net Assets
Resulting from Operations | 100,330 | | | | 1,122,615 | |
Distributions ($): | |
Distributions to shareholders: | | | | | | | | |
Class A | | | (13,800) | | | | (51,378) | |
Class C | | | (5,396) | | | | (17,038) | |
Class I | | | (63,913) | | | | (40,633) | |
Class Y | | | (789,339) | | | | (1,076,095) | |
Total Distributions | | | (872,448) | | | | (1,185,144) | |
Capital Stock Transactions ($): | |
Net proceeds from shares sold: | | | | | | | | |
Class A | | | 307,161 | | | | 180,404 | |
Class C | | | 91,720 | | | | 99,777 | |
Class I | | | 1,274,934 | | | | 3,285,341 | |
Class Y | | | 28,226,139 | | | | 7,271,205 | |
Distributions reinvested: | | | | | | | | |
Class A | | | 12,310 | | | | 48,686 | |
Class C | | | 4,568 | | | | 14,727 | |
Class I | | | 63,914 | | | | 40,613 | |
Class Y | | | 628,494 | | | | 870,213 | |
Cost of shares redeemed: | | | | | | | | |
Class A | | | (130,784) | | | | (1,331,970) | |
Class C | | | (361,041) | | | | (77,228) | |
Class I | | | (2,546,190) | | | | (790,155) | |
Class Y | | | (4,747,742) | | | | (2,293,351) | |
Increase (Decrease) in Net Assets
from Capital Stock Transactions | 22,823,483 | | | | 7,318,262 | |
Total Increase (Decrease) in Net Assets | 22,051,365 | | | | 7,255,733 | |
Net Assets ($): | |
Beginning of Period | | | 45,940,921 | | | | 38,685,188 | |
End of Period | | | 67,992,286 | | | | 45,940,921 | |
29
STATEMENT OF CHANGES IN NET ASSETS (continued)
| | | | | | | | | | |
| | | | Year Ended October 31, |
| | | | 2018 | | 2017 | a |
Capital Share Transactions (Shares): | |
Class A | | | | | | | | |
Shares sold | | | 25,225 | | | | 14,906 | |
Shares issued for distributions reinvested | | | 1,016 | | | | 4,071 | |
Shares redeemed | | | (10,781) | | | | (111,006) | |
Net Increase (Decrease) in Shares Outstanding | 15,460 | | | | (92,029) | |
Class C | | | | | | | | |
Shares sold | | | 7,673 | | | | 8,337 | |
Shares issued for distributions reinvested | | | 381 | | | | 1,243 | |
Shares redeemed | | | (30,189) | | | | (6,430) | |
Net Increase (Decrease) in Shares Outstanding | (22,135) | | | | 3,150 | |
Class Ib | | | | | | | | |
Shares sold | | | 104,279 | | | | 271,560 | |
Shares issued for distributions reinvested | | | 5,258 | | | | 3,393 | |
Shares redeemed | | | (209,129) | | | | (64,944) | |
Net Increase (Decrease) in Shares Outstanding | (99,592) | | | | 210,009 | |
Class Yb | | | | | | | | |
Shares sold | | | 2,322,659 | | | | 601,724 | |
Shares issued for distributions reinvested | | | 51,718 | | | | 72,624 | |
Shares redeemed | | | (389,019) | | | | (189,361) | |
Net Increase (Decrease) in Shares Outstanding | 1,985,358 | | | | 484,987 | |
| | | | | | | | | | |
a Distributions to shareholders include $50,770 Class A, $16,808 Class C, $40,162 Class I and $1,063,886 Class Y of distributions from net investment income and $608 Class A, $230 Class C, $471 Class I and $12,209 Class Y distributions from net realized gains. Distributions in excess of investment income—net was $187,563 in 2017 and is no longer presented as a result of the adoption of SEC’s Disclosure Update and Simplification Rule. | |
b During the period ended October 31, 2018, 6,216 Class Y shares representing $76,270 were exchanged for 6,221 Class I shares and during the period ended October 31, 2017, 2,080 Class Y shares representing $25,229 were exchanged for 2,080 Class I shares. | |
See notes to financial statements.
| | | | | | | | |
30
FINANCIAL HIGHLIGHTS
The following tables describe the performance for each share class for the fiscal periods indicated. All information (except portfolio turnover rate) reflects financial results for a single fund share. Total return shows how much your investment in the fund would have increased (or decreased) during each period, assuming you had reinvested all dividends and distributions. These figures have been derived from the fund’s financial statements.
| | | | | | | | | | | | | |
| | | | | |
| | | |
Class A Shares | | Year Ended October 31, |
| | 2018 | 2017 | 2016 | 2015 | 2014 | |
Per Share Data ($): | | | | | | | |
Net asset value, beginning of period | | 12.23 | 12.30 | 12.13 | 12.70 | 12.59 | |
Investment Operations: | | | | | | | |
Investment income—neta | | .32 | .19 | .13 | .16 | .26 | |
Net realized and unrealized
gain (loss) on investments | | (.31) | .10 | .25 | (.18) | (.00)b | |
Total from Investment Operations | | .01 | .29 | .38 | (.02) | .26 | |
Distributions: | | | | | | | |
Dividends from
investment income—net | | (.20) | (.36) | (.19) | (.49) | (.15) | |
Dividends from net realized
gain on investments | | - | (.00)b | (.02) | (.06) | - | |
Total Distributions | | (.20) | (.36) | (.21) | (.55) | (.15) | |
Net asset value, end of period | | 12.04 | 12.23 | 12.30 | 12.13 | 12.70 | |
Total Return (%)c | | .08 | 2.45 | 3.20 | (.15) | 2.08 | |
Ratios/Supplemental Data (%): | | | | | | | |
Ratio of total expenses
to average net assets | | 1.39 | 1.37 | 1.64 | 1.99 | 2.22 | |
Ratio of net expenses
to average net assets | | .75 | .89 | .95 | .95 | 1.02 | |
Ratio of net investment income
to average net assets | | 2.60 | 1.65 | 1.10 | 1.29 | 2.04 | |
Portfolio Turnover Rate | | 114.73 | 145.88 | 141.08 | 134.49 | 157.23 | |
Net Assets, end of period ($ x 1,000) | | 858 | 682 | 1,818 | 1,407 | 1,466 | |
a Based on average shares outstanding.
b Amount represents less than $.01 per share.
c Exclusive of sales charge.
See notes to financial statements.
31
FINANCIAL HIGHLIGHTS (continued)
| | | | | | | | | | | | | |
| | | | | | |
| | | |
Class C Shares | | Year Ended October 31, |
| | 2018 | 2017 | 2016 | 2015 | 2014 | |
Per Share Data ($): | | | | | | | |
Net asset value, beginning of period | | 12.06 | 12.18 | 12.05 | 12.62 | 12.54 | |
Investment Operations: | | | | | | | |
Investment income—neta | | .24 | .11 | .04 | .07 | .17 | |
Net realized and unrealized
gain (loss) on investments | | (.33) | .08 | .25 | (.19) | (.00)b | |
Total from Investment Operations | | (.09) | .19 | .29 | (.12) | .17 | |
Distributions: | | | | | | | |
Dividends from
investment income—net | | (.11) | (.31) | (.14) | (.39) | (.09) | |
Dividends from net realized
gain on investments | | - | (.00)b | (.02) | (.06) | - | |
Total Distributions | | (.11) | (.31) | (.16) | (.45) | (.09) | |
Net asset value, end of period | | 11.86 | 12.06 | 12.18 | 12.05 | 12.62 | |
Total Return (%)c | | (.64) | 1.59 | 2.47 | (.94) | 1.30 | |
Ratios/Supplemental Data (%): | | | | | | | |
Ratio of total expenses
to average net assets | | 2.07 | 2.09 | 2.39 | 2.74 | 2.95 | |
Ratio of net expenses
to average net assets | | 1.50 | 1.64 | 1.70 | 1.70 | 1.76 | |
Ratio of net investment income
to average net assets | | 2.00 | .90 | .35 | .54 | 1.31 | |
Portfolio Turnover Rate | | 114.73 | 145.88 | 141.08 | 134.49 | 157.23 | |
Net Assets, end of period ($ x 1,000) | | 428 | 702 | 671 | 788 | 1,051 | |
a Based on average shares outstanding.
b Amount represents less than $.01 per share.
c Exclusive of sales charge.
See notes to financial statements.
32
| | | | | | | | | | | | | |
| | | | | | |
| | | |
Class I Shares | | Year Ended October 31, |
| | 2018 | 2017 | 2016 | 2015 | 2014 | |
Per Share Data ($): | | | | | | | |
Net asset value, beginning of period | | 12.27 | 12.33 | 12.14 | 12.71 | 12.60 | |
Investment Operations: | | | | | | | |
Investment income—neta | | .37 | .23 | .15 | .19 | .29 | |
Net realized and unrealized
gain (loss) on investments | | (.33) | .08 | .27 | (.18) | (.00)b | |
Total from Investment Operations | | .04 | .31 | .42 | .01 | .29 | |
Distributions: | | | | | | | |
Dividends from
investment income—net | | (.22) | (.37) | (.21) | (.52) | (.18) | |
Dividends from net realized
gain on investments | | - | (.00)b | (.02) | (.06) | - | |
Total Distributions | | (.22) | (.37) | (.23) | (.58) | (.18) | |
Net asset value, end of period | | 12.09 | 12.27 | 12.33 | 12.14 | 12.71 | |
Total Return (%) | | .38 | 2.57 | 3.52 | .07 | 2.30 | |
Ratios/Supplemental Data (%): | | | | | | | |
Ratio of total expenses
to average net assets | | 1.10 | 1.14 | 1.39 | 1.70 | 1.88 | |
Ratio of net expenses
to average net assets | | .50 | .65 | .70 | .70 | .77 | |
Ratio of net investment income
to average net assets | | 3.03 | 1.91 | 1.35 | 1.54 | 2.29 | |
Portfolio Turnover Rate | | 114.73 | 145.88 | 141.08 | 134.49 | 157.23 | |
Net Assets, end of period ($ x 1,000) | | 2,555 | 3,815 | 1,244 | 5,472 | 10,292 | |
a Based on average shares outstanding.
b Amount represents less than $.01 per share.
See notes to financial statements.
33
FINANCIAL HIGHLIGHTS (continued)
| | | | | | | | | | | | |
| | | | | |
| | | | |
Class Y Shares | | Year Ended October 31, |
| | 2018 | 2017 | 2016 | 2015 | 2014 | |
Per Share Data ($): | | | | | | | |
Net asset value, beginning of period | | 12.27 | 12.33 | 12.14 | 12.71 | 12.60 | |
Investment Operations: | | | | | | | |
Investment income—neta | | .33 | .23 | .16 | .19 | .29 | |
Net realized and unrealized
gain (loss) on investments | | (.29) | .08 | .27 | (.18) | (.00)b | |
Total from Investment Operations | | .04 | .31 | .43 | .01 | .29 | |
Distributions: | | | | | | | |
Dividends from
investment income—net | | (.22) | (.37) | (.22) | (.52) | (.18) | |
Dividends from net realized
gain on investments | | - | (.00)b | (.02) | (.06) | - | |
Total Distributions | | (.22) | (.37) | (.24) | (.58) | (.18) | |
Net asset value, end of period | | 12.09 | 12.27 | 12.33 | 12.14 | 12.71 | |
Total Return (%) | | .30 | 2.67 | 3.54 | .09 | 2.34 | |
Ratios/Supplemental Data (%): | | | | | | | |
Ratio of total expenses
to average net assets | | .96 | .98 | 1.23 | 1.31 | 1.88 | |
Ratio of net expenses
to average net assets | | .50 | .64 | .70 | .70 | .75 | |
Ratio of net investment income
to average net assets | | 2.70 | 1.90 | 1.35 | 1.54 | 2.30 | |
Portfolio Turnover Rate | | 114.73 | 145.88 | 141.08 | 134.49 | 157.23 | |
Net Assets, end of period ($ x 1,000) | | 64,151 | 40,741 | 34,952 | 14,611 | 1 | |
a Based on average shares outstanding.
b Amount represents less than $.01 per share.
See notes to financial statements.
34
NOTES TO FINANCIAL STATEMENTS
NOTE 1—Significant Accounting Policies:
Dreyfus Global Dynamic Bond Income Fund (the “fund”) is a separate non-diversified series of Advantage Funds, Inc. (the “Company”), which is registered under the Investment Company Act of 1940, as amended (the “Act”), as an open-end management investment company and operates as a series company currently offering ten series, including the fund. The fund’s investment objective is to seek total return (consisting of income and capital appreciation). The Dreyfus Corporation (the “Manager” or “Dreyfus”), a wholly-owned subsidiary of The Bank of New York Mellon Corporation (“BNY Mellon”), serves as the fund’s investment adviser. Newton Investment Management (North America) Limited (“Newton”), a wholly-owned subsidiary of BNY Mellon and an affiliate of Dreyfus, serves as the fund’s sub-investment adviser.
The Company’s Board of Directors (the “Board”) approved, effective March 19, 2018, a change in the fund’s name from “Dreyfus Global Dynamic Bond Fund” to “Dreyfus Global Dynamic Bond Income Fund”.
MBSC Securities Corporation (the “Distributor”), a wholly-owned subsidiary of Dreyfus, is the distributor of the fund’s shares. The fund is authorized to issue 100 million shares of $.001 par value Common Stock in each of the following classes of shares: Class A, Class C, Class I, Class T and Class Y. Class A and Class T shares generally are subject to a sales charge imposed at the time of purchase. Class C shares are subject to a contingent deferred sales charge (“CDSC”) imposed on Class C shares redeemed within one year of purchase. Class C shares automatically convert to Class A shares ten years after the date of purchase, without the imposition of a sales charge. Class I and Class Y shares are sold at net asset value per share generally to institutional investors. As of the date of this report, the fund did not offer Class T shares for purchase. Other differences between the classes include the services offered to and the expenses borne by each class, the allocation of certain transfer agency costs, and certain voting rights. Income, expenses (other than expenses attributable to a specific class), and realized and unrealized gains or losses on investments are allocated to each class of shares based on its relative net assets.
As of October 31, 2018, MBC Investments Corp., an indirect subsidiary of BNY Mellon, held 7,453 Class A and 7,267 Class C shares of the fund.
The Company accounts separately for the assets, liabilities and operations of each series. Expenses directly attributable to each series are charged to
35
NOTES TO FINANCIAL STATEMENTS (continued)
that series’ operations; expenses which are applicable to all series are allocated among them on a pro rata basis.
The Financial Accounting Standards Board (“FASB”) Accounting Standards Codification (“ASC”) is the exclusive reference of authoritative U.S. generally accepted accounting principles (“GAAP”) recognized by the FASB to be applied by nongovernmental entities. Rules and interpretive releases of the Securities and Exchange Commission (“SEC”) under authority of federal laws are also sources of authoritative GAAP for SEC registrants. The fund’s financial statements are prepared in accordance with GAAP, which may require the use of management estimates and assumptions. Actual results could differ from those estimates.
The Company enters into contracts that contain a variety of indemnifications. The fund’s maximum exposure under these arrangements is unknown. The fund does not anticipate recognizing any loss related to these arrangements.
(a) Portfolio valuation: The fair value of a financial instrument is the amount that would be received to sell an asset or paid to transfer a liability in an orderly transaction between market participants at the measurement date (i.e., the exit price). GAAP establishes a fair value hierarchy that prioritizes the inputs of valuation techniques used to measure fair value. This hierarchy gives the highest priority to unadjusted quoted prices in active markets for identical assets or liabilities (Level 1 measurements) and the lowest priority to unobservable inputs (Level 3 measurements).
Additionally, GAAP provides guidance on determining whether the volume and activity in a market has decreased significantly and whether such a decrease in activity results in transactions that are not orderly. GAAP requires enhanced disclosures around valuation inputs and techniques used during annual and interim periods.
Various inputs are used in determining the value of the fund’s investments relating to fair value measurements. These inputs are summarized in the three broad levels listed below:
Level 1—unadjusted quoted prices in active markets for identical investments.
Level 2—other significant observable inputs (including quoted prices for similar investments, interest rates, prepayment speeds, credit risk, etc.).
Level 3—significant unobservable inputs (including the fund’s own assumptions in determining the fair value of investments).
36
The inputs or methodology used for valuing securities are not necessarily an indication of the risk associated with investing in those securities.
Changes in valuation techniques may result in transfers in or out of an assigned level within the disclosure hierarchy. Valuation techniques used to value the fund’s investments are as follows:
Registered investment companies that are not traded on an exchange are valued at their net asset value and are generally categorized within Level 1 of the fair value hierarchy.
Investments in securities, excluding short-term investments (other than U.S. Treasury Bills), financial futures, options and forward foreign currency exchange contracts ("forward contracts") are valued each business day by an independent pricing service (the “Service”) approved by the Board Investments for which quoted bid prices are readily available and are representative of the bid side of the market in the judgment of the Service are valued at the mean between the quoted bid prices (as obtained by the Service from dealers in such securities) and asked prices (as calculated by the Service based upon its evaluation of the market for such securities). Other investments are valued as determined by the Service, based on methods which include consideration of the following: yields or prices of securities of comparable quality, coupon, maturity and type; indications as to values from dealers; and general market conditions. These securities are generally categorized within Level 2 of the fair value hierarchy.
The Service is engaged under the general supervision of the Board.
When market quotations or official closing prices are not readily available, or are determined not to accurately reflect fair value, such as when the value of a security has been significantly affected by events after the close of the exchange or market on which the security is principally traded (for example, a foreign exchange or market), but before the fund calculates its net asset value, the fund may value these investments at fair value as determined in accordance with the procedures approved by the Board. Certain factors may be considered when fair valuing investments such as: fundamental analytical data, the nature and duration of restrictions on disposition, an evaluation of the forces that influence the market in which the securities are purchased and sold, and public trading in similar securities of the issuer or comparable issuers. These securities are either categorized within Level 2 or 3 of the fair value hierarchy depending on the relevant inputs used.
For restricted securities where observable inputs are limited, assumptions about market activity and risk are used and such securities are generally categorized within Level 3 of the fair value hierarchy.
37
NOTES TO FINANCIAL STATEMENTS (continued)
Investments denominated in foreign currencies are translated to U.S. dollars at the prevailing rates of exchange.
Futures and options, which are traded on an exchange, are valued at the last sales price on the securities exchange on which such securities are primarily traded or at the last sales price on the national securities market on each business day and are generally categorized within Level 1 of the fair value hierarchy. Options traded over-the-counter (“OTC”) are valued at the mean between the bid and asked price and are generally categorized within Level 2 of the fair value hierarchy. Forward contracts are valued at the forward rate and are generally categorized within Level 2 of the fair value hierarchy.
The following is a summary of the inputs used as of October 31, 2018 in valuing the fund’s investments:
| | | | | | |
| Level 1 - Unadjusted Quoted Prices | Level 2 - Other Significant Observable Inputs | Level 3 -Significant Unobservable Inputs | Total |
Assets ($) | | | | |
Investments in Securities: | | | | |
Corporate Bonds† | - | 32,296,115 | - | 32,296,115 |
Foreign Government | - | 20,515,730 | - | 20,515,730 |
Investment Company | 236,153 | - | - | 236,153 |
U.S. Treasury | - | 12,786,516 | - | 12,786,516 |
Other Financial Instruments: | | | | |
Forward Foreign Currency Exchange Contracts†† | - | 913,748 | - | 913,748 |
Options Purchased | 31,500 | - | - | 31,500 |
Liabilities ($) | | | | |
Other Financial Instruments: | | | | |
Futures†† | (8,842) | - | - | (8,842) |
Forward Foreign Currency Exchange Contracts†† | - | (242,290) | - | (242,290) |
† See Statement of Investments for additional detailed categorizations.
†† Amount shown represents unrealized appreciation (depreciation) at period end.
At October 31, 2018, there were no transfers between levels of the fair value hierarchy. It is the fund’s policy to recognize transfers between levels at the end of the reporting period.
(b) Foreign currency transactions: The fund does not isolate that portion of the results of operations resulting from changes in foreign exchange rates on investments from the fluctuations arising from changes
38
in the market prices of securities held. Such fluctuations are included with the net realized and unrealized gain or loss on investments.
Net realized foreign exchange gains or losses arise from sales of foreign currencies, currency gains or losses realized on securities transactions between trade and settlement date, and the difference between the amounts of dividends, interest and foreign withholding taxes recorded on the fund’s books and the U.S. dollar equivalent of the amounts actually received or paid. Net unrealized foreign exchange gains and losses arise from changes in the value of assets and liabilities other than investments resulting from changes in exchange rates. Foreign currency gains and losses on foreign currency transactions are also included with net realized and unrealized gain or loss on investments.
(c) Securities transactions and investment income: Securities transactions are recorded on a trade date basis. Realized gains and losses from securities transactions are recorded on the identified cost basis. Interest income, adjusted for accretion of discount and amortization of premium on investments, is earned from settlement date and recognized on the accrual basis. Securities purchased or sold on a when issued or delayed delivery basis may be settled a month or more after the trade date.
(d) Affiliated issuers: Investments in other investment companies advised by Dreyfus are considered “affiliated” under the Act.
Certain affiliated investment companies may also invest in the fund. At October 31, 2018, Dreyfus Yield Enhancement Strategy Fund, an affiliate of the fund, held 2,712,622 Class Y shares representing approximately 48% of the fund’s net assets.
(e) Risk: Investing in foreign markets may involve special risks and considerations not typically associated with investing in the U.S. These risks include revaluation of currencies, high rates of inflation, repatriation restrictions on income and capital, and adverse political and economic developments. Moreover, securities issued in these markets may be less liquid, subject to government ownership controls and delayed settlements, and their prices may be more volatile than those of comparable securities in the U.S.
(f) Dividends and distributions to shareholders: Dividends and distributions are recorded on the ex-dividend date. Dividends from investment income-net are normally declared and paid quarterly. Dividends from net realized capital gains, if any, are normally declared and paid annually, but the fund may make distributions on a more frequent basis to comply with the distribution requirements of the Internal Revenue Code of 1986, as amended (the “Code”). To the extent that net realized capital
39
NOTES TO FINANCIAL STATEMENTS (continued)
gains can be offset by capital loss carryovers, it is the policy of the fund not to distribute such gains. Income and capital gain distributions are determined in accordance with income tax regulations, which may differ from GAAP.
(g) Federal income taxes: It is the policy of the fund to continue to qualify as a regulated investment company, if such qualification is in the best interests of its shareholders, by complying with the applicable provisions of the Code, and to make distributions of taxable income and net realized capital gain sufficient to relieve it from substantially all federal income and excise taxes.
As of and during the period ended October 31, 2018, the fund did not have any liabilities for any uncertain tax positions. The fund recognizes interest and penalties, if any, related to uncertain tax positions as income tax expense in the Statement of Operations. During the period ended October 31, 2018, the fund did not incur any interest or penalties.
Each tax year in the four-year period ended October 31, 2018 remains subject to examination by the Internal Revenue Service and state taxing authorities.
At October 31, 2018, the components of accumulated earnings on a tax basis were as follows: undistributed ordinary income $2,091,833, accumulated capital losses $617,774 and unrealized depreciation $2,420,045.
The fund is permitted to carry forward capital losses for an unlimited period. Furthermore, capital loss carryovers retain their character as either short-term or long-term capital losses.
The accumulated capital loss carryover is available for federal income tax purposes to be applied against future net realized capital gains, if any, realized subsequent to October 31, 2018. The fund has $580,955 of short-term capital losses and $36,819 of long-term capital losses which can be carried forward for an unlimited period.
The tax character of distributions paid to shareholders during the fiscal periods ended October 31, 2018 and October 31, 2017 were as follows: ordinary income $872,448 and $1,185,144, respectively.
(h) New Accounting Pronouncements: In March 2017, the FASB issued Accounting Standards Update 2017-08, Receivables—Nonrefundable Fees and Other Costs (Subtopic 310-20): Premium Amortization On Purchased Callable Debt Securities (“ASU 2017-08”). The update shortens the amortization period for the premium on certain
40
purchased callable debt securities to the earliest call date. ASU 2017-08 will be effective for annual periods beginning after December 15, 2018.
Also in August 2018, the FASB issued Accounting Standards Update 2018-13, Fair Value Measurement (Topic 820): Disclosure Framework—Changes to the Disclosure Requirements for Fair Value Measurement (“ASU 2018-13”). The update provides guidance that eliminates, adds and modifies certain disclosure requirements for fair value measurements. ASU 2018-13 will be effective for annual periods beginning after December 15, 2019. Management is currently assessing the potential impact of these changes to future financial statements.
NOTE 2—Bank Lines of Credit:
The fund participates with other Dreyfus-managed funds in an $830 million unsecured credit facility led by Citibank, N.A. and a $300 million unsecured credit facility provided by The Bank of New York Mellon, a subsidiary of BNY Mellon and an affiliate of Dreyfus (each, a “Facility”), each to be utilized primarily for temporary or emergency purposes, including the financing of redemptions. In connection therewith, the fund has agreed to pay its pro rata portion of commitment fees for each Facility. Interest is charged to the fund based on rates determined pursuant to the terms of the respective Facility at the time of borrowing. During the period ended October 31, 2018, the fund did not borrow under the Facilities.
NOTE 3—Management Fee, Sub-Investment Advisory Fee and Other Transactions with Affiliates:
(a) Pursuant to a management agreement with Dreyfus, the management fee is computed at the annual rate of .40% of the value of the fund’s average daily net assets and is payable monthly. Dreyfus has contractually agreed, from November 1, 2017 through March 1, 2019, to waive receipt of its fees and/or assume the direct expenses of the fund, so that the direct expenses of none of the classes (excluding Rule 12b-1 Distribution Plan fees, Shareholder Services Plan fees, taxes, interest expense, brokerage commissions, commitment fees on borrowings and extraordinary expenses) exceed .50% of the value of the fund’s average daily net assets. On or after March 1, 2019, Dreyfus may terminate this expense limitation at any time. The reduction in expenses, pursuant to the undertaking, amounted to $248,996 during the period ended October 31, 2018.
Pursuant to a sub-investment advisory agreement between Dreyfus and Newton, Dreyfus pays Newton a monthly fee at an annual rate of .19% of the value of the fund’s average daily net assets.
41
NOTES TO FINANCIAL STATEMENTS (continued)
During the period ended October 31, 2018, the Distributor retained $201 from commissions earned on sales of the fund’s Class A shares.
(b) Under the Distribution Plan adopted pursuant to Rule 12b-1 under the Act, Class C shares pay the Distributor for distributing its shares at an annual rate of .75% of the value of its average daily net assets. During the period ended October 31, 2018, Class C shares were charged $4,240 pursuant to the Distribution Plan.
(c) Under the Shareholder Services Plan, Class A and Class C shares pay the Distributor at an annual rate of .25% of the value of their average daily net assets for the provision of certain services. The services provided may include personal services relating to shareholder accounts, such as answering shareholder inquiries regarding the fund and providing reports and other information, and services related to the maintenance of shareholder accounts. The Distributor may make payments to Service Agents (securities dealers, financial institutions or other industry professionals) with respect to these services. The Distributor determines the amounts to be paid to Service Agents. During the period ended October 31, 2018, Class A and Class C shares were charged $2,038 and $1,414, respectively, pursuant to the Shareholder Services Plan.
The fund has arrangements with the transfer agent and the custodian whereby the fund may receive earnings credits when positive cash balances are maintained, which are used to offset transfer agency and custody fees. For financial reporting purposes, the fund includes net earnings credits, if any, as an expense offset in the Statement of Operations.
The fund compensates Dreyfus Transfer, Inc., a wholly-owned subsidiary of Dreyfus, under a transfer agency agreement for providing transfer agency and cash management services for the fund. The majority of transfer agency fees are comprised of amounts paid on a per account basis, while cash management fees are related to fund subscriptions and redemptions. During the period ended October 31, 2018, the fund was charged $2,210 for transfer agency services. These fees are included in Shareholder servicing costs in the Statement of Operations.
The fund compensates The Bank of New York Mellon under a custody agreement for providing custodial services for the fund. These fees are determined based on net assets, geographic region and transaction activity. During the period ended October 31, 2018, the fund was charged $16,276 pursuant to the custody agreement.
During the period ended October 31, 2018, the fund was charged $12,797 for services performed by the Chief Compliance Officer and his staff. These fees are included in Miscellaneous in the Statement of Operations.
42
The components of “Due to The Dreyfus Corporation and affiliates” in the Statement of Assets and Liabilities consist of: management fees $22,715, Distribution Plan fees $293, Shareholder Services Plan fees $279, custodian fees $7,082, Chief Compliance Officer fees $4,193 and transfer agency fees $359, which are offset against an expense reimbursement currently in effect in the amount of $23,011.
(d) Each Board member also serves as a Board member of other funds within the Dreyfus complex. Annual retainer fees and attendance fees are allocated to each fund based on net assets.
NOTE 4—Securities Transactions:
The aggregate amount of purchases and sales of investment securities, excluding short-term securities, futures, options transactions and forward contracts, during the period ended October 31, 2018, amounted to $80,036,134 and $57,063,605, respectively.
Derivatives: A derivative is a financial instrument whose performance is derived from the performance of another asset. The fund enters into International Swaps and Derivatives Association, Inc. Master Agreements or similar agreements (collectively, “Master Agreements”) with its OTC derivative contract counterparties in order to, among other things, reduce its credit risk to counterparties. Master Agreements include provisions for general obligations, representations, collateral and events of default or termination. Under a Master Agreement, the fund may offset with the counterparty certain derivative financial instrument’s payables and/or receivables with collateral held and/or posted and create one single net payment in the event of default or termination.
Each type of derivative instrument that was held by the fund during the period ended October 31, 2018 is discussed below.
Futures: In the normal course of pursuing its investment objective, the fund is exposed to market risk, including interest rate risk, as a result of changes in value of underlying financial instruments. The fund invests in futures in order to manage its exposure to or protect against changes in the market. A futures contract represents a commitment for the future purchase or a sale of an asset at a specified date. Upon entering into such contracts, these investments require initial margin deposits with a counterparty, which consist of cash or cash equivalents. The amount of these deposits is determined by the exchange or Board of Trade on which the contract is traded and is subject to change. Accordingly, variation margin payments are received or made to reflect daily unrealized gains or losses which are recorded in the Statement of Operations. When the contracts are closed, the fund recognizes a realized gain or loss which is
43
NOTES TO FINANCIAL STATEMENTS (continued)
reflected in the Statement of Operations. There is minimal counterparty credit risk to the fund with futures since they are exchange traded, and the exchange guarantees the futures against default. Futures open at October 31, 2018 are set forth in the Statement of Futures.
Options Transactions: The fund purchases and writes (sells) put and call options to hedge against changes in the values of interest rates, or as a substitute for an investment. The fund is subject to market risk and interest rate risk in the course of pursuing its investment objectives through its investments in options contracts. A call option gives the purchaser of the option the right (but not the obligation) to buy, and obligates the writer to sell, the underlying financial instrument at the exercise price at any time during the option period, or at a specified date. Conversely, a put option gives the purchaser of the option the right (but not the obligation) to sell, and obligates the writer to buy the underlying financial instrument at the exercise price at any time during the option period, or at a specified date.
As a writer of call options, the fund receives a premium at the outset and then bears the market risk of unfavorable changes in the price of the financial instrument underlying the option. Generally, the fund realizes a gain, to the extent of the premium, if the price of the underlying financial instrument decreases between the date the option is written and the date on which the option is terminated. Generally, the fund incurs a loss if the price of the financial instrument increases between those dates. The maximum payout for those contracts is limited to the number of call option contracts written and the related strike prices, respectively.
As a writer of put options, the fund receives a premium at the outset and then bears the market risk of unfavorable changes in the price of the financial instrument underlying the option. Generally, the fund realizes a gain, to the extent of the premium, if the price of the underlying financial instrument increases between the date the option is written and the date on which the option is terminated. Generally, the fund incurs a loss if the price of the financial instrument decreases between those dates. The maximum payout for those contracts is limited to the number of put option contracts written and the related strike prices, respectively.
As a writer of an option, the fund has no control over whether the underlying financial instrument may be sold (call) or purchased (put) and as a result bears the market risk of an unfavorable change in the price of the financial instrument underlying the written option. There is a risk of loss from a change in value of such options which may exceed the related premiums received. This risk may be mitigated by Master Agreements, if any, between the fund and the counterparty and the posting of collateral, if any, by the counterparty to the fund to cover the fund’s exposure to the
44
counterparty. The Statement of Operations reflects any unrealized gains or losses which occurred during the period as well as any realized gains or losses which occurred upon the expiration or closing of the option transaction.
Forward Foreign Currency Exchange Contracts: The fund enters into forward contracts in order to hedge its exposure to changes in foreign currency exchange rates on its foreign portfolio holdings, to settle foreign currency transactions or as a part of its investment strategy. When executing forward contracts, the fund is obligated to buy or sell a foreign currency at a specified rate on a certain date in the future. With respect to sales of forward contracts, the fund incurs a loss if the value of the contract increases between the date the forward contract is opened and the date the forward contract is closed. The fund realizes a gain if the value of the contract decreases between those dates. With respect to purchases of forward contracts, the fund incurs a loss if the value of the contract decreases between the date the forward contract is opened and the date the forward contract is closed. The fund realizes a gain if the value of the contract increases between those dates. Any realized or unrealized gains or losses which occurred during the period are reflected in the Statement of Operations. The fund is exposed to foreign currency risk as a result of changes in value of underlying financial instruments. The fund is also exposed to credit risk associated with counterparty nonperformance on these forward contracts, which is generally limited to the unrealized gain on each open contract. This risk may be mitigated by Master Agreements, if any, between the fund and the counterparty and the posting of collateral, if any, by the counterparty to the fund to cover the fund’s exposure to the counterparty. Forward contracts open at October 31, 2018 are set forth in the Statement of Forward Foreign Currency Exchange Contracts.
The following tables show the fund’s exposure to different types of market risk as it relates to the Statement of Assets and Liabilities and the Statement of Operations, respectively.
Fair value of derivative instruments as of October 31, 2018 is shown below:
45
NOTES TO FINANCIAL STATEMENTS (continued)
| | | | | | | | |
| | Derivative
Assets ($) | | | | Derivative
Liabilities ($) | |
Interest rate risk | 31,500 | 1 | Interest rate risk | (8,842) | 2 |
Foreign exchange risk | 913,748 | 3 | Foreign exchange risk | (242,290) | 3 |
Gross fair value of
derivative contracts | 945,248 | | | | (251,132) | |
| | | | | | | |
| | Statement of Assets and Liabilities location: | |
1 | Options purchased are included in Investments in securities—Unaffiliated issuers, at value. |
2 | Includes cumulative appreciation (depreciation) on futures as reported in the Statement of Futures, but only the
unpaid variation margin is reported in the Statement of Assets and Liabilities. |
3 | Unrealized appreciation (depreciation) on forward foreign currency exchange contracts. |
The effect of derivative instruments in the Statement of Operations during the period ended October 31, 2018 is shown below:
| | | | | | | | | | | |
Amount of realized gain (loss) on derivatives recognized in income ($) | |
Underlying
risk | Futures | 1 | Options
Transactions | 2 | Forward
Contracts | 3 | Total | | |
Interest
rate | (44,600) | | 113,860 | | - | | 69,260 | | |
Foreign
exchange | - | | - | | 1,032,299 | | 1,032,299 | | |
Total | (44,600) | | 113,860 | | 1,032,299 | | 1,101,559 | | |
| | | | | | | | | | |
Change in unrealized appreciation (depreciation)
on derivatives recognized in income ($) | |
Underlying
risk | Futures | 4 | Options
Transactions | 5 | Forward
Contracts | 6 | Total | | |
Interest
rate | 14,037 | | (49,068) | | - | | (35,031) | | |
Foreign
exchange | - | | - | | 491,417 | | 491,417 | | |
Total | 14,037 | | (49,068) | | 491,417 | | 456,386 | | |
| | | | | | | | | | | |
Statement of Operations location: | |
1 Net realized gain (loss) on futures. | |
2 Net realized gain (loss) on options transactions. |
3 Net realized gain (loss) on forward foreign currency exchange contracts. | |
4 Net unrealized appreciation (depreciation) on futures. | |
5 Net unrealized appreciation (depreciation) on options transactions. | |
6 Net unrealized appreciation (depreciation) on forward foreign currency exchange contracts. |
The provisions of ASC Topic 210 “Disclosures about Offsetting Assets and Liabilities” require disclosure on the offsetting of financial assets and liabilities. These disclosures are required for certain investments, including derivative financial instruments subject to Master Agreements which are eligible for offsetting in the Statement of Assets and Liabilities and require the fund to disclose both gross and net information with respect to such investments. For financial reporting purposes, the fund does not offset
46
derivative assets and derivative liabilities that are subject to Master Agreements in the Statement of Assets and Liabilities.
At October 31, 2018, derivative assets and liabilities (by type) on a gross basis are as follows:
| | | | | | |
Derivative Financial Instruments: | | Assets ($) | | Liabilities ($) | |
Futures | | - | | (8,842) | |
Options | | 31,500 | | - | |
Forward contracts | | 913,748 | | (242,290) | |
Total gross amount of derivative | | | | | |
assets and liabilities in the | | | | | |
Statement of Assets and Liabilities | | 945,248 | | (251,132) | |
Derivatives not subject to | | | | | |
Master Agreements | | (31,500) | | 8,842 | |
Total gross amount of assets | | | | | |
and liabilities subject to | | | | | |
Master Agreements | | 913,748 | | (242,290) | |
The following tables present derivative assets and liabilities net of amounts available for offsetting under Master Agreements and net of related collateral received or pledged, if any, as of October 31, 2018:
| | | | | | | |
| | | | Financial | | | |
| | | | Instruments | | | |
| | | | and Derivatives | | | |
| | Gross Amount of | | Available | Collateral | | Net Amount of |
Counterparty | Assets ($) | 1 | for Offset ($) | Received ($) | 2 | Assets ($) |
CIBC World Markets Corp. | 65,755 | | (3,341) | - | | 62,414 |
Citigroup | 92,227 | | (67,248) | - | | 24,979 |
RBS Securities | 193,634 | | (95,454) | - | | 98,180 |
State Street Bank
and Trust Company | 515,892 | | (58,539) | (280,000) | | 177,353 |
UBS Securities | 46,240 | | (17,708) | - | | 28,532 |
Total | 913,748 | | (242,290) | (280,000) | | 391,458 |
| | | | | | | |
47
NOTES TO FINANCIAL STATEMENTS (continued)
| | | | | | | |
| | | | Financial | | | |
| | | | Instruments | | | |
| | | | and Derivatives | | | |
| | Gross Amount of | | Available | Collateral | | Net Amount of |
Counterparty | Liabilities ($) | 1 | for Offset ($) | Pledged ($) | 2 | Liabilities ($) |
CIBC World Markets Corp. | (3,341) | | 3,341 | - | | - |
Citigroup | (67,248) | | 67,248 | - | | - |
RBS Securities | (95,454) | | 95,454 | - | | - |
State Street Bank
and Trust Company | (58,539) | | 58,539 | - | | - |
UBS Securities | (17,708) | | 17,708 | - | | - |
Total | (242,290) | | 242,290 | - | | - |
| | | | | | | |
1 Absent a default event or early termination, OTC derivative assets and liabilities are presented at gross amounts and are not offset in the Statement of Assets and Liabilities. |
2 In some instances, the actual collateral received and/or pledged may be more than the amount shown due to over collateralization. |
The following summarizes the average market value of derivatives outstanding during the period ended October 31, 2018:
| | | |
| | Average Market Value ($) |
Interest rate futures | | 2,947,925 |
Interest rate options contracts | | 47,284 |
Forward contracts | | 30,348,858 |
| | | |
At October 31, 2018, the cost of investments for federal income tax purposes was $68,273,184; accordingly, accumulated net unrealized depreciation on investments inclusive of derivative contracts was $2,406,577, consisting of $399,101 gross unrealized appreciation and $2,805,678 gross unrealized depreciation.
48
REPORT OF INDEPENDENT REGISTERED PUBLIC ACCOUNTING FIRM
To the Shareholders and the Board of Directors of Dreyfus Global Dynamic Bond Income Fund (formerly, Dreyfus Global Dynamic Bond Fund)
Opinion on the Financial Statements
We have audited the accompanying statement of assets and liabilities of Dreyfus Global Dynamic Bond Income Fund (the “Fund”) (formerly, Dreyfus Global Dynamic Bond Fund) (one of the funds constituting Advantage Funds, Inc.), including the statements of investments, investments in affiliated issuers, futures, and forward foreign currency exchange contracts, as of October 31, 2018, and the related statement of operations for the year then ended, the statements of changes in net assets for each of the two years in the period then ended, the financial highlights for each of the five years in the period then ended and the related notes (collectively referred to as the “financial statements”). In our opinion, the financial statements present fairly, in all material respects, the financial position of the Fund (one of the funds constituting Advantage Funds, Inc.) at October 31, 2018, the results of its operations for the year then ended, the changes in its net assets for each of the two years in the period then ended and its financial highlights for each of the five years in the period then ended, in conformity with U.S. generally accepted accounting principles.
Basis for Opinion
These financial statements are the responsibility of the Fund’s management. Our responsibility is to express an opinion on the Fund’s financial statements based on our audits. We are a public accounting firm registered with the Public Company Accounting Oversight Board (United States) (“PCAOB”) and are required to be independent with respect to the Fund in accordance with the U.S. federal securities laws and the applicable rules and regulations of the Securities and Exchange Commission and the PCAOB.
We conducted our audits in accordance with the standards of the PCAOB. Those standards require that we plan and perform the audit to obtain reasonable assurance about whether the financial statements are free of material misstatement, whether due to error or fraud. The Fund is not required to have, nor were we engaged to perform, an audit of the Fund’s internal control over financial reporting. As part of our audits, we are required to obtain an understanding of internal control over financial reporting, but not for the purpose of expressing an opinion on the effectiveness of the Fund’s internal control over financial reporting. Accordingly, we express no such opinion.
Our audits included performing procedures to assess the risks of material misstatement of the financial statements, whether due to error or fraud, and performing procedures that respond to those risks. Such procedures included examining, on a test basis, evidence regarding the amounts and disclosures in the financial statements. Our procedures included confirmation of securities owned as of October 31, 2018, by correspondence with the custodian and others or by other appropriate auditing procedures where replies from others were not received. Our audits also included evaluating the accounting principles used and significant estimates made by management, as well as evaluating the overall presentation of the financial statements. We believe that our audits provide a reasonable basis for our opinion.

We have served as the auditor of one or more Dreyfus investment companies since at least 1957, but we are unable to determine the specific year.
New York, New York
December 28, 2018
49
BOARD MEMBERS INFORMATION (Unaudited)
INDEPENDENT BOARD MEMBERS
Joseph S. DiMartino (75)
Chairman of the Board (1995)
Principal Occupation During Past 5 Years:
· Corporate Director and Trustee (1995-present)
Other Public Company Board Memberships During Past 5 Years:
· CBIZ (formerly, Century Business Services, Inc.), a provider of outsourcing functions for small and medium size companies, Director (1997-present)
No. of Portfolios for which Board Member Serves: 124
———————
Peggy C. Davis (75)
Board Member (2006)
Principal Occupation During Past 5 Years:
· Shad Professor of Law, New York University School of Law (1983-present)
No. of Portfolios for which Board Member Serves: 45
———————
David P. Feldman (78)
Board Member (1996)
Principal Occupation During Past 5 Years:
· Corporate Director and Trustee (1985-present)
Other Public Company Board Memberships During Past 5 Years:
· BBH Mutual Funds Group (5 registered mutual funds), Director (1992-2014)
No. of Portfolios for which Board Member Serves: 31
———————
Joan Gulley (71)
Board Member (2017)
Principal Occupation During Past 5 Years:
· PNC Financial Services Group, Inc.(1993-2014), Executive Vice President and Chief Human Resources Officer and Executive Committee Member (2008-2014)
No. of Portfolios for which Board Member Serves: 52
———————
50
Ehud Houminer (78)
Board Member (1993)
Principal Occupation During Past 5 Years:
· Board of Overseers at the Columbia Business School, Columbia University (1992-present)
· Trustee, Ben Gurion University
No. of Portfolios for which Board Member Serves: 52
———————
Lynn Martin (78)
Board Member (2012)
Principal Occupation During Past 5 Years:
· President of The Martin Hall Group LLC, a human resources consulting firm (2005-2012)
No. of Portfolios for which Board Member Serves: 31
———————
Robin A. Melvin (55)
Board Member (2012)
Principal Occupation During Past 5 Years:
· Co-chairman, Illinois Mentoring Partnership, non-profit organization dedicated to increasing the quantity and quality of mentoring services in Illinois; (2014-present; board member since 2013)
No. of Portfolios for which Board Member Serves: 99
———————
Dr. Martin Peretz (79)
Board Member (2006)
Principal Occupation During Past 5 Years:
· Editor-in-Chief Emeritus of The New Republic Magazine (2011-2012) (previously,
Editor-in-Chief, 1974-2011)
· Lecturer at Harvard University (1968-2010)
No. of Portfolios for which Board Member Serves: 31
———————
Once elected all Board Members serve for an indefinite term, but achieve Emeritus status upon reaching age 80. The address of the Board Members and Officers is c/o The Dreyfus Corporation, 200 Park Avenue, New York, New York 10166. Additional information about the Board Members is available in the fund’s Statement of Additional Information which can be obtained from Dreyfus free of charge by calling this toll free number: 1-800-DREYFUS.
James F. Henry, Emeritus Board Member
Philip L. Toia, Emeritus Board Member
51
OFFICERS OF THE FUND (Unaudited)
BRADLEY J. SKAPYAK, President since January 2010.
Chief Operating Officer and a director of the Manager since June 2009, Chairman of Dreyfus Transfer, Inc., an affiliate of the Manager and the transfer agent of the funds, since May 2011 and Chief Executive Officer of MBSC Securities Corporation since August 2016. He is an officer of 62 investment companies (comprised of 124 portfolios) managed by the Manager. He is 59 years old and has been an employee of the Manager since February 1988.
BENNETT A. MACDOUGALL, Chief Legal Officer since October 2015.
Chief Legal Officer of the Manager and Associate General Counsel and Managing Director of BNY Mellon since June 2015; from June 2005 to June 2015, he served in various capacities with Deutsche Bank – Asset & Wealth Management Division, including as Director and Associate General Counsel, and Chief Legal Officer of Deutsche Investment Management Americas Inc. from June 2012 to May 2015. He is an officer of 63 investment companies (comprised of 149 portfolios) managed by the Manager. He is 47 years old and has been an employee of the Manager since June 2015.
JAMES BITETTO, Vice President since August 2005 and Secretary since February 2018.
Managing Counsel of BNY Mellon and Secretary of the Manager, and an officer of 63 investment companies (comprised of 149 portfolios) managed by the Manager. He is 52 years old and has been an employee of the Manager since December 1996.
JOSEPH M. CHIOFFI, Vice President and Assistant Secretary since August 2005.
Managing Counsel of BNY Mellon, and an officer of 63 investment companies (comprised of 149 portfolios) managed by the Manager. He is 56 years old and has been an employee of the Manager since June 2000.
SONALEE CROSS, Vice President and Assistant Secretary since March 2018.
Counsel of BNY Mellon since October 2016; Associate at Proskauer Rose LLP from April 2016 to September 2016; Attorney at EnTrust Capital from August 2015 to February 2016; Associate at Sidley Austin LLP from September 2013 until August 2015. She is an officer of 63 investment companies (comprised of 149 portfolios) managed by Dreyfus. She is 31 years old and has been an employee of the Manager since October 2016.
MAUREEN E. KANE, Vice President and Assistant Secretary since April 2015.
Managing Counsel of BNY Mellon since July 2014; from October 2004 until July 2014, General Counsel, and from May 2009 until July 2014, Chief Compliance Officer of Century Capital Management. She is an officer of 63 investment companies (comprised of 149 portfolios) managed by the Manager. She is 56 years old and has been an employee of the Manager since July 2014.
SARAH S. KELLEHER, Vice President and Assistant Secretary since April 2014.
Managing Counsel of BNY Mellon since December 2017, from March 2013 to December 2017, Senior Counsel of BNY Mellon. She is an officer of 63 investment companies (comprised of 149 portfolios) managed by the Manager. She is 43 years old and has been an employee of the Manager since March 2013.
JEFF PRUSNOFSKY, Vice President and Assistant Secretary since August 2005.
Senior Managing Counsel of BNY Mellon, and an officer of 63 investment companies (comprised of 149 portfolios) managed by the Manager. He is 53 years old and has been an employee of the Manager since October 1990.
NATALYA ZELENSKY, Vice President and Assistant Secretary since March 2017.
Counsel of BNY Mellon since May 2016; Attorney at Wildermuth Endowment Strategy Fund/Wildermuth Advisory, LLC from November 2015 until May 2016; Assistant General Counsel at RCS Advisory Services from July 2014 until November 2015; Associate at Sutherland, Asbill & Brennan from January 2013 until January 2014. She is an officer of 63 investment companies (comprised of 149 portfolios) managed by Dreyfus. She is 33 years old and has been an employee of the Manager since May 2016.
JAMES WINDELS, Treasurer since November 2001.
Director – Mutual Fund Accounting of the Manager, and an officer of 63 investment companies (comprised of 149 portfolios) managed by the Manager. He is 60 years old and has been an employee of the Manager since April 1985.
52
GAVIN C. REILLY, Assistant Treasurer since December 2005.
Tax Manager of the Investment Accounting and Support Department of the Manager, and an officer of 63 investment companies (comprised of 149 portfolios) managed by the Manager. He is 50 years old and has been an employee of the Manager since April 1991.
ROBERT S. ROBOL, Assistant Treasurer since December 2002.
Senior Accounting Manager – Dreyfus Financial Reporting of the Manager, and an officer of 63 investment companies (comprised of 149 portfolios) managed by the Manager. He is 54 years old and has been an employee of the Manager since October 1988.
ROBERT SALVIOLO, Assistant Treasurer since July 2007.
Senior Accounting Manager – Equity Funds of the Manager, and an officer of 63 investment companies (comprised of 149 portfolios) managed by the Manager. He is 51 years old and has been an employee of the Manager since June 1989.
ROBERT SVAGNA, Assistant Treasurer since December 2002.
Senior Accounting Manager – Fixed Income and Equity Funds of the Manager, and an officer of 63 investment companies (comprised of 149 portfolios) managed by the Manager. He is 51 years old and has been an employee of the Manager since November 1990.
JOSEPH W. CONNOLLY, Chief Compliance Officer since October 2004.
Chief Compliance Officer of the Manager, the Dreyfus Family of Funds and BNY Mellon Funds Trust (63 investment companies, comprised of 149 portfolios). He is 61 years old and has served in various capacities with the Manager since 1980, including manager of the firm’s Fund Accounting Department from 1997 through October 2001.
CARIDAD M. CAROSELLA, Anti-Money Laundering Compliance Officer since January 2016.
Anti-Money Laundering Compliance Officer of the Dreyfus Family of Funds and BNY Mellon Funds Trust since January 2016; from May 2015 to December 2015, Interim Anti-Money Laundering Compliance Officer of the Dreyfus Family of Funds and BNY Mellon Funds Trust and the Distributor; from January 2012 to May 2015, AML Surveillance Officer of the Distributor and from 2007 to December 2011, Financial Processing Manager of the Distributor. She is an officer of 57 investment companies (comprised of 143 portfolios) managed by the Manager. She is 50 years old and has been an employee of the Distributor since 1997.
53
Dreyfus Global Dynamic Bond Income Fund
200 Park Avenue
New York, NY 10166
Manager
The Dreyfus Corporation
200 Park Avenue
New York, NY 10166
Sub-Investment Adviser
Newton Investment Management
(North America) Limited
160 Queen Victoria Street
London, EC4V, 4LA, UK
Custodian
The Bank of New York Mellon
240 Greenwich Street
New York, NY 10286
Transfer Agent &
Dividend Disbursing Agent
Dreyfus Transfer, Inc.
200 Park Avenue
New York, NY 10166
Distributor
MBSC Securities Corporation
200 Park Avenue
New York, NY 10166
| | |
Ticker Symbols: | Class A: DGDAX Class C: DGDCX Class I: DGDIX Class Y: DGDYX |
Telephone Call your financial representative or 1-800-DREYFUS
Mail The Dreyfus Family of Funds, 144 Glenn Curtiss Boulevard, Uniondale, NY 11556-0144
E-mail Send your request to info@dreyfus.com
Internet Information can be viewed online or downloaded at www.dreyfus.com
The fund files its complete schedule of portfolio holdings with the Securities and Exchange Commission (“SEC”) for the first and third quarters of each fiscal year on Form N-Q. The fund’s Forms N-Q are available on the SEC’s website at www.sec.gov.
A description of the policies and procedures that the fund uses to determine how to vote proxies relating to portfolio securities and information regarding how the fund voted these proxies for the most recent 12-month period ended June 30 is available at www.dreyfus.com and on the SEC’s website at www.sec.gov and without charge, upon request, by calling 1-800-DREYFUS.
| | |
© 2018 MBSC Securities Corporation
6298AR1018 | 
|
Dreyfus Total Emerging Markets Fund
| | | |

| | ANNUAL REPORT October 31, 2018 |
| |
Save time. Save paper. View your next shareholder report online as soon as it’s available. Log into www.dreyfus.com and sign up for Dreyfus eCommunications. It’s simple and only takes a few minutes. |
| |
The views expressed in this report reflect those of the portfolio manager(s) only through the end of the period covered and do not necessarily represent the views of Dreyfus or any other person in the Dreyfus organization. Any such views are subject to change at any time based upon market or other conditions and Dreyfus disclaims any responsibility to update such views. These views may not be relied on as investment advice and, because investment decisions for a Dreyfus fund are based on numerous factors, may not be relied on as an indication of trading intent on behalf of any Dreyfus fund. |
| |
Not FDIC-Insured • Not Bank-Guaranteed • May Lose Value |
Contents
THE FUND
FOR MORE INFORMATION
Back Cover
| | | | |
| |
Dreyfus Total Emerging Markets Fund
| | The Fund |
A LETTER FROM THE PRESIDENT OF DREYFUS
Dear Shareholder:
We are pleased to present this annual report for Dreyfus Total Emerging Markets Fund, covering the 12-month period from November 1, 2017 through October 31, 2018. For information about how the fund performed during the reporting period, as well as general market perspectives, we provide a Discussion of Fund Performance on the pages that follow.
Markets began the reporting period on solid footing as major global economies experienced above-trend growth across the board. In the United States, the Federal Reserve continued to move away from its accommodative monetary policy while other major central banks also began to consider monetary tightening. In the equity markets, both U.S. and non-U.S. markets enjoyed an upward trend, though investor concerns about volatility and inflation later began to weigh on returns. Interest rates rose across the curve, putting pressure on bond prices.
Later in the reporting period, global growth trends began to diverge. While a strong economic performance continued to bolster U.S. equity markets, slower growth and political concerns pressured markets in the Eurozone. Emerging markets also came under pressure as weakness in their currencies added to investors’ uneasiness. Fixed income markets continued to struggle as interest rates rose; the yield on the benchmark 10-year Treasury bond surged late in the reporting period, but growing investor concerns about global growth helped keep it from rising further.
Despite continuing doubts regarding trade, U.S. inflationary pressures, and global growth, we are optimistic that the U.S. economy will remain strong in the near term. However, we will stay attentive to signs that signal potential changes on the horizon. As always, we encourage you to discuss the risks and opportunities of today’s investment environment with your financial advisor.
Thank you for your continued confidence and support.
Sincerely,

Renee Laroche-Morris
PresidentThe Dreyfus Corporation
November 15, 2018
2
DISCUSSION OF FUND PERFORMANCE (Unaudited)
For the period from November 1, 2017 through October 31, 2018, as provided by Sean P. Fitzgibbon, Federico Garcia Zamora, and Josephine Shea, Portfolio Managers
Market and Fund Performance Overview
For the 12-month period ended October 31, 2018, Dreyfus Total Emerging Markets Fund’s
Class A shares produced a total return of -14.81%, Class C shares returned -15.40%, Class I shares returned -14.53%, and Class Y shares returned -14.51%.1 In comparison, the MSCI Emerging Markets Index, the fund’s benchmark, returned -12.52% for the same period.2 The fund’s secondary benchmark index, the hybrid “Customized Blended Index,” returned
-10.22% for the same period. The Customized Blended Index is a blend of 70% MSCI Emerging Markets Index/15% J.P. Morgan GB Index-EM Global Diversified/7.5% J.P. Morgan EMB Index Global/7.5% J.P. Morgan CEMB Index Diversified.2,3,4,5,6
Emerging-market equities and bonds lost ground during the period on geopolitical tensions, increasing trade tensions and rising interest rates. The fund lagged its primary benchmark, the MSCI Emerging Markets Index, as well as its secondary benchmark, the Customized Blended Index. In equities, the shortfall was primarily due to positioning within the energy and materials sectors. In fixed income, exposure to Argentina was the strongest headwind.
The Fund’s Investment Approach
The fund seeks to maximize total return. To pursue its goal, the fund normally invests at least 80% of its net assets, plus any borrowings for investment purposes, in the securities of emerging-market issuers and other investments that are tied economically to emerging-market countries. The fund normally allocates its investments among emerging-market equities, bonds, and currencies.
The portfolio construction process starts with the fund’s portfolio managers assessing the risk and return expectations of equities, bonds, and currencies for each emerging-market country over a 12-month period. These expectations are guided primarily by the portfolio managers’ common global macroeconomic view and top-down country-specific outlooks. Moreover, these expectations also reflect the portfolio managers’ bottom-up valuation assessments of individual securities. The fund’s assets are then allocated to what we consider the more attractive emerging-market asset classes and countries. After making asset and country allocation decisions, the portfolio managers select individual securities for the fund’s portfolio.
In choosing bonds and currency investments for the fund, the portfolio managers rely on in-depth fundamental analysis. In considering the attractiveness of local currency exposures (through investment in forward contracts, bonds, or equities), the portfolio managers focus, among other things, on the balance-of-payments outlook for the relevant country. In choosing equity investments for the fund, the portfolio managers rely on in-depth fundamental analysis supported by proprietary quantitative models.
Emerging Markets Rebound, Then Reverse Course
Emerging-market equities benefited broadly from positive global economic trends during the first four months of the reporting period. Corporate earnings growth gained momentum across most industry groups and geographic regions. Strengthening global demand for
3
DISCUSSION OF FUND PERFORMANCE (Unaudited) (continued)
commodities bolstered markets that export raw materials and energy, such as Russia and Brazil. Strong information technology and financials sector performance drove gains in China. South Korea benefited from easing regional political tensions.
Global equity markets, including most emerging markets, dipped sharply in February 2018 in response to concerns about renewed inflationary pressures in the United States. In March, the prospect of potential U.S. trade restrictions sparked additional market declines. Markets steadied after the initial sell-off, but as U.S. rates and yields resumed their upward trend in April, alongside a rising oil price, the heightened inflation expectations resulted in the U.S. dollar strengthening. This was a headwind for all emerging-market currencies to varying degrees, particularly those of Argentina and Turkey, which depreciated significantly. The rising U.S./China trade tensions, as well as political and economic difficulties in parts of South America, have all further weighed on sentiment.
Emerging bond markets peaked in January 2018. Since then, markets have become increasingly volatile in response to concerns about rising interest rates, dollar strength, and trade disputes.
Equity Returns Driven by Security Selections
The fund trailed the MSCI Emerging Markets Index during the period, largely due to security selection within Brazilian and Chinese companies. Underperforming Brazil-based holdings included Estácio Participações, a traditional and online secondary education company, which has been hurt by the recession in Brazil, and oil company Petrobras, which saw its stock price fall after government subsidies were reenacted. We have since liquidated our position in Petrobras. In China, a position in Sunny Optical Technology Group hurt returns when the stock price fell due to pressure from trade disputes. The price of Beijing Capital International Airport also fell during the period. The company’s revenues were hurt by regulators’ decision to discontinue a revenue-sharing agreement. From a sector perspective, investments in energy and materials also detracted.
Conversely, positions in India, Mexico and South Africa helped relative returns. India-based financial company ICICI Bank saw its stock price appreciate after a management change. In Mexico, increased air traffic led Grupo Aeroportuario del Centro Norte SAB shares higher, helping relative returns. A position in discount retailer Wal-Mart de México also benefited returns due to a rising stock price on the back of strong earnings. A position in South African pharmaceutical retailer Clicks Group also contributed. From a sector perspective, decisions in information technology and real estate were also additive.
The largest headwind to the fund’s fixed-income portfolio was positioning in Argentina, specifically an overweight to the Argentine peso. In addition, exposure to the Czech koruna also detracted. Conversely, the fund’s currency positioning added value through overweight positions to the Malaysian ringgit and Brazilian real. Positioning within the Mexican peso was also additive. The fund employed forward contracts to establish its currency positioning.
Constructively Positioned for a Changing Landscape
The emerging-market investment landscape has changed over the past year. Volatility brought on by developed versus emerging country growth differentials, geopolitical disputes, and a strengthening dollar has put downward pressure on valuations. However, this pullback in prices has adjusted valuations and may be a buying opportunity.
4
In fixed income, external drivers that move the asset class are still constructive. Commodity prices continue to be supported by a healthy global growth outlook. An expensive valuation and weakening fundamentals may put downward pressure on the U.S. dollar. All of these factors provide a positive outlook for emerging-market debt. In equities, exposure to China has been reduced in light of recent tensions and the possibility of a slowing economy. Exposure to India and South Korea has increased. The team has also reduced energy exposure in favor of a larger financial sector allocation. A portion of the fund previously invested in consumer discretionary stocks has been moved to the more defensive consumer staples sector.
November 15, 2018
¹ Total return includes reinvestment of dividends and any capital gains paid and does not take into consideration the maximum initial sales charge in the case of Class A shares, or the applicable contingent deferred sales charges imposed on redemptions in the case of Class C shares. Had these charges been reflected, returns would have been lower. Past performance is no guarantee of future results. Share price, yield, and investment return fluctuate such that upon redemption, fund shares may be worth more or less than their original cost. Return figures provided reflect the absorption of certain fund expenses by The Dreyfus Corporation pursuant to an agreement in effect until March 1, 2019, at which time it may be extended, terminated, or modified. Had these expenses not been absorbed, the fund’s returns would have been lower for Class A, Class C, Class I, and Class Y.
2 Source: Lipper Inc. — The MSCI Emerging Markets Index is a free float-adjusted, market capitalization-weighted index that is designed to measure the equity market performance of emerging markets. It reflects reinvestment of net dividends and, where applicable, capital gain distributions. Investors cannot invest directly in any index.
3 Source: Lipper Inc. — The J.P. Morgan GB Index-EM Global Diversified tracks total returns for U.S. dollar-denominated debt instruments issued by emerging-market sovereign and quasi-sovereign entities: Brady bonds, loans, and Eurobonds. The index limits the exposure of some of the larger countries. Investors cannot invest directly in any index.
4 Source: Lipper Inc. — The J.P. Morgan EMB Index Global tracks the total return for the U.S. dollar-denominated emerging-market debt, including Brady bonds, Eurobonds, and loans. Investors cannot invest directly in any index.
5 Source: Lipper Inc. — The J.P. Morgan CEMB Index Diversified tracks U.S. dollar-denominated debt issued by emerging-market corporations. The diversified index limits the exposure of some of the larger countries. Investors cannot invest directly in any index.
6 Source: FactSet — The Customized Blended Index is an unmanaged hybrid index composed of 70% MSCI Emerging Markets Index /15% J.P. Morgan GB Index-EM Global Diversified /7.5% J.P. Morgan EMB Index Global/7.5% J.P. Morgan CEMB Index Diversified. Investors cannot invest directly in any index.
Please note: the position in any security highlighted with italicized typeface was sold during the reporting period.
Equities are subject generally to market, market sector, market liquidity, issuer, and investment style risks, among other factors, to varying degrees, all of which are more fully described in the fund’s prospectus.
Bonds are subject generally to interest-rate, credit, liquidity, and market risks, to varying degrees, all of which are more fully described in the fund’s prospectus. Generally, all other factors being equal, bond prices are inversely related to interest-rate changes, and rate increases can cause price declines.
Emerging markets tend to be more volatile than the markets of more mature economies and generally have less diverse and less mature economic structures and less stable political systems than those of developed countries. The securities of companies located in emerging markets are often subject to rapid and large changes in price. An investment in this fund should be considered only as a supplement to a complete investment program for those investors willing to accept the greater risks associated with investing in emerging-market countries.
Investing internationally involves special risks, including changes in currency exchange rates, political, economic, and social instability, a lack of comprehensive company information, differing auditing and legal standards, and less market liquidity. These risks generally are greater with emerging-market countries than with more economically and politically established foreign countries.
5
FUND PERFORMANCE (Unaudited)

Comparison of change in value of $10,000 investment in Dreyfus Total Emerging Markets Fund Class A shares, Class C shares, Class I shares and Class Y shares and the MSCI Emerging Markets Index and a 70% MSCI Emerging Markets Index/15% J.P. Morgan GB Index-EM Global Diversified/7.5% J.P. Morgan EMB Index Global/7.5% J.P. Morgan CEMB Index Diversified Index (the “Customized Blended Index”)
† Source: Lipper Inc.
†† Source: FactSet
††† The total return figures presented for Class Y shares of the fund reflect the performance of the fund’s Class A shares for the period prior to 7/1/13 (the inception date for Class Y shares), not reflecting the applicable sales charges on Class A shares.
Past performance is not predictive of future performance.
The above graph compares a $10,000 investment made in each of the Class A, Class C, Class I and Class Y shares of Dreyfus Total Emerging Markets Fund on 3/25/11 (inception date) to a $10,000 investment made in the MSCI Emerging Markets Index and Customized Blended Index. All dividends and capital gain distributions are reinvested.
The fund’s performance shown in the line graph above takes into account the maximum initial sales charge on Class A shares and all other applicable fees and expenses on all classes. The MSCI Emerging Markets Index is a free float-adjusted market capitalization-weighted index that is designed to measure equity market performance of emerging markets. The J.P. Morgan GB Index-EM Global Diversified tracks total returns for U.S.-dollar-denominated debt instruments issued by emerging market sovereign and quasi-sovereign entities: Brady bonds, loans, and Eurobonds. The index limits the exposure of some of the larger countries. The J.P. Morgan EMB Index Global tracks the total return for the U.S. dollar-denominated emerging markets debt, including Brady bonds, Eurobonds and loans. The J.P. Morgan CEMB Index Diversified tracks U.S. dollar-denominated debt issued by emerging market corporations. The diversified index limits the exposure of some of the larger countries. Unlike a mutual fund, the indices are not subject to charges, fees and other expenses. Investors cannot invest directly in any index. Further information relating to fund performance, including expense reimbursements, if applicable, is contained in the Financial Highlights section of the prospectus and elsewhere in this report.
6
| | | | | |
Average Annual Total Returns as of 10/31/18 |
| | Inception | | | From |
| Date | 1 Year | 5 Year | Inception |
Class A shares | | | | |
with maximum sales charge (5.75%) | 3/25/11 | -19.73% | 0.02% | -0.01% |
without sales charge | 3/25/11 | -14.81% | 1.22% | 0.77% |
Class C shares | | | | |
with applicable redemption charge† | 3/25/11 | -16.23% | 0.48% | 0.02% |
without redemption | 3/25/11 | -15.40% | 0.48% | 0.02% |
Class I shares | 3/25/11 | -14.53% | 1.52% | 1.05% |
Class Y shares | 7/1/13 | -14.51% | 1.53% | 1.02%†† |
MSCI Emerging Markets Index | 3/31/11 | -12.52% | 0.78% | -0.19%††† |
Customized Blended Index | 3/31/11 | -10.22% | 0.87% | 0.61%††† |
† The maximum contingent deferred sales charge for Class C shares is 1% for shares redeemed within one year of the date of purchase.
†† The total return performance figures presented for Class Y shares of the fund reflect the performance of the fund’s Class A shares for the period prior to 7/1/13 (the inception date for Class Y shares), not reflecting the applicable sales charges for Class A shares.
††† For comparative purposes, the value of each Index as of 3/31/11 is used as the beginning value on 3/25/11.
The performance data quoted represents past performance, which is no guarantee of future results. Share price and investment return fluctuate and an investor’s shares may be worth more or less than original cost upon redemption. Current performance may be lower or higher than the performance quoted. Go to Dreyfus.com for the fund’s most recent month-end returns.
The fund’s performance shown in the graph and table does not reflect the deduction of taxes that a shareholder would pay on fund distributions or the redemption of fund shares. In addition to the performance of Class A shares shown with and without a maximum sales charge, the fund’s performance shown in the table takes into account all other applicable fees and expenses on all classes.
7
UNDERSTANDING YOUR FUND’S EXPENSES (Unaudited)
As a mutual fund investor, you pay ongoing expenses, such as management fees and other expenses. Using the information below, you can estimate how these expenses affect your investment and compare them with the expenses of other funds. You also may pay one-time transaction expenses, including sales charges (loads) and redemption fees, which are not shown in this section and would have resulted in higher total expenses. For more information, see your fund’s prospectus or talk to your financial adviser.
Review your fund’s expenses
The table below shows the expenses you would have paid on a $1,000 investment in Dreyfus Total Emerging Markets Fund from May 1, 2018 to October 31, 2018. It also shows how much a $1,000 investment would be worth at the close of the period, assuming actual returns and expenses.
| | | | | | | | | | | |
Expenses and Value of a $1,000 Investment | | |
assuming actual returns for the six months ended October 31, 2018 |
| | | Class A | | Class C | | Class I | | Class Y |
Expenses paid per $1,000† | | $7.34 | | $10.76 | | $5.92 | | $5.87 |
Ending value (after expenses) | | $818.90 | | $816.20 | | $820.60 | | $820.70 |
COMPARING YOUR FUND’S EXPENSES
WITH THOSE OF OTHER FUNDS (Unaudited)
Using the SEC’s method to compare expenses
The Securities and Exchange Commission (“SEC”) has established guidelines to help investors assess fund expenses. Per these guidelines, the table below shows your fund’s expenses based on a $1,000 investment, assuming a hypothetical 5% annualized return. You can use this information to compare the ongoing expenses (but not transaction expenses or total cost) of investing in the fund with those of other funds. All mutual fund shareholder reports will provide this information to help you make this comparison. Please note that you cannot use this information to estimate your actual ending account balance and expenses paid during the period.
| | | | | | | | | |
Expenses and Value of a $1,000 Investment |
assuming a hypothetical 5% annualized return for the six months ended October 31, 2018 |
| | | Class A | | Class C | | Class I | | Class Y |
Expenses paid per $1,000† | | $8.13 | | $11.93 | | $6.56 | | $6.51 |
Ending value (after expenses) | | $1,017.14 | | $1,013.36 | | $1,018.70 | | $1,018.75 |
† Expenses are equal to the fund’s annualized expense ratio of 1.60% for Class A, 2.35% for Class C, 1.29% for Class I and 1.28% for Class Y, multiplied by the average account value over the period, multiplied by 184/365 (to reflect the one-half year period).
8
STATEMENT OF INVESTMENTS
October 31, 2018
| | | | | | | | | | |
| |
Description | Coupon
Rate (%) | | Maturity
Date | | Principal
Amount ($) | a | Value ($) | |
Bonds and Notes - 28.4% | | | | | |
Argentina - 3.3% | | | | | |
Argentina POM Politica Monetaria,
Unscd. Bonds, ARLLMONP FLAT | ARS | 42.82 | | 6/21/2020 | | 5,055,000 | b | 159,574 | |
Argentine Government,
Sr. Unscd. Notes | ARS | 5.83 | | 12/31/2033 | | 20,876,240 | c | 663,478 | |
Autonomous City of Buenos Aires Argentina,
Unscd. Bonds, Ser. 22, BADLAR + 3.25% | ARS | 38.69 | | 3/29/2024 | | 36,485,000 | b | 921,563 | |
Autonomous City of Buenos Aires Argentina,
Unscd. Bonds, Ser. 23, BADLAR + 3.75% | ARS | 35.69 | | 2/22/2028 | | 5,970,000 | b | 147,677 | |
Bonos de la Nacion Argentina Con Ajuste Por,
Unscd. Bonds | ARS | 4.00 | | 3/6/2020 | | 31,857,409 | c | 846,184 | |
Provincia de Buenos Aires/Argentina,
Unscd. Bonds, BADLAR + 3.75% | ARS | 40.61 | | 4/12/2025 | | 25,550,000 | b,d | 641,663 | |
Provincia de Buenos Aires/Argentina,
Unscd. Bonds, BADLAR + 3.83% | ARS | 36.25 | | 5/31/2022 | | 14,697,000 | b | 375,107 | |
| | 3,755,246 | |
Azerbaijan - .5% | | | | | |
Southern Gas Corridor,
Govt. Gtd. Bonds | | 6.88 | | 3/24/2026 | | 500,000 | | 537,859 | |
Bahrain - .2% | | | | | |
Bahraini Government,
Sr. Unscd. Bonds | | 7.00 | | 10/12/2028 | | 290,000 | | 284,003 | |
Brazil - .2% | | | | | |
Natura Cosmeticos,
Sr. Unscd. Notes | | 5.38 | | 2/1/2023 | | 225,000 | d | 219,883 | |
British Virgin - 1.2% | | | | | |
Sinopec Group Overseas Development 2018,
Gtd. Notes | | 3.75 | | 9/12/2023 | | 675,000 | d | 667,199 | |
State Grid Overseas Investment 2016,
Gtd. Notes | | 3.50 | | 5/4/2027 | | 775,000 | | 726,787 | |
| | 1,393,986 | |
Cayman Islands - .8% | | | | | |
Gran Tierra Energy International Holdings,
Gtd. Notes | | 6.25 | | 2/15/2025 | | 200,000 | | 192,000 | |
Gran Tierra Energy International Holdings,
Gtd. Notes | | 6.25 | | 2/15/2025 | | 320,000 | d | 307,200 | |
9
STATEMENT OF INVESTMENTS (continued)
| | | | | | | | | | |
| |
Description | Coupon
Rate (%) | | Maturity
Date | | Principal
Amount ($) | a | Value ($) | |
Bonds and Notes - 28.4% (continued) | | | | | |
Cayman Islands - .8% (continued) | | | | | |
Sands China,
Notes | | 5.13 | | 8/8/2025 | | 400,000 | d | 392,781 | |
| | 891,981 | |
Chile - .9% | | | | | |
Celulosa Arauco y Constitucion,
Sr. Unscd. Notes | | 5.50 | | 11/2/2047 | | 240,000 | | 231,900 | |
Chilean Government,
Unscd. Bonds | CLP | 4.50 | | 3/1/2026 | | 175,000,000 | | 251,723 | |
Enel Chile,
Sr. Unscd. Notes | | 4.88 | | 6/12/2028 | | 520,000 | | 516,620 | |
| | 1,000,243 | |
Colombia - 1.1% | | | | | |
Ecopetrol,
Sr. Unscd. Notes | | 5.88 | | 5/28/2045 | | 520,000 | | 496,990 | |
Emgesa,
Sr. Unscd. Notes | COP | 8.75 | | 1/25/2021 | | 237,000,000 | | 77,137 | |
Empresas Publicas de Medellin,
Sr. Unscd. Notes | COP | 7.63 | | 9/10/2024 | | 230,000,000 | d | 68,384 | |
Empresas Publicas de Medellin,
Sr. Unscd. Notes | COP | 8.38 | | 11/8/2027 | | 710,000,000 | d | 209,504 | |
Transportadora de Gas Internacional,
Sr. Unscd. Notes | | 5.55 | | 11/1/2028 | | 360,000 | d | 362,736 | |
| | 1,214,751 | |
Croatia - .5% | | | | | |
Croatian Government,
Sr. Unscd. Notes | | 6.00 | | 1/26/2024 | | 500,000 | | 539,894 | |
Ecuador - .2% | | | | | |
Ecuadorian Government,
Sr. Unscd. Notes | | 9.63 | | 6/2/2027 | | 250,000 | d | 230,625 | |
Georgia - .7% | | | | | |
Bank of Georgia,
Sr. Unscd. Bonds | | 6.00 | | 7/26/2023 | | 760,000 | | 747,186 | |
Hungary - .3% | | | | | |
Hungarian Government,
Sr. Unscd. Notes | | 5.38 | | 3/25/2024 | | 360,000 | | 382,464 | |
Israel - 1.0% | | | | | |
Israel Chemicals,
Sr. Unscd. Bonds | | 6.38 | | 5/31/2038 | | 680,000 | d | 676,430 | |
Israel Electric,
Sr. Scd. Notes | | 4.25 | | 8/14/2028 | | 450,000 | d | 427,801 | |
| | 1,104,231 | |
Ivory Coast - .5% | | | | | |
Ivory Coast Government,
Sr. Unscd. Bonds | | 6.13 | | 6/15/2033 | | 375,000 | d | 326,097 | |
10
| | | | | | | | | | |
| |
Description | Coupon
Rate (%) | | Maturity
Date | | Principal
Amount ($) | a | Value ($) | |
Bonds and Notes - 28.4% (continued) | | | | | |
Ivory Coast - .5% (continued) | | | | | |
Ivory Coast Government,
Sr. Unscd. Notes | EUR | 5.25 | | 3/22/2030 | | 215,000 | d | 223,495 | |
| | 549,592 | |
Kazakhstan - .8% | | | | | |
Development Bank of Kazakhstan,
Sr. Unscd. Notes | | 4.13 | | 12/10/2022 | | 380,000 | | 374,000 | |
Development Bank of Kazakhstan,
Sr. Unscd. Notes | KZT | 8.95 | | 5/4/2023 | | 50,000,000 | d | 117,173 | |
Kazmunaygas National,
Sr. Unscd. Notes | | 4.75 | | 4/24/2025 | | 235,000 | d | 235,051 | |
KazTransGas,
Gtd. Notes | | 4.38 | | 9/26/2027 | | 200,000 | d | 189,326 | |
| | 915,550 | |
Luxembourg - 2.7% | | | | | |
Aegea Finance,
Gtd. Notes | | 5.75 | | 10/10/2024 | | 235,000 | d | 227,363 | |
Atento Luxco 1,
Sr. Scd. Notes | | 6.13 | | 8/10/2022 | | 660,000 | d | 650,100 | |
Cosan Luxembourg,
Gtd. Notes | | 7.00 | | 1/20/2027 | | 270,000 | d | 270,810 | |
Hidrovias International Finance,
Gtd. Notes | | 5.95 | | 1/24/2025 | | 500,000 | d | 465,625 | |
MHP Lux,
Gtd. Notes | | 6.95 | | 4/3/2026 | | 490,000 | d | 453,799 | |
Nexa Resources,
Gtd. Notes | | 5.38 | | 5/4/2027 | | 380,000 | | 370,504 | |
Rumo Luxembourg,
Gtd. Notes | | 7.38 | | 2/9/2024 | | 270,000 | d | 280,125 | |
Rumo Luxembourg,
Sr. Unscd. Notes | | 5.88 | | 1/18/2025 | | 400,000 | d | 381,254 | |
| | 3,099,580 | |
Malaysia - .5% | | | | | |
Malaysia Sovereign Sukuk,
Unscd. Notes | | 3.04 | | 4/22/2025 | | 570,000 | | 542,515 | |
Mauritius - .4% | | | | | |
HTA Group,
Gtd. Bonds | | 9.13 | | 3/8/2022 | | 500,000 | | 511,875 | |
Mexico - .7% | | | | | |
Axtel,
Gtd. Notes | | 6.38 | | 11/14/2024 | | 560,000 | d | 537,600 | |
Metalsa,
Gtd. Notes | | 4.90 | | 4/24/2023 | | 260,000 | | 248,108 | |
| | 785,708 | |
Morocco - .9% | | | | | |
Moroccan Government,
Sr. Unscd. Notes | | 4.25 | | 12/11/2022 | | 375,000 | | 373,918 | |
11
STATEMENT OF INVESTMENTS (continued)
| | | | | | | | | | |
| |
Description | Coupon
Rate (%) | | Maturity
Date | | Principal
Amount ($) | a | Value ($) | |
Bonds and Notes - 28.4% (continued) | | | | | |
Morocco - .9% (continued) | | | | | |
OCP,
Sr. Unscd. Notes | | 6.88 | | 4/25/2044 | | 610,000 | | 638,990 | |
| | 1,012,908 | |
Netherlands - 3.1% | | | | | |
Equate Petrochemical,
Gtd. Notes | | 3.00 | | 3/3/2022 | | 400,000 | | 383,594 | |
Equate Petrochemical,
Gtd. Notes | | 4.25 | | 11/3/2026 | | 360,000 | | 349,902 | |
GTH Finance,
Gtd. Notes | | 6.25 | | 4/26/2020 | | 360,000 | | 365,450 | |
Lukoil International Finance,
Gtd. Notes | | 4.75 | | 11/2/2026 | | 550,000 | | 540,918 | |
Mdc-Gmtn,
Gtd. Notes | | 4.50 | | 11/7/2028 | | 530,000 | d | 527,806 | |
SABIC Capital II,
Gtd. Bonds | | 4.00 | | 10/10/2023 | | 545,000 | d | 539,877 | |
VTR Finance,
Sr. Scd. Notes | | 6.88 | | 1/15/2024 | | 790,000 | | 802,837 | |
| | 3,510,384 | |
Peru - .6% | | | | | |
Orazul Energy Egenor,
Gtd. Notes | | 5.63 | | 4/28/2027 | | 720,000 | d | 657,367 | |
Qatar - .9% | | | | | |
Qatari Government,
Notes | | 4.50 | | 4/23/2028 | | 775,000 | d | 792,437 | |
Ras Laffan Liquefied Natural Gas Co II,
Sr. Scd. Bonds | | 5.30 | | 9/30/2020 | | 286,780 | | 292,085 | |
| | 1,084,522 | |
Romania - .5% | | | | | |
Romanian Government,
Sr. Unscd. Notes | | 4.38 | | 8/22/2023 | | 550,000 | | 550,085 | |
Russia - .7% | | | | | |
Russian Government,
Bonds, Ser. 6212 | RUB | 7.05 | | 1/19/2028 | | 585,000 | | 8,117 | |
Russian Government,
Bonds, Ser. 6215 | RUB | 7.00 | | 8/16/2023 | | 17,140,000 | | 248,352 | |
Russian Government,
Unscd. Bonds, Ser. 6207 | RUB | 8.15 | | 2/3/2027 | | 34,000,000 | | 507,362 | |
| | 763,831 | |
Senegal - .3% | | | | | |
Senegalese Government,
Sr. Unscd. Bonds | EUR | 4.75 | | 3/13/2028 | | 320,000 | d | 339,150 | |
Singapore - .5% | | | | | |
Indika Energy Capital III,
Gtd. Notes | | 5.88 | | 11/9/2024 | | 655,000 | d | 587,424 | |
12
| | | | | | | | | | |
| |
Description | Coupon
Rate (%) | | Maturity
Date | | Principal
Amount ($) | a | Value ($) | |
Bonds and Notes - 28.4% (continued) | | | | | |
South Africa - .4% | | | | | |
South African Government,
Bonds, Ser. 2048 | ZAR | 8.75 | | 2/28/2048 | | 6,900,000 | | 402,658 | |
South African Government,
Bonds, Ser. R207 | ZAR | 7.25 | | 1/15/2020 | | 300,000 | | 20,496 | |
| | 423,154 | |
South Korea - .7% | | | | | |
Shinhan Bank Co.,
Sr. Unscd. Notes | | 3.88 | | 11/5/2023 | | 750,000 | d | 745,665 | |
Spain - .3% | | | | | |
AI Candelaria Spain,
Sr. Scd. Notes | | 7.50 | | 12/15/2028 | | 340,000 | d | 336,192 | |
Supranational - 1.1% | | | | | |
Arab Petroleum Investments,
Sr. Unscd. Notes | | 4.13 | | 9/18/2023 | | 650,000 | d | 651,272 | |
West African Development Bank,
Sr. Unscd. Notes | | 5.00 | | 7/27/2027 | | 575,000 | | 548,550 | |
| | 1,199,822 | |
Turkey - .1% | | | | | |
Turkish Government,
Bonds | TRY | 10.60 | | 2/11/2026 | | 860,000 | | 109,854 | |
Turkish Government,
Unscd. Bonds | TRY | 11.00 | | 2/24/2027 | | 420,000 | | 53,079 | |
| | 162,933 | |
United Arab Emirates - 1.2% | | | | | |
Abu Dhabi Crude Oil Pipeline,
Sr. Scd. Bonds | | 4.60 | | 11/2/2047 | | 230,000 | d | 218,268 | |
Abu Dhabi Crude Oil Pipeline,
Sr. Scd. Notes | | 3.65 | | 11/2/2029 | | 600,000 | | 556,152 | |
DP World,
Sr. Unscd. Notes | | 6.85 | | 7/2/2037 | | 530,000 | | 592,377 | |
| | 1,366,797 | |
United Kingdom - .2% | | | | | |
Tullow Oil,
Sr. Unscd. Notes | | 7.00 | | 3/1/2025 | | 200,000 | d | 196,270 | |
United States - .4% | | | | | |
SASOL Financing USA,
Gtd. Notes | | 6.50 | | 9/27/2028 | | 420,000 | | 425,874 | |
Total Bonds and Notes
(cost $37,520,192) | | 32,069,550 | |
Description | | | | | Shares | | Value ($) | |
Common Stocks - 62.7% | | | | | |
Brazil - 2.9% | | | | | |
Ambev, ADR | | | | | | 418,800 | e | 1,813,404 | |
Estacio Participacoes | | | | | | 237,700 | | 1,478,639 | |
| | 3,292,043 | |
13
STATEMENT OF INVESTMENTS (continued)
| | | | | | | | | | |
| |
Description | | | | | Shares | | Value ($) | |
Common Stocks - 62.7% (continued) | | | | | |
China - 20.4% | | | | | |
Alibaba Group Holding, ADR | | | | | | 26,700 | e | 3,798,876 | |
ANTA Sports Products | | | | | | 559,000 | | 2,291,096 | |
China Construction Bank, Cl. H | | | | | | 2,381,000 | | 1,882,954 | |
China Shenhua Energy, Cl. H | | | | | | 653,000 | | 1,474,211 | |
PICC Property & Casualty, Cl. H | | | | | | 1,453,000 | | 1,405,302 | |
Ping An Insurance Group Company of China, Cl. H | | | | | | 328,000 | | 3,104,180 | |
Shanghai Pharmaceuticals Holding, Cl. H | | | | | | 825,300 | | 1,827,545 | |
Sunny Optical Technology Group | | | | | | 110,700 | | 968,746 | |
TAL Education Group, ADR | | | | | | 49,158 | e | 1,424,599 | |
Tencent Holdings | | | | | | 143,100 | | 4,850,382 | |
| | 23,027,891 | |
Hong Kong - 1.2% | | | | | |
Galaxy Entertainment Group | | | | | | 263,000 | | 1,414,078 | |
India - 7.6% | | | | | |
ICICI Bank, ADR | | | | | | 340,232 | | 3,228,802 | |
Infosys, ADR | | | | | | 312,900 | | 2,963,163 | |
Larsen & Toubro, GDR | | | | | | 136,400 | d | 2,393,384 | |
| | 8,585,349 | |
Indonesia - 3.2% | | | | | |
Bank Rakyat Indonesia Persero | | | | | | 8,607,100 | | 1,786,882 | |
Telekomunikasi Indonesia Persero | | | | | | 7,169,800 | | 1,812,473 | |
| | 3,599,355 | |
Mexico - 4.2% | | | | | |
Arca Continental | | | | | | 169,900 | | 853,128 | |
Grupo Aeroportuario del Centro Norte | | | | | | 239,100 | | 1,252,279 | |
Grupo Financiero Banorte, Cl. O | | | | | | 170,100 | | 937,787 | |
Wal-Mart de Mexico | | | | | | 652,900 | | 1,669,434 | |
| | 4,712,628 | |
Philippines - .6% | | | | | |
Puregold Price Club | | | | | | 954,230 | | 723,101 | |
Russia - 1.8% | | | | | |
Sberbank of Russia, ADR | | | | | | 172,705 | | 2,018,921 | |
South Africa - 2.7% | | | | | |
Clicks Group | | | | | | 236,862 | | 3,018,584 | |
South Korea - 7.2% | | | | | |
GS Engineering & Construction | | | | | | 40,795 | | 1,489,099 | |
Hyundai Heavy Industries | | | | | | 18,485 | e | 2,032,231 | |
KB Financial Group | | | | | | 63,063 | | 2,623,984 | |
Korea Investment Holdings | | | | | | 16,136 | | 844,738 | |
POSCO | | | | | | 5,382 | | 1,214,170 | |
| | 8,204,222 | |
14
| | | | | | | | | | |
| |
Description | | | | | Shares | | Value ($) | |
Common Stocks - 62.7% (continued) | | | | | |
Taiwan - 6.5% | | | | | |
Chailease Holding | | | | | | 925,440 | | 2,655,922 | |
Taiwan Semiconductor Manufacturing | | | | | | 630,000 | | 4,680,670 | |
| | 7,336,592 | |
Thailand - .9% | | | | | |
Thai Beverage | | | | | | 2,273,000 | | 1,027,901 | |
Turkey - .9% | | | | | |
Tofas Turk Otomobil Fabrikasi | | | | | | 260,786 | | 983,668 | |
United Arab Emirates - .9% | | | | | |
Abu Dhabi Commercial Bank | | | | | | 485,375 | | 1,072,237 | |
United States - 1.7% | | | | | |
Cognizant Technology Solutions, Cl. A | | | | | | 27,600 | | 1,905,228 | |
Total Common Stocks
(cost $69,910,701) | | 70,921,798 | |
Description /Number of Contracts/Counterparty | Exercise
Price | | Expiration Date | | Notional Amount ($) | a | | |
Options Purchased - .0% | | | | | |
Put Options - .0% | | | | | |
Chilean Peso,
Contracts 1,210,000 J.P. Morgan Securities | | 660.00 | | 1/17/2019 | | 1,210,000 | | 6,212 | |
Chilean Peso,
Contracts 1,100,000 Citigroup | | 655.00 | | 12/21/2018 | | 1,100,000 | | 2,210 | |
Euro,
Contracts 2,030,000 J.P. Morgan Securities | EUR | 1.16 | | 11/27/2018 | | 2,030,000 | | 46,621 | |
Indian Rupee,
Contracts 2,300,000 Barclays Capital | | 71.70 | | 12/13/2018 | | 2,300,000 | | 1,318 | |
Total Options Purchased
(cost $80,018) | | 56,361 | |
| | Preferred Dividend Yield (%) | | | | Shares | | | |
Preferred Stocks - 2.6% | | | | | |
Brazil - 2.6% | | | | | |
Banco do Estado do Rio Grande do Sul, Cl. B | | 5.73 | | | | 204,400 | | 1,075,963 | |
Cia Brasileira de Distribuicao | | 1.78 | | | | 88,200 | | 1,844,817 | |
Total Preferred Stocks
(cost $2,929,408) | | 2,920,780 | |
| | Yield at Date of Purchase (%) | | Maturity Date | | Principal Amount ($) | a | | |
Short-Term Investments - .9% | | | | | |
U.S. Government Securities | | | | | |
U. S. Treasury Bills
(cost $991,325) | | 2.15 | | 1/3/2019 | | 995,000 | f,g | 991,143 | |
15
STATEMENT OF INVESTMENTS (continued)
| | | | | | | | | | |
| |
Description | 7-Day
Yield (%) | | | | Shares | | Value ($) | |
Investment Companies - 6.0% | | | | | |
Registered Investment Companies - 6.0% | | | | | |
Dreyfus Institutional Preferred Government Plus Money Market Fund
(cost $6,835,307) | | 2.21 | | | | 6,835,307 | h | 6,835,307 | |
Total Investments (cost $118,266,951) | | 100.6% | 113,794,939 | |
Liabilities, Less Cash and Receivables | | (0.6%) | (690,042) | |
Net Assets | | 100.0% | 113,104,897 | |
ADR—American Depository Receipt
ARLLMONP—Argentina Blended Historical Policy Rate
BADLAR—Buenos Aires Interbank Offer Rate
GDR—Global Depository Receipt
ARS—Argentine Peso
BRL—Brazilian Real
CLP—Chilean Peso
COP—Colombian Peso
EUR—Euro
HKD—Hong Kong Dollar
INR—Indian Rupee
KRW—South Korean Won
MXN—Mexican Peso
RUB—Russian Ruble
TRY—Turkish Lira
ZAR—South African Rand
a Amount stated in U.S. Dollars unless otherwise noted above.
b Variable rate security—rate shown is the interest rate in effect at period end.
c Principal amount for accrual purposes is periodically adjusted based on changes in the Consumer Price Index.
d Security exempt from registration pursuant to Rule 144A under the Securities Act of 1933. These securities may be resold in transactions exempt from registration, normally to qualified institutional buyers. At October 31, 2018, these securities were valued at $16,547,136 or 14.63% of net assets.
e Non-income producing security.
f Held by a counterparty for open exchange traded derivative contracts.
g Security is a discount security. Income is recognized through the accretion of discount.
h Investment in affiliated issuer. The investment objective of this investment company is publicly available and can be found within the investment company’s prospectus.
16
| | |
Portfolio Summary (Unaudited) † | Value (%) |
Banks | 21.8 |
Information Technology | 10.1 |
Foreign/Governmental | 8.9 |
Industrials | 7.7 |
Energy | 6.1 |
Registered Investment Companies | 6.0 |
Consumer Staples | 4.5 |
Consumer Discretionary | 4.5 |
Commercial & Professional Services | 3.7 |
Internet Software & Services | 3.4 |
Telecommunication Services | 2.9 |
Chemicals | 2.7 |
Technology Hardware & Equipment | 2.6 |
Utilities | 2.6 |
Retailing | 2.1 |
Food Products | 1.6 |
Health Care | 1.6 |
Beverage Products | 1.6 |
Metals & Mining | 1.4 |
Transportation | 1.0 |
Municipal Bonds | .9 |
U. S. Treasury Bills | .9 |
Media | .7 |
Diversified Financials | .5 |
Agriculture | .4 |
Automobiles & Components | .2 |
Forest Products & Other | .2 |
Options Purchased | .0 |
| | 100.6 |
† Based on net assets.
See notes to financial statements.
17
STATEMENT OF INVESTMENTS IN AFFILIATED ISSUERS
| | | | | | | |
Registered Investment Company | Value
10/31/17 ($) | Purchases ($) | Sales ($) | Value
10/31/18 ($) | Net
Assets (%) | Dividends/
Distributions ($) |
Dreyfus Institutional Preferred Government Plus Money Market Fund | 2,170,429 | 72,042,984 | 67,378,106 | 6,835,307 | 6.0 | 64,437 |
See notes to financial statements.
18
STATEMENT OF FUTURES
October 31, 2018
| | | | | | | |
Description | Number of
Contracts | Expiration | Notional
Value ($) | Value ($) | Unrealized (Depreciation) ($) | |
Futures Short | | |
Euro-Bobl | 2 | 12/18 | 297,273a | 297,751 | (478) | |
Euro-Bond | 2 | 12/18 | 361,676a | 363,037 | (1,361) | |
Gross Unrealized Depreciation | | (1,839) | |
a Notional amounts in foreign currency have been converted to USD using relevant foreign exchange rates.
See notes to financial statements.
19
STATEMENT OF OPTIONS WRITTEN
October 31, 2018
| | | | | | | |
Description/ Contracts/ Counterparties | Exercise Price | Expiration Date | Notional Amount | | Value ($) | |
Call Options: | | | | | | |
Chilean Peso
Contracts 1,210,000, J.P. Morgan Securities | 690 | 1/17/19 | 1,210,000 | | (32,437) | |
Chilean Peso
Contracts 1,100,000, Citigroup | 690 | 12/21/18 | 1,100,000 | | (25,034) | |
Total Options Written (premiums received $30,441) | | | | (57,471) | |
See notes to financial statements.
20
STATEMENT OF FORWARD FOREIGN CURRENCY EXCHANGE CONTRACTS October 31, 2018
| | | | | | |
Counterparty/ Purchased
Currency | Purchased Currency
Amounts | Currency
Sold | Sold
Currency
Amounts | Settlement Date | Unrealized Appreciation (Depreciation)($) |
Barclays Capital | | | |
United States Dollar | 668,384 | Turkish Lira | 4,670,000 | 12/7/18 | (147,906) |
United States Dollar | 3,379,412 | Philippine Peso | 182,860,000 | 12/7/18 | (29,970) |
Taiwan Dollar | 101,015,000 | United States Dollar | 3,312,185 | 12/7/18 | (38,869) |
United States Dollar | 771,425 | Taiwan Dollar | 23,570,000 | 12/7/18 | 7,657 |
Indonesian Rupiah | 27,164,880,000 | United States Dollar | 1,748,343 | 12/7/18 | 29,874 |
United States Dollar | 864,607 | Hungarian Forint | 243,750,000 | 12/7/18 | 11,880 |
Malaysian Ringgit | 2,600,000 | United States Dollar | 627,564 | 12/7/18 | (6,683) |
United States Dollar | 631,651 | Malaysian Ringgit | 2,600,000 | 12/7/18 | 10,770 |
Malaysian Ringgit | 8,610,000 | United States Dollar | 2,064,253 | 12/7/18 | (8,180) |
Czech Koruna | 58,800,000 | Euro | 2,274,033 | 12/7/18 | (10,416) |
Mexican Peso | 10,039,108 | United States Dollar | 515,461 | 12/7/18 | (24,295) |
United States Dollar | 4,879,787 | Mexican Peso | 95,665,000 | 12/7/18 | 199,355 |
South Korean Won | 8,619,750,000 | United States Dollar | 7,780,471 | 12/7/18 | (208,370) |
United States Dollar | 2,674,028 | South Korean Won | 2,987,440,000 | 12/7/18 | 49,683 |
United States Dollar | 1,445,222 | Peruvian Nuevo Sol | 4,790,000 | 11/27/18 | 26,011 |
Russian Ruble | 274,585,000 | United States Dollar | 3,939,244 | 12/7/18 | 209,411 |
Indian Rupee | 303,650,000 | United States Dollar | 4,235,598 | 12/7/18 | (147,785) |
Citigroup | | | |
United States Dollar | 834,501 | Brazilian Real | 3,425,000 | 12/4/18 | (82,810) |
Czech Koruna | 5,500,000 | United States Dollar | 248,877 | 12/7/18 | (8,166) |
United States Dollar | 426,274 | Peruvian Nuevo Sol | 1,418,000 | 11/27/18 | 6,140 |
Taiwan Dollar | 43,000,000 | United States Dollar | 1,412,174 | 12/7/18 | (18,791) |
Mexican Peso | 13,600,000 | United States Dollar | 696,204 | 12/7/18 | (30,821) |
Brazilian Real | 7,660,000 | United States Dollar | 1,890,424 | 12/4/18 | 161,138 |
21
STATEMENT OF FORWARD FOREIGN CURRENCY EXCHANGE CONTRACTS (continued)
| | | | | | |
Counterparty/ Purchased
Currency | Purchased Currency
Amounts | Currency
Sold | Sold
Currency
Amounts | Settlement Date | Unrealized Appreciation (Depreciation)($) |
HSBC | | | |
Mexican Peso | 7,975,000 | United States Dollar | 408,355 | 12/7/18 | (18,176) |
United States Dollar | 903,281 | Hong Kong Dollar | 7,060,000 | 4/10/19 | 163 |
United States Dollar | 542,093 | Mexican Peso | 10,370,000 | 12/7/18 | 34,738 |
J.P. Morgan Securities | | | |
Euro | 8,365,000 | United States Dollar | 9,539,822 | 11/30/18 | (42,536) |
United States Dollar | 1,764,616 | Argentine Peso | 57,650,000 | 11/23/18 | 205,384 |
Polish Zloty | 5,600,000 | United States Dollar | 1,507,524 | 12/7/18 | (46,771) |
Singapore Dollar | 3,170,000 | United States Dollar | 2,307,922 | 12/7/18 | (17,594) |
Taiwan Dollar | 22,040,000 | United States Dollar | 720,379 | 12/7/18 | (6,189) |
Brazilian Real | 9,420,000 | United States Dollar | 2,578,702 | 12/4/18 | (55,763) |
United States Dollar | 1,216,256 | Hungarian Forint | 342,960,000 | 12/7/18 | 16,456 |
Hong Kong Dollar | 10,700,000 | United States Dollar | 1,368,504 | 4/10/19 | 245 |
United States Dollar | 1,164,398 | Chinese Yuan Renminbi | 8,000,000 | 12/7/18 | 17,391 |
Colombian Peso | 7,423,895,000 | United States Dollar | 2,383,694 | 12/7/18 | (81,649) |
United States Dollar | 2,782,783 | Romanian Leu | 11,120,000 | 12/7/18 | 84,369 |
South African Rand | 35,895,000 | United States Dollar | 2,295,708 | 12/7/18 | 126,166 |
Russian Ruble | 2,010,000 | United States Dollar | 30,332 | 12/7/18 | 37 |
Hong Kong Dollar | 15,850,000 | United States Dollar | 2,026,253 | 4/10/19 | 1,286 |
United States Dollar | 6,496,571 | Hong Kong Dollar | 50,750,000 | 4/10/19 | 4,609 |
Thai Baht | 59,000,000 | United States Dollar | 1,802,792 | 12/7/18 | (21,158) |
Chilean Peso | 645,390,000 | United States Dollar | 933,724 | 12/7/18 | (5,977) |
Hong Kong Dollar | 32,550,000 | United States Dollar | 4,150,118 | 4/10/19 | 13,692 |
United States Dollar | 4,160,140 | Hong Kong Dollar | 32,550,000 | 4/10/19 | (3,670) |
Merrill Lynch, Pierce, Fenner & Smith | | | |
Mexican Peso | 4,425,000 | United States Dollar | 227,631 | 12/7/18 | (11,137) |
22
| | | | | | |
Counterparty/ Purchased
Currency | Purchased Currency
Amounts | Currency
Sold | Sold
Currency
Amounts | Settlement Date | Unrealized Appreciation (Depreciation)($) |
UBS Securities | | | |
Czech Koruna | 100,070,000 | Euro | 3,869,309 | 12/7/18 | (16,818) |
United States Dollar | 313,896 | Malaysian Ringgit | 1,300,000 | 12/7/18 | 3,455 |
Gross Unrealized Appreciation | | | 1,219,910 |
Gross Unrealized Depreciation | | | (1,090,500) |
See notes to financial statements.
23
STATEMENT OF ASSETS AND LIABILITIES
October 31, 2018
| | | | | | | |
| | | | | | |
| | | Cost | | Value | |
Assets ($): | | | | |
Investments in securities—See Statement of Investments: | | | |
Unaffiliated issuers | 111,431,644 | | 106,959,632 | |
Affiliated issuers | | 6,835,307 | | 6,835,307 | |
Cash | | | | | 77,370 | |
Cash denominated in foreign currency | | | 401,125 | | 400,481 | |
Unrealized appreciation on forward foreign
currency exchange contracts—Note 4 | | 1,219,910 | |
Dividends and interest receivable | | 657,118 | |
Receivable for shares of Common Stock subscribed | | 69,965 | |
Receivable for futures variation margin—Note 4 | | 589 | |
Cash collateral held by broker—Note 4 | | 120 | |
Prepaid expenses | | | | | 15,045 | |
| | | | | 116,235,537 | |
Liabilities ($): | | | | |
Due to The Dreyfus Corporation and affiliates—Note 3(c) | | | | 124,559 | |
Payable for investment securities purchased | | 1,731,967 | |
Unrealized depreciation on forward foreign
currency exchange contracts—Note 4 | | 1,090,500 | |
Outstanding options written, at value
(premiums received $30,441)—Note 4 | | 57,471 | |
Payable for shares of Common Stock redeemed | | 23,898 | |
Unrealized depreciation on foreign currency transactions | | 23,316 | |
Directors fees and expenses payable | | 3,068 | |
Accrued expenses and other liabilities | | | | | 75,861 | |
| | | | | 3,130,640 | |
Net Assets ($) | | | 113,104,897 | |
Composition of Net Assets ($): | | | | |
Paid-in capital | | | | | 106,893,068 | |
Total distributable earnings (loss) | | | | | 6,211,829 | |
Net Assets ($) | | | 113,104,897 | |
| | | | | | |
Net Asset Value Per Share | Class A | Class C | Class I | Class Y | |
Net Assets ($) | 1,774,831 | 804,517 | 108,677,011 | 1,848,538 | |
Shares Outstanding | 147,474 | 68,364 | 8,968,229 | 152,456 | |
Net Asset Value Per Share ($) | 12.03 | 11.77 | 12.12 | 12.13 | |
| | | | | | |
See notes to financial statements. | | | | | |
24
STATEMENT OF OPERATIONS
Year Ended October 31, 2018
| | | | | | | |
| | | | | | |
| | | | | | |
Investment Income ($): | | | | |
Income: | | | | |
Interest (net of $4,535 foreign taxes withheld at source) | | | 3,322,246 | |
Dividends (net of $209,536 foreign taxes withheld at source): | |
Unaffiliated issuers | | | 1,785,488 | |
Affiliated issuers | | | 64,437 | |
Total Income | | | 5,172,171 | |
Expenses: | | | | |
Management fee—Note 3(a) | | | 1,195,972 | |
Professional fees | | | 128,555 | |
Custodian fees—Note 3(c) | | | 72,622 | |
Registration fees | | | 62,313 | |
Shareholder servicing costs—Note 3(c) | | | 28,624 | |
Directors’ fees and expenses—Note 3(d) | | | 8,930 | |
Prospectus and shareholders’ reports | | | 6,636 | |
Distribution fees—Note 3(b) | | | 6,418 | |
Loan commitment fees—Note 2 | | | 2,335 | |
Miscellaneous | | | 58,780 | |
Total Expenses | | | 1,571,185 | |
Less—reduction in expenses due to undertaking—Note 3(a) | | | (11,192) | |
Less—reduction in fees due to earnings credits—Note 3(c) | | | (1,260) | |
Net Expenses | | | 1,558,733 | |
Investment Income—Net | | | 3,613,438 | |
Realized and Unrealized Gain (Loss) on Investments—Note 4 ($): | | |
Net realized gain (loss) on investments and foreign currency transactions | 8,080,886 | |
Net realized gain (loss) on options transactions | (131,166) | |
Net realized gain (loss) on futures | (17,972) | |
Net realized gain (loss) on forward foreign currency exchange contracts | (673,357) | |
Net Realized Gain (Loss) | | | 7,258,391 | |
Net unrealized appreciation (depreciation) on investments
and foreign currency transactions | | | (29,498,955) | |
Net unrealized appreciation (depreciation) on options transactions | (47,093) | |
Net unrealized appreciation (depreciation) on futures | | | (1,839) | |
Net unrealized appreciation (depreciation) on
forward foreign currency exchange contracts | | | 13,470 | |
Net Unrealized Appreciation (Depreciation) | | | (29,534,417) | |
Net Realized and Unrealized Gain (Loss) on Investments | | | (22,276,026) | |
Net (Decrease) in Net Assets Resulting from Operations | | (18,662,588) | |
| | | | | | | |
See notes to financial statements. | | | | | |
25
STATEMENT OF CHANGES IN NET ASSETS
| | | | | | | | | | |
| | | | Year Ended October 31, |
| | | | 2018 | | 2017a | |
Operations ($): | | | | | | | | |
Investment income—net | | | 3,613,438 | | | | 1,996,058 | |
Net realized gain (loss) on investments | | 7,258,391 | | | | 10,871,233 | |
Net unrealized appreciation (depreciation)
on investments | | (29,534,417) | | | | 16,768,193 | |
Net Increase (Decrease) in Net Assets
Resulting from Operations | (18,662,588) | | | | 29,635,484 | |
Distributions ($): | |
Distributions to shareholders: | | | | | | | | |
Class A | | | (63,977) | | | | (18,734) | |
Class C | | | (18,423) | | | | (4,434) | |
Class I | | | (3,441,924) | | | | (1,633,825) | |
Class Y | | | (96,537) | | | | (22,811) | |
Total Distributions | | | (3,620,861) | | | | (1,679,804) | |
Capital Stock Transactions ($): | |
Net proceeds from shares sold: | | | | | | | | |
Class A | | | 2,445,223 | | | | 681,914 | |
Class C | | | 253,510 | | | | 26,603 | |
Class I | | | 23,988,362 | | | | 12,118,649 | |
Class Y | | | 3,702,915 | | | | 1,498,875 | |
Distributions reinvested: | | | | | | | | |
Class A | | | 46,837 | | | | 12,366 | |
Class C | | | 5,523 | | | | 1,434 | |
Class I | | | 99,613 | | | | 49,084 | |
Class Y | | | 80,225 | | | | 18,891 | |
Cost of shares redeemed: | | | | | | | | |
Class A | | | (1,822,043) | | | | (416,423) | |
Class C | | | (115,793) | | | | (28,025) | |
Class I | | | (5,303,796) | | | | (27,470,441) | |
Class Y | | | (3,447,364) | | | | (1,408,029) | |
Increase (Decrease) in Net Assets
from Capital Stock Transactions | 19,933,212 | | | | (14,915,102) | |
Total Increase (Decrease) in Net Assets | (2,350,237) | | | | 13,040,578 | |
Net Assets ($): | |
Beginning of Period | | | 115,455,134 | | | | 102,414,556 | |
End of Period | | | 113,104,897 | | | | 115,455,134 | |
26
| | | | | | | | | | |
| | | | Year Ended October 31, |
| | | | 2018 | | 2017a | |
Capital Share Transactions (Shares): | |
Class Ab | | | | | | | | |
Shares sold | | | 165,729 | | | | 55,979 | |
Shares issued for distributions reinvested | | | 3,160 | | | | 1,153 | |
Shares redeemed | | | (135,210) | | | | (32,409) | |
Net Increase (Decrease) in Shares Outstanding | 33,679 | | | | 24,723 | |
Class Cb | | | | | | | | |
Shares sold | | | 19,071 | | | | 2,251 | |
Shares issued for distributions reinvested | | | 379 | | | | 136 | |
Shares redeemed | | | (8,758) | | | | (2,423) | |
Net Increase (Decrease) in Shares Outstanding | 10,692 | | | | (36) | |
Class I | | | | | | | | |
Shares sold | | | 1,736,845 | | | | 964,144 | |
Shares issued for distributions reinvested | | | 6,694 | | | | 4,562 | |
Shares redeemed | | | (374,212) | | | | (2,032,547) | |
Net Increase (Decrease) in Shares Outstanding | 1,369,327 | | | | (1,063,841) | |
Class Y | | | | | | | | |
Shares sold | | | 244,138 | | | | 121,641 | |
Shares issued for distributions reinvested | | | 5,384 | | | | 1,754 | |
Shares redeemed | | | (227,269) | | | | (118,655) | |
Net Increase (Decrease) in Shares Outstanding | 22,253 | | | | 4,740 | |
| | | | | | | | | | |
a Distributions to shareholders include only distributions from net investment income. Undistributed investment income—net was $1,495,694 in 2017 and is no longer presented as a result of the adoption of SEC’s Disclosure Update and Simplification Rule. | |
b During the period ended October 31, 2018, 627 Class C shares representing $9,833 were automatically converted to 662 Class A shares. | |
See notes to financial statements.
| | | | | | | | |
27
FINANCIAL HIGHLIGHTS
The following tables describe the performance for each share class for the fiscal periods indicated. All information (except portfolio turnover rate) reflects financial results for a single fund share. Total return shows how much your investment in the fund would have increased (or decreased) during each period, assuming you had reinvested all dividends and distributions. These figures have been derived from the fund’s financial statements.
| | | | | | | |
| | | |
| | | Year Ended October 31, |
Class A Shares | | 2018 | 2017 | 2016 | 2015 | 2014 |
Per Share Data ($): | | | | | | |
Net asset value,
beginning of period | | 14.53 | 11.41 | 10.27 | 12.13 | 12.22 |
Investment Operations: | | | | | | |
Investment income—neta | | .41 | .18 | .17 | .19 | .21 |
Net realized and unrealized
gain (loss) on investments | | (2.48) | 3.10 | .97 | (1.84) | (.13) |
Total from
Investment Operations | | (2.07) | 3.28 | 1.14 | (1.65) | .08 |
Distributions: | | | | | | |
Dividends from
investment income—net | | (.22) | (.16) | - | (.19) | (.17) |
Dividends from net realized gains on investment—net | | (.21) | - | - | - | - |
Tax return of capital | | - | - | - | (.02) | - |
Total Distributions | | (.43) | (.16) | - | (.21) | (.17) |
Net asset value, end of period | | 12.03 | 14.53 | 11.41 | 10.27 | 12.13 |
Total Return (%)b | | (14.81) | 29.23 | 11.10 | (13.76) | .71 |
Ratios/ Supplemental Data (%): | | | | | |
Ratio of total expenses
to average net assets | | 1.70 | 1.61 | 1.69 | 1.72 | 1.71 |
Ratio of net expenses
to average net assets | | 1.60 | 1.60 | 1.60 | 1.60 | 1.60 |
Ratio of net investment income
to average net assets | | 2.79 | 1.44 | 1.60 | 1.71 | 1.80 |
Portfolio Turnover Rate | | 68.70 | 71.57 | 79.54 | 125.89 | 97.47 |
Net Assets,
end of period ($ x 1,000) | | 1,775 | 1,654 | 1,016 | 916 | 1,294 |
a Based on average shares outstanding.
b Exclusive of sales charge.
See notes to financial statements.
28
| | | | | | | |
| | | |
| | | Year Ended October 31, |
Class C Shares | | 2018 | 2017 | 2016 | 2015 | 2014 |
Per Share Data ($): | | | | | | |
Net asset value,
beginning of period | | 14.22 | 11.16 | 10.13 | 11.96 | 12.07 |
Investment Operations: | | | | | | |
Investment income—neta | | .27 | .09 | .09 | .10 | .12 |
Net realized and unrealized
gain (loss) on investments | | (2.40) | 3.05 | .94 | (1.81) | (.14) |
Total from
Investment Operations | | (2.13) | 3.13 | 1.03 | (1.71) | (.02) |
Distributions: | | | | | | |
Dividends from
investment income—net | | (.11) | (.08) | - | (.10) | (.09) |
Dividends from net realized gains on investment—net | | (.21) | - | - | - | - |
Tax return of capital | | - | - | - | (.02) | - |
Total Distributions | | (.32) | (.08) | - | (.12) | (.09) |
Net asset value, end of period | | 11.77 | 14.22 | 11.16 | 10.13 | 11.96 |
Total Return (%)b | | (15.40) | 28.32 | 10.17 | (14.36) | (.03) |
Ratios/ Supplemental Data (%): | | | | | | |
Ratio of total expenses
to average net assets | | 2.41 | 2.34 | 2.41 | 2.46 | 2.44 |
Ratio of net expenses
to average net assets | | 2.35 | 2.34 | 2.35 | 2.35 | 2.35 |
Ratio of net investment income
to average net assets | | 1.95 | .72 | .85 | .96 | 1.04 |
Portfolio Turnover Rate | | 68.70 | 71.57 | 79.54 | 125.89 | 97.47 |
Net Assets,
end of period ($ x 1,000) | | 805 | 820 | 644 | 669 | 823 |
a Based on average shares outstanding.
b Exclusive of sales charge.
See notes to financial statements.
29
FINANCIAL HIGHLIGHTS (continued)
| | | | | | | |
| | | |
| | | Year Ended October 31, |
Class I Shares | | 2018 | 2017 | 2016 | 2015 | 2014 |
Per Share Data ($): | | | | | | |
Net asset value,
beginning of period | | 14.62 | 11.46 | 10.29 | 12.16 | 12.25 |
Investment Operations: | | | | | | |
Investment income—neta | | .43 | .23 | .20 | .21 | .24 |
Net realized and unrealized
gain (loss) on investments | | (2.47) | 3.11 | .97 | (1.84) | (.13) |
Total from Investment Operations | | (2.04) | 3.34 | 1.17 | (1.63) | .11 |
Distributions: | | | | | | |
Dividends from
investment income—net | | (.25) | (.18) | - | (.21) | (.20) |
Dividends from net realized gains on investment—net | | (.21) | - | - | - | - |
Tax return of capital | | - | - | - | (.03) | - |
Total Distributions | | (.46) | (.18) | - | (.24) | (.20) |
Net asset value, end of period | | 12.12 | 14.62 | 11.46 | 10.29 | 12.16 |
Total Return (%) | | (14.53) | 29.76 | 11.37 | (13.54) | .97 |
Ratios/ Supplemental Data (%): | | | | | | |
Ratio of total expenses
to average net assets | | 1.30 | 1.27 | 1.32 | 1.36 | 1.35 |
Ratio of net expenses
to average net assets | | 1.29 | 1.27 | 1.29 | 1.35 | 1.35 |
Ratio of net investment income
to average net assets | | 3.04 | 1.81 | 1.91 | 1.96 | 2.04 |
Portfolio Turnover Rate | | 68.70 | 71.57 | 79.54 | 125.89 | 97.47 |
Net Assets,
end of period ($ x 1,000) | | 108,677 | 111,076 | 99,315 | 68,147 | 81,636 |
a Based on average shares outstanding.
See notes to financial statements.
30
| | | | | | | | |
| | | | |
| | | | Year Ended October 31, |
Class Y Shares | | 2018 | 2017 | 2016 | 2015 | 2014 |
Per Share Data ($): | | | | | | |
Net asset value, beginning of period | | 14.63 | 11.47 | 10.29 | 12.16 | 12.25 |
Investment Operations: | | | | | | |
Investment income—neta | | .45 | .22 | .20 | .24 | .28 |
Net realized and unrealized
gain (loss) on investments | | (2.49) | 3.12 | .98 | (1.87) | (.16) |
Total from Investment Operations | | (2.04) | 3.34 | 1.18 | (1.63) | .12 |
Distributions: | | | | | | |
Dividends from
investment income—net | | (.25) | (.18) | - | (.22) | (.21) |
Dividends from net realized gains on investment—net | | (.21) | - | - | - | - |
Tax return of capital | | - | - | - | (.02) | - |
Total Distributions | | (.46) | (.18) | - | (.24) | (.21) |
Net asset value, end of period | | 12.13 | 14.63 | 11.47 | 10.29 | 12.16 |
Total Return (%) | | (14.51) | 29.70 | 11.47 | (13.53) | .95 |
Ratios/ Supplemental Data (%): | | | | | | |
Ratio of total expenses
to average net assets | | 1.29 | 1.28 | 1.32 | 1.38 | 1.35 |
Ratio of net expenses
to average net assets | | 1.28 | 1.28 | 1.30 | 1.30 | 1.33 |
Ratio of net investment income
to average net assets | | 2.92 | 1.77 | 1.90 | 2.10 | 2.26 |
Portfolio Turnover Rate | | 68.70 | 71.57 | 79.54 | 125.89 | 97.47 |
Net Assets, end of period($ x 1,000) | | 1,849 | 1,905 | 1,439 | 1,052 | 653 |
a Based on average shares outstanding.
See notes to financial statements.
31
NOTES TO FINANCIAL STATEMENTS
NOTE 1—Significant Accounting Policies:
Dreyfus Total Emerging Markets Fund (the “fund”) is a separate non-diversified series of Advantage Funds, Inc. (the “Company”), which is registered under the Investment Company Act of 1940, as amended (the “Act”), as an open-end management investment company and operates as a series company currently offering ten series, including the fund. The fund’s investment objective is to seek to maximize total return. The Dreyfus Corporation (the “Manager” or “Dreyfus”), a wholly-owned subsidiary of The Bank of New York Mellon Corporation (“BNY Mellon”), serves as the fund’s investment adviser.
MBSC Securities Corporation (the “Distributor”), a wholly-owned subsidiary of Dreyfus, is the distributor of the fund’s shares. The fund is authorized to issue 100 million shares of $.001 par value Common Stock in each of the following classes of shares: Class A, Class C, Class I, Class T and Class Y. Class A and Class T shares generally are subject to a sales charge imposed at the time of purchase. Class C shares are subject to a contingent deferred sales charge (“CDSC”) imposed on Class C shares redeemed within one year of purchase. Class C shares automatically convert to Class A shares ten years after the date of purchase, without the imposition of a sales charge. Class I and Class Y shares are sold at net asset value per share generally to institutional investors. As of the date of this report, the fund did not offer Class T shares for purchase. Other differences between the classes include the services offered to and the expenses borne by each class, the allocation of certain transfer agency costs, and certain voting rights. Income, expenses (other than expenses attributable to a specific class), and realized and unrealized gains or losses on investments are allocated to each class of shares based on its relative net assets.
As of October 31, 2018, MBC Investments Corp., an indirect subsidiary of BNY Mellon, held 40,000 Class A shares, 40,000 Class C shares and 463,798 Class I shares of the fund.
The Company accounts separately for the assets, liabilities and operations of each series. Expenses directly attributable to each series are charged to that series’ operations; expenses which are applicable to all series are allocated among them on a pro rata basis.
The Financial Accounting Standards Board (“FASB”) Accounting Standards Codification (“ASC”) is the exclusive reference of authoritative U.S. generally accepted accounting principles (“GAAP”) recognized by the FASB to be applied by nongovernmental entities. Rules and interpretive releases of the Securities and Exchange Commission (“SEC”) under
32
authority of federal laws are also sources of authoritative GAAP for SEC registrants. The fund’s financial statements are prepared in accordance with GAAP, which may require the use of management estimates and assumptions. Actual results could differ from those estimates.
The Company enters into contracts that contain a variety of indemnifications. The fund’s maximum exposure under these arrangements is unknown. The fund does not anticipate recognizing any loss related to these arrangements.
(a) Portfolio valuation: The fair value of a financial instrument is the amount that would be received to sell an asset or paid to transfer a liability in an orderly transaction between market participants at the measurement date (i.e., the exit price). GAAP establishes a fair value hierarchy that prioritizes the inputs of valuation techniques used to measure fair value. This hierarchy gives the highest priority to unadjusted quoted prices in active markets for identical assets or liabilities (Level 1 measurements) and the lowest priority to unobservable inputs (Level 3 measurements).
Additionally, GAAP provides guidance on determining whether the volume and activity in a market has decreased significantly and whether such a decrease in activity results in transactions that are not orderly. GAAP requires enhanced disclosures around valuation inputs and techniques used during annual and interim periods.
Various inputs are used in determining the value of the fund’s investments relating to fair value measurements. These inputs are summarized in the three broad levels listed below:
Level 1—unadjusted quoted prices in active markets for identical investments.
Level 2—other significant observable inputs (including quoted prices for similar investments, interest rates, prepayment speeds, credit risk, etc.).
Level 3—significant unobservable inputs (including the fund’s own assumptions in determining the fair value of investments).
The inputs or methodology used for valuing securities are not necessarily an indication of the risk associated with investing in those securities.
Changes in valuation techniques may result in transfers in or out of an assigned level within the disclosure hierarchy. Valuation techniques used to value the fund’s investments are as follows:
Investments in debt securities, excluding short-term investments (other than U.S. Treasury Bills), futures, options and forward foreign currency
33
NOTES TO FINANCIAL STATEMENTS (continued)
exchange contracts (“forward contracts”) are valued each business day by an independent pricing service (the “Service”) approved by the Company’s Board of Directors (the “Board”). Investments for which quoted bid prices are readily available and are representative of the bid side of the market in the judgment of the Service are valued at the mean between the quoted bid prices (as obtained by the Service from dealers in such securities) and asked prices (as calculated by the Service based upon its evaluation of the market for such securities). Other investments are valued as determined by the Service, based on methods which include consideration of the following: yields or prices of securities of comparable quality, coupon, maturity and type; indications as to values from dealers; and general market conditions. These securities are generally categorized within Level 2 of the fair value hierarchy.
Investments in equity securities are valued at the last sales price on the securities exchange or national securities market on which such securities are primarily traded. Securities listed on the National Market System for which market quotations are available are valued at the official closing price or, if there is no official closing price that day, at the last sales price. For open short positions, asked prices are used for valuation purposes. Bid price is used when no asked price is available. Registered investment companies that are not traded on an exchange are valued at their net asset value. All of the preceding securities are generally categorized within Level 1 of the fair value hierarchy.
Securities not listed on an exchange or the national securities market, or securities for which there were no transactions, are valued at the average of the most recent bid and asked prices. These securities are generally categorized within Level 2 of the fair value hierarchy.
The Service is engaged under the general supervision of the Board.
Fair valuing of securities may be determined with the assistance of a pricing service using calculations based on indices of domestic securities and other appropriate indicators, such as prices of relevant ADRs and futures. Utilizing these techniques may result in transfers between Level 1 and Level 2 of the fair value hierarchy.
When market quotations or official closing prices are not readily available, or are determined not to accurately reflect fair value, such as when the value of a security has been significantly affected by events after the close of the exchange or market on which the security is principally traded (for example, a foreign exchange or market), but before the fund calculates its net asset value, the fund may value these investments at fair value as determined in accordance with the procedures approved by the Board.
34
Certain factors may be considered when fair valuing investments such as: fundamental analytical data, the nature and duration of restrictions on disposition, an evaluation of the forces that influence the market in which the securities are purchased and sold, and public trading in similar securities of the issuer or comparable issuers. These securities are either categorized within Level 2 or 3 of the fair value hierarchy depending on the relevant inputs used.
For restricted securities where observable inputs are limited, assumptions about market activity and risk are used and such securities are generally categorized within Level 3 of the fair value hierarchy.
Investments denominated in foreign currencies are translated to U.S. dollars at the prevailing rates of exchange.
Futures, options, which are traded on an exchange, are valued at the last sales price on the securities exchange on which such securities are primarily traded or at the last sales price on the national securities market on each business day and are generally categorized within Level 1 of the fair value hierarchy. Options traded over-the-counter (“OTC”) are valued at the mean between the bid and asked price and are generally categorized within Level 2 of the fair value hierarchy. Forward contracts are valued at the forward rate and are generally categorized within Level 2 of the fair value hierarchy.
The following is a summary of the inputs used as of October 31, 2018 in valuing the fund’s investments:
| | | | | |
| | Level 1 –
Unadjusted
Quoted Prices | Level 2 – Other
Significant
Observable
Inputs | Level 3 –
Significant
Unobservable
Inputs | Total |
Assets ($) | | | |
Investments in Securities: | | | |
Corporate Bonds | - | 20,928,158 | - | 20,928,158 |
Equity Securities –
Common Stocks | 25,737,645 | 45,184,153†† | - | 70,921,798 |
Equity Securities –
Preferred Stocks | 2,920,780 | - | - | 2,920,780 |
Foreign Government | - | 10,072,152 | - | 10,072,152 |
Investment Company | 6,835,307 | - | - | 6,835,307 |
Municipal Bonds | - | 1,069,240 | - | 1,069,240 |
U.S. Treasury | - | 991,143 | - | 991,143 |
35
NOTES TO FINANCIAL STATEMENTS (continued)
| | | | | |
| | Level 1 –
Unadjusted
Quoted Prices | Level 2 – Other
Significant
Observable
Inputs | Level 3 –
Significant
Unobservable
Inputs | Total |
Assets ($) | | | |
Other Financial Instruments: | | | |
Forward Foreign Currency Exchange Contracts | - | 1,219,910 | - | 1,219,910 |
Options Purchased | - | 56,361 | - | 56,361 |
Liabilities ($) | | | | |
Other Financial Instruments: | | | |
Futures† | (1,839) | - | - | (1,839) |
Forward Foreign Currency Exchange Contracts† | - | (1,090,500) | - | (1,090,500) |
Options Written | - | (57,471) | - | (57,471) |
† Amount shown represents unrealized appreciation (depreciation) at period end, but only variation margin on exchanged traded and centrally cleared derivatives are reported in the Statement of Assets and Liabilities..
†† Securities classified within Level 2 at period end as the values were determined pursuant to the fund’s fair valuation procedures.
At October 31, 2018, the amount of securities transferred between levels equals fair value of exchange traded foreign equity securities reported as Level 2 in the table above. At October 31, 2017, there was no transfer between levels of the fair value hierarchy. It is the fund’s policy to recognize transfers between levels at the end of the reporting period.
(b) Foreign currency transactions: The fund does not isolate that portion of the results of operations resulting from changes in foreign exchange rates on investments from the fluctuations arising from changes in the market prices of securities held. Such fluctuations are included with the net realized and unrealized gain or loss on investments.
Net realized foreign exchange gains or losses arise from sales of foreign currencies, currency gains or losses realized on securities transactions between trade and settlement date, and the difference between the amounts of dividends, interest and foreign withholding taxes recorded on the fund’s books and the U.S. dollar equivalent of the amounts actually received or paid. Net unrealized foreign exchange gains and losses arise from changes in the value of assets and liabilities other than investments resulting from changes in exchange rates. Foreign currency gains and losses on foreign currency transactions are also included with net realized and unrealized gain or loss on investments.
36
(c) Securities transactions and investment income: Securities transactions are recorded on a trade date basis. Realized gains and losses from securities transactions are recorded on the identified cost basis. Dividend income is recognized on the ex-dividend date and interest income, including, where applicable, accretion of discount and amortization of premium on investments, is recognized on the accrual basis.
(d) Affiliated issuers: Investments in other investment companies advised by Dreyfus are considered “affiliated” under the Act.
(e) Risk: Investing in foreign markets may involve special risks and considerations not typically associated with investing in the U.S. These risks include revaluation of currencies, high rates of inflation, repatriation restrictions on income and capital, and adverse political and economic developments. Moreover, securities issued in these markets may be less liquid, subject to government ownership controls and delayed settlements, and their prices may be more volatile than those of comparable securities in the U.S.
(f) Dividends and distributions to shareholders: Dividends and distributions are recorded on the ex-dividend date. Dividends from investment income-net and dividends from net realized capital gains, if any, are normally declared and paid annually, but the fund may make distributions on a more frequent basis to comply with the distribution requirements of the Internal Revenue Code of 1986, as amended (the “Code”). To the extent that net realized capital gains can be offset by capital loss carryovers, it is the policy of the fund not to distribute such gains. Income and capital gain distributions are determined in accordance with income tax regulations, which may differ from GAAP.
(g) Federal income taxes: It is the policy of the fund to continue to qualify as a regulated investment company, if such qualification is in the best interests of its shareholders, by complying with the applicable provisions of the Code, and to make distributions of taxable income and net realized capital gain sufficient to relieve it from substantially all federal income and excise taxes.
As of and during the period ended October 31, 2018, the fund did not have any liabilities for any uncertain tax positions. The fund recognizes interest and penalties, if any, related to uncertain tax positions as income tax expense in the Statement of Operations. During the period ended October 31, 2018, the fund did not incur any interest or penalties.
37
NOTES TO FINANCIAL STATEMENTS (continued)
Each tax year in the four-year period ended October 31, 2018 remains subject to examination by the Internal Revenue Service and state taxing authorities.
At October 31, 2018, the components of accumulated earnings on a tax basis were as follows: undistributed ordinary income $2,630,614, undistributed capital gains $7,902,282 and unrealized depreciation $4,321,067.
The tax character of distributions paid to shareholders during the fiscal periods ended October 31, 2018 and October 31, 2017 were as follows: ordinary income $1,947,789 and $1,679,804 and long-term capital gains $1,673,072 and $0, respectively.
(h) New Accounting Pronouncements: In March 2017, the FASB issued Accounting Standards Update 2017-08, Receivables—Nonrefundable Fees and Other Costs (Subtopic 310-20): Premium Amortization On Purchased Callable Debt Securities (“ASU 2017-08”). The update shortens the amortization period for the premium on certain purchased callable debt securities to the earliest call date. ASU 2017-08 will be effective for annual periods beginning after December 15, 2018.
Also in August 2018, the FASB issued Accounting Standards Update 2018-13, Fair Value Measurement (Topic 820): Disclosure Framework—Changes to the Disclosure Requirements for Fair Value Measurement (“ASU 2018-13”). The update provides guidance that eliminates, adds and modifies certain disclosure requirements for fair value measurements. ASU 2018-13 will be effective for annual periods beginning after December 15, 2019. Management is currently assessing the potential impact of these changes to future financial statements.
NOTE 2—Bank Lines of Credit:
The fund participates with other Dreyfus-managed funds in an $830 million unsecured credit facility led by Citibank, N.A. and a $300 million unsecured credit facility provided by The Bank of New York Mellon, a subsidiary of BNY Mellon and an affiliate of Dreyfus (each, a “Facility”), each to be utilized primarily for temporary or emergency purposes, including the financing of redemptions. In connection therewith, the fund has agreed to pay its pro rata portion of commitment fees for each Facility. Interest is charged to the fund based on rates determined pursuant to the terms of the respective Facility at the time of borrowing. During the period ended October 31, 2018, the fund did not borrow under the Facilities.
38
NOTE 3—Management Fee and Other Transactions with Affiliates:
(a) Pursuant to a management agreement with Dreyfus, the management fee is computed at the annual rate of 1% of the value of the fund’s average daily net assets and is payable monthly. Dreyfus has contractually agreed, from November 1, 2017 through March 1, 2019, to waive receipt of its fees and/or assume the direct expenses of the fund, so that the direct expenses of none of the classes (excluding Rule 12b-1 Distribution Plan fees, Shareholder Services Plan fees, taxes, interest expense, brokerage commissions, commitment fees on borrowings and extraordinary expenses) exceed 1.35% of the fund’s average daily net assets. On or after March 1, 2019, Dreyfus may terminate this expense limitation at any time. The reduction in expenses, pursuant to the undertaking, amounted to $11,192 during the period ended October 31, 2018.
During the period ended October 31, 2018, the Distributor retained $410 from commissions earned on sales of the fund’s Class A shares and $63 from CDSC fees on redemptions of the fund’s Class C shares.
(b) Under the Distribution Plan adopted pursuant to Rule 12b-1 under the Act, Class C shares pay the Distributor for distributing its shares at an annual rate of .75% of the value of its average daily net assets. During the period ended October 31, 2018, Class C shares were charged $6,418 pursuant to the Distribution Plan.
(c) Under the Shareholder Services Plan, Class A and Class C shares pay the Distributor at an annual rate of .25% of the value of their average daily net assets for the provision of certain services. The services provided may include personal services relating to shareholder accounts, such as answering shareholder inquiries regarding the fund and providing reports and other information, and services related to the maintenance of shareholder accounts. The Distributor may make payments to Service Agents (securities dealers, financial institutions or other industry professionals) with respect to these services. The Distributor determines the amounts to be paid to Service Agents. During the period ended October 31, 2018, Class A and Class C shares were charged $6,149 and $2,139, respectively, pursuant to the Shareholder Services Plan.
The fund has arrangements with the transfer agent and the custodian whereby the fund may receive earnings credits when positive cash balances are maintained, which are used to offset transfer agency and custody fees. For financial reporting purposes, the fund includes net earnings credits, if any, as an expense offset in the Statement of Operations.
39
NOTES TO FINANCIAL STATEMENTS (continued)
The fund compensates Dreyfus Transfer, Inc., a wholly-owned subsidiary of Dreyfus, under a transfer agency agreement for providing transfer agency and cash management services for the fund. The majority of transfer agency fees are comprised of amounts paid on a per account basis, while cash management fees are related to fund subscriptions and redemptions. During the period ended October 31, 2018, the fund was charged $4,083 for transfer agency services. These fees are included in Shareholder servicing costs in the Statement of Operations.
The fund compensates The Bank of New York Mellon under a custody agreement for providing custodial services for the fund. These fees are determined based on net assets, geographic region and transaction activity. During the period ended October 31, 2018, the fund was charged $72,622 pursuant to the custody agreement. These fees were partially offset by earnings credits of $1,260.
During the period ended October 31, 2018, the fund was charged $15,357 for services performed by the Chief Compliance Officer and his staff. These fees are included in Miscellaneous in the Statement of Operations.
The components of “Due to The Dreyfus Corporation and affiliates” in the Statement of Assets and Liabilities consist of: management fees $96,729, Distribution Plan fees $478, Shareholder Services Plan fees $548, custodian fees $30,000, Chief Compliance Officer fees $5,031 and transfer agency fees $920, which are offset against an expense reimbursement currently in effect in the amount $9,147.
(d) Each Board member also serves as a Board member of other funds within the Dreyfus complex. Annual retainer fees and attendance fees are allocated to each fund based on net assets.
(e) A 2% redemption fee is charged and retained by the fund on certain shares redeemed within sixty days following the date of issuance subject to certain exceptions, including redemptions made through use of the fund’s exchange privilege. During the period ended October 31, 2018, redemption fees charged and retained by the fund amounted to $11,489.
NOTE 4—Securities Transactions:
The aggregate amount of purchases and sales of investment securities, excluding short-term securities, futures, options transactions and forward contracts, during the period ended October 31, 2018, amounted to $92,218,693 and $78,434,567, respectively.
Derivatives: A derivative is a financial instrument whose performance is derived from the performance of another asset. The fund enters into International Swaps and Derivatives Association, Inc. Master Agreements
40
or similar agreements (collectively, “Master Agreements”) with its OTC derivative contract counterparties in order to, among other things, reduce its credit risk to counterparties. Master Agreements include provisions for general obligations, representations, collateral and events of default or termination. Under a Master Agreement, the fund may offset with the counterparty certain derivative financial instrument’s payables and/or receivables with collateral held and/or posted and create one single net payment in the event of default or termination.
Each type of derivative instrument that was held by the fund during the period ended October 31, 2018 is discussed below.
Futures: In the normal course of pursuing its investment objective, the fund is exposed to market risk, including interest rate risk as a result of changes in value of underlying financial instruments. The fund invests in futures in order to manage its exposure to or protect against changes in the market. A futures contract represents a commitment for the future purchase or a sale of an asset at a specified date. Upon entering into such contracts, these investments require initial margin deposits with a counterparty, which consist of cash or cash equivalents. The amount of these deposits is determined by the exchange or Board of Trade on which the contract is traded and is subject to change. Accordingly, variation margin payments are received or made to reflect daily unrealized gains or losses which are recorded in the Statement of Operations. When the contracts are closed, the fund recognizes a realized gain or loss which is reflected in the Statement of Operations. There is minimal counterparty credit risk to the fund with futures since they are exchange traded, and the exchange guarantees the futures against default. Futures open at October 31, 2018 are set forth in the Statement of Futures.
Options Transactions: The fund purchases and writes (sells) put and call options to hedge against changes in the values of foreign currencies or as a substitute for an investment. The fund is subject to market risk and currency risk in the course of pursuing its investment objectives through its investments in options contracts. A call option gives the purchaser of the option the right (but not the obligation) to buy, and obligates the writer to sell, the underlying financial instrument at the exercise price at any time during the option period, or at a specified date. Conversely, a put option gives the purchaser of the option the right (but not the obligation) to sell, and obligates the writer to buy the underlying financial instrument at the exercise price at any time during the option period, or at a specified date.
As a writer of call options, the fund receives a premium at the outset and then bears the market risk of unfavorable changes in the price of the financial instrument underlying the option. Generally, the fund realizes a
41
NOTES TO FINANCIAL STATEMENTS (continued)
gain, to the extent of the premium, if the price of the underlying financial instrument decreases between the date the option is written and the date on which the option is terminated. Generally, the fund incurs a loss if the price of the financial instrument increases between those dates. The maximum payout for those contracts is limited to the number of call option contracts written and the related strike prices, respectively.
As a writer of put options, the fund receives a premium at the outset and then bears the market risk of unfavorable changes in the price of the financial instrument underlying the option. Generally, the fund realizes a gain, to the extent of the premium, if the price of the underlying financial instrument increases between the date the option is written and the date on which the option is terminated. Generally, the fund incurs a loss if the price of the financial instrument decreases between those dates. The maximum payout for those contracts is limited to the number of put option contracts written and the related strike prices, respectively.
As a writer of an option, the fund has no control over whether the underlying financial instrument may be sold (call) or purchased (put) and as a result bears the market risk of an unfavorable change in the price of the financial instrument underlying the written option. There is a risk of loss from a change in value of such options which may exceed the related premiums received. This risk may be mitigated by Master Agreements, if any, between the fund and the counterparty and the posting of collateral, if any, by the counterparty to the fund to cover the fund’s exposure to the counterparty. The Statement of Operations reflects any unrealized gains or losses which occurred during the period as well as any realized gains or losses which occurred upon the expiration or closing of the option transaction. Options written open at October 31, 2018 are set forth in Statement of Options Written.
Forward Foreign Currency Exchange Contracts: The fund enters into forward contracts in order to hedge its exposure to changes in foreign currency exchange rates on its foreign portfolio holdings, to settle foreign currency transactions or as a part of its investment strategy. When executing forward contracts, the fund is obligated to buy or sell a foreign currency at a specified rate on a certain date in the future. With respect to sales of forward contracts, the fund incurs a loss if the value of the contract increases between the date the forward contract is opened and the date the forward contract is closed. The fund realizes a gain if the value of the contract decreases between those dates. With respect to purchases of forward contracts, the fund incurs a loss if the value of the contract decreases between the date the forward contract is opened and the date the forward contract is closed. The fund realizes a gain if the value of the
42
contract increases between those dates. Any realized or unrealized gains or losses which occurred during the period are reflected in the Statement of Operations. The fund is exposed to foreign currency risk as a result of changes in value of underlying financial instruments. The fund is also exposed to credit risk associated with counterparty nonperformance on these forward contracts, which is generally limited to the unrealized gain on each open contract. This risk may be mitigated by Master Agreements, if any, between the fund and the counterparty and the posting of collateral, if any, by the counterparty to the fund to cover the fund’s exposure to the counterparty. Forward contracts open at October 31, 2018 are set forth in the Statement of Forward Foreign Currency Exchange Contracts.
The following tables show the fund’s exposure to different types of market risk as it relates to the Statement of Assets and Liabilities and the Statement of Operations, respectively.
Fair value of derivative instruments as of October 31, 2018 is shown below:
| | | | | | | | |
| | Derivative
Assets ($) | | | | Derivative
Liabilities ($) | |
Interest rate risk | - | | Interest rate risk | (1,839) | 1 |
Foreign exchange risk | 1,276,271 | 2,3 | Foreign exchange risk | (1,147,971) | 3,4 |
Gross fair value of
derivative contracts | 1,276,271 | | | | (1,149,810) | |
| | | | | | | |
| | Statement of Assets and Liabilities location: | |
1 | Includes cumulative appreciation (depreciation) on futures as reported in the Statement of Futures, but only the
unpaid variation margin is reported in the Statement of Assets and Liabilities. |
2 | Options purchased are included in Investments in securities—Unaffiliated issuers, at value. |
3 | Unrealized appreciation (depreciation) on forward foreign currency exchange contracts. |
4 | Outstanding options written, at value. | |
The effect of derivative instruments in the Statement of Operations during the period ended October 31, 2018 is shown below:
| | | | | | | | | | |
Amount of realized gain (loss) on derivatives recognized in income ($) | |
Underlying
risk | Futures | 1 | Options
Transactions | 2 | Forward
Contracts | 3 | Total | | |
Interest
rate | (17,972) | | - | | - | | (17,972) | | |
Foreign
exchange | - | | (131,166) | | (673,357) | | (804,523) | | |
Total | (17,972) | | (131,166) | | (673,357) | | (822,495) | | |
| | | | | | | | | | |
43
NOTES TO FINANCIAL STATEMENTS (continued)
| | | | | | | | | | | |
Change in unrealized appreciation (depreciation)
on derivatives recognized in income ($) | |
Underlying
risk | Futures | 4 | Options
Transactions | 5 | Forward
Contracts | 6 | Total | | |
Interest
rate | (1,839) | | - | | - | | (1,839) | | |
Foreign
exchange | - | | (47,093) | | 13,470 | | (33,623) | | |
Total | (1,839) | | (47,093) | | 13,470 | | (35,462) | | |
| | | | | | | | | | | |
Statement of Operations location: | |
1 Net realized gain (loss) on futures. | |
2 Net realized gain (loss) on options transactions. |
3 Net realized gain (loss) on forward foreign currency exchange contracts. | |
4 Net unrealized appreciation (depreciation) on futures. | |
5 Net unrealized appreciation (depreciation) on options transactions. | |
6 Net unrealized appreciation (depreciation) on forward foreign currency exchange contracts. |
The provisions of ASC Topic 210 “Disclosures about Offsetting Assets and Liabilities” require disclosure on the offsetting of financial assets and liabilities. These disclosures are required for certain investments, including derivative financial instruments subject to Master Agreements which are eligible for offsetting in the Statement of Assets and Liabilities and require the fund to disclose both gross and net information with respect to such investments. For financial reporting purposes, the fund does not offset derivative assets and derivative liabilities that are subject to Master Agreements in the Statement of Assets and Liabilities.
At October 31, 2018, derivative assets and liabilities (by type) on a gross basis are as follows:
| | | | | | |
Derivative Financial Instruments: | | Assets ($) | | Liabilities ($) | |
Futures | | - | | (1,839) | |
Options | | 56,361 | | (57,471) | |
Forward contracts | | 1,219,910 | | (1,090,500) | |
Total gross amount of derivative | | | | | |
assets and liabilities in the | | | | | |
Statement of Assets and Liabilities | | 1,276,271 | | (1,149,810) | |
Derivatives not subject to | | | | | |
Master Agreements | | - | | 1,839 | |
Total gross amount of assets | | | | | |
and liabilities subject to | | | | | |
Master Agreements | | 1,276,271 | | (1,147,971) | |
The following tables present derivative assets and liabilities net of amounts available for offsetting under Master Agreements and net of related collateral received or pledged, if any, as of October 31, 2018:†
44
| | | | | | | |
| | | | Financial | | | |
| | | | Instruments | | | |
| | | | and Derivatives | | | |
| | Gross Amount of | | Available | Collateral | | Net Amount of |
Counterparty | Assets ($) | 1 | for Offset ($) | Received ($) | 2 | Assets ($) |
Barclays Capital | 545,959 | | (545,959) | - | | - |
Citigroup | 169,488 | | (165,622) | - | | 3,866 |
HSBC | 34,901 | | (18,176) | - | | 16,725 |
J.P. Morgan Securities | 522,468 | | (313,744) | (160,000) | | 48,724 |
UBS Securities | 3,455 | | (3,455) | - | | - |
Total | 1,276,271 | | (1,046,956) | (160,000) | | 69,315 |
| | | | | | | |
| | | | Financial | | | |
| | | | Instruments | | | |
| | | | and Derivatives | | | |
| | Gross Amount of | | Available | Collateral | | Net Amount of |
Counterparty | Liabilities ($) | 1 | for Offset ($) | Pledged ($) | 2 | Liabilities ($) |
Barclays Capital | (622,474) | | 545,959 | 80,602 | | 4,087 |
Citigroup | (165,622) | | 165,622 | - | | - |
HSBC | (18,176) | | 18,176 | - | | - |
J.P. Morgan Securities | (313,744) | | 313,744 | - | | - |
Merrill Lynch, Pierce, Fenner & Smith | (11,137) | | - | - | | (11,137) |
UBS Securities | (16,818) | | 3,455 | - | | (13,363) |
Total | (1,147,971) | | 1,046,956 | 80,602 | | (20,413) |
| | | | | | | |
1 Absent a default event or early termination, OTC derivative assets and liabilities are presented at gross amounts and are not offset in the Statement of Assets and Liabilities. |
2 In some instances, the actual collateral received and/or pledged may be more than the amount shown due to over collateralization. |
† See Statement of Investments for detailed information regarding collateral held for open exchange traded derivative contracts. |
The following summarizes the average market value of derivatives outstanding during the period ended October 31, 2018:
| | | |
| | Average Market Value ($) |
Interest rate futures | | 452,136 |
Foreign currency options contracts | | 72,616 |
Forward contracts | | 88,294,024 |
| | | |
At October 31, 2018, the cost of investments for federal income tax purposes was $118,331,223; accordingly, accumulated net unrealized depreciation on investments inclusive of derivative contracts was $4,343,766, consisting of $8,559,927 gross unrealized appreciation and $12,903,693 gross unrealized depreciation.
45
REPORT OF INDEPENDENT REGISTERED PUBLIC ACCOUNTING FIRM
To the Shareholders and the Board of Directors of Dreyfus Total Emerging Markets Fund
Opinion on the Financial Statements
We have audited the accompanying statement of assets and liabilities of Dreyfus Total Emerging Markets Fund (the “Fund”) (one of the funds constituting Advantage Funds, Inc.), including the statements of investments, investments in affiliated issuers, futures, options written and forward foreign currency exchange contracts, as of October 31, 2018, and the related statement of operations for the year then ended, the statements of changes in net assets for each of the two years in the period then ended, the financial highlights for each of the five years in the period then ended and the related notes (collectively referred to as the “financial statements”). In our opinion, the financial statements present fairly, in all material respects, the financial position of the Fund (one of the funds constituting Advantage Funds, Inc.) at October 31, 2018, the results of its operations for the year then ended, the changes in its net assets for each of the two years in the period then ended and its financial highlights for each of the five years in the period then ended, in conformity with U.S. generally accepted accounting principles.
Basis for Opinion
These financial statements are the responsibility of the Fund’s management. Our responsibility is to express an opinion on the Fund’s financial statements based on our audits. We are a public accounting firm registered with the Public Company Accounting Oversight Board (United States) (“PCAOB”) and are required to be independent with respect to the Fund in accordance with the U.S. federal securities laws and the applicable rules and regulations of the Securities and Exchange Commission and the PCAOB.
We conducted our audits in accordance with the standards of the PCAOB. Those standards require that we plan and perform the audit to obtain reasonable assurance about whether the financial statements are free of material misstatement, whether due to error or fraud. The Fund is not required to have, nor were we engaged to perform, an audit of the Fund’s internal control over financial reporting. As part of our audits, we are required to obtain an understanding of internal control over financial reporting, but not for the purpose of expressing an opinion on the effectiveness of the Fund’s internal control over financial reporting. Accordingly, we express no such opinion.
Our audits included performing procedures to assess the risks of material misstatement of the financial statements, whether due to error or fraud, and performing procedures that respond to those risks. Such procedures included examining, on a test basis, evidence regarding the amounts and disclosures in the financial statements. Our procedures included confirmation of securities owned as of October 31, 2018, by correspondence with the custodian and others or by other appropriate auditing procedures where replies from others were not received. Our audits also included evaluating the accounting principles used and significant estimates made by management, as well as evaluating the overall presentation of the financial statements. We believe that our audits provide a reasonable basis for our opinion.

We have served as the auditor of one or more Dreyfus investment companies since at least 1957, but we are unable to determine the specific year.
New York, New York
December 28, 2018
46
IMPORTANT TAX INFORMATION (Unaudited)
In accordance with federal tax law, the fund elects to provide each shareholder with their portion of the fund’s foreign taxes paid and the income sourced from foreign countries. Accordingly, the fund hereby reports the following information regarding its fiscal year ended October 31, 2018:
- the total amount of taxes paid to foreign countries was $212,774
- the total amount of income sourced from foreign countries was $3,981,819.
Where required by Federal tax law rules, shareholders will receive notification of their proportionate share of foreign taxes paid and foreign sourced income for the 2018 calendar year with Form 1099-DIV which will be mailed in early 2019.
For the fiscal year ended October 31, 2018, certain dividends paid by the fund may be subject to a maximum tax rate of 15%, as provided for by the Jobs and Growth Tax Relief Reconciliation Act of 2003. Of the distributions paid during the fiscal year, $196,667 represents the maximum amount that may be considered qualified dividend income. The fund also hereby reports $.2125 per share as a long-term capital gain distribution paid on December 28, 2018.
47
BOARD MEMBERS INFORMATION (Unaudited)
INDEPENDENT BOARD MEMBERS
Joseph S. DiMartino (75)
Chairman of the Board (1995)
Principal Occupation During Past 5 Years:
· Corporate Director and Trustee (1995-present)
Other Public Company Board Memberships During Past 5 Years:
· CBIZ (formerly, Century Business Services, Inc.), a provider of outsourcing functions for small and medium size companies, Director (1997-present)
No. of Portfolios for which Board Member Serves: 124
———————
Peggy C. Davis (75)
Board Member (2006)
Principal Occupation During Past 5 Years:
· Shad Professor of Law, New York University School of Law (1983-present)
No. of Portfolios for which Board Member Serves: 45
———————
David P. Feldman (78)
Board Member (1996)
Principal Occupation During Past 5 Years:
· Corporate Director and Trustee (1985-present)
Other Public Company Board Memberships During Past 5 Years:
· BBH Mutual Funds Group (5 registered mutual funds), Director (1992-2014)
No. of Portfolios for which Board Member Serves: 31
———————
Joan Gulley (71)
Board Member (2017)
Principal Occupation During Past 5 Years:
· PNC Financial Services Group, Inc.(1993-2014), Executive Vice President and Chief Human Resources Officer and Executive Committee Member (2008-2014)
No. of Portfolios for which Board Member Serves: 52
———————
48
Ehud Houminer (78)
Board Member (1993)
Principal Occupation During Past 5 Years:
· Board of Overseers at the Columbia Business School, Columbia University (1992-present)
· Trustee, Ben Gurion University
No. of Portfolios for which Board Member Serves: 52
———————
Lynn Martin (78)
Board Member (2012)
Principal Occupation During Past 5 Years:
· President of The Martin Hall Group LLC, a human resources consulting firm (2005-2012)
No. of Portfolios for which Board Member Serves: 31
———————
Robin A. Melvin (55)
Board Member (2012)
Principal Occupation During Past 5 Years:
· Co-chairman, Illinois Mentoring Partnership, non-profit organization dedicated to increasing the quantity and quality of mentoring services in Illinois; (2014-present; board member since 2013)
No. of Portfolios for which Board Member Serves: 99
———————
Dr. Martin Peretz (79)
Board Member (2006)
Principal Occupation During Past 5 Years:
· Editor-in-Chief Emeritus of The New Republic Magazine (2011-2012) (previously,
Editor-in-Chief, 1974-2011)
· Lecturer at Harvard University (1968-2010)
No. of Portfolios for which Board Member Serves: 31
———————
Once elected all Board Members serve for an indefinite term, but achieve Emeritus status upon reaching age 80. The address of the Board Members and Officers is c/o The Dreyfus Corporation, 200 Park Avenue, New York, New York 10166. Additional information about the Board Members is available in the fund’s Statement of Additional Information which can be obtained from Dreyfus free of charge by calling this toll free number: 1-800-DREYFUS.
James F. Henry, Emeritus Board Member
Philip L. Toia, Emeritus Board Member
49
OFFICERS OF THE FUND (Unaudited)
BRADLEY J. SKAPYAK, President since January 2010.
Chief Operating Officer and a director of the Manager since June 2009, Chairman of Dreyfus Transfer, Inc., an affiliate of the Manager and the transfer agent of the funds, since May 2011 and Chief Executive Officer of MBSC Securities Corporation since August 2016. He is an officer of 62 investment companies (comprised of 124 portfolios) managed by the Manager. He is 59 years old and has been an employee of the Manager since February 1988.
BENNETT A. MACDOUGALL, Chief Legal Officer since October 2015.
Chief Legal Officer of the Manager and Associate General Counsel and Managing Director of BNY Mellon since June 2015; from June 2005 to June 2015, he served in various capacities with Deutsche Bank – Asset & Wealth Management Division, including as Director and Associate General Counsel, and Chief Legal Officer of Deutsche Investment Management Americas Inc. from June 2012 to May 2015. He is an officer of 63 investment companies (comprised of 149 portfolios) managed by the Manager. He is 47 years old and has been an employee of the Manager since June 2015.
JAMES BITETTO, Vice President since August 2005 and Secretary since February 2018.
Managing Counsel of BNY Mellon and Secretary of the Manager, and an officer of 63 investment companies (comprised of 149 portfolios) managed by the Manager. He is 52 years old and has been an employee of the Manager since December 1996.
JOSEPH M. CHIOFFI, Vice President and Assistant Secretary since August 2005.
Managing Counsel of BNY Mellon, and an officer of 63 investment companies (comprised of 149 portfolios) managed by the Manager. He is 56 years old and has been an employee of the Manager since June 2000.
SONALEE CROSS, Vice President and Assistant Secretary since March 2018.
Counsel of BNY Mellon since October 2016; Associate at Proskauer Rose LLP from April 2016 to September 2016; Attorney at EnTrust Capital from August 2015 to February 2016; Associate at Sidley Austin LLP from September 2013 until August 2015. She is an officer of 63 investment companies (comprised of 149 portfolios) managed by Dreyfus. She is 31 years old and has been an employee of the Manager since October 2016.
MAUREEN E. KANE, Vice President and Assistant Secretary since April 2015.
Managing Counsel of BNY Mellon since July 2014; from October 2004 until July 2014, General Counsel, and from May 2009 until July 2014, Chief Compliance Officer of Century Capital Management. She is an officer of 63 investment companies (comprised of 149 portfolios) managed by the Manager. She is 56 years old and has been an employee of the Manager since July 2014.
SARAH S. KELLEHER, Vice President and Assistant Secretary since April 2014.
Managing Counsel of BNY Mellon since December 2017, from March 2013 to December 2017, Senior Counsel of BNY Mellon. She is an officer of 63 investment companies (comprised of 149 portfolios) managed by the Manager. She is 43 years old and has been an employee of the Manager since March 2013.
JEFF PRUSNOFSKY, Vice President and Assistant Secretary since August 2005.
Senior Managing Counsel of BNY Mellon, and an officer of 63 investment companies (comprised of 149 portfolios) managed by the Manager. He is 53 years old and has been an employee of the Manager since October 1990.
NATALYA ZELENSKY, Vice President and Assistant Secretary since March 2017.
Counsel of BNY Mellon since May 2016; Attorney at Wildermuth Endowment Strategy Fund/Wildermuth Advisory, LLC from November 2015 until May 2016; Assistant General Counsel at RCS Advisory Services from July 2014 until November 2015; Associate at Sutherland, Asbill & Brennan from January 2013 until January 2014. She is an officer of 63 investment companies (comprised of 149 portfolios) managed by Dreyfus. She is 33 years old and has been an employee of the Manager since May 2016.
JAMES WINDELS, Treasurer since November 2001.
Director – Mutual Fund Accounting of the Manager, and an officer of 63 investment companies (comprised of 149 portfolios) managed by the Manager. He is 60 years old and has been an employee of the Manager since April 1985.
50
GAVIN C. REILLY, Assistant Treasurer since December 2005.
Tax Manager of the Investment Accounting and Support Department of the Manager, and an officer of 63 investment companies (comprised of 149 portfolios) managed by the Manager. He is 50 years old and has been an employee of the Manager since April 1991.
ROBERT S. ROBOL, Assistant Treasurer since August 2005.
Senior Accounting Manager – Dreyfus Financial Reporting of the Manager, and an officer of 63 investment companies (comprised of 149 portfolios) managed by the Manager. He is 54 years old and has been an employee of the Manager since October 1988.
ROBERT SALVIOLO, Assistant Treasurer since July 2007.
Senior Accounting Manager – Equity Funds of the Manager, and an officer of 63 investment companies (comprised of 149 portfolios) managed by the Manager. He is 51 years old and has been an employee of the Manager since June 1989.
ROBERT SVAGNA, Assistant Treasurer since December 2002.
Senior Accounting Manager – Fixed Income and Equity Funds of the Manager, and an officer of 63 investment companies (comprised of 149 portfolios) managed by the Manager. He is 51 years old and has been an employee of the Manager since November 1990.
JOSEPH W. CONNOLLY, Chief Compliance Officer since October 2004.
Chief Compliance Officer of the Manager, the Dreyfus Family of Funds and BNY Mellon Funds Trust (63 investment companies, comprised of 149 portfolios). He is 61 years old and has served in various capacities with the Manager since 1980, including manager of the firm’s Fund Accounting Department from 1997 through October 2001.
CARIDAD M. CAROSELLA, Anti-Money Laundering Compliance Officer since January 2016.
Anti-Money Laundering Compliance Officer of the Dreyfus Family of Funds and BNY Mellon Funds Trust since January 2016; from May 2015 to December 2015, Interim Anti-Money Laundering Compliance Officer of the Dreyfus Family of Funds and BNY Mellon Funds Trust and the Distributor; from January 2012 to May 2015, AML Surveillance Officer of the Distributor and from 2007 to December 2011, Financial Processing Manager of the Distributor. She is an officer of 57 investment companies (comprised of 143 portfolios) managed by the Manager. She is 50 years old and has been an employee of the Distributor since 1997.
51
NOTES
52
NOTES
53
Dreyfus Total Emerging Markets Fund
200 Park Avenue
New York, NY 10166
Manager
The Dreyfus Corporation
200 Park Avenue
New York, NY 10166
Custodian
The Bank of New York Mellon
240 Greenwich Street
New York, NY 10286
Transfer Agent &
Dividend Disbursing Agent
Dreyfus Transfer, Inc.
200 Park Avenue
New York, NY 10166
Distributor
MBSC Securities Corporation
200 Park Avenue
New York, NY 10166
| | |
Ticker Symbols: | Class A: DTMAX Class C: DTMCX Class I: DTEIX Class Y: DTMYX |
Telephone Call your financial representative or 1-800-DREYFUS
Mail The Dreyfus Family of Funds, 144 Glenn Curtiss Boulevard, Uniondale, NY 11556-0144
E-mail Send your request to info@dreyfus.com
Internet Information can be viewed online or downloaded at www.dreyfus.com
The fund files its complete schedule of portfolio holdings with the Securities and Exchange Commission (“SEC”) for the first and third quarters of each fiscal year on Form N-Q. The fund’s Forms N-Q are available on the SEC’s website at www.sec.gov.
A description of the policies and procedures that the fund uses to determine how to vote proxies relating to portfolio securities and information regarding how the fund voted these proxies for the most recent 12-month period ended June 30 is available at www.dreyfus.com and on the SEC’s website at www.sec.gov and without charge, upon request, by calling 1-800-DREYFUS.
| | |
© 2018 MBSC Securities Corporation
6301AR1018 | 
|
Dynamic Total Return Fund
| | | |

| | ANNUAL REPORT October 31, 2018 |
| |
Save time. Save paper. View your next shareholder report online as soon as it’s available. Log into www.dreyfus.com and sign up for Dreyfus eCommunications. It’s simple and only takes a few minutes. |
| |
The views expressed in this report reflect those of the portfolio manager(s) only through the end of the period covered and do not necessarily represent the views of Dreyfus or any other person in the Dreyfus organization. Any such views are subject to change at any time based upon market or other conditions and Dreyfus disclaims any responsibility to update such views. These views may not be relied on as investment advice and, because investment decisions for a Dreyfus fund are based on numerous factors, may not be relied on as an indication of trading intent on behalf of any Dreyfus fund. |
| |
Not FDIC-Insured • Not Bank-Guaranteed • May Lose Value |
Contents
THE FUND
FOR MORE INFORMATION
Back Cover
| | | | |
| |
Dynamic Total Return Fund
| | The Fund |
A LETTER FROM THE PRESIDENT OF DREYFUS
Dear Shareholder:
We are pleased to present this annual report for Dynamic Total Return Fund, covering the 12-month period from November 1, 2017 through October 31, 2018. For information about how the fund performed during the reporting period, as well as general market perspectives, we provide a Discussion of Fund Performance on the pages that follow.
Markets began the reporting period on solid footing as major global economies experienced above-trend growth across the board. In the United States, the Federal Reserve continued to move away from its accommodative monetary policy while other major central banks also began to consider monetary tightening. In the equity markets, both U.S. and non-U.S. markets enjoyed an upward trend, though investor concerns about volatility and inflation later began to weigh on returns. Interest rates rose across the curve, putting pressure on bond prices.
Later in the reporting period, global growth trends began to diverge. While a strong economic performance continued to bolster U.S. equity markets, slower growth and political concerns pressured markets in the Eurozone. Emerging markets also came under pressure as weakness in their currencies added to investors’ uneasiness. Fixed income markets continued to struggle as interest rates rose; the yield on the benchmark 10-year Treasury bond surged late in the reporting period, but growing investor concerns about global growth helped keep it from rising further.
Despite continuing doubts regarding trade, U.S. inflationary pressures, and global growth, we are optimistic that the U.S. economy will remain strong in the near term. However, we will stay attentive to signs that signal potential changes on the horizon. As always, we encourage you to discuss the risks and opportunities of today’s investment environment with your financial advisor.
Thank you for your continued confidence and support.
Sincerely,

Renee Laroche-Morris
President
The Dreyfus Corporation
November 15, 2018
2
DISCUSSION OF FUND PERFORMANCE (Unaudited)
For the period from November 1, 2017 through October 31, 2018, as provided by portfolio managers Vassilis Dagioglu, James Stavena, Torrey Zaches, Joseph Miletich, and Sinead Colton, of BNY Mellon Asset Management North America Corporation, Sub-Investment Adviser.
Market and Fund Performance Overview
For the 12-month period ended October 31, 2018, Dynamic Total Return Fund’s Class A shares produced a total return of -4.63%, Class C shares returned -5.30%, Class I shares returned
-4.33% and Class Y shares returned -4.27%.1 In comparison, the FTSE Three-Month U.S. Treasury Bill Index, the MSCI World Index, and an index comprised of 60% MSCI World Index and 40% FTSE World Government Bond Index (the “Hybrid Index”) returned 1.67%, 1.16%, and -0.02%, respectively.2,3,4,5
Market volatility re-emerged in 2018, largely driven by the normalization of U.S. monetary policy and contentious trade negotiations between the U.S. and China. Cash earned a higher return than global stocks, while global bond returns were negative over the reporting period. The fund lagged its benchmark indices due to overweight positions in several international equity markets and the underperformance of U.S. Treasury bonds relative to German bunds.
On July 31, 2018, the Citi Three-Month U.S. Treasury Bill Index and the Citi World Government Bond Index were renamed the FTSE Three-Month U.S. Treasury Bill Index and the FTSE World Government Bond Index, respectively.
The Fund’s Investment Approach
The fund seeks total return. To pursue this goal, the fund normally invests in instruments that provide investment exposure to global equity, bond, currency, and commodity markets, and in fixed-income securities. The fund may invest in instruments that provide economic exposure to developed- and, to a limited extent, emerging-market issuers.
The fund seeks to achieve investment exposure to global equity, bond, currency, and commodity markets primarily through long and short positions in futures, options, forward contracts, swap agreements or exchange-traded funds (ETFs), and will normally use economic leverage as part of its investment strategy. The fund may also invest in fixed-income securities, such as bonds, notes (including structured notes), and money market instruments, as well as foreign government obligations and securities of supranational entities, to provide exposure to bond markets and for liquidity and income, as well as hold cash.
The fund’s portfolio managers apply a systematic, analytical investment approach designed to identify and exploit relative misvaluation opportunities across and within global capital markets. Active investment decisions to dynamically shift between long or short positions in individual country, equity, bond, currency and commodity markets, as well as allocations to cash, are driven by this systematic investment process and seek to capitalize on opportunities within and among the capital markets of the world. The fund’s portfolio managers have considerable latitude in allocating the fund’s assets and in selecting derivative instruments and securities to implement the fund’s investment approach.
The portfolio managers update, monitor, and follow buy or sell recommendations using proprietary investment models. Among equity markets, the portfolio managers employ a bottom-up valuation approach using proprietary models to derive market-level expected returns. For bond markets, the portfolio managers use proprietary models to identify temporary mispricing among global bond markets. For currency markets, the portfolio managers evaluate currencies on a relative valuation basis and hold overweight exposure to currencies that are undervalued. For commodities, the portfolio managers seek to identify opportunities in commodity markets by measuring and evaluating inventory
3
DISCUSSION OF FUND PERFORMANCE (Unaudited) (continued)
and term structure, hedging, and speculative activity as well as momentum. The investment process combines fundamental and momentum signals in a quantitative framework.
Monetary Policy Normalization Offsets Uptick in U.S.-Led Global Growth
After one of its most subdued levels ever recorded, market volatility re-emerged in 2018, largely driven by the normalization of U.S. monetary policy and contentious trade negotiations between the U.S. and China. The first bout of volatility occurred in late January, and a second occurred as the reporting period came to a close.
Fiscal stimulus, led by tax cuts in the U.S., fostered increased expectations of higher growth and corporate profits. The fiscal stimulus, combined with a robust labor market, continued to lead the U.S. Federal Reserve (the “Fed”) toward policy normalization. The Fed hiked short-term interest rates four times in quarter-point increments over the reporting period, bringing the range of the federal funds rate to 2.00%-2.25%. Additional hikes are anticipated in late 2018 and throughout 2019.
While trade negotiations have progressed among North American countries, the trade and tariff tensions between the U.S. and China continued to build during the reporting period. This, and the fear of rising U.S. interest rates, led to a significant increase in volatility across global stock and bond markets, especially emerging-market equities and bonds that are sensitive to a strengthening U.S. dollar.
U.S. stocks outperformed international stocks, with emerging-market equities falling the hardest. Conversely, U.S. bonds fared worse than their international peers in Germany, Japan, and the U.K. Commodities were broadly lower over the reporting period, with the exception of crude oil, which benefited from an expectation of better global growth.
Lagging Non-U.S. Equities and U.S. Government Bonds Detracted from Performance
The fund’s performance was hindered largely by an overweight to global stocks, particularly outside the U.S. market. Overseas equity markets generally lagged the U.S. market, especially in emerging-market countries. Fortunately, the fund has maintained a minimal allocation to emerging-market equities and thus avoided exposure to the markets that experienced the largest declines. The relative underperformance of the fund’s international equity allocation was broadly spread across the U.K., German, Italian, Canadian, and Swiss markets.
Also contributing to the fund’s negative total return over the reporting period was a preference for U.S. government bonds, especially relative to U.K., German and Japanese counterparts. U.S. bonds declined in reaction to improving domestic economic growth and the normalization of U.S. monetary policy, while the European and Japanese central banks extended their bond-buying programs due to the continuation of sluggish economic growth and weak inflation. In the currency market, the two largest detractors from the fund’s performance were a long position in the Canadian dollar and a short position in the New Zealand dollar.
The largest positive contributor to the fund’s return over the reporting period was active currency selection. Long allocations to the U.S. dollar and the Swiss franc, combined with short positions in the euro and the Swedish krona, added to the fund’s performance. The fund also had small positive contributions from active positioning in the commodity markets and a small allocation to high yield bonds.
Cautiously Optimistic as Policy Risks Grow
We currently expect modest global economic growth and mildly higher inflation as more central banks begin tightening monetary policy. However, the cumulative impact of eight U.S. rate hikes over the last two-and-a-half years, and expectations that other central banks will begin hiking rates, have raised the probability of a policy error that could derail economic growth.
4
In this environment, we believe global growth over the next 12 months will be strong enough to sustain the positive trends in corporate profitability. Moreover, given the notable drop in equity markets at the end of the reporting period, the fund is maintaining a healthy allocation to global stocks. Approximately two-thirds of the stock allocation is concentrated in foreign markets, such as the U.K., Japan and Canada. But not every stock market is attractive, and thus the fund has short positions in the Australian and Swiss equity markets. We continue to strongly favor U.S. government bonds, especially relative to international counterparts, as the interest-rate differentials between the U.S. and overseas markets are at or near historic highs. The fund is also maintaining short positions in Japanese and German government bonds. Lastly, given our belief that global inflationary pressures are contained, we maintain only small allocations to real assets, such as commodities and inflation-protected bonds.
November 15, 2018
1 Total return includes reinvestment of dividends and any capital gains paid, and does not take into consideration the maximum initial sales charge in the case of Class A shares, or the applicable contingent deferred sales charge imposed on redemptions in the case of Class C shares. Had these charges been reflected, returns would have been lower. Share price, yield, and investment return fluctuate such that upon redemption, fund shares may be worth more or less than their original cost. Past performance is no guarantee of future results. The fund’s returns reflect the absorption of certain fund expenses by The Dreyfus Corporation pursuant to an agreement in effect through March 1, 2019, at which time it may be extended, terminated, or modified.
2 Source: Lipper, Inc. — Reflects reinvestment of net dividends and, where applicable, capital gain distributions. The MSCI World Index is a free float-adjusted, market capitalization-weighted index that is designed to measure the equity market performance of developed markets. Investors cannot invest directly in any index.
3 Source: Lipper, Inc. — The FTSE Three-Month U.S. Treasury Bill Index consists of the last three-month Treasury bill month-end rates. The FTSE Three-Month U.S. Treasury Bill Index measures return equivalents of yield averages. The instruments are not marked to market. Investors cannot invest directly in any index.
4 Source: Lipper, Inc. — The FTSE World Government Bond Index (the “WGB Index”) measures the performance of fixed-rate, local-currency, investment-grade sovereign bonds. The WGB Index is a widely used benchmark that currently comprises sovereign debt from over 20 countries, denominated in a variety of currencies, and has more than 25 years of history available. The WGB Index provides a broad benchmark for the global sovereign fixed-income market. Investors cannot invest directly in any index.
5 Source: FactSet —The Hybrid Index is an unmanaged hybrid index composed of 60% MSCI World Index and 40% WGB Index. Investors cannot invest directly in any index.
Equities are subject generally to market, market sector, market liquidity, issuer, and investment style risks, among other factors, to varying degrees, all of which are more fully described in the fund’s prospectus.
Bonds are subject generally to interest-rate, credit, liquidity, call, sector, and market risks, to varying degrees, all of which are more fully described in the fund’s prospectus.
Investing internationally involves special risks, including changes in currency exchange rates, political, economic, and social instability, a lack of comprehensive company information, differing auditing and legal standards, and less market liquidity. These risks generally are greater with emerging-market countries than with more economically and politically established foreign countries.
Emerging markets tend to be more volatile than the markets of more mature economies and generally have less diverse and less mature economic structures and less stable political systems than those of developed countries. The securities of companies located in emerging markets are often subject to rapid and large changes in price. An investment in this fund should be considered only as a supplement to a complete investment program for those investors willing to accept the greater risks associated with investing in emerging-market countries.
5
FUND PERFORMANCE (Unaudited)

Comparison of change in value of $10,000 investment in Dynamic Total Return Fund Class A shares, Class C shares, Class I shares and Class Y shares and the MSCI World Index, FTSE Three-Month U.S. Treasury Bill Index and an index comprised of 60% MSCI World Index and 40% FTSE World Government Bond Index (the “Hybrid Index”)
† Source: FactSet
†† Source: Lipper Inc.
††† The total return figures presented for Class Y shares of the fund reflect the performance of the fund’s Class A shares for the period prior to 7/1/13 (inception date for Class Y shares), not reflecting the applicable sales charges for Class A shares.
Past performance is not predictive of future performance.
The above graph compares a $10,000 investment made in each of the Class A, Class C, Class I and Class Y shares of Dynamic Total Return Fund on 10/31/08 to a $10,000 investment made on that date in each of the following: MSCI World Index, FTSE Three-Month U.S. Treasury Bill Index and the Hybrid Index. Returns assume all dividends and capital gain distributions are reinvested.
The fund’s performance shown in the line graph above takes into account the maximum initial sales charge on Class A shares and all other applicable fees and expenses on all classes. The MSCI World Index is a free float-adjusted market capitalization-weighted index that is designed to measure the equity market performance of developed markets. The FTSE Three-Month U.S. Treasury Bill Index consists of the last three-month Treasury bill month-end rates. The FTSE Three-Month U.S. Treasury Bill Index measures returns equivalent of yield averages. The instruments are not marked to market. The FTSE World Government Bond Index (the "WGB Index") measures the performance of fixed-rate, local currency, investment-grade sovereign bonds. The WGB Index is a widely used benchmark that currently comprises sovereign debt from over 20 countries, denominated in a variety of currencies, and has more than 25 years of history available. The WGB Index provides a broad benchmark for the global sovereign fixed income market. Unlike a mutual fund, the indices are not subject to charges, fees and other expenses. Investors cannot invest directly in any index. Further information relating to fund performance, including expense reimbursements, if applicable, is contained in the Financial Highlights section of the prospectus and elsewhere in this report.
6
| | | | | |
Average Annual Total Returns as of 10/31/18 |
| | Inception | | | |
| | Date | 1 Year | 5 Years | 10 Years |
Class A shares | | | | |
with maximum sales charge (5.75%) | 5/2/06 | -10.09% | 1.11% | 6.31% |
without sales charge | 5/2/06 | -4.63% | 2.32% | 6.95% |
Class C shares | | | | |
with applicable redemption charge † | 5/2/06 | -6.19% | 1.57% | 6.15% |
without redemption | 5/2/06 | -5.30% | 1.57% | 6.15% |
Class I shares | 5/2/06 | -4.33% | 2.61% | 7.29% |
Class Y shares | 7/1/13 | -4.27% | 2.62% | 7.26%†† |
MSCI World Index | | 1.16% | 6.81% | 10.02% |
FTSE Three-Month U.S. Treasury Bill Index | 1.67% | 0.53% | 0.33% |
Hybrid Index | | -0.02% | 4.09% | 7.11% |
† The maximum contingent deferred sales charge for Class C shares is 1% for shares redeemed within one year of the date of purchase.
†† The total return performance figures presented for Class Y shares of the fund reflect the performance of the fund’s Class A shares for the period prior to 7/1/13 (inception date for Class Y shares), not reflecting the applicable sales charges for class A shares.
The performance data quoted represents past performance, which is no guarantee of future results. Share price and investment return fluctuate and an investor’s shares may be worth more or less than original cost upon redemption. Current performance may be lower or higher than the performance quoted. Go to Dreyfus.com for the fund’s most recent month-end returns.
The fund’s performance shown in the graph and table does not reflect the deduction of taxes that a shareholder would pay on fund distributions or the redemption of fund shares. In addition to the performance of Class A shares shown with and without a maximum sales charge, the fund’s performance shown in the table takes into account all other applicable fees and expenses on all classes.
7
UNDERSTANDING YOUR FUND’S EXPENSES (Unaudited)
As a mutual fund investor, you pay ongoing expenses, such as management fees and other expenses. Using the information below, you can estimate how these expenses affect your investment and compare them with the expenses of other funds. You also may pay one-time transaction expenses, including sales charges (loads) and redemption fees, which are not shown in this section and would have resulted in higher total expenses. For more information, see your fund’s prospectus or talk to your financial adviser.
Review your fund’s expenses
The table below shows the expenses you would have paid on a $1,000 investment in Dynamic Total Return Fund from May 1, 2018 to October 31, 2018. It also shows how much a $1,000 investment would be worth at the close of the period, assuming actual returns and expenses.
| | | | | | | | | | | |
Expenses and Value of a $1,000 Investment | | |
assuming actual returns for the six months ended October 31, 2018 |
| | | Class A | | Class C | | Class I | | Class Y |
Expenses paid per $1,000† | | $7.18 | | $10.90 | | $5.94 | | $5.69 |
Ending value (after expenses) | | $978.60 | | $975.50 | | $980.40 | | $980.40 |
COMPARING YOUR FUND’S EXPENSES
WITH THOSE OF OTHER FUNDS (Unaudited)
Using the SEC’s method to compare expenses
The Securities and Exchange Commission (“SEC”) has established guidelines to help investors assess fund expenses. Per these guidelines, the table below shows your fund’s expenses based on a $1,000 investment, assuming a hypothetical 5% annualized return. You can use this information to compare the ongoing expenses (but not transaction expenses or total cost) of investing in the fund with those of other funds. All mutual fund shareholder reports will provide this information to help you make this comparison. Please note that you cannot use this information to estimate your actual ending account balance and expenses paid during the period.
| | | | | | | | | |
Expenses and Value of a $1,000 Investment |
assuming a hypothetical 5% annualized return for the six months ended October 31, 2018 |
| | | Class A | | Class C | | Class I | | Class Y |
Expenses paid per $1,000† | | $7.32 | | $11.12 | | $6.06 | | $5.80 |
Ending value (after expenses) | | $1,017.95 | | $1,014.17 | | $1,019.21 | | $1,019.46 |
† Expenses are equal to the fund’s annualized expense ratio of 1.44% for Class A, 2.19% for Class C, 1.19% for Class I and 1.14% for Class Y, multiplied by the average account value over the period, multiplied by 184/365 (to reflect the one-half year period).
8
CONSOLIDATED STATEMENT OF INVESTMENTS
October 31, 2018
| | | | | | | | | | |
| |
Description | Coupon
Rate (%) | | Maturity
Date | | Principal
Amount ($) | | Value ($) | |
Bonds and Notes - 5.0% | | | | | |
Advertising - .0% | | | | | |
Lamar Media,
Gtd. Notes | | 5.00 | | 5/1/2023 | | 75,000 | | 75,234 | |
Lamar Media,
Gtd. Notes | | 5.38 | | 1/15/2024 | | 75,000 | | 75,469 | |
Outfront Media Capital,
Gtd. Notes | | 5.25 | | 2/15/2022 | | 25,000 | | 25,274 | |
Outfront Media Capital,
Gtd. Notes | | 5.63 | | 2/15/2024 | | 75,000 | | 75,375 | |
| | 251,352 | |
Aerospace & Defense - .1% | | | | | |
Arconic,
Sr. Unscd. Notes | | 5.13 | | 10/1/2024 | | 225,000 | | 221,484 | |
Arconic,
Sr. Unscd. Notes | | 5.95 | | 2/1/2037 | | 100,000 | | 96,937 | |
Bombardier,
Sr. Unscd. Notes | | 6.13 | | 1/15/2023 | | 75,000 | b | 74,437 | |
Bombardier,
Sr. Unscd. Notes | | 7.75 | | 3/15/2020 | | 50,000 | b | 52,063 | |
Bombardier,
Sr. Unscd. Notes | | 8.75 | | 12/1/2021 | | 250,000 | b | 270,000 | |
KLX,
Gtd. Notes | | 5.88 | | 12/1/2022 | | 75,000 | b | 77,437 | |
TransDigm,
Gtd. Notes | | 6.00 | | 7/15/2022 | | 125,000 | | 125,937 | |
TransDigm,
Gtd. Notes | | 6.38 | | 6/15/2026 | | 175,000 | | 171,937 | |
TransDigm,
Gtd. Notes | | 6.50 | | 7/15/2024 | | 75,000 | | 76,000 | |
Triumph Group,
Gtd. Notes | | 4.88 | | 4/1/2021 | | 100,000 | | 94,690 | |
| | 1,260,922 | |
Agriculture - .0% | | | | | |
Pyxus International,
Scd. Notes | | 9.88 | | 7/15/2021 | | 100,000 | | 96,250 | |
Vector Group,
Sr. Scd. Notes | | 6.13 | | 2/1/2025 | | 75,000 | b | 68,625 | |
| | 164,875 | |
Airlines - .0% | | | | | |
Air Canada,
Gtd. Notes | | 7.75 | | 4/15/2021 | | 50,000 | b | 53,745 | |
American Airlines Group,
Gtd. Notes | | 4.63 | | 3/1/2020 | | 25,000 | b | 25,094 | |
UAL 2007-1 Pass Through Trust,
Ser. 2007-1, Cl. A | | 6.64 | | 1/2/2024 | | 59,108 | | 61,989 | |
9
CONSOLIDATED STATEMENT OF INVESTMENTS (continued)
| | | | | | | | | | |
| |
Description | Coupon
Rate (%) | | Maturity
Date | | Principal
Amount ($) | | Value ($) | |
Bonds and Notes - 5.0% (continued) | | | | | |
Airlines - .0% (continued) | | | | | |
Virgin Australia Holdings,
Gtd. Notes | | 7.88 | | 10/15/2021 | | 50,000 | b | 49,500 | |
| | 190,328 | |
Automobiles & Components - .1% | | | | | |
Adient Global Holdings,
Gtd. Notes | | 4.88 | | 8/15/2026 | | 75,000 | b | 64,688 | |
Allison Transmission,
Sr. Unscd. Bonds | | 5.00 | | 10/1/2024 | | 75,000 | b | 72,984 | |
American Axle & Manufacturing,
Gtd. Notes | | 6.50 | | 4/1/2027 | | 100,000 | | 95,500 | |
American Axle & Manufacturing,
Gtd. Notes | | 6.63 | | 10/15/2022 | | 24,000 | | 24,390 | |
Aston Martin Capital Holding,
Sr. Scd. Notes | | 6.50 | | 4/15/2022 | | 50,000 | b | 49,250 | |
BCD Acquisition,
Sr. Scd. Notes | | 9.63 | | 9/15/2023 | | 75,000 | b | 79,500 | |
Cooper-Standard Automotive,
Gtd. Notes | | 5.63 | | 11/15/2026 | | 50,000 | b | 47,500 | |
Dana Financing Luxembourg,
Gtd. Notes | | 5.75 | | 4/15/2025 | | 50,000 | b | 48,000 | |
Dana Holding,
Sr. Unscd. Notes | | 5.50 | | 12/15/2024 | | 100,000 | | 96,850 | |
Fiat Chrysler Automobiles,
Sr. Unscd. Notes | | 4.50 | | 4/15/2020 | | 125,000 | | 125,781 | |
Fiat Chrysler Automobiles,
Sr. Unscd. Notes | | 5.25 | | 4/15/2023 | | 75,000 | | 74,812 | |
Goodyear Tire & Rubber,
Gtd. Bonds | | 5.13 | | 11/15/2023 | | 75,000 | | 73,763 | |
Goodyear Tire & Rubber,
Gtd. Notes | | 4.88 | | 3/15/2027 | | 25,000 | | 22,438 | |
Goodyear Tire & Rubber,
Gtd. Notes | | 5.00 | | 5/31/2026 | | 75,000 | | 68,344 | |
IHO Verwaltungs GmbH,
Sr. Scd. Bonds | | 4.13 | | 9/15/2021 | | 50,000 | b | 48,625 | |
Jaguar Land Rover Automotive,
Gtd. Notes | | 4.25 | | 11/15/2019 | | 75,000 | b | 74,906 | |
Jaguar Land Rover Automotive,
Gtd. Notes | | 5.63 | | 2/1/2023 | | 75,000 | b | 71,719 | |
Tenneco,
Gtd. Notes | | 5.00 | | 7/15/2026 | | 50,000 | | 41,750 | |
Tesla,
Gtd. Notes | | 5.30 | | 8/15/2025 | | 100,000 | b | 89,250 | |
| | 1,270,050 | |
Banks - .1% | | | | | |
Barclays,
Sub. Notes | | 4.84 | | 5/9/2028 | | 200,000 | | 184,866 | |
10
| | | | | | | | | | |
| |
Description | Coupon
Rate (%) | | Maturity
Date | | Principal
Amount ($) | | Value ($) | |
Bonds and Notes - 5.0% (continued) | | | | | |
Banks - .1% (continued) | | | | | |
CIT Group,
Sr. Unscd. Notes | | 5.00 | | 8/1/2023 | | 75,000 | | 75,375 | |
CIT Group,
Sr. Unscd. Notes | | 5.00 | | 8/15/2022 | | 65,000 | | 65,650 | |
CIT Group,
Sr. Unscd. Notes | | 5.38 | | 5/15/2020 | | 17,000 | | 17,500 | |
CIT Group,
Sub. Notes | | 6.13 | | 3/9/2028 | | 50,000 | | 52,000 | |
CIT Group ,
Sr. Unscd. Notes | | 4.13 | | 3/9/2021 | | 30,000 | | 30,000 | |
Deutsche Bank,
Sub. Notes | | 4.30 | | 5/24/2028 | | 75,000 | | 67,682 | |
Dresdner Funding Trust I,
Jr. Sub. Notes | | 8.15 | | 6/30/2031 | | 130,000 | b | 161,857 | |
Intesa Sanpaolo,
Sub. Notes | | 5.71 | | 1/15/2026 | | 75,000 | b | 66,688 | |
| | 721,618 | |
Building Materials - .1% | | | | | |
Builders Firstsource,
Sr. Scd. Notes | | 5.63 | | 9/1/2024 | | 75,000 | b | 70,219 | |
Building Materials Corp of America,
Sr. Unscd. Notes | | 6.00 | | 10/15/2025 | | 75,000 | b | 74,062 | |
CIMPOR Financial Operations,
Gtd. Notes | | 5.75 | | 7/17/2024 | | 75,000 | b | 61,350 | |
Griffon,
Gtd. Notes | | 5.25 | | 3/1/2022 | | 75,000 | | 70,406 | |
Norbord,
Sr. Scd. Notes | | 5.38 | | 12/1/2020 | | 100,000 | b | 102,125 | |
St. Marys Cement,
Gtd. Notes | | 5.75 | | 1/28/2027 | | 75,000 | b | 74,696 | |
Standard Industries,
Sr. Unscd. Notes | | 5.00 | | 2/15/2027 | | 100,000 | b | 91,500 | |
Standard Industries,
Sr. Unscd. Notes | | 5.50 | | 2/15/2023 | | 75,000 | b | 73,688 | |
Summit Materials,
Gtd. Notes | | 6.13 | | 7/15/2023 | | 100,000 | | 97,250 | |
US Concrete,
Gtd. Notes | | 6.38 | | 6/1/2024 | | 75,000 | | 70,313 | |
| | 785,609 | |
Casinos - .0% | | | | | |
International Game Technology,
Sr. Scd. Notes | | 6.25 | | 2/15/2022 | | 125,000 | b | 129,687 | |
Chemicals - .2% | | | | | |
Aruba Investments,
Sr. Unscd. Notes | | 8.75 | | 2/15/2023 | | 100,000 | b | 102,500 | |
11
CONSOLIDATED STATEMENT OF INVESTMENTS (continued)
| | | | | | | | | | |
| |
Description | Coupon
Rate (%) | | Maturity
Date | | Principal
Amount ($) | | Value ($) | |
Bonds and Notes - 5.0% (continued) | | | | | |
Chemicals - .2% (continued) | | | | | |
Ashland,
Gtd. Notes | | 4.75 | | 8/15/2022 | | 60,000 | | 59,700 | |
Ashland,
Gtd. Notes | | 6.88 | | 5/15/2043 | | 50,000 | | 50,875 | |
Axalta Coating Systems,
Gtd. Notes | | 4.88 | | 8/15/2024 | | 75,000 | b | 70,969 | |
Blue Cube Spinco,
Gtd. Notes | | 9.75 | | 10/15/2023 | | 75,000 | | 83,625 | |
Blue Cube Spinco,
Gtd. Notes | | 10.00 | | 10/15/2025 | | 25,000 | | 28,438 | |
CF Industries,
Gtd. Notes | | 3.45 | | 6/1/2023 | | 75,000 | | 71,531 | |
CF Industries,
Gtd. Notes | | 4.95 | | 6/1/2043 | | 125,000 | | 107,031 | |
CF Industries,
Gtd. Notes | | 5.38 | | 3/15/2044 | | 75,000 | | 66,281 | |
CF Industries,
Gtd. Notes | | 7.13 | | 5/1/2020 | | 24,000 | | 25,020 | |
Chemours,
Gtd. Notes | | 6.63 | | 5/15/2023 | | 39,000 | | 39,975 | |
Chemours,
Gtd. Notes | | 7.00 | | 5/15/2025 | | 40,000 | | 41,400 | |
CVR Partners,
Scd. Notes | | 9.25 | | 6/15/2023 | | 75,000 | b | 79,312 | |
H.B. Fuller,
Sr. Unscd. Notes | | 4.00 | | 2/15/2027 | | 60,000 | | 52,050 | |
Hexion,
Sr. Scd. Notes | | 6.63 | | 4/15/2020 | | 200,000 | | 177,500 | |
Huntsman International,
Gtd. Notes | | 4.88 | | 11/15/2020 | | 75,000 | | 75,681 | |
Huntsman International,
Gtd. Notes | | 5.13 | | 11/15/2022 | | 125,000 | | 126,875 | |
INEOS Group Holdings,
Gtd. Notes | | 5.63 | | 8/1/2024 | | 75,000 | b | 71,813 | |
Kissner Holdings,
Sr. Scd. Notes | | 8.38 | | 12/1/2022 | | 100,000 | b | 102,000 | |
Momentive Performance Materials,
Sr. Scd. Notes | | 3.88 | | 10/24/2021 | | 75,000 | | 80,625 | |
Olin,
Sr. Unscd. Notes | | 5.00 | | 2/1/2030 | | 30,000 | | 27,047 | |
Platform Specialty Products,
Gtd. Notes | | 5.88 | | 12/1/2025 | | 100,000 | b | 95,250 | |
Platform Specialty Products,
Sr. Unscd. Notes | | 6.50 | | 2/1/2022 | | 125,000 | b | 127,031 | |
PolyOne,
Sr. Unscd. Notes | | 5.25 | | 3/15/2023 | | 75,000 | | 75,419 | |
12
| | | | | | | | | | |
| |
Description | Coupon
Rate (%) | | Maturity
Date | | Principal
Amount ($) | | Value ($) | |
Bonds and Notes - 5.0% (continued) | | | | | |
Chemicals - .2% (continued) | | | | | |
PQ,
Sr. Scd. Notes | | 6.75 | | 11/15/2022 | | 75,000 | b | 77,531 | |
Rayonier AM Products,
Gtd. Notes | | 5.50 | | 6/1/2024 | | 75,000 | b | 70,500 | |
TPC Group,
Sr. Scd. Notes | | 8.75 | | 12/15/2020 | | 50,000 | b | 49,250 | |
Tronox Finance,
Gtd. Notes | | 5.75 | | 10/1/2025 | | 35,000 | b | 30,800 | |
Valvoline,
Gtd. Notes | | 5.50 | | 7/15/2024 | | 50,000 | | 49,813 | |
WR Grace & Co-Conn,
Gtd. Notes | | 5.13 | | 10/1/2021 | | 75,000 | b | 75,750 | |
| | 2,191,592 | |
Commercial & Professional Services - .2% | | | | | |
ADT,
Sr. Scd. Notes | | 6.25 | | 10/15/2021 | | 175,000 | | 181,125 | |
Ahern Rentals,
Scd. Notes | | 7.38 | | 5/15/2023 | | 75,000 | b | 69,844 | |
APX Group,
Gtd. Notes | | 8.75 | | 12/1/2020 | | 125,000 | | 122,187 | |
APX Group,
Sr. Scd. Notes | | 7.88 | | 12/1/2022 | | 75,000 | | 75,562 | |
Atento Luxco 1,
Sr. Scd. Notes | | 6.13 | | 8/10/2022 | | 50,000 | b | 49,250 | |
Avis Budget Car Rental,
Gtd. Notes | | 5.13 | | 4/6/2022 | | 45,000 | b | 46,153 | |
Avis Budget Car Rental,
Gtd. Notes | | 5.50 | | 4/1/2023 | | 75,000 | | 73,219 | |
Cardtronics,
Gtd. Notes | | 5.13 | | 8/1/2022 | | 100,000 | | 96,500 | |
Emeco Pty,
Sr. Scd. Notes, Ser. B | | 9.25 | | 3/31/2022 | | 60,000 | | 63,900 | |
Great Lakes Dredge & Dock Corp,
Gtd. Notes | | 8.00 | | 5/15/2022 | | 75,000 | | 77,272 | |
Hertz,
Gtd. Notes | | 5.50 | | 10/15/2024 | | 75,000 | b | 58,125 | |
Hertz,
Gtd. Notes | | 6.25 | | 10/15/2022 | | 75,000 | | 66,188 | |
Jaguar Holding Co II,
Gtd. Notes | | 6.38 | | 8/1/2023 | | 75,000 | b | 75,165 | |
Midas Intermediate Holdco,
Gtd. Notes | | 7.88 | | 10/1/2022 | | 60,000 | b | 53,250 | |
Nielsen Finance,
Gtd. Notes | | 5.00 | | 4/15/2022 | | 275,000 | b | 268,469 | |
Prime Security Services Borrower,
Scd. Notes | | 9.25 | | 5/15/2023 | | 144,000 | b | 152,525 | |
13
CONSOLIDATED STATEMENT OF INVESTMENTS (continued)
| | | | | | | | | | |
| |
Description | Coupon
Rate (%) | | Maturity
Date | | Principal
Amount ($) | | Value ($) | |
Bonds and Notes - 5.0% (continued) | | | | | |
Commercial & Professional Services - .2% (continued) | | | | | |
Refinitiv Us Holdings,
Gtd. Notes | | 8.25 | | 11/15/2026 | | 130,000 | b | 126,425 | |
Rent-A-Center,
Gtd. Notes | | 6.63 | | 11/15/2020 | | 50,000 | | 49,625 | |
Ritchie Bros Auctioneers,
Gtd. Notes | | 5.38 | | 1/15/2025 | | 75,000 | b | 74,250 | |
Service Corporation International,
Sr. Unscd. Notes | | 5.38 | | 5/15/2024 | | 75,000 | | 76,125 | |
Service Corporation International,
Sr. Unscd. Notes | | 5.38 | | 1/15/2022 | | 60,000 | | 60,563 | |
ServiceMaster,
Gtd. Notes | | 5.13 | | 11/15/2024 | | 75,000 | b | 72,375 | |
Team Health Holdings,
Gtd. Notes | | 6.38 | | 2/1/2025 | | 30,000 | b | 25,950 | |
United Rentals North America,
Gtd. Notes | | 5.50 | | 5/15/2027 | | 200,000 | | 190,500 | |
United Rentals North America,
Gtd. Notes | | 5.88 | | 9/15/2026 | | 100,000 | | 98,375 | |
United Rentals North America,
Scd. Notes | | 4.63 | | 7/15/2023 | | 75,000 | | 74,625 | |
WEX,
Sr. Scd. Notes | | 4.75 | | 2/1/2023 | | 50,000 | b | 50,125 | |
| | 2,427,672 | |
Consumer Discretionary - .4% | | | | | |
24 Hour Fit Worldwide,
Gtd. Notes | | 8.00 | | 6/1/2022 | | 100,000 | b | 98,750 | |
AMC Entertainment Holdings,
Gtd. Notes | | 5.75 | | 6/15/2025 | | 75,000 | | 69,656 | |
AMC Entertainment Holdings,
Gtd. Notes | | 5.88 | | 2/15/2022 | | 50,000 | | 50,438 | |
AMC Entertainment Holdings,
Gtd. Notes | | 5.88 | | 11/15/2026 | | 75,000 | | 69,000 | |
Beazer Homes,
Gtd. Notes | | 8.75 | | 3/15/2022 | | 30,000 | | 30,375 | |
Beazer Homes USA,
Gtd. Notes | | 5.88 | | 10/15/2027 | | 50,000 | | 40,625 | |
Boyd Gaming,
Gtd. Notes | | 6.38 | | 4/1/2026 | | 75,000 | | 74,625 | |
Boyd Gaming,
Gtd. Notes | | 6.88 | | 5/15/2023 | | 75,000 | | 78,187 | |
Century Communities,
Gtd. Notes | | 6.88 | | 5/15/2022 | | 150,000 | | 150,375 | |
Choice Hotels International,
Gtd. Notes | | 5.70 | | 8/28/2020 | | 50,000 | | 51,938 | |
Choice Hotels International,
Gtd. Notes | | 5.75 | | 7/1/2022 | | 75,000 | | 79,125 | |
14
| | | | | | | | | | |
| |
Description | Coupon
Rate (%) | | Maturity
Date | | Principal
Amount ($) | | Value ($) | |
Bonds and Notes - 5.0% (continued) | | | | | |
Consumer Discretionary - .4% (continued) | | | | | |
Cinemark USA,
Gtd. Notes | | 4.88 | | 6/1/2023 | | 75,000 | | 73,594 | |
Constellation Merger Sub,
Sr. Unscd. Notes | | 8.50 | | 9/15/2025 | | 45,000 | b | 43,481 | |
Eldorado Resorts,
Notes | | 6.00 | | 4/1/2025 | | 100,000 | | 99,250 | |
Global Partners,
Gtd. Notes | | 6.25 | | 7/15/2022 | | 100,000 | | 98,750 | |
Hilton Domestic Operating,
Gtd. Notes | | 4.25 | | 9/1/2024 | | 75,000 | | 72,210 | |
Hilton Worldwide Finance,
Gtd. Notes | | 4.63 | | 4/1/2025 | | 175,000 | | 170,187 | |
International Game Technology,
Sr. Scd. Notes | | 6.50 | | 2/15/2025 | | 75,000 | b | 76,312 | |
Jack Ohio Finance,
Scd. Notes | | 10.25 | | 11/15/2022 | | 100,000 | b | 109,125 | |
Jack Ohio Finance,
Sr. Scd. Notes | | 6.75 | | 11/15/2021 | | 75,000 | b | 77,156 | |
K Hovnanian Enterprises,
Scd. Notes | | 10.00 | | 7/15/2022 | | 60,000 | b | 58,200 | |
Kar Auction Services,
Gtd. Notes | | 5.13 | | 6/1/2025 | | 90,000 | b | 85,500 | |
KB Home,
Gtd. Notes | | 7.50 | | 9/15/2022 | | 50,000 | | 53,000 | |
KB Home,
Gtd. Notes | | 8.00 | | 3/15/2020 | | 50,000 | | 52,438 | |
Lennar,
Gtd. Notes | | 2.95 | | 11/29/2020 | | 60,000 | | 58,500 | |
Lennar,
Gtd. Notes | | 4.13 | | 1/15/2022 | | 100,000 | | 98,005 | |
Lennar,
Gtd. Notes | | 4.75 | | 11/29/2027 | | 100,000 | | 93,625 | |
Lennar,
Gtd. Notes | | 4.75 | | 11/15/2022 | | 75,000 | | 74,452 | |
Lennar,
Gtd. Notes | | 5.25 | | 6/1/2026 | | 60,000 | | 57,529 | |
Lennar,
Gtd. Notes | | 5.88 | | 11/15/2024 | | 100,000 | | 101,125 | |
Lennar,
Gtd. Notes | | 8.38 | | 1/15/2021 | | 50,000 | | 54,125 | |
Live Nation Entertainment,
Gtd. Notes | | 4.88 | | 11/1/2024 | | 75,000 | b | 72,000 | |
Live Nation Entertainment,
Gtd. Notes | | 5.38 | | 6/15/2022 | | 50,000 | b | 50,500 | |
Live Nation Entertainment,
Gtd. Notes | | 5.63 | | 3/15/2026 | | 50,000 | b | 50,125 | |
15
CONSOLIDATED STATEMENT OF INVESTMENTS (continued)
| | | | | | | | | | |
| |
Description | Coupon
Rate (%) | | Maturity
Date | | Principal
Amount ($) | | Value ($) | |
Bonds and Notes - 5.0% (continued) | | | | | |
Consumer Discretionary - .4% (continued) | | | | | |
LKQ,
Gtd. Notes | | 4.75 | | 5/15/2023 | | 75,000 | | 72,750 | |
M/I Homes,
Gtd. Notes | | 6.75 | | 1/15/2021 | | 100,000 | | 100,625 | |
Mattel,
Gtd. Notes | | 6.75 | | 12/31/2025 | | 100,000 | b | 95,719 | |
Mattel,
Sr. Unscd. Notes | | 2.35 | | 8/15/2021 | | 50,000 | | 45,125 | |
MDC Holdings,
Gtd. Notes | | 6.00 | | 1/15/2043 | | 75,000 | | 60,375 | |
Meritage Homes,
Gtd. Notes | | 6.00 | | 6/1/2025 | | 100,000 | | 97,750 | |
Meritage Homes,
Gtd. Notes | | 7.15 | | 4/15/2020 | | 100,000 | | 102,875 | |
MGM Resorts International,
Gtd. Notes | | 6.00 | | 3/15/2023 | | 75,000 | | 76,312 | |
MGM Resorts International,
Gtd. Notes | | 6.63 | | 12/15/2021 | | 175,000 | | 183,696 | |
MGM Resorts International,
Gtd. Notes | | 6.75 | | 10/1/2020 | | 50,000 | | 52,220 | |
MGM Resorts International,
Gtd. Notes | | 7.75 | | 3/15/2022 | | 75,000 | | 80,719 | |
Mohegan Gaming & Entertainment,
Gtd. Notes | | 7.88 | | 10/15/2024 | | 75,000 | b | 73,031 | |
National CineMedia,
Sr. Scd. Notes | | 6.00 | | 4/15/2022 | | 60,000 | | 60,900 | |
NCL,
Sr. Unscd. Notes | | 4.75 | | 12/15/2021 | | 101,000 | b | 101,252 | |
Pultegroup,
Gtd. Notes | | 5.00 | | 1/15/2027 | | 75,000 | | 69,656 | |
PulteGroup,
Gtd. Notes | | 5.50 | | 3/1/2026 | | 75,000 | | 73,688 | |
PulteGroup,
Gtd. Notes | | 7.88 | | 6/15/2032 | | 50,000 | | 53,250 | |
Rivers Pittsburgh Borrower,
Sr. Scd. Notes | | 6.13 | | 8/15/2021 | | 60,000 | b | 59,850 | |
Sabre Global,
Sr. Scd. Notes | | 5.25 | | 11/15/2023 | | 75,000 | b | 74,428 | |
Scientific Games International,
Gtd. Notes | | 6.25 | | 9/1/2020 | | 15,000 | | 14,663 | |
Scientific Games International,
Gtd. Notes | | 6.63 | | 5/15/2021 | | 100,000 | | 97,250 | |
Scientific Games International,
Gtd. Notes | | 10.00 | | 12/1/2022 | | 50,000 | | 52,438 | |
Silversea Cruise Finance,
Sr. Scd. Notes | | 7.25 | | 2/1/2025 | | 75,000 | b | 81,188 | |
16
| | | | | | | | | | |
| |
Description | Coupon
Rate (%) | | Maturity
Date | | Principal
Amount ($) | | Value ($) | |
Bonds and Notes - 5.0% (continued) | | | | | |
Consumer Discretionary - .4% (continued) | | | | | |
Six Flags Entertainment,
Gtd. Notes | | 4.88 | | 7/31/2024 | | 150,000 | b | 142,125 | |
Taylor Morrison Communities,
Gtd. Notes | | 5.25 | | 4/15/2021 | | 75,000 | b | 75,000 | |
Taylor Morrison Communities,
Gtd. Notes | | 6.63 | | 5/15/2022 | | 75,000 | | 75,469 | |
Tempur Sealy International,
Gtd. Notes | | 5.50 | | 6/15/2026 | | 75,000 | | 69,000 | |
Toll Brothers Finance,
Gtd. Notes | | 4.35 | | 2/15/2028 | | 50,000 | | 44,375 | |
Toll Brothers Finance,
Gtd. Notes | | 4.88 | | 11/15/2025 | | 150,000 | | 142,125 | |
TRI Pointe Holdings,
Gtd. Notes | | 5.88 | | 6/15/2024 | | 80,000 | | 75,100 | |
VOC Escrow,
Sr. Scd. Notes | | 5.00 | | 2/15/2028 | | 100,000 | b | 94,500 | |
William Lyon Homes,
Gtd. Notes | | 5.88 | | 1/31/2025 | | 100,000 | | 88,625 | |
Williams Scotsman International,
Sr. Scd. Notes | | 7.88 | | 12/15/2022 | | 100,000 | b | 103,000 | |
WMG Acquisition,
Sr. Scd. Notes | | 5.63 | | 4/15/2022 | | 125,000 | b | 126,875 | |
Wyndham Destinations,
Sr. Scd. Notes | | 5.40 | | 4/1/2024 | | 80,000 | | 77,400 | |
Wyndham Destinations,
Sr. Scd. Notes | | 5.75 | | 4/1/2027 | | 90,000 | | 83,812 | |
Wyndham Worldwide,
Sr. Unscd. Notes | | 3.90 | | 3/1/2023 | | 50,000 | | 46,500 | |
Wynn Las Vegas,
Gtd. Notes | | 5.50 | | 3/1/2025 | | 200,000 | b | 190,750 | |
| | 5,786,699 | |
Consumer Durables & Apparel - .0% | | | | | |
Hanesbrands,
Gtd. Notes | | 4.88 | | 5/15/2026 | | 75,000 | b | 71,438 | |
Under Armour,
Sr. Unscd. Notes | | 3.25 | | 6/15/2026 | | 30,000 | | 26,444 | |
| | 97,882 | |
Consumer Staples - .0% | | | | | |
Avon Products,
Sr. Unscd. Notes | | 6.60 | | 3/15/2020 | | 50,000 | | 50,000 | |
Avon Products,
Sr. Unscd. Notes | | 7.00 | | 3/15/2023 | | 150,000 | | 131,812 | |
Central Garden & Pet Co.,
Gtd. Notes | | 5.13 | | 2/1/2028 | | 50,000 | | 46,250 | |
Edgewell Personal Care,
Gtd. Notes | | 4.70 | | 5/24/2022 | | 50,000 | | 48,813 | |
17
CONSOLIDATED STATEMENT OF INVESTMENTS (continued)
| | | | | | | | | | |
| |
Description | Coupon
Rate (%) | | Maturity
Date | | Principal
Amount ($) | | Value ($) | |
Bonds and Notes - 5.0% (continued) | | | | | |
Consumer Staples - .0% (continued) | | | | | |
First Quality Finance,
Sr. Unscd. Notes | | 4.63 | | 5/15/2021 | | 75,000 | b | 74,062 | |
Kronos Acquistion Holdings,
Gtd. Notes | | 9.00 | | 8/15/2023 | | 25,000 | b | 21,938 | |
Prestige Brands,
Gtd. Notes | | 6.38 | | 3/1/2024 | | 55,000 | b | 54,588 | |
Revlon Consumer Products,
Gtd. Notes | | 5.75 | | 2/15/2021 | | 75,000 | | 59,063 | |
Scotts Miracle-Gro,
Gtd. Notes | | 5.25 | | 12/15/2026 | | 20,000 | | 19,000 | |
Spectrum Brands,
Gtd. Notes | | 5.75 | | 7/15/2025 | | 75,000 | | 73,125 | |
| | 578,651 | |
Diversified Financials - .2% | | | | | |
Ally Financial,
Gtd. Notes | | 7.50 | | 9/15/2020 | | 165,000 | | 175,312 | |
Ally Financial,
Gtd. Notes | | 8.00 | | 11/1/2031 | | 150,000 | | 181,125 | |
Ally Financial,
Sr. Unscd. Notes | | 3.75 | | 11/18/2019 | | 125,000 | | 125,325 | |
Ally Financial,
Sr. Unscd. Notes | | 4.13 | | 2/13/2022 | | 50,000 | | 49,375 | |
Ally Financial,
Sub. Notes | | 5.75 | | 11/20/2025 | | 150,000 | | 154,312 | |
Cooke Omega Investments,
Sr. Scd. Notes | | 8.50 | | 12/15/2022 | | 50,000 | b | 49,500 | |
Credit Acceptance,
Gtd. Notes | | 6.13 | | 2/15/2021 | | 100,000 | | 100,730 | |
E*TRADE Financial,
Jr. Sub. Notes, Ser. A | | 5.88 | | 12/15/2049 | | 200,000 | | 199,500 | |
goeasy,
Gtd. Notes | | 7.88 | | 11/1/2022 | | 100,000 | b | 103,250 | |
Jefferies Finance,
Sr. Unscd. Notes | | 6.88 | | 4/15/2022 | | 50,000 | b | 50,375 | |
Ladder Capital Finance,
Gtd. Notes | | 5.88 | | 8/1/2021 | | 125,000 | b | 126,719 | |
Lions Gate Capital Holding,
Gtd. Notes | | 5.88 | | 11/1/2024 | | 75,000 | b | 75,750 | |
LPL Holdings,
Gtd. Notes | | 5.75 | | 9/15/2025 | | 100,000 | b | 97,250 | |
Nationstar Mortgage,
Gtd. Notes | | 6.50 | | 6/1/2022 | | 100,000 | | 99,187 | |
Nationstar Mortgage,
Gtd. Notes | | 6.50 | | 7/1/2021 | | 35,000 | | 35,069 | |
Navient,
Sr. Unscd. Notes | | 4.88 | | 6/17/2019 | | 75,000 | | 75,375 | |
18
| | | | | | | | | | |
| |
Description | Coupon
Rate (%) | | Maturity
Date | | Principal
Amount ($) | | Value ($) | |
Bonds and Notes - 5.0% (continued) | | | | | |
Diversified Financials - .2% (continued) | | | | | |
Navient,
Sr. Unscd. Notes | | 5.50 | | 1/25/2023 | | 75,000 | | 73,929 | |
Navient,
Sr. Unscd. Notes | | 5.88 | | 10/25/2024 | | 100,000 | | 94,750 | |
Navient,
Sr. Unscd. Notes | | 6.50 | | 6/15/2022 | | 190,000 | | 193,562 | |
Quicken Loans,
Gtd. Notes | | 5.75 | | 5/1/2025 | | 150,000 | b | 145,312 | |
Springleaf Finance,
Gtd. Notes | | 5.25 | | 12/15/2019 | | 75,000 | | 75,937 | |
Springleaf Finance,
Gtd. Notes | | 6.00 | | 6/1/2020 | | 40,000 | | 41,000 | |
Springleaf Finance,
Gtd. Notes | | 6.13 | | 5/15/2022 | | 50,000 | | 50,500 | |
Springleaf Finance,
Gtd. Notes | | 6.88 | | 3/15/2025 | | 100,000 | | 96,000 | |
Springleaf Finance,
Gtd. Notes | | 7.13 | | 3/15/2026 | | 45,000 | | 42,722 | |
Springleaf Finance,
Gtd. Notes | | 8.25 | | 12/15/2020 | | 50,000 | | 53,625 | |
| | 2,565,491 | |
Electronic Components - .0% | | | | | |
Ingram Micro,
Sr. Unscd. Notes | | 5.00 | | 8/10/2022 | | 100,000 | | 98,942 | |
Ingram Micro,
Sr. Unscd. Notes | | 5.45 | | 12/15/2024 | | 75,000 | | 73,213 | |
Sensata Technologies,
Gtd. Notes | | 4.88 | | 10/15/2023 | | 75,000 | b | 73,313 | |
WESCO Distribution,
Gtd. Notes | | 5.38 | | 12/15/2021 | | 75,000 | | 75,187 | |
| | 320,655 | |
Energy - .7% | | | | | |
American Midstream Partners,
Gtd. Notes | | 9.50 | | 12/15/2021 | | 50,000 | b | 49,250 | |
Antero Midstream Partners,
Gtd. Notes | | 5.38 | | 9/15/2024 | | 75,000 | | 73,500 | |
Antero Resources,
Gtd. Notes | | 5.13 | | 12/1/2022 | | 125,000 | | 124,453 | |
Antero Resources,
Gtd. Notes | | 5.63 | | 6/1/2023 | | 75,000 | | 75,187 | |
Archrock Partners,
Gtd. Notes | | 6.00 | | 4/1/2021 | | 100,000 | | 99,500 | |
Archrock Partners,
Sr. Unscd. Notes | | 6.00 | | 10/1/2022 | | 100,000 | | 99,500 | |
Ascent Resources Utica Holdings,
Sr. Unscd. Notes | | 10.00 | | 4/1/2022 | | 32,000 | b | 35,400 | |
19
CONSOLIDATED STATEMENT OF INVESTMENTS (continued)
| | | | | | | | | | |
| |
Description | Coupon
Rate (%) | | Maturity
Date | | Principal
Amount ($) | | Value ($) | |
Bonds and Notes - 5.0% (continued) | | | | | |
Energy - .7% (continued) | | | | | |
Athabasca Oil,
Scd. Notes | | 9.88 | | 2/24/2022 | | 50,000 | b | 50,000 | |
Blue Racer Midstream,
Gtd. Notes | | 6.13 | | 11/15/2022 | | 75,000 | b | 76,875 | |
Bristow Group,
Gtd. Notes | | 6.25 | | 10/15/2022 | | 100,000 | | 74,000 | |
Buckeye Partners,
Jr. Sub. Notes | | 6.38 | | 1/22/2078 | | 100,000 | | 91,867 | |
California Resources,
Scd. Notes | | 8.00 | | 12/15/2022 | | 150,000 | b | 133,875 | |
Callon Petroleum,
Notes | | 6.13 | | 10/1/2024 | | 55,000 | | 53,900 | |
Calumet Specialty Products Partners,
Gtd. Notes | | 6.50 | | 4/15/2021 | | 125,000 | | 120,625 | |
Canadian Oil Sands,
Gtd. Notes | | 4.50 | | 4/1/2022 | | 100,000 | b | 101,010 | |
Carrizo Oil & Gas,
Gtd. Notes | | 6.25 | | 4/15/2023 | | 75,000 | | 74,063 | |
Cheniere,
Sr. Scd. Notes | | 7.00 | | 6/30/2024 | | 140,000 | | 151,725 | |
Cheniere Corpus Christi Holdings,
Sr. Scd. Notes | | 5.13 | | 6/30/2027 | | 100,000 | | 98,250 | |
Chesapeake Energy,
Gtd. Notes | | 6.13 | | 2/15/2021 | | 100,000 | | 101,500 | |
Chesapeake Energy,
Gtd. Notes | | 8.00 | | 6/15/2027 | | 100,000 | | 99,625 | |
Chesapeake Energy,
Gtd. Notes | | 8.00 | | 1/15/2025 | | 75,000 | | 76,266 | |
Chesapeake Energy,
Scd. Notes | | 8.00 | | 12/15/2022 | | 189,000 | b | 197,505 | |
CNX Resources,
Gtd. Notes | | 5.88 | | 4/15/2022 | | 100,000 | | 98,438 | |
Crestwood Midstream Partners,
Gtd. Notes | | 6.25 | | 4/1/2023 | | 75,000 | | 76,781 | |
CSI Compressco,
Gtd. Notes | | 7.25 | | 8/15/2022 | | 100,000 | | 93,500 | |
CVR Refining,
Gtd. Notes | | 6.50 | | 11/1/2022 | | 100,000 | | 101,125 | |
DCP Midstream Operating,
Gtd. Notes | | 3.88 | | 3/15/2023 | | 130,000 | | 125,450 | |
DCP Midstream Operating,
Gtd. Notes | | 4.75 | | 9/30/2021 | | 95,000 | b | 95,475 | |
DCP Midstream Operating,
Gtd. Notes | | 4.95 | | 4/1/2022 | | 60,000 | | 60,450 | |
DCP Midstream Operating,
Gtd. Notes | | 6.75 | | 9/15/2037 | | 50,000 | b | 52,250 | |
20
| | | | | | | | | | |
| |
Description | Coupon
Rate (%) | | Maturity
Date | | Principal
Amount ($) | | Value ($) | |
Bonds and Notes - 5.0% (continued) | | | | | |
Energy - .7% (continued) | | | | | |
Denbury Resources,
Scd. Bonds | | 9.00 | | 5/15/2021 | | 100,000 | b | 104,875 | |
Denbury Resources ,
Gtd. Notes | | 5.50 | | 5/1/2022 | | 50,000 | | 43,500 | |
Diamond Offshore Drilling,
Sr. Unscd. Notes | | 4.88 | | 11/1/2043 | | 100,000 | | 68,500 | |
Diamond Offshore Drilling,
Sr. Unscd. Notes | | 7.88 | | 8/15/2025 | | 100,000 | | 98,750 | |
Diamondback Energy,
Gtd. Notes | | 4.75 | | 11/1/2024 | | 75,000 | | 73,125 | |
Diamondback Energy,
Gtd. Notes | | 5.38 | | 5/31/2025 | | 75,000 | | 74,812 | |
Eclipse Resources,
Gtd. Notes | | 8.88 | | 5/15/2023 | | 75,000 | | 75,000 | |
Energy Transfer Equity,
Sr. Scd. Notes | | 5.50 | | 6/1/2027 | | 75,000 | | 76,429 | |
Energy Transfer Equity,
Sr. Scd. Notes | | 5.88 | | 1/15/2024 | | 25,000 | | 26,313 | |
Energy Transfer Equity,
Sr. Scd. Notes | | 7.50 | | 10/15/2020 | | 50,000 | | 53,063 | |
Enlink Midstream Partner,
Sr. Unscd. Notes | | 4.85 | | 7/15/2026 | | 25,000 | | 23,723 | |
EnLink Midstream Partners ,
Sr. Unscd. Notes | | 5.05 | | 4/1/2045 | | 110,000 | | 87,309 | |
EnLink Midstream Partners ,
Sr. Unscd. Notes | | 5.45 | | 6/1/2047 | | 110,000 | | 92,972 | |
EnLink Midstream Partners ,
Sr. Unscd. Notes | | 5.60 | | 4/1/2044 | | 100,000 | | 85,323 | |
Ensco,
Sr. Unscd. Notes | | 4.50 | | 10/1/2024 | | 150,000 | | 122,437 | |
Ensco,
Sr. Unscd. Notes | | 5.75 | | 10/1/2044 | | 100,000 | | 70,375 | |
EP Energy,
Gtd. Notes | | 6.38 | | 6/15/2023 | | 75,000 | | 44,063 | |
EP Energy,
Scd. Notes | | 8.00 | | 2/15/2025 | | 100,000 | b | 67,750 | |
Extraction Oil & Gas,
Sr. Unscd. Notes | | 5.63 | | 2/1/2026 | | 100,000 | b | 85,000 | |
Genesis Energy,
Gtd. Notes | | 6.00 | | 5/15/2023 | | 50,000 | | 47,375 | |
Genesis Energy,
Gtd. Notes | | 6.75 | | 8/1/2022 | | 75,000 | | 75,750 | |
Gulfport Energy,
Gtd. Notes | | 6.00 | | 10/15/2024 | | 100,000 | | 94,250 | |
Gulfport Energy,
Gtd. Notes | | 6.38 | | 5/15/2025 | | 75,000 | | 71,531 | |
21
CONSOLIDATED STATEMENT OF INVESTMENTS (continued)
| | | | | | | | | | |
| |
Description | Coupon
Rate (%) | | Maturity
Date | | Principal
Amount ($) | | Value ($) | |
Bonds and Notes - 5.0% (continued) | | | | | |
Energy - .7% (continued) | | | | | |
Halcon Resources,
Gtd. Notes | | 6.75 | | 2/15/2025 | | 18,000 | | 16,470 | |
Hilcorp Energy I,
Sr. Unscd. Notes | | 5.75 | | 10/1/2025 | | 75,000 | b | 73,313 | |
KCA Deutag UK Finance,
Sr. Scd. Notes | | 9.88 | | 4/1/2022 | | 50,000 | b | 48,500 | |
Laredo Petroleum,
Gtd. Notes | | 5.63 | | 1/15/2022 | | 100,000 | | 98,250 | |
Martin Midstream Partners,
Gtd. Notes | | 7.25 | | 2/15/2021 | | 85,000 | | 84,787 | |
McDermott Technology Americas,
Gtd. Notes | | 10.63 | | 5/1/2024 | | 100,000 | b | 90,250 | |
MEG Energy,
Gtd. Notes | | 7.00 | | 3/31/2024 | | 75,000 | b | 73,875 | |
MEG Energy,
Scd. Notes | | 6.50 | | 1/15/2025 | | 50,000 | b | 51,719 | |
Murphy Oil,
Sr. Unscd. Notes | | 5.75 | | 8/15/2025 | | 70,000 | | 69,804 | |
Murphy Oil,
Sr. Unscd. Notes | | 5.88 | | 12/1/2042 | | 50,000 | | 44,990 | |
Murphy Oil,
Sr. Unscd. Notes | | 6.88 | | 8/15/2024 | | 150,000 | | 157,047 | |
Newfield Exploration,
Sr. Unscd. Notes | | 5.38 | | 1/1/2026 | | 60,000 | | 60,863 | |
Newfield Exploration,
Sr. Unscd. Notes | | 5.63 | | 7/1/2024 | | 55,000 | | 56,788 | |
Newfield Exploration,
Sr. Unscd. Notes | | 5.75 | | 1/30/2022 | | 25,000 | | 25,906 | |
NGPL Pipeco,
Sr. Unscd. Bonds | | 4.88 | | 8/15/2027 | | 75,000 | b | 72,469 | |
Noble Holding International,
Gtd. Notes | | 5.25 | | 3/15/2042 | | 100,000 | | 70,000 | |
Noble Holding International,
Gtd. Notes | | 6.05 | | 3/1/2041 | | 100,000 | | 73,500 | |
Noble Holding International,
Gtd. Notes | | 7.75 | | 1/15/2024 | | 43,000 | | 40,366 | |
NuStar Logistics,
Gtd. Notes | | 4.75 | | 2/1/2022 | | 125,000 | | 123,906 | |
Oceaneering International,
Sr. Unscd. Notes | | 4.65 | | 11/15/2024 | | 100,000 | | 92,978 | |
Parsley Energy,
Gtd. Notes | | 5.38 | | 1/15/2025 | | 75,000 | b | 73,688 | |
Parsley Energy,
Gtd. Notes | | 6.25 | | 6/1/2024 | | 120,000 | b | 123,600 | |
Parsley Energy ,
Gtd. Notes | | 5.63 | | 10/15/2027 | | 120,000 | b | 118,592 | |
22
| | | | | | | | | | |
| |
Description | Coupon
Rate (%) | | Maturity
Date | | Principal
Amount ($) | | Value ($) | |
Bonds and Notes - 5.0% (continued) | | | | | |
Energy - .7% (continued) | | | | | |
Pattern Energy Group,
Gtd. Notes | | 5.88 | | 2/1/2024 | | 50,000 | b | 49,750 | |
PBF Finance,
Gtd. Notes | | 7.00 | | 11/15/2023 | | 125,000 | | 129,687 | |
PBF Logistics Finance,
Gtd. Notes | | 6.88 | | 5/15/2023 | | 125,000 | | 127,812 | |
Precision Drilling,
Gtd. Notes | | 7.13 | | 1/15/2026 | | 70,000 | b | 69,650 | |
QEP Resources,
Sr. Unscd. Notes | | 5.25 | | 5/1/2023 | | 25,000 | | 24,063 | |
Range Resources,
Gtd. Notes | | 4.88 | | 5/15/2025 | | 75,000 | | 69,750 | |
Range Resources,
Gtd. Notes | | 5.00 | | 8/15/2022 | | 25,000 | | 24,656 | |
Range Resources,
Gtd. Notes | | 5.88 | | 7/1/2022 | | 20,000 | | 20,200 | |
Resolute Energy,
Gtd. Notes | | 8.50 | | 5/1/2020 | | 50,000 | | 50,063 | |
Rose Rock Midstream,
Gtd. Notes | | 5.63 | | 7/15/2022 | | 150,000 | | 144,750 | |
Rowan Cos.,
Gtd. Notes | | 4.88 | | 6/1/2022 | | 25,000 | | 24,031 | |
Rowan Cos.,
Gtd. Notes | | 5.85 | | 1/15/2044 | | 20,000 | | 14,900 | |
Rowan Cos.,
Gtd. Notes | | 7.38 | | 6/15/2025 | | 75,000 | | 71,719 | |
Sanchez Energy,
Gtd. Notes | | 6.13 | | 1/15/2023 | | 100,000 | | 37,750 | |
Sanchez Energy,
Gtd. Notes | | 7.75 | | 6/15/2021 | | 35,000 | | 17,675 | |
SESI,
Gtd. Notes | | 7.13 | | 12/15/2021 | | 75,000 | | 74,625 | |
Seven Generations Energy,
Gtd. Notes | | 6.88 | | 6/30/2023 | | 120,000 | b | 124,200 | |
SM Energy,
Sr. Unscd. Notes | | 5.63 | | 6/1/2025 | | 75,000 | | 72,563 | |
SM Energy,
Sr. Unscd. Notes | | 6.13 | | 11/15/2022 | | 27,000 | | 27,473 | |
Southwestern Energy,
Gtd. Notes | | 7.75 | | 10/1/2027 | | 50,000 | | 51,250 | |
Southwestern Energy,
Sr. Unscd. Notes | | 4.10 | | 3/15/2022 | | 200,000 | | 198,000 | |
Summit Midstream Holdings,
Gtd. Notes | | 5.75 | | 4/15/2025 | | 75,000 | | 72,188 | |
Tallgrass Energy Partners,
Gtd. Notes | | 5.50 | | 1/15/2028 | | 80,000 | b | 79,285 | |
23
CONSOLIDATED STATEMENT OF INVESTMENTS (continued)
| | | | | | | | | | |
| |
Description | Coupon
Rate (%) | | Maturity
Date | | Principal
Amount ($) | | Value ($) | |
Bonds and Notes - 5.0% (continued) | | | | | |
Energy - .7% (continued) | | | | | |
Targa Resources Partners,
Gtd. Notes | | 4.13 | | 11/15/2019 | | 125,000 | | 125,625 | |
Targa Resources Partners ,
Gtd. Notes | | 5.00 | | 1/15/2028 | | 80,000 | | 76,100 | |
Teine Energy,
Sr. Unscd. Notes | | 6.88 | | 9/30/2022 | | 60,000 | b | 60,000 | |
Transocean,
Gtd. Bonds | | 6.50 | | 11/15/2020 | | 100,000 | | 103,125 | |
Transocean,
Gtd. Notes | | 6.80 | | 3/15/2038 | | 150,000 | | 121,312 | |
Transocean,
Gtd. Notes | | 7.50 | | 1/15/2026 | | 100,000 | b | 98,500 | |
Transocean,
Gtd. Notes | | 7.50 | | 4/15/2031 | | 75,000 | | 69,750 | |
Transocean,
Gtd. Notes | | 8.38 | | 12/15/2021 | | 100,000 | | 107,375 | |
Transocean Phoenix 2,
Sr. Scd. Notes | | 7.75 | | 10/15/2024 | | 60,000 | b | 62,250 | |
Trinidad Drilling,
Gtd. Notes | | 6.63 | | 2/15/2025 | | 40,000 | b | 40,200 | |
Ultra Resources,
Gtd. Notes | | 6.88 | | 4/15/2022 | | 50,000 | b | 29,000 | |
Weatherford International,
Gtd. Notes | | 4.50 | | 4/15/2022 | | 40,000 | | 30,200 | |
Weatherford International,
Gtd. Notes | | 7.00 | | 3/15/2038 | | 100,000 | | 68,000 | |
Weatherford International,
Gtd. Notes | | 7.75 | | 6/15/2021 | | 45,000 | | 37,406 | |
Weatherford International,
Gtd. Notes | | 8.25 | | 6/15/2023 | | 45,000 | | 34,650 | |
Weatherford International,
Gtd. Notes | | 9.88 | | 3/1/2025 | | 100,000 | b | 78,000 | |
Whiting Petroleum,
Gtd. Notes | | 5.75 | | 3/15/2021 | | 75,000 | | 75,750 | |
WPX Energy,
Sr. Unscd. Notes | | 5.25 | | 9/15/2024 | | 75,000 | | 74,437 | |
WPX Energy,
Sr. Unscd. Notes | | 6.00 | | 1/15/2022 | | 11,000 | | 11,303 | |
| | 9,044,254 | |
Environmental Control - .0% | | | | | |
Clean Harbors,
Gtd. Notes | | 5.13 | | 6/1/2021 | | 125,000 | | 125,312 | |
Covanta Holding,
Sr. Unscd. Notes | | 5.88 | | 3/1/2024 | | 100,000 | | 100,000 | |
GFL Environmental,
Sr. Unscd. Notes | | 5.38 | | 3/1/2023 | | 100,000 | b | 92,000 | |
24
| | | | | | | | | | |
| |
Description | Coupon
Rate (%) | | Maturity
Date | | Principal
Amount ($) | | Value ($) | |
Bonds and Notes - 5.0% (continued) | | | | | |
Environmental Control - .0% (continued) | | | | | |
Tervita Escrow,
Scd. Notes | | 7.63 | | 12/1/2021 | | 60,000 | b | 61,200 | |
| | 378,512 | |
Financials - .0% | | | | | |
AerCap Global Aviation Trust,
Gtd. Notes | | 6.50 | | 6/15/2045 | | 75,000 | b | 77,250 | |
Fortress Transportation & Infrastructure Investors,
Sr. Unscd. Notes | | 6.75 | | 3/15/2022 | | 60,000 | b | 61,575 | |
Icahn Enterprises,
Gtd. Notes | | 5.88 | | 2/1/2022 | | 125,000 | | 125,469 | |
Icahn Enterprises,
Gtd. Notes | | 6.00 | | 8/1/2020 | | 125,000 | | 126,250 | |
Park Aerospace Holdings,
Gtd. Notes | | 5.25 | | 8/15/2022 | | 140,000 | b | 139,475 | |
Park Aerospace Holdings,
Gtd. Notes | | 5.50 | | 2/15/2024 | | 75,000 | b | 74,456 | |
| | 604,475 | |
Food Products - .1% | | | | | |
B&G Foods,
Gtd. Notes | | 4.63 | | 6/1/2021 | | 75,000 | | 74,812 | |
Darling Ingredients,
Gtd. Notes | | 5.38 | | 1/15/2022 | | 70,000 | | 70,263 | |
Dean Foods,
Gtd. Notes | | 6.50 | | 3/15/2023 | | 75,000 | b | 69,281 | |
Dole Food,
Sr. Scd. Notes | | 7.25 | | 6/15/2025 | | 50,000 | b | 48,250 | |
Fresh Market,
Sr. Scd. Notes | | 9.75 | | 5/1/2023 | | 25,000 | b | 18,375 | |
JBS USA Finance,
Gtd. Notes | | 5.75 | | 6/15/2025 | | 100,000 | b | 97,125 | |
JBS USA Finance,
Gtd. Notes | | 5.88 | | 7/15/2024 | | 75,000 | b | 73,894 | |
JBS USA LUX,
Gtd. Notes | | 6.75 | | 2/15/2028 | | 50,000 | b | 48,813 | |
New Albertsons,
Gtd. Notes | | 5.75 | | 3/15/2025 | | 75,000 | | 66,375 | |
New Albertsons,
Gtd. Notes | | 6.63 | | 6/15/2024 | | 75,000 | | 71,250 | |
New Albertsons,
Sr. Unscd. Bonds | | 8.00 | | 5/1/2031 | | 50,000 | | 43,000 | |
New Albertsons,
Sr. Unscd. Notes | | 8.70 | | 5/1/2030 | | 40,000 | | 36,100 | |
Pilgrim's Pride,
Gtd. Notes | | 5.75 | | 3/15/2025 | | 75,000 | b | 70,313 | |
25
CONSOLIDATED STATEMENT OF INVESTMENTS (continued)
| | | | | | | | | | |
| |
Description | Coupon
Rate (%) | | Maturity
Date | | Principal
Amount ($) | | Value ($) | |
Bonds and Notes - 5.0% (continued) | | | | | |
Food Products - .1% (continued) | | | | | |
Post Holdings,
Gtd. Notes | | 5.00 | | 8/15/2026 | | 250,000 | b | 231,562 | |
Post Holdings,
Gtd. Notes | | 5.50 | | 3/1/2025 | | 75,000 | b | 72,797 | |
Post Holdings,
Gtd. Notes | | 5.63 | | 1/15/2028 | | 50,000 | b | 47,140 | |
Safeway,
Sr. Unscd. Notes | | 7.25 | | 2/1/2031 | | 50,000 | | 49,625 | |
Tesco,
Sr. Unscd. Notes | | 6.15 | | 11/15/2037 | | 100,000 | b | 106,109 | |
TreeHouse Foods,
Gtd. Notes | | 6.00 | | 2/15/2024 | | 75,000 | b | 75,187 | |
US Foods,
Gtd. Notes | | 5.88 | | 6/15/2024 | | 75,000 | b | 74,625 | |
| | 1,444,896 | |
Food Service - .0% | | | | | |
Aramark Services,
Gtd. Notes | | 4.75 | | 6/1/2026 | | 75,000 | | 71,625 | |
Aramark Services,
Sr. Unscd. Notes | | 5.00 | | 2/1/2028 | | 150,000 | b | 142,687 | |
| | 214,312 | |
Forest Products & Other - .0% | | | | | |
Cascades,
Gtd. Notes | | 5.50 | | 7/15/2022 | | 19,000 | b | 18,953 | |
Mercer International,
Sr. Unscd. Notes | | 6.50 | | 2/1/2024 | | 50,000 | | 50,625 | |
Resolute Forest Products,
Gtd. Notes | | 5.88 | | 5/15/2023 | | 75,000 | | 76,644 | |
| | 146,222 | |
Health Care - .6% | | | | | |
Acadia Healthcare,
Gtd. Notes | | 5.13 | | 7/1/2022 | | 100,000 | | 100,188 | |
Acadia Healthcare,
Gtd. Notes | | 5.63 | | 2/15/2023 | | 75,000 | | 75,469 | |
Acadia Healthcare,
Gtd. Notes | | 6.13 | | 3/15/2021 | | 95,000 | | 95,831 | |
Avantor,
Sr. Scd. Notes | | 6.00 | | 10/1/2024 | | 100,000 | b | 100,000 | |
Avantor,
Sr. Unscd. Notes | | 9.00 | | 10/1/2025 | | 100,000 | b | 101,250 | |
Bausch Health,
Sr. Scd. Notes | | 7.00 | | 3/15/2024 | | 200,000 | b | 209,938 | |
Bausch Health Cos.,
Gtd. Notes | | 5.88 | | 5/15/2023 | | 300,000 | b | 288,000 | |
Bausch Health ,
Gtd. Notes | | 5.63 | | 12/1/2021 | | 150,000 | b | 148,312 | |
26
| | | | | | | | | | |
| |
Description | Coupon
Rate (%) | | Maturity
Date | | Principal
Amount ($) | | Value ($) | |
Bonds and Notes - 5.0% (continued) | | | | | |
Health Care - .6% (continued) | | | | | |
Bausch Health ,
Gtd. Notes | | 6.13 | | 4/15/2025 | | 300,000 | b | 276,660 | |
Bausch Health ,
Gtd. Notes | | 7.50 | | 7/15/2021 | | 48,000 | b | 48,840 | |
Centene,
Sr. Unscd. Notes | | 4.75 | | 1/15/2025 | | 75,000 | | 74,266 | |
Centene,
Sr. Unscd. Notes | | 4.75 | | 5/15/2022 | | 125,000 | | 125,781 | |
Centene,
Sr. Unscd. Notes | | 5.63 | | 2/15/2021 | | 75,000 | | 76,219 | |
Centene Corp,
Sr. Unscd. Notes | | 5.38 | | 6/1/2026 | | 150,000 | b | 152,625 | |
Community Health Systems,
Gtd. Notes | | 6.88 | | 2/1/2022 | | 44,000 | | 22,462 | |
Community Health Systems,
Scd. Notes | | 8.13 | | 6/30/2024 | | 4,000 | b | 3,180 | |
Community Health Systems,
Scd. Notes | | 11.00 | | 6/30/2023 | | 190,000 | b | 159,125 | |
Community Health Systems,
Sr. Scd. Notes | | 5.13 | | 8/1/2021 | | 50,000 | | 47,625 | |
Community Health Systems,
Sr. Scd. Notes | | 6.25 | | 3/31/2023 | | 210,000 | | 193,924 | |
Davita Healthcare Partners,
Gtd. Notes | | 5.00 | | 5/1/2025 | | 75,000 | | 70,875 | |
DaVita HealthCare Partners,
Gtd. Notes | | 5.13 | | 7/15/2024 | | 300,000 | | 287,250 | |
DJO Finance,
Scd. Notes | | 8.13 | | 6/15/2021 | | 75,000 | b | 75,937 | |
Encompass Health,
Gtd. Notes | | 5.75 | | 11/1/2024 | | 75,000 | | 75,094 | |
Encompass Health,
Gtd. Notes | | 5.75 | | 9/15/2025 | | 100,000 | | 99,500 | |
Endo Finance,
Gtd. Notes | | 5.38 | | 1/15/2023 | | 75,000 | b | 64,313 | |
Endo Finance,
Gtd. Notes | | 5.75 | | 1/15/2022 | | 50,000 | b | 45,500 | |
Endo Finance,
Gtd. Notes | | 6.00 | | 2/1/2025 | | 75,000 | b | 63,188 | |
Endo Finance,
Gtd. Notes | | 6.00 | | 7/15/2023 | | 150,000 | b | 130,080 | |
HCA,
Gtd. Notes | | 5.38 | | 2/1/2025 | | 230,000 | | 232,012 | |
HCA,
Gtd. Notes | | 5.88 | | 5/1/2023 | | 150,000 | | 155,625 | |
HCA,
Gtd. Notes | | 7.50 | | 2/15/2022 | | 300,000 | | 326,250 | |
27
CONSOLIDATED STATEMENT OF INVESTMENTS (continued)
| | | | | | | | | | |
| |
Description | Coupon
Rate (%) | | Maturity
Date | | Principal
Amount ($) | | Value ($) | |
Bonds and Notes - 5.0% (continued) | | | | | |
Health Care - .6% (continued) | | | | | |
HCA,
Sr. Scd. Bonds | | 4.50 | | 2/15/2027 | | 160,000 | | 156,000 | |
HCA,
Sr. Scd. Notes | | 5.00 | | 3/15/2024 | | 300,000 | | 304,312 | |
HCA,
Sr. Scd. Notes | | 5.50 | | 6/15/2047 | | 100,000 | | 98,650 | |
HCA,
Sr. Scd. Notes | | 6.50 | | 2/15/2020 | | 50,000 | | 51,750 | |
Immucor,
Gtd. Notes | | 11.13 | | 2/15/2022 | | 60,000 | b | 61,875 | |
inVentiv Group Holdings,
Gtd. Notes | | 7.50 | | 10/1/2024 | | 55,000 | b | 58,163 | |
Kinetic Concepts,
Scd. Notes | | 12.50 | | 11/1/2021 | | 125,000 | b | 135,625 | |
Kinetic Concepts,
Sr. Scd. Notes | | 7.88 | | 2/15/2021 | | 75,000 | b | 76,781 | |
LifePoint Health,
Gtd. Notes | | 5.38 | | 5/1/2024 | | 75,000 | | 78,847 | |
LifePoint Health,
Gtd. Notes | | 5.50 | | 12/1/2021 | | 60,000 | | 60,825 | |
LifePoint Health,
Gtd. Notes | | 5.88 | | 12/1/2023 | | 75,000 | | 78,609 | |
Mallinckrodt International Finance,
Gtd. Notes | | 4.88 | | 4/15/2020 | | 75,000 | b | 74,250 | |
Mallinckrodt International Finance,
Gtd. Notes | | 5.63 | | 10/15/2023 | | 75,000 | b | 64,688 | |
Mallinckrodt International Finance,
Gtd. Notes | | 5.75 | | 8/1/2022 | | 75,000 | b | 67,313 | |
MEDNAX,
Gtd. Notes | | 5.25 | | 12/1/2023 | | 75,000 | b | 75,187 | |
Molina Healthcare,
Gtd. Notes | | 5.38 | | 11/15/2022 | | 75,000 | | 75,375 | |
MPH Acquisition Holdings,
Gtd. Notes | | 7.13 | | 6/1/2024 | | 75,000 | b | 76,374 | |
One Call,
Sr. Scd. Notes | | 7.50 | | 7/1/2024 | | 100,000 | b | 97,000 | |
Ortho-Clinical Diagnostics,
Sr. Unscd. Notes | | 6.63 | | 5/15/2022 | | 125,000 | b | 120,000 | |
RegionalCare Hospital Partners Holdings,
Sr. Scd. Notes | | 8.25 | | 5/1/2023 | | 75,000 | b | 79,594 | |
Select Medical,
Gtd. Notes | | 6.38 | | 6/1/2021 | | 75,000 | | 75,937 | |
Sotera Health Topco,
Sr. Unscd. Notes | | 8.13 | | 11/1/2021 | | 60,000 | b | 59,100 | |
Surgery Center Holdings,
Gtd. Notes | | 8.88 | | 4/15/2021 | | 60,000 | b | 61,950 | |
28
| | | | | | | | | | |
| |
Description | Coupon
Rate (%) | | Maturity
Date | | Principal
Amount ($) | | Value ($) | |
Bonds and Notes - 5.0% (continued) | | | | | |
Health Care - .6% (continued) | | | | | |
Tenet Healthcare,
Scd. Notes | | 7.50 | | 1/1/2022 | | 110,000 | b | 115,019 | |
Tenet Healthcare,
Sr. Scd. Notes | | 4.63 | | 7/15/2024 | | 100,000 | | 96,635 | |
Tenet Healthcare,
Sr. Scd. Notes | | 6.00 | | 10/1/2020 | | 200,000 | | 205,310 | |
Tenet Healthcare,
Sr. Unscd. Notes | | 6.75 | | 2/1/2020 | | 50,000 | | 51,563 | |
Tenet Healthcare,
Sr. Unscd. Notes | | 6.75 | | 6/15/2023 | | 200,000 | | 200,190 | |
Tenet Healthcare,
Sr. Unscd. Notes | | 8.13 | | 4/1/2022 | | 50,000 | | 52,250 | |
Universal Hospital Services,
Scd. Notes | | 7.63 | | 8/15/2020 | | 75,000 | | 75,187 | |
Vizient,
Sr. Unscd. Notes | | 10.38 | | 3/1/2026 | | 75,000 | b | 82,125 | |
WellCare Health Plans,
Sr. Unscd. Notes | | 5.25 | | 4/1/2025 | | 150,000 | | 150,000 | |
West Street Merger Sub,
Sr. Unscd. Notes | | 6.38 | | 9/1/2025 | | 100,000 | b | 94,250 | |
| | 7,136,053 | |
Industrials - .1% | | | | | |
AECOM,
Gtd. Notes | | 5.13 | | 3/15/2027 | | 75,000 | | 70,125 | |
AECOM,
Gtd. Notes | | 5.88 | | 10/15/2024 | | 75,000 | | 76,687 | |
Blueline Rental,
Scd. Notes | | 9.25 | | 3/15/2024 | | 75,000 | b | 78,375 | |
Brand Industrial Services,
Sr. Unscd. Notes | | 8.50 | | 7/15/2025 | | 100,000 | b | 98,875 | |
CDW,
Gtd. Notes | | 5.00 | | 9/1/2025 | | 75,000 | | 73,406 | |
CDW,
Gtd. Notes | | 5.50 | | 12/1/2024 | | 75,000 | | 76,125 | |
Gates Global,
Gtd. Notes | | 6.00 | | 7/15/2022 | | 35,000 | b | 34,913 | |
Koppers,
Gtd. Notes | | 6.00 | | 2/15/2025 | | 75,000 | b | 72,210 | |
Mobile Mini,
Gtd. Notes | | 5.88 | | 7/1/2024 | | 50,000 | | 50,375 | |
New Enterprise Stone & Lime,
Sr. Unscd. Notes | | 10.13 | | 4/1/2022 | | 100,000 | b | 105,000 | |
Spectrum Brands Holdings,
Sr. Unscd. Notes | | 7.75 | | 1/15/2022 | | 125,000 | | 128,281 | |
Stena,
Sr. Unscd. Notes | | 7.00 | | 2/1/2024 | | 75,000 | b | 71,175 | |
29
CONSOLIDATED STATEMENT OF INVESTMENTS (continued)
| | | | | | | | | | |
| |
Description | Coupon
Rate (%) | | Maturity
Date | | Principal
Amount ($) | | Value ($) | |
Bonds and Notes - 5.0% (continued) | | | | | |
Industrials - .1% (continued) | | | | | |
Terex,
Gtd. Notes | | 5.63 | | 2/1/2025 | | 35,000 | b | 33,338 | |
Vertiv Group,
Sr. Unscd. Notes | | 9.25 | | 10/15/2024 | | 75,000 | b | 75,000 | |
Weekley Homes ,
Sr. Unscd. Notes | | 6.63 | | 8/15/2025 | | 75,000 | | 71,250 | |
| | 1,115,135 | |
Information Technology - .2% | | | | | |
Camelot Finance,
Sr. Unscd. Notes | | 7.88 | | 10/15/2024 | | 75,000 | b | 74,437 | |
CDK Global,
Sr. Unscd. Notes | | 5.00 | | 10/15/2024 | | 50,000 | | 49,485 | |
Change Healthcare Holdings,
Sr. Unscd. Notes | | 5.75 | | 3/1/2025 | | 75,000 | b | 73,594 | |
First Data,
Scd. Notes | | 5.75 | | 1/15/2024 | | 300,000 | b | 303,000 | |
First Data,
Sr. Scd. Notes | | 5.38 | | 8/15/2023 | | 200,000 | b | 202,250 | |
Genesys,
Gtd. Notes | | 10.00 | | 11/30/2024 | | 75,000 | b | 81,562 | |
Infor Software Parent,
Sr. Unscd. Notes | | 7.13 | | 5/1/2021 | | 125,000 | b | 126,250 | |
Infor US,
Gtd. Notes | | 6.50 | | 5/15/2022 | | 50,000 | | 50,125 | |
IQVIA,
Gtd. Notes | | 4.88 | | 5/15/2023 | | 45,000 | b | 44,719 | |
IQVIA,
Gtd. Notes | | 5.00 | | 10/15/2026 | | 300,000 | b | 289,779 | |
Italics Merger Sub,
Sr. Unscd. Notes | | 7.13 | | 7/15/2023 | | 75,000 | b | 76,898 | |
MSCI,
Gtd. Notes | | 4.75 | | 8/1/2026 | | 75,000 | b | 72,563 | |
MSCI,
Gtd. Notes | | 5.25 | | 11/15/2024 | | 75,000 | b | 75,937 | |
MSCI,
Gtd. Notes | | 5.75 | | 8/15/2025 | | 75,000 | b | 77,437 | |
Nuance Communications,
Gtd. Bonds | | 5.63 | | 12/15/2026 | | 75,000 | | 73,688 | |
Nuance Communications,
Gtd. Notes | | 6.00 | | 7/1/2024 | | 50,000 | | 50,813 | |
Open Text,
Gtd. Notes | | 5.63 | | 1/15/2023 | | 75,000 | b | 75,949 | |
Open Text,
Gtd. Notes | | 5.88 | | 6/1/2026 | | 75,000 | b | 75,562 | |
Rackspace Hosting,
Gtd. Notes | | 8.63 | | 11/15/2024 | | 75,000 | b | 70,688 | |
30
| | | | | | | | | | |
| |
Description | Coupon
Rate (%) | | Maturity
Date | | Principal
Amount ($) | | Value ($) | |
Bonds and Notes - 5.0% (continued) | | | | | |
Information Technology - .2% (continued) | | | | | |
Riverbed Technology,
Gtd. Notes | | 8.88 | | 3/1/2023 | | 75,000 | b | 69,094 | |
Solera Finance,
Sr. Unscd. Notes | | 10.50 | | 3/1/2024 | | 75,000 | b | 81,752 | |
TIBCO Software,
Sr. Unscd. Notes | | 11.38 | | 12/1/2021 | | 125,000 | b | 132,656 | |
Veritas US,
Sr. Unscd. Notes | | 10.50 | | 2/1/2024 | | 75,000 | b | 64,875 | |
| | 2,293,113 | |
Insurance - .0% | | | | | |
Genworth Holdings,
Gtd. Notes | | 7.63 | | 9/24/2021 | | 50,000 | | 51,125 | |
Liberty Mutual Group,
Gtd. Bonds | | 7.80 | | 3/15/2037 | | 50,000 | b | 57,375 | |
Radian Group,
Sr. Unscd. Notes | | 7.00 | | 3/15/2021 | | 100,000 | | 106,000 | |
Voya Financial,
Gtd. Notes | | 4.70 | | 1/23/2048 | | 75,000 | b | 64,688 | |
| | 279,188 | |
Internet Software & Services - .1% | | | | | |
Netflix,
Sr. Unscd. Bonds | | 4.38 | | 11/15/2026 | | 75,000 | | 69,047 | |
Netflix,
Sr. Unscd. Notes | | 4.88 | | 4/15/2028 | | 100,000 | b | 91,875 | |
Netflix,
Sr. Unscd. Notes | | 5.50 | | 2/15/2022 | | 50,000 | | 51,245 | |
Netflix,
Sr. Unscd. Notes | | 5.75 | | 3/1/2024 | | 25,000 | | 25,500 | |
Netflix,
Sr. Unscd. Notes | | 5.88 | | 11/15/2028 | | 200,000 | b | 197,500 | |
Netflix,
Sr. Unscd. Notes | | 5.88 | | 2/15/2025 | | 75,000 | | 76,406 | |
Symantec,
Sr. Unscd. Notes | | 5.00 | | 4/15/2025 | | 75,000 | b | 70,747 | |
VeriSign,
Sr. Unscd. Notes | | 4.75 | | 7/15/2027 | | 30,000 | | 28,359 | |
VeriSign,
Sr. Unscd. Notes | | 5.25 | | 4/1/2025 | | 22,000 | | 22,028 | |
Zayo Group,
Gtd. Notes | | 5.75 | | 1/15/2027 | | 75,000 | b | 73,703 | |
Zayo Group,
Gtd. Notes | | 6.00 | | 4/1/2023 | | 75,000 | | 76,875 | |
Zayo Group,
Gtd. Notes | | 6.38 | | 5/15/2025 | | 75,000 | | 76,969 | |
| | 860,254 | |
31
CONSOLIDATED STATEMENT OF INVESTMENTS (continued)
| | | | | | | | | | |
| |
Description | Coupon
Rate (%) | | Maturity
Date | | Principal
Amount ($) | | Value ($) | |
Bonds and Notes - 5.0% (continued) | | | | | |
Materials - .2% | | | | | |
ARD Finance,
Sr. Scd. Notes | | 7.13 | | 9/15/2023 | | 75,000 | | 73,125 | |
Ardagh Packaging Finance,
Gtd. Notes | | 7.25 | | 5/15/2024 | | 75,000 | b | 75,656 | |
Ardagh Packaging Finance,
Sr. Scd. Notes | | 4.63 | | 5/15/2023 | | 75,000 | b | 73,125 | |
Ball,
Gtd. Bonds | | 4.00 | | 11/15/2023 | | 75,000 | | 72,938 | |
Ball,
Gtd. Bonds | | 5.00 | | 3/15/2022 | | 100,000 | | 101,750 | |
Ball,
Gtd. Notes | | 4.38 | | 12/15/2020 | | 50,000 | | 50,125 | |
Ball,
Gtd. Notes | | 5.25 | | 7/1/2025 | | 75,000 | | 75,656 | |
Berry Global,
Scd. Notes | | 5.50 | | 5/15/2022 | | 75,000 | | 75,094 | |
Berry Plastics,
Scd. Notes | | 5.13 | | 7/15/2023 | | 75,000 | | 74,906 | |
Bway Holding,
Sr. Scd. Notes | | 5.50 | | 4/15/2024 | | 100,000 | b | 96,250 | |
Bway Holding,
Sr. Unscd. Notes | | 7.25 | | 4/15/2025 | | 115,000 | b | 109,250 | |
CROWN Americas,
Gtd. Notes | | 4.75 | | 2/1/2026 | | 100,000 | b | 94,625 | |
Crown Americas ,
Gtd. Notes | | 4.25 | | 9/30/2026 | | 50,000 | | 45,500 | |
Crown Americas Capital Corp IV,
Gtd. Notes | | 4.50 | | 1/15/2023 | | 75,000 | | 73,688 | |
Flex Acquisition,
Sr. Unscd. Notes | | 6.88 | | 1/15/2025 | | 75,000 | b | 70,500 | |
Foresight Energy,
Scd. Notes | | 11.50 | | 4/1/2023 | | 50,000 | b | 44,625 | |
Grinding Med,
Sr. Scd. Notes | | 7.38 | | 12/15/2023 | | 75,000 | b | 77,250 | |
Hillman Group,
Sr. Unscd. Notes | | 6.38 | | 7/15/2022 | | 100,000 | b | 88,500 | |
Novelis,
Gtd. Notes | | 5.88 | | 9/30/2026 | | 75,000 | b | 70,875 | |
Novelis,
Gtd. Notes | | 6.25 | | 8/15/2024 | | 75,000 | b | 74,437 | |
Owens-Brockway Glass Container,
Gtd. Notes | | 5.00 | | 1/15/2022 | | 65,000 | b | 64,431 | |
Pactiv,
Sr. Unscd. Notes | | 8.38 | | 4/15/2027 | | 50,000 | | 52,250 | |
Peabody Securities Finance,
Sr. Scd. Notes | | 6.38 | | 3/31/2025 | | 75,000 | b | 75,281 | |
32
| | | | | | | | | | |
| |
Description | Coupon
Rate (%) | | Maturity
Date | | Principal
Amount ($) | | Value ($) | |
Bonds and Notes - 5.0% (continued) | | | | | |
Materials - .2% (continued) | | | | | |
Reynolds Group,
Gtd. Notes | | 7.00 | | 7/15/2024 | | 75,000 | b | 75,328 | |
Reynolds Group Issuer,
Sr. Scd. Notes | | 5.13 | | 7/15/2023 | | 175,000 | b | 171,500 | |
Sealed Air,
Gtd. Notes | | 5.13 | | 12/1/2024 | | 120,000 | b | 117,600 | |
Sealed Air,
Gtd. Notes | | 5.25 | | 4/1/2023 | | 60,000 | b | 59,700 | |
Sealed Air,
Gtd. Notes | | 5.50 | | 9/15/2025 | | 45,000 | b | 44,325 | |
Sealed Air,
Gtd. Notes | | 6.50 | | 12/1/2020 | | 50,000 | b | 51,875 | |
SunCoke Energy Partners,
Gtd. Notes | | 7.50 | | 6/15/2025 | | 100,000 | b | 102,000 | |
| | 2,332,165 | |
Media - .4% | | | | | |
Altice,
Gtd. Notes | | 7.63 | | 2/15/2025 | | 75,000 | b | 64,219 | |
Altice,
Gtd. Notes | | 7.75 | | 5/15/2022 | | 200,000 | b | 185,750 | |
Altice Financing,
Sr. Scd. Bonds | | 7.50 | | 5/15/2026 | | 150,000 | b | 141,375 | |
Altice Financing,
Sr. Scd. Notes | | 6.63 | | 2/15/2023 | | 150,000 | b | 148,845 | |
Altice France,
Sr. Scd. Bonds | | 6.25 | | 5/15/2024 | | 75,000 | b | 72,281 | |
Altice France,
Sr. Scd. Notes | | 7.38 | | 5/1/2026 | | 300,000 | b | 289,125 | |
AMC Networks,
Gtd. Notes | | 4.75 | | 8/1/2025 | | 50,000 | | 46,605 | |
AMC Networks,
Gtd. Notes | | 4.75 | | 12/15/2022 | | 75,000 | | 74,063 | |
AMC Networks,
Gtd. Notes | | 5.00 | | 4/1/2024 | | 75,000 | | 71,921 | |
Cablevision Systems,
Sr. Unscd. Notes | | 5.88 | | 9/15/2022 | | 130,000 | | 130,975 | |
Cablevision Systems,
Sr. Unscd. Notes | | 8.00 | | 4/15/2020 | | 50,000 | | 52,308 | |
CCO Holdings,
Sr. Unscd. Notes | | 5.00 | | 2/1/2028 | | 200,000 | b | 187,250 | |
CCO Holdings,
Sr. Unscd. Notes | | 5.13 | | 5/1/2027 | | 200,000 | b | 188,750 | |
CCO Holdings,
Sr. Unscd. Notes | | 5.13 | | 2/15/2023 | | 200,000 | | 199,500 | |
CCO Holdings,
Sr. Unscd. Notes | | 5.50 | | 5/1/2026 | | 75,000 | b | 73,219 | |
33
CONSOLIDATED STATEMENT OF INVESTMENTS (continued)
| | | | | | | | | | |
| |
Description | Coupon
Rate (%) | | Maturity
Date | | Principal
Amount ($) | | Value ($) | |
Bonds and Notes - 5.0% (continued) | | | | | |
Media - .4% (continued) | | | | | |
CCO Holdings,
Sr. Unscd. Notes | | 5.75 | | 2/15/2026 | | 200,000 | b | 198,500 | |
CCO Holdings,
Sr. Unscd. Notes | | 5.75 | | 9/1/2023 | | 120,000 | | 121,200 | |
CCO Holdings,
Sr. Unscd. Notes | | 5.88 | | 4/1/2024 | | 75,000 | b | 75,844 | |
Cengage Learning,
Sr. Unscd. Notes | | 9.50 | | 6/15/2024 | | 50,000 | b | 43,188 | |
Clear Channel Worldwide Holdings,
Gtd. Notes, Ser. B | | 6.50 | | 11/15/2022 | | 145,000 | | 147,929 | |
CSC Holdings,
Gtd. Notes | | 5.50 | | 4/15/2027 | | 75,000 | b | 72,188 | |
CSC Holdings,
Sr. Unscd. Notes | | 6.75 | | 11/15/2021 | | 50,000 | | 52,483 | |
CSC Holdings,
Sr. Unscd. Notes | | 10.13 | | 1/15/2023 | | 200,000 | b | 217,594 | |
DISH DBS,
Gtd. Notes | | 5.88 | | 7/15/2022 | | 200,000 | | 189,750 | |
DISH DBS,
Gtd. Notes | | 5.88 | | 11/15/2024 | | 50,000 | | 42,688 | |
DISH DBS,
Gtd. Notes | | 6.75 | | 6/1/2021 | | 150,000 | | 151,875 | |
DISH DBS,
Gtd. Notes | | 7.75 | | 7/1/2026 | | 200,000 | | 179,750 | |
EW Scripps,
Sr. Unscd. Notes | | 5.13 | | 5/15/2025 | | 50,000 | b | 47,125 | |
Gray Television,
Gtd. Notes | | 5.13 | | 10/15/2024 | | 75,000 | b | 71,531 | |
Gray Television,
Gtd. Notes | | 5.88 | | 7/15/2026 | | 75,000 | b | 72,164 | |
Lee Enterprises,
Sr. Scd. Notes | | 9.50 | | 3/15/2022 | | 50,000 | b | 51,813 | |
Nexstar Escrow,
Gtd. Notes | | 5.63 | | 8/1/2024 | | 75,000 | b | 71,813 | |
Quebecor Media,
Sr. Unscd. Notes | | 5.75 | | 1/15/2023 | | 100,000 | | 100,750 | |
Radiate Holdco,
Sr. Unscd. Notes | | 6.88 | | 2/15/2023 | | 100,000 | b | 96,500 | |
Sinclair Television Group,
Gtd. Notes | | 5.38 | | 4/1/2021 | | 75,000 | | 75,094 | |
Sinclair Television Group,
Gtd. Notes | | 6.13 | | 10/1/2022 | | 75,000 | | 75,937 | |
Sirius XM Radio,
Gtd. Notes | | 3.88 | | 8/1/2022 | | 200,000 | b | 193,500 | |
Sirius XM Radio,
Gtd. Notes | | 5.38 | | 4/15/2025 | | 75,000 | b | 74,484 | |
34
| | | | | | | | | | |
| |
Description | Coupon
Rate (%) | | Maturity
Date | | Principal
Amount ($) | | Value ($) | |
Bonds and Notes - 5.0% (continued) | | | | | |
Media - .4% (continued) | | | | | |
Sirius XM Radio,
Gtd. Notes | | 5.38 | | 7/15/2026 | | 75,000 | b | 73,538 | |
Sirius XM Radio,
Gtd. Notes | | 6.00 | | 7/15/2024 | | 75,000 | b | 76,860 | |
TEGNA,
Gtd. Notes | | 4.88 | | 9/15/2021 | | 125,000 | b | 124,687 | |
TEGNA,
Gtd. Notes | | 6.38 | | 10/15/2023 | | 175,000 | | 179,594 | |
Tribune Media,
Gtd. Notes | | 5.88 | | 7/15/2022 | | 75,000 | | 76,312 | |
Unitymedia Hessen GmbH & Co.,
Sr. Scd. Bonds | | 5.00 | | 1/15/2025 | | 75,000 | b | 76,099 | |
Univision Communications,
Sr. Scd. Notes | | 5.13 | | 2/15/2025 | | 75,000 | b | 68,738 | |
Univision Communications,
Sr. Scd. Notes | | 5.13 | | 5/15/2023 | | 75,000 | b | 70,838 | |
Univision Communications,
Sr. Scd. Notes | | 6.75 | | 9/15/2022 | | 25,000 | b | 25,563 | |
Viacom,
Jr. Sub. Notes | | 5.88 | | 2/28/2057 | | 50,000 | | 47,911 | |
Viacom,
Jr. Sub. Notes | | 6.25 | | 2/28/2057 | | 50,000 | | 48,375 | |
Virgin Media Secured Finance,
Sr. Scd. Bonds | | 5.25 | | 1/15/2026 | | 75,000 | b | 70,219 | |
Ziggo,
Sr. Scd. Notes | | 5.50 | | 1/15/2027 | | 300,000 | b | 276,000 | |
Ziggo Bond Finance,
Sr. Unscd. Notes | | 6.00 | | 1/15/2027 | | 75,000 | b | 66,938 | |
| | 5,631,558 | |
Metals & Mining - .2% | | | | | |
AK Steel,
Gtd. Notes | | 7.63 | | 10/1/2021 | | 100,000 | | 100,375 | |
Alcoa Nederland Holding,
Gtd. Notes | | 6.75 | | 9/30/2024 | | 75,000 | b | 79,125 | |
Alcoa Nederland Holding,
Gtd. Notes | | 7.00 | | 9/30/2026 | | 75,000 | b | 79,500 | |
Allegheny Technologies,
Sr. Unscd. Notes | | 7.88 | | 8/15/2023 | | 75,000 | | 79,406 | |
Barminco Finance,
Sr. Scd. Notes | | 6.63 | | 5/15/2022 | | 100,000 | b | 99,000 | |
Carpenter Technology,
Sr. Unscd. Notes | | 5.20 | | 7/15/2021 | | 100,000 | | 101,646 | |
Century Aluminum,
Scd. Notes | | 7.50 | | 6/1/2021 | | 50,000 | b | 50,250 | |
Cleveland-Cliffs,
Gtd. Notes | | 5.75 | | 3/1/2025 | | 75,000 | | 71,156 | |
35
CONSOLIDATED STATEMENT OF INVESTMENTS (continued)
| | | | | | | | | | |
| |
Description | Coupon
Rate (%) | | Maturity
Date | | Principal
Amount ($) | | Value ($) | |
Bonds and Notes - 5.0% (continued) | | | | | |
Metals & Mining - .2% (continued) | | | | | |
Coeur Mining,
Gtd. Notes | | 5.88 | | 6/1/2024 | | 75,000 | | 71,531 | |
Constellium,
Sr. Unscd. Notes | | 6.63 | | 3/1/2025 | | 75,000 | b | 73,688 | |
FMG Resources,
Gtd. Notes | | 4.75 | | 5/15/2022 | | 50,000 | b | 48,188 | |
Freeport-McMoran,
Gtd. Notes | | 4.00 | | 11/14/2021 | | 50,000 | | 48,875 | |
Freeport-McMoRan,
Gtd. Notes | | 3.55 | | 3/1/2022 | | 75,000 | | 71,156 | |
Freeport-McMoRan,
Gtd. Notes | | 3.88 | | 3/15/2023 | | 100,000 | | 92,750 | |
Freeport-McMoRan,
Gtd. Notes | | 4.55 | | 11/14/2024 | | 50,000 | | 46,438 | |
Freeport-McMoRan,
Gtd. Notes | | 5.40 | | 11/14/2034 | | 75,000 | | 66,000 | |
Freeport-McMoRan,
Gtd. Notes | | 5.45 | | 3/15/2043 | | 100,000 | | 85,250 | |
Hudbay Minerals,
Gtd. Notes | | 7.25 | | 1/15/2023 | | 25,000 | b | 25,000 | |
Hudbay Minerals,
Gtd. Notes | | 7.63 | | 1/15/2025 | | 75,000 | b | 75,562 | |
IAMGOLD,
Gtd. Notes | | 7.00 | | 4/15/2025 | | 50,000 | b | 49,813 | |
Mountain Province Diamonds,
Scd. Notes | | 8.00 | | 12/15/2022 | | 100,000 | b | 101,875 | |
Steel Dynamics,
Gtd. Notes | | 5.00 | | 12/15/2026 | | 75,000 | | 73,500 | |
Steel Dynamics,
Gtd. Notes | | 5.13 | | 10/1/2021 | | 125,000 | | 126,094 | |
Taseko Mines,
Sr. Scd. Notes | | 8.75 | | 6/15/2022 | | 50,000 | b | 49,375 | |
Teck Resources,
Gtd. Bonds | | 6.00 | | 8/15/2040 | | 50,000 | | 49,125 | |
Teck Resources,
Gtd. Notes | | 5.40 | | 2/1/2043 | | 100,000 | | 91,500 | |
Teck Resources,
Gtd. Notes | | 8.50 | | 6/1/2024 | | 75,000 | b | 81,562 | |
United States Steel,
Sr. Unscd. Notes | | 6.88 | | 8/15/2025 | | 100,000 | | 98,500 | |
| | 2,086,240 | |
Radio & Television - .0% | | | | | |
Clear Channel Worldwide Holdings,
Gtd. Notes, Ser. B | | 7.63 | | 3/15/2020 | | 40,000 | | 40,100 | |
36
| | | | | | | | | | |
| |
Description | Coupon
Rate (%) | | Maturity
Date | | Principal
Amount ($) | | Value ($) | |
Bonds and Notes - 5.0% (continued) | | | | | |
Real Estate - .2% | | | | | |
CoreCivic,
Gtd. Notes | | 5.00 | | 10/15/2022 | | 125,000 | | 121,250 | |
Equinix,
Sr. Unscd. Notes | | 5.38 | | 4/1/2023 | | 49,000 | | 50,071 | |
Equinix,
Sr. Unscd. Notes | | 5.88 | | 1/15/2026 | | 200,000 | | 203,500 | |
ESH Hospitality,
Gtd. Notes | | 5.25 | | 5/1/2025 | | 75,000 | b | 71,156 | |
FelCor Lodging,
Gtd. Notes | | 6.00 | | 6/1/2025 | | 50,000 | | 51,938 | |
GEO Group,
Gtd. Notes | | 5.13 | | 4/1/2023 | | 50,000 | | 47,125 | |
GEO Group,
Gtd. Notes | | 6.00 | | 4/15/2026 | | 100,000 | | 91,875 | |
Iron Mountain,
Gtd. Notes | | 4.38 | | 6/1/2021 | | 30,000 | b | 29,925 | |
Iron Mountain,
Gtd. Notes | | 5.25 | | 3/15/2028 | | 100,000 | b | 90,250 | |
Iron Mountain,
Gtd. Notes | | 5.75 | | 8/15/2024 | | 125,000 | | 122,969 | |
Iron Mountain,
Gtd. Notes | | 6.00 | | 8/15/2023 | | 75,000 | | 76,969 | |
iStar,
Sr. Unscd. Bonds | | 6.00 | | 4/1/2022 | | 100,000 | | 100,000 | |
iStar,
Sr. Unscd. Notes | | 5.00 | | 7/1/2019 | | 98,000 | | 98,122 | |
Mack-Cali Realty,
Sr. Unscd. Notes | | 3.15 | | 5/15/2023 | | 30,000 | | 26,499 | |
MGM Growth Properties Operating Partnership,
Gtd. Notes | | 4.50 | | 9/1/2026 | | 100,000 | | 91,000 | |
MPT Operating Partnership,
Gtd. Notes | | 5.00 | | 10/15/2027 | | 50,000 | | 47,110 | |
MPT Operating Partnership,
Gtd. Notes | | 5.25 | | 8/1/2026 | | 75,000 | | 72,750 | |
Realogy Group,
Gtd. Notes | | 4.88 | | 6/1/2023 | | 75,000 | b | 68,250 | |
Realogy Group,
Gtd. Notes | | 5.25 | | 12/1/2021 | | 50,000 | b | 49,188 | |
RHP Hotel Properties,
Gtd. Notes | | 5.00 | | 4/15/2023 | | 100,000 | | 99,500 | |
RHP Hotel Properties,
Gtd. Notes | | 5.00 | | 4/15/2021 | | 60,000 | | 60,225 | |
SBA Communications,
Sr. Unscd. Notes | | 4.88 | | 7/15/2022 | | 125,000 | | 124,687 | |
SBA Communications,
Sr. Unscd. Notes | | 4.88 | | 9/1/2024 | | 85,000 | | 82,344 | |
37
CONSOLIDATED STATEMENT OF INVESTMENTS (continued)
| | | | | | | | | | |
| |
Description | Coupon
Rate (%) | | Maturity
Date | | Principal
Amount ($) | | Value ($) | |
Bonds and Notes - 5.0% (continued) | | | | | |
Real Estate - .2% (continued) | | | | | |
Starwood Property Trust,
Sr. Unscd. Notes | | 5.00 | | 12/15/2021 | | 125,000 | | 124,687 | |
Uniti Group,
Gtd. Notes | | 8.25 | | 10/15/2023 | | 150,000 | | 142,125 | |
Uniti Group,
Sr. Scd. Notes | | 6.00 | | 4/15/2023 | | 75,000 | b | 72,188 | |
WeWork Cos,
Gtd. Notes | | 7.88 | | 5/1/2025 | | 45,000 | b | 41,513 | |
| | 2,257,216 | |
Retailing - .2% | | | | | |
Asbury Automotive Group,
Gtd. Notes | | 6.00 | | 12/15/2024 | | 55,000 | | 54,313 | |
Beacon Escrow,
Gtd. Notes | | 4.88 | | 11/1/2025 | | 100,000 | b | 90,250 | |
Conn's,
Gtd. Notes | | 7.25 | | 7/15/2022 | | 100,000 | | 99,375 | |
DriveTime Automotive Group,
Sr. Scd. Notes | | 8.00 | | 6/1/2021 | | 60,000 | b | 61,800 | |
Golden Nugget,
Sr. Unscd. Notes | | 6.75 | | 10/15/2024 | | 75,000 | b | 75,000 | |
Group 1 Automotive,
Gtd. Notes | | 5.00 | | 6/1/2022 | | 75,000 | | 73,500 | |
JC Penney,
Gtd. Notes | | 6.38 | | 10/15/2036 | | 100,000 | | 38,750 | |
KFC Holding,
Gtd. Notes | | 4.75 | | 6/1/2027 | | 100,000 | b | 94,250 | |
KFC Holding,
Gtd. Notes | | 5.25 | | 6/1/2026 | | 75,000 | b | 73,875 | |
L Brands,
Gtd. Notes | | 6.69 | | 1/15/2027 | | 65,000 | | 61,425 | |
L Brands,
Gtd. Notes | | 6.75 | | 7/1/2036 | | 75,000 | | 62,156 | |
L Brands,
Gtd. Notes | | 6.88 | | 11/1/2035 | | 75,000 | | 64,125 | |
Men's Wearhouse,
Gtd. Notes | | 7.00 | | 7/1/2022 | | 35,000 | | 36,050 | |
Michaels Stores,
Gtd. Notes | | 5.88 | | 12/15/2020 | | 75,000 | b | 75,094 | |
New Red Finance,
Scd. Notes | | 5.00 | | 10/15/2025 | | 100,000 | b | 94,000 | |
New Red Finance,
Sr. Scd. Notes | | 4.25 | | 5/15/2024 | | 150,000 | b | 141,000 | |
New Red Finance,
Sr. Scd. Notes | | 4.63 | | 1/15/2022 | | 50,000 | b | 49,681 | |
Penske Automotive Group,
Gtd. Notes | | 5.50 | | 5/15/2026 | | 75,000 | | 71,625 | |
38
| | | | | | | | | | |
| |
Description | Coupon
Rate (%) | | Maturity
Date | | Principal
Amount ($) | | Value ($) | |
Bonds and Notes - 5.0% (continued) | | | | | |
Retailing - .2% (continued) | | | | | |
Petsmart,
Gtd. Notes | | 7.13 | | 3/15/2023 | | 200,000 | b | 141,000 | |
Rite Aid,
Gtd. Notes | | 6.13 | | 4/1/2023 | | 150,000 | b | 128,156 | |
Sally Holdings,
Gtd. Notes | | 5.63 | | 12/1/2025 | | 75,000 | | 70,028 | |
Sonic Automotive,
Gtd. Notes | | 5.00 | | 5/15/2023 | | 75,000 | | 70,130 | |
Yum! Brands,
Sr. Unscd. Notes | | 3.75 | | 11/1/2021 | | 100,000 | | 98,125 | |
Yum! Brands,
Sr. Unscd. Notes | | 3.88 | | 11/1/2020 | | 100,000 | | 99,625 | |
| | 1,923,333 | |
Semiconductors & Semiconductor Equipment - .0% | | | | | |
Advanced Micro Devices,
Sr. Unscd. Notes | | 7.50 | | 8/15/2022 | | 150,000 | | 164,812 | |
Amkor Technology,
Sr. Unscd. Notes | | 6.38 | | 10/1/2022 | | 75,000 | | 75,656 | |
NXP Funding,
Gtd. Notes | | 3.88 | | 9/1/2022 | | 75,000 | b | 72,563 | |
NXP Funding,
Gtd. Notes | | 4.13 | | 6/1/2021 | | 125,000 | b | 124,844 | |
NXP Funding,
Gtd. Notes | | 4.63 | | 6/15/2022 | | 50,000 | b | 49,813 | |
Sensata Technologies,
Gtd. Notes | | 6.25 | | 2/15/2026 | | 75,000 | b | 76,687 | |
| | 564,375 | |
Technology Hardware & Equipment - .1% | | | | | |
Booz Allen Hamilton,
Gtd. Notes | | 5.13 | | 5/1/2025 | | 50,000 | b | 48,938 | |
Dell,
Sr. Unscd. Bonds | | 4.63 | | 4/1/2021 | | 45,000 | | 45,257 | |
Diamond 1 Finance,
Gtd. Notes | | 5.88 | | 6/15/2021 | | 150,000 | b | 152,444 | |
EMC,
Sr. Unscd. Notes | | 2.65 | | 6/1/2020 | | 275,000 | | 267,998 | |
GCI,
Sr. Unscd. Notes | | 6.75 | | 6/1/2021 | | 75,000 | | 75,735 | |
GCI,
Sr. Unscd. Notes | | 6.88 | | 4/15/2025 | | 85,000 | | 88,134 | |
Harland Clarke Holdings,
Sr. Unscd. Notes | | 9.25 | | 3/1/2021 | | 50,000 | b | 44,688 | |
Leidos Holdings,
Sr. Scd. Notes, Ser. 1 | | 5.95 | | 12/1/2040 | | 75,000 | | 70,913 | |
NCR,
Gtd. Notes | | 4.63 | | 2/15/2021 | | 75,000 | | 74,062 | |
39
CONSOLIDATED STATEMENT OF INVESTMENTS (continued)
| | | | | | | | | | |
| |
Description | Coupon
Rate (%) | | Maturity
Date | | Principal
Amount ($) | | Value ($) | |
Bonds and Notes - 5.0% (continued) | | | | | |
Technology Hardware & Equipment - .1% (continued) | | | | | |
NCR,
Gtd. Notes | | 5.00 | | 7/15/2022 | | 75,000 | | 72,375 | |
Sungard Availability Services,
Gtd. Notes | | 8.75 | | 4/1/2022 | | 50,000 | b | 23,000 | |
Western Digital,
Gtd. Notes | | 4.75 | | 2/15/2026 | | 90,000 | | 83,250 | |
| | 1,046,794 | |
Telecommunication Services - .4% | | | | | |
Anixter,
Gtd. Notes | | 5.13 | | 10/1/2021 | | 100,000 | | 101,000 | |
CenturyLink,
Sr. Unscd. Bonds, Ser. P | | 7.60 | | 9/15/2039 | | 120,000 | | 103,200 | |
CenturyLink,
Sr. Unscd. Notes, Ser. S | | 6.45 | | 6/15/2021 | | 75,000 | | 76,969 | |
CenturyLink,
Sr. Unscd. Notes, Ser. T | | 5.80 | | 3/15/2022 | | 50,000 | | 50,065 | |
CenturyLink,
Sr. Unscd. Notes, Ser. Y | | 7.50 | | 4/1/2024 | | 75,000 | | 78,937 | |
Cincinnati Bell,
Gtd. Notes | | 7.00 | | 7/15/2024 | | 75,000 | b | 67,875 | |
Cogent Communications Finance,
Gtd. Notes | | 5.63 | | 4/15/2021 | | 150,000 | b | 150,375 | |
CommScope,
Gtd. Notes | | 5.00 | | 6/15/2021 | | 75,000 | b | 75,037 | |
CommScope,
Gtd. Notes | | 5.50 | | 6/15/2024 | | 75,000 | b | 72,844 | |
CommScope Technologies Finance,
Gtd. Notes | | 6.00 | | 6/15/2025 | | 75,000 | b | 73,313 | |
Consolidated Communications,
Gtd. Notes | | 6.50 | | 10/1/2022 | | 75,000 | | 69,225 | |
Embarq,
Sr. Unscd. Notes | | 8.00 | | 6/1/2036 | | 50,000 | | 47,875 | |
Frontier Communications,
Scd. Notes | | 8.50 | | 4/1/2026 | | 75,000 | b | 69,938 | |
Frontier Communications,
Sr. Unscd. Notes | | 7.63 | | 4/15/2024 | | 100,000 | | 60,500 | |
Frontier Communications,
Sr. Unscd. Notes | | 9.00 | | 8/15/2031 | | 50,000 | | 31,000 | |
Frontier Communications,
Sr. Unscd. Notes | | 10.50 | | 9/15/2022 | | 125,000 | | 104,687 | |
Frontier Communications,
Sr. Unscd. Notes | | 11.00 | | 9/15/2025 | | 300,000 | | 221,250 | |
HC2 Holdings,
Sr. Scd. Notes | | 11.00 | | 12/1/2019 | | 50,000 | b | 49,750 | |
Hughes Satellite Systems,
Gtd. Notes | | 7.63 | | 6/15/2021 | | 130,000 | | 138,190 | |
40
| | | | | | | | | | |
| |
Description | Coupon
Rate (%) | | Maturity
Date | | Principal
Amount ($) | | Value ($) | |
Bonds and Notes - 5.0% (continued) | | | | | |
Telecommunication Services - .4% (continued) | | | | | |
Hughes Satellite Systems,
Sr. Scd. Notes | | 5.25 | | 8/1/2026 | | 50,000 | | 47,688 | |
Inmarsat Finance,
Gtd. Notes | | 4.88 | | 5/15/2022 | | 125,000 | b | 123,065 | |
Intelsat Jackson Holdings,
Gtd. Bonds | | 5.50 | | 8/1/2023 | | 150,000 | | 134,625 | |
Intelsat Jackson Holdings,
Gtd. Notes | | 7.50 | | 4/1/2021 | | 80,000 | | 81,000 | |
Intelsat Jackson Holdings,
Gtd. Notes | | 9.75 | | 7/15/2025 | | 150,000 | b | 157,500 | |
Intelsat Jackson Holdings,
Sr. Scd. Notes | | 8.00 | | 2/15/2024 | | 75,000 | b | 78,656 | |
Intelsat Luxembourg,
Gtd. Bonds | | 8.13 | | 6/1/2023 | | 100,000 | | 84,515 | |
Level 3 Financing,
Gtd. Notes | | 5.38 | | 8/15/2022 | | 300,000 | | 301,125 | |
Nokia OYJ,
Sr. Unscd. Notes | | 3.38 | | 6/12/2022 | | 50,000 | | 48,045 | |
Qwest,
Sr. Unscd. Debs. | | 6.88 | | 9/15/2033 | | 125,000 | | 121,246 | |
Qwest,
Sr. Unscd. Notes | | 7.25 | | 9/15/2025 | | 50,000 | | 53,375 | |
Sable International Finance,
Gtd. Notes | | 6.88 | | 8/1/2022 | | 75,000 | b | 78,469 | |
Sprint,
Gtd. Notes | | 7.13 | | 6/15/2024 | | 300,000 | | 307,500 | |
Sprint,
Gtd. Notes | | 7.88 | | 9/15/2023 | | 300,000 | | 321,000 | |
Sprint Capital,
Gtd. Notes | | 6.88 | | 11/15/2028 | | 200,000 | | 197,000 | |
Sprint Capital,
Gtd. Notes | | 8.75 | | 3/15/2032 | | 100,000 | | 109,010 | |
Sprint Communications,
Gtd. Notes | | 7.00 | | 3/1/2020 | | 55,000 | b | 57,131 | |
Sprint Communications,
Sr. Unscd. Notes | | 6.00 | | 11/15/2022 | | 200,000 | | 202,375 | |
Sprint Communications,
Sr. Unscd. Notes | | 7.00 | | 8/15/2020 | | 100,000 | | 103,750 | |
Telecom Italia,
Gtd. Notes | | 8.88 | | 11/15/2024 | | 75,000 | b | 80,062 | |
Telecom Italia,
Sr. Unscd. Notes | | 5.30 | | 5/30/2024 | | 75,000 | b | 70,969 | |
Telecom Italia Capital,
Gtd. Notes | | 6.38 | | 11/15/2033 | | 100,000 | | 92,000 | |
Telecom Italia Capital,
Gtd. Notes | | 7.20 | | 7/18/2036 | | 150,000 | | 147,958 | |
41
CONSOLIDATED STATEMENT OF INVESTMENTS (continued)
| | | | | | | | | | |
| |
Description | Coupon
Rate (%) | | Maturity
Date | | Principal
Amount ($) | | Value ($) | |
Bonds and Notes - 5.0% (continued) | | | | | |
Telecommunication Services - .4% (continued) | | | | | |
T-Mobile USA,
Gtd. Bonds | | 6.50 | | 1/15/2026 | | 100,000 | | 105,750 | |
T-Mobile USA,
Gtd. Notes | | 4.00 | | 4/15/2022 | | 50,000 | | 49,500 | |
T-Mobile USA,
Gtd. Notes | | 4.75 | | 2/1/2028 | | 175,000 | | 162,312 | |
T-Mobile USA,
Gtd. Notes | | 5.13 | | 4/15/2025 | | 100,000 | | 98,750 | |
T-Mobile USA,
Gtd. Notes | | 5.38 | | 4/15/2027 | | 100,000 | | 98,000 | |
T-Mobile USA,
Gtd. Notes | | 6.38 | | 3/1/2025 | | 150,000 | | 155,062 | |
Trilogy International Partners,
Sr. Scd. Notes | | 8.88 | | 5/1/2022 | | 100,000 | b | 100,500 | |
| | 5,409,968 | |
Transportation - .0% | | | | | |
Hornbeck Offshore Service,
Gtd. Notes | | 5.00 | | 3/1/2021 | | 75,000 | | 54,000 | |
XPO Logistics,
Gtd. Notes | | 6.13 | | 9/1/2023 | | 200,000 | b | 205,590 | |
XPO Logistics,
Gtd. Notes | | 6.50 | | 6/15/2022 | | 40,000 | b | 41,150 | |
| | 300,740 | |
Utilities - .1% | | | | | |
AES,
Sr. Unscd. Notes | | 4.88 | | 5/15/2023 | | 200,000 | | 198,500 | |
AES ,
Sr. Unscd. Notes | | 5.13 | | 9/1/2027 | | 30,000 | | 29,700 | |
AmeriGas Partners,
Sr. Unscd. Notes | | 5.63 | | 5/20/2024 | | 75,000 | | 72,375 | |
AmeriGas Partners,
Sr. Unscd. Notes | | 5.88 | | 8/20/2026 | | 75,000 | | 71,250 | |
Calpine,
Sr. Scd. Notes | | 5.25 | | 6/1/2026 | | 130,000 | b | 119,925 | |
Calpine,
Sr. Scd. Notes | | 5.88 | | 1/15/2024 | | 75,000 | b | 75,187 | |
Calpine,
Sr. Scd. Notes | | 6.00 | | 1/15/2022 | | 125,000 | b | 126,094 | |
Calpine,
Sr. Unscd. Notes | | 5.75 | | 1/15/2025 | | 170,000 | | 152,541 | |
Clearway Energy,
Gtd. Notes | | 5.38 | | 8/15/2024 | | 75,000 | | 74,578 | |
InterGen,
Sr. Scd. Notes | | 7.00 | | 6/30/2023 | | 75,000 | b | 73,875 | |
NGL Energy Partners,
Gtd. Notes | | 6.13 | | 3/1/2025 | | 75,000 | | 68,625 | |
42
| | | | | | | | | | |
| |
Description | Coupon
Rate (%) | | Maturity
Date | | Principal
Amount ($) | | Value ($) | |
Bonds and Notes - 5.0% (continued) | | | | | |
Utilities - .1% (continued) | | | | | |
NRG Energy,
Gtd. Notes | | 6.63 | | 1/15/2027 | | 75,000 | | 77,906 | |
NRG Energy,
Gtd. Notes | | 7.25 | | 5/15/2026 | | 75,000 | | 80,062 | |
Talen Energy Supply,
Gtd. Notes | | 9.50 | | 7/15/2022 | | 75,000 | b | 76,500 | |
Vistra Energy,
Gtd. Notes | | 7.38 | | 11/1/2022 | | 150,000 | | 156,000 | |
Vistra Energy,
Gtd. Notes | | 7.63 | | 11/1/2024 | | 74,000 | | 78,625 | |
| | 1,531,743 | |
Total Bonds and Notes
(cost $67,966,574) | | 65,383,729 | |
Description /Number of Contracts/Counterparty | Exercise
Price | | Expiration Date | | Notional Amount($) | a | | |
Options Purchased - .6% | | | | | |
Put Options - .6% | | | | | |
Undly Financial Comm Future Id
Contracts 1,419 | | 2,150 | | 6/21/2019 | | 152,542,500 | | 2,320,065 | |
S&P 500 Mini Index
Contracts 3,021 | | 2,250 | | 3/15/2019 | | 164,137,500 | | 3,587,437 | |
Swiss Market Index
Contracts 3,110 Goldman Sachs | CHF | 8,998 | | 12/21/2018 | | 27,983,392 | | 589,213 | |
Swiss Market Index
Contracts 1,180 Goldman Sachs | CHF | 9,041 | | 12/21/2018 | | 10,668,704 | | 246,708 | |
Swiss Market Index
Contracts 2,220 Goldman Sachs | CHF | 8,918 | | 12/21/2018 | | 19,798,682 | | 396,763 | |
Swiss Market Index
Contracts 400 Goldman Sachs | CHF | 8,949 | | 12/21/2018 | | 3,579,562 | | 67,859 | |
Total Options Purchased
(cost $7,430,059) | | 7,208,045 | |
| | | | | | Shares | | | |
Exchange-Traded Funds - 4.8% | | | | | |
Registered Investment Companies - 4.8% | | | | | |
iShares TIPS Bond ETF
(cost $62,767,881) | | | | | | 573,125 | | 62,378,925 | |
Description | Yield at Date of Purchase (%) | | Maturity
Date | | Principal
Amount ($) | | Value ($) | |
Short-Term Investments - 80.9% | | | | | |
U.S. Government Securities | | | | | |
U. S. Treasury Bills | | 2.31 | | 3/14/2019 | | 294,296,500 | c | 291,784,924 | |
U. S. Treasury Bills | | 2.09 | | 1/3/2019 | | 296,513,100 | c | 295,363,741 | |
U. S. Treasury Bills | | 2.05 | | 11/29/2018 | | 358,523,400 | c | 357,920,385 | |
U. S. Treasury Bills | | 1.86 | | 12/6/2018 | | 71,545,000 | c,d | 71,396,581 | |
43
CONSOLIDATED STATEMENT OF INVESTMENTS (continued)
| | | | | | | | | | |
| |
Description | Yield at Date of Purchase (%) | | Maturity
Date | | Principal
Amount ($) | | Value ($) | |
Short-Term Investments - 80.9% (continued) | | | | | |
U.S. Government Securities (continued) | | | | | |
U. S. Treasury Bills | | 2.06 | | 12/13/2018 | | 36,000,000 | c | 35,909,963 | |
Total Short-Term Investments
(cost $1,052,582,131) | | 1,052,375,594 | |
Description | 7-Day
Yield (%) | | | | Shares | | | |
Investment Companies - 5.5% | | | | | |
Registered Investment Companies - 5.5% | | | | | |
Dreyfus Institutional Preferred Government Plus Money Market Fund
(cost $71,233,766) | | 2.21 | | | | 71,233,766 | e | 71,233,766 | |
Total Investments (cost $1,261,980,411) | | 96.8% | 1,258,580,059 | |
Cash and Receivables (Net) | | 3.2% | 41,693,335 | |
Net Assets | | 100.0% | 1,300,273,394 | |
ETF—Exchange-Traded Fund
CHF—Swiss Franc
a Amount stated in U.S. Dollars unless otherwise noted above.
b Security exempt from registration pursuant to Rule 144A under the Securities Act of 1933. These securities may be resold in transactions exempt from registration, normally to qualified institutional buyers. At October 31, 2018, these securities were valued at $27,887,327 or 2.14% of net assets.
c Security is a discount security. Income is recognized through the accretion of discount.
d Held by a counterparty for open exchange traded derivative contracts.
e Investment in affiliated issuer. The investment objective of this investment company is publicly available and can be found within the investment company’s prospectus.
| | |
Portfolio Summary (Unaudited) † | Value (%) |
Government | 80.9 |
Investment Companies | 10.3 |
Communications | .9 |
Consumer, Non-cyclical | .9 |
Consumer, Cyclical | .8 |
Energy | .7 |
Options Purchased | .6 |
Industrial | .5 |
Financial | .5 |
Basic Materials | .3 |
Technology | .3 |
Utilities | .1 |
Diversified | .0 |
| | 96.8 |
† Based on net assets.
See notes to consolidated financial statements.
44
CONSOLIDATED STATEMENT OF INVESTMENTS IN AFFILIATED ISSUERS
| | | | | | | |
Registered Investment Company | Value
10/31/17 ($) | Purchases ($) | Sales ($) | Value
10/31/18 ($) | Net
Assets (%) | Dividends/
Distributions ($) |
Dreyfus Institutional Preferred Government Plus Money Market Fund | 213,024,668 | 544,497,424 | 686,288,326 | 71,233,766 | 5.5 | 1,872,671 |
See notes to consolidated financial statements.
45
CONSOLIDATED STATEMENT OF FUTURES
October 31, 2018
| | | | | | | |
Description | Number of
Contracts | Expiration | Notional
Value ($) | Value ($) | Unrealized Appreciation (Depreciation) ($) | |
Futures Long | | |
Amsterdam Exchange Index | 427 | 11/18 | 50,421,280a | 49,989,191 | (432,089) | |
Australian 10 Year Bond | 62 | 12/18 | 5,680,329a | 5,681,903 | 1,574 | |
Brent Crude | 83 | 6/19 | 6,614,592b | 6,220,850 | (393,742) | |
CAC 40 10 Euro | 448 | 11/18 | 25,663,229a | 25,828,044 | 164,815 | |
Canadian 10 year Bond | 1,793 | 12/18 | 181,482,171a | 179,987,808 | (1,494,363) | |
Cocoa | 204 | 3/19 | 4,504,490b | 4,596,120 | 91,630 | |
Copper | 72 | 3/19 | 4,998,626b | 4,820,400 | (178,226) | |
Crude Oil | 25 | 6/19 | 1,778,298b | 1,651,250 | (127,048) | |
Crude Soybean Oil | 224 | 3/19 | 3,863,966b | 3,829,056 | (34,910) | |
DAX | 78 | 12/18 | 26,453,054a | 25,305,808 | (1,147,246) | |
Euro-Bond | 519 | 12/18 | 93,962,167a | 94,208,096 | 245,929 | |
Euro-Bund Option | 1,081 | 11/18 | 19,861,015a | 20,496,366 | 635,351 | |
FTSE 100 | 2,030 | 12/18 | 187,881,950a | 184,512,388 | (3,369,562) | |
FTSE/MIB Index | 693 | 12/18 | 80,160,056a | 74,509,143 | (5,650,913) | |
Gold 100 oz | 81 | 12/18 | 9,959,159b | 9,841,500 | (117,659) | |
Hang Seng | 210 | 11/18 | 33,270,420a | 33,354,650 | 84,230 | |
Live Cattle | 14 | 2/19 | 684,496b | 684,320 | (176) | |
LME Primary Aluminum | 118 | 11/18 | 5,921,291b | 5,743,650 | (177,641) | |
LME Primary Nickel | 11 | 11/18 | 872,421b | 755,073 | (117,348) | |
LME Primary Nickel | 11 | 3/19 | 810,579b | 761,112 | (49,467) | |
LME Refined Pig Lead | 4 | 11/18 | 202,012b | 191,350 | (10,662) | |
LME Refined Pig Lead | 4 | 3/19 | 200,712b | 192,500 | (8,212) | |
LME Zinc | 7 | 11/18 | 412,058b | 445,681 | 33,623 | |
LME Zinc | 7 | 3/19 | 463,071b | 434,394 | (28,677) | |
Long Gilt | 81 | 12/18 | 12,479,857a | 12,673,621 | 193,764 | |
Low Sulphur Gas oil | 117 | 6/19 | 8,053,874b | 8,049,600 | (4,274) | |
Mini MSCI Emerging Markets Index | 495 | 12/18 | 25,776,821 | 23,678,325 | (2,098,496) | |
Natural Gas | 297 | 3/19 | 9,054,460b | 8,811,990 | (242,470) | |
NY Harbor ULSD | 91 | 3/19 | 8,662,824b | 8,539,112 | (123,712) | |
Platinum | 522 | 1/19 | 21,683,853b | 22,002,300 | 318,447 | |
S&P/Toronto Stock Exchange 60 Index | 885 | 12/18 | 127,361,958a | 120,227,430 | (7,134,528) | |
Soybean Meal | 283 | 3/19 | 8,803,528b | 8,761,680 | (41,848) | |
Standard & Poor's 500 E-mini | 3,033 | 12/18 | 435,327,341 | 411,138,315 | (24,189,026) | |
Sugar No.11 | 639 | 3/19 | 9,385,888b | 9,439,819 | 53,931 | |
Topix | 875 | 12/18 | 132,101,480a | 127,254,398 | (4,847,082) | |
U.S. Treasury 10 Year Notes | 8,190 | 12/18 | 978,957,188 | 970,003,125 | (8,954,063) | |
46
| | | | | | | |
Description | Number of
Contracts | Expiration | Notional
Value ($) | Value ($) | Unrealized Appreciation (Depreciation) ($) | |
Futures Short | | |
ASX SPI 200 | 519 | 12/18 | 53,497,202a | 53,273,452 | 223,750 | |
Chicago SRW Wheat | 395 | 3/19 | 10,651,530b | 10,191,000 | 460,530 | |
Coffee "C" | 245 | 3/19 | 11,529,455b | 10,698,844 | 830,611 | |
Corn No.2 Yellow | 103 | 3/19 | 1,996,309b | 1,935,113 | 61,196 | |
Cotton No.2 | 218 | 3/19 | 8,594,594b | 8,534,700 | 59,894 | |
Gasoline | 136 | 2/19 | 10,480,788b | 10,193,064 | 287,724 | |
Hard Red Winter Wheat | 186 | 3/19 | 4,921,594b | 4,817,400 | 104,194 | |
IBEX 35 Index | 86 | 11/18 | 8,625,603a | 8,656,056 | (30,453) | |
Japanese 10 Year Bond | 133 | 12/18 | 177,112,141a | 177,549,431 | (437,290) | |
Lean Hog | 25 | 2/19 | 656,211b | 653,250 | 2,961 | |
LME Primary Aluminum | 118 | 11/18 | 6,002,896b | 5,743,650 | 259,246 | |
LME Primary Aluminum | 83 | 3/19 | 4,165,314b | 4,080,488 | 84,826 | |
LME Primary Nickel | 11 | 11/18 | 803,187b | 755,073 | 48,114 | |
LME Refined Pig Lead | 4 | 11/18 | 199,988b | 191,350 | 8,638 | |
LME Zinc | 7 | 11/18 | 472,479b | 445,681 | 26,798 | |
NYMEX Palladium | 38 | 12/18 | 3,402,390b | 4,060,300 | (657,910) | |
Silver | 101 | 12/18 | 7,271,914b | 7,212,410 | 59,504 | |
Soybean | 238 | 3/19 | 10,367,180b | 10,293,500 | 73,680 | |
Gross Unrealized Appreciation | | 4,414,960 | |
Gross Unrealized Depreciation | | (62,099,093) | |
a Notional amounts in foreign currency have been converted to USD using relevant foreign exchange rates.
b These securities are wholly-owned by the Subsidiary referenced in Note 1.
See notes to consolidated financial statements.
47
CONSOLIDATED STATEMENT OF OPTIONS WRITTEN
October 31, 2018
| | | | | | | |
Description/ Contracts/ Counterparties | Exercise Price | Expiration Date | Notional Amount | a | Value ($) | |
Call Options: | | | | | | |
Swiss Market Index
Contracts 2,220, Goldman Sachs | 8,918 | 12/21/18 | 19,798,682 | CHF | (396,763) | |
Swiss Market Index
Contracts 400, Goldman Sachs | 8,949 | 12/21/18 | 3,579,562 | CHF | (90,182) | |
Swiss Market Index
Contracts 3,110, Goldman Sachs | 8,998 | 12/21/18 | 27,983,392 | CHF | (611,218) | |
Swiss Market Index
Contracts 1,180, Goldman Sachs | 9,041 | 12/21/18 | 10,668,704 | CHF | (204,094) | |
Total Options Written (premiums received $1,360,213) | | | | (1,302,257) | |
a Notional amount stated in U.S. Dollars unless otherwise indicated.
CHF—Swiss Franc
See notes to consolidated financial statements.
48
CONSOLIDATED STATEMENT OF FORWARD FOREIGN CURRENCY EXCHANGE CONTRACTS October 31, 2018
| | | | | | |
Counterparty/ Purchased
Currency | Purchased Currency
Amounts | Currency
Sold | Sold
Currency
Amounts | Settlement Date | Unrealized Appreciation (Depreciation)($) |
Bank of Montreal | | | |
Swedish Krona | 104,724,000 | United States Dollar | 11,560,397 | 12/19/18 | (61,220) |
United States Dollar | 38,939,694 | Euro | 33,354,342 | 12/19/18 | 991,090 |
United States Dollar | 8,463,277 | New Zealand Dollar | 13,079,000 | 12/19/18 | (75,993) |
Norwegian Krone | 47,121,000 | United States Dollar | 5,758,550 | 12/19/18 | (155,703) |
British Pound | 8,759,000 | United States Dollar | 11,608,040 | 12/19/18 | (383,556) |
Japanese Yen | 1,690,233,000 | United States Dollar | 15,084,969 | 12/19/18 | (40,215) |
United States Dollar | 8,917,042 | Japanese Yen | 988,467,476 | 12/19/18 | 118,699 |
Australian Dollar | 20,811,000 | United States Dollar | 14,792,667 | 12/19/18 | (47,382) |
United States Dollar | 18,170,577 | Australian Dollar | 25,603,000 | 12/19/18 | 30,001 |
Swiss Franc | 30,308,935 | United States Dollar | 31,391,307 | 12/19/18 | (1,144,067) |
United States Dollar | 54,435,631 | Swiss Franc | 53,667,000 | 12/19/18 | 877,872 |
Canadian Dollar | 54,556,000 | United States Dollar | 41,913,458 | 12/19/18 | (428,397) |
Citigroup | | | |
Euro | 12,442,000 | United States Dollar | 14,413,510 | 12/19/18 | (257,736) |
United States Dollar | 1,842,506 | Swedish Krona | 16,079,000 | 12/19/18 | 76,958 |
Norwegian Krone | 236,018,000 | United States Dollar | 28,874,614 | 12/19/18 | (811,272) |
United States Dollar | 6,881,552 | Norwegian Krone | 57,145,782 | 12/19/18 | 86,724 |
Australian Dollar | 19,542,000 | United States Dollar | 13,924,066 | 12/19/18 | (77,910) |
British Pound | 67,349,325 | United States Dollar | 87,948,453 | 12/19/18 | (1,641,636) |
United States Dollar | 29,198,569 | British Pound | 22,152,000 | 12/19/18 | 811,223 |
United States Dollar | 39,353,152 | Swiss Franc | 39,016,000 | 12/19/18 | 416,570 |
Australian Dollar | 54,794,989 | United States Dollar | 38,937,867 | 12/19/18 | (113,798) |
United States Dollar | 5,500,672 | Australian Dollar | 7,554,000 | 12/19/18 | 148,412 |
Japanese Yen | 2,126,016,000 | United States Dollar | 19,068,102 | 12/19/18 | (144,447) |
49
CONSOLIDATED STATEMENT OF FORWARD FOREIGN CURRENCY EXCHANGE CONTRACTS (continued)
| | | | | | |
Counterparty/ Purchased
Currency | Purchased Currency
Amounts | Currency
Sold | Sold
Currency
Amounts | Settlement Date | Unrealized Appreciation (Depreciation)($) |
Citigroup (continued) |
United States Dollar | 27,312,979 | Japanese Yen | 3,034,818,475 | 12/19/18 | 300,078 |
United States Dollar | 31,331,829 | New Zealand Dollar | 48,219,183 | 12/19/18 | (150,443) |
Swedish Krona | 28,569,000 | United States Dollar | 3,207,802 | 12/19/18 | (70,794) |
United States Dollar | 14,475,792 | Canadian Dollar | 18,800,000 | 12/19/18 | 180,038 |
Canadian Dollar | 53,821,294 | United States Dollar | 41,223,870 | 12/19/18 | (297,489) |
United States Dollar | 6,687,515 | Canadian Dollar | 8,618,000 | 12/19/18 | 134,281 |
United States Dollar | 28,623,179 | British Pound | 21,741,000 | 12/19/18 | 762,521 |
New Zealand Dollar | 4,349,000 | United States Dollar | 2,858,945 | 12/19/18 | (19,486) |
Euro | 4,261,000 | United States Dollar | 5,056,231 | 12/19/18 | (208,316) |
United States Dollar | 133,339,847 | Euro | 114,335,341 | 12/19/18 | 3,255,838 |
Japanese Yen | 321,724,000 | United States Dollar | 2,882,379 | 12/19/18 | (18,716) |
Credit Suisse International | | | |
United States Dollar | 11,965,908 | New Zealand Dollar | 18,377,000 | 12/19/18 | (32,423) |
British Pound | 6,326,663 | United States Dollar | 8,263,729 | 12/19/18 | (156,237) |
United States Dollar | 27,964,423 | Swedish Krona | 251,410,228 | 12/19/18 | 358,423 |
United States Dollar | 6,384,525 | Norwegian Krone | 53,051,000 | 12/19/18 | 76,581 |
United States Dollar | 13,246,290 | Japanese Yen | 1,468,338,000 | 12/19/18 | 176,622 |
Goldman Sachs | | | |
New Zealand Dollar | 6,653,000 | United States Dollar | 4,368,293 | 12/19/18 | (24,554) |
United States Dollar | 3,305,064 | New Zealand Dollar | 4,999,000 | 12/19/18 | 41,220 |
Euro | 5,294,000 | United States Dollar | 6,229,946 | 12/19/18 | (206,745) |
United States Dollar | 87,804,671 | Euro | 75,223,341 | 12/19/18 | 2,219,989 |
Australian Dollar | 62,698,137 | United States Dollar | 44,857,779 | 12/19/18 | (434,067) |
United States Dollar | 7,191,682 | Australian Dollar | 9,908,000 | 12/19/18 | 171,535 |
United States Dollar | 41,172,311 | Swiss Franc | 40,296,000 | 12/19/18 | 958,335 |
50
| | | | | | |
Counterparty/ Purchased
Currency | Purchased Currency
Amounts | Currency
Sold | Sold
Currency
Amounts | Settlement Date | Unrealized Appreciation (Depreciation)($) |
Goldman Sachs (continued) |
British Pound | 22,085,000 | United States Dollar | 28,947,251 | 12/19/18 | (645,764) |
United States Dollar | 34,736,659 | British Pound | 26,370,000 | 12/19/18 | 944,030 |
Canadian Dollar | 30,412,095 | United States Dollar | 23,264,888 | 12/19/18 | (139,153) |
United States Dollar | 12,785,475 | Canadian Dollar | 16,641,000 | 12/19/18 | 131,452 |
Swedish Krona | 17,033,000 | United States Dollar | 1,916,124 | 12/19/18 | (45,822) |
United States Dollar | 28,154,762 | Swedish Krona | 253,059,459 | 12/19/18 | 367,669 |
United States Dollar | 46,401,928 | Japanese Yen | 5,153,490,000 | 12/19/18 | 530,745 |
Norwegian Krone | 271,147,000 | United States Dollar | 33,214,365 | 12/19/18 | (974,066) |
United States Dollar | 14,298,316 | Norwegian Krone | 116,384,000 | 12/19/18 | 459,863 |
HSBC | | | |
United States Dollar | 15,102,422 | Canadian Dollar | 19,609,000 | 12/19/18 | 191,495 |
United States Dollar | 10,670,379 | New Zealand Dollar | 16,275,000 | 12/19/18 | 44,442 |
United States Dollar | 27,975,189 | Swedish Krona | 251,410,228 | 12/19/18 | 369,189 |
United States Dollar | 12,323,891 | Japanese Yen | 1,363,259,000 | 12/19/18 | 189,531 |
Swiss Franc | 36,505,000 | United States Dollar | 37,969,878 | 12/19/18 | (1,539,185) |
Morgan Stanley | | | |
Australian Dollar | 32,074,000 | United States Dollar | 22,785,755 | 12/19/18 | (60,261) |
United States Dollar | 9,782,457 | New Zealand Dollar | 15,027,000 | 12/19/18 | (28,661) |
United States Dollar | 82,872,381 | Euro | 70,991,341 | 12/19/18 | 2,102,619 |
United States Dollar | 21,549,021 | Japanese Yen | 2,388,071,034 | 12/19/18 | 292,815 |
United States Dollar | 1,306,979 | Swedish Krona | 11,752,000 | 12/19/18 | 16,555 |
RBC Capital Markets | | | |
Swiss Franc | 20,263,624 | United States Dollar | 20,986,830 | 12/19/18 | (764,453) |
Canadian Dollar | 29,245,098 | United States Dollar | 22,305,296 | 12/19/18 | (66,960) |
51
CONSOLIDATED STATEMENT OF FORWARD FOREIGN CURRENCY EXCHANGE CONTRACTS (continued)
| | | | | | |
Counterparty/ Purchased
Currency | Purchased Currency
Amounts | Currency
Sold | Sold
Currency
Amounts | Settlement Date | Unrealized Appreciation (Depreciation)($) |
RBC Capital Markets (continued) |
British Pound | 20,658,663 | United States Dollar | 26,982,735 | 12/19/18 | (509,070) |
Gross Unrealized Appreciation | | | 17,833,415 |
Gross Unrealized Depreciation | | | (11,775,997) |
See notes to consolidated financial statements.
52
CONSOLIDATED STATEMENT OF SWAP AGREEMENTS
October 31, 2018
| | | | | | |
Centrally Cleared Credit Default Swaps | |
| | | | | | |
Reference
Obligation | Maturity
Date | Notional
Amount1 | Market
Value ($) | Upfront
Payments/
Receipts ($) | Unrealized (Depreciation)($) |
Sold Contracts:2 | |
Cdx.Na.Hy.31 12/23 Cds_Idx Received Fixed Rate of 5.00 3 Month | 12/20/23 | 5,000,000 | 264,367 | 359,178 | (65,645) |
Gross Unrealized Depreciation | (65,645) |
1 The maximum potential amount the fund could be required to pay as a seller of credit protection or receive as a buyer of credit protection if a credit event occurs as defined under the terms of the swap agreement.
2 If the fund is a seller of protection and a credit event occurs, as defined under the terms of the swap agreement, the fund will either (i) pay to the buyer of protection an amount equal to the notional amount of the swap and take delivery of the reference obligation or (ii) pay a net settlement amount in the form of cash or securities equal to the notional amount of the swap less the recovery value of the reference obligation.
See notes to consolidated financial statements.
53
CONSOLIDATED STATEMENT OF ASSETS AND LIABILITIES
October 31, 2018
| | | | | | | |
| | | | | | |
| | | Cost | | Value | |
Assets ($): | | | | |
Investments in securities—See Statement of Investments: | | | |
Unaffiliated issuers | 1,190,746,645 | | 1,187,346,293 | |
Affiliated issuers | | 71,233,766 | | 71,233,766 | |
Cash | | | | | 6,073,745 | |
Cash denominated in foreign currency | | | 464,469 | | 464,444 | |
Cash collateral held by broker—Note 4 | | 18,425,491 | |
Unrealized appreciation on forward foreign
currency exchange contracts—Note 4 | | 17,833,415 | |
Receivable for futures variation margin—Note 4 | | 8,232,870 | |
Receivable for investment securities sold | | 5,235,928 | |
Receivable for shares of Common Stock subscribed | | 1,869,877 | |
Interest receivable | | 1,017,975 | |
Swap upfront payments—Note 4 | | 359,178 | |
Prepaid expenses | | | | | 27,902 | |
| | | | | 1,318,120,884 | |
Liabilities ($): | | | | |
Due to The Dreyfus Corporation and affiliates—Note 3(c) | | | | 1,262,508 | |
Unrealized depreciation on forward foreign
currency exchange contracts—Note 4 | | 11,775,997 | |
Payable for shares of Common Stock redeemed | | 2,722,928 | |
Outstanding options written, at value
(premiums received $1,360,213)—Note 4 | | 1,302,257 | |
Payable for investment securities purchased | | 396,951 | |
Payable for swap variation margin—Note 4 | | 65,645 | |
Directors fees and expenses payable | | 17,503 | |
Unrealized depreciation on foreign currency transactions | | 325 | |
Accrued expenses | | | | | 303,376 | |
| | | | | 17,847,490 | |
Net Assets ($) | | | 1,300,273,394 | |
Composition of Net Assets ($): | | | | |
Paid-in capital | | | | | 1,342,447,838 | |
Total distributable earnings (loss) | | | | | (42,174,444) | |
Net Assets ($) | | | 1,300,273,394 | |
| | | | | | |
Net Asset Value Per Share | Class A | Class C | Class I | Class Y | |
Net Assets ($) | 47,280,034 | 46,680,570 | 472,940,067 | 733,372,723 | |
Shares Outstanding | 3,134,645 | 3,344,424 | 30,483,667 | 47,228,972 | |
Net Asset Value Per Share ($) | 15.08 | 13.96 | 15.51 | 15.53 | |
| | | | | | |
See notes to consolidated financial statements. | | | | | |
54
CONSOLIDATED STATEMENT OF OPERATIONS
Year Ended October 31, 2018
| | | | | | | |
| | | | | | |
| | | | | | |
Investment Income ($): | | | | |
Income: | | | | |
Interest | | | 23,649,813 | |
Dividends (net of $736 foreign taxes withheld at source): | |
Unaffiliated issuers | | | 2,093,873 | |
Affiliated issuers | | | 1,872,671 | |
Total Income | | | 27,616,357 | |
Expenses: | | | | |
Management fee—Note 3(a) | | | 15,823,463 | |
Subsidiary management fee—Note 3(a) | | | 1,003,251 | |
Shareholder servicing costs—Note 3(c) | | | 970,590 | |
Distribution fees—Note 3(b) | | | 467,016 | |
Directors’ fees and expenses—Note 3(d) | | | 121,116 | |
Registration fees | | | 101,713 | |
Professional fees | | | 100,558 | |
Prospectus and shareholders’ reports | | | 77,151 | |
Custodian fees—Note 3(c) | | | 37,608 | |
Loan commitment fees—Note 2 | | | 32,174 | |
Miscellaneous | | | 143,961 | |
Total Expenses | | | 18,878,601 | |
Less—reduction in expenses due to undertaking—Note 3(a) | | | (1,314,770) | |
Less—reduction in fees due to earnings credits—Note 3(c) | | | (29,327) | |
Net Expenses | | | 17,534,504 | |
Investment Income—Net | | | 10,081,853 | |
Realized and Unrealized Gain (Loss) on Investments—Note 4 ($): | | |
Net realized gain (loss) on investments and foreign currency transactions | 230,447 | |
Net realized gain (loss) on options transactions | (25,332,939) | |
Net realized gain (loss) on futures | 39,170,802 | |
Net realized gain (loss) on swap agreements | 360,639 | |
Net realized gain (loss) on forward foreign currency exchange contracts | 13,859,151 | |
Net Realized Gain (Loss) | | | 28,288,100 | |
Net unrealized appreciation (depreciation) on investments
and foreign currency transactions | | | (5,456,850) | |
Net unrealized appreciation (depreciation) on options transactions | 3,229,873 | |
Net unrealized appreciation (depreciation) on futures | | | (103,868,978) | |
Net unrealized appreciation (depreciation) on swap agreements | | | (209,879) | |
Net unrealized appreciation (depreciation) on
forward foreign currency exchange contracts | | | 6,343,065 | |
Net Unrealized Appreciation (Depreciation) | | | (99,962,769) | |
Net Realized and Unrealized Gain (Loss) on Investments | | | (71,674,669) | |
Net (Decrease) in Net Assets Resulting from Operations | | (61,592,816) | |
| | | | | | | |
See notes to consolidated financial statements. | | | | | |
55
CONSOLIDATED STATEMENT OF CHANGES IN NET ASSETS
| | | | | | | | | | |
| | | | Year Ended October 31, |
| | | | 2018 | | 2017a | |
Operations ($): | | | | | | | | |
Investment income (loss)—net | | | 10,081,853 | | | | (3,716,758) | |
Net realized gain (loss) on investments | | 28,288,100 | | | | 80,158,082 | |
Net unrealized appreciation (depreciation)
on investments | | (99,962,769) | | | | 11,555,140 | |
Net Increase (Decrease) in Net Assets
Resulting from Operations | (61,592,816) | | | | 87,996,464 | |
Distributions ($): | |
Distributions to shareholders: | | | | | | | | |
Class A | | | (3,628,341) | | | | (341,762) | |
Class C | | | (3,966,680) | | | | (237,196) | |
Class I | | | (30,866,723) | | | | (775,856) | |
Class Y | | | (35,205,227) | | | | (1,271,510) | |
Total Distributions | | | (73,666,971) | | | | (2,626,324) | |
Capital Stock Transactions ($): | |
Net proceeds from shares sold: | | | | | | | | |
Class A | | | 9,551,768 | | | | 15,191,131 | |
Class C | | | 3,022,939 | | | | 5,013,783 | |
Class I | | | 137,796,035 | | | | 467,890,826 | |
Class Y | | | 161,422,956 | | | | 217,849,128 | |
Distributions reinvested: | | | | | | | | |
Class A | | | 3,266,497 | | | | 325,546 | |
Class C | | | 3,248,878 | | | | 181,423 | |
Class I | | | 26,282,157 | | | | 590,605 | |
Class Y | | | 17,523,027 | | | | 721,951 | |
Cost of shares redeemed: | | | | | | | | |
Class A | | | (32,687,647) | | | | (151,909,545) | |
Class C | | | (33,272,348) | | | | (59,663,859) | |
Class I | | | (290,753,006) | | | | (294,198,094) | |
Class Y | | | (165,820,468) | | | | (130,888,867) | |
Increase (Decrease) in Net Assets
from Capital Stock Transactions | (160,419,212) | | | | 71,104,028 | |
Total Increase (Decrease) in Net Assets | (295,678,999) | | | | 156,474,168 | |
Net Assets ($): | |
Beginning of Period | | | 1,595,952,393 | | | | 1,439,478,225 | |
End of Period | | | 1,300,273,394 | | | | 1,595,952,393 | |
56
| | | | | | | | | | |
| | | | Year Ended October 31, |
| | | | 2018 | | 2017a | |
Capital Share Transactions (Shares): | |
Class Ab,c | | | | | | | | |
Shares sold | | | 601,336 | | | | 955,739 | |
Shares issued for distributions reinvested | | | 207,002 | | | | 21,139 | |
Shares redeemed | | | (2,091,483) | | | | (9,643,628) | |
Net Increase (Decrease) in Shares Outstanding | (1,283,145) | | | | (8,666,750) | |
Class Cb | | | | | | | | |
Shares sold | | | 204,986 | | | | 337,106 | |
Shares issued for distributions reinvested | | | 221,012 | | | | 12,512 | |
Shares redeemed | | | (2,276,707) | | | | (4,009,428) | |
Net Increase (Decrease) in Shares Outstanding | (1,850,709) | | | | (3,659,810) | |
Class Ic | | | | | | | | |
Shares sold | | | 8,550,569 | | | | 28,694,862 | |
Shares issued for distributions reinvested | | | 1,622,356 | | | | 37,522 | |
Shares redeemed | | | (18,057,949) | | | | (18,147,833) | |
Net Increase (Decrease) in Shares Outstanding | (7,885,024) | | | | 10,584,551 | |
Class Yc | | | | | | | | |
Shares sold | | | 10,041,332 | | | | 13,453,316 | |
Shares issued for distributions reinvested | | | 1,081,668 | | | | 45,867 | |
Shares redeemed | | | (10,121,870) | | | | (8,067,592) | |
Net Increase (Decrease) in Shares Outstanding | 1,001,130 | | | | 5,431,591 | |
| | | | | | | | | | |
a Distributions to shareholders include only distributions from net realized gain on investments. Accumulated Investment losses—net was $1,757,232 in 2017 and is no longer presented as a result of the adoption of SEC’s Disclosure Update and Simplification Rule. | |
b During the period ended October 31, 2018, 2,443 Class C shares representing $38,020 were automatically exchanged for 2,285 Class A shares. | |
c During the period ended October 31, 2018, 10,885 Class A shares representing $170,857 were exchanged for 10,589 Class Y shares, 638,594 Class Y shares representing $10,291,095 were exchanged for 638,902 Class I shares and during the period ended October 31, 2017, 2,183 Class A shares representing $34,879 were exchanged for 2,132 Class I shares, 2,736 Class C shares representing $40,409 were exchanged for 2,518 Class I shares, 638,261 Class Y shares representing $10,378,341 were exchanged for 638,253 Class I shares. | |
See notes to consolidated financial statements.
| | | | | | | | |
57
CONSOLIDATED FINANCIAL HIGHLIGHTS
The following tables describe the performance for each share class for the fiscal periods indicated. All information (except portfolio turnover rate) reflects financial results for a single fund share. Total return shows how much your investment in the fund would have increased (or decreased) during each period, assuming you had reinvested all dividends and distributions. These figures have been derived from the fund’s financial statements.
| | | | | | | |
| | | |
| | | Year Ended October 31, |
Class A Shares | | 2018 | 2017 | 2016 | 2015 | 2014 |
Per Share Data ($): | | | | | | |
Net asset value,
beginning of period | | 16.63 | 15.73 | 15.63 | 15.36 | 14.18 |
Investment Operations: | | | | | | |
Investment income (loss)—neta | | .08 | (.09) | (.17) | (.22) | (.19) |
Net realized and unrealized
gain (loss) on investments | | (.81) | 1.02 | .27 | .49b | 1.38 |
Total from
Investment Operations | | (.73) | .93 | .10 | .27 | 1.19 |
Distributions: | | | | | | |
Dividends from
investment income—net | | – | – | – | – | (.01) |
Dividends from
net realized gain on investments | | (.82) | (.03) | – | – | – |
Total Distributions | | (.82) | (.03) | – | – | (.01) |
Net asset value, end of period | | 15.08 | 16.63 | 15.73 | 15.63 | 15.36 |
Total Return (%)c | | (4.63) | 5.92 | .70 | 1.69 | 8.42 |
Ratios/Supplemental Data (%): | | | | | | |
Ratio of total expenses
to average net assets | | 1.59 | 1.55 | 1.51 | 1.49 | 1.54 |
Ratio of net expenses
to average net assets | | 1.44 | 1.47 | 1.50 | 1.49 | 1.50 |
Ratio of net investment income (loss) to average net assets | | .48 | (.56) | (1.13) | (1.41) | (1.30) |
Portfolio Turnover Rate | | 17.55 | 69.80 | 10.66 | 165.55 | 124.10 |
Net Assets,
end of period ($ x 1,000) | | 47,280 | 73,458 | 205,832 | 268,600 | 54,798 |
a Based on average shares outstanding.
b In addition to net realized and unrealized losses on investments, this amount includes an increase in net asset value per share resulting from the timing of issuances and redemptions of shares in relation to fluctuating market values for the portfolio investments.
c Exclusive of sales charge.
See notes to consolidated financial statements.
58
| | | | | | | |
| | | |
| | | Year Ended October 31, |
Class C Shares | | 2018 | 2017 | 2016 | 2015 | 2014 |
Per Share Data ($): | | | | | | |
Net asset value,
beginning of period | | 15.56 | 14.83 | 14.85 | 14.70 | 13.66 |
Investment Operations: | | | | | | |
Investment (loss)—neta | | (.04) | (.19) | (.27) | (.33) | (.29) |
Net realized and unrealized
gain (loss) on investments | | (.74) | .95 | .25 | .48b | 1.33 |
Total from
Investment Operations | | (.78) | .76 | (.02) | .15 | 1.04 |
Distributions: | | | | | | |
Dividends from
net realized gain on investments | | (.82) | (.03) | – | – | – |
Net asset value, end of period | | 13.96 | 15.56 | 14.83 | 14.85 | 14.70 |
Total Return (%)c | | (5.30) | 5.14 | (.07) | .95 | 7.61 |
Ratios/Supplemental Data (%): | | | | | | |
Ratio of total expenses
to average net assets | | 2.31 | 2.32 | 2.26 | 2.24 | 2.30 |
Ratio of net expenses
to average net assets | | 2.19 | 2.23 | 2.25 | 2.24 | 2.25 |
Ratio of net investment (loss)
to average net assets | | (.27) | (1.26) | (1.82) | (2.16) | (2.08) |
Portfolio Turnover Rate | | 17.55 | 69.80 | 10.66 | 165.55 | 124.10 |
Net Assets,
end of period ($ x 1,000) | | 46,681 | 80,834 | 131,341 | 141,904 | 23,672 |
a Based on average shares outstanding.
b In addition to net realized and unrealized losses on investments, this amount includes an increase in net asset value per share resulting from the timing of issuances and redemptions of shares in relation to fluctuating market values for the portfolio investments.
c Exclusive of sales charge.
See notes to consolidated financial statements.
59
CONSOLIDATED FINANCIAL HIGHLIGHTS (continued)
| | | | | | | |
| | | |
| | | Year Ended October 31, |
Class I Shares | | 2018 | 2017 | 2016 | 2015 | 2014 |
Per Share Data ($): | | | | | | |
Net asset value,
beginning of period | | 17.04 | 16.08 | 15.93 | 15.61 | 14.39 |
Investment Operations: | | | | | | |
Investment income (loss)—neta | | .12 | (.03) | (.13) | (.19) | (.14) |
Net realized and unrealized
gain (loss) on investments | | (.83) | 1.02 | .28 | .51b | 1.39 |
Total from
Investment Operations | | (.71) | .99 | .15 | .32 | 1.25 |
Distributions: | | | | | | |
Dividends from
investment income—net | | – | – | – | – | (.03) |
Dividends from
net realized gain on investments | | (.82) | (.03) | – | – | – |
Total Distributions | | (.82) | (.03) | – | – | (.03) |
Net asset value, end of period | | 15.51 | 17.04 | 16.08 | 15.93 | 15.61 |
Total Return (%) | | (4.33) | 6.17 | 1.01 | 1.92 | 8.77 |
Ratios/Supplemental Data (%): | | | | | | |
Ratio of total expenses
to average net assets | | 1.31 | 1.30 | 1.25 | 1.22 | 1.21 |
Ratio of net expenses
to average net assets | | 1.19 | 1.21 | 1.24 | 1.22 | 1.21 |
Ratio of net investment income (loss) to average net assets | | .73 | (.17) | (.86) | (1.15) | (.94) |
Portfolio Turnover Rate | | 17.55 | 69.80 | 10.66 | 165.55 | 124.10 |
Net Assets,
end of period ($ x 1,000) | | 472,940 | 653,752 | 446,643 | 489,361 | 71,731 |
a Based on average shares outstanding.
b In addition to net realized and unrealized losses on investments, this amount includes an increase in net asset value per share resulting from the timing of issuances and redemptions of shares in relation to fluctuating market values for the portfolio investments.
See notes to consolidated financial statements.
60
| | | | | | | |
| | | |
| | | Year Ended October 31, |
Class Y Shares | | 2018 | 2017 | 2016 | 2015 | 2014 |
Per Share Data ($): | | | | | | |
Net asset value,
beginning of period | | 17.04 | 16.07 | 15.91 | 15.59 | 14.39 |
Investment Operations: | | | | | | |
Investment income (loss)—neta | | .13 | (.02) | (.11) | (.15) | (.17) |
Net realized and unrealized
gain (loss) on investments | | (.82) | 1.02 | .27 | .47b | 1.40 |
Total from
Investment Operations | | (.69) | 1.00 | .16 | .32 | 1.23 |
Distributions: | | | | | | |
Dividends from
investment income—net | | – | – | – | – | (.03) |
Dividends from
net realized gain on investments | | (.82) | (.03) | – | – | – |
Total Distributions | | (.82) | (.03) | – | – | (.03) |
Net asset value, end of period | | 15.53 | 17.04 | 16.07 | 15.91 | 15.59 |
Total Return (%) | | (4.27) | 6.23 | 1.01 | 2.05 | 8.56 |
Ratios/Supplemental Data (%): | | | | | | |
Ratio of total expenses
to average net assets | | 1.21 | 1.21 | 1.18 | 1.14 | 1.16 |
Ratio of net expenses
to average net assets | | 1.14 | 1.15 | 1.16 | 1.14 | 1.16 |
Ratio of net investment income (loss) to average net assets | | .78 | (.14) | (.68) | (.96) | (1.14) |
Portfolio Turnover Rate | | 17.55 | 69.80 | 10.66 | 165.55 | 124.10 |
Net Assets,
end of period ($ x 1,000) | | 733,373 | 787,909 | 655,662 | 483,043 | 387,629 |
a Based on average shares outstanding.
b In addition to net realized and unrealized losses on investments, this amount includes an increase in net asset value per share resulting from the timing of issuances and redemptions of shares in relation to fluctuating market values for the portfolio investments.
See notes to consolidated financial statements.
61
NOTES TO CONSOLIDATED FINANCIAL STATEMENTS
NOTE 1—Significant Accounting Policies:
Dynamic Total Return Fund (the “fund”) is a separate non-diversified series of Advantage Funds, Inc. (the “Company”), which is registered under the Investment Company Act of 1940, as amended (the “Act”), as an open-end management investment company and operates as a series company currently offering ten series, including the fund. The fund’s investment objective is to seek total return. The Dreyfus Corporation (the “Manager” or “Dreyfus”), a wholly-owned subsidiary of The Bank of New York Mellon Corporation (“BNY Mellon”), serves as the fund’s investment adviser. Effective January 31, 2018, BNY Mellon Asset Management North America Corporation (the “Sub-Adviser”), a wholly-owned subsidiary of BNY Mellon and an affiliate of Dreyfus, serves as the fund’s sub-investment adviser. The Sub-Adviser is a specialist multi-asset investment manager formed by the combination of certain BNY Mellon affiliated investment management firms, including Mellon Capital Management Corporation, which served as the fund’s sub-investment adviser prior to January 31, 2018.
The fund may invest in certain commodities through its investment in DTR Commodity Fund Ltd., (the “Subsidiary”), a wholly-owned and controlled subsidiary of the fund organized under the laws of the Cayman Islands. The Subsidiary has the ability to invest in commodities and securities consistent with the investment objective of the fund. Dreyfus serves as investment adviser for the Subsidiary, BNY Mellon Asset Management North America Corporation serves as the Subsidiary’s sub-investment advisor and Citibank N.A. serves as the Subsidiary’s custodian. The financial statements have been consolidated and include the accounts of the fund and the Subsidiary. Accordingly, all inter-company transactions and balances have been eliminated. A subscription agreement was entered into between the fund and the Subsidiary, comprising the entire issued share capital of the Subsidiary, with the intent that the fund will remain the sole shareholder and retain all rights. Under the Amended and Restated Memorandum and Articles of Association, shares issued by the Subsidiary confer upon a shareholder the right to receive notice of, to attend and to vote at general meetings of the Subsidiary and shall confer upon the shareholder rights in a winding-up or repayment of capital and the right to participate in the profits or assets of the Subsidiary. The following summarizes the structure and relationship of the Subsidiary at October 31, 2018:
62
| | | | |
| | Subsidiary Activity |
Consolidated fund Net Assets ($) | | 1,300,273,394 | |
Subsidiary Percentage of fund Net Assets | | 6.51% | |
Subsidiary Financial Statement Information ($) | | | |
Total assets | | 84,940,516 | |
Total liabilities | | 97,169 | |
Net assets | | 84,843,347 | |
Total income | | 1,320,538 | |
Investment income—net | | 307,747 | |
Net realized gain (loss) | | 5,350,536 | |
Net unrealized appreciation (depreciation) | | (2,852,831) | |
Net increase (decrease) in net assets resulting from operations | | 2,497,705 | |
MBSC Securities Corporation (the “Distributor”), a wholly-owned subsidiary of Dreyfus, is the distributor of the fund’s shares. The fund is authorized to issue 600 million shares of $.001 par value Common Stock. The fund currently has authorized five classes of shares: Class A (200 million shares authorized), Class C (100 million shares authorized), Class I (100 million shares authorized), Class T (100 million shares authorized) and Class Y (100 million shares authorized). Class A and Class T shares generally are subject to a sales charge imposed at the time of purchase. Class C shares are subject to a contingent deferred sales charge (“CDSC”) imposed on Class C shares redeemed within one year of purchase. Class C shares automatically convert to Class A shares ten years after the date of purchase, without the imposition of a sales charge. Class I and Class Y shares are sold at net asset value per share generally to institutional investors. As of the date of this report, the fund did not offer Class T shares for purchase. Other differences between the classes include the services offered to and the expenses borne by each class, the allocation of certain transfer agency costs, and certain voting rights. Income, expenses (other than expenses attributable to a specific class), and realized and unrealized gains or losses on investments are allocated to each class of shares based on its relative net assets.
The Company accounts separately for the assets, liabilities and operations of each series. Expenses directly attributable to each series are charged to that series’ operations; expenses which are applicable to all series are allocated among them on a pro rata basis.
The Financial Accounting Standards Board (“FASB”) Accounting Standards Codification (“ASC”) is the exclusive reference of authoritative U.S. generally accepted accounting principles (“GAAP”) recognized by the FASB to be applied by nongovernmental entities. Rules and interpretive releases of the Securities and Exchange Commission (“SEC”) under authority of federal laws are also sources of authoritative GAAP for SEC registrants. The fund’s financial statements are prepared in accordance with
63
NOTES TO CONSOLIDATED FINANCIAL STATEMENTS (continued)
GAAP, which may require the use of management estimates and assumptions. Actual results could differ from those estimates.
The Company enters into contracts that contain a variety of indemnifications. The fund’s maximum exposure under these arrangements is unknown. The fund does not anticipate recognizing any loss related to these arrangements.
(a) Portfolio valuation: The fair value of a financial instrument is the amount that would be received to sell an asset or paid to transfer a liability in an orderly transaction between market participants at the measurement date (i.e., the exit price). GAAP establishes a fair value hierarchy that prioritizes the inputs of valuation techniques used to measure fair value. This hierarchy gives the highest priority to unadjusted quoted prices in active markets for identical assets or liabilities (Level 1 measurements) and the lowest priority to unobservable inputs (Level 3 measurements).
Additionally, GAAP provides guidance on determining whether the volume and activity in a market has decreased significantly and whether such a decrease in activity results in transactions that are not orderly. GAAP requires enhanced disclosures around valuation inputs and techniques used during annual and interim periods.
Various inputs are used in determining the value of the fund’s investments relating to fair value measurements. These inputs are summarized in the three broad levels listed below:
Level 1—unadjusted quoted prices in active markets for identical investments.
Level 2—other significant observable inputs (including quoted prices for similar investments, interest rates, prepayment speeds, credit risk, etc.).
Level 3—significant unobservable inputs (including the fund’s own assumptions in determining the fair value of investments).
The inputs or methodology used for valuing securities are not necessarily an indication of the risk associated with investing in those securities.
Changes in valuation techniques may result in transfers in or out of an assigned level within the disclosure hierarchy. Valuation techniques used to value the fund’s investments are as follows:
Investments in debt securities, excluding short-term investments (other than U.S. Treasury Bills), futures, options and forward foreign currency exchange contracts (“forward contracts”) are valued each business day by an independent pricing service (the “Service”) approved by the Company’s
64
Board of Directors (the “Board”). Investments for which quoted bid prices are readily available and are representative of the bid side of the market in the judgment of the Service are valued at the mean between the quoted bid prices (as obtained by the Service from dealers in such securities) and asked prices (as calculated by the Service based upon its evaluation of the market for such securities). Other investments (which constitute a majority of portfolio securities) are valued as determined by the Service, based on methods which include consideration of the following: yields or prices of securities of comparable quality, coupon, maturity and type; indications as to values from dealers; and general market conditions. These securities are generally categorized within Level 2 of the fair value hierarchy.
Investments in equity securities are valued at the last sales price on the securities exchange or national securities market on which such securities are primarily traded. Securities listed on the National Market System for which market quotations are available are valued at the official closing price or, if there is no official closing price that day, at the last sales price. For open short positions, asked prices are used for valuation purposes. Bid price is used when no asked price is available. Registered investment companies that are not traded on an exchange are valued at their net asset value. All of the preceding securities are generally categorized within Level 1 of the fair value hierarchy.
Securities not listed on an exchange or the national securities market, or securities for which there were no transactions, are valued at the average of the most recent bid and asked prices. U.S. Treasury Bills are valued at the mean price between quoted bid prices and asked prices by the Service approved by the Board. These securities are generally categorized within Level 2 of the fair value hierarchy.
The Service is engaged under the general supervision of the Board.
Fair valuing of securities may be determined with the assistance of a pricing service using calculations based on indices of domestic securities and other appropriate indicators, such as prices of relevant American Depository Receipts and futures. Utilizing these techniques may result in transfers between Level 1 and Level 2 of the fair value hierarchy.
When market quotations or official closing prices are not readily available, or are determined not to accurately reflect fair value, such as when the value of a security has been significantly affected by events after the close of the exchange or market on which the security is principally traded (for example, a foreign exchange or market), but before the fund calculates its net asset value, the fund may value these investments at fair value as determined in accordance with the procedures approved by the Board.
65
NOTES TO CONSOLIDATED FINANCIAL STATEMENTS (continued)
Certain factors may be considered when fair valuing investments such as: fundamental analytical data, the nature and duration of restrictions on disposition, an evaluation of the forces that influence the market in which the securities are purchased and sold, and public trading in similar securities of the issuer or comparable issuers. These securities are either categorized within Level 2 or 3 of the fair value hierarchy depending on the relevant inputs used.
For restricted securities where observable inputs are limited, assumptions about market activity and risk are used and such securities are generally categorized within Level 3 of the fair value hierarchy.
Investments denominated in foreign currencies are translated to U.S. dollars at the prevailing rates of exchange.
Futures and options, which are traded on an exchange, are valued at the last sales price on the securities exchange on which such securities are primarily traded or at the last sales price on the national securities market on each business day and are generally categorized within Level 1 of the fair value hierarchy. Options traded over-the-counter (“OTC”) are valued at the mean between the bid and asked price and are generally categorized within Level 2 of the fair value hierarchy. Investments in swap agreements are valued each business day by the Service. Swaps are valued by the Service by using a swap pricing model which incorporates among other factors, default probabilities, recovery rates, credit curves of the underlying issuer and swap spreads on interest rates and are generally categorized within Level 2 of the fair value hierarchy. Forward contracts are valued at the forward rate and are generally categorized within Level 2 of the fair value hierarchy.
The following is a summary of the inputs used as of October 31, 2018 in valuing the fund’s investments:
| | | | | |
| | Level 1 - Unadjusted Quoted Prices | Level 2 - Other Significant Observable Inputs | Level 3 -Significant Unobservable Inputs | Total |
Assets ($) | | | |
Investments in Securities: | | | |
Corporate Bonds† | – | 65,383,729 | – | 65,383,729 |
Exchange-Traded Funds | 62,378,925 | – | – | 62,378,925 |
Investment Company | 71,233,766 | – | – | 71,233,766 |
U.S. Treasury | – | 1,052,375,594 | – | 1,052,375,594 |
Other Financial Instruments: | | | |
Futures†† | 4,414,960 | – | – | 4,414,960 |
66
| | | | | |
| | Level 1 - Unadjusted Quoted Prices | Level 2 - Other Significant Observable Inputs | Level 3 -Significant Unobservable Inputs | Total |
Assets ($) | | | |
Forward Foreign Currency Exchange Contracts†† | – | 17,833,415 | – | 17,833,415 |
Options Purchased | 5,907,502 | 1,300,543 | – | 7,208,045 |
Liabilities ($) | | | | |
Other Financial Instruments: | | | |
Futures†† | (62,099,093) | – | – | (62,099,093) |
Forward Foreign Currency Exchange Contracts†† | – | (11,775,997) | – | (11,775,997) |
Options Written | – | (1,302,257) | – | (1,302,257) |
Swaps†† | – | (65,645) | – | (65,645) |
† See Consolidated Statement of Investments for additional detailed categorizations.
†† Amount shown represents unrealized appreciation (depreciation) at period end, but only variation margin on exchanged traded and centrally cleared derivatives are reported in the Statement of Assets and Liabilities.
(b) Foreign currency transactions: The fund does not isolate that portion of the results of operations resulting from changes in foreign exchange rates on investments from the fluctuations arising from changes in the market prices of securities held. Such fluctuations are included with the net realized and unrealized gain or loss on investments.
Net realized foreign exchange gains or losses arise from sales of foreign currencies, currency gains or losses realized on securities transactions between trade and settlement date, and the difference between the amounts of dividends, interest and foreign withholding taxes recorded on the fund’s books and the U.S. dollar equivalent of the amounts actually received or paid. Net unrealized foreign exchange gains and losses arise from changes in the value of assets and liabilities other than investments resulting from changes in exchange rates. Foreign currency gains and losses on foreign currency transactions are also included with net realized and unrealized gain or loss on investments.
(c) Securities transactions and investment income: Securities transactions are recorded on a trade date basis. Realized gains and losses from securities transactions are recorded on the identified cost basis. Dividend income is recognized on the ex-dividend date and interest income, including, where applicable, accretion of discount and amortization of premium on investments, is recognized on the accrual basis.
67
NOTES TO CONSOLIDATED FINANCIAL STATEMENTS (continued)
(d) Affiliated issuers: Investments in other investment companies advised by Dreyfus are considered “affiliated” under the Act.
(e) Risk: Investing in foreign markets may involve special risks and considerations not typically associated with investing in the U.S. These risks include revaluation of currencies, high rates of inflation, repatriation restrictions on income and capital, and adverse political and economic developments. Moreover, securities issued in these markets may be less liquid, subject to government ownership controls and delayed settlements, and their prices may be more volatile than those of comparable securities in the U.S.
The fund’s investments in commodity-linked financial derivatives instruments may subject the fund to greater market price volatility than investments in traditional securities. The value of commodity-linked financial derivative instruments may be affected by changes in overall market movements, commodity index volatility, changes in interest rates, or factors affecting a particular industry or commodity, such as drought, floods, weather, livestock disease, embargoes, tariffs and international economic, political and regulatory developments.
(f) Dividends and distributions to shareholders: Dividends and distributions are recorded on the ex-dividend date. Dividends from investment income-net and dividends from net realized capital gains, if any, are normally declared and paid annually, but the fund may make distributions on a more frequent basis to comply with the distribution requirements of the Internal Revenue Code of 1986, as amended (the “Code”). To the extent that net realized capital gains can be offset by capital loss carryovers, it is the policy of the fund not to distribute such gains. Income and capital gain distributions are determined in accordance with income tax regulations, which may differ from GAAP.
(g) Federal income taxes: It is the policy of the fund to continue to qualify as a regulated investment company, if such qualification is in the best interests of its shareholders, by complying with the applicable provisions of the Code, and to make distributions of taxable income and net realized capital gain sufficient to relieve it from substantially all federal income and excise taxes.
The Subsidiary is classified as a controlled foreign corporation under Subchapter N of the Code. Therefore, the fund is required to increase its taxable income by its share of the Subsidiary’s income. Net investment losses of the Subsidiary cannot be deducted by the fund in the current period nor carried forward to offset taxable income in future periods.
68
As of and during the period ended October 31, 2018, the fund did not have any liabilities for any uncertain tax positions. The fund recognizes interest and penalties, if any, related to uncertain tax positions as income tax expense in the consolidated Statement of Operations. During the period ended October 31, 2018, the fund did not incur any interest or penalties.
Each tax year in the four-year period ended October 31, 2018 remains subject to examination by the Internal Revenue Service and state taxing authorities.
At October 31, 2018, the components of accumulated earnings on a tax basis were as follows: undistributed ordinary income $13,597,083, accumulated capital losses $39,049,948 and unrealized depreciation $16,721,579.
The fund is permitted to carry forward capital losses for an unlimited period. Furthermore, capital loss carryovers retain their character as either short-term or long-term capital losses.
The accumulated capital loss carryover is available for federal income tax purposes to be applied against future net realized capital gains, if any, realized subsequent to October 31, 2018. The fund has $4,890,706 of short-term capital losses and $34,159,242 of long-term capital losses which can be carried forward for an unlimited period..
The tax character of distributions paid to shareholders during the fiscal periods ended October 31, 2018 and October 31, 2017 were as follows: ordinary income $44,222,833 and $0, and long-term capital gains $29,444,138 and $2,626,324, respectively.
During the period ended October 31, 2018, as a result of permanent book to tax differences, primarily due to the tax treatment for Subpart F income from subsidiary, the fund decreased total distributable earnings (loss) by $5,658,283 and increased paid-in capital by the same amount. Net assets and net asset value per share were not affected by this reclassification.
(h) New Accounting Pronouncements: In March 2017, the FASB issued Accounting Standards Update 2017-08, Receivables—Nonrefundable Fees and Other Costs (Subtopic 310-20): Premium Amortization On Purchased Callable Debt Securities (“ASU 2017-08”). The update shortens the amortization period for the premium on certain purchased callable debt securities to the earliest call date. ASU 2017-08 will be effective for annual periods beginning after December 15, 2018.
Also in August 2018, the FASB issued Accounting Standards Update 2018-13, Fair Value Measurement (Topic 820): Disclosure Framework—
69
NOTES TO CONSOLIDATED FINANCIAL STATEMENTS (continued)
Changes to the Disclosure Requirements for Fair Value Measurement (“ASU 2018-13”). The update provides guidance that eliminates, adds and modifies certain disclosure requirements for fair value measurements. ASU 2018-13 will be effective for annual periods beginning after December 15, 2019. Management is currently assessing the potential impact of these changes to future financial statements.
NOTE 2—Bank Lines of Credit:
The fund participates with other Dreyfus-managed funds in an $830 million unsecured credit facility led by Citibank, N.A. and a $300 million unsecured credit facility provided by The Bank of New York Mellon, a subsidiary of BNY Mellon and an affiliate of Dreyfus (each, a “Facility”), each to be utilized primarily for temporary or emergency purposes, including the financing of redemptions. In connection therewith, the fund has agreed to pay its pro rata portion of commitment fees for each Facility. Interest is charged to the fund based on rates determined pursuant to the terms of the respective Facility at the time of borrowing. During the period ended October 31, 2018, the fund did not borrow under the Facilities.
NOTE 3— Management Fee, Sub-Investment Advisory Fee and Other Transactions with Affiliates:
(a) Dreyfus has entered into separate management agreements with the fund and the Subsidiary pursuant to which Dreyfus receives a management fee computed at the annual rate of 1.10% of the value of the average daily net assets of each of the fund and the Subsidiary which is payable monthly. In addition, Dreyfus has contractually agreed for as long as the fund invests in the Subsidiary, to waive the management fee it receives from the fund in an amount equal to the management fee paid to Dreyfus by the Subsidiary. The reduction in expenses, pursuant to the undertaking amounted to $1,003,251 during the period ended October 31, 2018.
In addition, Dreyfus has contractually agreed, from November 1, 2017 through March 1, 2019, to waive receipt of its fees and/or assume the direct expenses of the fund, so that the direct expenses of none of the classes (excluding Rule 12b-1 Distribution Plan fees, Shareholder Services Plan fees, taxes, interest expense, brokerage commissions, commitment fees on borrowings and extraordinary expenses) exceed 1.19% of the value of the fund’s average daily net assets. On or after March 1, 2019, Dreyfus may terminate this expense limitation at any time. The reduction in expenses, pursuant to the undertaking, amounted to $311,519 during the period ended October 31, 2018.
Pursuant to separate sub-investment advisory agreements between Dreyfus and the Sub-Adviser with respect to the fund and the Subsidiary, Dreyfus
70
pays the Sub Adviser an annual fee of .65% of the value of the average daily net assets of each of the fund and the Subsidiary which is payable monthly.
During the period ended October 31, 2018, the Distributor retained $7,184 from commissions earned on sales of the fund’s Class A shares and $16,301 from CDSC fees on redemptions of the fund’s Class C shares.
(b) Under the Distribution Plan adopted pursuant to Rule 12b-1 under the Act, Class C shares pay the Distributor for distributing its shares at an annual rate of .75% of the value of its average daily net assets. During the period ended October 31, 2018, Class C shares were charged $467,016 pursuant to the Distribution Plan.
(c) Under the Shareholder Services Plan, Class A and Class C shares pay the Distributor at an annual rate of .25% of the value of their average daily net assets for the provision of certain services. The services provided may include personal services relating to shareholder accounts, such as answering shareholder inquiries regarding the fund and providing reports and other information, and services related to the maintenance of shareholder accounts. The Distributor may make payments to Service Agents (securities dealers, financial institutions or other industry professionals) with respect to these services. The Distributor determines the amounts to be paid to Service Agents. During the period ended October 31, 2018, Class A and Class C shares were charged $155,915 and $155,672, respectively, pursuant to the Shareholder Services Plan.
The fund has arrangements with the transfer agent and the custodian whereby the fund may receive earnings credits when positive cash balances are maintained, which are used to offset transfer agency and custody fees. For financial reporting purposes, the fund includes net earnings credits, if any, as an expense offset in the consolidated Statement of Operations.
The fund compensates Dreyfus Transfer, Inc., a wholly-owned subsidiary of Dreyfus, under a transfer agency agreement for providing transfer agency and cash management services for the fund. The majority of transfer agency fees are comprised of amounts paid on a per account basis, while cash management fees are related to fund subscriptions and redemptions. During the period ended October 31, 2018, the fund was charged $21,947 for transfer agency services. These fees are included in Shareholder servicing costs in the consolidated Statement of Operations.
The fund compensates The Bank of New York Mellon under a custody agreement for providing custodial services for the fund. These fees are determined based on net assets, geographic region and transaction activity. During the period ended October 31, 2018, the fund was charged $37,608
71
NOTES TO CONSOLIDATED FINANCIAL STATEMENTS (continued)
pursuant to the custody agreement. These fees were partially offset by earnings credits of $29,327.
During the period ended October 31, 2018, the fund was charged $12,797 for services performed by the Chief Compliance Officer and his staff. These fees are included in Miscellaneous in the Statement of Operations.
The components of “Due to The Dreyfus Corporation and affiliates” in the consolidated Statement of Assets and Liabilities consist of: management fees $1,316,175, Distribution Plan fees $30,883, Shareholder Services Plan fees $20,546, custodian fees $44,000, Chief Compliance Officer fees $4,193 and transfer agency fees $8,324, which are offset against an expense reimbursement currently in effect in the amount of $161,613.
(d) Each Board member also serves as a Board member of other funds within the Dreyfus complex. Annual retainer fees and attendance fees are allocated to each fund based on net assets.
NOTE 4—Securities Transactions:
The aggregate amount of purchases and sales of investment securities, excluding short-term securities, futures, options transactions, forward contracts and swap agreements, during the period ended October 31, 2018, amounted to $25,184,811 and $57,707,607, respectively.
Derivatives: A derivative is a financial instrument whose performance is derived from the performance of another asset. The fund enters into International Swaps and Derivatives Association, Inc. Master Agreements or similar agreements (collectively, “Master Agreements”) with its OTC derivative contract counterparties in order to, among other things, reduce its credit risk to counterparties. Master Agreements include provisions for general obligations, representations, collateral and events of default or termination. Under a Master Agreement, the fund may offset with the counterparty certain derivative financial instrument’s payables and/or receivables with collateral held and/or posted and create one single net payment in the event of default or termination.
Each type of derivative instrument that was held by the fund during the period ended October 31, 2018 is discussed below.
Futures: In the normal course of pursuing its investment objective, the fund is exposed to market risk, including equity price risk, interest rate risk and commodity risk, as a result of changes in value of underlying financial instruments. The fund invests in futures in order to manage its exposure to or protect against changes in the market. A futures contract represents a commitment for the future purchase or a sale of an asset at a specified
72
date. Upon entering into such contracts, these investments require initial margin deposits with a counterparty, which consist of cash or cash equivalents. The amount of these deposits is determined by the exchange or Board of Trade on which the contract is traded and is subject to change. Accordingly, variation margin payments are received or made to reflect daily unrealized gains or losses which are recorded in the consolidated Statement of Operations. When the contracts are closed, the fund recognizes a realized gain or loss which is reflected in the consolidated Statement of Operations. There is minimal counterparty credit risk to the fund with futures since they are exchange traded, and the exchange guarantees the futures against default. Futures open at October 31, 2018 are set forth in the Consolidated Statement of Futures.
Options Transactions: The fund purchases and writes (sells) put and call options to hedge against changes in the values of values of equities or as a substitute for an investment. The fund is subject to market risk in the course of pursuing its investment objectives through its investments in options contracts. A call option gives the purchaser of the option the right (but not the obligation) to buy, and obligates the writer to sell, the underlying financial instrument at the exercise price at any time during the option period, or at a specified date. Conversely, a put option gives the purchaser of the option the right (but not the obligation) to sell, and obligates the writer to buy the underlying financial instrument at the exercise price at any time during the option period, or at a specified date.
As a writer of call options, the fund receives a premium at the outset and then bears the market risk of unfavorable changes in the price of the financial instrument underlying the option. Generally, the fund realizes a gain, to the extent of the premium, if the price of the underlying financial instrument decreases between the date the option is written and the date on which the option is terminated. Generally, the fund incurs a loss if the price of the financial instrument increases between those dates. The maximum payout for those contracts is limited to the number of call option contracts written and the related strike prices, respectively.
As a writer of put options, the fund receives a premium at the outset and then bears the market risk of unfavorable changes in the price of the financial instrument underlying the option. Generally, the fund realizes a gain, to the extent of the premium, if the price of the underlying financial instrument increases between the date the option is written and the date on which the option is terminated. Generally, the fund incurs a loss if the price of the financial instrument decreases between those dates. The maximum payout for those contracts is limited to the number of put option contracts written and the related strike prices, respectively.
73
NOTES TO CONSOLIDATED FINANCIAL STATEMENTS (continued)
As a writer of an option, the fund has no control over whether the underlying financial instrument may be sold (call) or purchased (put) and as a result bears the market risk of an unfavorable change in the price of the financial instrument underlying the written option. There is a risk of loss from a change in value of such options which may exceed the related premiums received. This risk may be mitigated by Master Agreements, if any, between the fund and the counterparty and the posting of collateral, if any, by the counterparty to the fund to cover the fund’s exposure to the counterparty. The consolidated Statement of Operations reflects any unrealized gains or losses which occurred during the period as well as any realized gains or losses which occurred upon the expiration or closing of the option transaction. Options written open at October 31, 2018 are set forth in Consolidated Statement of Options Written.
Forward Foreign Currency Exchange Contracts: The fund enters into forward contracts in order to hedge its exposure to changes in foreign currency exchange rates on its foreign portfolio holdings, to settle foreign currency transactions or as a part of its investment strategy. When executing forward contracts, the fund is obligated to buy or sell a foreign currency at a specified rate on a certain date in the future. With respect to sales of forward contracts, the fund incurs a loss if the value of the contract increases between the date the forward contract is opened and the date the forward contract is closed. The fund realizes a gain if the value of the contract decreases between those dates. With respect to purchases of forward contracts, the fund incurs a loss if the value of the contract decreases between the date the forward contract is opened and the date the forward contract is closed. The fund realizes a gain if the value of the contract increases between those dates. Any realized or unrealized gains or losses which occurred during the period are reflected in the consolidated Statement of Operations. The fund is exposed to foreign currency risk as a result of changes in value of underlying financial instruments. The fund is also exposed to credit risk associated with counterparty nonperformance on these forward contracts, which is generally limited to the unrealized gain on each open contract. This risk may be mitigated by Master Agreements, if any, between the fund and the counterparty and the posting of collateral, if any, by the counterparty to the fund to cover the fund’s exposure to the counterparty. Forward contracts open at October 31, 2018 are set forth in the Consolidated Statement of Forward Foreign Currency Exchange Contracts.
Swap Agreements: The fund enters into swap agreements to exchange the interest rate on, or return generated by, one nominal instrument for the return generated by another nominal instrument. Swap agreements are privately negotiated in the OTC market or centrally cleared. The fund
74
enters into these agreements to hedge certain market or interest rate risks, to manage the interest rate sensitivity (sometimes called duration) of fixed income securities, to provide a substitute for purchasing or selling particular securities or to increase potential returns.
For OTC swaps, the fund accrues for interim payments on a daily basis, with the net amount recorded within unrealized appreciation (depreciation) on swap agreements in the consolidated Statement of Assets and Liabilities. Once the interim payments are settled in cash, the net amount is recorded as a realized gain (loss) on swaps, in addition to realized gain (loss) recorded upon the termination of swap agreements in the consolidated Statement of Operations. Upfront payments made and/or received by the fund, are recorded as an asset and/or liability in the consolidated Statement of Assets and Liabilities and are recorded as a realized gain or loss ratably over the agreement’s term/event with the exception of forward starting interest rate swaps which are recorded as realized gains or losses on the termination date.
Upon entering into centrally cleared swap agreements, an initial margin deposit is required with a counterparty, which consists of cash or cash equivalents. The amount of these deposits is determined by the exchange on which the agreement is traded and is subject to change. The change in valuation of centrally cleared swaps is recorded as a receivable or payable for variation margin in the Statement of Assets and Liabilities. Payments received from (paid to) the counterparty, including upon termination, are recorded as realized gain (loss) in the Statement of Operations.
Fluctuations in the value of swap agreements are recorded for financial statement purposes as unrealized appreciation or depreciation on swap agreements.
Credit Default Swaps: Credit default swaps involve commitments to pay a fixed interest rate in exchange for payment if a credit event affecting a third party (the referenced obligation or index) occurs. Credit events may include a failure to pay interest or principal, bankruptcy, or restructuring. The fund enters into these agreements to manage its exposure to the market or certain sectors of the market, to reduce its risk exposure to defaults of corporate and sovereign issuers, or to create exposure to corporate or sovereign issuers to which it is not otherwise exposed. For those credit default swaps in which the fund is paying a fixed rate, the fund is buying credit protection on the instrument. In the event of a credit event, the fund would receive the full notional amount for the reference obligation. For those credit default swaps in which the fund is receiving a fixed rate, the fund is selling credit protection on the underlying instrument. The maximum payouts for these agreements are limited to the
75
NOTES TO CONSOLIDATED FINANCIAL STATEMENTS (continued)
notional amount of each swap. Credit default swaps may involve greater risks than if the fund had invested in the reference obligation directly and are subject to general market risk, liquidity risk, counterparty risk and credit risk. This risk may be mitigated by Master Agreements, if any, between the fund and the counterparty and the posting of collateral, if any, by the counterparty to the fund to cover the fund’s exposure to the counterparty.
The maximum potential amount of future payments (undiscounted) that a fund as a seller of protection could be required to make under a credit default swap agreement would be an amount equal to the notional amount of the agreement which may exceed the amount of unrealized appreciation or depreciation reflected in the Statement of Assets and Liabilities. Notional amounts of all credit default swap agreements are disclosed in the consolidated Statement of Swap Agreements, which summarizes open credit default swaps entered into by the fund. These potential amounts would be partially offset by any recovery values of the respective referenced obligations, underlying securities comprising the referenced index, upfront payments received upon entering into the agreement, or net amounts received from the settlement of buy protection credit default swap agreements entered into by the fund for the same referenced entity or entities. Credit default swaps open at October 31, 2018 are set forth in the consolidated Statement of Swap Agreements.
GAAP requires disclosure for (i) the nature and terms of the credit derivative, reasons for entering into the credit derivative, the events or circumstances that would require the seller to perform under the credit derivative, and the current status of the payment/performance risk of the credit derivative, (ii) the maximum potential amount of future payments (undiscounted) the seller could be required to make under the credit derivative, (iii) the fair value of the credit derivative, and (iv) the nature of any recourse provisions and assets held either as collateral or by third parties. All required disclosures have been made and are incorporated within the current period as part of the Notes to the Statement of Investments and disclosures within this Note.
The following tables show the fund’s exposure to different types of market risk as it relates to the consolidated Statement of Assets and Liabilities and the consolidated Statement of Operations, respectively.
Fair value of derivative instruments as of October 31, 2018 is shown below:
| | | | | | | | |
| | Derivative
Assets ($) | | | | Derivative
Liabilities ($) | |
Interest rate risk | 1,076,618 | 1 | Interest rate risk | (10,885,716) | 1 |
Equity risk | 7,680,840 | 1,2 | Equity risk | (50,201,652) | 1,3 |
76
| | | | | | | | |
Foreign exchange risk | 17,833,415 | 4 | Foreign exchange risk | (11,775,997) | 4 |
Credit risk | - | | Credit risk | (65,645) | 5 |
Commodity risk | 2,865,547 | 1 | Commodity risk | (2,313,982) | 1 |
Gross fair value of
derivative contracts | 29,456,420 | | | | (75,242,992) | |
| | | | | | | |
Statement of Assets and Liabilities location: | |
1 Includes cumulative appreciation (depreciation) on futures as reported in the Statement of Futures, but only the unpaid variation margin is reported in the Consolidated Statement of Assets and Liabilities. |
2 Options purchased are included in Investments in securities—Unaffiliated issuers, at value. |
3 Outstanding options written, at value. | |
4 Unrealized appreciation (depreciation) on forward foreign currency exchange contracts. |
5 Includes cumulative appreciation (depreciation) on swap agreements as reported in the Statement of Swap Agreements. Unrealized appreciation (depreciation) on OTC swap agreements and only unpaid variation margin on cleared swap agreements, are reported in the Consolidated Statement of Assets and Liabilities. |
The effect of derivative instruments in the consolidated Statement of Operations during the period ended October 31, 2018 is shown below:
| | | | | | | | | | | |
Amount of realized gain (loss) on derivatives recognized in income ($) | |
Underlying
risk | Futures | 1 | Options
Transactions | 2 | Forward
Contracts | 3 | Swap
Agreements | 4 | Total | |
Interest
rate | (26,485,543) | | - | | - | | - | | (26,485,543) | |
Equity | 60,305,912 | | (25,332,939) | | - | | - | | 34,972,973 | |
Foreign
exchange | - | | - | | 13,859,151 | | - | | 13,859,151 | |
Credit | - | | - | | - | | 360,639 | | 360,639 | |
Commodity | 5,350,433 | | - | | - | | - | | 5,350,433 | |
Total | 39,170,802 | | (25,332,939) | | 13,859,151 | | 360,639 | | 28,057,653 | |
| | | | | | | | | | | |
77
NOTES TO CONSOLIDATED FINANCIAL STATEMENTS (continued)
| | | | | | | | | | | | | |
Change in unrealized appreciation (depreciation)
on derivatives recognized in income ($) | |
Underlying
risk | Futures | 5 | Options
Transactions | 6 | Forward
Contracts | 7 | Swap
Agreements | 8 | Total | |
Interest
rate | (15,828,293) | | - | | - | | - | | (15,828,293) | |
Equity | (85,199,582) | | 3,229,873 | | - | | - | | (81,969,709) | |
Foreign
exchange | - | | - | | 6,343,065 | | - | | 6,343,065 | |
Credit | - | | - | | - | | (209,879) | | (209,879) | |
Commodity | (2,841,103) | | - | | - | | - | | (2,841,103) | |
Total | (103,868,978) | | 3,229,873 | | 6,343,065 | | (209,879) | | (94,505,919) | |
| | | | | | | | | | | | |
Statement of Operations location: | |
1 Net realized gain (loss) on futures. | | |
2 Net realized gain (loss) on options transactions. |
3 Net realized gain (loss) on forward foreign currency exchange contracts. | | |
4 Net realized gain (loss) on swap agreements. | | |
5 Net unrealized appreciation (depreciation) on futures. | | |
6 Net unrealized appreciation (depreciation) on options transactions. | | |
7 Net unrealized appreciation (depreciation) on forward foreign currency exchange contracts. | |
8 Net unrealized appreciation (depreciation) on swap agreements. | | |
The provisions of ASC Topic 210 “Disclosures about Offsetting Assets and Liabilities” require disclosure on the offsetting of financial assets and liabilities. These disclosures are required for certain investments, including derivative financial instruments subject to Master Agreements which are eligible for offsetting in the consolidated Statement of Assets and Liabilities and require the fund to disclose both gross and net information with respect to such investments. For financial reporting purposes, the fund does not offset derivative assets and derivative liabilities that are subject to Master Agreements in the consolidated Statement of Assets and Liabilities.
At October 31, 2018, derivative assets and liabilities (by type) on a gross basis are as follows:
| | | | | | |
Derivative Financial Instruments: | | Assets ($) | | Liabilities ($) | |
Futures | | 4,414,960 | | (62,099,093) | |
Options | | 7,208,045 | | (1,302,257) | |
Forward contracts | | 17,833,415 | | (11,775,997) | |
Swaps | | - | | (65,645) | |
Total gross amount of derivative | | | | | |
assets and liabilities in the | | | | | |
Statement of Assets and Liabilities | | 29,456,420 | | (75,242,992) | |
Derivatives not subject to | | | | | |
Master Agreements | | (10,934,088) | | 62,353,398 | |
Total gross amount of assets | | | | | |
and liabilities subject to | | | | | |
Master Agreements | | 18,522,332 | | (12,889,594) | |
78
The following tables present derivative assets and liabilities net of amounts available for offsetting under Master Agreements and net of related collateral received or pledged, if any, as of October 31, 2018:†
| | | | | | | |
| | | | Financial | | | |
| | | | Instruments | | | |
| | | | and Derivatives | | | |
| | Gross Amount of | | Available | Collateral | | Net Amount of |
Counterparty | Assets ($) | 1 | for Offset ($) | Received ($) | 2 | Assets ($) |
Bank of Montreal | 2,017,662 | | (2,017,662) | - | | - |
Citigroup | 6,172,643 | | (3,812,043) | (5,791) | | 2,354,809 |
Goldman Sachs
International | 7,125,381 | | (3,772,428) | (3,352,953) | | - |
HSBC | 794,657 | | (794,657) | - | | - |
Morgan Stanley | 2,411,989 | | (88,922) | (2,150,002) | | 173,065 |
Total | 18,522,332 | | (10,485,712) | (5,508,746) | | 2,527,874 |
| | | | | | | |
| | | | Financial | | | |
| | | | Instruments | | | |
| | | | and Derivatives | | | |
| | Gross Amount of | | Available | Collateral | | Net Amount of |
Counterparty | Liabilities ($) | 1 | for Offset ($) | Pledged ($) | 2 | Liabilities ($) |
Bank of Montreal | (2,336,533) | | 2,017,662 | 318,871 | | - |
Citigroup | (3,812,043) | | 3,812,043 | - | | - |
Goldman Sachs
International | (3,772,428) | | 3,772,428 | - | | - |
HSBC | (1,539,185) | | 794,657 | 744,528 | | - |
Morgan Stanley | (88,922) | | 88,922 | - | | - |
RBC Capital Markets | (1,340,483) | | - | 1,340,000 | | (483) |
Total | (12,889,594) | | 10,485,712 | 2,403,399 | | (483) |
| | | | | | | |
1 Absent a default event or early termination, OTC derivative assets and liabilities are presented at gross amounts and are not offset in the Statement of Assets and Liabilities. |
2 In some instances, the actual collateral received and/or pledged may be more than the amount shown due to over collateralization. |
† See Statement of Investments for detailed information regarding collateral held for open exchange traded derivative contracts. |
The following summarizes the average market value of derivatives outstanding during the period ended October 31, 2018:
| | | |
| | Average Market Value ($) |
Equity futures | | 1,024,178,702 |
Equity options contracts | | 7,181,418 |
Interest rate futures | | 1,971,208,413 |
Forward contracts | | 1,816,614,226 |
Commodity futures | | 180,277,836 |
| | | |
79
NOTES TO CONSOLIDATED FINANCIAL STATEMENTS (continued)
The following summarizes the average notional value of swap agreements outstanding during the period ended October 31, 2018:
| | | |
| | Average Notional Value ($) |
Credit default swap agreements | | 5,886,584 |
| | | |
At October 31, 2018, the cost of investments for federal income tax purposes was $1,264,987,556; accordingly, accumulated net unrealized depreciation on investments inclusive of derivative contracts was $17,362,211, consisting of $22,623,661 gross unrealized appreciation and $39,985,872 gross unrealized depreciation.
80
REPORT OF INDEPENDENT REGISTERED PUBLIC ACCOUNTING FIRM
To the Shareholders and the Board of Directors of Dynamic Total Return Fund
Opinion on the Financial Statements
We have audited the accompanying consolidated statement of assets and liabilities of Dynamic Total Return Fund (the “Fund”) (one of the funds constituting Advantage Funds, Inc.), including the consolidated statements of investments, consolidated investments in affiliated issuers, futures, options written, forward foreign currency exchange contracts and swap agreements, as of October 31, 2018, and the related consolidated statement of operations for the year then ended, the consolidated statements of changes in net assets for each of the two years in the period then ended, the consolidated financial highlights for each of the five years in the period then ended and the related notes (collectively referred to as the “financial statements”). In our opinion, the financial statements present fairly, in all material respects, the consolidated financial position of the Fund (one of the funds constituting Advantage Funds, Inc.) at October 31, 2018, the consolidated results of its operations for the year then ended, the consolidated changes in its net assets for each of the two years in the period then ended and its consolidated financial highlights for each of the five years in the period then ended, in conformity with U.S. generally accepted accounting principles.
Basis for Opinion
These financial statements are the responsibility of the Fund’s management. Our responsibility is to express an opinion on the Fund’s financial statements based on our audits. We are a public accounting firm registered with the Public Company Accounting Oversight Board (United States) (“PCAOB”) and are required to be independent with respect to the Fund in accordance with the U.S. federal securities laws and the applicable rules and regulations of the Securities and Exchange Commission and the PCAOB.
We conducted our audits in accordance with the standards of the PCAOB. Those standards require that we plan and perform the audit to obtain reasonable assurance about whether the financial statements are free of material misstatement, whether due to error or fraud. The Fund is not required to have, nor were we engaged to perform, an audit of the Fund’s internal control over financial reporting. As part of our audits, we are required to obtain an understanding of internal control over financial reporting, but not for the purpose of expressing an opinion on the effectiveness of the Fund’s internal control over financial reporting. Accordingly, we express no such opinion.
Our audits included performing procedures to assess the risks of material misstatement of the financial statements, whether due to error or fraud, and performing procedures that respond to those risks. Such procedures included examining, on a test basis, evidence regarding the amounts and disclosures in the financial statements. Our procedures included confirmation of securities owned as of October 31, 2018, by correspondence with the custodian and others or by other appropriate auditing procedures where replies from others were not received. Our audits also included evaluating the accounting principles used and significant estimates made by management, as well as evaluating the overall presentation of the financial statements. We believe that our audits provide a reasonable basis for our opinion.

We have served as the auditor of one or more Dreyfus investment companies since at least 1957, but we are unable to determine the specific year.
New York, New York
December 28, 2018
81
IMPORTANT TAX INFORMATION (Unaudited)
For federal tax purposes, the fund hereby reports 6.20% of the ordinary dividends paid during the fiscal year ended October 31, 2018 as qualifying for the corporate dividends received deduction. Also certain dividends paid by the fund may be subject to a maximum tax rate of 15%, as provided for by the Jobs and Growth Tax Relief Reconciliation Act of 2003. Of the distributions paid during the fiscal year, $2,758,524 represents the maximum amount that may be considered qualified dividend income. Shareholders will receive notification in early 2019 of the percentage applicable to the preparation of their 2018 income tax returns. Also, the fund hereby reports $.4905 per share as a short-term capital gain distribution and also $.3267 per share as a long-term capital gain distribution paid on December 22, 2017. For state individual income tax purposes, the fund hereby reports 66.18% of the ordinary income dividends paid during its fiscal year ended October 31, 2018 as attributable to interest income from direct obligations of the United States. Such dividends are currently exempt from taxation for individual income tax purposes in most states, including New York, California, Connecticut and the District of Columbia.
82
BOARD MEMBERS INFORMATION (Unaudited)
INDEPENDENT BOARD MEMBERS
Joseph S. DiMartino (75)
Chairman of the Board (1995)
Principal Occupation During Past 5 Years:
· Corporate Director and Trustee (1995-present)
Other Public Company Board Memberships During Past 5 Years:
· CBIZ (formerly, Century Business Services, Inc.), a provider of outsourcing functions for small and medium size companies, Director (1997-present)
No. of Portfolios for which Board Member Serves: 124
———————
Peggy C. Davis (75)
Board Member (2006)
Principal Occupation During Past 5 Years:
· Shad Professor of Law, New York University School of Law (1983-present)
No. of Portfolios for which Board Member Serves: 45
———————
David P. Feldman (78)
Board Member (1996)
Principal Occupation During Past 5 Years:
· Corporate Director and Trustee (1985-present)
Other Public Company Board Memberships During Past 5 Years:
· BBH Mutual Funds Group (5 registered mutual funds), Director (1992-2014)
No. of Portfolios for which Board Member Serves: 31
———————
Joan Gulley (71)
Board Member (2017)
Principal Occupation During Past 5 Years:
· PNC Financial Services Group, Inc.(1993-2014), Executive Vice President and Chief Human Resources Officer and Executive Committee Member (2008-2014)
No. of Portfolios for which Board Member Serves: 52
———————
83
BOARD MEMBERS INFORMATION (Unaudited) (continued)
INDEPENDENT BOARD MEMBERS (continued)
Ehud Houminer (78)
Board Member (1993)
Principal Occupation During Past 5 Years:
· Board of Overseers at the Columbia Business School, Columbia University (1992-present)
· Trustee, Ben Gurion University
No. of Portfolios for which Board Member Serves: 52
———————
Lynn Martin (78)
Board Member (2012)
Principal Occupation During Past 5 Years:
· President of The Martin Hall Group LLC, a human resources consulting firm (2005-2012)
No. of Portfolios for which Board Member Serves: 31
———————
Robin A. Melvin (55)
Board Member (2012)
Principal Occupation During Past 5 Years:
· Co-chairman, Illinois Mentoring Partnership, non-profit organization dedicated to increasing the quantity and quality of mentoring services in Illinois; (2014-present; board member since 2013)
No. of Portfolios for which Board Member Serves: 99
———————
Dr. Martin Peretz (79)
Board Member (2006)
Principal Occupation During Past 5 Years:
· Editor-in-Chief Emeritus of The New Republic Magazine (2011-2012) (previously,
Editor-in-Chief, 1974-2011)
· Lecturer at Harvard University (1968-2010)
No. of Portfolios for which Board Member Serves: 31
———————
Once elected all Board Members serve for an indefinite term, but achieve Emeritus status upon reaching age 80. The address of the Board Members and Officers is c/o The Dreyfus Corporation, 200 Park Avenue, New York, New York 10166. Additional information about the Board Members is available in the fund’s Statement of Additional Information which can be obtained from Dreyfus free of charge by calling this toll free number: 1-800-DREYFUS.
James F. Henry, Emeritus Board Member
Philip L. Toia, Emeritus Board Member
84
OFFICERS OF THE FUND (Unaudited)
BRADLEY J. SKAPYAK, President since January 2010.
Chief Operating Officer and a director of the Manager since June 2009, Chairman of Dreyfus Transfer, Inc., an affiliate of the Manager and the transfer agent of the funds, since May 2011 and Chief Executive Officer of MBSC Securities Corporation since August 2016. He is an officer of 62 investment companies (comprised of 124 portfolios) managed by the Manager. He is 59 years old and has been an employee of the Manager since February 1988.
BENNETT A. MACDOUGALL, Chief Legal Officer since October 2015.
Chief Legal Officer of the Manager and Associate General Counsel and Managing Director of BNY Mellon since June 2015; from June 2005 to June 2015, he served in various capacities with Deutsche Bank – Asset & Wealth Management Division, including as Director and Associate General Counsel, and Chief Legal Officer of Deutsche Investment Management Americas Inc. from June 2012 to May 2015. He is an officer of 63 investment companies (comprised of 149 portfolios) managed by the Manager. He is 47 years old and has been an employee of the Manager since June 2015.
JAMES BITETTO, Vice President since August 2005 and Secretary since February 2018.
Managing Counsel of BNY Mellon and Secretary of the Manager, and an officer of 63 investment companies (comprised of 149 portfolios) managed by the Manager. He is 52 years old and has been an employee of the Manager since December 1996.
JOSEPH M. CHIOFFI, Vice President and Assistant Secretary since August 2005.
Managing Counsel of BNY Mellon, and an officer of 63 investment companies (comprised of 149 portfolios) managed by the Manager. He is 56 years old and has been an employee of the Manager since June 2000.
SONALEE CROSS, Vice President and Assistant Secretary since March 2018.
Counsel of BNY Mellon since October 2016; Associate at Proskauer Rose LLP from April 2016 to September 2016; Attorney at EnTrust Capital from August 2015 to February 2016; Associate at Sidley Austin LLP from September 2013 until August 2015. She is an officer of 63 investment companies (comprised of 149 portfolios) managed by Dreyfus. She is 31 years old and has been an employee of the Manager since October 2016.
MAUREEN E. KANE, Vice President and Assistant Secretary since April 2015.
Managing Counsel of BNY Mellon since July 2014; from October 2004 until July 2014, General Counsel, and from May 2009 until July 2014, Chief Compliance Officer of Century Capital Management. She is an officer of 63 investment companies (comprised of 149 portfolios) managed by the Manager. She is 56 years old and has been an employee of the Manager since July 2014.
SARAH S. KELLEHER, Vice President and Assistant Secretary since April 2014.
Managing Counsel of BNY Mellon since December 2017, from March 2013 to December 2017, Senior Counsel of BNY Mellon. She is an officer of 63 investment companies (comprised of 149 portfolios) managed by the Manager. She is 43 years old and has been an employee of the Manager since March 2013.
JEFF PRUSNOFSKY, Vice President and Assistant Secretary since August 2005.
Senior Managing Counsel of BNY Mellon, and an officer of 63 investment companies (comprised of 149 portfolios) managed by the Manager. He is 53 years old and has been an employee of the Manager since October 1990.
NATALYA ZELENSKY, Vice President and Assistant Secretary since March 2017.
Counsel of BNY Mellon since May 2016; Attorney at Wildermuth Endowment Strategy Fund/Wildermuth Advisory, LLC from November 2015 until May 2016; Assistant General Counsel at RCS Advisory Services from July 2014 until November 2015; Associate at Sutherland, Asbill & Brennan from January 2013 until January 2014. She is an officer of 63 investment companies (comprised of 149 portfolios) managed by Dreyfus. She is 33 years old and has been an employee of the Manager since May 2016.
JAMES WINDELS, Treasurer since November 2001.
Director – Mutual Fund Accounting of the Manager, and an officer of 63 investment companies (comprised of 149 portfolios) managed by the Manager. He is 60 years old and has been an employee of the Manager since April 1985.
85
OFFICERS OF THE FUND (Unaudited) (continued)
GAVIN C. REILLY, Assistant Treasurer since December 2005.
Tax Manager of the Investment Accounting and Support Department of the Manager, and an officer of 63 investment companies (comprised of 149 portfolios) managed by the Manager. He is 50 years old and has been an employee of the Manager since April 1991.
ROBERT S. ROBOL, Assistant Treasurer since December 2005.
Senior Accounting Manager – Dreyfus Financial Reporting of the Manager, and an officer of 63 investment companies (comprised of 149 portfolios) managed by the Manager. He is 54 years old and has been an employee of the Manager since October 1988.
ROBERT SALVIOLO, Assistant Treasurer since July 2007.
Senior Accounting Manager – Equity Funds of the Manager, and an officer of 63 investment companies (comprised of 149 portfolios) managed by the Manager. He is 51 years old and has been an employee of the Manager since June 1989.
ROBERT SVAGNA, Assistant Treasurer since December 2002.
Senior Accounting Manager – Fixed Income and Equity Funds of the Manager, and an officer of 63 investment companies (comprised of 149 portfolios) managed by the Manager. He is 51 years old and has been an employee of the Manager since November 1990.
JOSEPH W. CONNOLLY, Chief Compliance Officer since October 2004.
Chief Compliance Officer of the Manager, the Dreyfus Family of Funds and BNY Mellon Funds Trust (63 investment companies, comprised of 149 portfolios). He is 61 years old and has served in various capacities with the Manager since 1980, including manager of the firm’s Fund Accounting Department from 1997 through October 2001.
CARIDAD M. CAROSELLA, Anti-Money Laundering Compliance Officer since January 2016.
Anti-Money Laundering Compliance Officer of the Dreyfus Family of Funds and BNY Mellon Funds Trust since January 2016; from May 2015 to December 2015, Interim Anti-Money Laundering Compliance Officer of the Dreyfus Family of Funds and BNY Mellon Funds Trust and the Distributor; from January 2012 to May 2015, AML Surveillance Officer of the Distributor and from 2007 to December 2011, Financial Processing Manager of the Distributor. She is an officer of 57 investment companies (comprised of 143 portfolios) managed by the Manager. She is 50 years old and has been an employee of the Distributor since 1997.
86
NOTES
87
NOTES
88
NOTES
89
Dynamic Total Return Fund
200 Park Avenue
New York, NY 10166
Manager
The Dreyfus Corporation
200 Park AvenueNew York, NY 10166
Sub-Investment Adviser
BNY Mellon Asset
Management North
America Corporation
One Boston Place
Boston, MA 02108-4408
Custodian
The Bank of New York Mellon
240 Greenwich Street
New York, NY 10286
Transfer Agent &
Dividend Disbursing Agent
Dreyfus Transfer, Inc.
200 Park Avenue
New York, NY 10166
Distributor
MBSC Securities Corporation
200 Park Avenue
New York, NY 10166
| | |
Ticker Symbols: | Class A: AVGAX Class C: AVGCX Class I: AVGRX Class Y: AVGYX |
Telephone Call your financial representative or 1-800-DREYFUS
Mail The Dreyfus Family of Funds, 144 Glenn Curtiss Boulevard, Uniondale, NY 11556-0144
E-mail Send your request to info@dreyfus.com
Internet Information can be viewed online or downloaded at www.dreyfus.com
The fund files its complete schedule of portfolio holdings with the Securities and Exchange Commission (“SEC”) for the first and third quarters of each fiscal year on Form N-Q. The fund’s Forms N-Q are available on the SEC’s website at www.sec.gov.
A description of the policies and procedures that the fund uses to determine how to vote proxies relating to portfolio securities and information regarding how the fund voted these proxies for the most recent 12-month period ended June 30 is available at www.dreyfus.com and on the SEC’s website at www.sec.gov and without charge, upon request, by calling 1-800-DREYFUS.
| | |
© 2018 MBSC Securities Corporation
6140AR1018 | 
|
Item 2. Code of Ethics.
The Registrant has adopted a code of ethics that applies to the Registrant's principal executive officer, principal financial officer, principal accounting officer or controller, or persons performing similar functions. There have been no amendments to, or waivers in connection with, the Code of Ethics during the period covered by this Report.
Item 3. Audit Committee Financial Expert.
The Registrant's Board has determined that David P. Feldman, a member of the Audit Committee of the Board, is an audit committee financial expert as defined by the Securities and Exchange Commission (the "SEC"). Mr. Feldman is "independent" as defined by the SEC for purposes of audit committee financial expert determinations.
Item 4. Principal Accountant Fees and Services.
(a) Audit Fees. The aggregate fees billed for each of the last two fiscal years (the "Reporting Periods") for professional services rendered by the Registrant's principal accountant (the "Auditor") for the audit of the Registrant's annual financial statements or services that are normally provided by the Auditor in connection with the statutory and regulatory filings or engagements for the Reporting Periods, were $171,856 in 2017 and $235,095 in 2018.
(b) Audit-Related Fees. The aggregate fees billed in the Reporting Periods for assurance and related services by the Auditor that are reasonably related to the performance of the audit of the Registrant's financial statements and are not reported under paragraph (a) of this Item 4 were $58,126 in 2017 and $82,205 in 2018. These services consisted of one or more of the following: (i) agreed upon procedures related to compliance with Internal Revenue Code section 817(h), (ii) security counts required by Rule 17f-2 under the Investment Company Act of 1940, as amended, (iii) advisory services as to the accounting or disclosure treatment of Registrant transactions or events and (iv) advisory services to the accounting or disclosure treatment of the actual or potential impact to the Registrant of final or proposed rules, standards or interpretations by the Securities and Exchange Commission, the Financial Accounting Standards Boards or other regulatory or standard-setting bodies.
The aggregate fees billed in the Reporting Periods for non-audit assurance and related services by the Auditor to the Registrant's investment adviser (not including any sub-investment adviser whose role is primarily portfolio management and is subcontracted with or overseen by another investment adviser), and any entity controlling, controlled by or under common control with the investment adviser that provides ongoing services to the Registrant ("Service Affiliates"), that were reasonably related to the performance of the annual audit of the Service Affiliate, which required pre-approval by the Audit Committee were $0 in 2017 and $0 in 2018.
(c) Tax Fees. The aggregate fees billed in the Reporting Periods for professional services rendered by the Auditor for tax compliance, tax advice, and tax planning ("Tax Services") were $14,678 in 2017 and $27,457 in 2018. These services consisted of: (i) review or preparation of U.S. federal, state, local and excise tax returns; (ii) U.S. federal, state and local tax planning, advice and assistance regarding statutory, regulatory or administrative developments; (iii) tax advice regarding tax qualification matters and/or treatment of various financial instruments held or proposed to be acquired or held, and (iv) determination of Passive Foreign Investment Companies. The aggregate fees billed in the Reporting Periods for Tax Services by the Auditor to Service Affiliates, which required pre-approval by the Audit Committee were $0 in 2017 and $0 in 2018.
(d) All Other Fees. The aggregate fees billed in the Reporting Periods for products and services provided by the Auditor, other than the services reported in paragraphs (a) through (c) of this Item, were $434 in 2017 and $316 in 2018. These services consisted of a review of the Registrant's anti-money laundering program.
The aggregate fees billed in the Reporting Periods for Non-Audit Services by the Auditor to Service Affiliates, other than the services reported in paragraphs (b) through (c) of this Item, which required pre-approval by the Audit Committee, were $0 in 2017 and $0 in 2018.
(e)(1) Audit Committee Pre-Approval Policies and Procedures. The Registrant's Audit Committee has established policies and procedures (the "Policy") for pre-approval (within specified fee limits) of the Auditor's engagements for non-audit services to the Registrant and Service Affiliates without specific case-by-case consideration. The pre-approved services in the Policy can include pre-approved audit services, pre-approved audit-related services, pre-approved tax services and pre-approved all other services. Pre-approval considerations include whether the proposed services are compatible with maintaining the Auditor's independence. Pre-approvals pursuant to the Policy are considered annually.
(e)(2) Note. None of the services described in paragraphs (b) through (d) of this Item 4 were approved by the Audit Committee pursuant to paragraph (c)(7)(i)(C) of Rule 2-01 of Regulation S-X.
(f) None of the hours expended on the principal accountant's engagement to audit the registrant's financial statements for the most recent fiscal year were attributed to work performed by persons other than the principal account's full-time, permanent employees.
Non-Audit Fees. The aggregate non-audit fees billed by the Auditor for services rendered to the Registrant, and rendered to Service Affiliates, for the Reporting Periods were $32,905,415 in 2017 and $30,820,284 in 2018.
Auditor Independence. The Registrant's Audit Committee has considered whether the provision of non-audit services that were rendered to Service Affiliates, which were not pre-approved (not requiring pre-approval), is compatible with maintaining the Auditor's independence.
Item 5. Audit Committee of Listed Registrants.
Not applicable.
Item 6. Investments.
(a) Not applicable.
Item 7. Disclosure of Proxy Voting Policies and Procedures for Closed-End Management Investment Companies.
Not applicable.
Item 8. Portfolio Managers of Closed-End Management Investment Companies.
Not applicable.
Item 9. Purchases of Equity Securities by Closed-End Management Investment Companies and Affiliated Purchasers.
Not applicable.
Item 10. Submission of Matters to a Vote of Security Holders.
There have been no material changes to the procedures applicable to Item 10.
Item 11. Controls and Procedures.
(a) The Registrant's principal executive and principal financial officers have concluded, based on their evaluation of the Registrant's disclosure controls and procedures as of a date within 90 days of the filing date of this report, that the Registrant's disclosure controls and procedures are reasonably designed to ensure that information required to be disclosed by the Registrant on Form N-CSR is recorded, processed, summarized and reported within the required time periods and that information required to be disclosed by the Registrant in the reports that it files or submits on Form N-CSR is accumulated and communicated to the Registrant's management, including its principal executive and principal financial officers, as appropriate to allow timely decisions regarding required disclosure.
(b) There were no changes to the Registrant's internal control over financial reporting that occurred during the second fiscal quarter of the period covered by this report that have materially affected, or are reasonably likely to materially affect, the Registrant's internal control over financial reporting.
Item 12. Disclosure of Securities Lending Activities for Closed-End Management Investment Companies.
Not applicable.
Item 13. Exhibits.
(a)(1) Code of ethics referred to in Item 2.
(a)(2) Certifications of principal executive and principal financial officers as required by Rule 30a-2(a) under the Investment Company Act of 1940.
(a)(3) Not applicable.
(b) Certification of principal executive and principal financial officers as required by Rule 30a-2(b) under the Investment Company Act of 1940.
SIGNATURES
Pursuant to the requirements of the Securities Exchange Act of 1934 and the Investment Company Act of 1940, the Registrant has duly caused this Report to be signed on its behalf by the undersigned, thereunto duly authorized.
Advantage Funds, Inc.
By: /s/ Bradley J. Skapyak
Bradley J. Skapyak
President
Date: January 2, 2019
Pursuant to the requirements of the Securities Exchange Act of 1934 and the Investment Company Act of 1940, this Report has been signed below by the following persons on behalf of the Registrant and in the capacities and on the dates indicated.
By: /s/ Bradley J. Skapyak
Bradley J. Skapyak
President
Date: January 2, 2019
By: /s/ James Windels
James Windels
Treasurer
Date: January 2, 2019
EXHIBIT INDEX
(a)(1) Code of ethics referred to in Item 2.
(a)(2) Certifications of principal executive and principal financial officers as required by Rule 30a-2(a) under the Investment Company Act of 1940. (EX-99.CERT)
(b) Certification of principal executive and principal financial officers as required by Rule 30a-2(b) under the Investment Company Act of 1940. (EX-99.906CERT)