UNITED STATES
SECURITIES AND EXCHANGE COMMISSION
Washington, D.C. 20549
FORM N-CSR
CERTIFIED SHAREHOLDER REPORT OF REGISTERED MANAGEMENT
INVESTMENT COMPANIES
Investment Company Act file number | 811-07123 | |||||
|
| |||||
| Advantage Funds, Inc. |
| ||||
| (Exact name of Registrant as specified in charter) |
| ||||
|
|
| ||||
|
c/o The Dreyfus Corporation 200 Park Avenue New York, New York 10166 |
| ||||
| (Address of principal executive offices) (Zip code) |
| ||||
|
|
| ||||
| Bennett A. MacDougall, Esq. 200 Park Avenue New York, New York 10166 |
| ||||
| (Name and address of agent for service) |
| ||||
| ||||||
Registrant's telephone number, including area code: | (212) 922-6400 | |||||
|
| |||||
Date of fiscal year end:
| 08/31 |
| ||||
Date of reporting period: | 08/31/18
|
| ||||
The following N-CSR relates only to the Registrant's series listed below and does not relate to any series of the Registrant with a different fiscal year end and, therefore, different N-CSR reporting requirements. A separate N-CSR will be filed for any series with a different fiscal year end, as appropriate.
Dreyfus Opportunistic Midcap Value Fund
Dreyfus Opportunistic Small Cap Fund
Dreyfus Strategic Value Fund
Dreyfus Structured Midcap Fund
Dreyfus Technology Growth Fund
FORM N-CSR
Item 1. Reports to Stockholders.
Dreyfus Opportunistic Midcap Value Fund
| ANNUAL REPORT |

|

Save time. Save paper. View your next shareholder report online as soon as it’s available. Log into www.dreyfus.com and sign up for Dreyfus eCommunications. It’s simple and only takes a few minutes. |
The views expressed in this report reflect those of the portfolio manager(s) only through the end of the period covered and do not necessarily represent the views of Dreyfus or any other person in the Dreyfus organization. Any such views are subject to change at any time based upon market or other conditions and Dreyfus disclaims any responsibility to update such views. These views may not be relied on as investment advice and, because investment decisions for a Dreyfus fund are based on numerous factors, may not be relied on as an indication of trading intent on behalf of any Dreyfus fund. |
Not FDIC-Insured • Not Bank-Guaranteed • May Lose Value |
Contents
THE FUND
With Those of Other Funds | |
in Affiliated Issuers | |
Public Accounting Firm | |
FOR MORE INFORMATION
Back Cover
| The Fund |
A LETTER FROM THE PRESIDENT OF DREYFUS
Dear Shareholder:
We are pleased to present this annual report for Dreyfus Opportunistic Midcap Value Fund, covering the 12-month period from September 1, 2017 through August 31, 2018. For information about how the fund performed during the reporting period, as well as general market perspectives, we provide a Discussion of Fund Performance on the pages that follow.
The 12-month period started on solid footing which gave way to a shifting landscape. Through February of 2018, major global economies appeared to be in lock-step as they moved towards less accommodative monetary policy and concurrent growth. In the equity markets, both U.S. and non-U.S. markets enjoyed an upward trek across sectors and market caps. Interest rates rose across the curve putting pressure on bond prices, but sectors such as investment grade and high yield corporates, non-U.S. dollar denominated bonds and emerging market debt, were able to outperform like-duration U.S. Treasuries.
In February, the first rumblings of discontent shook equity markets. Global growth and monetary policy paths began to diverge. Non-U.S. economies weakened. Momentum sputtered, and equities began to struggle. Emerging market debt, non-U.S. denominated bonds and corporate debt gave up much of the performance earned earlier in the period. Long-term U.S. interest rates started to fall. The shockwave ended in April and pressure on U.S. equity markets eased, allowing U.S. equity markets to end the 12-month period with double-digit gains.
Despite new concerns regarding trade, U.S. inflationary pressures and global growth, we are optimistic that U.S. consumer spending, corporate earnings, and economic data will remain strong in the near term. However, we will stay attentive to signs that might signal possible changes on the horizon. As always, we encourage you to discuss the risks and opportunities of today’s investment environment with your financial advisor.
Thank you for your continued confidence and support.
Sincerely,

Renee Laroche-Morris
President
The Dreyfus Corporation
September 17, 2018
2
DISCUSSION OF FUND PERFORMANCE (Unaudited)
For the period from September 1, 2017 through August 31, 2018, as provided by David A. Daglio, lead portfolio manager, James Boyd, Brian R. Duncan, and Dale Dutile, portfolio managers
Market and Fund Performance Overview
For the 12-month period ended August 31, 2018, Dreyfus Opportunistic Midcap Value Fund’s Class A shares produced a total return of 16.44%, Class C shares returned 15.55%, Class I shares returned 16.74%, and Class Y shares returned 16.84%.1 In comparison, the fund’s benchmark, the Russell Midcap® Value Index (the “Index”), produced a 12.67% total return for the same period.2
Mid-cap stocks continued to gain ground over the reporting period amid rising corporate earnings, improved economic conditions, and ongoing tailwinds from business-friendly tax reform legislation. Small- and mid-cap companies benefited disproportionately from tax reform, as they earn 85%-90% of their profits domestically. The fund produced higher returns than the Index, mainly due to the success of our security selection strategy in the information technology and financials sectors.
The Fund’s Investment Approach
The fund seeks to surpass the performance of the Index. Effective January 12, 2018, the fund normally invests at least 80% of its net assets, plus any borrowings for investment purposes, in equity securities of mid-cap companies. The fund currently considers mid-cap companies to be those with market capitalizations, at the time of purchase, within the market capitalization range of companies comprising the Index.
The fund’s portfolio managers identify potential investments through extensive fundamental and quantitative research. The fund focuses on individual stock selection (a “bottom-up” approach), emphasizing three key factors: relative value, business health, and business momentum.
The fund’s portfolio managers use an opportunistic value approach to identify stocks whose current market prices trade at a large discount to their intrinsic value, as calculated by the portfolio managers. Intrinsic value is based on the combination of the valuation assessment of the company's operating divisions with its economic balance sheet. The opportunistic value style attempts to benefit from valuation inefficiencies and underappreciated fundamental prospects present in the marketplace. The portfolio managers use mid-cycle estimates, growth prospects, the identification of a revaluation catalyst, and competitive advantages as some of the factors in the valuation assessment. Additionally, a company's stated and hidden liabilities and assets are included in the portfolio managers’ economic balance sheet calculation for the company.
Healthy Corporate Earnings Supported Markets
Equities across all capitalization ranges continued to benefit from an improving economic environment, strengthening labor markets, and corporate earnings growth assisted by the corporate tax cut, helping to drive the Index to new highs in January. While trade tensions continued to cause some concern, some progress on this front eased worries during the reporting period.
The market’s advance also was supported by a well-telegraphed implementation of monetary policy. Although rising interest rates historically have tended to undermine investor sentiment toward stocks, the Federal Reserve Board’s gradual approach to a less accommodative monetary policy was received calmly by investors, who focused more on improving business conditions and
3
DISCUSSION OF FUND PERFORMANCE (Unaudited) (continued)
corporate earnings growth. However, mid-cap stocks generally trailed their large-cap counterparts, and growth stocks outperformed value stocks.
Security Selections Enhanced Performance
The fund participated fully in the Index’s gains over the reporting period, supported by our security selection and asset allocation strategies across several market segments. Underweighted exposure to the struggling utilities sector enhanced relative performance, as did our security selection strategy in the information technology and financials sectors. In information technology, the semiconductor industry performed particularly well, with Advanced Micro Devices gaining on improved market share and margins. In the payment processing industry, First Data advanced on the introduction of new products designed to compete with a leading rival, Square. In the software industry, cybersecurity company Fortinet performed well, as it reported gains in new market segments. In the financials sector, online brokerage firms E*Trade Financial and TD Ameritrade Holdings benefited from expanded market share and from higher interest rates on their large cash positions. Silicon Valley-based SVB Financial Group reported growth in its venture capital business while SLM, a leader in student loans, capitalized on a growing need to finance education.
Disappointment proved relatively mild during the reporting period. Overweights to the industrials and materials sectors detracted from performance. In materials, metal prices declined on fears of slowing China economic growth, hurting companies such as Freeport-McMoRan, which detracted from performance.
Finding Opportunities Amid Slowing Profit Growth
We have continued to identify what we believe to be attractive mid-cap value investment opportunities in an environment of positive economic growth, and we expect that the tax cut will continue to provide a stimulus. However, we anticipate that profit growth may slow in 2019. In addition, we have reduced our exposure to financials and information technology, as stocks appreciated to our intrinsic value price targets. As of the reporting period’s end, we have identified a number of companies meeting our investment criteria in the health care, energy, consumer discretionary, and industrials sectors. We believe that emerging markets represent a possible source of risk, and we are monitoring this situation for possible contagion.
September 17, 2018
1 Total return includes reinvestment of dividends and any capital gains paid, and does not take into consideration the maximum initial sales charge in the case of Class A shares, or the applicable contingent deferred sales charge imposed on redemptions in the case of Class C shares. Had these charges been reflected, returns would have been lower. Past performance is no guarantee of future results. Share price and investment return fluctuate such that upon redemption, fund shares may be worth more or less than their original cost.
2 Source: Lipper Inc. — The Russell Midcap® Value Index measures the performance of the mid-cap value segment of the U.S. equity universe. It includes those Russell Midcap® Index companies that are considered more value-oriented relative to the overall market as defined by Russell’s leading style methodology. The Index is constructed to provide a comprehensive and unbiased barometer of the mid-cap value market. The Index is completely reconstituted annually to ensure larger stocks do not distort the performance and characteristics of the true mid-cap value market. Investors cannot invest directly in any index.
Please note: the position in any security highlighted with italicized typeface was sold during the reporting period.
Equities are subject generally to market, market sector, market liquidity, issuer, and investment style risks, among other factors, to varying degrees, all of which are more fully described in the fund’s prospectus.
Stocks of small- and/or mid-cap companies often experience sharper price fluctuations than stocks of large-cap companies.
4
FUND PERFORMANCE (Unaudited)

Comparison of change in value of $10,000 investment in Dreyfus Opportunistic Midcap Value Fund Class A shares, Class C shares, Class I shares and Class Y shares and the Russell Midcap® Value Index (the “Index”)
† Source: Lipper Inc.
†† The total return figures presented for Class Y shares of the fund reflect the performance of the fund’s Class A shares for the period prior to 7/1/13 (the inception date for Class Y shares), not reflecting the applicable sales charges for Class A shares.
Past performance is not predictive of future performance.
The above graph compares a $10,000 investment made in each of the Class A, Class C, Class I and Class Y shares of Dreyfus Opportunistic Midcap Value Fund on 8/31/08 to a $10,000 investment made in the Index on that date. All dividends and capital gain distributions are reinvested.
The fund’s performance shown in the line graph above takes into account the maximum initial sales charge on Class A shares and all other applicable fees and expenses on all classes. The Index measures the performance of the mid-cap value segment of the U.S. equity universe. It includes those Russell Midcap® Index companies that are considered more value-oriented relative to the overall market as defined by Russell’s leading style methodology. The Index is constructed to provide a comprehensive and unbiased barometer of the mid-cap value market. The Index is completely reconstituted annually to ensure larger stocks do not distort the performance and characteristics of the true mid-cap value market. Unlike a mutual fund, the Index is not subject to charges, fees and other expenses. Investors cannot invest directly in any index. Further information relating to fund performance, including expense reimbursements, if applicable, is contained in the Financial Highlights section of the prospectus and elsewhere in this report.
5
FUND PERFORMANCE (Unaudited) (continued)
Average Annual Total Returns as of 8/31/18 | |||||||
|
| Inception Date | 1 Year | 5 Years | 10 Years | ||
Class A shares | |||||||
with maximum sales charge (5.75%) | 9/29/95 | 9.73% | 9.06% | 10.65% | |||
without sales charge | 9/29/95 | 16.44% | 10.36% | 11.30% | |||
Class C shares | |||||||
with applicable redemption charge † | 5/30/08 | 14.55% | 9.54% | 10.44% | |||
without redemption | 5/30/08 | 15.55% | 9.54% | 10.44% | |||
Class I shares | 5/30/08 | 16.74% | 10.67% | 11.58% | |||
Class Y shares | 7/1/13 | 16.84% | 10.83% | 11.50%†† | |||
Russell Midcap® Value Index | 12.67% | 11.81% | 10.33% | ||||
† The maximum contingent deferred sales charge for Class C shares is 1% for shares redeemed within one year of the date of purchase.
†† The total return performance figures presented for Class Y shares of the fund reflect the performance of the fund’s Class A shares for the period prior to 7/1/13 (the inception date for Class Y shares), not reflecting the applicable sales charges for Class A shares.
The performance data quoted represents past performance, which is no guarantee of future results. Share price and investment return fluctuate and an investor’s shares may be worth more or less than original cost upon redemption. Current performance may be lower or higher than the performance quoted. Go to Dreyfus.com for the fund’s most recent month-end returns.
The fund’s performance shown in the graph and table does not reflect the deduction of taxes that a shareholder would pay on fund distributions or the redemption of fund shares. In addition to the performance of Class A shares shown with and without a maximum sales charge, the fund’s performance shown in the table takes into account all other applicable fees and expenses on all classes.
6
UNDERSTANDING YOUR FUND’S EXPENSES (Unaudited)
As a mutual fund investor, you pay ongoing expenses, such as management fees and other expenses. Using the information below, you can estimate how these expenses affect your investment and compare them with the expenses of other funds. You also may pay one-time transaction expenses, including sales charges (loads) and redemption fees, which are not shown in this section and would have resulted in higher total expenses. For more information, see your fund’s prospectus or talk to your financial adviser.
Review your fund’s expenses
The table below shows the expenses you would have paid on a $1,000 investment in Dreyfus Opportunistic Midcap Value Fund from March 1, 2018 to August 31, 2018. It also shows how much a $1,000 investment would be worth at the close of the period, assuming actual returns and expenses.
Expenses and Value of a $1,000 Investment | |||||||||||
assuming actual returns for the six months ended August 31, 2018 | |||||||||||
|
|
|
| Class A | Class C | Class I | Class Y | ||||
Expenses paid per $1,000† |
| $6.02 | $9.80 | $4.62 | $4.11 | ||||||
Ending value (after expenses) |
| $1,060.30 | $1,056.30 | $1,061.60 | $1,062.10 | ||||||
COMPARING YOUR FUND’S EXPENSES
WITH THOSE OF OTHER FUNDS (Unaudited)
Using the SEC’s method to compare expenses
The Securities and Exchange Commission (“SEC”) has established guidelines to help investors assess fund expenses. Per these guidelines, the table below shows your fund’s expenses based on a $1,000 investment, assuming a hypothetical 5% annualized return. You can use this information to compare the ongoing expenses (but not transaction expenses or total cost) of investing in the fund with those of other funds. All mutual fund shareholder reports will provide this information to help you make this comparison. Please note that you cannot use this information to estimate your actual ending account balance and expenses paid during the period.
Expenses and Value of a $1,000 Investment | |||||||||||
assuming a hypothetical 5% annualized return for the six months ended August 31, 2018 | |||||||||||
|
|
|
| Class A | Class C | Class I | Class Y | ||||
Expenses paid per $1,000† | $5.90 | $9.60 | $4.53 | $4.02 | |||||||
Ending value (after expenses) | $1,019.36 | $1,015.68 | $1,020.72 | $1,021.22 | |||||||
† Expenses are equal to the fund’s annualized expense ratio of 1.16% for Class A, 1.89% for Class C, .89% for Class I and .79% for Class Y, multiplied by the average account value over the period, multiplied by 184/365 (to reflect the one-half year period).
7
STATEMENT OF INVESTMENTS
August 31, 2018
Description | Shares | Value ($) | |||||
Common Stocks - 98.3% | |||||||
Automobiles & Components - 1.0% | |||||||
Visteon | 94,679 | a,b | 10,451,615 | ||||
Banks - 5.3% | |||||||
East West Bancorp | 406,559 | 25,771,775 | |||||
KeyCorp | 263,933 | 5,561,068 | |||||
SVB Financial Group | 75,457 | b | 24,353,747 | ||||
55,686,590 | |||||||
Capital Goods - 2.6% | |||||||
Fluor | 474,360 | 27,233,008 | |||||
Commercial & Professional Services - 2.5% | |||||||
Nielsen Holdings | 1,024,627 | a | 26,640,302 | ||||
Consumer Durables & Apparel - 4.1% | |||||||
Newell Brands | 890,749 | a | 19,347,068 | ||||
Skechers USA, Cl. A | 822,418 | a,b | 24,244,883 | ||||
43,591,951 | |||||||
Consumer Services - 2.0% | |||||||
Norwegian Cruise Line Holdings | 399,372 | b | 21,410,333 | ||||
Diversified Financials - 9.9% | |||||||
Ally Financial | 654,292 | 17,587,369 | |||||
E*TRADE Financial | 423,335 | b | 24,917,498 | ||||
Eaton Vance | 286,916 | 15,129,081 | |||||
Jefferies Financial Group | 1,338,868 | 31,088,515 | |||||
SLM | 1,373,726 | b | 16,100,069 | ||||
104,822,532 | |||||||
Energy - 10.3% | |||||||
Cabot Oil & Gas | 1,349,711 | 32,163,613 | |||||
Cheniere Energy | 277,471 | b | 18,571,134 | ||||
Parsley Energy, Cl. A | 694,419 | b | 19,284,016 | ||||
Pioneer Natural Resources | 82,806 | 14,466,208 | |||||
Valero Energy | 208,339 | 24,559,001 | |||||
109,043,972 | |||||||
Food & Staples Retailing - 1.0% | |||||||
US Foods Holding | 314,083 | b | 10,235,965 | ||||
Food, Beverage & Tobacco - 3.4% | |||||||
Archer-Daniels-Midland | 665,498 | 33,541,099 | |||||
Ingredion | 25,031 | 2,529,883 | |||||
36,070,982 | |||||||
Health Care Equipment & Services - 4.3% | |||||||
Boston Scientific | 622,993 | b | 22,153,631 | ||||
Zimmer Biomet Holdings | 192,282 | 23,771,824 | |||||
45,925,455 | |||||||
8
Description | Shares | Value ($) | |||||
Common Stocks - 98.3% (continued) | |||||||
Materials - 9.7% | |||||||
Eagle Materials | 183,645 | 16,955,943 | |||||
Freeport-McMoRan | 1,783,362 | 25,056,236 | |||||
Huntsman | 768,813 | 23,441,108 | |||||
Newmont Mining | 462,736 | 14,358,698 | |||||
Westlake Chemical | 236,921 | 22,405,619 | |||||
102,217,604 | |||||||
Media - 1.6% | |||||||
Altice USA | 604,087 | 10,825,239 | |||||
Sinclair Broadcast Group, Cl. A | 198,848 | 5,756,650 | |||||
16,581,889 | |||||||
Pharmaceuticals Biotechnology & Life Sciences - 12.4% | |||||||
Alexion Pharmaceuticals | 207,148 | b | 25,321,771 | ||||
Jazz Pharmaceuticals | 142,311 | b | 24,323,796 | ||||
Mylan | 854,272 | b | 33,427,663 | ||||
PRA Health Sciences | 274,817 | b | 29,020,675 | ||||
Sage Therapeutics | 114,020 | a,b | 18,728,925 | ||||
130,822,830 | |||||||
Semiconductors & Semiconductor Equipment - 6.3% | |||||||
Advanced Micro Devices | 1,582,362 | a,b | 39,828,052 | ||||
Maxim Integrated Products | 281,159 | 17,001,685 | |||||
Teradyne | 242,541 | 9,990,264 | |||||
66,820,001 | |||||||
Software & Services - 10.1% | |||||||
Activision Blizzard | 273,288 | 19,704,065 | |||||
DXC Technology | 156,074 | 14,216,781 | |||||
First Data, Cl. A | 1,761,416 | b | 45,303,619 | ||||
Nuance Communications | 639,879 | a,b | 10,442,825 | ||||
Teradata | 398,507 | a,b | 16,526,085 | ||||
106,193,375 | |||||||
Technology Hardware & Equipment - 3.4% | |||||||
Keysight Technologies | 292,539 | b | 18,982,856 | ||||
Viavi Solutions | 232,938 | b | 2,608,906 | ||||
Xerox | 521,882 | 14,539,632 | |||||
36,131,394 | |||||||
Transportation - 6.1% | |||||||
J.B. Hunt Transport Services | 111,388 | 13,450,101 | |||||
Knight-Swift Transportation Holdings | 462,602 | a | 15,788,606 | ||||
Southwest Airlines | 579,050 | 35,495,765 | |||||
64,734,472 | |||||||
Utilities - 2.3% | |||||||
American Electric Power | 150,109 | 10,767,319 | |||||
9
STATEMENT OF INVESTMENTS (continued)
Description | Shares | Value ($) | |||||
Common Stocks - 98.3% (continued) | |||||||
Utilities - 2.3% (continued) | |||||||
Edison International | 208,061 | 13,675,850 | |||||
24,443,169 | |||||||
Total Common Stocks (cost $903,609,083) | 1,039,057,439 | ||||||
7-Day | |||||||
Investment Companies - 1.4% | |||||||
Registered Investment Companies - 1.4% | |||||||
Dreyfus Institutional Preferred Government Plus Money Market Fund | 1.91 | 14,732,681 | c | 14,732,681 | |||
Total Investments (cost $918,341,764) | 99.7% | 1,053,790,120 | |||||
Cash and Receivables (Net) | .3% | 3,424,010 | |||||
Net Assets | 100.0% | 1,057,214,130 | |||||
a Security, or portion thereof, on loan. At August 31, 2018, the value of the fund’s securities on loan was $137,918,732 and the value of the collateral held by the fund was $140,255,972, consisting of U.S. Government & Agency securities.
b Non-income producing security.
c Investment in affiliated issuer. The investment objective of this investment company is publicly available and can be found within the respective investment company’s prospectus.
Portfolio Summary (Unaudited) † | Value (%) |
Information Technology | 19.8 |
Financials | 15.2 |
Health Care | 14.3 |
Industrials | 11.2 |
Energy | 10.3 |
Materials | 9.7 |
Consumer Discretionary | 8.7 |
Consumer, Non-cyclical | 5.6 |
Utilities | 2.3 |
Investment Companies | 1.4 |
Consumer Staples | 1.2 |
99.7 |
† Based on net assets.
See notes to financial statements.
10
STATEMENT OF INVESTMENTS IN AFFILIATED ISSUERS
Registered Investment Companies | Value | Purchases ($) | Sales ($) | Value | Net | Dividends/ |
Dreyfus Institutional Preferred Government Plus Money Market Fund | 2,081,600 | 334,207,289 | 321,556,208 | 14,732,681 | 1.4 | 105,483 |
Dreyfus Institutional Preferred Government Money Market Fund, Institutional Shares | - | 293,203,672 | 293,203,672 | - | - | - |
Total | 2,081,600 | 627,410,961 | 614,759,880 | 14,732,681 | 1.4 | 105,483 |
See notes to financial statements.
11
STATEMENT OF ASSETS AND LIABILITIES
August 31, 2018
|
|
|
|
|
|
|
|
|
| Cost |
| Value |
|
Assets ($): |
|
|
|
| ||
Investments in securities—See Statement of Investments |
|
|
| |||
Unaffiliated issuers | 903,609,083 |
| 1,039,057,439 |
| ||
Affiliated issuers |
| 14,732,681 |
| 14,732,681 |
| |
Receivable for investment securities sold |
| 4,830,014 |
| |||
Dividends and securities lending income receivable |
| 1,499,268 |
| |||
Receivable for shares of Common Stock subscribed |
| 683,588 |
| |||
Prepaid expenses |
|
|
|
| 62,373 |
|
|
|
|
|
| 1,060,865,363 |
|
Liabilities ($): |
|
|
|
| ||
Due to The Dreyfus Corporation and affiliates—Note 3(c) |
|
|
| 859,142 |
| |
Payable for investment securities purchased |
| 1,399,190 |
| |||
Payable for shares of Common Stock redeemed |
| 1,025,802 |
| |||
Directors fees and expenses payable |
| 12,597 |
| |||
Interest payable—Note 2 |
| 164 |
| |||
Accrued expenses |
|
|
|
| 354,338 |
|
|
|
|
|
| 3,651,233 |
|
Net Assets ($) |
|
| 1,057,214,130 |
| ||
Composition of Net Assets ($): |
|
|
|
| ||
Paid-in capital |
|
|
|
| 767,092,338 |
|
Accumulated undistributed investment income—net |
| 70,644 |
| |||
Accumulated net realized gain (loss) on investments |
|
|
|
| 154,602,792 |
|
Accumulated net unrealized appreciation (depreciation) |
| 135,448,356 |
| |||
Net Assets ($) |
|
| 1,057,214,130 |
| ||
Net Asset Value Per Share | Class A | Class C | Class I | Class Y |
|
Net Assets ($) | 484,168,833 | 50,209,581 | 507,297,792 | 15,537,924 |
|
Shares Outstanding | 13,708,263 | 1,630,233 | 14,437,738 | 441,172 |
|
Net Asset Value Per Share ($) | 35.32 | 30.80 | 35.14 | 35.22 |
|
See notes to financial statements. |
12
STATEMENT OF OPERATIONS
Year Ended August 31, 2018
|
|
|
|
|
|
|
|
|
|
|
|
|
|
Investment Income ($): |
|
|
|
| ||
Income: |
|
|
|
| ||
Cash dividends: |
| |||||
Unaffiliated issuers |
|
| 11,422,321 |
| ||
Affiliated issuers |
|
| 105,483 |
| ||
Income from securities lending—Note 1(b) |
|
| 100,829 |
| ||
Total Income |
|
| 11,628,633 |
| ||
Expenses: |
|
|
|
| ||
Management fee—Note 3(a) |
|
| 8,090,272 |
| ||
Shareholder servicing costs—Note 3(c) |
|
| 2,588,270 |
| ||
Distribution fees—Note 3(b) |
|
| 421,610 |
| ||
Professional fees |
|
| 86,155 |
| ||
Directors’ fees and expenses—Note 3(d) |
|
| 77,925 |
| ||
Registration fees |
|
| 74,833 |
| ||
Prospectus and shareholders’ reports |
|
| 62,291 |
| ||
Custodian fees—Note 3(c) |
|
| 38,096 |
| ||
Loan commitment fees—Note 2 |
|
| 23,856 |
| ||
Interest expense—Note 2 |
|
| 844 |
| ||
Miscellaneous |
|
| 40,849 |
| ||
Total Expenses |
|
| 11,505,001 |
| ||
Less—reduction in fees due to earnings credits—Note 3(c) |
|
| (1,534) |
| ||
Net Expenses |
|
| 11,503,467 |
| ||
Investment Income—Net |
|
| 125,166 |
| ||
Realized and Unrealized Gain (Loss) on Investments—Note 4 ($): |
|
| ||||
Net realized gain (loss) on investments | 197,859,216 |
| ||||
Net unrealized appreciation (depreciation) on investments |
|
| (31,129,848) |
| ||
Net Realized and Unrealized Gain (Loss) on Investments |
|
| 166,729,368 |
| ||
Net Increase in Net Assets Resulting from Operations |
| 166,854,534 |
| |||
See notes to financial statements. | ||||||
13
STATEMENT OF CHANGES IN NET ASSETS
|
|
|
| Year Ended August 31, | |||||
|
|
|
| 2018 |
| 2017 |
| ||
Operations ($): |
|
|
|
|
|
|
|
| |
Investment income—net |
|
| 125,166 |
|
|
| 2,218,030 |
| |
Net realized gain (loss) on investments |
| 197,859,216 |
|
|
| 135,298,858 |
| ||
Net unrealized appreciation (depreciation) |
| (31,129,848) |
|
|
| 31,898,736 |
| ||
Net Increase (Decrease) in Net Assets | 166,854,534 |
|
|
| 169,415,624 |
| |||
Distributions to Shareholders from ($): |
| ||||||||
Investment income—net: |
|
|
|
|
|
|
|
| |
Class A |
|
| - |
|
|
| (150,447) |
| |
Class I |
|
| (2,056,470) |
|
|
| (1,718,638) |
| |
Class Y |
|
| (63,829) |
|
|
| (41,145) |
| |
Net realized gain on investments: |
|
|
|
|
|
|
|
| |
Class A |
|
| (61,344,461) |
|
|
| (34,720,829) |
| |
Class C |
|
| (8,165,849) |
|
|
| (3,672,816) |
| |
Class I |
|
| (61,702,573) |
|
|
| (21,342,132) |
| |
Class Y |
|
| (1,568,682) |
|
|
| (376,578) |
| |
Total Distributions |
|
| (134,901,864) |
|
|
| (62,022,585) |
| |
Capital Stock Transactions ($): |
| ||||||||
Net proceeds from shares sold: |
|
|
|
|
|
|
|
| |
Class A |
|
| 46,347,977 |
|
|
| 75,094,482 |
| |
Class C |
|
| 5,109,170 |
|
|
| 6,613,135 |
| |
Class I |
|
| 97,483,340 |
|
|
| 284,476,355 |
| |
Class Y |
|
| 7,988,741 |
|
|
| 6,198,203 |
| |
Distributions reinvested: |
|
|
|
|
|
|
|
| |
Class A |
|
| 55,122,682 |
|
|
| 32,052,598 |
| |
Class C |
|
| 7,103,712 |
|
|
| 3,049,663 |
| |
Class I |
|
| 61,433,975 |
|
|
| 22,018,042 |
| |
Class Y |
|
| 1,270,067 |
|
|
| 312,777 |
| |
Cost of shares redeemed: |
|
|
|
|
|
|
|
| |
Class A |
|
| (143,015,105) |
|
|
| (452,533,679) |
| |
Class C |
|
| (24,872,704) |
|
|
| (28,803,314) |
| |
Class I |
|
| (168,762,845) |
|
|
| (340,780,615) |
| |
Class Y |
|
| (3,274,603) |
|
|
| (15,338,617) |
| |
Increase (Decrease) in Net Assets | (58,065,593) |
|
|
| (407,640,970) |
| |||
Total Increase (Decrease) in Net Assets | (26,112,923) |
|
|
| (300,247,931) |
| |||
Net Assets ($): |
| ||||||||
Beginning of Period |
|
| 1,083,327,053 |
|
|
| 1,383,574,984 |
| |
End of Period |
|
| 1,057,214,130 |
|
|
| 1,083,327,053 |
| |
Undistributed investment income—net | 70,644 |
|
|
| 2,115,370 |
| |||
14
|
|
|
| Year Ended August 31, | |||||
|
|
|
| 2018 |
| 2017 |
| ||
Capital Share Transactions (Shares): |
| ||||||||
Class Aa |
|
|
|
|
|
|
|
| |
Shares sold |
|
| 1,352,924 |
|
|
| 2,248,398 |
| |
Shares issued for distributions reinvested |
|
| 1,676,481 |
|
|
| 966,313 |
| |
Shares redeemed |
|
| (4,152,303) |
|
|
| (13,502,201) |
| |
Net Increase (Decrease) in Shares Outstanding | (1,122,898) |
|
|
| (10,287,490) |
| |||
Class Ca,b |
|
|
|
|
|
|
|
| |
Shares sold |
|
| 169,785 |
|
|
| 218,979 |
| |
Shares issued for distributions reinvested |
|
| 246,485 |
|
|
| 102,372 |
| |
Shares redeemed |
|
| (825,487) |
|
|
| (963,162) |
| |
Net Increase (Decrease) in Shares Outstanding | (409,217) |
|
|
| (641,811) |
| |||
Class Ib |
|
|
|
|
|
|
|
| |
Shares sold |
|
| 2,848,509 |
|
|
| 8,483,733 |
| |
Shares issued for distributions reinvested |
|
| 1,881,592 |
|
|
| 667,011 |
| |
Shares redeemed |
|
| (4,937,020) |
|
|
| (10,075,991) |
| |
Net Increase (Decrease) in Shares Outstanding | (206,919) |
|
|
| (925,247) |
| |||
Class Y |
|
|
|
|
|
|
|
| |
Shares sold |
|
| 230,669 |
|
|
| 186,843 |
| |
Shares issued for distributions reinvested |
|
| 38,840 |
|
|
| 9,464 |
| |
Shares redeemed |
|
| (94,414) |
|
|
| (475,970) |
| |
Net Increase (Decrease) in Shares Outstanding | 175,095 |
|
|
| (279,663) |
| |||
aDuring the period ended August 31, 2018, 8,403 Class C shares representing $242,093 were automatically converted to 7,367 Class A shares. | |||||||||
bDuring the period ended August 31, 2017, 348 Class C shares representing $10,555 were exchanged for 313 Class I shares. | |||||||||
See notes to financial statements. | |||||||||
15
FINANCIAL HIGHLIGHTS
The following tables describe the performance for each share class for the fiscal periods indicated. All information (except portfolio turnover rate) reflects financial results for a single fund share. Total return shows how much your investment in the fund would have increased (or decreased) during each period, assuming you had reinvested all dividends and distributions. These figures have been derived from the fund’s financial statements.
Year Ended August 31, | |||||||||||
Class A Shares | 2018 | 2017 | 2016 | 2015 | 2014 | ||||||
Per Share Data ($): | |||||||||||
Net asset value, beginning of period | 34.37 | 31.72 | 36.97 | 43.17 | 38.27 | ||||||
Investment Operations: | |||||||||||
Investment income (loss)—net a | (.03) | .03 | .03 | (.02) | .05 | ||||||
Net realized and unrealized gain | 5.35 | 4.13 | .82 | (1.79) | 9.10 | ||||||
Total from Investment Operations | 5.32 | 4.16 | .85 | (1.81) | 9.15 | ||||||
Distributions: | |||||||||||
Dividends from investment | - | (.01) | - | (.05) | - | ||||||
Dividends from net realized gain | (4.37) | (1.50) | (6.10) | (4.34) | (4.25) | ||||||
Total Distributions | (4.37) | (1.51) | (6.10) | (4.39) | (4.25) | ||||||
Net asset value, end of period | 35.32 | 34.37 | 31.72 | 36.97 | 43.17 | ||||||
Total Return (%)b | 16.44 | 13.28 | 3.95 | (4.72) | 25.32 | ||||||
Ratios/Supplemental Data (%): | |||||||||||
Ratio of total expenses to | 1.16 | 1.17 | 1.21 | 1.18 | 1.15 | ||||||
Ratio of net expenses to | 1.16 | 1.17 | 1.21 | 1.18 | 1.15 | ||||||
Ratio of net investment income | (.08) | .10 | .11 | (.05) | .12 | ||||||
Portfolio Turnover Rate | 100.55 | 104.51 | 101.68 | 74.05 | 67.49 | ||||||
Net Assets, end of period ($ x 1,000) | 484,169 | 509,761 | 796,686 | 1,071,713 | 1,417,535 | ||||||
a Based on average shares outstanding.
b Exclusive of sales charge.
See notes to financial statements.
16
Year Ended August 31, | ||||||||||
Class C Shares | 2018 | 2017 | 2016 | 2015 | 2014 | |||||
Per Share Data ($): | ||||||||||
Net asset value, beginning of period | 30.70 | 28.68 | 34.26 | 40.55 | 36.44 | |||||
Investment Operations: | ||||||||||
Investment (loss)—net a | (.25) | (.19) | (.18) | (.29) | (.26) | |||||
Net realized and unrealized gain | 4.72 | 3.71 | .70 | (1.66) | 8.62 | |||||
Total from Investment Operations | 4.47 | 3.52 | .52 | (1.95) | 8.36 | |||||
Distributions: | ||||||||||
Dividends from net realized gain | (4.37) | (1.50) | (6.10) | (4.34) | (4.25) | |||||
Net asset value, end of period | 30.80 | 30.70 | 28.68 | 34.26 | 40.55 | |||||
Total Return (%)b | 15.55 | 12.44 | 3.19 | (5.41) | 24.35 | |||||
Ratios/Supplemental Data (%): | ||||||||||
Ratio of total expenses to | 1.91 | 1.92 | 1.94 | 1.90 | 1.92 | |||||
Ratio of net expenses to | 1.91 | 1.92 | 1.94 | 1.90 | 1.92 | |||||
Ratio of net investment (loss) | (.84) | (.65) | (.62) | (.77) | (.66) | |||||
Portfolio Turnover Rate | 100.55 | 104.51 | 101.68 | 74.05 | 67.49 | |||||
Net Assets, end of period ($ x 1,000) | 50,210 | 62,608 | 76,886 | 116,683 | 114,179 | |||||
a Based on average shares outstanding.
b Exclusive of sales charge.
See notes to financial statements.
17
FINANCIAL HIGHLIGHTS (continued)
Year Ended August 31, | ||||||||||
Class I Shares | 2018 | 2017 | 2016 | 2015 | 2014 | |||||
Per Share Data ($): | ||||||||||
Net asset value, beginning of period | 34.27 | 31.64 | 36.83 | 43.01 | 38.12 | |||||
Investment Operations: | ||||||||||
Investment income—neta | .07 | .14 | .12 | .09 | .15 | |||||
Net realized and unrealized gain | 5.32 | 4.11 | .81 | (1.78) | 9.07 | |||||
Total from Investment Operations | 5.39 | 4.25 | .93 | (1.69) | 9.22 | |||||
Distributions: | ||||||||||
Dividends from investment | (.15) | (.12) | (.02) | (.15) | (.08) | |||||
Dividends from net realized gain | (4.37) | (1.50) | (6.10) | (4.34) | (4.25) | |||||
Total Distributions | (4.52) | (1.62) | (6.12) | (4.49) | (4.33) | |||||
Net asset value, end of period | 35.14 | 34.27 | 31.64 | 36.83 | 43.01 | |||||
Total Return (%) | 16.74 | 13.63 | 4.23 | (4.43) | 25.62 | |||||
Ratios/Supplemental Data (%): | ||||||||||
Ratio of total expenses to | .89 | .90 | .90 | .89 | .90 | |||||
Ratio of net expenses to | .89 | .90 | .90 | .89 | .90 | |||||
Ratio of net investment income | .19 | .42 | .39 | .22 | .37 | |||||
Portfolio Turnover Rate | 100.55 | 104.51 | 101.68 | 74.05 | 67.49 | |||||
Net Assets, end of period ($ x 1,000) | 507,298 | 501,821 | 492,694 | 913,852 | 1,282,578 | |||||
a Based on average shares outstanding.
See notes to financial statements.
18
Year Ended August 31, | ||||||||||||
Class Y Shares | 2018 | 2017 | 2016 | 2015 | 2014 | |||||||
Per Share Data ($): | ||||||||||||
Net asset value, beginning of period | 34.34 | 31.72 | 36.93 | 43.12 | 38.12 | |||||||
Investment Operations: | ||||||||||||
Investment income—neta | .10 | .15 | .16 | .13 | .19 | |||||||
Net realized and unrealized gain | 5.33 | 4.13 | .83 | (1.78) | 9.17 | |||||||
Total from Investment Operations | 5.43 | 4.28 | .99 | (1.65) | 9.36 | |||||||
Distributions: | ||||||||||||
Dividends from investment | (.18) | (.16) | (.10) | (.20) | (.11) | |||||||
Dividends from net realized gain | (4.37) | (1.50) | (6.10) | (4.34) | (4.25) | |||||||
Total Distributions | (4.55) | (1.66) | (6.20) | (4.54) | (4.36) | |||||||
Net asset value, end of period | 35.22 | 34.34 | 31.72 | 36.93 | 43.12 | |||||||
Total Return (%) | 16.84 | 13.71 | 4.40 | (4.34) | 26.02 | |||||||
Ratios/Supplemental Data (%): | ||||||||||||
Ratio of total expenses to | .79 | .80 | .78 | .80 | .83 | |||||||
Ratio of net expenses to | .79 | .80 | .78 | .80 | .83 | |||||||
Ratio of net investment income to average net assets | .30 | .49 | .53 | .30 | .50 | |||||||
Portfolio Turnover Rate | 100.55 | 104.51 | 101.68 | 74.05 | 67.49 | |||||||
Net Assets, end of period ($ x 1,000) | 15,538 | 9,137 | 17,308 | 79,397 | 25,147 | |||||||
a Based on average shares outstanding.
See notes to financial statements.
19
NOTES TO FINANCIAL STATEMENTS
NOTE 1—Significant Accounting Policies:
Dreyfus Opportunistic Midcap Value Fund (the “fund”) is a separate diversified series of Advantage Funds, Inc. (the “Company”), which is registered under the Investment Company Act of 1940, as amended (the “Act”), as an open-end management investment company and operates as a series company currently offering ten series, including the fund. The fund’s investment objective is to seek to surpass the performance of the Russell Midcap® Value Index. The Dreyfus Corporation (the “Manager” or “Dreyfus”), a wholly-owned subsidiary of The Bank of New York Mellon Corporation (“BNY Mellon”), serves as the fund’s investment adviser.
MBSC Securities Corporation (the “Distributor”), a wholly-owned subsidiary of Dreyfus, is the distributor of the fund’s shares. The fund is authorized to issue 800 million shares of $.001 par value Common Stock. The fund currently has authorized five classes of shares: Class A (350 million shares authorized), Class C (125 million shares authorized), Class I (125 million shares authorized), Class T (100 million shares authorized) and Class Y (100 million shares authorized). Class A and Class T shares generally are subject to a sales charge imposed at the time of purchase. Class C shares are subject to a contingent deferred sales charge (“CDSC”) imposed on Class C shares redeemed within one year of purchase. Class C shares automatically convert to Class A shares ten years after the date of purchase, without the imposition of a sales charge. Class I and Class Y shares are sold at net asset value per share generally to institutional investors. As of the date of this report, the fund did not offer Class T shares for purchase. Other differences between the classes include the services offered to and the expenses borne by each class, the allocation of certain transfer agency costs, and certain voting rights. Income, expenses (other than expenses attributable to a specific class), and realized and unrealized gains or losses on investments are allocated to each class of shares based on its relative net assets.
The Company accounts separately for the assets, liabilities and operations of each series. Expenses directly attributable to each series are charged to that series’ operations; expenses which are applicable to all series are allocated among them on a pro rata basis.
The Financial Accounting Standards Board (“FASB”) Accounting Standards Codification is the exclusive reference of authoritative U.S. generally accepted accounting principles (“GAAP”) recognized by the FASB to be applied by nongovernmental entities. Rules and interpretive releases of the Securities and Exchange Commission (“SEC”) under authority of federal laws are also sources of authoritative GAAP for SEC
20
registrants. The fund’s financial statements are prepared in accordance with GAAP, which may require the use of management estimates and assumptions. Actual results could differ from those estimates.
The Company enters into contracts that contain a variety of indemnifications. The fund’s maximum exposure under these arrangements is unknown. The fund does not anticipate recognizing any loss related to these arrangements.
(a) Portfolio valuation: The fair value of a financial instrument is the amount that would be received to sell an asset or paid to transfer a liability in an orderly transaction between market participants at the measurement date (i.e., the exit price). GAAP establishes a fair value hierarchy that prioritizes the inputs of valuation techniques used to measure fair value. This hierarchy gives the highest priority to unadjusted quoted prices in active markets for identical assets or liabilities (Level 1 measurements) and the lowest priority to unobservable inputs (Level 3 measurements).
Additionally, GAAP provides guidance on determining whether the volume and activity in a market has decreased significantly and whether such a decrease in activity results in transactions that are not orderly. GAAP requires enhanced disclosures around valuation inputs and techniques used during annual and interim periods.
Various inputs are used in determining the value of the fund’s investments relating to fair value measurements. These inputs are summarized in the three broad levels listed below:
Level 1—unadjusted quoted prices in active markets for identical investments.
Level 2—other significant observable inputs (including quoted prices for similar investments, interest rates, prepayment speeds, credit risk, etc.).
Level 3—significant unobservable inputs (including the fund’s own assumptions in determining the fair value of investments).
The inputs or methodology used for valuing securities are not necessarily an indication of the risk associated with investing in those securities.
Changes in valuation techniques may result in transfers in or out of an assigned level within the disclosure hierarchy. Valuation techniques used to value the fund’s investments are as follows:
Investments in securities are valued at the last sales price on the securities exchange or national securities market on which such securities are primarily traded. Securities listed on the National Market System for which
21
NOTES TO FINANCIAL STATEMENTS (continued)
market quotations are available are valued at the official closing price or, if there is no official closing price that day, at the last sales price. For open short positions, asked prices are used for valuation purposes. Bid price is used when no asked price is available. Registered investment companies that are not traded on an exchange are valued at their net asset value. All of the preceding securities are generally categorized within Level 1 of the fair value hierarchy.
Securities not listed on an exchange or the national securities market, or securities for which there were no transactions, are valued at the average of the most recent bid and asked prices. These securities are generally categorized within Level 2 of the fair value hierarchy.
Fair valuing of securities may be determined with the assistance of a pricing service using calculations based on indices of domestic securities and other appropriate indicators, such as prices of relevant American Depository Receipts and futures. Utilizing these techniques may result in transfers between Level 1 and Level 2 of the fair value hierarchy.
When market quotations or official closing prices are not readily available, or are determined not to accurately reflect fair value, such as when the value of a security has been significantly affected by events after the close of the exchange or market on which the security is principally traded (for example, a foreign exchange or market), but before the fund calculates its net asset value, the fund may value these investments at fair value as determined in accordance with the procedures approved by the Company’s Board of Directors (the “Board”). Certain factors may be considered when fair valuing investments such as: fundamental analytical data, the nature and duration of restrictions on disposition, an evaluation of the forces that influence the market in which the securities are purchased and sold, and public trading in similar securities of the issuer or comparable issuers. These securities are either categorized within Level 2 or 3 of the fair value hierarchy depending on the relevant inputs used.
For restricted securities where observable inputs are limited, assumptions about market activity and risk are used and such securities are generally categorized within Level 3 of the fair value hierarchy.
The following is a summary of the inputs used as of August 31, 2018 in valuing the fund’s investments:
22
Level 1 - | Level 2 - Other | Level 3 | Total | ||
Assets ($) | |||||
Investments in Securities: |
|
|
| ||
Equity Securities - Domestic Common Stocks† | 1,039,057,439 | - | - | 1,039,057,439 | |
Registered Investment Companies | 14,732,681 | - | - | 14,732,681 | |
† See Statement of Investments for additional detailed categorizations.
At August 31, 2018, there were no transfers between levels of the fair value hierarchy. It is the fund’s policy to recognize transfers between levels at the end of the reporting period.
(b) Securities transactions and investment income: Securities transactions are recorded on a trade date basis. Realized gains and losses from securities transactions are recorded on the identified cost basis. Dividend income is recognized on the ex-dividend date and interest income, including, where applicable, accretion of discount and amortization of premium on investments, is recognized on the accrual basis.
Pursuant to a securities lending agreement with The Bank of New York Mellon, a subsidiary of BNY Mellon and an affiliate of Dreyfus, the fund may lend securities to qualified institutions. It is the fund’s policy that, at origination, all loans are secured by collateral of at least 102% of the value of U.S. securities loaned and 105% of the value of foreign securities loaned. Collateral equivalent to at least 100% of the market value of securities on loan is maintained at all times. Collateral is either in the form of cash, which can be invested in certain money market mutual funds managed by Dreyfus, or U.S. Government and Agency securities. The fund is entitled to receive all dividends, interest and distributions on securities loaned, in addition to income earned as a result of the lending transaction. Should a borrower fail to return the securities in a timely manner, The Bank of New York Mellon is required to replace the securities for the benefit of the fund or credit the fund with the market value of the unreturned securities and is subrogated to the fund’s rights against the borrower and the collateral. Additionally, the contractual maturity of security lending transactions are on an overnight and continuous basis. During the period ended August 31, 2018, The Bank of New York Mellon earned $20,233 from lending portfolio securities, pursuant to the securities lending agreement.
23
NOTES TO FINANCIAL STATEMENTS (continued)
(c) Affiliated issuers: Investments in other investment companies advised by Dreyfus are defined as “affiliated” under the Act.
(d) Dividends and distributions to shareholders: Dividends and distributions are recorded on the ex-dividend date. Dividends from investment income-net and dividends from net realized capital gains, if any, are normally declared and paid annually, but the fund may make distributions on a more frequent basis to comply with the distribution requirements of the Internal Revenue Code of 1986, as amended (the “Code”). To the extent that net realized capital gains can be offset by capital loss carryovers, it is the policy of the fund not to distribute such gains. Income and capital gain distributions are determined in accordance with income tax regulations, which may differ from GAAP.
(e) Federal income taxes: It is the policy of the fund to continue to qualify as a regulated investment company, if such qualification is in the best interests of its shareholders, by complying with the applicable provisions of the Code, and to make distributions of taxable income sufficient to relieve it from substantially all federal income and excise taxes.
As of and during the period ended August 31, 2018, the fund did not have any liabilities for any uncertain tax positions. The fund recognizes interest and penalties, if any, related to uncertain tax positions as income tax expense in the Statement of Operations. During the period ended August 31, 2018, the fund did not incur any interest or penalties.
Each tax year in the four-year period ended August 31, 2018 remains subject to examination by the Internal Revenue Service and state taxing authorities.
At August 31, 2018, the components of accumulated earnings on a tax basis were as follows: undistributed ordinary income $55,392,087, undistributed capital gains $107,358,223 and unrealized appreciation $127,371,482.
The tax character of distributions paid to shareholders during the fiscal periods ended August 31, 2018 and August 31, 2017 were as follows: ordinary income $37,250,668 and $11,170,930, and long-term capital gains $97,651,196 and $50,851,655, respectively.
During the period ended August 31, 2018, as a result of permanent book to tax differences, primarily due to the tax treatment for real estate investment trusts, the fund decreased accumulated undistributed investment income-net by $49,593 and increased accumulated net realized gain (loss) on investments by the same amount. Net assets and net asset value per share were not affected by this reclassification.
24
(f) New Accounting Pronouncements: In August 2018, the FASB issued Accounting Standards Update 2018-13, Fair Value Measurement (Topic 820): Disclosure Framework—Changes to the Disclosure Requirements for Fair Value Measurement (“ASU 2018-13”). The update provides guidance that eliminates, adds and modifies certain disclosure requirements for fair value measurements. ASU 2018-13 will be effective for annual periods beginning after December 15, 2019. Management is currently assessing the potential impact of these changes to future financial statements.
NOTE 2—Bank Lines of Credit:
The fund participates with other Dreyfus-managed funds in an $830 million unsecured credit facility led by Citibank, N.A. and a $300 million unsecured credit facility provided by The Bank of New York Mellon (each, a “Facility”), each to be utilized primarily for temporary or emergency purposes, including the financing of redemptions. Prior to October 4, 2017, the unsecured credit facility with Citibank, N.A. was $810 million. In connection therewith, the fund has agreed to pay its pro rata portion of commitment fees for each Facility. Interest is charged to the fund based on rates determined pursuant to the terms of the respective Facility at the time of borrowing.
The average amount of borrowings outstanding under the Facilities during the period ended August 31, 2018, was approximately $30,400 with a related weighted average annualized interest rate of 2.78%.
NOTE 3—Management Fee and Other Transactions with Affiliates:
(a) Pursuant to a management agreement with Dreyfus, the management fee is computed at the annual rate of .75% of the value of the fund's average daily net assets and is payable monthly.
During the period ended August 31, 2018, the Distributor retained $10,492 from commissions earned on sales of the fund’s Class A shares and $5,432 from CDSC fees on redemptions of the fund’s Class C shares.
(b) Under the Distribution Plan adopted pursuant to Rule 12b-1 under the Act, Class C shares pay the Distributor for distributing its shares at an annual rate of .75% of the value of its average daily net assets. During the period ended August 31, 2018, Class C shares were charged $421,610 pursuant to the Distribution Plan.
(c) Under the Shareholder Services Plan, Class A and Class C shares pay the Distributor at an annual rate of .25% of the value of their average daily net assets for the provision of certain services. The services provided may
25
NOTES TO FINANCIAL STATEMENTS (continued)
include personal services relating to shareholder accounts, such as answering shareholder inquiries regarding the fund and providing reports and other information, and services related to the maintenance of shareholder accounts. The Distributor may make payments to Service Agents (securities dealers, financial institutions or other industry professionals) with respect to these services. The Distributor determines the amounts to be paid to Service Agents. During the period ended August 31, 2018, Class A and Class C shares were charged $1,260,554 and $140,537, respectively, pursuant to the Shareholder Services Plan.
The fund has arrangements with the transfer agent and the custodian whereby the fund may receive earnings credits when positive cash balances are maintained, which are used to offset transfer agency and custody fees. For financial reporting purposes, the fund includes net earnings credits, if any, as an expense offset in the Statement of Operations.
The fund compensates Dreyfus Transfer, Inc., a wholly-owned subsidiary of Dreyfus, under a transfer agency agreement for providing transfer agency and cash management services for the fund. The majority of transfer agency fees are comprised of amounts paid on a per account basis, while cash management fees are related to fund subscriptions and redemptions. During the period ended August 31, 2018, the fund was charged $105,413 for transfer agency services. These fees are included in Shareholder servicing costs in the Statement of Operations.
The fund compensates The Bank of New York Mellon under a custody agreement for providing custodial services for the fund. These fees are determined based on net assets, geographic region and transaction activity. During the period ended August 31, 2018, the fund was charged $38,096 pursuant to the custody agreement. These fees were partially offset by earnings credits of $1,534.
During the period ended August 31, 2018, the fund was charged $13,269 for services performed by the Chief Compliance Officer and his staff. These fees are included in Miscellaneous in the Statement of Operations.
The components of “Due to The Dreyfus Corporation and affiliates” in the Statement of Assets and Liabilities consist of: management fees $671,361, Distribution Plan fees $32,242, Shareholder Services Plan fees $113,282, custodian fees $15,018, Chief Compliance Officer fees $5,693 and transfer agency fees $21,546.
(d) Each Board member also serves as a Board member of other funds within the Dreyfus complex. Annual retainer fees and attendance fees are allocated to each fund based on net assets.
26
NOTE 4—Securities Transactions:
The aggregate amount of purchases and sales of investment securities, excluding short-term securities, during the period ended August 31, 2018, amounted to $1,074,286,746 and $1,276,470,565, respectively.
At August 31, 2018, the cost of investments for federal income tax purposes was $926,418,638; accordingly, accumulated net unrealized appreciation on investments was $127,371,482, consisting of $157,597,398 gross unrealized appreciation and $30,225,916 gross unrealized depreciation.
27
REPORT OF INDEPENDENT REGISTERED PUBLIC ACCOUNTING FIRM
To the Shareholders and the Board of Directors of Dreyfus Opportunistic Midcap Value Fund
Opinion on the Financial Statements
We have audited the accompanying statement of assets and liabilities of Dreyfus Opportunistic Midcap Value Fund (the “Fund”) (one of the funds constituting Advantage Funds, Inc.), including the statements of investments and investments in affiliated issuers, as of August 31, 2018, and the related statement of operations for the year then ended, the statements of changes in net assets for each of the two years in the period then ended, the financial highlights for each of the five years in the period then ended and the related notes (collectively referred to as the “financial statements”). In our opinion, the financial statements present fairly, in all material respects, the financial position of the Fund (one of the funds constituting Advantage Funds, Inc.) at August 31, 2018, the results of its operations for the year then ended, the changes in its net assets for each of the two years in the period then ended and its financial highlights for each of the five years in the period then ended, in conformity with U.S. generally accepted accounting principles.
Basis for Opinion
These financial statements are the responsibility of the Fund’s management. Our responsibility is to express an opinion on the Fund’s financial statements based on our audits. We are a public accounting firm registered with the Public Company Accounting Oversight Board (United States) (“PCAOB”) and are required to be independent with respect to the Fund in accordance with the U.S. federal securities laws and the applicable rules and regulations of the Securities and Exchange Commission and the PCAOB.
We conducted our audits in accordance with the standards of the PCAOB. Those standards require that we plan and perform the audit to obtain reasonable assurance about whether the financial statements are free of material misstatement, whether due to error or fraud. The Fund is not required to have, nor were we engaged to perform, an audit of the Fund’s internal control over financial reporting. As part of our audits, we are required to obtain an understanding of internal control over financial reporting, but not for the purpose of expressing an opinion on the effectiveness of the Fund’s internal control over financial reporting. Accordingly, we express no such opinion.
Our audits included performing procedures to assess the risks of material misstatement of the financial statements, whether due to error or fraud, and performing procedures that respond to those risks. Such procedures included examining, on a test basis, evidence regarding the amounts and disclosures in the financial statements. Our procedures included confirmation of securities owned as of August 31, 2018, by correspondence with the custodian and others or by other appropriate auditing procedures where replies from others were not received. Our audits also included evaluating the accounting principles used and significant estimates made by management, as well as evaluating the overall presentation of the financial statements. We believe that our audits provide a reasonable basis for our opinion.

We have served as the auditor of one or more Dreyfus investment companies since at least 1957, but we are unable to determine the specific year.
New York, New York
October 26, 2018
28
IMPORTANT TAX INFORMATION (Unaudited)
For federal tax purposes, the fund hereby reports 33.62% of the ordinary dividends paid during the fiscal year ended August 31, 2018 as qualifying for the corporate dividends received deduction. Also, certain dividends paid by the fund may be subject to a maximum tax rate of 15%, as provided for by the Jobs and Growth Tax Relief Reconciliation Act of 2003. Of the distributions paid during the fiscal year, $16,326,261 represents the maximum amount that may be considered qualified dividend income. The fund also hereby reports $1.1574 per share as a short-term capital gain distribution and $3.2172 per share as a long-term capital gain distribution paid on December 12, 2017. Shareholders will receive notification in early 2019 of the percentage applicable to the preparation of their 2018 income tax returns.
29
BOARD MEMBERS INFORMATION (Unaudited)
INDEPENDENT BOARD MEMBERS
Chairman of the Board (1995)
Principal Occupation During Past 5 Years:
· Corporate Director and Trustee (1995-present)
Other Public Company Board Memberships During Past 5 Years:
· CBIZ (formerly, Century Business Services, Inc.), a provider of outsourcing functions for small and medium size companies, Director (1997-present)
No. of Portfolios for which Board Member Serves: 125
———————
Peggy C. Davis (75)
Board Member (2006)
Principal Occupation During Past 5 Years:
· Shad Professor of Law, New York University School of Law (1983-present)
No. of Portfolios for which Board Member Serves: 45
———————
David P. Feldman (78)
Board Member (1996)
Principal Occupation During Past 5 Years:
· Corporate Director and Trustee (1985-present)
Other Public Company Board Memberships During Past 5 Years:
· BBH Mutual Funds Group (5 registered mutual funds), Director (1992-2014)
No. of Portfolios for which Board Member Serves: 31
———————
Joan Gulley (70)
Board Member (2017)
Principal Occupation During Past 5 Years:
· PNC Financial Services Group, Inc.(1993-2014), Executive Vice President and Chief Human Resources Officer and Executive Committee Member (2008-2014)
No. of Portfolios for which Board Member Serves: 52
———————
30
Ehud Houminer (78)
Board Member (1993)
Principal Occupation During Past 5 Years:
· Board of Overseers at the Columbia Business School, Columbia University (1992-present)
· Trustee, Ben Gurion University
No. of Portfolios for which Board Member Serves: 52
———————
Lynn Martin (78)
Board Member (2012)
Principal Occupation During Past 5 Years:
· President of The Martin Hall Group LLC, a human resources consulting firm (2005-2012)
No. of Portfolios for which Board Member Serves: 31
———————
Robin A. Melvin (54)
Board Member (2012)
Principal Occupation During Past 5 Years:
· Co-chairman, Illinois Mentoring Partnership, non-profit organization dedicated to increasing the quantity and quality of mentoring services in Illinois; (2014-present; board member since 2013)
No. of Portfolios for which Board Member Serves: 100
———————
Dr. Martin Peretz (79)
Board Member (2006)
Principal Occupation During Past 5 Years:
· Editor-in-Chief Emeritus of The New Republic Magazine (2011-2012) (previously,
Editor-in-Chief, 1974-2011)
· Lecturer at Harvard University (1968-2010)
No. of Portfolios for which Board Member Serves: 31
———————
Once elected all Board Members serve for an indefinite term, but achieve Emeritus status upon reaching age 80. The address of the Board Members and Officers is c/o The Dreyfus Corporation, 200 Park Avenue, New York, New York 10166. Additional information about the Board Members is available in the fund’s Statement of Additional Information which can be obtained from Dreyfus free of charge by calling this toll free number: 1-800-DREYFUS.
James F. Henry, Emeritus Board Member
Philip L. Toia, Emeritus Board Member
31
OFFICERS OF THE FUND (Unaudited)
BRADLEY J. SKAPYAK, President since January 2010.
Chief Operating Officer and a director of the Manager since June 2009, Chairman of Dreyfus Transfer, Inc., an affiliate of the Manager and the transfer agent of the funds, since May 2011 and Chief Executive Officer of MBSC Securities Corporation since August 2016. He is an officer of 62 investment companies (comprised of 125 portfolios) managed by the Manager. He is 59 years old and has been an employee of the Manager since February 1988.
BENNETT A. MACDOUGALL, Chief Legal Officer since October 2015.
Chief Legal Officer of the Manager and Associate General Counsel and Managing Director of BNY Mellon since June 2015; from June 2005 to June 2015, he served in various capacities with Deutsche Bank – Asset & Wealth Management Division, including as Director and Associate General Counsel, and Chief Legal Officer of Deutsche Investment Management Americas Inc. from June 2012 to May 2015. He is an officer of 63 investment companies (comprised of 150 portfolios) managed by the Manager. He is 46 years old and has been an employee of the Manager since June 2015.
JAMES BITETTO, Vice President since August 2005 and Secretary since February 2018.
Managing Counsel of BNY Mellon and Secretary of the Manager, and an officer of 63 investment companies (comprised of 150 portfolios) managed by the Manager. He is 52 years old and has been an employee of the Manager since December 1996.
JOSEPH M. CHIOFFI, Vice President and Assistant Secretary since August 2005.
Managing Counsel of BNY Mellon, and an officer of 63 investment companies (comprised of 150 portfolios) managed by the Manager. He is 56 years old and has been an employee of the Manager since June 2000.
SONALEE CROSS, Vice President and Assistant Secretary since March 2018.
Counsel of BNY Mellon since October 2016; Associate at Proskauer Rose LLP from April 2016 to September 2016; Attorney at EnTrust Capital from August 2015 to February 2016; Associate at Sidley Austin LLP from September 2013 until August 2015. She is an officer of 63 investment companies (comprised of 150 portfolios) managed by Dreyfus. She is 30 years old and has been an employee of the Manager since October 2016.
MAUREEN E. KANE, Vice President and Assistant Secretary since April 2015.
Managing Counsel of BNY Mellon since July 2014; from October 2004 until July 2014, General Counsel, and from May 2009 until July 2014, Chief Compliance Officer of Century Capital Management. She is an officer of 63 investment companies (comprised of 150 portfolios) managed by the Manager. She is 56 years old and has been an employee of the Manager since July 2014.
SARAH S. KELLEHER, Vice President and Assistant Secretary since April 2014.
Managing Counsel of BNY Mellon. She is an officer of 63 investment companies (comprised of 150 portfolios) managed by the Manager. She is 42 years old and has been an employee of the Manager since March 2013.
JEFF PRUSNOFSKY, Vice President and Assistant Secretary since August 2005.
Senior Managing Counsel of BNY Mellon, and an officer of 63 investment companies (comprised of 150 portfolios) managed by the Manager. He is 53 years old and has been an employee of the Manager since October 1990.
NATALYA ZELENSKY, Vice President and Assistant Secretary since March 2017.
Counsel of BNY Mellon since May 2016; Attorney at Wildermuth Endowment Strategy Fund/Wildermuth Advisory, LLC from November 2015 until May 2016; Assistant General Counsel at RCS Advisory Services from July 2014 until November 2015; Associate at Sutherland, Asbill & Brennan from January 2013 until January 2014. She is an officer of 63 investment companies (comprised of 150 portfolios) managed by Dreyfus. She is 33 years old and has been an employee of the Manager since May 2016.
JAMES WINDELS, Treasurer since November 2001.
Director – Mutual Fund Accounting of the Manager, and an officer of 63 investment companies (comprised of 150 portfolios) managed by the Manager. He is 59 years old and has been an employee of the Manager since April 1985.
RICHARD CASSARO, Assistant Treasurer since January 2008.
Senior Accounting Manager – Money Market and Municipal Bond Funds of the Manager, and an officer of 63 investment companies (comprised of 150 portfolios) managed by the Manager. He is 59 years old and has been an employee of the Manager since September 1982.
32
GAVIN C. REILLY, Assistant Treasurer since December 2005.
Tax Manager of the Investment Accounting and Support Department of the Manager, and an officer of 63 investment companies (comprised of 150 portfolios) managed by the Manager. He is 50 years old and has been an employee of the Manager since April 1991.
ROBERT S. ROBOL, Assistant Treasurer since August 2005.
Senior Accounting Manager – Dreyfus Financial Reporting of the Manager, and an officer of 63 investment companies (comprised of 150 portfolios) managed by the Manager. He is 54 years old and has been an employee of the Manager since October 1988.
ROBERT SALVIOLO, Assistant Treasurer since July 2007.
Senior Accounting Manager – Equity Funds of the Manager, and an officer of 63 investment companies (comprised of 150 portfolios) managed by the Manager. He is 51 years old and has been an employee of the Manager since June 1989.
ROBERT SVAGNA, Assistant Treasurer since December 2002.
Senior Accounting Manager – Fixed Income and Equity Funds of the Manager, and an officer of 63 investment companies (comprised of 150 portfolios) managed by the Manager. He is 51 years old and has been an employee of the Manager since November 1990.
JOSEPH W. CONNOLLY, Chief Compliance Officer since October 2004.
Chief Compliance Officer of the Manager, the Dreyfus Family of Funds and BNY Mellon Funds Trust (63 investment companies, comprised of 150 portfolios). He is 61 years old and has served in various capacities with the Manager since 1980, including manager of the firm’s Fund Accounting Department from 1997 through October 2001.
CARIDAD M. CAROSELLA, Anti-Money Laundering Compliance Officer since January 2016.
Anti-Money Laundering Compliance Officer of the Dreyfus Family of Funds and BNY Mellon Funds Trust since January 2016; from May 2015 to December 2015, Interim Anti-Money Laundering Compliance Officer of the Dreyfus Family of Funds and BNY Mellon Funds Trust and the Distributor; from January 2012 to May 2015, AML Surveillance Officer of the Distributor and from 2007 to December 2011, Financial Processing Manager of the Distributor. She is an officer of 57 investment companies (comprised of 144 portfolios) managed by the Manager. She is 50 years old and has been an employee of the Distributor since 1997.
33
Dreyfus Opportunistic Midcap Value Fund
200 Park Avenue
New York, NY 10166
Manager
The Dreyfus Corporation
200 Park Avenue
New York, NY 10166
Custodian
The Bank of New York Mellon
240 Greenwich Street
New York, NY 10286
Transfer Agent &
Dividend Disbursing Agent
Dreyfus Transfer, Inc.
200 Park Avenue
New York, NY 10166
Distributor
MBSC Securities Corporation
200 Park Avenue
New York, NY 10166
Ticker Symbols: | Class A: DMCVX Class C: DVLCX Class I: DVLIX Class Y: DMCYX |
Telephone Call your financial representative or 1-800-DREYFUS
Mail The Dreyfus Family of Funds, 144 Glenn Curtiss Boulevard, Uniondale, NY 11556-0144
E-mail Send your request to info@dreyfus.com
Internet Information can be viewed online or downloaded at www.dreyfus.com
The fund files its complete schedule of portfolio holdings with the Securities and Exchange Commission (“SEC”) for the first and third quarters of each fiscal year on Form N-Q. The fund’s Forms N-Q are available on the SEC’s website at www.sec.gov and may be reviewed and copied at the SEC’s Public Reference Room in Washington, D.C. (phone 1-800-SEC-0330 for information).
A description of the policies and procedures that the fund uses to determine how to vote proxies relating to portfolio securities and information regarding how the fund voted these proxies for the most recent 12-month period ended June 30 is available at www.dreyfus.com and on the SEC’s website at www.sec.gov and without charge, upon request, by calling 1-800-DREYFUS.
© 2018 MBSC Securities Corporation |
|

Dreyfus Opportunistic Small Cap Fund
| ANNUAL REPORT |

|

Save time. Save paper. View your next shareholder report online as soon as it’s available. Log into www.dreyfus.com and sign up for Dreyfus eCommunications. It’s simple and only takes a few minutes. |
The views expressed in this report reflect those of the portfolio manager(s) only through the end of the period covered and do not necessarily represent the views of Dreyfus or any other person in the Dreyfus organization. Any such views are subject to change at any time based upon market or other conditions and Dreyfus disclaims any responsibility to update such views. These views may not be relied on as investment advice and, because investment decisions for a Dreyfus fund are based on numerous factors, may not be relied on as an indication of trading intent on behalf of any Dreyfus fund. |
Not FDIC-Insured • Not Bank-Guaranteed • May Lose Value |
Contents
THE FUND
With Those of Other Funds | |
in Affiliated Issuers | |
Public Accounting Firm | |
FOR MORE INFORMATION
Back Cover
| The Fund |
A LETTER FROM THE PRESIDENT OF DREYFUS
Dear Shareholder:
We are pleased to present this annual report for Dreyfus Opportunistic Small Cap Fund, covering the 12-month period from September 1, 2017 through August 31, 2018. For information about how the fund performed during the reporting period, as well as general market perspectives, we provide a Discussion of Fund Performance on the pages that follow.
The 12-month period started on solid footing which gave way to a shifting landscape. Through February of 2018, major global economies appeared to be in lock-step as they moved towards less accommodative monetary policy and concurrent growth. In the equity markets, both U.S. and non-U.S. markets enjoyed an upward trek across sectors and market caps. Interest rates rose across the curve putting pressure on bond prices, but sectors such as investment grade and high yield corporates, non-U.S. dollar denominated bonds and emerging market debt, were able to outperform like-duration U.S. Treasuries.
In February, the first rumblings of discontent shook equity markets. Global growth and monetary policy paths began to diverge. Non-U.S. economies weakened. Momentum sputtered, and equities began to struggle. Emerging market debt, non-U.S. denominated bonds and corporate debt gave up much of the performance earned earlier in the period. Long-term U.S. interest rates started to fall. The shockwave ended in April and pressure on U.S. equity markets eased, allowing U.S. equity markets to end the 12-month period with double-digit gains.
Despite new concerns regarding trade, U.S. inflationary pressures and global growth, we are optimistic that U.S. consumer spending, corporate earnings, and economic data will remain strong in the near term. However, we will stay attentive to signs that might signal possible changes on the horizon. As always, we encourage you to discuss the risks and opportunities of today’s investment environment with your financial advisor.
Thank you for your continued confidence and support.
Sincerely,

Renee Laroche-Morris
President
The Dreyfus Corporation
September 17, 2018
2
DISCUSSION OF FUND PERFORMANCE (Unaudited)
For the period from September 1, 2017 through August 31, 2018, as provided by David A. Daglio, lead portfolio manager, James Boyd, Brian R. Duncan, and Dale Dutile, portfolio managers
Market and Fund Performance Overview
For the 12-month period ended August 31, 2018, Dreyfus Opportunistic Small Cap Fund’s Investor shares achieved a total return of 23.51%, Class I shares returned 23.78%, and Class Y shares returned 23.90%.1 In comparison, the fund’s benchmark, the Russell 2000® Index (the “Index”), produced a total return of 25.45% for the same period.2
Small-cap stocks continued to gain ground over the reporting period amid rising corporate earnings, improved economic conditions, and the ongoing tailwind of business-friendly tax-reform legislation. Small caps benefited disproportionately from tax reform, as they earn 85%-90% of their profits domestically. The fund modestly trailed the Index, mainly due to an overweight to the materials sector and security selection in the industrials sector.
The Fund’s Investment Approach
The fund seeks capital appreciation. The fund normally invests at least 80% of its net assets, plus any borrowing for investment purposes, in the stocks of small-cap companies. The fund currently considers small-cap companies to be those companies with market capitalizations that fall within the range of companies in the Index. As of October 31, 2017, the market capitalization of the largest company in the Index was approximately $6.55 billion, and the weighted average and median market capitalizations of the Index were approximately $2.27 billion and $851 million, respectively. Stocks are selected for the fund’s portfolio based primarily on bottom-up fundamental analysis. The fund’s team of portfolio managers uses a disciplined investment process that relies, in general, on proprietary fundamental research and valuation. Generally, elements of the process include analysis of a company’s business prospects, estimation of the company’s value and the identification of events that could cause the estimated value of the company to change. In general, the fund seeks exposure to securities and sectors that the fund’s portfolio managers perceive to be attractive from a valuation and fundamental standpoint.
Healthy Corporate Earnings Supported Markets
Equities across all capitalization ranges continued to benefit from an improving economic environment, strengthening labor markets, and corporate earnings growth assisted by the corporate tax cut, helping to drive the Index to new highs. While trade tensions continue to cause some concern, some progress on this front eased worries during the reporting period.
The market’s advance also was supported by a well-telegraphed implementation of monetary policy. Although rising interest rates historically have tended to undermine investor sentiment toward stocks, the Federal Reserve Board’s gradual approach to a less accommodative monetary policy was received calmly by investors, who focused more on improving business conditions and corporate earnings growth. Small-cap stocks generally outperformed their large-cap counterparts, and growth stocks outperformed value stocks.
3
DISCUSSION OF FUND PERFORMANCE (Unaudited) (continued)
Security Selections Enhanced Performance
Disappointments proved relatively mild. The fund’s slight underperformance versus the benchmark stemmed primarily from an overweight to the materials sectors and from security selection in the industrials sector. In addition, gold mining companies were broadly affected by flat gold prices, hindering the fund’s performance. In industrials, Avis Budget Group struggled as auto rental demand came in below expectations, and Knight-Swift Transportation Holdings, a trucking company, failed to realize the savings expected from the merger with Swift Transportation.
On the positive side, the fund participated fully in the Index’s gains, supported by our security selection and asset allocation strategies across several market segments. The fund fared especially well in the information technology and health care sectors. In information technology, our positions in payment processing companies Square and Cardtronics enhanced returns, as both companies continue to benefit from the shift to smartphone payment systems. Ciena and Finisar, communications equipment companies, also performed well as they began to see new orders come in for 5G phone technology. In health care, our position in biotech company Sage Therapeutics, which is emerging as a leader in antidepressant products, added to performance. Health care payment services company Evolent Health capitalized on the trend toward value-based billing, and HMS Holdings benefited from improved market share. Underweighted exposure to the struggling utilities sector further enhanced relative performance, as did an underweight to the real estate sector.
Finding Opportunities Amid Moderating Profits
We have continued to identify what we believe to be attractive investment opportunities in an environment of positive economic growth, and we expect that the tax cuts will continue to provide a stimulus. However, we anticipate that profit growth may slow in 2019. In addition, we have reduced our exposure to financials and information technology, as stocks appreciated to our intrinsic value price targets. As of the reporting period’s end, we have identified a number of companies meeting our investment criteria in the health care, energy, and industrials sectors.
September 17, 2018
1 Total return includes reinvestment of dividends and any capital gains paid. Past performance is no guarantee of future results. Share price and investment return fluctuate such that upon redemption, fund shares may be worth more or less than their original cost.
2 Source: Lipper Inc. — The Russell 2000® Index measures the performance of the small-cap segment of the U.S. equity universe. The Russell 2000® Index is a subset of the Russell 3000® Index representing approximately 10% of the total market capitalization of that index. It includes approximately 2,000 of the smallest securities based on a combination of their market cap and current index membership. The Russell 2000® is constructed to provide a comprehensive and unbiased small-cap barometer and is completely reconstituted annually to ensure larger stocks do not distort the performance and characteristics of the true small-cap opportunity set. Investors cannot invest directly in any index.
Please note: the position in any security highlighted with italicized typeface was sold during the reporting period.
Equities are subject generally to market, market sector, market liquidity, issuer, and investment style risks, among other factors, to varying degrees, all of which are more fully described in the fund’s prospectus.
Stocks of small- and/or mid-cap companies often experience sharper price fluctuations than stocks of large-cap companies.
4
FUND PERFORMANCE (Unaudited)

Comparison of change in value of $10,000 investment in Dreyfus Opportunistic Small Cap Fund Investor shares, Class I shares and Class Y shares and the Russell 2000® Index (the “Index’)
† Source: Lipper Inc.
†† The total return figures presented for Class I shares of the fund reflect the performance of the fund’s Investor Class shares for the period prior to 9/30/16 (the inception date for Class I shares).
The total return figures presented for Class Y shares of the fund reflect the performance of the fund’s Investor Class shares for the period prior to 9/30/16 (the inception date for Class Y shares).
Past performance is not predictive of future performance.
The above graph compares a $10,000 investment made in each of the Investor, Class I and Class Y shares of Dreyfus Opportunistic Small Cap Fund on 8/31/08 to a $10,000 investment made in the Index on that date. All dividends and capital gain distributions are reinvested.
The fund’s performance shown in the line graph above takes into account all applicable fees and expenses. The Index measures the performance of the small-cap segment of the U.S. equity universe. The Index is a subset of the Russell 3000® Index representing approximately 10% of the total market capitalization of that index. It includes approximately 2,000 of the smallest securities based on a combination of their market cap and current index membership. The Index is constructed to provide a comprehensive and unbiased small-cap barometer and is completely reconstituted annually to ensure larger stocks do not distort the performance and characteristics of the true small-cap opportunity set. Unlike a mutual fund, the Index is not subject to charges, fees and other expenses. Investors cannot invest directly in any index. Further information relating to fund performance, including expense reimbursements, if applicable, is contained in the Financial Highlights section of the prospectus and elsewhere in this report.
5
FUND PERFORMANCE (Unaudited) (continued)
Average Annual Total Returns as of 8/31/18 | ||||
| Inception | 1 Year | 5 Years | 10 Years |
Investor shares | 11/16/1993 | 23.51% | 12.64% | 13.92% |
Class I shares | 9/30/2016 | 23.78% | 12.74%† | 13.97%† |
Class Y shares | 9/30/2016 | 23.90% | 12.76%† | 13.98%† |
Russell 2000® Index | 25.45% | 13.00% | 10.46% | |
† The total return performance figures presented for Class I shares of the fund reflect the performance of the fund’s Investor Class shares for the period prior to 9/30/16 (the inception date for Class I shares).
The total return performance figures presented for Class Y shares of the fund reflect the performance of the fund’s Investor Class shares for the period prior to 9/30/16 (the inception date for Class Y shares).
The performance data quoted represents past performance, which is no guarantee of future results. Share price and investment return fluctuate and an investor’s shares may be worth more or less than original cost upon redemption. Current performance may be lower or higher than the performance quoted. Go to Dreyfus.com for the fund’s most recent month-end returns.
The fund’s performance shown in the graph and table does not reflect the deduction of taxes that a shareholder would pay on fund distributions or the redemption of fund shares.
6
UNDERSTANDING YOUR FUND’S EXPENSES (Unaudited)
As a mutual fund investor, you pay ongoing expenses, such as management fees and other expenses. Using the information below, you can estimate how these expenses affect your investment and compare them with the expenses of other funds. You also may pay one-time transaction expenses, including sales charges (loads) and redemption fees, which are not shown in this section and would have resulted in higher total expenses. For more information, see your fund’s prospectus or talk to your financial adviser.
Review your fund’s expenses
The table below shows the expenses you would have paid on a $1,000 investment in Dreyfus Opportunistic Small Cap Fund from March 1, 2018 to August 31, 2018. It also shows how much a $1,000 investment would be worth at the close of the period, assuming actual returns and expenses.
Expenses and Value of a $1,000 Investment | |||||||||
assuming actual returns for the six months ended August 31, 2018 | |||||||||
Investor Shares | Class I | Class Y | |||||||
Expenses paid per $1,000† |
| $5.80 | $4.58 | $4.21 | |||||
Ending value (after expenses) |
| $1,111.40 | $1,112.70 | $1,113.20 | |||||
COMPARING YOUR FUND’S EXPENSES
WITH THOSE OF OTHER FUNDS (Unaudited)
Using the SEC’s method to compare expenses
The Securities and Exchange Commission (“SEC”) has established guidelines to help investors assess fund expenses. Per these guidelines, the table below shows your fund’s expenses based on a $1,000 investment, assuming a hypothetical 5% annualized return. You can use this information to compare the ongoing expenses (but not transaction expenses or total cost) of investing in the fund with those of other funds. All mutual fund shareholder reports will provide this information to help you make this comparison. Please note that you cannot use this information to estimate your actual ending account balance and expenses paid during the period.
Expenses and Value of a $1,000 Investment | |||||||||
assuming a hypothetical 5% annualized return for the six months ended August 31, 2018 | |||||||||
Investor Shares | Class I | Class Y | |||||||
Expenses paid per $1,000† | $5.55 | $4.38 | $4.02 | ||||||
Ending value (after expenses) | $1,019.71 | $1,020.87 | $1,021.22 | ||||||
† Expenses are equal to the fund’s annualized expense ratio of 1.09% for Investor shares, .86% for Class I and .79% for Class Y, multiplied by the average account value over the period, multiplied by 184/365 (to reflect the one-half year period).
7
STATEMENT OF INVESTMENTS
August 31, 2018
Description | Shares | Value ($) | |||||
Common Stocks - 96.8% | |||||||
Automobiles & Components - 2.1% | |||||||
Delphi Technologies | 374,085 | 13,179,015 | |||||
Visteon | 123,953 | a,b | 13,683,172 | ||||
26,862,187 | |||||||
Banks - 8.7% | |||||||
Ameris Bancorp | 132,753 | 6,591,186 | |||||
Atlantic Capital Bancshares | 630,303 | b | 11,503,030 | ||||
FCB Financial Holdings, Cl. A | 154,177 | b | 7,986,369 | ||||
First Interstate BancSystem, Cl. A | 445,188 | 20,678,983 | |||||
First Merchants | 222,757 | 10,719,067 | |||||
Great Western Bancorp | 447,279 | 19,474,528 | |||||
MGIC Investment | 656,649 | b | 8,352,575 | ||||
Midland States Bancorp | 163,772 | 5,638,670 | |||||
Union Bankshares | 513,523 | a | 21,362,557 | ||||
112,306,965 | |||||||
Capital Goods - 4.7% | |||||||
Capitol Investment IV | 679,597 | a | 7,061,013 | ||||
Simpson Manufacturing | 344,371 | a | 26,437,362 | ||||
Tennant | 156,474 | a | 11,978,085 | ||||
TPG Pace Holdings | 471,627 | b | 4,963,874 | ||||
Wesco Aircraft Holdings | 812,796 | a,b | 9,875,471 | ||||
60,315,805 | |||||||
Commercial & Professional Services - 2.1% | |||||||
Avis Budget Group | 865,864 | b | 26,937,029 | ||||
Consumer Durables & Apparel - 1.0% | |||||||
G-III Apparel Group | 275,438 | a,b | 12,526,920 | ||||
Consumer Services - 7.6% | |||||||
Dave & Buster's Entertainment | 551,062 | a,b | 32,055,277 | ||||
DeVry Education Group | 449,306 | b | 21,499,292 | ||||
Penn National Gaming | 317,507 | a,b | 10,941,291 | ||||
Pinnacle Entertainment | 282,337 | b | 9,667,219 | ||||
Planet Fitness, Cl. A | 478,627 | b | 24,587,069 | ||||
98,750,148 | |||||||
Diversified Financials - 5.6% | |||||||
Cannae Holdings | 264,544 | b | 5,142,735 | ||||
Green Dot, Cl. A | 91,581 | b | 7,845,744 | ||||
Investment Technology Group | 618,187 | 13,525,932 | |||||
OneMain Holdings | 904,870 | b | 33,208,729 | ||||
SLM | 1,041,785 | b | 12,209,720 | ||||
71,932,860 | |||||||
Energy - 8.3% | |||||||
Ardmore Shipping | 395,858 | a,b | 2,771,006 | ||||
8
Description | Shares | Value ($) | |||||
Common Stocks - 96.8% (continued) | |||||||
Energy - 8.3% (continued) | |||||||
Delek US Holdings | 668,293 | 36,421,968 | |||||
GasLog | 320,144 | a | 5,378,419 | ||||
Green Plains | 826,158 | a | 14,664,304 | ||||
Navigator Holdings | 223,570 | a,b | 2,705,197 | ||||
PBF Energy, Cl. A | 344,665 | 17,895,007 | |||||
Scorpio Tankers | 4,221,287 | a | 8,104,871 | ||||
Select Energy Services, Cl. A | 1,456,609 | a,b | 19,882,713 | ||||
107,823,485 | |||||||
Food & Staples Retailing - .5% | |||||||
US Foods Holding | 185,812 | b | 6,055,613 | ||||
Health Care Equipment & Services - 3.8% | |||||||
AxoGen | 249,606 | a,b | 10,945,223 | ||||
Evolent Health, Cl. A | 1,097,859 | a,b | 27,995,404 | ||||
HMS Holdings | 327,254 | b | 10,488,491 | ||||
49,429,118 | |||||||
Materials - 11.2% | |||||||
Alamos Gold | 1,796,497 | a | 7,886,622 | ||||
Arch Coal, Cl. A | 87,648 | a | 7,771,748 | ||||
Cabot | 610,233 | 39,616,326 | |||||
Eagle Materials | 176,097 | 16,259,036 | |||||
IAMGOLD | 3,511,408 | a,b | 14,326,545 | ||||
Methanex | 153,262 | 11,172,800 | |||||
OMNOVA Solutions | 1,721,485 | b | 15,579,439 | ||||
Tahoe Resources | 2,601,295 | a,b | 8,948,455 | ||||
TimkenSteel | 23,600 | b | 330,636 | ||||
US Concrete | 482,194 | a,b | 23,241,751 | ||||
145,133,358 | |||||||
Media - 4.7% | |||||||
Criteo, ADR | 961,785 | a,b | 23,861,886 | ||||
Gray Television | 550,877 | a,b | 9,612,804 | ||||
Nexstar Media Group, Cl. A | 167,154 | a | 13,706,628 | ||||
Sinclair Broadcast Group, Cl. A | 491,313 | 14,223,511 | |||||
61,404,829 | |||||||
Pharmaceuticals Biotechnology & Life Sciences - 11.7% | |||||||
Flexion Therapeutics | 645,105 | a,b | 14,772,904 | ||||
G1 Therapeutics | 272,353 | a,b | 16,526,380 | ||||
PRA Health Sciences | 67,351 | b | 7,112,266 | ||||
Revance Therapeutics | 759,161 | a,b | 20,801,011 | ||||
SAGE Therapeutics | 147,063 | a,b | 24,156,568 | ||||
TherapeuticsMD | 6,473,407 | b | 41,947,677 | ||||
Zogenix | 543,430 | b | 26,247,669 | ||||
151,564,475 | |||||||
9
STATEMENT OF INVESTMENTS (continued)
Description | Shares | Value ($) | |||||
Common Stocks - 96.8% (continued) | |||||||
Software & Services - 7.0% | |||||||
Acxiom | 609,990 | b | 27,870,443 | ||||
Cardtronics | 783,682 | b | 27,499,401 | ||||
CommVault Systems | 94,277 | b | 6,566,393 | ||||
Talend, ADR | 470,672 | b | 28,969,862 | ||||
90,906,099 | |||||||
Technology Hardware & Equipment - 8.5% | |||||||
Ciena | 1,353,952 | a,b | 42,757,804 | ||||
Finisar | 798,853 | a,b | 16,296,601 | ||||
Infinera | 1,766,607 | a,b | 15,811,133 | ||||
Sierra Wireless | 996,337 | a,b | 18,780,952 | ||||
Viavi Solutions | 1,408,645 | b | 15,776,824 | ||||
109,423,314 | |||||||
Transportation - 9.3% | |||||||
Knight-Swift Transportation Holdings | 736,669 | a | 25,142,513 | ||||
Mesa Air Group | 500,097 | 6,896,338 | |||||
Scorpio Bulkers | 478,586 | a | 3,254,385 | ||||
SkyWest | 568,406 | 37,116,912 | |||||
Werner Enterprises | 1,306,705 | a | 48,413,420 | ||||
120,823,568 | |||||||
Total Common Stocks (cost $1,016,776,918) | 1,252,195,773 | ||||||
Number of Warrants | |||||||
Warrants - .0% | |||||||
Diversified Financials - .0% | |||||||
Landcadia Holdings (6/1/23) | 301,090 | 255,927 | |||||
7-Day | Shares | ||||||
Investment Companies - 3.2% | |||||||
Registered Investment Companies - 3.2% | |||||||
Dreyfus Institutional Preferred Government Plus Money Market Fund | 1.91 | 42,131,453 | c | 42,131,453 | |||
10
Description | 7-Day | Shares | Value ($) | ||||
Investment of Cash Collateral for Securities Loaned - 3.7% | |||||||
Registered Investment Companies - 3.7% | |||||||
Dreyfus Institutional Preferred Government Money Market Fund, Institutional Shares | 1.87 | 47,435,457 | c | 47,435,457 | |||
Total Investments (cost $1,106,552,803) | 103.7% | 1,342,018,610 | |||||
Liabilities, Less Cash and Receivables | (3.7%) | (48,266,619) | |||||
Net Assets | 100.0% | 1,293,751,991 | |||||
ADR—American Depository Receipt
a Security, or portion thereof, on loan. At August 31, 2018, the value of the fund’s securities on loan was $269,193,939 and the value of the collateral held by the fund was $273,707,211, consisting of cash collateral of $47,435,457 and U.S. Government & Agency securities valued at $226,271,754.
b Non-income producing security.
c Investment in affiliated issuer. The investment objective of this investment company is publicly available and can be found within the respective investment company’s prospectus.
Portfolio Summary (Unaudited) † | Value (%) |
Consumer Discretionary | 17.5 |
Health Care | 15.5 |
Information Technology | 15.5 |
Financials | 15.2 |
Industrials | 13.1 |
Materials | 10.6 |
Energy | 8.9 |
Investment Companies | 6.9 |
Consumer Staples | .5 |
103.7 |
† Based on net assets.
See notes to financial statements.
11
STATEMENT OF INVESTMENTS IN AFFILIATED ISSUERS
Registered Investment Companies | Value | Purchases($) | Sales ($) | Value | Net | Dividends/ |
Dreyfus Institutional Preferred Government Money Market Fund, Institutional Shares | 161,197,475 | 784,975,695 | 898,737,713 | 47,435,457 | 3.7 | – |
Dreyfus Institutional Preferred Government Plus Money Market Fund | 11,747,168 | 376,548,164 | 346,163,879 | 42,131,453 | 3.2 | 271,607 |
Total | 172,944,643 | 1,161,523,859 | 1,244,901,592 | 89,566,910 | 6.9 | 271,607 |
See notes to financial statements.
12
STATEMENT OF ASSETS AND LIABILITIES
August 31, 2018
|
|
|
|
|
|
|
|
|
| Cost |
| Value |
|
Assets ($): |
|
|
|
| ||
Investments in securities—See Statement of Investments |
|
|
| |||
Unaffiliated issuers | 1,016,985,893 |
| 1,252,451,700 |
| ||
Affiliated issuers |
| 89,566,910 |
| 89,566,910 |
| |
Receivable for investment securities sold |
| 2,828,323 |
| |||
Dividends and securities lending income receivable |
| 846,376 |
| |||
Receivable for shares of Common Stock subscribed |
| 625,848 |
| |||
Prepaid expenses |
|
|
|
| 31,510 |
|
|
|
|
|
| 1,346,350,667 |
|
Liabilities ($): |
|
|
|
| ||
Due to The Dreyfus Corporation and affiliates—Note 3(b) |
|
|
| 982,837 |
| |
Liability for securities on loan—Note 1(b) |
| 47,435,457 |
| |||
Payable for investment securities purchased |
| 3,111,187 |
| |||
Payable for shares of Common Stock redeemed |
| 927,394 |
| |||
Directors fees and expenses payable |
| 12,386 |
| |||
Accrued expenses and other liabilities |
|
|
|
| 129,415 |
|
|
|
|
|
| 52,598,676 |
|
Net Assets ($) |
|
| 1,293,751,991 |
| ||
Composition of Net Assets ($): |
|
|
|
| ||
Paid-in capital |
|
|
|
| 906,243,439 |
|
Accumulated investment (loss)—net |
| (512,648) |
| |||
Accumulated net realized gain (loss) on investments |
|
|
|
| 152,555,393 |
|
Accumulated net unrealized appreciation (depreciation) |
| 235,465,807 |
| |||
Net Assets ($) |
|
| 1,293,751,991 |
| ||
Net Asset Value Per Share | Investor Shares | Class I | Class Y |
|
Net Assets ($) | 635,221,185 | 72,844,731 | 585,686,075 |
|
Shares Outstanding | 15,839,467 | 1,808,442 | 14,526,443 |
|
Net Asset Value Per Share ($) | 40.10 | 40.28 | 40.32 |
|
See notes to financial statements. |
13
STATEMENT OF OPERATIONS
Year Ended August 31, 2018
|
|
|
|
|
|
|
|
|
|
|
|
|
|
Investment Income ($): |
|
|
|
| ||
Income: |
|
|
|
| ||
Cash dividends (net of $60,716 foreign taxes withheld at source): |
| |||||
Unaffiliated issuers |
|
| 6,920,219 |
| ||
Affiliated issuers |
|
| 271,607 |
| ||
Income from securities lending—Note 1(b) |
|
| 557,566 |
| ||
Total Income |
|
| 7,749,392 |
| ||
Expenses: |
|
|
|
| ||
Management fee—Note 3(a) |
|
| 8,698,110 |
| ||
Shareholder servicing costs—Note 3(b) |
|
| 1,799,102 |
| ||
Directors’ fees and expenses—Note 3(c) |
|
| 89,256 |
| ||
Registration fees |
|
| 75,266 |
| ||
Professional fees |
|
| 74,006 |
| ||
Custodian fees—Note 3(b) |
|
| 48,637 |
| ||
Prospectus and shareholders’ reports |
|
| 34,628 |
| ||
Loan commitment fees—Note 2 |
|
| 26,623 |
| ||
Miscellaneous |
|
| 38,318 |
| ||
Total Expenses |
|
| 10,883,946 |
| ||
Less—reduction in fees due to earnings credits—Note 3(b) |
|
| (998) |
| ||
Net Expenses |
|
| 10,882,948 |
| ||
Investment (Loss)—Net |
|
| (3,133,556) |
| ||
Realized and Unrealized Gain (Loss) on Investments—Note 4 ($): |
|
| ||||
Net realized gain (loss) on investments | 182,469,411 |
| ||||
Net unrealized appreciation (depreciation) on investments |
|
| 59,192,998 |
| ||
Net Realized and Unrealized Gain (Loss) on Investments |
|
| 241,662,409 |
| ||
Net Increase in Net Assets Resulting from Operations |
| 238,528,853 |
| |||
See notes to financial statements. | ||||||
14
STATEMENT OF CHANGES IN NET ASSETS
|
|
|
| Year Ended August 31, | |||||
|
|
|
| 2018 |
| 2017 | a | ||
Operations ($): |
|
|
|
|
|
|
|
| |
Investment (loss)—net |
|
| (3,133,556) |
|
|
| (3,745,652) |
| |
Net realized gain (loss) on investments |
| 182,469,411 |
|
|
| 118,409,645 |
| ||
Net unrealized appreciation (depreciation) |
| 59,192,998 |
|
|
| 83,275,055 |
| ||
Net Increase (Decrease) in Net Assets | 238,528,853 |
|
|
| 197,939,048 |
| |||
Distributions to Shareholders from ($): |
| ||||||||
Net realized gain on investments: |
|
|
|
|
|
|
|
| |
Investor Shares |
|
| (56,618,655) |
|
|
| (3,999,748) |
| |
Class I |
|
| (7,439,198) |
|
|
| (665) |
| |
Class Y |
|
| (60,129,762) |
|
|
| (45) |
| |
Total Distributions |
|
| (124,187,615) |
|
|
| (4,000,458) |
| |
Capital Stock Transactions ($): |
| ||||||||
Net proceeds from shares sold: |
|
|
|
|
|
|
|
| |
Investor Shares |
|
| 144,162,912 |
|
|
| 217,081,169 |
| |
Class I |
|
| 32,244,708 |
|
|
| 66,561,226 |
| |
Class Y |
|
| 104,740,380 |
|
|
| 455,884,195 |
| |
Distributions reinvested: |
|
|
|
|
|
|
|
| |
Investor Shares |
|
| 54,909,530 |
|
|
| 3,036,951 |
| |
Class I |
|
| 6,496,612 |
|
|
| 620 |
| |
Class Y |
|
| 25,950,112 |
|
|
| - |
| |
Cost of shares redeemed: |
|
|
|
|
|
|
|
| |
Investor Shares |
|
| (106,539,619) |
|
|
| (705,991,264) |
| |
Class I |
|
| (25,655,205) |
|
|
| (15,345,775) |
| |
Class Y |
|
| (66,272,320) |
|
|
| (8,533,201) |
| |
Increase (Decrease) in Net Assets | 170,037,110 |
|
|
| 12,693,921 |
| |||
Total Increase (Decrease) in Net Assets | 284,378,348 |
|
|
| 206,632,511 |
| |||
Net Assets ($): |
| ||||||||
Beginning of Period |
|
| 1,009,373,643 |
|
|
| 802,741,132 |
| |
End of Period |
|
| 1,293,751,991 |
|
|
| 1,009,373,643 |
| |
Accumulated investment (loss)—net | (512,648) |
|
|
| - |
| |||
15
STATEMENT OF CHANGES IN NET ASSETS (continued)
|
|
|
| Year Ended August 31, | |||||
|
|
|
| 2018 |
| 2017 | a | ||
Capital Share Transactions (Shares): |
| ||||||||
Investor Sharesb |
|
|
|
|
|
|
|
| |
Shares sold |
|
| 3,784,355 |
|
|
| 6,575,414 |
| |
Shares issued for distributions reinvested |
|
| 1,508,504 |
|
|
| 90,709 |
| |
Shares redeemed |
|
| (2,825,723) |
|
|
| (20,354,904) |
| |
Net Increase (Decrease) in Shares Outstanding | 2,467,136 |
|
|
| (13,688,781) |
| |||
Class Ib |
|
|
|
|
|
|
|
| |
Shares sold |
|
| 845,857 |
|
|
| 1,899,812 |
| |
Shares issued for distributions reinvested |
|
| 177,941 |
|
|
| 18 |
| |
Shares redeemed |
|
| (668,800) |
|
|
| (446,386) |
| |
Net Increase (Decrease) in Shares Outstanding | 354,998 |
|
|
| 1,453,444 |
| |||
Class Yb |
|
|
|
|
|
|
|
| |
Shares sold |
|
| 2,759,859 |
|
|
| 13,014,137 |
| |
Shares issued for distributions reinvested |
|
| 710,572 |
|
|
| - |
| |
Shares redeemed |
|
| (1,721,775) |
|
|
| (236,350) |
| |
Net Increase (Decrease) in Shares Outstanding | 1,748,656 |
|
|
| 12,777,787 |
| |||
a On September 30, 2016, the fund redesignated existing shares as Investor shares and commenced offering Class I and Class Y shares. | |||||||||
b During the period ended August 31, 2018, 301,212 Investor shares representing $11,313,310 were exchanged for 300,505 Class Y shares, 108,847 Class Y shares representing $4,225,876 were exchanged for 108,913 Class I shares and during the period ended August 31, 2017, 3,150 Investor shares representing $91,861 were exchanged for 3,149 Class I shares, 12,139,913 Investor shares representing $423,925,756 were exchanged for 12,126,023 Class Y shares and 41,076 Class Y shares representing $1,482,175 were exchanged for 41,067 Class I shares. | |||||||||
| |||||||||
16
FINANCIAL HIGHLIGHTS
The following tables describe the performance for each share class for the fiscal periods indicated. All information (except portfolio turnover rate) reflects financial results for a single fund share. Total return shows how much your investment in the fund would have increased (or decreased) during each period, assuming you had reinvested all dividends and distributions. These figures have been derived from the fund’s financial statements.
Investor Shares | Year Ended August 31, | |||||||
2018 | 2017a | 2016 | 2015 | 2014 | ||||
Per Share Data ($): | ||||||||
Net asset value, beginning of period | 36.53 | 29.66 | 30.45 | 35.87 | 34.70 | |||
Investment Operations: | ||||||||
Investment (loss)—netb | (.16) | (.15) | (.05) | (.13) | (.13) | |||
Net realized and unrealized gain | 8.29 | 7.16 | .43 | .17 | 5.70 | |||
Total from Investment Operations | 8.13 | 7.01 | .38 | .04 | 5.57 | |||
Distributions: | ||||||||
Dividends from | - | - | (.10) | - | - | |||
Dividends from net realized | (4.56) | (.14) | (1.07) | (5.46) | (4.40) | |||
Total Distributions | (4.56) | (.14) | (1.17) | (5.46) | (4.40) | |||
Net asset value, end of period | 40.10 | 36.53 | 29.66 | 30.45 | 35.87 | |||
Total Return (%) | 23.51 | 23.67 | 1.34 | .18 | 16.95 | |||
Ratios/Supplemental Data (%): | ||||||||
Ratio of total expenses | 1.09 | 1.10 | 1.11 | 1.09 | 1.10 | |||
Ratio of net expenses | 1.09 | 1.10 | 1.11 | 1.09 | 1.10 | |||
Ratio of net investment (loss) | (.43) | (.44) | (.17) | (.41) | (.35) | |||
Portfolio Turnover Rate | 74.02 | 84.96 | 82.01 | 74.06 | 88.69 | |||
Net Assets, end of period ($ x 1,000) | 635,221 | 488,507 | 802,741 | 940,235 | 1,162,516 | |||
a On September 30, 2016, the fund redesignated existing shares as Investor shares.
b Based on average shares outstanding.
See notes to financial statements.
17
FINANCIAL HIGHLIGHTS (continued)
Class I Shares | Year Ended August 31, | ||||||||
2018 | 2017a | ||||||||
Per Share Data ($): | |||||||||
Net asset value, beginning of period | 36.60 | 30.62 | |||||||
Investment Operations: | |||||||||
Investment (loss)—netb | (.08) | (.07) | |||||||
Net realized and unrealized gain | 8.32 | 6.19 | |||||||
Total from Investment Operations | 8.24 | 6.12 | |||||||
Distributions: | |||||||||
Dividends from net realized | (4.56) | (.14) | |||||||
Net asset value, end of period | 40.28 | 36.60 | |||||||
Total Return (%) | 23.78 | 20.02c | |||||||
Ratios/Supplemental Data (%): | |||||||||
Ratio of total expenses | .87 | .95d | |||||||
Ratio of net expenses | .87 | .95d | |||||||
Ratio of net investment (loss) | (.20) | (.23)d | |||||||
Portfolio Turnover Rate | 74.02 | 84.96 | |||||||
Net Assets, end of period ($ x 1,000) | 72,845 | 53,194 | |||||||
a From September 30, 2016 (commencement of initial offering) to August 31, 2017.
b Based on average shares outstanding.
c Not annualized.
d Annualized.
See notes to financial statements.
18
Class Y Shares | Year Ended August 31, | ||||||||
2018 | 2017a | ||||||||
Per Share Data ($): | |||||||||
Net asset value, beginning of period | 36.60 | 30.62 | |||||||
Investment Operations: | |||||||||
Investment (loss)—netb | (.04) | (.01) | |||||||
Net realized and unrealized gain | 8.32 | 6.13 | |||||||
Total from Investment Operations | 8.28 | 6.12 | |||||||
Distributions: | |||||||||
Dividends from net realized | (4.56) | (.14) | |||||||
Net asset value, end of period | 40.32 | 36.60 | |||||||
Total Return (%) | 23.90 | 20.02c | |||||||
Ratios/Supplemental Data (%): | |||||||||
Ratio of total expenses | .79 | .81d | |||||||
Ratio of net expenses | .79 | .81d | |||||||
Ratio of net investment (loss) | (.12) | (.03)d | |||||||
Portfolio Turnover Rate | 74.02 | 84.96 | |||||||
Net Assets, end of period ($ x 1,000) | 585,686 | 467,673 | |||||||
a From September 30, 2016 (commencement of initial offering) to August 31, 2017.
b Based on average shares outstanding.
c Not annualized.
d Annualized.
See notes to financial statements.
19
NOTES TO FINANCIAL STATEMENTS
NOTE 1—Significant Accounting Policies:
Dreyfus Opportunistic Small Cap Fund (the “fund”) is a separate diversified series of Advantage Funds, Inc. (the “Company”), which is registered under the Investment Company Act of 1940, as amended (the “Act”), as an open-end management investment company and operates as a series company currently offering ten series, including the fund. The fund’s investment objective is to seek capital appreciation. The Dreyfus Corporation (the “Manager” or “Dreyfus”), a wholly-owned subsidiary of The Bank of New York Mellon Corporation (“BNY Mellon”), serves as the fund’s investment adviser.
MBSC Securities Corporation (the “Distributor”), a wholly-owned subsidiary of Dreyfus, is the distributor of the fund’s shares, which are sold without a sales charge. The fund is authorized to issue 400 million shares of $.001 par value Common Stock. The fund currently has authorized three classes of shares: Investor (200 million shares authorized), Class I (100 million shares authorized) and Class Y shares (100 million shares authorized). Investor shares are sold primarily to retail investors through financial intermediaries and bear Shareholder Services Plan fees. Class I and Y shares are sold at net asset value per share generally to institutional investors. Other differences between the classes include the services offered to and the expenses borne by each class, the allocation of certain transfer agency costs, and certain voting rights. Income, expenses (other than expenses attributable to a specific class), and realized and unrealized gains or losses on investments are allocated to each class of shares based on its relative net assets.
The Company accounts separately for the assets, liabilities and operations of each series. Expenses directly attributable to each series are charged to that series’ operations; expenses which are applicable to all series are allocated among them on a pro rata basis.
The Financial Accounting Standards Board (“FASB”) Accounting Standards Codification is the exclusive reference of authoritative U.S. generally accepted accounting principles (“GAAP”) recognized by the FASB to be applied by nongovernmental entities. Rules and interpretive releases of the Securities and Exchange Commission (“SEC”) under authority of federal laws are also sources of authoritative GAAP for SEC registrants. The fund’s financial statements are prepared in accordance with GAAP, which may require the use of management estimates and assumptions. Actual results could differ from those estimates.
20
The Company enters into contracts that contain a variety of indemnifications. The fund’s maximum exposure under these arrangements is unknown. The fund does not anticipate recognizing any loss related to these arrangements.
(a) Portfolio valuation: The fair value of a financial instrument is the amount that would be received to sell an asset or paid to transfer a liability in an orderly transaction between market participants at the measurement date (i.e., the exit price). GAAP establishes a fair value hierarchy that prioritizes the inputs of valuation techniques used to measure fair value. This hierarchy gives the highest priority to unadjusted quoted prices in active markets for identical assets or liabilities (Level 1 measurements) and the lowest priority to unobservable inputs (Level 3 measurements).
Additionally, GAAP provides guidance on determining whether the volume and activity in a market has decreased significantly and whether such a decrease in activity results in transactions that are not orderly. GAAP requires enhanced disclosures around valuation inputs and techniques used during annual and interim periods.
Various inputs are used in determining the value of the fund’s investments relating to fair value measurements. These inputs are summarized in the three broad levels listed below:
Level 1—unadjusted quoted prices in active markets for identical investments.
Level 2—other significant observable inputs (including quoted prices for similar investments, interest rates, prepayment speeds, credit risk, etc.).
Level 3—significant unobservable inputs (including the fund’s own assumptions in determining the fair value of investments).
The inputs or methodology used for valuing securities are not necessarily an indication of the risk associated with investing in those securities.
Changes in valuation techniques may result in transfers in or out of an assigned level within the disclosure hierarchy. Valuation techniques used to value the fund’s investments are as follows:
Investments in securities are valued at the last sales price on the securities exchange or national securities market on which such securities are primarily traded. Securities listed on the National Market System for which market quotations are available are valued at the official closing price or, if there is no official closing price that day, at the last sales price. For open short positions, asked prices are used for valuation purposes. Bid price is
21
NOTES TO FINANCIAL STATEMENTS (continued)
used when no asked price is available. Registered investment companies that are not traded on an exchange are valued at their net asset value. All of the preceding securities are generally categorized within Level 1 of the fair value hierarchy.
Securities not listed on an exchange or the national securities market, or securities for which there were no transactions, are valued at the average of the most recent bid and asked prices. These securities are generally categorized within Level 2 of the fair value hierarchy.
Fair valuing of securities may be determined with the assistance of a pricing service using calculations based on indices of domestic securities and other appropriate indicators, such as prices of relevant ADRs and futures. Utilizing these techniques may result in transfers between Level 1 and Level 2 of the fair value hierarchy.
When market quotations or official closing prices are not readily available, or are determined not to accurately reflect fair value, such as when the value of a security has been significantly affected by events after the close of the exchange or market on which the security is principally traded (for example, a foreign exchange or market), but before the fund calculates its net asset value, the fund may value these investments at fair value as determined in accordance with the procedures approved by the Company’s Board of Directors (the “Board”). Certain factors may be considered when fair valuing investments such as: fundamental analytical data, the nature and duration of restrictions on disposition, an evaluation of the forces that influence the market in which the securities are purchased and sold, and public trading in similar securities of the issuer or comparable issuers. These securities are either categorized within Level 2 or 3 of the fair value hierarchy depending on the relevant inputs used.
For restricted securities where observable inputs are limited, assumptions about market activity and risk are used and such securities are generally categorized within Level 3 of the fair value hierarchy.
The following is a summary of the inputs used as of August 31, 2018 in valuing the fund’s investments:
22
Level 1 - Unadjusted Quoted Prices | Level 2 - Other Significant Observable Inputs | Level 3 -Significant Unobservable Inputs | Total | |
Assets ($) | ||||
Investments in Securities: | ||||
Equity Securities- Common Stocks† | 1,252,195,773 | - | - | 1,252,195,773 |
Warrants† | 255,927 | - | - | 255,927 |
Registered Investment Companies | 89,566,910 | - | - | 89,566,910 |
† See Statement of Investments for additional detailed categorizations.
At August 31, 2018, there were no transfers between levels of the fair value hierarchy. It is the fund’s policy to recognize transfers between levels at the end of the reporting period.
(b) Securities transactions and investment income: Securities transactions are recorded on a trade date basis. Realized gains and losses from securities transactions are recorded on the identified cost basis. Dividend income is recognized on the ex-dividend date and interest income, including, where applicable, accretion of discount and amortization of premium on investments, is recognized on the accrual basis.
Pursuant to a securities lending agreement with The Bank of New York Mellon, a subsidiary of BNY Mellon and an affiliate of Dreyfus, the fund may lend securities to qualified institutions. It is the fund’s policy that, at origination, all loans are secured by collateral of at least 102% of the value of U.S. securities loaned and 105% of the value of foreign securities loaned. Collateral equivalent to at least 100% of the market value of securities on loan is maintained at all times. Collateral is either in the form of cash, which can be invested in certain money market mutual funds managed by Dreyfus, or U.S. Government and Agency securities. The fund is entitled to receive all dividends, interest and distributions on securities loaned, in addition to income earned as a result of the lending transaction. Should a borrower fail to return the securities in a timely manner, The Bank of New York Mellon is required to replace the securities for the benefit of the fund or credit the fund with the market value of the unreturned securities and is subrogated to the fund’s rights against the borrower and the collateral. Additionally, the contractual maturity of security lending transactions are on an overnight and continuous basis. During the period ended August 31, 2018, The Bank of New York Mellon earned $103,226 from lending portfolio securities, pursuant to the securities lending agreement.
23
NOTES TO FINANCIAL STATEMENTS (continued)
(c) Affiliated issuers: Investments in other investment companies advised by Dreyfus are defined as “affiliated” under the Act.
(d) Dividends and distributions to shareholders: Dividends and distributions are recorded on the ex-dividend date. Dividends from investment income-net and dividends from net realized capital gains, if any, are normally declared and paid annually, but the fund may make distributions on a more frequent basis to comply with the distribution requirements of the Internal Revenue Code of 1986, as amended (the “Code”). To the extent that net realized capital gains can be offset by capital loss carryovers, it is the policy of the fund not to distribute such gains. Income and capital gain distributions are determined in accordance with income tax regulations, which may differ from GAAP.
(e) Federal income taxes: It is the policy of the fund to continue to qualify as a regulated investment company, if such qualification is in the best interests of its shareholders, by complying with the applicable provisions of the Code, and to make distributions of taxable income sufficient to relieve it from substantially all federal income and excise taxes.
As of and during the period ended August 31, 2018, the fund did not have any liabilities for any uncertain tax positions. The fund recognizes interest and penalties, if any, related to uncertain tax positions as income tax expense in the Statement of Operations. During the period ended August 31, 2018, the fund did not incur any interest or penalties.
Each tax year in the four-year period ended August 31, 2018 remains subject to examination by the Internal Revenue Service and state taxing authorities.
At August 31, 2018, the components of accumulated earnings on a tax basis were as follows: undistributed ordinary income $38,077,625, undistributed capital gains $118,387,865 and unrealized appreciation $231,043,062.
The tax character of distributions paid to shareholders during the fiscal periods ended August 31, 2018 and August 31, 2017 were as follows: ordinary income $13,576,887 and $0, and long-term capital gains $110,610,728 and $4,000,458, respectively.
During the period ended August 31, 2018, as a result of permanent book to tax differences, primarily due to the tax treatment for net operating losses, the fund increased accumulated undistributed investment income-net by $2,620,908 and decreased accumulated net realized gain (loss) on investments by the same amount. Net assets and net asset value per share were not affected by this reclassification.
24
(f) New Accounting Pronouncements: In August 2018, the FASB issued Accounting Standards Update 2018-13, Fair Value Measurement (Topic 820): Disclosure Framework—Changes to the Disclosure Requirements for Fair Value Measurement (“ASU 2018-13”). The update provides guidance that eliminates, adds and modifies certain disclosure requirements for fair value measurements. ASU 2018-13 will be effective for annual periods beginning after December 15, 2019. Management is currently assessing the potential impact of these changes to future financial statements.
NOTE 2—Bank Lines of Credit:
The fund participates with other Dreyfus-managed funds in an $830 million unsecured credit facility led by Citibank, N.A. and a $300 million unsecured credit facility provided by The Bank of New York Mellon (each, a “Facility”), each to be utilized primarily for temporary or emergency purposes, including the financing of redemptions. Prior to October 4, 2017, the unsecured credit facility with Citibank, N.A. was $810 million. In connection therewith, the fund has agreed to pay its pro rata portion of commitment fees for each Facility. Interest is charged to the fund based on rates determined pursuant to the terms of the respective Facility at the time of borrowing. During the period ended August 31, 2018, the fund did not borrow under the Facilities.
NOTE 3—Management Fee and Other Transactions with Affiliates:
(a) Pursuant to a management agreement with Dreyfus, the management fee is computed at the annual rate of .75% of the value of the fund’s average daily net assets and is payable monthly.
(b) Under the Shareholder Services Plan, Investor shares pay the Distributor at an annual rate of .25% of the value of its average daily net assets for the provision of certain services. The services provided may include personal services relating to shareholder accounts, such as answering shareholder inquiries regarding the fund and providing reports and other information, and services related to the maintenance of shareholder accounts, such as recordkeeping and sub-accounting services. The Distributor may make payments to Service Agents (securities dealers, financial institutions or other industry professionals) with respect to these services. The Distributor determines the amounts to be paid to Service Agents. During the period ended August 31, 2018, the fund was charged $1,382,900 pursuant to the Shareholder Services Plan.
The fund has arrangements with the transfer agent and the custodian whereby the fund may receive earnings credits when positive cash balances
25
NOTES TO FINANCIAL STATEMENTS (continued)
are maintained, which are used to offset transfer agency and custody fees. For financial reporting purposes, the fund includes net earnings credits, if any, as an expense offset in the Statement of Operations.
The fund compensates Dreyfus Transfer, Inc., a wholly-owned subsidiary of Dreyfus, under a transfer agency agreement for providing transfer agency and cash management services for the fund. The majority of transfer agency fees are comprised of amounts paid on a per account basis, while cash management fees are related to fund subscriptions and redemptions. During the period ended August 31, 2018, the fund was charged $92,550 for transfer agency services. These fees are included in Shareholder servicing costs in the Statement of Operations.
The fund compensates The Bank of New York Mellon under a custody agreement for providing custodial services for the fund. These fees are determined based on net assets, geographic region and transaction activity. During the period ended August 31, 2018, the fund was charged $48,637 pursuant to the custody agreement. These fees were partially offset by earnings credits of $998.
During the period ended August 31, 2018, the fund was charged $13,269 for services performed by the Chief Compliance Officer and his staff. These fees are included in Miscellaneous in the Statement of Operations.
The components of “Due to The Dreyfus Corporation and affiliates” in the Statement of Assets and Liabilities consist of: management fees $811,690, Shareholder Services Plan fees $132,400, custodian fees $16,834, Chief Compliance Officer fees $5,693 and transfer agency fees $16,220.
(c) Each Board member also serves as a Board member of other funds within the Dreyfus complex. Annual retainer fees and attendance fees are allocated to each fund based on net assets.
NOTE 4—Securities Transactions:
The aggregate amount of purchases and sales of investment securities, excluding short-term securities, during the period ended August 31, 2018, amounted to $848,984,587 and $835,017,123, respectively.
At August 31, 2018, the cost of investments for federal income tax purposes was $1,110,975,548; accordingly, accumulated net unrealized appreciation on investments was $231,043,062, consisting of $279,767,803 gross unrealized appreciation and $48,724,741 gross unrealized depreciation.
26
REPORT OF INDEPENDENT REGISTERED PUBLIC ACCOUNTING FIRM
To the Shareholders and the Board of Directors of Dreyfus Opportunistic Small Cap Fund
Opinion on the Financial Statements
We have audited the accompanying statement of assets and liabilities of Dreyfus Opportunistic Small Cap Fund (the “Fund”) (one of the funds constituting Advantage Funds, Inc.), including the statements of investments and investments in affiliated issuers, as of August 31, 2018, and the related statement of operations for the year then ended, the statements of changes in net assets for each of the two years in the period then ended, the financial highlights for each of the five years in the period then ended and the related notes (collectively referred to as the “financial statements”). In our opinion, the financial statements present fairly, in all material respects, the financial position of the Fund (one of the funds constituting Advantage Funds, Inc.) at August 31, 2018, the results of its operations for the year then ended, the changes in its net assets for each of the two years in the period then ended and its financial highlights for each of the five years in the period then ended, in conformity with U.S. generally accepted accounting principles.
Basis for Opinion
These financial statements are the responsibility of the Fund’s management. Our responsibility is to express an opinion on the Fund’s financial statements based on our audits. We are a public accounting firm registered with the Public Company Accounting Oversight Board (United States) (“PCAOB”) and are required to be independent with respect to the Fund in accordance with the U.S. federal securities laws and the applicable rules and regulations of the Securities and Exchange Commission and the PCAOB.
We conducted our audits in accordance with the standards of the PCAOB. Those standards require that we plan and perform the audit to obtain reasonable assurance about whether the financial statements are free of material misstatement, whether due to error or fraud. The Fund is not required to have, nor were we engaged to perform, an audit of the Fund’s internal control over financial reporting. As part of our audits, we are required to obtain an understanding of internal control over financial reporting, but not for the purpose of expressing an opinion on the effectiveness of the Fund’s internal control over financial reporting. Accordingly, we express no such opinion.
Our audits included performing procedures to assess the risks of material misstatement of the financial statements, whether due to error or fraud, and performing procedures that respond to those risks. Such procedures included examining, on a test basis, evidence regarding the amounts and disclosures in the financial statements. Our procedures included confirmation of securities owned as of August 31, 2018, by correspondence with the custodian and others or by other appropriate auditing procedures where replies from others were not received. Our audits also included evaluating the accounting principles used and significant estimates made by management, as well as evaluating the overall presentation of the financial statements. We believe that our audits provide a reasonable basis for our opinion.

We have served as the auditor of one or more Dreyfus investment companies since at least 1957, but we are unable to determine the specific year.
New York, New York
October 26, 2018
27
IMPORTANT TAX INFORMATION (Unaudited)
For federal tax purposes, the fund hereby reports 37.64% of the ordinary dividends paid during the fiscal year ended August 31, 2018 as qualifying for the corporate dividends received deduction. Also, certain dividends paid by the fund may be subject to a maximum tax rate of 15%, as provided for by the Jobs and Growth Tax Relief Reconciliation Act of 2003. Of the distributions paid during the fiscal year, $5,081,524 represents the maximum amount that may be considered qualified dividend income. The fund also hereby reports $.4980 per share as a short-term capital gain distribution and $4.0572 per share as a long-term capital gain distribution paid on December 15, 2017. Shareholders will receive notification in early 2019 of the percentage applicable to the preparation of their 2018 income tax returns.
28
BOARD MEMBERS INFORMATION (Unaudited)
INDEPENDENT BOARD MEMBERS
Chairman of the Board (1995)
Principal Occupation During Past 5 Years:
· Corporate Director and Trustee (1995-present)
Other Public Company Board Memberships During Past 5 Years:
· CBIZ (formerly, Century Business Services, Inc.), a provider of outsourcing functions for small and medium size companies, Director (1997-present)
No. of Portfolios for which Board Member Serves: 125
———————
Peggy C. Davis (75)
Board Member (2006)
Principal Occupation During Past 5 Years:
· Shad Professor of Law, New York University School of Law (1983-present)
No. of Portfolios for which Board Member Serves: 45
———————
David P. Feldman (78)
Board Member (1996)
Principal Occupation During Past 5 Years:
· Corporate Director and Trustee (1985-present)
Other Public Company Board Memberships During Past 5 Years:
· BBH Mutual Funds Group (5 registered mutual funds), Director (1992-2014)
No. of Portfolios for which Board Member Serves: 31
———————
Joan Gulley (70)
Board Member (2017)
Principal Occupation During Past 5 Years:
· PNC Financial Services Group, Inc.(1993-2014), Executive Vice President and Chief Human Resources Officer and Executive Committee Member (2008-2014)
No. of Portfolios for which Board Member Serves: 52
———————
29
BOARD MEMBERS INFORMATION (Unaudited) (continued)
INDEPENDENT BOARD MEMBERS (continued)
Ehud Houminer (78)
Board Member (1993)
Principal Occupation During Past 5 Years:
· Board of Overseers at the Columbia Business School, Columbia University (1992-present)
· Trustee, Ben Gurion University
No. of Portfolios for which Board Member Serves: 52
———————
Lynn Martin (78)
Board Member (2012)
Principal Occupation During Past 5 Years:
· President of The Martin Hall Group LLC, a human resources consulting firm (2005-2012)
No. of Portfolios for which Board Member Serves: 31
———————
Robin A. Melvin (54)
Board Member (2012)
Principal Occupation During Past 5 Years:
· Co-chairman, Illinois Mentoring Partnership, non-profit organization dedicated to increasing the quantity and quality of mentoring services in Illinois; (2014-present; board member since 2013)
No. of Portfolios for which Board Member Serves: 100
———————
Dr. Martin Peretz (79)
Board Member (2006)
Principal Occupation During Past 5 Years:
· Editor-in-Chief Emeritus of The New Republic Magazine (2011-2012) (previously,
Editor-in-Chief, 1974-2011)
· Lecturer at Harvard University (1968-2010)
No. of Portfolios for which Board Member Serves: 31
———————
Once elected all Board Members serve for an indefinite term, but achieve Emeritus status upon reaching age 80. The address of the Board Members and Officers is c/o The Dreyfus Corporation, 200 Park Avenue, New York, New York 10166. Additional information about the Board Members is available in the fund’s Statement of Additional Information which can be obtained from Dreyfus free of charge by calling this toll free number: 1-800-DREYFUS.
James F. Henry, Emeritus Board Member
Philip L. Toia, Emeritus Board Member
30
OFFICERS OF THE FUND (Unaudited)
BRADLEY J. SKAPYAK, President since January 2010.
Chief Operating Officer and a director of the Manager since June 2009, Chairman of Dreyfus Transfer, Inc., an affiliate of the Manager and the transfer agent of the funds, since May 2011 and Chief Executive Officer of MBSC Securities Corporation since August 2016. He is an officer of 62 investment companies (comprised of 125 portfolios) managed by the Manager. He is 59 years old and has been an employee of the Manager since February 1988.
BENNETT A. MACDOUGALL, Chief Legal Officer since October 2015.
Chief Legal Officer of the Manager and Associate General Counsel and Managing Director of BNY Mellon since June 2015; from June 2005 to June 2015, he served in various capacities with Deutsche Bank – Asset & Wealth Management Division, including as Director and Associate General Counsel, and Chief Legal Officer of Deutsche Investment Management Americas Inc. from June 2012 to May 2015. He is an officer of 63 investment companies (comprised of 150 portfolios) managed by the Manager. He is 46 years old and has been an employee of the Manager since June 2015.
JAMES BITETTO, Vice President since August 2005 and Secretary since February 2018.
Managing Counsel of BNY Mellon and Secretary of the Manager, and an officer of 63 investment companies (comprised of 150 portfolios) managed by the Manager. He is 52 years old and has been an employee of the Manager since December 1996.
JOSEPH M. CHIOFFI, Vice President and Assistant Secretary since August 2005.
Managing Counsel of BNY Mellon, and an officer of 63 investment companies (comprised of 150 portfolios) managed by the Manager. He is 56 years old and has been an employee of the Manager since June 2000.
SONALEE CROSS, Vice President and Assistant Secretary since March 2018.
Counsel of BNY Mellon since October 2016; Associate at Proskauer Rose LLP from April 2016 to September 2016; Attorney at EnTrust Capital from August 2015 to February 2016; Associate at Sidley Austin LLP from September 2013 until August 2015. She is an officer of 63 investment companies (comprised of 150 portfolios) managed by Dreyfus. She is 30 years old and has been an employee of the Manager since October 2016.
MAUREEN E. KANE, Vice President and Assistant Secretary since April 2015.
Managing Counsel of BNY Mellon since July 2014; from October 2004 until July 2014, General Counsel, and from May 2009 until July 2014, Chief Compliance Officer of Century Capital Management. She is an officer of 63 investment companies (comprised of 150 portfolios) managed by the Manager. She is 56 years old and has been an employee of the Manager since July 2014.
SARAH S. KELLEHER, Vice President and Assistant Secretary since April 2014.
Managing Counsel of BNY Mellon. She is an officer of 63 investment companies (comprised of 150 portfolios) managed by the Manager. She is 42 years old and has been an employee of the Manager since March 2013.
JEFF PRUSNOFSKY, Vice President and Assistant Secretary since August 2005.
Senior Managing Counsel of BNY Mellon, and an officer of 63 investment companies (comprised of 150 portfolios) managed by the Manager. He is 53 years old and has been an employee of the Manager since October 1990.
NATALYA ZELENSKY, Vice President and Assistant Secretary since March 2017.
Counsel of BNY Mellon since May 2016; Attorney at Wildermuth Endowment Strategy Fund/Wildermuth Advisory, LLC from November 2015 until May 2016; Assistant General Counsel at RCS Advisory Services from July 2014 until November 2015; Associate at Sutherland, Asbill & Brennan from January 2013 until January 2014. She is an officer of 63 investment companies (comprised of 150 portfolios) managed by Dreyfus. She is 33 years old and has been an employee of the Manager since May 2016.
JAMES WINDELS, Treasurer since November 2001.
Director – Mutual Fund Accounting of the Manager, and an officer of 63 investment companies (comprised of 150 portfolios) managed by the Manager. He is 59 years old and has been an employee of the Manager since April 1985.
RICHARD CASSARO, Assistant Treasurer since January 2008.
Senior Accounting Manager – Money Market and Municipal Bond Funds of the Manager, and an officer of 63 investment companies (comprised of 150 portfolios) managed by the Manager. He is 59 years old and has been an employee of the Manager since September 1982.
31
OFFICERS OF THE FUND (Unaudited) (continued)
GAVIN C. REILLY, Assistant Treasurer since December 2005.
Tax Manager of the Investment Accounting and Support Department of the Manager, and an officer of 63 investment companies (comprised of 150 portfolios) managed by the Manager. He is 50 years old and has been an employee of the Manager since April 1991.
ROBERT S. ROBOL, Assistant Treasurer since August 2005.
Senior Accounting Manager – Dreyfus Financial Reporting of the Manager, and an officer of 63 investment companies (comprised of 150 portfolios) managed by the Manager. He is 54 years old and has been an employee of the Manager since October 1988.
ROBERT SALVIOLO, Assistant Treasurer since July 2007.
Senior Accounting Manager – Equity Funds of the Manager, and an officer of 63 investment companies (comprised of 150 portfolios) managed by the Manager. He is 51 years old and has been an employee of the Manager since June 1989.
ROBERT SVAGNA, Assistant Treasurer since December 2002.
Senior Accounting Manager – Fixed Income and Equity Funds of the Manager, and an officer of 63 investment companies (comprised of 150 portfolios) managed by the Manager. He is 51 years old and has been an employee of the Manager since November 1990.
JOSEPH W. CONNOLLY, Chief Compliance Officer since October 2004.
Chief Compliance Officer of the Manager, the Dreyfus Family of Funds and BNY Mellon Funds Trust (63 investment companies, comprised of 150 portfolios). He is 61 years old and has served in various capacities with the Manager since 1980, including manager of the firm’s Fund Accounting Department from 1997 through October 2001.
CARIDAD M. CAROSELLA, Anti-Money Laundering Compliance Officer since January 2016.
Anti-Money Laundering Compliance Officer of the Dreyfus Family of Funds and BNY Mellon Funds Trust since January 2016; from May 2015 to December 2015, Interim Anti-Money Laundering Compliance Officer of the Dreyfus Family of Funds and BNY Mellon Funds Trust and the Distributor; from January 2012 to May 2015, AML Surveillance Officer of the Distributor and from 2007 to December 2011, Financial Processing Manager of the Distributor. She is an officer of 57 investment companies (comprised of 144 portfolios) managed by the Manager. She is 50 years old and has been an employee of the Distributor since 1997.
32
NOTES
33
Dreyfus Opportunistic Small Cap Fund
200 Park Avenue
New York, NY 10166
Manager
The Dreyfus Corporation
200 Park Avenue
New York, NY 10166
Custodian
The Bank of New York Mellon
240 Greenwich Street
New York, NY 10286
Transfer Agent &
Dividend Disbursing Agent
Dreyfus Transfer, Inc.
200 Park Avenue
New York, NY 10166
Distributor
MBSC Securities Corporation
200 Park Avenue
New York, NY 10166
Ticker Symbols: | Investor: DSCVX Class I: DOPIX Class Y: DSCYX |
Telephone Call your financial representative or 1-800-DREYFUS
Mail The Dreyfus Family of Funds, 144 Glenn Curtiss Boulevard, Uniondale, NY 11556-0144
E-mail Send your request to info@dreyfus.com
Internet Information can be viewed online or downloaded at www.dreyfus.com
The fund files its complete schedule of portfolio holdings with the Securities and Exchange Commission (“SEC”) for the first and third quarters of each fiscal year on Form N-Q. The fund’s Forms N-Q are available on the SEC’s website at www.sec.gov and may be reviewed and copied at the SEC’s Public Reference Room in Washington, D.C. (phone 1-800-SEC-0330 for information).
A description of the policies and procedures that the fund uses to determine how to vote proxies relating to portfolio securities and information regarding how the fund voted these proxies for the most recent 12-month period ended June 30 is available at www.dreyfus.com and on the SEC’s website at www.sec.gov and without charge, upon request, by calling 1-800-DREYFUS.
© 2018 MBSC Securities Corporation |
|

Dreyfus Strategic Value Fund
| ANNUAL REPORT |

|

Save time. Save paper. View your next shareholder report online as soon as it’s available. Log into www.dreyfus.com and sign up for Dreyfus eCommunications. It’s simple and only takes a few minutes. |
The views expressed in this report reflect those of the portfolio manager(s) only through the end of the period covered and do not necessarily represent the views of Dreyfus or any other person in the Dreyfus organization. Any such views are subject to change at any time based upon market or other conditions and Dreyfus disclaims any responsibility to update such views. These views may not be relied on as investment advice and, because investment decisions for a Dreyfus fund are based on numerous factors, may not be relied on as an indication of trading intent on behalf of any Dreyfus fund. |
Not FDIC-Insured • Not Bank-Guaranteed • May Lose Value |
Contents
THE FUND
With Those of Other Funds | |
in Affiliated Issuers | |
Public Accounting Firm | |
FOR MORE INFORMATION
Back Cover
| The Fund |
A LETTER FROM THE PRESIDENT OF DREYFUS
Dear Shareholder:
We are pleased to present this annual report for Dreyfus Strategic Value Fund, covering the 12-month period from September 1, 2017 through August 31, 2018. For information about how the fund performed during the reporting period, as well as general market perspectives, we provide a Discussion of Fund Performance on the pages that follow.
The 12-month period started on solid footing which gave way to a shifting landscape. Through February of 2018, major global economies appeared to be in lock-step as they moved towards less accommodative monetary policy and concurrent growth. In the equity markets, both U.S. and non-U.S. markets enjoyed an upward trek across sectors and market caps. Interest rates rose across the curve putting pressure on bond prices, but sectors such as investment grade and high yield corporates, non-U.S. dollar denominated bonds and emerging market debt, were able to outperform like-duration U.S. Treasuries.
In February, the first rumblings of discontent shook equity markets. Global growth and monetary policy paths began to diverge. Non-U.S. economies weakened. Momentum sputtered, and equities began to struggle. Emerging market debt, non-U.S. denominated bonds and corporate debt gave up much of the performance earned earlier in the period. Long-term U.S. interest rates started to fall. The shockwave ended in April and pressure on U.S. equity markets eased, allowing U.S. equity markets to end the 12-month period with double-digit gains.
Despite new concerns regarding trade, U.S. inflationary pressures and global growth, we are optimistic that U.S. consumer spending, corporate earnings, and economic data will remain strong in the near term. However, we will stay attentive to signs that might signal possible changes on the horizon. As always, we encourage you to discuss the risks and opportunities of today’s investment environment with your financial advisor.
Thank you for your continued confidence and support.
Sincerely,

Renee Laroche-Morris
President
The Dreyfus Corporation
September 17, 2018
2
DISCUSSION OF FUND PERFORMANCE (Unaudited)
For the period from September 1, 2017 through August 31, 2018, as provided by Brian C. Ferguson, John C. Bailer, and David S. Intoppa, Portfolio Managers
Market and Fund Performance Overview
For the 12-month period ended August 31, 2018, Dreyfus Strategic Value Fund’s Class A shares produced a total return of 16.68%, Class C shares returned 15.86%, Class I shares returned 16.99%, and Class Y shares returned 17.05%.1 The fund’s benchmark, the Russell 1000® Value Index (the “Index”), produced a total return of 12.47% for the same period.2
U.S. equity markets rose during the reporting period amid better-than-expected corporate earnings and improving economic prospects. The fund outperformed its benchmark, primarily on the strength of favorable sector allocations and successful security selections in the energy, utilities, industrials, and consumer staples sectors.
The Fund’s Investment Approach
The fund seeks capital appreciation. To pursue its goal, the fund normally invests at least 80% of its net assets, plus any borrowings for investment purposes, in stocks. The fund may invest up to 30% of its assets in foreign securities. The fund’s portfolio managers identify potential investments through extensive quantitative and fundamental research. The fund will focus on individual stock selection (a “bottom-up” approach), emphasizing three key factors: value, sound business fundamentals, and positive business momentum.
Positive Economic Trends and Strong Corporate Earnings Boosted Stocks
The long-running U.S. economic expansion that began in mid-2009 continued throughout the reporting period, maintaining a favorable backdrop for equity markets. September 2017 saw an upward revision to second-quarter GDP growth despite hurricane-related economic disruptions. Positive economic news continued to accumulate during the remainder of 2017, as corporate earnings exceeded expectations, economic growth remained near 3%, and the Federal Reserve Board (the “Fed”) raised growth forecasts for 2018. Tax reform legislation in December caused markets to rally sharply, and the Index reached new all-time highs.
January 2018 saw a continuation of positive market and economic trends. Economic data indicated robust levels of consumer spending during the critical year-end shopping season, and long-awaited signs of wage growth began to appear. However, concerns about rising inflationary pressures and prospects for more aggressive interest-rate hikes by the Fed began to weigh on market sentiment. In response to these concerns, markets dipped sharply in early February.
In the second half of the reporting period, trade tensions also became a concern, but earnings were strong, and the U.S. economy continued to gain momentum. The employment picture also improved, and consumer and business confidence remained high. Although the global economy moderated, economic activity remained positive despite rising trade tensions and geopolitical concerns. As a result, the Index nearly regained its previous high.
For the reporting period overall, small-cap stocks fared better than their mid- and large-cap counterparts, and growth stocks outperformed value stocks.
Performance Helped by Sector Allocations and Stock Selections
The fund’s performance versus the Index benefited significantly from an overweight to the energy sector as well as from stock selection. In the exploration-and-production industry, the fund’s positions in EOG Resources, Occidental Petroleum, and Hess added to performance, as these companies benefited from improved earnings and higher oil prices. In the refining industry, Phillips 66 and Valero Energy took advantage of lower input costs and steady demand for refined products. In the utilities sector,
3
DISCUSSION OF FUND PERFORMANCE (Unaudited) (continued)
which lagged the Index, the fund benefited from a significant underweight. A position in FirstEnergy also added to performance, as the company made progress on its planned exit from the merchant energy business in favor of the more stable regulated segment of the utility industry, leading to outperformance for the stock. The fund also benefited from a slight overweight to the industrials sector and from certain stock selections there. In addition, positions in defense contractors Harris and Raytheon added to returns, as defense spending globally has been strong. The fund’s underweight to consumer staples also contributed, as that sector lagged the Index, and a slight overweight of information technology also proved beneficial. There, Cisco Systems earned higher profits and used repatriated cash to increase its dividend and buy back stock.
The fund underperformed its benchmark in only one sector, materials. There, positions in Martin Marietta Materials and Vulcan Materials, construction materials companies, hurt performance. Both companies were hindered by lower-than-expected volumes due in part to weather-related issues. A position in Newmont Mining, a metals producer, also detracted from performance, as prices for gold and copper declined. A few individual holdings in other sectors further detracted from returns, including diversified financial institution Wells Fargo & Co., media company Comcast, and food giant Kraft Heinz.
Investment Environment Remains Supportive
We believe that with the domestic economy expanding and the global economy remaining relatively strong, the environment is supportive for the stock market and the fund’s investment approach. Inflation remains modest, and though interest rates are rising, financial conditions are not tight. In addition, although trade tensions are a concern, the impact of tariffs so far has been modest. As of the end of the reporting period, we have continued to find attractive investment opportunities in the financials, materials, energy, telecommunications, industrials, and information technology sectors. In contrast, we are finding relatively few opportunities in the real estate, utilities, consumer staples, and consumer discretionary sectors.
September 17, 2018
1 Total return includes reinvestment of dividends and any capital gains paid, and does not take into consideration the maximum initial sales charge in the case of Class A shares, or the applicable contingent deferred sales charges imposed on redemptions in the case of Class C shares. Had these charges been reflected, returns would have been lower. Past performance is no guarantee of future results. Share price and investment return fluctuate such that upon redemption, fund shares may be worth more or less than their original cost. The fund’s returns reflect the absorption of certain fund expenses by The Dreyfus Corporation pursuant to an agreement in effect through December 31, 2018, at which time it may be extended, terminated, or modified. Had these expenses not been absorbed, the fund’s returns would have been lower.
2 Source: Lipper Inc. — The Russell 1000® Value Index measures the performance of the large-cap value segment of the U.S. equity universe. It includes those Russell 1000 companies that are considered more value-oriented relative to the overall market as defined by Russell’s leading style methodology. The Russell 1000® Value Index is constructed to provide a comprehensive and unbiased barometer for the large-cap value segment. The index is completely reconstituted annually to ensure new and growing equities are included and that the represented companies continue to reflect value characteristics. Investors cannot invest directly in any index.
Please note: the position in any security highlighted with italicized typeface was sold during the reporting period.
Equities are subject generally to market, market sector, market liquidity, issuer, and investment style risks, among other factors, to varying degrees, all of which are more fully described in the fund’s prospectus.
The fund’s performance will be influenced by political, social, and economic factors affecting investments in foreign companies. Special risks associated with investments in foreign companies include exposure to currency fluctuations, less liquidity, less developed or less efficient trading markets, lack of comprehensive company information, political instability, and differing auditing and legal standards. These risks are enhanced in emerging market countries. Please read the prospectus for further discussion of these risks.
4
FUND PERFORMANCE (Unaudited)

Comparison of change in value of $10,000 investment in Dreyfus Strategic Value Fund Class A shares, Class C shares, Class I shares and Class Y shares and the Russell 1000® Value Index (the “Index”)
† Source: Lipper Inc.
†† The total return figures presented for Class Y shares of the fund reflect the performance of the fund’s Class A shares for the period prior to 7/1/13 (the inception date for Class Y shares), not reflecting the applicable sales charges for Class A shares.
Past performance is not predictive of future performance.
The above graph compares a $10,000 investment made in each of the Class A, Class C, Class I and Class Y shares of Dreyfus Strategic Value Fund on 8/31/08 to a $10,000 investment made in the Index on that date. All dividends and capital gain distributions are reinvested.
The fund’s performance shown in the line graph above takes into account the maximum initial sales charge on Class A shares and all other applicable fees and expenses on all classes. The Index measures the performance of the large-cap value segment of the U.S. equity universe. It includes those Russell 1000 companies that are considered more value-oriented relative to the overall market as defined by Russell's leading style methodology. The Russell 1000® Value Index is constructed to provide a comprehensive and unbiased barometer for the large-cap value segment. The index is completely reconstituted annually to ensure new and growing equities are included and that the represented companies continue to reflect value characteristics. Unlike a mutual fund, the Index is not subject to charges, fees and other expenses. Investors cannot invest directly in any index. Further information relating to fund performance, including expense reimbursements, if applicable, is contained in the Financial Highlights section of the prospectus and elsewhere in this report.
5
FUND PERFORMANCE (Unaudited) (continued)
Average Annual Total Returns as of 8/31/18 | |||||||
Inception | |||||||
|
| Date | 1 Year | 5 Years | 10 Years | ||
Class A shares | |||||||
with maximum sales charge (5.75%) without sales charge | 9/29/95 | 9.97% | 10.66% | 8.59% | |||
9/29/95 | 16.68% | 11.98% | 9.23% | ||||
Class C shares | |||||||
with applicable redemption charge † | 5/31/01 | 14.86% | 11.15% | 8.42% | |||
without redemption | 5/31/01 | 15.86% | 11.15% | 8.42% | |||
Class I shares | 5/31/01 | 16.99% | 12.26% | 9.49% | |||
Class Y shares | 7/1/13 | 17.05% | 12.28% | 9.40%†† | |||
Russell 1000® Value Index | 12.47% | 11.22% | 8.93% | ||||
† The maximum contingent deferred sales charge for Class C shares is 1% for shares redeemed within one year of the date of purchase.
†† The total return performance figures presented for Class Y shares of the fund reflect the performance of the fund’s Class A shares for the period prior to 7/1/13 (the inception date for Class Y shares), not reflecting the applicable sales charges for Class A shares.
The performance data quoted represents past performance, which is no guarantee of future results. Share price and investment return fluctuate and an investor’s shares may be worth more or less than original cost upon redemption. Current performance may be lower or higher than the performance quoted. Go to Dreyfus.com for the fund’s most recent month-end returns.
The fund’s performance shown in the graph and table does not reflect the deduction of taxes that a shareholder would pay on fund distributions or the redemption of fund shares. In addition to the performance of Class A shares shown with and without a maximum sales charge, the fund’s performance shown in the table takes into account all other applicable fees and expenses on all classes.
6
UNDERSTANDING YOUR FUND’S EXPENSES (Unaudited)
As a mutual fund investor, you pay ongoing expenses, such as management fees and other expenses. Using the information below, you can estimate how these expenses affect your investment and compare them with the expenses of other funds. You also may pay one-time transaction expenses, including sales charges (loads) and redemption fees, which are not shown in this section and would have resulted in higher total expenses. For more information, see your fund’s prospectus or talk to your financial adviser.
Review your fund’s expenses
The table below shows the expenses you would have paid on a $1,000 investment in Dreyfus Strategic Value Fund from March 1, 2018 to August 31, 2018. It also shows how much a $1,000 investment would be worth at the close of the period, assuming actual returns and expenses.
Expenses and Value of a $1,000 Investment | |||||||||||
assuming actual returns for the six months ended August 31, 2018 | |||||||||||
|
|
| Class A | Class C | Class I | Class Y | |||||
Expenses paid per $1,000† |
| $4.80 | $8.66 | $3.52 | $3.31 | ||||||
Ending value (after expenses) |
| $1,049.80 | $1,046.20 | $1,051.10 | $1,051.40 | ||||||
COMPARING YOUR FUND’S EXPENSES
WITH THOSE OF OTHER FUNDS (Unaudited)
Using the SEC’s method to compare expenses
The Securities and Exchange Commission (“SEC”) has established guidelines to help investors assess fund expenses. Per these guidelines, the table below shows your fund’s expenses based on a $1,000 investment, assuming a hypothetical 5% annualized return. You can use this information to compare the ongoing expenses (but not transaction expenses or total cost) of investing in the fund with those of other funds. All mutual fund shareholder reports will provide this information to help you make this comparison. Please note that you cannot use this information to estimate your actual ending account balance and expenses paid during the period.
Expenses and Value of a $1,000 Investment | |||||||||||
assuming a hypothetical 5% annualized return for the six months ended August 31, 2018 | |||||||||||
|
|
| Class A | Class C | Class I | Class Y | |||||
Expenses paid per $1,000† | $4.74 | $8.54 | $3.47 | $3.26 | |||||||
Ending value (after expenses) | $1,020.52 | 1,016.74 | $1,021.78 | $1,021.98 | |||||||
† Expenses are equal to the fund’s annualized expense ratio of .93% for Class A, 1.68% for Class C, .68% for Class I and .64% for Class Y, multiplied by the average account value over the period, multiplied by 184/365 (to reflect the one-half year period).
7
STATEMENT OF INVESTMENTS
August 31, 2018
Description | Shares | Value ($) | |||||
Common Stocks - 99.2% | |||||||
Automobiles & Components - .7% | |||||||
General Motors | 372,791 | 13,439,116 | |||||
Banks - 14.7% | |||||||
Bank of America | 2,121,909 | a | 65,630,645 | ||||
BB&T | 276,178 | a | 14,267,355 | ||||
Citigroup | 340,773 | 24,276,669 | |||||
JPMorgan Chase & Co. | 683,789 | 78,348,544 | |||||
PNC Financial Services Group | 131,419 | 18,863,883 | |||||
SunTrust Banks | 324,809 | 23,892,950 | |||||
U.S. Bancorp | 358,006 | 19,371,705 | |||||
Wells Fargo & Co. | 642,635 | 37,581,295 | |||||
282,233,046 | |||||||
Capital Goods - 7.0% | |||||||
Dover | 113,253 | 9,725,035 | |||||
General Electric | 657,617 | 8,509,564 | |||||
Harris | 56,639 | 9,204,404 | |||||
Honeywell International | 147,902 | 23,525,292 | |||||
L3 Technologies | 65,055 | 13,903,555 | |||||
Northrop Grumman | 47,661 | 14,226,332 | |||||
Quanta Services | 250,362 | a | 8,660,022 | ||||
Raytheon | 72,375 | 14,434,470 | |||||
United Technologies | 240,454 | 31,667,792 | |||||
133,856,466 | |||||||
Consumer Services - .5% | |||||||
Las Vegas Sands | 138,203 | 9,041,240 | |||||
Diversified Financials - 9.6% | |||||||
Ameriprise Financial | 101,406 | 14,395,596 | |||||
Berkshire Hathaway, Cl. B | 424,021 | a | 88,501,663 | ||||
Capital One Financial | 141,780 | 14,048,980 | |||||
Goldman Sachs Group | 79,876 | 18,995,312 | |||||
LPL Financial Holdings | 188,176 | 12,464,778 | |||||
Raymond James Financial | 136,836 | 12,731,221 | |||||
Voya Financial | 454,372 | 22,750,406 | |||||
183,887,956 | |||||||
Energy - 12.5% | |||||||
Anadarko Petroleum | 374,743 | a | 24,133,449 | ||||
Apergy | 325,944 | 14,739,188 | |||||
Hess | 360,911 | 24,303,747 | |||||
Marathon Petroleum | 529,663 | 43,585,968 | |||||
Occidental Petroleum | 589,111 | 47,052,296 | |||||
Phillips 66 | 301,308 | 35,708,011 | |||||
Schlumberger | 281,538 | 17,781,940 | |||||
8
Description | Shares | Value ($) | |||||
Common Stocks - 99.2% (continued) | |||||||
Energy - 12.5% (continued) | |||||||
Valero Energy | 291,014 | 34,304,730 | |||||
241,609,329 | |||||||
Food, Beverage & Tobacco - 5.7% | |||||||
Coca-Cola | 196,737 | 8,768,568 | |||||
Coca-Cola European Partners | 215,928 | 9,207,170 | |||||
Conagra Brands | 646,910 | 23,773,943 | |||||
Kellogg | 458,711 | b | 32,930,863 | ||||
Kraft Heinz | 151,396 | 8,821,845 | |||||
Mondelez International, Cl. A | 216,932 | 9,267,335 | |||||
PepsiCo | 160,372 | 17,963,268 | |||||
110,732,992 | |||||||
Health Care Equipment & Services - 7.9% | |||||||
Abbott Laboratories | 354,292 | a | 23,680,877 | ||||
Boston Scientific | 420,899 | a | 14,967,168 | ||||
CVS Health | 274,939 | 20,686,410 | |||||
DaVita | 118,716 | a | 8,225,832 | ||||
HCA Healthcare | 74,534 | 9,995,755 | |||||
Humana | 43,025 | 14,338,512 | |||||
McKesson | 59,711 | 7,687,791 | |||||
Medtronic | 210,989 | 20,341,449 | |||||
Quest Diagnostics | 162,680 | 17,891,546 | |||||
UnitedHealth Group | 53,632 | 14,398,047 | |||||
152,213,387 | |||||||
Insurance - 3.1% | |||||||
American International Group | 350,216 | a | 18,620,985 | ||||
Assurant | 128,595 | 13,222,138 | |||||
Athene Holding, Cl. A | 192,759 | a | 9,572,412 | ||||
Hartford Financial Services Group | 348,039 | 17,530,724 | |||||
58,946,259 | |||||||
Materials - 8.2% | |||||||
CF Industries Holdings | 678,527 | 35,249,478 | |||||
DowDuPont | 472,960 | 33,168,685 | |||||
Freeport-McMoRan | 986,651 | 13,862,447 | |||||
Martin Marietta Materials | 141,441 | 28,107,156 | |||||
Mosaic | 644,183 | 20,143,602 | |||||
Newmont Mining | 297,440 | 9,229,563 | |||||
Vulcan Materials | 172,258 | 19,086,186 | |||||
158,847,117 | |||||||
Media - 2.0% | |||||||
Comcast, Cl. A | 650,970 | 24,079,380 | |||||
Omnicom Group | 201,207 | b | 13,947,669 | ||||
38,027,049 | |||||||
9
STATEMENT OF INVESTMENTS (continued)
Description | Shares | Value ($) | |||||
Common Stocks - 99.2% (continued) | |||||||
Pharmaceuticals Biotechnology & Life Sciences - 6.5% | |||||||
Biogen | 27,596 | a | 9,754,910 | ||||
Bristol-Myers Squibb | 160,023 | 9,689,393 | |||||
Gilead Sciences | 128,321 | 9,717,749 | |||||
Merck & Co. | 561,007 | 38,479,470 | |||||
Mylan | 229,825 | a | 8,993,052 | ||||
Pfizer | 1,190,647 | 49,435,663 | |||||
126,070,237 | |||||||
Retailing - .5% | |||||||
Advance Auto Parts | 59,880 | 9,822,116 | |||||
Semiconductors & Semiconductor Equipment - 2.7% | |||||||
Broadcom | 44,168 | 9,674,117 | |||||
Qualcomm | 356,765 | 24,513,323 | |||||
Texas Instruments | 156,412 | 17,580,709 | |||||
51,768,149 | |||||||
Software & Services - 3.8% | |||||||
Alphabet, Cl. A | 11,106 | a | 13,680,371 | ||||
International Business Machines | 243,150 | 35,616,612 | |||||
Oracle | 297,534 | 14,454,202 | |||||
Teradata | 232,831 | a,b | 9,655,502 | ||||
73,406,687 | |||||||
Technology Hardware & Equipment - 4.5% | |||||||
Apple | 66,189 | a | 15,066,602 | ||||
Cisco Systems | 1,286,099 | 61,436,949 | |||||
Xerox | 343,851 | 9,579,689 | |||||
86,083,240 | |||||||
Telecommunication Services - 5.1% | |||||||
AT&T | 960,061 | 30,664,348 | |||||
Verizon Communications | 1,232,576 | 67,015,157 | |||||
97,679,505 | |||||||
Transportation - 1.5% | |||||||
Delta Air Lines | 494,737 | 28,932,220 | |||||
Utilities - 2.7% | |||||||
FirstEnergy | 634,320 | 23,710,882 | |||||
PG&E | 109,352 | 5,049,875 | |||||
PPL | 796,233 | b | 23,679,969 | ||||
52,440,726 | |||||||
Total Common Stocks (cost $1,551,294,700) | 1,909,036,837 | ||||||
Exchange-Traded Funds - .6% | |||||||
Registered Investment Companies - .6% | |||||||
iShares Russell 1000 Value ETF | 85,030 | 10,807,313 | |||||
10
Description | 7-Day | Shares | Value ($) | ||||
Investment Companies - .1% | |||||||
Registered Investment Companies - .1% | |||||||
Dreyfus Institutional Preferred Government Plus Money Market Fund | 1.91 | 2,944,397 | c | 2,944,397 | |||
Total Investments (cost $1,564,803,279) | 99.9% | 1,922,788,547 | |||||
Cash and Receivables (Net) | .1% | 2,132,837 | |||||
Net Assets | 100.0% | 1,924,921,384 | |||||
a Non-income producing security.
b Security, or portion thereof, on loan. At August 31, 2018, the value of the fund’s securities on loan was $66,142,748 and the value of the collateral held by the fund was $67,411,481, consisting of U.S. Government & Agency securities.
c Investment in affiliated issuer. The investment objective of this investment company is publicly available and can be found within the respective investment company’s prospectus.
Portfolio Summary (Unaudited) † | Value (%) |
Financials | 17.6 |
Health Care | 13.2 |
Energy | 12.5 |
Information Technology | 11.0 |
Financial | 9.7 |
Materials | 8.2 |
Industrials | 8.0 |
Consumer Staples | 5.8 |
Telecommunication Services | 5.1 |
Consumer Discretionary | 3.7 |
Utilities | 2.7 |
Consumer, Non-cyclical | 1.7 |
Investment Companies | .7 |
99.9 |
† Based on net assets.
See notes to financial statements.
11
STATEMENT OF INVESTMENTS IN AFFILIATED ISSUERS
Registered Investment Companies | Value | Purchases ($) | Sales ($) | Value | Net | Dividends/ |
Dreyfus Institutional Preferred Government Plus Money Market Fund | 4,789,111 | 326,583,829 | 328,428,543 | 2,944,397 | .1 | 49,637 |
Dreyfus Institutional Preferred Government Money Market Fund, Institutional Shares | - | 154,545,721 | 154,545,721 | - | - | - |
Total | 4,789,111 | 481,129,550 | 482,974,264 | 2,944,397 | .1 | 49,637 |
See notes to financial statements.
12
STATEMENT OF ASSETS AND LIABILITIES
August 31, 2018
|
|
|
|
|
|
|
|
|
| Cost |
| Value |
|
Assets ($): |
|
|
|
| ||
Investments in securities—See Statement of Investments |
|
|
| |||
Unaffiliated issuers | 1,561,858,882 |
| 1,919,844,150 |
| ||
Affiliated issuers |
| 2,944,397 |
| 2,944,397 |
| |
Dividends and securities lending income receivable |
| 3,738,777 |
| |||
Receivable for shares of Common Stock subscribed |
| 1,197,024 |
| |||
Unrealized appreciation on foreign currency transactions |
| 740 |
| |||
Prepaid expenses |
|
|
|
| 49,646 |
|
|
|
|
|
| 1,927,774,734 |
|
Liabilities ($): |
|
|
|
| ||
Due to The Dreyfus Corporation and affiliates—Note 3(c) |
|
|
| 1,218,776 |
| |
Payable for shares of Common Stock redeemed |
| 1,347,494 |
| |||
Directors fees and expenses payable |
| 29,075 |
| |||
Interest payable—Note 2 |
| 293 |
| |||
Accrued expenses |
|
|
|
| 257,712 |
|
|
|
|
|
| 2,853,350 |
|
Net Assets ($) |
|
| 1,924,921,384 |
| ||
Composition of Net Assets ($): |
|
|
|
| ||
Paid-in capital |
|
|
|
| 1,405,830,560 |
|
Accumulated undistributed investment income—net |
| 18,211,818 |
| |||
Accumulated net realized gain (loss) on investments |
|
|
|
| 142,892,998 |
|
Accumulated net unrealized appreciation (depreciation) |
| 357,986,008 |
| |||
Net Assets ($) |
|
| 1,924,921,384 |
| ||
Net Asset Value Per Share | Class A | Class C | Class I | Class Y |
|
Net Assets ($) | 856,213,279 | 29,481,657 | 510,020,190 | 529,206,258 |
|
Shares Outstanding | 20,297,301 | 752,178 | 12,047,976 | 12,495,455 |
|
Net Asset Value Per Share ($) | 42.18 | 39.20 | 42.33 | 42.35 |
|
See notes to financial statements. |
13
STATEMENT OF OPERATIONS
Year Ended August 31, 2018
|
|
|
|
|
|
|
|
|
|
|
|
|
|
Investment Income ($): |
|
|
|
| ||
Income: |
|
|
|
| ||
Cash dividends: |
| |||||
Unaffiliated issuers |
|
| 39,705,466 |
| ||
Affiliated issuers |
|
| 49,637 |
| ||
Income from securities lending—Note 1(c) |
|
| 49,579 |
| ||
Total Income |
|
| 39,804,682 |
| ||
Expenses: |
|
|
|
| ||
Management fee—Note 3(a) |
|
| 11,249,954 |
| ||
Shareholder servicing costs—Note 3(c) |
|
| 3,531,656 |
| ||
Distribution fees—Note 3(b) |
|
| 262,042 |
| ||
Directors’ fees and expenses—Note 3(d) |
|
| 149,472 |
| ||
Prospectus and shareholders’ reports |
|
| 103,857 |
| ||
Professional fees |
|
| 101,727 |
| ||
Registration fees |
|
| 95,659 |
| ||
Custodian fees—Note 3(c) |
|
| 43,872 |
| ||
Loan commitment fees—Note 2 |
|
| 42,980 |
| ||
Interest expense—Note 2 |
|
| 3,686 |
| ||
Miscellaneous |
|
| 48,442 |
| ||
Total Expenses |
|
| 15,633,347 |
| ||
Less—reduction in expenses due to undertaking—Note 3(a) |
|
| (506,627) |
| ||
Net Expenses |
|
| 15,126,720 |
| ||
Investment Income—Net |
|
| 24,677,962 |
| ||
Realized and Unrealized Gain (Loss) on Investments—Note 4 ($): |
|
| ||||
Net realized gain (loss) on investments and foreign currency transactions | 169,558,501 |
| ||||
Net realized gain (loss) on forward foreign currency exchange contracts | 1,517 |
| ||||
Net Realized Gain (Loss) |
|
| 169,560,018 |
| ||
Net unrealized appreciation (depreciation) on investments |
|
| 97,012,680 |
| ||
Net Realized and Unrealized Gain (Loss) on Investments |
|
| 266,572,698 |
| ||
Net Increase in Net Assets Resulting from Operations |
| 291,250,660 |
| |||
See notes to financial statements. | ||||||
14
STATEMENT OF CHANGES IN NET ASSETS
|
|
|
| Year Ended August 31, | |||||
|
|
|
| 2018 |
| 2017 |
| ||
Operations ($): |
|
|
|
|
|
|
|
| |
Investment income—net |
|
| 24,677,962 |
|
|
| 18,938,438 |
| |
Net realized gain (loss) on investments |
| 169,560,018 |
|
|
| 183,264,325 |
| ||
Net unrealized appreciation (depreciation) |
| 97,012,680 |
|
|
| 32,839,772 |
| ||
Net Increase (Decrease) in Net Assets | 291,250,660 |
|
|
| 235,042,535 |
| |||
Distributions to Shareholders from ($): |
| ||||||||
Investment income—net: |
|
|
|
|
|
|
|
| |
Class A |
|
| (7,698,049) |
|
|
| (11,206,616) |
| |
Class C |
|
| (78,380) |
|
|
| (290,055) |
| |
Class I |
|
| (9,103,468) |
|
|
| (9,313,258) |
| |
Class Y |
|
| (2,118,510) |
|
|
| (2,700,953) |
| |
Net realized gain on investments: |
|
|
|
|
|
|
|
| |
Class A |
|
| (77,881,686) |
|
|
| (12,942,367) |
| |
Class C |
|
| (4,217,212) |
|
|
| (742,862) |
| |
Class I |
|
| (72,188,323) |
|
|
| (9,421,902) |
| |
Class Y |
|
| (16,724,585) |
|
|
| (2,732,461) |
| |
Total Distributions |
|
| (190,010,213) |
|
|
| (49,350,474) |
| |
Capital Stock Transactions ($): |
| ||||||||
Net proceeds from shares sold: |
|
|
|
|
|
|
|
| |
Class A |
|
| 48,320,387 |
|
|
| 76,003,545 |
| |
Class C |
|
| 3,321,433 |
|
|
| 5,149,906 |
| |
Class I |
|
| 142,902,762 |
|
|
| 464,675,655 |
| |
Class Y |
|
| 377,670,606 |
|
|
| 40,160,158 |
| |
Distributions reinvested: |
|
|
|
|
|
|
|
| |
Class A |
|
| 79,361,240 |
|
|
| 22,422,051 |
| |
Class C |
|
| 3,574,080 |
|
|
| 805,366 |
| |
Class I |
|
| 78,055,760 |
|
|
| 18,245,284 |
| |
Class Y |
|
| 7,462,513 |
|
|
| 1,787,134 |
| |
Cost of shares redeemed: |
|
|
|
|
|
|
|
| |
Class A |
|
| (135,670,924) |
|
|
| (215,907,215) |
| |
Class C |
|
| (21,318,372) |
|
|
| (15,945,364) |
| |
Class I |
|
| (497,825,804) |
|
|
| (308,483,958) |
| |
Class Y |
|
| (52,679,238) |
|
|
| (63,440,368) |
| |
Increase (Decrease) in Net Assets | 33,174,443 |
|
|
| 25,472,194 |
| |||
Total Increase (Decrease) in Net Assets | 134,414,890 |
|
|
| 211,164,255 |
| |||
Net Assets ($): |
| ||||||||
Beginning of Period |
|
| 1,790,506,494 |
|
|
| 1,579,342,239 |
| |
End of Period |
|
| 1,924,921,384 |
|
|
| 1,790,506,494 |
| |
Undistributed investment income—net | 18,211,818 |
|
|
| 12,532,274 |
| |||
15
STATEMENT OF CHANGES IN NET ASSETS (continued)
|
|
|
| Year Ended August 31, | |||||
|
|
|
| 2018 |
| 2017 |
| ||
Capital Share Transactions (Shares): |
| ||||||||
Class Aa,b |
|
|
|
|
|
|
|
| |
Shares sold |
|
| 1,193,614 |
|
|
| 1,967,238 |
| |
Shares issued for distributions reinvested |
|
| 2,030,221 |
|
|
| 587,272 |
| |
Shares redeemed |
|
| (3,317,685) |
|
|
| (5,518,118) |
| |
Net Increase (Decrease) in Shares Outstanding | (93,850) |
|
|
| (2,963,608) |
| |||
Class Ca |
|
|
|
|
|
|
|
| |
Shares sold |
|
| 88,204 |
|
|
| 139,175 |
| |
Shares issued for distributions reinvested |
|
| 97,866 |
|
|
| 22,427 |
| |
Shares redeemed |
|
| (569,442) |
|
|
| (436,913) |
| |
Net Increase (Decrease) in Shares Outstanding | (383,372) |
|
|
| (275,311) |
| |||
Class Ib |
|
|
|
|
|
|
|
| |
Shares sold |
|
| 3,497,874 |
|
|
| 12,002,506 |
| |
Shares issued for distributions reinvested |
|
| 1,993,252 |
|
|
| 477,251 |
| |
Shares redeemed |
|
| (12,125,718) |
|
|
| (7,886,248) |
| |
Net Increase (Decrease) in Shares Outstanding | (6,634,592) |
|
|
| 4,593,509 |
| |||
Class Yb |
|
|
|
|
|
|
|
| |
Shares sold |
|
| 9,177,640 |
|
|
| 1,017,302 |
| |
Shares issued for distributions reinvested |
|
| 190,564 |
|
|
| 46,747 |
| |
Shares redeemed |
|
| (1,291,721) |
|
|
| (1,612,375) |
| |
Net Increase (Decrease) in Shares Outstanding | 8,076,483 |
|
|
| (548,326) |
| |||
a During the period ended August 31, 2018, 36,406 Class C shares representing $1,345,388 automatically converted to 34,003 Class A shares. | |||||||||
b During the period ended August 31, 2018, 1,793 Class Y shares representing $72,237 were exchanged for 1,798 Class A shares and 29,580 Class Y shares representing $1,218,740 were exchanged for 29,590 Class I shares. During the period ended August 31, 2017, 14,939 Class A shares representing $603,006 were exchanged for 14,897 Class I shares and 2,348 Class A shares representing 92,439 were exchanged for 2,344 Class Y shares and 59,810 Class Y shares representing 2,352,272 were exchanged for 59,811 Class I shares. | |||||||||
| |||||||||
16
FINANCIAL HIGHLIGHTS
The following tables describe the performance for each share class for the fiscal periods indicated. All information (except portfolio turnover rate) reflects financial results for a single fund share. Total return shows how much your investment in the fund would have increased (or decreased) during each period, assuming you had reinvested all dividends and distributions. These figures have been derived from the fund’s financial statements.
Year Ended August 31, | |||||||
Class A Shares | 2018 | 2017 | 2016 | 2015 | 2014 | ||
Per Share Data ($): | |||||||
Net asset value, beginning of period | 40.12 | 36.08 | 38.49 | 43.34 | 37.27 | ||
Investment Operations: | |||||||
Investment income—neta | .49 | .37 | .50 | .33 | .35 | ||
Net realized and unrealized gain | 5.86 | 4.72 | 2.41 | (.66) | 8.03 | ||
Total from Investment Operations | 6.35 | 5.09 | 2.91 | (.33) | 8.38 | ||
Distributions: | |||||||
Dividends from investment | (.39) | (.49) | (.39) | (.36) | (.26) | ||
Dividends from net realized gain | (3.90) | (.56) | (4.93) | (4.16) | (2.05) | ||
Total Distributions | (4.29) | (1.05) | (5.32) | (4.52) | (2.31) | ||
Net asset value, end of period | 42.18 | 40.12 | 36.08 | 38.49 | 43.34 | ||
Total Return (%)b | 16.68 | 14.26 | 8.26 | (.90) | 23.09 | ||
Ratios/Supplemental Data (%): | |||||||
Ratio of total expenses to | .95 | 1.07 | 1.12 | 1.11 | 1.12 | ||
Ratio of net expenses to | .93 | .97 | .98 | .98 | .98 | ||
Ratio of net investment income to | 1.19 | .95 | 1.42 | .81 | .88 | ||
Portfolio Turnover Rate | 105.82 | 96.39 | 80.82 | 96.32 | 67.00 | ||
Net Assets, end of period ($ x 1,000) | 856,213 | 818,085 | 842,532 | 880,116 | 970,817 | ||
a Based on average shares outstanding.
b Exclusive of sales charge.
See notes to financial statements.
17
FINANCIAL HIGHLIGHTS (continued)
Year Ended August 31, | |||||||||||
Class C Shares | 2018 | 2017 | 2016 | 2015 | 2014 | ||||||
Per Share Data ($): | |||||||||||
Net asset value, beginning of period | 37.52 | 33.81 | 36.35 | 41.17 | 35.54 | ||||||
Investment Operations: |
|
|
|
| |||||||
Investment income—neta | .17 | .07 | .22 | .02 | .05 | ||||||
Net realized and unrealized gain | 5.48 | 4.42 | 2.26 | (.61) | 7.63 | ||||||
Total from Investment Operations | 5.65 | 4.49 | 2.48 | (.59) | 7.68 | ||||||
Distributions: |
|
|
|
| |||||||
Dividends from investment | (.07) | (.22) | (.09) | (.07) | - | ||||||
Dividends from net realized gain | (3.90) | (.56) | (4.93) | (4.16) | (2.05) | ||||||
Total Distributions | (3.97) | (.78) | (5.02) | (4.23) | (2.05) | ||||||
Net asset value, end of period | 39.20 | 37.52 | 33.81 | 36.35 | 41.17 | ||||||
Total Return (%)b | 15.86 | 13.39 | 7.46 | (1.65) | 22.17 | ||||||
Ratios/Supplemental Data (%): |
|
|
|
| |||||||
Ratio of total expenses to | 1.71 | 1.84 | 1.89 | 1.87 | 1.88 | ||||||
Ratio of net expenses to | 1.68 | 1.72 | 1.73 | 1.73 | 1.73 | ||||||
Ratio of net investment income to | .45 | .20 | .67 | .06 | .12 | ||||||
Portfolio Turnover Rate | 105.82 | 96.39 | 80.82 | 96.32 | 67.00 | ||||||
Net Assets, end of period ($ x 1,000) | 29,482 | 42,611 | 47,696 | 53,226 | 59,442 | ||||||
a Based on average shares outstanding.
b Exclusive of sales charge.
See notes to financial statements.
18
Year Ended August 31, | ||||||||
Class I Shares | 2018 | 2017 | 2016 | 2015 | 2014 | |||
Per Share Data ($): | ||||||||
Net asset value, beginning of period | 40.25 | 36.16 | 38.58 | 43.45 | 37.36 | |||
Investment Operations: |
|
|
|
| ||||
Investment income—neta | .59 | .48 | .58 | .43 | .47 | |||
Net realized and unrealized gain | 5.88 | 4.73 | 2.42 | (.66) | 8.03 | |||
Total from Investment Operations | 6.47 | 5.21 | 3.00 | (.23) | 8.50 | |||
Distributions: |
|
|
|
| ||||
Dividends from investment | (.49) | (.56) | (.49) | (.48) | (.36) | |||
Dividends from net realized gain | (3.90) | (.56) | (4.93) | (4.16) | (2.05) | |||
Total Distributions | (4.39) | (1.12) | (5.42) | (4.64) | (2.41) | |||
Net asset value, end of period | 42.33 | 40.25 | 36.16 | 38.58 | 43.45 | |||
Total Return (%) | 16.99 | 14.58 | 8.52 | (.66) | 23.40 | |||
Ratios/Supplemental Data (%): |
|
|
|
| ||||
Ratio of total expenses to | .72 | .84 | .89 | .87 | .84 | |||
Ratio of net expenses to | .68 | .72 | .73 | .73 | .73 | |||
Ratio of net investment income to | 1.44 | 1.21 | 1.67 | 1.05 | 1.14 | |||
Portfolio Turnover Rate | 105.82 | 96.39 | 80.82 | 96.32 | 67.00 | |||
Net Assets, end of period ($ x 1,000) | 510,020 | 751,934 | 509,485 | 389,711 | 392,260 | |||
a Based on average shares outstanding.
See notes to financial statements.
19
FINANCIAL HIGHLIGHTS (continued)
Year Ended August 31, | ||||||||||
Class Y Shares | 2018 | 2017 | 2016 | 2015 | 2014 | |||||
Per Share Data ($): | ||||||||||
Net asset value, beginning of period | 40.25 | 36.16 | 38.58 | 43.45 | 37.36 | |||||
Investment Operations: |
| |||||||||
Investment income—neta | .62 | .48 | .59 | .44 | .32 | |||||
Net realized and unrealized gain | 5.87 | 4.73 | 2.41 | (.67) | 8.18 | |||||
Total from Investment Operations | 6.49 | 5.21 | 3.00 | (.23) | 8.50 | |||||
Distributions: |
|
|
| |||||||
Dividends from investment | (.49) | (.56) | (.49) | (.48) | (.36) | |||||
Dividends from net realized gain | (3.90) | (.56) | (4.93) | (4.16) | (2.05) | |||||
Total Distributions | (4.39) | (1.12) | (5.42) | (4.64) | (2.41) | |||||
Net asset value, end of period | 42.35 | 40.25 | 36.16 | 38.58 | 43.45 | |||||
Total Return (%) | 17.05 | 14.58 | 8.52 | (.66) | 23.40 | |||||
Ratios/Supplemental Data (%): |
|
|
| |||||||
Ratio of total expenses to | .64 | .75 | .79 | .79 | .78 | |||||
Ratio of net expenses to | .64 | .71 | .73 | .73 | .73 | |||||
Ratio of net investment income to | 1.50 | 1.22 | 1.67 | 1.07 | .87 | |||||
Portfolio Turnover Rate | 105.82 | 96.39 | 80.82 | 96.32 | 67.00 | |||||
Net Assets, end of period ($ x 1,000) | 529,206 | 177,876 | 179,629 | 215,685 | 230,522 | |||||
a Based on average shares outstanding.
See notes to financial statements.
20
NOTES TO FINANCIAL STATEMENTS
NOTE 1—Significant Accounting Policies:
Dreyfus Strategic Value Fund (the “fund”) is a separate diversified series of Advantage Funds, Inc. (the “Company”), which is registered under the Investment Company Act of 1940, as amended (the “Act”), as an open-end management investment company and operates as a series company currently offering ten series, including the fund. The fund’s investment objective is to seek capital appreciation. The Dreyfus Corporation (the “Manager” or “Dreyfus”), a wholly-owned subsidiary of The Bank of New York Mellon Corporation (“BNY Mellon”), serves as the fund’s investment adviser.
MBSC Securities Corporation (the “Distributor”), a wholly-owned subsidiary of Dreyfus, is the distributor of the fund’s shares. The fund is authorized to issue 800 million shares of $.001 par value Common Stock. The fund currently has authorized five classes of shares: Class A (300 million shares authorized), Class C (100 million shares authorized), Class I (200 million shares authorized), Class T (100 million shares authorized) and Class Y (100 million shares authorized). Class A and Class T shares generally are subject to a sales charge imposed at the time of purchase. Class C shares are subject to a contingent deferred sales charge (“CDSC”) imposed on Class C shares redeemed within one year of purchase. Class C shares automatically convert to Class A shares ten years after the date of purchase, without the imposition of a sales charge. Class I and Class Y shares are sold at net asset value per share generally to institutional investors. As of the date of this report, the fund did not offer Class T shares for purchase. Other differences between the classes include the services offered to and the expenses borne by each class, the allocation of certain transfer agency costs, and certain voting rights. Income, expenses (other than expenses attributable to a specific class), and realized and unrealized gains or losses on investments are allocated to each class of shares based on its relative net assets.
The Company accounts separately for the assets, liabilities and operations of each series. Expenses directly attributable to each series are charged to that series’ operations; expenses which are applicable to all series are allocated among them on a pro rata basis.
The Financial Accounting Standards Board (“FASB”) Accounting Standards Codification is the exclusive reference of authoritative U.S. generally accepted accounting principles (“GAAP”) recognized by the FASB to be applied by nongovernmental entities. Rules and interpretive releases of the Securities and Exchange Commission (“SEC”) under authority of federal laws are also sources of authoritative GAAP for SEC
21
NOTES TO FINANCIAL STATEMENTS (continued)
registrants. The fund’s financial statements are prepared in accordance with GAAP, which may require the use of management estimates and assumptions. Actual results could differ from those estimates.
The Company enters into contracts that contain a variety of indemnifications. The fund’s maximum exposure under these arrangements is unknown. The fund does not anticipate recognizing any loss related to these arrangements.
(a) Portfolio valuation: The fair value of a financial instrument is the amount that would be received to sell an asset or paid to transfer a liability in an orderly transaction between market participants at the measurement date (i.e., the exit price). GAAP establishes a fair value hierarchy that prioritizes the inputs of valuation techniques used to measure fair value. This hierarchy gives the highest priority to unadjusted quoted prices in active markets for identical assets or liabilities (Level 1 measurements) and the lowest priority to unobservable inputs (Level 3 measurements).
Additionally, GAAP provides guidance on determining whether the volume and activity in a market has decreased significantly and whether such a decrease in activity results in transactions that are not orderly. GAAP requires enhanced disclosures around valuation inputs and techniques used during annual and interim periods.
Various inputs are used in determining the value of the fund’s investments relating to fair value measurements. These inputs are summarized in the three broad levels listed below:
Level 1—unadjusted quoted prices in active markets for identical investments.
Level 2—other significant observable inputs (including quoted prices for similar investments, interest rates, prepayment speeds, credit risk, etc.).
Level 3—significant unobservable inputs (including the fund’s own assumptions in determining the fair value of investments).
The inputs or methodology used for valuing securities are not necessarily an indication of the risk associated with investing in those securities.
Changes in valuation techniques may result in transfers in or out of an assigned level within the disclosure hierarchy. Valuation techniques used to value the fund’s investments are as follows:
Investments in securities are valued at the last sales price on the securities exchange or national securities market on which such securities are primarily traded. Securities listed on the National Market System for which
22
market quotations are available are valued at the official closing price or, if there is no official closing price that day, at the last sales price. For open short positions, asked prices are used for valuation purposes. Bid price is used when no asked price is available. Registered investment companies that are not traded on an exchange are valued at their net asset value. All of the preceding securities are generally categorized within Level 1 of the fair value hierarchy.
Securities not listed on an exchange or the national securities market, or securities for which there were no transactions, are valued at the average of the most recent bid and asked prices. These securities are generally categorized within Level 2 of the fair value hierarchy.
Fair valuing of securities may be determined with the assistance of a pricing service using calculations based on indices of domestic securities and other appropriate indicators, such as prices of relevant American Depository Receipts and futures. Utilizing these techniques may result in transfers between Level 1 and Level 2 of the fair value hierarchy.
When market quotations or official closing prices are not readily available, or are determined not to accurately reflect fair value, such as when the value of a security has been significantly affected by events after the close of the exchange or market on which the security is principally traded (for example, a foreign exchange or market), but before the fund calculates its net asset value, the fund may value these investments at fair value as determined in accordance with the procedures approved by the Company’s Board of Directors (the “Board”). Certain factors may be considered when fair valuing investments such as: fundamental analytical data, the nature and duration of restrictions on disposition, an evaluation of the forces that influence the market in which the securities are purchased and sold, and public trading in similar securities of the issuer or comparable issuers. These securities are either categorized within Level 2 or 3 of the fair value hierarchy depending on the relevant inputs used.
For restricted securities where observable inputs are limited, assumptions about market activity and risk are used and such securities are generally categorized within Level 3 of the fair value hierarchy.
Investments denominated in foreign currencies are translated to U.S. dollars at the prevailing rates of exchange.
Forward foreign currency exchange contracts (“forward contracts”) are valued at the forward rate and are generally categorized within Level 2 of the fair value hierarchy.
23
NOTES TO FINANCIAL STATEMENTS (continued)
The following is a summary of the inputs used as of August 31, 2018 in valuing the fund’s investments:
Level 1 - Unadjusted Quoted Prices | Level 2 - Other Significant Observable Inputs | Level 3 -Significant Unobservable Inputs | Total | |
Assets ($) |
|
|
|
|
Investments in Securities: | ||||
Equity Securities - Common Stocks† | 1,909,036,837 | - | - | 1,909,036,837 |
Exchange-Traded Funds | 10,807,313 | - | - | 10,807,313 |
Registered | 2,944,397 | - | - | 2,944,397 |
† See Statement of Investments for additional detailed categorizations.
At August 31, 2018, there were no transfers between levels of the fair value hierarchy. It is the fund’s policy to recognize transfers between levels at the end of the reporting period.
(b) Foreign currency transactions: The fund does not isolate that portion of the results of operations resulting from changes in foreign exchange rates on investments from the fluctuations arising from changes in the market prices of securities held. Such fluctuations are included with the net realized and unrealized gain or loss on investments.
Net realized foreign exchange gains or losses arise from sales of foreign currencies, currency gains or losses realized on securities transactions between trade and settlement date, and the difference between the amounts of dividends, interest and foreign withholding taxes recorded on the fund’s books and the U.S. dollar equivalent of the amounts actually received or paid. Net unrealized foreign exchange gains and losses arise from changes in the value of assets and liabilities other than investments resulting from changes in exchange rates. Foreign currency gains and losses on foreign currency transactions are also included with net realized and unrealized gain or loss on investments.
(c) Securities transactions and investment income: Securities transactions are recorded on a trade date basis. Realized gains and losses from securities transactions are recorded on the identified cost basis. Dividend income is recognized on the ex-dividend date and interest income, including, where applicable, accretion of discount and amortization of premium on investments, is recognized on the accrual basis.
24
Pursuant to a securities lending agreement with The Bank of New York Mellon, a subsidiary of BNY Mellon and an affiliate of Dreyfus, the fund may lend securities to qualified institutions. It is the fund’s policy that, at origination, all loans are secured by collateral of at least 102% of the value of U.S. securities loaned and 105% of the value of foreign securities loaned. Collateral equivalent to at least 100% of the market value of securities on loan is maintained at all times. Collateral is either in the form of cash, which can be invested in certain money market mutual funds managed by Dreyfus, or U.S. Government and Agency securities. The fund is entitled to receive all dividends, interest and distributions on securities loaned, in addition to income earned as a result of the lending transaction. Should a borrower fail to return the securities in a timely manner, The Bank of New York Mellon is required to replace the securities for the benefit of the fund or credit the fund with the market value of the unreturned securities and is subrogated to the fund’s rights against the borrower and the collateral. Additionally, the contractual maturity of security lending transactions are on an overnight and continuous basis. During the period ended August 31, 2018, The Bank of New York Mellon earned $10,083 from lending portfolio securities, pursuant to the securities lending agreement.
(d) Affiliated issuers: Investments in other investment companies advised by Dreyfus are defined as “affiliated” under the Act.
(e) Dividends and distributions to shareholders: Dividends and distributions are recorded on the ex-dividend date. Dividends from investment income-net and dividends from net realized capital gains, if any, are normally declared and paid annually, but the fund may make distributions on a more frequent basis to comply with the distribution requirements of the Internal Revenue Code of 1986, as amended (the “Code”). To the extent that net realized capital gains can be offset by capital loss carryovers, it is the policy of the fund not to distribute such gains. Income and capital gain distributions are determined in accordance with income tax regulations, which may differ from GAAP.
(f) Federal income taxes: It is the policy of the fund to continue to qualify as a regulated investment company, if such qualification is in the best interests of its shareholders, by complying with the applicable provisions of the Code, and to make distributions of taxable income sufficient to relieve it from substantially all federal income and excise taxes.
As of and during the period ended August 31, 2018, the fund did not have any liabilities for any uncertain tax positions. The fund recognizes interest and penalties, if any, related to uncertain tax positions as income tax
25
NOTES TO FINANCIAL STATEMENTS (continued)
expense in the Statement of Operations. During the period ended August 31, 2018, the fund did not incur any interest or penalties.
Each tax year in the four-year period ended August 31, 2018 remains subject to examination by the Internal Revenue Service and state taxing authorities.
At August 31, 2018, the components of accumulated earnings on a tax basis were as follows: undistributed ordinary income $52,304,079, undistributed capital gains $124,308,344 and unrealized appreciation $342,478,401.
The tax character of distributions paid to shareholders during the fiscal periods ended August 31, 2018 and August 31, 2017 were as follows: ordinary income $73,398,974 and $23,510,882, and long-term capital gains $116,611,239 and $25,839,592, respectively.
During the period ended August 31, 2018, as a result of permanent book to tax differences, primarily due to the tax treatment for foreign currency gains and losses, the fund decreased accumulated undistributed investment income-net by $11 and increased accumulated net realized gain (loss) on investments by the same amount. Net assets and net asset value per share were not affected by this reclassification.
(g) New Accounting Pronouncements: In August 2018, the FASB issued Accounting Standards Update 2018-13, Fair Value Measurement (Topic 820): Disclosure Framework—Changes to the Disclosure Requirements for Fair Value Measurement (“ASU 2018-13”). The update provides guidance that eliminates, adds and modifies certain disclosure requirements for fair value measurements. ASU 2018-13 will be effective for annual periods beginning after December 15, 2019. Management is currently assessing the potential impact of these changes to future financial statements.
NOTE 2—Bank Lines of Credit:
The fund participates with other Dreyfus-managed funds in an $830 million unsecured credit facility led by Citibank, N.A. and a $300 million unsecured credit facility provided by The Bank of New York Mellon (each, a “Facility”), each to be utilized primarily for temporary or emergency purposes, including the financing of redemptions. Prior to October 4, 2017, the unsecured credit facility with Citibank, N.A. was $810 million. In connection therewith, the fund has agreed to pay its pro rata portion of commitment fees for each Facility. Interest is charged to the fund based on rates determined pursuant to the terms of the respective Facility at the time of borrowing.
26
The average amount of borrowings outstanding under the Facilities during the period ended August 31, 2018 was approximately $149,300 with a related weighted average annualized interest rate of 2.47%.
NOTE 3—Management Fee and Other Transactions with Affiliates:
(a) Pursuant to a management agreement with Dreyfus in place during the period ended August 31, 2018, the fund had agreed to pay a management fee at the annual rate of .60% of the value of the fund’s average daily net assets and is payable monthly. Dreyfus has contractually agreed, from September 1, 2017 through December 31, 2018, to waive receipt of its fees and/or assume the direct expenses of the fund, so that the total annual fund operating expenses of Class A, C, I and Y shares (excluding Rule 12b-1 Distribution Plan fees, Shareholder Services Plan fees, taxes, interest expense, brokerage commissions, commitment fees on borrowings and extraordinary expenses) do not exceed .68% of the value of the fund’s average daily net assets. The reduction in expenses, pursuant to the undertaking amounted to $506,627 during the period ended August 31, 2018.
During the period ended August 31, 2018, the Distributor retained $22,742 from commissions earned on sales of the fund’s Class A shares and $3,647 from CDSCs on redemptions of the fund’s Class C shares.
(b) Under the Distribution Plan adopted pursuant to Rule 12b-1 under the Act, Class C shares pay the Distributor for distributing its shares at an annual rate of .75% of the value of its average daily net assets. During the period ended August 31, 2018, Class C shares were charged $262,042 pursuant to the Distribution Plan.
(c) Under the Shareholder Services Plan, Class A and Class C shares pay the Distributor at an annual rate of .25% of the value of their average daily net assets for the provision of certain services. The services provided may include personal services relating to shareholder accounts, such as answering shareholder inquiries regarding the fund and providing reports and other information, and services related to the maintenance of shareholder accounts. The Distributor may make payments to Service Agents (securities dealers, financial institutions or other industry professionals) with respect to these services. The Distributor determines the amounts to be paid to Service Agents. During the period ended August 31, 2018, Class A and Class C shares were charged $2,127,789 and $87,348, respectively, pursuant to the Shareholder Services Plan.
The fund has arrangements with the transfer agent and the custodian whereby the fund may receive earnings credits when positive cash balances
27
NOTES TO FINANCIAL STATEMENTS (continued)
are maintained, which are used to offset transfer agency and custody fees. For financial reporting purposes, the fund includes net earnings credits, if any, as an expense offset in the Statement of Operations.
The fund compensates Dreyfus Transfer, Inc., a wholly-owned subsidiary of Dreyfus, under a transfer agency agreement for providing transfer agency and cash management services for the fund. The majority of transfer agency fees are comprised of amounts paid on a per account basis, while cash management fees are related to fund subscriptions and redemptions. During the period ended August 31, 2018, the fund was charged $230,291 for transfer agency services. These fees are included in Shareholder servicing costs in the Statement of Operations.
The fund compensates The Bank of New York Mellon under a custody agreement for providing custodial services for the fund. These fees are determined based on net assets, geographic region and transaction activity. During the period ended August 31, 2018, the fund was charged $43,872 pursuant to the custody agreement.
During the period ended August 31, 2018, the fund was charged $13,269 for services performed by the Chief Compliance Officer and his staff. These fees are included in Miscellaneous in the Statement of Operations.
The components of “Due to The Dreyfus Corporation and affiliates” in the Statement of Assets and Liabilities consist of: management fees $972,766, Distribution Plan fees $18,796, Shareholder Services Plan fees $187,005, custodian fees $15,729, Chief Compliance Officer fees $5,693 and transfer agency fees $41,232, which are offset against an expense reimbursement currently in effect in the amount of $22,445.
(d) Each Board member also serves as a Board member of other funds within the Dreyfus complex. Annual retainer fees and attendance fees are allocated to each fund based on net assets.
NOTE 4—Securities Transactions:
The aggregate amount of purchases and sales of investment securities, excluding short-term securities and forward contracts, during the period ended August 31, 2018, amounted to $1,976,372,695 and $2,107,890,376, respectively.
Derivatives: A derivative is a financial instrument whose performance is derived from the performance of another asset. The fund enters into International Swaps and Derivatives Association, Inc. Master Agreements or similar agreements (collectively, “Master Agreements”) with its over-the-counter (“OTC”) derivative contract counterparties in order to, among other things, reduce its credit risk to counterparties. Master Agreements
28
include provisions for general obligations, representations, collateral and events of default or termination. Under a Master Agreement, the fund may offset with the counterparty certain derivative financial instrument’s payables and/or receivables with collateral held and/or posted and create one single net payment in the event of default or termination.
Each type of derivative instrument that was held by the fund during the period ended August 31, 2018 is discussed below.
Forward Foreign Currency Exchange Contracts: The fund enters into forward contracts in order to hedge its exposure to changes in foreign currency exchange rates on its foreign portfolio holdings, to settle foreign currency transactions or as a part of its investment strategy. When executing forward contracts, the fund is obligated to buy or sell a foreign currency at a specified rate on a certain date in the future. With respect to sales of forward contracts, the fund incurs a loss if the value of the contract increases between the date the forward contract is opened and the date the forward contract is closed. The fund realizes a gain if the value of the contract decreases between those dates. With respect to purchases of forward contracts, the fund incurs a loss if the value of the contract decreases between the date the forward contract is opened and the date the forward contract is closed. The fund realizes a gain if the value of the contract increases between those dates. Any realized or unrealized gains or losses which occurred during the period are reflected in the Statement of Operations. The fund is exposed to foreign currency risk as a result of changes in value of underlying financial instruments. The fund is also exposed to credit risk associated with counterparty nonperformance on these forward contracts, which is generally limited to the unrealized gain on each open contract. This risk may be mitigated by Master Agreements, if any, between the fund and the counterparty and the posting of collateral, if any, by the counterparty to the fund to cover the fund’s exposure to the counterparty. At August 31, 2018, there were no outstanding forward contracts.
The following summarizes the average market value of derivatives outstanding during the period ended August 31, 2018:
|
| Average Market Value ($) |
Forward contracts | 5,166 | |
At August 31, 2018, the cost of investments for federal income tax purposes was $1,580,310,886; accordingly, accumulated net unrealized appreciation on investments was $342,477,661, consisting of $382,927,295
29
NOTES TO FINANCIAL STATEMENTS (continued)
gross unrealized appreciation and $40,449,634 gross unrealized depreciation.
30
REPORT OF INDEPENDENT REGISTERED PUBLIC ACCOUNTING FIRM
To the Shareholders and the Board of Directors of Dreyfus Strategic Value Fund
Opinion on the Financial Statements
We have audited the accompanying statement of assets and liabilities of Dreyfus Strategic Value Fund (the “Fund”) (one of the funds constituting Advantage Funds, Inc.), including the statement of investments and investments in affiliated issuers, as of August 31, 2018, and the related statement of operations for the year then ended, the statements of changes in net assets for each of the two years in the period then ended, the financial highlights for each of the five years in the period then ended and the related notes (collectively referred to as the “financial statements”). In our opinion, the financial statements present fairly, in all material respects, the financial position of the Fund (one of the funds constituting Advantage Funds, Inc.) at August 31, 2018, the results of its operations for the year then ended, the changes in its net assets for each of the two years in the period then ended and its financial highlights for each of the five years in the period then ended, in conformity with U.S. generally accepted accounting principles.
Basis for Opinion
These financial statements are the responsibility of the Fund’s management. Our responsibility is to express an opinion on the Fund’s financial statements based on our audits. We are a public accounting firm registered with the Public Company Accounting Oversight Board (United States) (“PCAOB”) and are required to be independent with respect to the Fund in accordance with the U.S. federal securities laws and the applicable rules and regulations of the Securities and Exchange Commission and the PCAOB.
We conducted our audits in accordance with the standards of the PCAOB. Those standards require that we plan and perform the audit to obtain reasonable assurance about whether the financial statements are free of material misstatement, whether due to error or fraud. The Fund is not required to have, nor were we engaged to perform, an audit of the Fund’s internal control over financial reporting. As part of our audits, we are required to obtain an understanding of internal control over financial reporting, but not for the purpose of expressing an opinion on the effectiveness of the Fund’s internal control over financial reporting. Accordingly, we express no such opinion.
Our audits included performing procedures to assess the risks of material misstatement of the financial statements, whether due to error or fraud, and performing procedures that respond to those risks. Such procedures included examining, on a test basis, evidence regarding the amounts and disclosures in the financial statements. Our procedures included confirmation of securities owned as of August 31, 2018, by correspondence with the custodian and others or by other appropriate auditing procedures where replies from others were not received. Our audits also included evaluating the accounting principles used and significant estimates made by management, as well as evaluating the overall presentation of the financial statements. We believe that our audits provide a reasonable basis for our opinion.

We have served as the auditor of one or more Dreyfus investment companies since at least 1957, but we are unable to determine the specific year.
New York, New York
October 26, 2018
31
IMPORTANT TAX INFORMATION (Unaudited)
For federal tax purposes, the fund hereby reports 48.66% of the ordinary dividends paid during the fiscal year ended August 31, 2018 as qualifying for the corporate dividends received deduction. Also certain dividends paid by the fund may be subject to a maximum tax rate of 15%, as provided for by the Jobs and Growth Tax Relief Reconciliation Act of 2003. Of the distributions paid during the fiscal year, $32,471,585 represents the maximum amount that may be considered qualified dividend income. The fund also hereby reports $1.2426 per share as a short-term capital gain distribution and $2.6636 per share as a long-term capital gain distribution paid on December 5, 2017. Shareholders will receive notification in early 2019 of the percentage applicable to the preparation of their 2018 income tax returns.
32
BOARD MEMBERS INFORMATION (Unaudited)
INDEPENDENT BOARD MEMBERS
Chairman of the Board (1995)
Principal Occupation During Past 5 Years:
· Corporate Director and Trustee (1995-present)
Other Public Company Board Memberships During Past 5 Years:
· CBIZ (formerly, Century Business Services, Inc.), a provider of outsourcing functions for small and medium size companies, Director (1997-present)
No. of Portfolios for which Board Member Serves: 125
———————
Peggy C. Davis (75)
Board Member (2006)
Principal Occupation During Past 5 Years:
· Shad Professor of Law, New York University School of Law (1983-present)
No. of Portfolios for which Board Member Serves: 45
———————
David P. Feldman (78)
Board Member (1996)
Principal Occupation During Past 5 Years:
· Corporate Director and Trustee (1985-present)
Other Public Company Board Memberships During Past 5 Years:
· BBH Mutual Funds Group (5 registered mutual funds), Director (1992-2014)
No. of Portfolios for which Board Member Serves: 31
———————
Joan Gulley (70)
Board Member (2017)
Principal Occupation During Past 5 Years:
· PNC Financial Services Group, Inc.(1993-2014), Executive Vice President and Chief Human Resources Officer and Executive Committee Member (2008-2014)
No. of Portfolios for which Board Member Serves: 52
———————
33
BOARD MEMBERS INFORMATION (Unaudited) (continued)
INDEPENDENT BOARD MEMBERS (continued)
Ehud Houminer (78)
Board Member (1993)
Principal Occupation During Past 5 Years:
· Board of Overseers at the Columbia Business School, Columbia University (1992-present)
· Trustee, Ben Gurion University
No. of Portfolios for which Board Member Serves: 52
———————
Lynn Martin (78)
Board Member (2012)
Principal Occupation During Past 5 Years:
· President of The Martin Hall Group LLC, a human resources consulting firm (2005-2012)
No. of Portfolios for which Board Member Serves: 31
———————
Robin A. Melvin (54)
Board Member (2012)
Principal Occupation During Past 5 Years:
· Co-chairman, Illinois Mentoring Partnership, non-profit organization dedicated to increasing the quantity and quality of mentoring services in Illinois; (2014-present; board member since 2013)
No. of Portfolios for which Board Member Serves: 100
———————
Dr. Martin Peretz (79)
Board Member (2006)
Principal Occupation During Past 5 Years:
· Editor-in-Chief Emeritus of The New Republic Magazine (2011-2012) (previously,
Editor-in-Chief, 1974-2011)
· Lecturer at Harvard University (1968-2010)
No. of Portfolios for which Board Member Serves: 31
———————
Once elected all Board Members serve for an indefinite term, but achieve Emeritus status upon reaching age 80. The address of the Board Members and Officers is c/o The Dreyfus Corporation, 200 Park Avenue, New York, New York 10166. Additional information about the Board Members is available in the fund’s Statement of Additional Information which can be obtained from Dreyfus free of charge by calling this toll free number: 1-800-DREYFUS.
James F. Henry, Emeritus Board Member
Philip L. Toia, Emeritus Board Member
34
OFFICERS OF THE FUND (Unaudited)
BRADLEY J. SKAPYAK, President since January 2010.
Chief Operating Officer and a director of the Manager since June 2009, Chairman of Dreyfus Transfer, Inc., an affiliate of the Manager and the transfer agent of the funds, since May 2011 and Chief Executive Officer of MBSC Securities Corporation since August 2016. He is an officer of 62 investment companies (comprised of 125 portfolios) managed by the Manager. He is 59 years old and has been an employee of the Manager since February 1988.
BENNETT A. MACDOUGALL, Chief Legal Officer since October 2015.
Chief Legal Officer of the Manager and Associate General Counsel and Managing Director of BNY Mellon since June 2015; from June 2005 to June 2015, he served in various capacities with Deutsche Bank – Asset & Wealth Management Division, including as Director and Associate General Counsel, and Chief Legal Officer of Deutsche Investment Management Americas Inc. from June 2012 to May 2015. He is an officer of 63 investment companies (comprised of 150 portfolios) managed by the Manager. He is 46 years old and has been an employee of the Manager since June 2015.
JAMES BITETTO, Vice President since August 2005 and Secretary since February 2018.
Managing Counsel of BNY Mellon and Secretary of the Manager, and an officer of 63 investment companies (comprised of 150 portfolios) managed by the Manager. He is 52 years old and has been an employee of the Manager since December 1996.
JOSEPH M. CHIOFFI, Vice President and Assistant Secretary since August 2005.
Managing Counsel of BNY Mellon, and an officer of 63 investment companies (comprised of 150 portfolios) managed by the Manager. He is 56 years old and has been an employee of the Manager since June 2000.
SONALEE CROSS, Vice President and Assistant Secretary since March 2018.
Counsel of BNY Mellon since October 2016; Associate at Proskauer Rose LLP from April 2016 to September 2016; Attorney at EnTrust Capital from August 2015 to February 2016; Associate at Sidley Austin LLP from September 2013 until August 2015. She is an officer of 63 investment companies (comprised of 150 portfolios) managed by Dreyfus. She is 30 years old and has been an employee of the Manager since October 2016.
MAUREEN E. KANE, Vice President and Assistant Secretary since April 2015.
Managing Counsel of BNY Mellon since July 2014; from October 2004 until July 2014, General Counsel, and from May 2009 until July 2014, Chief Compliance Officer of Century Capital Management. She is an officer of 63 investment companies (comprised of 150 portfolios) managed by the Manager. She is 56 years old and has been an employee of the Manager since July 2014.
SARAH S. KELLEHER, Vice President and Assistant Secretary since April 2014.
Managing Counsel of BNY Mellon. She is an officer of 63 investment companies (comprised of 150 portfolios) managed by the Manager. She is 42 years old and has been an employee of the Manager since March 2013.
JEFF PRUSNOFSKY, Vice President and Assistant Secretary since August 2005.
Senior Managing Counsel of BNY Mellon, and an officer of 63 investment companies (comprised of 150 portfolios) managed by the Manager. He is 53 years old and has been an employee of the Manager since October 1990.
NATALYA ZELENSKY, Vice President and Assistant Secretary since March 2017.
Counsel of BNY Mellon since May 2016; Attorney at Wildermuth Endowment Strategy Fund/Wildermuth Advisory, LLC from November 2015 until May 2016; Assistant General Counsel at RCS Advisory Services from July 2014 until November 2015; Associate at Sutherland, Asbill & Brennan from January 2013 until January 2014. She is an officer of 63 investment companies (comprised of 150 portfolios) managed by Dreyfus. She is 33 years old and has been an employee of the Manager since May 2016.
JAMES WINDELS, Treasurer since November 2001.
Director – Mutual Fund Accounting of the Manager, and an officer of 63 investment companies (comprised of 150 portfolios) managed by the Manager. He is 59 years old and has been an employee of the Manager since April 1985.
RICHARD CASSARO, Assistant Treasurer since January 2008.
Senior Accounting Manager – Money Market and Municipal Bond Funds of the Manager, and an officer of 63 investment companies (comprised of 150 portfolios) managed by the Manager. He is 59 years old and has been an employee of the Manager since September 1982.
35
OFFICERS OF THE FUND (Unaudited) (continued)
GAVIN C. REILLY, Assistant Treasurer since December 2005.
Tax Manager of the Investment Accounting and Support Department of the Manager, and an officer of 63 investment companies (comprised of 150 portfolios) managed by the Manager. He is 50 years old and has been an employee of the Manager since April 1991.
ROBERT S. ROBOL, Assistant Treasurer since August 2005.
Senior Accounting Manager – Dreyfus Financial Reporting of the Manager, and an officer of 63 investment companies (comprised of 150 portfolios) managed by the Manager. He is 54 years old and has been an employee of the Manager since October 1988.
ROBERT SALVIOLO, Assistant Treasurer since July 2007.
Senior Accounting Manager – Equity Funds of the Manager, and an officer of 63 investment companies (comprised of 150 portfolios) managed by the Manager. He is 51 years old and has been an employee of the Manager since June 1989.
ROBERT SVAGNA, Assistant Treasurer since December 2002.
Senior Accounting Manager – Fixed Income and Equity Funds of the Manager, and an officer of 63 investment companies (comprised of 150 portfolios) managed by the Manager. He is 51 years old and has been an employee of the Manager since November 1990.
JOSEPH W. CONNOLLY, Chief Compliance Officer since October 2004.
Chief Compliance Officer of the Manager, the Dreyfus Family of Funds and BNY Mellon Funds Trust (63 investment companies, comprised of 150 portfolios). He is 61 years old and has served in various capacities with the Manager since 1980, including manager of the firm’s Fund Accounting Department from 1997 through October 2001.
CARIDAD M. CAROSELLA, Anti-Money Laundering Compliance Officer since January 2016.
Anti-Money Laundering Compliance Officer of the Dreyfus Family of Funds and BNY Mellon Funds Trust since January 2016; from May 2015 to December 2015, Interim Anti-Money Laundering Compliance Officer of the Dreyfus Family of Funds and BNY Mellon Funds Trust and the Distributor; from January 2012 to May 2015, AML Surveillance Officer of the Distributor and from 2007 to December 2011, Financial Processing Manager of the Distributor. She is an officer of 57 investment companies (comprised of 144 portfolios) managed by the Manager. She is 50 years old and has been an employee of the Distributor since 1997.
36
NOTES
37
Dreyfus Strategic Value Fund
200 Park Avenue
New York, NY 10166
Manager
The Dreyfus Corporation
200 Park Avenue
New York, NY 10166
Custodian
The Bank of New York Mellon
240 Greenwich Street
New York, NY 10286
Transfer Agent &
Dividend Disbursing Agent
Dreyfus Transfer, Inc.
200 Park Avenue
New York, NY 10166
Distributor
MBSC Securities Corporation
200 Park Avenue
New York, NY 10166
Ticker Symbols: | Class A:DAGVX Class C:DCGVX Class I:DRGVX Class Y:DRGYX |
Telephone Call your financial representative or 1-800-DREYFUS
Mail The Dreyfus Family of Funds, 144 Glenn Curtiss Boulevard, Uniondale, NY 11556-0144
E-mail Send your request to info@dreyfus.com
Internet Information can be viewed online or downloaded at www.dreyfus.com
The fund files its complete schedule of portfolio holdings with the Securities and Exchange Commission (“SEC”) for the first and third quarters of each fiscal year on Form N-Q. The fund’s Forms N-Q are available on the SEC’s website at www.sec.gov and may be reviewed and copied at the SEC’s Public Reference Room in Washington, D.C. (phone 1-800-SEC-0330 for information).
A description of the policies and procedures that the fund uses to determine how to vote proxies relating to portfolio securities and information regarding how the fund voted these proxies for the most recent 12-month period ended June 30 is available at www.dreyfus.com and on the SEC’s website at www.sec.gov and without charge, upon request, by calling 1-800-DREYFUS.
© 2018 MBSC Securities Corporation |
|

Dreyfus Structured Midcap Fund
| ANNUAL REPORT |

|

Save time. Save paper. View your next shareholder report online as soon as it’s available. Log into www.dreyfus.com and sign up for Dreyfus eCommunications. It’s simple and only takes a few minutes. |
The views expressed in this report reflect those of the portfolio manager(s) only through the end of the period covered and do not necessarily represent the views of Dreyfus or any other person in the Dreyfus organization. Any such views are subject to change at any time based upon market or other conditions and Dreyfus disclaims any responsibility to update such views. These views may not be relied on as investment advice and, because investment decisions for a Dreyfus fund are based on numerous factors, may not be relied on as an indication of trading intent on behalf of any Dreyfus fund. |
Not FDIC-Insured • Not Bank-Guaranteed • May Lose Value |
Contents
THE FUND
With Those of Other Funds | |
in Affiliated Issuers | |
Public Accounting Firm | |
FOR MORE INFORMATION
Back Cover
| The Fund |
A LETTER FROM THE PRESIDENT OF DREYFUS
Dear Shareholder:
We are pleased to present this annual report for Dreyfus Structured Midcap Fund, covering the 12-month period from September 1, 2017 through August 31, 2018. For information about how the fund performed during the reporting period, as well as general market perspectives, we provide a Discussion of Fund Performance on the pages that follow.
The 12-month period started on solid footing which gave way to a shifting landscape. Through February of 2018, major global economies appeared to be in lock-step as they moved towards less accommodative monetary policy and concurrent growth. In the equity markets, both U.S. and non-U.S. markets enjoyed an upward trek across sectors and market caps. Interest rates rose across the curve putting pressure on bond prices, but sectors such as investment grade and high yield corporates, non-U.S. dollar denominated bonds and emerging market debt, were able to outperform like-duration U.S. Treasuries.
In February, the first rumblings of discontent shook equity markets. Global growth and monetary policy paths began to diverge. Non-U.S. economies weakened. Momentum sputtered, and equities began to struggle. Emerging market debt, non-U.S. denominated bonds and corporate debt gave up much of the performance earned earlier in the period. Long-term U.S. interest rates started to fall. The shockwave ended in April and pressure on U.S. equity markets eased, allowing U.S. equity markets to end the 12-month period with double-digit gains.
Despite new concerns regarding trade, U.S. inflationary pressures and global growth, we are optimistic that U.S. consumer spending, corporate earnings, and economic data will remain strong in the near term. However, we will stay attentive to signs that might signal possible changes on the horizon. As always, we encourage you to discuss the risks and opportunities of today’s investment environment with your financial advisor.
Thank you for your continued confidence and support.
Sincerely,

Renee Laroche-Morris
President
The Dreyfus Corporation
September 17, 2018
2
DISCUSSION OF FUND PERFORMANCE (Unaudited)
For the period from September 1, 2017 through August 31, 2018, as provided by the fund’s primary portfolio managers C. Wesley Boggs, William S. Cazalet, CAIA, Peter D. Goslin, CFA, and Syed A. Zamil, CFA, of BNY Mellon Asset Management North America Corporation, Sub-Investment Adviser
Market and Fund Performance Overview
For the 12-month period ended August 31, 2018, Dreyfus Structured Midcap Fund’s Class A shares achieved a total return of 13.96%, Class C shares returned 13.14%, Class I shares returned 14.24%, and Class Y shares returned 14.43%.1 In comparison, the fund’s benchmark, the S&P MidCap 400® Index (the “Index”), achieved a total return of 20.00% for the same period.2
Mid-cap stocks continued to gain ground over the reporting period amid rising corporate earnings, improved economic conditions, and the passage of business-friendly tax reform legislation. The fund participated in the market rally but produced lower returns than the Index, mainly due to security selection shortfalls.
The Fund’s Investment Approach
The fund seeks long-term capital growth. To pursue its goal, the fund normally invests at least 80% of its net assets, plus any borrowings for investment purposes, in the stocks of companies included in the Index or the Russell Midcap® Index.
The fund’s portfolio managers select stocks through a “bottom-up,” structured approach that seeks to identify undervalued securities using a quantitative screening process. This process is driven by a proprietary quantitative model that measures a diverse set of characteristics of stocks to identify and rank stocks based on relative value, momentum/sentiment, and earnings quality measures.
Next, the fund’s portfolio managers construct the portfolio through a risk-controlled process, focusing on stock selection as opposed to making proactive decisions as to industry and sector exposure. The fund seeks to maintain a portfolio that has exposure to industries and market capitalizations that are generally similar to those of the Index. Finally, within each sector and style subset, the fund will seek to overweight the most attractive stocks and underweight or not hold the stocks that have been ranked least attractive.
Rising Corporate Earnings Drive Markets Higher
The second half of 2017 brought an energized environment for stocks across all capitalization ranges fueled by better-than-expected corporate earnings growth, strengthening U.S. labor markets, tax cuts for U.S. businesses and individuals, and encouraging global economic developments. Consequently, the Index reached a series of new highs through January 2018. When inflation fears sparked heightened market volatility in February, it marked a shift in the global economic environment, monetary policies, and equity market behavior.
Volatility roiled global equity markets through late February, but the U.S. was able to stabilize and renew the upward trend on the back of continued positive economic data, corporate balance-sheet strength, and consumer spending. However, economic growth and market activity in many other global areas stalled. While the U.S. Federal Reserve Board (the “Fed”) continued to raise rates, central banks elsewhere reconsidered tabling their easy money policies in favor of continued stimulus measures. A comparatively rosy picture in the U.S. economy continued to support stock prices despite concerns over rising inflation. In this environment, mid-cap stocks mildly outperformed their large-cap counterparts, and growth-oriented stocks outperformed value-oriented stocks.
3
DISCUSSION OF FUND PERFORMANCE (Unaudited) (continued)
Security Selections Impact Fund Performance
Positioning in the energy and utilities sectors supported the fund’s gains over the reporting period. This positioning was the result of our quantitative security selection process, which identifies opportunities across market sectors. During the first part of the period, underweight exposure to utilities stocks benefited performance. We subsequently added exposure and ended the reporting period with an overweight to the sector. Energy was the best-performing sector, driven by an overweight to refineries within the oil, gas, and consumable fuels industry. HollyFrontier was a top contributor. The company stock price rallied from the end of February through May on the back of positive earnings reports. Among individual companies, Deckers Outdoor was a top contributor. The textiles-and-apparel company raised earnings guidance during all four quarters of the period and the stock price benefited. In addition, health care company WellCare Health Plans beat and raised estimates every quarter during the year and announced an accretive acquisition in May. These events supported an increase in the stock price over the period.
Relative strength in these areas was offset by shortfalls in other segments of the mid-cap stock market. Most significant, the fund’s relative performance was constrained by some disappointing security selections in the information technology, materials, consumer discretionary, and health care sectors. Among semiconductor manufacturers, Cirrus Logic sold off sharply in February after missing earnings and lowered guidance targets due to weak demand for smartphones. Electronics producer NCR reduced guidance several times during the reporting period, which pushed the stock lower. In materials, selection within the metals and mining and containers and packaging industries detracted. Results in the health care sector were dampened by security selection shortfalls in health care equipment and supplies. An underweight to Abiomed, which was not held and which graduated into the large-cap market segment during the period, was a primary detractor.
A Disciplined Approach to Stock Picking
As of the reporting period’s end, our quantitative models have continued to identify what we believe are attractive investment opportunities across a broad spectrum of mid-cap companies and industry groups. Stock market volatility experienced earlier this year may have provided opportunities to purchase the stocks of companies ranked highly by our process. When the fund’s holdings reach what we perceive to be fuller valuations, we expect to replace them with high-quality companies that display then-currently attractive valuations in our model. In addition, we continue to maintain a broadly diversified portfolio.
September 17, 2018
1 Total return includes reinvestment of dividends and any capital gains paid, and does not take into consideration the maximum initial sales charge in the case of Class A shares or the applicable contingent deferred sales charge imposed on redemptions in the case of Class C shares. Past performance is no guarantee of future results. Share price, yield, and investment return fluctuate such that upon redemption, fund shares may be worth more or less than their original cost. The fund’s returns reflect the absorption of certain fund expenses by The Dreyfus Corporation pursuant to an agreement in effect through December 31, 2018, at which time it may be extended, terminated, or modified. Had these expenses not been absorbed, the fund’s returns would have been lower.
2 Source: Lipper Inc. — The S&P MidCap 400® Index provides investors with a benchmark for mid-sized companies. The index measures the performance of mid-sized companies, reflecting the distinctive risk and return characteristics of this market segment. Investors cannot invest directly in any index.
Please note: the position in any security highlighted with italicized typeface was sold during the reporting period.
Equities are subject generally to market, market sector, market liquidity, issuer, and investment style risks, among other factors, to varying degrees, all of which are more fully described in the fund’s prospectus.
Stocks of small- and/or mid-cap companies often experience sharper price fluctuations than stocks of large-cap companies.
4
FUND PERFORMANCE (Unaudited)
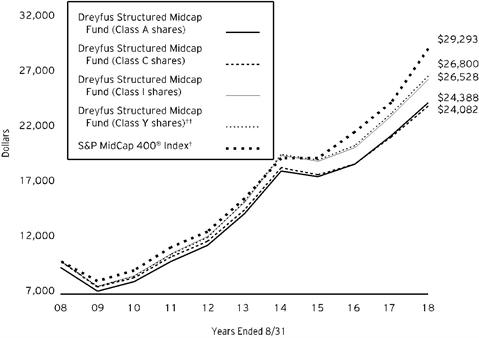
Comparison of change in value of $10,000 investment in Dreyfus Structured Midcap Fund Class A shares, Class C shares, Class I shares and Class Y shares and the S&P MidCap 400® Index (the “Index”)
† Source: Lipper Inc.
†† The total return figures presented for Class Y shares of the fund reflect the performance of the fund’s Class A shares for the period prior to 7/1/13 (the inception date for Class Y shares), not reflecting the applicable sales charges for Class A shares.
Past performance is not predictive of future performance.
The above graph compares a $10,000 investment made in each of the Class A, Class C, Class I and Class Y shares of Dreyfus Structured Midcap Fund on 8/31/08 to a $10,000 investment made in the Index on that date. All dividends and capital gain distributions are reinvested.
The fund’s performance shown in the line graph above takes into account the maximum initial sales charge on Class A shares and all other applicable fees and expenses on all classes. The Index provides investors with a benchmark for mid-sized companies. The index measures the performance of mid-sized companies, reflecting the distinctive risk and return characteristics of this market segment. Unlike a mutual fund, the Index is not subject to charges, fees and other expenses. Investors cannot invest directly in any index. Further information relating to fund performance, including expense reimbursements, if applicable, is contained in the Financial Highlights section of the prospectus and elsewhere in this report.
5
FUND PERFORMANCE (Unaudited) (continued)
Average Annual Total Returns as of 8/31/18 | ||||
Inception | 1 Year | 5 Years | 10 Years | |
Class A shares | ||||
with maximum sales charge (5.75%) | 6/29/01 | 7.42% | 9.97% | 9.32% |
without sales charge | 6/29/01 | 13.96% | 11.28% | 9.98% |
Class C shares | ||||
with applicable redemption charge † | 6/29/01 | 12.14% | 10.47% | 9.19% |
without redemption | 6/29/01 | 13.14% | 10.47% | 9.19% |
Class I shares | 6/29/01 | 14.24% | 11.57% | 10.25% |
Class Y shares | 7/1/13 | 14.43% | 11.71% | 10.36%†† |
S & P MidCap 400® Index | 20.00% | 13.30% | 11.35% | |
† The maximum contingent deferred sales charge for Class C shares is 1% for shares redeemed within one year of the date of purchase.
†† The total return performance figures presented for Class Y shares of the fund reflect the performance of the fund’s Class A shares for the period prior to 7/1/13 (the inception date for Class Y shares), not reflecting the applicable sales charges for Class A shares.
The performance data quoted represents past performance, which is no guarantee of future results. Share price and investment return fluctuate and an investor’s shares may be worth more or less than original cost upon redemption. Current performance may be lower or higher than the performance quoted. Go to Dreyfus.com for the fund’s most recent month-end returns.
The fund’s performance shown in the graph and table does not reflect the deduction of taxes that a shareholder would pay on fund distributions or the redemption of fund shares. In addition to the performance of Class A shares shown with and without a maximum sales charge, the fund’s performance shown in the table takes into account all other applicable fees and expenses on all classes.
6
UNDERSTANDING YOUR FUND’S EXPENSES (Unaudited)
As a mutual fund investor, you pay ongoing expenses, such as management fees and other expenses. Using the information below, you can estimate how these expenses affect your investment and compare them with the expenses of other funds. You also may pay one-time transaction expenses, including sales charges (loads) and redemption fees, which are not shown in this section and would have resulted in higher total expenses. For more information, see your fund’s prospectus or talk to your financial adviser.
Review your fund’s expenses
The table below shows the expenses you would have paid on a $1,000 investment in Dreyfus Structured Midcap Fund from March 1, 2018 to August 31, 2018. It also shows how much a $1,000 investment would be worth at the close of the period, assuming actual returns and expenses.
Expenses and Value of a $1,000 Investment | |||||||||||
assuming actual returns for the six months ended August 31, 2018 | |||||||||||
|
|
|
| Class A | Class C | Class I | Class Y | ||||
Expenses paid per $1,000† |
| $6.46 | $10.17 | $5.17 | $4.40 | ||||||
Ending value (after expenses) |
| $1,051.30 | $1,047.40 | $1,052.50 | $1,053.60 | ||||||
COMPARING YOUR FUND’S EXPENSES
WITH THOSE OF OTHER FUNDS (Unaudited)
Using the SEC’s method to compare expenses
The Securities and Exchange Commission (“SEC”) has established guidelines to help investors assess fund expenses. Per these guidelines, the table below shows your fund’s expenses based on a $1,000 investment, assuming a hypothetical 5% annualized return. You can use this information to compare the ongoing expenses (but not transaction expenses or total cost) of investing in the fund with those of other funds. All mutual fund shareholder reports will provide this information to help you make this comparison. Please note that you cannot use this information to estimate your actual ending account balance and expenses paid during the period.
Expenses and Value of a $1,000 Investment | |||||||||||
assuming a hypothetical 5% annualized return for the six months ended August 31, 2018 | |||||||||||
|
|
|
| Class A | Class C | Class I | Class Y | ||||
Expenses paid per $1,000† | $6.36 | $10.01 | $5.09 | $4.33 | |||||||
Ending value (after expenses) | $1,018.90 | $1,015.27 | $1,020.16 | $1,020.92 | |||||||
† Expenses are equal to the fund’s annualized expense ratio of 1.25% for Class A, 1.97% for Class C, 1.00% for Class I and .85% for Class Y, multiplied by the average account value over the period, multiplied by 184/365 (to reflect the one-half year period).
7
STATEMENT OF INVESTMENTS
August 31, 2018
Description | Shares | Value ($) | |||||
Common Stocks - 99.7% | |||||||
Automobiles & Components - 3.3% | |||||||
Dana | 57,000 | 1,115,490 | |||||
Gentex | 64,230 | 1,501,697 | |||||
Lear | 5,390 | 874,258 | |||||
Visteon | 28,345 | a,b | 3,129,005 | ||||
6,620,450 | |||||||
Banks - 5.7% | |||||||
Cathay General Bancorp | 77,560 | a | 3,280,788 | ||||
Comerica | 38,250 | 3,728,610 | |||||
East West Bancorp | 61,330 | 3,887,709 | |||||
Synovus Financial | 4,430 | 221,766 | |||||
UMB Financial | 4,820 | 362,657 | |||||
11,481,530 | |||||||
Capital Goods - 8.6% | |||||||
Allison Transmission Holdings | 74,430 | 3,696,194 | |||||
Curtiss-Wright | 24,480 | 3,279,096 | |||||
EMCOR | 43,790 | 3,507,579 | |||||
Granite Construction | 7,320 | a | 334,378 | ||||
Spirit AeroSystems Holdings, Cl. A | 9,075 | 775,912 | |||||
Terex | 93,320 | a | 3,616,150 | ||||
Toro | 31,310 | 1,903,335 | |||||
Woodward | 2,700 | 217,512 | |||||
17,330,156 | |||||||
Commercial & Professional Services - .5% | |||||||
Copart | 14,540 | b | 935,067 | ||||
Deluxe | 2,870 | a | 169,961 | ||||
1,105,028 | |||||||
Consumer Durables & Apparel - 6.3% | |||||||
Deckers Outdoor | 35,610 | b | 4,338,722 | ||||
KB Home | 65,350 | 1,623,947 | |||||
NVR | 1,240 | b | 3,308,878 | ||||
Toll Brothers | 67,200 | 2,434,656 | |||||
TRI Pointe | 71,760 | a,b | 1,039,802 | ||||
12,746,005 | |||||||
Consumer Services - .8% | |||||||
Churchill Downs | 2,900 | 819,540 | |||||
Hilton Grand Vacations | 13,290 | b | 434,051 | ||||
International Speedway, Cl. A | 9,110 | 402,206 | |||||
1,655,797 | |||||||
Diversified Financials - 4.7% | |||||||
Discover Financial Services | 4,820 | 376,538 | |||||
Dun & Bradstreet | 31,050 | 4,437,666 | |||||
8
Description | Shares | Value ($) | |||||
Common Stocks - 99.7% (continued) | |||||||
Diversified Financials - 4.7% (continued) | |||||||
Evercore, Cl. A | 10,780 | 1,144,297 | |||||
Federated Investors, Cl. B | 118,660 | a | 2,748,166 | ||||
SEI Investments | 12,555 | 791,969 | |||||
9,498,636 | |||||||
Energy - 5.0% | |||||||
HollyFrontier | 51,810 | 3,860,881 | |||||
Marathon Petroleum | 24,180 | 1,989,772 | |||||
PBF Energy, Cl. A | 82,850 | 4,301,572 | |||||
10,152,225 | |||||||
Food & Staples Retailing - .2% | |||||||
United Natural Foods | 11,890 | b | 422,214 | ||||
Food, Beverage & Tobacco - .7% | |||||||
Ingredion | 13,280 | 1,342,210 | |||||
Health Care Equipment & Services - 6.4% | |||||||
Cantel Medical | 2,200 | 213,400 | |||||
Haemonetics | 39,310 | b | 4,388,568 | ||||
Masimo | 5,200 | b | 613,028 | ||||
Varian Medical Systems | 19,210 | b | 2,151,904 | ||||
WellCare Health Plans | 18,570 | b | 5,618,725 | ||||
12,985,625 | |||||||
Household & Personal Products - 1.6% | |||||||
Edgewell Personal Care | 57,990 | a,b | 3,274,695 | ||||
Insurance - 7.4% | |||||||
CNO Financial Group | 141,460 | 3,056,951 | |||||
Kemper | 25,700 | 2,090,695 | |||||
Old Republic International | 85,450 | 1,895,281 | |||||
Primerica | 37,785 | a | 4,619,216 | ||||
Reinsurance Group of America | 18,400 | 2,628,440 | |||||
Torchmark | 7,030 | 618,078 | |||||
14,908,661 | |||||||
Materials - 8.4% | |||||||
Chemours | 44,160 | 1,925,376 | |||||
Commercial Metals | 31,220 | 674,352 | |||||
Freeport-McMoRan | 95,130 | 1,336,576 | |||||
Greif, Cl. A | 28,370 | 1,565,457 | |||||
Huntsman | 115,040 | 3,507,570 | |||||
Louisiana-Pacific | 143,170 | 4,174,837 | |||||
Westlake Chemical | 32,130 | 3,038,534 | |||||
Worthington Industries | 17,740 | a | 826,329 | ||||
17,049,031 | |||||||
Media - 1.0% | |||||||
John Wiley & Sons, Cl. A | 32,380 | 2,090,129 | |||||
9
STATEMENT OF INVESTMENTS (continued)
Description | Shares | Value ($) | |||||
Common Stocks - 99.7% (continued) | |||||||
Pharmaceuticals Biotechnology & Life Sciences - 6.0% | |||||||
Bio-Techne | 1,640 | 315,159 | |||||
Bruker | 40,400 | 1,437,432 | |||||
Charles River Laboratories International | 32,940 | b | 4,068,419 | ||||
Mettler-Toledo International | 3,155 | b | 1,843,971 | ||||
United Therapeutics | 1,880 | b | 231,221 | ||||
Waters | 6,350 | b | 1,203,198 | ||||
Zoetis | 33,950 | 3,075,870 | |||||
12,175,270 | |||||||
Real Estate - 6.8% | |||||||
Apple Hospitality | 18,500 | c | 326,525 | ||||
First Industrial Realty Trust | 122,420 | c | 3,973,753 | ||||
Highwoods Properties | 5,790 | c | 287,995 | ||||
Kilroy Realty | 20,690 | c | 1,513,267 | ||||
Lamar Advertising, Cl. A | 47,735 | c | 3,677,982 | ||||
Piedmont Office Realty Trust, Cl. A | 23,780 | c | 471,795 | ||||
Weingarten Realty Investors | 117,435 | c | 3,632,265 | ||||
13,883,582 | |||||||
Retailing - .7% | |||||||
Best Buy | 11,210 | 891,868 | |||||
Big Lots | 10,790 | a | 464,510 | ||||
1,356,378 | |||||||
Semiconductors & Semiconductor Equipment - 2.0% | |||||||
KLA-Tencor | 2,000 | 232,420 | |||||
MKS Instruments | 13,480 | 1,252,292 | |||||
ON Semiconductor | 120,180 | b | 2,564,641 | ||||
4,049,353 | |||||||
Software & Services - 11.3% | |||||||
Aspen Technology | 10,230 | b | 1,180,133 | ||||
CDK Global | 65,940 | 4,109,381 | |||||
Convergys | 124,590 | 3,081,111 | |||||
CoreLogic | 53,120 | b | 2,700,621 | ||||
Fair Isaac | 16,340 | b | 3,774,213 | ||||
Manhattan Associates | 68,380 | a,b | 3,965,356 | ||||
MAXIMUS | 61,300 | 4,076,450 | |||||
22,887,265 | |||||||
Technology Hardware & Equipment - 4.6% | |||||||
F5 Networks | 6,840 | b | 1,293,581 | ||||
NCR | 7,200 | a,b | 204,552 | ||||
Vishay Intertechnology | 136,840 | 3,256,792 | |||||
Zebra Technologies, Cl. A | 27,080 | b | 4,650,719 | ||||
9,405,644 | |||||||
Transportation - 1.1% | |||||||
Old Dominion Freight Line | 4,160 | 633,984 | |||||
10
Description | Shares | Value ($) | |||||
Common Stocks - 99.7% (continued) | |||||||
Transportation - 1.1% (continued) | |||||||
Schneider National | 43,300 | 1,171,265 | |||||
Werner Enterprises | 10,880 | a | 403,104 | ||||
2,208,353 | |||||||
Utilities - 6.6% | |||||||
IDACORP | 10,780 | a | 1,054,823 | ||||
MDU Resources | 140,190 | 3,909,899 | |||||
New Jersey Resources | 20,410 | a | 930,696 | ||||
NorthWestern | 43,410 | 2,602,864 | |||||
NRG Energy | 92,700 | 3,280,653 | |||||
OGE Energy | 44,040 | 1,621,993 | |||||
13,400,928 | |||||||
Total Common Stocks (cost $164,819,117) | 202,029,165 | ||||||
7-Day | |||||||
Investment Companies - .5% | |||||||
Registered Investment Companies - .5% | |||||||
Dreyfus Institutional Preferred Government Plus Money Market Fund | 1.91 | 923,258 | d | 923,258 | |||
Investment of Cash Collateral for Securities Loaned - 1.1% | |||||||
Registered Investment Companies - 1.1% | |||||||
Dreyfus Institutional Preferred Government Money Market Fund, Institutional Shares | 1.87 | 2,151,644 | d | 2,151,644 | |||
Total Investments (cost $167,894,019) | 101.3% | 205,104,067 | |||||
Liabilities, Less Cash and Receivables | (1.3%) | (2,534,631) | |||||
Net Assets | 100.0% | 202,569,436 | |||||
a Security, or portion thereof, on loan. At August 31, 2018, the value of the fund’s securities on loan was $21,280,048 and the value of the collateral held by the fund was $21,751,870, consisting of cash collateral of $2,151,644 and U.S. Government & Agency securities valued at $19,600,226.
b Non-income producing security.
c Investment in real estate investment trust.
d Investment in affiliated issuer. The investment objective of this investment company is publicly available and can be found within the respective investment company’s prospectus.
11
STATEMENT OF INVESTMENTS (continued)
Portfolio Summary (Unaudited) † | Value (%) |
Information Technology | 20.2 |
Financials | 15.5 |
Health Care | 12.4 |
Consumer Discretionary | 11.4 |
Industrials | 10.2 |
Materials | 8.4 |
Real Estate | 6.9 |
Utilities | 6.6 |
Energy | 5.0 |
Consumer Staples | 2.5 |
Investment Companies | 1.5 |
Consumer, Cyclical | .7 |
101.3 |
† Based on net assets.
See notes to financial statements.
12
STATEMENT OF INVESTMENTS IN AFFILIATED ISSUERS
Registered Investment Companies | Value | Purchases($) | Sales ($) | Value | Net | Dividends/ |
Dreyfus Institutional Preferred Government Money Market Fund, Institutional Shares | 7,231,724 | 52,410,578 | 57,490,658 | 2,151,644 | 1.1 | – |
Dreyfus Institutional Preferred Government Plus Money Market Fund | 1,029,107 | 38,802,507 | 38,908,356 | 923,258 | .5 | 17,169 |
Total | 8,260,831 | 91,213,085 | 96,399,014 | 3,074,902 | 1.6 | 17,169 |
See notes to financial statements.
13
STATEMENT OF ASSETS AND LIABILITIES
August 31, 2018
|
|
|
|
|
|
|
|
|
| Cost |
| Value |
|
Assets ($): |
|
|
|
| ||
Investments in securities—See Statement of Investments |
|
|
| |||
Unaffiliated issuers | 164,819,117 |
| 202,029,165 |
| ||
Affiliated issuers |
| 3,074,902 |
| 3,074,902 |
| |
Dividends and securities lending income receivable |
| 160,741 |
| |||
Receivable for shares of Common Stock subscribed |
| 54,124 |
| |||
Prepaid expenses |
|
|
|
| 30,918 |
|
|
|
|
|
| 205,349,850 |
|
Liabilities ($): |
|
|
|
| ||
Due to The Dreyfus Corporation and affiliates—Note 3(c) |
|
|
| 157,560 |
| |
Cash overdraft due to Custodian |
|
|
|
| 221 |
|
Liability for securities on loan—Note 1(b) |
| 2,151,644 |
| |||
Payable for shares of Common Stock redeemed |
| 252,299 |
| |||
Directors fees and expenses payable |
| 2,797 |
| |||
Interest payable—Note 2 |
| 518 |
| |||
Accrued expenses |
|
|
|
| 215,375 |
|
|
|
|
|
| 2,780,414 |
|
Net Assets ($) |
|
| 202,569,436 |
| ||
Composition of Net Assets ($): |
|
|
|
| ||
Paid-in capital |
|
|
|
| 151,074,118 |
|
Accumulated undistributed investment income—net |
| 241,411 |
| |||
Accumulated net realized gain (loss) on investments |
|
|
|
| 14,043,859 |
|
Accumulated net unrealized appreciation (depreciation) |
| 37,210,048 |
| |||
Net Assets ($) |
|
| 202,569,436 |
| ||
Net Asset Value Per Share | Class A | Class C | Class I | Class Y |
|
Net Assets ($) | 105,934,277 | 10,948,827 | 80,835,348 | 4,850,984 |
|
Shares Outstanding | 3,292,528 | 390,211 | 2,456,804 | 147,637 |
|
Net Asset Value Per Share ($) | 32.17 | 28.06 | 32.90 | 32.86 |
|
See notes to financial statements. |
14
STATEMENT OF OPERATIONS
Year Ended August 31, 2018
|
|
|
|
|
|
|
|
|
|
|
|
|
|
Investment Income ($): |
|
|
|
| ||
Income: |
|
|
|
| ||
Cash dividends: |
| |||||
Unaffiliated issuers |
|
| 2,689,824 |
| ||
Affiliated issuers |
|
| 17,169 |
| ||
Income from securities lending—Note 1(b) |
|
| 23,926 |
| ||
Miscellaneous income |
|
|
| 1,892 |
| |
Total Income |
|
| 2,732,811 |
| ||
Expenses: |
|
|
|
| ||
Management fee—Note 3(a) |
|
| 1,561,803 |
| ||
Shareholder servicing costs—Note 3(c) |
|
| 809,039 |
| ||
Distribution fees—Note 3(b) |
|
| 121,715 |
| ||
Professional fees |
|
| 89,588 |
| ||
Registration fees |
|
| 61,042 |
| ||
Prospectus and shareholders’ reports |
|
| 37,654 |
| ||
Directors’ fees and expenses—Note 3(d) |
|
| 16,418 |
| ||
Custodian fees—Note 3(c) |
|
| 5,435 |
| ||
Loan commitment fees—Note 2 |
|
| 4,444 |
| ||
Interest expense—Note 2 |
|
| 1,599 |
| ||
Miscellaneous |
|
| 32,748 |
| ||
Total Expenses |
|
| 2,741,485 |
| ||
Less—reduction in expenses due to undertaking—Note 3(a) |
|
| (250,290) |
| ||
Less—reduction in fees due to earnings credits—Note 3(c) |
|
| (9) |
| ||
Net Expenses |
|
| 2,491,186 |
| ||
Investment Income—Net |
|
| 241,625 |
| ||
Realized and Unrealized Gain (Loss) on Investments—Note 4 ($): |
|
| ||||
Net realized gain (loss) on investments | 18,178,762 |
| ||||
Net unrealized appreciation (depreciation) on investments |
|
| 8,836,405 |
| ||
Net Realized and Unrealized Gain (Loss) on Investments |
|
| 27,015,167 |
| ||
Net Increase in Net Assets Resulting from Operations |
| 27,256,792 |
| |||
See notes to financial statements. | ||||||
15
STATEMENT OF CHANGES IN NET ASSETS
|
|
|
| Year Ended August 31, | |||||
|
|
|
| 2018 |
| 2017 |
| ||
Operations ($): |
|
|
|
|
|
|
|
| |
Investment income—net |
|
| 241,625 |
|
|
| 285,622 |
| |
Net realized gain (loss) on investments |
| 18,178,762 |
|
|
| 20,930,553 |
| ||
Net unrealized appreciation (depreciation) |
| 8,836,405 |
|
|
| 6,855,820 |
| ||
Net Increase (Decrease) in Net Assets | 27,256,792 |
|
|
| 28,071,995 |
| |||
Distributions to Shareholders from ($): |
| ||||||||
Investment income—net: |
|
|
|
|
|
|
|
| |
Class A |
|
| (69,326) |
|
|
| (818,323) |
| |
Class C |
|
| - |
|
|
| (46,268) |
| |
Class I |
|
| (224,609) |
|
|
| (667,751) |
| |
Class Y |
|
| (36,219) |
|
|
| (219,963) |
| |
Net realized gain on investments: |
|
|
|
|
|
|
|
| |
Class A |
|
| (10,513,415) |
|
|
| - |
| |
Class C |
|
| (1,486,325) |
|
|
| - |
| |
Class I |
|
| (6,859,546) |
|
|
| - |
| |
Class Y |
|
| (810,785) |
|
|
| - |
| |
Total Distributions |
|
| (20,000,225) |
|
|
| (1,752,305) |
| |
Capital Stock Transactions ($): |
| ||||||||
Net proceeds from shares sold: |
|
|
|
|
|
|
|
| |
Class A |
|
| 20,292,443 |
|
|
| 16,262,776 |
| |
Class C |
|
| 758,112 |
|
|
| 1,309,354 |
| |
Class I |
|
| 34,251,103 |
|
|
| 32,044,088 |
| |
Class Y |
|
| 5,877,281 |
|
|
| 5,171,284 |
| |
Distributions reinvested: |
|
|
|
|
|
|
|
| |
Class A |
|
| 9,723,569 |
|
|
| 772,391 |
| |
Class C |
|
| 1,356,335 |
|
|
| 38,165 |
| |
Class I |
|
| 6,852,347 |
|
|
| 627,913 |
| |
Class Y |
|
| 36,219 |
|
|
| 219,963 |
| |
Cost of shares redeemed: |
|
|
|
|
|
|
|
| |
Class A |
|
| (25,954,176) |
|
|
| (39,836,246) |
| |
Class C |
|
| (17,520,593) |
|
|
| (11,930,991) |
| |
Class I |
|
| (27,411,263) |
|
|
| (37,562,441) |
| |
Class Y |
|
| (16,840,393) |
|
|
| (6,115,371) |
| |
Increase (Decrease) in Net Assets | (8,579,016) |
|
|
| (38,999,115) |
| |||
Total Increase (Decrease) in Net Assets | (1,322,449) |
|
|
| (12,679,425) |
| |||
Net Assets ($): |
| ||||||||
Beginning of Period |
|
| 203,891,885 |
|
|
| 216,571,310 |
| |
End of Period |
|
| 202,569,436 |
|
|
| 203,891,885 |
| |
Undistributed investment income—net | 241,411 |
|
|
| 329,940 |
| |||
16
|
|
|
| Year Ended August 31, | |||||
|
|
|
| 2018 |
| 2017 |
| ||
Capital Share Transactions (Shares): |
| ||||||||
Class Aa,b |
|
|
|
|
|
|
|
| |
Shares sold |
|
| 613,775 |
|
|
| 538,993 |
| |
Shares issued for distributions reinvested |
|
| 309,668 |
|
|
| 25,789 |
| |
Shares redeemed |
|
| (820,403) |
|
|
| (1,333,926) |
| |
Net Increase (Decrease) in Shares Outstanding | 103,040 |
|
|
| (769,144) |
| |||
Class Ca,b |
|
|
|
|
|
|
|
| |
Shares sold |
|
| 27,006 |
|
|
| 49,748 |
| |
Shares issued for distributions reinvested |
|
| 49,285 |
|
|
| 1,426 |
| |
Shares redeemed |
|
| (594,929) |
|
|
| (445,097) |
| |
Net Increase (Decrease) in Shares Outstanding | (518,638) |
|
|
| (393,923) |
| |||
Class Ia |
|
|
|
|
|
|
|
| |
Shares sold |
|
| 1,054,051 |
|
|
| 1,043,977 |
| |
Shares issued for distributions reinvested |
|
| 213,802 |
|
|
| 20,509 |
| |
Shares redeemed |
|
| (850,122) |
|
|
| (1,241,093) |
| |
Net Increase (Decrease) in Shares Outstanding | 417,731 |
|
|
| (176,607) |
| |||
Class Y |
|
|
|
|
|
|
|
| |
Shares sold |
|
| 183,083 |
|
|
| 168,902 |
| |
Shares issued for distributions reinvested |
|
| 1,132 |
|
|
| 7,189 |
| |
Shares redeemed |
|
| (519,283) |
|
|
| (195,659) |
| |
Net Increase (Decrease) in Shares Outstanding | (335,068) |
|
|
| (19,568) |
| |||
a During the period ended August 31, 2018, 7,976 Class A shares representing $248,936 were exchanged for 7,804 Class I shares and during the period ended August 31, 2017, 1,737 Class A shares representing $52,964 were exchanged for 1,704 Class I shares and 1,044 Class C shares representing $25,961 were exchanged for 910 Class I shares. | |||||||||
b During the period ended August 31, 2018, 44,686 Class C shares representing $1,347,556 were automatically converted to 39,613 Class A shares. | |||||||||
| |||||||||
17
FINANCIAL HIGHLIGHTS
The following tables describe the performance for each share class for the fiscal periods indicated. All information (except portfolio turnover rate) reflects financial results for a single fund share. Total return shows how much your investment in the fund would have increased (or decreased) during each period, assuming you had reinvested all dividends and distributions. These figures have been derived from the fund’s financial statements.
Class A Shares | Year Ended August 31, | ||||||
2018 | 2017 | 2016 | 2015 | 2014 | |||
Per Share Data ($): | |||||||
Net asset value, beginning of period | 31.03 | 27.43 | 28.21 | 33.28 | 26.49 | ||
Investment Operations: | |||||||
Investment income—neta | .02 | .04 | .23 | .06 | .11 | ||
Net realized and unrealized | 4.23 | 3.78 | 1.43 | (.96) | 7.06 | ||
Total from Investment Operations | 4.25 | 3.82 | 1.66 | (.90) | 7.17 | ||
Distributions: | |||||||
Dividends from | (.02) | (.22) | - | (.14) | (.10) | ||
Dividends from net realized | (3.09) | - | (2.44) | (4.03) | (.28) | ||
Total Distributions | (3.11) | (.22) | (2.44) | (4.17) | (.38) | ||
Net asset value, end of period | 32.17 | 31.03 | 27.43 | 28.21 | 33.28 | ||
Total Return (%)b | 13.96 | 13.95 | 6.27 | (2.80) | 27.21 | ||
Ratios/Supplemental Data (%): | |||||||
Ratio of total expenses | 1.42 | 1.32 | 1.29 | 1.25 | 1.25 | ||
Ratio of net expenses | 1.25 | 1.25 | 1.25 | 1.23 | 1.24 | ||
Ratio of net investment income | .07 | .13 | .87 | .20 | .37 | ||
Portfolio Turnover Rate | 66.61 | 63.25 | 71.27 | 78.09 | 74.66 | ||
Net Assets, end of period ($ x 1,000) | 105,934 | 98,978 | 108,588 | 118,954 | 123,057 | ||
a Based on average shares outstanding.
b Exclusive of sales charge.
See notes to financial statements.
18
Class C Shares | Year Ended August 31, | |||||||
2018 | 2017 | 2016 | 2015 | 2014 | ||||
Per Share Data ($): | ||||||||
Net asset value, beginning of period | 27.59 | 24.42 | 25.55 | 30.60 | 24.48 | |||
Investment Operations: | ||||||||
Investment income (loss)—neta | (.17) | (.16) | .03 | (.14) | (.10) | |||
Net realized and unrealized | 3.73 | 3.37 | 1.28 | (.88) | 6.50 | |||
Total from Investment Operations | 3.56 | 3.21 | 1.31 | (1.02) | 6.40 | |||
Distributions: | ||||||||
Dividends from | - | (.04) | - | - | - | |||
Dividends from net realized | (3.09) | - | (2.44) | (4.03) | (.28) | |||
Total Distributions | (3.09) | (.04) | (2.44) | (4.03) | (.28) | |||
Net asset value, end of period | 28.06 | 27.59 | 24.42 | 25.55 | 30.60 | |||
Total Return (%)b | 13.14 | 13.14 | 5.50 | (3.51) | 26.25 | |||
Ratios/Supplemental Data (%): | ||||||||
Ratio of total expenses | 1.99 | 1.98 | 2.00 | 1.96 | 1.98 | |||
Ratio of net expenses | 1.97 | 1.97 | 1.99 | 1.96 | 1.98 | |||
Ratio of net investment income | (.62) | (.59) | .13 | (.52) | (.37) | |||
Portfolio Turnover Rate | 66.61 | 63.25 | 71.27 | 78.09 | 74.66 | |||
Net Assets, end of period ($ x 1,000) | 10,949 | 25,077 | 31,817 | 33,926 | 30,502 | |||
a Based on average shares outstanding.
b Exclusive of sales charge.
See notes to financial statements.
19
FINANCIAL HIGHLIGHTS (continued)
Class I Shares | Year Ended August 31, | |||||||||
2018 | 2017 | 2016 | 2015 | 2014 | ||||||
Per Share Data ($): | ||||||||||
Net asset value, beginning of period | 31.67 | 28.02 | 28.73 | 33.83 | 26.90 | |||||
Investment Operations: | ||||||||||
Investment income—neta | .10 | .12 | .31 | .14 | .19 | |||||
Net realized and unrealized | 4.32 | 3.87 | 1.45 | (.99) | 7.17 | |||||
Total from Investment Operations | 4.42 | 3.99 | 1.76 | (.85) | 7.36 | |||||
Distributions: | ||||||||||
Dividends from | (.10) | (.34) | (.03) | (.22) | (.15) | |||||
Dividends from net realized | (3.09) | - | (2.44) | (4.03) | (.28) | |||||
Total Distributions | (3.19) | (.34) | (2.47) | (4.25) | (.43) | |||||
Net asset value, end of period | 32.90 | 31.67 | 28.02 | 28.73 | 33.83 | |||||
Total Return (%) | 14.24 | 14.28 | 6.54 | (2.59) | 27.57 | |||||
Ratios/Supplemental Data (%): | ||||||||||
Ratio of total expenses | 1.06 | 1.03 | 1.09 | 1.05 | 1.16 | |||||
Ratio of net expenses | 1.00 | .99 | 1.00 | 1.00 | .99 | |||||
Ratio of net investment income | .31 | .39 | 1.15 | .46 | .62 | |||||
Portfolio Turnover Rate | 66.61 | 63.25 | 71.27 | 78.09 | 74.66 | |||||
Net Assets, end of period ($ x 1,000) | 80,835 | 64,572 | 62,094 | 75,779 | 72,947 | |||||
a Based on average shares outstanding.
See notes to financial statements.
20
Class Y Shares | Year Ended August 31, | |||||||
2018 | 2017 | 2016 | 2015 | 2014 | ||||
Per Share Data ($): | ||||||||
Net asset value, beginning of period | 31.62 | 28.02 | 28.75 | 33.85 | 26.91 | |||
Investment Operations: | ||||||||
Investment income—neta | .15 | .16 | .33 | .18 | .19 | |||
Net realized and unrealized | 4.32 | 3.86 | 1.48 | (.98) | 7.20 | |||
Total from Investment Operations | 4.47 | 4.02 | 1.81 | (.80) | 7.39 | |||
Distributions: | ||||||||
Dividends from | (.14) | (.42) | (.10) | (.27) | (.17) | |||
Dividends from net realized | (3.09) | - | (2.44) | (4.03) | (.28) | |||
Total Distributions | (3.23) | (.42) | (2.54) | (4.30) | (.45) | |||
Net asset value, end of period | 32.86 | 31.62 | 28.02 | 28.75 | 33.85 | |||
Total Return (%) | 14.43 | 14.39 | 6.71 | (2.43) | 27.69 | |||
Ratios/Supplemental Data (%): | ||||||||
Ratio of total expenses | .86 | .86 | .87 | .84 | .87 | |||
Ratio of net expenses | .86 | .86 | .87 | .84 | .87 | |||
Ratio of net investment income | .47 | .52 | 1.24 | .59 | .58 | |||
Portfolio Turnover Rate | 66.61 | 63.25 | 71.27 | 78.09 | 74.66 | |||
Net Assets, end of period ($ x 1,000) | 4,851 | 15,265 | 14,073 | 22,004 | 21,977 | |||
a Based on average shares outstanding.
See notes to financial statements.
21
NOTES TO FINANCIAL STATEMENTS
NOTE 1—Significant Accounting Policies:
Dreyfus Structured Midcap Fund (the “fund”) is a separate diversified series of Advantage Funds, Inc. (the “Company”), which is registered under the Investment Company Act of 1940, as amended (the “Act”), as an open-end management investment company and operates as a series company currently offering ten series, including the fund. The fund’s investment objective is to seek long-term capital growth. The Dreyfus Corporation (the “Manager” or “Dreyfus”), a wholly-owned subsidiary of The Bank of New York Mellon Corporation (“BNY Mellon”), serves as the fund’s investment adviser. Effective January 31, 2018, BNY Mellon Asset Management North America Corporation (the “subadviser”), a wholly-owned subsidiary of BNY Mellon and an affiliate of Dreyfus, serves as the fund’s sub-investment adviser. The subadviser is a specialist multi-asset investment manager formed by the combination of certain BNY Mellon affiliated investment management firms, including Mellon Capital Management Corporation (“Mellon Capital”), which served as the fund’s sub-investment adviser prior to January 31, 2018.
MBSC Securities Corporation (the “Distributor”), a wholly-owned subsidiary of Dreyfus, is the distributor of the fund’s shares. The fund is authorized to issue 700 million shares of $.001 par value Common Stock. The fund currently has authorized five classes of shares: Class A (200 million shares authorized), Class C (100 million shares authorized), Class I (200 million shares authorized), Class T (100 million shares authorized) and Class Y (100 million shares authorized). Class A and Class T shares generally are subject to a sales charge imposed at the time of purchase. Class C shares are subject to a contingent deferred sales charge (“CDSC”) imposed on Class C shares redeemed within one year of purchase. Class C shares automatically convert to Class A shares ten years after the date of purchase, without the imposition of a sales charge. Class I and Class Y shares are sold at net asset value per share generally to institutional investors. As of the date of this report, the fund did not offer Class T shares for purchase. Other differences between the classes include the services offered to and the expenses borne by each class, the allocation of certain transfer agency costs, and certain voting rights. Income, expenses (other than expenses attributable to a specific class), and realized and unrealized gains or losses on investments are allocated to each class of shares based on its relative net assets.
The Company accounts separately for the assets, liabilities and operations of each series. Expenses directly attributable to each series are charged to that series’ operations; expenses which are applicable to all series are allocated among them on a pro rata basis.
22
The Financial Accounting Standards Board (“FASB”) Accounting Standards Codification is the exclusive reference of authoritative U.S. generally accepted accounting principles (“GAAP”) recognized by the FASB to be applied by nongovernmental entities. Rules and interpretive releases of the Securities and Exchange Commission (“SEC”) under authority of federal laws are also sources of authoritative GAAP for SEC registrants. The fund’s financial statements are prepared in accordance with GAAP, which may require the use of management estimates and assumptions. Actual results could differ from those estimates.
The Company enters into contracts that contain a variety of indemnifications. The fund’s maximum exposure under these arrangements is unknown. The fund does not anticipate recognizing any loss related to these arrangements.
(a) Portfolio valuation: The fair value of a financial instrument is the amount that would be received to sell an asset or paid to transfer a liability in an orderly transaction between market participants at the measurement date (i.e., the exit price). GAAP establishes a fair value hierarchy that prioritizes the inputs of valuation techniques used to measure fair value. This hierarchy gives the highest priority to unadjusted quoted prices in active markets for identical assets or liabilities (Level 1 measurements) and the lowest priority to unobservable inputs (Level 3 measurements).
Additionally, GAAP provides guidance on determining whether the volume and activity in a market has decreased significantly and whether such a decrease in activity results in transactions that are not orderly. GAAP requires enhanced disclosures around valuation inputs and techniques used during annual and interim periods.
Various inputs are used in determining the value of the fund’s investments relating to fair value measurements. These inputs are summarized in the three broad levels listed below:
Level 1—unadjusted quoted prices in active markets for identical investments.
Level 2—other significant observable inputs (including quoted prices for similar investments, interest rates, prepayment speeds, credit risk, etc.).
Level 3—significant unobservable inputs (including the fund’s own assumptions in determining the fair value of investments).
The inputs or methodology used for valuing securities are not necessarily an indication of the risk associated with investing in those securities.
23
NOTES TO FINANCIAL STATEMENTS (continued)
Changes in valuation techniques may result in transfers in or out of an assigned level within the disclosure hierarchy. Valuation techniques used to value the fund’s investments are as follows:
Investments in securities are valued at the last sales price on the securities exchange or national securities market on which such securities are primarily traded. Securities listed on the National Market System for which market quotations are available are valued at the official closing price or, if there is no official closing price that day, at the last sales price. For open short positions, asked prices are used for valuation purposes. Bid price is used when no asked price is available. Registered investment companies that are not traded on an exchange are valued at their net asset value. All of the preceding securities are generally categorized within Level 1 of the fair value hierarchy.
Securities not listed on an exchange or the national securities market, or securities for which there were no transactions, are valued at the average of the most recent bid and asked prices. These securities are generally categorized within Level 2 of the fair value hierarchy.
Fair valuing of securities may be determined with the assistance of a pricing service using calculations based on indices of domestic securities and other appropriate indicators, such as prices of relevant American Depository Receipts and futures. Utilizing these techniques may result in transfers between Level 1 and Level 2 of the fair value hierarchy.
When market quotations or official closing prices are not readily available, or are determined not to accurately reflect fair value, such as when the value of a security has been significantly affected by events after the close of the exchange or market on which the security is principally traded (for example, a foreign exchange or market), but before the fund calculates its net asset value, the fund may value these investments at fair value as determined in accordance with the procedures approved by the Company’s Board of Directors (the “Board”). Certain factors may be considered when fair valuing investments such as: fundamental analytical data, the nature and duration of restrictions on disposition, an evaluation of the forces that influence the market in which the securities are purchased and sold, and public trading in similar securities of the issuer or comparable issuers. These securities are either categorized within Level 2 or 3 of the fair value hierarchy depending on the relevant inputs used.
For restricted securities where observable inputs are limited, assumptions about market activity and risk are used and such securities are generally categorized within Level 3 of the fair value hierarchy.
24
The following is a summary of the inputs used as of August 31, 2018 in valuing the fund’s investments:
Level 1 - Unadjusted Quoted Prices | Level 2 - Other Significant Observable Inputs | Level 3 -Significant Unobservable Inputs | Total | |
Assets ($) | ||||
Investments in Securities: |
|
|
| |
Equity Securities - Common Stocks† | 202,029,165 | - | - | 202,029,165 |
Registered Investment Companies | 3,074,902 | - | - | 3,074,902 |
† See Statement of Investments for additional detailed categorizations.
At August 31, 2018, there were no transfers between levels of the fair value hierarchy. It is the fund’s policy to recognize transfers between levels at the end of the reporting period.
(b) Securities transactions and investment income: Securities transactions are recorded on a trade date basis. Realized gains and losses from securities transactions are recorded on the identified cost basis. Dividend income is recognized on the ex-dividend date and interest income, including, where applicable, accretion of discount and amortization of premium on investments, is recognized on the accrual basis.
Pursuant to a securities lending agreement with The Bank of New York Mellon, a subsidiary of BNY Mellon and an affiliate of Dreyfus, the fund may lend securities to qualified institutions. It is the fund’s policy that, at origination, all loans are secured by collateral of at least 102% of the value of U.S. securities loaned and 105% of the value of foreign securities loaned. Collateral equivalent to at least 100% of the market value of securities on loan is maintained at all times. Collateral is either in the form of cash, which can be invested in certain money market mutual funds managed by Dreyfus, or U.S. Government and Agency securities. The fund is entitled to receive all dividends, interest and distributions on securities loaned, in addition to income earned as a result of the lending transaction. Should a borrower fail to return the securities in a timely manner, The Bank of New York Mellon is required to replace the securities for the benefit of the fund or credit the fund with the market value of the unreturned securities and is subrogated to the fund’s rights against the borrower and the collateral. Additionally, the contractual maturity of security lending transactions are on an overnight and continuous basis. During the period ended August 31, 2018, The Bank of New York Mellon
25
NOTES TO FINANCIAL STATEMENTS (continued)
earned $4,820 from lending portfolio securities, pursuant to the securities lending agreement.
(c) Affiliated issuers: Investments in other investment companies advised by Dreyfus are defined as “affiliated” under the Act.
(d) Dividends and distributions to shareholders: Dividends and distributions are recorded on the ex-dividend date. Dividends from investment income-net and dividends from net realized capital gains, if any, are normally declared and paid annually, but the fund may make distributions on a more frequent basis to comply with the distribution requirements of the Internal Revenue Code of 1986, as amended (the “Code”). To the extent that net realized capital gains can be offset by capital loss carryovers, it is the policy of the fund not to distribute such gains. Income and capital gain distributions are determined in accordance with income tax regulations, which may differ from GAAP.
(e) Federal income taxes: It is the policy of the fund to continue to qualify as a regulated investment company, if such qualification is in the best interests of its shareholders, by complying with the applicable provisions of the Code, and to make distributions of taxable income sufficient to relieve it from substantially all federal income and excise taxes.
As of and during the period ended August 31, 2018, the fund did not have any liabilities for any uncertain tax positions. The fund recognizes interest and penalties, if any, related to uncertain tax positions as income tax expense in the Statement of Operations. During the period ended August 31, 2018, the fund did not incur any interest or penalties.
Each tax year in the four-year period ended August 31, 2018 remains subject to examination by the Internal Revenue Service and state taxing authorities.
At August 31, 2018, the components of accumulated earnings on a tax basis were as follows: undistributed ordinary income $859,028, undistributed capital gains $13,624,585 and unrealized appreciation $37,011,705.
The tax character of distributions paid to shareholders during the fiscal periods ended August 31, 2018 and August 31, 2017 were as follows: ordinary income $330,154 and $1,752,305, and long-term capital gains $19,670,071 and $0, respectively.
(f) New Accounting Pronouncements: In August 2018, the FASB issued Accounting Standards Update 2018-13, Fair Value Measurement (Topic 820): Disclosure Framework—Changes to the Disclosure Requirements for Fair Value Measurement (“ASU 2018-13”). The update
26
provides guidance that eliminates, adds and modifies certain disclosure requirements for fair value measurements. ASU 2018-13 will be effective for annual periods beginning after December 15, 2019. Management is currently assessing the potential impact of these changes to future financial statements.
NOTE 2—Bank Lines of Credit:
The fund participates with other Dreyfus-managed funds in an $830 million unsecured credit facility led by Citibank, N.A. and a $300 million unsecured credit facility provided by The Bank of New York Mellon (each, a “Facility”), each to be utilized primarily for temporary or emergency purposes, including the financing of redemptions. Prior to October 4, 2017, the unsecured credit facility with Citibank, N.A. was $810 million. In connection therewith, the fund has agreed to pay its pro rata portion of commitment fees for each Facility. Interest is charged to the fund based on rates determined pursuant to the terms of the respective Facility at the time of borrowing.
The average amount of borrowings outstanding under the Facilities during the period ended August 31, 2018 was approximately $69,300 with a related weighted average annualized interest rate of 2.31%.
NOTE 3—Management Fee, Sub-Investment Advisory Fee and Other Transactions with Affiliates:
(a) Pursuant to a management agreement with Dreyfus, the management fee is computed at the annual rate of .75% of the value of the fund’s average daily net assets and is payable monthly. Dreyfus has contractually agreed, from September 1, 2017 through December 31, 2018, to waive receipt of its fees and/or assume the direct expenses of the fund, so that the direct expenses of none of the classes (excluding Rule 12b-1 Distribution Plan fees, Shareholder Services Plan fees, taxes, interest expense, brokerage commissions, commitment fees on borrowings and extraordinary expenses) exceed 1.00% of the value of the fund’s average daily net assets. The reduction in expenses, pursuant to the undertaking, amounted to $250,290 during the period ended August 31, 2018.
Pursuant to a sub-investment advisory agreement between Dreyfus and the subadviser, the sub-investment advisory fee is payable monthly by Dreyfus, and is based upon the value of the fund’s average daily net assets, computed at the following annual rates:
Average Net Assets
0 up to $100 million .25%
$100 million up to $1 billion .20%
27
NOTES TO FINANCIAL STATEMENTS (continued)
$1 billion up to $1.5 billion .16%
In excess of $1.5 billion .10%
During the period ended August 31, 2018, the Distributor retained $4,118 from commissions earned on sales of the fund’s Class A shares and $199 from CDSC fees on redemptions of the fund’s Class C shares.
(b) Under the Distribution Plan adopted pursuant to Rule 12b-1 under the Act, Class C shares pay the Distributor for distributing its shares at an annual rate of .75% of the value of its average daily net assets. During the period ended August 31, 2018, Class C shares were charged $121,715 pursuant to the Distribution Plan.
(c) Under the Shareholder Services Plan, Class A and Class C shares pay the Distributor at an annual rate of .25% of the value of their average daily net assets for the provision of certain services. The services provided may include personal services relating to shareholder accounts, such as answering shareholder inquiries regarding the fund and providing reports and other information, and services related to the maintenance of shareholder accounts. The Distributor may make payments to Service Agents (securities dealers, financial institutions or other industry professionals) with respect to these services. The Distributor determines the amounts to be paid to Service Agents. During the period ended August 31, 2018, Class A and Class C shares were charged $271,689 and $40,572, respectively, pursuant to the Shareholder Services Plan.
The fund has arrangements with the transfer agent and the custodian whereby the fund may receive earnings credits when positive cash balances are maintained, which are used to offset transfer agency and custody fees. For financial reporting purposes, the fund includes net earnings credits, if any, as an expense offset in the Statement of Operations.
The fund compensates Dreyfus Transfer, Inc., a wholly-owned subsidiary of Dreyfus, under a transfer agency agreement for providing transfer agency and cash management services for the fund. The majority of transfer agency fees are comprised of amounts paid on a per account basis, while cash management fees are related to fund subscriptions and redemptions. During the period ended August 31, 2018, the fund was charged $53,294 for transfer agency services. These fees are included in Shareholder servicing costs in the Statement of Operations.
The fund compensates The Bank of New York Mellon under a custody agreement for providing custodial services for the fund. These fees are determined based on net assets, geographic region and transaction activity. During the period ended August 31, 2018, the fund was charged $5,435
28
pursuant to the custody agreement. These fees were partially offset by earnings credits of $9.
During the period ended August 31, 2018, the fund was charged $13,269 for services performed by the Chief Compliance Officer and his staff. These fees are included in Miscellaneous in the Statement of Operations.
The components of “Due to The Dreyfus Corporation and affiliates” in the Statement of Assets and Liabilities consist of: management fees $128,452, Distribution Plan fees $6,958, Shareholder Services Plan fees $24,708, custodian fees $3,153, Chief Compliance Officer fees $5,693 and transfer agency fees $18,766, which are offset against an expense reimbursement currently in effect in the amount of $30,170.
(d) Each Board member also serves as a Board member of other funds within the Dreyfus complex. Annual retainer fees and attendance fees are allocated to each fund based on net assets.
NOTE 4—Securities Transactions:
The aggregate amount of purchases and sales of investment securities, excluding short-term securities, during the period ended August 31, 2018, amounted to $137,456,972 and $165,421,909, respectively.
At August 31, 2018, the cost of investments for federal income tax purposes was $168,092,362; accordingly, accumulated net unrealized appreciation on investments was $37,011,705, consisting of $41,354,514 gross unrealized appreciation and $4,342,809 gross unrealized depreciation.
29
REPORT OF INDEPENDENT REGISTERED PUBLIC ACCOUNTING FIRM
To the Shareholders and the Board of Directors of Dreyfus Structured Midcap Fund
Opinion on the Financial Statements
We have audited the accompanying statement of assets and liabilities of Dreyfus Structured Midcap Fund (the “Fund”) (one of the funds constituting Advantage Funds, Inc.), including the statements of investments and investments in affiliated issuers, as of August 31, 2018, and the related statement of operations for the year then ended, the statements of changes in net assets for each of the two years in the period then ended, the financial highlights for each of the five years in the period then ended and the related notes (collectively referred to as the “financial statements”). In our opinion, the financial statements present fairly, in all material respects, the financial position of the Fund (one of the funds constituting Advantage Funds, Inc.) at August 31, 2018, the results of its operations for the year then ended, the changes in its net assets for each of the two years in the period then ended and its financial highlights for each of the five years in the period then ended, in conformity with U.S. generally accepted accounting principles.
Basis for Opinion
These financial statements are the responsibility of the Fund’s management. Our responsibility is to express an opinion on the Fund’s financial statements based on our audits. We are a public accounting firm registered with the Public Company Accounting Oversight Board (United States) (“PCAOB”) and are required to be independent with respect to the Fund in accordance with the U.S. federal securities laws and the applicable rules and regulations of the Securities and Exchange Commission and the PCAOB.
We conducted our audits in accordance with the standards of the PCAOB. Those standards require that we plan and perform the audit to obtain reasonable assurance about whether the financial statements are free of material misstatement, whether due to error or fraud. The Fund is not required to have, nor were we engaged to perform, an audit of the Fund’s internal control over financial reporting. As part of our audits, we are required to obtain an understanding of internal control over financial reporting, but not for the purpose of expressing an opinion on the effectiveness of the Fund’s internal control over financial reporting. Accordingly, we express no such opinion.
Our audits included performing procedures to assess the risks of material misstatement of the financial statements, whether due to error or fraud, and performing procedures that respond to those risks. Such procedures included examining, on a test basis, evidence regarding the amounts and disclosures in the financial statements. Our procedures included confirmation of securities owned as of August 31, 2018, by correspondence with the custodian and others or by other appropriate auditing procedures where replies from others were not received. Our audits also included evaluating the accounting principles used and significant estimates made by management, as well as evaluating the overall presentation of the financial statements. We believe that our audits provide a reasonable basis for our opinion.

We have served as the auditor of one or more Dreyfus investment companies since at least 1957, but we are unable to determine the specific year.
New York, New York
October 26, 2018
30
IMPORTANT TAX INFORMATION (Unaudited)
For federal tax purposes, the fund hereby reports 100% of the ordinary dividends paid during the fiscal year ended August 31, 2018 as qualifying for the corporate dividends received deduction. Also, certain dividends paid by the fund may be subject to a maximum tax rate of 15%, as provided for by the Jobs and Growth Tax Relief Reconciliation Act of 2003. Of the distributions paid during the fiscal year, $330,154 represents the maximum amount that may be considered qualified dividend income. The fund also hereby reports $3.0937 per share as a long-term capital gain distribution paid on December 21, 2017. Shareholders will receive notification in early 2019 of the percentage applicable to the preparation of their 2018 income tax returns.
31
BOARD MEMBERS INFORMATION (Unaudited)
INDEPENDENT BOARD MEMBERS
Chairman of the Board (1995)
Principal Occupation During Past 5 Years:
· Corporate Director and Trustee (1995-present)
Other Public Company Board Memberships During Past 5 Years:
· CBIZ (formerly, Century Business Services, Inc.), a provider of outsourcing functions for small and medium size companies, Director (1997-present)
No. of Portfolios for which Board Member Serves: 125
———————
Peggy C. Davis (75)
Board Member (2006)
Principal Occupation During Past 5 Years:
· Shad Professor of Law, New York University School of Law (1983-present)
No. of Portfolios for which Board Member Serves: 45
———————
David P. Feldman (78)
Board Member (1996)
Principal Occupation During Past 5 Years:
· Corporate Director and Trustee (1985-present)
Other Public Company Board Memberships During Past 5 Years:
· BBH Mutual Funds Group (5 registered mutual funds), Director (1992-2014)
No. of Portfolios for which Board Member Serves: 31
———————
Joan Gulley (70)
Board Member (2017)
Principal Occupation During Past 5 Years:
· PNC Financial Services Group, Inc.(1993-2014), Executive Vice President and Chief Human Resources Officer and Executive Committee Member (2008-2014)
No. of Portfolios for which Board Member Serves: 52
———————
32
Ehud Houminer (78)
Board Member (1993)
Principal Occupation During Past 5 Years:
· Board of Overseers at the Columbia Business School, Columbia University (1992-present)
· Trustee, Ben Gurion University
No. of Portfolios for which Board Member Serves: 52
———————
Lynn Martin (78)
Board Member (2012)
Principal Occupation During Past 5 Years:
· President of The Martin Hall Group LLC, a human resources consulting firm (2005-2012)
No. of Portfolios for which Board Member Serves: 31
———————
Robin A. Melvin (54)
Board Member (2012)
Principal Occupation During Past 5 Years:
· Co-chairman, Illinois Mentoring Partnership, non-profit organization dedicated to increasing the quantity and quality of mentoring services in Illinois; (2014-present; board member since 2013)
No. of Portfolios for which Board Member Serves: 100
———————
Dr. Martin Peretz (79)
Board Member (2006)
Principal Occupation During Past 5 Years:
· Editor-in-Chief Emeritus of The New Republic Magazine (2011-2012) (previously,
Editor-in-Chief, 1974-2011)
· Lecturer at Harvard University (1968-2010)
No. of Portfolios for which Board Member Serves: 31
———————
Once elected all Board Members serve for an indefinite term, but achieve Emeritus status upon reaching age 80. The address of the Board Members and Officers is c/o The Dreyfus Corporation, 200 Park Avenue, New York, New York 10166. Additional information about the Board Members is available in the fund’s Statement of Additional Information which can be obtained from Dreyfus free of charge by calling this toll free number: 1-800-DREYFUS.
James F. Henry, Emeritus Board Member
Philip L. Toia, Emeritus Board Member
33
OFFICERS OF THE FUND (Unaudited)
BRADLEY J. SKAPYAK, President since January 2010.
Chief Operating Officer and a director of the Manager since June 2009, Chairman of Dreyfus Transfer, Inc., an affiliate of the Manager and the transfer agent of the funds, since May 2011 and Chief Executive Officer of MBSC Securities Corporation since August 2016. He is an officer of 62 investment companies (comprised of 125 portfolios) managed by the Manager. He is 59 years old and has been an employee of the Manager since February 1988.
BENNETT A. MACDOUGALL, Chief Legal Officer since October 2015.
Chief Legal Officer of the Manager and Associate General Counsel and Managing Director of BNY Mellon since June 2015; from June 2005 to June 2015, he served in various capacities with Deutsche Bank – Asset & Wealth Management Division, including as Director and Associate General Counsel, and Chief Legal Officer of Deutsche Investment Management Americas Inc. from June 2012 to May 2015. He is an officer of 63 investment companies (comprised of 150 portfolios) managed by the Manager. He is 46 years old and has been an employee of the Manager since June 2015.
JAMES BITETTO, Vice President since August 2005 and Secretary since February 2018.
Managing Counsel of BNY Mellon and Secretary of the Manager, and an officer of 63 investment companies (comprised of 150 portfolios) managed by the Manager. He is 52 years old and has been an employee of the Manager since December 1996.
JOSEPH M. CHIOFFI, Vice President and Assistant Secretary since August 2005.
Managing Counsel of BNY Mellon, and an officer of 63 investment companies (comprised of 150 portfolios) managed by the Manager. He is 56 years old and has been an employee of the Manager since June 2000.
SONALEE CROSS, Vice President and Assistant Secretary since March 2018.
Counsel of BNY Mellon since October 2016; Associate at Proskauer Rose LLP from April 2016 to September 2016; Attorney at EnTrust Capital from August 2015 to February 2016; Associate at Sidley Austin LLP from September 2013 until August 2015. She is an officer of 63 investment companies (comprised of 150 portfolios) managed by Dreyfus. She is 30 years old and has been an employee of the Manager since October 2016.
MAUREEN E. KANE, Vice President and Assistant Secretary since April 2015.
Managing Counsel of BNY Mellon since July 2014; from October 2004 until July 2014, General Counsel, and from May 2009 until July 2014, Chief Compliance Officer of Century Capital Management. She is an officer of 63 investment companies (comprised of 150 portfolios) managed by the Manager. She is 56 years old and has been an employee of the Manager since July 2014.
SARAH S. KELLEHER, Vice President and Assistant Secretary since April 2014.
Managing Counsel of BNY Mellon. She is an officer of 63 investment companies (comprised of 150 portfolios) managed by the Manager. She is 42 years old and has been an employee of the Manager since March 2013.
JEFF PRUSNOFSKY, Vice President and Assistant Secretary since August 2005.
Senior Managing Counsel of BNY Mellon, and an officer of 63 investment companies (comprised of 150 portfolios) managed by the Manager. He is 53 years old and has been an employee of the Manager since October 1990.
NATALYA ZELENSKY, Vice President and Assistant Secretary since March 2017.
Counsel of BNY Mellon since May 2016; Attorney at Wildermuth Endowment Strategy Fund/Wildermuth Advisory, LLC from November 2015 until May 2016; Assistant General Counsel at RCS Advisory Services from July 2014 until November 2015; Associate at Sutherland, Asbill & Brennan from January 2013 until January 2014. She is an officer of 63 investment companies (comprised of 150 portfolios) managed by Dreyfus. She is 33 years old and has been an employee of the Manager since May 2016.
JAMES WINDELS, Treasurer since November 2001.
Director – Mutual Fund Accounting of the Manager, and an officer of 63 investment companies (comprised of 150 portfolios) managed by the Manager. He is 59 years old and has been an employee of the Manager since April 1985.
RICHARD CASSARO, Assistant Treasurer since January 2008.
Senior Accounting Manager – Money Market and Municipal Bond Funds of the Manager, and an officer of 63 investment companies (comprised of 150 portfolios) managed by the Manager. He is 59 years old and has been an employee of the Manager since September 1982.
34
GAVIN C. REILLY, Assistant Treasurer since December 2005.
Tax Manager of the Investment Accounting and Support Department of the Manager, and an officer of 63 investment companies (comprised of 150 portfolios) managed by the Manager. He is 50 years old and has been an employee of the Manager since April 1991.
ROBERT S. ROBOL, Assistant Treasurer since August 2005.
Senior Accounting Manager – Dreyfus Financial Reporting of the Manager, and an officer of 63 investment companies (comprised of 150 portfolios) managed by the Manager. He is 54 years old and has been an employee of the Manager since October 1988.
ROBERT SALVIOLO, Assistant Treasurer since July 2007.
Senior Accounting Manager – Equity Funds of the Manager, and an officer of 63 investment companies (comprised of 150 portfolios) managed by the Manager. He is 51 years old and has been an employee of the Manager since June 1989.
ROBERT SVAGNA, Assistant Treasurer since December 2002.
Senior Accounting Manager – Fixed Income and Equity Funds of the Manager, and an officer of 63 investment companies (comprised of 150 portfolios) managed by the Manager. He is 51 years old and has been an employee of the Manager since November 1990.
JOSEPH W. CONNOLLY, Chief Compliance Officer since October 2004.
Chief Compliance Officer of the Manager, the Dreyfus Family of Funds and BNY Mellon Funds Trust (63 investment companies, comprised of 150 portfolios). He is 61 years old and has served in various capacities with the Manager since 1980, including manager of the firm’s Fund Accounting Department from 1997 through October 2001.
CARIDAD M. CAROSELLA, Anti-Money Laundering Compliance Officer since January 2016.
Anti-Money Laundering Compliance Officer of the Dreyfus Family of Funds and BNY Mellon Funds Trust since January 2016; from May 2015 to December 2015, Interim Anti-Money Laundering Compliance Officer of the Dreyfus Family of Funds and BNY Mellon Funds Trust and the Distributor; from January 2012 to May 2015, AML Surveillance Officer of the Distributor and from 2007 to December 2011, Financial Processing Manager of the Distributor. She is an officer of 57 investment companies (comprised of 144 portfolios) managed by the Manager. She is 50 years old and has been an employee of the Distributor since 1997.
35
NOTES
36
NOTES
37
Dreyfus Structured Midcap Fund
200 Park Avenue
New York, NY 10166
Manager
The Dreyfus Corporation
200 Park Avenue
New York, NY 10166
Sub-Investment Adviser
BNY Mellon Asset Management
North America Corporation
BNY Mellon Center
One Boston Place
Boston, MA 02108-4408
Custodian
The Bank of New York Mellon
240 Greenwich Street
New York, NY 10286
Transfer Agent &
Dividend Disbursing Agent
Dreyfus Transfer, Inc.
200 Park Avenue
New York, NY 10166
Distributor
MBSC Securities Corporation
200 Park Avenue
New York, NY 10166
Ticker Symbols: | Class A: DPSAX Class C: DPSCX Class I: DPSRX Class Y: DPSYX |
Telephone Call your financial representative or 1-800-DREYFUS
Mail The Dreyfus Family of Funds, 144 Glenn Curtiss Boulevard, Uniondale, NY 11556-0144
E-mail Send your request to info@dreyfus.com
Internet Information can be viewed online or downloaded at www.dreyfus.com
The fund files its complete schedule of portfolio holdings with the Securities and Exchange Commission (“SEC”) for the first and third quarters of each fiscal year on Form N-Q. The fund’s Forms N-Q are available on the SEC’s website at www.sec.gov and may be reviewed and copied at the SEC’s Public Reference Room in Washington, D.C. (phone 1-800-SEC-0330 for information).
A description of the policies and procedures that the fund uses to determine how to vote proxies relating to portfolio securities and information regarding how the fund voted these proxies for the most recent 12-month period ended June 30 is available at www.dreyfus.com and on the SEC’s website at www.sec.gov and without charge, upon request, by calling 1-800-DREYFUS.
© 2018 MBSC Securities Corporation |
|

Dreyfus Technology Growth Fund
| ANNUAL REPORT |

|

Save time. Save paper. View your next shareholder report online as soon as it’s available. Log into www.dreyfus.com and sign up for Dreyfus eCommunications. It’s simple and only takes a few minutes. |
The views expressed in this report reflect those of the portfolio manager(s) only through the end of the period covered and do not necessarily represent the views of Dreyfus or any other person in the Dreyfus organization. Any such views are subject to change at any time based upon market or other conditions and Dreyfus disclaims any responsibility to update such views. These views may not be relied on as investment advice and, because investment decisions for a Dreyfus fund are based on numerous factors, may not be relied on as an indication of trading intent on behalf of any Dreyfus fund. |
Not FDIC-Insured • Not Bank-Guaranteed • May Lose Value |
Contents
THE FUND
With Those of Other Funds | |
in Affiliated Issuers | |
Public Accounting Firm | |
FOR MORE INFORMATION
Back Cover
| The Fund |
A LETTER FROM THE PRESIDENT OF DREYFUS
Dear Shareholder:
We are pleased to present this annual report for Dreyfus Technology Growth Fund, covering the 12-month period from September 1, 2017 through August 31, 2018. For information about how the fund performed during the reporting period, as well as general market perspectives, we provide a Discussion of Fund Performance on the pages that follow.
The 12-month period started on solid footing which gave way to a shifting landscape. Through February of 2018, major global economies appeared to be in lock-step as they moved towards less accommodative monetary policy and concurrent growth. In the equity markets, both U.S. and non-U.S. markets enjoyed an upward trek across sectors and market caps. Interest rates rose across the curve putting pressure on bond prices, but sectors such as investment grade and high yield corporates, non-U.S. dollar denominated bonds and emerging market debt, were able to outperform like-duration U.S. Treasuries.
In February, the first rumblings of discontent shook equity markets. Global growth and monetary policy paths began to diverge. Non-U.S. economies weakened. Momentum sputtered, and equities began to struggle. Emerging market debt, non-U.S. denominated bonds and corporate debt gave up much of the performance earned earlier in the period. Long-term U.S. interest rates started to fall. The shockwave ended in April and pressure on U.S. equity markets eased, allowing U.S. equity markets to end the 12-month period with double-digit gains.
Despite new concerns regarding trade, U.S. inflationary pressures and global growth, we are optimistic that U.S. consumer spending, corporate earnings, and economic data will remain strong in the near term. However, we will stay attentive to signs that might signal possible changes on the horizon. As always, we encourage you to discuss the risks and opportunities of today’s investment environment with your financial advisor.
Thank you for your continued confidence and support.
Sincerely,

Renee Laroche-Morris
President
The Dreyfus Corporation
September 17, 2018
2
DISCUSSION OF FUND PERFORMANCE (Unaudited)
For the period from September 1, 2017 through August 31, 2018, as provided by Barry K. Mills, CFA, Matthew Griffin, Erik Swords, and Elizabeth Slover, Portfolio Managers
Market and Fund Performance Overview
For the 12-month period ended August 31, 2018, Dreyfus Technology Growth Fund’s Class A shares produced a total return of 30.67%, Class C shares returned 29.74%, Class I shares returned 30.97%, and Class Y shares returned 31.16%.1 In comparison, the fund’s benchmarks, the NYSE® Technology Index and the S&P 500® Index, produced total returns of 24.25% and 19.66%, respectively, over the same period.2,3
Equities gained ground amid continued economic expansion, with information technology stocks leading the market’s rise. The fund’s focus on technology stocks positioned it to outperform the broader market, but security selection also contributed to returns.
The Fund’s Investment Approach
The fund seeks capital appreciation. To pursue its goal, the fund normally invests at least 80% of its net assets, plus any borrowings for investment purposes, in the stocks of growth companies of any size that Dreyfus believes to be leading producers or beneficiaries of technological innovation. Up to 25% of the fund’s assets may be invested in foreign securities. In choosing stocks, the fund looks for technology companies with the potential for strong earnings or revenue growth rates. The fund’s investment process centers on a multidimensional approach that looks for opportunities across emerging growth, cyclical, or stable growth companies.
Capital Expenditures Boosted Information Technology Stocks
Stocks were supported in the first half of the reporting period by an upward revision to second-quarter 2017 GDP growth, strong corporate earnings, a revised growth forecast by the Federal Reserve Board (the “Fed”), and other positive economic news. In addition, the passage of tax-reform legislation in December, featuring substantial corporate tax cuts, caused equity markets to rally to new all-time highs. The information technology sector’s strong performance was due in part to more robust corporate spending on productivity-enhancing technologies.
The economy gained momentum early in 2018 as economic data indicated robust levels of consumer spending, and long-awaited signs of wage growth began to appear. However, concerns about rising inflationary pressures and prospects for more aggressive interest-rate hikes by the Fed began to weigh on market enthusiasm, causing markets to dip in February before they recovered later in the reporting period.
Despite some concerns about trade relations, economic momentum continued through the remainder of the reporting period, as GDP growth came in above 4% for the second quarter of 2018. Buoyant levels of consumer and business confidence provided further support, and corporate earnings continued to benefit from the recent corporate tax cuts. Technology stocks have gained from increasing levels of capital expenditures and as technology companies have repatriated earnings and conducted stock buybacks.
3
DISCUSSION OF FUND PERFORMANCE (Unaudited) (continued)
Stock Selection Drove Performance
The fund participated in the information technology (IT) sector’s robust gains, and our security selection strategy identified strong performers in various related industry groups. Our positions in Amazon.com, Netflix, and Microsoft enhanced performance, as did our holding of Square, a payment processor. Cloud computing services provider ServiceNow also contributed, as it benefited from continued expansion beyond its IT service management business. Avoiding certain stocks helped as well, including Chinese Internet companies NetEase, a gaming and e-commerce company, which declined 45%, and JD.com, China’s Amazon-like company whose founder and CEO was arrested for sexual misconduct. Our decision to avoid NXP Semiconductors also benefited the fund, as its planned merger with Qualcomm failed, and the decision to sell eBay, which has declined for much of the year, also added to performance.
Returns were hindered primarily by positions in certain Chinese companies. Weibo, which offers a Twitter-like service, and Tencent Holdings, a video gaming company, declined on concerns about China generally. Tencent Holdings was also hampered by a slowing of the Chinese government’s content approval process and by an arrangement that prohibits it from monetizing its distribution of Fortnite, a popular video game. This, in turn, harmed sales of the company’s other video games. E-commerce service provider First Data was undermined by a variety of business challenges, and semiconductor maker Microchip Technology was hurt by disappointing results from its acquisition of Microsemi.
Economic Conditions Bode Well for Technology
Many technology companies appear well positioned to thrive in the current climate of steady growth, reduced U.S. corporate tax obligations, and rising interest rates. In addition, the capital spending environment is more favorable than it has been for some time. Therefore, we remain optimistic regarding the market sector’s prospects. At the end of the reporting period, we continued to find attractive opportunities in fast-growing industries in telecommunications equipment, enterprise software, robotics, and gene analysis. We are cautious on the semiconductor industry, however, because the outlook for China — where much of the consumer electronics industry operates — is uncertain, given trade tensions.
September 17, 2018
1 Total return includes reinvestment of dividends and any capital gains paid, and does not take into consideration the maximum initial sales charge in the case of Class A shares, or the applicable contingent deferred sales charge imposed on redemptions in the case of Class C shares. Had these charges been reflected, returns would have been lower. Past performance is no guarantee of future results. Share price, yield, and investment return fluctuate such that upon redemption, fund shares may be worth more or less than their original cost.
2 Source: Bloomberg L.P. — The NYSE® Technology Index is an equal-dollar-weighted index designed to objectively represent the technology sector by holding 35 of the leading U.S. technology-related companies. Investors cannot invest directly in any index.
3 Source: Lipper Inc. — The S&P 500® Index is widely regarded as the best single gauge of large-cap U.S. equities. The index includes 500 leading companies and captures approximately 80% coverage of available market capitalization. Investors cannot invest directly in any index.
Please note: the position in any security highlighted with italicized typeface was sold during the reporting period.
Equities are subject generally to market, market sector, market liquidity, issuer, and investment style risks, among other factors, to varying degrees, all of which are more fully described in the fund’s prospectus.
The technology sector has been among the most volatile sectors of the stock market. Technology companies involve greater risk because their revenue and/or earnings tend to be less predictable, and some companies may be experiencing significant losses.
4
FUND PERFORMANCE (Unaudited)

Comparison of change in value of $10,000 investment in Dreyfus Technology Growth Fund Class A shares, Class C shares, Class I shares and Class Y Shares and the NYSE® Technology Index and the S&P 500® Index (the “Index”)
† Source: Bloomberg L.P.
†† Source: Lipper Inc.
††† The total return figures presented for Class Y shares of the fund reflect the performance of the fund’s Class I shares for the period prior to 9/30/16 (the inception date for Class Y shares).
Past performance is not predictive of future performance.
The above graph compares a $10,000 investment made in each of the Class A, Class C, Class I and Class Y shares of Dreyfus Technology Growth Fund on 8/31/08 to a $10,000 investment made in each of the S&P 500® Index and the NYSE® Technology Index on that date. All dividends and capital gain distributions are reinvested.
The fund’s performance shown in the line graph above takes into account the maximum initial sales charge on Class A shares and all other applicable fees and expenses on all classes. The NYSE® Technology Index is an equal-dollar weighted index designed to objectively represent the technology sector by holding 35 of the leading U.S. technology-related companies. The S&P 500® Index is widely regarded as the best single gauge of large-cap U.S. equities. The index includes 500 leading companies and captures approximately 80% coverage of available market capitalization. Unlike a mutual fund, the indices are not subject to charges, fees and other expenses. Investors cannot invest directly in any index. Further information relating to fund performance, including expense reimbursements, if applicable, is contained in the Financial Highlights section of the prospectus and elsewhere in this report.
5
FUND PERFORMANCE (Unaudited) (continued)
Average Annual Total Returns as of 8/31/18 | ||||
Inception Date | 1 Year | 5 Years | 10 Years | |
Class A shares | ||||
with maximum sales charge (5.75%) | 10/13/1997 | 23.15% | 18.06% | 13.51% |
without sales charge | 10/13/1997 | 30.67% | 19.46% | 14.19% |
Class C shares | ||||
with applicable redemption charge† | 4/15/1999 | 28.74% | 18.51% | 13.22% |
without redemption | 4/15/1999 | 29.74% | 18.51% | 13.22% |
Class I shares | 4/15/1999 | 30.97% | 19.75% | 14.55% |
Class Y shares | 9/30/2016 | 31.16% | 19.82%†† | 14.58%†† |
NYSE® Technology Index | 24.25% | 21.40% | 14.43% | |
S&P 500® Index | 19.66% | 14.51% | 10.85% | |
† The maximum contingent deferred sales charge for Class C shares is 1% for shares redeemed within one year of the date of purchase.
†† The total return performance figures presented for Class Y shares of the fund reflect the performance of the fund’s Class I shares for the period prior to 9/30/16 (the inception date for Class Y shares).
The performance data quoted represents past performance, which is no guarantee of future results. Share price and investment return fluctuate and an investor’s shares may be worth more or less than original cost upon redemption. Current performance may be lower or higher than the performance quoted. Go to Dreyfus.com for the fund’s most recent month-end returns.
The fund’s performance shown in the graph and table does not reflect the deduction of taxes that a shareholder would pay on fund distributions or the redemption of fund shares. In addition to the performance of Class A shares shown with and without a maximum sales charge, the fund's performance shown in the table takes into account all other applicable fees and expenses on all classes.
6
UNDERSTANDING YOUR FUND’S EXPENSES (Unaudited)
As a mutual fund investor, you pay ongoing expenses, such as management fees and other expenses. Using the information below, you can estimate how these expenses affect your investment and compare them with the expenses of other funds. You also may pay one-time transaction expenses, including sales charges (loads) and redemption fees, which are not shown in this section and would have resulted in higher total expenses. For more information, see your fund’s prospectus or talk to your financial adviser.
Review your fund’s expenses
The table below shows the expenses you would have paid on a $1,000 investment in Dreyfus Technology Growth Fund from March 1, 2018 to August 31, 2018. It also shows how much a $1,000 investment would be worth at the close of the period, assuming actual returns and expenses.
Expenses and Value of a $1,000 Investment | ||||||||||||||
assuming actual returns for the six months ended August 31, 2018 | ||||||||||||||
|
|
|
| Class A | Class C | Class I | Class Y | |||||||
Expenses paid per $1,000† |
| $6.38 | $9.94 | $5.38 | $4.54 | |||||||||
Ending value (after expenses) |
| $1,091.40 | $1,087.60 | $1,092.50 | $1,093.30 | |||||||||
COMPARING YOUR FUND’S EXPENSES
WITH THOSE OF OTHER FUNDS (Unaudited)
Using the SEC’s method to compare expenses
The Securities and Exchange Commission (“SEC”) has established guidelines to help investors assess fund expenses. Per these guidelines, the table below shows your fund’s expenses based on a $1,000 investment, assuming a hypothetical 5% annualized return. You can use this information to compare the ongoing expenses (but not transaction expenses or total cost) of investing in the fund with those of other funds. All mutual fund shareholder reports will provide this information to help you make this comparison. Please note that you cannot use this information to estimate your actual ending account balance and expenses paid during the period.
Expenses and Value of a $1,000 Investment | ||||||||||||||
assuming a hypothetical 5% annualized return for the six months ended August 31, 2018 | ||||||||||||||
|
|
|
| Class A | Class C | Class I | Class Y | |||||||
Expenses paid per $1,000† | $6.16 | $9.60 | $5.19 | $4.38 | ||||||||||
Ending value (after expenses) | $1,019.11 | $1,015.68 | $1,020.06 | $1,020.87 | ||||||||||
† Expenses are equal to the fund’s annualized expense ratio of 1.21% for Class A, 1.89% for Class C, 1.02% for Class I and .86% for Class Y, multiplied by the average account value over the period, multiplied by 184/365 (to reflect the one-half year period).
7
STATEMENT OF INVESTMENTS
August 31, 2018
Description | Shares | Value ($) | |||||
Common Stocks - 97.0% | |||||||
Commercial & Professional Services - 1.6% | |||||||
CoStar Group | 12,894 | a | 5,701,211 | ||||
Health Care Equipment & Services - 2.3% | |||||||
Intuitive Surgical | 15,118 | a | 8,466,080 | ||||
Pharmaceuticals Biotechnology & Life Sciences - 1.7% | |||||||
Illumina | 16,791 | a | 5,957,951 | ||||
Retailing - 11.1% | |||||||
Amazon.com | 11,251 | a | 22,645,000 | ||||
Netflix | 46,766 | a | 17,194,923 | ||||
39,839,923 | |||||||
Semiconductors & Semiconductor Equipment - 12.7% | |||||||
Applied Materials | 108,276 | a | 4,658,034 | ||||
Microchip Technology | 73,489 | b | 6,322,259 | ||||
NVIDIA | 52,976 | 14,869,304 | |||||
Taiwan Semiconductor Manufacturing, ADR | 243,443 | 10,614,115 | |||||
Texas Instruments | 79,615 | 8,948,726 | |||||
45,412,438 | |||||||
Software & Services - 50.4% | |||||||
Activision Blizzard | 161,896 | 11,672,702 | |||||
Adobe Systems | 60,514 | a | 15,946,044 | ||||
Alibaba Group Holding, ADR | 64,795 | a | 11,339,773 | ||||
Alphabet, Cl. C | 12,600 | a | 15,349,194 | ||||
Facebook, Cl. A | 72,050 | a | 12,661,346 | ||||
International Business Machines | 69,425 | 10,169,374 | |||||
Microsoft | 197,921 | 22,232,466 | |||||
Oracle | 200,783 | 9,754,038 | |||||
PayPal Holdings | 136,137 | a | 12,569,529 | ||||
salesforce.com | 107,577 | a | 16,424,856 | ||||
ServiceNow | 38,288 | a | 7,518,232 | ||||
Splunk | 41,188 | a | 5,278,242 | ||||
Spotify Technology | 18,353 | a | 3,478,261 | ||||
Square, Cl. A | 38,349 | a,b | 3,399,255 | ||||
Tencent Holdings | 163,400 | 7,078,325 | |||||
Visa, Cl. A | 80,479 | b | 11,821,560 | ||||
Weibo, ADR | 52,007 | a | 3,991,017 | ||||
180,684,214 | |||||||
Technology Hardware & Equipment - 14.4% | |||||||
Amphenol, Cl. A | 51,209 | a | 4,843,347 | ||||
Apple | 92,091 | a | 20,962,674 | ||||
Cisco Systems | 315,251 | 15,059,540 | |||||
Lumentum Holdings | 44,070 | a,b | 2,992,353 | ||||
8
Description | Shares | Value ($) | |||||
Common Stocks - 97.0% (continued) | |||||||
Technology Hardware & Equipment - 14.4% (continued) | |||||||
Palo Alto Networks | 33,480 | a | 7,738,902 | ||||
51,596,816 | |||||||
Telecommunication Services - 2.8% | |||||||
Verizon Communications | 187,797 | 10,210,523 | |||||
Total Common Stocks (cost $207,232,968) | 347,869,156 | ||||||
7-Day | |||||||
Investment Companies - 2.7% | |||||||
Registered Investment Companies - 2.7% | |||||||
Dreyfus Institutional Preferred Government Plus Money Market Fund | 1.91 | 9,671,575 | c | 9,671,575 | |||
Investment of Cash Collateral for Securities Loaned - .9% | |||||||
Registered Investment Companies - .9% | |||||||
Dreyfus Institutional Preferred Government Money Market Fund, Institutional Shares | 1.87 | 3,057,267 | c | 3,057,267 | |||
Total Investments (cost $219,961,810) | 100.6% | 360,597,998 | |||||
Liabilities, Less Cash and Receivables | (.6%) | (2,040,193) | |||||
Net Assets | 100.0% | 358,557,805 | |||||
ADR—American Depository Receipt
a Non-income producing security.
b Security, or portion thereof, on loan. At August 31, 2018, the value of the fund’s securities on loan was $18,105,458 and the value of the collateral held by the fund was $18,439,052, consisting of cash collateral of $3,057,267 and U.S. Government & Agency securities valued at $15,381,785.
c Investment in affiliated issuer. The investment objective of this investment company is publicly available and can be found within the respective investment company’s prospectus.
Portfolio Summary (Unaudited) † | Value (%) |
Information Technology | 76.1 |
Consumer Discretionary | 11.1 |
Health Care | 4.0 |
Investment Companies | 3.6 |
Industrials | 2.9 |
Telecommunication Services | 2.9 |
100.6 |
† Based on net assets.
See notes to financial statements.
9
STATEMENT OF INVESTMENTS IN AFFILIATED ISSUERS
Registered Investment Companies | Value | Purchases ($) | Sales ($) | Value | Net | Dividends/ |
Dreyfus Institutional Preferred Government Plus Money Market Fund | 2,724,352 | 72,000,725 | 65,053,502 | 9,671,575 | 2.7 | 94,651 |
Dreyfus Institutional Preferred Government Money Market Fund, Institutional Shares | 15,462,961 | 134,487,357 | 146,893,051 | 3,057,267 | .9 | - |
Total | 18,187,313 | 206,488,082 | 211,946,553 | 12,728,842 | 3.6 | 94,651 |
See notes to financial statements.
10
STATEMENT OF ASSETS AND LIABILITIES
August 31, 2018
|
|
|
|
|
|
|
|
|
| Cost |
| Value |
|
Assets ($): |
|
|
|
| ||
Investments in securities—See Statement of Investments |
|
|
| |||
Unaffiliated issuers | 207,232,968 |
| 347,869,156 |
| ||
Affiliated issuers |
| 12,728,842 |
| 12,728,842 |
| |
Cash denominated in foreign currency |
|
| 18,333 |
| 18,320 |
|
Receivable for shares of Common Stock subscribed |
| 1,416,867 |
| |||
Dividends and securities lending income receivable |
| 286,507 |
| |||
Prepaid expenses |
|
|
|
| 37,318 |
|
|
|
|
|
| 362,357,010 |
|
Liabilities ($): |
|
|
|
| ||
Due to The Dreyfus Corporation and affiliates—Note 3(c) |
|
|
| 347,803 |
| |
Liability for securities on loan—Note 1(b) |
| 3,057,267 |
| |||
Payable for shares of Common Stock redeemed |
| 262,570 |
| |||
Directors fees and expenses payable |
| 4,370 |
| |||
Accrued expenses |
|
|
|
| 127,195 |
|
|
|
|
|
| 3,799,205 |
|
Net Assets ($) |
|
| 358,557,805 |
| ||
Composition of Net Assets ($): |
|
|
|
| ||
Paid-in capital |
|
|
|
| 168,883,916 |
|
Accumulated net realized gain (loss) on investments |
|
|
|
| 49,037,714 |
|
Accumulated net unrealized appreciation (depreciation) |
| 140,636,175 |
| |||
Net Assets ($) |
|
| 358,557,805 |
| ||
Net Asset Value Per Share | Class A | Class C | Class I | Class Y |
|
Net Assets ($) | 310,109,912 | 13,691,928 | 34,741,780 | 14,185 |
|
Shares Outstanding | 5,253,384 | 301,309 | 532,035 | 216.64 |
|
Net Asset Value Per Share ($) | 59.03 | 45.44 | 65.30 | 65.48 |
|
See notes to financial statements. |
11
STATEMENT OF OPERATIONS
Year Ended August 31, 2018
|
|
|
|
|
|
|
|
|
|
|
|
|
|
Investment Income ($): |
|
|
|
| ||
Income: |
|
|
|
| ||
Cash dividends: |
| |||||
Unaffiliated issuers |
|
| 2,612,858 |
| ||
Affiliated issuers |
|
| 94,651 |
| ||
Income from securities lending—Note 1(b) |
|
| 102,043 |
| ||
Total Income |
|
| 2,809,552 |
| ||
Expenses: |
|
|
|
| ||
Management fee—Note 3(a) |
|
| 2,417,465 |
| ||
Shareholder servicing costs—Note 3(c) |
|
| 1,170,273 |
| ||
Distribution fees—Note 3(b) |
|
| 125,032 |
| ||
Professional fees |
|
| 94,262 |
| ||
Registration fees |
|
| 65,368 |
| ||
Prospectus and shareholders’ reports |
|
| 27,624 |
| ||
Directors’ fees and expenses—Note 3(d) |
|
| 24,844 |
| ||
Custodian fees—Note 3(c) |
|
| 14,344 |
| ||
Loan commitment fees—Note 2 |
|
| 8,213 |
| ||
Interest expense—Note 2 |
|
| 814 |
| ||
Miscellaneous |
|
| 37,889 |
| ||
Total Expenses |
|
| 3,986,128 |
| ||
Less—reduction in fees due to earnings credits—Note 3(c) |
|
| (4) |
| ||
Net Expenses |
|
| 3,986,124 |
| ||
Investment (Loss)—Net |
|
| (1,176,572) |
| ||
Realized and Unrealized Gain (Loss) on Investments—Note 4 ($): |
|
| ||||
Net realized gain (loss) on investments and foreign currency transactions | 47,539,757 |
| ||||
Net unrealized appreciation (depreciation) on investments |
|
| 38,682,753 |
| ||
Net Realized and Unrealized Gain (Loss) on Investments |
|
| 86,222,510 |
| ||
Net Increase in Net Assets Resulting from Operations |
| 85,045,938 |
| |||
See notes to financial statements. | ||||||
12
STATEMENT OF CHANGES IN NET ASSETS
|
|
|
| Year Ended August 31, | |||||
|
|
|
| 2018 |
| 2017 | a | ||
Operations ($): |
|
|
|
|
|
|
|
| |
Investment (loss)—net |
|
| (1,176,572) |
|
|
| (1,199,448) |
| |
Net realized gain (loss) on investments |
| 47,539,757 |
|
|
| 43,450,119 |
| ||
Net unrealized appreciation (depreciation) |
| 38,682,753 |
|
|
| 23,864,865 |
| ||
Net Increase (Decrease) in Net Assets | 85,045,938 |
|
|
| 66,115,536 |
| |||
Distributions to Shareholders from ($): |
| ||||||||
Net realized gain on investments: |
|
|
|
|
|
|
|
| |
Class A |
|
| (23,004,524) |
|
|
| (18,879,916) |
| |
Class C |
|
| (2,842,926) |
|
|
| (2,566,583) |
| |
Class I |
|
| (1,868,874) |
|
|
| (1,412,768) |
| |
Class Y |
|
| (1,051) |
|
|
| (834) |
| |
Total Distributions |
|
| (27,717,375) |
|
|
| (22,860,101) |
| |
Capital Stock Transactions ($): |
| ||||||||
Net proceeds from shares sold: |
|
|
|
|
|
|
|
| |
Class A |
|
| 34,790,832 |
|
|
| 16,981,586 |
| |
Class C |
|
| 2,052,576 |
|
|
| 1,578,314 |
| |
Class I |
|
| 24,973,003 |
|
|
| 11,469,224 |
| |
Class Y |
|
| - |
|
|
| 10,000 |
| |
Distributions reinvested: |
|
|
|
|
|
|
|
| |
Class A |
|
| 21,160,000 |
|
|
| 17,571,730 |
| |
Class C |
|
| 2,656,571 |
|
|
| 2,046,764 |
| |
Class I |
|
| 1,616,707 |
|
|
| 1,266,977 |
| |
Cost of shares redeemed: |
|
|
|
|
|
|
|
| |
Class A |
|
| (43,499,300) |
|
|
| (38,651,652) |
| |
Class C |
|
| (16,682,659) |
|
|
| (7,411,850) |
| |
Class I |
|
| (16,174,670) |
|
|
| (14,183,829) |
| |
Increase (Decrease) in Net Assets | 10,893,060 |
|
|
| (9,322,736) |
| |||
Total Increase (Decrease) in Net Assets | 68,221,623 |
|
|
| 33,932,699 |
| |||
Net Assets ($): |
| ||||||||
Beginning of Period |
|
| 290,336,182 |
|
|
| 256,403,483 |
| |
End of Period |
|
| 358,557,805 |
|
|
| 290,336,182 |
| |
13
STATEMENT OF CHANGES IN NET ASSETS (continued)
|
|
|
| Year Ended August 31, | |||||
|
|
|
| 2018 |
| 2017 | a | ||
Capital Share Transactions (Shares): |
| ||||||||
Class Ab,c |
|
|
|
|
|
|
|
| |
Shares sold |
|
| 665,564 |
|
|
| 383,149 |
| |
Shares issued for distributions reinvested |
|
| 432,720 |
|
|
| 455,935 |
| |
Shares redeemed |
|
| (812,775) |
|
|
| (904,111) |
| |
Net Increase (Decrease) in Shares Outstanding | 285,509 |
|
|
| (65,027) |
| |||
Class Cb,c |
|
|
|
|
|
|
|
| |
Shares sold |
|
| 49,529 |
|
|
| 45,991 |
| |
Shares issued for distributions reinvested |
|
| 70,224 |
|
|
| 66,346 |
| |
Shares redeemed |
|
| (427,238) |
|
|
| (206,441) |
| |
Net Increase (Decrease) in Shares Outstanding | (307,485) |
|
|
| (94,104) |
| |||
Class Ib |
|
|
|
|
|
|
|
| |
Shares sold |
|
| 415,708 |
|
|
| 244,039 |
| |
Shares issued for distributions reinvested |
|
| 29,933 |
|
|
| 30,102 |
| |
Shares redeemed |
|
| (273,813) |
|
|
| (297,419) |
| |
Net Increase (Decrease) in Shares Outstanding | 171,828 |
|
|
| (23,278) |
| |||
Class Y |
|
|
|
|
|
|
|
| |
Shares sold |
|
| - |
|
|
| 216.64 |
| |
Net Increase (Decrease) in Shares Outstanding | - |
|
|
| 216.64 |
| |||
a On September 30, 2016, the fund commenced offering Class Y shares. | |||||||||
b During the period ended August 31, 2018, 135 Class A shares representing $7,362 were exchanged for 123 Class I shares and during the period ended August 31, 2017, 237 Class C shares representing $8,154 were exchanged for 194 Class A shares. | |||||||||
c During the period ended August 31, 2018, 39,000 Class A shares representing $1,500,791 were automatically converted to 30,167 Class C shares. | |||||||||
| |||||||||
14
FINANCIAL HIGHLIGHTS
The following tables describe the performance for each share class for the fiscal periods indicated. All information (except portfolio turnover rate) reflects financial results for a single fund share. Total return shows how much your investment in the fund would have increased (or decreased) during each period, assuming you had reinvested all dividends and distributions. These figures have been derived from the fund’s financial statements.
Year Ended August 31, | ||||||
Class A Shares | 2018 | 2017 | 2016 | 2015 | 2014 | |
Per Share Data ($): | ||||||
Net asset value, beginning of period | 49.66 | 42.56 | 40.03 | 47.28 | 38.16 | |
Investment Operations: | ||||||
Investment (loss)—neta | (.18) | (.18) | (.21) | (.26) | (.21) | |
Net realized and unrealized | 14.40 | 11.13 | 5.32 | .75 | 10.17 | |
Total from Investment Operations | 14.22 | 10.95 | 5.11 | .49 | 9.96 | |
Distributions: | ||||||
Dividends from net realized | (4.85) | (3.85) | (2.58) | (7.74) | (.84) | |
Net asset value, end of period | 59.03 | 49.66 | 42.56 | 40.03 | 47.28 | |
Total Return (%)b | 30.67 | 28.34 | 13.23 | 1.40 | 26.37 | |
Ratios/Supplemental Data (%): | ||||||
Ratio of total expenses | 1.22 | 1.26 | 1.28 | 1.28 | 1.26 | |
Ratio of net expenses | 1.22 | 1.26 | 1.28 | 1.28 | 1.26 | |
Ratio of net investment (loss) | (.34) | (.40) | (.53) | (.61) | (.47) | |
Portfolio Turnover Rate | 49.14 | 58.27 | 37.76 | 67.23 | 69.81 | |
Net Assets, end of period ($ x 1,000) | 310,110 | 246,693 | 214,185 | 218,398 | 237,657 | |
a Based on average shares outstanding.
b Exclusive of sales charge.
See notes to financial statements.
15
FINANCIAL HIGHLIGHTS (continued)
Year Ended August 31, | ||||||
Class C Shares | 2018 | 2017 | 2016 | 2015 | 2014 | |
Per Share Data ($): | ||||||
Net asset value, beginning of period | 39.52 | 34.92 | 33.55 | 41.17 | 33.60 | |
Investment Operations: | ||||||
Investment (loss)—neta | (.47) | (.43) | (.44) | (.52) | (.51) | |
Net realized and unrealized | 11.24 | 8.88 | 4.39 | .64 | 8.92 | |
Total from Investment Operations | 10.77 | 8.45 | 3.95 | .12 | 8.41 | |
Distributions: | ||||||
Dividends from net realized | (4.85) | (3.85) | (2.58) | (7.74) | (.84) | |
Net asset value, end of period | 45.44 | 39.52 | 34.92 | 33.55 | 41.17 | |
Total Return (%)b | 29.74 | 27.30 | 12.27 | .61 | 25.33 | |
Ratios/Supplemental Data (%): | ||||||
Ratio of total expenses | 1.96 | 2.07 | 2.10 | 2.08 | 2.10 | |
Ratio of net expenses | 1.96 | 2.07 | 2.09 | 2.08 | 2.10 | |
Ratio of net investment (loss) | (1.14) | (1.21) | (1.34) | (1.41) | (1.31) | |
Portfolio Turnover Rate | 49.14 | 58.27 | 37.76 | 67.23 | 69.81 | |
Net Assets, end of period ($ x 1,000) | 13,692 | 24,060 | 24,544 | 25,028 | 29,098 | |
a Based on average shares outstanding.
b Exclusive of sales charge.
See notes to financial statements.
16
Year Ended August 31, | ||||||
Class I Shares | 2018 | 2017 | 2016 | 2015 | 2014 | |
Per Share Data ($): | ||||||
Net asset value, beginning of period | 54.34 | 46.09 | 43.05 | 50.14 | 40.34 | |
Investment Operations: | ||||||
Investment (loss)—neta | (.07) | (.06) | (.12) | (.16) | (.12) | |
Net realized and unrealized | 15.88 | 12.16 | 5.74 | .81 | 10.76 | |
Total from Investment Operations | 15.81 | 12.10 | 5.62 | .65 | 10.64 | |
Distributions: | ||||||
Dividends from net realized | (4.85) | (3.85) | (2.58) | (7.74) | (.84) | |
Net asset value, end of period | 65.30 | 54.34 | 46.09 | 43.05 | 50.14 | |
Total Return (%) | 30.97 | 28.69 | 13.49 | 1.69 | 26.61 | |
Ratios/Supplemental Data (%): | ||||||
Ratio of total expenses | .99 | 1.00 | 1.03 | 1.02 | 1.05 | |
Ratio of net expenses | .99 | 1.00 | 1.03 | 1.02 | 1.05 | |
Ratio of net investment | (.11) | (.13) | (.27) | (.36) | (.26) | |
Portfolio Turnover Rate | 49.14 | 58.27 | 37.76 | 67.23 | 69.81 | |
Net Assets, end of period ($ x 1,000) | 34,742 | 19,572 | 17,675 | 16,659 | 15,536 | |
a Based on average shares outstanding.
See notes to financial statements.
17
FINANCIAL HIGHLIGHTS (continued)
Year Ended August 31, | |||
Class Y Shares | 2018 | 2017a | |
Per Share Data ($): | |||
Net asset value, beginning of period | 54.40 | 46.16 | |
Investment Operations: | |||
Investment income—netb | .01 | .00c | |
Net realized and unrealized | 15.92 | 12.09 | |
Total from Investment Operations | 15.93 | 12.09 | |
Distributions: | |||
Dividends from net realized | (4.85) | (3.85) | |
Net asset value, end of period | 65.48 | 54.40 | |
Total Return (%) | 31.16 | 28.63d | |
Ratios/Supplemental Data (%): | |||
Ratio of total expenses | .85 | .89e | |
Ratio of net expenses | .85 | .89e | |
Ratio of net investment income | .02 | .01e | |
Portfolio Turnover Rate | 49.14 | 58.27 | |
Net Assets, end of period ($ x 1,000) | 14 | 12 | |
a From September 30, 2016 (commencement of initial offering) to August 31, 2017.
b Based on average shares outstanding.
c Amount represents less than $.01 per share.
d Not annualized.
e Annualized.
See notes to financial statements.
18
NOTES TO FINANCIAL STATEMENTS
NOTE 1—Significant Accounting Policies:
Dreyfus Technology Growth Fund (the “fund”) is a separate diversified series of Advantage Funds, Inc. (the “Company”), which is registered under the Investment Company Act of 1940, as amended (the “Act”), as an open-end management investment company and operates as a series company currently offering ten series, including the fund. The fund’s investment objective is to seek capital appreciation. The Dreyfus Corporation (the “Manager” or “Dreyfus”), a wholly-owned subsidiary of The Bank of New York Mellon Corporation (“BNY Mellon”), serves as the fund’s investment adviser.
MBSC Securities Corporation (the “Distributor”), a wholly-owned subsidiary of Dreyfus, is the distributor of the fund’s shares. The fund is authorized to issue 700 million shares of $.001 par value Common Stock. The fund currently has authorized five classes of shares: Class A (200 million shares authorized), Class C (100 million shares authorized), Class I (200 million shares authorized), Class T (100 million shares authorized), and Class Y (100 million shares authorized). Class A and Class T shares generally are subject to a sales charge imposed at the time of purchase. Class C shares are subject to a contingent deferred sales charge (“CDSC”) imposed on Class C shares redeemed within one year of purchase. Class C shares automatically convert to Class A shares ten years after the date of purchase, without the imposition of a sales charge. Class I and Class Y shares are sold at net asset value per share generally to institutional investors. As of the date of this report, the fund did not offer Class T shares for purchase. Other differences between the classes include the services offered to and the expenses borne by each class, the allocation of certain transfer agency costs and certain voting rights. Income, expenses (other than expenses attributable to a specific class), and realized and unrealized gains or losses on investments are allocated to each class of shares based on its relative net assets.
As of August 31, 2018, MBC Investments Corp., an indirect subsidiary of BNY Mellon, held all of the outstanding Class Y shares of the fund.
The Company accounts separately for the assets, liabilities and operations of each series. Expenses directly attributable to each series are charged to that series’ operations; expenses which are applicable to all series are allocated among them on a pro rata basis.
The Financial Accounting Standards Board (“FASB”) Accounting Standards Codification is the exclusive reference of authoritative U.S.
19
NOTES TO FINANCIAL STATEMENTS (continued)
generally accepted accounting principles (“GAAP”) recognized by the FASB to be applied by nongovernmental entities. Rules and interpretive releases of the Securities and Exchange Commission (“SEC”) under authority of federal laws are also sources of authoritative GAAP for SEC registrants. The fund’s financial statements are prepared in accordance with GAAP, which may require the use of management estimates and assumptions. Actual results could differ from those estimates.
The Company enters into contracts that contain a variety of indemnifications. The fund’s maximum exposure under these arrangements is unknown. The fund does not anticipate recognizing any loss related to these arrangements.
(a) Portfolio valuation: The fair value of a financial instrument is the amount that would be received to sell an asset or paid to transfer a liability in an orderly transaction between market participants at the measurement date (i.e., the exit price). GAAP establishes a fair value hierarchy that prioritizes the inputs of valuation techniques used to measure fair value. This hierarchy gives the highest priority to unadjusted quoted prices in active markets for identical assets or liabilities (Level 1 measurements) and the lowest priority to unobservable inputs (Level 3 measurements).
Additionally, GAAP provides guidance on determining whether the volume and activity in a market has decreased significantly and whether such a decrease in activity results in transactions that are not orderly. GAAP requires enhanced disclosures around valuation inputs and techniques used during annual and interim periods.
Various inputs are used in determining the value of the fund’s investments relating to fair value measurements. These inputs are summarized in the three broad levels listed below:
Level 1—unadjusted quoted prices in active markets for identical investments.
Level 2—other significant observable inputs (including quoted prices for similar investments, interest rates, prepayment speeds, credit risk, etc.).
Level 3—significant unobservable inputs (including the fund’s own assumptions in determining the fair value of investments).
The inputs or methodology used for valuing securities are not necessarily an indication of the risk associated with investing in those securities.
20
Changes in valuation techniques may result in transfers in or out of an assigned level within the disclosure hierarchy. Valuation techniques used to value the fund’s investments are as follows:
Investments in securities are valued at the last sales price on the securities exchange or national securities market on which such securities are primarily traded. Securities listed on the National Market System for which market quotations are available are valued at the official closing price or, if there is no official closing price that day, at the last sales price. For open short positions, asked prices are used for valuation purposes. Bid price is used when no asked price is available. Registered investment companies that are not traded on an exchange are valued at their net asset value. All of the preceding securities are generally categorized within Level 1 of the fair value hierarchy.
Securities not listed on an exchange or the national securities market, or securities for which there were no transactions, are valued at the average of the most recent bid and asked prices. These securities are generally categorized within Level 2 of the fair value hierarchy.
Fair valuing of securities may be determined with the assistance of a pricing service using calculations based on indices of domestic securities and other appropriate indicators, such as prices of relevant American Depository Receipts and futures. Utilizing these techniques may result in transfers between Level 1 and Level 2 of the fair value hierarchy.
When market quotations or official closing prices are not readily available, or are determined not to accurately reflect fair value, such as when the value of a security has been significantly affected by events after the close of the exchange or market on which the security is principally traded (for example, a foreign exchange or market), but before the fund calculates its net asset value, the fund may value these investments at fair value as determined in accordance with the procedures approved by the Company’s Board of Directors (the “Board”). Certain factors may be considered when fair valuing investments such as: fundamental analytical data, the nature and duration of restrictions on disposition, an evaluation of the forces that influence the market in which the securities are purchased and sold, and public trading in similar securities of the issuer or comparable issuers. These securities are either categorized within Level 2 or 3 of the fair value hierarchy depending on the relevant inputs used.
For restricted securities where observable inputs are limited, assumptions about market activity and risk are used and such securities are generally categorized within Level 3 of the fair value hierarchy.
21
NOTES TO FINANCIAL STATEMENTS (continued)
The following is a summary of the inputs used as of August 31, 2018 in valuing the fund’s investments:
Level 1 – Unadjusted | Level 2 - Other Significant Observable | Level 3 - | Total | |
Equity Securities - | 347,869,156 | - | - | 347,869,156 |
Registered Investment Companies | 12,728,842 | - | - | 12,728,842 |
† See Statement of Investments for additional detailed categorizations.
At August 31, 2017, $8,285,835 of exchange traded foreign equity securities were classified within Level 2 of the fair value hierarchy pursuant to the fund’s fair valuation procedures. It is the fund’s policy to recognize transfers between levels at the end of the reporting period.
(b) Securities transactions and investment income: Securities transactions are recorded on a trade date basis. Realized gains and losses from securities transactions are recorded on the identified cost basis. Dividend income is recognized on the ex-dividend date and interest income, including, where applicable, accretion of discount and amortization of premium on investments, is recognized on the accrual basis.
Pursuant to a securities lending agreement with The Bank of New York Mellon, a subsidiary of BNY Mellon and an affiliate of Dreyfus, the fund may lend securities to qualified institutions. It is the fund’s policy that, at origination, all loans are secured by collateral of at least 102% of the value of U.S. securities loaned and 105% of the value of foreign securities loaned. Collateral equivalent to at least 100% of the market value of securities on loan is maintained at all times. Collateral is either in the form of cash, which can be invested in certain money market mutual funds managed by Dreyfus, or U.S. Government and Agency securities. The fund is entitled to receive all dividends, interest and distributions on securities loaned, in addition to income earned as a result of the lending transaction. Should a borrower fail to return the securities in a timely manner, The Bank of New York Mellon is required to replace the securities for the benefit of the fund or credit the fund with the market value of the unreturned securities and is subrogated to the fund’s rights against the borrower and the collateral. Additionally, the contractual maturity of security lending transactions are on an overnight and continuous basis. During the period ended August 31, 2018, The Bank of New York Mellon
22
earned $19,414 from lending portfolio securities, pursuant to the securities lending agreement.
(c) Affiliated issuers: Investments in other investment companies advised by Dreyfus are defined as “affiliated” under the Act.
(d) Dividends and distributions to shareholders: Dividends and distributions are recorded on the ex-dividend date. Dividends from investment income-net and dividends from net realized capital gains, if any, are normally declared and paid annually, but the fund may make distributions on a more frequent basis to comply with the distribution requirements of the Internal Revenue Code of 1986, as amended (the “Code”). To the extent that net realized capital gains can be offset by capital loss carryovers, it is the policy of the fund not to distribute such gains. Income and capital gain distributions are determined in accordance with income tax regulations, which may differ from GAAP.
(e) Federal income taxes: It is the policy of the fund to continue to qualify as a regulated investment company, if such qualification is in the best interests of its shareholders, by complying with the applicable provisions of the Code, and to make distributions of taxable income sufficient to relieve it from substantially all federal income and excise taxes.
As of and during the period ended August 31, 2018, the fund did not have any liabilities for any uncertain tax positions. The fund recognizes interest and penalties, if any, related to uncertain tax positions as income tax expense in the Statement of Operations. During the period ended August 31, 2018, the fund did not incur any interest or penalties.
Each tax year in the four-year period ended August 31, 2018 remains subject to examination by the Internal Revenue Service and state taxing authorities.
At August 31, 2018, the components of accumulated earnings on a tax basis were as follows: undistributed ordinary income $4,457,130, undistributed capital gains $44,671,963, and unrealized appreciation $140,544,796.
The tax character of distributions paid to shareholders during the fiscal periods ended August 31, 2018 and August 31, 2017 were as follows: ordinary income $4,853,688 and $0, and long-term capital gains $22,863,687 and $22,860,101, respectively.
During the period ended August 31, 2018, as a result of permanent book to tax differences, primarily due to the tax treatment for net operating losses and limited partnerships, the fund increased accumulated undistributed investment income-net by $1,176,572, increased accumulated
23
NOTES TO FINANCIAL STATEMENTS (continued)
net realized gain (loss) on investments by $1,548,467 and decreased paid-in capital by $2,725,039. Net assets and net asset value per share were not affected by this reclassification.
(f) New Accounting Pronouncements: In August 2018, the FASB issued Accounting Standards Update 2018-13, Fair Value Measurement (Topic 820): Disclosure Framework—Changes to the Disclosure Requirements for Fair Value Measurement (“ASU 2018-13”). The update provides guidance that eliminates, adds and modifies certain disclosure requirements for fair value measurements. ASU 2018-13 will be effective for annual periods beginning after December 15, 2019. Management is currently assessing the potential impact of these changes to future financial statements.
NOTE 2—Bank Lines of Credit:
The fund participates with other Dreyfus-managed funds in an $830 million unsecured credit facility led by Citibank, N.A. and a $300 million unsecured credit facility provided by The Bank of New York Mellon (each, a “Facility”), each to be utilized primarily for temporary or emergency purposes, including the financing of redemptions. Prior to October 4, 2017, the unsecured credit facility with Citibank, N.A. was $810 million. In connection therewith, the fund has agreed to pay its pro rata portion of commitment fees for each Facility. Interest is charged to the fund based on rates determined pursuant to the terms of the respective Facility at the time of borrowing.
The average amount of borrowings outstanding under the Facilities during the period ended August 31, 2018 was approximately $38,400 with a related weighted average annualized interest rate of 2.12%.
NOTE 3—Management Fee and Other Transactions with Affiliates:
(a) Pursuant to a management agreement with Dreyfus, the management fee is computed at the annual rate of .75% of the value of the fund’s average daily net assets and is payable monthly.
During the period ended August 31, 2018, the Distributor retained $24,551 from commissions earned on sales of the fund’s Class A shares and $704 from CDSC fees on redemptions of the fund’s Class C shares.
(b) Under the Distribution Plan adopted pursuant to Rule 12b-1 under the Act, Class C shares pay the Distributor for distributing its shares at an annual rate of .75% of the value of its average daily net assets. During the period ended August 31, 2018, Class C shares were charged $125,032 pursuant to the Distribution Plan.
24
(c) Under the Shareholder Services Plan, Class A and Class C shares pay the Distributor at an annual rate of .25% of the value of their average daily net assets for the provision of certain services. The services provided may include personal services relating to shareholder accounts, such as answering shareholder inquiries regarding the fund and providing reports and other information, and services related to the maintenance of shareholder accounts. The Distributor may make payments to Service Agents (securities dealers, financial institutions or other industry professionals) with respect to these services. The Distributor determines the amounts to be paid to Service Agents. During the period ended August 31, 2018, Class A and Class C shares were charged $697,607 and $41,677, respectively, pursuant to the Shareholder Services Plan.
The fund has arrangements with the transfer agent and the custodian whereby the fund may receive earnings credits when positive cash balances are maintained, which are used to offset transfer agency and custody fees. For financial reporting purposes, the fund includes net earnings credits as an expense offset in the Statement of Operations.
The fund compensates Dreyfus Transfer, Inc., a wholly-owned subsidiary of Dreyfus, under a transfer agency agreement for providing transfer agency and cash management services for the fund. The majority of transfer agency fees are comprised of amounts paid on a per account basis, while cash management fees are related to fund subscriptions and redemptions. During the period ended August 31, 2018, the fund was charged $141,093 for transfer agency services. These fees are included in Shareholder servicing costs in the Statement of Operations.
The fund compensates The Bank of New York Mellon under a custody agreement for providing custodial services for the fund. These fees are determined based on net assets, geographic region and transaction activity. During the period ended August 31, 2018, the fund was charged $14,344 pursuant to the custody agreement. These fees were partially offset by earnings credits of $4.
During the period ended August 31, 2018, the fund was charged $13,269 for services performed by the Chief Compliance Officer and his staff. These fees are included in Miscellaneous in the Statement of Operations.
The components of “Due to The Dreyfus Corporation and affiliates” in the Statement of Assets and Liabilities consist of: management fees $220,859, Distribution Plan fees $8,469, Shareholder Services Plan fees $66,539, custodian fees $5,504, Chief Compliance Officer fees $5,693 and transfer agency fees $40,739.
25
NOTES TO FINANCIAL STATEMENTS (continued)
(d) Each Board member also serves as a Board member of other funds within the Dreyfus complex. Annual retainer fees and attendance fees are allocated to each fund based on net assets.
NOTE 4—Securities Transactions:
The aggregate amount of purchases and sales of investment securities, excluding short-term securities, during the period ended August 31, 2018, amounted to $154,491,527 and $179,234,731, respectively.
At August 31, 2018, the cost of investments for federal income tax purposes was $220,053,189; accordingly, accumulated net unrealized appreciation on investments was $140,544,809, consisting of $144,159,923 gross unrealized appreciation and $3,615,114 gross unrealized depreciation.
26
REPORT OF INDEPENDENT REGISTERED PUBLIC ACCOUNTING FIRM
To the Shareholders and the Board of Directors of Dreyfus Technology Growth Fund
Opinion on the Financial Statements
We have audited the accompanying statement of assets and liabilities of Dreyfus Technology Growth Fund (the “Fund”) (one of the funds constituting Advantage Funds, Inc.), including the statements of investments and investments in affiliated issuers, as of August 31, 2018, and the related statement of operations for the year then ended, the statements of changes in net assets for each of the two years in the period then ended, the financial highlights for each of the five years in the period then ended and the related notes (collectively referred to as the “financial statements”). In our opinion, the financial statements present fairly, in all material respects, the financial position of the Fund (one of the funds constituting Advantage Funds, Inc.) at August 31, 2018, the results of its operations for the year then ended, the changes in its net assets for each of the two years in the period then ended and its financial highlights for each of the five years in the period then ended, in conformity with U.S. generally accepted accounting principles.
Basis for Opinion
These financial statements are the responsibility of the Fund’s management. Our responsibility is to express an opinion on the Fund’s financial statements based on our audits. We are a public accounting firm registered with the Public Company Accounting Oversight Board (United States) (“PCAOB”) and are required to be independent with respect to the Fund in accordance with the U.S. federal securities laws and the applicable rules and regulations of the Securities and Exchange Commission and the PCAOB.
We conducted our audits in accordance with the standards of the PCAOB. Those standards require that we plan and perform the audit to obtain reasonable assurance about whether the financial statements are free of material misstatement, whether due to error or fraud. The Fund is not required to have, nor were we engaged to perform, an audit of the Fund’s internal control over financial reporting. As part of our audits, we are required to obtain an understanding of internal control over financial reporting, but not for the purpose of expressing an opinion on the effectiveness of the Fund’s internal control over financial reporting. Accordingly, we express no such opinion.
Our audits included performing procedures to assess the risks of material misstatement of the financial statements, whether due to error or fraud, and performing procedures that respond to those risks. Such procedures included examining, on a test basis, evidence regarding the amounts and disclosures in the financial statements. Our procedures included confirmation of securities owned as of August 31, 2018, by correspondence with the custodian and others or by other appropriate auditing procedures where replies from others were not received. Our audits also included evaluating the accounting principles used and significant estimates made by management, as well as evaluating the overall presentation of the financial statements. We believe that our audits provide a reasonable basis for our opinion.

We have served as the auditor of one or more Dreyfus investment companies since at least 1957, but we are unable to determine the specific year.
New York, New York
October 26, 2018
27
IMPORTANT TAX INFORMATION (Unaudited)
For federal tax purposes, the fund hereby reports 36.99% of the ordinary dividends paid during the fiscal year ended August 31, 2018 as qualifying for the corporate dividends received deduction. Also certain dividends paid by the fund may be subject to a maximum tax rate of 15%, as provided for by the Jobs and Growth Tax Relief Reconciliation Act of 2003. Of the distributions paid during the fiscal year, $1,987,513 represents the maximum amount that may be considered qualified dividend income. The fund also hereby reports $.8500 per share as a short-term capital gain distribution and $4.0040 per share as a long-term capital gain distribution paid on December 12, 2017. Shareholders will receive notification in early 2019 of the percentage applicable to the preparation of their 2018 income tax returns.
28
BOARD MEMBERS INFORMATION (Unaudited)
INDEPENDENT BOARD MEMBERS
Chairman of the Board (1995)
Principal Occupation During Past 5 Years:
· Corporate Director and Trustee (1995-present)
Other Public Company Board Memberships During Past 5 Years:
· CBIZ (formerly, Century Business Services, Inc.), a provider of outsourcing functions for small and medium size companies, Director (1997-present)
No. of Portfolios for which Board Member Serves: 125
———————
Peggy C. Davis (75)
Board Member (2006)
Principal Occupation During Past 5 Years:
· Shad Professor of Law, New York University School of Law (1983-present)
No. of Portfolios for which Board Member Serves: 45
———————
David P. Feldman (78)
Board Member (1996)
Principal Occupation During Past 5 Years:
· Corporate Director and Trustee (1985-present)
Other Public Company Board Memberships During Past 5 Years:
· BBH Mutual Funds Group (5 registered mutual funds), Director (1992-2014)
No. of Portfolios for which Board Member Serves: 31
———————
Joan Gulley (70)
Board Member (2017)
Principal Occupation During Past 5 Years:
· PNC Financial Services Group, Inc.(1993-2014), Executive Vice President and Chief Human Resources Officer and Executive Committee Member (2008-2014)
No. of Portfolios for which Board Member Serves: 52
———————
29
BOARD MEMBERS INFORMATION (Unaudited) (continued)
INDEPENDENT BOARD MEMBERS (continued)
Ehud Houminer (78)
Board Member (1993)
Principal Occupation During Past 5 Years:
· Board of Overseers at the Columbia Business School, Columbia University (1992-present)
· Trustee, Ben Gurion University
No. of Portfolios for which Board Member Serves: 52
———————
Lynn Martin (78)
Board Member (2012)
Principal Occupation During Past 5 Years:
· President of The Martin Hall Group LLC, a human resources consulting firm (2005-2012)
No. of Portfolios for which Board Member Serves: 31
———————
Robin A. Melvin (54)
Board Member (2012)
Principal Occupation During Past 5 Years:
· Co-chairman, Illinois Mentoring Partnership, non-profit organization dedicated to increasing the quantity and quality of mentoring services in Illinois; (2014-present; board member since 2013)
No. of Portfolios for which Board Member Serves: 100
———————
Dr. Martin Peretz (79)
Board Member (2006)
Principal Occupation During Past 5 Years:
· Editor-in-Chief Emeritus of The New Republic Magazine (2011-2012) (previously,
Editor-in-Chief, 1974-2011)
· Lecturer at Harvard University (1968-2010)
No. of Portfolios for which Board Member Serves: 31
———————
Once elected all Board Members serve for an indefinite term, but achieve Emeritus status upon reaching age 80. The address of the Board Members and Officers is c/o The Dreyfus Corporation, 200 Park Avenue, New York, New York 10166. Additional information about the Board Members is available in the fund’s Statement of Additional Information which can be obtained from Dreyfus free of charge by calling this toll free number: 1-800-DREYFUS.
James F. Henry, Emeritus Board Member
Philip L. Toia, Emeritus Board Member
30
OFFICERS OF THE FUND (Unaudited)
BRADLEY J. SKAPYAK, President since January 2010.
Chief Operating Officer and a director of the Manager since June 2009, Chairman of Dreyfus Transfer, Inc., an affiliate of the Manager and the transfer agent of the funds, since May 2011 and Chief Executive Officer of MBSC Securities Corporation since August 2016. He is an officer of 62 investment companies (comprised of 125 portfolios) managed by the Manager. He is 59 years old and has been an employee of the Manager since February 1988.
BENNETT A. MACDOUGALL, Chief Legal Officer since October 2015.
Chief Legal Officer of the Manager and Associate General Counsel and Managing Director of BNY Mellon since June 2015; from June 2005 to June 2015, he served in various capacities with Deutsche Bank – Asset & Wealth Management Division, including as Director and Associate General Counsel, and Chief Legal Officer of Deutsche Investment Management Americas Inc. from June 2012 to May 2015. He is an officer of 63 investment companies (comprised of 150 portfolios) managed by the Manager. He is 46 years old and has been an employee of the Manager since June 2015.
JAMES BITETTO, Vice President since August 2005 and Secretary since February 2018.
Managing Counsel of BNY Mellon and Secretary of the Manager, and an officer of 63 investment companies (comprised of 150 portfolios) managed by the Manager. He is 52 years old and has been an employee of the Manager since December 1996.
JOSEPH M. CHIOFFI, Vice President and Assistant Secretary since August 2005.
Managing Counsel of BNY Mellon, and an officer of 63 investment companies (comprised of 150 portfolios) managed by the Manager. He is 56 years old and has been an employee of the Manager since June 2000.
SONALEE CROSS, Vice President and Assistant Secretary since March 2018.
Counsel of BNY Mellon since October 2016; Associate at Proskauer Rose LLP from April 2016 to September 2016; Attorney at EnTrust Capital from August 2015 to February 2016; Associate at Sidley Austin LLP from September 2013 until August 2015. She is an officer of 63 investment companies (comprised of 150 portfolios) managed by Dreyfus. She is 30 years old and has been an employee of the Manager since October 2016.
MAUREEN E. KANE, Vice President and Assistant Secretary since April 2015.
Managing Counsel of BNY Mellon since July 2014; from October 2004 until July 2014, General Counsel, and from May 2009 until July 2014, Chief Compliance Officer of Century Capital Management. She is an officer of 63 investment companies (comprised of 150 portfolios) managed by the Manager. She is 56 years old and has been an employee of the Manager since July 2014.
SARAH S. KELLEHER, Vice President and Assistant Secretary since April 2014.
Managing Counsel of BNY Mellon. She is an officer of 63 investment companies (comprised of 150 portfolios) managed by the Manager. She is 42 years old and has been an employee of the Manager since March 2013.
JEFF PRUSNOFSKY, Vice President and Assistant Secretary since August 2005.
Senior Managing Counsel of BNY Mellon, and an officer of 63 investment companies (comprised of 150 portfolios) managed by the Manager. He is 53 years old and has been an employee of the Manager since October 1990.
NATALYA ZELENSKY, Vice President and Assistant Secretary since March 2017.
Counsel of BNY Mellon since May 2016; Attorney at Wildermuth Endowment Strategy Fund/Wildermuth Advisory, LLC from November 2015 until May 2016; Assistant General Counsel at RCS Advisory Services from July 2014 until November 2015; Associate at Sutherland, Asbill & Brennan from January 2013 until January 2014. She is an officer of 63 investment companies (comprised of 150 portfolios) managed by Dreyfus. She is 33 years old and has been an employee of the Manager since May 2016.
JAMES WINDELS, Treasurer since November 2001.
Director – Mutual Fund Accounting of the Manager, and an officer of 63 investment companies (comprised of 150 portfolios) managed by the Manager. He is 59 years old and has been an employee of the Manager since April 1985.
RICHARD CASSARO, Assistant Treasurer since January 2008.
Senior Accounting Manager – Money Market and Municipal Bond Funds of the Manager, and an officer of 63 investment companies (comprised of 150 portfolios) managed by the Manager. He is 59 years old and has been an employee of the Manager since September 1982.
31
OFFICERS OF THE FUND (Unaudited) (continued)
GAVIN C. REILLY, Assistant Treasurer since December 2005.
Tax Manager of the Investment Accounting and Support Department of the Manager, and an officer of 63 investment companies (comprised of 150 portfolios) managed by the Manager. He is 50 years old and has been an employee of the Manager since April 1991.
ROBERT S. ROBOL, Assistant Treasurer since August 2005.
Senior Accounting Manager – Dreyfus Financial Reporting of the Manager, and an officer of 63 investment companies (comprised of 150 portfolios) managed by the Manager. He is 54 years old and has been an employee of the Manager since October 1988.
ROBERT SALVIOLO, Assistant Treasurer since July 2007.
Senior Accounting Manager – Equity Funds of the Manager, and an officer of 63 investment companies (comprised of 150 portfolios) managed by the Manager. He is 51 years old and has been an employee of the Manager since June 1989.
ROBERT SVAGNA, Assistant Treasurer since December 2002.
Senior Accounting Manager – Fixed Income and Equity Funds of the Manager, and an officer of 63 investment companies (comprised of 150 portfolios) managed by the Manager. He is 51 years old and has been an employee of the Manager since November 1990.
JOSEPH W. CONNOLLY, Chief Compliance Officer since October 2004.
Chief Compliance Officer of the Manager, the Dreyfus Family of Funds and BNY Mellon Funds Trust (63 investment companies, comprised of 150 portfolios). He is 61 years old and has served in various capacities with the Manager since 1980, including manager of the firm’s Fund Accounting Department from 1997 through October 2001.
CARIDAD M. CAROSELLA, Anti-Money Laundering Compliance Officer since January 2016.
Anti-Money Laundering Compliance Officer of the Dreyfus Family of Funds and BNY Mellon Funds Trust since January 2016; from May 2015 to December 2015, Interim Anti-Money Laundering Compliance Officer of the Dreyfus Family of Funds and BNY Mellon Funds Trust and the Distributor; from January 2012 to May 2015, AML Surveillance Officer of the Distributor and from 2007 to December 2011, Financial Processing Manager of the Distributor. She is an officer of 57 investment companies (comprised of 144 portfolios) managed by the Manager. She is 50 years old and has been an employee of the Distributor since 1997.
32
NOTES
33
Dreyfus Technology Growth Fund
200 Park Avenue
New York, NY 10166
Manager
The Dreyfus Corporation
200 Park Avenue
New York, NY 10166
Custodian
The Bank of New York Mellon
240 Greenwich Street
New York, NY 10286
Transfer Agent &
Dividend Disbursing Agent
Dreyfus Transfer, Inc.
200 Park Avenue
New York, NY 10166
Distributor
MBSC Securities Corporation
200 Park Avenue
New York, NY 10166
Ticker Symbols: | Class A: DTGRX Class C: DTGCX Class I: DGVRX Class Y: DTEYX |
Telephone Call your financial representative or 1-800-DREYFUS
Mail The Dreyfus Family of Funds, 144 Glenn Curtiss Boulevard, Uniondale, NY 11556-0144
E-mail Send your request to info@dreyfus.com
Internet Information can be viewed online or downloaded at www.dreyfus.com
The fund files its complete schedule of portfolio holdings with the Securities and Exchange Commission (“SEC”) for the first and third quarters of each fiscal year on Form N-Q. The fund’s Forms N-Q are available on the SEC’s website at www.sec.gov and may be reviewed and copied at the SEC’s Public Reference Room in Washington, D.C. (phone 1-800-SEC-0330 for information).
A description of the policies and procedures that the fund uses to determine how to vote proxies relating to portfolio securities and information regarding how the fund voted these proxies for the most recent 12-month period ended June 30 is available at www.dreyfus.com and on the SEC’s website at www.sec.gov and without charge, upon request, by calling 1-800-DREYFUS.
© 2018 MBSC Securities Corporation |
|

Item 2. Code of Ethics.
The Registrant has adopted a code of ethics that applies to the Registrant's principal executive officer, principal financial officer, principal accounting officer or controller, or persons performing similar functions. There have been no amendments to, or waivers in connection with, the Code of Ethics during the period covered by this Report.
Item 3. Audit Committee Financial Expert.
The Registrant's Board has determined that Mr. David P. Feldman, a member of the Audit Committee of the Board, is an audit committee financial expert as defined by the Securities and Exchange Commission (the "SEC"). Mr. Feldman is "independent" as defined by the SEC for purposes of audit committee financial expert determinations.
Item 4. Principal Accountant Fees and Services.
(a) Audit Fees. The aggregate fees billed for each of the last two fiscal years (the "Reporting Periods") for professional services rendered by the Registrant's principal accountant (the "Auditor") for the audit of the Registrant's annual financial statements or services that are normally provided by the Auditor in connection with the statutory and regulatory filings or engagements for the Reporting Periods, were $173,510 in 2017 and $176,110 in 2018.
(b) Audit-Related Fees. The aggregate fees billed in the Reporting Periods for assurance and related services by the Auditor that are reasonably related to the performance of the audit of the Registrant's financial statements and are not reported under paragraph (a) of this Item 4 were $47,555 in 2017 and $34,695 in 2018. These services consisted of one or more of the following: (i) agreed upon procedures related to compliance with Internal Revenue Code section 817(h), (ii) security counts required by Rule 17f-2 under the Investment Company Act of 1940, as amended, (iii) advisory services as to the accounting or disclosure treatment of Registrant transactions or events and (iv) advisory services to the accounting or disclosure treatment of the actual or potential impact to the Registrant of final or proposed rules, standards or interpretations by the Securities and Exchange Commission, the Financial Accounting Standards Boards or other regulatory or standard-setting bodies.
The aggregate fees billed in the Reporting Periods for non-audit assurance and related services by the Auditor to the Registrant's investment adviser (not including any sub-investment adviser whose role is primarily portfolio management and is subcontracted with or overseen by another investment adviser), and any entity controlling, controlled by or under common control with the investment adviser that provides ongoing services to the Registrant ("Service Affiliates"), that were reasonably related to the performance of the annual audit of the Service Affiliate, which required pre-approval by the Audit Committee were $0 in 2017 and $0 in 2018.
(c) Tax Fees. The aggregate fees billed in the Reporting Periods for professional services rendered by the Auditor for tax compliance, tax advice, and tax planning ("Tax Services") were $14,174 in 2017 and $22,629 in 2018. These services consisted of: (i) review or preparation of U.S. federal, state, local and excise tax returns; (ii) U.S. federal, state and local tax planning, advice and assistance regarding statutory, regulatory or administrative developments; (iii) tax advice regarding tax qualification matters and/or treatment of various financial instruments held or proposed to be acquired or held, and (iv) determination of Passive Foreign Investment Companies. The aggregate fees billed in the Reporting Periods for Tax Services by the Auditor to Service Affiliates, which required pre-approval by the Audit Committee were $0 in 2017 and $0 in 2018.
(d) All Other Fees. The aggregate fees billed in the Reporting Periods for products and services provided by the Auditor, other than the services reported in paragraphs (a) through (c) of this Item, were $8,700 in 2017 and $9,006 in 2018. These services consisted of a review of the Registrant's anti-money laundering program.
The aggregate fees billed in the Reporting Periods for Non-Audit Services by the Auditor to Service Affiliates, other than the services reported in paragraphs (b) through (c) of this Item, which required pre-approval by the Audit Committee, were $0 in 2017 and $0 in 2018.
(e)(1) Audit Committee Pre-Approval Policies and Procedures. The Registrant's Audit Committee has established policies and procedures (the "Policy") for pre-approval (within specified fee limits) of the Auditor's engagements for non-audit services to the Registrant and Service Affiliates without specific case-by-case consideration. The pre-approved services in the Policy can include pre-approved audit services, pre-approved audit-related services, pre-approved tax services and pre-approved all other services. Pre-approval considerations include whether the proposed services are compatible with maintaining the Auditor's independence. Pre-approvals pursuant to the Policy are considered annually.
(e)(2) Note. None of the services described in paragraphs (b) through (d) of this Item 4 were approved by the Audit Committee pursuant to paragraph (c)(7)(i)(C) of Rule 2-01 of Regulation S-X.
(f) None of the hours expended on the principal accountant's engagement to audit the registrant's financial statements for the most recent fiscal year were attributed to work performed by persons other than the principal account's full-time, permanent employees.
Non-Audit Fees. The aggregate non-audit fees billed by the Auditor for services rendered to the Registrant, and rendered to Service Affiliates, for the Reporting Periods were $29,586,733 in 2017 and $19,579,325 in 2018.
Auditor Independence. The Registrant's Audit Committee has considered whether the provision of non-audit services that were rendered to Service Affiliates, which were not pre-approved (not requiring pre-approval), is compatible with maintaining the Auditor's independence.
Item 5. Audit Committee of Listed Registrants.
Not applicable.
Item 6. Investments.
(a) Not applicable.
Item 7. Disclosure of Proxy Voting Policies and Procedures for Closed-End Management Investment Companies.
Not applicable.
Item 8. Portfolio Managers of Closed-End Management Investment Companies.
Not applicable.
Item 9. Purchases of Equity Securities by Closed-End Management Investment Companies and Affiliated Purchasers.
Not applicable.
Item 10. Submission of Matters to a Vote of Security Holders.
There have been no material changes to the procedures applicable to Item 10.
Item 11. Controls and Procedures.
(a) The Registrant's principal executive and principal financial officers have concluded, based on their evaluation of the Registrant's disclosure controls and procedures as of a date within 90 days of the filing date of this report, that the Registrant's disclosure controls and procedures are reasonably designed to ensure that information required to be disclosed by the Registrant on Form N-CSR is recorded, processed, summarized and reported within the required time periods and that information required to be disclosed by the Registrant in the reports that it files or submits on Form N-CSR is accumulated and communicated to the Registrant's management, including its principal executive and principal financial officers, as appropriate to allow timely decisions regarding required disclosure.
(b) There were no changes to the Registrant's internal control over financial reporting that occurred during the second fiscal quarter of the period covered by this report that have materially affected, or are reasonably likely to materially affect, the Registrant's internal control over financial reporting.
Item 12. Disclosure of Securities Lending Activities for Closed-End Management Investment Companies.
Not applicable.
Item 13. Exhibits.
(a)(1) Code of ethics referred to in Item 2.
(a)(2) Certifications of principal executive and principal financial officers as required by Rule 30a-2(a) under the Investment Company Act of 1940.
(a)(3) Not applicable.
(b) Certification of principal executive and principal financial officers as required by Rule 30a-2(b) under the Investment Company Act of 1940.
SIGNATURES
Pursuant to the requirements of the Securities Exchange Act of 1934 and the Investment Company Act of 1940, the Registrant has duly caused this Report to be signed on its behalf by the undersigned, thereunto duly authorized.
Advantage Funds, Inc.
By: /s/ Bradley J. Skapyak
Bradley J. Skapyak
President
Date: October 29, 2018
Pursuant to the requirements of the Securities Exchange Act of 1934 and the Investment Company Act of 1940, this Report has been signed below by the following persons on behalf of the Registrant and in the capacities and on the dates indicated.
By: /s/ Bradley J. Skapyak
Bradley J. Skapyak
President
Date: October 29, 2018
By: /s/ James Windels
James Windels
Treasurer
Date: October 29, 2018
EXHIBIT INDEX
(a)(1) Code of ethics referred to in Item 2.
(a)(2) Certifications of principal executive and principal financial officers as required by Rule 30a-2(a) under the Investment Company Act of 1940. (EX-99.CERT)
(b) Certification of principal executive and principal financial officers as required by Rule 30a-2(b) under the Investment Company Act of 1940. (EX-99.906CERT)