We are pleased to present this annual report for Dreyfus Global Real Return Fund, covering the 12-month period from November 1, 2015 through October 31, 2016. For information about how the fund performed during the reporting period, as well as general market perspectives, we provide a Discussion of Fund Performance on the pages that follow.
Stocks and bonds generally advanced over the reporting period in the midst of heightened market volatility stemming from various global economic developments. Toward the end of 2015, investor sentiment deteriorated amid sluggish global economic growth, falling commodity prices, and the first increase in short-term U.S. interest rates in nearly a decade. These worries sparked sharp stock market declines in January 2016, but equities began to rally in February when U.S. monetary policymakers refrained from additional rate hikes, other central banks eased their monetary policies further, and commodity prices began to rebound. Stocks generally continued to climb through the summer, driving several broad measures of U.S. stock market performance to record highs in July and August before moderating as a result of uncertainty regarding U.S. elections and potential rate hikes. In the bond market, yields of high-quality sovereign bonds generally moved lower and their prices increased in response to robust investor demand for current income in a low interest rate environment.
The outcome of the U.S. presidential election and ongoing global economic headwinds suggest that uncertainty will persist in the financial markets over the foreseeable future. Some asset classes and industry groups may benefit from a changing economic and political landscape, while others probably will face challenges. Consequently, selectivity could become a more important determinant of investment success. As always, we encourage you to discuss the implications of our observations with your financial advisor.
Thank you for your continued confidence and support.
DISCUSSION OF FUND PERFORMANCE
For the period from November 1, 2015 through October 31, 2016, as provided by Suzanne Hutchins (Lead) and Aron Pataki, Portfolio Managers of Newton Investment Management (North America) Limited, Sub-Investment Adviser
Market and Fund Performance Overview
For the 12-month period ended October 31, 2016, Dreyfus Global Real Return Fund’s Class A shares produced a total return of 4.87%, Class C shares returned 4.12%, Class I shares returned 5.16%, and Class Y shares returned 5.18%.1 In comparison, the fund’s benchmark, the Citi 1-Month Treasury Bill Index, and the fund’s performance baseline benchmark, the U.S.$ 1-Month London Interbank Offered Rate (LIBOR) Index, produced total returns of 0.18% and 0.43%, respectively, for the same period.2,3
Bonds gained value as interest rates declined, and stocks generally advanced when investor sentiment improved during the spring and summer of 2016. The fund delivered higher returns than its benchmark during the period.
The Fund’s Investment Approach
The fund seeks total return (consisting of capital appreciation and income). To pursue its goal, the fund uses an actively managed multi-asset strategy to produce positive absolute or real returns exhibiting less volatility than major equity markets over a complete market cycle, typically a period of five years. The fund is not managed relative to an index, but rather seeks to provide returns that are largely independent of market moves.
The fund invests in a core of return-seeking assets, including global equities, convertible bonds, and global high yield corporate bonds to meet its total return objective. To complement this core and to provide capital protection as well as to reduce volatility, the fund is invested in other asset types where we find value, including commodity-related investments, currencies, select government bonds, and index-linked securities and derivatives. The fund must invest at least 10% of the value of its total assets in equity securities and at least 10% of the value of its total assets in fixed income securities.
To allocate the fund’s assets, we combine a top-down approach emphasizing economic trends and current investment themes on a global basis, with bottom-up security selection based on fundamental research. In choosing investments, we consider economic trends as emphasized by our global investment themes, security valuation, and company fundamentals. Within markets and sectors, we seek attractively priced companies possessing sustainable competitive advantages, and we may invest in such companies anywhere across their capital structure and where we find the best risk/reward tradeoff. Identifying the right security characteristics for the prevailing investment environment is key to our approach, which currently emphasizes income generation.
Financial Markets Advanced Despite Headwinds
Global equity investors grew increasingly averse to risks over the final months of 2015 amid sluggish growth in Europe, Japan, and China, and stocks and corporate bonds suffered particularly severe declines in January 2016 due to plunging commodity prices and worries about higher short-term U.S. interest rates. The markets reversed course in mid-February after reports of better-than-expected economic data and corporate earnings. The rally continued through the spring when U.S. monetary policymakers refrained from additional rate hikes, other major central banks eased their monetary policies further, commodity prices rebounded, and foreign currencies strengthened against the U.S. dollar. Although a referendum in the United Kingdom to leave the European Union introduced renewed market turmoil in late June, riskier assets bounced back quickly over the summer.
Among traditional safe havens, robust investor demand sent yields of high-quality sovereign bonds lower and gold prices higher. Indeed, international investors seeking higher levels of current income than were available in international markets drove yields of U.S. Treasury securities to historical lows in July.
3
DISCUSSION OF FUND PERFORMANCE (continued)
Bonds, Gold, and Currencies Supported Results
In the fund’s return-seeking core, equities weighed on relative results over the reporting period due to our emphasis on more defensive market sectors. The equity portfolio was also hurt by a strengthening U.S. dollar. In contrast, a modest exposure to corporate bonds, where the fund maintains a handful of opportunistic holdings, provided a positive contribution to relative performance.
In the offsetting layer, government bonds and gold contributed positively. Returns from cash and currency positions also proved constructive, as our currency hedges gained value when the U.S. dollar appreciated. On the other hand, direct equity index protection detracted from relative performance over the reporting period.
A More Cautious Investment Posture
In light of ongoing global economic headwinds and recently elevated political uncertainties, we believe that market volatility is likely to increase. Therefore, we have maintained the fund’s relatively cautious positioning, with an emphasis on capital preservation over the pursuit of short-term gains. We have attempted to reduce risks in the fund’s return-seeking core through additional equity index protection and by eliminating exposure to convertible bonds. We also increased indirect protection by reallocating assets from cash to U.S. Treasury bonds, and we raised the fund’s exposure to gold. In our view, these strategies position the fund to provide a positive absolute return with an acceptable level of volatility.
November 15, 2016
Equities are subject generally to market, market sector, market liquidity, issuer, and investment style risks, among other factors, to varying degrees, all of which are more fully described in the fund’s prospectus.
Bonds are subject generally to interest-rate, credit, liquidity, and market risks, to varying degrees, all of which are more fully described in the fund’s prospectus. Generally, all other factors being equal, bond prices are inversely related to interest-rate changes, and rate increases can cause price declines.
The fund’s performance will be influenced by political, social, and economic factors affecting investments in foreign companies. Special risks associated with such companies include exposure to currency fluctuations, less liquidity, less developed or less efficient trading markets, lack of comprehensive company information, political instability, and differing auditing and legal standards.
Because the fund seeks to provide exposure to alternative or non-traditional (i.e., satellite) asset categories or investment strategies, the fund’s performance will be linked to the performance of these highly volatile asset categories and strategies. Accordingly, investors should consider purchasing shares of the fund only as part of an overall diversified portfolio and should be willing to assume the risks of potentially significant fluctuations in the value of fund shares.
The fund may, but is not required to, use derivative instruments, such as options, futures, options on futures, forward contracts, and other credit derivatives. A small investment in derivatives could have a potentially large impact on the fund’s performance. The use of derivatives involves risks different from, or possibly greater than, the risks associated with investing directly in the underlying assets.
1 Total return includes reinvestment of dividends and any capital gains paid, and does not take into consideration the maximum initial sales charge in the case of Class A shares, or the applicable contingent deferred sales charge imposed on redemptions in the case of Class C shares. Share price and investment return fluctuate such that upon redemption, fund shares may be worth more or less than their original cost. Return figures provided reflect the absorption of certain fund expenses by The Dreyfus Corporation pursuant to an agreement in effect through March 1, 2017, at which time it may be extended, modified, or terminated. Had these expenses not been absorbed, the fund’s returns would have been lower. Past performance is no guarantee of future results.
2 Source: Bloomberg — The London Interbank Offered Rate (LIBOR). The rate of interest at which banks borrow funds, in marketable size, from other banks in the London interbank market. LIBOR is the most widely used benchmark or reference rate for short-term interest rates, and is an international rate. The London Interbank Offered Rate is fixed each morning at 11 a.m. London time by the British Bankers’ Association (BBA). The rate is an average derived from 16 quotations provided by banks determined by the BBA; the four highest and lowest are then eliminated, and an average of the remaining eight is calculated to arrive at the fix. Eurodollar Libor is calculated on an ACT/360-day count basis, and settlement is for two days hence.
3 Source: Lipper, Inc. — Reflects reinvestment of dividends and, where applicable, capital gain distributions. The Citi 1-Month Treasury Bill Index is a market value-weighted index of public obligations of the U.S. Treasury with maturities of 30 days. Investors cannot invest directly in any index.
4
FUND PERFORMANCE
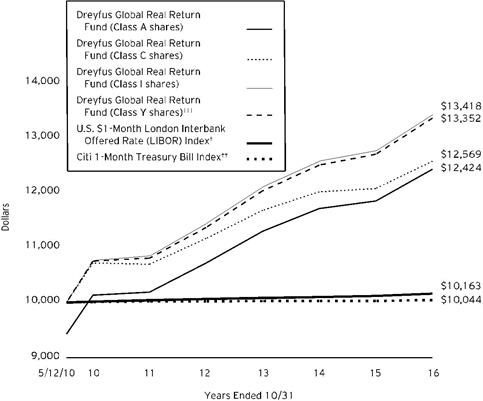
Comparison of change in value of $10,000 investment in Dreyfus Global Real Return Fund Class A shares, Class C shares, Class I shares, and Class Y shares with the U.S. $1-Month London Interbank Offered Rate (LIBOR) Index and the Citi 1-Month Treasury Bill Index
† Source: Bloomberg L.P.
†† Source: Lipper Inc.
††† The total return figures presented for Class Y shares of the fund reflect the performance of the fund’s Class A shares for the period prior to 7/1/13 (the inception date for Class Y shares), not reflecting the applicable sales charges for Class A shares.
Past performance is not predictive of future performance.
The above graph compares a $10,000 investment made in each of the Class A, Class C, Class I and Class Y shares of Dreyfus Global Real Return Fund on 5/12/10 (inception date) to a $10,000 investment made in the Citi 1-Month Treasury Bill Index and the U.S.$ 1-Month London Interbank Offered Rate (LIBOR) Index on that date. All dividends and capital gain distributions are reinvested.
The fund’s performance shown in the line graph above takes into account the maximum initial sales charge on Class A shares and all other applicable fees and expenses on all classes. The Citi 1-Month Treasury Bill Index is a market value-weighted index of public obligations of the U.S. Treasury with maturities of 30 days. LIBOR is the rate of interest at which banks borrow funds, in marketable size, from other banks in the London interbank market. LIBOR is the most widely used benchmark or reference rate for short term interest rates, and is an international rate. LIBOR is fixed each morning at 11 a.m. London time by the British Bankers’ Association (BBA). The rate is an average derived from 16 quotations provided by banks determined by the British Bankers’ Association; the four highest and lowest are then eliminated and an average of the remaining eight is calculated to arrive at the fix. Eurodollar LIBOR is calculated on an ACT/360 day count basis and settlement is for two days hence. Unlike a mutual fund, the indices are not subject to charges, fees and other expenses. Investors cannot invest directly in any index. Further information relating to fund performance, including expense reimbursements, if applicable, is contained in the Financial Highlights section of the prospectus and elsewhere in this report.
Further information relating to fund performance, including expense reimbursements, if applicable, is contained in the Financial Highlights section of the prospectus and elsewhere in this report.
5
FUND PERFORMANCE (continued)
| | | | | |
Average Annual Total Returns as of 10/31/16 |
| Inception
Date | 1 Year | 5 Years | From
Inception |
Class A shares | | | | |
with maximum sales charge (5.75%) | 5/12/10 | -1.15% | 2.83% | 3.41% |
without sales charge | 5/12/10 | 4.87% | 4.05% | 4.36% |
Class C shares | | | | |
with applicable redemption charge† | 5/12/10 | 3.12% | 3.28% | 3.60% |
without redemption | 5/12/10 | 4.12% | 3.28% | 3.60% |
Class I shares | 5/12/10 | 5.16% | 4.34% | 4.65% |
Class Y shares | 7/1/13 | 5.18% | 4.32%†† | 4.57%†† |
U.S.$ 1-Month London Interbank
Offered Rate (LIBOR) Index | 4/30/10 | 0.43% | 0.25% | 0.25%††† |
Citi 1-Month Treasury Bill Index | 4/30/10 | 0.18% | 0.06% | 0.07%††† |
Past performance is not predictive of future performance. The fund’s performance shown in the graph and table does not reflect the deduction of taxes that a shareholder would pay on fund distributions or the redemption of fund shares. In addition to the performance of Class A shares shown with and without a maximum sales charge, the fund’s performance shown in the table takes into account all other applicable fees and expenses on all classes.
† The maximum contingent deferred sales charge for Class C shares is 1% for shares redeemed within one year of the date of purchase.
†† The total return performance figures presented for Class Y shares of the fund reflect the performance of the fund’s Class A shares for the period prior to 7/1/13 (the inception date for Class Y shares), not reflecting the applicable sales charges for Class A shares.
††† For comparative purposes, the value of each Index as of 4/30/10 is used as the beginning value on 5/12/10.
6
UNDERSTANDING YOUR FUND’S EXPENSES (Unaudited)
As a mutual fund investor, you pay ongoing expenses, such as management fees and other expenses. Using the information below, you can estimate how these expenses affect your investment and compare them with the expenses of other funds. You also may pay one-time transaction expenses, including sales charges (loads) and redemption fees, which are not shown in this section and would have resulted in higher total expenses. For more information, see your fund’s prospectus or talk to your financial adviser.
Review your fund’s expenses
The table below shows the expenses you would have paid on a $1,000 investment in Dreyfus Global Real Return Fund from May 1, 2016 to October 31, 2016. It also shows how much a $1,000 investment would be worth at the close of the period, assuming actual returns and expenses.
| | | | | | | | | |
Expenses and Value of a $1,000 Investment |
assuming actual returns for the six months ended October 31, 2016 |
| | | | | |
| | Class A | Class C | Class I | Class Y |
Expenses paid per $1,000† | | $5.84 | | $9.63 | | $4.52 | | $4.11 |
Ending value (after expenses) | | $1,018.70 | | $1,015.60 | | $1,020.00 | | $1,020.70 |
COMPARING YOUR FUND’S EXPENSES
WITH THOSE OF OTHER FUNDS (Unaudited)
Using the SEC’s method to compare expenses
The Securities and Exchange Commission (SEC) has established guidelines to help investors assess fund expenses. Per these guidelines, the table below shows your fund’s expenses based on a $1,000 investment, assuming a hypothetical 5% annualized return. You can use this information to compare the ongoing expenses (but not transaction expenses or total cost) of investing in the fund with those of other funds. All mutual fund shareholder reports will provide this information to help you make this comparison. Please note that you cannot use this information to estimate your actual ending account balance and expenses paid during the period.
| | | | | | | | | |
Expenses and Value of a $1,000 Investment |
assuming a hypothetical 5% annualized return for the six months ended October 31, 2016 |
| | | | | |
| | Class A | Class C | Class I | Class Y |
Expenses paid per $1,000† | | $5.84 | | $9.63 | | $4.52 | | $4.12 |
Ending value (after expenses) | | $1,019.36 | | $1,015.58 | | $1,020.66 | | $1,021.06 |
† Expenses are equal to the fund’s annualized expense ratio of 1.15% for Class A, 1.90% for Class C, .89% for Class I and .81% for Class Y, multiplied by the average account value over the period, multiplied by 184/366 (to reflect the one-half year period).
7
STATEMENT OF INVESTMENTS
October 31, 2016
| | | | | | | | | | | |
| |
Bonds and Notes - 34.0% | | | | | | Principal
Amount ($) | a | Value ($) | |
Australia - 5.5% | | | | | |
Australian Government, Sr. Unscd. Bonds, Ser. 144, 3.75%, 4/21/37 | | | | AUD | | 6,404,000 | | 5,484,204 | |
Australian Government, Sr. Unscd. Bonds, Ser. 147, 3.25%, 6/21/39 | | | | AUD | | 33,131,000 | | 26,131,623 | |
Australian Government, Sr. Unscd. Bonds, Ser. 150, 3.00%, 3/21/47 | | | | AUD | | 22,738,000 | | 16,415,387 | |
New South Wales Treasury, Govt. Gtd. Notes, Ser. CIB1, 2.75%, 11/20/25 | | | | AUD | | 6,226,300 | b | 6,955,673 | |
Treasury Corp. of Victoria, Govt. Gtd. Notes, 5.50%, 11/17/26 | | | | AUD | | 24,250,000 | | 23,335,123 | |
| | 78,322,010 | |
France - .3% | | | | | |
SFR Group, Sr. Scd. Bonds, 5.63%, 5/15/24 | | | | EUR | | 3,218,000 | | 3,715,828 | |
Germany - .2% | | | | | |
SIG Combibloc Holdings, Sr. Scd. Notes, 7.75%, 2/15/23 | | | | EUR | | 2,584,000 | | 3,008,568 | |
New Zealand - 2.5% | | | | | |
New Zealand Government, Sr. Unscd. Bonds, Ser. 0427, 4.50%, 4/15/27 | | | | NZD | | 15,491,000 | | 12,877,045 | |
New Zealand Government, Sr. Unscd. Bonds, Ser. 0437, 2.75%, 4/15/37 | | | | NZD | | 11,722,000 | | 7,706,464 | |
New Zealand Government, Sr. Unscd. Bonds, Ser. 0521, 6.00%, 5/15/21 | | | | NZD | | 14,366,000 | | 11,956,774 | |
New Zealand Government, Sr. Unscd. Bonds, Ser. 0925, 2.00%, 9/20/25 | | | | NZD | | 4,185,000 | c | 3,220,308 | |
| | 35,760,591 | |
United Kingdom - 1.4% | | | | | |
Anglian Water Services Financing, Sr. Scd. Notes, Ser. A8, 3.67%, 7/30/24 | | | | GBP | | 151,000 | d | 373,194 | |
Arqiva Broadcast Finance, Sr. Scd. Notes, 9.50%, 3/31/20 | | | | GBP | | 3,545,000 | | 4,698,159 | |
British Telecommunications, Sr. Unscd. Notes, 3.50%, 4/25/25 | | | | GBP | | 287,000 | d | 748,112 | |
Centrica, Jr. Sub. Bonds, 5.25%, 4/10/75 | | | | GBP | | 982,000 | e | 1,244,302 | |
Centrica, Jr. Sub. Bonds, 3.00%, 4/10/76 | | | | EUR | | 1,353,000 | e | 1,459,271 | |
CPUK Finance, Scd. Notes, 7.00%, 2/28/42 | | | | GBP | | 212,000 | | 275,498 | |
Dwr Cymru Financing, Asset Backed Notes, 1.86%, 3/31/48 | | | | GBP | | 150,000 | d | 389,686 | |
High Speed Rail Finance 1, Sr. Scd. Notes, 1.57%, 11/1/38 | | | | GBP | | 268,000 | d | 516,926 | |
National Grid Electricity Transmission, Insured Bonds, 2.98%, 7/8/18 | | | | GBP | | 667,000 | d | 1,318,349 | |
Network Rail Infrastructure Finance, Govt. Gtd. Notes, Ser. RPI, 1.75%, 11/22/27 | | | | GBP | | 865,000 | d | 1,924,622 | |
Scotland Gas Networks, Insured Notes, Ser. A2S, 2.13%, 10/21/22 | | | | GBP | | 300,000 | d | 603,367 | |
TESCO, Sr. Unscd. Notes, 6.13%, 2/24/22 | | | | GBP | | 672,000 | | 929,913 | |
TESCO, Sr. Unscd. Notes, 3.32%, 11/5/25 | | | | GBP | | 245,000 | d | 527,628 | |
Tesco Property Finance 3, Mortgage Backed Bonds, 5.74%, 4/13/40 | | | | GBP | | 3,393,788 | | 4,124,657 | |
| | 19,133,684 | |
8
| | | | | | | | | | | |
| |
Bonds and Notes - 34.0% (continued) | | | | | | Principal
Amount ($) | a | Value ($) | |
United States - 24.1% | | | | | |
Sprint, Gtd. Notes, 7.88%, 9/15/23 | | | | | | 5,758,000 | | 5,700,420 | |
Sprint, Gtd. Notes, 7.13%, 6/15/24 | | | | | | 3,548,000 | | 3,388,340 | |
Sprint Capital, Gtd. Notes, 8.75%, 3/15/32 | | | | | | 6,347,000 | | 6,519,562 | |
Sprint Communications, Sr. Unscd. Debs., 9.25%, 4/15/22 | | | | | | 404,000 | | 450,460 | |
Sprint Communications, Sr. Unscd. Notes, 6.00%, 12/1/16 | | | | | | 4,066,000 | | 4,076,165 | |
Sprint Spectrum, Sr. Scd. Notes, 3.36%, 3/20/23 | | | | | | 472,000 | f | 475,540 | |
U.S. Treasury Bonds, 3.00%, 5/15/45 | | | | | | 64,040,000 | | 69,626,017 | |
U.S. Treasury Bonds, 3.00%, 11/15/45 | | | | | | 45,929,400 | | 49,937,475 | |
U.S. Treasury Notes, 1.00%, 12/31/17 | | | | | | 17,219,100 | | 17,272,910 | |
U.S. Treasury Notes, 1.50%, 8/31/18 | | | | | | 50,549,700 | | 51,146,035 | |
U.S. Treasury Notes, 0.88%, 4/15/19 | | | | | | 16,784,000 | | 16,759,411 | |
U.S. Treasury Notes, 1.75%, 12/31/20 | | | | | | 66,993,300 | | 68,385,488 | |
U.S. Treasury Notes, 2.00%, 2/15/25 | | | | | | 41,398,400 | | 42,219,082 | |
Western Digital, Gtd. Notes, 10.50%, 4/1/24 | | | | | | 3,339,000 | f | 3,869,066 | |
| | 339,825,971 | |
Total Bonds and Notes
(cost $478,584,692) | | 479,766,652 | |
Common Stocks - 53.5% | | | | | | Shares | | Value ($) | |
Australia - 1.6% | | | | | |
Dexus Property Group | | | | | | 1,456,156 | | 9,902,809 | |
Newcrest Mining | | | | | | 729,322 | | 12,516,168 | |
| | 22,418,977 | |
Canada - 5.1% | | | | | |
Agnico Eagle Mines | | | | | | 79,174 | | 4,020,974 | |
Alacer Gold | | | | | | 1,444,980 | g | 2,919,478 | |
Alamos Gold | | | | | | 425,250 | | 3,335,294 | |
Barrick Gold | | | | | | 642,479 | | 11,301,206 | |
Centerra Gold | | | | | | 606,097 | | 3,063,698 | |
Detour Gold | | | | | | 244,297 | g | 4,657,179 | |
Eldorado Gold | | | | | | 1,085,218 | g | 3,422,405 | |
IAMGOLD | | | | | | 1,556,672 | g | 6,232,259 | |
Kinross Gold | | | | | | 1,075,501 | g | 4,177,559 | |
New Gold | | | | | | 1,485,682 | g | 5,859,433 | |
OceanaGold | | | | | | 1,190,142 | | 3,637,950 | |
Primero Mining | | | | | | 1,340,835 | g | 1,809,373 | |
Silver Wheaton | | | | | | 738,466 | | 17,794,096 | |
| | 72,230,904 | |
Denmark - .1% | | | | | |
DONG Energy | | | | | | 41,087 | f | 1,629,339 | |
France - 1.8% | | | | | |
Vivendi | | | | | | 1,272,344 | | 25,727,621 | |
Germany - 3.1% | | | | | |
Bayer | | | | | | 135,025 | | 13,383,179 | |
Brenntag | | | | | | 73,302 | | 3,918,372 | |
Infineon Technologies | | | | | | 317,294 | | 5,696,628 | |
LEG Immobilien | | | | | | 36,093 | g | 3,044,499 | |
SAP | | | | | | 75,233 | | 6,626,814 | |
Telefonica Deutschland Holding | | | | | | 2,807,407 | | 10,881,996 | |
| | 43,551,488 | |
9
STATEMENT OF INVESTMENTS (continued)
| | | | | | | | | | | |
| |
Common Stocks - 53.5% (continued) | | | | | | Shares | | Value ($) | |
Ireland - .6% | | | | | |
CRH | | | | | | 273,105 | | 8,838,414 | |
Israel - 1.2% | | | | | |
Teva Pharmaceutical Industries, ADR | | | | | | 405,529 | | 17,332,309 | |
Japan - 3.2% | | | | | |
Japan Tobacco | | | | | | 779,100 | | 29,672,217 | |
Skylark | | | | | | 520,600 | | 7,332,185 | |
Suntory Beverage & Food | | | | | | 83,800 | | 3,671,794 | |
Topcon | | | | | | 271,700 | | 4,070,189 | |
| | 44,746,385 | |
Mexico - .3% | | | | | |
Fresnillo | | | | | | 210,020 | | 4,215,875 | |
Netherlands - 3.4% | | | | | |
RELX | | | | | | 1,029,898 | | 17,382,603 | |
Wolters Kluwer | | | | | | 781,983 | | 30,263,802 | |
| | 47,646,405 | |
New Zealand - .5% | | | | | |
Spark New Zealand | | | | | | 2,990,959 | | 7,828,112 | |
South Africa - .3% | | | | | |
Gold Fields | | | | | | 896,998 | | 3,646,201 | |
South Korea - .5% | | | | | |
Samsung SDI | | | | | | 78,960 | | 6,507,256 | |
Switzerland - 3.8% | | | | | |
Adecco Group | | | | | | 41,270 | | 2,454,388 | |
Novartis | | | | | | 422,101 | | 30,029,721 | |
Roche Holding | | | | | | 90,503 | | 20,806,864 | |
| | 53,290,973 | |
United Kingdom - 10.0% | | | | | |
BAE Systems | | | | | | 941,594 | | 6,252,399 | |
British American Tobacco | | | | | | 112,583 | | 6,464,989 | |
Centrica | | | | | | 7,831,864 | | 20,533,731 | |
Cobham | | | | | | 4,693,300 | | 8,209,067 | |
Diageo | | | | | | 261,563 | | 6,977,767 | |
Dixons Carphone | | | | | | 1,519,949 | | 5,854,759 | |
GlaxoSmithKline | | | | | | 1,001,276 | | 19,835,802 | |
National Grid | | | | | | 1,476,886 | | 19,252,177 | |
Randgold Resources | | | | | | 37,803 | | 3,350,025 | |
United Utilities Group | | | | | | 1,683,459 | | 19,369,288 | |
Vodafone Group | | | | | | 5,109,528 | | 14,059,192 | |
Wolseley | | | | | | 216,637 | | 11,272,156 | |
| | 141,431,352 | |
United States - 18.0% | | | | | |
Abbott Laboratories | | | | | | 370,573 | | 14,541,285 | |
Accenture, Cl. A | | | | | | 217,283 | | 25,256,976 | |
CA | | | | | | 480,892 | | 14,782,620 | |
CMS Energy | | | | | | 798,842 | | 33,671,190 | |
Cognizant Technology Solutions, Cl. A | | | | | | 83,747 | g | 4,300,408 | |
Dollar General | | | | | | 86,227 | | 5,957,424 | |
Dun & Bradstreet | | | | | | 40,909 | | 5,107,489 | |
Eversource Energy | | | | | | 676,843 | | 37,266,976 | |
Maxim Integrated Products | | | | | | 84,756 | | 3,358,880 | |
Merck & Co. | | | | | | 148,806 | | 8,737,888 | |
Microsoft | | | | | | 576,286 | | 34,531,057 | |
10
| | | | | | | | | | | |
| |
Common Stocks - 53.5% (continued) | | | | | | Shares | | Value ($) | |
United States - 18.0% (continued) | | | | | |
PowerShares DB Gold Fund | | | | | | 543,408 | g,h | 22,442,750 | |
Procter & Gamble | | | | | | 124,028 | | 10,765,630 | |
Reynolds American | | | | | | 291,358 | | 16,047,999 | |
Sysco | | | | | | 145,661 | | 7,009,207 | |
Trimble Navigation | | | | | | 106,791 | g | 2,951,703 | |
Walgreens Boots Alliance | | | | | | 85,827 | | 7,100,468 | |
| | 253,829,950 | |
Total Common Stocks
(cost $742,564,563) | | 754,871,561 | |
Short-Term Investments - 4.4% | | | | | | Principal Amount ($) | | Value ($) | |
U.S. Government Securities | | | | | |
U.S. Treasury Bills, 0.33%, 12/8/16
(cost $62,615,618) | | | | | | 62,636,600 | | 62,626,077 | |
Other Investment - 5.5% | | | | | | Shares | | Value ($) | |
Registered Investment Company; | | | | | |
Dreyfus Institutional Preferred Government Plus Money Market Fund
(cost $77,404,811) | | | | | | 77,404,811 | i | 77,404,811 | |
Total Investments (cost $1,361,169,684) | | 97.4% | 1,374,669,101 | |
Cash and Receivables (Net) | | 2.6% | 36,254,584 | |
Net Assets | | 100.0% | 1,410,923,685 | |
ADR—American Depository Receipt
a Principal amount stated in U.S. Dollars unless otherwise noted.
AUD—Australian Dollar
EUR—Euro
GBP—British Pound
NZD—New Zealand Dollar
b Interest accruals are adjusted based on changes in the Australian Consumer Price Index.
c Interest accruals are adjusted based on changes in the New Zealand Consumer Price Index.
d Interest accruals are adjusted based on changes in the British Consumer Price Index.
e Variable rate security—rate shown is the interest rate in effect at period end.
f Security exempt from registration pursuant to Rule 144A under the Securities Act of 1933. These securities may be resold in transactions exempt from registration, normally to qualified institutional buyers. At October 31, 2016, these securities were valued at $5,973,945 or .42% of net assets.
g Non-income producing security.
h Investment in non-controlled affiliate (cost $23,555,235).
i Investment in affiliated money market mutual fund.
11
STATEMENT OF INVESTMENTS (continued)
| | |
Portfolio Summary (Unaudited) † | Value (%) |
U.S. Government Securities | 22.3 |
Short-Term/Money Market Investments | 9.9 |
Utilities | 9.4 |
Health Care | 8.2 |
Foreign/Governmental | 8.1 |
Basic Materials | 8.0 |
Consumer Services | 7.9 |
Consumer Goods | 5.2 |
Industrials | 5.1 |
Technology | 4.9 |
Corporate Bonds | 3.6 |
Telecommunication | 2.3 |
Exchange-Traded Funds | 1.6 |
Financials | .9 |
| | 97.4 |
† Based on net assets.
See notes to financial statements.
12
STATEMENT OF FINANCIAL FUTURES
October 31, 2016
| | | | | | |
| | Contracts | Market Value Covered by Contracts ($) | Expiration | Unrealized Appreciation (Depreciation) ($) | |
| | | | | | |
Financial Futures Short | | | | | |
FTSE 100 | 393 | (33,330,848) | December 2016 | (593,176) | |
Standard & Poor's 500 | 677 | (358,826,925) | December 2016 | 8,203,034 | |
Gross Unrealized Appreciation | | | | 8,203,034 | |
Gross Unrealized Depreciation | | | | (593,176) | |
See notes to financial statements.
13
STATEMENT OF ASSETS AND LIABILITIES
October 31, 2016
| | | | | | | |
| | | | | | |
| | | Cost | | Value | |
Assets ($): | | | | |
Investments in securities—See Statement of Investments: | | | | |
Unaffiliated issuers | | 1,260,209,638 | | 1,274,821,540 | |
Affiliated issuers | | 100,960,046 | | 99,847,561 | |
Cash | | | | | 2,114,307 | |
Cash denominated in foreign currency | | | 337,463 | | 338,354 | |
Cash collateral held by broker—Note 4 | | | | | 17,155,000 | |
Unrealized appreciation on forward foreign
currency exchange contracts—Note 4 | | | | | 14,547,920 | |
Dividends and interest receivable | | | | | 5,929,932 | |
Receivable for shares of Common Stock subscribed | | | | | 4,906,236 | |
Receivable for investment securities sold | | | | | 1,090,858 | |
Receivable for futures variation margin—Note 4 | | | | | 758,509 | |
Prepaid expenses | | | | | 61,170 | |
| | | | | 1,421,571,387 | |
Liabilities ($): | | | | |
Due to The Dreyfus Corporation and affiliates—Note 3(c) | | | | | 1,034,390 | |
Payable for investment securities purchased | | | | | 5,738,340 | |
Unrealized depreciation on forward foreign
currency exchange contracts—Note 4 | | | | | 2,977,580 | |
Payable for shares of Common Stock redeemed | | | | | 676,325 | |
Accrued expenses | | | | | 221,067 | |
| | | | | 10,647,702 | |
Net Assets ($) | | | 1,410,923,685 | |
Composition of Net Assets ($): | | | | |
Paid-in capital | | | | | 1,409,316,889 | |
Accumulated undistributed investment income—net | | | | | 24,651,403 | |
Accumulated net realized gain (loss) on investments | | | | | (55,698,491) | |
Accumulated net unrealized appreciation (depreciation)
on investments and foreign currency transactions
(including $7,609,858 net unrealized appreciation
on financial futures) | | | | 32,653,884 | |
Net Assets ($) | | | 1,410,923,685 | |
| | | | | | |
Net Asset Value Per Share | Class A | Class C | Class I | Class Y | |
Net Assets ($) | 157,624,145 | 35,860,863 | 509,711,864 | 707,726,813 | |
Shares Outstanding | 10,706,050 | 2,501,381 | 34,476,317 | 47,837,264 | |
Net Asset Value Per Share ($) | 14.72 | 14.34 | 14.78 | 14.79 | |
| | | | | | |
See notes to financial statements. | | | | | |
14
STATEMENT OF OPERATIONS
Year Ended October 31, 2016
| | | | | | | |
| | | | | | |
| | | | | | |
Investment Income ($): | | | | |
Income: | | | | |
Dividends (net of $663,715 foreign taxes withheld at source): | | | | |
Unaffiliated issuers | | | 12,274,821 | |
Affiliated issuers | | | 141,199 | |
Interest | | | 7,247,524 | |
Total Income | | | 19,663,544 | |
Expenses: | | | | |
Management fee—Note 3(a) | | | 6,391,147 | |
Shareholder servicing costs—Note 3(c) | | | 526,328 | |
Registration fees | | | 183,753 | |
Distribution fees—Note 3(b) | | | 177,921 | |
Custodian fees—Note 3(c) | | | 133,404 | |
Professional fees | | | 83,372 | |
Directors’ fees and expenses—Note 3(d) | | | 64,906 | |
Prospectus and shareholders’ reports | | | 36,386 | |
Loan commitment fees—Note 2 | | | 14,958 | |
Interest expense—Note 2 | | | 1,107 | |
Miscellaneous | | | 47,289 | |
Total Expenses | | | 7,660,571 | |
Less—reduction in expenses due to undertaking—Note 3(a) | | | (9,641) | |
Less—reduction in fees due to earnings credits—Note 3(c) | | | (182) | |
Net Expenses | | | 7,650,748 | |
Investment Income—Net | | | 12,012,796 | |
Realized and Unrealized Gain (Loss) on Investments—Note 4 ($): | | |
Net realized gain (loss) on investments and foreign currency transactions | (8,047,061) | |
Net realized gain (loss) on options transactions | (1,087,566) | |
Net realized gain (loss) on financial futures | (25,122,089) | |
Net realized gain (loss) on forward foreign currency exchange contracts | 13,320,467 | |
Capital gain distributions on unaffiliated issuers | 148,033 | |
Net Realized Gain (Loss) | | | (20,788,216) | |
Net unrealized appreciation (depreciation) on investments
and foreign currency transactions: | | | | |
Unaffiliated issuers | | | | 7,721,244 | |
Affiliated issuers | | | | 1,256,788 | |
Net unrealized appreciation (depreciation) on options transactions | | | 122,393 | |
Net unrealized appreciation (depreciation) on financial futures | | | 13,406,904 | |
Net unrealized appreciation (depreciation) on
forward foreign currency exchange contracts | | | 12,875,018 | |
Net Unrealized Appreciation (Depreciation) | | | 35,382,347 | |
Net Realized and Unrealized Gain (Loss) on Investments | | | 14,594,131 | |
Net Increase in Net Assets Resulting from Operations | | 26,606,927 | |
| | | | | | | |
See notes to financial statements. | | | | | |
15
STATEMENT OF CHANGES IN NET ASSETS
| | | | | | | | | | |
| | | | Year Ended October 31, |
| | | | 2016 | | | | 2015 | |
Operations ($): | | | | | | | | |
Investment income—net | | | 12,012,796 | | | | 6,715,992 | |
Net realized gain (loss) on investments | | (20,788,216) | | | | 7,957,599 | |
Net unrealized appreciation (depreciation)
on investments | | 35,382,347 | | | | (10,791,176) | |
Net Increase (Decrease) in Net Assets
Resulting from Operations | 26,606,927 | | | | 3,882,415 | |
Dividends to Shareholders from ($): | | | | | | | | |
Investment income—net: | | | | | | | | |
Class A | | | (1,985,751) | | | | (2,671,161) | |
Class C | | | (565,274) | | | | (519,065) | |
Class I | | | (4,536,404) | | | | (3,560,081) | |
Class Y | | | (17,423,097) | | | | (12,071,963) | |
Total Dividends | | | (24,510,526) | | | | (18,822,270) | |
Capital Stock Transactions ($): | | | | | | | | |
Net proceeds from shares sold: | | | | | | | | |
Class A | | | 135,924,150 | | | | 22,416,838 | |
Class C | | | 22,230,757 | | | | 6,252,076 | |
Class I | | | 468,457,613 | | | | 52,781,238 | |
Class Y | | | 393,078,796 | | | | 210,309,244 | |
Dividends reinvested: | | | | | | | | |
Class A | | | 1,985,751 | | | | 2,671,161 | |
Class C | | | 565,274 | | | | 519,065 | |
Class I | | | 4,412,721 | | | | 3,424,219 | |
Class Y | | | 10,077,228 | | | | 8,084,258 | |
Cost of shares redeemed: | | | | | | | | |
Class A | | | (30,295,189) | | | | (29,553,397) | |
Class C | | | (3,502,241) | | | | (1,749,030) | |
Class I | | | (67,046,742) | | | | (24,372,003) | |
Class Y | | | (104,900,705) | | | | (44,162,813) | |
Increase (Decrease) in Net Assets
from Capital Stock Transactions | 830,987,413 | | | | 206,620,856 | |
Total Increase (Decrease) in Net Assets | 833,083,814 | | | | 191,681,001 | |
Net Assets ($): | | | | | | | | |
Beginning of Period | | | 577,839,871 | | | | 386,158,870 | |
End of Period | | | 1,410,923,685 | | | | 577,839,871 | |
Undistributed investment income—net | 24,651,403 | | | | 24,541,256 | |
16
| | | | | | | | | | |
| | | | Year Ended October 31, |
| | | | 2016 | | | | 2015 | |
Capital Share Transactions (Shares): | | | | | | | | |
Class Aa | | | | | | | | |
Shares sold | | | 9,236,847 | | | | 1,516,866 | |
Shares issued for dividends reinvested | | | 142,245 | | | | 183,207 | |
Shares redeemed | | | (2,072,271) | | | | (2,039,778) | |
Net Increase (Decrease) in Shares Outstanding | 7,306,821 | | | | (339,705) | |
Class C | | | | | | | | |
Shares sold | | | 1,550,131 | | | | 430,720 | |
Shares issued for dividends reinvested | | | 41,321 | | | | 36,247 | |
Shares redeemed | | | (244,973) | | | | (121,038) | |
Net Increase (Decrease) in Shares Outstanding | 1,346,479 | | | | 345,929 | |
Class Ia | | | | | | | | |
Shares sold | | | 31,624,601 | | | | 3,595,479 | |
Shares issued for dividends reinvested | | | 315,645 | | | | 234,215 | |
Shares redeemed | | | (4,550,565) | | | | (1,646,567) | |
Net Increase (Decrease) in Shares Outstanding | 27,389,681 | | | | 2,183,127 | |
Class Ya | | | | | | | | |
Shares sold | | | 26,614,889 | | | | 14,191,557 | |
Shares issued for dividends reinvested | | | 720,317 | | | | 552,959 | |
Shares redeemed | | | (7,250,679) | | | | (3,013,167) | |
Net Increase (Decrease) in Shares Outstanding | 20,084,527 | | | | 11,731,349 | |
| | | | | | | | | | |
aDuring the period ending October 31, 2016, 498 Class A shares representing $7,336 were exchanged for 496 Class I shares and 167,112 Class Y shares representing $2,457,452 were exchanged for 167,167 Class I shares. | |
See notes to financial statements. | | | | | | | | |
17
FINANCIAL HIGHLIGHTS
The following tables describe the performance for each share class for the fiscal periods indicated. All information (except portfolio turnover rate) reflects financial results for a single fund share. Total return shows how much your investment in the fund would have increased (or decreased) during each period, assuming you had reinvested all dividends and distributions. These figures have been derived from the fund’s financial statements.
| | | | | | | |
| | | |
| | | Year Ended October 31, |
Class A Shares | | 2016 | 2015 | 2014 | 2013 | 2012 |
Per Share Data ($): | | | | | | |
Net asset value, beginning of period | | 14.61 | 15.11 | 14.75 | 14.07 | 13.51 |
Investment Operations: | | | | | | |
Investment income—neta | | .17 | .17 | .36 | .21 | .17 |
Net realized and unrealized
gain (loss) on investments | | .51 | .01b | .17 | .54 | .53 |
Total from Investment Operations | | .68 | .18 | .53 | .75 | .70 |
Distributions: | | | | | | |
Dividends from
investment income—net | | (.57) | (.68) | (.04) | (.07) | (.07) |
Dividends from net realized
gain on investments | | - | - | (.13) | - | (.07) |
Total Distributions | | (.57) | (.68) | (.17) | (.07) | (.14) |
Net asset value, end of period | | 14.72 | 14.61 | 15.11 | 14.75 | 14.07 |
Total Return (%)c | | 4.87 | 1.22 | 3.63 | 5.42 | 5.16 |
Ratios/Supplemental Data (%): | | | | | | |
Ratio of total expenses
to average net assets | | 1.16 | 1.15 | 1.20 | 1.49 | 1.72 |
Ratio of net expenses to
average net assets | | 1.15 | 1.15 | 1.15 | 1.47 | 1.50 |
Ratio of net investment income
to average net assets | | 1.15 | 1.16 | 2.38 | 1.48 | 1.26 |
Portfolio Turnover Rate | | 57.17 | 68.92 | 47.01 | 44.96 | 53.24 |
Net Assets, end of period ($ x 1,000) | | 157,624 | 49,672 | 56,501 | 35,478 | 17,088 |
a Based on average shares outstanding.
b In addition to net realized and unrealized losses on investments, this amount includes an increase in net asset value per share resulting from the timing of issuances and redemptions of shares in relation to fluctuating market values for the portfolio investments.
c Exclusive of sales charge.
See notes to financial statements.
18
| | | | | | | |
| | | |
| | | Year Ended October 31, |
Class C Shares | | 2016 | 2015 | 2014 | 2013 | 2012 |
Per Share Data ($): | | | | | | |
Net asset value, beginning of period | | 14.26 | 14.79 | 14.51 | 13.89 | 13.37 |
Investment Operations: | | | | | | |
Investment income—neta | | .06 | .06 | .21 | .08 | .06 |
Net realized and unrealized
gain (loss) on investments | | .50 | .02b | .20 | .55 | .53 |
Total from Investment Operations | | .56 | .08 | .41 | .63 | .59 |
Distributions: | | | | | | |
Dividends from
investment income—net | | (.48) | (.61) | - | (.01) | - |
Dividends from net realized
gain on investments | | - | - | (.13) | - | (.07) |
Total Distributions | | (.48) | (.61) | (.13) | (.01) | (.07) |
Net asset value, end of period | | 14.34 | 14.26 | 14.79 | 14.51 | 13.89 |
Total Return (%)c | | 4.12 | .49 | 2.87 | 4.58 | 4.39 |
Ratios/Supplemental Data (%): | | | | | | |
Ratio of total expenses
to average net assets | | 1.90 | 1.91 | 1.96 | 2.21 | 2.56 |
Ratio of net expenses
to average net assets | | 1.90 | 1.90 | 1.90 | 2.18 | 2.25 |
Ratio of net investment income
to average net assets | | .44 | .39 | 1.41 | .58 | .51 |
Portfolio Turnover Rate | | 57.17 | 68.92 | 47.01 | 44.96 | 53.24 |
Net Assets, end of period ($ x 1,000) | | 35,861 | 16,470 | 11,969 | 5,671 | 944 |
a Based on average shares outstanding.
b In addition to net realized and unrealized losses on investments, this amount includes an increase in net asset value per share resulting from the timing of issuances and redemptions of shares in relation to fluctuating market values for the portfolio investments.
c Exclusive of sales charge.
See notes to financial statements.
19
FINANCIAL HIGHLIGHTS (continued)
| | | | | | | |
| | | |
| | | Year Ended October 31, |
Class I Shares | | 2016 | 2015 | 2014 | 2013 | 2012 |
Per Share Data ($): | | | | | | |
Net asset value, beginning of period | | 14.68 | 15.18 | 14.81 | 14.10 | 13.56 |
Investment Operations: | | | | | | |
Investment income—neta | | .20 | .21 | .38 | .26 | .21 |
Net realized and unrealized
gain (loss) on investments | | .52 | .01b | .19 | .54 | .53 |
Total from Investment Operations | | .72 | .22 | .57 | .80 | .74 |
Distributions: | | | | | | |
Dividends from
investment income—net | | (.62) | (.72) | (.07) | (.09) | (.13) |
Dividends from net realized
gain on investments | | - | - | (.13) | - | (.07) |
Total Distributions | | (.62) | (.72) | (.20) | (.09) | (.20) |
Net asset value, end of period | | 14.78 | 14.68 | 15.18 | 14.81 | 14.10 |
Total Return (%) | | 5.16 | 1.49 | 3.89 | 5.79 | 5.45 |
Ratios/Supplemental Data (%): | | | | | | |
Ratio of total expenses
to average net assets | | .88 | .86 | .90 | 1.11 | 1.35 |
Ratio of net expenses
to average net assets | | .88 | .86 | .90 | 1.11 | 1.25 |
Ratio of net investment income
to average net assets | | 1.36 | 1.40 | 2.51 | 1.84 | 1.55 |
Portfolio Turnover Rate | | 57.17 | 68.92 | 47.01 | 44.96 | 53.24 |
Net Assets, end of period ($ x 1,000) | | 509,712 | 104,057 | 74,438 | 60,482 | 52,410 |
a Based on average shares outstanding.
b In addition to net realized and unrealized losses on investments, this amount includes an increase in net asset value per share resulting from the timing of issuances and redemptions of shares in relation to fluctuating market values for the portfolio investments.
See notes to financial statements.
20
| | | | | | |
| | | |
| | | Year Ended October 31, |
Class Y Shares | | 2016 | 2015 | 2014 | 2013a |
Per Share Data ($): | | | | | |
Net asset value, beginning of period | | 14.69 | 15.18 | 14.81 | 14.16 |
Investment Operations: | | | | | |
Investment income—netb | | .22 | .22 | .26 | .05 |
Net realized and unrealized
gain (loss) on investments | | .51 | .02c | .31 | .60 |
Total from Investment Operations | | .73 | .24 | .57 | .65 |
Distributions: | | | | | |
Dividends from
investment income—net | | (.63) | (.73) | (.07) | - |
Dividends from net realized
gain on investments | | - | - | (.13) | - |
Total Distributions | | (.63) | (.73) | (.20) | - |
Net asset value, end of period | | 14.79 | 14.69 | 15.18 | 14.81 |
Total Return (%) | | 5.18 | 1.57 | 3.89 | 4.59d |
Ratios/Supplemental Data (%): | | | | | |
Ratio of total expenses
to average net assets | | .81 | .83 | .88 | 1.09e |
Ratio of net expenses
to average net assets | | .81 | .83 | .88 | 1.09e |
Ratio of net investment income
to average net assets | | 1.53 | 1.45 | 1.77 | 1.10e |
Portfolio Turnover Rate | | 57.17 | 68.92 | 47.01 | 44.96 |
Net Assets, end of period ($ x 1,000) | | 707,727 | 407,642 | 243,251 | 41,381 |
a From July 1, 2013 (commencement of initial offering) to October 31, 2013.
b Based on average shares outstanding.
c In addition to net realized and unrealized losses on investments, this amount includes an increase in net asset value per share resulting from the timing of issuances and redemptions of shares in relation to fluctuating market values for the portfolio investments.
d Not annualized.
e Annualized.
See notes to financial statements.
21
NOTES TO FINANCIAL STATEMENTS
NOTE 1—Significant Accounting Policies:
Dreyfus Global Real Return Fund (the “fund”) is a separate diversified series of Advantage Funds, Inc. (the “Company”), which is registered under the Investment Company Act of 1940, as amended (the “Act”), as an open-end management investment company and operates as a series company currently offering ten series, including the fund. The fund’s investment objective is to seek total return (consisting of capital appreciation and income). The Dreyfus Corporation (the “Manager” or “Dreyfus”), a wholly-owned subsidiary of The Bank of New York Mellon Corporation (“BNY Mellon”), serves as the fund’s investment adviser. Newton Investment Management (North America) Limited (“Newton”), formerly, Newton Capital Management Limited, a wholly-owned subsidiary of BNY Mellon and an affiliate of Dreyfus, serves as the fund’s sub-investment adviser.
MBSC Securities Corporation (the “Distributor”), a wholly-owned subsidiary of Dreyfus, is the distributor of the fund’s shares. The fund is authorized to issue 100 million shares of $.001 par value Common Stock in each of the following classes of shares: Class A, Class C, Class I and Class Y. Class A shares generally are subject to a sales charge imposed at the time of purchase. Class C shares are subject to a contingent deferred sales charge (“CDSC”) imposed on Class C shares redeemed within one year of purchase. Class I and Class Y shares are sold at net asset value per share generally to institutional investors. Other differences between the classes include the services offered to and the expenses borne by each class, the allocation of certain transfer agency costs, and certain voting rights. Income, expenses (other than expenses attributable to a specific class), and realized and unrealized gains or losses on investments are allocated to each class of shares based on its relative net assets.
The Company accounts separately for the assets, liabilities and operations of each series. Expenses directly attributable to each series are charged to that series’ operations; expenses which are applicable to all series are allocated among them on a pro rata basis.
The Financial Accounting Standards Board (“FASB”) Accounting Standards Codification (“ASC”) is the exclusive reference of authoritative U.S. generally accepted accounting principles (“GAAP”) recognized by the FASB to be applied by nongovernmental entities. Rules and interpretive releases of the Securities and Exchange Commission (“SEC”) under authority of federal laws are also sources of authoritative GAAP for SEC registrants. The fund’s financial statements are prepared in accordance with
22
GAAP, which may require the use of management estimates and assumptions. Actual results could differ from those estimates.
The Company enters into contracts that contain a variety of indemnifications. The fund’s maximum exposure under these arrangements is unknown. The fund does not anticipate recognizing any loss related to these arrangements.
(a) Portfolio valuation: The fair value of a financial instrument is the amount that would be received to sell an asset or paid to transfer a liability in an orderly transaction between market participants at the measurement date (i.e., the exit price). GAAP establishes a fair value hierarchy that prioritizes the inputs of valuation techniques used to measure fair value. This hierarchy gives the highest priority to unadjusted quoted prices in active markets for identical assets or liabilities (Level 1 measurements) and the lowest priority to unobservable inputs (Level 3 measurements).
Additionally, GAAP provides guidance on determining whether the volume and activity in a market has decreased significantly and whether such a decrease in activity results in transactions that are not orderly. GAAP requires enhanced disclosures around valuation inputs and techniques used during annual and interim periods.
Various inputs are used in determining the value of the fund’s investments relating to fair value measurements. These inputs are summarized in the three broad levels listed below:
Level 1—unadjusted quoted prices in active markets for identical investments.
Level 2—other significant observable inputs (including quoted prices for similar investments, interest rates, prepayment speeds, credit risk, etc.).
Level 3—significant unobservable inputs (including the fund’s own assumptions in determining the fair value of investments).
The inputs or methodology used for valuing securities are not necessarily an indication of the risk associated with investing in those securities.
Changes in valuation techniques may result in transfers in or out of an assigned level within the disclosure hierarchy. Valuation techniques used to value the fund’s investments are as follows:
Investments in debt securities, excluding short-term investments (other than U.S. Treasury Bills), financial futures, options and forward foreign currency exchange contracts (“forward contracts”), are valued each business day by an independent pricing service (the “Service”) approved by
23
NOTES TO FINANCIAL STATEMENTS (continued)
the Company’s Board of Directors (the “Board”). Investments for which quoted bid prices are readily available and are representative of the bid side of the market in the judgment of the Service are valued at the mean between the quoted bid prices (as obtained by the Service from dealers in such securities) and asked prices (as calculated by the Service based upon its evaluation of the market for such securities). Other investments are valued as determined by the Service, based on methods which include consideration of the following: yields or prices of securities of comparable quality, coupon, maturity and type; indications as to values from dealers; and general market conditions. These securities are generally categorized within Level 2 of the fair value hierarchy.
Investments in equity securities are valued at the last sales price on the securities exchange or national securities market on which such securities are primarily traded. Securities listed on the National Market System for which market quotations are available are valued at the official closing price or, if there is no official closing price that day, at the last sales price. For open short positions, asked prices are used for valuation purposes. Bid price is used when no asked price is available. Registered investment companies that are not traded on an exchange are valued at their net asset value. All of the preceding securities are generally categorized within Level 1 of the fair value hierarchy.
Securities not listed on an exchange or the national securities market, or securities for which there were no transactions, are valued at the average of the most recent bid and asked prices. U.S. Treasury Bills are valued at the mean price between quoted bid prices and asked prices by an independent pricing service (the“Service”) approved by the Board. These securities are generally categorized within Level 2 of the fair value hierarchy.
The Service is engaged under the general supervision of the Board.
Fair valuing of securities may be determined with the assistance of a pricing service using calculations based on indices of domestic securities and other appropriate indicators, such as prices of relevant ADRs and financial futures. Utilizing these techniques may result in transfers between Level 1 and Level 2 of the fair value hierarchy.
When market quotations or official closing prices are not readily available, or are determined not to reflect accurately fair value, such as when the value of a security has been significantly affected by events after the close of the exchange or market on which the security is principally traded (for example, a foreign exchange or market), but before the fund calculates its net asset value, the fund may value these investments at fair value as determined in accordance with the procedures approved by the Board.
24
Certain factors may be considered when fair valuing investments such as: fundamental analytical data, the nature and duration of restrictions on disposition, an evaluation of the forces that influence the market in which the securities are purchased and sold, and public trading in similar securities of the issuer or comparable issuers. These securities are either categorized within Level 2 or 3 of the fair value hierarchy depending on the relevant inputs used.
For restricted securities where observable inputs are limited, assumptions about market activity and risk are used and are generally categorized within Level 3 of the fair value hierarchy.
Investments denominated in foreign currencies are translated to U.S. dollars at the prevailing rates of exchange.
Financial futures and options, which are traded on an exchange, are valued at the last sales price on the securities exchange on which such securities are primarily traded or at the last sales price on the national securities market on each business day and are generally categorized within Level 1 of the fair value hierarchy. Options traded over-the-counter (“OTC”) are valued at the mean between the bid and asked price and are generally categorized within Level 2 of the fair value hierarchy. Forward contracts are valued at the forward rate and are generally categorized within Level 2 of the fair value hierarchy.
The following is a summary of the inputs used as of October 31, 2016 in valuing the fund’s investments:
| | | | | |
| | Level 1 - Unadjusted Quoted Prices | Level 2 - Other Significant Observable Inputs | Level 3 -Significant Unobservable Inputs | Total |
Assets ($) | | | |
Investments in Securities: | | | |
Corporate Bonds† | - | 50,337,633 | - | 50,337,633 |
Equity Securities –Domestic
Common Stocks† | 231,387,200 | - | - | 231,387,200 |
Equity Securities –Foreign
Common Stocks† | 501,041,611 | - | - | 501,041,611 |
Exchange –Traded Funds | 22,442,750 | - | - | 22,442,750 |
Foreign Government | - | 114,082,601 | - | 114,082,601 |
Mutual Funds | 77,404,811 | - | - | 77,404,811 |
U.S. Treasury | - | 377,972,495 | - | 377,972,495 |
Other Financial Instruments: | | | |
Financial Futures†† | 8,203,034 | - | - | 8,203,034 |
Forward Foreign Currency
Exchange Contracts†† | - | 14,547,920 | - | 14,547,920 |
25
NOTES TO FINANCIAL STATEMENTS (continued)
| | | | | |
| | Level 1 - Unadjusted Quoted Prices | Level 2 - Other Significant Observable Inputs | Level 3 -Significant Unobservable Inputs | Total |
Liabilities ($) | | | | |
Other Financial Instruments: | | | |
Financial Futures†† | (593,176) | - | - | (593,176) |
Forward Foreign Currency
Exchange Contracts†† | - | (2,977,580) | - | (2,977,580) |
† See Statement of Investments for additional detailed categorizations.
†† Amount shown represents unrealized appreciation (depreciation) at period end.
At October 31, 2016, there were no transfers between levels of the fair value hierarchy.
(b) Foreign currency transactions: The fund does not isolate that portion of the results of operations resulting from changes in foreign exchange rates on investments from the fluctuations arising from changes in the market prices of securities held. Such fluctuations are included with the net realized and unrealized gain or loss on investments.
Net realized foreign exchange gains or losses arise from sales of foreign currencies, currency gains or losses realized on securities transactions between trade and settlement date, and the difference between the amounts of dividends, interest and foreign withholding taxes recorded on the fund’s books and the U.S. dollar equivalent of the amounts actually received or paid. Net unrealized foreign exchange gains and losses arise from changes in the value of assets and liabilities other than investments resulting from changes in exchange rates. Foreign currency gains and losses on foreign currency transactions are also included with net realized and unrealized gain or loss on investments.
(c) Securities transactions and investment income: Securities transactions are recorded on a trade date basis. Realized gains and losses from securities transactions are recorded on the identified cost basis. Dividend income is recognized on the ex-dividend date and interest income, including, where applicable, accretion of discount and amortization of premium on investments, is recognized on the accrual basis.
(d) Affiliated issuers: Investments in other investment companies advised by Dreyfus are defined as “affiliated” under the Act. Investments in affiliated investment companies during the period ended October 31, 2016 were as follows:
26
| | | | | | |
Affiliated Investment Company | Value
10/31/2015 ($) | Purchases ($) | Sales ($) | Value
10/31/2016 ($) | Net
Assets (%) |
Dreyfus Institutional Preferred Government Plus Money Market Fund† | 15,598,919 | 724,894,435 | 663,088,543 | 77,404,811 | 5.5 |
† Formerly Dreyfus Institutional Preferred Plus Money Market Fund.
In addition, an affiliated company is a company in which the fund has ownership of at least 5% of the voting securities. Investments in affiliated companies during the period ended October 31, 2016 were as follows:
| | | | | |
Affiliated
Company | Value
10/31/2015 ($) | Purchases ($) | Sales ($) | Net Realized
Gain (Loss) ($) |
PowerShares DB
Gold Fund | 13,555,443 | 7,630,519 | - | - |
| | | | | |
Affiliated
Company | Change in Net Unrealized Appreciation
(Depreciation) ($) | Value
10/31/2016 ($) | Net
Assets (%) | Dividends/
Distributions ($) |
PowerShares DB
Gold Fund | 1,256,788 | 22,442,750 | 1.6 | - |
(e) Risk: Investing in foreign markets may involve special risks and considerations not typically associated with investing in the U.S. These risks include revaluation of currencies, high rates of inflation, repatriation restrictions on income and capital, and adverse political and economic developments. Moreover, securities issued in these markets may be less liquid, subject to government ownership controls and delayed settlements, and their prices may be more volatile than those of comparable securities in the U.S.
(f) Dividends to shareholders: Dividends are recorded on the ex-dividend date. Dividends from investment income-net and dividends from net realized capital gains, if any, are normally declared and paid annually, but the fund may make distributions on a more frequent basis to comply with the distribution requirements of the Internal Revenue Code of 1986, as amended (the “Code”). To the extent that net realized capital gains can be offset by capital loss carryovers, it is the policy of the fund not to distribute such gains. Income and capital gain distributions are determined in accordance with income tax regulations, which may differ from GAAP.
(g) Federal income taxes: It is the policy of the fund to continue to qualify as a regulated investment company, if such qualification is in the best interests of its shareholders, by complying with the applicable
27
NOTES TO FINANCIAL STATEMENTS (continued)
provisions of the Code, and to make distributions of taxable income sufficient to relieve it from substantially all federal income and excise taxes.
As of and during the period ended October 31, 2016, the fund did not have any liabilities for any uncertain tax positions. The fund recognizes interest and penalties, if any, related to uncertain tax positions as income tax expense in the Statement of Operations. During the period ended October 31, 2016, the fund did not incur any interest or penalties.
Each tax year in the four-year period ended October 31, 2016 remains subject to examination by the Internal Revenue Service and state taxing authorities.
At October 31, 2016, the components of accumulated earnings on a tax basis were as follows: undistributed ordinary income $38,217,454, accumulated capital and other losses $43,167,163 and unrealized appreciation $6,556,505.
Under the Regulated Investment Company Modernization Act of 2010, the fund is permitted to carry forward capital losses for an unlimited period. Furthermore, capital loss carryovers retain their character as either short-term or long-term capital losses.
The accumulated capital loss carryover is available for federal income tax purposes to be applied against future net realized capital gains, if any, realized subsequent to October 31, 2016. If not applied, the fund has $13,001,271 of short-term capital losses and $29,376,366 of long-term capital losses which can be carried forward for an unlimited period.
The tax character of distributions paid to shareholders during the fiscal periods ended October 31, 2016 and October 31, 2015 were as follows: ordinary income $24,510,526 and $18,822,270, respectively.
During the period ended October 31, 2016, as a result of permanent book to tax differences, primarily due to the tax treatment for foreign currency gains and losses, limited partnerships and passive foreign investment companies, the fund increased accumulated undistributed investment income-net by $12,607,877 and decreased accumulated net realized gain (loss) on investments by the same amount. Net assets and net asset value per share were not affected by this reclassification.
NOTE 2—Bank Lines of Credit:
The fund participates with other Dreyfus-managed funds in a $810 million unsecured credit facility led by Citibank, N.A. and a $300 million unsecured credit facility provided by The Bank of New York Mellon, a subsidiary of BNY Mellon and an affiliate of Dreyfus (each, a “Facility”),
28
each to be utilized primarily for temporary or emergency purposes, including the financing of redemptions. Prior to October 5, 2016, the unsecured credit facility with Citibank, N.A. was $555 million and prior to January 11, 2016, the unsecured credit facility with Citibank, N.A. was $480 million. In connection therewith, the fund has agreed to pay its pro rata portion of commitment fees for each Facility. Interest is charged to the fund based on rates determined pursuant to the terms of the respective Facility at the time of borrowing.
The average amount of borrowings outstanding under the Facilities during the period ended October 31, 2016, was approximately $80,900 with a related weighted average annualized interest rate of 1.37%.
NOTE 3—Management Fee, Sub-Investment Advisory Fee and Other Transactions with Affiliates:
(a) Pursuant to a management agreement with Dreyfus, the management fee is computed at the annual rate of .75% of the value of the fund’s average daily net assets and is payable monthly. Dreyfus has contractually agreed, from November 1, 2015 through March 1, 2017, to waive receipt of its fees and/or assume the direct expenses of the fund, so that the expenses of none of the classes (excluding Rule 12b-1 Distribution Plan fees, Shareholder Services Plan fees, taxes, interest expense, brokerage commissions, commitment fees on borrowings and extraordinary expenses) exceed .90% of the value of the fund’s average daily net assets. The reduction in expenses, pursuant to the undertaking, amounted to $9,641 during the period ended October 31, 2016.
Pursuant to a sub-investment advisory agreement between Dreyfus and Newton, Dreyfus pays Newton an annual fee of .36% of the value of the fund’s average daily net assets.
During the period ended October 31, 2016, the Distributor retained $76,186 from commissions earned on sales of the fund’s Class A shares and $1,854 from CDSCs on redemptions of the fund’s Class C shares.
(b) Under the Distribution Plan adopted pursuant to Rule 12b-1 under the Act, Class C shares pay the Distributor for distributing its shares at an annual rate of .75% of the value of its average daily net assets. During the period ended October 31, 2016, Class C shares were charged $177,921 pursuant to the Distribution Plan.
(c) Under the Shareholder Services Plan, Class A and Class C shares pay the Distributor at an annual rate of .25% of the value of their average daily net assets for the provision of certain services. The services provided may include personal services relating to shareholder accounts, such as
29
NOTES TO FINANCIAL STATEMENTS (continued)
answering shareholder inquiries regarding the fund and providing reports and other information, and services related to the maintenance of shareholder accounts. The Distributor may make payments to Service Agents (securities dealers, financial institutions or other industry professionals) with respect to these services. The Distributor determines the amounts to be paid to Service Agents. During the period ended October 31, 2016, Class A and Class C shares were charged $223,360 and $59,307, respectively, pursuant to the Shareholder Services Plan.
The fund has arrangements with the transfer agent and the custodian whereby the fund may receive earnings credits when positive cash balances are maintained, which are used to offset transfer agency and custody fees. For financial reporting purposes, the fund includes net earnings credits as an expense offset in the Statement of Operations.
The fund compensates Dreyfus Transfer, Inc., a wholly-owned subsidiary of Dreyfus, under a transfer agency agreement for providing transfer agency and cash management services for the fund. The majority of transfer agency fees are comprised of amounts paid on a per account basis, while cash management fees are related to fund subscriptions and redemptions. During the period ended October 31, 2016, the fund was charged $7,214 for transfer agency services and $418 for cash management services. These fees are included in Shareholder servicing costs in the Statement of Operations. Cash management fees were partially offset by earnings credits of $182.
The fund compensates The Bank of New York Mellon under a custody agreement for providing custodial services for the fund. These fees are determined based on net assets, geographic region and transaction activity. During the period ended October 31, 2016, the fund was charged $133,404 pursuant to the custody agreement.
During the period ended October 31, 2016, the fund was charged $9,804 for services performed by the Chief Compliance Officer and his staff.
The components of “Due to The Dreyfus Corporation and affiliates” in the Statement of Assets and Liabilities consist of: management fees $868,454, Distribution Plan fees $22,127, Shareholder Services Plan fees $39,781, custodian fees $92,708, Chief Compliance Officer fees $5,688 and transfer agency fees $7,293, which are offset against an expense reimbursement currently in effect in the amount of $1,661.
(d) Each Board member also serves as a Board member of other funds within the Dreyfus complex. Annual retainer fees and attendance fees are allocated to each fund based on net assets.
30
NOTE 4—Securities Transactions:
The aggregate amount of purchases and sales of investment securities, excluding short-term securities, financial futures, options transactions and forward contracts, during the period ended October 31, 2016, amounted to $1,234,343,172 and $426,608,022, respectively.
Derivatives: A derivative is a financial instrument whose performance is derived from the performance of another asset. The fund enters into International Swaps and Derivatives Association, Inc. Master Agreements or similar agreements (collectively, “Master Agreements”) with its OTC derivative contract counterparties in order to, among other things, reduce its credit risk to counterparties. Master Agreements include provisions for general obligations, representations, collateral and events of default or termination. Under a Master Agreement, the fund may offset with the counterparty certain derivative financial instrument’s payables and/or receivables with collateral held and/or posted and create one single net payment in the event of default or termination.
Each type of derivative instrument that was held by the fund during the period ended October 31, 2016 is discussed below.
Financial Futures: In the normal course of pursuing its investment objective, the fund is exposed to market risk, including equity risk and interest risk, as a result of changes in value of underlying financial instruments. The fund invests in financial futures in order to manage its exposure to or protect against changes in the market. A financial futures contract represents a commitment for the future purchase or a sale of an asset at a specified date. Upon entering into such contracts, these investments require initial margin deposits with a counterparty, which consist of cash or cash equivalents. The amount of these deposits is determined by the exchange or Board of Trade on which the contract is traded and is subject to change. Accordingly, variation margin payments are received or made to reflect daily unrealized gains or losses which are recorded in the Statement of Operations. When the contracts are closed, the fund recognizes a realized gain or loss which is reflected in the Statement of Operations. There is minimal counterparty credit risk to the fund with financial futures since they are exchange traded, and the exchange guarantees the financial futures against default. Financial futures open at October 31, 2016 are set forth in the Statement of Financial Futures.
Options Transactions: The fund purchases and writes (sells) put and call options to hedge against changes in the values of equities, interest rates, foreign currencies or as a substitute for an investment. The fund is subject
31
NOTES TO FINANCIAL STATEMENTS (continued)
to market risk, interest rate risk and currency risk in the course of pursuing its investment objectives through its investments in options contracts. A call option gives the purchaser of the option the right (but not the obligation) to buy, and obligates the writer to sell, the underlying financial instrument at the exercise price at any time during the option period, or at a specified date. Conversely, a put option gives the purchaser of the option the right (but not the obligation) to sell, and obligates the writer to buy the underlying financial instrument at the exercise price at any time during the option period, or at a specified date.
As a writer of call options, the fund receives a premium at the outset and then bears the market risk of unfavorable changes in the price of the financial instrument underlying the option. Generally, the fund realizes a gain, to the extent of the premium, if the price of the underlying financial instrument decreases between the date the option is written and the date on which the option is terminated. Generally, the fund incurs a loss if the price of the financial instrument increases between those dates.
As a writer of put options, the fund receives a premium at the outset and then bears the market risk of unfavorable changes in the price of the financial instrument underlying the option. Generally, the fund realizes a gain, to the extent of the premium, if the price of the underlying financial instrument increases between the date the option is written and the date on which the option is terminated. Generally, the fund incurs a loss if the price of the financial instrument decreases between those dates.
As a writer of an option, the fund has no control over whether the underlying financial instrument may be sold (call) or purchased (put) and as a result bears the market risk of an unfavorable change in the price of the financial instrument underlying the written option. There is a risk of loss from a change in value of such options which may exceed the related premiums received. This risk may be mitigated by Master Agreements, if any, between the fund and the counterparty and the posting of collateral, if any, by the counterparty to the fund to cover the fund’s exposure to the counterparty. The Statement of Operations reflects any unrealized gains or losses which occurred during the period as well as any realized gains or losses which occurred upon the expiration or closing of the option transaction.
The following summarizes the fund’s call/put options written during the period ended October 31, 2016:
32
| | | | | |
| | | | Options Terminated |
| | Number of | Premiums | | Net Realized |
Options Written: | Contracts | Received ($) | Cost ($) | Gain ($) |
Contracts outstanding
October 31, 2015 | - | - | | |
Contracts written | 1,099 | 630,563 | | |
Contracts terminated: | | | | |
Contracts closed | 1,099 | 630,563 | 242,876 | 387,687 |
Contracts outstanding
October 31, 2016 | - | - | | |
Forward Foreign Currency Exchange Contracts: The fund enters into forward contracts in order to hedge its exposure to changes in foreign currency exchange rates on its foreign portfolio holdings, to settle foreign currency transactions or as a part of its investment strategy. When executing forward contracts, the fund is obligated to buy or sell a foreign currency at a specified rate on a certain date in the future. With respect to sales of forward contracts, the fund incurs a loss if the value of the contract increases between the date the forward contract is opened and the date the forward contract is closed. The fund realizes a gain if the value of the contract decreases between those dates. With respect to purchases of forward contracts, the fund incurs a loss if the value of the contract decreases between the date the forward contract is opened and the date the forward contract is closed. The fund realizes a gain if the value of the contract increases between those dates. Any realized or unrealized gains or losses which occurred during the period are reflected in the Statement of Operations. The fund is exposed to foreign currency risk as a result of changes in value of underlying financial instruments. The fund is also exposed to credit risk associated with counterparty nonperformance on these forward contracts, which is generally limited to the unrealized gain on each open contract. This risk may be mitigated by Master Agreements, if any, between the fund and the counterparty and the posting of collateral, if any, by the counterparty to the fund to cover the fund’s exposure to the counterparty. The following summarizes open forward contracts at October 31, 2016:
| | | | | |
Forward Foreign Currency Exchange Contracts | Foreign Currency
Amounts | Cost/
Proceeds ($) | Value ($) | Unrealized Appreciation (Depreciation)($) |
Purchases: | | | |
JP Morgan Chase Bank | | | |
Japanese Yen, | | | | |
Expiring | | | | |
12/15/2016 | 267,737,700 | 2,558,691 | 2,557,808 | (883) |
33
NOTES TO FINANCIAL STATEMENTS (continued)
| | | | | |
Forward Foreign Currency Exchange Contracts | Foreign Currency
Amounts | Cost/
Proceeds ($) | Value ($) | Unrealized Appreciation (Depreciation)($) |
Purchases: (continued) |
Royal Bank of Scotland | | | |
British Pound, | | | | |
Expiring | | | | |
11/1/2016 | 45,195 | 54,982 | 55,319 | 337 |
State Street Bank and Trust Co. | | | |
Japanese Yen, | | | | |
Expiring | | | | |
12/15/2016 | 39,596,497 | 389,089 | 378,282 | (10,807) |
UBS | | | |
Australian Dollar, | | | | |
Expiring | | | | |
12/15/2016 | 11,067,510 | 8,412,458 | 8,409,324 | (3,134) |
Japanese Yen, | | | | |
Expiring | | | | |
12/15/2016 | 115,446,549 | 1,139,798 | 1,102,908 | (36,890) |
Sales: | | | |
Barclays Bank | | | |
Canadian Dollar, | | | | |
Expiring | | | | |
11/16/2016 | 3,539,771 | 2,766,038 | 2,639,324 | 126,714 |
New Zealand Dollar, | | | | |
Expiring | | | | |
11/16/2016 | 2,336,192 | 1,690,869 | 1,669,505 | 21,364 |
JP Morgan Chase Bank | | | |
Australian Dollar, | | | | |
Expiring | | | | |
12/15/2016 | 13,081,129 | 9,982,909 | 9,939,314 | 43,595 |
British Pound, | | | | |
Expiring | | | | |
1/17/2017 | 2,319,295 | 2,831,616 | 2,844,281 | (12,665) |
Canadian Dollar, | | | | |
Expiring | | | | |
11/16/2016 | 16,050,180 | 12,137,623 | 11,967,336 | 170,287 |
Euro, | | | | |
Expiring | | | | |
1/17/2017 | 3,092,811 | 3,424,183 | 3,407,900 | 16,283 |
Japanese Yen, | | | | |
Expiring | | | | |
12/15/2016 | 359,154,595 | 3,521,715 | 3,431,152 | 90,563 |
New Zealand Dollar, | | | | |
Expiring | | | | |
11/16/2016 | 24,593,083 | 17,868,481 | 17,574,870 | 293,611 |
34
| | | | | |
Forward Foreign Currency Exchange Contracts | Foreign Currency
Amounts | Cost/
Proceeds ($) | Value ($) | Unrealized Appreciation (Depreciation)($) |
Sales: (continued) |
JP Morgan Chase Bank (continued) |
South African Rand, | | | | |
Expiring | | | | |
1/17/2017 | 51,174,603 | 3,634,573 | 3,734,754 | (100,181) |
Royal Bank of Scotland | | | |
Australian Dollar, | | | | |
Expiring | | | | |
12/15/2016 | 181,792,074 | 136,053,188 | 138,129,399 | (2,076,211) |
British Pound, | | | | |
Expiring | | | | |
1/17/2017 | 184,222,674 | 234,174,919 | 225,922,573 | 8,252,346 |
Canadian Dollar, | | | | |
Expiring | | | | |
11/16/2016 | 79,557,592 | 60,486,685 | 59,319,736 | 1,166,949 |
Euro, | | | | |
Expiring | | | | |
1/17/2017 | 7,180,501 | 7,834,215 | 7,912,035 | (77,820) |
Japanese Yen, | | | | |
Expiring | | | | |
11/1/2016 | 8,942,411 | 85,467 | 85,271 | 196 |
11/4/2016 | 26,287,403 | 250,447 | 250,667 | (220) |
New Zealand Dollar, | | | | |
Expiring | | | | |
11/16/2016 | 946,229 | 679,853 | 676,200 | 3,653 |
South Korean Won, | | | | |
Expiring | | | | |
11/16/2016 | 5,006,678,057 | 4,499,416 | 4,375,263 | 124,153 |
State Street Bank and Trust Co. | | | |
Australian Dollar, | | | | |
Expiring | | | | |
12/15/2016 | 15,856,237 | 12,059,577 | 12,047,899 | 11,678 |
British Pound, | | | | |
Expiring | | | | |
1/17/2017 | 8,162,131 | 9,975,864 | 10,009,677 | (33,813) |
Canadian Dollar, | | | | |
Expiring | | | | |
11/16/2016 | 19,253,902 | 14,690,905 | 14,356,095 | 334,810 |
Euro, | | | | |
Expiring | | | | |
1/17/2017 | 1,873,657 | 2,070,049 | 2,064,541 | 5,508 |
35
NOTES TO FINANCIAL STATEMENTS (continued)
| | | | | |
Forward Foreign Currency Exchange Contracts | Foreign Currency
Amounts | Cost/
Proceeds ($) | Value ($) | Unrealized Appreciation (Depreciation)($) |
Sales: (continued) |
State Street Bank and Trust Co. (continued) |
Japanese Yen, | | | | |
Expiring | | | | |
11/2/2016 | 9,036,351 | 85,829 | 86,167 | (338) |
12/15/2016 | 2,501,589,527 | 24,568,158 | 23,898,714 | 669,444 |
New Zealand Dollar, | | | | |
Expiring | | | | |
11/16/2016 | 19,303,837 | 13,931,416 | 13,795,034 | 136,382 |
UBS | | | |
British Pound, | | | | |
Expiring | | | | |
1/17/2017 | 4,781,481 | 5,853,985 | 5,863,798 | (9,813) |
Euro, | | | | |
Expiring | | | | |
1/17/2017 | 148,051,486 | 166,200,170 | 163,134,654 | 3,065,516 |
New Zealand Dollar, | | | | |
Expiring | | | | |
11/16/2016 | 131,550,259 | 93,394,502 | 94,009,307 | (614,805) |
South Korean Won, | | | | |
Expiring | | | | |
11/16/2016 | 680,028,693 | 608,798 | 594,267 | 14,531 |
Gross Unrealized Appreciation | | | 14,547,920 |
Gross Unrealized Depreciation | | | (2,977,580) |
The following tables show the fund’s exposure to different types of market risk as it relates to the Statement of Assets and Liabilities and the Statement of Operations, respectively.
Fair value of derivative instruments as of October 31, 2016 is shown below:
| | | | | | | | |
| | Derivative
Assets ($) | | | | Derivative
Liabilities ($) | |
Equity risk | 8,203,034 | 1 | Equity risk | | (593,176) | 1 |
Foreign exchange risk | 14,547,920 | 2 | Foreign exchange risk | | (2,977,580) | 2 |
Gross fair value of
derivative contracts | 22,750,954 | | | | (3,570,756) | |
| | | | | | | |
| | Statement of Assets and Liabilities location: | |
1 | Includes cumulative appreciation (depreciation) on financial futures as reported in the Statement of Financial
Futures, but only the unpaid variation margin is reported in the Statement of Assets and Liabilities. |
2 | Unrealized appreciation (depreciation) on forward foreign currency exchange contracts. |
36
The effect of derivative instruments in the Statement of Operations during the period ended October 31, 2016 is shown below:
| | | | | | | | | | | |
Amount of realized gain (loss) on derivatives recognized in income ($) | |
Underlying
risk | Financial
Futures | 1 | Options
Transactions | 2 | Forward
Contracts | 3 | Total | | |
Interest
rate | (529,805) | | (805,234) | | - | | (1,335,039) | | |
Equity | (24,765,808) | | (389,638) | | - | | (25,155,446) | | |
Foreign
exchange | 173,524 | | 107,306 | | 13,320,467 | | 13,601,297 | | |
Total | (25,122,089) | | (1,087,566) | | 13,320,467 | | (12,889,188) | | |
| | | | | | | | | | |
Change in unrealized appreciation (depreciation) on derivatives recognized in income ($) | |
Underlying
risk | Financial
Futures | 4 | Options
Transactions | 5 | Forward
Contracts | 6 | Total | | |
Equity | 13,406,904 | | - | | - | | 13,406,904 | | |
Foreign
exchange | - | | 122,393 | | 12,875,018 | | 12,997,411 | | |
Total | 13,406,904 | | 122,393 | | 12,875,018 | | 26,404,315 | | |
| | | | | | | | | | | |
| | Statement of Operations location: | | | | | | |
1 | Net realized gain (loss) on financial futures. | |
2 | Net realized gain (loss) on options transactions. |
3 | Net realized gain (loss) on forward foreign currency exchange contracts. | |
4 | Net unrealized appreciation (depreciation) on financial futures. | |
5 | Net unrealized appreciation (depreciation) on options transactions. | |
6 | Net unrealized appreciation (depreciation) on forward foreign currency exchange contracts. |
The provisions of ASC Topic 210 “Disclosures about Offsetting Assets and Liabilities” require disclosure on the offsetting of financial assets and liabilities. These disclosures are required for certain investments, including derivative financial instruments subject to Master Agreements which are eligible for offsetting in the Statement of Assets and Liabilities and require the fund to disclose both gross and net information with respect to such investments. For financial reporting purposes, the fund does not offset derivative assets and derivative liabilities that are subject to Master Agreements in the Statement of Assets and Liabilities.
37
NOTES TO FINANCIAL STATEMENTS (continued)
At October 31, 2016, derivative assets and liabilities (by type) on a gross basis are as follows:
| | | | | | |
Derivative Financial Instruments: | | Assets ($) | | Liabilities ($) | |
Financial futures | | 8,203,034 | | (593,176) | |
Forward contracts | | 14,547,920 | | (2,977,580) | |
Total gross amount of derivative | | | | | |
assets and liabilities in the | | | | | |
Statement of Assets and Liabilities | | 22,750,954 | | (3,570,756) | |
Derivatives not subject to | | | | | |
Master Agreements | | (8,203,034) | | 593,176 | |
Total gross amount of assets | | | | | |
and liabilities subject to | | | | | |
Master Agreements | | 14,547,920 | | (2,977,580) | |
The following tables present derivative assets and liabilities net of amounts available for offsetting under Master Agreements and net of related collateral received or pledged, if any, as of October 31, 2016:
| | | | | | | |
| | | | Financial | | | |
| | | | Instruments | | | |
| | | | and Derivatives | | | |
| | Gross Amount of | | Available | Collateral | | Net Amount of |
Counterparty | Assets ($) | 1 | for Offset ($) | Received ($) | | Assets ($) |
Barclays Bank | 148,078 | | - | - | | 148,078 |
JP Morgan
Chase Bank | 614,339 | | (113,729) | - | | 500,610 |
Royal Bank
of Scotland | 9,547,634 | | (2,154,251) | - | | 7,393,383 |
State Street
Bank and Trust Co. | 1,157,822 | | (44,958) | - | | 1,112,864 |
UBS | 3,080,047 | | (664,642) | - | | 2,415,405 |
Total | 14,547,920 | | (2,977,580) | - | | 11,570,340 |
| | | | | | | |
| | | | Financial | | | |
| | | | Instruments | | | |
| | | | and Derivatives | | | |
| | Gross Amount of | | Available | Collateral | | Net Amount of |
Counterparty | Liabilities ($) | 1 | for Offset ($) | Pledged ($) | | Liabilities ($) |
JP Morgan
Chase Bank | (113,729) | | 113,729 | - | | - |
Royal Bank
of Scotland | (2,154,251) | | 2,154,251 | - | | - |
State Street
Bank and Trust Co. | (44,958) | | 44,958 | - | | - |
UBS | (664,642) | | 664,642 | - | | - |
Total | (2,977,580) | | 2,977,580 | - | | - |
| | | | | | | |
1 Absent a default event or early termination, OTC derivative assets and liabilities are presented at gross amounts
and are not offset in the Statement of Assets and Liabilities. |
| |
38
The following summarizes the average market value of derivatives outstanding during the period ended October 31, 2016:
| | | |
| | Average Market Value ($) |
Equity financial futures | | 205,453,914 |
Equity options contracts | | 32,800 |
Interest rate financial futures | | 5,808 |
Interest rate options contracts | | 93,647 |
Foreign currency options contracts | | 16,391 |
Forward contracts | | 438,304,873 |
| | | |
At October 31, 2016, the cost of investments for federal income tax purposes was $1,368,086,619; accordingly, accumulated net unrealized appreciation on investments was $6,582,482, consisting of $53,343,536 gross unrealized appreciation and $46,761,054 gross unrealized depreciation.
39
REPORT OF INDEPENDENT REGISTERED
PUBLIC ACCOUNTING FIRM
Shareholders and Board of Directors
Dreyfus Global Real Return Fund
We have audited the accompanying statement of assets and liabilities, including the statements of investments and financial futures, of Dreyfus Global Real Return Fund (one of the series comprising Advantage Funds, Inc.) as of October 31, 2016, and the related statement of operations for the year then ended, the statement of changes in net assets for each of the two years in the period then ended, and the financial highlights for each of the periods indicated therein. These financial statements and financial highlights are the responsibility of the Fund’s management. Our responsibility is to express an opinion on these financial statements and financial highlights based on our audits.
We conducted our audits in accordance with the standards of the Public Company Accounting Oversight Board (United States). Those standards require that we plan and perform the audit to obtain reasonable assurance about whether the financial statements and financial highlights are free of material misstatement. We were not engaged to perform an audit of the Fund’s internal control over financial reporting. Our audits included consideration of internal control over financial reporting as a basis for designing audit procedures that are appropriate in the circumstances, but not for the purpose of expressing an opinion on the effectiveness of the Fund’s internal control over financial reporting. Accordingly, we express no such opinion. An audit also includes examining, on a test basis, evidence supporting the amounts and disclosures in the financial statements and financial highlights, assessing the accounting principles used and significant estimates made by management, and evaluating the overall financial statement presentation. Our procedures included confirmation of securities owned as of October 31, 2016 by correspondence with the custodian and others. We believe that our audits provide a reasonable basis for our opinion.
In our opinion, the financial statements and financial highlights referred to above present fairly, in all material respects, the financial position of Dreyfus Global Real Return Fund at October 31, 2016, the results of its operations for the year then ended, the changes in its net assets for each of the two years in the period then ended, and the financial highlights for each of the indicated periods, in conformity with U.S. generally accepted accounting principles.

New York, New York
December 29, 2016
40
IMPORTANT TAX INFORMATION (Unaudited)
In accordance with federal tax law, the fund elects to provide each shareholder with their portion of the fund’s foreign taxes paid and the income sourced from foreign countries. Accordingly, the fund hereby reports the following information regarding its fiscal year ended October 31, 2016:
- the total amount of taxes paid to foreign countries was $589,274.
- the total amount of income sourced from foreign countries was $12,952,161.
Where required by federal tax law rules, shareholders will receive notification of their proportionate share of foreign taxes paid and foreign sourced income for the 2016 calendar year with Form 1099-DIV which will be mailed in early 2017. For the fiscal year ended October 31, 2016, certain dividends paid by the fund may be subject to a maximum tax rate of 15%, as provided for by the Jobs and Growth Tax Relief Reconciliation Act of 2003. Of the distributions paid during the fiscal year, $8,846,858 represents the maximum amount that may be considered qualified dividend income.
41
BOARD MEMBERS INFORMATION (Unaudited)
INDEPENDENT BOARD MEMBERS
Joseph S. DiMartino (73)
Chairman of the Board (1995)
Principal Occupation During Past 5 Years:
· Corporate Director and Trustee (1995-present)
Other Public Company Board Memberships During Past 5 Years:
· CBIZ (formerly, Century Business Services, Inc.), a provider of outsourcing functions for small and medium size companies, Director (1997-present)
No. of Portfolios for which Board Member Serves: 135
———————
Peggy C. Davis (73)
Board Member (2006)
Principal Occupation During Past 5 Years:
· Shad Professor of Law, New York University School of Law (1983-present)
No. of Portfolios for which Board Member Serves: 49
———————
David P. Feldman (76)
Board Member (1996)
Principal Occupation During Past 5 Years:
· Corporate Director and Trustee (1985-present)
Other Public Company Board Memberships During Past 5 Years:
· BBH Mutual Funds Group (5 registered mutual funds), Director (1992-2014)
No. of Portfolios for which Board Member Serves: 35
———————
Ehud Houminer (76)
Board Member (1993)
Principal Occupation During Past 5 Years:
· Executive-in-Residence at the Columbia Business School, Columbia
University (1992-present)
Other Public Company Board Memberships During Past 5 Years:
· Avnet, Inc., an electronics distributor, Director (1993-2012)
No. of Portfolios for which Board Member Serves: 59
———————
42
Lynn Martin (76)
Board Member (2012)
Principal Occupation During Past 5 Years:
· President of The Martin Hall Group LLC, a human resources consulting firm (2005-2012)
Other Public Company Board Memberships During Past 5 Years:
· AT&T, Inc., a telecommunications company, Director (1999-2012)
· Ryder System, Inc., a supply chain and transportation management company, Director (1993-2012)
No. of Portfolios for which Board Member Serves: 35
———————
Robin A. Melvin (53)
Board Member (2012)
Principal Occupation During Past 5 Years:
· Co-chairman, Illinois Mentoring Partnership, non-profit organization dedicated to increasing the quantity and quality of mentoring services in Illinois; (2014-present; served as a board member since 2013)
· Director, Boisi Family Foundation, a private family foundation that supports youth-serving organizations that promote the self sufficiency of youth from disadvantaged circumstances (1995-2012)
No. of Portfolios for which Board Member Serves: 107
———————
Dr. Martin Peretz (77)
Board Member (2006)
Principal Occupation During Past 5 Years:
· Editor-in-Chief Emeritus of The New Republic Magazine (2011-2012) (previously,
Editor-in-Chief, 1974-2011)
· Director of TheStreet.com, a financial information service on the web (1996-2010)
· Lecturer at Harvard University (1969-2012)
No. of Portfolios for which Board Member Serves: 35
———————
Once elected all Board Members serve for an indefinite term, but achieve Emeritus status upon reaching age 80. The address of the Board Members and Officers is c/o The Dreyfus Corporation, 200 Park Avenue, New York, New York 10166. Additional information about the Board Members is available in the fund’s Statement of Additional Information which can be obtained from Dreyfus free of charge by calling this toll free number: 1-800-DREYFUS.
James F. Henry, Emeritus Board Member
Dr. Paul A. Marks, Emeritus Board Member
Philip L. Toia, Emeritus Board Member
43
OFFICERS OF THE FUND (Unaudited)
BRADLEY J. SKAPYAK, President since January 2010.
Chief Operating Officer and a director of the Manager since June 2009, Chairman of Dreyfus Transfer, Inc., an affiliate of the Manager and the transfer agent of the funds, since May 2011 and Executive Vice President of the Distributor since June 2007. From April 2003 to June 2009, Mr. Skapyak was the head of the Investment Accounting and Support Department of the Manager. He is an officer of 64 investment companies (comprised of 135 portfolios) managed by the Manager. He is 57 years old and has been an employee of the Manager since February 1988.
BENNETT A. MACDOUGALL, Chief Legal Officer since October 2015.
Chief Legal Officer of the Manager since June 2015; from June 2005 to June 2015, he served in various capacities with Deutsche Bank – Asset & Wealth Management Division, including as Director and Associate General Counsel, and Chief Legal Officer of Deutsche Investment Management Americas Inc. from June 2012 to May 2015. He is an officer of 65 investment companies (comprised of 160 portfolios) managed by the Manager. He is 45 years old and has been an employee of the Manager since June 2015.
JANETTE E. FARRAGHER, Vice President and Secretary since December 2011.
Assistant General Counsel of BNY Mellon, and an officer of 65 investment companies (comprised of 160 portfolios) managed by the Manager. She is 53 years old and has been an employee of the Manager since February 1984.
JAMES BITETTO, Vice President and Assistant Secretary since August 2005.
Managing Counsel of BNY Mellon and Secretary of the Manager, and an officer of 65 investment companies (comprised of 160 portfolios) managed by the Manager. He is 50 years old and has been an employee of the Manager since December 1996.
JONI LACKS CHARATAN, Vice President and Assistant Secretary since August 2005.
Managing Counsel of BNY Mellon, and an officer of 65 investment companies (comprised of 160 portfolios) managed by the Manager. She is 60 years old and has been an employee of the Manager since October 1988.
JOSEPH M. CHIOFFI, Vice President and Assistant Secretary since August 2005.
Managing Counsel of BNY Mellon, and an officer of 65 investment companies (comprised of 160 portfolios) managed by the Manager. He is 54 years old and has been an employee of the Manager since June 2000.
MAUREEN E. KANE, Vice President and Assistant Secretary since April 2015.
Managing Counsel of BNY Mellon since July 2014; from October 2004 until July 2014, General Counsel, and from May 2009 until July 2014, Chief Compliance Officer of Century Capital Management. She is an officer of 65 investment companies (comprised of 160 portfolios) managed by the Manager. She is 54 years old and has been an employee of the Manager since July 2014.
SARAH S. KELLEHER, Vice President and Assistant Secretary since April 2014.
Senior Counsel of BNY Mellon, and an officer of 65 investment companies (comprised of 160 portfolios) managed by the Manager; from August 2005 to March 2013, Associate General Counsel of Third Avenue Management. She is 41 years old and has been an employee of the Manager since March 2013.
JEFF PRUSNOFSKY, Vice President and Assistant Secretary since August 2005.
Senior Managing Counsel of BNY Mellon, and an officer of 65 investment companies (comprised of 160 portfolios) managed by the Manager. He is 51 years old and has been an employee of the Manager since October 1990.
JAMES WINDELS, Treasurer since November 2001.
Director – Mutual Fund Accounting of the Manager, and an officer of 65 investment companies (comprised of 160 portfolios) managed by the Manager. He is 58 years old and has been an employee of the Manager since April 1985.
RICHARD CASSARO, Assistant Treasurer since January 2008.
Senior Accounting Manager – Money Market, Municipal Bond and Equity Funds of the Manager, and an officer of 65 investment companies (comprised of 160 portfolios) managed by the Manager. He is 57 years old and has been an employee of the Manager since September 1982.
44
GAVIN C. REILLY, Assistant Treasurer since December 2005.
Tax Manager of the Investment Accounting and Support Department of the Manager, and an officer of 65 investment companies (comprised of 160 portfolios) managed by the Manager. He is 48 years old and has been an employee of the Manager since April 1991.
ROBERT S. ROBOL, Assistant Treasurer since December 2005.
Senior Accounting Manager of the Manager, and an officer of 65 investment companies (comprised of 160 portfolios) managed by the Manager. He is 52 years old and has been an employee of the Manager since October 1988.
ROBERT SALVIOLO, Assistant Treasurer since July 2007.
Senior Accounting Manager – Equity Funds of the Manager, and an officer of 65 investment companies (comprised of 160 portfolios) managed by the Manager. He is 49 years old and has been an employee of the Manager since June 1989.
ROBERT SVAGNA, Assistant Treasurer since December 2002.
Senior Accounting Manager – Fixed Income and Equity Funds of the Manager, and an officer of 65 investment companies (comprised of 160 portfolios) managed by the Manager. He is 49 years old and has been an employee of the Manager since November 1990.
JOSEPH W. CONNOLLY, Chief Compliance Officer since October 2004.
Chief Compliance Officer of the Manager and The Dreyfus Family of Funds (65 investment companies, comprised of 160 portfolios). He is 59 years old and has served in various capacities with the Manager since 1980, including manager of the firm’s Fund Accounting Department from 1997 through October 2001.
CARIDAD M. CAROSELLA, Anti-Money Laundering Compliance Officer since January 2016
Anti-Money Laundering Compliance Officer of the Dreyfus Family of Funds and BNY Mellon Funds Trust since January 2016; from May 2015 to December 2015, Interim Anti-Money Laundering Compliance Officer of the Dreyfus Family of Funds and BNY Mellon Funds Trust and the Distributor; from January 2012 to May 2015, AML Surveillance Officer of the Distributor and from 2007 to December 2011, Financial Processing Manager of the Distributor. She is an officer of 60 investment companies (comprised of 155 portfolios) managed by the Manager. She is 48 years old and has been an employee of the Distributor since 1997.
45
Dreyfus Global Real Return Fund
200 Park Avenue
New York, NY 10166
Manager
The Dreyfus Corporation
200 Park Avenue
New York, NY 10166
Sub-Investment Adviser
Newton Investment Management
(North America) Limited
160 Queen Victoria Street
London, EC4V, 4LA, UK
Custodian
The Bank of New York Mellon
225 Liberty Street
New York, NY 10286
Transfer Agent &
Dividend Disbursing Agent
Dreyfus Transfer, Inc.
200 Park Avenue
New York, NY 10166
Distributor
MBSC Securities Corporation
200 Park Avenue
New York, NY 10166
| | |
Ticker Symbols: | Class A: DRRAX Class C: DRRCX Class I: DRRIX Class Y: DRRYX |
Telephone Call your financial representative or 1-800-DREYFUS
Mail The Dreyfus Family of Funds, 144 Glenn Curtiss Boulevard, Uniondale, NY 11556-0144
E-mail Send your request to info@dreyfus.com
Internet Information can be viewed online or downloaded at www.dreyfus.com
The fund files its complete schedule of portfolio holdings with the Securities and Exchange Commission (“SEC”) for the first and third quarters of each fiscal year on Form N-Q. The fund’s Forms N-Q are available on the SEC’s website at www.sec.gov and may be reviewed and copied at the SEC’s Public Reference Room in Washington, DC. (phone 1-800-SEC-0330 for information).
A description of the policies and procedures that the fund uses to determine how to vote proxies relating to portfolio securities and information regarding how the fund voted these proxies for the most recent 12-month period ended June 30 is available at www.dreyfus.com and on the SEC’s website at www.sec.gov and without charge, upon request, by calling 1-800-DREYFUS.
| | |
© 2016 MBSC Securities Corporation
6278AR1016 | 
|