UNITED STATES
SECURITIES AND EXCHANGE COMMISSION
Washington, D.C. 20549
FORM N-CSR
CERTIFIED SHAREHOLDER REPORT OF REGISTERED MANAGEMENT
INVESTMENT COMPANIES
Investment Company Act file number | 811-07123 |
| |
| Advantage Funds, Inc. | |
| (Exact name of Registrant as specified in charter) | |
| | |
| c/o The Dreyfus Corporation 200 Park Avenue New York, New York 10166 | |
| (Address of principal executive offices) (Zip code) | |
| | |
| Bennett MacDougall, Esq. 200 Park Avenue New York, New York 10166 | |
| (Name and address of agent for service) | |
|
Registrant's telephone number, including area code: | (212) 922-6400 |
| |
Date of fiscal year end: | 08/31 | |
Date of reporting period: | 08/31/2016 | |
| | | | | | | |
The following N-CSR relates only to the Registrant's series listed below and does not affect the other series of the Registrant, which have a different fiscal year end and, therefore, different N-CSR reporting requirements. A separate N-CSR Form will be filed for those series, as appropriate.
Dreyfus Opportunistic Midcap Value Fund
Dreyfus Opportunistic Small Cap Fund
Dreyfus Opportunistic U.S. Stock Fund
Dreyfus Strategic Value Fund
Dreyfus Structured Midcap Fund
Dreyfus Technology Growth Fund
FORM N-CSR
Item 1. Reports to Stockholders.
Dreyfus Opportunistic Midcap Value Fund
| | | |

| | ANNUAL REPORT August 31, 2016 |
| |
Save time. Save paper. View your next shareholder report online as soon as it’s available. Log into www.dreyfus.com and sign up for Dreyfus eCommunications. It’s simple and only takes a few minutes. |
| |
The views expressed in this report reflect those of the portfolio manager only through the end of the period covered and do not necessarily represent the views of Dreyfus or any other person in the Dreyfus organization. Any such views are subject to change at any time based upon market or other conditions and Dreyfus disclaims any responsibility to update such views. These views may not be relied on as investment advice and, because investment decisions for a Dreyfus fund are based on numerous factors, may not be relied on as an indication of trading intent on behalf of any Dreyfus fund. |
| |
Not FDIC-Insured • Not Bank-Guaranteed • May Lose Value |
Contents
T H E F U N D
F O R M O R E I N F O R M AT I O N
Back Cover
| | | | |
| |
Dreyfus Opportunistic Midcap Value Fund
| | The Fund |
A LETTER FROM THE CHIEF EXECUTIVE OFFICER
Dear Shareholder:
We are pleased to present this annual report for Dreyfus Opportunistic Midcap Value Fund, covering the 12-month period from September 1, 2015 through August 31, 2016. For information about how the fund performed during the reporting period, as well as general market perspectives, we provide a Discussion of Fund Performance on the pages that follow.
Despite tumultuous swings in market sentiment stemming from global economic developments, stocks and bonds generally produced strong returns over the reporting period. During the fall of 2015, investors reacted cautiously to sluggish global economic growth, plummeting commodity prices, and the first increase in short-term U.S. interest rates in nearly a decade. These worries sparked particularly sharp declines in equities in January 2016, but investor sentiment soon improved when U.S. monetary policymakers refrained from additional rate hikes, other central banks eased their monetary policies further, and commodity prices rebounded. Stocks mostly rallied over the ensuing months, driving several broad measures of stock market performance to new record highs. In the bond market, aggressively accommodative monetary policies and robust investor demand for current income sent yields of high-quality sovereign bonds lower and their prices higher.
Recently we have seen evidence that investors may be shifting their focus away from macroeconomic influences and toward underlying company and industry fundamentals. This development—along with wide differences in underlying fundamental and technical influences across various asset classes, economic sectors, and regional markets—suggests that selectivity may be a more important determinant of investment success over the months ahead. As always, we encourage you to discuss the implications of our observations with your financial advisor.
Thank you for your continued confidence and support.
Sincerely,

Mark D. Santero
Chief Executive Officer
The Dreyfus Corporation
September 15, 2016
2
DISCUSSION OF FUND PERFORMANCE
For the period from September 1, 2015 through August 31, 2016, as provided by David A. Daglio, James Boyd, and Dale Dutile, Primary Portfolio Managers
Market and Fund Performance Overview
For the 12-month period ended August 31, 2016, Dreyfus Opportunistic Midcap Value Fund’s Class A shares produced a total return of 3.95%, Class C shares returned 3.19%, Class I shares returned 4.23%, and Class Y shares returned 4.40%.1 In comparison, the fund’s benchmark, the Russell Midcap® Value Index (the “Index”), produced a 12.88% total return for the same period.2
Mid-cap value stocks achieved double-digit returns as a rally over the reporting period’s second half more than erased losses from the first half. The fund lagged its benchmark, mainly due to shortfalls in the financials, health care, and consumer discretionary sectors.
The Fund’s Investment Approach
The fund seeks to surpass the performance of the Index by investing in mid-cap companies with market capitalizations between $1 billion and $25 billion at the time of purchase. The fund’s portfolio managers identify potential investments through extensive fundamental and macro research conducted by the team’s dedicated sector specialists and primary portfolio managers.
The fund focuses on individual stock selection to position the fund in stocks priced at a large discount to the portfolio managers’ view of their intrinsic value and a capital allocation discipline guided by market dislocations.
The portfolio managers use an opportunistic value style in selecting stocks in an attempt to benefit from valuation inefficiencies and underappreciated fundamental prospects present in the marketplace. To do this, the portfolio managers use mid-cycle estimates, growth prospects, the identification of a revaluation catalyst, and competitive advantages as some of the factors in the valuation assessment.
Stocks Advanced Strongly Despite Headwinds
Stocks across all capitalization ranges proved volatile over the final months of 2015 as investors grew more averse to risks in light of persistently sluggish global growth. In January 2016, equity markets suffered particularly severe declines due to disappointing economic data in China, plunging commodity prices, and worries that higher short-term U.S. interest rates might weigh on the domestic economic recovery. The markets changed direction in mid-February, as investors responded positively to relatively strong U.S. economic data and better-than-expected corporate earnings. The market rally continued through the spring when monetary policymakers refrained from implementing additional rate hikes, commodity prices rebounded, and foreign currencies strengthened against the U.S. dollar. Although a referendum in the United Kingdom to leave the European Union introduced renewed market turmoil in late June, equity markets bounced back quickly, enabling the Index to post solidly positive returns for the reporting period overall.
Income-Oriented Stocks Led Market’s Advance
In a market environment motivated mainly by changing investor sentiment, companies exhibiting attractive fundamental characteristics were not rewarded to the extent they have been in the past. Investors seeking higher levels of income than were available from high-quality sovereign bonds turned instead to dividend-paying stocks generally in traditionally defensive market sectors, such as utilities and real estate investment trusts (REITs). Consequently, the fund’s security selections lagged market averages.
3
DISCUSSION OF FUND PERFORMANCE (continued)
Results in the financials sector were particularly undermined by low interest rates, which investors worried might weigh on lenders’ profit margins. Consequently, fund holdings E*TRADE Financial and TD Ameritrade Holding underperformed. Meanwhile, residential real estate agency franchisor Realogy Holdings did not benefit as expected from a recovering housing market. In the health care sector, biopharmaceutical developer Vertex Pharmaceuticals was hurt by insurance reimbursement issues surrounding a new product, which dampened demand. Among consumer discretionary companies, office supplies retailer Staples struggled after a proposed merger was not approved by regulators, and kitchenware seller Williams-Sonoma languished when investors disregarded the company’s e-commerce growth opportunities.
The fund produced better relative results in the materials sector, where rebounding commodity prices benefited Newmont Mining and Yamana Gold. In addition, paint manufacturer Valspar was acquired by a former rival, and the fund benefited from favorable timing in the trading of agricultural commodities producer Mosaic. Finally, underweighted exposure to the energy sector enabled the fund to cushion the impact of industry-wide weakness, and a new position in natural gas distributor Cheniere Energy rallied strongly when commodity prices bounced back during the spring. In the industrials sector, water infrastructure components supplier Xylem was rewarded during the market rally for strong fundamentals, and Ingersoll-Rand was bolstered by generally improved investor sentiment.
Maintaining a Focus on Fundamentals
In our analysis, investors are likely to return their focus to underlying company fundamentals as global economic and political conditions stabilize. We have maintained the fund’s research-driven investment approach, which favors mid-cap companies we have identified as having attractive valuations and underappreciated cash flow potential. As of the reporting period’s end, we have identified an ample number of stocks meeting our criteria in the financials, information technology, and industrials sectors, but relatively few in the more richly valued utilities, REITs, and consumer staples sectors.
September 15, 2016
Please note, the position in any security highlighted with italicized typeface was sold during the reporting period.
Equities are subject generally to market, market sector, market liquidity, issuer, and investment style risks, among other factors, to varying degrees, all of which are more fully described in the fund’s prospectus.
Stocks of small- and/or mid-cap companies often experience sharper price fluctuations than stocks of large-cap companies.
1 Total return includes reinvestment of dividends and any capital gains paid and does not take into consideration the maximum initial sales charge in the case of Class A shares, or the applicable contingent deferred sales charge imposed on redemptions in the case of Class C shares. Had these charges been reflected, returns would have been lower. Past performance is no guarantee of future results. Share price and investment return fluctuate such that upon redemption, fund shares may be worth more or less than their original cost.
2 Source: Lipper Inc. — Reflects reinvestment of dividends and, where applicable, capital gain distributions. The Russell Midcap® Value Index is a widely accepted, unmanaged index of medium-cap stock market performance and measures the performance of those Russell mid-cap companies with lower price-to-book ratios and lower forecasted growth values. Investors cannot invest directly in any index.
4
FUND PERFORMANCE
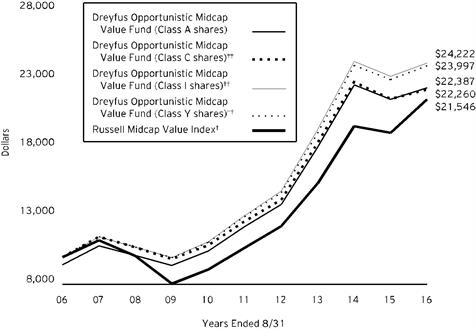
Comparison of change in value of $10,000 investment in Dreyfus Opportunistic Midcap Value Fund Class A shares, Class C shares, Class I shares and Class Y shares and the Russell Midcap Value Index
† Source: Lipper Inc.
†† The total return figures presented for Class C shares of the fund reflect the performance of the fund’s Class A shares for the period prior to 5/30/08 (the inception date for Class C shares), not reflecting the applicable sales charges for Class A shares.
The total return figures presented for Class I shares of the fund reflect the performance of the fund’s Class A shares for the period prior to 5/30/08 (the inception date for Class I shares), not reflecting the applicable sales charges for Class A shares.
The total return figures presented for Class Y shares of the fund reflect the performance of the fund’s Class A shares for the period prior to 7/1/13 (the inception date for Class Y shares), not reflecting the applicable sales charges for Class A shares.
Past performance is not predictive of future performance.
The above graph compares a $10,000 investment made in each of the Class A, Class C, Class I and Class Y shares of Dreyfus Opportunistic Midcap Value Fund on 8/31/06 to a $10,000 investment made in the Russell Midcap Value Index (the “Index”) on that date. All dividends and capital gain distributions are reinvested.
The fund’s performance shown in the line graph above takes into account the maximum initial sales charge on Class A shares and all other applicable fees and expenses on all classes. The Index is a widely accepted, unmanaged index of medium-cap stock market performance and measures the performance of those Russell Midcap companies with lower price-to-book ratios and lower forecasted growth values. Unlike a mutual fund, the Index is not subject to charges, fees and other expenses. Investors cannot invest directly in any index. Further information relating to fund performance, including expense reimbursements, if applicable, is contained in the Financial Highlights section of the prospectus and elsewhere in this report.
5
FUND PERFORMANCE (continued)
| | | | | | | | |
Average Annual Total Returns as of 8/31/16 | | | |
| | Inception
Date | 1 Year | 5 Years | | 10 Years | |
Class A shares | | | | | | |
with maximum sales charge (5.75%) | 9/29/95 | -2.04% | 11.54% | | 8.39% | |
without sales charge | 9/29/95 | 3.95% | 12.87% | | 9.04% | |
Class C shares | | | | | | |
with applicable redemption charge † | 5/30/08 | 2.36% | 12.01% | | 8.33% | †† |
without redemption | 5/30/08 | 3.19% | 12.01% | | 8.33% | †† |
Class I shares | | 5/30/08 | 4.23% | 13.14% | | 9.25% | †† |
Class Y shares | | 7/1/13 | 4.40% | 13.10% | †† | 9.15% | †† |
Russell Midcap Value Index | 12.88% | 15.03% | | 7.98% | |
Past performance is not predictive of future performance. The fund’s performance shown in the graph and table does not reflect the deduction of taxes that a shareholder would pay on fund distributions or the redemption of fund shares. In addition to the performance of Class A shares shown with and without a maximum sales charge, the fund’s performance shown in the table takes into account all other applicable fees and expenses on all classes.
† The maximum contingent deferred sales charge for Class C shares is 1% for shares redeemed within one year of the date of purchase.
†† The total return performance figures presented for Class C shares of the fund reflect the performance of the fund’s Class A shares for the period prior to 5/30/08 (the inception date for Class C shares), not reflecting the applicable sales charges for Class A shares.
The total return performance figures presented for Class I shares of the fund reflect the performance of the fund’s Class A shares for the period prior to 5/30/08 (the inception date for Class I shares), not reflecting the applicable sales charges for Class A shares.
The total return performance figures presented for Class Y shares of the fund reflect the performance of the fund’s Class A shares for the period prior to 7/1/13 (the inception date for Class Y shares), not reflecting the applicable sales charges for Class A shares.
6
UNDERSTANDING YOUR FUND’S EXPENSES (Unaudited)
As a mutual fund investor, you pay ongoing expenses, such as management fees and other expenses. Using the information below, you can estimate how these expenses affect your investment and compare them with the expenses of other funds. You also may pay one-time transaction expenses, including sales charges (loads) and redemption fees, which are not shown in this section and would have resulted in higher total expenses. For more information, see your fund’s prospectus or talk to your financial adviser.
Review your fund’s expenses
The table below shows the expenses you would have paid on a $1,000 investment in Dreyfus Opportunistic Midcap Value Fund from March 1, 2016 to August 31, 2016. It also shows how much a $1,000 investment would be worth at the close of the period, assuming actual returns and expenses.
| | | | | | | | | | | | |
Expenses and Value of a $1,000 Investment | | |
assuming actual returns for the six months ended August 31, 2016 |
| | | | | | | | |
| | | | Class A | Class C | Class I | Class Y |
Expenses paid per $1,000† | | $6.57 | | $10.52 | | $5.00 | | $4.35 |
Ending value (after expenses) | | $1,160.60 | | $1,156.50 | | $1,162.00 | | $1,162.80 |
COMPARING YOUR FUND’S EXPENSES
WITH THOSE OF OTHER FUNDS (Unaudited)
Using the SEC’s method to compare expenses
The Securities and Exchange Commission (SEC) has established guidelines to help investors assess fund expenses. Per these guidelines, the table below shows your fund’s expenses based on a $1,000 investment, assuming a hypothetical 5% annualized return. You can use this information to compare the ongoing expenses (but not transaction expenses or total cost) of investing in the fund with those of other funds. All mutual fund shareholder reports will provide this information to help you make this comparison. Please note that you cannot use this information to estimate your actual ending account balance and expenses paid during the period.
| | | | | | | | | | | | |
Expenses and Value of a $1,000 Investment | | |
assuming a hypothetical 5% annualized return for the six months ended August 31, 2016 |
| | | | | | | | |
| | | | Class A | Class C | Class I | Class Y |
Expenses paid per $1,000† | | $6.14 | | $9.83 | | $4.67 | | $4.06 |
Ending value (after expenses) | | $1,019.05 | | $1,015.38 | | $1,020.51 | | $1,021.11 |
† Expenses are equal to the fund’s annualized expense ratio of 1.21% for Class A, 1.94% for Class C, .92% for Class I and .80% for Class Y, multiplied by the average account value over the period, multiplied by 184/366 (to reflect the one-half year period).
7
STATEMENT OF INVESTMENTS
August 31, 2016
| | | | | | |
| |
Common Stocks - 98.8% | | Shares | | Value ($) | |
Banks - 3.9% | | | | | |
Capital One Financial | | 469,451 | | 33,612,692 | |
First Republic Bank | | 266,446 | | 20,505,684 | |
| | | | | 54,118,376 | |
Capital Goods - 10.4% | | | | | |
HD Supply Holdings | | 1,200,686 | a | 43,356,771 | |
Hubbell | | 364,683 | | 39,498,816 | |
Ingersoll-Rand | | 101,903 | | 6,928,385 | |
Regal Beloit | | 71,400 | | 4,378,962 | |
Snap-on | | 138,639 | | 21,251,972 | |
Textron | | 708,497 | | 28,942,102 | |
| | | | | 144,357,008 | |
Consumer Durables & Apparel - 2.0% | | | | | |
PVH | | 260,455 | | 28,066,631 | |
Consumer Services - 1.7% | | | | | |
Houghton Mifflin Harcourt | | 539,651 | a | 8,607,433 | |
Royal Caribbean Cruises | | 202,377 | | 14,391,028 | |
| | | | | 22,998,461 | |
Diversified Financials - 24.0% | | | | | |
E*TRADE Financial | | 2,214,318 | a | 58,413,709 | |
Intercontinental Exchange | | 149,763 | | 42,236,161 | |
Leucadia National | | 2,711,105 | | 51,917,661 | |
Raymond James Financial | | 710,195 | | 41,312,043 | |
SLM | | 6,196,142 | a | 45,944,393 | |
Synchrony Financial | | 2,273,508 | | 63,271,728 | |
TD Ameritrade Holding | | 867,436 | | 28,508,284 | |
| | | | | 331,603,979 | |
Energy - 2.0% | | | | | |
Cheniere Energy | | 643,468 | a | 27,604,777 | |
Food, Beverage & Tobacco - 2.6% | | | | | |
Archer-Daniels-Midland | | 829,012 | | 36,277,565 | |
Insurance - 4.6% | | | | | |
Assurant | | 310,688 | | 27,822,110 | |
FNF Group | | 959,327 | | 36,157,035 | |
| | | | | 63,979,145 | |
Materials - 5.3% | | | | | |
Mosaic | | 1,634,933 | b | 49,162,435 | |
Newmont Mining | | 262,687 | | 10,045,151 | |
8
| | | | | | |
| |
Common Stocks - 98.8% (continued) | | Shares | | Value ($) | |
Materials - 5.3% (continued) | | | | | |
Potash Corp of Saskatchewan | | 740,411 | | 13,401,439 | |
| | | | | 72,609,025 | |
Media - 3.2% | | | | | |
CBS, Cl. B | | 777,191 | | 39,660,057 | |
Sinclair Broadcast Group, Cl. A | | 179,551 | | 5,113,613 | |
| | | | | 44,773,670 | |
Pharmaceuticals, Biotechnology & Life Sciences - 8.2% | | | | | |
Agilent Technologies | | 347,175 | | 16,310,282 | |
Akorn | | 1,061,852 | a | 28,585,056 | |
Jazz Pharmaceuticals | | 248,645 | a | 30,789,710 | |
Mylan | | 882,419 | a | 37,379,269 | |
| | | | | 113,064,317 | |
Retailing - 6.7% | | | | | |
Bed Bath & Beyond | | 123,437 | | 5,723,774 | |
LKQ | | 574,785 | a | 20,743,991 | |
Staples | | 4,562,931 | | 39,058,689 | |
Tiffany & Co. | | 88,072 | b | 6,285,699 | |
Williams-Sonoma | | 392,799 | b | 20,676,939 | |
| | | | | 92,489,092 | |
Semiconductors & Semiconductor Equipment - 2.8% | | | | | |
Maxim Integrated Products | | 553,810 | | 22,551,143 | |
United Microelectronics, ADR | | 9,051,076 | | 16,835,001 | |
| | | | | 39,386,144 | |
Software & Services - 5.5% | | | | | |
Broadridge Financial Solutions | | 207,223 | | 14,360,554 | |
CommVault Systems | | 161,815 | a | 8,339,945 | |
eBay | | 538,055 | a | 17,303,849 | |
First Data, Cl. A | | 1,067,844 | a | 14,864,389 | |
Fortinet | | 216,155 | a | 7,811,842 | |
Intuit | | 115,157 | | 12,834,248 | |
| | | | | 75,514,827 | |
Technology Hardware & Equipment - 10.4% | | | | | |
Amphenol, Cl. A | | 377,784 | | 23,539,721 | |
Ciena | | 1,147,071 | a | 24,604,673 | |
Corning | | 1,133,565 | | 25,720,590 | |
FEI | | 74,374 | | 7,918,600 | |
FLIR Systems | | 470,439 | | 14,503,634 | |
Hewlett Packard Enterprise | | 356,986 | | 7,668,059 | |
Keysight Technologies | | 867,671 | a | 26,403,229 | |
9
STATEMENT OF INVESTMENTS (continued)
| | | | | | |
| |
Common Stocks - 98.8% (continued) | | Shares | | Value ($) | |
Technology Hardware & Equipment - 10.4% (continued) | | | | | |
Viavi Solutions | | 1,749,503 | a | 13,611,133 | |
| | | | | 143,969,639 | |
Transportation - 3.8% | | | | | |
Hertz Global Holdings | | 465,089 | a | 22,910,284 | |
Norfolk Southern | | 311,570 | | 29,256,423 | |
| | | | | 52,166,707 | |
Utilities - 1.7% | | | | | |
Calpine | | 1,888,355 | a | 23,566,670 | |
Total Common Stocks (cost $1,234,686,670) | | | | 1,366,546,033 | |
Master Limited Partnership - .8% | | | | | |
Diversified Financials - .8% | | | | | |
Blackstone Group LP
(cost $8,242,659) | | 403,456 | | 11,062,764 | |
Other Investment - .2% | | | | | |
Registered Investment Company; | | | | | |
Dreyfus Institutional Preferred Government Plus Money Market Fund
(cost $3,006,949) | | 3,006,949 | c | 3,006,949 | |
Investment of Cash Collateral for Securities Loaned - 1.3% | | | | | |
Registered Investment Company; | | | | | |
Dreyfus Institutional Cash Advantage Fund, Institutional Shares
(cost $18,406,000) | | 18,406,000 | c | 18,406,000 | |
Total Investments (cost $1,264,342,278) | | 101.1% | | 1,399,021,746 | |
Liabilities, Less Cash and Receivables | | (1.1%) | | (15,446,762) | |
Net Assets | | 100.0% | | 1,383,574,984 | |
ADR—American Depository Receipt
LP—Limited Partnership
a Non-income producing security.
b Security, or portion thereof, on loan. At August 31, 2016, the value of the fund’s securities on loan was $75,059,390 and the value of the collateral held by the fund was $77,660,493, consisting of cash collateral of $18,406,000 and U.S. Government & Agency securities valued at $59,254,493.
c Investment in affiliated money market mutual fund.
10
| | |
Portfolio Summary (Unaudited) † | Value (%) |
Diversified Financials | 24.8 |
Capital Goods | 10.4 |
Technology Hardware & Equipment | 10.4 |
Pharmaceuticals, Biotechnology & Life Sciences | 8.2 |
Retailing | 6.7 |
Software & Services | 5.5 |
Materials | 5.3 |
Insurance | 4.6 |
Banks | 3.9 |
Transportation | 3.8 |
Media | 3.2 |
Semiconductors & Semiconductor Equipment | 2.8 |
Food, Beverage & Tobacco | 2.6 |
Consumer Durables & Apparel | 2.0 |
Energy | 2.0 |
Consumer Services | 1.7 |
Utilities | 1.7 |
Money Market Investments | 1.5 |
| | 101.1 |
† Based on net assets.
See notes to financial statements.
11
STATEMENT OF ASSETS AND LIABILITIES
August 31, 2016
| | | | | | | |
| | | | | | |
| | | Cost | | Value | |
Assets ($): | | | | |
Investments in securities—See Statement of Investments
(including securities on loan, valued at $75,059,390)—Note 1(b): | | | | |
Unaffiliated issuers | | 1,242,929,329 | | 1,377,608,797 | |
Affiliated issuers | | 21,412,949 | | 21,412,949 | |
Cash | | | | | 176,378 | |
Receivable for investment securities sold | | | | | 14,477,199 | |
Dividends and securities lending income receivable | | | | | 1,349,385 | |
Receivable for shares of Common Stock subscribed | | | | | 318,490 | |
Prepaid expenses | | | | | 73,411 | |
| | | | | 1,415,416,609 | |
Liabilities ($): | | | | |
Due to The Dreyfus Corporation and affiliates—Note 3(c) | | | | | 1,201,323 | |
Liability for securities on loan—Note 1(b) | | | | | 18,406,000 | |
Payable for investment securities purchased | | | | | 9,939,865 | |
Payable for shares of Common Stock redeemed | | | | | 1,863,118 | |
Interest payable—Note 2 | | | | | 3,447 | |
Accrued expenses | | | | | 427,872 | |
| | | | | 31,841,625 | |
Net Assets ($) | | | 1,383,574,984 | |
Composition of Net Assets ($): | | | | |
Paid-in capital | | | | | 1,232,798,901 | |
Accumulated undistributed investment income—net | | | | | 1,905,676 | |
Accumulated net realized gain (loss) on investments | | | | | 14,190,939 | |
Accumulated net unrealized appreciation (depreciation)
on investments | | | | | 134,679,468 | |
Net Assets ($) | | | 1,383,574,984 | |
| | | | | | |
Net Asset Value Per Share | Class A | Class C | Class I | Class Y | |
Net Assets ($) | 796,685,948 | 76,886,464 | 492,694,132 | 17,308,440 | |
Shares Outstanding | 25,118,651 | 2,681,261 | 15,569,904 | 545,740 | |
Net Asset Value Per Share ($) | 31.72 | 28.68 | 31.64 | 31.72 | |
See notes to financial statements.
12
STATEMENT OF OPERATIONS
Year Ended August 31, 2016
| | | | | | | |
| | | | | | |
| | | | | | |
Investment Income ($): | | | | |
Income: | | | | |
Cash dividends (net of $249,173 foreign taxes withheld at source): | | | | |
Unaffiliated issuers | | | 20,632,206 | |
Affiliated issuers | | | 25,482 | |
Income from securities lending—Note 1(b) | | | 101,886 | |
Total Income | | | 20,759,574 | |
Expenses: | | | | |
Management fee—Note 3(a) | | | 11,932,283 | |
Shareholder servicing costs—Note 3(c) | | | 4,692,469 | |
Distribution fees—Note 3(b) | | | 668,265 | |
Prospectus and shareholders’ reports | | | 137,909 | |
Custodian fees—Note 3(c) | | | 120,828 | |
Directors’ fees and expenses—Note 3(d) | | | 113,603 | |
Registration fees | | | 94,827 | |
Professional fees | | | 75,565 | |
Loan commitment fees—Note 2 | | | 24,609 | |
Interest expense—Note 2 | | | 12,574 | |
Miscellaneous | | | 43,518 | |
Total Expenses | | | 17,916,450 | |
Less—reduction in fees due to earnings credits—Note 3(c) | | | (2,968) | |
Net Expenses | | | 17,913,482 | |
Investment Income—Net | | | 2,846,092 | |
Realized and Unrealized Gain (Loss) on Investments—Note 4 ($): | | |
Net realized gain (loss) on investments | 33,387,974 | a |
Net unrealized appreciation (depreciation) on investments | | | (9,528,738) | |
Net Realized and Unrealized Gain (Loss) on Investments | | | 23,859,236 | |
Net Increase in Net Assets Resulting from Operations | | 26,705,328 | |
| | | | | | | |
a Includes net realized gain of $10,278,766 for securities redeemed-in-kind. |
See notes to financial statements.
13
STATEMENT OF CHANGES IN NET ASSETS
| | | | | | | | | | |
| | | | Year Ended August 31, |
| | | | 2016 | | | | 2015 | |
Operations ($): | | | | | | | | |
Investment income—net | | | 2,846,092 | | | | 1,009,372 | |
Net realized gain (loss) on investments | | 33,387,974 | | | | 364,285,092 | |
Net unrealized appreciation (depreciation)
on investments | | (9,528,738) | | | | (490,058,264) | |
Net Increase (Decrease) in Net Assets
Resulting from Operations | 26,705,328 | | | | (124,763,800) | |
Dividends to Shareholders from ($): | | | | | | | | |
Investment income—net: | | | | | | | | |
Class A | | | - | | | | (1,486,128) | |
Class I | | | (378,487) | | | | (3,415,093) | |
Class Y | | | (201,480) | | | | (95,271) | |
Net realized gain on investments: | | | | | | | | |
Class A | | | (163,514,213) | | | | (134,482,192) | |
Class C | | | (18,133,204) | | | | (12,676,901) | |
Class I | | | (95,819,995) | | | | (101,601,362) | |
Class Y | | | (12,858,708) | | | | (2,100,596) | |
Total Dividends | | | (290,906,087) | | | | (255,857,543) | |
Capital Stock Transactions ($): | | | | | | | | |
Net proceeds from shares sold: | | | | | | | | |
Class A | | | 144,471,285 | | | | 325,561,801 | |
Class C | | | 9,703,250 | | | | 32,333,148 | |
Class I | | | 141,009,615 | | | | 491,709,342 | |
Class Y | | | 9,901,433 | | | | 74,744,792 | |
Dividends reinvested: | | | | | | | | |
Class A | | | 148,969,232 | | | | 125,099,846 | |
Class C | | | 14,641,322 | | | | 9,693,034 | |
Class I | | | 88,032,264 | | | | 96,450,364 | |
Class Y | | | 12,714,335 | | | | 1,960,207 | |
Cost of shares redeemed: | | | | | | | | |
Class A | | | (424,844,330) | | | | (610,472,279) | |
Class C | | | (46,692,551) | | | | (20,205,410) | |
Class I | | | (562,111,303) | | | | (788,832,838) | |
Class Y | | | (69,663,961) | | | | (15,214,634) | |
Increase (Decrease) in Net Assets
from Capital Stock Transactions | (533,869,409) | | | | (277,172,627) | |
Total Increase (Decrease) in Net Assets | (798,070,168) | | | | (657,793,970) | |
Net Assets ($): | | | | | | | | |
Beginning of Period | | | 2,181,645,152 | | | | 2,839,439,122 | |
End of Period | | | 1,383,574,984 | | | | 2,181,645,152 | |
Undistributed investment income—net | 1,905,676 | | | | 576,363 | |
14
| | | | | | | | | | |
| | | | Year Ended August 31, |
| | | | 2016 | | | | 2015 | |
Capital Share Transactions (Shares): | | | | | | | | |
Class A | | | | | | | | |
Shares sold | | | 4,722,794 | | | | 8,137,340 | |
Shares issued for dividends reinvested | | | 5,163,578 | | | | 3,215,108 | |
Shares redeemed | | | (13,754,633) | | | | (15,199,740) | |
Net Increase (Decrease) in Shares Outstanding | (3,868,261) | | | | (3,847,292) | |
Class Ca | | | | | | | | |
Shares sold | | | 346,788 | | | | 866,037 | |
Shares issued for dividends reinvested | | | 558,402 | | | | 267,394 | |
Shares redeemed | | | (1,629,615) | | | | (543,447) | |
Net Increase (Decrease) in Shares Outstanding | (724,425) | | | | 589,984 | |
Class Ia | | | | | | | | |
Shares sold | | | 4,618,348 | | | | 12,271,844 | |
Shares issued for dividends reinvested | | | 3,065,191 | | | | 2,493,547 | |
Shares redeemedb | | | (16,927,149) | | | | (19,773,668) | |
Net Increase (Decrease) in Shares Outstanding | (9,243,610) | | | | (5,008,277) | |
Class Y | | | | | | | | |
Shares sold | | | 335,763 | | | | 1,897,175 | |
Shares issued for dividends reinvested | | | 442,084 | | | | 50,573 | |
Shares redeemed | | | (2,381,985) | | | | (380,984) | |
Net Increase (Decrease) in Shares Outstanding | (1,604,138) | | | | 1,566,764 | |
| | | | | | | | | | |
a | During the period ended August 31, 2016, 164 Class C shares representing $5,387 were exchanged for 152 Class I shares. | |
b | During the period ended August 31, 2016, 6,020,293 shares amounting to $216,790,748 were redeemed-in-kind resulting in a net realized gain on investments of $10,278,766. | |
See notes to financial statements.
15
FINANCIAL HIGHLIGHTS
The following tables describe the performance for each share class for the fiscal periods indicated. All information (except portfolio turnover rate) reflects financial results for a single fund share. Total return shows how much your investment in the fund would have increased (or decreased) during each period, assuming you had reinvested all dividends and distributions. These figures have been derived from the fund’s financial statements.
| | | | | | | | | | |
| | | | | | |
| | |
| | Year Ended August 31, |
Class A Shares | | | 2016 | 2015 | 2014 | 2013 | 2012 |
Per Share Data ($): | | | | | | | |
Net asset value, beginning of period | | | 36.97 | 43.17 | 38.27 | 29.47 | 31.19 |
Investment Operations: | | | | | | | |
Investment income (loss)—net a | | | .03 | (.02) | .05 | .03 | .07 |
Net realized and unrealized gain (loss)
on investments | | | .82 | (1.79) | 9.10 | 8.83 | 3.34 |
Total from Investment Operations | | | .85 | (1.81) | 9.15 | 8.86 | 3.41 |
Distributions: | | | | | | | |
Dividends from investment income—net | | | - | (.05) | - | (.06) | (.23) |
Dividends from net realized gain
on investments | | | (6.10) | (4.34) | (4.25) | - | (4.90) |
Total Distributions | | | (6.10) | (4.39) | (4.25) | (.06) | (5.13) |
Net asset value, end of period | | | 31.72 | 36.97 | 43.17 | 38.27 | 29.47 |
Total Return (%)b | | | 3.95 | (4.72) | 25.32 | 30.11 | 13.44 |
Ratios/Supplemental Data (%): | | | | | | | |
Ratio of total expenses to
average net assets | | | 1.21 | 1.18 | 1.15 | 1.18 | 1.22 |
Ratio of net expenses to
average net assets | | | 1.21 | 1.18 | 1.15 | 1.18 | 1.22 |
Ratio of net investment income (loss) to
average net assets | | | .11 | (.05) | .12 | .08 | .25 |
Portfolio Turnover Rate | | | 101.68 | 74.05 | 67.49 | 91.31 | 71.25 |
Net Assets, end of period ($ x 1,000) | | | 796,686 | 1,071,713 | 1,417,535 | 1,079,346 | 979,628 |
a Based on average shares outstanding.
b Exclusive of sales charge.
See notes to financial statements.
16
| | | | | | | | | | |
| | | | | | |
| | | | |
| | | | Year Ended August 31, |
Class C Shares | | | 2016 | 2015 | 2014 | 2013 | 2012 |
Per Share Data ($): | | | | | | | |
Net asset value, beginning of period | | | 34.26 | 40.55 | 36.44 | 28.22 | 30.24 |
Investment Operations: | | | | | | | |
Investment (loss)—net a | | | (.18) | (.29) | (.26) | (.24) | (.16) |
Net realized and unrealized gain (loss)
on investments | | | .70 | (1.66) | 8.62 | 8.46 | 3.20 |
Total from Investment Operations | | | .52 | (1.95) | 8.36 | 8.22 | 3.04 |
Distributions: | | | | | | | |
Dividends from investment income—net | | | - | - | - | - | (.16) |
Dividends from net realized gain
on investments | | | (6.10) | (4.34) | (4.25) | - | (4.90) |
Total Distributions | | | (6.10) | (4.34) | (4.25) | - | (5.06) |
Net asset value, end of period | | | 28.68 | 34.26 | 40.55 | 36.44 | 28.22 |
Total Return (%)b | | | 3.19 | (5.41) | 24.35 | 29.13 | 12.48 |
Ratios/Supplemental Data (%): | | | | | | | |
Ratio of total expenses to
average net assets | | | 1.94 | 1.90 | 1.92 | 1.97 | 2.03 |
Ratio of net expenses to
average net assets | | | 1.94 | 1.90 | 1.92 | 1.97 | 2.03 |
Ratio of net investment (loss) to
average net assets | | | (.62) | (.77) | (.66) | (.72) | (.56) |
Portfolio Turnover Rate | | | 101.68 | 74.05 | 67.49 | 91.31 | 71.25 |
Net Assets, end of period ($ x 1,000) | | | 76,886 | 116,683 | 114,179 | 46,708 | 22,538 |
a Based on average shares outstanding.
b Exclusive of sales charge.
See notes to financial statements.
17
FINANCIAL HIGHLIGHTS (continued)
| | | | | | | | | |
| | | | | | |
| | | | |
| | | | Year Ended August 31, |
Class I Shares | | | 2016 | 2015 | 2014 | 2013 | 2012 |
Per Share Data ($): | | | | | | | |
Net asset value, beginning of period | | | 36.83 | 43.01 | 38.12 | 29.38 | 31.21 |
Investment Operations: | | | | | | | |
Investment income—neta | | | .12 | .09 | .15 | .10 | .14 |
Net realized and unrealized gain (loss)
on investments | | | .81 | (1.78) | 9.07 | 8.77 | 3.32 |
Total from Investment Operations | | | .93 | (1.69) | 9.22 | 8.87 | 3.46 |
Distributions: | | | | | | | |
Dividends from investment income—net | | | (.02) | (.15) | (.08) | (.13) | (.39) |
Dividends from net realized gain
on investments | | | (6.10) | (4.34) | (4.25) | - | (4.90) |
Total Distributions | | | (6.12) | (4.49) | (4.33) | (.13) | (5.29) |
Net asset value, end of period | | | 31.64 | 36.83 | 43.01 | 38.12 | 29.38 |
Total Return (%) | | | 4.23 | (4.43) | 25.62 | 30.26 | 13.71 |
Ratios/Supplemental Data (%): | | | | | | | |
Ratio of total expenses to
average net assets | | | .90 | .89 | .90 | .97 | 1.00 |
Ratio of net expenses to
average net assets | | | .90 | .89 | .90 | .97 | 1.00 |
Ratio of net investment income to
average net assets | | | .39 | .22 | .37 | .27 | .48 |
Portfolio Turnover Rate | | | 101.68 | 74.05 | 67.49 | 91.31 | 71.25 |
Net Assets, end of period ($ x 1,000) | | | 492,694 | 913,852 | 1,282,578 | 856,830 | 155,210 |
a Based on average shares outstanding.
See notes to financial statements.
18
| | | | | | | | |
| | | | | | |
| | | | |
| | | | Year Ended August 31, |
Class Y Shares | | 2016 | 2015 | 2014 | 2013a |
Per Share Data ($): | | | | | |
Net asset value, beginning of period | | 36.93 | 43.12 | 38.12 | 37.48 |
Investment Operations: | | | | | |
Investment income—netb | | .16 | .13 | .19 | .02 |
Net realized and unrealized gain (loss) on investments | | .83 | (1.78) | 9.17 | .62 |
Total from Investment Operations | | .99 | (1.65) | 9.36 | .64 |
Distributions: | | | | | |
Dividends from investment income—net | | (.10) | (.20) | (.11) | - |
Dividends from net realized gain on investments | | (6.10) | (4.34) | (4.25) | - |
Total Distributions | | (6.20) | (4.54) | (4.36) | - |
Net asset value, end of period | | 31.72 | 36.93 | 43.12 | 38.12 |
Total Return (%) | | 4.40 | (4.34) | 26.02 | 1.74c |
Ratios/Supplemental Data (%): | | | | | |
Ratio of total expenses to average net assets | | .78 | .80 | .83 | .80d |
Ratio of net expenses to average net assets | | .78 | .80 | .83 | .80d |
Ratio of net investment income to average net assets | | .53 | .30 | .50 | .33d |
Portfolio Turnover Rate | | 101.68 | 74.05 | 67.49 | 91.31 |
Net Assets, end of period ($ x 1,000) | | 17,308 | 79,397 | 25,147 | 1 |
a From July 1, 2013 (commencement of initial offering) to August 31, 2013.
b Based on average shares outstanding.
c Not annualized.
d Annualized.
See notes to financial statements.
19
NOTES TO FINANCIAL STATEMENTS
NOTE 1—Significant Accounting Policies:
Dreyfus Opportunistic Midcap Value Fund (the “fund”) is a separate diversified series of Advantage Funds, Inc. (the “Company”), which is registered under the Investment Company Act of 1940, as amended (the “Act”), as an open-end management investment company and operates as a series company currently offering ten series, including the fund. The fund’s investment objective is to seek to surpass the performance of the Russell Midcap® Value Index. The Dreyfus Corporation (the “Manager” or “Dreyfus”), a wholly-owned subsidiary of The Bank of New York Mellon Corporation (“BNY Mellon”), serves as the fund’s investment adviser.
MBSC Securities Corporation (the “Distributor”), a wholly-owned subsidiary of Dreyfus, is the distributor of the fund’s shares. The fund is authorized to issue 700 million shares of $.001 par value Common Stock. The fund currently offers four classes of shares: Class A (350 million shares authorized), Class C (125 million shares authorized), Class I (125 million shares authorized) and Class Y (100 million shares authorized). Class A shares generally are subject to a sales charge imposed at the time of purchase. Class C shares are subject to a contingent deferred sales charge (“CDSC”) imposed on Class C shares redeemed within one year of purchase. Class I and Class Y shares are sold at net asset value per share generally to institutional investors. Other differences between the classes include the services offered to and the expenses borne by each class, the allocation of certain transfer agency costs, and certain voting rights. Income, expenses (other than expenses attributable to a specific class), and realized and unrealized gains or losses on investments are allocated to each class of shares based on its relative net assets.
The Company accounts separately for the assets, liabilities and operations of each series. Expenses directly attributable to each series are charged to that series’ operations; expenses which are applicable to all series are allocated among them on a pro rata basis.
The Financial Accounting Standards Board (“FASB”) Accounting Standards Codification (“ASC”) is the exclusive reference of authoritative U.S. generally accepted accounting principles (“GAAP”) recognized by the FASB to be applied by nongovernmental entities. Rules and interpretive releases of the Securities and Exchange Commission (“SEC”) under authority of federal laws are also sources of authoritative GAAP for SEC registrants. The fund’s financial statements are prepared in accordance with GAAP, which may require the use of management estimates and assumptions. Actual results could differ from those estimates.
20
The Company enters into contracts that contain a variety of indemnifications. The fund’s maximum exposure under these arrangements is unknown. The fund does not anticipate recognizing any loss related to these arrangements.
(a) Portfolio valuation: The fair value of a financial instrument is the amount that would be received to sell an asset or paid to transfer a liability in an orderly transaction between market participants at the measurement date (i.e., the exit price). GAAP establishes a fair value hierarchy that prioritizes the inputs of valuation techniques used to measure fair value. This hierarchy gives the highest priority to unadjusted quoted prices in active markets for identical assets or liabilities (Level 1 measurements) and the lowest priority to unobservable inputs (Level 3 measurements).
Additionally, GAAP provides guidance on determining whether the volume and activity in a market has decreased significantly and whether such a decrease in activity results in transactions that are not orderly. GAAP requires enhanced disclosures around valuation inputs and techniques used during annual and interim periods.
Various inputs are used in determining the value of the fund’s investments relating to fair value measurements. These inputs are summarized in the three broad levels listed below:
Level 1—unadjusted quoted prices in active markets for identical investments.
Level 2—other significant observable inputs (including quoted prices for similar investments, interest rates, prepayment speeds, credit risk, etc.).
Level 3—significant unobservable inputs (including the fund’s own assumptions in determining the fair value of investments).
The inputs or methodology used for valuing securities are not necessarily an indication of the risk associated with investing in those securities.
Changes in valuation techniques may result in transfers in or out of an assigned level within the disclosure hierarchy. Valuation techniques used to value the fund’s investments are as follows:
Investments in securities are valued at the last sales price on the securities exchange or national securities market on which such securities are primarily traded. Securities listed on the National Market System for which market quotations are available are valued at the official closing price or, if there is no official closing price that day, at the last sales price. For open short positions, asked prices are used for valuation purposes. Bid price is
21
NOTES TO FINANCIAL STATEMENTS (continued)
used when no asked price is available. Registered investment companies that are not traded on an exchange are valued at their net asset value. All of the preceding securities are generally categorized within Level 1 of the fair value hierarchy.
Securities not listed on an exchange or the national securities market, or securities for which there were no transactions, are valued at the average of the most recent bid and asked prices. These securities are generally categorized within Level 2 of the fair value hierarchy.
Fair valuing of securities may be determined with the assistance of a pricing service using calculations based on indices of domestic securities and other appropriate indicators, such as prices of relevant ADRs and financial futures. Utilizing these techniques may result in transfers between Level 1 and Level 2 of the fair value hierarchy.
When market quotations or official closing prices are not readily available, or are determined not to reflect accurately fair value, such as when the value of a security has been significantly affected by events after the close of the exchange or market on which the security is principally traded (for example, a foreign exchange or market), but before the fund calculates its net asset value, the fund may value these investments at fair value as determined in accordance with the procedures approved by the Company’s Board of Directors (the “Board”). Certain factors may be considered when fair valuing investments such as: fundamental analytical data, the nature and duration of restrictions on disposition, an evaluation of the forces that influence the market in which the securities are purchased and sold, and public trading in similar securities of the issuer or comparable issuers. These securities are either categorized within Level 2 or 3 of the fair value hierarchy depending on the relevant inputs used.
For restricted securities where observable inputs are limited, assumptions about market activity and risk are used and are generally categorized within Level 3 of the fair value hierarchy.
The following is a summary of the inputs used as of August 31, 2016 in valuing the fund’s investments:
22
| | | | | | |
| | Level 1 -
Unadjusted
Quoted Prices | Level 2 - Other
Significant
Observable
Inputs | Level 3
-Significant
Unobservable
Inputs | Total |
Assets ($) | | | | |
Investments in Securities: | | | |
Equity Securities - Domestic Common Stocks† | 1,336,309,593 | - | - | 1,336,309,593 |
Equity Securities - Foreign Common Stocks† | 30,236,440 | - | - | 30,236,440 |
Master Limited Partnership† | 11,062,764 | - | - | 11,062,764 |
Mutual Funds | 21,412,949 | - | - | 21,412,949 |
† See Statement of Investments for additional detailed categorizations.
At August 31, 2016, there were no transfers between levels of the fair value hierarchy.
(b) Securities transactions and investment income: Securities transactions are recorded on a trade date basis. Realized gains and losses from securities transactions are recorded on the identified cost basis. Dividend income is recognized on the ex-dividend date and interest income, including, where applicable, accretion of discount and amortization of premium on investments, is recognized on the accrual basis.
Pursuant to a securities lending agreement with The Bank of New York Mellon, a subsidiary of BNY Mellon and an affiliate of Dreyfus, the fund may lend securities to qualified institutions. It is the fund’s policy that, at origination, all loans are secured by collateral of at least 102% of the value of U.S. securities loaned and 105% of the value of foreign securities loaned. Collateral equivalent to at least 100% of the market value of securities on loan is maintained at all times. Collateral is either in the form of cash, which can be invested in certain money market mutual funds managed by Dreyfus, or U.S. Government and Agency securities. The fund is entitled to receive all dividends, interest and distributions on securities loaned, in addition to income earned as a result of the lending transaction. Should a borrower fail to return the securities in a timely manner, The Bank of New York Mellon is required to replace the securities for the benefit of the fund or credit the fund with the market value of the unreturned securities and is subrogated to the fund’s rights against the borrower and the collateral. Additionally, the contractual maturity of security lending transactions are on an overnight and continuous basis. During the period ended August 31, 2016, The Bank of New York Mellon
23
NOTES TO FINANCIAL STATEMENTS (continued)
earned $26,161 from lending portfolio securities, pursuant to the securities lending agreement.
(c) Affiliated issuers: Investments in other investment companies advised by Dreyfus are defined as “affiliated” under the Act. Investments in affiliated investment companies during the period ended August 31, 2016 were as follows:
| | | | | | |
Affiliated Investment Company | Value 8/31/2015 ($) | Purchases ($) | Sales ($) | Value 8/31/2016 ($) | Net
Assets (%) |
Dreyfus Institutional Cash Advantage Fund, Institutional Shares | - | 318,655,347 | 300,249,347 | 18,406,000 | 1.3 |
Dreyfus Institutional Preferred Government Plus Money Market Fund† | 18,497,781 | 607,535,248 | 623,026,080 | 3,006,949 | .2 |
Total | 18,497,781 | 926,190,595 | 923,275,427 | 21,412,949 | 1.5 |
† Formerly Dreyfus Institutional Preferred Plus Money Market Fund.
(d) Dividends to shareholders: Dividends are recorded on the ex-dividend date. Dividends from investment income-net and dividends from net realized capital gains, if any, are normally declared and paid annually, but the fund may make distributions on a more frequent basis to comply with the distribution requirements of the Internal Revenue Code of 1986, as amended (the “Code”). To the extent that net realized capital gains can be offset by capital loss carryovers, it is the policy of the fund not to distribute such gains. Income and capital gain distributions are determined in accordance with income tax regulations, which may differ from GAAP.
(e) Federal income taxes: It is the policy of the fund to continue to qualify as a regulated investment company, if such qualification is in the best interests of its shareholders, by complying with the applicable provisions of the Code, and to make distributions of taxable income sufficient to relieve it from substantially all federal income and excise taxes.
As of and during the period ended August 31, 2016, the fund did not have any liabilities for any uncertain tax positions. The fund recognizes interest and penalties, if any, related to uncertain tax positions as income tax expense in the Statement of Operations. During the period ended August 31, 2016, the fund did not incur any interest or penalties.
24
Each tax year in the four–year period ended August 31, 2016 remains subject to examination by the Internal Revenue Service and state taxing authorities.
At August 31, 2016, the components of accumulated earnings on a tax basis were as follows: undistributed ordinary income $1,905,676, undistributed capital gains $43,085,187 and unrealized appreciation $105,785,220.
The tax character of distributions paid to shareholders during the fiscal periods ended August 31, 2016 and August 31, 2015 were as follows: ordinary income $27,165,334 and $68,462,559, and long-term capital gains $263,740,753 and $187,394,984, respectively.
During the period ended August 31, 2016, as a result of permanent book to tax differences, primarily due to the tax treatment for gains from redemptions-in-kind, dividend reclassification and limited partnerships, the fund decreased accumulated undistributed investment income-net by $936,812, decreased accumulated net realized gain (loss) on investments by $9,341,954 and increased paid-in-capital by $10,278,766. Net assets and net asset value per share were not affected by this reclassification.
NOTE 2—Bank Lines of Credit:
The fund participates with other Dreyfus-managed funds in a $555 million unsecured credit facility led by Citibank, N.A. and a $300 million unsecured credit facility provided by The Bank of New York Mellon (each, a “Facility”), each to be utilized primarily for temporary or emergency purposes, including the financing of redemptions. Prior to January 11, 2016, the unsecured credit facility with Citibank, N.A. was $480 million and prior to October 7, 2015, the unsecured credit facility with Citibank, N.A. was $430 million. In connection therewith, the fund has agreed to pay its pro rata portion of commitment fees for each Facility. Interest is charged to the fund based on rates determined pursuant to the terms of the respective Facility at the time of borrowing.
The average amount of borrowings outstanding under the Facilities during the period ended August 31, 2016, was approximately $938,500 with a related weighted average annualized interest rate of 1.34%.
NOTE 3—Management Fee and Other Transactions with Affiliates:
(a) Pursuant to a management agreement with Dreyfus, the management fee is computed at the annual rate of .75% of the value of the fund's average daily net assets and is payable monthly.
25
NOTES TO FINANCIAL STATEMENTS (continued)
During the period ended August 31, 2016, the Distributor retained $12,621 from commissions earned on sales of the fund’s Class A shares and $16,608 from CDSCs on redemptions of the fund’s Class C shares.
(b) Under the Distribution Plan adopted pursuant to Rule 12b-1 under the Act, Class C shares pay the Distributor for distributing its shares at an annual rate of .75% of the value of its average daily net assets. During the period ended August 31, 2016, Class C shares were charged $668,265 pursuant to the Distribution Plan.
(c) Under the Shareholder Services Plan, Class A and Class C shares pay the Distributor at an annual rate of .25% of the value of their average daily net assets for the provision of certain services. The services provided may include personal services relating to shareholder accounts, such as answering shareholder inquiries regarding the fund and providing reports and other information, and services related to the maintenance of shareholder accounts. The Distributor may make payments to Service Agents (securities dealers, financial institutions or other industry professionals) with respect to these services. The Distributor determines the amounts to be paid to Service Agents. During the period ended August 31, 2016, Class A and Class C shares were charged $2,213,375 and $222,755, respectively, pursuant to the Shareholder Services Plan.
The fund has arrangements with the transfer agent and the custodian whereby the fund may receive earnings credits when positive cash balances are maintained, which are used to offset transfer agency and custody fees. For financial reporting purposes, the fund includes net earnings credits as an expense offset in the Statement of Operations.
The fund compensates Dreyfus Transfer, Inc., a wholly-owned subsidiary of Dreyfus, under a transfer agency agreement for providing transfer agency and cash management services for the fund. The majority of transfer agency fees are comprised of amounts paid on a per account basis, while cash management fees are related to fund subscriptions and redemptions. During the period ended August 31, 2016, the fund was charged $113,500 for transfer agency services and $8,667 for cash management services. These fees are included in Shareholder servicing costs in the Statement of Operations. Cash management fees were partially offset by earnings credits of $2,968.
The fund compensates The Bank of New York Mellon under a custody agreement for providing custodial services for the fund. These fees are determined based on net assets, geographic region and transaction activity. During the period ended August 31, 2016, the fund was charged $120,828 pursuant to the custody agreement.
26
During the period ended August 31, 2016, the fund was charged $9,967 for services performed by the Chief Compliance Officer and his staff.
The components of “Due to The Dreyfus Corporation and affiliates” in the Statement of Assets and Liabilities consist of: management fees $881,059, Distribution Plan fees $49,277, Shareholder Services Plan fees $185,931, custodian fees $56,761, Chief Compliance Officer fees $6,416 and transfer agency fees $21,879.
(d) Each Board member also serves as a Board member of other funds within the Dreyfus complex. Annual retainer fees and attendance fees are allocated to each fund based on net assets.
NOTE 4—Securities Transactions:
The aggregate amount of purchases and sales of investment securities, excluding short-term securities, during the period ended August 31, 2016, amounted to $1,622,742,543 and $2,433,874,350, respectively.
At August 31, 2016, the cost of investments for federal income tax purposes was $1,293,236,526; accordingly, accumulated net unrealized appreciation on investments was $105,785,220, consisting of $186,612,278 gross unrealized appreciation and $80,827,058 gross unrealized depreciation.
27
REPORT OF INDEPENDENT REGISTERED
PUBLIC ACCOUNTING FIRM
Shareholders and Board of Directors
Dreyfus Opportunistic Midcap Value Fund
We have audited the accompanying statement of assets and liabilities, including the statement of investments, of Dreyfus Opportunistic Midcap Value Fund (one of the series comprising Advantage Funds, Inc.) as of August 31, 2016, and the related statement of operations for the year then ended, the statement of changes in net assets for each of the two years in the period then ended, and the financial highlights for each of the periods indicated therein. These financial statements and financial highlights are the responsibility of the Fund’s management. Our responsibility is to express an opinion on these financial statements and financial highlights based on our audits.
We conducted our audits in accordance with the standards of the Public Company Accounting Oversight Board (United States). Those standards require that we plan and perform the audit to obtain reasonable assurance about whether the financial statements and financial highlights are free of material misstatement. We were not engaged to perform an audit of the Fund’s internal control over financial reporting. Our audits included consideration of internal control over financial reporting as a basis for designing audit procedures that are appropriate in the circumstances, but not for the purpose of expressing an opinion on the effectiveness of the Fund’s internal control over financial reporting. Accordingly, we express no such opinion. An audit also includes examining, on a test basis, evidence supporting the amounts and disclosures in the financial statements and financial highlights, assessing the accounting principles used and significant estimates made by management, and evaluating the overall financial statement presentation. Our procedures included confirmation of securities owned as of August 31, 2016 by correspondence with the custodian and others. We believe that our audits provide a reasonable basis for our opinion.
In our opinion, the financial statements and financial highlights referred to above present fairly, in all material respects, the financial position of Dreyfus Opportunistic Midcap Value Fund at August 31, 2016, the results of its operations for the year then ended, the changes in its net assets for each of the two years in the period then ended, and the financial highlights for each of the indicated periods, in conformity with U.S. generally accepted accounting principles.

New York, New York
October 27, 2016
28
IMPORTANT TAX INFORMATION (Unaudited)
For federal tax purposes, the fund hereby reports 84.80% of the ordinary dividends paid during the fiscal year ended August 31, 2016 as qualifying for the corporate dividends received deduction. Also, certain dividends paid by the fund may be subject to a maximum tax rate of 15%, as provided for by the Jobs and Growth Tax Relief Reconciliation Act of 2003. Of the distributions paid during the fiscal year, $27,165,335 represents the maximum amount that may be considered qualified dividend income. The fund also hereby reports $.5587 per share as a short-term capital gain distribution and $5.5426 per share as a long-term capital gain distribution paid on December 15, 2015. Shareholders will receive notification in early 2017 of the percentage applicable to the preparation of their 2016 income tax returns.
29
BOARD MEMBERS INFORMATION (Unaudited)
INDEPENDENT BOARD MEMBERS
Joseph S. DiMartino (72)
Chairman of the Board (1995)
Principal Occupation During Past 5 Years:
· Corporate Director and Trustee (1995-present)
Other Public Company Board Memberships During Past 5 Years:
· CBIZ (formerly, Century Business Services, Inc.), a provider of outsourcing functions for small and medium size companies, Director (1997-present)
No. of Portfolios for which Board Member Serves: 136
———————
Peggy C. Davis (73)
Board Member (2006)
Principal Occupation During Past 5 Years:
· Shad Professor of Law, New York University School of Law (1983-present)
No. of Portfolios for which Board Member Serves: 49
———————
David P. Feldman (76)
Board Member (1996)
Principal Occupation During Past 5 Years:
· Corporate Director and Trustee (1985-present)
Other Public Company Board Memberships During Past 5 Years:
· BBH Mutual Funds Group (5 registered mutual funds), Director (1992-2014)
No. of Portfolios for which Board Member Serves: 35
———————
Ehud Houminer (76)
Board Member (1993)
Principal Occupation During Past 5 Years:
· Executive-in-Residence at the Columbia Business School, Columbia
University (1992-present)
Other Public Company Board Memberships During Past 5 Years:
· Avnet, Inc., an electronics distributor, Director (1993-2012)
No. of Portfolios for which Board Member Serves: 59
———————
30
Lynn Martin (76)
Board Member (2012)
Principal Occupation During Past 5 Years:
· President of The Martin Hall Group LLC, a human resources consulting firm (2005-2012)
Other Public Company Board Memberships During Past 5 Years:
· AT&T, Inc., a telecommunications company, Director (1999-2012)
· Ryder System, Inc., a supply chain and transportation management company, Director (1993-2012)
No. of Portfolios for which Board Member Serves: 35
———————
Robin A. Melvin (52)
Board Member (2012)
Principal Occupation During Past 5 Years:
· Co-chairman, Illinois Mentoring Partnership, non-profit organization dedicated to increasing the quantity and quality of mentoring services in Illinois; (2014-present; served as a board member since 2013)
· Director, Boisi Family Foundation, a private family foundation that supports youth-serving organizations that promote the self sufficiency of youth from disadvantaged circumstances (1995-2012)
No. of Portfolios for which Board Member Serves: 108
———————
Dr. Martin Peretz (77)
Board Member (2006)
Principal Occupation During Past 5 Years:
· Editor-in-Chief Emeritus of The New Republic Magazine (2011-2012) (previously,
Editor-in-Chief, 1974-2011)
· Director of TheStreet.com, a financial information service on the web (1996-2010)
· Lecturer at Harvard University (1969-2012)
No. of Portfolios for which Board Member Serves: 35
———————
Once elected all Board Members serve for an indefinite term, but achieve Emeritus status upon reaching age 80. The address of the Board Members and Officers is c/o The Dreyfus Corporation, 200 Park Avenue, New York, New York 10166. Additional information about the Board Members is available in the fund’s Statement of Additional Information which can be obtained from Dreyfus free of charge by calling this toll free number: 1-800-DREYFUS.
James F. Henry, Emeritus Board Member
Dr. Paul A. Marks, Emeritus Board Member
Philip L. Toia, Emeritus Board Member
31
OFFICERS OF THE FUND (Unaudited)
BRADLEY J. SKAPYAK, President since January 2010.
Chief Operating Officer and a director of the Manager since June 2009, Chairman of Dreyfus Transfer, Inc., an affiliate of the Manager and the transfer agent of the funds, since May 2011 and Executive Vice President of the Distributor since June 2007. From April 2003 to June 2009, Mr. Skapyak was the head of the Investment Accounting and Support Department of the Manager. He is an officer of 65 investment companies (comprised of 136 portfolios) managed by the Manager. He is 57 years old and has been an employee of the Manager since February 1988.
BENNETT A. MACDOUGALL, Chief Legal Officer since October 2015.
Chief Legal Officer of the Manager since June 2015; from June 2005 to June 2015, he served in various capacities with Deutsche Bank – Asset & Wealth Management Division, including as Director and Associate General Counsel, and Chief Legal Officer of Deutsche Investment Management Americas Inc. from June 2012 to May 2015. He is an officer of 66 investment companies (comprised of 161 portfolios) managed by the Manager. He is 44 years old and has been an employee of the Manager since June 2015.
JANETTE E. FARRAGHER, Vice President and Secretary since December 2011.
Assistant General Counsel of BNY Mellon, and an officer of 66 investment companies (comprised of 161 portfolios) managed by the Manager. She is 53 years old and has been an employee of the Manager since February 1984.
JAMES BITETTO, Vice President and Assistant Secretary since August 2005.
Managing Counsel of BNY Mellon and Secretary of the Manager, and an officer of 66 investment companies (comprised of 161 portfolios) managed by the Manager. He is 50 years old and has been an employee of the Manager since December 1996.
JONI LACKS CHARATAN, Vice President and Assistant Secretary since August 2005.
Managing Counsel of BNY Mellon, and an officer of 66 investment companies (comprised of 161 portfolios) managed by the Manager. She is 60 years old and has been an employee of the Manager since October 1988.
JOSEPH M. CHIOFFI, Vice President and Assistant Secretary since August 2005.
Managing Counsel of BNY Mellon, and an officer of 66 investment companies (comprised of 161 portfolios) managed by the Manager. He is 54 years old and has been an employee of the Manager since June 2000.
MAUREEN E. KANE, Vice President and Assistant Secretary since April 2015.
Managing Counsel of BNY Mellon since July 2014; from October 2004 until July 2014, General Counsel, and from May 2009 until July 2014, Chief Compliance Officer of Century Capital Management. She is an officer of 66 investment companies (comprised of 161 portfolios) managed by the Manager. She is 54 years old and has been an employee of the Manager since July 2014.
SARAH S. KELLEHER, Vice President and Assistant Secretary since April 2014.
Senior Counsel of BNY Mellon, and an officer of 66 investment companies (comprised of 161 portfolios) managed by the Manager; from August 2005 to March 2013, Associate General Counsel of Third Avenue Management. She is 40 years old and has been an employee of the Manager since March 2013.
JEFF PRUSNOFSKY, Vice President and Assistant Secretary since August 2005.
Senior Managing Counsel of BNY Mellon, and an officer of 66 investment companies (comprised of 161 portfolios) managed by the Manager. He is 51 years old and has been an employee of the Manager since October 1990.
JAMES WINDELS, Treasurer since November 2001.
Director – Mutual Fund Accounting of the Manager, and an officer of 66 investment companies (comprised of 161 portfolios) managed by the Manager. He is 57 years old and has been an employee of the Manager since April 1985.
RICHARD CASSARO, Assistant Treasurer since January 2008.
Senior Accounting Manager – Money Market, Municipal Bond and Equity Funds of the Manager, and an officer of 66 investment companies (comprised of 161 portfolios) managed by the Manager. He is 57 years old and has been an employee of the Manager since September 1982.
32
GAVIN C. REILLY, Assistant Treasurer since December 2005.
Tax Manager of the Investment Accounting and Support Department of the Manager, and an officer of 66 investment companies (comprised of 161 portfolios) managed by the Manager. He is 48 years old and has been an employee of the Manager since April 1991.
ROBERT S. ROBOL, Assistant Treasurer since August 2005.
Senior Accounting Manager of the Manager, and an officer of 66 investment companies (comprised of 161 portfolios) managed by the Manager. He is 52 years old and has been an employee of the Manager since October 1988.
ROBERT SALVIOLO, Assistant Treasurer since July 2007.
Senior Accounting Manager – Equity Funds of the Manager, and an officer of 66 investment companies (comprised of 161 portfolios) managed by the Manager. He is 49 years old and has been an employee of the Manager since June 1989.
ROBERT SVAGNA, Assistant Treasurer since December 2002.
Senior Accounting Manager – Fixed Income and Equity Funds of the Manager, and an officer of 66 investment companies (comprised of 161 portfolios) managed by the Manager. He is 49 years old and has been an employee of the Manager since November 1990.
JOSEPH W. CONNOLLY, Chief Compliance Officer since October 2004.
Chief Compliance Officer of the Manager and The Dreyfus Family of Funds (66 investment companies, comprised of 161 portfolios). He is 59 years old and has served in various capacities with the Manager since 1980, including manager of the firm’s Fund Accounting Department from 1997 through October 2001.
CARIDAD M. CAROSELLA, Anti-Money Laundering Compliance Officer since January 2016
Anti-Money Laundering Compliance Officer of the Dreyfus Family of Funds and BNY Mellon Funds Trust since January 2016; from May 2015 to December 2015, Interim Anti-Money Laundering Compliance Officer of the Dreyfus Family of Funds and BNY Mellon Funds Trust and the Distributor; from January 2012 to May 2015, AML Surveillance Officer of the Distributor and from 2007 to December 2011, Financial Processing Manager of the Distributor. She is an officer of 61 investment companies (comprised of 156 portfolios) managed by the Manager. She is 48 years old and has been an employee of the Distributor since 1997.
33
Dreyfus Opportunistic Midcap Value Fund
200 Park Avenue
New York, NY 10166
Manager
The Dreyfus Corporation
200 Park Avenue
New York, NY 10166
Custodian
The Bank of New York Mellon
225 Liberty Street
New York, NY 10286
Transfer Agent &
Dividend Disbursing Agent
Dreyfus Transfer, Inc.
200 Park Avenue
New York, NY 10166
Distributor
MBSC Securities Corporation
200 Park Avenue
New York, NY 10166
| | |
Ticker Symbol: | Class A: DMCVX Class C: DVLCX Class I: DVLIX Class Y: DMCYX |
Telephone Call your financial representative or 1-800-DREYFUS
Mail The Dreyfus Family of Funds, 144 Glenn Curtiss Boulevard, Uniondale, NY 11556-0144
E-mail Send your request to info@dreyfus.com
Internet Information can be viewed online or downloaded at www.dreyfus.com
The fund files its complete schedule of portfolio holdings with the Securities and Exchange Commission (“SEC”) for the first and third quarters of each fiscal year on Form N-Q. The fund’s Forms N-Q are available on the SEC’s website at www.sec.gov and may be reviewed and copied at the SEC’s Public Reference Room in Washington, DC. (phone 1-800-SEC-0330 for information).
A description of the policies and procedures that the fund uses to determine how to vote proxies relating to portfolio securities and information regarding how the fund voted these proxies for the most recent 12-month period ended June 30 is available at www.dreyfus.com and on the SEC’s website at www.sec.gov and without charge, upon request, by calling 1-800-DREYFUS.
| | |
© 2016 MBSC Securities Corporation
0258AR0816 | 
|
Dreyfus Opportunistic Small Cap Fund
| | | |

| | ANNUAL REPORT August 31, 2016 |
| |
Save time. Save paper. View your next shareholder report online as soon as it’s available. Log into www.dreyfus.com and sign up for Dreyfus eCommunications. It’s simple and only takes a few minutes. |
| |
The views expressed in this report reflect those of the portfolio manager only through the end of the period covered and do not necessarily represent the views of Dreyfus or any other person in the Dreyfus organization. Any such views are subject to change at any time based upon market or other conditions and Dreyfus disclaims any responsibility to update such views. These views may not be relied on as investment advice and, because investment decisions for a Dreyfus fund are based on numerous factors, may not be relied on as an indication of trading intent on behalf of any Dreyfus fund. |
| |
Not FDIC-Insured • Not Bank-Guaranteed • May Lose Value |
Contents
T H E F U N D
F O R M O R E I N F O R M AT I O N
Back Cover
| | | | |
| |
Dreyfus Opportunistic Small Cap Fund
| | The Fund |
A LETTER FROM THE CHIEF EXECUTIVE OFFICER
Dear Shareholder:
We are pleased to present this annual report for Dreyfus Opportunistic Small Cap Fund, covering the 12-month period from September 1, 2015 through August 31, 2016. For information about how the fund performed during the reporting period, as well as general market perspectives, we provide a Discussion of Fund Performance on the pages that follow.
Despite tumultuous swings in market sentiment stemming from global economic developments, stocks and bonds generally produced strong returns over the reporting period. During the fall of 2015, investors reacted cautiously to sluggish global economic growth, plummeting commodity prices, and the first increase in short-term U.S. interest rates in nearly a decade. These worries sparked particularly sharp declines in equities in January 2016, but investor sentiment soon improved when U.S. monetary policymakers refrained from additional rate hikes, other central banks eased their monetary policies further, and commodity prices rebounded. Stocks mostly rallied over the ensuing months, driving several broad measures of stock market performance to new record highs. In the bond market, aggressively accommodative monetary policies and robust investor demand for current income sent yields of high-quality sovereign bonds lower and their prices higher.
Recently we have seen evidence that investors may be shifting their focus away from macroeconomic influences and toward underlying company and industry fundamentals. This development—along with wide differences in underlying fundamental and technical influences across various asset classes, economic sectors, and regional markets—suggests that selectivity may be a more important determinant of investment success over the months ahead. As always, we encourage you to discuss the implications of our observations with your financial advisor.
Thank you for your continued confidence and support.
Sincerely,

Mark D. Santero
Chief Executive Officer
The Dreyfus Corporation
September 15, 2016
2
DISCUSSION OF FUND PERFORMANCE
For the period from September 1, 2015 through August 31, 2016, as provided by David A. Daglio, James Boyd, and Dale Dutile, Primary Portfolio Managers
Market and Fund Performance Overview
For the 12-month period ended August 31, 2016, Dreyfus Opportunistic Small Cap Fund produced a total return of 1.34%.1 In comparison, the fund’s benchmark, the Russell 2000® Index (the “Index”), produced a total return of 8.59%.2
Small-cap stocks achieved relatively strong returns as a rally over the reporting period’s second half more than erased losses from the first half. The fund lagged its benchmark, mainly due to shortfalls in the financials, industrials, and health care sectors.
The Fund’s Investment Approach
The fund seeks capital appreciation. The fund normally invests at least 80% of its assets in the stocks of small-cap companies. The fund currently considers small-cap companies to be those companies with market capitalizations that fall within the range of companies in the Index. Stocks are selected for the fund’s portfolio based primarily on bottom-up fundamental analysis. The fund’s team of portfolio managers uses a disciplined investment process that relies, in general, on proprietary fundamental research and valuation. Generally, elements of the process include analysis of mid-cycle business prospects, estimation of the intrinsic value of the company, and the identification of a revaluation trigger. Intrinsic value is based on the combination of the valuation assessment of the company’s operating divisions with the firm’s economic balance sheet. Mid-cycle estimates, growth prospects, and competitive advantages are some of the factors used in the valuation assessment. A company’s stated and hidden liabilities and assets are included in the portfolio manager’s economic balance sheet calculation. Sector overweights and underweights are a function of the relative attractiveness of securities within the fund’s investable universe. The fund’s portfolio managers invest in stocks that they believe have attractive reward-to-risk opportunities and may actively adjust the fund’s portfolio to reflect new developments.
Stocks Advanced Strongly Despite Headwinds
Stocks across all capitalization ranges proved volatile over the final months of 2015 as investors grew more averse to risks in light of persistently sluggish global growth. In January 2016, equity markets suffered particularly severe declines due to disappointing economic data in China, plunging commodity prices, and worries that higher short-term interest rates from the Federal Reserve Board (the “Fed”) might weigh on the U.S. economic recovery. The markets changed direction in mid-February, as investors responded positively to relatively strong U.S. economic data and better-than-expected corporate earnings. The market rally continued through the spring when the Fed refrained from implementing additional rate hikes, commodity prices rebounded, and foreign currencies strengthened against the U.S. dollar. Although a referendum in the United Kingdom to leave the European Union introduced renewed market turmoil in late June, equity markets bounced back quickly, enabling the Index to post solidly positive returns for the reporting period overall.
3
DISCUSSION OF FUND PERFORMANCE (continued)
Income-Oriented Stocks Led Market’s Advance
In a market environment motivated mainly by changing investor sentiment, companies exhibiting attractive fundamental characteristics were generally not rewarded to the extent they have been in the past. Investors seeking higher levels of income than were available from high-quality sovereign bonds turned instead to dividend-paying stocks in traditionally defensive market sectors, such as utilities and real estate investment trusts (REITs). Consequently, the fund’s security selections lagged market averages.
Results in the financials sector were particularly undermined by low interest rates, which investors worried might weigh on lenders’ profit margins. Consequently, fund holdings SVB Financial and South State Corporation underperformed. Meanwhile, residential real estate agency franchisor Realogy Holdings did not benefit as expected from a recovering housing market. In the industrials sector, staffing specialists TrueBlue and Korn/Ferry International encountered weaker-than-expected demand, and carpet tiles supplier Interface was hurt by sluggish commercial construction trends. The health care sector was hampered by disappointing outcomes of some new product trials, including a next-generation heart pump from HeartWare and a topical Botox product from Revance Therapeutics.
The fund produced better relative results in the materials sector, where rebounding commodity prices benefited miners New Gold and Yamana Gold. Specialty chemicals producer OMNOVA Solutions advanced after divesting unprofitable and lower-margin business lines. The fund also fared relatively well through underweighted exposure to the struggling energy sector. Strong stock selections in the information technology sector included flat-panel manufacturer Universal Display, communications equipment makers Lumentum Holdings and Viavi Solutions, and storage systems specialist CommVault Systems.
Maintaining a Focus on Fundamentals
In our analysis, investors are likely to return their focus to underlying company fundamentals as global economic and political conditions stabilize. We have maintained the fund’s research-driven investment approach, which favors companies we have identified as having attractive valuations and underappreciated cash flow prospects. As of the reporting period’s end, we have identified an ample number of stocks meeting our criteria in the information technology, financials, and industrials sectors, but relatively few in the more richly valued utilities, REITs, and consumer staples sectors.
September 15, 2016
Please note, the position in any security highlighted with italicized typeface was sold during the reporting period.
Equities are subject generally to market, market sector, market liquidity, issuer, and investment style risks, among other factors, to varying degrees, all of which are more fully described in the fund’s prospectus.
Stocks of small- and/or mid-cap companies often experience sharper price fluctuations than stocks of large-cap companies.
1 Total return includes reinvestment of dividends and any capital gains paid. Past performance is no guarantee of future results. Share price and investment return fluctuate such that upon redemption, fund shares may be worth more or less than their original cost.
2 Source: Lipper Inc. — Reflects reinvestment of dividends and, where applicable, capital gain distributions. The Russell 2000® Index is an unmanaged index of small-cap stock performance and is composed of the 2,000 smallest companies in the Russell 3000® Index. The Russell 3000® Index is composed of the 3,000 largest U.S. companies based on total market capitalization. Investors cannot invest directly in any index.
4
FUND PERFORMANCE
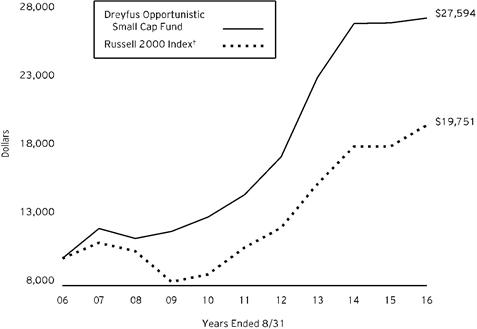
Comparison of change in value of $10,000 investment in Dreyfus Opportunistic Small Cap Fund and the Russell 2000 Index
| | | | |
Average Annual Total Returns as of 8/31/16 | |
| | | | |
| 1 Year | 5 Years | 10 Years |
Fund | 1.34% | 13.47% | 10.68% |
Russell 2000 Index | 8.59% | 12.85% | 7.04% |
† Source: Lipper Inc.
Past performance is not predictive of future performance. The fund’s performance shown in the graph and table does not reflect the deduction of taxes that a shareholder would pay on fund distributions or the redemption of fund shares.
The above graph compares a $10,000 investment made in Dreyfus Opportunistic Small Cap Fund on 8/31/06 to a $10,000 investment made in the Russell 2000 Index (the “Index”) on that date. All dividends and capital gain distributions are reinvested.
The fund’s performance shown in the line graph above takes into account all applicable fees and expenses. The Index is an unmanaged index and is composed of the 2,000 smallest companies in the Russell 3000 Index. The Russell 3000 Index measures the performance of the largest 3,000 U.S. companies representing approximately 98% of the investable U.S. equity market. Unlike a mutual fund, the Index is not subject to charges, fees and other expenses. Investors cannot invest directly in any index. Further information relating to fund performance, including expense reimbursements, if applicable, is contained in the Financial Highlights section of the prospectus and elsewhere in this report.
5
UNDERSTANDING YOUR FUND’S EXPENSES (Unaudited)
As a mutual fund investor, you pay ongoing expenses, such as management fees and other expenses. Using the information below, you can estimate how these expenses affect your investment and compare them with the expenses of other funds. You also may pay one-time transaction expenses, including sales charges (loads) and redemption fees, which are not shown in this section and would have resulted in higher total expenses. For more information, see your fund’s prospectus or talk to your financial adviser.
Review your fund’s expenses
The table below shows the expenses you would have paid on a $1,000 investment in Dreyfus Opportunistic Small Cap Fund from March 1, 2016 to August 31, 2016. It also shows how much a $1,000 investment would be worth at the close of the period, assuming actual returns and expenses.
| | | | | | | | | |
Expenses and Value of a $1,000 Investment |
assuming actual returns for the six months ended August 31, 2016 | | |
| | | | | | | | | |
Expenses paid per $1,000† | | | $6.03 | | | |
Ending value (after expenses) | | | $1,182.60 | | | |
COMPARING YOUR FUND’S EXPENSES
WITH THOSE OF OTHER FUNDS (Unaudited)
Using the SEC’s method to compare expenses
The Securities and Exchange Commission (SEC) has established guidelines to help investors assess fund expenses. Per these guidelines, the table below shows your fund’s expenses based on a $1,000 investment, assuming a hypothetical 5% annualized return. You can use this information to compare the ongoing expenses (but not transaction expenses or total cost) of investing in the fund with those of other funds. All mutual fund shareholder reports will provide this information to help you make this comparison. Please note that you cannot use this information to estimate your actual ending account balance and expenses paid during the period.
| | | | | | | | | |
Expenses and Value of a $1,000 Investment |
assuming a hypothetical 5% annualized return for the six months ended August 31, 2016 |
| | | | | | | | | |
Expenses paid per $1,000† | | | $5.58 | | | |
Ending value (after expenses) | | | $1,019.61 | | | |
† Expenses are equal to the fund’s annualized expense ratio of 1.10%, multiplied by the average account value over the period, multiplied by 184/366 (to reflect the one-half year period).
6
STATEMENT OF INVESTMENTS
August 31, 2016
| | | | | | |
| |
Common Stocks - 98.9% | | Shares | | Value ($) | |
Banks - 12.4% | | | | | |
Ameris Bancorp | | 303,174 | | 10,556,519 | |
Columbia Banking System | | 196,349 | | 6,487,371 | |
FCB Financial Holdings, Cl. A | | 452,606 | a | 17,334,810 | |
First Busey | | 124,355 | | 2,903,689 | |
First Interstate BancSystem, Cl. A | | 333,145 | | 10,240,877 | |
Pinnacle Financial Partners | | 192,193 | | 10,895,421 | |
Simmons First National, Cl. A | | 98,208 | | 4,929,060 | |
South State | | 138,221 | | 10,503,414 | |
SVB Financial Group | | 232,542 | a | 25,826,114 | |
| | | | | 99,677,275 | |
Capital Goods - 5.5% | | | | | |
CLARCOR | | 98,138 | | 6,425,095 | |
Proto Labs | | 86,659 | a,b | 4,741,980 | |
Simpson Manufacturing | | 362,886 | | 15,923,438 | |
TASER International | | 241,991 | a,b | 6,553,116 | |
Thermon Group Holdings | | 540,997 | a | 10,186,973 | |
| | | | | 43,830,602 | |
Commercial & Professional Services - 4.2% | | | | | |
Interface | | 283,284 | | 5,008,461 | |
Knoll | | 127,869 | | 3,383,414 | |
Steelcase, Cl. A | | 645,855 | | 9,649,074 | |
TrueBlue | | 723,133 | a | 15,800,456 | |
| | | | | 33,841,405 | |
Consumer Durables & Apparel - 1.5% | | | | | |
WCI Communities | | 622,149 | a | 11,708,844 | |
Consumer Services - 2.5% | | | | | |
Fogo De Chao | | 114,335 | a | 1,402,890 | |
Houghton Mifflin Harcourt | | 861,177 | a | 13,735,773 | |
Potbelly | | 357,257 | a | 4,630,051 | |
| | | | | 19,768,714 | |
Diversified Financials - 10.4% | | | | | |
FNFV Group | | 646,164 | a | 8,329,054 | |
Green Dot, Cl. A | | 380,692 | a | 8,832,054 | |
Investment Technology Group | | 477,448 | | 7,343,150 | |
Landcadia Holdings | | 303,399 | | 3,061,296 | |
Raymond James Financial | | 389,439 | | 22,653,667 | |
SLM | | 3,566,014 | a | 26,441,994 | |
7
STATEMENT OF INVESTMENTS (continued)
| | | | | | |
| |
Common Stocks - 98.9% (continued) | | Shares | | Value ($) | |
Diversified Financials - 10.4% (continued) | | | | | |
Square, Cl. A | | 531,265 | b | 6,476,120 | |
| | | | | 83,137,335 | |
Exchange-Traded Funds - .1% | | | | | |
iShares Russell 2000 ETF | | 9,080 | b | 1,118,928 | |
Health Care Equipment & Services - 3.6% | | | | | |
Adeptus Health, Cl. A | | 346,783 | a,b | 14,759,084 | |
Brookdale Senior Living | | 847,480 | a | 14,585,131 | |
| | | | | 29,344,215 | |
Insurance - .3% | | | | | |
Assurant | | 27,302 | | 2,444,894 | |
Materials - 4.7% | | | | | |
Methanex | | 861,832 | b | 24,993,128 | |
New Gold | | 680,554 | a,b | 3,259,854 | |
OMNOVA Solutions | | 953,238 | a | 9,532,380 | |
| | | | | 37,785,362 | |
Media - 4.8% | | | | | |
Gray Television | | 305,018 | a | 3,425,352 | |
Media General | | 170,220 | a | 3,007,787 | |
Nexstar Broadcasting Group, Cl. A | | 291,737 | b | 15,380,375 | |
Sinclair Broadcast Group, Cl. A | | 588,489 | b | 16,760,167 | |
| | | | | 38,573,681 | |
Pharmaceuticals, Biotechnology & Life Sciences - 8.7% | | | | | |
Akorn | | 89,565 | a | 2,411,090 | |
Flamel Technologies, ADR | | 769,511 | a,b | 10,288,362 | |
Flexion Therapeutics | | 323,849 | a | 5,401,801 | |
GW Pharmaceuticals, ADR | | 213,782 | a,b | 17,476,679 | |
Revance Therapeutics | | 620,332 | a,b | 8,715,665 | |
Sangamo BioSciences | | 548,362 | a,b | 2,352,473 | |
TherapeuticsMD | | 3,422,299 | a | 23,545,417 | |
| | | | | 70,191,487 | |
Retailing - 4.9% | | | | | |
Lithia Motors, Cl. A | | 244,970 | | 20,276,167 | |
Office Depot | | 4,496,380 | | 16,546,678 | |
Staples | | 279,617 | | 2,393,522 | |
| | | | | 39,216,367 | |
Semiconductors & Semiconductor Equipment - 7.6% | | | | | |
Applied Micro Circuits | | 1,219,425 | a | 8,511,586 | |
Cavium | | 380,604 | a,b | 21,192,031 | |
Microsemi | | 151,249 | a | 6,043,910 | |
8
| | | | | | |
| |
Common Stocks - 98.9% (continued) | | Shares | | Value ($) | |
Semiconductors & Semiconductor Equipment - 7.6% (continued) | | | | | |
Teradyne | | 997,785 | | 21,013,352 | |
Veeco Instruments | | 202,248 | a | 3,978,218 | |
| | | | | 60,739,097 | |
Software & Services - 5.5% | | | | | |
CommVault Systems | | 531,691 | a | 27,403,354 | |
CoreLogic | | 137,781 | a | 5,651,777 | |
Envestnet | | 114,685 | a | 4,531,204 | |
Infoblox | | 172,804 | a | 3,708,374 | |
Silver Spring Networks | | 230,387 | a | 3,144,783 | |
| | | | | 44,439,492 | |
Technology Hardware & Equipment - 15.3% | | | | | |
Ciena | | 1,011,856 | a | 21,704,311 | |
Fabrinet | | 217,486 | a | 8,442,807 | |
Infinera | | 673,720 | a | 5,780,518 | |
Keysight Technologies | | 267,837 | a | 8,150,280 | |
Lumentum Holdings | | 324,004 | | 11,379,020 | |
Methode Electronics | | 397,284 | | 14,560,459 | |
ScanSource | | 300,233 | a | 10,270,971 | |
Sierra Wireless | | 619,423 | a,b | 8,684,310 | |
Universal Display | | 263,021 | a,b | 15,147,379 | |
Viavi Solutions | | 2,390,633 | a | 18,599,125 | |
| | | | | 122,719,180 | |
Transportation - 6.6% | | | | | |
ArcBest | | 205,318 | | 3,759,373 | |
Avis Budget Group | | 688,868 | a | 24,888,801 | |
Knight Transportation | | 592,136 | b | 16,639,022 | |
Werner Enterprises | | 338,891 | | 7,821,604 | |
| | | | | 53,108,800 | |
Utilities - .3% | | | | | |
Calpine | | 191,833 | a | 2,394,076 | |
Total Common Stocks (cost $701,042,000) | | | | 794,039,754 | |
Other Investment - 1.6% | | | | | |
Registered Investment Company; | | | | | |
Dreyfus Institutional Preferred Government Plus Money Market Fund
(cost $12,473,420) | | 12,473,420 | c | 12,473,420 | |
9
STATEMENT OF INVESTMENTS (continued)
| | | | | | |
| |
Investment of Cash Collateral for Securities Loaned - 8.2% | | Shares | | Value ($) | |
Registered Investment Company; | | | | | |
Dreyfus Institutional Cash Advantage Fund, Institutional Shares
(cost $65,913,277) | | 65,913,277 | c | 65,913,277 | |
Total Investments (cost $779,428,697) | | 108.7% | | 872,426,451 | |
Liabilities, Less Cash and Receivables | | (8.7%) | | (69,685,319) | |
Net Assets | | 100.0% | | 802,741,132 | |
ADR—American Depository Receipt
ETF—Exchange-Traded Fund
a Non-income producing security.
b Security, or portion thereof, on loan. At August 31, 2016, the value of the fund’s securities on loan was $70,682,080 and the value of the collateral held by the fund was $72,731,746, consisting of cash collateral of $65,913,277 and U.S. Government & Agency securities valued at $6,818,469.
c Investment in affiliated money market mutual fund.
| | |
Portfolio Summary (Unaudited) † | Value (%) |
Technology Hardware & Equipment | 15.3 |
Banks | 12.4 |
Diversified Financials | 10.4 |
Money Market Investments | 9.8 |
Pharmaceuticals, Biotechnology & Life Sciences | 8.7 |
Semiconductors & Semiconductor Equipment | 7.6 |
Transportation | 6.6 |
Capital Goods | 5.5 |
Software & Services | 5.5 |
Retailing | 4.9 |
Media | 4.8 |
Materials | 4.7 |
Commercial & Professional Services | 4.2 |
Health Care Equipment & Services | 3.6 |
Consumer Services | 2.5 |
Consumer Durables & Apparel | 1.5 |
Insurance | .3 |
Utilities | .3 |
Exchange-Traded Funds | .1 |
| | 108.7 |
† Based on net assets.
See notes to financial statements.
10
STATEMENT OF ASSETS AND LIABILITIES
August 31, 2016
| | | | | | | | | |
| | | | | | |
| | | Cost | | Value | |
Assets ($): | | | | |
Investments in securities—See Statement of Investments
(including securities on loan, valued at $70,682,080)—Note 1(b): | | | | |
Unaffiliated issuers | | 701,042,000 | | 794,039,754 | |
Affiliated issuers | | 78,386,697 | | 78,386,697 | |
Cash | | | | | 520,051 | |
Receivable for investment securities sold | | | | | 8,787,891 | |
Dividends and securities lending income receivable | | | | | 404,867 | |
Receivable for shares of Common Stock subscribed | | | | | 103,972 | |
Prepaid expenses | | | | | 17,907 | |
| | | | | 882,261,139 | |
Liabilities ($): | | | | |
Due to The Dreyfus Corporation and affiliates—Note 3(b) | | | | | 753,262 | |
Liability for securities on loan—Note 1(b) | | | | | 65,913,277 | |
Payable for investment securities purchased | | | | | 12,189,295 | |
Payable for shares of Common Stock redeemed | | | | | 545,239 | |
Accrued expenses | | | | | 118,934 | |
| | | | | 79,520,007 | |
Net Assets ($) | | | 802,741,132 | |
Composition of Net Assets ($): | | | | |
Paid-in capital | | | | | 725,777,004 | |
Accumulated investment (loss)—net | | | | | (3,191,973) | |
Accumulated net realized gain (loss) on investments | | | | | (12,841,653) | |
Accumulated net unrealized appreciation (depreciation)
on investments | | | | | 92,997,754 | |
Net Assets ($) | | | 802,741,132 | |
Shares Outstanding | | |
(200 million shares of $.001 par value Common Stock authorized) | | 27,061,112 | |
Net Asset Value Per Share ($) | | 29.66 | |
See notes to financial statements.
11
STATEMENT OF OPERATIONS
Year Ended August 31, 2016
| | | | | | | |
| | | | | | |
| | | | | | |
Investment Income ($): | | | | |
Income: | | | | |
Cash dividends (net of $76,587 foreign taxes withheld at source): | | | | |
Unaffiliated issuers | | | 6,891,681 | |
Affiliated issuers | | | 17,397 | |
Income from securities lending—Note 1(b) | | | 684,786 | |
Total Income | | | 7,593,864 | |
Expenses: | | | | |
Management fee—Note 3(a) | | | 6,040,487 | |
Shareholder servicing costs—Note 3(b) | | | 2,552,873 | |
Custodian fees—Note 3(b) | | | 95,527 | |
Directors’ fees and expenses—Note 3(c) | | | 66,732 | |
Professional fees | | | 64,629 | |
Prospectus and shareholders’ reports | | | 41,412 | |
Registration fees | | | 31,765 | |
Loan commitment fees—Note 2 | | | 11,045 | |
Interest expense—Note 2 | | | 8,619 | |
Miscellaneous | | | 24,846 | |
Total Expenses | | | 8,937,935 | |
Less—reduction in fees due to earnings credits—Note 3(b) | | | (2,800) | |
Net Expenses | | | 8,935,135 | |
Investment (Loss)—Net | | | (1,341,271) | |
Realized and Unrealized Gain (Loss) on Investments—Note 4 ($): | | |
Net realized gain (loss) on investments | 14,972,795 | |
Net unrealized appreciation (depreciation) on investments | | | (8,400,423) | |
Net Realized and Unrealized Gain (Loss) on Investments | | | 6,572,372 | |
Net Increase in Net Assets Resulting from Operations | | 5,231,101 | |
See notes to financial statements.
12
STATEMENT OF CHANGES IN NET ASSETS
| | | | | | | | | | |
| | | | Year Ended August 31, |
| | | | 2016 | | | | 2015 | |
Operations ($): | | | | | | | | |
Investment (loss)—net | | | (1,341,271) | | | | (3,844,450) | |
Net realized gain (loss) on investments | | 14,972,795 | | | | 28,084,691 | |
Net unrealized appreciation (depreciation)
on investments | | (8,400,423) | | | | (56,776,643) | |
Net Increase (Decrease) in Net Assets
Resulting from Operations | 5,231,101 | | | | (32,536,402) | |
Dividends to Shareholders from ($): | | | | | | | | |
Investment income—net | | | (2,920,964) | | | | - | |
Net realized gain on investments | | | (30,554,710) | | | | (136,261,066) | |
Total Dividends | | | (33,475,674) | | | | (136,261,066) | |
Capital Stock Transactions ($): | | | | | | | | |
Net proceeds from shares sold | | | 158,035,790 | | | | 278,711,391 | |
Dividends reinvested | | | 25,215,603 | | | | 110,475,587 | |
Cost of shares redeemeda | | | (292,501,076) | | | | (442,670,410) | |
Increase (Decrease) in Net Assets
from Capital Stock Transactions | (109,249,683) | | | | (53,483,432) | |
Total Increase (Decrease) in Net Assets | (137,494,256) | | | | (222,280,900) | |
Net Assets ($): | | | | | | | | |
Beginning of Period | | | 940,235,388 | | | | 1,162,516,288 | |
End of Period | | | 802,741,132 | | | | 940,235,388 | |
Accumulated investment (loss)—net | (3,191,973) | | | | (3,847,924) | |
Capital Share Transactions (Shares): | | | | | | | | |
Shares sold | | | 5,626,484 | | | | 8,621,489 | |
Shares issued for dividends reinvested | | | 867,410 | | | | 3,648,467 | |
Shares redeemed | | | (10,309,536) | | | | (13,799,475) | |
Net Increase (Decrease) in Shares Outstanding | (3,815,642) | | | | (1,529,519) | |
| | | | | | | | | | |
a During the period ended August 31, 2015, 7,011,133 shares amounting to $223,795,369 were redeemed-in-kind resulting in a net realized gain on investments of $8,264,606. | |
See notes to financial statements.
13
FINANCIAL HIGHLIGHTS
The following table describes the performance for the fiscal periods indicated. Total return shows how much your investment in the fund would have increased (or decreased) during each period, assuming you had reinvested all dividends and distributions. These figures have been derived from the fund’s financial statements.
| | | | | | | | |
| | | | |
| | |
| | Year Ended August 31, |
| | 2016 | 2015 | 2014 | 2013 | 2012 |
Per Share Data ($): | | | | | | |
Net asset value, beginning of period | | 30.45 | 35.87 | 34.70 | 26.02 | 24.90 |
Investment Operations: | | | | | | |
Investment (loss)—neta | | (.05) | (.13) | (.13) | (.09) | (.13) |
Net realized and unrealized gain
(loss) on investments | | .43 | .17 | 5.70 | 8.77 | 4.27 |
Total from Investment Operations | | .38 | .04 | 5.57 | 8.68 | 4.14 |
Distributions: | | | | | | |
Dividends from
investment income—net | | (.10) | - | - | - | - |
Dividends from net realized
gain on investments | | (1.07) | (5.46) | (4.40) | - | (3.02) |
Total Distributions | | (1.17) | (5.46) | (4.40) | - | (3.02) |
Net asset value, end of period | | 29.66 | 30.45 | 35.87 | 34.70 | 26.02 |
Total Return (%) | | 1.34 | .18 | 16.95 | 33.36 | 18.81 |
Ratios/Supplemental Data (%): | | | | | | |
Ratio of total expenses
to average net assets | | 1.11 | 1.09 | 1.10 | 1.13 | 1.19 |
Ratio of net expenses
to average net assets | | 1.11 | 1.09 | 1.10 | 1.13 | 1.19 |
Ratio of net investment (loss)
to average net assets | | (.17) | (.41) | (.35) | (.29) | (.52) |
Portfolio Turnover Rate | | 82.01 | 74.06 | 88.69 | 94.62 | 85.92 |
Net Assets, end of period ($ x 1,000) | | 802,741 | 940,235 | 1,162,516 | 850,685 | 595,337 |
a Based on average shares outstanding.
See notes to financial statements.
14
NOTES TO FINANCIAL STATEMENTS
NOTE 1—Significant Accounting Policies:
Dreyfus Opportunistic Small Cap Fund (the “fund”) is a separate diversified series of Advantage Funds, Inc. (the “Company”), which is registered under the Investment Company Act of 1940, as amended (the “Act”), as an open-end management investment company and operates as a series company currently offering ten series, including the fund. The fund’s investment objective is to seek capital appreciation. The Dreyfus Corporation (the “Manager” or “Dreyfus”), a wholly-owned subsidiary of The Bank of New York Mellon Corporation (“BNY Mellon”), serves as the fund’s investment adviser. MBSC Securities Corporation (the “Distributor”), a wholly-owned subsidiary of Dreyfus, is the distributor of the fund’s shares, which are sold to the public without a sales charge.
The Company accounts separately for the assets, liabilities and operations of each series. Expenses directly attributable to each series are charged to that series’ operations; expenses which are applicable to all series are allocated among them on a pro rata basis.
The Financial Accounting Standards Board (“FASB”) Accounting Standards Codification (“ASC”) is the exclusive reference of authoritative U.S. generally accepted accounting principles (“GAAP”) recognized by the FASB to be applied by nongovernmental entities. Rules and interpretive releases of the Securities and Exchange Commission (“SEC”) under authority of federal laws are also sources of authoritative GAAP for SEC registrants. The fund’s financial statements are prepared in accordance with GAAP, which may require the use of management estimates and assumptions. Actual results could differ from those estimates.
The Company enters into contracts that contain a variety of indemnifications. The fund’s maximum exposure under these arrangements is unknown. The fund does not anticipate recognizing any loss related to these arrangements.
(a) Portfolio valuation: The fair value of a financial instrument is the amount that would be received to sell an asset or paid to transfer a liability in an orderly transaction between market participants at the measurement date (i.e., the exit price). GAAP establishes a fair value hierarchy that prioritizes the inputs of valuation techniques used to measure fair value. This hierarchy gives the highest priority to unadjusted quoted prices in active markets for identical assets or liabilities (Level 1 measurements) and the lowest priority to unobservable inputs (Level 3 measurements).
15
NOTES TO FINANCIAL STATEMENTS (continued)
Additionally, GAAP provides guidance on determining whether the volume and activity in a market has decreased significantly and whether such a decrease in activity results in transactions that are not orderly. GAAP requires enhanced disclosures around valuation inputs and techniques used during annual and interim periods.
Various inputs are used in determining the value of the fund’s investments relating to fair value measurements. These inputs are summarized in the three broad levels listed below:
Level 1—unadjusted quoted prices in active markets for identical investments.
Level 2—other significant observable inputs (including quoted prices for similar investments, interest rates, prepayment speeds, credit risk, etc.).
Level 3—significant unobservable inputs (including the fund’s own assumptions in determining the fair value of investments).
The inputs or methodology used for valuing securities are not necessarily an indication of the risk associated with investing in those securities.
Changes in valuation techniques may result in transfers in or out of an assigned level within the disclosure hierarchy. Valuation techniques used to value the fund’s investments are as follows:
Investments in securities are valued at the last sales price on the securities exchange or national securities market on which such securities are primarily traded. Securities listed on the National Market System for which market quotations are available are valued at the official closing price or, if there is no official closing price that day, at the last sales price. For open short positions, asked prices are used for valuation purposes. Bid price is used when no asked price is available. Registered investment companies that are not traded on an exchange are valued at their net asset value. All of the preceding securities are generally categorized within Level 1 of the fair value hierarchy.
Securities not listed on an exchange or the national securities market, or securities for which there were no transactions, are valued at the average of the most recent bid and asked prices. These securities are generally categorized within Level 2 of the fair value hierarchy.
Fair valuing of securities may be determined with the assistance of a pricing service using calculations based on indices of domestic securities and other appropriate indicators, such as prices of relevant ADRs and
16
financial futures. Utilizing these techniques may result in transfers between Level 1 and Level 2 of the fair value hierarchy.
When market quotations or official closing prices are not readily available, or are determined not to reflect accurately fair value, such as when the value of a security has been significantly affected by events after the close of the exchange or market on which the security is principally traded (for example, a foreign exchange or market), but before the fund calculates its net asset value, the fund may value these investments at fair value as determined in accordance with the procedures approved by the Company’s Board of Directors (the “Board”). Certain factors may be considered when fair valuing investments such as: fundamental analytical data, the nature and duration of restrictions on disposition, an evaluation of the forces that influence the market in which the securities are purchased and sold, and public trading in similar securities of the issuer or comparable issuers. These securities are either categorized within Level 2 or 3 of the fair value hierarchy depending on the relevant inputs used.
For restricted securities where observable inputs are limited, assumptions about market activity and risk are used and are generally categorized within Level 3 of the fair value hierarchy.
The following is a summary of the inputs used as of August 31, 2016 in valuing the fund’s investments:
| | | | | |
| | Level 1 - Unadjusted Quoted Prices | Level 2 - Other Significant Observable Inputs | Level 3 -Significant Unobservable Inputs | Total |
Assets ($) | | | | |
Investments in Securities: | | |
Equity Securities—Domestic Common Stocks† | 719,775,686 | - | - | 719,775,686 |
Equity Securities—Foreign Common Stocks† | 73,145,140 | - | - | 73,145,140 |
Exchange—Traded Funds | 1,118,928 | - | - | 1,118,928 |
Mutual Funds | 78,386,697 | - | - | 78,386,697 |
† See Statement of Investments for additional detailed categorizations.
At August 31, 2016, there were no transfers between levels of the fair value hierarchy.
(b) Securities transactions and investment income: Securities transactions are recorded on a trade date basis. Realized gains and losses from securities transactions are recorded on the identified cost basis.
17
NOTES TO FINANCIAL STATEMENTS (continued)
Dividend income is recognized on the ex-dividend date and interest income, including, where applicable, accretion of discount and amortization of premium on investments, is recognized on the accrual basis.
Pursuant to a securities lending agreement with The Bank of New York Mellon, a subsidiary of BNY Mellon and an affiliate of Dreyfus, the fund may lend securities to qualified institutions. It is the fund’s policy that, at origination, all loans are secured by collateral of at least 102% of the value of U.S. securities loaned and 105% of the value of foreign securities loaned. Collateral equivalent to at least 100% of the market value of securities on loan is maintained at all times. Collateral is either in the form of cash, which can be invested in certain money market mutual funds managed by Dreyfus, or U.S. Government and Agency securities. The fund is entitled to receive all dividends, interest and distributions on securities loaned, in addition to income earned as a result of the lending transaction. Should a borrower fail to return the securities in a timely manner, The Bank of New York Mellon is required to replace the securities for the benefit of the fund or credit the fund with the market value of the unreturned securities and is subrogated to the fund’s rights against the borrower and the collateral. Additionally, the contractual maturity of security lending transactions are on an overnight and continuous basis. During the period ended August 31, 2016, The Bank of New York Mellon earned $153,388 from lending portfolio securities, pursuant to the securities lending agreement.
(c) Affiliated issuers: Investments in other investment companies advised by Dreyfus are defined as “affiliated” under the Act. Investments in affiliated investment companies during the period ended August 31, 2016 were as follows:
18
| | | | | | |
Affiliated Investment Company | Value 8/31/2015 ($) | Purchases ($) | Sales ($) | Value
8/31/2016 ($) | Net
Assets (%) |
Dreyfus Institutional Cash Advantage Fund, Institutional Shares | 69,388,897 | 597,458,480 | 600,934,100 | 65,913,277 | 8.2 |
Dreyfus Institutional Preferred Government Plus Money Market Fund† | 5,945,821 | 251,080,702 | 244,553,103 | 12,473,420 | 1.6 |
Total | 75,334,718 | 848,539,182 | 845,487,203 | 78,386,697 | 9.8 |
† Formerly Dreyfus Institutional Preferred Plus Money Market Fund.
(d) Dividends to shareholders: Dividends are recorded on the ex-dividend date. Dividends from investment income-net and dividends from net realized capital gains, if any, are normally declared and paid annually, but the fund may make distributions on a more frequent basis to comply with the distribution requirements of the Internal Revenue Code of 1986, as amended (the “Code”). To the extent that net realized capital gains can be offset by capital loss carryovers, it is the policy of the fund not to distribute such gains. Income and capital gain distributions are determined in accordance with income tax regulations, which may differ from GAAP.
(e) Federal income taxes: It is the policy of the fund to continue to qualify as a regulated investment company, if such qualification is in the best interests of its shareholders, by complying with the applicable provisions of the Code, and to make distributions of taxable income sufficient to relieve it from substantially all federal income and excise taxes.
As of and during the period ended August 31, 2016, the fund did not have any liabilities for any uncertain tax positions. The fund recognizes interest and penalties, if any, related to uncertain tax positions as income tax expense in the Statement of Operations. During the period ended August 31, 2016, the fund did not incur any interest or penalties.
Each tax year in the four–year period ended August 31, 2016 remains subject to examination by the Internal Revenue Service and state taxing authorities.
At August 31, 2016, the components of accumulated earnings on a tax basis were as follows: accumulated capital losses $5,572,906 and unrealized appreciation $87,427,637. In addition, the fund had $3,311,649 of capital
19
NOTES TO FINANCIAL STATEMENTS (continued)
losses realized after October 31, 2015 and late year ordinary losses of $1,578,954, which were deferred for tax purposes to the first day of the following fiscal year.
Under the Regulated Investment Company Modernization Act of 2010 (the “2010 Act”), the fund is permitted to carry forward capital losses incurred in taxable years beginning after December 22, 2010 (“post-enactment losses”) for an unlimited period. Furthermore, post-enactment capital loss carryovers retain their character as either short-term or long-term capital losses rather than short-term as they were under previous statute. The 2010 Act requires post-enactment losses to be utilized before the utilization of losses incurred in taxable years prior to the effective date of the 2010 Act (“pre-enactment losses”). As a result of this ordering rule, pre-enactment losses may be more likely to expire unused.
As a result of the fund’s merger with Dreyfus Emerging Leaders Fund, capital losses of $5,572,906 are available to offset future realized gains, if any. Based on certain provisions in the Code, the amount of losses which can be utilized in subsequent years is subject to an annual limitation. If not applied, these acquired capital losses expire in fiscal year 2017.
The tax character of distributions paid to shareholders during the fiscal periods ended August 31, 2016 and August 31, 2015 were as follows: ordinary income $2,918,692 and $37,560,707, and long-term capital gains $30,556,982 and $98,700,359, respectively.
During the period ended August 31, 2016, as a result of permanent book to tax differences, primarily due to the tax treatment for dividend reclassification, passive foreign investment companies, taxable over-distribution and real estate investment trusts, the fund increased accumulated undistributed investment income-net by $4,918,186, decreased accumulated net realized gain (loss) on investments by $1,607,332 and decreased paid-in capital by $3,310,854. Net assets and net asset value per share were not affected by this reclassification.
NOTE 2—Bank Lines of Credit:
The fund participates with other Dreyfus-managed funds in a $555 million unsecured credit facility led by Citibank, N.A. and a $300 million unsecured credit facility provided by The Bank of New York Mellon (each, a “Facility”), each to be utilized primarily for temporary or emergency purposes, including the financing of redemptions. Prior to January 11, 2016, the unsecured credit facility with Citibank, N.A. was $480 million and prior to October 7, 2015, the unsecured credit facility with Citibank, N.A. was $430 million. In connection therewith, the fund has agreed to pay its pro rata portion of commitment fees for each Facility. Interest is
20
charged to the fund based on rates determined pursuant to the terms of the respective Facility at the time of borrowing.
The average amount of borrowings outstanding under the Facilities during the period ended August 31, 2016 was approximately $742,400 with a related weighted average annualized interest rate of 1.16%.
NOTE 3—Management Fee and Other Transactions with Affiliates:
(a) Pursuant to a management agreement with Dreyfus, the management fee is computed at the annual rate of .75% of the value of the fund’s average daily net assets and is payable monthly.
(b) Under the Shareholder Services Plan, the fund pays the Distributor for the provision of certain services, at an annual rate of .25% of the value of the fund’s average daily net assets. The services provided may include personal services relating to shareholder accounts, such as answering shareholder inquiries regarding the fund and providing reports and other information, and services related to the maintenance of shareholder accounts. The Distributor may make payments to Service Agents (securities dealers, financial institutions or other industry professionals) with respect to these services. The Distributor determines the amounts to be paid to Service Agents. During the period ended August 31, 2016, the fund was charged $2,013,496 pursuant to the Shareholder Services Plan.
The fund has arrangements with the transfer agent and the custodian whereby the fund may receive earnings credits when positive cash balances are maintained, which are used to offset transfer agency and custody fees. For financial reporting purposes, the fund includes net earnings credits as an expense offset in the Statement of Operations.
The fund compensates Dreyfus Transfer, Inc., a wholly-owned subsidiary of Dreyfus, under a transfer agency agreement for providing transfer agency and cash management services for the fund. The majority of transfer agency fees are comprised of amounts paid on a per account basis, while cash management fees are related to fund subscriptions and redemptions. During the period ended August 31, 2016, the fund was charged $99,826 for transfer agency services and $8,114 for cash management services. These fees are included in Shareholder servicing costs in the Statement of Operations. Cash management fees were partially offset by earnings credits of $2,800.
The fund compensates The Bank of New York Mellon under a custody agreement for providing custodial services for the fund. These fees are determined based on net assets, geographic region and transaction activity.
21
NOTES TO FINANCIAL STATEMENTS (continued)
During the period ended August 31, 2016, the fund was charged $95,527 pursuant to the custody agreement.
During the period ended August 31, 2016, the fund was charged $9,967 for services performed by the Chief Compliance Officer and his staff.
The components of “Due to The Dreyfus Corporation and affiliates” in the Statement of Assets and Liabilities consist of: management fees $509,539, Shareholder Services Plan fees $169,847, custodian fees $46,110, Chief Compliance Officer fees $6,416 and transfer agency fees $21,350.
(c) Each Board member also serves as a Board member of other funds within the Dreyfus complex. Annual retainer fees and attendance fees are allocated to each fund based on net assets.
NOTE 4—Securities Transactions:
The aggregate amount of purchases and sales of investment securities, excluding short-term securities, during the period ended August 31, 2016, amounted to $662,981,125 and $807,774,323, respectively.
At August 31, 2016, the cost of investments for federal income tax purposes was $784,998,814; accordingly, accumulated net unrealized appreciation on investments was $87,427,637, consisting of $122,241,119 gross unrealized appreciation and $34,813,482 gross unrealized depreciation.
NOTE 5—Subsequent Event:
On September 8, 2016, the Board approved, effective September 30, 2016, a proposal to commence offering Class I and Class Y shares as new classes of shares of the fund, and the redesignation of existing shares as Investor shares.
22
REPORT OF INDEPENDENT REGISTERED
PUBLIC ACCOUNTING FIRM
Shareholders and Board of Directors
Dreyfus Opportunistic Small Cap Fund
We have audited the accompanying statement of assets and liabilities, including the statement of investments, of Dreyfus Opportunistic Small Cap Fund (one of the series comprising Advantage Funds, Inc.) as of August 31, 2016, and the related statement of operations for the year then ended, the statement of changes in net assets for each of the two years in the period then ended, and the financial highlights for each of the five years in the period then ended. These financial statements and financial highlights are the responsibility of the Fund’s management. Our responsibility is to express an opinion on these financial statements and financial highlights based on our audits.
We conducted our audits in accordance with the standards of the Public Company Accounting Oversight Board (United States). Those standards require that we plan and perform the audit to obtain reasonable assurance about whether the financial statements and financial highlights are free of material misstatement. We were not engaged to perform an audit of the Fund’s internal control over financial reporting. Our audits included consideration of internal control over financial reporting as a basis for designing audit procedures that are appropriate in the circumstances, but not for the purpose of expressing an opinion on the effectiveness of the Fund’s internal control over financial reporting. Accordingly, we express no such opinion. An audit also includes examining, on a test basis, evidence supporting the amounts and disclosures in the financial statements and financial highlights, assessing the accounting principles used and significant estimates made by management, and evaluating the overall financial statement presentation. Our procedures included confirmation of securities owned as of August 31, 2016 by correspondence with the custodian and others. We believe that our audits provide a reasonable basis for our opinion.
In our opinion, the financial statements and financial highlights referred to above present fairly, in all material respects, the financial position of Dreyfus Opportunistic Small Cap Fund at August 31, 2016, the results of its operations for the year then ended, the changes in its net assets for each of the two years in the period then ended, and the financial highlights for each of the five years in the period then ended, in conformity with U.S. generally accepted accounting principles.

New York, New York
October 27, 2016
23
IMPORTANT TAX INFORMATION (Unaudited)
For federal tax purposes, the fund hereby reports 100% of the ordinary dividends paid during the fiscal year ended August 31, 2016 as qualifying for the corporate dividends received deduction. Also, certain dividends paid by the fund may be subject to a maximum tax rate of 15%, as provided for by the Jobs and Growth Tax Relief Reconciliation Act of 2003. Of the distributions paid during the fiscal year, $2,918,692 represents the maximum amount that may be considered qualified dividend income. The fund also hereby reports $1.0722 per share as a long-term capital gain distribution paid on December 16, 2015. Shareholders will receive notification in early 2017 of the percentage applicable to the preparation of their 2016 income tax returns.
24
BOARD MEMBERS INFORMATION (Unaudited)
INDEPENDENT BOARD MEMBERS
Joseph S. DiMartino (72)
Chairman of the Board (1995)
Principal Occupation During Past 5 Years:
· Corporate Director and Trustee (1995-present)
Other Public Company Board Memberships During Past 5 Years:
· CBIZ (formerly, Century Business Services, Inc.), a provider of outsourcing functions for small and medium size companies, Director (1997-present)
No. of Portfolios for which Board Member Serves: 136
———————
Peggy C. Davis (73)
Board Member (2006)
Principal Occupation During Past 5 Years:
· Shad Professor of Law, New York University School of Law (1983-present)
No. of Portfolios for which Board Member Serves: 49
———————
David P. Feldman (76)
Board Member (1996)
Principal Occupation During Past 5 Years:
· Corporate Director and Trustee (1985-present)
Other Public Company Board Memberships During Past 5 Years:
· BBH Mutual Funds Group (5 registered mutual funds), Director (1992-2014)
No. of Portfolios for which Board Member Serves: 35
———————
Ehud Houminer (76)
Board Member (1993)
Principal Occupation During Past 5 Years:
· Executive-in-Residence at the Columbia Business School, Columbia
University (1992-present)
Other Public Company Board Memberships During Past 5 Years:
· Avnet, Inc., an electronics distributor, Director (1993-2012)
No. of Portfolios for which Board Member Serves: 59
———————
25
BOARD MEMBERS INFORMATION (Unaudited) (continued)
INDEPENDENT BOARD MEMBERS (continued)
Lynn Martin (76)
Board Member (2012)
Principal Occupation During Past 5 Years:
· President of The Martin Hall Group LLC, a human resources consulting firm (2005-2012)
Other Public Company Board Memberships During Past 5 Years:
· AT&T, Inc., a telecommunications company, Director (1999-2012)
· Ryder System, Inc., a supply chain and transportation management company, Director (1993-2012)
No. of Portfolios for which Board Member Serves: 35
———————
Robin A. Melvin (52)
Board Member (2012)
Principal Occupation During Past 5 Years:
· Co-chairman, Illinois Mentoring Partnership, non-profit organization dedicated to increasing the quantity and quality of mentoring services in Illinois; (2014-present; served as a board member since 2013)
· Director, Boisi Family Foundation, a private family foundation that supports youth-serving organizations that promote the self sufficiency of youth from disadvantaged circumstances (1995-2012)
No. of Portfolios for which Board Member Serves: 108
———————
Dr. Martin Peretz (77)
Board Member (2006)
Principal Occupation During Past 5 Years:
· Editor-in-Chief Emeritus of The New Republic Magazine (2011-2012) (previously,
Editor-in-Chief, 1974-2011)
· Director of TheStreet.com, a financial information service on the web (1996-2010)
· Lecturer at Harvard University (1969-2012)
No. of Portfolios for which Board Member Serves: 35
———————
Once elected all Board Members serve for an indefinite term, but achieve Emeritus status upon reaching age 80. The address of the Board Members and Officers is c/o The Dreyfus Corporation, 200 Park Avenue, New York, New York 10166. Additional information about the Board Members is available in the fund’s Statement of Additional Information which can be obtained from Dreyfus free of charge by calling this toll free number: 1-800-DREYFUS.
James F. Henry, Emeritus Board Member
Dr. Paul A. Marks, Emeritus Board Member
Philip L. Toia, Emeritus Board Member
26
OFFICERS OF THE FUND (Unaudited)
BRADLEY J. SKAPYAK, President since January 2010.
Chief Operating Officer and a director of the Manager since June 2009, Chairman of Dreyfus Transfer, Inc., an affiliate of the Manager and the transfer agent of the funds, since May 2011 and Executive Vice President of the Distributor since June 2007. From April 2003 to June 2009, Mr. Skapyak was the head of the Investment Accounting and Support Department of the Manager. He is an officer of 65 investment companies (comprised of 136 portfolios) managed by the Manager. He is 57 years old and has been an employee of the Manager since February 1988.
BENNETT A. MACDOUGALL, Chief Legal Officer since October 2015.
Chief Legal Officer of the Manager since June 2015; from June 2005 to June 2015, he served in various capacities with Deutsche Bank – Asset & Wealth Management Division, including as Director and Associate General Counsel, and Chief Legal Officer of Deutsche Investment Management Americas Inc. from June 2012 to May 2015. He is an officer of 66 investment companies (comprised of 161 portfolios) managed by the Manager. He is 44 years old and has been an employee of the Manager since June 2015.
JANETTE E. FARRAGHER, Vice President and Secretary since December 2011.
Assistant General Counsel of BNY Mellon, and an officer of 66 investment companies (comprised of 161 portfolios) managed by the Manager. She is 53 years old and has been an employee of the Manager since February 1984.
JAMES BITETTO, Vice President and Assistant Secretary since August 2005.
Managing Counsel of BNY Mellon and Secretary of the Manager, and an officer of 66 investment companies (comprised of 161 portfolios) managed by the Manager. He is 50 years old and has been an employee of the Manager since December 1996.
JONI LACKS CHARATAN, Vice President and Assistant Secretary since August 2005.
Managing Counsel of BNY Mellon, and an officer of 66 investment companies (comprised of 161 portfolios) managed by the Manager. She is 60 years old and has been an employee of the Manager since October 1988.
JOSEPH M. CHIOFFI, Vice President and Assistant Secretary since August 2005.
Managing Counsel of BNY Mellon, and an officer of 66 investment companies (comprised of 161 portfolios) managed by the Manager. He is 54 years old and has been an employee of the Manager since June 2000.
MAUREEN E. KANE, Vice President and Assistant Secretary since April 2015.
Managing Counsel of BNY Mellon since July 2014; from October 2004 until July 2014, General Counsel, and from May 2009 until July 2014, Chief Compliance Officer of Century Capital Management. She is an officer of 66 investment companies (comprised of 161 portfolios) managed by the Manager. She is 54 years old and has been an employee of the Manager since July 2014.
SARAH S. KELLEHER, Vice President and Assistant Secretary since April 2014.
Senior Counsel of BNY Mellon, and an officer of 66 investment companies (comprised of 161 portfolios) managed by the Manager; from August 2005 to March 2013, Associate General Counsel of Third Avenue Management. She is 40 years old and has been an employee of the Manager since March 2013.
JEFF PRUSNOFSKY, Vice President and Assistant Secretary since August 2005.
Senior Managing Counsel of BNY Mellon, and an officer of 66 investment companies (comprised of 161 portfolios) managed by the Manager. He is 51 years old and has been an employee of the Manager since October 1990.
JAMES WINDELS, Treasurer since November 2001.
Director – Mutual Fund Accounting of the Manager, and an officer of 66 investment companies (comprised of 161 portfolios) managed by the Manager. He is 57 years old and has been an employee of the Manager since April 1985.
RICHARD CASSARO, Assistant Treasurer since January 2008.
Senior Accounting Manager – Money Market, Municipal Bond and Equity Funds of the Manager, and an officer of 66 investment companies (comprised of 161 portfolios) managed by the Manager. He is 57 years old and has been an employee of the Manager since September 1982.
27
OFFICERS OF THE FUND (Unaudited) (continued)
GAVIN C. REILLY, Assistant Treasurer since December 2005.
Tax Manager of the Investment Accounting and Support Department of the Manager, and an officer of 66 investment companies (comprised of 161 portfolios) managed by the Manager. He is 48 years old and has been an employee of the Manager since April 1991.
ROBERT S. ROBOL, Assistant Treasurer since August 2005.
Senior Accounting Manager of the Manager, and an officer of 66 investment companies (comprised of 161 portfolios) managed by the Manager. He is 52 years old and has been an employee of the Manager since October 1988.
ROBERT SALVIOLO, Assistant Treasurer since July 2007.
Senior Accounting Manager – Equity Funds of the Manager, and an officer of 66 investment companies (comprised of 161 portfolios) managed by the Manager. He is 49 years old and has been an employee of the Manager since June 1989.
ROBERT SVAGNA, Assistant Treasurer since December 2002.
Senior Accounting Manager – Fixed Income and Equity Funds of the Manager, and an officer of 66 investment companies (comprised of 161 portfolios) managed by the Manager. He is 49 years old and has been an employee of the Manager since November 1990.
JOSEPH W. CONNOLLY, Chief Compliance Officer since October 2004.
Chief Compliance Officer of the Manager and The Dreyfus Family of Funds (66 investment companies, comprised of 161 portfolios). He is 59 years old and has served in various capacities with the Manager since 1980, including manager of the firm’s Fund Accounting Department from 1997 through October 2001.
CARIDAD M. CAROSELLA, Anti-Money Laundering Compliance Officer since January 2016
Anti-Money Laundering Compliance Officer of the Dreyfus Family of Funds and BNY Mellon Funds Trust since January 2016; from May 2015 to December 2015, Interim Anti-Money Laundering Compliance Officer of the Dreyfus Family of Funds and BNY Mellon Funds Trust and the Distributor; from January 2012 to May 2015, AML Surveillance Officer of the Distributor and from 2007 to December 2011, Financial Processing Manager of the Distributor. She is an officer of 61 investment companies (comprised of 156 portfolios) managed by the Manager. She is 48 years old and has been an employee of the Distributor since 1997.
28
NOTES
29
Dreyfus Opportunistic Small Cap Fund
200 Park Avenue
New York, NY 10166
Manager
The Dreyfus Corporation
200 Park Avenue
New York, NY 10166
Custodian
The Bank of New York Mellon
225 Liberty Street
New York, NY 10286
Transfer Agent &
Dividend Disbursing Agent
Dreyfus Transfer, Inc.
200 Park Avenue
New York, NY 10166
Distributor
MBSC Securities Corporation
200 Park Avenue
New York, NY 10166
Telephone Call your financial representative or 1-800-DREYFUS
Mail The Dreyfus Family of Funds, 144 Glenn Curtiss Boulevard, Uniondale, NY 11556-0144
E-mail Send your request to info@dreyfus.com
Internet Information can be viewed online or downloaded at www.dreyfus.com
The fund files its complete schedule of portfolio holdings with the Securities and Exchange Commission (“SEC”) for the first and third quarters of each fiscal year on Form N-Q. The fund’s Forms N-Q are available on the SEC’s website at www.sec.gov and may be reviewed and copied at the SEC’s Public Reference Room in Washington, DC. (phone 1-800-SEC-0330 for information).
A description of the policies and procedures that the fund uses to determine how to vote proxies relating to portfolio securities and information regarding how the fund voted these proxies for the most recent 12-month period ended June 30 is available at www.dreyfus.com and on the SEC’s website at www.sec.gov and without charge, upon request, by calling 1-800-DREYFUS.
| | |
© 2016 MBSC Securities Corporation
0253AR0816 | 
|
Dreyfus Opportunistic U.S. Stock Fund
| | | |

| | ANNUAL REPORT August 31, 2016 |
| |
Save time. Save paper. View your next shareholder report online as soon as it’s available. Log into www.dreyfus.com and sign up for Dreyfus eCommunications. It’s simple and only takes a few minutes. |
| |
The views expressed in this report reflect those of the portfolio manager only through the end of the period covered and do not necessarily represent the views of Dreyfus or any other person in the Dreyfus organization. Any such views are subject to change at any time based upon market or other conditions and Dreyfus disclaims any responsibility to update such views. These views may not be relied on as investment advice and, because investment decisions for a Dreyfus fund are based on numerous factors, may not be relied on as an indication of trading intent on behalf of any Dreyfus fund. |
| |
Not FDIC-Insured • Not Bank-Guaranteed • May Lose Value |
Contents
T H E F U N D
F O R M O R E I N F O R M AT I O N
Back Cover
| | | | |
| |
Dreyfus Opportunistic U.S. Stock Fund
| | The Fund |
A LETTER FROM THE CHIEF EXECUTIVE OFFICER
Dear Shareholder:
We are pleased to present this annual report for Dreyfus Opportunistic U.S. Stock Fund, covering the 12-month period from September 1, 2015 through August 31, 2016. For information about how the fund performed during the reporting period, as well as general market perspectives, we provide a Discussion of Fund Performance on the pages that follow.
Despite tumultuous swings in market sentiment stemming from global economic developments, stocks and bonds generally produced strong returns over the reporting period. During the fall of 2015, investors reacted cautiously to sluggish global economic growth, plummeting commodity prices, and the first increase in short-term U.S. interest rates in nearly a decade. These worries sparked particularly sharp declines in equities in January 2016, but investor sentiment soon improved when U.S. monetary policymakers refrained from additional rate hikes, other central banks eased their monetary policies further, and commodity prices rebounded. Stocks mostly rallied over the ensuing months, driving several broad measures of stock market performance to new record highs. In the bond market, aggressively accommodative monetary policies and robust investor demand for current income sent yields of high-quality sovereign bonds lower and their prices higher.
Recently we have seen evidence that investors may be shifting their focus away from macroeconomic influences and toward underlying company and industry fundamentals. This development—along with wide differences in underlying fundamental and technical influences across various asset classes, economic sectors, and regional markets—suggests that selectivity may be a more important determinant of investment success over the months ahead. As always, we encourage you to discuss the implications of our observations with your financial advisor.
Thank you for your continued confidence and support.
Sincerely,

Mark D. Santero
Chief Executive Officer
The Dreyfus Corporation
September 15, 2016
2
DISCUSSION OF FUND PERFORMANCE
For the period from September 1, 2015 through August 31, 2016, as provided by David A. Daglio and Elizabeth Slover, Primary Portfolio Managers
Market and Fund Performance Overview
For the 12-month period ended August 31, 2016, Dreyfus Opportunistic U.S. Stock Fund’s Class A shares produced a total return of 2.07%, Class C shares returned 1.33%, Class I shares returned 2.37%, and Class Y shares returned 2.37%.1 In comparison, the fund’s benchmark, the Russell 3000® Index (the “Index”), produced a total return of 11.44%.2
U.S. stocks generally achieved double-digit returns when a rally over the reporting period’s second half more than erased losses from the first half. Shortfalls in the information technology, health care, and financials sectors dampened the fund’s results compared to its benchmark.
The Fund’s Investment Approach
The fund seeks long-term capital appreciation. The fund normally invests at least 80% of its assets in the stocks of publicly traded companies located in the United States. The fund may invest in the stocks of companies of any market capitalization and may hold growth or value stocks or a blend of both.
Stocks are selected for the fund’s portfolio based on a combination of fundamental, bottom-up research, macro insights, and risk management. With support from a team of research analysts, we use a disciplined, opportunistic investment approach to identify stocks of companies that we believe to be attractive from a valuation and fundamental standpoint, including those that are trading materially below our estimate of intrinsic market value, those that have strong or improving fundamentals, and those that have a revaluation catalyst. We focus on understanding the current fundamentals driving a company’s profits and cash flow, valuing the liabilities most likely to impact the company’s business, and evaluating business conditions most likely to affect the company’s prospects for future growth.
Stocks Advanced Strongly Despite Headwinds
Stocks across all capitalization ranges proved volatile over the final months of 2015 in the midst of persistently sluggish global growth. In January 2016, equity markets suffered particularly severe declines due to disappointing economic data in China, plunging commodity prices, and worries that higher short-term interest rates might weigh on the U.S. economic recovery. The markets changed direction in mid-February, as investors responded positively to relatively strong U.S. economic data and better-than-expected corporate earnings. The market rally continued through the spring when U.S. monetary policymakers refrained from implementing additional rate hikes, commodity prices rebounded, and foreign currencies strengthened against the U.S. dollar. Although a referendum in the United Kingdom to leave the European Union introduced renewed market turmoil in June, equity markets bounced back quickly, enabling the Index to post solidly positive returns for the reporting period overall.
Income-Oriented Stocks Led Market’s Advance
In this environment, companies generally were not rewarded for exhibiting attractive fundamental characteristics. Instead, investors seeking higher levels of income than were available from high-quality sovereign bonds turned to dividend-paying stocks in traditionally defensive market sectors, such as utilities and real estate investment trusts (REITs). Consequently, the fund’s security selections lagged market averages.
3
DISCUSSION OF FUND PERFORMANCE (continued)
Results in the information technology sector also were undermined by network management company Infoblox and thin film equipment specialist Veeco Instruments, which have not yet achieved expected business turnarounds. In the health care sector, results were hampered when smaller drug developers, such as Jazz Pharmaceuticals and Flamel Technologies, succumbed to negative industry trends stemming from waning new product pipelines and pricing pressures. The financials sector was hampered by persistently low interest rates, which investors worried might weigh on the profit margins of fund holdings such as SVB Financial, E*TRADE Financial and Synchrony Financial. Meanwhile, residential real estate agency franchisor Realogy Holdings did not benefit as expected from a recovering housing market.
The fund produced better relative results in the energy sector, where a cautious investment posture helped cushion the impact of the commodities-related downturn. Our timing proved favorable when we began to increase the fund’s energy holdings in the spring through a new investment in Pioneer Natural Resources, which has lowered operating costs while increasing production. Internet retailer Amazon.com ranked as the top contributor in the consumer staples sector, and media companies CBS Corp. and Interpublic Group benefited from greater advertising spending. Finally, in the materials sector, paint manufacturer Valspar was acquired by a former rival, and the fund benefited from favorable timing in the trading of agricultural commodities producer Mosaic.
Maintaining a Focus on Fundamentals
In our analysis, investors are likely to return their focus to underlying company fundamentals as global economic and political conditions stabilize. We have maintained the fund’s research-driven investment approach, which favors companies with attractive valuations and underappreciated cash flow potential. As of the reporting period’s end, we have identified an ample number of stocks meeting our criteria in the information technology and financials sectors, but relatively few in the more richly valued utilities, REITs, and consumer staples sectors.
September 15, 2016
Please note, the position in any security highlighted with italicized typeface was sold during the reporting period.
Equities are subject generally to market, market sector, market liquidity, issuer, and investment style risks, among other factors, to varying degrees, all of which are more fully described in the fund’s prospectus.
Stocks of small- and/or mid-cap companies often experience sharper price fluctuations than stocks of large-cap companies.
The fund’s performance will be influenced by political, social, and economic factors affecting investments in foreign companies. Special risks associated with investments in foreign companies include exposure to currency fluctuations, less liquidity, less developed or less efficient trading markets, lack of comprehensive company information, political instability, and differing auditing and legal standards. These risks are enhanced in emerging market countries. Please read the prospectus for further discussion of these risks.
1 Total return includes reinvestment of dividends and any capital gains paid and does not take into consideration the maximum initial sales charge in the case of Class A shares, or the applicable contingent deferred sales charge imposed on redemptions in the case of Class C shares. Had these charges been reflected, returns would have been lower. Past performance is no guarantee of future results. Share price and investment return fluctuate such that upon redemption, fund shares may be worth more or less than their original cost. The fund’s returns reflect the absorption of certain fund expenses by The Dreyfus Corporation pursuant to an agreement in effect through January 1, 2017, at which time it may be extended, terminated, or modified. Had these expenses not been absorbed, the fund’s returns would have been lower.
2 Source: Lipper Inc. — Reflects the reinvestment of dividends and, where applicable, capital gain distributions. The Russell 3000® Index is composed of the 3,000 largest U.S. companies based on total market capitalization. Investors cannot invest directly in any index.
4
FUND PERFORMANCE
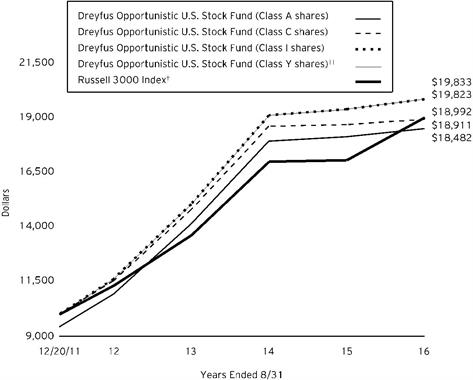
Comparison of change in value of $10,000 investment in Dreyfus Opportunistic U.S. Stock Fund Class A shares, Class C shares, Class I shares and Class Y shares and the Russell 3000 Index
† Source: Lipper Inc.
†† The total return figures presented for Class Y shares of the fund reflect the performance of the fund’s Class I shares for the period prior to 5/1/15 (the inception date for Class Y shares).
Past performance is not predictive of future performance.
The above graph compares a $10,000 investment made in each of the Class A, Class C, Class I and Class Y shares of Dreyfus Opportunistic U.S. Stock Fund on 12/20/11 (inception date) to a $10,000 investment made in the Russell 3000 Index (the “Index”) on that date. All dividends and capital gain distributions are reinvested.
The fund’s performance shown in the line graph above takes into account the maximum initial sales charge on Class A shares and all other applicable fees and expenses on all classes. The Index measures the performance of the largest 3,000 U.S. companies representing approximately 98% of the investable U.S. equity market. Unlike a mutual fund, the Index is not subject to charges, fees and other expenses. Investors cannot invest directly in any index. Further information relating to fund performance, including expense reimbursements, if applicable, is contained in the Financial Highlights section of the prospectus and elsewhere in this report.
5
FUND PERFORMANCE (continued)
| | | | | | |
Average Annual Total Returns as of 8/31/16 | | | |
| | Inception | | | From | |
| Date | 1 Year | | Inception | |
Class A shares | | | | | |
with maximum sales charge (5.75%) | 12/20/11 | -3.82% | | 13.96% | |
without sales charge | 12/20/11 | 2.07% | | 15.40% | |
Class C shares | | | | | |
with applicable redemption charge† | 12/20/11 | 0.35% | | 14.52% | |
without redemption | 12/20/11 | 1.33% | | 14.52% | |
Class I shares | 12/20/11 | 2.37% | | 15.67% | |
Class Y shares | 5/1/15 | 2.37% | †† | 15.68% | †† |
Russell 3000 Index | 12/31/11 | 11.44% | | 14.73% | ††† |
Past performance is not predictive of future performance. The fund’s performance shown in the graph and table does not reflect the deduction of taxes that a shareholder would pay on fund distributions or the redemption of fund shares. In addition to the performance of Class A shares shown with and without a maximum sales charge, the fund’s performance shown in the table takes into account all other applicable fees and expenses on all classes.
† The maximum contingent deferred sales charge for Class C shares is 1% for shares redeemed within one year of the date of purchase.
†† The total return figures presented for Class Y shares of the fund reflect the performance of the fund’s Class I shares for the period prior to 5/1/15 (the inception date for Class Y shares).
††† For comparative purposes, the value of the Index on 12/31/11 is used as the beginning value on 12/20/11.
6
UNDERSTANDING YOUR FUND’S EXPENSES (Unaudited)
As a mutual fund investor, you pay ongoing expenses, such as management fees and other expenses. Using the information below, you can estimate how these expenses affect your investment and compare them with the expenses of other funds. You also may pay one-time transaction expenses, including sales charges (loads) and redemption fees, which are not shown in this section and would have resulted in higher total expenses. For more information, see your fund’s prospectus or talk to your financial adviser.
Review your fund’s expenses
The table below shows the expenses you would have paid on a $1,000 investment in Dreyfus Opportunistic U.S. Stock Fund from March 1, 2016 to August 31, 2016. It also shows how much a $1,000 investment would be worth at the close of the period, assuming actual returns and expenses.
| | | | | | | | | | | | |
Expenses and Value of a $1,000 Investment | | |
assuming actual returns for the six months ended August 31, 2016 |
| | | | | | | | |
| | | | Class A | Class C | Class I | Class Y |
Expenses paid per $1,000† | | $6.42 | | $10.40 | | $5.08 | | $5.08 |
Ending value (after expenses) | | $1,126.90 | | $1,122.40 | | $1,128.10 | | $1,128.70 |
COMPARING YOUR FUND’S EXPENSES
WITH THOSE OF OTHER FUNDS (Unaudited)
Using the SEC’s method to compare expenses
The Securities and Exchange Commission (SEC) has established guidelines to help investors assess fund expenses. Per these guidelines, the table below shows your fund’s expenses based on a $1,000 investment, assuming a hypothetical 5% annualized return. You can use this information to compare the ongoing expenses (but not transaction expenses or total cost) of investing in the fund with those of other funds. All mutual fund shareholder reports will provide this information to help you make this comparison. Please note that you cannot use this information to estimate your actual ending account balance and expenses paid during the period.
| | | | | | | | | | | | |
Expenses and Value of a $1,000 Investment | | |
assuming a hypothetical 5% annualized return for the six months ended August 31, 2016 |
| | | | | | | | |
| | | | Class A | Class C | Class I | Class Y |
Expenses paid per $1,000† | | $6.09 | | $9.88 | | $4.82 | | $4.82 |
Ending value (after expenses) | | $1,019.10 | | $1,015.33 | | $1,020.36 | | $1,020.36 |
† Expenses are equal to the fund’s annualized expense ratio of 1.20% for Class A, 1.95% for Class C, .95% for Class I and .95% for Class Y, multiplied by the average account value over the period, multiplied by 184/366 (to reflect the one-half year period).
7
STATEMENT OF INVESTMENTS
August 31, 2016
| | | | | | |
| |
Common Stocks - 100.2% | | Shares | | Value ($) | |
Banks - 6.5% | | | | | |
Bank of America | | 65,245 | | 1,053,054 | |
Citigroup | | 15,558 | | 742,739 | |
| | | | | 1,795,793 | |
Capital Goods - 5.6% | | | | | |
Honeywell International | | 6,801 | | 793,745 | |
Snap-on | | 4,867 | | 746,062 | |
| | | | | 1,539,807 | |
Consumer Services - 1.1% | | | | | |
Penn National Gaming | | 21,388 | a | 303,282 | |
Diversified Financials - 14.5% | | | | | |
BlackRock | | 2,038 | | 759,787 | |
E*TRADE Financial | | 19,029 | a | 501,985 | |
Intercontinental Exchange | | 3,712 | | 1,046,858 | |
SLM | | 62,471 | a | 463,222 | |
Synchrony Financial | | 43,208 | | 1,202,479 | |
| | | | | 3,974,331 | |
Energy - 7.3% | | | | | |
Pioneer Natural Resources | | 6,291 | | 1,126,404 | |
Superior Energy Services | | 51,434 | | 865,634 | |
| | | | | 1,992,038 | |
Exchange-Traded Funds - 3.9% | | | | | |
SPDR S&P 500 ETF Trust | | 2,480 | | 539,102 | |
Vanguard S&P 500 ETF | | 2,702 | | 539,103 | |
| | | | | 1,078,205 | |
Food, Beverage & Tobacco - 5.6% | | | | | |
Coca-Cola | | 13,187 | | 572,711 | |
ConAgra Foods | | 9,665 | | 450,486 | |
Molson Coors Brewing, Cl. B | | 4,922 | | 503,619 | |
| | | | | 1,526,816 | |
Health Care Equipment & Services - 4.7% | | | | | |
Abbott Laboratories | | 14,460 | | 607,609 | |
Brookdale Senior Living | | 39,042 | a | 671,913 | |
| | | | | 1,279,522 | |
Insurance - 2.0% | | | | | |
Marsh & McLennan Cos. | | 8,269 | | 559,232 | |
Media - 3.7% | | | | | |
CBS, Cl. B | | 10,839 | | 553,114 | |
8
| | | | | | |
| |
Common Stocks - 100.2% (continued) | | Shares | | Value ($) | |
Media - 3.7% (continued) | | | | | |
Starz, Cl. A | | 14,583 | a | 454,844 | |
| | | | | 1,007,958 | |
Pharmaceuticals, Biotechnology & Life Sciences - 4.9% | | | | | |
Allergan | | 2,372 | a | 556,329 | |
Mylan | | 18,499 | a | 783,618 | |
| | | | | 1,339,947 | |
Retailing - 6.6% | | | | | |
Amazon.com | | 1,472 | a | 1,132,203 | |
J.C. Penney | | 40,477 | a,b | 381,698 | |
Staples | | 35,879 | | 307,124 | |
| | | | | 1,821,025 | |
Semiconductors & Semiconductor Equipment - 10.6% | | | | | |
Broadcom | | 3,878 | | 684,157 | |
Mellanox Technologies | | 6,297 | a | 276,061 | |
Microchip Technology | | 10,801 | b | 668,690 | |
Power Integrations | | 11,043 | | 644,911 | |
Xilinx | | 11,414 | | 618,753 | |
| | | | | 2,892,572 | |
Software & Services - 18.4% | | | | | |
Alphabet, Cl. C | | 1,286 | a | 986,426 | |
Facebook, Cl. A | | 5,472 | a | 690,129 | |
Fortinet | | 17,561 | a | 634,655 | |
HubSpot | | 9,812 | a | 546,921 | |
Oracle | | 23,667 | | 975,554 | |
salesforce.com | | 9,034 | a | 717,480 | |
Splunk | | 8,286 | a,b | 482,577 | |
| | | | | 5,033,742 | |
Technology Hardware & Equipment - 1.8% | | | | | |
Amphenol, Cl. A | | 7,862 | | 489,881 | |
Transportation - 3.0% | | | | | |
Union Pacific | | 8,540 | | 815,826 | |
Total Common Stocks (cost $25,188,580) | | | | 27,449,977 | |
Other Investment - .4% | | | | | |
Registered Investment Company; | | | | | |
Dreyfus Institutional Preferred Government Plus Money Market Fund
(cost $117,172) | | 117,172 | c | 117,172 | |
9
STATEMENT OF INVESTMENTS (continued)
| | | | | | |
| |
Investment of Cash Collateral for Securities Loaned - 3.2% | | Shares | | Value ($) | |
Registered Investment Company; | | | | | |
Dreyfus Institutional Cash Advantage Fund, Institutional Shares
(cost $860,269) | | 860,269 | c | 860,269 | |
Total Investments (cost $26,166,021) | | 103.8% | | 28,427,418 | |
Liabilities, Less Cash and Receivables | | (3.8%) | | (1,032,912) | |
Net Assets | | 100.0% | | 27,394,506 | |
ETF—Exchange-Traded Fund
SPDR—Standard & Poor's Depository Receipt
a Non-income producing security.
b Security, or portion thereof, on loan. At August 31, 2016, the value of the fund’s securities on loan was $1,320,818 and the value of the collateral held by the fund was $1,364,274, consisting of cash collateral of $860,269 and U.S. Government & Agency securities valued at $504,005.
c Investment in affiliated money market mutual fund.
| | |
Portfolio Summary (Unaudited) † | Value (%) |
Software & Services | 18.4 |
Diversified Financials | 14.5 |
Semiconductors & Semiconductor Equipment | 10.6 |
Energy | 7.3 |
Retailing | 6.6 |
Banks | 6.5 |
Capital Goods | 5.6 |
Food, Beverage & Tobacco | 5.6 |
Pharmaceuticals, Biotechnology & Life Sciences | 4.9 |
Health Care Equipment & Services | 4.7 |
Exchange-Traded Funds | 3.9 |
Media | 3.7 |
Money Market Investments | 3.6 |
Transportation | 3.0 |
Insurance | 2.0 |
Technology Hardware & Equipment | 1.8 |
Consumer Services | 1.1 |
| | 103.8 |
† Based on net assets.
See notes to financial statements.
10
STATEMENT OF ASSETS AND LIABILITIES
August 31, 2016
| | | | | | | |
| | | | | | |
| | | Cost | | Value | |
Assets ($): | | | | |
Investments in securities—See Statement of Investments
(including securities on loan, valued at $1,320,818)—Note 1(b): | | | | |
Unaffiliated issuers | | 25,188,580 | | 27,449,977 | |
Affiliated issuers | | 977,441 | | 977,441 | |
Cash | | | | | 2,738 | |
Dividends and securities lending income receivable | | | | | 29,151 | |
Receivable for shares of Common Stock subscribed | | | | | 891 | |
Prepaid expenses | | | | | 12,304 | |
| | | | | 28,472,502 | |
Liabilities ($): | | | | |
Due to The Dreyfus Corporation and affiliates—Note 3(c) | | | | | 29,852 | |
Liability for securities on loan—Note 1(b) | | | | | 860,269 | |
Payable for shares of Common Stock redeemed | | | | | 141,654 | |
Accrued expenses | | | | | 46,221 | |
| | | | | 1,077,996 | |
Net Assets ($) | | | 27,394,506 | |
Composition of Net Assets ($): | | | | |
Paid-in capital | | | | | 27,215,096 | |
Accumulated undistributed investment income—net | | | | | 10,992 | |
Accumulated net realized gain (loss) on investments | | | | | (2,092,979) | |
Accumulated net unrealized appreciation (depreciation)
on investments | | | | | 2,261,397 | |
Net Assets ($) | | | 27,394,506 | |
| | | | | | |
Net Asset Value Per Share | Class A | Class C | Class I | Class Y | |
Net Assets ($) | 19,133,175 | 3,684,145 | 4,576,228 | 958.46 | |
Shares Outstanding | 979,508 | 195,006 | 232,051 | 48.59 | |
Net Asset Value Per Share ($) | 19.53 | 18.89 | 19.72 | 19.73 | |
See notes to financial statements.
11
STATEMENT OF OPERATIONS
Year Ended August 31, 2016
| | | | | | | |
| | | | | | |
| | | | | | |
Investment Income ($): | | | | |
Income: | | | | |
Cash dividends: | | | | |
Unaffiliated issuers | | | 384,003 | |
Affiliated issuers | | | 317 | |
Income from securities lending—Note 1(b) | | | 3,209 | |
Total Income | | | 387,529 | |
Expenses: | | | | |
Management fee—Note 3(a) | | | 231,511 | |
Shareholder servicing costs—Note 3(c) | | | 86,398 | |
Registration fees | | | 59,649 | |
Professional fees | | | 49,590 | |
Distribution fees—Note 3(b) | | | 24,629 | |
Custodian fees—Note 3(c) | | | 13,211 | |
Prospectus and shareholders’ reports | | | 8,733 | |
Directors’ fees and expenses—Note 3(d) | | | 2,611 | |
Loan commitment fees—Note 2 | | | 477 | |
Interest expense—Note 2 | | | 222 | |
Miscellaneous | | | 20,466 | |
Total Expenses | | | 497,497 | |
Less—reduction in expenses due to undertaking—Note 3(a) | | | (122,057) | |
Less—reduction in fees due to earnings credits—Note 3(c) | | | (183) | |
Net Expenses | | | 375,257 | |
Investment Income—Net | | | 12,272 | |
Realized and Unrealized Gain (Loss) on Investments—Note 4 ($): | | |
Net realized gain (loss) on investments | (2,068,186) | |
Net unrealized appreciation (depreciation) on investments | | | 1,746,372 | |
Net Realized and Unrealized Gain (Loss) on Investments | | | (321,814) | |
Net (Decrease) in Net Assets Resulting from Operations | | (309,542) | |
See notes to financial statements.
12
STATEMENT OF CHANGES IN NET ASSETS
| | | | | | | | | | |
| | | | Year Ended August 31, |
| | | | 2016 | | | | 2015 | a |
Operations ($): | | | | | | | | |
Investment income (loss)—net | | | 12,272 | | | | (47,713) | |
Net realized gain (loss) on investments | | (2,068,186) | | | | 1,270,648 | |
Net unrealized appreciation (depreciation)
on investments | | 1,746,372 | | | | (1,874,142) | |
Net Increase (Decrease) in Net Assets
Resulting from Operations | (309,542) | | | | (651,207) | |
Dividends to Shareholders from ($): | | | | | | | | |
Net realized gain on investments: | | | | | | | | |
Class A | | | (662,767) | | | | (675,244) | |
Class C | | | (100,280) | | | | (44,845) | |
Class I | | | (385,925) | | | | (264,021) | |
Class Y | | | (32) | | | | - | |
Total Dividends | | | (1,149,004) | | | | (984,110) | |
Capital Stock Transactions ($): | | | | | | | | |
Net proceeds from shares sold: | | | | | | | | |
Class A | | | 9,915,500 | | | | 14,045,615 | |
Class C | | | 2,449,294 | | | | 1,503,448 | |
Class I | | | 5,544,984 | | | | 3,494,463 | |
Class Y | | | - | | | | 1,000 | |
Dividends reinvested: | | | | | | | | |
Class A | | | 659,450 | | | | 670,979 | |
Class C | | | 99,756 | | | | 43,988 | |
Class I | | | 229,916 | | | | 8,670 | |
Cost of shares redeemed: | | | | | | | | |
Class A | | | (11,964,075) | | | | (7,702,320) | |
Class C | | | (714,856) | | | | (251,226) | |
Class I | | | (8,588,008) | | | | (152,058) | |
Increase (Decrease) in Net Assets
from Capital Stock Transactions | (2,368,039) | | | | 11,662,559 | |
Total Increase (Decrease) in Net Assets | (3,826,585) | | | | 10,027,242 | |
Net Assets ($): | | | | | | | | |
Beginning of Period | | | 31,221,091 | | | | 21,193,849 | |
End of Period | | | 27,394,506 | | | | 31,221,091 | |
Undistributed investment income—net | 10,992 | | | | - | |
13
STATEMENT OF CHANGES IN NET ASSETS (continued)
| | | | | | | | | | |
| | | | Year Ended August 31, |
| | | | 2016 | | | | 2015 | a |
Capital Share Transactions (Shares): | | | | | | | | |
Class A | | | | | | | | |
Shares sold | | | 517,464 | | | | 678,661 | |
Shares issued for dividends reinvested | | | 33,006 | | | | 34,604 | |
Shares redeemed | | | (642,865) | | | | (386,173) | |
Net Increase (Decrease) in Shares Outstanding | (92,395) | | | | 327,092 | |
Class C | | | | | | | | |
Shares sold | | | 128,867 | | | | 74,344 | |
Shares issued for dividends reinvested | | | 5,134 | | | | 2,314 | |
Shares redeemed | | | (38,658) | | | | (12,492) | |
Net Increase (Decrease) in Shares Outstanding | 95,343 | | | | 64,166 | |
Class I | | | | | | | | |
Shares sold | | | 282,875 | | | | 168,114 | |
Shares issued for dividends reinvested | | | 11,422 | | | | 445 | |
Shares redeemed | | | (470,680) | | | | (7,431) | |
Net Increase (Decrease) in Shares Outstanding | (176,383) | | | | 161,128 | |
Class Y | | | | | | | | |
Shares sold | | | - | | | | 48.59 | |
| | | | | | | | | | |
a Effective May 1, 2015, the fund commenced offering Class Y shares. | |
See notes to financial statements.
14
FINANCIAL HIGHLIGHTS
The following tables describe the performance for each share class for the fiscal periods indicated. All information (except portfolio turnover rate) reflects financial results for a single fund share. Total return shows how much your investment in the fund would have increased (or decreased) during each period, assuming you had reinvested all dividends and distributions. These figures have been derived from the fund’s financial statements.
| | | | | | | | | | | |
| | | | | | | | |
| | | |
Class A Shares | Year Ended August 31, |
2016 | 2015 | 2014 | 2013 | 2012a |
Per Share Data ($): | | | | | |
Net asset value, beginning of period | 19.76 | 20.62 | 17.75 | 14.49 | 12.50 |
Investment Operations: | | | | | |
Investment income (loss)—netb | .01 | (.05) | (.02) | (.01) | .02 |
Net realized and unrealized
gain (loss) on investments | .41c | .26c | 4.55 | 4.08 | 1.97 |
Total from Investment Operations | .42 | .21 | 4.53 | 4.07 | 1.99 |
Distributions: | | | | | |
Dividends from
investment income—net | - | - | (.00)d | (.09) | - |
Dividends from net realized
gain on investments | (.65) | (1.07) | (1.66) | (.72) | - |
Total Distributions | (.65) | (1.07) | (1.66) | (.81) | - |
Net asset value, end of period | 19.53 | 19.76 | 20.62 | 17.75 | 14.49 |
Total Return (%)e | 2.07 | 1.12 | 26.73 | 29.30 | 15.92f |
Ratios/Supplemental Data (%): | | | | | |
Ratio of total expenses
to average net assets | 1.60 | 1.69 | 1.86 | 2.93 | 7.51g |
Ratio of net expenses
to average net assets | 1.20 | 1.20 | 1.20 | 1.20 | 1.20g |
Ratio of net investment income
(loss) to average net assets | .06 | (.25) | (.09) | (.04) | .18g |
Portfolio Turnover Rate | 199.63 | 147.86 | 111.14 | 142.83 | 46.51f |
Net Assets, end of period ($x 1,000) | 19,133 | 21,176 | 15,355 | 3,118 | 61 |
a From December 20, 2011 (commencement of operations) to August 31, 2012.
b Based on average shares outstanding.
c In addition to net realized and unrealized losses on investments, this amount includes an increase in net asset value per share resulting from the timing of issuances and redemptions of shares in relation to fluctuating market values for the portfolio investments.
d Amount represents less than $.01 per share.
e Exclusive of sales charge.
f Not annualized.
g Annualized.
See notes to financial statements.
15
FINANCIAL HIGHLIGHTS (continued)
| | | | | | | |
| | | | |
| | | |
Class C Shares | Year Ended August 31, |
2016 | 2015 | 2014 | 2013 | 2012a |
Per Share Data ($): | | | | | |
Net asset value, beginning of period | 19.27 | 20.28 | 17.61 | 14.42 | 12.50 |
Investment Operations: | | | | | |
Investment (loss)—netb | (.13) | (.20) | (.17) | (.10) | (.05) |
Net realized and unrealized
gain (loss) on investments | .40c | .26c | 4.50 | 4.01 | 1.97 |
Total from Investment Operations | .27 | .06 | 4.33 | 3.91 | 1.92 |
Distributions: | | | | | |
Dividends from net realized
gain on investments | (.65) | (1.07) | (1.66) | (.72) | - |
Net asset value, end of period | 18.89 | 19.27 | 20.28 | 17.61 | 14.42 |
Total Return (%)d | 1.33 | .37 | 25.81 | 28.12 | 15.36e |
Ratios/Supplemental Data (%): | | | | | |
Ratio of total expenses
to average net assets | 2.41 | 2.54 | 2.75 | 5.44 | 8.09f |
Ratio of net expenses
to average net assets | 1.95 | 1.95 | 1.95 | 1.95 | 1.95f |
Ratio of net investment (loss)
to average net assets | (.68) | (1.00) | (.87) | (.60) | (.53)f |
Portfolio Turnover Rate | 199.63 | 147.86 | 111.14 | 142.83 | 46.51e |
Net Assets, end of period ($x 1,000) | 3,684 | 1,920 | 720 | 49 | 33 |
a From December 20, 2011 (commencement of operations) to August 31, 2012.
b Based on average shares outstanding.
c In addition to net realized and unrealized losses on investments, this amount includes an increase in net asset value per share resulting from the timing of issuances and redemptions of shares in relation to fluctuating market values for the portfolio investments.
d Exclusive of sales charge.
e Not annualized.
f Annualized.
See notes to financial statements.
16
| | | | | | | | | | |
| | | | | | | | |
| | | |
Class I Shares | Year Ended August 31, |
2016 | 2015 | 2014 | 2013 | 2012a |
Per Share Data ($): | | | | | |
Net asset value, beginning of period | 19.89 | 20.70 | 17.80 | 14.52 | 12.50 |
Investment Operations: | | | | | |
Investment income—netb | .06 | .00c | .05 | .07 | .04 |
Net realized and unrealized
gain (loss) on investments | .42d | .26d | 4.53 | 4.03 | 1.98 |
Total from Investment Operations | .48 | .26 | 4.58 | 4.10 | 2.02 |
Distributions: | | | | | |
Dividends from
investment income—net | - | - | (.02) | (.10) | - |
Dividends from net realized
gain on investments | (.65) | (1.07) | (1.66) | (.72) | - |
Total Distributions | (.65) | (1.07) | (1.68) | (.82) | - |
Net asset value, end of period | 19.72 | 19.89 | 20.70 | 17.80 | 14.52 |
Total Return (%) | 2.37 | 1.42 | 27.00 | 29.43 | 16.16e |
Ratios/Supplemental Data (%): | | | | | |
Ratio of total expenses
to average net assets | 1.32 | 1.37 | 1.61 | 4.05 | 7.13f |
Ratio of net expenses
to average net assets | .95 | .95 | .95 | .95 | .95f |
Ratio of net investment income
to average net assets | .29 | .01 | .24 | .43 | .40f |
Portfolio Turnover Rate | 199.63 | 147.86 | 111.14 | 142.83 | 46.51e |
Net Assets, end of period ($x 1,000) | 4,576 | 8,124 | 5,119 | 4,273 | 3,462 |
a From December 20, 2011 (commencement of operations) to August 31, 2012.
b Based on average shares outstanding.
c Amount represents less than $.01 per share.
d In addition to net realized and unrealized losses on investments, this amount includes an increase in net asset value per share resulting from the timing of issuances and redemptions of shares in relation to fluctuating market values for the portfolio investments.
e Not annualized.
f Annualized.
See notes to financial statements.
17
FINANCIAL HIGHLIGHTS (continued)
| | | |
| | | |
| | Year Ended August 31, |
Class Y Shares | 2016 | 2015a |
Per Share Data ($): | | |
Net asset value, beginning of period | 19.90 | 20.58 |
Investment Operations: | | |
Investment income—netb | .06 | .01 |
Net realized and unrealized
gain (loss) on investments | .42c | (.69) |
Total from Investment Operations | .48 | (.68) |
Distributions: | | |
Dividends from net realized
gain on investments | (.65) | - |
Net asset value, end of period | 19.73 | 19.90 |
Total Return (%) | 2.37 | (3.30)d |
Ratios/Supplemental Data (%): | | |
Ratio of total expenses to average net assets | 2.68 | 2.62e |
Ratio of net expenses to average net assets | .95 | .95e |
Ratio of net investment income
to average net assets | .31 | .12e |
Portfolio Turnover Rate | 199.63 | 147.86 |
Net Assets, end of period ($x 1,000) | 1 | 1 |
a From May 1, 2015 (commencement of initial offering) to August 31, 2015.
b Based on average shares outstanding.
c In addition to net realized and unrealized losses on investments, this amount includes an increase in net asset value per share resulting from the timing of issuances and redemptions of shares in relation to fluctuating market values for the portfolio investments.
d Not annualized.
e Annualized.
See notes to financial statements.
18
NOTES TO FINANCIAL STATEMENTS
NOTE 1—Significant Accounting Policies:
Dreyfus Opportunistic U.S. Stock Fund (the “fund”) is a separate diversified series of Advantage Funds, Inc. (the “Company”), which is registered under the Investment Company Act of 1940, as amended (the “Act”), as an open-end management investment company and operates as a series company currently offering ten series, including the fund. The fund’s investment objective is to seek long-term capital appreciation. The Dreyfus Corporation (the “Manager” or “Dreyfus”), a wholly-owned subsidiary of The Bank of New York Mellon Corporation (“BNY Mellon”), serves as the fund’s investment adviser.
MBSC Securities Corporation (the “Distributor”), a wholly-owned subsidiary of Dreyfus, is the distributor of the fund’s shares. The fund is authorized to issue 100 million shares of $.001 par value Common Stock in each of the following classes of shares: Class A, Class C, Class I and Class Y. Class A shares generally are subject to a sales charge imposed at the time of purchase. Class C shares are subject to a contingent deferred sales charge (“CDSC”) imposed on Class C shares redeemed within one year of purchase. Class I and Class Y shares are sold at net asset value per share generally to institutional investors. Other differences between the classes include the services offered to and the expenses borne by each class, the allocation of certain transfer agency costs, and certain voting rights. Income, expenses (other than expenses attributable to a specific class), and realized and unrealized gains or losses on investments are allocated to each class of shares based on its relative net assets.
As of August 31, 2016, MBC Investments Corp., an indirect subsidiary of BNY Mellon, held all of the outstanding Class Y shares of the fund.
The Company accounts separately for the assets, liabilities and operations of each series. Expenses directly attributable to each series are charged to that series’ operations; expenses which are applicable to all series are allocated among them on a pro rata basis.
The Financial Accounting Standards Board (“FASB”) Accounting Standards Codification (“ASC”) is the exclusive reference of authoritative U.S. generally accepted accounting principles (“GAAP”) recognized by the FASB to be applied by nongovernmental entities. Rules and interpretive releases of the Securities and Exchange Commission (“SEC”) under authority of federal laws are also sources of authoritative GAAP for SEC registrants. The fund’s financial statements are prepared in accordance with GAAP, which may require the use of management estimates and assumptions. Actual results could differ from those estimates.
19
NOTES TO FINANCIAL STATEMENTS (continued)
The Company enters into contracts that contain a variety of indemnifications. The fund’s maximum exposure under these arrangements is unknown. The fund does not anticipate recognizing any loss related to these arrangements.
(a) Portfolio valuation: The fair value of a financial instrument is the amount that would be received to sell an asset or paid to transfer a liability in an orderly transaction between market participants at the measurement date (i.e., the exit price). GAAP establishes a fair value hierarchy that prioritizes the inputs of valuation techniques used to measure fair value. This hierarchy gives the highest priority to unadjusted quoted prices in active markets for identical assets or liabilities (Level 1 measurements) and the lowest priority to unobservable inputs (Level 3 measurements).
Additionally, GAAP provides guidance on determining whether the volume and activity in a market has decreased significantly and whether such a decrease in activity results in transactions that are not orderly. GAAP requires enhanced disclosures around valuation inputs and techniques used during annual and interim periods.
Various inputs are used in determining the value of the fund’s investments relating to fair value measurements. These inputs are summarized in the three broad levels listed below:
Level 1—unadjusted quoted prices in active markets for identical investments.
Level 2—other significant observable inputs (including quoted prices for similar investments, interest rates, prepayment speeds, credit risk, etc.).
Level 3—significant unobservable inputs (including the fund’s own assumptions in determining the fair value of investments).
The inputs or methodology used for valuing securities are not necessarily an indication of the risk associated with investing in those securities.
Changes in valuation techniques may result in transfers in or out of an assigned level within the disclosure hierarchy. Valuation techniques used to value the fund’s investments are as follows:
Investments in securities are valued at the last sales price on the securities exchange or national securities market on which such securities are primarily traded. Securities listed on the National Market System for which market quotations are available are valued at the official closing price or, if there is no official closing price that day, at the last sales price. For open short positions, asked prices are used for valuation purposes. Bid price is
20
used when no asked price is available. Registered investment companies that are not traded on an exchange are valued at their net asset value. All of the preceding securities are generally categorized within Level 1 of the fair value hierarchy.
Securities not listed on an exchange or the national securities market, or securities for which there were no transactions, are valued at the average of the most recent bid and asked prices. These securities are generally categorized within Level 2 of the fair value hierarchy.
Fair valuing of securities may be determined with the assistance of a pricing service using calculations based on indices of domestic securities and other appropriate indicators, such as prices of relevant ADRs and financial futures. Utilizing these techniques may result in transfers between Level 1 and Level 2 of the fair value hierarchy.
When market quotations or official closing prices are not readily available, or are determined not to reflect accurately fair value, such as when the value of a security has been significantly affected by events after the close of the exchange or market on which the security is principally traded (for example, a foreign exchange or market), but before the fund calculates its net asset value, the fund may value these investments at fair value as determined in accordance with the procedures approved by the Company’s Board of Directors (the “Board”). Certain factors may be considered when fair valuing investments such as: fundamental analytical data, the nature and duration of restrictions on disposition, an evaluation of the forces that influence the market in which the securities are purchased and sold, and public trading in similar securities of the issuer or comparable issuers. These securities are either categorized within Level 2 or 3 of the fair value hierarchy depending on the relevant inputs used.
For restricted securities where observable inputs are limited, assumptions about market activity and risk are used and are generally categorized within Level 3 of the fair value hierarchy.
The following is a summary of the inputs used as of August 31, 2016 in valuing the fund’s investments:
21
NOTES TO FINANCIAL STATEMENTS (continued)
| | | | | |
| | Level 1 - Unadjusted Quoted Prices | Level 2 - Other Significant Observable Inputs | Level 3 -Significant Unobservable Inputs | Total |
Assets ($) | | | | |
Investments in Securities: | | | |
Equity Securities -
Domestic
Common Stocks† | 25,687,615 | - | - | 25,687,615 |
Equity Securities -
Foreign
Common Stocks† | 684,157 | - | - | 684,157 |
Exchange-Traded
Funds | 1,078,205 | - | - | 1,078,205 |
Mutual Funds | 977,441 | - | - | 977,441 |
† See Statement of Investments for additional detailed categorizations.
At August 31, 2016, there were no transfers between levels of the fair value hierarchy.
(b) Securities transactions and investment income: Securities transactions are recorded on a trade date basis. Realized gains and losses from securities transactions are recorded on the identified cost basis. Dividend income is recognized on the ex-dividend date and interest income, including, where applicable, accretion of discount and amortization of premium on investments, is recognized on the accrual basis.
Pursuant to a securities lending agreement with The Bank of New York Mellon, a subsidiary of BNY Mellon and an affiliate of Dreyfus, the fund may lend securities to qualified institutions. It is the fund’s policy that, at origination, all loans are secured by collateral of at least 102% of the value of U.S. securities loaned and 105% of the value of foreign securities loaned. Collateral equivalent to at least 100% of the market value of securities on loan is maintained at all times. Collateral is either in the form of cash, which can be invested in certain money market mutual funds managed by Dreyfus, or U.S. Government and Agency securities. The fund is entitled to receive all dividends, interest and distributions on securities loaned, in addition to income earned as a result of the lending transaction. Should a borrower fail to return the securities in a timely manner, The Bank of New York Mellon is required to replace the securities for the benefit of the fund or credit the fund with the market value of the unreturned securities and is subrogated to the fund’s rights against the borrower and the collateral. Additionally, the contractual maturity of security lending transactions are on an overnight and continuous basis. During the period ended August 31, 2016, The Bank of New York Mellon
22
earned $703 from lending portfolio securities, pursuant to the securities lending agreement.
(c) Affiliated issuers: Investments in other investment companies advised by Dreyfus are defined as “affiliated” under the Act. Investments in affiliated investment companies during the period ended August 31, 2016 were as follows:
| | | | | | |
Affiliated Investment Company | Value 8/31/2015 ($) | Purchases ($) | Sales ($) | Value 8/31/2016 ($) | Net Assets (%) |
Dreyfus Institutional Cash Advantage Fund, Institutional Shares | - | 8,993,440 | 8,133,171 | 860,269 | 3.2 |
Dreyfus Institutional Preferred Government Plus Money Market Fund† | 197,658 | 12,525,758 | 12,606,244 | 117,172 | .4 |
Total | 197,658 | 21,519,198 | 20,739,415 | 977,441 | 3.6 |
† Formerly Dreyfus Institutional Preferred Plus Money Market Fund.
(d) Dividends to shareholders: Dividends are recorded on the ex-dividend date. Dividends from investment income-net and dividends from net realized capital gains, if any, are normally declared and paid annually, but the fund may make distributions on a more frequent basis to comply with the distribution requirements of the Internal Revenue Code of 1986, as amended (the “Code”). To the extent that net realized capital gains can be offset by capital loss carryovers, it is the policy of the fund not to distribute such gains. Income and capital gain distributions are determined in accordance with income tax regulations, which may differ from GAAP.
(e) Federal income taxes: It is the policy of the fund to continue to qualify as a regulated investment company, if such qualification is in the best interests of its shareholders, by complying with the applicable provisions of the Code, and to make distributions of taxable income sufficient to relieve it from substantially all federal income and excise taxes.
As of and during the period ended August 31, 2016, the fund did not have any liabilities for any uncertain tax positions. The fund recognizes interest and penalties, if any, related to uncertain tax positions as income tax expense in the Statement of Operations. During the period ended August 31, 2016, the fund did not incur any interest or penalties.
23
NOTES TO FINANCIAL STATEMENTS (continued)
Each tax year in the four-year period ended August 31, 2016 remains subject to examination by the Internal Revenue Service and state taxing authorities.
At August 31, 2016, the components of accumulated earnings on a tax basis were as follows: undistributed ordinary income $10,992, accumulated capital losses $1,912,493 and unrealized appreciation $2,080,911.
Under the Regulated Investment Company Modernization Act of 2010, the fund is permitted to carry forward capital losses for an unlimited period. Furthermore, capital loss carryovers retain their character as either short-term or long-term capital losses.
The accumulated capital loss carryover is available for federal income tax purposes to be applied against future net realized capital gains, if any, realized subsequent to August 31, 2016. The fund has $1,912,493 of short-term capital losses which can be carried forward for an unlimited period.
The tax character of distributions paid to shareholders during the fiscal periods ended August 31, 2016 and August 31, 2015 were as follows: ordinary income $56,874 and $515,071, and long-term capital gains $1,092,130 and $469,039, respectively.
During the period ended August 31, 2016, as a result of permanent book to tax differences, primarily due to dividend reclassification, the fund decreased accumulated undistributed investment income-net by $1,280 and increased accumulated net realized gain (loss) on investments by the same amount. Net assets and net asset value per share were not affected by this reclassification.
NOTE 2—Bank Lines of Credit:
The fund participates with other Dreyfus-managed funds in a $555 million unsecured credit facility led by Citibank, N.A. and a $300 million unsecured credit facility provided by The Bank of New York Mellon (each, a “Facility”), each to be utilized primarily for temporary or emergency purposes, including the financing of redemptions. Prior to January 11, 2016, the unsecured credit facility with Citibank, N.A. was $480 million and prior to October 7, 2015, the unsecured credit facility with Citibank, N.A. was $430 million. In connection therewith, the fund has agreed to pay its pro rata portion of commitment fees for each Facility. Interest is charged to the fund based on rates determined pursuant to the terms of the respective Facility at the time of borrowing.
The average amount of borrowings outstanding under the Facilities during the period ended August 31, 2016, was approximately $17,800 with a related weighted average annualized interest rate of 1.25%.
24
NOTE 3—Management Fee and Other Transactions with Affiliates:
(a) Pursuant to a management agreement with Dreyfus, the management fee is computed at the annual rate of .75% of the value of the fund’s average daily net assets and is payable monthly. Dreyfus has contractually agreed, from September 1, 2015 through January 1, 2017, to waive receipt of its fees and/or assume the direct expenses of the fund, so that the expenses of none of the classes (excluding Rule 12b-1 Distribution Plan fees, Shareholder Services Plan fees, taxes, interest expense, brokerage commissions, commitment fees on borrowings and extraordinary expenses) exceed .95% of the value of the fund’s average daily net assets. The reduction in expenses, pursuant to the undertaking, amounted to $122,057 during the period ended August 31, 2016.
During the period ended August 31, 2016, the Distributor retained $3,939 from commissions earned on sales of the fund’s Class A shares.
(b) Under the Distribution Plan adopted pursuant to Rule 12b-1 under the Act, Class C shares pay the Distributor for distributing its shares at an annual rate of .75% of the value of its average daily net assets. During the period ended August 31, 2016, Class C shares were charged $24,629 pursuant to the Distribution Plan.
(c) Under the Shareholder Services Plan, Class A and Class C shares pay the Distributor at an annual rate of .25% of the value of their average daily net assets for the provision of certain services. The services provided may include personal services relating to shareholder accounts, such as answering shareholder inquiries regarding the fund and providing reports and other information, and services related to the maintenance of shareholder accounts. The Distributor may make payments to Service Agents (securities dealers, financial institutions or other industry professionals) with respect to these services. The Distributor determines the amounts to be paid to Service Agents. During the period ended August 31, 2016, Class A and Class C shares were charged $48,473 and $8,210, respectively, pursuant to the Shareholder Services Plan.
The fund has arrangements with the transfer agent and the custodian whereby the fund may receive earnings credits when positive cash balances are maintained, which are used to offset transfer agency and custody fees. For financial reporting purposes, the fund includes net earnings credits as an expense offset in the Statement of Operations.
The fund compensates Dreyfus Transfer, Inc., a wholly-owned subsidiary of Dreyfus, under a transfer agency agreement for providing transfer agency and cash management services for the fund. The majority of
25
NOTES TO FINANCIAL STATEMENTS (continued)
transfer agency fees are comprised of amounts paid on a per account basis, while cash management fees are related to fund subscriptions and redemptions. During the period ended August 31, 2016, the fund was charged $12,548 for transfer agency services and $517 for cash management services. These fees are included in Shareholder servicing costs in the Statement of Operations. Cash management fees were partially offset by earnings credits of $183.
The fund compensates The Bank of New York Mellon under a custody agreement for providing custodial services for the fund. These fees are determined based on net assets, geographic region and transaction activity. During the period ended August 31, 2016, the fund was charged $13,211 pursuant to the custody agreement.
During the period ended August 31, 2016, the fund was charged $9,967 for services performed by the Chief Compliance Officer and his staff.
The components of “Due to The Dreyfus Corporation and affiliates” in the Statement of Assets and Liabilities consist of: management fees $17,862, Distribution Plan fees $2,362, Shareholder Services Plan fees $4,915, custodian fees $6,844, Chief Compliance Officer fees $6,416 and transfer agency fees $1,706, which are offset against an expense reimbursement currently in effect in the amount of $10,253.
(d) Each Board member also serves as a Board member of other funds within the Dreyfus complex. Annual retainer fees and attendance fees are allocated to each fund based on net assets.
NOTE 4—Securities Transactions:
The aggregate amount of purchases and sales of investment securities, excluding short-term securities, during the period ended August 31, 2016, amounted to $61,299,603 and $64,538,944, respectively.
At August 31, 2016, the cost of investments for federal income tax purposes was $26,346,507; accordingly, accumulated net unrealized appreciation on investments was $2,080,911, consisting of $3,005,145 gross unrealized appreciation and $924,234 gross unrealized depreciation.
26
REPORT OF INDEPENDENT REGISTERED
PUBLIC ACCOUNTING FIRM
Shareholders and Board of Directors
Dreyfus Opportunistic U.S. Stock Fund
We have audited the accompanying statement of assets and liabilities, including the statement of investments, of Dreyfus Opportunistic U.S. Stock Fund (one of the series comprising Advantage Funds, Inc.) as of August 31, 2016, and the related statement of operations for the year then ended, the statement of changes in net assets for each of the two years in the period then ended, and the financial highlights for the each of the periods indicated therein. These financial statements and financial highlights are the responsibility of the Fund’s management. Our responsibility is to express an opinion on these financial statements and financial highlights based on our audits.
We conducted our audits in accordance with the standards of the Public Company Accounting Oversight Board (United States). Those standards require that we plan and perform the audit to obtain reasonable assurance about whether the financial statements and financial highlights are free of material misstatement. We were not engaged to perform an audit of the Fund’s internal control over financial reporting. Our audits included consideration of internal control over financial reporting as a basis for designing audit procedures that are appropriate in the circumstances, but not for the purpose of expressing an opinion on the effectiveness of the Fund’s internal control over financial reporting. Accordingly, we express no such opinion. An audit also includes examining, on a test basis, evidence supporting the amounts and disclosures in the financial statements and financial highlights, assessing the accounting principles used and significant estimates made by management, and evaluating the overall financial statement presentation. Our procedures included confirmation of securities owned as of August 31, 2016 by correspondence with the custodian and others. We believe that our audits provide a reasonable basis for our opinion.
In our opinion, the financial statements and financial highlights referred to above present fairly, in all material respects, the financial position of Dreyfus Opportunistic U.S. Stock Fund at August 31, 2016, the results of its operations for the year then ended, the changes in its net assets for each of the two years in the period then ended, and the financial highlights for each of the indicated periods, in conformity with U.S. generally accepted accounting principles.

New York, New York
October 27, 2016
27
IMPORTANT TAX INFORMATION (Unaudited)
For federal tax purposes, the fund hereby reports 100% of the ordinary dividends paid during the fiscal year ended August 31, 2016 as qualifying for the corporate dividends received deduction. Also, certain dividends paid by the fund may be subject to a maximum tax rate of 15%, as provided for by the Jobs and Growth Tax Relief Reconciliation Act of 2003. Of the distributions paid during the fiscal year, $56,874 represents the maximum amount that may be considered qualified dividend income. The fund also hereby reports $.0319 per share as a short-term capital gain distribution and $.6225 per share as a long-term capital gain distribution paid on December 8, 2015. Shareholders will receive notification in early 2017 of the percentage applicable to the preparation of their 2016 income tax returns.
28
BOARD MEMBERS INFORMATION (Unaudited)
INDEPENDENT BOARD MEMBERS
Joseph S. DiMartino (72)
Chairman of the Board (1995)
Principal Occupation During Past 5 Years:
· Corporate Director and Trustee (1995-present)
Other Public Company Board Memberships During Past 5 Years:
· CBIZ (formerly, Century Business Services, Inc.), a provider of outsourcing functions for small and medium size companies, Director (1997-present)
No. of Portfolios for which Board Member Serves: 136
———————
Peggy C. Davis (73)
Board Member (2006)
Principal Occupation During Past 5 Years:
· Shad Professor of Law, New York University School of Law (1983-present)
No. of Portfolios for which Board Member Serves: 49
———————
David P. Feldman (76)
Board Member (1996)
Principal Occupation During Past 5 Years:
· Corporate Director and Trustee (1985-present)
Other Public Company Board Memberships During Past 5 Years:
· BBH Mutual Funds Group (5 registered mutual funds), Director (1992-2014)
No. of Portfolios for which Board Member Serves: 35
———————
Ehud Houminer (76)
Board Member (1993)
Principal Occupation During Past 5 Years:
· Executive-in-Residence at the Columbia Business School, Columbia
University (1992-present)
Other Public Company Board Memberships During Past 5 Years:
· Avnet, Inc., an electronics distributor, Director (1993-2012)
No. of Portfolios for which Board Member Serves: 59
———————
29
BOARD MEMBERS INFORMATION (Unaudited) (continued)
INDEPENDENT BOARD MEMBERS (continued)
Lynn Martin (76)
Board Member (2012)
Principal Occupation During Past 5 Years:
· President of The Martin Hall Group LLC, a human resources consulting firm (2005-2012)
Other Public Company Board Memberships During Past 5 Years:
· AT&T, Inc., a telecommunications company, Director (1999-2012)
· Ryder System, Inc., a supply chain and transportation management company, Director (1993-2012)
No. of Portfolios for which Board Member Serves: 35
———————
Robin A. Melvin (52)
Board Member (2012)
Principal Occupation During Past 5 Years:
· Co-chairman, Illinois Mentoring Partnership, non-profit organization dedicated to increasing the quantity and quality of mentoring services in Illinois; (2014-present; served as a board member since 2013)
· Director, Boisi Family Foundation, a private family foundation that supports youth-serving organizations that promote the self sufficiency of youth from disadvantaged circumstances (1995-2012)
No. of Portfolios for which Board Member Serves: 108
———————
Dr. Martin Peretz (77)
Board Member (2006)
Principal Occupation During Past 5 Years:
· Editor-in-Chief Emeritus of The New Republic Magazine (2011-2012) (previously,
Editor-in-Chief, 1974-2011)
· Director of TheStreet.com, a financial information service on the web (1996-2010)
· Lecturer at Harvard University (1969-2012)
No. of Portfolios for which Board Member Serves: 35
———————
Once elected all Board Members serve for an indefinite term, but achieve Emeritus status upon reaching age 80. The address of the Board Members and Officers is c/o The Dreyfus Corporation, 200 Park Avenue, New York, New York 10166. Additional information about the Board Members is available in the fund’s Statement of Additional Information which can be obtained from Dreyfus free of charge by calling this toll free number: 1-800-DREYFUS.
James F. Henry, Emeritus Board Member
Dr. Paul A. Marks, Emeritus Board Member
Philip L. Toia, Emeritus Board Member
30
OFFICERS OF THE FUND (Unaudited)
BRADLEY J. SKAPYAK, President since January 2010.
Chief Operating Officer and a director of the Manager since June 2009, Chairman of Dreyfus Transfer, Inc., an affiliate of the Manager and the transfer agent of the funds, since May 2011 and Executive Vice President of the Distributor since June 2007. From April 2003 to June 2009, Mr. Skapyak was the head of the Investment Accounting and Support Department of the Manager. He is an officer of 65 investment companies (comprised of 136 portfolios) managed by the Manager. He is 57 years old and has been an employee of the Manager since February 1988.
BENNETT A. MACDOUGALL, Chief Legal Officer since October 2015.
Chief Legal Officer of the Manager since June 2015; from June 2005 to June 2015, he served in various capacities with Deutsche Bank – Asset & Wealth Management Division, including as Director and Associate General Counsel, and Chief Legal Officer of Deutsche Investment Management Americas Inc. from June 2012 to May 2015. He is an officer of 66 investment companies (comprised of 161 portfolios) managed by the Manager. He is 44 years old and has been an employee of the Manager since June 2015.
JANETTE E. FARRAGHER, Vice President and Secretary since December 2011.
Assistant General Counsel of BNY Mellon, and an officer of 66 investment companies (comprised of 161 portfolios) managed by the Manager. She is 53 years old and has been an employee of the Manager since February 1984.
JAMES BITETTO, Vice President and Assistant Secretary since August 2005.
Managing Counsel of BNY Mellon and Secretary of the Manager, and an officer of 66 investment companies (comprised of 161 portfolios) managed by the Manager. He is 50 years old and has been an employee of the Manager since December 1996.
JONI LACKS CHARATAN, Vice President and Assistant Secretary since August 2005.
Managing Counsel of BNY Mellon, and an officer of 66 investment companies (comprised of 161 portfolios) managed by the Manager. She is 60 years old and has been an employee of the Manager since October 1988.
JOSEPH M. CHIOFFI, Vice President and Assistant Secretary since August 2005.
Managing Counsel of BNY Mellon, and an officer of 66 investment companies (comprised of 161 portfolios) managed by the Manager. He is 54 years old and has been an employee of the Manager since June 2000.
MAUREEN E. KANE, Vice President and Assistant Secretary since April 2015.
Managing Counsel of BNY Mellon since July 2014; from October 2004 until July 2014, General Counsel, and from May 2009 until July 2014, Chief Compliance Officer of Century Capital Management. She is an officer of 66 investment companies (comprised of 161 portfolios) managed by the Manager. She is 54 years old and has been an employee of the Manager since July 2014.
SARAH S. KELLEHER, Vice President and Assistant Secretary since April 2014.
Senior Counsel of BNY Mellon, and an officer of 66 investment companies (comprised of 161 portfolios) managed by the Manager; from August 2005 to March 2013, Associate General Counsel of Third Avenue Management. She is 40 years old and has been an employee of the Manager since March 2013.
JEFF PRUSNOFSKY, Vice President and Assistant Secretary since August 2005.
Senior Managing Counsel of BNY Mellon, and an officer of 66 investment companies (comprised of 161 portfolios) managed by the Manager. He is 51 years old and has been an employee of the Manager since October 1990.
JAMES WINDELS, Treasurer since November 2001.
Director – Mutual Fund Accounting of the Manager, and an officer of 66 investment companies (comprised of 161 portfolios) managed by the Manager. He is 57 years old and has been an employee of the Manager since April 1985.
RICHARD CASSARO, Assistant Treasurer since January 2008.
Senior Accounting Manager – Money Market, Municipal Bond and Equity Funds of the Manager, and an officer of 66 investment companies (comprised of 161 portfolios) managed by the Manager. He is 57 years old and has been an employee of the Manager since September 1982.
31
OFFICERS OF THE FUND (Unaudited) (continued)
GAVIN C. REILLY, Assistant Treasurer since December 2005.
Tax Manager of the Investment Accounting and Support Department of the Manager, and an officer of 66 investment companies (comprised of 161 portfolios) managed by the Manager. He is 48 years old and has been an employee of the Manager since April 1991.
ROBERT S. ROBOL, Assistant Treasurer since August 2005.
Senior Accounting Manager of the Manager, and an officer of 66 investment companies (comprised of 161 portfolios) managed by the Manager. He is 52 years old and has been an employee of the Manager since October 1988.
ROBERT SALVIOLO, Assistant Treasurer since July 2007.
Senior Accounting Manager – Equity Funds of the Manager, and an officer of 66 investment companies (comprised of 161 portfolios) managed by the Manager. He is 49 years old and has been an employee of the Manager since June 1989.
ROBERT SVAGNA, Assistant Treasurer since December 2002.
Senior Accounting Manager – Fixed Income and Equity Funds of the Manager, and an officer of 66 investment companies (comprised of 161 portfolios) managed by the Manager. He is 49 years old and has been an employee of the Manager since November 1990.
JOSEPH W. CONNOLLY, Chief Compliance Officer since October 2004.
Chief Compliance Officer of the Manager and The Dreyfus Family of Funds (66 investment companies, comprised of 161 portfolios). He is 59 years old and has served in various capacities with the Manager since 1980, including manager of the firm’s Fund Accounting Department from 1997 through October 2001.
CARIDAD M. CAROSELLA, Anti-Money Laundering Compliance Officer since January 2016
Anti-Money Laundering Compliance Officer of the Dreyfus Family of Funds and BNY Mellon Funds Trust since January 2016; from May 2015 to December 2015, Interim Anti-Money Laundering Compliance Officer of the Dreyfus Family of Funds and BNY Mellon Funds Trust and the Distributor; from January 2012 to May 2015, AML Surveillance Officer of the Distributor and from 2007 to December 2011, Financial Processing Manager of the Distributor. She is an officer of 61 investment companies (comprised of 156 portfolios) managed by the Manager. She is 48 years old and has been an employee of the Distributor since 1997.
32
NOTES
33
Dreyfus Opportunistic U.S. Stock Fund
200 Park Avenue
New York, NY 10166
Manager
The Dreyfus Corporation
200 Park Avenue
New York, NY 10166
Custodian
The Bank of New York Mellon
225 Liberty Street
New York, NY 10286
Transfer Agent &
Dividend Disbursing Agent
Dreyfus Transfer, Inc.
200 Park Avenue
New York, NY 10166
Distributor
MBSC Securities Corporation
200 Park Avenue
New York, NY 10166
| | |
Ticker Symbols: | Class A: DOSAX Class C: DOSCX Class I: DOSIX Class Y: DOSYX |
Telephone Call your financial representative or 1-800-DREYFUS
Mail The Dreyfus Family of Funds, 144 Glenn Curtiss Boulevard, Uniondale, NY 11556-0144
E-mail Send your request to info@dreyfus.com
Internet Information can be viewed online or downloaded at www.dreyfus.com
The fund files its complete schedule of portfolio holdings with the Securities and Exchange Commission (“SEC”) for the first and third quarters of each fiscal year on Form N-Q. The fund’s Forms N-Q are available on the SEC’s website at www.sec.gov and may be reviewed and copied at the SEC’s Public Reference Room in Washington, DC. (phone 1-800-SEC-0330 for information).
A description of the policies and procedures that the fund uses to determine how to vote proxies relating to portfolio securities and information regarding how the fund voted these proxies for the most recent 12-month period ended June 30 is available at www.dreyfus.com and on the SEC’s website at www.sec.gov and without charge, upon request, by calling 1-800-DREYFUS.
| | |
© 2016 MBSC Securities Corporation
6316AR0816 | 
|
Dreyfus Strategic Value Fund
| | | |

| | ANNUAL REPORT August 31, 2016 |
| |
Save time. Save paper. View your next shareholder report online as soon as it’s available. Log into www.dreyfus.com and sign up for Dreyfus eCommunications. It’s simple and only takes a few minutes. |
| |
The views expressed in this report reflect those of the portfolio manager only through the end of the period covered and do not necessarily represent the views of Dreyfus or any other person in the Dreyfus organization. Any such views are subject to change at any time based upon market or other conditions and Dreyfus disclaims any responsibility to update such views. These views may not be relied on as investment advice and, because investment decisions for a Dreyfus fund are based on numerous factors, may not be relied on as an indication of trading intent on behalf of any Dreyfus fund. |
| |
Not FDIC-Insured • Not Bank-Guaranteed • May Lose Value |
Contents
T H E F U N D
F O R M O R E I N F O R M AT I O N
Back Cover
| | | | |
| |
Dreyfus Strategic Value Fund
| | The Fund |
A LETTER FROM THE CHIEF EXECUTIVE OFFICER
Dear Shareholder:
We are pleased to present this annual report for Dreyfus Strategic Value Fund, covering the 12-month period from September 1, 2015 through August 31, 2016. For information about how the fund performed during the reporting period, as well as general market perspectives, we provide a Discussion of Fund Performance on the pages that follow.
Despite tumultuous swings in market sentiment stemming from global economic developments, stocks and bonds generally produced strong returns over the reporting period. During the fall of 2015, investors reacted cautiously to sluggish global economic growth, plummeting commodity prices, and the first increase in short-term U.S. interest rates in nearly a decade. These worries sparked particularly sharp declines in equities in January 2016, but investor sentiment soon improved when U.S. monetary policymakers refrained from additional rate hikes, other central banks eased their monetary policies further, and commodity prices rebounded. Stocks mostly rallied over the ensuing months, driving several broad measures of stock market performance to new record highs. In the bond market, aggressively accommodative monetary policies and robust investor demand for current income sent yields of high-quality sovereign bonds lower and their prices higher.
Recently we have seen evidence that investors may be shifting their focus away from macroeconomic influences and toward underlying company and industry fundamentals. This development—along with wide differences in underlying fundamental and technical influences across various asset classes, economic sectors, and regional markets—suggests that selectivity may be a more important determinant of investment success over the months ahead. As always, we encourage you to discuss the implications of our observations with your financial advisor.
Thank you for your continued confidence and support.
Sincerely,

Mark D. Santero
Chief Executive Officer
The Dreyfus Corporation
September 15, 2016
2
DISCUSSION OF FUND PERFORMANCE
For the period from September 1, 2015 through August 31, 2016, as provided by Brian C. Ferguson, John C. Bailer, and David S. Intoppa, Portfolio Managers
Market and Fund Performance Overview
For the 12-month period ended August 31, 2016, Dreyfus Strategic Value Fund’s Class A shares produced a total return of 8.26%, Class C shares returned 7.46%, Class I shares returned 8.52%, and Class Y shares returned 8.52%.1 The fund’s benchmark, the Russell 1000® Value Index (the “Index”), produced a total return of 12.92% for the same period.2
U.S. stocks achieved double-digit returns, on average, as a rally over the reporting period’s second half more than offset losses incurred over the first half. The fund lagged its benchmark, mainly due to security selection shortfalls in the financials, materials, and consumer staples sectors.
The Fund’s Investment Approach
The fund seeks capital appreciation. We identify potential investments through extensive quantitative and fundamental research. The fund will focus on individual stock selection (a “bottom-up” approach), emphasizing three key factors: value, displayed through quantitative screens tracking traditional measures — such as price-to-earnings, price-to-book, and price-to-sales ratios — that are analyzed and compared against the market; sound business fundamentals, in which a company’s balance sheet and income data are examined to determine the company’s financial history; and positive business momentum, where a company’s earnings and forecast changes are analyzed and sales and earnings trends are reviewed to determine the company’s financial condition or the presence of a catalyst that will trigger a price increase near- to mid-term.
The fund typically sells a stock when we believe there is a more attractive alternative, the stock’s valuation is excessive, or there are deteriorating fundamentals, such as a loss of competitive advantage, a failure in management execution, or deteriorating capital structure.
Stocks Advanced Strongly Despite Headwinds
Stocks proved volatile over the final four months of 2015 when global investors grew more averse to risks in light of sluggish growth in international markets, and U.S. investors responded cautiously to the first increase in short-term U.S. interest rates in nearly a decade. In January 2016, disappointing economic data in China sparked severe declines in commodity prices, and investors worried that additional U.S. rate hikes might weigh on the domestic economic recovery. Consequently, U.S. stocks fell sharply during the month.
The market changed direction in mid-February as investors responded positively to relatively strong U.S. economic data and better-than-expected corporate earnings. The market rally continued through the spring when commodity prices began to rebound, U.S. monetary policymakers refrained from implementing additional rate hikes, and overseas central banks further eased their monetary policies. Although a referendum in the United Kingdom to leave the European Union introduced renewed market turmoil in June, equities bounced back quickly, enabling the Index to record a double-digit total return for the reporting period overall.
Financial Stocks Hurt by Low Interest Rates
The move to negative short-term interest rates by central banks in Europe and Japan, as well as the lack of additional U.S. rate hikes, generally hurt the profit margins of banks, sending their stock prices broadly lower. The fund’s overweighted exposure to the financials sector and weakness among its holdings of diversified financial providers, capital markets companies, insurers, and consumer finance companies limited its participation in the market’s robust rally. The fund’s relative performance also was hampered by its stock selections in the materials sector, where fertilizer producers such as CF
3
DISCUSSION OF FUND PERFORMANCE (continued)
Industries Holdings and Mosaic struggled with industrywide supply-and-demand issues. In the industrials sector, air carriers such as Delta Air Lines encountered concerns regarding overcapacity, and the fund did not hold winners such as General Electric.
The fund achieved better relative results in the information technology sector, where semiconductor equipment maker Applied Materials benefited from a build-out of China’s microchip manufacturing capacity, and semiconductor manufacturers Microchip Technology and Texas Instruments saw rising demand for chips used in automobiles, appliances, and other devices. In addition, Cisco Systems gained value as customers upgraded to new products. Overweighted exposure aided relative performance in the telecommunication services sector, where industry leader AT&T climbed in the wake of its acquisition of a major satellite television provider. In the consumer staples sector, a merger of two rivals boosted the stock price of beverage maker Molson Coors Brewing, activist shareholders prompted margin improvements at PepsiCo, and higher profits supported shares of food producer Kellogg.
Maintaining a Constructive Investment Posture
We remain optimistic regarding global economic trends, as we expect the choppy U.S. recovery to continue and aggressive stimulus measures to boost activity in overseas markets. Interest rates should normalize gradually as the economic environment improves, helping financial companies achieve higher lending margins.
As of the reporting period’s end, we have maintained overweighted exposure to the financials, information technology, materials, energy, and consumer discretionary sectors. In contrast, we have identified relatively few opportunities in areas we regard as richly valued, including utilities, real estate investment trusts, telecommunication services companies, industrial firms, and consumer staples companies.
September 15, 2016
Please note, the position in any security highlighted with italicized typeface was sold during the reporting period.
Equities are subject generally to market, market sector, market liquidity, issuer, and investment style risks, among other factors, to varying degrees, all of which are more fully described in the fund’s prospectus.
The fund’s performance will be influenced by political, social, and economic factors affecting investments in foreign companies. Special risks associated with investments in foreign companies include exposure to currency fluctuations, less liquidity, less developed or less efficient trading markets, lack of comprehensive company information, political instability, and differing auditing and legal standards. These risks are enhanced in emerging market countries. Please read the prospectus for further discussion of these risks.
1 Total return includes reinvestment of dividends and any capital gains paid and does not take into consideration the maximum initial sales charge in the case of Class A shares, or the applicable contingent deferred sales charges imposed on redemptions in the case of Class C shares. Had these charges been reflected, returns would have been lower. Past performance is no guarantee of future results. Share price and investment return fluctuate such that upon redemption, fund shares may be worth more or less than their original cost. The fund’s returns reflect the absorption of certain fund expenses by The Dreyfus Corporation pursuant to an agreement in effect through January 1, 2017, at which time it may be extended, terminated, or modified. Had these expenses not been absorbed, the fund’s returns would have been lower.
2 Source: Lipper Inc. — Reflects the reinvestment of dividends and, where applicable, capital gain distributions. The Russell 1000® Value Index is an unmanaged index which measures the performance of those Russell 1000® companies with lower price-to-book ratios and lower forecasted growth values. Investors cannot invest directly in any index.
4
FUND PERFORMANCE
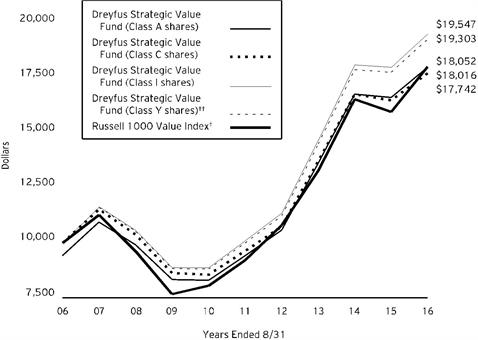
Comparison of change in value of $10,000 investment in Dreyfus Strategic Value Fund Class A shares, Class C shares, Class I shares and Class Y shares and the Russell 1000 Value Index
† Source: Lipper Inc.
†† The total return figures presented for Class Y shares of the fund reflect the performance of the fund’s Class A shares for the period prior to 7/1/13 (the inception date for Class Y shares), not reflecting the applicable sales charges for Class A shares.
Past performance is not predictive of future performance.
The above graph compares a $10,000 investment made in each of the Class A, Class C, Class I and Class Y shares of Dreyfus Strategic Value Fund on 8/31/06 to a $10,000 investment made in the Russell 1000 Value Index (the “Index”) on that date. All dividends and capital gain distributions are reinvested.
The fund’s performance shown in the line graph above takes into account the maximum initial sales charge on Class A shares and all other applicable fees and expenses on all classes. The Index uses company price-to-book ratios and long-term growth rates to calculate a composite ranking, which is used to determine if a stock is “growth” or “value.” Unlike a mutual fund, the Index is not subject to charges, fees and other expenses. Investors cannot invest directly in any index. Further information relating to fund performance, including expense reimbursements, if applicable, is contained in the Financial Highlights section of the prospectus and elsewhere in this report.
5
FUND PERFORMANCE (continued)
| | | | | | | | |
Average Annual Total Returns as of 8/31/16 | | | | |
| | | Inception | | | | | |
| | Date | 1 Year | 5 Years | | 10 Years | |
| | | | | | | | |
Class A shares | | | | | | |
with maximum sales charge (5.75%) without sales charge | 9/29/95 | 2.03% | 12.49% | | 6.06% | |
9/29/95 | 8.26% | 13.83% | | 6.69% | |
Class C shares | | | | | | |
with applicable redemption charge † | 5/31/01 | 6.53% | 12.98% | | 5.90% | |
without redemption | 5/31/01 | 7.46% | 12.98% | | 5.90% | |
Class I shares | 5/31/01 | 8.52% | 14.11% | | 6.93% | |
Class Y shares | 7/1/13 | 8.52% | 14.05% | †† | 6.80% | †† |
Russell 1000 Value Index | | 12.92% | 14.39% | | 6.08% | |
Past performance is not predictive of future performance. The fund’s performance shown in the graph and table does not reflect the deduction of taxes that a shareholder would pay on fund distributions or the redemption of fund shares. In addition to the performance of Class A shares shown with and without a maximum sales charge, the fund’s performance shown in the table takes into account all other applicable fees and expenses on all classes.
† The maximum contingent deferred sales charge for Class C shares is 1% for shares redeemed within one year of the date of purchase.
†† The total return performance figures presented for Class Y shares of the fund reflect the performance of the fund’s Class A shares for the period prior to 7/1/13 (the inception date for Class Y shares), not reflecting the applicable sales charges for Class A shares.
6
UNDERSTANDING YOUR FUND’S EXPENSES (Unaudited)
As a mutual fund investor, you pay ongoing expenses, such as management fees and other expenses. Using the information below, you can estimate how these expenses affect your investment and compare them with the expenses of other funds. You also may pay one-time transaction expenses, including sales charges (loads) and redemption fees, which are not shown in this section and would have resulted in higher total expenses. For more information, see your fund’s prospectus or talk to your financial adviser.
Review your fund’s expenses
The table below shows the expenses you would have paid on a $1,000 investment in Dreyfus Strategic Value Fund from March 1, 2016 to August 31, 2016. It also shows how much a $1,000 investment would be worth at the close of the period, assuming actual returns and expenses.
| | | | | | | | | | | | |
Expenses and Value of a $1,000 Investment | | |
assuming actual returns for the six months ended August 31, 2016 | |
| | | Class A | Class C | Class I | Class Y |
Expenses paid per $1,000† | | $5.32 | | $9.36 | | $3.96 | | $3.96 |
Ending value (after expenses) | | $1,157.90 | | $1,153.50 | | $1,159.00 | | $1,159.00 |
COMPARING YOUR FUND’S EXPENSES
WITH THOSE OF OTHER FUNDS (Unaudited)
Using the SEC’s method to compare expenses
The Securities and Exchange Commission (SEC) has established guidelines to help investors assess fund expenses. Per these guidelines, the table below shows your fund’s expenses based on a $1,000 investment, assuming a hypothetical 5% annualized return. You can use this information to compare the ongoing expenses (but not transaction expenses or total cost) of investing in the fund with those of other funds. All mutual fund shareholder reports will provide this information to help you make this comparison. Please note that you cannot use this information to estimate your actual ending account balance and expenses paid during the period.
| | | | | | | | | | | | |
Expenses and Value of a $1,000 Investment | | |
assuming a hypothetical 5% annualized return for the six months ended August 31, 2016 | |
| | | Class A | Class C | Class I | Class Y |
Expenses paid per $1,000† | | $4.98 | | $8.77 | | $3.71 | | $3.71 |
Ending value (after expenses) | | $1,020.21 | | $1,016.44 | | $1,021.47 | | $1,021.47 |
† Expenses are equal to the fund’s annualized expense ratio of .98% for Class A, 1.73% for Class C, .73% for Class I and .73% for Class Y, multiplied by the average account value over the period, multiplied by 184/366 (to reflect the one-half year period).
7
STATEMENT OF INVESTMENTS
August 31, 2016
| | | | | | |
| |
Common Stocks - 99.8% | | Shares | | Value ($) | |
Banks - 11.4% | | | | | |
Bank of America | | 2,497,759 | | 40,313,830 | |
BB&T | | 334,188 | | 12,866,238 | |
Citigroup | | 605,841 | | 28,922,849 | |
Comerica | | 254,654 | | 12,042,588 | |
JPMorgan Chase & Co. | | 1,023,393 | | 69,079,028 | |
SunTrust Banks | | 373,526 | | 16,461,291 | |
| | | | | 179,685,824 | |
Capital Goods - 6.8% | | | | | |
Honeywell International | | 200,856 | | 23,441,904 | |
Northrop Grumman | | 71,344 | | 15,129,922 | |
Raytheon | | 325,826 | | 45,657,997 | |
United Technologies | | 218,347 | | 23,238,671 | |
| | | | | 107,468,494 | |
Consumer Services - .8% | | | | | |
Carnival | | 250,145 | | 11,956,931 | |
Diversified Financials - 13.3% | | | | | |
Berkshire Hathaway, Cl. B | | 315,711 | a | 47,511,348 | |
Charles Schwab | | 628,607 | | 19,775,976 | |
E*TRADE Financial | | 749,866 | a | 19,781,465 | |
Goldman Sachs Group | | 187,714 | | 31,810,014 | |
Morgan Stanley | | 943,282 | | 30,241,621 | |
Raymond James Financial | | 213,064 | | 12,393,933 | |
Synchrony Financial | | 899,664 | | 25,037,649 | |
Voya Financial | | 825,786 | | 24,145,983 | |
| | | | | 210,697,989 | |
Energy - 14.0% | | | | | |
EOG Resources | | 426,902 | | 37,776,558 | |
Halliburton | | 651,053 | | 28,001,790 | |
Hess | | 432,657 | | 23,493,275 | |
Kinder Morgan | | 719,830 | | 15,728,286 | |
Occidental Petroleum | | 876,259 | | 67,340,504 | |
Phillips 66 | | 323,550 | b | 25,382,498 | |
Pioneer Natural Resources | | 129,763 | | 23,234,065 | |
| | | | | 220,956,976 | |
Food, Beverage & Tobacco - 8.0% | | | | | |
Archer-Daniels-Midland | | 368,928 | | 16,144,289 | |
Coca-Cola | | 661,545 | | 28,730,899 | |
8
| | | | | | |
| |
Common Stocks - 99.8% (continued) | | Shares | | Value ($) | |
Food, Beverage & Tobacco - 8.0% (continued) | | | | | |
ConAgra Foods | | 485,415 | | 22,625,193 | |
Kellogg | | 236,426 | | 19,436,581 | |
Molson Coors Brewing, Cl. B | | 305,114 | | 31,219,265 | |
Mondelez International, Cl. A | | 169,643 | | 7,637,328 | |
| | | | | 125,793,555 | |
Health Care Equipment & Services - 5.1% | | | | | |
Abbott Laboratories | | 468,361 | | 19,680,529 | |
Boston Scientific | | 816,024 | a | 19,437,692 | |
Humana | | 43,820 | | 7,831,072 | |
Laboratory Corporation of America Holdings | | 67,672 | a | 9,266,327 | |
UnitedHealth Group | | 113,956 | | 15,503,714 | |
Zimmer Biomet Holdings | | 73,329 | | 9,504,172 | |
| | | | | 81,223,506 | |
Insurance - 6.0% | | | | | |
Allstate | | 226,769 | | 15,637,990 | |
Chubb | | 166,930 | | 21,188,425 | |
FNF Group | | 252,998 | | 9,535,495 | |
Hartford Financial Services Group | | 390,819 | | 16,050,936 | |
Prudential Financial | | 410,139 | | 32,556,834 | |
| | | | | 94,969,680 | |
Materials - 5.0% | | | | | |
CF Industries Holdings | | 470,025 | | 12,220,650 | |
Dow Chemical | | 146,314 | | 7,848,283 | |
Martin Marietta Materials | | 75,583 | | 13,833,957 | |
Packaging Corporation of America | | 199,654 | | 15,698,794 | |
Vulcan Materials | | 262,074 | | 29,842,366 | |
| | | | | 79,444,050 | |
Media - 3.8% | | | | | |
Omnicom Group | | 231,756 | | 19,961,144 | |
Time Warner | | 427,049 | | 33,484,912 | |
Viacom, Cl. B | | 169,938 | | 6,855,299 | |
| | | | | 60,301,355 | |
Pharmaceuticals, Biotechnology & Life Sciences - 6.0% | | | | | |
Bristol-Myers Squibb | | 131,737 | | 7,560,386 | |
Eli Lilly & Co. | | 234,509 | | 18,233,075 | |
Merck & Co. | | 603,300 | | 37,881,207 | |
Pfizer | | 901,232 | | 31,362,874 | |
| | | | | 95,037,542 | |
9
STATEMENT OF INVESTMENTS (continued)
| | | | | | |
| |
Common Stocks - 99.8% (continued) | | Shares | | Value ($) | |
Real Estate - 1.3% | | | | | |
Communications Sales & Leasing | | 647,084 | c | 20,189,021 | |
Retailing - 1.0% | | | | | |
Staples | | 1,863,538 | | 15,951,885 | |
Semiconductors & Semiconductor Equipment - 4.9% | | | | | |
Applied Materials | | 919,407 | | 27,435,105 | |
Microchip Technology | | 510,317 | b | 31,593,725 | |
Texas Instruments | | 276,441 | | 19,223,707 | |
| | | | | 78,252,537 | |
Software & Services - 4.1% | | | | | |
Alphabet, Cl. A | | 19,194 | a | 15,160,381 | |
eBay | | 372,009 | a | 11,963,809 | |
Oracle | | 591,824 | | 24,394,985 | |
Teradata | | 397,760 | a | 12,620,925 | |
| | | | | 64,140,100 | |
Technology Hardware & Equipment - 3.8% | | | | | |
Cisco Systems | | 1,508,303 | | 47,421,046 | |
Corning | | 547,008 | | 12,411,612 | |
| | | | | 59,832,658 | |
Telecommunication Services - 2.8% | | | | | |
AT&T | | 1,066,768 | | 43,609,476 | |
Transportation - 1.7% | | | | | |
Delta Air Lines | | 517,195 | | 19,006,916 | |
United Continental Holdings | | 156,528 | a | 7,890,577 | |
| | | | | 26,897,493 | |
Total Common Stocks (cost $1,348,275,516) | | | | 1,576,409,072 | |
Other Investment - .1% | | | | | |
Registered Investment Company; | | | | | |
Dreyfus Institutional Preferred Government Plus Money Market Fund
(cost $1,363,977) | | 1,363,977 | d | 1,363,977 | |
10
| | | | | | |
| |
Investment of Cash Collateral for Securities Loaned - 1.0% | | Shares | | Value ($) | |
Registered Investment Company; | | | | | |
Dreyfus Institutional Cash Advantage Fund, Institutional Shares
(cost $15,350,019) | | 15,350,019 | d | 15,350,019 | |
Total Investments (cost $1,364,989,512) | | 100.9% | | 1,593,123,068 | |
Liabilities, Less Cash and Receivables | | (.9%) | | (13,780,829) | |
Net Assets | | 100.0% | | 1,579,342,239 | |
a Non-income producing security.
b Security, or portion thereof, on loan. At August 31, 2016, the value of the fund’s securities on loan was $28,498,660 and the value of the collateral held by the fund was $29,127,299, consisting of cash collateral of $15,350,019 and U.S. Government & Agency securities valued at $13,777,280.
c Investment in real estate investment trust.
d Investment in affiliated money market mutual fund.
| | |
Portfolio Summary (Unaudited) † | Value (%) |
Energy | 14.0 |
Diversified Financials | 13.3 |
Banks | 11.4 |
Food, Beverage & Tobacco | 8.0 |
Capital Goods | 6.8 |
Pharmaceuticals, Biotechnology & Life Sciences | 6.0 |
Insurance | 6.0 |
Health Care Equipment & Services | 5.1 |
Materials | 5.0 |
Semiconductors & Semiconductor Equipment | 4.9 |
Software & Services | 4.1 |
Technology Hardware & Equipment | 3.8 |
Media | 3.8 |
Telecommunication Services | 2.8 |
Transportation | 1.7 |
Real Estate | 1.3 |
Money Market Investments | 1.1 |
Retailing | 1.0 |
Consumer Services | .8 |
| | 100.9 |
† Based on net assets.
See notes to financial statements.
11
STATEMENT OF ASSETS AND LIABILITIES
August 31, 2016
| | | | | | | |
| | | | | | |
| | | Cost | | Value | |
Assets ($): | | | | |
Investments in securities—See Statement of Investments
(including securities on loan, valued at $28,498,660)—Note 1(b): | | | | |
Unaffiliated issuers | | 1,348,275,516 | | 1,576,409,072 | |
Affiliated issuers | | 16,713,996 | | 16,713,996 | |
Cash | | | | | 1,051,709 | |
Receivable for investment securities sold | | | | | 28,944,033 | |
Dividends and securities lending income receivable | | | | | 3,122,417 | |
Receivable for shares of Common Stock subscribed | | | | | 743,690 | |
Prepaid expenses | | | | | 62,914 | |
| | | | | 1,627,047,831 | |
Liabilities ($): | | | | |
Due to The Dreyfus Corporation and affiliates—Note 3(c) | | | | | 1,149,867 | |
Payable for investment securities purchased | | | | | 29,563,156 | |
Liability for securities on loan—Note 1(b) | | | | | 15,350,019 | |
Payable for shares of Common Stock redeemed | | | | | 1,402,073 | |
Interest payable—Note 2 | | | | | 287 | |
Accrued expenses | | | | | 240,190 | |
| | | | | 47,705,592 | |
Net Assets ($) | | | 1,579,342,239 | |
Composition of Net Assets ($): | | | | |
Paid-in capital | | | | | 1,347,183,923 | |
Accumulated undistributed investment income—net | | | | | 17,104,718 | |
Accumulated net realized gain (loss) on investments | | | | | (13,079,958) | |
Accumulated net unrealized appreciation (depreciation)
on investments | | | | | 228,133,556 | |
Net Assets ($) | | | 1,579,342,239 | |
| | | | | | |
Net Asset Value Per Share | Class A | Class C | Class I | Class Y | |
Net Assets ($) | 842,532,410 | 47,696,249 | 509,484,721 | 179,628,859 | |
Shares Outstanding | 23,354,759 | 1,410,861 | 14,089,059 | 4,967,298 | |
Net Asset Value Per Share ($) | 36.08 | 33.81 | 36.16 | 36.16 | |
See notes to financial statements.
12
STATEMENT OF OPERATIONS
Year Ended August 31, 2016
| | | | | | | |
| | | | | | |
| | | | | | |
Investment Income ($): | | | | |
Income: | | | | |
Cash dividends: | | | | |
Unaffiliated issuers | | | 36,021,575 | |
Affiliated issuers | | | 9,569 | |
Income from securities lending—Note 1(b) | | | 56,905 | |
Total Income | | | 36,088,049 | |
Expenses: | | | | |
Management fee—Note 3(a) | | | 11,281,713 | |
Shareholder servicing costs—Note 3(c) | | | 3,432,004 | |
Distribution fees—Note 3(b) | | | 369,860 | |
Directors’ fees and expenses—Note 3(d) | | | 119,516 | |
Custodian fees—Note 3(c) | | | 102,500 | |
Registration fees | | | 101,423 | |
Prospectus and shareholders’ reports | | | 91,015 | |
Professional fees | | | 81,169 | |
Loan commitment fees—Note 2 | | | 16,224 | |
Interest expense—Note 2 | | | 2,962 | |
Miscellaneous | | | 35,910 | |
Total Expenses | | | 15,634,296 | |
Less—reduction in expenses due to undertaking—Note 3(a) | | | (2,031,425) | |
Less—reduction in fees due to earnings credits—Note 3(c) | | | (6,280) | |
Net Expenses | | | 13,596,591 | |
Investment Income—Net | | | 22,491,458 | |
Realized and Unrealized Gain (Loss) on Investments—Note 4 ($): | | |
Net realized gain (loss) on investments | 19,173,104 | |
Net unrealized appreciation (depreciation) on investments | | | 82,566,457 | |
Net Realized and Unrealized Gain (Loss) on Investments | | | 101,739,561 | |
Net Increase in Net Assets Resulting from Operations | | 124,231,019 | |
See notes to financial statements.
13
STATEMENT OF CHANGES IN NET ASSETS
| | | | | | | | | | |
| | | | Year Ended August 31, |
| | | | 2016 | | | | 2015 | |
Operations ($): | | | | | | | | |
Investment income—net | | | 22,491,458 | | | | 14,617,598 | |
Net realized gain (loss) on investments | | 19,173,104 | | | | 220,703,954 | |
Net unrealized appreciation (depreciation)
on investments | | 82,566,457 | | | | (244,418,336) | |
Net Increase (Decrease) in Net Assets
Resulting from Operations | 124,231,019 | | | | (9,096,784) | |
Dividends to Shareholders from ($): | | | | | | | | |
Investment income—net: | | | | | | | | |
Class A | | | (8,700,408) | | | | (7,856,213) | |
Class C | | | (131,423) | | | | (95,222) | |
Class I | | | (5,363,362) | | | | (4,941,242) | |
Class Y | | | (2,304,293) | | | | (2,606,561) | |
Net realized gain on investments: | | | | | | | | |
Class A | | | (111,293,637) | | | | (90,450,836) | |
Class C | | | (7,014,133) | | | | (5,883,979) | |
Class I | | | (54,195,811) | | | | (43,024,811) | |
Class Y | | | (23,284,466) | | | | (22,696,078) | |
Total Dividends | | | (212,287,533) | | | | (177,554,942) | |
Capital Stock Transactions ($): | | | | | | | | |
Net proceeds from shares sold: | | | | | | | | |
Class A | | | 62,929,649 | | | | 68,367,595 | |
Class C | | | 4,750,944 | | | | 4,823,635 | |
Class I | | | 239,127,465 | | | | 172,672,376 | |
Class Y | | | 51,388,951 | | | | 54,092,395 | |
Dividends reinvested: | | | | | | | | |
Class A | | | 111,920,429 | | | | 91,931,813 | |
Class C | | | 5,546,090 | | | | 4,641,705 | |
Class I | | | 57,225,539 | | | | 45,914,899 | |
Class Y | | | 10,295,602 | | | | 9,641,172 | |
Cost of shares redeemed: | | | | | | | | |
Class A | | | (158,297,103) | | | | (145,900,093) | |
Class C | | | (11,949,165) | | | | (8,906,929) | |
Class I | | | (154,953,764) | | | | (172,509,948) | |
Class Y | | | (89,324,013) | | | | (52,419,012) | |
Increase (Decrease) in Net Assets
from Capital Stock Transactions | 128,660,624 | | | | 72,349,608 | |
Total Increase (Decrease) in Net Assets | 40,604,110 | | | | (114,302,118) | |
Net Assets ($): | | | | | | | | |
Beginning of Period | | | 1,538,738,129 | | | | 1,653,040,247 | |
End of Period | | | 1,579,342,239 | | | | 1,538,738,129 | |
Undistributed investment income—net | 17,104,718 | | | | 11,126,296 | |
14
| | | | | | | | | | |
| | | | Year Ended August 31, |
| | | | 2016 | | | | 2015 | |
Capital Share Transactions (Shares): | | | | | | | | |
Class A | | | | | | | | |
Shares sold | | | 1,797,542 | | | | 1,672,858 | |
Shares issued for dividends reinvested | | | 3,263,943 | | | | 2,357,831 | |
Shares redeemed | | | (4,574,517) | | | | (3,564,561) | |
Net Increase (Decrease) in Shares Outstanding | 486,968 | | | | 466,128 | |
Class C | | | | | | | | |
Shares sold | | | 144,175 | | | | 125,361 | |
Shares issued for dividends reinvested | | | 171,652 | | | | 125,350 | |
Shares redeemed | | | (369,177) | | | | (230,203) | |
Net Increase (Decrease) in Shares Outstanding | (53,350) | | | | 20,508 | |
Class Ia | | | | | | | | |
Shares sold | | | 6,926,397 | | | | 4,172,427 | |
Shares issued for dividends reinvested | | | 1,667,897 | | | | 1,177,003 | |
Shares redeemed | | | (4,606,783) | | | | (4,276,490) | |
Net Increase (Decrease) in Shares Outstanding | 3,987,511 | | | | 1,072,940 | |
Class Ya | | | | | | | | |
Shares sold | | | 1,539,436 | | | | 1,321,083 | |
Shares issued for dividends reinvested | | | 300,076 | | | | 247,146 | |
Shares redeemed | | | (2,462,907) | | | | (1,283,539) | |
Net Increase (Decrease) in Shares Outstanding | (623,395) | | | | 284,690 | |
| | | | | | | | | | |
a During the period ended August 31, 2016, 28,618 Class Y shares representing $996,583 were exchanged for 28,618 Class I shares. | |
See notes to financial statements.
15
FINANCIAL HIGHLIGHTS
The following tables describe the performance for each share class for the fiscal periods indicated. All information (except portfolio turnover rate) reflects financial results for a single fund share. Total return shows how much your investment in the fund would have increased (or decreased) during each period, assuming you had reinvested all dividends and distributions. These figures have been derived from the fund’s financial statements.
| | | | | | | |
| | Year Ended August 31, |
| |
Class A Shares | | 2016 | 2015 | 2014 | 2013 | 2012 |
Per Share Data ($): | | | | | | |
Net asset value, beginning of period | | 38.49 | 43.34 | 37.27 | 29.28 | 26.27 |
Investment Operations: | | | | | | |
Investment income—neta | | .50 | .33 | .35 | .40 | .30 |
Net realized and unrealized gain (loss)
on investments | | 2.41 | (.66) | 8.03 | 7.97 | 2.91 |
Total from Investment Operations | | 2.91 | (.33) | 8.38 | 8.37 | 3.21 |
Distributions: | | | | | | |
Dividends from investment income—net | | (.39) | (.36) | (.26) | (.38) | (.20) |
Dividends from net realized gain
on investments | | (4.93) | (4.16) | (2.05) | - | - |
Total Distributions | | (5.32) | (4.52) | (2.31) | (.38) | (.20) |
Net asset value, end of period | | 36.08 | 38.49 | 43.34 | 37.27 | 29.28 |
Total Return (%)b | | 8.26 | (.90) | 23.09 | 28.82 | 12.31 |
Ratios/Supplemental Data (%): | | | | | | |
Ratio of total expenses to
average net assets | | 1.12 | 1.11 | 1.12 | 1.14 | 1.20 |
Ratio of net expenses to
average net assets | | .98 | .98 | .98 | .98 | .98 |
Ratio of net investment income to
average net assets | | 1.42 | .81 | .88 | 1.19 | 1.07 |
Portfolio Turnover Rate | | 80.82 | 96.32 | 67.00 | 76.28 | 95.38 |
Net Assets, end of period ($ x 1,000) | | 842,532 | 880,116 | 970,817 | 1,065,660 | 875,703 |
a Based on average shares outstanding.
b Exclusive of sales charge.
See notes to financial statements.
16
| | | | | | | | | | | |
| | | | | | |
| | Year Ended August 31, |
Class C Shares | | 2016 | 2015 | 2014 | 2013 | 2012 |
Per Share Data ($): | | | | | | |
Net asset value, beginning of period | | 36.35 | 41.17 | 35.54 | 27.93 | 25.05 |
Investment Operations: | | | | | | |
Investment income—neta | | .22 | .02 | .05 | .14 | .08 |
Net realized and unrealized gain (loss)
on investments | | 2.26 | (.61) | 7.63 | 7.62 | 2.80 |
Total from Investment Operations | | 2.48 | (.59) | 7.68 | 7.76 | 2.88 |
Distributions: | | | | | | |
Dividends from investment income—net | | (.09) | (.07) | - | (.15) | - |
Dividends from net realized gain
on investments | | (4.93) | (4.16) | (2.05) | - | - |
Total Distributions | | (5.02) | (4.23) | (2.05) | (.15) | - |
Net asset value, end of period | | 33.81 | 36.35 | 41.17 | 35.54 | 27.93 |
Total Return (%)b | | 7.46 | (1.65) | 22.17 | 27.87 | 11.50 |
Ratios/Supplemental Data (%): | | | | | | |
Ratio of total expenses to
average net assets | | 1.89 | 1.87 | 1.88 | 1.91 | 1.97 |
Ratio of net expenses to
average net assets | | 1.73 | 1.73 | 1.73 | 1.73 | 1.73 |
Ratio of net investment income to
average net assets | | .67 | .06 | .12 | .45 | .32 |
Portfolio Turnover Rate | | 80.82 | 96.32 | 67.00 | 76.28 | 95.38 |
Net Assets, end of period ($ x 1,000) | | 47,696 | 53,226 | 59,442 | 50,665 | 47,824 |
a Based on average shares outstanding.
b Exclusive of sales charge.
See notes to financial statements.
17
FINANCIAL HIGHLIGHTS (continued)
| | | | | | | |
| | | | |
| | Year Ended August 31, |
Class I Shares | | 2016 | 2015 | 2014 | 2013 | 2012 |
Per Share Data ($): | | | | | | |
Net asset value, beginning of period | | 38.58 | 43.45 | 37.36 | 29.34 | 26.30 |
Investment Operations: | | | | | | |
Investment income—neta | | .58 | .43 | .47 | .48 | .37 |
Net realized and unrealized gain (loss)
on investments | | 2.42 | (.66) | 8.03 | 7.99 | 2.90 |
Total from Investment Operations | | 3.00 | (.23) | 8.50 | 8.47 | 3.27 |
Distributions: | | | | | | |
Dividends from investment income—net | | (.49) | (.48) | (.36) | (.45) | (.23) |
Dividends from net realized gain
on investments | | (4.93) | (4.16) | (2.05) | - | - |
Total Distributions | | (5.42) | (4.64) | (2.41) | (.45) | (.23) |
Net asset value, end of period | | 36.16 | 38.58 | 43.45 | 37.36 | 29.34 |
Total Return (%) | | 8.52 | (.66) | 23.40 | 29.18 | 12.57 |
Ratios/Supplemental Data (%): | | | | | | |
Ratio of total expenses to
average net assets | | .89 | .87 | .84 | .95 | .97 |
Ratio of net expenses to
average net assets | | .73 | .73 | .73 | .73 | .73 |
Ratio of net investment income to
average net assets | | 1.67 | 1.05 | 1.14 | 1.45 | 1.33 |
Portfolio Turnover Rate | | 80.82 | 96.32 | 67.00 | 76.28 | 95.38 |
Net Assets, end of period ($ x 1,000) | | 509,485 | 389,711 | 392,260 | 317,800 | 179,900 |
a Based on average shares outstanding.
See notes to financial statements.
18
| | | | | | |
| | | | |
| | Year Ended August 31, |
Class Y Shares | 2016 | 2015 | 2014 | 2013a | |
Per Share Data ($): | | | | | |
Net asset value, beginning of period | 38.58 | 43.45 | 37.36 | 36.70 | |
Investment Operations: | | | | | |
Investment income—netb | .59 | .44 | .32 | .08 | |
Net realized and unrealized gain (loss)
on investments | 2.41 | (.67) | 8.18 | .58 | |
Total from Investment Operations | 3.00 | (.23) | 8.50 | .66 | |
Distributions: | | | | | |
Dividends from investment income—net | (.49) | (.48) | (.36) | - | |
Dividends from net realized gain
on investments | (4.93) | (4.16) | (2.05) | - | |
Total Distributions | (5.42) | (4.64) | (2.41) | - | |
Net asset value, end of period | 36.16 | 38.58 | 43.45 | 37.36 | |
Total Return (%) | 8.52 | (.66) | 23.40 | 1.80c | |
Ratios/Supplemental Data (%): | | | | | |
Ratio of total expenses to
average net assets | .79 | .79 | .78 | .83d | |
Ratio of net expenses to
average net assets | .73 | .73 | .73 | .73d | |
Ratio of net investment income to
average net assets | 1.67 | 1.07 | .87 | 1.21d | |
Portfolio Turnover Rate | 80.82 | 96.32 | 67.00 | 76.28 | |
Net Assets, end of period ($ x 1,000) | 179,629 | 215,685 | 230,522 | 1 | |
a From July 1, 2013 (commencement of initial offering) to August 31, 2013.
b Based on average shares outstanding.
c Not annualized.
d Annualized.
See notes to financial statements.
19
NOTES TO FINANCIAL STATEMENTS
NOTE 1—Significant Accounting Policies:
Dreyfus Strategic Value Fund (the “fund”) is a separate diversified series of Advantage Funds, Inc. (the “Company”), which is registered under the Investment Company Act of 1940, as amended (the “Act”), as an open-end management investment company and operates as a series company currently offering ten series, including the fund. The fund’s investment objective is to seek capital appreciation. The Dreyfus Corporation (the “Manager” or “Dreyfus”), a wholly-owned subsidiary of The Bank of New York Mellon Corporation (“BNY Mellon”), serves as the fund’s investment adviser.
MBSC Securities Corporation (the “Distributor”), a wholly-owned subsidiary of Dreyfus, is the distributor of the fund’s shares. The fund is authorized to issue 700 million shares of $.001 par value Common Stock. The fund currently offers four classes of shares: Class A (300 million shares authorized), Class C (100 million shares authorized), Class I (200 million shares authorized) and Class Y (100 million shares authorized). Class A shares generally are subject to a sales charge imposed at the time of purchase. Class C shares are subject to a contingent deferred sales charge (“CDSC”) imposed on Class C shares redeemed within one year of purchase. Class I and Class Y shares are sold at net asset value per share generally to institutional investors. Other differences between the classes include the services offered to and the expenses borne by each class, the allocation of certain transfer agency costs, and certain voting rights. Income, expenses (other than expenses attributable to a specific class), and realized and unrealized gains or losses on investments are allocated to each class of shares based on its relative net assets.
The Company accounts separately for the assets, liabilities and operations of each series. Expenses directly attributable to each series are charged to that series’ operations; expenses which are applicable to all series are allocated among them on a pro rata basis.
The Financial Accounting Standards Board (“FASB”) Accounting Standards Codification (“ASC”) is the exclusive reference of authoritative U.S. generally accepted accounting principles (“GAAP”) recognized by the FASB to be applied by nongovernmental entities. Rules and interpretive releases of the Securities and Exchange Commission (“SEC”) under authority of federal laws are also sources of authoritative GAAP for SEC registrants. The fund’s financial statements are prepared in accordance with GAAP, which may require the use of management estimates and assumptions. Actual results could differ from those estimates.
20
The Company enters into contracts that contain a variety of indemnifications. The fund’s maximum exposure under these arrangements is unknown. The fund does not anticipate recognizing any loss related to these arrangements.
(a) Portfolio valuation: The fair value of a financial instrument is the amount that would be received to sell an asset or paid to transfer a liability in an orderly transaction between market participants at the measurement date (i.e., the exit price). GAAP establishes a fair value hierarchy that prioritizes the inputs of valuation techniques used to measure fair value. This hierarchy gives the highest priority to unadjusted quoted prices in active markets for identical assets or liabilities (Level 1 measurements) and the lowest priority to unobservable inputs (Level 3 measurements).
Additionally, GAAP provides guidance on determining whether the volume and activity in a market has decreased significantly and whether such a decrease in activity results in transactions that are not orderly. GAAP requires enhanced disclosures around valuation inputs and techniques used during annual and interim periods.
Various inputs are used in determining the value of the fund’s investments relating to fair value measurements. These inputs are summarized in the three broad levels listed below:
Level 1—unadjusted quoted prices in active markets for identical investments.
Level 2—other significant observable inputs (including quoted prices for similar investments, interest rates, prepayment speeds, credit risk, etc.).
Level 3—significant unobservable inputs (including the fund’s own assumptions in determining the fair value of investments).
The inputs or methodology used for valuing securities are not necessarily an indication of the risk associated with investing in those securities.
Changes in valuation techniques may result in transfers in or out of an assigned level within the disclosure hierarchy. Valuation techniques used to value the fund’s investments are as follows:
Investments in securities are valued at the last sales price on the securities exchange or national securities market on which such securities are primarily traded. Securities listed on the National Market System for which market quotations are available are valued at the official closing price or, if there is no official closing price that day, at the last sales price. For open short positions, asked prices are used for valuation purposes. Bid price is
21
NOTES TO FINANCIAL STATEMENTS (continued)
used when no asked price is available. Registered investment companies that are not traded on an exchange are valued at their net asset value. All of the preceding securities are generally categorized within Level 1 of the fair value hierarchy.
Securities not listed on an exchange or the national securities market, or securities for which there were no transactions, are valued at the average of the most recent bid and asked prices. These securities are generally categorized within Level 2 of the fair value hierarchy.
Fair valuing of securities may be determined with the assistance of a pricing service using calculations based on indices of domestic securities and other appropriate indicators, such as prices of relevant American Depository Receipts and financial futures. Utilizing these techniques may result in transfers between Level 1 and Level 2 of the fair value hierarchy.
When market quotations or official closing prices are not readily available, or are determined not to reflect accurately fair value, such as when the value of a security has been significantly affected by events after the close of the exchange or market on which the security is principally traded (for example, a foreign exchange or market), but before the fund calculates its net asset value, the fund may value these investments at fair value as determined in accordance with the procedures approved by the Company’s Board of Directors (the “Board”). Certain factors may be considered when fair valuing investments such as: fundamental analytical data, the nature and duration of restrictions on disposition, an evaluation of the forces that influence the market in which the securities are purchased and sold, and public trading in similar securities of the issuer or comparable issuers. These securities are either categorized within Level 2 or 3 of the fair value hierarchy depending on the relevant inputs used.
For restricted securities where observable inputs are limited, assumptions about market activity and risk are used and are generally categorized within Level 3 of the fair value hierarchy.
The following is a summary of the inputs used as of August 31, 2016 in valuing the fund’s investments:
22
| | | | | |
| | Level 1 - Unadjusted Quoted Prices | Level 2 - Other Significant Observable Inputs | Level 3 -Significant Unobservable Inputs | Total |
Assets ($) | | | | |
Investments in Securities: | | | |
Equity Securities - Domestic Common Stocks† | 1,576,409,072 | - | - | 1,576,409,072 |
Mutual Funds | 16,713,996 | - | - | 16,713,996 |
† See Statement of Investments for additional detailed categorizations.
At August 31, 2016, there were no transfers between levels of the fair value hierarchy.
(b) Securities transactions and investment income: Securities transactions are recorded on a trade date basis. Realized gains and losses from securities transactions are recorded on the identified cost basis. Dividend income is recognized on the ex-dividend date and interest income, including, where applicable, accretion of discount and amortization of premium on investments, is recognized on the accrual basis.
Pursuant to a securities lending agreement with The Bank of New York Mellon, a subsidiary of BNY Mellon and an affiliate of Dreyfus, the fund may lend securities to qualified institutions. It is the fund’s policy that, at origination, all loans are secured by collateral of at least 102% of the value of U.S. securities loaned and 105% of the value of foreign securities loaned. Collateral equivalent to at least 100% of the market value of securities on loan is maintained at all times. Collateral is either in the form of cash, which can be invested in certain money market mutual funds managed by Dreyfus, or U.S. Government and Agency securities. The fund is entitled to receive all dividends, interest and distributions on securities loaned, in addition to income earned as a result of the lending transaction. Should a borrower fail to return the securities in a timely manner, The Bank of New York Mellon is required to replace the securities for the benefit of the fund or credit the fund with the market value of the unreturned securities and is subrogated to the fund’s rights against the borrower and the collateral. Additionally, the contractual maturity of security lending transactions are on an overnight and continuous basis. During the period ended August 31, 2016, The Bank of New York Mellon earned $14,879 from lending portfolio securities, pursuant to the securities lending agreement.
(c) Affiliated issuers: Investments in other investment companies advised by Dreyfus are defined as “affiliated” under the Act. Investments in
23
NOTES TO FINANCIAL STATEMENTS (continued)
affiliated investment companies during the period ended August 31, 2016 were as follows:
| | | | | | |
Affiliated Investment Company | Value 8/31/2015 ($) | Purchases ($) | Sales ($) | Value 8/31/2016 ($) | Net
Assets (%) |
Dreyfus Institutional Cash Advantage Fund, Institutional Shares | - | 206,479,175 | 191,129,156 | 15,350,019 | 1.0 |
Dreyfus Institutional Preferred Government Plus Money Market Fund† | 2,203,251 | 285,600,259 | 286,439,533 | 1,363,977 | .1 |
Total | 2,203,251 | 492,079,434 | 477,568,689 | 16,713,996 | 1.1 |
† Formerly Dreyfus Institutional Preferred Plus Money Market Fund.
(d) Dividends to shareholders: Dividends are recorded on the ex-dividend date. Dividends from investment income-net and dividends from net realized capital gains, if any, are normally declared and paid annually, but the fund may make distributions on a more frequent basis to comply with the distribution requirements of the Internal Revenue Code of 1986, as amended (the “Code”). To the extent that net realized capital gains can be offset by capital loss carryovers, it is the policy of the fund not to distribute such gains. Income and capital gain distributions are determined in accordance with income tax regulations, which may differ from GAAP.
(e) Federal income taxes: It is the policy of the fund to continue to qualify as a regulated investment company, if such qualification is in the best interests of its shareholders, by complying with the applicable provisions of the Code, and to make distributions of taxable income sufficient to relieve it from substantially all federal income and excise taxes.
As of and during the period ended August 31, 2016, the fund did not have any liabilities for any uncertain tax positions. The fund recognizes interest and penalties, if any, related to uncertain tax positions as income tax expense in the Statement of Operations. During the period ended August 31, 2016, the fund did not incur any interest or penalties.
Each tax year in the four-year period ended August 31, 2016 remains subject to examination by the Internal Revenue Service and state taxing authorities.
24
At August 31, 2016, the components of accumulated earnings on a tax basis were as follows: undistributed ordinary income $16,888,808, undistributed capital gains $2,354,926, accumulated capital losses $2,827,632 and unrealized appreciation $215,742,214.
Under the Regulated Investment Company Modernization Act of 2010 (the “2010 Act”), the fund is permitted to carry forward capital losses incurred in taxable years beginning after December 22, 2010 (“post-enactment losses”) for an unlimited period. Furthermore, post-enactment capital loss carryovers retain their character as either short-term or long-term capital losses rather than short-term as they were under previous statute. The 2010 Act requires post-enactment losses to be utilized before the utilization of losses incurred in taxable years prior to the effective date of the 2010 Act (“pre-enactment losses”). As a result of this ordering rule, pre-enactment losses may be more likely to expire unused.
As a result of the fund’s merger with Dreyfus Large Cap Value Fund, capital losses of $2,827,632 are available to offset future realized gains, if any. Based on certain provisions in the Code, the amount of losses which can be utilized in subsequent years is subject to an annual limitation. Of this acquired capital loss, $1,668,025 will expire in fiscal year 2017 and $1,159,607 will expire in fiscal year 2018.
The tax character of distributions paid to shareholders during the fiscal periods ended August 31, 2016 and August 31, 2015 were as follows: ordinary income $25,374,554 and $46,163,797, and long-term capital gains $186,912,979 and $131,391,145, respectively.
During the period ended August 31, 2016, as a result of permanent book to tax differences, primarily due to the tax treatment for real estate investment trusts and dividend reclassification, the fund decreased accumulated undistributed investment income-net by $13,550 and increased accumulated net realized gain (loss) on investments by the same amount. Net assets and net asset value per share were not affected by this reclassification.
NOTE 2—Bank Lines of Credit:
The fund participates with other Dreyfus-managed funds in a $555 million unsecured credit facility led by Citibank, N.A. and a $300 million unsecured credit facility provided by The Bank of New York Mellon (each, a “Facility”), each to be utilized primarily for temporary or emergency purposes, including the financing of redemptions. Prior to January 11, 2016, the unsecured credit facility with Citibank, N.A. was $480 million and prior to October 7, 2015, the unsecured credit facility with Citibank, N.A. was $430 million. In connection therewith, the fund has agreed to
25
NOTES TO FINANCIAL STATEMENTS (continued)
pay its pro rata portion of commitment fees for each Facility. Interest is charged to the fund based on rates determined pursuant to the terms of the respective Facility at the time of borrowing.
The average amount of borrowings outstanding under the Facilities during the period ended August 31, 2016 was approximately $226,800 with a related weighted average annualized interest rate of 1.30%.
NOTE 3—Management Fee and Other Transactions with Affiliates:
(a) Pursuant to a management agreement with Dreyfus, the management fee is computed at the annual rate of .75% of the value of the fund’s average daily net assets and is payable monthly. Dreyfus has contractually agreed, from September 1, 2015 through January 1, 2017 to waive receipt of its fees and/or assume the direct expenses of the fund, so that the expenses of Class A, Class C, Class I and Class Y shares (excluding taxes, interest expense, brokerage commissions, commitment fees on borrowings and extraordinary expenses) do not exceed .98%, 1.73%, .73% and .73% of the value of the respective class’ average daily net assets. The reduction in expenses, pursuant to the undertaking, amounted to $2,031,425 during the period ended August 31, 2016.
During the period ended August 31, 2016, the Distributor retained $16,477 from commissions earned on sales of the fund’s Class A shares and $2,823 from CDSCs on redemptions of the fund’s Class C shares.
(b) Under the Distribution Plan adopted pursuant to Rule 12b-1 under the Act, Class C shares pay the Distributor for distributing its shares at an annual rate of .75% of the value of its average daily net assets. During the period ended August 31, 2016, Class C shares were charged $369,860 pursuant to the Distribution Plan.
(c) Under the Shareholder Services Plan, Class A and Class C shares pay the Distributor at an annual rate of .25% of the value of their average daily net assets for the provision of certain services. The services provided may include personal services relating to shareholder accounts, such as answering shareholder inquiries regarding the fund and providing reports and other information, and services related to the maintenance of shareholder accounts. The Distributor may make payments to Service Agents (securities dealers, financial institutions or other industry professionals) with respect to these services. The Distributor determines the amounts to be paid to Service Agents. During the period ended August 31, 2016, Class A and Class C shares were charged $2,103,393 and $123,287, respectively, pursuant to the Shareholder Services Plan.
26
The fund has arrangements with the transfer agent and the custodian whereby the fund may receive earnings credits when positive cash balances are maintained, which are used to offset transfer agency and custody fees. For financial reporting purposes, the fund includes net earnings credits as an expense offset in the Statement of Operations.
The fund compensates Dreyfus Transfer, Inc., a wholly-owned subsidiary of Dreyfus, under a transfer agency agreement for providing transfer agency and cash management services for the fund. The majority of transfer agency fees are comprised of amounts paid on a per account basis, while cash management fees are related to fund subscriptions and redemptions. During the period ended August 31, 2016, the fund was charged $258,968 for transfer agency services and $18,190 for cash management services. These fees are included in Shareholder servicing costs in the Statement of Operations. Cash management fees were partially offset by earnings credits of $6,280.
The fund compensates The Bank of New York Mellon under a custody agreement for providing custodial services for the fund. These fees are determined based on net assets, geographic region and transaction activity. During the period ended August 31, 2016, the fund was charged $102,500 pursuant to the custody agreement.
During the period ended August 31, 2016, the fund was charged $9,967 for services performed by the Chief Compliance Officer and his staff.
The components of “Due to The Dreyfus Corporation and affiliates” in the Statement of Assets and Liabilities consist of: management fees $993,982, Distribution Plan fees $30,234, Shareholder Services Plan fees $187,496, custodian fees $49,796, Chief Compliance Officer fees $6,416 and transfer agency fees $46,498, which are offset against an expense reimbursement currently in effect in the amount of $164,555.
(d) Each Board member also serves as a Board member of other funds within the Dreyfus complex. Annual retainer fees and attendance fees are allocated to each fund based on net assets.
NOTE 4—Securities Transactions:
The aggregate amount of purchases and sales of investment securities, excluding short-term securities, during the period ended August 31, 2016, amounted to $1,219,480,833 and $1,280,760,940, respectively.
At August 31, 2016, the cost of investments for federal income tax purposes was $1,377,380,854; accordingly, accumulated net unrealized appreciation on investments was $215,742,214, consisting of $248,679,525
27
NOTES TO FINANCIAL STATEMENTS (continued)
gross unrealized appreciation and $32,937,311 gross unrealized depreciation.
28
REPORT OF INDEPENDENT REGISTERED
PUBLIC ACCOUNTING FIRM
Shareholders and Board of Directors
Dreyfus Strategic Value Fund
We have audited the accompanying statement of assets and liabilities, including the statement of investments, of Dreyfus Strategic Value Fund (one of the series comprising Advantage Funds, Inc.) as of August 31, 2016, and the related statement of operations for the year then ended, the statement of changes in net assets for each of the two years in the period then ended, and the financial highlights for each of the periods indicated therein. These financial statements and financial highlights are the responsibility of the Fund’s management. Our responsibility is to express an opinion on these financial statements and financial highlights based on our audits.
We conducted our audits in accordance with the standards of the Public Company Accounting Oversight Board (United States). Those standards require that we plan and perform the audit to obtain reasonable assurance about whether the financial statements and financial highlights are free of material misstatement. We were not engaged to perform an audit of the Fund’s internal control over financial reporting. Our audits included consideration of internal control over financial reporting as a basis for designing audit procedures that are appropriate in the circumstances, but not for the purpose of expressing an opinion on the effectiveness of the Fund’s internal control over financial reporting. Accordingly, we express no such opinion. An audit also includes examining, on a test basis, evidence supporting the amounts and disclosures in the financial statements and financial highlights, assessing the accounting principles used and significant estimates made by management, and evaluating the overall financial statement presentation. Our procedures included confirmation of securities owned as of August 31, 2016 by correspondence with the custodian and others. We believe that our audits provide a reasonable basis for our opinion.
In our opinion, the financial statements and financial highlights referred to above present fairly, in all material respects, the financial position of Dreyfus Strategic Value Fund at August 31, 2016, the results of its operations for the year then ended, the changes in its net assets for each of the two years in the period then ended, and the financial highlights for each of the indicated periods, in conformity with U.S. generally accepted accounting principles.

New York, New York
October 27, 2016
29
IMPORTANT TAX INFORMATION (Unaudited)
For federal tax purposes, the fund hereby reports 100% of the ordinary dividends paid during the fiscal year ended August 31, 2016 as qualifying for the corporate dividends received deduction. Also, certain dividends paid by the fund may be subject to a maximum tax rate of 15%, as provided for by the Jobs and Growth Tax Relief Reconciliation Act of 2003. Of the distributions paid during the fiscal year, $25,374,554 represents the maximum amount that may be considered qualified dividend income. The fund also hereby reports $.2233 per share as a short-term capital gain distribution and $4.7028 per share as a long-term capital gain distribution paid on December 8, 2015. Shareholders will receive notification in early 2017 of the percentage applicable to the preparation of their 2016 income tax returns.
30
BOARD MEMBERS INFORMATION (Unaudited)
INDEPENDENT BOARD MEMBERS
Joseph S. DiMartino (72)
Chairman of the Board (1995)
Principal Occupation During Past 5 Years:
· Corporate Director and Trustee (1995-present)
Other Public Company Board Memberships During Past 5 Years:
· CBIZ (formerly, Century Business Services, Inc.), a provider of outsourcing functions for small and medium size companies, Director (1997-present)
No. of Portfolios for which Board Member Serves: 136
———————
Peggy C. Davis (73)
Board Member (2006)
Principal Occupation During Past 5 Years:
· Shad Professor of Law, New York University School of Law (1983-present)
No. of Portfolios for which Board Member Serves: 49
———————
David P. Feldman (76)
Board Member (1996)
Principal Occupation During Past 5 Years:
· Corporate Director and Trustee (1985-present)
Other Public Company Board Memberships During Past 5 Years:
· BBH Mutual Funds Group (5 registered mutual funds), Director (1992-2014)
No. of Portfolios for which Board Member Serves: 35
———————
Ehud Houminer (76)
Board Member (1993)
Principal Occupation During Past 5 Years:
· Executive-in-Residence at the Columbia Business School, Columbia
University (1992-present)
Other Public Company Board Memberships During Past 5 Years:
· Avnet, Inc., an electronics distributor, Director (1993-2012)
No. of Portfolios for which Board Member Serves: 59
———————
31
BOARD MEMBERS INFORMATION (Unaudited) (continued)
INDEPENDENT BOARD MEMBERS (continued)
Lynn Martin (76)
Board Member (2012)
Principal Occupation During Past 5 Years:
· President of The Martin Hall Group LLC, a human resources consulting firm (2005-2012)
Other Public Company Board Memberships During Past 5 Years:
· AT&T, Inc., a telecommunications company, Director (1999-2012)
· Ryder System, Inc., a supply chain and transportation management company, Director (1993-2012)
No. of Portfolios for which Board Member Serves: 35
———————
Robin A. Melvin (52)
Board Member (2012)
Principal Occupation During Past 5 Years:
· Co-chairman, Illinois Mentoring Partnership, non-profit organization dedicated to increasing the quantity and quality of mentoring services in Illinois; (2014-present; served as a board member since 2013)
· Director, Boisi Family Foundation, a private family foundation that supports youth-serving organizations that promote the self sufficiency of youth from disadvantaged circumstances (1995-2012)
No. of Portfolios for which Board Member Serves: 108
———————
Dr. Martin Peretz (77)
Board Member (2006)
Principal Occupation During Past 5 Years:
· Editor-in-Chief Emeritus of The New Republic Magazine (2011-2012) (previously,
Editor-in-Chief, 1974-2011)
· Director of TheStreet.com, a financial information service on the web (1996-2010)
· Lecturer at Harvard University (1969-2012)
No. of Portfolios for which Board Member Serves: 35
———————
Once elected all Board Members serve for an indefinite term, but achieve Emeritus status upon reaching age 80. The address of the Board Members and Officers is c/o The Dreyfus Corporation, 200 Park Avenue, New York, New York 10166. Additional information about the Board Members is available in the fund’s Statement of Additional Information which can be obtained from Dreyfus free of charge by calling this toll free number: 1-800-DREYFUS.
James F. Henry, Emeritus Board Member
Dr. Paul A. Marks, Emeritus Board Member
Philip L. Toia, Emeritus Board Member
32
OFFICERS OF THE FUND (Unaudited)
BRADLEY J. SKAPYAK, President since January 2010.
Chief Operating Officer and a director of the Manager since June 2009, Chairman of Dreyfus Transfer, Inc., an affiliate of the Manager and the transfer agent of the funds, since May 2011 and Executive Vice President of the Distributor since June 2007. From April 2003 to June 2009, Mr. Skapyak was the head of the Investment Accounting and Support Department of the Manager. He is an officer of 65 investment companies (comprised of 136 portfolios) managed by the Manager. He is 57 years old and has been an employee of the Manager since February 1988.
BENNETT A. MACDOUGALL, Chief Legal Officer since October 2015.
Chief Legal Officer of the Manager since June 2015; from June 2005 to June 2015, he served in various capacities with Deutsche Bank – Asset & Wealth Management Division, including as Director and Associate General Counsel, and Chief Legal Officer of Deutsche Investment Management Americas Inc. from June 2012 to May 2015. He is an officer of 66 investment companies (comprised of 161 portfolios) managed by the Manager. He is 44 years old and has been an employee of the Manager since June 2015.
JANETTE E. FARRAGHER, Vice President and Secretary since December 2011.
Assistant General Counsel of BNY Mellon, and an officer of 66 investment companies (comprised of 161 portfolios) managed by the Manager. She is 53 years old and has been an employee of the Manager since February 1984.
JAMES BITETTO, Vice President and Assistant Secretary since August 2005.
Managing Counsel of BNY Mellon and Secretary of the Manager, and an officer of 66 investment companies (comprised of 161 portfolios) managed by the Manager. He is 50 years old and has been an employee of the Manager since December 1996.
JONI LACKS CHARATAN, Vice President and Assistant Secretary since August 2005.
Managing Counsel of BNY Mellon, and an officer of 66 investment companies (comprised of 161 portfolios) managed by the Manager. She is 60 years old and has been an employee of the Manager since October 1988.
JOSEPH M. CHIOFFI, Vice President and Assistant Secretary since August 2005.
Managing Counsel of BNY Mellon, and an officer of 66 investment companies (comprised of 161 portfolios) managed by the Manager. He is 54 years old and has been an employee of the Manager since June 2000.
MAUREEN E. KANE, Vice President and Assistant Secretary since April 2015.
Managing Counsel of BNY Mellon since July 2014; from October 2004 until July 2014, General Counsel, and from May 2009 until July 2014, Chief Compliance Officer of Century Capital Management. She is an officer of 66 investment companies (comprised of 161 portfolios) managed by the Manager. She is 54 years old and has been an employee of the Manager since July 2014.
SARAH S. KELLEHER, Vice President and Assistant Secretary since April 2014.
Senior Counsel of BNY Mellon, and an officer of 66 investment companies (comprised of 161 portfolios) managed by the Manager; from August 2005 to March 2013, Associate General Counsel of Third Avenue Management. She is 40 years old and has been an employee of the Manager since March 2013.
JEFF PRUSNOFSKY, Vice President and Assistant Secretary since August 2005.
Senior Managing Counsel of BNY Mellon, and an officer of 66 investment companies (comprised of 161 portfolios) managed by the Manager. He is 51 years old and has been an employee of the Manager since October 1990.
JAMES WINDELS, Treasurer since November 2001.
Director – Mutual Fund Accounting of the Manager, and an officer of 66 investment companies (comprised of 161 portfolios) managed by the Manager. He is 57 years old and has been an employee of the Manager since April 1985.
RICHARD CASSARO, Assistant Treasurer since January 2008.
Senior Accounting Manager – Money Market, Municipal Bond and Equity Funds of the Manager, and an officer of 66 investment companies (comprised of 161 portfolios) managed by the Manager. He is 57 years old and has been an employee of the Manager since September 1982.
33
OFFICERS OF THE FUND (Unaudited) (continued)
GAVIN C. REILLY, Assistant Treasurer since December 2005.
Tax Manager of the Investment Accounting and Support Department of the Manager, and an officer of 66 investment companies (comprised of 161 portfolios) managed by the Manager. He is 48 years old and has been an employee of the Manager since April 1991.
ROBERT S. ROBOL, Assistant Treasurer since August 2005.
Senior Accounting Manager of the Manager, and an officer of 66 investment companies (comprised of 161 portfolios) managed by the Manager. He is 52 years old and has been an employee of the Manager since October 1988.
ROBERT SALVIOLO, Assistant Treasurer since July 2007.
Senior Accounting Manager – Equity Funds of the Manager, and an officer of 66 investment companies (comprised of 161 portfolios) managed by the Manager. He is 49 years old and has been an employee of the Manager since June 1989.
ROBERT SVAGNA, Assistant Treasurer since December 2002.
Senior Accounting Manager – Fixed Income and Equity Funds of the Manager, and an officer of 66 investment companies (comprised of 161 portfolios) managed by the Manager. He is 49 years old and has been an employee of the Manager since November 1990.
JOSEPH W. CONNOLLY, Chief Compliance Officer since October 2004.
Chief Compliance Officer of the Manager and The Dreyfus Family of Funds (66 investment companies, comprised of 161 portfolios). He is 59 years old and has served in various capacities with the Manager since 1980, including manager of the firm’s Fund Accounting Department from 1997 through October 2001.
CARIDAD M. CAROSELLA, Anti-Money Laundering Compliance Officer since January 2016
Anti-Money Laundering Compliance Officer of the Dreyfus Family of Funds and BNY Mellon Funds Trust since January 2016; from May 2015 to December 2015, Interim Anti-Money Laundering Compliance Officer of the Dreyfus Family of Funds and BNY Mellon Funds Trust and the Distributor; from January 2012 to May 2015, AML Surveillance Officer of the Distributor and from 2007 to December 2011, Financial Processing Manager of the Distributor. She is an officer of 61 investment companies (comprised of 156 portfolios) managed by the Manager. She is 48 years old and has been an employee of the Distributor since 1997.
34
NOTES
35
NOTES
36
NOTES
37
Dreyfus Strategic Value Fund
200 Park Avenue
New York, NY 10166
Manager
The Dreyfus Corporation
200 Park Avenue
New York, NY 10166
Custodian
The Bank of New York Mellon
225 Liberty Street
New York, NY 10286
Transfer Agent &
Dividend Disbursing Agent
Dreyfus Transfer, Inc.
200 Park Avenue
New York, NY 10166
Distributor
MBSC Securities Corporation
200 Park Avenue
New York, NY 10166
| | |
Ticker Symbol: | Class A:DAGVX Class C:DCGVX Class I:DRGVX Class Y:DRGYX |
Telephone Call your financial representative or 1-800-DREYFUS
Mail The Dreyfus Family of Funds, 144 Glenn Curtiss Boulevard, Uniondale, NY 11556-0144
E-mail Send your request to info@dreyfus.com
Internet Information can be viewed online or downloaded at www.dreyfus.com
The fund files its complete schedule of portfolio holdings with the Securities and Exchange Commission (“SEC”) for the first and third quarters of each fiscal year on Form N-Q. The fund’s Forms N-Q are available on the SEC’s website at www.sec.gov and may be reviewed and copied at the SEC’s Public Reference Room in Washington, DC. (phone 1-800-SEC-0330 for information).
A description of the policies and procedures that the fund uses to determine how to vote proxies relating to portfolio securities and information regarding how the fund voted these proxies for the most recent 12-month period ended June 30 is available at www.dreyfus.com and on the SEC’s website at www.sec.gov and without charge, upon request, by calling 1-800-DREYFUS.
| | |
© 2016 MBSC Securities Corporation
0257AR0816 | 
|
Dreyfus Structured Midcap Fund
| | | |

| | ANNUAL REPORT August 31, 2016 |
| |
Save time. Save paper. View your next shareholder report online as soon as it’s available. Log into www.dreyfus.com and sign up for Dreyfus eCommunications. It’s simple and only takes a few minutes. |
| |
The views expressed in this report reflect those of the portfolio manager only through the end of the period covered and do not necessarily represent the views of Dreyfus or any other person in the Dreyfus organization. Any such views are subject to change at any time based upon market or other conditions and Dreyfus disclaims any responsibility to update such views. These views may not be relied on as investment advice and, because investment decisions for a Dreyfus fund are based on numerous factors, may not be relied on as an indication of trading intent on behalf of any Dreyfus fund. |
| |
Not FDIC-Insured • Not Bank-Guaranteed • May Lose Value |
Contents
T H E F U N D
F O R M O R E I N F O R M AT I O N
Back Cover
| | | | |
| |
Dreyfus Structured Midcap Fund
| | The Fund |
A LETTER FROM THE CHIEF EXECUTIVE OFFICER
Dear Shareholder:
We are pleased to present this annual report for Dreyfus Structured Midcap Fund, covering the 12-month period from September 1, 2015 through August 31, 2016. For information about how the fund performed during the reporting period, as well as general market perspectives, we provide a Discussion of Fund Performance on the pages that follow.
Despite tumultuous swings in market sentiment stemming from global economic developments, stocks and bonds generally produced strong returns over the reporting period. During the fall of 2015, investors reacted cautiously to sluggish global economic growth, plummeting commodity prices, and the first increase in short-term U.S. interest rates in nearly a decade. These worries sparked particularly sharp declines in equities in January 2016, but investor sentiment soon improved when U.S. monetary policymakers refrained from additional rate hikes, other central banks eased their monetary policies further, and commodity prices rebounded. Stocks mostly rallied over the ensuing months, driving several broad measures of stock market performance to new record highs. In the bond market, aggressively accommodative monetary policies and robust investor demand for current income sent yields of high-quality sovereign bonds lower and their prices higher.
Recently we have seen evidence that investors may be shifting their focus away from macroeconomic influences and toward underlying company and industry fundamentals. This development—along with wide differences in underlying fundamental and technical influences across various asset classes, economic sectors, and regional markets—suggests that selectivity may be a more important determinant of investment success over the months ahead. As always, we encourage you to discuss the implications of our observations with your financial advisor.
Thank you for your continued confidence and support.
Sincerely,

Mark D. Santero
Chief Executive Officer
The Dreyfus Corporation
September 15, 2016
2
DISCUSSION OF FUND PERFORMANCE
For the period from September 1, 2015 through August 31, 2016, as provided by C. Wesley Boggs, William S. Cazalet, CAIA, and Ronald P. Gala, CFA, Portfolio Managers
Market and Fund Performance Overview
For the 12-month period ended August 31, 2016, Dreyfus Structured Midcap Fund’s Class A shares produced a total return of 6.27%, Class C shares returned 5.50%, Class I shares returned 6.54%, and Class Y shares returned 6.71%.1 In comparison, the Standard & Poor’s MidCap 400® Index (the “S&P 400 Index”), the fund’s benchmark, produced a total return of 12.33%.2
Mid-cap stocks achieved double-digit returns, on average, as a rally over the reporting period’s second half more than erased losses from the first half. The fund lagged its benchmark, mainly due to security selection shortfalls in the financials and industrials sectors.
The Fund’s Investment Approach
The fund seeks long-term capital growth. To pursue this goal, the fund normally invests at least 80% of its net assets, plus any borrowings for investment purposes, in the stocks of companies included in the S&P 400 Index or the Russell Midcap® Index. The fund invests principally in common stocks, but the fund’s equity investments may also include preferred stocks, convertible securities of U.S. and foreign issuers, including those purchased in initial public offerings, and securities issued by real estate investment trusts (REITs). We construct the portfolio through a “bottom-up” structured approach focusing on stock selection as opposed to making proactive decisions as to industry sector exposure. The approach seeks to identify undervalued securities through a quantitative process that ranks stocks based on value measures, behavioral/momentum factors, and earnings quality metrics.
Stocks Advanced Strongly Despite Global Headwinds
Stocks proved volatile over the final four months of 2015 when global investors grew more averse to risks in light of sluggish international growth, and U.S. investors responded cautiously to the first increase in short-term U.S. interest rates in nearly a decade. In January 2016, disappointing economic data in China sparked sharp declines in commodity prices, and investors worried that additional U.S. rate hikes might weigh on the domestic economic recovery. Consequently, stocks across all capitalization ranges fell sharply during the month.
The market changed direction in mid-February as investors responded to relatively strong U.S. economic data and better-than-expected corporate earnings. The market rally continued through the spring when commodity prices began to rebound, U.S. monetary policymakers refrained from implementing additional rate hikes, and some major central banks further eased their monetary policies. Although a referendum in the United Kingdom to leave the European Union introduced renewed market turmoil in late June, equities bounced back quickly, enabling the S&P 400 Index to post solid returns for the reporting period overall.
Income-Oriented Stocks Led Market’s Advance
In a market environment motivated mainly by changing investor sentiment, companies exhibiting the fundamental characteristics considered by the fund’s quantitative process were
3
DISCUSSION OF FUND PERFORMANCE (continued)
generally not rewarded to the extent they have been in the past. Investors seeking higher levels of income than were available from high-quality sovereign bonds turned to dividend-paying stocks in traditionally defensive market sectors, such as utilities. Consequently, the fund’s security selections generally lagged market averages.
Results in the real estate industry were further undermined by our stock selections among REITs as the fund did not own some of the better-performing REITs in the benchmark. In the financials sector, investment manager Affiliated Managers Group lost value after reducing its earnings guidance in a generally poor environment for capital markets companies.
Relative performance in the industrials sector was undermined by overweighted exposure to air carriers, such as JetBlue Airways, that were hard hit during the period and underperformed our expectations. Among individual stocks, oil refiner Western Refining, which acquired Northern Tier Energy during the period, declined due to a challenging environment for refining margins, and wholesale grocery distributor Supervalu struggled with lower sales volumes.
The information technology sector produced better relative results. The fund benefited from fortunate timing in trades of Internet registry company VeriSign, which fared well amid strong domain-name renewal activity and rising international demand for .com and .net web addresses. In the consumer discretionary sector, bedding provider Tempur Sealy International rallied strongly after the fund established a position during the reporting period’s second half. The fund’s top individual performer for the reporting period was food ingredients provider Ingredion, which announced better-than-expected earnings over two consecutive quarters.
Maintaining a Focus on Fundamentals
As of the reporting period’s end, our quantitative models have continued to identify what we believe are attractive investment opportunities across a broad spectrum of mid-cap companies and industry groups. Indeed, recent bouts of volatility have provided opportunities to purchase the stocks of companies ranked highly by our process. When the fund’s holdings reach what we perceive to be fuller valuations, we expect to replace them with high-quality companies that display then-currently attractive valuations in our model. In addition, we continue to maintain a broadly diversified portfolio.
September 15, 2016
Equities are subject generally to market, market sector, market liquidity, issuer, and investment style risks, among other factors, to varying degrees, all of which are more fully described in the fund’s prospectus.
Stocks of small- and/or mid-cap companies often experience sharper price fluctuations than stocks of large-cap companies.
1 Total return includes reinvestment of dividends and any capital gains paid, and does not take into consideration the maximum initial sales charge in the case of Class A shares or the applicable contingent deferred sales charge imposed on redemptions in the case of Class C shares. Past performance is no guarantee of future results. Share price, yield, and investment return fluctuate such that upon redemption, fund shares may be worth more or less than their original cost. The fund’s returns reflect the absorption of certain fund expenses by The Dreyfus Corporation pursuant to an agreement in effect through January 1, 2017, at which time it may be extended, terminated, or modified. Had these expenses not been absorbed, the fund’s returns would have been lower.
2 Source: Lipper Inc. — Reflects reinvestment of dividends and, where applicable, capital gain distributions. The Standard & Poor’s MidCap 400® Index is a widely accepted, unmanaged total return index measuring the performance of the midsized company segment of the U.S. market. Investors cannot invest directly in any index.
4
FUND PERFORMANCE

Comparison of change in value of $10,000 investment in Dreyfus Structured Midcap Fund Class A shares, Class C shares, Class I shares and Class Y shares with the Standard & Poor’s MidCap 400 Index
† Source: Lipper Inc.
†† The total return figures presented for Class Y shares of the fund reflect the performance of the fund’s Class A shares for the period prior to 7/1/13 (the inception date for Class Y shares), not reflecting the applicable sales charges for Class A shares.
Past performance is not predictive of future performance.
The above graph compares a $10,000 investment made in each of the Class A, Class C, Class I and Class Y shares of Dreyfus Structured Midcap Fund on 8/31/06 to a $10,000 investment made in the Standard & Poor’s MidCap 400 Index (the “Index”) on that date. All dividends and capital gain distributions are reinvested.
The fund’s performance shown in the line graph above takes into account the maximum initial sales charge on Class A shares and all other applicable fees and expenses on all classes. The Index is a widely accepted, unmanaged total return index measuring the performance of the midsize company segment of the U.S. market. Unlike a mutual fund, the index is not subject to charges, fees and other expenses. Investors cannot invest directly in any Index. Further information relating to fund performance, including expense reimbursements, if applicable, is contained in the Financial Highlights section of the prospectus and elsewhere in this report.
5
FUND PERFORMANCE (continued)
| | | | | |
Average Annual Total Returns as of 8/31/16 |
| | Inception
Date | 1 Year | 5 Years | 10 Years |
Class A shares | | | | |
with maximum sales charge (5.75%) | 6/29/01 | 0.16% | 12.15% | 7.02% |
without sales charge | 6/29/01 | 6.27% | 13.49% | 7.66% |
Class C shares | | | | |
with applicable redemption charge † | 6/29/01 | 4.55% | 12.65% | 6.87% |
without redemption | 6/29/01 | 5.50% | 12.65% | 6.87% |
Class I shares | 6/29/01 | 6.54% | 13.75% | 7.90% |
Class Y shares | 7/1/13 | 6.71% | 14.10%†† | 7.95%†† |
Standard & Poor’s
MidCap 400 Index | | 12.33% | 14.07% | 9.26% |
Past performance is not predictive of future performance. The fund’s performance shown in the graph and table does not reflect the deduction of taxes that a shareholder would pay on fund distributions or the redemption of fund shares. In addition to the performance of Class A shares shown with and without a maximum sales charge, the fund’s performance shown in the table takes into account all other applicable fees and expenses on all classes.
† The maximum contingent deferred sales charge for Class C shares is 1% for shares redeemed within one year of the date of purchase.
†† The total return performance figures presented for Class Y shares of the fund reflect the performance of the fund’s Class A shares for the period prior to 7/1/13 (the inception date for Class Y shares), not reflecting the applicable sales charges for Class A shares.
6
UNDERSTANDING YOUR FUND’S EXPENSES (Unaudited)
As a mutual fund investor, you pay ongoing expenses, such as management fees and other expenses. Using the information below, you can estimate how these expenses affect your investment and compare them with the expenses of other funds. You also may pay one-time transaction expenses, including sales charges (loads) and redemption fees, which are not shown in this section and would have resulted in higher total expenses. For more information, see your fund’s prospectus or talk to your financial adviser.
Review your fund’s expenses
The table below shows the expenses you would have paid on a $1,000 investment in Dreyfus Structured Midcap Fund from March 1, 2016 to August 31, 2016. It also shows how much a $1,000 investment would be worth at the close of the period, assuming actual returns and expenses.
| | | | | | | | | | | | |
Expenses and Value of a $1,000 Investment | | |
assuming actual returns for the six months ended August 31, 2016 |
| | | | | | | | |
| | | | Class A | Class C | Class I | Class Y |
Expenses paid per $1,000† | | $6.65 | | $10.57 | | $5.27 | | $4.58 |
Ending value (after expenses) | | $1,116.40 | | $1,112.50 | | $1,117.80 | | $1,119.00 |
COMPARING YOUR FUND’S EXPENSES
WITH THOSE OF OTHER FUNDS (Unaudited)
Using the SEC’s method to compare expenses
The Securities and Exchange Commission (SEC) has established guidelines to help investors assess fund expenses. Per these guidelines, the table below shows your fund’s expenses based on a $1,000 investment, assuming a hypothetical 5% annualized return. You can use this information to compare the ongoing expenses (but not transaction expenses or total cost) of investing in the fund with those of other funds. All mutual fund shareholder reports will provide this information to help you make this comparison. Please note that you cannot use this information to estimate your actual ending account balance and expenses paid during the period.
| | | | | | | | |
Expenses and Value of a $1,000 Investment | | |
assuming a hypothetical 5% annualized return for the six months ended August 31, 2016 |
| | | | | | | | |
| | | | Class A | Class C | Class I | Class Y |
Expenses paid per $1,000† | $ 6.34 | $ 10.08 | $ 5.03 | $ 4.37 |
Ending value (after expenses) | $ 1,018.85 | $ 1,015.13 | $ 1,020.16 | $ 1,020.81 |
† Expenses are equal to the fund’s annualized expense ratio of 1.25% for Class A, 1.99% for Class C, .99% for Class I and .86% for Class Y, multiplied by the average account value over the period, multiplied by 184/366 (to reflect the one-half year period).
7
STATEMENT OF INVESTMENTS
August 31, 2016
| | | | | | |
| |
Common Stocks - 99.5% | | Shares | | Value ($) | |
Automobiles & Components - .9% | | | | | |
Visteon | | 26,345 | | 1,862,592 | |
Banks - 4.7% | | | | | |
BancorpSouth | | 82,880 | | 2,063,712 | |
Cathay General Bancorp | | 88,210 | | 2,771,558 | |
East West Bancorp | | 123,530 | | 4,587,904 | |
First Horizon National | | 45,595 | | 701,251 | |
| | | | | 10,124,425 | |
Capital Goods - 11.6% | | | | | |
Allison Transmission Holdings | | 129,145 | | 3,582,482 | |
BWX Technologies | | 21,115 | | 819,473 | |
GATX | | 46,495 | a | 2,038,806 | |
HD Supply Holdings | | 62,880 | b | 2,270,597 | |
Huntington Ingalls Industries | | 26,525 | | 4,381,134 | |
KBR | | 16,515 | | 242,440 | |
Lennox International | | 31,550 | | 5,081,758 | |
Owens Corning | | 52,490 | | 2,882,751 | |
Spirit AeroSystems Holdings, Cl. A | | 72,905 | b | 3,340,507 | |
Wabtec | | 6,045 | a | 463,107 | |
| | | | | 25,103,055 | |
Commercial & Professional Services - .2% | | | | | |
Deluxe | | 7,380 | | 503,095 | |
Consumer Durables & Apparel - 5.4% | | | | | |
Brunswick | | 90,320 | | 4,153,817 | |
NVR | | 1,620 | b | 2,732,616 | |
Tempur Sealy International | | 62,330 | a,b | 4,887,919 | |
| | | | | 11,774,352 | |
Consumer Services - 1.4% | | | | | |
Darden Restaurants | | 49,130 | | 3,028,373 | |
Diversified Financials - 3.1% | | | | | |
Affiliated Managers Group | | 22,950 | b | 3,260,047 | |
CBOE Holdings | | 29,990 | | 2,060,013 | |
SEI Investments | | 31,125 | | 1,434,863 | |
| | | | | 6,754,923 | |
Energy - 2.8% | | | | | |
Oceaneering International | | 40,700 | | 1,079,364 | |
Tesoro | | 19,860 | | 1,497,841 | |
8
| | | | | | |
| |
Common Stocks - 99.5% (continued) | | Shares | | Value ($) | |
Energy - 2.8% (continued) | | | | | |
World Fuel Services | | 76,790 | | 3,423,298 | |
| | | | | 6,000,503 | |
Food & Staples Retailing - 1.9% | | | | | |
Sprouts Farmers Markets | | 181,520 | a,b | 4,089,646 | |
Food, Beverage & Tobacco - 2.8% | | | | | |
Dean Foods | | 222,035 | a | 3,821,222 | |
Ingredion | | 14,990 | | 2,053,030 | |
J.M. Smucker | | 1,390 | | 197,088 | |
| | | | | 6,071,340 | |
Health Care Equipment & Services - 6.3% | | | | | |
Allscripts Healthcare Solutions | | 312,520 | a,b | 4,034,633 | |
Hologic | | 107,905 | b | 4,145,710 | |
Teleflex | | 10,530 | | 1,927,938 | |
Tenet Healthcare | | 29,240 | b | 698,836 | |
WellCare Health Plans | | 26,100 | b | 2,941,470 | |
| | | | | 13,748,587 | |
Insurance - 6.5% | | | | | |
American Financial Group | | 3,970 | | 298,346 | |
Aspen Insurance Holdings | | 26,020 | | 1,195,879 | |
CNO Financial Group | | 61,930 | | 1,006,363 | |
Hanover Insurance Group | | 25,150 | | 1,966,730 | |
Old Republic International | | 217,170 | | 4,176,179 | |
Primerica | | 55,325 | a | 3,149,652 | |
Reinsurance Group of America | | 20,910 | | 2,244,061 | |
| | | | | 14,037,210 | |
Materials - 7.4% | | | | | |
Bemis | | 7,925 | | 416,855 | |
Cabot | | 69,820 | | 3,481,225 | |
Celanese, Ser. A | | 14,800 | | 953,564 | |
Commercial Metals | | 94,840 | | 1,471,917 | |
Crown Holdings | | 21,880 | b | 1,186,552 | |
PolyOne | | 53,180 | | 1,833,115 | |
Reliance Steel & Aluminum | | 62,425 | | 4,499,594 | |
Steel Dynamics | | 5,770 | | 142,057 | |
Worthington Industries | | 48,440 | | 2,078,076 | |
| | | | | 16,062,955 | |
Media - .9% | | | | | |
New York Times, Cl. A | | 149,645 | | 1,936,406 | |
9
STATEMENT OF INVESTMENTS (continued)
| | | | | | |
| |
Common Stocks - 99.5% (continued) | | Shares | | Value ($) | |
Pharmaceuticals, Biotechnology & Life Sciences - 4.4% | | | | | |
Charles River Laboratories International | | 37,490 | b | 3,119,543 | |
Mettler-Toledo International | | 13,725 | b | 5,532,136 | |
United Therapeutics | | 7,270 | a,b | 888,976 | |
| | | | | 9,540,655 | |
Real Estate - 9.8% | | | | | |
General Growth Properties | | 46,960 | c | 1,368,414 | |
Kilroy Realty | | 73,800 | c | 5,360,094 | |
Lamar Advertising, Cl. A | | 71,435 | c | 4,452,544 | |
Post Properties | | 52,780 | c | 3,498,258 | |
Tanger Factory Outlet Centers | | 14,320 | c | 581,965 | |
Taubman Centers | | 16,780 | c | 1,303,303 | |
Weingarten Realty Investors | | 115,255 | c | 4,754,269 | |
| | | | | 21,318,847 | |
Retailing - 1.8% | | | | | |
Big Lots | | 80,000 | a | 3,945,600 | |
Semiconductors & Semiconductor Equipment - 1.6% | | | | | |
Integrated Device Technology | | 167,285 | b | 3,360,756 | |
Software & Services - 11.0% | | | | | |
Citrix Systems | | 47,075 | b | 4,104,940 | |
Convergys | | 67,990 | | 2,028,142 | |
CoreLogic | | 62,560 | b | 2,566,211 | |
DST Systems | | 21,895 | | 2,660,461 | |
Leidos Holdings | | 54,100 | | 2,191,591 | |
Manhattan Associates | | 6,820 | b | 412,746 | |
Mentor Graphics | | 167,955 | | 4,032,600 | |
NeuStar, Cl. A | | 85,615 | b | 2,175,477 | |
Nuance Communications | | 217,485 | b | 3,170,931 | |
VeriSign | | 6,900 | b | 513,705 | |
| | | | | 23,856,804 | |
Technology Hardware & Equipment - 4.6% | | | | | |
Arrow Electronics | | 26,385 | b | 1,736,925 | |
Belden | | 35,180 | | 2,624,076 | |
InterDigital | | 28,165 | | 2,011,263 | |
IPG Photonics | | 6,145 | b | 534,492 | |
NCR | | 92,480 | b | 3,130,448 | |
| | | | | 10,037,204 | |
Telecommunication Services - .6% | | | | | |
CenturyLink | | 46,760 | a | 1,299,928 | |
10
| | | | | | |
| |
Common Stocks - 99.5% (continued) | | Shares | | Value ($) | |
Transportation - 2.5% | | | | | |
Alaska Air Group | | 41,575 | a | 2,807,560 | |
JetBlue Airways | | 164,365 | b | 2,621,622 | |
| | | | | 5,429,182 | |
Utilities - 7.3% | | | | | |
FirstEnergy | | 113,505 | | 3,715,019 | |
Great Plains Energy | | 153,570 | | 4,170,961 | |
IDACORP | | 14,530 | | 1,105,297 | |
MDU Resources Group | | 130,300 | | 3,071,171 | |
NiSource | | 152,480 | | 3,650,371 | |
| | | | | 15,712,819 | |
Total Common Stocks (cost $194,081,434) | | | | 215,599,257 | |
Other Investment - .4% | | | | | |
Registered Investment Company; | | | | | |
Dreyfus Institutional Preferred Government Plus Money Market Fund
(cost $865,384) | | 865,384 | d | 865,384 | |
Investment of Cash Collateral for Securities Loaned - 5.3% | | | | | |
Registered Investment Company; | | | | | |
Dreyfus Institutional Cash Advantage Fund, Institutional Shares
(cost $11,407,250) | | 11,407,250 | d | 11,407,250 | |
Total Investments (cost $206,354,068) | | 105.2% | | 227,871,891 | |
Liabilities, Less Cash and Receivables | | (5.2%) | | (11,300,581) | |
Net Assets | | 100.0% | | 216,571,310 | |
a Security, or portion thereof, on loan. At August 31, 2016, the value of the fund’s securities on loan was $26,226,489 and the value of the collateral held by the fund was $26,907,316, consisting of cash collateral of $11,407,250 and U.S. Government & Agency securities valued at $15,500,066.
b Non-income producing security.
c Investment in real estate investment trust.
d Investment in affiliated money market mutual fund.
11
STATEMENT OF INVESTMENTS (continued)
| | |
Portfolio Summary (Unaudited) † | Value (%) |
Capital Goods | 11.6 |
Software & Services | 11.0 |
Real Estate | 9.8 |
Materials | 7.4 |
Utilities | 7.3 |
Insurance | 6.5 |
Health Care Equipment & Services | 6.3 |
Money Market Investments | 5.7 |
Consumer Durables & Apparel | 5.4 |
Banks | 4.7 |
Technology Hardware & Equipment | 4.6 |
Pharmaceuticals, Biotechnology & Life Sciences | 4.4 |
Diversified Financials | 3.1 |
Energy | 2.8 |
Food, Beverage & Tobacco | 2.8 |
Transportation | 2.5 |
Food & Staples Retailing | 1.9 |
Retailing | 1.8 |
Semiconductors & Semiconductor Equipment | 1.6 |
Consumer Services | 1.4 |
Automobiles & Components | .9 |
Media | .9 |
Telecommunication Services | .6 |
Commercial & Professional Services | .2 |
| | 105.2 |
† Based on net assets.
See notes to financial statements.
12
STATEMENT OF ASSETS AND LIABILITIES
August 31, 2016
| | | | | | | |
| | | | | | |
| | | Cost | | Value | |
Assets ($): | | | | |
Investments in securities—See Statement of Investments
(including securities on loan, valued at $26,226,489)—Note 1(b): | | | | |
Unaffiliated issuers | | 194,081,434 | | 215,599,257 | |
Affiliated issuers | | 12,272,634 | | 12,272,634 | |
Cash | | | | | 81,869 | |
Dividends and securities lending income receivable | | | | | 354,949 | |
Receivable for shares of Common Stock subscribed | | | | | 138,777 | |
Prepaid expenses | | | | | 33,670 | |
| | | | | 228,481,156 | |
Liabilities ($): | | | | |
Due to The Dreyfus Corporation and affiliates—Note 3(c) | | | | | 212,436 | |
Liability for securities on loan—Note 1(b) | | | | | 11,407,250 | |
Payable for shares of Common Stock redeemed | | | | | 184,866 | |
Accrued expenses | | | | | 105,294 | |
| | | | | 11,909,846 | |
Net Assets ($) | | | 216,571,310 | |
Composition of Net Assets ($): | | | | |
Paid-in capital | | | | | 198,652,249 | |
Accumulated undistributed investment income—net | | | | | 1,796,623 | |
Accumulated net realized gain (loss) on investments | | | | | (5,395,385) | |
Accumulated net unrealized appreciation (depreciation)
on investments | | | | | 21,517,823 | |
Net Assets ($) | | | 216,571,310 | |
| | | | | | |
Net Asset Value Per Share | Class A | Class C | Class I | Class Y | |
Net Assets ($) | 108,587,867 | 31,816,613 | 62,094,131 | 14,072,699 | |
Shares Outstanding | 3,958,632 | 1,302,772 | 2,215,680 | 502,273 | |
Net Asset Value Per Share ($) | 27.43 | 24.42 | 28.02 | 28.02 | |
See notes to financial statements.
13
STATEMENT OF OPERATIONS
Year Ended August 31, 2016
| | | | | | | |
| | | | | | |
| | | | | | |
Investment Income ($): | | | | |
Income: | | | | |
Cash dividends: | | | | |
Unaffiliated issuers | | | 4,581,695 | |
Affiliated issuers | | | 3,199 | |
Income from securities lending—Note 1(b) | | | 121,122 | |
Total Income | | | 4,706,016 | |
Expenses: | | | | |
Management fee—Note 3(a) | | | 1,654,478 | |
Shareholder servicing costs—Note 3(c) | | | 759,449 | |
Distribution fees—Note 3(b) | | | 246,835 | |
Registration fees | | | 66,440 | |
Professional fees | | | 50,526 | |
Prospectus and shareholders’ reports | | | 44,984 | |
Custodian fees—Note 3(c) | | | 33,900 | |
Directors’ fees and expenses—Note 3(d) | | | 17,697 | |
Loan commitment fees—Note 2 | | | 3,285 | |
Interest expense—Note 2 | | | 878 | |
Miscellaneous | | | 20,389 | |
Total Expenses | | | 2,898,861 | |
Less—reduction in expenses due to undertaking—Note 3(a) | | | (102,608) | |
Less—reduction in fees due to earnings credits—Note 3(c) | | | (1,148) | |
Net Expenses | | | 2,795,105 | |
Investment Income—Net | | | 1,910,911 | |
Realized and Unrealized Gain (Loss) on Investments—Note 4 ($): | | |
Net realized gain (loss) on investments | (5,046,312) | |
Net unrealized appreciation (depreciation) on investments | | | 15,311,149 | |
Net Realized and Unrealized Gain (Loss) on Investments | | | 10,264,837 | |
Net Increase in Net Assets Resulting from Operations | | 12,175,748 | |
| | | | | | | |
See notes to financial statements.
14
STATEMENT OF CHANGES IN NET ASSETS
| | | | | | | | | | |
| | | | Year Ended August 31, |
| | | | 2016 | | | | 2015 | |
Operations ($): | | | | | | | | |
Investment income—net | | | 1,910,911 | | | | 567,030 | |
Net realized gain (loss) on investments | | (5,046,312) | | | | 26,675,022 | |
Net unrealized appreciation (depreciation)
on investments | | 15,311,149 | | | | (36,072,360) | |
Net Increase (Decrease) in Net Assets
Resulting from Operations | 12,175,748 | | | | (8,830,308) | |
Dividends to Shareholders from ($): | | | | | | | | |
Investment income—net: | | | | | | | | |
Class A | | | - | | | | (513,685) | |
Class I | | | (65,423) | | | | (520,523) | |
Class Y | | | (47,554) | | | | (165,825) | |
Net realized gain on investments: | | | | | | | | |
Class A | | | (10,139,977) | | | | (14,496,970) | |
Class C | | | (3,261,953) | | | | (4,104,326) | |
Class I | | | (5,295,150) | | | | (9,421,355) | |
Class Y | | | (1,128,399) | | | | (2,477,042) | |
Total Dividends | | | (19,938,456) | | | | (31,699,726) | |
Capital Stock Transactions ($): | | | | | | | | |
Net proceeds from shares sold: | | | | | | | | |
Class A | | | 16,172,587 | | | | 40,574,908 | |
Class C | | | 3,782,240 | | | | 9,017,756 | |
Class I | | | 27,361,227 | | | | 38,164,790 | |
Class Y | | | 2,370,209 | | | | 7,047,076 | |
Dividends reinvested: | | | | | | | | |
Class A | | | 9,709,012 | | | | 14,322,139 | |
Class C | | | 2,607,923 | | | | 3,238,854 | |
Class I | | | 4,953,262 | | | | 9,397,205 | |
Class Y | | | 1,147,660 | | | | 2,595,452 | |
Cost of shares redeemed: | | | | | | | | |
Class A | | | (32,649,718) | | | | (39,248,421) | |
Class C | | | (6,930,732) | | | | (3,363,756) | |
Class I | | | (43,248,879) | | | | (32,665,758) | |
Class Y | | | (11,603,175) | | | | (6,370,231) | |
Increase (Decrease) in Net Assets
from Capital Stock Transactions | (26,328,384) | | | | 42,710,014 | |
Total Increase (Decrease) in Net Assets | (34,091,092) | | | | 2,179,980 | |
Net Assets ($): | | | | | | | | |
Beginning of Period | | | 250,662,402 | | | | 248,482,422 | |
End of Period | | | 216,571,310 | | | | 250,662,402 | |
Undistributed investment income—net | 1,796,623 | | | | - | |
15
STATEMENT OF CHANGES IN NET ASSETS (continued)
| | | | | | | | | | |
| | | | Year Ended August 31, |
| | | | 2016 | | | | 2015 | |
Capital Share Transactions (Shares): | | | | | | | | |
Class Aa | | | | | | | | |
Shares sold | | | 605,504 | | | | 1,338,782 | |
Shares issued for dividends reinvested | | | 370,172 | | | | 503,946 | |
Shares redeemed | | | (1,234,420) | | | | (1,323,459) | |
Net Increase (Decrease) in Shares Outstanding | (258,744) | | | | 519,269 | |
Class Ca | | | | | | | | |
Shares sold | | | 156,611 | | | | 327,990 | |
Shares issued for dividends reinvested | | | 111,125 | | | | 125,149 | |
Shares redeemed | | | (292,663) | | | | (122,236) | |
Net Increase (Decrease) in Shares Outstanding | (24,927) | | | | 330,903 | |
Class Ia | | | | | | | | |
Shares sold | | | 996,832 | | | | 1,232,159 | |
Shares issued for dividends reinvested | | | 185,005 | | | | 325,163 | |
Shares redeemed | | | (1,603,669) | | | | (1,076,270) | |
Net Increase (Decrease) in Shares Outstanding | (421,832) | | | | 481,052 | |
Class Ya | | | | | | | | |
Shares sold | | | 86,782 | | | | 226,251 | |
Shares issued for dividends reinvested | | | 42,840 | | | | 89,839 | |
Shares redeemed | | | (392,706) | | | | (200,076) | |
Net Increase (Decrease) in Shares Outstanding | (263,084) | | | | 116,014 | |
| | | | | | | | | | |
a | During the period ended August 31, 2016, 1,545 Class A shares representing $37,414 were exchanged for 1,513 Class I shares, 329 Class C shares representing $6,904 were exchanged for 288 Class I shares and 11,035 Class Y shares representing $279,091 were exchanged for 11,049 Class I shares. | |
See notes to financial statements.
16
FINANCIAL HIGHLIGHTS
The following tables describe the performance for each share class for the fiscal periods indicated. All information (except portfolio turnover rate) reflects financial results for a single fund share. Total return shows how much your investment in the fund would have increased (or decreased) during each period, assuming you had reinvested all dividends and distributions. These figures have been derived from the fund’s financial statements.
| | | | | | | | | |
| | | | |
| | | |
Class A Shares | | Year Ended August 31, |
| | 2016 | 2015 | 2014 | 2013 | 2012 |
Per Share Data ($): | | | | | | |
Net asset value, beginning of period | | 28.21 | 33.28 | 26.49 | 21.41 | 18.67 |
Investment Operations: | | | | | | |
Investment income—neta | | .23 | .06 | .11 | .23 | .11 |
Net realized and unrealized
gain (loss) on investments | | 1.43 | (.96) | 7.06 | 5.06 | 2.63 |
Total from Investment Operations | | 1.66 | (.90) | 7.17 | 5.29 | 2.74 |
Distributions: | | | | | | |
Dividends from
investment income—net | | - | (.14) | (.10) | (.21) | - |
Dividends from net realized
gain on investments | | (2.44) | (4.03) | (.28) | - | - |
Total Distributions | | (2.44) | (4.17) | (.38) | (.21) | - |
Net asset value, end of period | | 27.43 | 28.21 | 33.28 | 26.49 | 21.41 |
Total Return (%)b | | 6.27 | (2.80) | 27.21 | 24.94 | 14.68 |
Ratios/Supplemental Data (%): | | | | | | |
Ratio of total expenses
to average net assets | | 1.29 | 1.25 | 1.25 | 1.35 | 1.41 |
Ratio of net expenses
to average net assets | | 1.25 | 1.23 | 1.24 | 1.26 | 1.41 |
Ratio of net investment income
to average net assets | | .87 | .20 | .37 | .92 | .55 |
Portfolio Turnover Rate | | 71.27 | 78.09 | 74.66 | 57.54 | 93.44 |
Net Assets, end of period ($ x 1,000) | | 108,588 | 118,954 | 123,057 | 106,245 | 26,786 |
a Based on average shares outstanding.
b Exclusive of sales charge.
See notes to financial statements.
17
FINANCIAL HIGHLIGHTS (continued)
| | | | | | | | | |
| | | | |
| | | |
Class C Shares | | Year Ended August 31, |
| | 2016 | 2015 | 2014 | 2013 | 2012 |
Per Share Data ($): | | | | | | |
Net asset value, beginning of period | | 25.55 | 30.60 | 24.48 | 19.80 | 17.40 |
Investment Operations: | | | | | | |
Investment income (loss)—neta | | .03 | (.14) | (.10) | .06 | (.04) |
Net realized and unrealized
gain (loss) on investments | | 1.28 | (.88) | 6.50 | 4.68 | 2.44 |
Total from Investment Operations | | 1.31 | (1.02) | 6.40 | 4.74 | 2.40 |
Distributions: | | | | | | |
Dividends from
investment income—net | | - | - | - | (.06) | - |
Dividends from net realized
gain on investments | | (2.44) | (4.03) | (.28) | - | - |
Total Distributions | | (2.44) | (4.03) | (.28) | (.06) | - |
Net asset value, end of period | | 24.42 | 25.55 | 30.60 | 24.48 | 19.80 |
Total Return (%)b | | 5.50 | (3.51) | 26.25 | 24.06 | 13.79 |
Ratios/Supplemental Data (%): | | | | | | |
Ratio of total expenses
to average net assets | | 2.00 | 1.96 | 1.98 | 2.10 | 2.14 |
Ratio of net expenses
to average net assets | | 1.99 | 1.96 | 1.98 | 2.01 | 2.14 |
Ratio of net investment income
(loss) to average net assets | | .13 | (.52) | (.37) | .26 | (.20) |
Portfolio Turnover Rate | | 71.27 | 78.09 | 74.66 | 57.54 | 93.44 |
Net Assets, end of period ($ x 1,000) | | 31,817 | 33,926 | 30,502 | 26,061 | 10,468 |
a Based on average shares outstanding.
b Exclusive of sales charge.
See notes to financial statements.
18
| | | | | | | | | | | | |
| | | | | | | |
| | | |
Class I Shares | | Year Ended August 31, |
| | 2016 | 2015 | 2014 | 2013 | 2012 |
Per Share Data ($): | | | | | | |
Net asset value, beginning of period | | 28.73 | 33.83 | 26.90 | 21.73 | 18.91 |
Investment Operations: | | | | | | |
Investment income—neta | | .31 | .14 | .19 | .33 | .16 |
Net realized and unrealized
gain (loss) on investments | | 1.45 | (.99) | 7.17 | 5.09 | 2.66 |
Total from Investment Operations | | 1.76 | (.85) | 7.36 | 5.42 | 2.82 |
Distributions: | | | | | | |
Dividends from
investment income—net | | (.03) | (.22) | (.15) | (.25) | - |
Dividends from net realized
gain on investments | | (2.44) | (4.03) | (.28) | - | - |
Total Distributions | | (2.47) | (4.25) | (.43) | (.25) | - |
Net asset value, end of period | | 28.02 | 28.73 | 33.83 | 26.90 | 21.73 |
Total Return (%) | | 6.54 | (2.59) | 27.57 | 25.17 | 14.91 |
Ratios/Supplemental Data (%): | | | | | | |
Ratio of total expenses
to average net assets | | 1.09 | 1.05 | 1.16 | 1.26 | 1.22 |
Ratio of net expenses
to average net assets | | 1.00 | 1.00 | .99 | 1.03 | 1.22 |
Ratio of net investment income
to average net assets | | 1.15 | .46 | .62 | 1.27 | .78 |
Portfolio Turnover Rate | | 71.27 | 78.09 | 74.66 | 57.54 | 93.44 |
Net Assets, end of period ($ x 1,000) | | 62,094 | 75,779 | 72,947 | 69,014 | 30,636 |
a Based on average shares outstanding.
See notes to financial statements.
19
FINANCIAL HIGHLIGHTS (continued)
| | | | | | | | |
| | | | |
| | | |
Class Y Shares | | Year Ended August 31, |
| | 2016 | 2015 | 2014 | 2013a |
Per Share Data ($): | | | | | |
Net asset value, beginning of period | | 28.75 | 33.85 | 26.91 | 26.38 |
Investment Operations: | | | | | |
Investment income—netb | | .33 | .18 | .19 | .02 |
Net realized and unrealized
gain (loss) on investments | | 1.48 | (.98) | 7.20 | .51 |
Total from Investment Operations | | 1.81 | (.80) | 7.39 | .53 |
Distributions: | | | | | |
Dividends from
investment income—net | | (.10) | (.27) | (.17) | - |
Dividends from net realized
gain on investments | | (2.44) | (4.03) | (.28) | - |
Total Distributions | | (2.54) | (4.30) | (.45) | - |
Net asset value, end of period | | 28.02 | 28.75 | 33.85 | 26.91 |
Total Return (%) | | 6.71 | (2.43) | 27.69 | 2.01c |
Ratios/Supplemental Data (%): | | | | | |
Ratio of total expenses
to average net assets | | .87 | .84 | .87 | .97d |
Ratio of net expenses
to average net assets | | .87 | .84 | .87 | .89d |
Ratio of net investment income
to average net assets | | 1.24 | .59 | .58 | .35d |
Portfolio Turnover Rate | | 71.27 | 78.09 | 74.66 | 57.54 |
Net Assets, end of period ($ x 1,000) | | 14,073 | 22,004 | 21,977 | 1 |
a From July 1, 2013 (commencement of initial offering) to August 31, 2013.
b Based on average shares outstanding.
c Not annualized.
d Annualized.
See notes to financial statements.
20
NOTES TO FINANCIAL STATEMENTS
NOTE 1—Significant Accounting Policies:
Dreyfus Structured Midcap Fund (the “fund”) is a separate diversified series of Advantage Funds, Inc. (the “Company”), which is registered under the Investment Company Act of 1940, as amended (the “Act”), as an open-end management investment company and operates as a series company currently offering ten series, including the fund. The fund’s investment objective is to seek long-term capital growth. The Dreyfus Corporation (the “Manager” or “Dreyfus”), a wholly-owned subsidiary of The Bank of New York Mellon Corporation (“BNY Mellon”), serves as the fund’s investment adviser. Mellon Capital Management Corporation (“Mellon Capital”), a wholly-owned subsidiary of Dreyfus, serves as the fund’s sub-investment adviser.
MBSC Securities Corporation (the “Distributor”), a wholly-owned subsidiary of Dreyfus, is the distributor of the fund’s shares. The fund is authorized to issue 600 million shares of $.001 par value Common Stock. The fund currently offers four classes of shares: Class A (200 million shares authorized), Class C (100 million shares authorized), Class I (200 million shares authorized) and Class Y (100 million shares authorized). Class A shares generally are subject to a sales charge imposed at the time of purchase. Class C shares are subject to a contingent deferred sales charge (“CDSC”) imposed on Class C shares redeemed within one year of purchase. Class I and Class Y shares are sold at net asset value per share generally to institutional investors. Other differences between the classes include the services offered to and the expenses borne by each class, the allocation of certain transfer agency costs, and certain voting rights. Income, expenses (other than expenses attributable to a specific class), and realized and unrealized gains or losses on investments are allocated to each class of shares based on its relative net assets.
The Company accounts separately for the assets, liabilities and operations of each series. Expenses directly attributable to each series are charged to that series’ operations; expenses which are applicable to all series are allocated among them on a pro rata basis.
The Financial Accounting Standards Board (“FASB”) Accounting Standards Codification (“ASC”) is the exclusive reference of authoritative U.S. generally accepted accounting principles (“GAAP”) recognized by the FASB to be applied by nongovernmental entities. Rules and interpretive releases of the Securities and Exchange Commission (“SEC”) under authority of federal laws are also sources of authoritative GAAP for SEC registrants. The fund’s financial statements are prepared in accordance with GAAP, which may require the use of management estimates and assumptions. Actual results could differ from those estimates.
21
NOTES TO FINANCIAL STATEMENTS (continued)
The Company enters into contracts that contain a variety of indemnifications. The fund’s maximum exposure under these arrangements is unknown. The fund does not anticipate recognizing any loss related to these arrangements.
(a) Portfolio valuation: The fair value of a financial instrument is the amount that would be received to sell an asset or paid to transfer a liability in an orderly transaction between market participants at the measurement date (i.e., the exit price). GAAP establishes a fair value hierarchy that prioritizes the inputs of valuation techniques used to measure fair value. This hierarchy gives the highest priority to unadjusted quoted prices in active markets for identical assets or liabilities (Level 1 measurements) and the lowest priority to unobservable inputs (Level 3 measurements).
Additionally, GAAP provides guidance on determining whether the volume and activity in a market has decreased significantly and whether such a decrease in activity results in transactions that are not orderly. GAAP requires enhanced disclosures around valuation inputs and techniques used during annual and interim periods.
Various inputs are used in determining the value of the fund’s investments relating to fair value measurements. These inputs are summarized in the three broad levels listed below:
Level 1—unadjusted quoted prices in active markets for identical investments.
Level 2—other significant observable inputs (including quoted prices for similar investments, interest rates, prepayment speeds, credit risk, etc.).
Level 3—significant unobservable inputs (including the fund’s own assumptions in determining the fair value of investments).
The inputs or methodology used for valuing securities are not necessarily an indication of the risk associated with investing in those securities.
Changes in valuation techniques may result in transfers in or out of an assigned level within the disclosure hierarchy. Valuation techniques used to value the fund’s investments are as follows:
Investments in securities are valued at the last sales price on the securities exchange or national securities market on which such securities are primarily traded. Securities listed on the National Market System for which market quotations are available are valued at the official closing price or, if there is no official closing price that day, at the last sales price. For open short positions, asked prices are used for valuation purposes. Bid price is
22
used when no asked price is available. Registered investment companies that are not traded on an exchange are valued at their net asset value. All of the preceding securities are generally categorized within Level 1 of the fair value hierarchy.
Securities not listed on an exchange or the national securities market, or securities for which there were no transactions, are valued at the average of the most recent bid and asked prices. These securities are generally categorized within Level 2 of the fair value hierarchy.
Fair valuing of securities may be determined with the assistance of a pricing service using calculations based on indices of domestic securities and other appropriate indicators, such as prices of relevant American Depository Receipts and financial futures. Utilizing these techniques may result in transfers between Level 1 and Level 2 of the fair value hierarchy.
When market quotations or official closing prices are not readily available, or are determined not to reflect accurately fair value, such as when the value of a security has been significantly affected by events after the close of the exchange or market on which the security is principally traded (for example, a foreign exchange or market), but before the fund calculates its net asset value, the fund may value these investments at fair value as determined in accordance with the procedures approved by the Company’s Board of Directors (the “Board”). Certain factors may be considered when fair valuing investments such as: fundamental analytical data, the nature and duration of restrictions on disposition, an evaluation of the forces that influence the market in which the securities are purchased and sold, and public trading in similar securities of the issuer or comparable issuers. These securities are either categorized within Level 2 or 3 of the fair value hierarchy depending on the relevant inputs used.
For restricted securities where observable inputs are limited, assumptions about market activity and risk are used and are generally categorized within Level 3 of the fair value hierarchy.
The following is a summary of the inputs used as of August 31, 2016 in valuing the fund’s investments:
23
NOTES TO FINANCIAL STATEMENTS (continued)
| | | | | |
| | Level 1 - Unadjusted Quoted Prices | Level 2 - Other Significant Observable Inputs | Level 3 -Significant Unobservable Inputs | Total |
Assets ($) | | | | |
Investments in Securities: | | | |
Equity Securities - Domestic Common Stocks† | 215,599,257 | - | - | 215,599,257 |
Mutual Funds | 12,272,634 | - | - | 12,272,634 |
† See Statement of Investments for additional detailed categorizations.
At August 31, 2016, there were no transfers between levels of the fair value hierarchy.
(b) Securities transactions and investment income: Securities transactions are recorded on a trade date basis. Realized gains and losses from securities transactions are recorded on the identified cost basis. Dividend income is recognized on the ex-dividend date and interest income, including, where applicable, accretion of discount and amortization of premium on investments, is recognized on the accrual basis.
Pursuant to a securities lending agreement with The Bank of New York Mellon, a subsidiary of BNY Mellon and an affiliate of Dreyfus, the fund may lend securities to qualified institutions. It is the fund’s policy that, at origination, all loans are secured by collateral of at least 102% of the value of U.S. securities loaned and 105% of the value of foreign securities loaned. Collateral equivalent to at least 100% of the market value of securities on loan is maintained at all times. Collateral is either in the form of cash, which can be invested in certain money market mutual funds managed by Dreyfus, or U.S. Government and Agency securities. The fund is entitled to receive all dividends, interest and distributions on securities loaned, in addition to income earned as a result of the lending transaction. Should a borrower fail to return the securities in a timely manner, The Bank of New York Mellon is required to replace the securities for the benefit of the fund or credit the fund with the market value of the unreturned securities and is subrogated to the fund’s rights against the borrower and the collateral. Additionally, the contractual maturity of security lending transactions are on an overnight and continuous basis. During the period ended August 31, 2016, The Bank of New York Mellon earned $25,719 from lending portfolio securities, pursuant to the securities lending agreement.
(c) Affiliated issuers: Investments in other investment companies advised by Dreyfus are defined as “affiliated” under the Act. Investments in
24
affiliated investment companies during the period ended August 31, 2016 were as follows:
| | | | | | |
Affiliated Investment Company | Value 8/31/2015 ($) | Purchases ($) | Sales ($) | Value 8/31/2016 ($) | Net
Assets (%) |
Dreyfus Institutional Cash Advantage Fund, Institutional Shares | 9,708,336 | 156,892,223 | 155,193,309 | 11,407,250 | 5.3 |
Dreyfus Institutional Preferred Government Plus Money Market Fund† | 665,102 | 31,552,923 | 31,352,641 | 865,384 | .4 |
Total | 10,373,438 | 188,445,146 | 186,545,950 | 12,272,634 | 5.7 |
† Formerly Dreyfus Institutional Preferred Plus Money Market Fund.
(d) Dividends to shareholders: Dividends are recorded on the ex-dividend date. Dividends from investment income-net and dividends from net realized capital gains, if any, are normally declared and paid annually, but the fund may make distributions on a more frequent basis to comply with the distribution requirements of the Internal Revenue Code of 1986, as amended (the “Code”). To the extent that net realized capital gains can be offset by capital loss carryovers, it is the policy of the fund not to distribute such gains. Income and capital gain distributions are determined in accordance with income tax regulations, which may differ from GAAP.
(e) Federal income taxes: It is the policy of the fund to continue to qualify as a regulated investment company, if such qualification is in the best interests of its shareholders, by complying with the applicable provisions of the Code, and to make distributions of taxable income sufficient to relieve it from substantially all federal income and excise taxes.
As of and during the period ended August 31, 2016, the fund did not have any liabilities for any uncertain tax positions. The fund recognizes interest and penalties, if any, related to uncertain tax positions as income tax expense in the Statement of Operations. During the period ended August 31, 2016, the fund did not incur any interest or penalties.
Each tax year in the four-year period ended August 31, 2016 remains subject to examination by the Internal Revenue Service and state taxing authorities.
25
NOTES TO FINANCIAL STATEMENTS (continued)
At August 31, 2016, the components of accumulated earnings on a tax basis were as follows: ordinary income $1,796,623, accumulated capital losses $887,534 and unrealized appreciation $21,092,303. In addition, the fund had $4,082,331 of capital losses realized after October 31, 2015, which were deferred for tax purposes to the first day of the following fiscal year.
Under the Regulated Investment Company Modernization Act of 2010 (the “2010 Act”), the fund is permitted to carry forward capital losses incurred in taxable years beginning after December 22, 2010 (“post-enactment losses”) for an unlimited period. Furthermore, post-enactment capital loss carryovers retain their character as either short-term or long-term capital losses rather than short-term as they were under previous statute. The 2010 Act requires post-enactment losses to be utilized before the utilization of losses incurred in taxable years prior to the effective date of the 2010 Act (“pre-enactment losses”). As a result of this ordering rule, pre-enactment losses may be more likely to expire unused.
As a result of the fund’s merger with Dreyfus MidCap Core Fund, capital losses of $489,201 are available to offset future realized gains, if any. Based on certain provisions in the Code, the amount of losses which can be utilized in subsequent years is subject to an annual limitation. These acquired capital losses expire in fiscal year 2017.
The accumulated capital loss carryover is available for federal income tax purposes to be applied against future net realized capital gains, if any, realized subsequent to August 31, 2016. The fund has $398,333 of post–enactment short–term capital losses which can be carried forward for an unlimited period.
The tax character of distributions paid to shareholders during the fiscal periods ended August 31, 2016 and August 31, 2015 were as follows: ordinary income $114,289 and $1,346,705, and long-term capital gains $19,824,167 and $30,353,021, respectively.
During the period ended August 31, 2016, as a result of permanent book to tax differences, primarily due to the tax treatment for dividend reclassification and a capital loss carryover expiration, the fund decreased accumulated undistributed investment income-net by $1,311, increased accumulated net realized gain (loss) on investments by $3,807,329 and decreased paid-in capital by $3,806,018. Net assets and net asset value per share were not affected by this reclassification.
26
NOTE 2—Bank Lines of Credit:
The fund participates with other Dreyfus-managed funds in a $555 million unsecured credit facility led by Citibank, N.A. and a $300 million unsecured credit facility provided by The Bank of New York Mellon (each, a “Facility”), each to be utilized primarily for temporary or emergency purposes, including the financing of redemptions. Prior to January 11, 2016, the unsecured credit facility with Citibank, N.A. was $480 million and prior to October 7, 2015, the unsecured credit facility with Citibank, N.A. was $430 million. In connection therewith, the fund has agreed to pay its pro rata portion of commitment fees for each Facility. Interest is charged to the fund based on rates determined pursuant to the terms of the respective Facility at the time of borrowing.
The average amount of borrowings outstanding under the Facilities during the period ended August 31, 2016, was approximately $80,100 with a related weighted average annualized interest rate of 1.10%.
NOTE 3—Management Fee, Sub-Investment Advisory Fee and Other Transactions with Affiliates:
(a) Pursuant to a management agreement with Dreyfus, the management fee is computed at the annual rate of .75% of the value of the fund's average daily net assets and is payable monthly. Dreyfus has contractually agreed, from September 1, 2015 through January 1, 2017, to waive receipt of its fees and/or assume the direct expenses of the fund, so that the expenses of none of the classes (excluding Rule 12b-1 Distribution Plan fees, Shareholder Services Plan fees, taxes, interest expense, brokerage commissions, commitment fees on borrowings and extraordinary expenses) exceed 1.00% of the value of the fund’s average daily net assets. The reduction in expenses, pursuant to the undertaking, amounted to $102,608 during the period ended August 31, 2016.
Pursuant to a sub-investment advisory agreement between Dreyfus and Mellon Capital, the sub-investment advisory fee is payable monthly by Dreyfus, and is based upon the value of the fund’s average daily net assets, computed at the following annual rates:
Average Net Assets
0 up to $100 million .25%
$100 million up to $1 billion .20%
$1 billion up to $1.5 billion .16%
In excess of $1.5 billion .10%
27
NOTES TO FINANCIAL STATEMENTS (continued)
During the period ended August 31, 2016, the Distributor retained $6,386 from commissions earned on sales of the fund’s Class A shares and $828 from CDSCs on redemptions of the fund’s Class C shares.
(b) Under the Distribution Plan adopted pursuant to Rule 12b-1 under the Act, Class C shares pay the Distributor for distributing its shares at an annual rate of .75% of the value of its average daily net assets. During the period ended August 31, 2016, Class C shares were charged $246,835 pursuant to the Distribution Plan.
(c) Under the Shareholder Services Plan, Class A and Class C shares pay the Distributor at an annual rate of .25% of the value of their average daily net assets for the provision of certain services. The services provided may include personal services relating to shareholder accounts, such as answering shareholder inquiries regarding the fund and providing reports and other information, and services related to the maintenance of shareholder accounts. The Distributor may make payments to Service Agents (securities dealers, financial institutions or other industry professionals) with respect to these services. The Distributor determines the amounts to be paid to Service Agents. During the period ended August 31, 2016, Class A and Class C shares were charged $282,837 and $82,278, respectively, pursuant to the Shareholder Services Plan.
The fund has arrangements with the transfer agent and the custodian whereby the fund may receive earnings credits when positive cash balances are maintained, which are used to offset transfer agency and custody fees. For financial reporting purposes, the fund includes net earnings credits as an expense offset in the Statement of Operations.
The fund compensates Dreyfus Transfer, Inc., a wholly-owned subsidiary of Dreyfus, under a transfer agency agreement for providing transfer agency and cash management services for the fund. The majority of transfer agency fees are comprised of amounts paid on a per account basis, while cash management fees are related to fund subscriptions and redemptions. During the period ended August 31, 2016, the fund was charged $62,582 for transfer agency services and $3,325 for cash management services. These fees are included in Shareholder servicing costs in the Statement of Operations. Cash management fees were partially offset by earnings credits of $1,148.
The fund compensates The Bank of New York Mellon under a custody agreement for providing custodial services for the fund. These fees are determined based on net assets, geographic region and transaction activity. During the period ended August 31, 2016, the fund was charged $33,900 pursuant to the custody agreement.
28
During the period ended August 31, 2016, the fund was charged $9,967 for services performed by the Chief Compliance Officer and his staff.
The components of “Due to The Dreyfus Corporation and affiliates” in the Statement of Assets and Liabilities consist of: management fees $137,785, Distribution Plan fees $20,308, Shareholder Services Plan fees $30,062, custodian fees $15,438, Chief Compliance Officer fees $6,416 and transfer agency fees $10,457, which are offset against an expense reimbursement currently in effect in the amount of $8,030.
(d) Each Board member also serves as a Board member of other funds within the Dreyfus complex. Annual retainer fees and attendance fees are allocated to each fund based on net assets.
NOTE 4—Securities Transactions:
The aggregate amount of purchases and sales of investment securities, excluding short-term securities, during the period ended August 31, 2016, amounted to $157,991,833 and $202,326,726, respectively.
At August 31, 2016, the cost of investments for federal income tax purposes was $206,779,588; accordingly, accumulated net unrealized appreciation on investments was $21,092,303, consisting of $30,740,872 gross unrealized appreciation and $9,648,569 gross unrealized depreciation.
29
REPORT OF INDEPENDENT REGISTERED
PUBLIC ACCOUNTING FIRM
Shareholders and Board of Directors
Dreyfus Structured Midcap Fund
We have audited the accompanying statement of assets and liabilities, including the statement of investments, of Dreyfus Structured Midcap Fund (one of the series comprising Advantage Funds, Inc.) as of August 31, 2016, and the related statement of operations for the year then ended, the statement of changes in net assets for each of the two years in the period then ended, and the financial highlights for each of the periods indicated therein. These financial statements and financial highlights are the responsibility of the Fund’s management. Our responsibility is to express an opinion on these financial statements and financial highlights based on our audits.
We conducted our audits in accordance with the standards of the Public Company Accounting Oversight Board (United States). Those standards require that we plan and perform the audit to obtain reasonable assurance about whether the financial statements and financial highlights are free of material misstatement. We were not engaged to perform an audit of the Fund’s internal control over financial reporting. Our audits included consideration of internal control over financial reporting as a basis for designing audit procedures that are appropriate in the circumstances, but not for the purpose of expressing an opinion on the effectiveness of the Fund’s internal control over financial reporting. Accordingly, we express no such opinion. An audit also includes examining, on a test basis, evidence supporting the amounts and disclosures in the financial statements and financial highlights, assessing the accounting principles used and significant estimates made by management, and evaluating the overall financial statement presentation. Our procedures included confirmation of securities owned as of August 31, 2016 by correspondence with the custodian and others. We believe that our audits provide a reasonable basis for our opinion.
In our opinion, the financial statements and financial highlights referred to above present fairly, in all material respects, the financial position of Dreyfus Structured Midcap Fund at August 31, 2016, the results of its operations for the year then ended, the changes in its net assets for each of the two years in the period then ended, and the financial highlights for each of the indicated periods, in conformity with U.S. generally accepted accounting principles.

New York, New York
October 27, 2016
30
IMPORTANT TAX INFORMATION (Unaudited)
For federal tax purposes, the fund hereby reports 100% of the ordinary dividends paid during the fiscal year ended August 31, 2016 as qualifying for the corporate dividends received deduction. Also, certain dividends paid by the fund may be subject to a maximum tax rate of 15%, as provided for by the Jobs and Growth Tax Relief Reconciliation Act of 2003. Of the distributions paid during the fiscal year, $114,289 represents the maximum amount that may be considered qualified dividend income. The fund also hereby reports $.0099 per share as a long-term capital gain distribution paid on March 24, 2016 and $2.4264 per share as a long-term capital gain distribution paid on December 23, 2015. Shareholders will receive notification in early 2017 of the percentage applicable to the preparation of their 2016 income tax returns.
31
BOARD MEMBERS INFORMATION (Unaudited)
INDEPENDENT BOARD MEMBERS
Joseph S. DiMartino (72)
Chairman of the Board (1995)
Principal Occupation During Past 5 Years:
· Corporate Director and Trustee (1995-present)
Other Public Company Board Memberships During Past 5 Years:
· CBIZ (formerly, Century Business Services, Inc.), a provider of outsourcing functions for small and medium size companies, Director (1997-present)
No. of Portfolios for which Board Member Serves: 136
———————
Peggy C. Davis (73)
Board Member (2006)
Principal Occupation During Past 5 Years:
· Shad Professor of Law, New York University School of Law (1983-present)
No. of Portfolios for which Board Member Serves: 49
———————
David P. Feldman (76)
Board Member (1996)
Principal Occupation During Past 5 Years:
· Corporate Director and Trustee (1985-present)
Other Public Company Board Memberships During Past 5 Years:
· BBH Mutual Funds Group (5 registered mutual funds), Director (1992-2014)
No. of Portfolios for which Board Member Serves: 35
———————
Ehud Houminer (76)
Board Member (1993)
Principal Occupation During Past 5 Years:
· Executive-in-Residence at the Columbia Business School, Columbia
University (1992-present)
Other Public Company Board Memberships During Past 5 Years:
· Avnet, Inc., an electronics distributor, Director (1993-2012)
No. of Portfolios for which Board Member Serves: 59
———————
32
Lynn Martin (76)
Board Member (2012)
Principal Occupation During Past 5 Years:
· President of The Martin Hall Group LLC, a human resources consulting firm (2005-2012)
Other Public Company Board Memberships During Past 5 Years:
· AT&T, Inc., a telecommunications company, Director (1999-2012)
· Ryder System, Inc., a supply chain and transportation management company, Director (1993-2012)
No. of Portfolios for which Board Member Serves: 35
———————
Robin A. Melvin (52)
Board Member (2012)
Principal Occupation During Past 5 Years:
· Co-chairman, Illinois Mentoring Partnership, non-profit organization dedicated to increasing the quantity and quality of mentoring services in Illinois; (2014-present; served as a board member since 2013)
· Director, Boisi Family Foundation, a private family foundation that supports youth-serving organizations that promote the self sufficiency of youth from disadvantaged circumstances (1995-2012)
No. of Portfolios for which Board Member Serves: 108
———————
Dr. Martin Peretz (77)
Board Member (2006)
Principal Occupation During Past 5 Years:
· Editor-in-Chief Emeritus of The New Republic Magazine (2011-2012) (previously,
Editor-in-Chief, 1974-2011)
· Director of TheStreet.com, a financial information service on the web (1996-2010)
· Lecturer at Harvard University (1969-2012)
No. of Portfolios for which Board Member Serves: 35
———————
Once elected all Board Members serve for an indefinite term, but achieve Emeritus status upon reaching age 80. The address of the Board Members and Officers is c/o The Dreyfus Corporation, 200 Park Avenue, New York, New York 10166. Additional information about the Board Members is available in the fund’s Statement of Additional Information which can be obtained from Dreyfus free of charge by calling this toll free number: 1-800-DREYFUS.
James F. Henry, Emeritus Board Member
Dr. Paul A. Marks, Emeritus Board Member
Philip L. Toia, Emeritus Board Member
33
OFFICERS OF THE FUND (Unaudited)
BRADLEY J. SKAPYAK, President since January 2010.
Chief Operating Officer and a director of the Manager since June 2009, Chairman of Dreyfus Transfer, Inc., an affiliate of the Manager and the transfer agent of the funds, since May 2011 and Executive Vice President of the Distributor since June 2007. From April 2003 to June 2009, Mr. Skapyak was the head of the Investment Accounting and Support Department of the Manager. He is an officer of 65 investment companies (comprised of 136 portfolios) managed by the Manager. He is 57 years old and has been an employee of the Manager since February 1988.
BENNETT A. MACDOUGALL, Chief Legal Officer since October 2015.
Chief Legal Officer of the Manager since June 2015; from June 2005 to June 2015, he served in various capacities with Deutsche Bank – Asset & Wealth Management Division, including as Director and Associate General Counsel, and Chief Legal Officer of Deutsche Investment Management Americas Inc. from June 2012 to May 2015. He is an officer of 66 investment companies (comprised of 161 portfolios) managed by the Manager. He is 44 years old and has been an employee of the Manager since June 2015.
JANETTE E. FARRAGHER, Vice President and Secretary since December 2011.
Assistant General Counsel of BNY Mellon, and an officer of 66 investment companies (comprised of 161 portfolios) managed by the Manager. She is 53 years old and has been an employee of the Manager since February 1984.
JAMES BITETTO, Vice President and Assistant Secretary since August 2005.
Managing Counsel of BNY Mellon and Secretary of the Manager, and an officer of 66 investment companies (comprised of 161 portfolios) managed by the Manager. He is 50 years old and has been an employee of the Manager since December 1996.
JONI LACKS CHARATAN, Vice President and Assistant Secretary since August 2005.
Managing Counsel of BNY Mellon, and an officer of 66 investment companies (comprised of 161 portfolios) managed by the Manager. She is 60 years old and has been an employee of the Manager since October 1988.
JOSEPH M. CHIOFFI, Vice President and Assistant Secretary since August 2005.
Managing Counsel of BNY Mellon, and an officer of 66 investment companies (comprised of 161 portfolios) managed by the Manager. He is 54 years old and has been an employee of the Manager since June 2000.
MAUREEN E. KANE, Vice President and Assistant Secretary since April 2015.
Managing Counsel of BNY Mellon since July 2014; from October 2004 until July 2014, General Counsel, and from May 2009 until July 2014, Chief Compliance Officer of Century Capital Management. She is an officer of 66 investment companies (comprised of 161 portfolios) managed by the Manager. She is 54 years old and has been an employee of the Manager since July 2014.
SARAH S. KELLEHER, Vice President and Assistant Secretary since April 2014.
Senior Counsel of BNY Mellon, and an officer of 66 investment companies (comprised of 161 portfolios) managed by the Manager; from August 2005 to March 2013, Associate General Counsel of Third Avenue Management. She is 40 years old and has been an employee of the Manager since March 2013.
JEFF PRUSNOFSKY, Vice President and Assistant Secretary since August 2005.
Senior Managing Counsel of BNY Mellon, and an officer of 66 investment companies (comprised of 161 portfolios) managed by the Manager. He is 51 years old and has been an employee of the Manager since October 1990.
JAMES WINDELS, Treasurer since November 2001.
Director – Mutual Fund Accounting of the Manager, and an officer of 66 investment companies (comprised of 161 portfolios) managed by the Manager. He is 57 years old and has been an employee of the Manager since April 1985.
RICHARD CASSARO, Assistant Treasurer since January 2008.
Senior Accounting Manager – Money Market, Municipal Bond and Equity Funds of the Manager, and an officer of 66 investment companies (comprised of 161 portfolios) managed by the Manager. He is 57 years old and has been an employee of the Manager since September 1982.
34
GAVIN C. REILLY, Assistant Treasurer since December 2005.
Tax Manager of the Investment Accounting and Support Department of the Manager, and an officer of 66 investment companies (comprised of 161 portfolios) managed by the Manager. He is 48 years old and has been an employee of the Manager since April 1991.
ROBERT S. ROBOL, Assistant Treasurer since August 2005.
Senior Accounting Manager of the Manager, and an officer of 66 investment companies (comprised of 161 portfolios) managed by the Manager. He is 52 years old and has been an employee of the Manager since October 1988.
ROBERT SALVIOLO, Assistant Treasurer since July 2007.
Senior Accounting Manager – Equity Funds of the Manager, and an officer of 66 investment companies (comprised of 161 portfolios) managed by the Manager. He is 49 years old and has been an employee of the Manager since June 1989.
ROBERT SVAGNA, Assistant Treasurer since December 2002.
Senior Accounting Manager – Fixed Income and Equity Funds of the Manager, and an officer of 66 investment companies (comprised of 161 portfolios) managed by the Manager. He is 49 years old and has been an employee of the Manager since November 1990.
JOSEPH W. CONNOLLY, Chief Compliance Officer since October 2004.
Chief Compliance Officer of the Manager and The Dreyfus Family of Funds (66 investment companies, comprised of 161 portfolios). He is 59 years old and has served in various capacities with the Manager since 1980, including manager of the firm’s Fund Accounting Department from 1997 through October 2001.
CARIDAD M. CAROSELLA, Anti-Money Laundering Compliance Officer since January 2016
Anti-Money Laundering Compliance Officer of the Dreyfus Family of Funds and BNY Mellon Funds Trust since January 2016; from May 2015 to December 2015, Interim Anti-Money Laundering Compliance Officer of the Dreyfus Family of Funds and BNY Mellon Funds Trust and the Distributor; from January 2012 to May 2015, AML Surveillance Officer of the Distributor and from 2007 to December 2011, Financial Processing Manager of the Distributor. She is an officer of 61 investment companies (comprised of 156 portfolios) managed by the Manager. She is 48 years old and has been an employee of the Distributor since 1997.
35
NOTES
36
NOTES
37
Dreyfus Structured Midcap Fund
200 Park Avenue
New York, NY 10166
Manager
The Dreyfus Corporation
200 Park Avenue
New York, NY 10166
Sub-Investment Adviser
Mellon Capital Management
Corporation
50 Fremont Street, Suite 3900
San Francisco, CA 94105
Custodian
The Bank of New York Mellon
225 Liberty Street
New York, NY 10286
Transfer Agent &
Dividend Disbursing Agent
Dreyfus Transfer, Inc.
200 Park Avenue
New York, NY 10166
Distributor
MBSC Securities Corporation
200 Park Avenue
New York, NY 10166
| | |
Ticker Symbols: | Class A: DPSAX Class C: DPSCX Class I: DPSRX Class Y: DPSYX |
Telephone Call your financial representative or 1-800-DREYFUS
Mail The Dreyfus Family of Funds, 144 Glenn Curtiss Boulevard, Uniondale, NY 11556-0144
E-mail Send your request to info@dreyfus.com
Internet Information can be viewed online or downloaded at www.dreyfus.com
The fund files its complete schedule of portfolio holdings with the Securities and Exchange Commission (“SEC”) for the first and third quarters of each fiscal year on Form N-Q. The fund’s Forms N-Q are available on the SEC’s website at www.sec.gov and may be reviewed and copied at the SEC’s Public Reference Room in Washington, DC. (phone 1-800-SEC-0330 for information).
A description of the policies and procedures that the fund uses to determine how to vote proxies relating to portfolio securities and information regarding how the fund voted these proxies for the most recent 12-month period ended June 30 is available at www.dreyfus.com and on the SEC’s website at www.sec.gov and without charge, upon request, by calling 1-800-DREYFUS.
| | |
© 2016 MBSC Securities Corporation
0936AR0816 | 
|
Dreyfus Technology Growth Fund
| | | |

| | ANNUAL REPORT August 31, 2016 |
| |
Save time. Save paper. View your next shareholder report online as soon as it’s available. Log into www.dreyfus.com and sign up for Dreyfus eCommunications. It’s simple and only takes a few minutes. |
| |
The views expressed in this report reflect those of the portfolio manager only through the end of the period covered and do not necessarily represent the views of Dreyfus or any other person in the Dreyfus organization. Any such views are subject to change at any time based upon market or other conditions and Dreyfus disclaims any responsibility to update such views. These views may not be relied on as investment advice and, because investment decisions for a Dreyfus fund are based on numerous factors, may not be relied on as an indication of trading intent on behalf of any Dreyfus fund. |
| |
Not FDIC-Insured • Not Bank-Guaranteed • May Lose Value |
Contents
T H E F U N D
F O R M O R E I N F O R M AT I O N
Back Cover
| | | | |
| |
Dreyfus Technology Growth Fund
| | The Fund |
A LETTER FROM THE CHIEF EXECUTIVE OFFICER
Dear Shareholder:
We are pleased to present this annual report for Dreyfus Technology Growth Fund, covering the 12-month period from September 1, 2015 through August 31, 2016. For information about how the fund performed during the reporting period, as well as general market perspectives, we provide a Discussion of Fund Performance on the pages that follow.
Despite tumultuous swings in market sentiment stemming from global economic developments, stocks and bonds generally produced strong returns over the reporting period. During the fall of 2015, investors reacted cautiously to sluggish global economic growth, plummeting commodity prices, and the first increase in short-term U.S. interest rates in nearly a decade. These worries sparked particularly sharp declines in equities in January 2016, but investor sentiment soon improved when U.S. monetary policymakers refrained from additional rate hikes, other central banks eased their monetary policies further, and commodity prices rebounded. Stocks mostly rallied over the ensuing months, driving several broad measures of stock market performance to new record highs. In the bond market, aggressively accommodative monetary policies and robust investor demand for current income sent yields of high-quality sovereign bonds lower and their prices higher.
Recently we have seen evidence that investors may be shifting their focus away from macroeconomic influences and toward underlying company and industry fundamentals. This development—along with wide differences in underlying fundamental and technical influences across various asset classes, economic sectors, and regional markets—suggests that selectivity may be a more important determinant of investment success over the months ahead. As always, we encourage you to discuss the implications of our observations with your financial advisor.
Thank you for your continued confidence and support.
Sincerely,

Mark D. Santero
Chief Executive Officer
The Dreyfus Corporation
September 15, 2016
2
DISCUSSION OF FUND PERFORMANCE
For the period from September 1, 2015 through August 31, 2016, as provided by Barry K. Mills, CFA, Matthew Griffin, Erik Swords, and Elizabeth Slover, Portfolio Managers
Fund and Market Performance Overview
For the 12-month period ended August 31, 2016, Dreyfus Technology Growth Fund’s Class A shares produced a total return of 13.23%, Class C shares returned 12.27%, and Class I shares returned 13.49%.1 In comparison, the fund’s benchmarks, the Morgan Stanley High Technology 35 Index (the “MS High Tech 35 Index”) and the Standard & Poor’s 500® Composite Stock Price Index (the “S&P 500 Index”), produced total returns of 17.82% and 12.53%, respectively, over the same period.2,3
A robust stock market rally over the reporting period’s second half more than offset declines over the first half. Technology stocks fared especially well during the rebound. While the fund participated significantly in the market’s double-digit gains, with Class A shares and Class I shares outperforming the S&P 500 Index, underweighted exposure to the semiconductor industry and a few disappointing individual stock selections caused its returns to lag the MS High Tech 35 Index.
The Fund’s Investment Approach
The fund seeks capital appreciation by investing in growth companies of any size that we regard as leading producers or beneficiaries of technological innovation. The fund’s investment process centers on a multi-dimensional approach that looks for opportunities across emerging growth, cyclical, or stable growth companies. The fund seeks companies that appear to have strong earnings momentum, positive earnings revisions, favorable growth, product or market cycles, and/or favorable valuations.
Global Uncertainties Drove Market Volatility
Stocks proved volatile over the final months of 2015 when global investors grew more averse to risks in light of sluggish growth in Europe, Japan, and other international markets, and U.S. investors responded cautiously to the first increase in short-term U.S. interest rates in nearly a decade. In January 2016, disappointing economic data in China sparked severe declines in commodity prices, and investors worried that additional U.S. rate hikes might weigh on the domestic economic recovery. Consequently, stocks declined sharply during the month.
The market changed direction in mid-February as investors responded positively to relatively strong U.S. economic data and better-than-expected corporate earnings. The market rally continued through the spring when commodity prices began to rebound, U.S. monetary policymakers refrained from implementing additional rate hikes, and overseas central banks further eased their monetary policies. Although a referendum in the United Kingdom to leave the European Union introduced renewed market turmoil in late June, equities bounced back quickly, enabling the S&P 500 Index to reach record highs in July and August.
As usual, technology stocks generally proved more volatile than the broader market. The semiconductor industry led the sector’s gains as many companies benefited from industry consolidation and growing demand for flash memory as well as industrial and automotive semiconductors. Other significant areas of growth included the rapid adoption of cloud services, the monetization of social media and Internet search services, the proliferation of electronic content, and rising levels of mergers-and-acquisitions activity in the software-as-a-service area.
3
DISCUSSION OF FUND PERFORMANCE (continued)
Underweighted Exposure to Semiconductors Detracted
While the fund benefited from some positions in the high-flying semiconductors industry, lack of exposure to some of the industry’s top performers, such as Lam Research, hindered performance compared to the MS High Tech 35 Index. To a lesser degree, underweighted exposure to application software stocks also weighed on relative returns. The fund also experienced a number of company-specific disappointments, including semiconductor maker Cavium, which experienced unexpected order delays; content distribution network Akamai Technologies, which struggled when some of the company’s major customers brought their distribution efforts in house; and computer vision and mapping company Mobileye, which encountered competitive pressures.
On a more positive note, the fund invested in several notably strong performers. Microchip Technology, a maker of semiconductors for a wide range of embedded control activities, announced several acquisitions that are expected to enhance earnings and revenues. China-based Internet services provider Tencent Holdings rose sharply, bolstered by the rapidly increasing popularity of its game offerings and messaging platform. Social media giant Facebook achieved strong user growth while continuing to successfully monetize its services. Online retailer Amazon.com exceeded sales growth targets while making unexpectedly rapid inroads in providing cloud-based web services.
Investing in Innovative New Technology
As of the end of the reporting period, the fund has continued to focus on innovative providers of new technology solutions in cybersecurity, cloud computing, social networking, and mobile computing, areas where we expect to see a widening gap in performance compared with slower-growing legacy technology companies. We also have found an increasing number of attractive investment opportunities among certain semiconductor makers that appear poised to benefit from industry consolidation and the increasing adoption of semiconductors in areas such as automotive and medical device applications.
September 15, 2016
Please note, the position in any security highlighted with italicized typeface was sold during the reporting period.
Equities are subject generally to market, market sector, market liquidity, issuer, and investment style risks, among other factors, to varying degrees, all of which are more fully described in the fund’s prospectus.
The technology sector has been among the most volatile sectors of the stock market. Technology companies involve greater risk because their revenue and/or earnings tend to be less predictable, and some companies may be experiencing significant losses.
1 Total return includes reinvestment of dividends and any capital gains paid, and does not take into consideration the maximum initial sales charge in the case of Class A shares, or the applicable contingent deferred sales charge imposed on redemptions in the case of Class C shares. Had these charges been reflected, returns would have been lower. Past performance is no guarantee of future results. Share price, yield, and investment return fluctuate such that upon redemption, fund shares may be worth more or less than their original cost.
2 Source: Bloomberg L.P. — Reflects reinvestment of net dividends and, where applicable, capital gain distributions. The Morgan Stanley High Technology 35 Index is an unmanaged, equal dollar-weighted index of 35 stocks from the electronics-based subsectors. The index does not take into account fees and expenses to which the fund is subject. Investors cannot invest directly in any index.
3 Source: Lipper Inc. — Reflects monthly reinvestment of dividends and, where applicable, capital gain distributions. The Standard & Poor’s 500® Composite Stock Price Index is a widely accepted, unmanaged index of U.S. stock market performance. The index does not take into account fees and expenses to which the fund is subject. Investors cannot invest directly in any index.
4
FUND PERFORMANCE
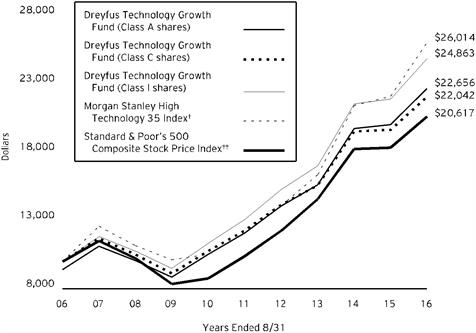
Comparison of change in value of $10,000 investment in Dreyfus Technology Growth Fund Class A shares, Class C shares and Class I shares with the Morgan Stanley High Technology 35 Index and the Standard & Poor's 500 Composite Stock Price Index
† Source: Bloomberg L.P.
†† Source: Lipper Inc.
Past performance is not predictive of future performance.
The above graph compares a $10,000 investment made in each of the Class A, Class C and Class I shares of Dreyfus Technology Growth Fund on 8/31/06 to a $10,000 investment made in each of the Standard & Poor’s 500 Composite Stock Price Index (the “S&P 500 Index”) and the Morgan Stanley High Technology 35 Index (the “MS High Tech 35 Index”) on that date. All dividends and capital gain distributions are reinvested.
The fund’s performance shown in the line graph above takes into account the maximum initial sales charge on Class A shares and all other applicable fees and expenses on all classes. The S&P 500 Index is a widely accepted, unmanaged index of U.S. stock market performance. The MS High Tech 35 Index reflects reinvestment of net dividends and, where applicable, capital gain distributions. The MS High Tech 35 Index is an unmanaged, equal dollar-weighted index from the electronics-based subsectors. Unlike a mutual fund, the indices are not subject to charges, fees and other expenses. Investors cannot invest directly in any index. Further information relating to fund performance, including expense reimbursements, if applicable, is contained in the Financial Highlights section of the prospectus and elsewhere in this report.
5
FUND PERFORMANCE (continued)
| | | | |
Average Annual Total Returns as of 8/31/16 |
| | 1 Year | 5 Years | 10 Years |
Class A shares | | | |
with maximum sales charge (5.75%) | 6.72% | 12.03% | 8.52% |
without sales charge | 13.23% | 13.36% | 9.17% |
Class C shares | | | |
with applicable redemption charge† | 11.27% | 12.43% | 8.22% |
without redemption | 12.27% | 12.43% | 8.22% |
Class I shares | 13.49% | 13.67% | 9.54% |
Morgan Stanley High
Technology 35 Index | 17.82% | 16.51% | 10.02% |
Standard & Poor’s 500
Composite Stock Price Index | 12.53% | 14.67% | 7.50% |
Past performance is not predictive of future performance. The fund’s performance shown in the graph and table does not reflect the deduction of taxes that a shareholder would pay on fund distributions or the redemption of fund shares. In addition to the performance of Class A shares shown with and without a maximum sales charge, the fund’s performance shown in the table takes into account all other applicable fees and expenses on all classes.
† The maximum contingent deferred sales charge for Class C shares is 1% for shares redeemed within one year of the date of purchase.
6
UNDERSTANDING YOUR FUND’S EXPENSES (Unaudited)
As a mutual fund investor, you pay ongoing expenses, such as management fees and other expenses. Using the information below, you can estimate how these expenses affect your investment and compare them with the expenses of other funds. You also may pay one-time transaction expenses, including sales charges (loads) and redemption fees, which are not shown in this section and would have resulted in higher total expenses. For more information, see your fund’s prospectus or talk to your financial adviser.
Review your fund’s expenses
The table below shows the expenses you would have paid on a $1,000 investment in Dreyfus Technology Growth Fund from March 1, 2016 to August 31, 2016. It also shows how much a $1,000 investment would be worth at the close of the period, assuming actual returns and expenses.
| | | | | | | | | | | |
Expenses and Value of a $1,000 Investment |
assuming actual returns for the six months ended August 31, 2016 |
| | | | | | | | | | | |
| | | | Class A | Class C | Class I | |
Expenses paid per $1,000† | | $7.02 | | $11.43 | | $5.60 | |
Ending value (after expenses) | | $1,181.60 | | $1,176.60 | | $1,183.00 | |
COMPARING YOUR FUND’S EXPENSES
WITH THOSE OF OTHER FUNDS (Unaudited)
Using the SEC’s method to compare expenses
The Securities and Exchange Commission (SEC) has established guidelines to help investors assess fund expenses. Per these guidelines, the table below shows your fund’s expenses based on a $1,000 investment, assuming a hypothetical 5% annualized return. You can use this information to compare the ongoing expenses (but not transaction expenses or total cost) of investing in the fund with those of other funds. All mutual fund shareholder reports will provide this information to help you make this comparison. Please note that you cannot use this information to estimate your actual ending account balance and expenses paid during the period.
| | | | | | | | |
Expenses and Value of a $1,000 Investment |
assuming a hypothetical 5% annualized return for the six months ended August 31, 2016 |
| |
| | Class A | Class C | Class I | |
Expenses paid per $1,000† | | $6.50 | | $10.58 | | $5.18 | |
Ending value (after expenses) | | $1,018.70 | | $1,014.63 | | $1,020.01 | |
† Expenses are equal to the fund’s annualized expense ratio of 1.28% for Class A, 2.09% for Class C and 1.02% for Class I,
multiplied by the average account value over the period, multiplied by 184/366 (to reflect the one-half year period).
7
STATEMENT OF INVESTMENTS
August 31, 2016
| | | | | | |
| |
Common Stocks - 98.1% | | Shares | | Value ($) | |
Communications Equipment - 4.1% | | | | | |
Cisco Systems | | 335,265 | | 10,540,732 | |
Electronic Equipment & Instruments - 6.7% | | | | | |
Amphenol, Cl. A | | 168,604 | | 10,505,715 | |
Tesla Motors | | 30,773 | a,b | 6,524,184 | |
| | | | | 17,029,899 | |
Health Care Equipment & Services - 2.0% | | | | | |
DexCom | | 56,065 | b | 5,106,961 | |
Internet & Catalog Retail - 9.4% | | | | | |
Amazon.com | | 19,541 | b | 15,030,155 | |
Priceline Group | | 6,353 | b | 9,000,486 | |
| | | | | 24,030,641 | |
Internet Software & Services - 20.4% | | | | | |
Alphabet, Cl. A | | 10,248 | b | 8,094,383 | |
Alphabet, Cl. C | | 14,715 | b | 11,287,141 | |
Facebook, Cl. A | | 118,174 | b | 14,904,105 | |
Splunk | | 184,802 | a,b | 10,762,868 | |
Tencent Holdings | | 282,200 | | 7,340,972 | |
| | | | | 52,389,469 | |
IT Services - 12.2% | | | | | |
Cognizant Technology Solutions, Cl. A | | 186,709 | b | 10,724,565 | |
Paychex | | 116,330 | | 7,057,741 | |
Visa, Cl. A | | 167,538 | | 13,553,824 | |
| | | | | 31,336,130 | |
Semiconductors & Semiconductor Equipment - 15.0% | | | | | |
Applied Materials | | 216,984 | | 6,474,803 | |
Broadcom | | 62,136 | | 10,962,033 | |
Microchip Technology | | 176,533 | a | 10,929,158 | |
Texas Instruments | | 144,118 | | 10,021,966 | |
| | | | | 38,387,960 | |
Software - 19.9% | | | | | |
Adobe Systems | | 56,035 | b | 5,732,941 | |
Citrix Systems | | 102,917 | b | 8,974,362 | |
Oracle | | 274,747 | | 11,325,071 | |
salesforce.com | | 185,614 | b | 14,741,464 | |
Workday, Cl. A | | 120,521 | b | 10,218,976 | |
| | | | | 50,992,814 | |
8
| | | | | | |
| |
Common Stocks - 98.1% (continued) | | Shares | | Value ($) | |
Software & Services - 8.4% | | | | | |
eBay | | 283,619 | b | 9,121,187 | |
HubSpot | | 43,681 | b | 2,434,779 | |
LogMeIn | | 39,488 | | 3,297,248 | |
Teradata | | 213,371 | b | 6,770,262 | |
| | | | | 21,623,476 | |
Total Common Stocks (cost $173,885,875) | | | | 251,438,082 | |
Limited Partnership Interest - .6% | | | | | |
Semiconductors & Semiconductor Equipment - .6% | | | | | |
Bluestream Ventures LP b,c,d
(cost $1,030,996) | | | | 1,567,346 | |
Other Investment - 3.0% | | | | | |
Registered Investment Company; | | | | | |
Dreyfus Institutional Preferred Government Plus Money Market Fund
(cost $7,617,664) | | 7,617,664 | e | 7,617,664 | |
Investment of Cash Collateral for Securities Loaned - 4.1% | | | | | |
Registered Investment Company; | | | | | |
Dreyfus Institutional Cash Advantage Fund, Institutional Shares
(cost $10,657,278) | | 10,657,278 | e | 10,657,278 | |
Total Investments (cost $193,191,813) | | 105.8% | | 271,280,370 | |
Liabilities, Less Cash and Receivables | | (5.8%) | | (14,876,887) | |
Net Assets | | 100.0% | | 256,403,483 | |
LP—Limited Partnership
a Security, or portion thereof, on loan. At August 31, 2016, the value of the fund’s securities on loan was $14,990,107 and the value of the collateral held by the fund was $15,301,548, consisting of cash collateral of $10,657,278 and U.S. Government & Agency securities valued at $4,644,270.
b Non-income producing security.
c The valuation of this security has been determined in good faith by management under the direction of the Board of Directors. At August 31, 2016, the value of this security amounted to $1,567,346 or .61% of net assets.
d Security restricted as to public resale.
e Investment in affiliated money market mutual fund.
9
STATEMENT OF INVESTMENTS (continued)
| | |
Portfolio Summary (Unaudited) † | Value (%) |
Internet Software & Services | 20.4 |
Software | 19.9 |
Semiconductors & Semiconductor Equipment | 15.6 |
IT Services | 12.2 |
Internet & Catalog Retail | 9.4 |
Software & Services | 8.4 |
Money Market Investments | 7.1 |
Electronic Equipment & Instruments | 6.7 |
Communications Equipment | 4.1 |
Health Care Equipment & Services | 2.0 |
| | 105.8 |
† Based on net assets.
See notes to financial statements.
10
STATEMENT OF ASSETS AND LIABILITIES
August 31, 2016
| | | | | | | |
| | | | | | |
| | | Cost | | Value | |
Assets ($): | | | | |
Investments in securities—See Statement of Investments
(including securities on loan, valued at $14,990,107)—Note 1(c): | | | | |
Unaffiliated issuers | | 174,916,871 | | 253,005,428 | |
Affiliated issuers | | 18,274,942 | | 18,274,942 | |
Cash | | | | | 6,125 | |
Receivable for investment securities sold | | | �� | | 5,260,706 | |
Dividends and securities lending income receivable | | | | | 184,065 | |
Receivable for shares of Common Stock subscribed | | | | | 344 | |
Prepaid expenses | | | | | 31,349 | |
| | | | | 276,762,959 | |
Liabilities ($): | | | | |
Due to The Dreyfus Corporation and affiliates—Note 3(c) | | | | | 279,748 | |
Liability for securities on loan—Note 1(c) | | | | | 10,657,278 | |
Payable for investment securities purchased | | | | | 9,073,439 | |
Payable for shares of Common Stock redeemed | | | | | 200,790 | |
Accrued expenses | | | | | 148,221 | |
| | | | | 20,359,476 | |
Net Assets ($) | | | 256,403,483 | |
Composition of Net Assets ($): | | | | |
Paid-in capital | | | | | 170,002,778 | |
Accumulated investment (loss)—net | | | | | (798,492) | |
Accumulated net realized gain (loss) on investments | | | | | 9,110,640 | |
Accumulated net unrealized appreciation (depreciation)
on investments | | | | | 78,088,557 | |
Net Assets ($) | | | 256,403,483 | |
| | | | | |
Net Asset Value Per Share | Class A | Class C | Class I | |
Net Assets ($) | 214,184,673 | 24,544,152 | 17,674,658 | |
Shares Outstanding | 5,032,902 | 702,898 | 383,485 | |
Net Asset Value Per Share ($) | 42.56 | 34.92 | 46.09 | |
See notes to financial statements.
11
STATEMENT OF OPERATIONS
Year Ended August 31, 2016
| | | | | | | |
| | | | | | |
| | | | | | |
Investment Income ($): | | | | |
Income: | | | | |
Cash dividends: | | | | |
Unaffiliated issuers | | | 1,640,739 | |
Affiliated issuers | | | 14,657 | |
Income from securities lending—Note 1(c) | | | 245,943 | |
Total Income | | | 1,901,339 | |
Expenses: | | | | |
Management fee—Note 3(a) | | | 1,894,866 | |
Shareholder servicing costs—Note 3(c) | | | 1,080,503 | |
Distribution fees—Note 3(b) | | | 183,137 | |
Prospectus and shareholders’ reports | | | 57,667 | |
Professional fees | | | 56,919 | |
Registration fees | | | 44,907 | |
Custodian fees—Note 3(c) | | | 27,807 | |
Directors’ fees and expenses—Note 3(d) | | | 19,527 | |
Loan commitment fees—Note 2 | | | 3,457 | |
Miscellaneous | | | 22,933 | |
Total Expenses | | | 3,391,723 | |
Less—reduction in fees due to earnings credits—Note 3(c) | | | (3,821) | |
Net Expenses | | | 3,387,902 | |
Investment (Loss)—Net | | | (1,486,563) | |
Realized and Unrealized Gain (Loss) on Investments—Note 4 ($): | | |
Net realized gain (loss) on investments and foreign currency transactions | 8,975,964 | |
Net unrealized appreciation (depreciation) on investments | | | 23,592,873 | |
Net Realized and Unrealized Gain (Loss) on Investments | | | 32,568,837 | |
Net Increase in Net Assets Resulting from Operations | | 31,082,274 | |
| | | | | | | |
See notes to financial statements.
12
STATEMENT OF CHANGES IN NET ASSETS
| | | | | | | | | | |
| | | | Year Ended August 31, |
| | | | 2016 | | | | 2015 | |
Operations ($): | | | | | | | | |
Investment (loss)—net | | | (1,486,563) | | | | (1,863,012) | |
Net realized gain (loss) on investments | | 8,975,964 | | | | 18,566,507 | |
Net unrealized appreciation (depreciation)
on investments | | 23,592,873 | | | | (12,766,942) | |
Net Increase (Decrease) in Net Assets
Resulting from Operations | 31,082,274 | | | | 3,936,553 | |
Dividends to Shareholders from ($): | | | | | | | | |
Net realized gain on investments: | | | | | | | | |
Class A | | | (13,683,569) | | | | (37,985,796) | |
Class C | | | (1,892,713) | | | | (5,255,489) | |
Class I | | | (952,935) | | | | (2,538,324) | |
Total Dividends | | | (16,529,217) | | | | (45,779,609) | |
Capital Stock Transactions ($): | | | | | | | | |
Net proceeds from shares sold: | | | | | | | | |
Class A | | | 13,080,834 | | | | 17,183,919 | |
Class C | | | 1,938,583 | | | | 1,933,628 | |
Class I | | | 6,329,676 | | | | 6,897,339 | |
Dividends reinvested: | | | | | | | | |
Class A | | | 12,764,547 | | | | 35,293,082 | |
Class C | | | 1,329,495 | | | | 3,699,203 | |
Class I | | | 798,438 | | | | 2,110,080 | |
Cost of shares redeemed: | | | | | | | | |
Class A | | | (42,683,295) | | | | (37,377,667) | |
Class C | | | (4,596,253) | | | | (4,632,843) | |
Class I | | | (7,197,066) | | | | (5,469,413) | |
Increase (Decrease) in Net Assets
from Capital Stock Transactions | (18,235,041) | | | | 19,637,328 | |
Total Increase (Decrease) in Net Assets | (3,681,984) | | | | (22,205,728) | |
Net Assets ($): | | | | | | | | |
Beginning of Period | | | 260,085,467 | | | | 282,291,195 | |
End of Period | | | 256,403,483 | | | | 260,085,467 | |
Accumulated investment (loss)—net | (798,492) | | | | - | |
Capital Share Transactions (Shares): | | | | | | | | |
Class A | | | | | | | | |
Shares sold | | | 334,802 | | | | 400,632 | |
Shares issued for dividends reinvested | | | 320,798 | | | | 903,098 | |
Shares redeemed | | | (1,077,892) | | | | (874,662) | |
Net Increase (Decrease) in Shares Outstanding | (422,292) | | | | 429,068 | |
Class C | | | | | | | | |
Shares sold | | | 58,009 | | | | 56,835 | |
Shares issued for dividends reinvested | | | 40,484 | | | | 112,335 | |
Shares redeemed | | | (141,701) | | | | (129,799) | |
Net Increase (Decrease) in Shares Outstanding | (43,208) | | | | 39,371 | |
Class I | | | | | | | | |
Shares sold | | | 147,214 | | | | 149,199 | |
Shares issued for dividends reinvested | | | 18,560 | | | | 50,300 | |
Shares redeemed | | | (169,250) | | | | (122,390) | |
Net Increase (Decrease) in Shares Outstanding | (3,476) | | | | 77,109 | |
| | | | | | | | | | |
See notes to financial statements.
13
FINANCIAL HIGHLIGHTS
The following tables describe the performance for each share class for the fiscal periods indicated. All information (except portfolio turnover rate) reflects financial results for a single fund share. Total return shows how much your investment in the fund would have increased (or decreased) during each period, assuming you had reinvested all dividends and distributions. These figures have been derived from the fund’s financial statements.
| | | | | | |
| | | | | | |
| | Year Ended August 31, |
Class A Shares | 2016 | 2015 | 2014 | 2013 | 2012 |
Per Share Data ($): | | | | | |
Net asset value, beginning of period | 40.03 | 47.28 | 38.16 | 34.40 | 29.58 |
Investment Operations: | | | | | |
Investment (loss)—neta | (.21) | (.26) | (.21) | (.19) | (.22) |
Net realized and unrealized
gain (loss) on investments | 5.32 | .75 | 10.17 | 3.95 | 5.04 |
Total from Investment Operations | 5.11 | .49 | 9.96 | 3.76 | 4.82 |
Distributions: | | | | | |
Dividends from net realized
gain on investments | (2.58) | (7.74) | (.84) | – | – |
Net asset value, end of period | 42.56 | 40.03 | 47.28 | 38.16 | 34.40 |
Total Return (%)b | 13.23 | 1.40 | 26.37 | 10.93 | 16.30 |
Ratios/Supplemental Data (%): | | | | | |
Ratio of total expenses
to average net assets | 1.28 | 1.28 | 1.26 | 1.39 | 1.45 |
Ratio of net expenses
to average net assets | 1.28 | 1.28 | 1.26 | 1.39 | 1.45 |
Ratio of net investment (loss)
to average net assets | (.53) | (.61) | (.47) | (.54) | (.67) |
Portfolio Turnover Rate | 37.76 | 67.23 | 69.81 | 54.34 | 69.20 |
Net Assets, end of period ($ x 1,000) | 214,185 | 218,398 | 237,657 | 212,378 | 234,452 |
a Based on average shares outstanding.
b Exclusive of sales charge.
See notes to financial statements.
14
| | | | | | |
| | | | | | |
| | Year Ended August 31, |
Class C Shares | 2016 | 2015 | 2014 | 2013 | 2012 |
Per Share Data ($): | | | | | |
Net asset value, beginning of period | 33.55 | 41.17 | 33.60 | 30.54 | 26.48 |
Investment Operations: | | | | | |
Investment (loss)—neta | (.44) | (.52) | (.51) | (.43) | (.43) |
Net realized and unrealized
gain (loss) on investments | 4.39 | .64 | 8.92 | 3.49 | 4.49 |
Total from Investment Operations | 3.95 | .12 | 8.41 | 3.06 | 4.06 |
Distributions: | | | | | |
Dividends from net realized
gain on investments | (2.58) | (7.74) | (.84) | – | – |
Net asset value, end of period | 34.92 | 33.55 | 41.17 | 33.60 | 30.54 |
Total Return (%)b | 12.27 | .61 | 25.33 | 10.02 | 15.33 |
Ratios/Supplemental Data (%): | | | | | |
Ratio of total expenses
to average net assets | 2.10 | 2.08 | 2.10 | 2.23 | 2.27 |
Ratio of net expenses
to average net assets | 2.09 | 2.08 | 2.10 | 2.23 | 2.27 |
Ratio of net investment (loss)
to average net assets | (1.34) | (1.41) | (1.31) | (1.37) | (1.49) |
Portfolio Turnover Rate | 37.76 | 67.23 | 69.81 | 54.34 | 69.20 |
Net Assets, end of period ($ x 1,000) | 24,544 | 25,028 | 29,098 | 25,253 | 27,428 |
a Based on average shares outstanding.
b Exclusive of sales charge.
See notes to financial statements.
15
FINANCIAL HIGHLIGHTS (continued)
| | | | | | |
| | | | | | |
| | Year Ended August 31, |
Class I Shares | 2016 | 2015 | 2014 | 2013 | 2012 |
Per Share Data ($): | | | | | |
Net asset value, beginning of period | 43.05 | 50.14 | 40.34 | 36.25 | 31.06 |
Investment Operations: | | | | | |
Investment (loss)—net a | (.12) | (.16) | (.12) | (.08) | (.11) |
Net realized and unrealized
gain (loss) on investments | 5.74 | .81 | 10.76 | 4.17 | 5.30 |
Total from Investment Operations | 5.62 | .65 | 10.64 | 4.09 | 5.19 |
Distributions: | | | | | |
Dividends from net realized
gain on investments | (2.58) | (7.74) | (.84) | – | – |
Net asset value, end of period | 46.09 | 43.05 | 50.14 | 40.34 | 36.25 |
Total Return (%) | 13.49 | 1.69 | 26.61 | 11.28 | 16.71 |
Ratios/Supplemental Data (%): | | | | | |
Ratio of total expenses
to average net assets | 1.03 | 1.02 | 1.05 | 1.07 | 1.08 |
Ratio of net expenses
to average net assets | 1.03 | 1.02 | 1.05 | 1.07 | 1.08 |
Ratio of net investment (loss)
to average net assets | (.27) | (.36) | (.26) | (.22) | (.32) |
Portfolio Turnover Rate | 37.76 | 67.23 | 69.81 | 54.34 | 69.20 |
Net Assets, end of period ($ x 1,000) | 17,675 | 16,659 | 15,536 | 12,467 | 13,483 |
a Based on average shares outstanding.
See notes to financial statements.
16
NOTES TO FINANCIAL STATEMENTS
NOTE 1—Significant Accounting Policies:
Dreyfus Technology Growth Fund (the “fund”) is a separate diversified series of Advantage Funds, Inc. (the “Company”), which is registered under the Investment Company Act of 1940, as amended (the “Act”), as an open-end management investment company and operates as a series company currently offering ten series, including the fund. The fund’s investment objective is to seek capital appreciation. The Dreyfus Corporation (the “Manager” or “Dreyfus”), a wholly-owned subsidiary of The Bank of New York Mellon Corporation (“BNY Mellon”), serves as the fund’s investment adviser.
MBSC Securities Corporation (the “Distributor”), a wholly-owned subsidiary of Dreyfus, is the distributor of the fund’s shares. The fund is authorized to issue 500 million shares of $.001 par value Common Stock. The fund currently offers three classes of shares: Class A (200 million shares authorized), Class C (100 million shares authorized) and Class I (200 million shares authorized). Class A shares generally are subject to a sales charge imposed at the time of purchase. Class C shares are subject to a contingent deferred sales charge (“CDSC”) imposed on Class C shares redeemed within one year of purchase. Class I shares are sold at net asset value per share generally to institutional investors. Other differences between the classes include the services offered to and the expenses borne by each class, the allocation of certain transfer agency costs, and certain voting rights. Income, expenses (other than expenses attributable to a specific class), and realized and unrealized gains or losses on investments are allocated to each class of shares based on its relative net assets.
The Company accounts separately for the assets, liabilities and operations of each series. Expenses directly attributable to each series are charged to that series’ operations; expenses which are applicable to all series are allocated among them on a pro rata basis.
The Financial Accounting Standards Board (“FASB”) Accounting Standards Codification (“ASC”) is the exclusive reference of authoritative U.S. generally accepted accounting principles (“GAAP”) recognized by the FASB to be applied by nongovernmental entities. Rules and interpretive releases of the Securities and Exchange Commission (“SEC”) under authority of federal laws are also sources of authoritative GAAP for SEC registrants. The fund’s financial statements are prepared in accordance with GAAP, which may require the use of management estimates and assumptions. Actual results could differ from those estimates.
17
NOTES TO FINANCIAL STATEMENTS (continued)
The Company enters into contracts that contain a variety of indemnifications. The fund’s maximum exposure under these arrangements is unknown. The fund does not anticipate recognizing any loss related to these arrangements.
(a) Portfolio valuation: The fair value of a financial instrument is the amount that would be received to sell an asset or paid to transfer a liability in an orderly transaction between market participants at the measurement date (i.e., the exit price). GAAP establishes a fair value hierarchy that prioritizes the inputs of valuation techniques used to measure fair value. This hierarchy gives the highest priority to unadjusted quoted prices in active markets for identical assets or liabilities (Level 1 measurements) and the lowest priority to unobservable inputs (Level 3 measurements).
Additionally, GAAP provides guidance on determining whether the volume and activity in a market has decreased significantly and whether such a decrease in activity results in transactions that are not orderly. GAAP requires enhanced disclosures around valuation inputs and techniques used during annual and interim periods.
Various inputs are used in determining the value of the fund’s investments relating to fair value measurements. These inputs are summarized in the three broad levels listed below:
Level 1—unadjusted quoted prices in active markets for identical investments.
Level 2—other significant observable inputs (including quoted prices for similar investments, interest rates, prepayment speeds, credit risk, etc.).
Level 3—significant unobservable inputs (including the fund’s own assumptions in determining the fair value of investments).
The inputs or methodology used for valuing securities are not necessarily an indication of the risk associated with investing in those securities.
Changes in valuation techniques may result in transfers in or out of an assigned level within the disclosure hierarchy. Valuation techniques used to value the fund’s investments are as follows:
Investments in securities are valued at the last sales price on the securities exchange or national securities market on which such securities are primarily traded. Securities listed on the National Market System for which market quotations are available are valued at the official closing price or, if there is no official closing price that day, at the last sales price. For open short positions, asked prices are used for valuation purposes. Bid price is
18
used when no asked price is available. Registered investment companies that are not traded on an exchange are valued at their net asset value. All of the preceding securities are generally categorized within Level 1 of the fair value hierarchy.
Securities not listed on an exchange or the national securities market, or securities for which there were no transactions, are valued at the average of the most recent bid and asked prices. These securities are generally categorized within Level 2 of the fair value hierarchy.
Fair valuing of securities may be determined with the assistance of a pricing service using calculations based on indices of domestic securities and other appropriate indicators, such as prices of relevant American Depository Receipts and financial futures. Utilizing these techniques may result in transfers between Level 1 and Level 2 of the fair value hierarchy.
The fair value of the fund’s interest in a limited partnership represents the amount that the fund could reasonably expect to receive from the limited partnership if the fund’s capital was withdrawn from the limited partnership at the time of valuation, based on information available at the time the valuation is made and that the fund believes to be reliable. The valuation utilizes financial information supplied by the limited partnership with adjustments made daily for any underlying exchange traded securities. Limited partnerships are generally categorized within Level 3 of the fair value hierarchy.
When market quotations or official closing prices are not readily available, or are determined not to reflect accurately fair value, such as when the value of a security has been significantly affected by events after the close of the exchange or market on which the security is principally traded (for example, a foreign exchange or market), but before the fund calculates its net asset value, the fund may value these investments at fair value as determined in accordance with the procedures approved by the Company’s Board of Directors (the “Board”). Certain factors may be considered when fair valuing investments such as: fundamental analytical data, the nature and duration of restrictions on disposition, an evaluation of the forces that influence the market in which the securities are purchased and sold, and public trading in similar securities of the issuer or comparable issuers. These securities are either categorized within Level 2 or 3 of the fair value hierarchy depending on the relevant inputs used.
For restricted securities where observable inputs are limited, assumptions about market activity and risk are used and are generally categorized within Level 3 of the fair value hierarchy.
19
NOTES TO FINANCIAL STATEMENTS (continued)
Investments denominated in foreign currencies are translated to U.S. dollars at the prevailing rates of exchange.
The following is a summary of the inputs used as of August 31, 2016 in valuing the fund’s investments:
| | | | | |
| | Level 1 – Unadjusted
Quoted Prices | Level 2 - Other Significant Observable
Inputs | Level 3 -
Significant Unobservable Inputs | Total |
Assets ($) |
Investments in Securities: |
Equity Securities - Domestic
Common Stocks† | 233,135,077 | - | - | 233,135,077 |
Equity Securities - Foreign
Common Stocks† | 18,303,005 | - | - | 18,303,005 |
Limited Partnership Interest† | - | - | 1,567,346 | 1,567,346 |
Mutual Funds | 18,274,942 | - | - | 18,274,942 |
† See Statement of Investments for additional detailed categorizations.
At August 31, 2015, $4,796,685 of exchange traded foreign equity securities were classified within Level 2 of the fair value hierarchy pursuant to the fund’s fair valuation procedures.
The following is a reconciliation of Level 3 assets for which significant unobservable inputs were used to determine fair value:
| | |
| Limited Partnership Interest ($) |
Balance as of 8/31/2015 | 436,594 |
Realized gain (loss) | - |
Change in unrealized appreciation (depreciation) | 1,130,752 |
Purchases / issuances | - |
Sales / dispositions | - |
Transfers into Level 3 | - |
Transfers out of Level 3 | - |
Balance as of 8/31/2016 | 1,567,346 |
The amount of total gains (losses) for the period included in earnings attributable to the change in unrealized gains (losses) relating to investments still held at 8/31/2016 | 1,130,752 |
(b) Foreign currency transactions: The fund does not isolate that portion of the results of operations resulting from changes in foreign exchange rates on investments from the fluctuations arising from changes
20
in the market prices of securities held. Such fluctuations are included with the net realized and unrealized gain or loss on investments.
Net realized foreign exchange gains or losses arise from sales of foreign currencies, currency gains or losses realized on securities transactions between trade and settlement date, and the difference between the amounts of dividends, interest and foreign withholding taxes recorded on the fund’s books and the U.S. dollar equivalent of the amounts actually received or paid. Net unrealized foreign exchange gains and losses arise from changes in the value of assets and liabilities other than investments resulting from changes in exchange rates. Foreign currency gains and losses on foreign currency transactions are also included with net realized and unrealized gain or loss on investments.
(c) Securities transactions and investment income: Securities transactions are recorded on a trade date basis. Realized gains and losses from securities transactions are recorded on the identified cost basis. Dividend income is recognized on the ex-dividend date and interest income, including, where applicable, accretion of discount and amortization of premium on investments, is recognized on the accrual basis.
Pursuant to a securities lending agreement with The Bank of New York Mellon, a subsidiary of BNY Mellon and an affiliate of Dreyfus, the fund may lend securities to qualified institutions. It is the fund’s policy that, at origination, all loans are secured by collateral of at least 102% of the value of U.S. securities loaned and 105% of the value of foreign securities loaned. Collateral equivalent to at least 100% of the market value of securities on loan is maintained at all times. Collateral is either in the form of cash, which can be invested in certain money market mutual funds managed by Dreyfus, or U.S. Government and Agency securities. The fund is entitled to receive all dividends, interest and distributions on securities loaned, in addition to income earned as a result of the lending transaction. Should a borrower fail to return the securities in a timely manner, The Bank of New York Mellon is required to replace the securities for the benefit of the fund or credit the fund with the market value of the unreturned securities and is subrogated to the fund’s rights against the borrower and the collateral. Additionally, the contractual maturity of security lending transactions are on an overnight and continuous basis. During the period ended August 31, 2016, The Bank of New York Mellon earned $52,576 from lending portfolio securities, pursuant to the securities lending agreement.
(d) Affiliated issuers: Investments in other investment companies advised by Dreyfus are defined as “affiliated” under the Act. Investments
21
NOTES TO FINANCIAL STATEMENTS (continued)
in affiliated investment companies during the period ended August 31, 2016 were as follows:
| | | | | | |
Affiliated Investment Company | Value
8/31/2015($) | Purchases($) | Sales($) | Value
8/31/2016($) | Net
Assets(%) |
Dreyfus Institutional Cash Advantage
Fund,
Institutional
Shares | - | 152,547,192 | 141,889,914 | 10,657,278 | 4.1 |
Dreyfus Institutional
Preferred
Government
Plus Money
Market Fund | 8,402,620 | 61,343,490 | 62,128,446 | 7,617,664 | 3.0 |
Total | 8,402,620 | 213,890,682 | 204,018,360 | 18,274,942 | 7.1 |
† Formerly Dreyfus Institutional Preferred Plus Money Market Fund.
(e) Dividends to shareholders: Dividends are recorded on the ex-dividend date. Dividends from investment income-net and dividends from net realized capital gains, if any, are normally declared and paid annually, but the fund may make distributions on a more frequent basis to comply with the distribution requirements of the Internal Revenue Code of 1986, as amended (the “Code”). To the extent that net realized capital gains can be offset by capital loss carryovers, it is the policy of the fund not to distribute such gains. Income and capital gain distributions are determined in accordance with income tax regulations, which may differ from GAAP.
(f) Federal income taxes: It is the policy of the fund to continue to qualify as a regulated investment company, if such qualification is in the best interests of its shareholders, by complying with the applicable provisions of the Code, and to make distributions of taxable income sufficient to relieve it from substantially all federal income and excise taxes.
As of and during the period ended August 31, 2016, the fund did not have any liabilities for any uncertain tax positions. The fund recognizes interest and penalties, if any, related to uncertain tax positions as income tax expense in the Statement of Operations. During the period ended August 31, 2016, the fund did not incur any interest or penalties.
Each tax year in the four-year period ended August 31, 2016 remains subject to examination by the Internal Revenue Service and state taxing authorities.
22
At August 31, 2016, the components of accumulated earnings on a tax basis were as follows: Undistributed capital gains $9,148,510 and unrealized appreciation $78,050,687. In addition, the fund deferred for tax purposes late year ordinary losses of $798,492 to the first day of the following fiscal year.
The tax character of distributions paid to shareholders during the fiscal periods ended August 31, 2016 and August 31, 2015 were as follows: ordinary income $851,052 and $7,067,051, and long-term capital gains $15,678,165 and $38,712,558, respectively.
During the period ended August 31, 2016, as a result of permanent book to tax differences, primarily due to the tax treatment for net operating losses, foreign currency gains and losses and limited partnerships, the fund increased accumulated undistributed investment income-net by $688,071, increased accumulated net realized gain (loss) on investments by $182,550 and decreased paid-in capital by $870,621. Net assets and net asset value per share were not affected by this reclassification.
NOTE 2—Bank Lines of Credit:
The fund participates with other Dreyfus-managed funds in a $555 million unsecured credit facility led by Citibank, N.A. and a $300 million unsecured credit facility provided by The Bank of New York Mellon (each, a “Facility”), each to be utilized primarily for temporary or emergency purposes, including the financing of redemptions. Prior to January 11, 2016, the unsecured credit facility with Citibank, N.A. was $480 million and prior to October 7, 2015, the unsecured credit facility with Citibank, N.A. was $430 million. In connection therewith, the fund has agreed to pay its pro rata portion of commitment fees for each Facility. Interest is charged to the fund based on rates determined pursuant to the terms of the respective Facility at the time of borrowing. During the period ended August 31, 2016, the fund did not borrow under the Facilities.
NOTE 3—Management Fee and Other Transactions with Affiliates:
(a) Pursuant to a management agreement with Dreyfus, the management fee is computed at the annual rate of .75% of the value of the fund’s average daily net assets and is payable monthly.
During the period ended August 31, 2016, the Distributor retained $9,771 from commissions earned on sales of the fund’s Class A shares and $15 from CDSCs on redemptions of the fund’s Class C shares.
(b) Under the Distribution Plan adopted pursuant to Rule 12b-1 under the Act, Class C shares pay the Distributor for distributing its shares at an
23
NOTES TO FINANCIAL STATEMENTS (continued)
annual rate of .75% of the value of its average daily net assets. During the period ended August 31, 2016, Class C shares were charged $183,137 pursuant to the Distribution Plan.
(c) Under the Shareholder Services Plan, Class A and Class C shares pay the Distributor at an annual rate of .25% of the value of their average daily net assets for the provision of certain services. The services provided may include personal services relating to shareholder accounts, such as answering shareholder inquiries regarding the fund and providing reports and other information, and services related to the maintenance of shareholder accounts. The Distributor may make payments to Service Agents (securities dealers, financial institutions or other industry professionals) with respect to these services. The Distributor determines the amounts to be paid to Service Agents. During the period ended August 31, 2016, Class A and Class C shares were charged $529,333 and $61,046, respectively, pursuant to the Shareholder Services Plan.
The fund has arrangements with the transfer agent and the custodian whereby the fund may receive earnings credits when positive cash balances are maintained, which are used to offset transfer agency and custody fees. For financial reporting purposes, the fund includes net earnings credits as an expense offset in the Statement of Operations.
The fund compensates Dreyfus Transfer, Inc., a wholly-owned subsidiary of Dreyfus, under a transfer agency agreement for providing transfer agency and cash management services for the fund. The majority of transfer agency fees are comprised of amounts paid on a per account basis, while cash management fees are related to fund subscriptions and redemptions. During the period ended August 31, 2016, the fund was charged $140,847 for transfer agency services and $11,111 for cash management services. These fees are included in Shareholder servicing costs in the Statement of Operations. Cash management fees were partially offset by earnings credits of $3,821.
The fund compensates The Bank of New York Mellon under a custody agreement for providing custodial services for the fund. These fees are determined based on net assets, geographic region and transaction activity. During the period ended August 31, 2016, the fund was charged $27,807 pursuant to the custody agreement.
During the period ended August 31, 2016, the fund was charged $9,967 for services performed by the Chief Compliance Officer and his staff.
The components of “Due to The Dreyfus Corporation and affiliates” in the Statement of Assets and Liabilities consist of: management fees $162,550, Distribution Plan fees $15,493, Shareholder Services Plan fees
24
$50,603, custodian fees $11,389, Chief Compliance Officer fees $6,416 and transfer agency fees $33,297.
(d) Each Board member also serves as a Board member of other funds within the Dreyfus complex. Annual retainer fees and attendance fees are allocated to each fund based on net assets.
NOTE 4—Securities Transactions:
The aggregate amount of purchases and sales of investment securities, excluding short-term securities, during the period ended August 31, 2016, amounted to $93,875,601 and $127,793,555, respectively.
At August 31, 2016, the cost of investments for federal income tax purposes was $193,229,683; accordingly, accumulated net unrealized appreciation on investments was $78,050,687, consisting of $79,690,645 gross unrealized appreciation and $1,639,958 gross unrealized depreciation.
NOTE 5—Subsequent Event:
On September 8, 2016, the Board approved, effective September 30, 2016, a proposal to commence offering Class Y shares as a new class of shares of the fund.
25
REPORT OF INDEPENDENT REGISTERED
PUBLIC ACCOUNTING FIRM
Shareholders and Board of Directors
Dreyfus Technology Growth Fund
We have audited the accompanying statement of assets and liabilities, including the statement of investments, of Dreyfus Technology Growth Fund (one of the series comprising Advantage Funds, Inc.) as of August 31, 2016, and the related statement of operations for the year then ended, the statement of changes in net assets for each of the two years in the period then ended, and the financial highlights for each of the five years in the period then ended. These financial statements and financial highlights are the responsibility of the Fund’s management. Our responsibility is to express an opinion on these financial statements and financial highlights based on our audits.
We conducted our audits in accordance with the standards of the Public Company Accounting Oversight Board (United States). Those standards require that we plan and perform the audit to obtain reasonable assurance about whether the financial statements and financial highlights are free of material misstatement. We were not engaged to perform an audit of the Fund’s internal control over financial reporting. Our audits included consideration of internal control over financial reporting as a basis for designing audit procedures that are appropriate in the circumstances, but not for the purpose of expressing an opinion on the effectiveness of the Fund’s internal control over financial reporting. Accordingly, we express no such opinion. An audit also includes examining, on a test basis, evidence supporting the amounts and disclosures in the financial statements and financial highlights, assessing the accounting principles used and significant estimates made by management, and evaluating the overall financial statement presentation. Our procedures included confirmation of securities owned as of August 31, 2016 by correspondence with the custodian and others. We believe that our audits provide a reasonable basis for our opinion.
In our opinion, the financial statements and financial highlights referred to above present fairly, in all material respects, the financial position of Dreyfus Technology Growth Fund at August 31, 2016, the results of its operations for the year then ended, the changes in its net assets for each of the two years in the period then ended, and the financial highlights for each of the five years in the period then ended, in conformity with U.S. generally accepted accounting principles.

New York, New York
October 27, 2016
26
IMPORTANT TAX INFORMATION (Unaudited)
For federal tax purposes, the fund hereby reports 100% of the ordinary dividends paid during the fiscal year ended August 31, 2016 as qualifying for the corporate dividends received deduction. Also certain dividends paid by the fund may be subject to a maximum tax rate of 15%, as provided for by the Jobs and Growth Tax Relief Reconciliation Act of 2003. Of the distributions paid during the fiscal year, $851,052 represents the maximum amount that may be considered qualified dividend income. The fund also hereby reports $.1332 per share as a short-term capital gain distribution and $2.4506 per share as a long-term capital gain distribution paid on December 17, 2015. Shareholders will receive notification in early 2017 of the percentage applicable to the preparation of their 2016 income tax returns.
27
BOARD MEMBERS INFORMATION (Unaudited)
INDEPENDENT BOARD MEMBERS
Joseph S. DiMartino (72)
Chairman of the Board (1995)
Principal Occupation During Past 5 Years:
· Corporate Director and Trustee (1995-present)
Other Public Company Board Memberships During Past 5 Years:
· CBIZ (formerly, Century Business Services, Inc.), a provider of outsourcing functions for small and medium size companies, Director (1997-present)
No. of Portfolios for which Board Member Serves: 136
———————
Peggy C. Davis (73)
Board Member (2006)
Principal Occupation During Past 5 Years:
· Shad Professor of Law, New York University School of Law (1983-present)
No. of Portfolios for which Board Member Serves: 49
———————
David P. Feldman (76)
Board Member (1996)
Principal Occupation During Past 5 Years:
· Corporate Director and Trustee (1985-present)
Other Public Company Board Memberships During Past 5 Years:
· BBH Mutual Funds Group (5 registered mutual funds), Director (1992-2014)
No. of Portfolios for which Board Member Serves: 35
———————
Ehud Houminer (76)
Board Member (1993)
Principal Occupation During Past 5 Years:
· Executive-in-Residence at the Columbia Business School, Columbia
University (1992-present)
Other Public Company Board Memberships During Past 5 Years:
· Avnet, Inc., an electronics distributor, Director (1993-2012)
No. of Portfolios for which Board Member Serves: 59
———————
28
Lynn Martin (76)
Board Member (2012)
Principal Occupation During Past 5 Years:
· President of The Martin Hall Group LLC, a human resources consulting firm (2005-2012)
Other Public Company Board Memberships During Past 5 Years:
· AT&T, Inc., a telecommunications company, Director (1999-2012)
· Ryder System, Inc., a supply chain and transportation management company, Director (1993-2012)
No. of Portfolios for which Board Member Serves: 35
———————
Robin A. Melvin (52)
Board Member (2012)
Principal Occupation During Past 5 Years:
· Co-chairman, Illinois Mentoring Partnership, non-profit organization dedicated to increasing the quantity and quality of mentoring services in Illinois; (2014-present; served as a board member since 2013)
· Director, Boisi Family Foundation, a private family foundation that supports youth-serving organizations that promote the self sufficiency of youth from disadvantaged circumstances (1995-2012)
No. of Portfolios for which Board Member Serves: 108
———————
Dr. Martin Peretz (77)
Board Member (2006)
Principal Occupation During Past 5 Years:
· Editor-in-Chief Emeritus of The New Republic Magazine (2011-2012) (previously,
Editor-in-Chief, 1974-2011)
· Director of TheStreet.com, a financial information service on the web (1996-2010)
· Lecturer at Harvard University (1969-2012)
No. of Portfolios for which Board Member Serves: 35
———————
Once elected all Board Members serve for an indefinite term, but achieve Emeritus status upon reaching age 80. The address of the Board Members and Officers is c/o The Dreyfus Corporation, 200 Park Avenue, New York, New York 10166. Additional information about the Board Members is available in the fund’s Statement of Additional Information which can be obtained from Dreyfus free of charge by calling this toll free number: 1-800-DREYFUS.
James F. Henry, Emeritus Board Member
Dr. Paul A. Marks, Emeritus Board Member
Philip L. Toia, Emeritus Board Member
29
OFFICERS OF THE FUND (Unaudited)
BRADLEY J. SKAPYAK, President since January 2010.
Chief Operating Officer and a director of the Manager since June 2009, Chairman of Dreyfus Transfer, Inc., an affiliate of the Manager and the transfer agent of the funds, since May 2011 and Executive Vice President of the Distributor since June 2007. From April 2003 to June 2009, Mr. Skapyak was the head of the Investment Accounting and Support Department of the Manager. He is an officer of 65 investment companies (comprised of 136 portfolios) managed by the Manager. He is 57 years old and has been an employee of the Manager since February 1988.
BENNETT A. MACDOUGALL, Chief Legal Officer since October 2015.
Chief Legal Officer of the Manager since June 2015; from June 2005 to June 2015, he served in various capacities with Deutsche Bank – Asset & Wealth Management Division, including as Director and Associate General Counsel, and Chief Legal Officer of Deutsche Investment Management Americas Inc. from June 2012 to May 2015. He is an officer of 66 investment companies (comprised of 161 portfolios) managed by the Manager. He is 44 years old and has been an employee of the Manager since June 2015.
JANETTE E. FARRAGHER, Vice President and Secretary since December 2011.
Assistant General Counsel of BNY Mellon, and an officer of 66 investment companies (comprised of 161 portfolios) managed by the Manager. She is 53 years old and has been an employee of the Manager since February 1984.
JAMES BITETTO, Vice President and Assistant Secretary since August 2005.
Managing Counsel of BNY Mellon and Secretary of the Manager, and an officer of 66 investment companies (comprised of 161 portfolios) managed by the Manager. He is 50 years old and has been an employee of the Manager since December 1996.
JONI LACKS CHARATAN, Vice President and Assistant Secretary since August 2005.
Managing Counsel of BNY Mellon, and an officer of 66 investment companies (comprised of 161 portfolios) managed by the Manager. She is 60 years old and has been an employee of the Manager since October 1988.
JOSEPH M. CHIOFFI, Vice President and Assistant Secretary since August 2005.
Managing Counsel of BNY Mellon, and an officer of 66 investment companies (comprised of 161 portfolios) managed by the Manager. He is 54 years old and has been an employee of the Manager since June 2000.
MAUREEN E. KANE, Vice President and Assistant Secretary since April 2015.
Managing Counsel of BNY Mellon since July 2014; from October 2004 until July 2014, General Counsel, and from May 2009 until July 2014, Chief Compliance Officer of Century Capital Management. She is an officer of 66 investment companies (comprised of 161 portfolios) managed by the Manager. She is 54 years old and has been an employee of the Manager since July 2014.
SARAH S. KELLEHER, Vice President and Assistant Secretary since April 2014.
Senior Counsel of BNY Mellon, and an officer of 66 investment companies (comprised of 161 portfolios) managed by the Manager; from August 2005 to March 2013, Associate General Counsel of Third Avenue Management. She is 40 years old and has been an employee of the Manager since March 2013.
JEFF PRUSNOFSKY, Vice President and Assistant Secretary since August 2005.
Senior Managing Counsel of BNY Mellon, and an officer of 66 investment companies (comprised of 161 portfolios) managed by the Manager. He is 51 years old and has been an employee of the Manager since October 1990.
JAMES WINDELS, Treasurer since November 2001.
Director – Mutual Fund Accounting of the Manager, and an officer of 66 investment companies (comprised of 161 portfolios) managed by the Manager. He is 57 years old and has been an employee of the Manager since April 1985.
RICHARD CASSARO, Assistant Treasurer since January 2008.
Senior Accounting Manager – Money Market, Municipal Bond and Equity Funds of the Manager, and an officer of 66 investment companies (comprised of 161 portfolios) managed by the Manager. He is 57 years old and has been an employee of the Manager since September 1982.
30
GAVIN C. REILLY, Assistant Treasurer since December 2005.
Tax Manager of the Investment Accounting and Support Department of the Manager, and an officer of 66 investment companies (comprised of 161 portfolios) managed by the Manager. He is 48 years old and has been an employee of the Manager since April 1991.
ROBERT S. ROBOL, Assistant Treasurer since August 2005.
Senior Accounting Manager of the Manager, and an officer of 66 investment companies (comprised of 161 portfolios) managed by the Manager. He is 52 years old and has been an employee of the Manager since October 1988.
ROBERT SALVIOLO, Assistant Treasurer since July 2007.
Senior Accounting Manager – Equity Funds of the Manager, and an officer of 66 investment companies (comprised of 161 portfolios) managed by the Manager. He is 49 years old and has been an employee of the Manager since June 1989.
ROBERT SVAGNA, Assistant Treasurer since December 2002.
Senior Accounting Manager – Fixed Income and Equity Funds of the Manager, and an officer of 66 investment companies (comprised of 161 portfolios) managed by the Manager. He is 49 years old and has been an employee of the Manager since November 1990.
JOSEPH W. CONNOLLY, Chief Compliance Officer since October 2004.
Chief Compliance Officer of the Manager and The Dreyfus Family of Funds (66 investment companies, comprised of 161 portfolios). He is 59 years old and has served in various capacities with the Manager since 1980, including manager of the firm’s Fund Accounting Department from 1997 through October 2001.
CARIDAD M. CAROSELLA, Anti-Money Laundering Compliance Officer since January 2016
Anti-Money Laundering Compliance Officer of the Dreyfus Family of Funds and BNY Mellon Funds Trust since January 2016; from May 2015 to December 2015, Interim Anti-Money Laundering Compliance Officer of the Dreyfus Family of Funds and BNY Mellon Funds Trust and the Distributor; from January 2012 to May 2015, AML Surveillance Officer of the Distributor and from 2007 to December 2011, Financial Processing Manager of the Distributor. She is an officer of 61 investment companies (comprised of 156 portfolios) managed by the Manager. She is 48 years old and has been an employee of the Distributor since 1997.
31
NOTES
32
NOTES
33
Dreyfus Technology Growth Fund
200 Park Avenue
New York, NY 10166
Manager
The Dreyfus Corporation
200 Park Avenue
New York, NY 10166
Custodian
The Bank of New York Mellon
225 Liberty Street
New York, NY 10286
Transfer Agent &
Dividend Disbursing Agent
Dreyfus Transfer, Inc.
200 Park Avenue
New York, NY 10166
Distributor
MBSC Securities Corporation
200 Park Avenue
New York, NY 10166
| | |
Ticker Symbols: | Class A: DTGRX Class C: DTGCX Class I: DGVRX |
Telephone Call your financial representative or 1-800-DREYFUS
Mail The Dreyfus Family of Funds, 144 Glenn Curtiss Boulevard, Uniondale, NY 11556-0144
E-mail Send your request to info@dreyfus.com
Internet Information can be viewed online or downloaded at www.dreyfus.com
The fund files its complete schedule of portfolio holdings with the Securities and Exchange Commission (“SEC”) for the first and third quarters of each fiscal year on Form N-Q. The fund’s Forms N-Q are available on the SEC’s website at www.sec.gov and may be reviewed and copied at the SEC’s Public Reference Room in Washington, DC. (phone 1-800-SEC-0330 for information).
A description of the policies and procedures that the fund uses to determine how to vote proxies relating to portfolio securities and information regarding how the fund voted these proxies for the most recent 12-month period ended June 30 is available at www.dreyfus.com and on the SEC’s website at www.sec.gov and without charge, upon request, by calling 1-800-DREYFUS.
| | |
© 2016 MBSC Securities Corporation
0255AR0816 | 
|
Item 2. Code of Ethics.
The Registrant has adopted a code of ethics that applies to the Registrant's principal executive officer, principal financial officer, principal accounting officer or controller, or persons performing similar functions. There have been no amendments to, or waivers in connection with, the Code of Ethics during the period covered by this Report.
Item 3. Audit Committee Financial Expert.
The Registrant's Board has determined that Mr. David P. Feldman, a member of the Audit Committee of the Board, is an audit committee financial expert as defined by the Securities and Exchange Commission (the "SEC"). Mr. Feldman is "independent" as defined by the SEC for purposes of audit committee financial expert determinations.
Item 4. Principal Accountant Fees and Services.
(a) Audit Fees. The aggregate fees billed for each of the last two fiscal years (the "Reporting Periods") for professional services rendered by the Registrant's principal accountant (the "Auditor") for the audit of the Registrant's annual financial statements or services that are normally provided by the Auditor in connection with the statutory and regulatory filings or engagements for the Reporting Periods, were $242,699 in 2015 and $203,136 in 2016.
(b) Audit-Related Fees. The aggregate fees billed in the Reporting Periods for assurance and related services by the Auditor that are reasonably related to the performance of the audit of the Registrant's financial statements and are not reported under paragraph (a) of this Item 4 were $43,911 in 2015 and $38,580 in 2016. These services consisted of one or more of the following: (i) agreed upon procedures related to compliance with Internal Revenue Code section 817(h), (ii) security counts required by Rule 17f-2 under the Investment Company Act of 1940, as amended, (iii) advisory services as to the accounting or disclosure treatment of Registrant transactions or events and (iv) advisory services to the accounting or disclosure treatment of the actual or potential impact to the Registrant of final or proposed rules, standards or interpretations by the Securities and Exchange Commission, the Financial Accounting Standards Boards or other regulatory or standard-setting bodies.
The aggregate fees billed in the Reporting Periods for non-audit assurance and related services by the Auditor to the Registrant's investment adviser (not including any sub-investment adviser whose role is primarily portfolio management and is subcontracted with or overseen by another investment adviser), and any entity controlling, controlled by or under common control with the investment adviser that provides ongoing services to the Registrant ("Service Affiliates"), that were reasonably related to the performance of the annual audit of the Service Affiliate, which required pre-approval by the Audit Committee were $0 in 2015 and $0 in 2016.
(c) Tax Fees. The aggregate fees billed in the Reporting Periods for professional services rendered by the Auditor for tax compliance, tax advice, and tax planning ("Tax Services") were $32,947 in 2015 and $22,871 in 2016. These services consisted of: (i) review or preparation of U.S. federal, state, local and excise tax returns; (ii) U.S. federal, state and local tax planning, advice and assistance regarding statutory, regulatory or administrative developments; (iii) tax advice regarding tax qualification matters and/or treatment of various financial instruments held or proposed to be acquired or held, and (iv) determination of Passive Foreign Investment Companies. The aggregate fees billed in the Reporting Periods for Tax Services by the Auditor to Service Affiliates, which required pre-approval by the Audit Committee were $0 in 2015 and $0 in 2016.
(d) All Other Fees. The aggregate fees billed in the Reporting Periods for products and services provided by the Auditor, other than the services reported in paragraphs (a) through (c) of this Item, were $22,057 in 2015 and $8,262 in 2016. These services included a review of the Registrant's anti-money laundering program.
The aggregate fees billed in the Reporting Periods for Non-Audit Services by the Auditor to Service Affiliates, other than the services reported in paragraphs (b) through (c) of this Item, which required pre-approval by the Audit Committee, were $0 in 2015 and $0 in 2016.
(e)(1) Audit Committee Pre-Approval Policies and Procedures. The Registrant's Audit Committee has established policies and procedures (the "Policy") for pre-approval (within specified fee limits) of the Auditor's engagements for non-audit services to the Registrant and Service Affiliates without specific case-by-case consideration. The pre-approved services in the Policy can include pre-approved audit services, pre-approved audit-related services, pre-approved tax services and pre-approved all other services. Pre-approval considerations include whether the proposed services are compatible with maintaining the Auditor's independence. Pre-approvals pursuant to the Policy are considered annually.
(e)(2) Note: None of the services described in paragraphs (b) through (d) of this Item 4 were approved by the Audit Committee pursuant to paragraph (c)(7)(i)(C) of Rule 2-01 of Regulation S-X.
(f) None of the hours expended on the principal accountant's engagement to audit the registrant's financial statements for the most recent fiscal year were attributed to work performed by persons other than the principal account's full-time, permanent employees.
Non-Audit Fees. The aggregate non-audit fees billed by the Auditor for services rendered to the Registrant, and rendered to Service Affiliates, for the Reporting Periods were $21,000,680 in 2015 and $20,260,418 in 2016.
Auditor Independence. The Registrant's Audit Committee has considered whether the provision of non-audit services that were rendered to Service Affiliates, which were not pre-approved (not requiring pre-approval), is compatible with maintaining the Auditor's independence.
Item 5. Audit Committee of Listed Registrants.
Not applicable.
Item 6. Investments.
(a) Not applicable.
Item 7. Disclosure of Proxy Voting Policies and Procedures for Closed-End Management Investment Companies.
Not applicable.
Item 8. Portfolio Managers of Closed-End Management Investment Companies.
Not applicable.
Item 9. Purchases of Equity Securities by Closed-End Management Investment Companies and Affiliated Purchasers.
Not applicable.
Item 10. Submission of Matters to a Vote of Security Holders.
There have been no material changes to the procedures applicable to Item 10.
Item 11. Controls and Procedures.
(a) The Registrant's principal executive and principal financial officers have concluded, based on their evaluation of the Registrant's disclosure controls and procedures as of a date within 90 days of the filing date of this report, that the Registrant's disclosure controls and procedures are reasonably designed to ensure that information required to be disclosed by the Registrant on Form N-CSR is recorded, processed, summarized and reported within the required time periods and that information required to be disclosed by the Registrant in the reports that it files or submits on Form N-CSR is accumulated and communicated to the Registrant's management, including its principal executive and principal financial officers, as appropriate to allow timely decisions regarding required disclosure.
(b) There were no changes to the Registrant's internal control over financial reporting that occurred during the second fiscal quarter of the period covered by this report that have materially affected, or are reasonably likely to materially affect, the Registrant's internal control over financial reporting.
Item 12. Exhibits.
(a)(1) Code of ethics referred to in Item 2.
(a)(2) Certifications of principal executive and principal financial officers as required by Rule 30a-2(a) under the Investment Company Act of 1940.
(a)(3) Not applicable.
(b) Certification of principal executive and principal financial officers as required by Rule 30a-2(b) under the Investment Company Act of 1940.
SIGNATURES
Pursuant to the requirements of the Securities Exchange Act of 1934 and the Investment Company Act of 1940, the Registrant has duly caused this Report to be signed on its behalf by the undersigned, thereunto duly authorized.
Advantage Funds, Inc.
By: /s/ Bradley J. Skapyak
Bradley J. Skapyak
President
Date: October 28, 2016
Pursuant to the requirements of the Securities Exchange Act of 1934 and the Investment Company Act of 1940, this Report has been signed below by the following persons on behalf of the Registrant and in the capacities and on the dates indicated.
By: /s/ Bradley J. Skapyak
Bradley J. Skapyak
President
Date: October 28, 2016
By: /s/ James Windels
James Windels
Treasurer
Date: October 28, 2016
EXHIBIT INDEX
(a)(1) Code of ethics referred to in Item 2.
(a)(2) Certifications of principal executive and principal financial officers as required by Rule 30a-2(a) under the Investment Company Act of 1940. (EX-99.CERT)
(b) Certification of principal executive and principal financial officers as required by Rule 30a-2(b) under the Investment Company Act of 1940. (EX-99.906CERT)


