UNITED STATES
SECURITIES AND EXCHANGE COMMISSION
Washington, D.C. 20549
FORM N-CSR
CERTIFIED SHAREHOLDER REPORT OF REGISTERED MANAGEMENT
INVESTMENT COMPANIES
Investment Company Act file number | 811-07123 |
| |
| BNY Mellon Advantage Funds, Inc. | |
| (Exact name of Registrant as specified in charter) | |
| | |
| c/o BNY Mellon Investment Adviser, Inc. 240 Greenwich Street New York, New York 10286 | |
| (Address of principal executive offices) (Zip code) | |
| | |
| Bennett A. MacDougall, Esq. 240 Greenwich Street New York, New York 10286 | |
| (Name and address of agent for service) | |
|
Registrant's telephone number, including area code: | (212) 922-6400 |
| |
Date of fiscal year end: | 08/31 | |
Date of reporting period: | 08/31/2020 | |
| | | | | | | |
The following N-CSR relates only to the Registrant's series listed below and does not relate to any series of the Registrant with a different fiscal year end and, therefore, different N-CSR reporting requirements. A separate N-CSR will be filed for any series with a different fiscal year end, as appropriate.
BNY Mellon Dynamic Value Fund
BNY Mellon Opportunistic Midcap Value Fund
BNY Mellon Opportunistic Small Cap Fund
BNY Mellon Structured Midcap Fund
BNY Mellon Technology Growth Fund
FORM N-CSR
Item 1. Reports to Stockholders.
BNY Mellon Dynamic Value Fund
| |
ANNUAL REPORT August 31, 2020 |
| |
Save time. Save paper. View your next shareholder report online as soon as it’s available. Log into www.bnymellonim.com/us and sign up for eCommunications. It’s simple and only takes a few minutes. |
| |
The views expressed in this report reflect those of the portfolio manager(s) only through the end of the period covered and do not necessarily represent the views of BNY Mellon Investment Adviser, Inc. or any other person in the BNY Mellon Investment Adviser, Inc. organization. Any such views are subject to change at any time based upon market or other conditions and BNY Mellon Investment Adviser, Inc. disclaims any responsibility to update such views. These views may not be relied on as investment advice and, because investment decisions for a fund in the BNY Mellon Family of Funds are based on numerous factors, may not be relied on as an indication of trading intent on behalf of any fund in the BNY Mellon Family of Funds. |
| |
Not FDIC-Insured • Not Bank-Guaranteed • May Lose Value |
Contents
THE FUND
FOR MORE INFORMATION
Back Cover
| | | | |
| |
BNY Mellon Dynamic Value Fund
| | The Fund |
A LETTER FROM THE PRESIDENT OF BNY MELLON INVESTMENT ADVISER, INC.
Dear Shareholder:
We are pleased to present this annual report for BNY Mellon Dynamic Value Fund, covering the 12-month period from September 1, 2019 through August 31, 2020. For information about how the fund performed during the reporting period, as well as general market perspectives, we provide a Discussion of Fund Performance on the pages that follow.
Early in the reporting period, positive investor sentiment fueled an equity rally. Accommodative rate policies from the U.S. Federal Reserve (the “Fed”) and progress towards a U.S./China trade deal stoked optimism about future economic growth prospects. As the calendar year turned over, this optimism turned to concern, as COVID-19 began to spread across China, adjacent areas of the Pacific Rim and parts of Europe. When the virus spread throughout the U.S. in March 2020, stocks began to show signs of volatility and posted historic losses during the month. Investor angst over the possible economic impact of a widespread quarantine worked to depress equity valuations. Global central banks and governments worked to enact emergency stimulus measures to support their respective economies and equity valuations began to rebound, trending upward for the remainder of the period.
In fixed-income markets, interest rates were heavily influenced by changes in Fed policy and investor concern over COVID-19. In 2019, as stocks rallied in response to Fed rate cuts, risk-asset valuations also rose while Treasuries lagged. When COVID-19 began to emerge, a flight to quality ensued and Treasury rates fell significantly. March 2020 brought extreme volatility and risk-asset spread widening. The Fed cut rates twice in March, resulting in an overnight lending target rate of nearly zero, and the government launched a large stimulus package; many governments and central banks around the globe followed suit. At their meeting in August 2020, the Fed confirmed their commitment to a “lower-for-longer” rate policy.
We believe the near-term outlook for the U.S. will be challenging, as the country curbs the spread of COVID-19. However, we are confident that ongoing central bank and government policy responses can continue to support economic progress. As always, we will monitor relevant data for any signs of a change. We encourage you to discuss the risks and opportunities in today’s investment environment with your financial advisor.
Thank you for your continued confidence and support.
Sincerely,

Renee LaRoche-Morris
President
BNY Mellon Investment Adviser, Inc.
September 15, 2020
2
DISCUSSION OF FUND PERFORMANCE (Unaudited)
For the period from September 1, 2019 through August 31, 2020, as provided by Brian C. Ferguson, John C. Bailer, and David S. Intoppa, Portfolio Managers
Market and Fund Performance Overview
For the 12-month period ended August 31, 2020, BNY Mellon Dynamic Value Fund’s Class A shares produced a total return of -0.55%, Class C shares returned -1.29%, Class I shares returned -0.30% and Class Y shares returned -0.27%.1 The fund’s benchmark, the Russell 1000® Value Index (the “Index”), produced a total return of 0.84% for the same period.2
Despite concerns about COVID-19, U.S. equities markets increased somewhat over the reporting period amid better-than-expected corporate earnings and signs of economic recovery. The fund underperformed the Index, primarily due to unfavorable security selections in the health care and industrial sectors.
The Fund’s Investment Approach
The fund seeks capital appreciation. To pursue its goal, the fund normally invests at least 80% of its net assets, plus any borrowings for investment purposes, in stocks. The fund may invest up to 30% of its assets in foreign securities. We identify potential investments through extensive quantitative and fundamental research. We focus on individual stock selection (a “bottom-up” approach), emphasizing three key factors: value, sound business fundamentals and positive business momentum.
Stocks Begin to Rebound from Pandemic
The reporting period began with the market continuing to benefit from a shift in Federal Reserve (the “Fed”) policy, which had been prompted by concerns about economic growth and corporate earnings. Late in 2019, the Fed implemented three rate cuts, as trade tensions and other geopolitical concerns appeared to be weighing on economic growth. Other major central banks also enacted supportive policies. Stocks also benefited from the announcement of a “Phase One” trade deal between the U.S. and China, and from the approval of the new U.S.-Mexico-Canada Trade Agreement.
Early in 2020, developed markets experienced a correction amid growing concerns about the COVID-19 virus, erasing the gain that occurred late in 2019. As a result, the Fed reduced the federal funds rate twice in March, bringing the target rate down to 0-0.25%. In addition, the Fed and other central banks initiated various programs to ease liquidity concerns in certain markets, and government authorities introduced programs to keep small businesses afloat. Steps were also taken to provide relief to employees who had lost their jobs as a result of government-mandated business shutdowns.
In the second half of the reporting period, the economy began to show signs of recovery. Retail sales rebounded, and the outlook for manufacturing also improved. The employment trends also recovered from depressed levels as the economy began to reopen, beating economists’ expectations. As the unemployment rate dropped sharply, and markets began to rebound as relief programs took effect, government shutdowns began to ease, and hope for a COVID-19 vaccine or effective therapy took hold.
Performance Hindered by Stock Selections
The fund’s performance versus the Index was hindered by stock selections in the health care and industrial sectors. In the health care sector, the fund’s performance versus the Index was hurt by its decision not to own Johnson & Johnson, which jumped 23%. A position in Becton Dickinson & Co. also hindered returns, as the company issued more shares, diluting per share performance. The company has produced a COVID-19 test, but a less expensive test announcement from Abbott Labs had investors concerned about competitive pressures. It’s likely that testing demand will outstrip capacity from any one provider, resulting in a complementary dynamic as testing becomes more widely
3
DISCUSSION OF FUND PERFORMANCE (Unaudited) (continued)
entrenched. In the industrial sector, positions in Delta Airlines and Raytheon Corporation were hurt by the decline in the travel industry resulting from COVID-19.
On the positive side, stock selections in the financial and real estate sectors proved beneficial. In the financial services sector, the fund’s positions in Morgan Stanley and Goldman Sachs Group were advantageous, as these well-diversified banks fared better than other banks during the economic downturn. In addition, LPL Financial Holdings, a wealth advisory firm, contributed positively to performance, rising 11%. In the real estate sector, shares of Weyerhaeuser, a lumber and OSB real estate investment trust, outperformed the sector.
Valuations on Value Stocks Still Attractive
The fund engaged in repositioning during the reporting period, moving to an overweight position in the health care sector and an equal weight in the utilities sector. This move was enabled by a shift to a larger underweight position in the communication services and a smaller overweight position in the energy sector.
We remain optimistic about the prospects about value-oriented stocks. We believe economic recovery in the U.S. will benefit these stocks, which have been hurt more than other segments of the equity universe by the market downturn. In addition, valuations on value-oriented stocks remain attractive versus growth-oriented stocks, and we believe the market downturn earlier in 2020 marked a new start for this segment of the market.
September 15, 2020
1 Total return includes reinvestment of dividends and any capital gains paid and does not take into consideration the maximum initial sales charge in the case of Class A shares, or the applicable contingent deferred sales charges imposed on redemptions in the case of Class C shares. Had these charges been reflected, returns would have been lower. Past performance is no guarantee of future results. Share price and investment return fluctuate such that upon redemption, fund shares may be worth more or less than their original cost. The fund’s returns reflect the absorption of certain fund expenses by BNY Mellon Investment Adviser, Inc. pursuant to an agreement in effect through December 31, 2020, at which time it may be extended, terminated or modified. Had these expenses not been absorbed, the fund’s returns would have been lower.
2 Source: Lipper Inc. — The Russell 1000® Value Index measures the performance of the large-cap value segment of the U.S. equity universe. It includes those Russell 1000 companies that are considered more value-oriented relative to the overall market as defined by Russell’s leading style methodology. The Russell 1000® Value Index is constructed to provide a comprehensive and unbiased barometer for the large-cap value segment. The index is completely reconstituted annually to ensure new and growing equities are included and that the represented companies continue to reflect value characteristics. Investors cannot invest directly in any index.
Please note: the position in any security highlighted with italicized typeface was sold during the reporting period.
Equities are subject generally to market, market sector, market liquidity, issuer and investment style risks, among other factors, to varying degrees, all of which are more fully described in the fund’s prospectus.
The fund’s performance will be influenced by political, social and economic factors affecting investments in foreign companies. Special risks associated with investments in foreign companies include exposure to currency fluctuations, less liquidity, less developed or less efficient trading markets, lack of comprehensive company information, political instability and differing auditing and legal standards. These risks are enhanced in emerging market countries. Please read the prospectus for further discussion of these risks.
Recent market risks include pandemic risks related to COVID-19. The effects of COVID-19 have contributed to increased volatility in global markets and will likely affect certain countries, companies, industries and market sectors more dramatically than others. To the extent the fund may overweight its investments in certain countries, companies, industries or market sectors, such positions will increase the fund’s exposure to risk of loss from adverse developments affecting those countries, companies, industries or sectors.
4
FUND PERFORMANCE (Unaudited)
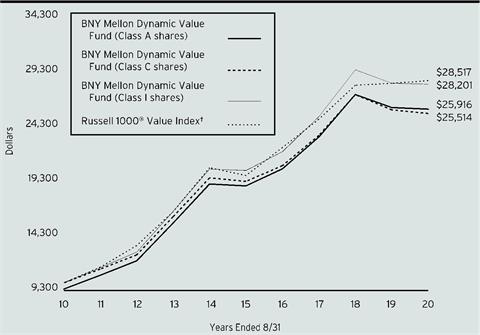
Comparison of change in value of a $10,000 investment in Class A shares, Class C shares, and Class I shares of BNY Mellon Dynamic Value Fund with a hypothetical investment of $10,000 in the Russell 1000® Value Index (the “Index”)
† Source: Lipper Inc.
Past performance is not predictive of future performance.
The above graph compares a hypothetical $10,000 investment made in each of the Class A shares, Class C shares and Class I shares of BNY Mellon Dynamic Value Fund on 8/31/10 to a hypothetical investment of $10,000 made in the Index on that date. All dividends and capital gain distributions are reinvested.
The fund’s performance shown in the line graph above takes into account the maximum initial sales charge on Class A shares and all other applicable fees and expenses on Class A shares, Class C shares, and Class I shares. The Index measures the performance of the large-cap value segment of the U.S. equity universe. It includes those Russell 1000 companies that are considered more value-oriented relative to the overall market as defined by Russell’s leading style methodology. The Russell 1000® Value Index is constructed to provide a comprehensive and unbiased barometer for the large-cap value segment. The index is completely reconstituted annually to ensure new and growing equities are included and that the represented companies continue to reflect value characteristics. Unlike a mutual fund, the Index is not subject to charges, fees and other expenses. Investors cannot invest directly in any index. Further information relating to fund performance, including expense reimbursements, if applicable, is contained in the Financial Highlights section of the prospectus and elsewhere in this report.
5
FUND PERFORMANCE (Unaudited) (continued)

Comparison of change in value of a $1,000,000 investment in Class Y shares of BNY Mellon Dynamic Value Fund with a hypothetical investment of $1,000,000 in the Russell 1000® Value Index (the “Index”)
† Source: Lipper Inc.
†† The total return figures presented for Class Y shares of the fund reflect the performance of the fund’s Class A shares for the period prior to 7/1/13 (the inception date for Class Y shares), not reflecting the applicable sales charges for Class A shares.
Past performance is not predictive of future performance.
The above graph compares a hypothetical $1,000,000 investment made in Class Y shares of BNY Mellon Dynamic Value Fund on 8/31/10 to a hypothetical investment of $1,000,000 made in the Index on that date. All dividends and capital gain distributions are reinvested.
The fund’s performance shown in the line graph above takes into account all applicable fees and expenses on Class Y shares. The Index measures the performance of the large-cap value segment of the U.S. equity universe. It includes those Russell 1000 companies that are considered more value-oriented relative to the overall market as defined by Russell’s leading style methodology. The Russell 1000® Value Index is constructed to provide a comprehensive and unbiased barometer for the large-cap value segment. The index is completely reconstituted annually to ensure new and growing equities are included and that the represented companies continue to reflect value characteristics. Unlike a mutual fund, the Index is not subject to charges, fees and other expenses. Investors cannot invest directly in any index. Further information relating to fund performance, including expense reimbursements, if applicable, is contained in the Financial Highlights section of the prospectus and elsewhere in this report.
6
| | | | | | | | |
Average Annual Total Returns as of 8/31/2020 | | | | |
| | | Inception | | | | | |
| | Date | 1 Year | 5 Years | | 10 Years | |
| | | | | | | | |
Class A shares | | | | | | |
with maximum sales charge (5.75%) without sales charge | 9/29/95 | -6.27% | 5.28% | | 9.99% | |
9/29/95 | -0.55% | 6.54% | | 10.64% | |
Class C shares | | | | | | |
with applicable redemption charge † | 5/31/01 | -2.25% | 5.75% | | 9.82% | |
without redemption | 5/31/01 | -1.29% | 5.75% | | 9.82% | |
Class I shares | 5/31/01 | -0.30% | 6.81% | | 10.92% | |
Class Y shares | 7/1/13 | -0.27% | 6.83% | | 10.88%†† | |
Russell 1000® Value Index | | 0.84% | 7.53% | | 11.05% | |
† The maximum contingent deferred sales charge for Class C shares is 1% for shares redeemed within one year of the date of purchase.
†† The total return performance figures presented for Class Y shares of the fund reflect the performance of the fund’s Class A shares for the period prior to 7/1/13 (the inception date for Class Y shares), not reflecting the applicable sales charges for Class A shares.
The performance data quoted represents past performance, which is no guarantee of future results. Share price and investment return fluctuate and an investor’s shares may be worth more or less than original cost upon redemption. Current performance may be lower or higher than the performance quoted. Go to www.bnymellonim.com/us for the fund’s most recent month-end returns.
The fund’s performance shown in the graphs and table does not reflect the deduction of taxes that a shareholder would pay on fund distributions or the redemption of fund shares. In addition to the performance of Class A shares shown with and without a maximum sales charge, the fund’s performance shown in the table takes into account all other applicable fees and expenses on all classes.
7
UNDERSTANDING YOUR FUND’S EXPENSES (Unaudited)
As a mutual fund investor, you pay ongoing expenses, such as management fees and other expenses. Using the information below, you can estimate how these expenses affect your investment and compare them with the expenses of other funds. You also may pay one-time transaction expenses, including sales charges (loads) and redemption fees, which are not shown in this section and would have resulted in higher total expenses. For more information, see your fund’s prospectus or talk to your financial adviser.
Review your fund’s expenses
The table below shows the expenses you would have paid on a $1,000 investment in BNY Mellon Dynamic Value Fund from March 1, 2020 to August 31, 2020. It also shows how much a $1,000 investment would be worth at the close of the period, assuming actual returns and expenses.
| | | | | | | |
Expenses and Value of a $1,000 Investment | |
Assume actual returns for the six months ended August 31, 2020 | |
| | | | | | |
| | Class A | Class C | Class I | Class Y | |
Expense paid per $1,000† | $4.72 | $8.52 | $3.46 | $3.30 | |
Ending value (after expenses) | $1,020.90 | $1,017.00 | $1,022.00 | $1,022.00 | |
COMPARING YOUR FUND’S EXPENSES
WITH THOSE OF OTHER FUNDS (Unaudited)
Using the SEC’s method to compare expenses
The Securities and Exchange Commission (“SEC”) has established guidelines to help investors assess fund expenses. Per these guidelines, the table below shows your fund’s expenses based on a $1,000 investment, assuming a hypothetical 5% annualized return. You can use this information to compare the ongoing expenses (but not transaction expenses or total cost) of investing in the fund with those of other funds. All mutual fund shareholder reports will provide this information to help you make this comparison. Please note that you cannot use this information to estimate your actual ending account balance and expenses paid during the period.
| | | | | | | |
Expenses and Value of a $1,000 Investment | |
Assuming a hypothetical 5% annualized return for the six months ended August 31, 2020 | |
| | | | | | |
| | Class A | Class C | Class I | Class Y | |
Expense paid per $1,000† | $4.72 | $8.52 | $3.46 | $3.30 | |
Ending value (after expenses) | $1,020.46 | $1,016.69 | $1,021.72 | $1,021.87 | |
†Expenses are equal to the fund’s annualized expense ratio of .93% for Class A, 1.68% for Class C, .68% for Class I and .65% for Class Y, multiplied by the average account value over the period, multiplied by 184/366 (to reflect the one-half year period). |
8
STATEMENT OF INVESTMENTS
August 31, 2020
| | | | | | | | |
| |
Description | | | | Shares | | Value ($) | |
Common Stocks - 99.4% | | | | | |
Automobiles & Components - 1.7% | | | | | |
General Motors | | | | 691,677 | | 20,494,390 | |
Banks - 5.9% | | | | | |
Citigroup | | | | 276,449 | | 14,132,073 | |
JPMorgan Chase & Co. | | | | 481,474 | | 48,238,880 | |
The PNC Financial Services Group | | | | 82,867 | | 9,214,810 | |
| | | | | 71,585,763 | |
Capital Goods - 9.9% | | | | | |
Carrier Global | | | | 629,483 | | 18,790,068 | |
Eaton | | | | 270,224 | | 27,589,870 | |
Ingersoll Rand | | | | 366,561 | a | 12,851,629 | |
L3Harris Technologies | | | | 66,442 | | 12,008,727 | |
Northrop Grumman | | | | 30,366 | | 10,403,695 | |
Otis Worldwide | | | | 146,824 | | 9,235,230 | |
Quanta Services | | | | 313,208 | | 16,051,910 | |
Trane Technologies | | | | 109,460 | | 12,958,969 | |
| | | | | 119,890,098 | |
Consumer Durables & Apparel - 2.0% | | | | | |
Lennar, Cl. A | | | | 239,480 | | 17,917,894 | |
PVH | | | | 105,093 | | 5,859,986 | |
| | | | | 23,777,880 | |
Consumer Services - 1.4% | | | | | |
Las Vegas Sands | | | | 330,709 | | 16,770,253 | |
Diversified Financials - 16.0% | | | | | |
Berkshire Hathaway, Cl. B | | | | 225,280 | a | 49,120,051 | |
Capital One Financial | | | | 217,391 | | 15,006,501 | |
LPL Financial Holdings | | | | 196,751 | | 16,165,062 | |
Morgan Stanley | | | | 659,794 | | 34,480,834 | |
State Street | | | | 107,893 | | 7,346,434 | |
The Charles Schwab | | | | 275,699 | | 9,795,586 | |
The Goldman Sachs Group | | | | 185,699 | | 38,044,154 | |
Voya Financial | | | | 447,479 | b | 23,228,635 | |
| | | | | 193,187,257 | |
Energy - 5.2% | | | | | |
ConocoPhillips | | | | 189,069 | | 7,163,824 | |
Hess | | | | 339,633 | | 15,636,703 | |
Marathon Petroleum | | | | 526,865 | | 18,682,633 | |
Phillips 66 | | | | 200,984 | | 11,751,535 | |
Pioneer Natural Resources | | | | 89,697 | | 9,322,209 | |
| | | | | 62,556,904 | |
Food, Beverage & Tobacco - 4.7% | | | | | |
Archer-Daniels-Midland | | | | 397,587 | | 17,795,994 | |
9
STATEMENT OF INVESTMENTS (continued)
| | | | | | | | |
| |
Description | | | | Shares | | Value ($) | |
Common Stocks - 99.4% (continued) | | | | | |
Food, Beverage & Tobacco - 4.7% (continued) | | | | | |
Mondelez International, Cl. A | | | | 208,529 | | 12,182,264 | |
PepsiCo | | | | 83,248 | | 11,659,715 | |
Philip Morris International | | | | 187,894 | | 14,992,062 | |
| | | | | 56,630,035 | |
Health Care Equipment & Services - 9.7% | | | | | |
Alcon | | | | 177,169 | a,b | 10,158,871 | |
Anthem | | | | 46,007 | | 12,951,891 | |
Becton Dickinson & Co. | | | | 106,658 | | 25,893,363 | |
Centene | | | | 141,471 | a | 8,675,002 | |
Humana | | | | 32,246 | | 13,387,572 | |
Laboratory Corp. of America Holdings | | | | 51,438 | a | 9,040,229 | |
Medtronic | | | | 344,075 | | 36,977,740 | |
| | | | | 117,084,668 | |
Insurance - 4.4% | | | | | |
Assurant | | | | 182,056 | | 22,130,727 | |
Chubb | | | | 156,890 | | 19,611,250 | |
Willis Towers Watson | | | | 53,723 | | 11,041,688 | |
| | | | | 52,783,665 | |
Materials - 7.9% | | | | | |
CF Industries Holdings | | | | 741,881 | | 24,207,577 | |
Freeport-McMoRan | | | | 2,105,970 | | 32,874,192 | |
Louisiana-Pacific | | | | 361,044 | | 11,892,789 | |
Vulcan Materials | | | | 216,832 | | 26,019,840 | |
| | | | | 94,994,398 | |
Media & Entertainment - 2.3% | | | | | |
Alphabet, Cl. A | | | | 16,878 | a | 27,503,207 | |
Pharmaceuticals Biotechnology & Life Sciences - 4.9% | | | | | |
AbbVie | | | | 128,741 | | 12,329,526 | |
Biogen | | | | 32,594 | a | 9,375,338 | |
Bristol-Myers Squibb | | | | 257,190 | | 15,997,218 | |
Eli Lilly & Co. | | | | 65,434 | | 9,709,751 | |
Horizon Therapeutics | | | | 77,840 | a | 5,847,341 | |
Thermo Fisher Scientific | | | | 14,477 | | 6,210,344 | |
| | | | | 59,469,518 | |
Real Estate - .8% | | | | | |
Weyerhaeuser | | | | 304,765 | c | 9,237,427 | |
Retailing - 1.8% | | | | | |
Booking Holdings | | | | 4,849 | a | 9,263,772 | |
Lowe's Companies | | | | 74,947 | | 12,343,021 | |
| | | | | 21,606,793 | |
Semiconductors & Semiconductor Equipment - 6.4% | | | | | |
Applied Materials | | | | 263,170 | | 16,211,272 | |
Intel | | | | 248,065 | | 12,638,912 | |
10
| | | | | | | | |
| |
Description | | | | Shares | | Value ($) | |
Common Stocks - 99.4% (continued) | | | | | |
Semiconductors & Semiconductor Equipment - 6.4% (continued) | | | | | |
Microchip Technology | | | | 82,670 | b | 9,068,899 | |
Micron Technology | | | | 139,875 | a | 6,365,711 | |
NXP Semiconductors | | | | 120,189 | | 15,114,969 | |
Qualcomm | | | | 152,453 | | 18,157,152 | |
| | | | | 77,556,915 | |
Software & Services - 1.8% | | | | | |
International Business Machines | | | | 74,103 | | 9,137,641 | |
Proofpoint | | | | 112,429 | a | 12,330,088 | |
| | | | | 21,467,729 | |
Technology Hardware & Equipment - 4.4% | | | | | |
Apple | | | | 46,908 | | 6,053,008 | |
Cisco Systems | | | | 287,304 | | 12,129,975 | |
Corning | | | | 547,306 | b | 17,765,553 | |
Dolby Laboratories, Cl. A | | | | 122,806 | | 8,577,999 | |
Zebra Technologies, Cl. A | | | | 31,508 | a | 9,027,987 | |
| | | | | 53,554,522 | |
Transportation - 2.5% | | | | | |
FedEx | | | | 27,748 | | 6,100,120 | |
Union Pacific | | | | 123,277 | | 23,723,426 | |
| | | | | 29,823,546 | |
Utilities - 5.7% | | | | | |
Exelon | | | | 372,472 | | 13,747,942 | |
FirstEnergy | | | | 234,405 | | 6,701,639 | |
NextEra Energy Partners | | | | 209,044 | b | 12,609,534 | |
PPL | | | | 1,268,564 | | 35,050,423 | |
| | | | | 68,109,538 | |
Total Common Stocks (cost $1,060,676,405) | | | | 1,198,084,506 | |
| | | | | | | | |
Exchange-Traded Funds - .5% | | | | | |
Registered Investment Companies - .5% | | | | | |
iShares Russell 1000 Value ETF
(cost $6,024,967) | | | | 49,557 | b | 6,041,494 | |
11
STATEMENT OF INVESTMENTS (continued)
| | | | | | | | |
| |
Description | | 1-day Yield (%) | | Shares | | Value ($) | |
Investment of Cash Collateral for Securities Loaned - 1.7% | | | | | |
Registered Investment Companies - 1.7% | | | | | |
Dreyfus Institutional Preferred Government Plus Money Market Fund
(cost $20,489,252) | | 0.20 | | 20,489,252 | d | 20,489,252 | |
Total Investments (cost $1,087,190,624) | | 101.6% | | 1,224,615,252 | |
Liabilities, Less Cash and Receivables | | (1.6%) | | (19,289,323) | |
Net Assets | | 100.0% | | 1,205,325,929 | |
ETF—Exchange-Traded Fund
aNon-income producing security.
bSecurity, or portion thereof, on loan. At August 31, 2020, the value of the fund’s securities on loan was $55,978,954 and the value of the collateral was $57,568,963, consisting of cash collateral of $20,489,252 and U.S. Government & Agency securities valued at $37,079,711.
cInvestment in real estate investment trust within the United States.
dInvestment in affiliated issuer. The investment objective of this investment company is publicly available and can be found within the investment company’s prospectus.
| | |
Portfolio Summary (Unaudited) † | Value (%) |
Financials | 26.3 |
Health Care | 14.6 |
Information Technology | 12.7 |
Industrials | 12.4 |
Materials | 7.9 |
Consumer Discretionary | 6.9 |
Utilities | 5.6 |
Energy | 5.2 |
Consumer Staples | 4.7 |
Communication Services | 2.3 |
Investment Companies | 2.2 |
Real Estate | .8 |
| | 101.6 |
† Based on net assets.
See notes to financial statements.
12
STATEMENT OF INVESTMENTS IN AFFILIATED ISSUERS
| | | | | | | |
Investment Companies | Value
8/31/19 ($) | Purchases ($)† | Sales ($) | Value
8/31/20 ($) | Net
Assets (%) | Dividends/
Distributions ($) |
Registered Investment Companies; | | | | |
Dreyfus Institutional Preferred Government Plus Money Market Fund | 1,749,947 | 196,471,680 | (198,221,627) | - | - | 19,806 |
Investment of Cash Collateral for Securities Loaned; | | | |
Dreyfus Institutional Preferred Government Plus Money Market Fund | 1,131,190 | 121,093,035 | (101,734,973) | 20,489,252 | 1.7 | - |
Total | 2,881,137 | 317,564,715 | (299,956,600) | 20,489,252 | 1.7 | 19,806 |
† Includes reinvested dividends/distributions.
See notes to financial statements.
13
STATEMENT OF ASSETS AND LIABILITIES
August 31, 2020
| | | | | | | |
| | | | | | |
| | | Cost | | Value | |
Assets ($): | | | | |
Investments in securities—See Statement of Investments
(including securities on loan, valued at $55,978,954)—Note 1(c): | | | |
Unaffiliated issuers | 1,066,701,372 | | 1,204,126,000 | |
Affiliated issuers | | 20,489,252 | | 20,489,252 | |
Receivable for investment securities sold | | 9,978,286 | |
Dividends and securities lending income receivable | | 2,258,322 | |
Receivable for shares of Common Stock subscribed | | 1,173,695 | |
Prepaid expenses | | | | | 51,166 | |
| | | | | 1,238,076,721 | |
Liabilities ($): | | | | |
Due to BNY Mellon Investment Adviser, Inc. and affiliates—Note 3(c) | | 782,451 | |
Cash overdraft due to Custodian | | | | | 257,977 | |
Liability for securities on loan—Note 1(c) | | 20,489,252 | |
Payable for investment securities purchased | | 9,626,350 | |
Payable for shares of Common Stock redeemed | | 1,327,383 | |
Directors’ fees and expenses payable | | 31,176 | |
Interest payable—Note 2 | | 59 | |
Other accrued expenses | | | | | 236,144 | |
| | | | | 32,750,792 | |
Net Assets ($) | | | 1,205,325,929 | |
Composition of Net Assets ($): | | | | |
Paid-in capital | | | | | 1,065,814,121 | |
Total distributable earnings (loss) | | | | | 139,511,808 | |
Net Assets ($) | | | 1,205,325,929 | |
| | | | | | |
Net Asset Value Per Share | Class A | Class C | Class I | Class Y | |
Net Assets ($) | 648,545,493 | 9,371,595 | 342,508,053 | 204,900,788 | |
Shares Outstanding | 19,488,968 | 306,510 | 10,233,605 | 6,132,938 | |
Net Asset Value Per Share ($) | 33.28 | 30.58 | 33.47 | 33.41 | |
| | | | | |
See notes to financial statements. | | | | | |
14
STATEMENT OF OPERATIONS
Year Ended August 31, 2020
| | | | | | | |
| | | | | | |
| | | | | | |
Investment Income ($): | | | | |
Income: | | | | |
Cash dividends (net of $3,079 foreign taxes withheld at source): | |
Unaffiliated issuers | | | 30,605,906 | |
Affiliated issuers | | | 19,759 | |
Interest | | | 76,100 | |
Income from securities lending—Note 1(c) | | | 57,217 | |
Total Income | | | 30,758,982 | |
Expenses: | | | | |
Management fee—Note 3(a) | | | 7,855,972 | |
Shareholder servicing costs—Note 3(c) | | | 2,594,725 | |
Directors’ fees and expenses—Note 3(d) | | | 125,205 | |
Distribution fees—Note 3(b) | | | 99,616 | |
Professional fees | | | 97,965 | |
Prospectus and shareholders’ reports | | | 83,299 | |
Registration fees | | | 82,646 | |
Loan commitment fees—Note 2 | | | 35,073 | |
Custodian fees—Note 3(c) | | | 31,487 | |
Chief Compliance Officer fees—Note 3(c) | | | 13,975 | |
Interest expense—Note 2 | | | 6,384 | |
Miscellaneous | | | 71,828 | |
Total Expenses | | | 11,098,175 | |
Less—reduction in expenses due to undertaking—Note 3(a) | | | (399,591) | |
Net Expenses | | | 10,698,584 | |
Investment Income—Net | | | 20,060,398 | |
Realized and Unrealized Gain (Loss) on Investments—Note 4 ($): | | |
Net realized gain (loss) on investments | 34,853,020 | |
Capital gain distributions from affiliated issuers | 47 | |
Net Realized Gain (Loss) | | | 34,853,067 | |
Net change in unrealized appreciation (depreciation) on investments | (69,024,430) | |
Net Realized and Unrealized Gain (Loss) on Investments | | | (34,171,363) | |
Net (Decrease) in Net Assets Resulting from Operations | | (14,110,965) | |
| | | | | | |
See notes to financial statements. | | | | | |
15
STATEMENT OF CHANGES IN NET ASSETS
| | | | | | | | | | |
| | | | Year Ended August 31, |
| | | | 2020 | | 2019 | |
Operations ($): | | | | | | | | |
Investment income—net | | | 20,060,398 | | | | 26,752,518 | |
Net realized gain (loss) on investments | | 34,853,067 | | | | 34,123,743 | |
Net change in unrealized appreciation
(depreciation) on investments | | (69,024,430) | | | | (151,536,950) | |
Net Increase (Decrease) in Net Assets
Resulting from Operations | (14,110,965) | | | | (90,660,689) | |
Distributions ($): | |
Distributions to shareholders: | | | | | | | | |
Class A | | | (25,395,218) | | | | (108,639,666) | |
Class C | | | (440,390) | | | | (3,576,184) | |
Class I | | | (16,654,035) | | | | (65,779,162) | |
Class Y | | | (8,883,603) | | | | (45,439,104) | |
Total Distributions | | | (51,373,246) | | | | (223,434,116) | |
Capital Stock Transactions ($): | |
Net proceeds from shares sold: | | | | | | | | |
Class A | | | 23,294,794 | | | | 40,244,563 | |
Class C | | | 692,588 | | | | 2,701,564 | |
Class I | | | 98,524,788 | | | | 178,906,342 | |
Class Y | | | 41,059,106 | | | | 57,818,315 | |
Distributions reinvested: | | | | | | | | |
Class A | | | 23,607,957 | | | | 100,531,970 | |
Class C | | | 334,420 | | | | 2,692,043 | |
Class I | | | 15,707,496 | | | | 61,306,599 | |
Class Y | | | 5,418,388 | | | | 31,824,011 | |
Cost of shares redeemed: | | | | | | | | |
Class A | | | (96,480,564) | | | | (120,669,500) | |
Class C | | | (7,613,430) | | | | (13,021,841) | |
Class I | | | (196,500,842) | | | | (208,767,777) | |
Class Y | | | (74,590,633) | | | | (307,036,796) | |
Increase (Decrease) in Net Assets
from Capital Stock Transactions | (166,545,932) | | | | (173,470,507) | |
Total Increase (Decrease) in Net Assets | (232,030,143) | | | | (487,565,312) | |
Net Assets ($): | |
Beginning of Period | | | 1,437,356,072 | | | | 1,924,921,384 | |
End of Period | | | 1,205,325,929 | | | | 1,437,356,072 | |
16
| | | | | | | | | | |
| | | | Year Ended August 31, |
| | | | 2020 | | 2019 | |
Capital Share Transactions (Shares): | |
Class Aa,b | | | | | | | | |
Shares sold | | | 713,315 | | | | 1,177,556 | |
Shares issued for distributions reinvested | | | 651,629 | | | | 3,032,531 | |
Shares redeemed | | | (2,915,370) | | | | (3,467,994) | |
Net Increase (Decrease) in Shares Outstanding | (1,550,426) | | | | 742,093 | |
Class Cb | | | | | | | | |
Shares sold | | | 21,874 | | | | 87,814 | |
Shares issued for distributions reinvested | | | 9,995 | | | | 87,814 | |
Shares redeemed | | | (247,262) | | | | (405,903) | |
Net Increase (Decrease) in Shares Outstanding | (215,393) | | | | (230,275) | |
Class Ia | | | | | | | | |
Shares sold | | | 3,063,057 | | | | 5,145,410 | |
Shares issued for distributions reinvested | | | 431,877 | | | | 1,842,704 | |
Shares redeemed | | | (6,262,171) | | | | (6,035,248) | |
Net Increase (Decrease) in Shares Outstanding | (2,767,237) | | | | 952,866 | |
Class Ya | | | | | | | | |
Shares sold | | | 1,400,714 | | | | 1,763,701 | |
Shares issued for distributions reinvested | | | 149,267 | | | | 958,559 | |
Shares redeemed | | | (2,329,883) | | | | (8,304,875) | |
Net Increase (Decrease) in Shares Outstanding | (779,902) | | | | (5,582,615) | |
| | | | | | | | | |
aDuring the period ended August 31, 2020, 32,083 Class Y shares representing $1,118,637 were exchanged for 32,028 Class I shares, 8,359 Class A shares representing $258,938 were exchanged for 8,318 Class I shares, and 1,512 Class A shares representing $54,664 were exchanged for 1,506 Class Y shares. During the period August 31, 2019, 13,830 Class Y shares representing $510,754 were exchanged for 13,814 Class I shares. | |
bDuring the period ended August 31, 2020, 3,386 Class C shares representing $103,287 were automatically converted to 3,116 Class A shares and during the period ended August 31, 2019, 1,897 Class C shares representing $64,313 were automatically converted to 1,755 Class A shares. | |
See notes to financial statements. | | | | | | | | |
17
FINANCIAL HIGHLIGHTS
The following tables describe the performance for each share class for the fiscal periods indicated. All information (except portfolio turnover rate) reflects financial results for a single fund share. Total return shows how much your investment in the fund would have increased (or decreased) during each period, assuming you had reinvested all dividends and distributions. These figures have been derived from the fund’s financial statements.
| | | | | | | | |
| | Year Ended August 31, |
| |
Class A Shares | | 2020 | 2019 | 2018 | 2017 | 2016 |
Per Share Data ($): | | | | | | |
Net asset value, beginning of period | | 34.61 | 42.18 | 40.12 | 36.08 | 38.49 |
Investment Operations: | | | | | | |
Investment income—neta | | .47 | .57 | .49 | .37 | .50 |
Net realized and unrealized gain
(loss) on investments | | (.56) | (2.67) | 5.86 | 4.72 | 2.41 |
Total from Investment Operations | | (.09) | (2.10) | 6.35 | 5.09 | 2.91 |
Distributions: | | | | | | |
Dividends from investment
income—net | | (.57) | (.63) | (.39) | (.49) | (.39) |
Dividends from net realized gain
on investments | | (.67) | (4.84) | (3.90) | (.56) | (4.93) |
Total Distributions | | (1.24) | (5.47) | (4.29) | (1.05) | (5.32) |
Net asset value, end of period | | 33.28 | 34.61 | 42.18 | 40.12 | 36.08 |
Total Return (%)b | | (.55) | (4.40) | 16.68 | 14.26 | 8.26 |
Ratios/Supplemental Data (%): | | | | | | |
Ratio of total expenses to
average net assets | | .97 | .96 | .95 | 1.07 | 1.12 |
Ratio of net expenses to
average net assets | | .93 | .93 | .93 | .97 | .98 |
Ratio of net investment income to
average net assets | | 1.42 | 1.58 | 1.19 | .95 | 1.42 |
Portfolio Turnover Rate | | 103.12 | 97.03 | 105.82 | 96.39 | 80.82 |
Net Assets, end of period ($ x 1,000) | | 648,545 | 728,146 | 856,213 | 818,085 | 842,532 |
a Based on average shares outstanding.
b Exclusive of sales charge.
See notes to financial statements.
18
| | | | | | | | | | | |
| | | | | | |
| | Year Ended August 31, |
Class C Shares | | 2020 | 2019 | 2018 | 2017 | 2016 |
Per Share Data ($): | | | | | | |
Net asset value, beginning of period | | 31.84 | 39.20 | 37.52 | 33.81 | 36.35 |
Investment Operations: | | | | | | |
Investment income—neta | | .20 | .27 | .17 | .07 | .22 |
Net realized and unrealized gain
(loss) on investments | | (.53) | (2.48) | 5.48 | 4.42 | 2.26 |
Total from Investment Operations | | (.33) | (2.21) | 5.65 | 4.49 | 2.48 |
Distributions: | | | | | | |
Dividends from investment
income—net | | (.26) | (.31) | (.07) | (.22) | (.09) |
Dividends from net realized gain
on investments | | (.67) | (4.84) | (3.90) | (.56) | (4.93) |
Total Distributions | | (.93) | (5.15) | (3.97) | (.78) | (5.02) |
Net asset value, end of period | | 30.58 | 31.84 | 39.20 | 37.52 | 33.81 |
Total Return (%)b | | (1.29) | (5.12) | 15.86 | 13.39 | 7.46 |
Ratios/Supplemental Data (%): | | | | | | |
Ratio of total expenses to
average net assets | | 1.73 | 1.71 | 1.71 | 1.84 | 1.89 |
Ratio of net expenses to
average net assets | | 1.68 | 1.68 | 1.68 | 1.72 | 1.73 |
Ratio of net investment income to
average net assets | | .66 | .83 | .45 | .20 | .67 |
Portfolio Turnover Rate | | 103.12 | 97.03 | 105.82 | 96.39 | 80.82 |
Net Assets, end of period ($ x 1,000) | | 9,372 | 16,615 | 29,482 | 42,611 | 47,696 |
a Based on average shares outstanding.
b Exclusive of sales charge.
See notes to financial statements.
19
FINANCIAL HIGHLIGHTS (continued)
| | | | | | | | | |
| | | | |
| | Year Ended August 31, |
Class I Shares | | 2020 | 2019 | 2018 | 2017 | 2016 |
Per Share Data ($): | | | | | | |
Net asset value, beginning of period | | 34.80 | 42.33 | 40.25 | 36.16 | 38.58 |
Investment Operations: | | | | | | |
Investment income—neta | | .56 | .66 | .59 | .48 | .58 |
Net realized and unrealized gain
(loss) on investments | | (.56) | (2.68) | 5.88 | 4.73 | 2.42 |
Total from Investment Operations | | (.00)b | (2.02) | 6.47 | 5.21 | 3.00 |
Distributions: | | | | | | |
Dividends from investment
income—net | | (.66) | (.67) | (.49) | (.56) | (.49) |
Dividends from net realized gain
on investments | | (.67) | (4.84) | (3.90) | (.56) | (4.93) |
Total Distributions | | (1.33) | (5.51) | (4.39) | (1.12) | (5.42) |
Net asset value, end of period | | 33.47 | 34.80 | 42.33 | 40.25 | 36.16 |
Total Return (%) | | (.30) | (4.16) | 16.99 | 14.58 | 8.52 |
Ratios/Supplemental Data (%): | | | | | | |
Ratio of total expenses to
average net assets | | .71 | .71 | .72 | .84 | .89 |
Ratio of net expenses to
average net assets | | .68 | .68 | .68 | .72 | .73 |
Ratio of net investment income to
average net assets | | 1.67 | 1.83 | 1.44 | 1.21 | 1.67 |
Portfolio Turnover Rate | | 103.12 | 97.03 | 105.82 | 96.39 | 80.82 |
Net Assets, end of period ($ x 1,000) | | 342,508 | 452,432 | 510,020 | 751,934 | 509,485 |
a Based on average shares outstanding.
b Amount represents less than $.01 per share.
See notes to financial statements.
20
| | | | | | | | | | |
| | | | |
| | Year Ended August 31, |
Class Y Shares | | 2020 | 2019 | 2018 | 2017 | 2016 |
Per Share Data ($): | | | | | | |
Net asset value, beginning of period | | 34.74 | 42.35 | 40.25 | 36.16 | 38.58 |
Investment Operations: | | | | | | |
Investment income—neta | | .57 | .67 | .62 | .48 | .59 |
Net realized and unrealized gain
(loss) on investments | | (.56) | (2.68) | 5.87 | 4.73 | 2.41 |
Total from Investment Operations | | .01 | (2.01) | 6.49 | 5.21 | 3.00 |
Distributions: | | | | | | |
Dividends from investment
income—net | | (.67) | (.76) | (.49) | (.56) | (.49) |
Dividends from net realized gain
on investments | | (.67) | (4.84) | (3.90) | (.56) | (4.93) |
Total Distributions | | (1.34) | (5.60) | (4.39) | (1.12) | (5.42) |
Net asset value, end of period | | 33.41 | 34.74 | 42.35 | 40.25 | 36.16 |
Total Return (%) | | (.27) | (4.13) | 17.05 | 14.58 | 8.52 |
Ratios/Supplemental Data (%): | | | | | | |
Ratio of total expenses to
average net assets | | .65 | .65 | .64 | .75 | .79 |
Ratio of net expenses to
average net assets | | .65 | .65 | .64 | .71 | .73 |
Ratio of net investment income to
average net assets | | 1.70 | 1.84 | 1.50 | 1.22 | 1.67 |
Portfolio Turnover Rate | | 103.12 | 97.03 | 105.82 | 96.39 | 80.82 |
Net Assets, end of period ($ x 1,000) | | 204,901 | 240,163 | 529,206 | 177,876 | 179,629 |
a Based on average shares outstanding.
See notes to financial statements.
21
NOTES TO FINANCIAL STATEMENTS
NOTE 1—Significant Accounting Policies:
BNY Mellon Dynamic Value Fund (the “fund”) is a separate diversified series of BNY Mellon Advantage Funds, Inc. (the “Company”), which is registered under the Investment Company Act of 1940, as amended (the “Act”), as an open-end management investment company and operates as a series company currently offering nine series, including the fund. The fund’s investment objective is to seek capital appreciation. BNY Mellon Investment Adviser, Inc. (the “Adviser”), a wholly-owned subsidiary of The Bank of New York Mellon Corporation (“BNY Mellon”), serves as the fund’s investment adviser.
The Company’s Board of Directors (the “Board”) approved, effective December 31, 2019 (the “Effective Date”), the termination of the fund’s authorized Class T shares. Prior to the Effective Date, the fund did not offer such Class T shares for purchase. The authorized Class T shares were reallocated to authorized Class I shares and Class Y shares, increasing authorized Class I shares from 200 million to 250 million and increasing authorized Class Y shares from 100 million to 150 million.
BNY Mellon Securities Corporation (the “Distributor”), a wholly-owned subsidiary of the Adviser, is the distributor of the fund’s shares. The fund is authorized to issue 800 million shares of $.001 par value Common Stock. The fund currently has authorized four classes of shares: Class A (300 million shares authorized), Class C (100 million shares authorized), Class I (250 million shares authorized), and Class Y (150 million shares authorized). Class A shares generally are subject to a sales charge imposed at the time of purchase. Class C shares are subject to a contingent deferred sales charge (“CDSC”) imposed on Class C shares redeemed within one year of purchase. Class C shares automatically convert to Class A shares ten years after the date of purchase, without the imposition of a sales charge. Class I and Class Y shares are sold at net asset value per share generally to institutional investors. Other differences between the classes include the services offered to and the expenses borne by each class, the allocation of certain transfer agency costs, and certain voting rights. Income, expenses (other than expenses attributable to a specific class), and realized and unrealized gains or losses on investments are allocated to each class of shares based on its relative net assets.
The Company accounts separately for the assets, liabilities and operations of each series. Expenses directly attributable to each series are charged to that series’ operations; expenses which are applicable to all series are allocated among them on a pro rata basis.
22
The Financial Accounting Standards Board (“FASB”) Accounting Standards Codification (“ASC”) is the exclusive reference of authoritative U.S. generally accepted accounting principles (“GAAP”) recognized by the FASB to be applied by nongovernmental entities. Rules and interpretive releases of the Securities and Exchange Commission (“SEC”) under authority of federal laws are also sources of authoritative GAAP for SEC registrants. The fund is an investment company and applies the accounting and reporting guidance of the FASB ASC Topic 946 Financial Services-Investment Companies. The fund’s financial statements are prepared in accordance with GAAP, which may require the use of management estimates and assumptions. Actual results could differ from those estimates.
The Company enters into contracts that contain a variety of indemnifications. The fund’s maximum exposure under these arrangements is unknown. The fund does not anticipate recognizing any loss related to these arrangements.
(a) Portfolio valuation: The fair value of a financial instrument is the amount that would be received to sell an asset or paid to transfer a liability in an orderly transaction between market participants at the measurement date (i.e., the exit price). GAAP establishes a fair value hierarchy that prioritizes the inputs of valuation techniques used to measure fair value. This hierarchy gives the highest priority to unadjusted quoted prices in active markets for identical assets or liabilities (Level 1 measurements) and the lowest priority to unobservable inputs (Level 3 measurements).
Additionally, GAAP provides guidance on determining whether the volume and activity in a market has decreased significantly and whether such a decrease in activity results in transactions that are not orderly. GAAP requires enhanced disclosures around valuation inputs and techniques used during annual and interim periods.
Various inputs are used in determining the value of the fund’s investments relating to fair value measurements. These inputs are summarized in the three broad levels listed below:
Level 1—unadjusted quoted prices in active markets for identical investments.
Level 2—other significant observable inputs (including quoted prices for similar investments, interest rates, prepayment speeds, credit risk, etc.).
Level 3—significant unobservable inputs (including the fund’s own assumptions in determining the fair value of investments).
23
NOTES TO FINANCIAL STATEMENTS (continued)
The inputs or methodology used for valuing securities are not necessarily an indication of the risk associated with investing in those securities.
Changes in valuation techniques may result in transfers in or out of an assigned level within the disclosure hierarchy. Valuation techniques used to value the fund’s investments are as follows:
Investments in equity securities are valued at the last sales price on the securities exchange or national securities market on which such securities are primarily traded. Securities listed on the National Market System for which market quotations are available are valued at the official closing price or, if there is no official closing price that day, at the last sales price. For open short positions, asked prices are used for valuation purposes. Bid price is used when no asked price is available. Registered investment companies that are not traded on an exchange are valued at their net asset value. All of the preceding securities are generally categorized within Level 1 of the fair value hierarchy.
Securities not listed on an exchange or the national securities market, or securities for which there were no transactions, are valued at the average of the most recent bid and asked prices. These securities are generally categorized within Level 2 of the fair value hierarchy.
Fair valuing of securities may be determined with the assistance of a pricing service using calculations based on indices of domestic securities and other appropriate indicators, such as prices of relevant American Depository Receipts and futures. Utilizing these techniques may result in transfers between Level 1 and Level 2 of the fair value hierarchy.
When market quotations or official closing prices are not readily available, or are determined not to accurately reflect fair value, such as when the value of a security has been significantly affected by events after the close of the exchange or market on which the security is principally traded (for example, a foreign exchange or market), but before the fund calculates its net asset value, the fund may value these investments at fair value as determined in accordance with the procedures approved by the Board. Certain factors may be considered when fair valuing investments such as: fundamental analytical data, the nature and duration of restrictions on disposition, an evaluation of the forces that influence the market in which the securities are purchased and sold, and public trading in similar securities of the issuer or comparable issuers. These securities are either categorized within Level 2 or 3 of the fair value hierarchy depending on the relevant inputs used.
24
For securities where observable inputs are limited, assumptions about market activity and risk are used and such securities are generally categorized within Level 3 of the fair value hierarchy.
The following is a summary of the inputs used as of August 31, 2020 in valuing the fund’s investments:
| | | | | |
| | Level 1 - Unadjusted Quoted Prices | Level 2 - Other Significant Observable Inputs | Level 3 -Significant Unobservable Inputs | Total |
Assets ($) | | | | |
Investments in Securities:† | | | |
Equity Securities - Common Stocks | 1,198,084,506 | - | - | 1,198,084,506 |
Exchange-Traded Funds | 6,041,494 | - | - | 6,041,494 |
Investment Companies | 20,489,252 | - | - | 20,489,252 |
† See Statement of Investments for additional detailed categorizations, if any.
(b) Foreign Taxes: The fund may be subject to foreign taxes (a portion of which may be reclaimable) on income, stock dividends, realized and unrealized capital gains on investments or certain foreign currency transactions. Foreign taxes are recorded in accordance with the fund’s understanding of the applicable foreign tax regulations and rates that exist in the foreign jurisdictions in which the fund invests. These foreign taxes, if any, are paid by the fund and are reflected in the Statement of Operations. Foreign taxes payable or deferred as of August 31, 2020, if any, are disclosed in the fund’s Statement of Assets and Liabilities.
(c) Securities transactions and investment income: Securities transactions are recorded on a trade date basis. Realized gains and losses from securities transactions are recorded on the identified cost basis. Dividend income is recognized on the ex-dividend date and interest income, including, where applicable, accretion of discount and amortization of premium on investments, is recognized on the accrual basis.
Pursuant to a securities lending agreement with The Bank of New York Mellon, a subsidiary of BNY Mellon and an affiliate of the Adviser, the fund may lend securities to qualified institutions. It is the fund’s policy that, at origination, all loans are secured by collateral of at least 102% of the value of U.S. securities loaned and 105% of the value of foreign securities loaned. Collateral equivalent to at least 100% of the market value of securities on loan is maintained at all times. Collateral is either in the form of cash, which can be invested in certain money market mutual funds managed by the Adviser, or U.S. Government and Agency securities. The fund is entitled to receive all dividends, interest and distributions on
25
NOTES TO FINANCIAL STATEMENTS (continued)
securities loaned, in addition to income earned as a result of the lending transaction. Should a borrower fail to return the securities in a timely manner, The Bank of New York Mellon is required to replace the securities for the benefit of the fund or credit the fund with the market value of the unreturned securities and is subrogated to the fund’s rights against the borrower and the collateral. Additionally, the contractual maturity of security lending transactions are on an overnight and continuous basis. During the period ended August 31, 2020, The Bank of New York Mellon earned $11,099 from the lending of the fund’s portfolio securities, pursuant to the securities lending agreement.
(d) Affiliated issuers: Investments in other investment companies advised by the Adviser are considered “affiliated” under the Act.
(e) Risk: Certain events particular to the industries in which the fund’s investments conduct their operations, as well as general economic, political and public health conditions, may have a significant negative impact on the investee’s operations and profitability. In addition, turbulence in financial markets and reduced liquidity in equity, credit and/or fixed income markets may negatively affect many issuers, which could adversely affect the fund. Global economies and financial markets are becoming increasingly interconnected, and conditions and events in one country, region or financial market may adversely impact issuers in a different country, region or financial market. These risks may be magnified if certain events or developments adversely interrupt the global supply chain; in these and other circumstances, such risks might affect companies worldwide. Recent examples include pandemic risks related to COVID-19 and aggressive measures taken world-wide in response by governments, including closing borders, restricting international and domestic travel, and the imposition of prolonged quarantines of large populations, and by businesses, including changes to operations and reducing staff. To the extent the fund may overweight its investments in certain countries, companies, industries or market sectors, such positions will increase the fund’s exposure to risk of loss from adverse developments affecting those countries, companies, industries or sectors.
(f) Dividends and distributions to shareholders: Dividends and distributions are recorded on the ex-dividend date. Dividends from investment income-net and dividends from net realized capital gains, if any, are normally declared and paid annually, but the fund may make distributions on a more frequent basis to comply with the distribution requirements of the Internal Revenue Code of 1986, as amended (the “Code”). To the extent that net realized capital gains can be offset by capital loss carryovers, it is the policy of the fund not to distribute such
26
gains. Income and capital gain distributions are determined in accordance with income tax regulations, which may differ from GAAP.
(g) Federal income taxes: It is the policy of the fund to continue to qualify as a regulated investment company, if such qualification is in the best interests of its shareholders, by complying with the applicable provisions of the Code, and to make distributions of taxable income and net realized capital gain sufficient to relieve it from substantially all federal income and excise taxes.
As of and during the period ended August 31, 2020, the fund did not have any liabilities for any uncertain tax positions. The fund recognizes interest and penalties, if any, related to uncertain tax positions as income tax expense in the Statement of Operations. During the period ended August 31, 2020, the fund did not incur any interest or penalties.
Each tax year in the four-year period ended August 31, 2020 remains subject to examination by the Internal Revenue Service and state taxing authorities.
At August 31, 2020, the components of accumulated earnings on a tax basis were as follows: undistributed ordinary income $9,306,807, undistributed capital gains $27,753,589 and unrealized appreciation $102,451,412.
The tax character of distributions paid to shareholders during the fiscal periods ended August 31, 2020 and August 31, 2019 were as follows: ordinary income $28,709,302 and $61,100,906, and long-term capital gains $22,663,944 and $162,333,210, respectively.
NOTE 2—Bank Lines of Credit:
The fund participates with other long-term open-end funds managed by the Adviser in a $927 million unsecured credit facility led by Citibank, N.A. (the “Citibank Credit Facility”) and a $300 million unsecured credit facility provided by The Bank of New York Mellon (the “BNYM Credit Facility”), each to be utilized primarily for temporary or emergency purposes, including the financing of redemptions (each, a “Facility”). The Citibank Credit Facility is available in two tranches: (i) Tranche A is in an amount equal to $747 million and is available to all long-term open-ended funds, including the fund, and (ii) Tranche B is an amount equal to $180 million and is available only to BNY Mellon Floating Rate Income Fund, a series of BNY Mellon Investment Funds IV, Inc. Prior to March 11, 2020, the Citibank Credit Facility was $1.030 billion with Tranche A available in an amount equal to $830 million and Tranche B available in an amount equal to $200 million. In connection therewith, the fund has agreed to pay its pro
27
NOTES TO FINANCIAL STATEMENTS (continued)
rata portion of commitment fees for Tranche A of the Citibank Credit Facility and the BNYM Credit Facility. Interest is charged to the fund based on rates determined pursuant to the terms of the respective Facility at the time of borrowing.
The average amount of borrowings outstanding under the Facilities during the period ended August 31, 2020 was approximately $316,120 with a related weighted average annualized interest rate of 2.02%.
NOTE 3—Management Fee and Other Transactions with Affiliates:
(a) Pursuant to a management agreement with the Adviser the management fee is computed at the annual rate of .60% of the value of the fund’s average daily net assets and is payable monthly. The Adviser has contractually agreed, from September 1, 2019 through December 31, 2020, to waive receipt of its fees and/or assume the direct expenses of the fund, so that the direct expenses of none of the classes (excluding Rule 12b-1 Distribution Plan fees, Shareholder Services Plan fees, taxes, interest expense, brokerage commissions, commitment fees on borrowings and extraordinary expenses) exceed .68% of the value of the fund’s average daily net assets. On or after December 31, 2020, the Adviser may terminate this expense limitation agreement at any time. The reduction in expenses, pursuant to the undertaking amounted to $399,591 during the period ended August 31, 2020.
During the period ended August 31, 2020, the Distributor retained $6,262 from commissions earned on sales of the fund’s Class A shares and $28 from CDSC fees on redemptions of the fund’s Class C shares.
(b) Under the Distribution Plan adopted pursuant to Rule 12b-1 under the Act, Class C shares pay the Distributor for distributing its shares at an annual rate of .75% of the value of its average daily net assets. During the period ended August 31, 2020, Class C shares were charged $99,616 pursuant to the Distribution Plan.
(c) Under the Shareholder Services Plan, Class A and Class C shares pay the Distributor at an annual rate of .25% of the value of their average daily net assets for the provision of certain services. The services provided may include personal services relating to shareholder accounts, such as answering shareholder inquiries regarding the fund and providing reports and other information, and services related to the maintenance of shareholder accounts. The Distributor may make payments to Service Agents (securities dealers, financial institutions or other industry professionals) with respect to these services. The Distributor determines the amounts to be paid to Service Agents. During the period ended August
28
31, 2020, Class A and Class C shares were charged $1,703,349 and $33,205, respectively, pursuant to the Shareholder Services Plan.
The fund has an arrangement with the transfer agent whereby the fund may receive earnings credits when positive cash balances are maintained, which are used to offset transfer agency fees. For financial reporting purposes, the fund includes net earnings credits, if any, as an expense offset in the Statement of Operations.
The fund has an arrangement with the custodian whereby the fund will receive interest income or be charged an overdraft fees when cash balances are maintained. For financial reporting purposes, the fund includes this interest income and overdraft fees, if any, as interest income in the Statement of Operations.
The fund compensates BNY Mellon Transfer, Inc., a wholly-owned subsidiary of the Adviser, under a transfer agency agreement for providing transfer agency and cash management services for the fund. The majority of transfer agency fees are comprised of amounts paid on a per account basis, while cash management fees are related to fund subscriptions and redemptions. During the period ended August 31, 2020, the fund was charged $158,213 for transfer agency services. These fees are included in Shareholder servicing costs in the Statement of Operations.
The fund compensates The Bank of New York Mellon under a custody agreement for providing custodial services for the fund. These fees are determined based on net assets, geographic region and transaction activity. During the period ended August 31, 2020, the fund was charged $31,487 pursuant to the custody agreement.
During the period ended August 31, 2020, the fund was charged $13,975 for services performed by the Chief Compliance Officer and his staff. These fees are included in Chief Compliance Officer fees in the Statement of Operations.
The components of “Due to BNY Mellon Investment Adviser, Inc. and affiliates” in the Statement of Assets and Liabilities consist of: management fees of $609,713, Distribution Plan fees of $5,981, Shareholder Services Plan fees of $138,712, custodian fees of $10,228, Chief Compliance Officer fees of $2,273 and transfer agency fees of $32,127, which are offset against an expense reimbursement currently in effect in the amount of $16,583.
(d) Each Board member also serves as a Board member of other funds in the BNY Mellon Family of Funds complex. Annual retainer fees and attendance fees are allocated to each fund based on net assets.
29
NOTES TO FINANCIAL STATEMENTS (continued)
NOTE 4—Securities Transactions:
The aggregate amount of purchases and sales of investment securities, excluding short-term securities, during the period ended August 31, 2020, amounted to $1,341,969,593 and $1,535,768,740, respectively.
At August 31, 2020, the cost of investments for federal income tax purposes was $1,122,163,840 accordingly, accumulated net unrealized appreciation on investments was $102,451,412, consisting of $186,996,287 gross unrealized appreciation and $84,544,875 gross unrealized depreciation.
30
REPORT OF INDEPENDENT REGISTERED PUBLIC ACCOUNTING FIRM
To the Shareholders and the Board of Directors of BNY Mellon Dynamic Value Fund
Opinion on the Financial Statements
We have audited the accompanying statement of assets and liabilities of BNY Mellon Dynamic Value Fund (the “Fund”) (one of the funds constituting BNY Mellon Advantage Funds, Inc.), including the statements of investments and investments in affiliated issuers, as of August 31, 2020, and the related statement of operations for the year then ended, the statements of changes in net assets for each of the two years in the period then ended, the financial highlights for each of the five years in the period then ended and the related notes (collectively referred to as the “financial statements”). In our opinion, the financial statements present fairly, in all material respects, the financial position of the Fund (one of the funds constituting BNY Mellon Advantage Funds, Inc.) at August 31, 2020, the results of its operations for the year then ended, the changes in its net assets for each of the two years in the period then ended and its financial highlights for each of the five years in the period then ended, in conformity with U.S. generally accepted accounting principles.
Basis for Opinion
These financial statements are the responsibility of the Fund’s management. Our responsibility is to express an opinion on the Fund’s financial statements based on our audits. We are a public accounting firm registered with the Public Company Accounting Oversight Board (United States) (“PCAOB”) and are required to be independent with respect to the Fund in accordance with the U.S. federal securities laws and the applicable rules and regulations of the Securities and Exchange Commission and the PCAOB.
We conducted our audits in accordance with the standards of the PCAOB. Those standards require that we plan and perform the audit to obtain reasonable assurance about whether the financial statements are free of material misstatement, whether due to error or fraud. The Fund is not required to have, nor were we engaged to perform, an audit of the Fund’s internal control over financial reporting. As part of our audits, we are required to obtain an understanding of internal control over financial reporting, but not for the purpose of expressing an opinion on the effectiveness of the Fund’s internal control over financial reporting. Accordingly, we express no such opinion.
Our audits included performing procedures to assess the risks of material misstatement of the financial statements, whether due to error or fraud, and performing procedures that respond to those risks. Such procedures included examining, on a test basis, evidence regarding the amounts and disclosures in the financial statements. Our procedures included confirmation of securities owned as of August 31, 2020, by correspondence with the custodian and others or by other appropriate auditing procedures where replies from others were not received. Our audits also included evaluating the accounting principles used and significant estimates made by management, as well as evaluating the overall presentation of the financial statements. We believe that our audits provide a reasonable basis for our opinion.

We have served as the auditor of one or more investment companies in the BNY Mellon Family of Funds since at least 1957, but we are unable to determine the specific year.
New York, New York
October 27, 2020
31
IMPORTANT TAX INFORMATION (Unaudited)
For federal tax purposes, the fund hereby reports 100% of the ordinary dividends paid during the fiscal year ended August 31, 2020 as qualifying for the corporate dividends received deduction. Also certain dividends paid by the fund may be subject to a maximum tax rate of 15%, as provided for by the Jobs and Growth Tax Relief Reconciliation Act of 2003. Of the distributions paid during the fiscal year, $28,709,302 represents the maximum amount that may be considered qualified dividend income. The fund also hereby reports $.1051 per share as a short-term capital gain distribution and $.5660 per share as a long-term capital gain distribution paid on December 10, 2019. Shareholders will receive notification in early 2021 of the percentage applicable to the preparation of their 2020 income tax returns.
32
LIQUIDITY RISK MANAGEMENT PROGRAM (Unaudited)
Effective June 1, 2019, the fund adopted a liquidity risk management program (the “Liquidity Risk Management Program”) pursuant to the requirements of Rule 22e-4 under the Investment Company Act of 1940, as amended. Rule 22e-4 requires registered open-end funds, including mutual funds and exchange-traded funds but not money market funds, to establish liquidity risk management programs in order to effectively manage fund liquidity and shareholder redemptions. The rule is designed to mitigate the risk that a fund could not meet redemption requests without significantly diluting the interests of remaining investors.
The rule requires the funds to assess, manage and review their liquidity risk at least annually considering applicable factors such as investment strategy and liquidity during normal and foreseeable stressed conditions, including whether the strategy is appropriate for an open-end fund and whether the fund has a relatively concentrated portfolio or large positions in particular issuers. The fund must also assess its use of borrowings and derivatives, short-term and long-term cash flow projections in normal and stressed conditions, holdings of cash and cash equivalents, and borrowing arrangements and other funding sources.
The rule also requires the fund to classify its investments as highly liquid, moderately liquid, less liquid or illiquid based on the number of days the fund expects it would take to liquidate the investment, and to review these classifications at least monthly or more often under certain conditions. The periods range from three or fewer business days for a highly liquid investment to greater than seven calendar days for settlement of a less liquid investment. Illiquid investments are those a fund does not expect to be able to sell or dispose of within seven calendar days without significantly changing the market value. The fund is prohibited from acquiring an investment if, after the acquisition, its holdings of illiquid assets will exceed 15% of its net assets. In addition, if a fund permits redemptions in-kind, the rule requires the fund to establish redemption in-kind policies and procedures governing how and when it will engage in such redemptions.
Pursuant to the rule’s requirements, the Liquidity Risk Management Program has been reviewed and approved by the fund’s board. Furthermore, the board has received a written report prepared by the Program’s Administrator that addresses the operation of the Program, assesses its adequacy and effectiveness and describes any material changes made to the Program.
Assessment of Program
In the opinion of the Program Administrator, the Program approved by the fund board continues to be adequate for the fund and the Program has been implemented effectively. The Program Administrator has monitored the fund’s liquidity risk and the liquidity classification of the securities held by the fund and has determined that the Program is operating effectively.
During the period from June 1, 2019 to March 31, 2020, there were no material changes to the Program and no material liquidity events that impacted the fund. During the period, the fund held sufficient highly liquid assets to meet fund redemptions.
33
LIQUIDITY RISK MANAGEMENT PROGRAM (Unaudited) (continued)
Under normal expected foreseeable fund redemption forecasts and foreseeable stressed fund redemption forecasts, the Program Administrator believes that the fund maintains sufficient highly liquid assets to meet expected fund redemptions.
34
BOARD MEMBERS INFORMATION (Unaudited)
INDEPENDENT BOARD MEMBERS
Joseph S. DiMartino (76)
Chairman of the Board (1995)
Principal Occupation During Past 5 Years:
· Director or Trustee of funds in the BNY Mellon Family of Funds and certain other entities (as described in the fund’s Statement of Additional Information) (1995-Present)
Other Public Company Board Memberships During Past 5 Years:
· CBIZ, Inc., a public company providing professional business services, products and solutions, Director (1997-Present)
No. of Portfolios for which Board Member Serves: 111
———————
Peggy C. Davis (77)
Board Member (2006)
Principal Occupation During Past 5 Years:
· Shad Professor of Law, New York University School of Law (1983-present)
No. of Portfolios for which Board Member Serves: 39
———————
Gina D. France (62)
Board Member (2019)
Principal Occupation During Past 5 Years:
· Founder, President and Chief Executive Officer, France Strategic Partners, a strategy and advisory firm serving corporate clients across the United States (2003 –Present)
· Corporate Director and Trustee (2004 – Present)
Other Public Company Board Memberships During Past 5 Years:
· Huntington Bancshares, a bank holding company headquartered in Columbus, Ohio, Director (2016 – Present)
· Cedar Fair, L.P., a publicly-traded partnership that owns and operates amusement parks and hotels in the U.S. and Canada, Director (2011 – Present)
· CBIZ, Inc., a public company providing professional business services, products and solutions, Director (2015 – Present)
· Baldwin Wallace University, Trustee (2013- 2019)
· FirstMerit Corporation, a diversified financial services company, Director (2004 – 2016)
No. of Portfolios for which Board Member Serves: 25
———————
35
BOARD MEMBERS INFORMATION (Unaudited) (continued)
INDEPENDENT BOARD MEMBERS (continued)
Joan Gulley (72)
Board Member (2017)
Principal Occupation During Past 5 Years:
· PNC Financial Services Group, Inc.(1993-2014), Executive Vice President and Chief Human Resources Officer and Executive Committee Member (2008-2014)
· Director, Nantucket Library (2015-Present)
No. of Portfolios for which Board Member Serves: 44
———————
Robin A. Melvin (56)
Board Member (2012)
Principal Occupation During Past 5 Years:
· Co-chairman, Mentor Illinois, a non-profit organization dedicated to increasing the quantity and quality of mentoring services in Illinois; (2014-Present); Board member (2013-Present)
No. of Portfolios for which Board Member Serves: 89
———————
Once elected all Board Members serve for an indefinite term, but achieve Emeritus status upon reaching age 80. The address of the Board Members and Officers is c/o BNY Mellon Investment Adviser, Inc. 240 Greenwich Street, New York, New York 10286. Additional information about the Board Members is available in the fund’s Statement of Additional Information which can be obtained from the Adviser free of charge by calling this toll free number: 1-800-373-9387.
David P. Feldman, Emeritus Board Member
James F. Henry, Emeritus Board Member
Ehud Houminer, Emeritus Board Member
Lynn Martin, Emeritus Board Member
Dr. Martin Peretz, Emeritus Board Member
Philip L. Toia, Emeritus Board Member
36
OFFICERS OF THE FUND (Unaudited)
RENEE LAROCHE-MORRIS, President since May 2019.
President and a director of BNY Mellon Investment Adviser, Inc. since January 2018. She is an officer of 62 investment companies (comprised of 111 portfolios) managed by the Adviser. She is 49 years old and has been an employee of BNY Mellon since 2003.
JAMES WINDELS, Treasurer since November 2001.
Director-BNY Mellon Fund Administration, and an officer of 64 investment companies (comprised of 142 portfolios) managed by the Adviser or an affiliate of the Adviser. He is 61 years old and has been an employee of the Adviser since April 1985.
BENNETT A. MACDOUGALL, Chief Legal Officer since October 2015.
Chief Legal Officer of the Adviser and Associate General Counsel and Managing Director of BNY Mellon since June 2015; Director and Associate General Counsel of Deutsche Bank–Asset & Wealth Management Division from June 2005 to June 2015, and as Chief Legal Officer of Deutsche Investment Management Americas Inc. from June 2012 to May 2015. He is an officer of 64 investment companies (comprised of 142 portfolios) managed by the Adviser or an affiliate of the Adviser. He is 48 years old and has been an employee of the Adviser since June 2015.
DAVID DIPETRILLO, Vice President since May 2019.
Head of North America Product, BNY Mellon Investment Management since January 2018, Director of Product Strategy, BNY Mellon Investment Management from January 2016 to December 2017; Head of US Retail Product and Channel Marketing, BNY Mellon Investment Management from January 2014 to December 2015. He is an officer of 63 investment companies (comprised of 119 portfolios) managed by the Adviser or an affiliate of the Adviser. He is 42 years old and has been an employee of BNY Mellon since 2005.
JAMES BITETTO, Vice President since August 2005 and Secretary since February 2018.
Senior Managing Counsel of BNY Mellon since December 2019; Managing Counsel of BNY Mellon from April 2014 to December 2019; Secretary of the Adviser, and an officer of 64 investment companies (comprised of 142 portfolios) managed by the Adviser or an affiliate of the Adviser. He is 54 years old and has been an employee of the Adviser since December 1996.
SONALEE CROSS, Vice President and Assistant Secretary since March 2018.
Counsel of BNY Mellon since October 2016; Associate at Proskauer Rose LLP from April 2016 to September 2016; Attorney at EnTrust Capital from August 2015 to February 2016; Associate at Sidley Austin LLP from September 2013 to August 2015. She is an officer of 64 investment companies (comprised of 142 portfolios) managed by the Adviser or an affiliate of the Adviser. She is 32 years old and has been an employee of the Adviser since October 2016.
DEIRDRE CUNNANE, Vice President and Assistant Secretary since March 2019.
Counsel of BNY Mellon since August 2018; Senior Regulatory Specialist at BNY Mellon Investment Management Services from February 2016 to August 2018; Trustee Associate at BNY Mellon Trust Company (Ireland) Limited from August 2013 to February 2016. She is an officer of 64 investment companies (comprised of 142 portfolios) managed by the Adviser or an affiliate of the Adviser. She is 30 years old and has been an employee of the Adviser since August 2018.
SARAH S. KELLEHER, Vice President and Assistant Secretary since April 2014.
Managing Counsel of BNY Mellon since December 2017, Senior Counsel of BNY Mellon from March 2013 to December 2017. She is an officer of 64 investment companies (comprised of 142 portfolios) managed by the Adviser or an affiliate of the Adviser. She is 44 years old and has been an employee of the Adviser since March 2013.
JEFF PRUSNOFSKY, Vice President and Assistant Secretary since August 2005.
Senior Managing Counsel of BNY Mellon, and an officer of 64 investment companies (comprised of 142 portfolios) managed by the Adviser or an affiliate of the Adviser. He is 55 years old and has been an employee of the Adviser since October 1990.
AMANDA QUINN, Vice President and Assistant Secretary since March 2020.
Counsel of BNY Mellon since June 2019; Regulatory Administration Manager at BNY Mellon Investment Management Services from September 2018 to May 2019; Senior Regulatory Specialist at BNY Mellon Investment Management Services from April 2015 to August 2018. She is an officer of 64 investment companies (comprised of 142 portfolios) managed by the Adviser or an affiliate of the Adviser. She is 35 years old and has been an employee of the Adviser since June 2019.
37
OFFICERS OF THE FUND (Unaudited) (continued)
PETER M. SULLIVAN, Vice President and Assistant Secretary since March 2019.
Managing Counsel of BNY Mellon since March 2009, Senior Counsel of BNY Mellon from April 2004 to March 2009, and an officer of 64 investment companies (comprised of 142 portfolios) managed by the Adviser or an affiliate of the Adviser. He is 52 years old and has been an employee of the Adviser since January 2019.
NATALYA ZELENSKY, Vice President and Assistant Secretary since March 2017.
Managing Counsel of BNY Mellon since December 2019; Counsel of BNY Mellon from May 2016 to December 2019; Attorney at Wildermuth Endowment Strategy Fund/Wildermuth Advisory, LLC from November 2015 to May 2016 and Assistant General Counsel at RCS Advisory Services from July 2014 to November 2015. She is an officer of 64 investment companies (comprised of 142 portfolios) managed by the Adviser or an affiliate of the Adviser. She is 35 years old and has been an employee of the Adviser since May 2016.
GAVIN C. REILLY, Assistant Treasurer since December 2005.
Tax Manager-BNY Mellon Fund Administration, and an officer of 64 investment companies (comprised of 142 portfolios) managed by the Adviser or an affiliate of the Adviser. He is 52 years old and has been an employee of the Adviser since April 1991.
ROBERT S. ROBOL, Assistant Treasurer since August 2005.
Senior Accounting Manager-BNY Mellon Fund Administration, and an officer of 64 investment companies (comprised of 142 portfolios) managed by the Adviser or an affiliate of the Adviser. He is 56 years old and has been an employee of the Adviser since October 1988.
ROBERT SALVIOLO, Assistant Treasurer since July 2007.
Senior Accounting Manager–BNY Mellon Fund Administration, and an officer of 64 investment companies (comprised of 142 portfolios) managed by the Adviser or an affiliate of the Adviser. He is 53 years old and has been an employee of the Adviser since June 1989.
ROBERT SVAGNA, Assistant Treasurer since December 2002.
Senior Accounting Manager–BNY Mellon Fund Administration, and an officer of 64 investment companies (comprised of 142 portfolios) managed by the Adviser or an affiliate of the Adviser. He is 53 years old and has been an employee of the Adviser since November 1990.
JOSEPH W. CONNOLLY, Chief Compliance Officer since October 2004.
Chief Compliance Officer of the Adviser, the BNY Mellon Family of Funds and BNY Mellon Funds Trust (63 investment companies, comprised of 134 portfolios). He is 63 years old and has served in various capacities with the Adviser since 1980, including manager of the firm’s Fund Accounting Department from 1997 through October 2001.
CARIDAD M. CAROSELLA, Anti-Money Laundering Compliance Officer since January 2016.
Anti-Money Laundering Compliance Officer of the BNY Mellon Family of Funds and BNY Mellon Funds Trust since January 2016; from May 2015 to December 2015, Interim Anti-Money Laundering Compliance Officer of the BNY Mellon Family of Funds and BNY Mellon Funds Trust and the Distributor; from January 2012 to May 2015, AML Surveillance Officer of the Distributor. She is an officer of 57 investment companies (comprised of 135 portfolios) managed by the Adviser or an affiliate of the Adviser. She is 52 years old and has been an employee of the Distributor since 1997.
38
This page intentionally left blank.
39
This page intentionally left blank.
40
This page intentionally left blank.
41
BNY Mellon Dynamic Value Fund
240 Greenwich Street
New York, NY 10286
Adviser
BNY Mellon Investment Adviser, Inc.
240 Greenwich Street
New York, NY 10286
Custodian
The Bank of New York Mellon
240 Greenwich Street
New York, NY 10286
Transfer Agent &
Dividend Disbursing Agent
BNY Mellon Transfer, Inc.
240 Greenwich Street
New York, NY 10286
Distributor
BNY Mellon Securities Corporation
240 Greenwich Street
New York, NY 10286
| | |
Ticker Symbols: | Class A:DAGVX Class C:DCGVX Class I:DRGVX Class Y:DRGYX |
Telephone Call your financial representative or 1-800-373-9387
Mail The BNY Mellon Family of Funds, 144 Glenn Curtiss Boulevard, Uniondale, NY 11556-0144
E-mail Send your request to info@bnymellon.com
Internet Information can be viewed online or downloaded at www.bnymellonim.com/us
The fund files its complete schedule of portfolio holdings with the Securities and Exchange Commission (“SEC”) for the first and third quarters of each fiscal year on Form N-PORT. The fund’s Forms N-PORT are available on the SEC’s website at www.sec.gov.
A description of the policies and procedures that the fund uses to determine how to vote proxies relating to portfolio securities and information regarding how the fund voted these proxies for the most recent 12-month period ended June 30 is available at www.bnymellonim.com/us and on the SEC’s website at www.sec.gov and without charge, upon request, by calling 1-800-373-9387.
| | |
© 2020 BNY Mellon Securities Corporation
0257AR0820 | 
|
BNY Mellon Opportunistic Midcap Value Fund
| |
ANNUAL REPORT August 31, 2020 |
| |
Save time. Save paper. View your next shareholder report online as soon as it’s available. Log into www.bnymellonim.com/us and sign up for eCommunications. It’s simple and only takes a few minutes. |
| |
The views expressed in this report reflect those of the portfolio manager(s) only through the end of the period covered and do not necessarily represent the views of BNY Mellon Investment Adviser, Inc. or any other person in the BNY Mellon Investment Adviser, Inc. organization. Any such views are subject to change at any time based upon market or other conditions and BNY Mellon Investment Adviser, Inc. disclaims any responsibility to update such views. These views may not be relied on as investment advice and, because investment decisions for a fund in the BNY Mellon Family of Funds are based on numerous factors, may not be relied on as an indication of trading intent on behalf of any fund in the BNY Mellon Family of Funds. |
| |
Not FDIC-Insured • Not Bank-Guaranteed • May Lose Value |
Contents
THE FUND
FOR MORE INFORMATION
Back Cover
| | | | |
| |
BNY Mellon Opportunistic Midcap Value Fund
| | The Fund |
A LETTER FROM THE PRESIDENT OF BNY MELLON INVESTMENT ADVISER, INC.
Dear Shareholder:
We are pleased to present this annual report for BNY Mellon Opportunistic Midcap Value Fund, covering the 12-month period from September 1, 2019 through August 31, 2020. For information about how the fund performed during the reporting period, as well as general market perspectives, we provide a Discussion of Fund Performance on the pages that follow.
Early in the reporting period, positive investor sentiment fueled an equity rally. Accommodative rate policies from the U.S. Federal Reserve (the “Fed”) and progress towards a U.S./China trade deal stoked optimism about future economic growth prospects. As the calendar year turned over, this optimism turned to concern, as COVID-19 began to spread across China, adjacent areas of the Pacific Rim and parts of Europe. When the virus spread throughout the U.S. in March 2020, stocks began to show signs of volatility and posted historic losses during the month. Investor angst over the possible economic impact of a widespread quarantine worked to depress equity valuations. Global central banks and governments worked to enact emergency stimulus measures to support their respective economies and equity valuations began to rebound, trending upward for the remainder of the period.
In fixed-income markets, interest rates were heavily influenced by changes in Fed policy and investor concern over COVID-19. In 2019, as stocks rallied in response to Fed rate cuts, risk-asset valuations also rose while Treasuries lagged. When COVID-19 began to emerge, a flight to quality ensued and Treasury rates fell significantly. March 2020 brought extreme volatility and risk-asset spread widening. The Fed cut rates twice in March, resulting in an overnight lending target rate of nearly zero, and the government launched a large stimulus package; many governments and central banks around the globe followed suit. At their meeting in August 2020, the Fed confirmed their commitment to a “lower-for-longer” rate policy.
We believe the near-term outlook for the U.S. will be challenging, as the country curbs the spread of COVID-19. However, we are confident that that ongoing central bank and government policy responses can continue to support economic progress. As always, we will monitor relevant data for any signs of a change. We encourage you to discuss the risks and opportunities in today’s investment environment with your financial advisor.
Thank you for your continued confidence and support.
Sincerely,

Renee LaRoche-Morris
President
BNY Mellon Investment Adviser, Inc.
September 15, 2020
2
DISCUSSION OF FUND PERFORMANCE (Unaudited)
For the period from September 1, 2019 through August 31, 2020, as provided by R. Patrick Kent, lead portfolio manager and James Boyd portfolio manager.
Market and Fund Performance Overview
For the 12-month period ended August 31, 2020, BNY Mellon Opportunistic Midcap Value Fund’s Class A shares produced a total return of 11.34%, Class C shares returned 10.46%, Class I shares returned 11.55% and Class Y shares returned 11.71%.1 In comparison, the fund’s benchmark, the Russell Midcap®Value Index (the “Index”), produced a -1.30% total return for the same period.2
Mid-cap stocks lost ground over the reporting period amid uncertainties about the COVID-19 virus. But the fund produced higher returns than the Index due to favorable asset allocation and security selection.
The Fund’s Investment Approach
The fund seeks to surpass the performance of the Index. Effective January 12, 2018, the fund normally invests at least 80% of its net assets, plus any borrowings for investment purposes, in equity securities of mid-cap companies with market capitalizations between $1 billion and $25 billion at the time of purchase. Because the fund may continue to hold a security whose market capitalization grows, a substantial portion of the fund’s holdings can have market capitalizations in excess of $25 billion at any given time.
The fund’s portfolio managers identify potential investments through extensive fundamental and quantitative research. The fund focuses on individual stock selection (a “bottom-up” approach), emphasizing three key factors: relative value, business health and business momentum.
The fund’s portfolio managers use an opportunistic value approach to identify stocks whose current market prices trade at a large discount to their intrinsic value, as calculated by the portfolio managers. The opportunistic value style attempts to benefit from valuation inefficiencies and underappreciated, fundamental prospects present in the marketplace. The portfolio managers use mid-cycle estimates, growth prospects, the identification of a revaluation catalyst and competitive advantages as some of the factors in the valuation assessment.
Stocks Rebound from Pandemic
The reporting period began with the market continuing to benefit from a shift in Federal Reserve (the “Fed”) policy, which had been prompted by concerns about economic growth and corporate earnings. Late in 2019, the Fed implemented three rate cuts, as trade tensions and other geopolitical concerns appeared to be weighing on economic growth. Other major central banks also enacted supportive policies. Stocks also benefited from the announcement of a “Phase One” trade deal between the U.S. and China, and from the approval of the new U.S.-Mexico-Canada Trade Agreement.
Early in 2020, developed markets experienced a correction amid growing concerns about the COVID-19 virus, erasing the gain that occurred late in 2019. As a result, the Fed reduced the federal funds rate twice in March, bringing the target rate down to 0-0.25%. In addition, the
3
DISCUSSION OF FUND PERFORMANCE (Unaudited) (continued)
Fed and other central banks initiated various programs to ease liquidity concerns in certain markets, and government authorities introduced programs to keep small businesses afloat. Steps were also taken to provide relief to employees who had lost their jobs as a result of government-mandated business shutdowns.
In the second half of the reporting period, the economy began to show signs of recovery. Retail sales rebounded, and the outlook for manufacturing also improved dramatically. Job creation also surged, beating economists’ expectations. Unemployment dropped sharply, and markets began to rebound as relief programs took effect, government shutdowns began to ease, and hope for a COVID-19 vaccine or effective therapy took hold.
Asset Allocation and Security Selection Drove Performance
The fund outperformed the Index over the reporting period as a result of favorable asset allocation and security selection. In the materials sector, an overweight position was beneficial, as were positions in Newmont Mining and Freeport-McMoran, mining companies that were supported by higher prices. In the information technology sector, holdings in the software industry, including DocuSign, an electronic signature company, and Nuance Communications, a health care, voice recognition company, proved beneficial. In the semiconductor industry, shares of Teradyne and Skyworks Solutions, gained on strong demand. In the communication services sector, a position in Activision Blizzard, a videogame company, gained as a result of strong demand during government lockdowns, and shares of Zillow Group, a real estate information company, rose as a result of a surge in home buying. In the industrials sector, Clarivate Analytics, a provider of data related to intellectual property, performed well, and Equifax, a credit reporting company, gained on strong demand related to homebuying. In the construction and engineering industry, Quanta Services, a provider of services to protect public power grids, benefited from strong demand related to the effect of forest fires.
On the negative side, selections in the health care and utilities sectors detracted from the fund’s performance. The primary detractors were in the health care sector, where shares of Sage Therapeutics and Jazz Pharmaceuticals declined. A position in the utilities sector, Edison International, also was slightly detrimental to fund performance.
Despite Continued Uncertainty, Optimism about 2021
Although stocks have experienced a strong recovery since bottoming in the first quarter of 2020, the pace of economic recovery is uncertain, and another consolidation in the market is possible. Nevertheless, we are optimistic about 2021. Supportive monetary policy is also likely to benefit this segment of the equity universe. Although small- and midcap stocks have lagged, we believe once the recovery is on more solid footing and a vaccine or therapeutic treatment is widely available, they may benefit more than other segments of the market.
4
Companies with higher operating leverage may also benefit, especially as the economy continues to recover. The team believes the current market volatility may be laying the foundation for one of the most favorable investment environments for this segment in the last several years.
September 15, 2020
1 Total return includes reinvestment of dividends and any capital gains paid and does not take into consideration the maximum initial sales charge in the case of Class A shares, or the applicable contingent deferred sales charge imposed on redemptions in the case of Class C shares. Had these charges been reflected, returns would have been lower. Past performance is no guarantee of future results. Share price and investment return fluctuate such that upon redemption, fund shares may be worth more or less than their original cost.
2 Source: Lipper Inc. — The Russell Midcap® Value Index measures the performance of the mid-cap value segment of the U.S. equity universe. It includes those Russell Midcap® Index companies that are considered more value-oriented relative to the overall market, as defined by Russell’s leading style methodology. The Index is constructed to provide a comprehensive and unbiased barometer of the mid-cap value market. The Index is completely reconstituted annually to ensure larger stocks do not distort the performance and characteristics of the true mid-cap value market. Investors cannot invest directly in any index.
Please note: the position in any security highlighted with italicized typeface was sold during the reporting period.
Equities are subject generally to market, market sector, market liquidity, issuer and investment style risks, among other factors, to varying degrees, all of which are more fully described in the fund’s prospectus.
Stocks of small- and/or mid-cap companies often experience sharper price fluctuations than stocks of large-cap companies.
Recent market risks include pandemic risks related to COVID-19. The effects of COVID-19 have contributed to increased volatility in global markets and will likely affect certain countries, companies, industries and market sectors more dramatically than others. To the extent the fund may overweight its investments in certain countries, companies, industries or market sectors, such positions will increase the fund’s exposure to risk of loss from adverse developments affecting those countries, companies, industries or sectors.
5
FUND PERFORMANCE (Unaudited)
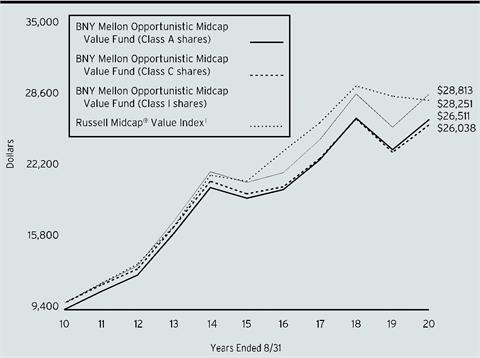
Comparison of change in value of a $10,000 investment in Class A shares, Class C shares, and Class I shares of BNY Mellon Opportunistic Midcap Value Fund with a hypothetical investment of $10,000 in the Russell Midcap® Value Index (the “Index”)
† Source: Lipper Inc.
Past performance is not predictive of future performance.
The above graph compares a hypothetical $10,000 investment made in each of the Class A shares, Class C shares, and Class I shares of BNY Mellon Opportunistic Midcap Value Fund on 8/31/10 to a hypothetical investment of $10,000 made in the Index on that date. All dividends and capital gain distributions are reinvested.
The fund’s performance shown in the line graph above takes into account the maximum initial sales charge on Class A shares and all other applicable fees and expenses on Class A shares, Class C shares, and Class I shares. The Index measures the performance of the mid-cap value segment of the U.S. equity universe. It includes those Russell Midcap® Index companies that are considered more value-oriented relative to the overall market as defined by Russell’s leading style methodology. The Index is constructed to provide a comprehensive and unbiased barometer of the mid-cap value market. The Index is completely reconstituted annually to ensure larger stocks do not distort the performance and characteristics of the true mid-cap value market. Unlike a mutual fund, the Index is not subject to charges, fees and other expenses. Investors cannot invest directly in any index. Further information relating to fund performance, including expense reimbursements, if applicable, is contained in the Financial Highlights section of the prospectus and elsewhere in this report.
6
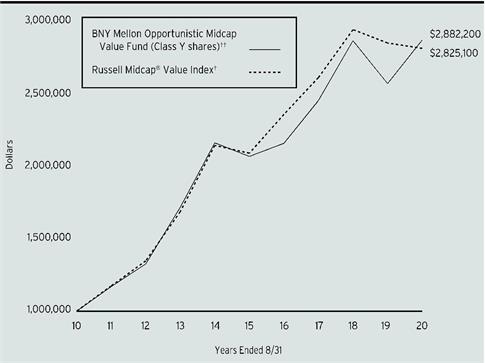
Comparison of change in value of a $1,000,000 investment in Class Y shares of BNY Mellon Opportunistic Midcap Value Fund with a hypothetical investment of $1,000,000 in the Russell Midcap® Value Index (the “Index”)
† Source: Lipper Inc.
†† The total return figures presented for Class Y shares of the fund reflect the performance of the fund’s Class A shares for the period prior to 7/1/13 (the inception date for Class Y shares), not reflecting the applicable sales charges for Class A shares.
Past performance is not predictive of future performance.
The above graph compares a hypothetical $1,000,000 investment made in Class Y shares of BNY Mellon Opportunistic Midcap Value Fund on 8/31/10 to a hypothetical investment of $1,000,000 made in the Index on that date. All dividends and capital gain distributions are reinvested.
The fund’s performance shown in the line graph above takes into account all applicable fees and expenses on Class Y shares. The Index measures the performance of the mid-cap value segment of the U.S. equity universe. It includes those Russell Midcap® Index companies that are considered more value-oriented relative to the overall market as defined by Russell’s leading style methodology. The Index is constructed to provide a comprehensive and unbiased barometer of the mid-cap value market. The Index is completely reconstituted annually to ensure larger stocks do not distort the performance and characteristics of the true mid-cap value market. Unlike a mutual fund, the Index is not subject to charges, fees and other expenses. Investors cannot invest directly in any index. Further information relating to fund performance, including expense reimbursements, if applicable, is contained in the Financial Highlights section of the prospectus and elsewhere in this report.
7
FUND PERFORMANCE (Unaudited) (continued)
| | | | | | | |
Average Annual Total Returns as of 8/31/2020 | |
| | Inception
Date | 1 Year | 5 Years | 10 Years | |
Class A shares | | | | | |
with maximum sales charge (5.75%) | 9/29/95 | 4.93% | 5.15% | 10.24% | |
without sales charge | 9/29/95 | 11.34% | 6.40% | 10.90% | |
Class C shares | | | | | |
with applicable redemption charge † | 5/30/08 | 9.46% | 5.60% | 10.04% | |
without redemption | 5/30/08 | 10.46% | 5.60% | 10.04% | |
Class I shares | 5/30/08 | 11.55% | 6.68% | 11.16% | |
Class Y shares | 7/1/13 | 11.71% | 6.79% | 11.17%†† | |
Russell Midcap® Value Index | | -1.30% | 6.14% | 10.94% | |
† The maximum contingent deferred sales charge for Class C shares is 1% for shares redeemed within one year of the date of purchase.
†† The total return performance figures presented for Class Y shares of the fund reflect the performance of the fund’s Class A shares for the period prior to 7/1/13 (the inception date for Class Y shares), not reflecting the applicable sales charges for Class A shares.
The performance data quoted represents past performance, which is no guarantee of future results. Share price and investment return fluctuate and an investor’s shares may be worth more or less than original cost upon redemption. Current performance may be lower or higher than the performance quoted. Go to www.bnymellonim.com/us for the fund’s most recent month-end returns.
The fund’s performance shown in the graphs and table does not reflect the deduction of taxes that a shareholder would pay on fund distributions or the redemption of fund shares. In addition to the performance of Class A shares shown with and without a maximum sales charge, the fund’s performance shown in the table takes into account all other applicable fees and expenses on all classes.
8
UNDERSTANDING YOUR FUND’S EXPENSES (Unaudited)
As a mutual fund investor, you pay ongoing expenses, such as management fees and other expenses. Using the information below, you can estimate how these expenses affect your investment and compare them with the expenses of other funds. You also may pay one-time transaction expenses, including sales charges (loads) and redemption fees, which are not shown in this section and would have resulted in higher total expenses. For more information, see your fund’s prospectus or talk to your financial adviser.
Review your fund’s expenses
The table below shows the expenses you would have paid on a $1,000 investment in BNY Mellon Opportunistic Midcap Value Fund from March 1, 2020 to August 31, 2020. It also shows how much a $1,000 investment would be worth at the close of the period, assuming actual returns and expenses.
| | | | | | | |
Expenses and Value of a $1,000 Investment | |
Assume actual returns for the six months ended August 31, 2020 | |
| | | | | | |
| | Class A | Class C | Class I | Class Y | |
Expense paid per $1,000† | $6.30 | $10.52 | $5.25 | $4.51 | |
Ending value (after expenses) | $1,107.70 | $1,102.90 | $1,108.60 | $1,109.30 | |
COMPARING YOUR FUND’S EXPENSES
WITH THOSE OF OTHER FUNDS (Unaudited)
Using the SEC’s method to compare expenses
The Securities and Exchange Commission (“SEC”) has established guidelines to help investors assess fund expenses. Per these guidelines, the table below shows your fund’s expenses based on a $1,000 investment, assuming a hypothetical 5% annualized return. You can use this information to compare the ongoing expenses (but not transaction expenses or total cost) of investing in the fund with those of other funds. All mutual fund shareholder reports will provide this information to help you make this comparison. Please note that you cannot use this information to estimate your actual ending account balance and expenses paid during the period.
| | | | | | | |
Expenses and Value of a $1,000 Investment | |
Assuming a hypothetical 5% annualized return for the six months ended August 31, 2020 | |
| | | | | | |
| | Class A | Class C | Class I | Class Y | |
Expense paid per $1,000† | $6.04 | $10.08 | $5.03 | $4.32 | |
Ending value (after expenses) | $1,019.15 | $1,015.13 | $1,020.16 | $1,020.86 | |
†Expenses are equal to the fund’s annualized expense ratio of 1.19% for Class A, 1.99% for Class C, .99% for Class I and .85% for Class Y, multiplied by the average account value over the period, multiplied by 184/366 (to reflect the one-half year period). |
9
STATEMENT OF INVESTMENTS
August 31, 2020
| | | | | | | | |
| |
Description | | | | Shares | | Value ($) | |
Common Stocks - 97.2% | | | | | |
Banks - 2.0% | | | | | |
Popular | | | | 144,494 | | 5,352,058 | |
TCF Financial | | | | 123,592 | | 3,322,153 | |
| | | | | 8,674,211 | |
Capital Goods - 3.7% | | | | | |
Owens Corning | | | | 90,149 | | 6,097,678 | |
Quanta Services | | | | 190,921 | | 9,784,701 | |
| | | | | 15,882,379 | |
Commercial & Professional Services - 6.1% | | | | | |
Clarivate | | | | 443,744 | a | 13,063,823 | |
Equifax | | | | 79,995 | | 13,460,759 | |
| | | | | 26,524,582 | |
Consumer Durables & Apparel - 4.6% | | | | | |
D.R. Horton | | | | 122,412 | | 8,736,544 | |
Hasbro | | | | 65,230 | | 5,149,256 | |
Skechers U.S.A, CI. A | | | | 207,411 | a | 6,191,218 | |
| | | | | 20,077,018 | |
Consumer Services - 1.2% | | | | | |
Norwegian Cruise Line Holdings | | | | 310,376 | a,b | 5,310,533 | |
Diversified Financials - 3.6% | | | | | |
Ares Management, Cl. A | | | | 126,348 | | 5,110,777 | |
Capital One Financial | | | | 46,746 | | 3,226,876 | |
Voya Financial | | | | 139,213 | b | 7,226,547 | |
| | | | | 15,564,200 | |
Energy - 2.4% | | | | | |
Parsley Energy, Cl. A | | | | 243,246 | | 2,614,895 | |
Pioneer Natural Resources | | | | 30,031 | | 3,121,122 | |
Valero Energy | | | | 89,287 | | 4,695,603 | |
| | | | | 10,431,620 | |
Food, Beverage & Tobacco - 3.9% | | | | | |
Conagra Brands | | | | 261,355 | | 10,025,578 | |
Ingredion | | | | 84,707 | | 6,813,831 | |
| | | | | 16,839,409 | |
Health Care Equipment & Services - 7.4% | | | | | |
Alcon | | | | 123,854 | a,b | 7,101,788 | |
Centene | | | | 93,299 | a | 5,721,095 | |
Encompass Health | | | | 65,086 | | 4,246,211 | |
Laboratory Corp. of America Holdings | | | | 43,245 | a | 7,600,309 | |
Zimmer Biomet Holdings | | | | 51,914 | | 7,313,644 | |
| | | | | 31,983,047 | |
Insurance - 1.7% | | | | | |
Arch Capital Group | | | | 102,802 | a | 3,242,375 | |
10
| | | | | | | | |
| |
Description | | | | Shares | | Value ($) | |
Common Stocks - 97.2% (continued) | | | | | |
Insurance - 1.7% (continued) | | | | | |
Willis Towers Watson | | | | 19,378 | | 3,982,760 | |
| | | | | 7,225,135 | |
Materials - 14.2% | | | | | |
Crown Holdings | | | | 101,803 | a | 7,823,561 | |
Eagle Materials | | | | 60,712 | | 4,964,420 | |
FMC | | | | 94,205 | | 10,066,746 | |
Freeport-McMoRan | | | | 417,791 | | 6,521,718 | |
Huntsman | | | | 231,687 | | 5,009,073 | |
Louisiana-Pacific | | | | 216,632 | | 7,135,858 | |
Newmont | | | | 171,219 | | 11,519,614 | |
The Mosaic Company | | | | 480,216 | | 8,754,338 | |
| | | | | 61,795,328 | |
Media & Entertainment - 5.3% | | | | | |
Activision Blizzard | | | | 175,030 | | 14,618,506 | |
Zillow Group, Cl. C | | | | 99,034 | a,b | 8,493,156 | |
| | | | | 23,111,662 | |
Pharmaceuticals Biotechnology & Life Sciences - 5.0% | | | | | |
Mylan | | | | 282,477 | a | 4,626,973 | |
Neurocrine Biosciences | | | | 50,458 | a | 5,874,320 | |
Sarepta Therapeutics | | | | 32,932 | a | 4,821,903 | |
Syneos Health | | | | 98,310 | a | 6,203,361 | |
| | | | | 21,526,557 | |
Real Estate - 5.5% | | | | | |
Alexandria Real Estate Equities | | | | 44,497 | b,c | 7,492,405 | |
CBRE Group, Cl. A | | | | 114,225 | a | 5,372,002 | |
Digital Realty Trust | | | | 71,172 | c | 11,077,922 | |
| | | | | 23,942,329 | |
Retailing - 2.3% | | | | | |
Dollar General | | | | 49,851 | | 10,063,920 | |
Semiconductors & Semiconductor Equipment - 7.3% | | | | | |
First Solar | | | | 162,702 | a,b | 12,461,346 | |
ON Semiconductor | | | | 346,351 | a | 7,401,521 | |
Skyworks Solutions | | | | 59,706 | | 8,648,414 | |
Teradyne | | | | 39,649 | | 3,368,976 | |
| | | | | 31,880,257 | |
Software & Services - 11.6% | | | | | |
DocuSign | | | | 15,448 | a | 3,444,904 | |
Euronet Worldwide | | | | 73,253 | a | 7,572,895 | |
Global Payments | | | | 49,539 | | 8,749,578 | |
Nuance Communications | | | | 480,221 | a | 14,387,421 | |
Proofpoint | | | | 59,387 | a | 6,512,972 | |
Slack Technologies, Cl. A | | | | 297,862 | a,b | 9,781,788 | |
| | | | | 50,449,558 | |
11
STATEMENT OF INVESTMENTS (continued)
| | | | | | | | |
| |
Description | | | | Shares | | Value ($) | |
Common Stocks - 97.2% (continued) | | | | | |
Technology Hardware & Equipment - 2.6% | | | | | |
FLIR Systems | | | | 130,640 | | 4,820,616 | |
Western Digital | | | | 169,251 | | 6,502,623 | |
| | | | | 11,323,239 | |
Transportation - 2.0% | | | | | |
Knight-Swift Transportation Holdings | | | | 190,952 | b | 8,680,678 | |
Utilities - 4.8% | | | | | |
Edison International | | | | 139,901 | | 7,342,005 | |
Exelon | | | | 137,206 | | 5,064,274 | |
PPL | | | | 303,022 | | 8,372,498 | |
| | | | | 20,778,777 | |
Total Common Stocks (cost $361,285,182) | | | | 422,064,439 | |
| | | | | | | | |
Exchange-Traded Funds - 1.1% | | | | | |
Registered Investment Companies - 1.1% | | | | | |
SPDR S&P MidCap 400 ETF Trust
(cost $4,835,110) | | | | 13,549 | | 4,761,119 | |
| | | 1-Day
Yield (%) | | | | | |
Investment Companies - 1.8% | | | | | |
Registered Investment Companies - 1.8% | | | | | |
Dreyfus Institutional Preferred Government Plus Money Market Fund
(cost $7,687,707) | | 0.20 | | 7,687,707 | d | 7,687,707 | |
| | | | | | | | |
Investment of Cash Collateral for Securities Loaned - 2.6% | | | | | |
Registered Investment Companies - 2.6% | | | | | |
Dreyfus Institutional Preferred Government Plus Money Market Fund
(cost $11,305,965) | | 0.20 | | 11,305,965 | d | 11,305,965 | |
Total Investments (cost $385,113,964) | | 102.7% | | 445,819,230 | |
Liabilities, Less Cash and Receivables | | (2.7%) | | (11,744,226) | |
Net Assets | | 100.0% | | 434,075,004 | |
ETF—Exchange-Traded Fund
aNon-income producing security.
bSecurity, or portion thereof, on loan. At August 31, 2020, the value of the fund’s securities on loan was $54,574,185 and the value of the collateral was $56,459,169, consisting of cash collateral of $11,305,965 and U.S. Government & Agency securities valued at $45,153,204.
cInvestment in real estate investment trust within the United States.
dInvestment in affiliated issuer. The investment objective of this investment company is publicly available and can be found within the investment company’s prospectus.
12
| | |
Portfolio Summary (Unaudited) † | Value (%) |
Information Technology | 21.6 |
Materials | 14.2 |
Health Care | 12.3 |
Industrials | 11.8 |
Consumer Discretionary | 8.2 |
Financials | 7.2 |
Real Estate | 5.5 |
Investment Companies | 5.5 |
Communication Services | 5.3 |
Utilities | 4.8 |
Consumer Staples | 3.9 |
Energy | 2.4 |
| | 102.7 |
† Based on net assets.
See notes to financial statements.
13
STATEMENT OF INVESTMENTS IN AFFILIATED ISSUERS
| | | | | | | |
Investment Companies | Value
8/31/19 ($) | Purchases ($)† | Sales ($) | Value
8/31/20 ($) | Net
Assets (%) | Dividends/
Distributions ($) |
Registered Investment Companies: |
Dreyfus Institutional Preferred Government Plus Money Market Fund | 3,248,008 | 150,454,904 | (146,015,205) | 7,687,707 | 1.8 | 39,180 |
Investment of Cash Collateral for Securities Loaned: |
Dreyfus Institutional Preferred Government Plus Money Market Fund | 3,567,020 | 217,730,005 | (209,991,060) | 11,305,965 | 2.6 | - |
Total | 6,815,028 | 368,184,909 | (356,006,265) | 18,993,672 | 4.4 | 39,180 |
† Includes reinvested dividends/distributions.
See notes to financial statements.
14
STATEMENT OF ASSETS AND LIABILITIES
August 31, 2020
| | | | | | | |
| | | | | | |
| | | Cost | | Value | |
Assets ($): | | | | |
Investments in securities—See Statement of Investments
(including securities on loan, valued at $54,574,185)—Note 1(c): | | | |
Unaffiliated issuers | 366,120,292 | | 426,825,558 | |
Affiliated issuers | | 18,993,672 | | 18,993,672 | |
Receivable for investment securities sold | | 3,762,285 | |
Dividends and securities lending income receivable | | 375,775 | |
Receivable for shares of Common Stock subscribed | | 104,982 | |
Prepaid expenses | | | | | 49,920 | |
| | | | | 450,112,192 | |
Liabilities ($): | | | | |
Due to BNY Mellon Investment Adviser, Inc. and affiliates—Note 3(c) | | 370,790 | |
Liability for securities on loan—Note 1(c) | | 11,305,965 | |
Payable for investment securities purchased | | 3,809,633 | |
Payable for shares of Common Stock redeemed | | 366,290 | |
Directors’ fees and expenses payable | | 9,325 | |
Other accrued expenses | | | | | 175,185 | |
| | | | | 16,037,188 | |
Net Assets ($) | | | 434,075,004 | |
Composition of Net Assets ($): | | | | |
Paid-in capital | | | | | 408,969,414 | |
Total distributable earnings (loss) | | | | | 25,105,590 | |
Net Assets ($) | | | 434,075,004 | |
| | | | | | |
Net Asset Value Per Share | Class A | Class C | Class I | Class Y | |
Net Assets ($) | 288,718,961 | 18,431,058 | 121,710,427 | 5,214,558 | |
Shares Outstanding | 10,790,702 | 838,943 | 4,567,360 | 195,385 | |
Net Asset Value Per Share ($) | 26.76 | 21.97 | 26.65 | 26.69 | |
| | | | | |
See notes to financial statements. | | | | | |
15
STATEMENT OF OPERATIONS
Year Ended August 31, 2020
| | | | | | | |
| | | | | | |
| | | | | | |
Investment Income ($): | | | | |
Income: | | | | |
Cash dividends (net of $23,390 foreign taxes withheld at source): | |
Unaffiliated issuers | | | 6,072,306 | |
Affiliated issuers | | | 38,473 | |
Income from securities lending—Note 1(c) | | | 89,862 | |
Interest | | | 32,800 | |
Total Income | | | 6,233,441 | |
Expenses: | | | | |
Management fee—Note 3(a) | | | 3,564,477 | |
Shareholder servicing costs—Note 3(c) | | | 1,351,479 | |
Distribution fees—Note 3(b) | | | 186,193 | |
Professional fees | | | 95,663 | |
Registration fees | | | 73,795 | |
Prospectus and shareholders’ reports | | | 69,692 | |
Directors’ fees and expenses—Note 3(d) | | | 36,961 | |
Custodian fees—Note 3(c) | | | 14,373 | |
Chief Compliance Officer fees—Note 3(c) | | | 13,975 | |
Loan commitment fees—Note 2 | | | 9,052 | |
Interest expense—Note 2 | | | 4,214 | |
Miscellaneous | | | 44,318 | |
Total Expenses | | | 5,464,192 | |
Investment Income—Net | | | 769,249 | |
Realized and Unrealized Gain (Loss) on Investments—Note 4 ($): | | |
Net realized gain (loss) on investments | 13,719,423 | |
Capital gain distributions from affiliated issuers | 707 | |
Net Realized Gain (Loss) | | | 13,720,130 | |
Net change in unrealized appreciation (depreciation) on investments | 35,147,037 | |
Net Realized and Unrealized Gain (Loss) on Investments | | | 48,867,167 | |
Net Increase in Net Assets Resulting from Operations | | 49,636,416 | |
| | | | | | |
See notes to financial statements. | | | | | |
16
STATEMENT OF CHANGES IN NET ASSETS
| | | | | | | | | | |
| | | | Year Ended August 31, |
| | | | 2020 | | 2019 | |
Operations ($): | | | | | | | | |
Investment income—net | | | 769,249 | | | | 1,676,849 | |
Net realized gain (loss) on investments | | 13,720,130 | | | | (3,479,590) | |
Net change in unrealized appreciation
(depreciation) on investments | | 35,147,037 | | | | (109,890,127) | |
Net Increase (Decrease) in Net Assets
Resulting from Operations | 49,636,416 | | | | (111,692,868) | |
Distributions ($): | |
Distributions to shareholders: | | | | | | | | |
Class A | | | (901,623) | | | | (89,325,514) | |
Class C | | | (238) | | | | (10,375,746) | |
Class I | | | (732,913) | | | | (80,239,051) | |
Class Y | | | (48,476) | | | | (2,340,142) | |
Total Distributions | | | (1,683,250) | | | | (182,280,453) | |
Capital Stock Transactions ($): | |
Net proceeds from shares sold: | | | | | | | | |
Class A | | | 17,711,916 | | | | 30,692,805 | |
Class C | | | 715,583 | | | | 3,001,837 | |
Class I | | | 20,935,087 | | | | 75,738,264 | |
Class Y | | | 941,882 | | | | 1,932,209 | |
Distributions reinvested: | | | | | | | | |
Class A | | | 847,239 | | | | 83,230,860 | |
Class C | | | 210 | | | | 9,141,082 | |
Class I | | | 700,605 | | | | 77,500,604 | |
Class Y | | | 36,142 | | | | 1,604,933 | |
Cost of shares redeemed: | | | | | �� | | | |
Class A | | | (104,233,826) | | | | (113,695,003) | |
Class C | | | (14,341,047) | | | | (16,238,435) | |
Class I | | | (111,672,519) | | | | (330,412,765) | |
Class Y | | | (5,550,332) | | | | (5,706,302) | |
Increase (Decrease) in Net Assets
from Capital Stock Transactions | (193,909,060) | | | | (183,209,911) | |
Total Increase (Decrease) in Net Assets | (145,955,894) | | | | (477,183,232) | |
Net Assets ($): | |
Beginning of Period | | | 580,030,898 | | | | 1,057,214,130 | |
End of Period | | | 434,075,004 | | | | 580,030,898 | |
17
STATEMENT OF CHANGES IN NET ASSETS (continued)
| | | | | | | | | | |
| | | | Year Ended August 31, |
| | | | 2020 | | 2019 | |
Capital Share Transactions (Shares): | |
Class Aa,b | | | | | | | | |
Shares sold | | | 726,839 | | | | 1,224,755 | |
Shares issued for distributions reinvested | | | 33,185 | | | | 3,718,983 | |
Shares redeemed | | | (4,229,157) | | | | (4,392,166) | |
Net Increase (Decrease) in Shares Outstanding | (3,469,133) | | | | 551,572 | |
Class Ca,b | | | | | | | | |
Shares sold | | | 38,096 | | | | 149,055 | |
Shares issued for distributions reinvested | | | 13 | | | | 492,005 | |
Shares redeemed | | | (701,770) | | | | (768,689) | |
Net Increase (Decrease) in Shares Outstanding | (663,661) | | | | (127,629) | |
Class Ia | | | | | | | | |
Shares sold | | | 912,034 | | | | 3,046,526 | |
Shares issued for distributions reinvested | | | 27,583 | | | | 3,483,169 | |
Shares redeemed | | | (4,593,325) | | | | (12,746,365) | |
Net Increase (Decrease) in Shares Outstanding | (3,653,708) | | | | (6,216,670) | |
Class Y | | | | | | | | |
Shares sold | | | 39,010 | | | | 75,370 | |
Shares issued for distributions reinvested | | | 1,422 | | | | 72,034 | |
Shares redeemed | | | (226,571) | | | | (207,052) | |
Net Increase (Decrease) in Shares Outstanding | (186,139) | | | | (59,648) | |
| | | | | | | | | |
aDuring the period ended August 31, 2020, 22,839 Class A shares representing $506,750 were exchanged to 22,943 Class I shares and 1,066 Class C shares representing $23,892 were exchanged to 883 Class I shares. During the period ended August 31, 2019, 1,152 Class A shares representing $27,563 were exchanged for 1,158 Class I shares. | |
bDuring the period ended August 31, 2020, 3,983 Class C shares representing $78,518 were automatically converted to 3,287 Class A shares. During the period ended August 31, 2019, 299 Class C shares representing $5,964 were automatically converted to 247 Class A shares.
| |
See notes to financial statements. | | | | | | | | |
18
FINANCIAL HIGHLIGHTS
The following tables describe the performance for each share class for the fiscal periods indicated. All information (except portfolio turnover rate) reflects financial results for a single fund share. Total return shows how much your investment in the fund would have increased (or decreased) during each period, assuming you had reinvested all dividends and distributions. These figures have been derived from the fund’s financial statements.
| | | | | | | | |
| | |
| | |
| | Year Ended August 31, |
Class A Shares | | 2020 | 2019 | 2018 | 2017 | 2016 |
Per Share Data ($): | | | | | | |
Net asset value,
beginning of period | | 24.10 | 35.32 | 34.37 | 31.72 | 36.97 |
Investment Operations: | | | | | | |
Investment income (loss)—neta | | .03 | .03 | (.03) | .03 | .03 |
Net realized and unrealized gain
(loss) on investments | | 2.70 | (4.32) | 5.35 | 4.13 | .82 |
Total from Investment Operations | | 2.73 | (4.29) | 5.32 | 4.16 | .85 |
Distributions: | | | | | | |
Dividends from investment
income—net | | (.07) | - | - | (.01) | - |
Dividends from net realized gain
on investments | | - | (6.93) | (4.37) | (1.50) | (6.10) |
Total Distributions | | (.07) | (6.93) | (4.37) | (1.51) | (6.10) |
Net asset value, end of period | | 26.76 | 24.10 | 35.32 | 34.37 | 31.72 |
Total Return (%)b | | 11.34 | (10.64) | 16.44 | 13.28 | 3.95 |
Ratios/Supplemental Data (%): | | | | | | |
Ratio of total expenses to
average net assets | | 1.18 | 1.15 | 1.16 | 1.17 | 1.21 |
Ratio of net investment income
(loss) to average net assets | | .13 | .12 | (.08) | .10 | .11 |
Portfolio Turnover Rate | | 91.55 | 98.59 | 100.55 | 104.51 | 101.68 |
Net Assets, end of period
($ x 1,000) | | 288,719 | 343,673 | 484,169 | 509,761 | 796,686 |
a Based on average shares outstanding.
b Exclusive of sales charge.
See notes to financial statements.
19
FINANCIAL HIGHLIGHTS (continued)
| | | | | | | | | |
| | |
| | |
| | Year Ended August 31, |
Class C Shares | | 2020 | 2019 | 2018 | 2017 | 2016 |
Per Share Data ($): | | | | | | | |
Net asset value, beginning of period | | | 19.89 | 30.80 | 30.70 | 28.68 | 34.26 |
Investment Operations: | | | | | | | |
Investment (loss)—neta | | | (.13) | (.14) | (.25) | (.19) | (.18) |
Net realized and unrealized gain
(loss) on investments | | | 2.21 | (3.84) | 4.72 | 3.71 | .70 |
Total from Investment Operations | | | 2.08 | (3.98) | 4.47 | 3.52 | .52 |
Distributions: | | | | | | | |
Dividends from investment
income—net | | | (.00)b | - | - | - | - |
Dividends from net realized gain
on investments | | | - | (6.93) | (4.37) | (1.50) | (6.10) |
Total Distributions | | | (.00)b | (6.93) | (4.37) | (1.50) | (6.10) |
Net asset value, end of period | | | 21.97 | 19.89 | 30.80 | 30.70 | 28.68 |
Total Return (%)c | | | 10.46 | (11.34) | 15.55 | 12.44 | 3.19 |
Ratios/Supplemental Data (%): | | | | | | | |
Ratio of total expenses to
average net assets | | | 1.97 | 1.91 | 1.91 | 1.92 | 1.94 |
Ratio of net investment (loss)
to average net assets | | | (.64) | (.65) | (.84) | (.65) | (.62) |
Portfolio Turnover Rate | | | 91.55 | 98.59 | 100.55 | 104.51 | 101.68 |
Net Assets, end of period ($ x 1,000) | | | 18,431 | 29,892 | 50,210 | 62,608 | 76,886 |
a Based on average shares outstanding.
b Amount is less than $.00 per share.
c Exclusive of sales charge.
See notes to financial statements.
20
| | | | | | | | |
| | |
| | |
| | Year Ended August 31, |
Class I Shares | | 2020 | 2019 | 2018 | 2017 | 2016 |
Per Share Data ($): | | | | | | |
Net asset value, beginning of period | | 24.00 | 35.14 | 34.27 | 31.64 | 36.83 |
Investment Operations: | | | | | | |
Investment income—neta | | .09 | .11 | .07 | .14 | .12 |
Net realized and unrealized gain
(loss) on investments | | 2.68 | (4.32) | 5.32 | 4.11 | .81 |
Total from Investment Operations | | 2.77 | (4.21) | 5.39 | 4.25 | .93 |
Distributions: | | | | | | |
Dividends from investment
income—net | | (.12) | (.00)b | (.15) | (.12) | (.02) |
Dividends from net realized gain
on investments | | - | (6.93) | (4.37) | (1.50) | (6.10) |
Total Distributions | | (.12) | (6.93) | (4.52) | (1.62) | (6.12) |
Net asset value, end of period | | 26.65 | 24.00 | 35.14 | 34.27 | 31.64 |
Total Return (%) | | 11.55 | (10.42) | 16.74 | 13.63 | 4.23 |
Ratios/Supplemental Data (%): | | | | | | |
Ratio of total expenses to
average net assets | | .96 | .90 | .89 | .90 | .90 |
Ratio of net investment income
to average net assets | | .35 | .40 | .19 | .42 | .39 |
Portfolio Turnover Rate | | 91.55 | 98.59 | 100.55 | 104.51 | 101.68 |
Net Assets, end of period ($ x 1,000) | | 121,710 | 197,290 | 507,298 | 501,821 | 492,694 |
a Based on average shares outstanding.
b Amount is less than $.00 per share.
See notes to financial statements.
21
FINANCIAL HIGHLIGHTS (continued)
| | | | | | | | |
| | |
| | |
| | Year Ended August 31, |
Class Y Shares | | 2020 | 2019 | 2018 | 2017 | 2016 |
Per Share Data ($): | | | | | | |
Net asset value, beginning of period | | 24.05 | 35.22 | 34.34 | 31.72 | 36.93 |
Investment Operations: | | | | | | |
Investment income—neta | | .12 | .12 | .10 | .15 | .16 |
Net realized and unrealized gain
(loss) on investments | | 2.69 | (4.31) | 5.33 | 4.13 | .83 |
Total from Investment Operations | | 2.81 | (4.19) | 5.43 | 4.28 | .99 |
Distributions: | | | | | | |
Dividends from investment
income—net | | (.17) | (.05) | (.18) | (.16) | (.10) |
Dividends from net realized gain
on investments | | - | (6.93) | (4.37) | (1.50) | (6.10) |
Total Distributions | | (17) | (6.98) | (4.55) | (1.66) | (6.20) |
Net asset value, end of period | | 26.69 | 24.05 | 35.22 | 34.34 | 31.72 |
Total Return (%) | | 11.71 | (10.34) | 16.84 | 13.71 | 4.40 |
Ratios/Supplemental Data (%): | | | | | | |
Ratio of total expenses to
average net assets | | .84 | .81 | .79 | .80 | .78 |
Ratio of net investment income to average net assets | | .47 | .45 | .30 | .49 | .53 |
Portfolio Turnover Rate | | 91.55 | 98.59 | 100.55 | 104.51 | 101.68 |
Net Assets, end of period ($ x 1,000) | | 5,215 | 9,176 | 15,538 | 9,137 | 17,308 |
a Based on average shares outstanding.
See notes to financial statements.
22
NOTES TO FINANCIAL STATEMENTS
NOTE 1—Significant Accounting Policies:
BNY Mellon Opportunistic Midcap Value Fund (the “fund”) is a separate diversified series of BNY Mellon Advantage Funds, Inc. (the “Company”), which is registered under the Investment Company Act of 1940, as amended (the “Act”), as an open-end management investment company and operates as a series company currently offering nine series, including the fund. The fund’s investment objective is to seek to surpass the performance of the Russell Midcap® Value Index. BNY Mellon Investment Adviser, Inc. (the “Adviser”), a wholly-owned subsidiary of The Bank of New York Mellon Corporation (“BNY Mellon”), serves as the fund’s investment adviser.
The Company’s Board of Directors (the “Board”) approved, effective December 31, 2019 (the “Effective Date”), the termination of the fund’s authorized Class T shares. Prior to the Effective Date, the fund did not offer such Class T shares for purchase. The authorized Class T shares were reallocated to authorized Class I shares and Class Y shares, increasing authorized Class I shares from 125 million to 175 million and increasing authorized Class Y shares from 100 million to 150 million.
BNY Mellon Securities Corporation (the “Distributor”), a wholly-owned subsidiary of the Adviser, is the distributor of the fund’s shares. The fund is authorized to issue 800 million shares of $.001 par value Common Stock. The fund currently has authorized four classes of shares: Class A (350 million shares authorized), Class C (125 million shares authorized), Class I (175 million shares authorized) and Class Y (150 million shares authorized). Class A shares generally are subject to a sales charge imposed at the time of purchase. Class C shares are subject to a contingent deferred sales charge (“CDSC”) imposed on Class C shares redeemed within one year of purchase. Class C shares automatically convert to Class A shares ten years after the date of purchase, without the imposition of a sales charge. Class I and Class Y shares are sold at net asset value per share generally to institutional investors. Other differences between the classes include the services offered to and the expenses borne by each class, the allocation of certain transfer agency costs, and certain voting rights. Income, expenses (other than expenses attributable to a specific class), and realized and unrealized gains or losses on investments are allocated to each class of shares based on its relative net assets.
The Company accounts separately for the assets, liabilities and operations of each series. Expenses directly attributable to each series are charged to that series’ operations; expenses which are applicable to all series are allocated among them on a pro rata basis.
23
NOTES TO FINANCIAL STATEMENTS (continued)
The Financial Accounting Standards Board (“FASB”) Accounting Standards Codification (“ASC”) is the exclusive reference of authoritative U.S. generally accepted accounting principles (“GAAP”) recognized by the FASB to be applied by nongovernmental entities. Rules and interpretive releases of the Securities and Exchange Commission (“SEC”) under authority of federal laws are also sources of authoritative GAAP for SEC registrants. The fund is an investment company and applies the accounting and reporting guidance of the FASB ASC Topic 946 Financial Services-Investment Companies. The fund’s financial statements are prepared in accordance with GAAP, which may require the use of management estimates and assumptions. Actual results could differ from those estimates.
The Company enters into contracts that contain a variety of indemnifications. The fund’s maximum exposure under these arrangements is unknown. The fund does not anticipate recognizing any loss related to these arrangements.
(a) Portfolio valuation: The fair value of a financial instrument is the amount that would be received to sell an asset or paid to transfer a liability in an orderly transaction between market participants at the measurement date (i.e., the exit price). GAAP establishes a fair value hierarchy that prioritizes the inputs of valuation techniques used to measure fair value. This hierarchy gives the highest priority to unadjusted quoted prices in active markets for identical assets or liabilities (Level 1 measurements) and the lowest priority to unobservable inputs (Level 3 measurements).
Additionally, GAAP provides guidance on determining whether the volume and activity in a market has decreased significantly and whether such a decrease in activity results in transactions that are not orderly. GAAP requires enhanced disclosures around valuation inputs and techniques used during annual and interim periods.
Various inputs are used in determining the value of the fund’s investments relating to fair value measurements. These inputs are summarized in the three broad levels listed below:
Level 1—unadjusted quoted prices in active markets for identical investments.
Level 2—other significant observable inputs (including quoted prices for similar investments, interest rates, prepayment speeds, credit risk, etc.).
Level 3—significant unobservable inputs (including the fund’s own assumptions in determining the fair value of investments).
24
The inputs or methodology used for valuing securities are not necessarily an indication of the risk associated with investing in those securities.
Changes in valuation techniques may result in transfers in or out of an assigned level within the disclosure hierarchy. Valuation techniques used to value the fund’s investments are as follows:
Investments in equity securities are valued at the last sales price on the securities exchange or national securities market on which such securities are primarily traded. Securities listed on the National Market System for which market quotations are available are valued at the official closing price or, if there is no official closing price that day, at the last sales price. For open short positions, asked prices are used for valuation purposes. Bid price is used when no asked price is available. Registered investment companies that are not traded on an exchange are valued at their net asset value. All of the preceding securities are generally categorized within Level 1 of the fair value hierarchy.
Securities not listed on an exchange or the national securities market, or securities for which there were no transactions, are valued at the average of the most recent bid and asked prices. These securities are generally categorized within Level 2 of the fair value hierarchy.
Fair valuing of securities may be determined with the assistance of a pricing service using calculations based on indices of domestic securities and other appropriate indicators, such as prices of relevant American Depository Receipts and futures. Utilizing these techniques may result in transfers between Level 1 and Level 2 of the fair value hierarchy.
When market quotations or official closing prices are not readily available, or are determined not to accurately reflect fair value, such as when the value of a security has been significantly affected by events after the close of the exchange or market on which the security is principally traded (for example, a foreign exchange or market), but before the fund calculates its net asset value, the fund may value these investments at fair value as determined in accordance with the procedures approved by the Board. Certain factors may be considered when fair valuing investments such as: fundamental analytical data, the nature and duration of restrictions on disposition, an evaluation of the forces that influence the market in which the securities are purchased and sold, and public trading in similar securities of the issuer or comparable issuers. These securities are either categorized within Level 2 or 3 of the fair value hierarchy depending on the relevant inputs used.
25
NOTES TO FINANCIAL STATEMENTS (continued)
For securities where observable inputs are limited, assumptions about market activity and risk are used and such securities are generally categorized within Level 3 of the fair value hierarchy.
The following is a summary of the inputs used as of August 31, 2020 in valuing the fund’s investments:
| | | | | | |
| | Level 1 -
Unadjusted
Quoted Prices | Level 2 -
Other
Significant
Observable
Inputs | Level 3 -
Significant
Unobservable
Inputs | Total |
Assets ($) | | | | |
Investments in Securities: † | | | |
Equity Securities - Common Stocks | 422,064,439 | - | - | 422,064,439 |
Exchange-Traded Funds | 4,761,119 | - | - | 4,761,119 |
Investment Companies | 18,993,672 | - | - | 18,993,672 |
† See Statement of Investments for additional detailed categorizations, if any.
(b) Foreign Taxes: The fund may be subject to foreign taxes (a portion of which may be reclaimable) on income, stock dividends, realized and unrealized capital gains on investments or certain foreign currency transactions. Foreign taxes are recorded in accordance with the fund’s understanding of the applicable foreign tax regulations and rates that exist in the foreign jurisdictions in which the fund invests. These foreign taxes, if any, are paid by the fund and are reflected in the Statement of Operations. Foreign taxes payable or deferred as of August 31, 2020, if any, are disclosed in the fund’s Statement of Assets and Liabilities.
(c) Securities transactions and investment income: Securities transactions are recorded on a trade date basis. Realized gains and losses from securities transactions are recorded on the identified cost basis. Dividend income is recognized on the ex-dividend date and interest income, including, where applicable, accretion of discount and amortization of premium on investments, is recognized on the accrual basis.
Pursuant to a securities lending agreement with The Bank of New York Mellon, a subsidiary of BNY Mellon and an affiliate of the Adviser, the fund may lend securities to qualified institutions. It is the fund’s policy that, at origination, all loans are secured by collateral of at least 102% of the value of U.S. securities loaned and 105% of the value of foreign securities loaned. Collateral equivalent to at least 100% of the market value of securities on loan is maintained at all times. Collateral is either in the
26
form of cash, which can be invested in certain money market mutual funds managed by the Adviser, or U.S. Government and Agency securities. The fund is entitled to receive all dividends, interest and distributions on securities loaned, in addition to income earned as a result of the lending transaction. Should a borrower fail to return the securities in a timely manner, The Bank of New York Mellon is required to replace the securities for the benefit of the fund or credit the fund with the market value of the unreturned securities and is subrogated to the fund’s rights against the borrower and the collateral. Additionally, the contractual maturity of security lending transactions are on an overnight and continuous basis. During the period ended August 31, 2020, The Bank of New York Mellon earned $17,245 from the lending of the fund’s portfolio securities, pursuant to the securities lending agreement.
(d) Affiliated issuers: Investments in other investment companies advised by the Adviser are considered “affiliated” under the Act.
(e) Risk: Certain events particular to the industries in which the fund’s investments conduct their operations, as well as general economic, political and public health conditions, may have a significant negative impact on the investee’s operations and profitability. In addition, turbulence in financial markets and reduced liquidity in equity, credit and/or fixed income markets may negatively affect many issuers, which could adversely affect the fund. Global economies and financial markets are becoming increasingly interconnected, and conditions and events in one country, region or financial market may adversely impact issuers in a different country, region or financial market. These risks may be magnified if certain events or developments adversely interrupt the global supply chain; in these and other circumstances, such risks might affect companies world-wide. Recent examples include pandemic risks related to COVID-19 and aggressive measures taken world-wide in response by governments, including closing borders, restricting international and domestic travel, and the imposition of prolonged quarantines of large populations, and by businesses, including changes to operations and reducing staff. To the extent the fund may overweight its investments in certain countries, companies, industries or market sectors, such positions will increase the fund’s exposure to risk of loss from adverse developments affecting those countries, companies, industries or sectors.
(f) Dividends and distributions to shareholders: Dividends and distributions are recorded on the ex-dividend date. Dividends from investment income-net and dividends from net realized capital gains, if any, are normally declared and paid annually, but the fund may make distributions on a more frequent basis to comply with the distribution
27
NOTES TO FINANCIAL STATEMENTS (continued)
requirements of the Internal Revenue Code of 1986, as amended (the “Code”). To the extent that net realized capital gains can be offset by capital loss carryovers, it is the policy of the fund not to distribute such gains. Income and capital gain distributions are determined in accordance with income tax regulations, which may differ from GAAP.
(g) Federal income taxes: It is the policy of the fund to continue to qualify as a regulated investment company, if such qualification is in the best interests of its shareholders, by complying with the applicable provisions of the Code, and to make distributions of taxable income and net realized capital gain sufficient to relieve it from substantially all federal income and excise taxes.
As of and during the period ended August 31, 2020, the fund did not have any liabilities for any uncertain tax positions. The fund recognizes interest and penalties, if any, related to uncertain tax positions as income tax expense in the Statement of Operations. During the period ended August 31, 2020, the fund did not incur any interest or penalties.
Each tax year in the four-year period ended August 31, 2020 remains subject to examination by the Internal Revenue Service and state taxing authorities.
At August 31, 2020, the components of accumulated earnings on a tax basis were as follows: undistributed ordinary income $758,177, accumulated capital losses $30,644,286 and unrealized appreciation $54,991,699.
The fund is permitted to carry forward capital losses for an unlimited period. Furthermore, capital loss carryovers retain their character as either short-term or long-term capital losses.
The accumulated capital loss carryover is available for federal income tax purposes to be applied against future net realized capital gains, if any, realized subsequent to August 31, 2020. The fund has $30,644,286 of short-term capital losses which can be carried forward for an unlimited period.
The tax character of distributions paid to shareholders during the fiscal periods ended August 31, 2020 and August 31, 2019 were as follows: ordinary income $1,683,250 and $84,381,884, and long-term capital gains $0 and $97,898,569, respectively.
NOTE 2—Bank Lines of Credit:
The fund participates with other long-term open-end funds managed by the Adviser in a $927 million unsecured credit facility led by Citibank, N.A.
28
(the “Citibank Credit Facility”) and a $300 million unsecured credit facility provided by The Bank of New York Mellon (the “BNYM Credit Facility”), each to be utilized primarily for temporary or emergency purposes, including the financing of redemptions (each, a “Facility”). The Citibank Credit Facility is available in two tranches: (i) Tranche A is in an amount equal to $747 million and is available to all long-term open-ended funds, including the fund, and (ii) Tranche B is an amount equal to $180 million and is available only to BNY Mellon Floating Rate Income Fund, a series of BNY Mellon Investment Funds IV, Inc. Prior to March 11, 2020, the Citibank Credit Facility was $1.030 billion with Tranche A available in an amount equal to $830 million and Tranche B available in an amount equal to $200 million. In connection therewith, the fund has agreed to pay its pro rata portion of commitment fees for Tranche A of the Citibank Credit Facility and the BNYM Credit Facility. Interest is charged to the fund based on rates determined pursuant to the terms of the respective Facility at the time of borrowing.
The average amount of borrowings outstanding under the Facilities during the period ended August 31, 2020, was approximately $160,109 with a related weighted average annualized interest rate of 2.63%.
NOTE 3—Management Fee and Other Transactions with Affiliates:
(a) Pursuant to a management agreement with the Adviser, the management fee is computed at the annual rate of .75% of the value of the fund's average daily net assets and is payable monthly.
During the period ended August 31, 2020, the Distributor retained $2,917 from commissions earned on sales of the fund’s Class A shares and $486 from CDSC fees on redemptions of the fund’s Class C shares.
(b) Under the Distribution Plan adopted pursuant to Rule 12b-1 under the Act, Class C shares pay the Distributor for distributing its shares at an annual rate of .75% of the value of its average daily net assets. During the period ended August 31, 2020, Class C shares were charged $186,193 pursuant to the Distribution Plan.
(c) Under the Shareholder Services Plan, Class A and Class C shares pay the Distributor at an annual rate of .25% of the value of their average daily net assets for the provision of certain services. The services provided may include personal services relating to shareholder accounts, such as answering shareholder inquiries regarding the fund and providing reports and other information, and services related to the maintenance of shareholder accounts. The Distributor may make payments to Service Agents (securities dealers, financial institutions or other industry
29
NOTES TO FINANCIAL STATEMENTS (continued)
professionals) with respect to these services. The Distributor determines the amounts to be paid to Service Agents. During the period ended August 31, 2020, Class A and Class C shares were charged $754,232 and $62,064, respectively, pursuant to the Shareholder Services Plan.
The fund has an arrangement with the transfer agent whereby the fund may receive earnings credits when positive cash balances are maintained, which are used to offset transfer agency fees. For financial reporting purposes, the fund includes net earnings credits, if any, as an expense offset in the Statement of Operations.
The fund has an arrangement with the custodian whereby the fund will receive interest income or be charged an overdraft fees when cash balances are maintained. For financial reporting purposes, the fund includes this interest income and overdraft fees, if any, as interest income in the Statement of Operations.
The fund compensates BNY Mellon Transfer, Inc., a wholly-owned subsidiary of the Adviser, under a transfer agency agreement for providing transfer agency and cash management services for the fund. The majority of transfer agency fees are comprised of amounts paid on a per account basis, while cash management fees are related to fund subscriptions and redemptions. During the period ended August 31, 2020, the fund was charged $70,023 for transfer agency services. These fees are included in Shareholder servicing costs in the Statement of Operations.
The fund compensates The Bank of New York Mellon under a custody agreement for providing custodial services for the fund. These fees are determined based on net assets, geographic region and transaction activity. During the period ended August 31, 2020, the fund was charged $14,373 pursuant to the custody agreement.
During the period ended August 31, 2020, the fund was charged $13,975 for services performed by the Chief Compliance Officer and his staff. These fees are included in Chief Compliance Officer fees in the Statement of Operations.
The components of “Due to BNY Mellon Investment Adviser, Inc. and affiliates” in the Statement of Assets and Liabilities consist of: management fees of $273,852, Distribution Plan fees of $11,958, Shareholder Services Plan fees of $64,599, custodian fees of $3,882, Chief Compliance Officer fees of $2,273 and transfer agency fees of $14,226.
(d) Each Board member also serves as a Board member of other funds in the BNY Mellon Family of Funds complex. Annual retainer fees and attendance fees are allocated to each fund based on net assets.
30
NOTE 4—Securities Transactions:
The aggregate amount of purchases and sales of investment securities, excluding short-term securities, during the period ended August 31, 2020, amounted to $431,908,344 and $630,924,379, respectively.
At August 31, 2020, the cost of investments for federal income tax purposes was $390,827,531; accordingly, accumulated net unrealized appreciation on investments was $54,991,699, consisting of $94,362,291 gross unrealized appreciation and $39,370,592 gross unrealized depreciation.
31
REPORT OF INDEPENDENT REGISTERED PUBLIC ACCOUNTING FIRM
To the Shareholders and the Board of Directors of BNY Mellon Opportunistic Midcap Value Fund
Opinion on the Financial Statements
We have audited the accompanying statement of assets and liabilities of BNY Mellon Opportunistic Midcap Value Fund (the “Fund”) (one of the funds constituting BNY Mellon Advantage Funds, Inc.), including the statements of investments and investments in affiliated issuers, as of August 31, 2020, and the related statement of operations for the year then ended, the statements of changes in net assets for each of the two years in the period then ended, the financial highlights for each of the five years in the period then ended and the related notes (collectively referred to as the “financial statements”). In our opinion, the financial statements present fairly, in all material respects, the financial position of the Fund (one of the funds constituting BNY Mellon Advantage Funds, Inc.) at August 31, 2020, the results of its operations for the year then ended, the changes in its net assets for each of the two years in the period then ended and its financial highlights for each of the five years in the period then ended, in conformity with U.S. generally accepted accounting principles.
Basis for Opinion
These financial statements are the responsibility of the Fund’s management. Our responsibility is to express an opinion on the Fund’s financial statements based on our audits. We are a public accounting firm registered with the Public Company Accounting Oversight Board (United States) (“PCAOB”) and are required to be independent with respect to the Fund in accordance with the U.S. federal securities laws and the applicable rules and regulations of the Securities and Exchange Commission and the PCAOB.
We conducted our audits in accordance with the standards of the PCAOB. Those standards require that we plan and perform the audit to obtain reasonable assurance about whether the financial statements are free of material misstatement, whether due to error or fraud. The Fund is not required to have, nor were we engaged to perform, an audit of the Fund’s internal control over financial reporting. As part of our audits, we are required to obtain an understanding of internal control over financial reporting, but not for the purpose of expressing an opinion on the effectiveness of the Fund’s internal control over financial reporting. Accordingly, we express no such opinion.
Our audits included performing procedures to assess the risks of material misstatement of the financial statements, whether due to error or fraud, and performing procedures that respond to those risks. Such procedures included examining, on a test basis, evidence regarding the amounts and disclosures in the financial statements. Our procedures included confirmation of securities owned as of August 31, 2020, by correspondence with the custodian and others or by other appropriate auditing procedures where replies from others were not received. Our audits also included evaluating the accounting principles used and significant estimates made by management, as well as evaluating the overall presentation of the financial statements. We believe that our audits provide a reasonable basis for our opinion.

We have served as the auditor of one or more investment companies in the BNY Mellon Family of Funds since at least 1957, but we are unable to determine the specific year.
New York, New York
October 27, 2020
32
IMPORTANT TAX INFORMATION (Unaudited)
For federal tax purposes, the fund hereby reports 100% of the ordinary dividends paid during the fiscal year ended August 31, 2020 as qualifying for the corporate dividends received deduction. Also certain dividends paid by the fund may be subject to a maximum tax rate of 15%, as provided for by the Jobs and Growth Tax Relief Reconciliation Act of 2003. Of the distributions paid during the fiscal year, $1,683,250 represents the maximum amount that may be considered qualified dividend income. Shareholders will receive notification in early 2021 of the percentage applicable to the preparation of their 2020 income tax returns.
33
INFORMATION ABOUT THE RENEWAL OF THE FUND’S MANAGEMENT AGREEMENT (Unaudited)
At a meeting of the fund’s Board of Directors held on July 28, 2020, the Board considered the renewal of the fund’s Management Agreement pursuant to which the Adviser provides the fund with investment advisory and administrative services (the “Agreement”). The Board members, none of whom are “interested persons” (as defined in the Investment Company Act of 1940, as amended) of the fund, were assisted in their review by independent legal counsel and met with counsel in executive session separate from representatives of the Adviser. In considering the renewal of the Agreement, the Board considered several factors that it believed to be relevant, including those discussed below. The Board did not identify any one factor as dispositive, and each Board member may have attributed different weights to the factors considered.
Analysis of Nature, Extent, and Quality of Services Provided to the Fund. The Board considered information provided to it at the meeting and in previous presentations from representatives of the Adviser regarding the nature, extent, and quality of the services provided to funds in the BNY Mellon fund complex, including the fund. The Adviser provided the number of open accounts in the fund, the fund’s asset size and the allocation of fund assets among distribution channels. The Adviser also had previously provided information regarding the diverse intermediary relationships and distribution channels of funds in the BNY Mellon fund complex (such as retail direct or intermediary, in which intermediaries typically are paid by the fund and/or the Adviser) and the Adviser’s corresponding need for broad, deep, and diverse resources to be able to provide ongoing shareholder services to each intermediary or distribution channel, as applicable to the fund.
The Board also considered research support available to, and portfolio management capabilities of, the fund’s portfolio management personnel and that the Adviser also provides oversight of day-to-day fund operations, including fund accounting and administration and assistance in meeting legal and regulatory requirements. The Board also considered the Adviser’s extensive administrative, accounting and compliance infrastructures. The Board also considered portfolio management’s brokerage policies and practices (including policies and practices regarding soft dollars) and the standards applied in seeking best execution.
Comparative Analysis of the Fund’s Performance and Management Fee and Expense Ratio. The Board reviewed reports prepared by Broadridge Financial Solutions, Inc. (“Broadridge”), an independent provider of investment company data based on classifications provided by Thomson Reuters Lipper, which included information comparing (1) the performance of the fund’s Class I shares with the performance of a group of institutional mid-cap core funds selected by Broadridge as comparable to the fund (the “Performance Group”) and with a broader group of funds consisting of all retail and institutional mid-cap core funds (the “Performance Universe”), all for various periods ended June 30, 2020, and (2) the fund’s actual and contractual management fees and total expenses with those of the same group of funds in the Performance Group (the “Expense Group”) and with a broader group of all institutional mid-cap core funds,
34
excluding outliers (the “Expense Universe”), the information for which was derived in part from fund financial statements available to Broadridge as of the date of its analysis. The Adviser previously had furnished the Board with a description of the methodology Broadridge used to select the Performance Group and Performance Universe and the Expense Group and Expense Universe.
Performance Comparisons. Representatives of the Adviser stated that the usefulness of performance comparisons may be affected by a number of factors, including different investment limitations and policies that may be applicable to the fund and comparison funds and the end date selected. The Board discussed with representatives of the Adviser the results of the comparisons and considered that the fund’s total return performance was above the Performance Group median for all periods except the two- and three-year periods when it was below the Performance Group median, and above the Performance Universe median for all periods except the two- and five-year periods when it was below the Performance Universe median. The Board considered the relative proximity of the fund’s performance to the Performance Universe medians when performance was below median. The Adviser also provided a comparison of the fund’s calendar year total returns to the returns of the fund’s benchmark index.
Management Fee and Expense Ratio Comparisons. The Board reviewed and considered the contractual management fee rate payable by the fund to the Adviser in light of the nature, extent and quality of the management services provided by the Adviser. In addition, the Board reviewed and considered the actual management fee rate paid by the fund over the fund’s last fiscal year. The Board also reviewed the range of actual and contractual management fees and total expenses as a percentage of average net assets of the Expense Group and Expense Universe funds and discussed the results of the comparisons. The Board considered that the fund’s contractual management fee was lower than the Expense Group median contractual management fee, the fund’s actual management fee was lower than the Expense Group median and higher than the Expense Universe median actual management fee and the fund’s total expenses were higher than the Expense Group and Expense Universe median total expenses.
Representatives of the Adviser reviewed with the Board the management or investment advisory fees (1) paid by funds advised or administered by the Adviser that are in the same Lipper category as the fund and (2) paid to the Adviser, or the primary employer of the fund’s primary portfolio manager(s) that is affiliated with the Adviser, for advising any separate accounts and/or other types of client portfolios that are considered to have similar investment strategies and policies as the fund (the “Similar Clients”), and explained the nature of the Similar Clients. They discussed differences in fees paid and the relationship of the fees paid in light of any differences in the services provided and other relevant factors. The Board considered the relevance of the fee information provided for the Similar Clients to evaluate the appropriateness of the fund’s management fee.
Analysis of Profitability and Economies of Scale. Representatives of the Adviser reviewed the expenses allocated and profit received by the Adviser and its affiliates and the resulting profitability percentage for managing the fund and the aggregate
35
INFORMATION ABOUT THE RENEWAL OF THE FUND’S MANAGEMENT AGREEMENT (Unaudited) (continued)
profitability percentage to the Adviser and its affiliates for managing the funds in the BNY Mellon fund complex, and the method used to determine the expenses and profit. The Board concluded that the profitability results were not excessive, given the services rendered and service levels provided by the Adviser and its affiliates. The Board also had been provided with information prepared by an independent consulting firm regarding the Adviser’s approach to allocating costs to, and determining the profitability of, individual funds and the entire BNY Mellon fund complex. The consulting firm also had analyzed where any economies of scale might emerge in connection with the management of a fund.
The Board considered, on the advice of its counsel, the profitability analysis (1) as part of its evaluation of whether the fees under the Agreement, considered in relation to the mix of services provided by the Adviser, including the nature, extent and quality of such services, supported the renewal of the Agreement and (2) in light of the relevant circumstances for the fund and the extent to which economies of scale would be realized if the fund grows and whether fee levels reflect these economies of scale for the benefit of fund shareholders. Representatives of the Adviser stated that a discussion of economies of scale is predicated on a fund having achieved a substantial size with increasing assets and that, if a fund’s assets had been stable or decreasing, the possibility that the Adviser may have realized any economies of scale would be less. Representatives of the Adviser also stated that, as a result of shared and allocated costs among funds in the BNY Mellon fund complex, the extent of economies of scale could depend substantially on the level of assets in the complex as a whole, so that increases and decreases in complex-wide assets can affect potential economies of scale in a manner that is disproportionate to, or even in the opposite direction from, changes in the fund’s asset level. The Board also considered potential benefits to the Adviser from acting as investment adviser and took into consideration the soft dollar arrangements in effect for trading the fund’s investments.
At the conclusion of these discussions, the Board agreed that it had been furnished with sufficient information to make an informed business decision with respect to the renewal of the Agreement. Based on the discussions and considerations as described above, the Board concluded and determined as follows.
· The Board concluded that the nature, extent and quality of the services provided by the Adviser are adequate and appropriate.
· The Board was satisfied with the fund’s improved performance.
· The Board concluded that the fee paid to the Adviser continued to be appropriate under the circumstances and in light of the factors and the totality of the services provided as discussed above, subject to renewal no later than the next renewal consideration.
· The Board determined that the economies of scale which may accrue to the Adviser and its affiliates in connection with the management of the fund had been adequately considered by the Adviser in connection with the fee rate
36
charged to the fund pursuant to the Agreement and that, to the extent in the future it were determined that material economies of scale had not been shared with the fund, the Board would seek to have those economies of scale shared with the fund.
In evaluating the Agreement, the Board considered these conclusions and determinations and also relied on its previous knowledge, gained through meetings and other interactions with the Adviser and its affiliates, of the Adviser and the services provided to the fund by the Adviser. The Board also relied on information received on a routine and regular basis throughout the year relating to the operations of the fund and the investment management and other services provided under the Agreement, including information on the investment performance of the fund in comparison to similar mutual funds and benchmark performance indices; general market outlook as applicable to the fund; and compliance reports. In addition, the Board’s consideration of the contractual fee arrangements for the fund had the benefit of a number of years of reviews of the Agreement for the fund, or substantially similar agreements for other BNY Mellon funds that the Board oversees, during which lengthy discussions took place between the Board and representatives of the Adviser. Certain aspects of the arrangements may receive greater scrutiny in some years than in others, and the Board’s conclusions may be based, in part, on their consideration of the fund’s arrangements, or substantially similar arrangements for other BNY Mellon funds that the Board oversees, in prior years. The Board determined to renew the Agreement for the remainder of the one-year term.
37
LIQUIDITY RISK MANAGEMENT PROGRAM (Unaudited)
Effective June 1, 2019, the fund adopted a liquidity risk management program (the “Liquidity Risk Management Program”) pursuant to the requirements of Rule 22e-4 under the Investment Company Act of 1940, as amended. Rule 22e-4 requires registered open-end funds, including mutual funds and exchange-traded funds but not money market funds, to establish liquidity risk management programs in order to effectively manage fund liquidity and shareholder redemptions. The rule is designed to mitigate the risk that a fund could not meet redemption requests without significantly diluting the interests of remaining investors.
The rule requires the funds to assess, manage and review their liquidity risk at least annually considering applicable factors such as investment strategy and liquidity during normal and foreseeable stressed conditions, including whether the strategy is appropriate for an open-end fund and whether the fund has a relatively concentrated portfolio or large positions in particular issuers. The fund must also assess its use of borrowings and derivatives, short-term and long-term cash flow projections in normal and stressed conditions, holdings of cash and cash equivalents, and borrowing arrangements and other funding sources.
The rule also requires the fund to classify its investments as highly liquid, moderately liquid, less liquid or illiquid based on the number of days the fund expects it would take to liquidate the investment, and to review these classifications at least monthly or more often under certain conditions. The periods range from three or fewer business days for a highly liquid investment to greater than seven calendar days for settlement of a less liquid investment. Illiquid investments are those a fund does not expect to be able to sell or dispose of within seven calendar days without significantly changing the market value. The fund is prohibited from acquiring an investment if, after the acquisition, its holdings of illiquid assets will exceed 15% of its net assets. In addition, if a fund permits redemptions in-kind, the rule requires the fund to establish redemption in-kind policies and procedures governing how and when it will engage in such redemptions.
Pursuant to the rule’s requirements, the Liquidity Risk Management Program has been reviewed and approved by the fund’s board. Furthermore, the board has received a written report prepared by the Program’s Administrator that addresses the operation of the Program, assesses its adequacy and effectiveness and describes any material changes made to the Program.
Assessment of Program
In the opinion of the Program Administrator, the Program approved by the fund board continues to be adequate for the fund and the Program has been implemented effectively. The Program Administrator has monitored the fund’s liquidity risk and the liquidity classification of the securities held by the fund and has determined that the Program is operating effectively.
During the period from June 1, 2019 to March 31, 2020, there were no material changes to the Program and no material liquidity events that impacted the fund. During the period, the fund held sufficient highly liquid assets to meet fund redemptions.
38
Under normal expected foreseeable fund redemption forecasts and foreseeable stressed fund redemption forecasts, the Program Administrator believes that the fund maintains sufficient highly liquid assets to meet expected fund redemptions.
39
BOARD MEMBERS INFORMATION (Unaudited)
INDEPENDENT BOARD MEMBERS
Joseph S. DiMartino (76)
Chairman of the Board (1995)
Principal Occupation During Past 5 Years:
· Director or Trustee of funds in the BNY Mellon Family of Funds and certain other entities (as described in the fund’s Statement of Additional Information) (1995-Present)
Other Public Company Board Memberships During Past 5 Years:
· CBIZ, Inc., a public company providing professional business services, products and solutions, Director (1997-Present)
No. of Portfolios for which Board Member Serves: 111
———————
Peggy C. Davis (77)
Board Member (2006)
Principal Occupation During Past 5 Years:
· Shad Professor of Law, New York University School of Law (1983-present)
No. of Portfolios for which Board Member Serves: 39
———————
Gina D. France (62)
Board Member (2019)
Principal Occupation During Past 5 Years:
· Founder, President and Chief Executive Officer, France Strategic Partners, a strategy and advisory firm serving corporate clients across the United States (2003 –Present)
· Corporate Director and Trustee (2004 – Present)
Other Public Company Board Memberships During Past 5 Years:
· Huntington Bancshares, a bank holding company headquartered in Columbus, Ohio, Director (2016 – Present)
· Cedar Fair, L.P., a publicly-traded partnership that owns and operates amusement parks and hotels in the U.S. and Canada, Director (2011 – Present)
· CBIZ, Inc., a public company providing professional business services, products and solutions, Director (2015 – Present)
· Baldwin Wallace University, Trustee (2013- 2019)
· FirstMerit Corporation, a diversified financial services company, Director (2004 – 2016)
No. of Portfolios for which Board Member Serves: 25
———————
40
Joan Gulley (72)
Board Member (2017)
Principal Occupation During Past 5 Years:
· PNC Financial Services Group, Inc.(1993-2014), Executive Vice President and Chief Human Resources Officer and Executive Committee Member (2008-2014)
· Director, Nantucket Library (2015-Present)
No. of Portfolios for which Board Member Serves: 44
———————
Robin A. Melvin (56)
Board Member (2012)
Principal Occupation During Past 5 Years:
· Co-chairman, Mentor Illinois, a non-profit organization dedicated to increasing the quantity and quality of mentoring services in Illinois; (2014-Present); Board member (2013-Present)
No. of Portfolios for which Board Member Serves: 89
———————
Once elected all Board Members serve for an indefinite term, but achieve Emeritus status upon reaching age 80. The address of the Board Members and Officers is c/o BNY Mellon Investment Adviser, Inc. 240 Greenwich Street, New York, New York 10286. Additional information about the Board Members is available in the fund’s Statement of Additional Information which can be obtained from the Adviser free of charge by calling this toll free number: 1-800-373-9387.
David P. Feldman, Emeritus Board Member
James F. Henry, Emeritus Board Member
Ehud Houmier, Emeritus Board Member
Lynn Martin, Emeritus Board Member
Dr. Martin Peretz, Emeritus Board Member
Philip L. Toia, Emeritus Board Member
41
OFFICERS OF THE FUND (Unaudited)
RENEE LAROCHE-MORRIS, President since May 2019.
President and a director of BNY Mellon Investment Adviser, Inc. since January 2018. She is an officer of 62 investment companies (comprised of 111 portfolios) managed by the Adviser. She is 49 years old and has been an employee of BNY Mellon since 2003.
JAMES WINDELS, Treasurer since November 2001.
Director-BNY Mellon Fund Administration, and an officer of 64 investment companies (comprised of 142 portfolios) managed by the Adviser or an affiliate of the Adviser. He is 61 years old and has been an employee of the Adviser since April 1985.
BENNETT A. MACDOUGALL, Chief Legal Officer since October 2015.
Chief Legal Officer of the Adviser and Associate General Counsel and Managing Director of BNY Mellon since June 2015; Director and Associate General Counsel of Deutsche Bank–Asset & Wealth Management Division from June 2005 to June 2015, and as Chief Legal Officer of Deutsche Investment Management Americas Inc. from June 2012 to May 2015. He is an officer of 64 investment companies (comprised of 142 portfolios) managed by the Adviser or an affiliate of the Adviser. He is 48 years old and has been an employee of the Adviser since June 2015.
DAVID DIPETRILLO, Vice President since May 2019.
Head of North America Product, BNY Mellon Investment Management since January 2018, Director of Product Strategy, BNY Mellon Investment Management from January 2016 to December 2017; Head of US Retail Product and Channel Marketing, BNY Mellon Investment Management from January 2014 to December 2015. He is an officer of 63 investment companies (comprised of 119 portfolios) managed by the Adviser or an affiliate of the Adviser. He is 42 years old and has been an employee of BNY Mellon since 2005.
JAMES BITETTO, Vice President since August 2005 and Secretary since February 2018.
Senior Managing Counsel of BNY Mellon since December 2019; Managing Counsel of BNY Mellon from April 2014 to December 2019; Secretary of the Adviser, and an officer of 64 investment companies (comprised of 142 portfolios) managed by the Adviser or an affiliate of the Adviser. He is 54 years old and has been an employee of the Adviser since December 1996.
SONALEE CROSS, Vice President and Assistant Secretary since March 2018.
Counsel of BNY Mellon since October 2016; Associate at Proskauer Rose LLP from April 2016 to September 2016; Attorney at EnTrust Capital from August 2015 to February 2016; Associate at Sidley Austin LLP from September 2013 to August 2015. She is an officer of 64 investment companies (comprised of 142 portfolios) managed by the Adviser or an affiliate of the Adviser. She is 32 years old and has been an employee of the Adviser since October 2016.
DEIRDRE CUNNANE, Vice President and Assistant Secretary since March 2019.
Counsel of BNY Mellon since August 2018; Senior Regulatory Specialist at BNY Mellon Investment Management Services from February 2016 to August 2018; Trustee Associate at BNY Mellon Trust Company (Ireland) Limited from August 2013 to February 2016. She is an officer of 64 investment companies (comprised of 142 portfolios) managed by the Adviser or an affiliate of the Adviser. She is 30 years old and has been an employee of the Adviser since August 2018.
SARAH S. KELLEHER, Vice President and Assistant Secretary since April 2014.
Managing Counsel of BNY Mellon since December 2017, Senior Counsel of BNY Mellon from March 2013 to December 2017. She is an officer of 64 investment companies (comprised of 142 portfolios) managed by the Adviser or an affiliate of the Adviser. She is 44 years old and has been an employee of the Adviser since March 2013.
JEFF PRUSNOFSKY, Vice President and Assistant Secretary since August 2005.
Senior Managing Counsel of BNY Mellon, and an officer of 64 investment companies (comprised of 142 portfolios) managed by the Adviser or an affiliate of the Adviser. He is 55 years old and has been an employee of the Adviser since October 1990.
AMANDA QUINN, Vice President and Assistant Secretary since March 2020.
Counsel of BNY Mellon since June 2019; Regulatory Administration Manager at BNY Mellon Investment Management Services from September 2018 to May 2019; Senior Regulatory Specialist at BNY Mellon Investment Management Services from April 2015 to August 2018. She is an officer of 64 investment companies (comprised of 142 portfolios) managed by the Adviser or an affiliate of the Adviser. She is 35 years old and has been an employee of the Adviser since June 2019.
42
PETER M. SULLIVAN, Vice President and Assistant Secretary since March 2019.
Managing Counsel of BNY Mellon since March 2009, Senior Counsel of BNY Mellon from April 2004 to March 2009, and an officer of 64 investment companies (comprised of 142 portfolios) managed by the Adviser or an affiliate of the Adviser. He is 52 years old and has been an employee of the Adviser since January 2019.
NATALYA ZELENSKY, Vice President and Assistant Secretary since March 2017.
Managing Counsel of BNY Mellon since December 2019; Counsel of BNY Mellon from May 2016 to December 2019; Attorney at Wildermuth Endowment Strategy Fund/Wildermuth Advisory, LLC from November 2015 to May 2016 and Assistant General Counsel at RCS Advisory Services from July 2014 to November 2015. She is an officer of 64 investment companies (comprised of 142 portfolios) managed by the Adviser or an affiliate of the Adviser. She is 35 years old and has been an employee of the Adviser since May 2016.
GAVIN C. REILLY, Assistant Treasurer since December 2005.
Tax Manager-BNY Mellon Fund Administration, and an officer of 64 investment companies (comprised of 142 portfolios) managed by the Adviser or an affiliate of the Adviser. He is 52 years old and has been an employee of the Adviser since April 1991.
ROBERT S. ROBOL, Assistant Treasurer since August 2005.
Senior Accounting Manager-BNY Mellon Fund Administration, and an officer of 64 investment companies (comprised of 142 portfolios) managed by the Adviser or an affiliate of the Adviser. He is 56 years old and has been an employee of the Adviser since October 1988.
ROBERT SALVIOLO, Assistant Treasurer since July 2007.
Senior Accounting Manager–BNY Mellon Fund Administration, and an officer of 64 investment companies (comprised of 142 portfolios) managed by the Adviser or an affiliate of the Adviser. He is 53 years old and has been an employee of the Adviser since June 1989.
ROBERT SVAGNA, Assistant Treasurer since December 2002.
Senior Accounting Manager–BNY Mellon Fund Administration, and an officer of 64 investment companies (comprised of 142 portfolios) managed by the Adviser or an affiliate of the Adviser. He is 53 years old and has been an employee of the Adviser since November 1990.
JOSEPH W. CONNOLLY, Chief Compliance Officer since October 2004.
Chief Compliance Officer of the Adviser, the BNY Mellon Family of Funds and BNY Mellon Funds Trust (63 investment companies, comprised of 134 portfolios). He is 63 years old and has served in various capacities with the Adviser since 1980, including manager of the firm’s Fund Accounting Department from 1997 through October 2001.
CARIDAD M. CAROSELLA, Anti-Money Laundering Compliance Officer since January 2016.
Anti-Money Laundering Compliance Officer of the BNY Mellon Family of Funds and BNY Mellon Funds Trust since January 2016; from May 2015 to December 2015, Interim Anti-Money Laundering Compliance Officer of the BNY Mellon Family of Funds and BNY Mellon Funds Trust and the Distributor; from January 2012 to May 2015, AML Surveillance Officer of the Distributor. She is an officer of 57 investment companies (comprised of 135 portfolios) managed by the Adviser or an affiliate of the Adviser. She is 52 years old and has been an employee of the Distributor since 1997.
43
This page intentionally left blank.
44
This page intentionally left blank.
45
BNY Mellon Opportunistic Midcap Value Fund
240 Greenwich Street
New York, NY 10286
Adviser
BNY Mellon Investment Adviser, Inc.
240 Greenwich Street
New York, NY 10286
Custodian
The Bank of New York Mellon
240 Greenwich Street
New York, NY 10286
Transfer Agent &
Dividend Disbursing Agent
BNY Mellon Transfer, Inc.
240 Greenwich Street
New York, NY 10286
Distributor
BNY Mellon Securities Corporation
240 Greenwich Street
New York, NY 10286
| | |
Ticker Symbols: | Class A: DMCVX Class C: DVLCX Class I: DVLIX Class Y: DMCYX |
Telephone Call your financial representative or 1-800-373-9387
Mail The BNY Mellon Family of Funds, 144 Glenn Curtiss Boulevard, Uniondale, NY 11556-0144
E-mail Send your request to info@bnymellon.com
Internet Information can be viewed online or downloaded at www.bnymellonim.com/us
The fund files its complete schedule of portfolio holdings with the Securities and Exchange Commission (“SEC”) for the first and third quarters of each fiscal year on Form N-PORT. The fund’s Forms N-PORT are available on the SEC’s website at www.sec.gov.
A description of the policies and procedures that the fund uses to determine how to vote proxies relating to portfolio securities and information regarding how the fund voted these proxies for the most recent 12-month period ended June 30 is available at www.bnymellonim.com/us and on the SEC’s website at www.sec.gov and without charge, upon request, by calling 1-800-373-9387.
| | |
© 2020 BNY Mellon Securities Corporation
0258AR0820 | 
|
BNY Mellon Opportunistic Small Cap Fund
| |
ANNUAL REPORT August 31, 2020 |
| |
Save time. Save paper. View your next shareholder report online as soon as it’s available. Log into www.bnymellonim.com/us and sign up for eCommunications. It’s simple and only takes a few minutes. |
| |
The views expressed in this report reflect those of the portfolio manager(s) only through the end of the period covered and do not necessarily represent the views of BNY Mellon Investment Adviser, Inc. or any other person in the BNY Mellon Investment Adviser, Inc. organization. Any such views are subject to change at any time based upon market or other conditions and BNY Mellon Investment Adviser, Inc. disclaims any responsibility to update such views. These views may not be relied on as investment advice and, because investment decisions for a fund in the BNY Mellon Family of Funds are based on numerous factors, may not be relied on as an indication of trading intent on behalf of any fund in the BNY Mellon Family of Funds. |
| |
Not FDIC-Insured • Not Bank-Guaranteed • May Lose Value |
Contents
THE FUND
FOR MORE INFORMATION
Back Cover
| | | | |
| |
BNY Mellon Opportunistic Small Cap Fund
| | The Fund |
A LETTER FROM THE PRESIDENT OF BNY MELLON INVESTMENT ADVISER, INC.
Dear Shareholder:
We are pleased to present this annual report for BNY Mellon Opportunistic Small Cap Fund, covering the 12-month period from September 1, 2019 through August 31, 2020. For information about how the fund performed during the reporting period, as well as general market perspectives, we provide a Discussion of Fund Performance on the pages that follow.
Early in the reporting period, positive investor sentiment fueled an equity rally. Accommodative rate policies from the U.S. Federal Reserve (the “Fed”) and progress towards a U.S./China trade deal stoked optimism about future economic growth prospects. As the calendar year turned over, this optimism turned to concern, as COVID-19 began to spread across China, adjacent areas of the Pacific Rim and parts of Europe. When the virus spread throughout the U.S. in March 2020, stocks began to show signs of volatility and posted historic losses during the month. Investor angst over the possible economic impact of a widespread quarantine worked to depress equity valuations. Global central banks and governments worked to enact emergency stimulus measures to support their respective economies and equity valuations began to rebound, trending upward for the remainder of the period.
In fixed-income markets, interest rates were heavily influenced by changes in Fed policy and investor concern over COVID-19. In 2019, as stocks rallied in response to Fed rate cuts, risk-asset valuations also rose while Treasuries lagged. When COVID-19 began to emerge, a flight to quality ensued and Treasury rates fell significantly. March 2020 brought extreme volatility and risk-asset spread widening. The Fed cut rates twice in March, resulting in an overnight lending target rate of nearly zero, and the government launched a large stimulus package; many governments and central banks around the globe followed suit. At their meeting in August 2020, the Fed confirmed their commitment to a “lower-for-longer” rate policy.
We believe the near-term outlook for the U.S. will be challenging, as the country curbs the spread of COVID-19. However, we are confident that ongoing central bank and government policy responses can continue to support economic progress. As always, we will monitor relevant data for any signs of a change. We encourage you to discuss the risks and opportunities in today’s investment environment with your financial advisor.
Thank you for your continued confidence and support.
Sincerely,

Renee LaRoche-Morris
President
BNY Mellon Investment Adviser, Inc.
September 15, 2020
2
DISCUSSION OF FUND PERFORMANCE (Unaudited)
For the period from September 1, 2019 through August 31, 2020, as provided by R. Patrick Kent, lead portfolio manager and James Boyd portfolio manager.
Market and Fund Performance Overview
For the 12-month period ended August 31, 2020, BNY Mellon Opportunistic Small Cap Fund’s Investor shares achieved a total return of 8.44%, Class I shares returned 8.63% and Class Y shares returned 8.81%.1 In comparison, the fund’s benchmark, the Russell 2000® Index (the “Index”), produced a total return of 6.02% for the same period.2
Small-cap stocks gained over the reporting period amid improving corporate earnings and ongoing economic recovery. The fund outperformed the Index, mainly due to favorable results in the real estate, financial, materials and information technology sectors.
The Fund’s Investment Approach
The fund seeks capital appreciation. The fund normally invests at least 80% of its net assets in the stocks of small-cap companies. The fund currently considers small-cap companies to be those companies with market capitalizations that fall within the range of companies in the Index. Stocks are selected for the fund’s portfolio based primarily on bottom-up fundamental analysis. The fund’s team of portfolio managers uses a disciplined investment process that relies, in general, on proprietary fundamental research and valuation. Generally, elements of the process include analysis of mid-cycle business prospects, estimation of the intrinsic value of the company and the identification of a revaluation trigger. The fund’s portfolio managers invest in securities and sectors that they perceive to be attractive from a valuation and fundamental standpoint.
Stocks Rebound from Pandemic
The reporting period began with the market continuing to benefit from a shift in Federal Reserve (the “Fed”) policy, which had been prompted by concerns about economic growth and corporate earnings. Late in 2019, the Fed implemented three rate cuts, as trade tensions and other geopolitical concerns appeared to be weighing on economic growth. Other major central banks also enacted supportive policies. Stocks also benefited from the announcement of a “Phase One” trade deal between the U.S. and China, and from the approval of the new U.S.-Mexico-Canada Trade Agreement.
Early in 2020, developed markets experienced a correction amid growing concerns about the COVID-19 virus, erasing the gain that occurred late in 2019. As a result, the Fed reduced the federal funds rate twice in March, bringing the target rate down to 0-0.25%. In addition, the Fed and other central banks initiated various programs to ease liquidity concerns in certain markets, and government authorities introduced programs to keep small businesses afloat. Steps were also taken to provide relief to employees who had lost their jobs as a result of government-mandated business shutdowns.
In the second half of the reporting period, the economy began to show signs of recovery. Retail sales rebounded, and the outlook for manufacturing also improved dramatically. Job creation also surged, beating economists’ expectations. Unemployment dropped sharply, and markets began to rebound as relief programs took effect, government shutdowns began to ease, and hope for a COVID-19 vaccine or effective therapy took hold.
Performance Boosted by Asset Allocation and Stock Selection
The fund’s outperformance versus the benchmark stemmed primarily from asset allocation and stock selections in the real estate and financial sectors. Stock selection in information technology and materials also contributed positively. In the real estate sector, an underweight helped performance, as retail, office and hospitality segments were harmed by the impact of COVID-19. But the fund also owned shares of CoreSite Realty, a data center, real estate investment trust, which performed well. The
3
DISCUSSION OF FUND PERFORMANCE (Unaudited) (continued)
fund was also helped by an underweight position in the financial sector and benefited from positions in two specialty insurance companies, Palomar Holdings and BRP Group, which experienced strong premium growth. In the information technology sector, a position in Everbridge, which makes software for critical event management, performed well. Shares of Cloudera, a data storage software maker, were also advantageous. In the materials sector, two positions in the gold mining industry helped the fund’s performance. Higher gold prices were beneficial to shares of IAMGOLD Corporation and Alamos Gold, both of which were also supported by improving efficiencies. Shares of Louisiana-Pacific, a forest products company, also contributed positively, as the company benefited from strong demand from the homebuilding industry.
On a less positive note, the fund was hampered by asset allocation and security selection in certain sectors. In the health care sector, the fund’s underweight position was detrimental, especially its underweight position in the richly valued biotech industry. In addition, a position in Sage Therapeutics contributed negatively, as it was hurt by poor results in a major drug trial. Shares of Aerie Pharmaceuticals also hindered returns, as it experienced a slow adoption of a new product. In the industrial sector, the fund was hurt by exposure to the airline industry, which suffered a sharp decline as a result of COVID-19. Fund performance was also hindered by shares of The Brinks Company, a security company, which experienced a decline in demand as consumers opted for credit cards over cash in their daily transactions.
Despite Continued Uncertainty, Optimistic about 2021
Although stocks have experienced a strong recovery since bottoming in the first quarter of 2020, the pace of economic recovery is uncertain, and another consolidation in the market is possible. Nevertheless, we are optimistic about 2021. Supportive monetary policy is also likely to benefit this segment of the equity universe. Although small-cap stocks have lagged, we believe once the recovery is on more solid footing and a vaccine or therapeutic treatment is widely available, they may benefit more than other segments of the market. Companies with higher operating leverage may also benefit, especially as the economy continues to recover. The team believes the current market volatility may be laying the foundation for one of the most favorable investment environments for this segment in the last several years.
September 15, 2020
1 Total return includes reinvestment of dividends and any capital gains paid. Past performance is no guarantee of future results. Share price and investment return fluctuate such that upon redemption, fund shares may be worth more or less than their original cost.
2 Source: Lipper Inc. — The Russell 2000® Index measures the performance of the small-cap segment of the U.S. equity universe. The Russell 2000® Index is a subset of the Russell 3000® Index representing approximately 10% of the total market capitalization of that index. It includes approximately 2,000 of the smallest securities based on a combination of their market cap and current index membership. The Russell 2000 is constructed to provide a comprehensive and unbiased, small-cap barometer and is completely reconstituted annually to ensure larger stocks do not distort the performance and characteristics of the true small-cap opportunity set. Investors cannot invest directly in any index.
Please note: the position in any security highlighted with italicized typeface was sold during the reporting period.
Equities are subject generally to market, market sector, market liquidity, issuer and investment style risks, among other factors, to varying degrees, all of which are more fully described in the fund’s prospectus.
Stocks of small- and/or mid-cap companies often experience sharper price fluctuations than stocks of large-cap companies.
Recent market risks include pandemic risks related to COVID-19. The effects of COVID-19 have contributed to increased volatility in global markets and will likely affect certain countries, companies, industries and market sectors more dramatically than others. To the extent the fund may overweight its investments in certain countries, companies, industries or market sectors, such positions will increase the fund's exposure to risk of loss from adverse developments affecting those countries, companies, industries or sectors.
4
FUND PERFORMANCE (Unaudited)
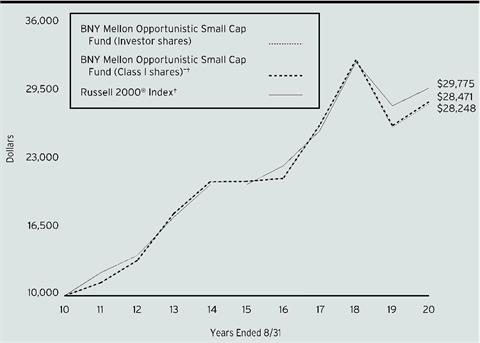
Comparison of change in value of a $10,000 investment in Investor shares and Class I shares of BNY Mellon Opportunistic Small Cap Fund with a hypothetical investment of $10,000 in the Russell 2000® Index (the “Index’)
† Source: Lipper Inc.
†† The total return figures presented for Class I shares of the fund reflect the performance of the fund’s Investor shares for the period prior to 9/30/16 (the inception date for Class I shares).
Past performance is not predictive of future performance.
The above graph compares a hypothetical $10,000 investment made in each of the Investor shares and Class I shares of BNY Mellon Opportunistic Small Cap Fund on 8/31/10 to a hypothetical investment of $10,000 made in the Index on that date. All dividends and capital gain distributions are reinvested.
The fund’s performance shown in the line graph above takes into account all applicable fees and expenses on Investor shares and Class I shares. The Index measures the performance of the small-cap segment of the U.S. equity universe. The Index is a subset of the Russell 3000® Index representing approximately 10% of the total market capitalization of that index. It includes approximately 2,000 of the smallest securities based on a combination of their market cap and current index membership. The Index is constructed to provide a comprehensive and unbiased small-cap barometer and is completely reconstituted annually to ensure larger stocks do not distort the performance and characteristics of the true small-cap opportunity set. Unlike a mutual fund, the Index is not subject to charges, fees and other expenses. Investors cannot invest directly in any index. Further information relating to fund performance, including expense reimbursements, if applicable, is contained in the Financial Highlights section of the prospectus and elsewhere in this report.
5
FUND PERFORMANCE (Unaudited) (continued)
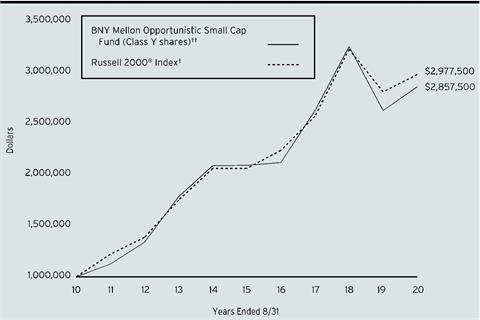
Comparison of change in value of a $1,000,000 investment in Class Y shares of BNY Mellon Opportunistic Small Cap Fund with a hypothetical investment of $1,000,000 in the Russell 2000® Index (the “Index’)
† Source: Lipper Inc.
†† The total return figures presented for Class Y shares of the fund reflect the performance of the fund’s Investor shares for the period prior to 9/30/16 (the inception date for Class Y shares).
Past performance is not predictive of future performance.
The above graph compares a hypothetical $1,000,000 investment made in Class Y shares of BNY Mellon Opportunistic Small Cap Fund on 8/31/10 to a hypothetical investment of $1,000,000 made in the Index on that date. All dividends and capital gain distributions are reinvested.
The fund’s performance shown in the line graph above takes into account all applicable fees and expenses on Class Y shares. The Index measures the performance of the small-cap segment of the U.S. equity universe. The Index is a subset of the Russell 3000® Index representing approximately 10% of the total market capitalization of that index. It includes approximately 2,000 of the smallest securities based on a combination of their market cap and current index membership. The Index is constructed to provide a comprehensive and unbiased small-cap barometer and is completely reconstituted annually to ensure larger stocks do not distort the performance and characteristics of the true small-cap opportunity set. Unlike a mutual fund, the Index is not subject to charges, fees and other expenses. Investors cannot invest directly in any index. Further information relating to fund performance, including expense reimbursements, if applicable, is contained in the Financial Highlights section of the prospectus and elsewhere in this report.
6
| | | | | |
Average Annual Total Returns as of 8/31/2020 | |
| Inception
Date | 1 Year | 5 Years | 10 Years |
Investor shares | 11/16/1993 | 8.44% | 6.21% | 10.94% |
Class I shares | 9/30/2016 | 8.63% | 6.38%† | 11.03%† |
Class Y shares | 9/30/2016 | 8.81% | 6.46%† | 11.07%† |
Russell 2000® Index | | 6.02% | 7.65% | 11.53% |
† The total return performance figures presented for Class I shares of the fund reflect the performance of the fund’s Investor shares for the period prior to 9/30/16 (the inception date for Class I shares).
The total return performance figures presented for Class Y shares of the fund reflect the performance of the fund’s Investor shares for the period prior to 9/30/16 (the inception date for Class Y shares).
The performance data quoted represents past performance, which is no guarantee of future results. Share price and investment return fluctuate and an investor’s shares may be worth more or less than original cost upon redemption. Current performance may be lower or higher than the performance quoted. Go to www.bnymellonim.com/us for the fund’s most recent month-end returns.
The fund’s performance shown in the graphs and table does not reflect the deduction of taxes that a shareholder would pay on fund distributions or the redemption of fund shares.
7
UNDERSTANDING YOUR FUND’S EXPENSES (Unaudited)
As a mutual fund investor, you pay ongoing expenses, such as management fees and other expenses. Using the information below, you can estimate how these expenses affect your investment and compare them with the expenses of other funds. You also may pay one-time transaction expenses, including sales charges (loads) and redemption fees, which are not shown in this section and would have resulted in higher total expenses. For more information, see your fund’s prospectus or talk to your financial adviser.
Review your fund’s expenses
The table below shows the expenses you would have paid on a $1,000 investment in BNY Mellon Opportunistic Small Cap Fund from March 1, 2020 to August 31, 2020. It also shows how much a $1,000 investment would be worth at the close of the period, assuming actual returns and expenses.
| | | | | | |
Expenses and Value of a $1,000 Investment | |
Assume actual returns for the six months ended August 31, 2020 | |
| | | | | |
| | Investor Shares | Class I | Class Y | |
Expense paid per $1,000† | $6.13 | $5.29 | $4.50 | |
Ending value (after expenses) | $1,102.30 | $1,103.30 | $1,104.40 | |
COMPARING YOUR FUND’S EXPENSES
WITH THOSE OF OTHER FUNDS (Unaudited)
Using the SEC’s method to compare expenses
The Securities and Exchange Commission (“SEC”) has established guidelines to help investors assess fund expenses. Per these guidelines, the table below shows your fund’s expenses based on a $1,000 investment, assuming a hypothetical 5% annualized return. You can use this information to compare the ongoing expenses (but not transaction expenses or total cost) of investing in the fund with those of other funds. All mutual fund shareholder reports will provide this information to help you make this comparison. Please note that you cannot use this information to estimate your actual ending account balance and expenses paid during the period.
| | | | | | |
Expenses and Value of a $1,000 Investment | |
Assuming a hypothetical 5% annualized return for the six months ended August 31, 2020 | |
| | | | | |
| | Investor Shares | Class I | Class Y | |
Expense paid per $1,000† | $5.89 | $5.08 | $4.32 | |
Ending value (after expenses) | $1,019.30 | $1,020.11 | $1,020.86 | |
†Expenses are equal to the fund’s annualized expense ratio of 1.16% for Investor Shares, 1.00% for Class I and .85% for Class Y, multiplied by the average account value over the period, multiplied by 184/366 (to reflect the one-half year period). |
8
STATEMENT OF INVESTMENTS
August 31, 2020
| | | | | | | | |
| |
Description | | | | Shares | | Value ($) | |
Common Stocks - 96.9% | | | | | |
Banks - 3.6% | | | | | |
Essent Group | | | | 110,175 | | 3,933,247 | |
First Bancorp | | | | 706,622 | | 4,048,944 | |
First Interstate BancSystem, Cl. A | | | | 130,952 | | 4,295,226 | |
First Merchants | | | | 94,747 | | 2,423,628 | |
| | | | | 14,701,045 | |
Capital Goods - 10.4% | | | | | |
Advanced Drainage Systems | | | | 56,552 | | 3,137,505 | |
Aerojet Rocketdyne Holdings | | | | 152,315 | a | 6,301,272 | |
American Woodmark | | | | 31,400 | a | 2,747,500 | |
Builders FirstSource | | | | 159,344 | a | 4,879,113 | |
Fortress Value Acquisition, Cl. A | | | | 238,353 | a | 3,217,765 | |
Masonite International | | | | 82,563 | a | 7,537,176 | |
Maxar Technologies | | | | 15,996 | | 370,307 | |
Quanta Services | | | | 114,665 | | 5,876,581 | |
Tennant | | | | 38,312 | | 2,546,599 | |
Valmont Industries | | | | 47,063 | | 5,979,354 | |
| | | | | 42,593,172 | |
Commercial & Professional Services - 7.1% | | | | | |
ADT | | | | 378,045 | b | 4,026,179 | |
Clarivate | | | | 395,845 | a | 11,653,677 | |
Clean Harbors | | | | 50,530 | a | 3,087,383 | |
Covanta Holding | | | | 508,848 | | 4,803,525 | |
Interface | | | | 228,706 | | 1,729,017 | |
The Brink's Company | | | | 73,505 | | 3,554,702 | |
| | | | | 28,854,483 | |
Consumer Durables & Apparel - 6.3% | | | | | |
Century Communities | | | | 112,361 | a | 4,009,040 | |
KB Home | | | | 162,821 | | 5,822,479 | |
Skyline Champion | | | | 147,667 | a | 4,214,416 | |
Taylor Morrison Home | | | | 291,897 | a | 6,868,336 | |
YETI Holdings | | | | 95,841 | a | 4,924,311 | |
| | | | | 25,838,582 | |
Consumer Services - 3.2% | | | | | |
Cracker Barrel Old Country Store | | | | 17,418 | | 2,328,961 | |
Houghton Mifflin Harcourt | | | | 1,035,929 | a | 2,341,200 | |
OneSpaWorld Holdings | | | | 239,017 | b | 1,656,388 | |
Papa John's International | | | | 69,167 | | 6,798,424 | |
| | | | | 13,124,973 | |
Diversified Financials - 3.1% | | | | | |
PJT Partners, Cl. A | | | | 152,119 | | 9,002,402 | |
9
STATEMENT OF INVESTMENTS (continued)
| | | | | | | | |
| |
Description | | | | Shares | | Value ($) | |
Common Stocks - 96.9% (continued) | | | | | |
Diversified Financials - 3.1% (continued) | | | | | |
PRA Group | | | | 77,982 | a | 3,639,810 | |
| | | | | 12,642,212 | |
Energy - 1.7% | | | | | |
Ardmore Shipping | | | | 191,742 | | 709,445 | |
PBF Energy, Cl. A | | | | 330,757 | | 2,831,280 | |
Scorpio Tankers | | | | 117,556 | b | 1,391,863 | |
Select Energy Services, Cl. A | | | | 443,002 | a | 2,113,120 | |
| | | | | 7,045,708 | |
Food, Beverage & Tobacco - 1.4% | | | | | |
Darling Ingredients | | | | 182,309 | a | 5,828,419 | |
Health Care Equipment & Services - 6.9% | | | | | |
Acadia Healthcare | | | | 192,814 | a,b | 5,959,881 | |
AdaptHealth | | | | 237,299 | a | 5,037,858 | |
Health Catalyst | | | | 205,937 | a,b | 6,421,116 | |
Molina Healthcare | | | | 18,903 | a | 3,496,488 | |
R1 RCM | | | | 168,835 | a | 2,448,107 | |
Tabula Rasa HealthCare | | | | 95,708 | a,b | 4,842,825 | |
| | | | | 28,206,275 | |
Insurance - 4.6% | | | | | |
BRP Group, Cl. A | | | | 188,809 | a | 5,194,136 | |
Palomar Holdings | | | | 78,000 | a | 8,763,300 | |
The Hanover Insurance Group | | | | 48,975 | | 5,019,448 | |
| | | | | 18,976,884 | |
Materials - 9.0% | | | | | |
Alamos Gold, Cl. A | | | | 1,081,903 | | 11,316,705 | |
Cabot | | | | 123,414 | | 4,567,552 | |
Eagle Materials | | | | 50,655 | | 4,142,059 | |
IAMGOLD | | | | 1,289,651 | a | 5,532,603 | |
Louisiana-Pacific | | | | 254,674 | | 8,388,962 | |
Norbord | | | | 86,038 | b | 2,942,500 | |
| | | | | 36,890,381 | |
Media & Entertainment - 3.5% | | | | | |
Cardlytics | | | | 87,900 | a,b | 6,667,215 | |
EverQuote, Cl. A | | | | 103,000 | a,b | 3,656,500 | |
Nexstar Media Group, Cl. A | | | | 43,273 | b | 4,154,641 | |
| | | | | 14,478,356 | |
Pharmaceuticals Biotechnology & Life Sciences - 10.1% | | | | | |
Aerie Pharmaceuticals | | | | 221,364 | a,b | 2,435,004 | |
Arena Pharmaceuticals | | | | 56,278 | a | 3,929,330 | |
Denali Therapeutics | | | | 110,760 | a,b | 3,533,244 | |
FibroGen | | | | 43,780 | a | 1,962,657 | |
Generation Bio | | | | 52,304 | a | 1,633,454 | |
GW Pharmaceuticals, ADR | | | | 20,504 | a,b | 2,131,391 | |
10
| | | | | | | | |
| |
Description | | | | Shares | | Value ($) | |
Common Stocks - 96.9% (continued) | | | | | |
Pharmaceuticals Biotechnology & Life Sciences - 10.1% (continued) | | | | | |
Invitae | | | | 164,734 | a,b | 5,759,101 | |
PTC Therapeutics | | | | 29,994 | a | 1,482,453 | |
Syneos Health | | | | 96,935 | a | 6,116,598 | |
Ultragenyx Pharmaceutical | | | | 48,506 | a,b | 4,125,920 | |
uniQure | | | | 58,075 | a | 2,367,718 | |
Voyager Therapeutics | | | | 56,981 | a | 671,806 | |
Xenon Pharmaceuticals | | | | 206,172 | a | 2,504,990 | |
Zogenix | | | | 119,079 | a | 2,818,600 | |
| | | | | 41,472,266 | |
Real Estate - 5.5% | | | | | |
Colliers International Group | | | | 74,478 | | 4,717,437 | |
CoreSite Realty | | | | 49,327 | c | 6,040,091 | |
Redfin | | | | 248,273 | a,b | 11,810,347 | |
| | | | | 22,567,875 | |
Semiconductors & Semiconductor Equipment - 1.6% | | | | | |
Diodes | | | | 129,545 | a | 6,329,569 | |
Software & Services - 8.4% | | | | | |
Cardtronics, Cl. A | | | | 106,191 | a | 2,305,407 | |
Cloudera | | | | 684,793 | a,b | 9,046,116 | |
Everbridge | | | | 56,168 | a,b | 8,347,126 | |
EVERTEC | | | | 133,551 | | 4,676,956 | |
Medallia | | | | 92,094 | a | 3,332,882 | |
Mimecast | | | | 136,478 | a | 6,720,177 | |
| | | | | 34,428,664 | |
Technology Hardware & Equipment - 2.3% | | | | | |
Ciena | | | | 162,547 | a | 9,227,793 | |
Transportation - 5.1% | | | | | |
Knight-Swift Transportation Holdings | | | | 166,414 | b | 7,565,180 | |
Scorpio Bulkers | | | | 10,701 | | 149,493 | |
SkyWest | | | | 199,727 | | 6,720,814 | |
Werner Enterprises | | | | 138,150 | | 6,356,281 | |
| | | | | 20,791,768 | |
Utilities - 3.1% | | | | | |
Clearway Energy, Cl. C | | | | 271,277 | | 6,920,276 | |
NextEra Energy Partners | | | | 95,763 | b | 5,776,424 | |
| | | | | 12,696,700 | |
Total Common Stocks (cost $334,172,627) | | | | 396,695,125 | |
| | | | | | | | |
Exchange-Traded Funds - .6% | | | | | |
Registered Investment Companies - .6% | | | | | |
iShares Russell 2000 ETF
(cost $2,681,471) | | | | 17,067 | b | 2,652,724 | |
11
STATEMENT OF INVESTMENTS (continued)
| | | | | | | | |
| |
Description | | 1-Day
Yield (%) | | Shares | | Value ($) | |
Investment Companies - 1.8% | | | | | |
Registered Investment Companies - 1.8% | | | | | |
Dreyfus Institutional Preferred Government Plus Money Market Fund
(cost $7,279,944) | | 0.20 | | 7,279,944 | d | 7,279,944 | |
| | | | | | | | |
Investment of Cash Collateral for Securities Loaned - 6.3% | | | | | |
Registered Investment Companies - 6.3% | | | | | |
Dreyfus Institutional Preferred Government Plus Money Market Fund
(cost $25,843,586) | | 0.20 | | 25,843,586 | d | 25,843,586 | |
Total Investments (cost $369,977,628) | | 105.6% | | 432,471,379 | |
Liabilities, Less Cash and Receivables | | (5.6%) | | (22,991,088) | |
Net Assets | | 100.0% | | 409,480,291 | |
ADR—American Depository Receipt
ETF—Exchange-Traded Fund
aNon-income producing security.
bSecurity, or portion thereof, on loan. At August 31, 2020, the value of the fund’s securities on loan was $75,686,370 and the value of the collateral was $79,179,043, consisting of cash collateral of $25,843,586 and U.S. Government & Agency securities valued at $53,335,457.
cInvestment in real estate investment trust within the United States.
dInvestment in affiliated issuer. The investment objective of this investment company is publicly available and can be found within the investment company’s prospectus.
| | |
Portfolio Summary (Unaudited) † | Value (%) |
Industrials | 21.9 |
Health Care | 17.0 |
Information Technology | 12.2 |
Financials | 11.3 |
Consumer Discretionary | 9.5 |
Materials | 9.0 |
Investment Companies | 8.7 |
Real Estate | 5.5 |
Communication Services | 3.5 |
Utilities | 3.1 |
Energy | 1.7 |
Consumer Staples | 1.4 |
Diversified | .8 |
| | 105.6 |
† Based on net assets.
See notes to financial statements.
12
STATEMENT OF INVESTMENTS IN AFFILIATED ISSUERS
| | | | | | | |
Investment Companies | Value
8/31/19($) | Purchases($)† | Sales ($) | Value
8/31/20($) | Net
Assets(%) | Dividends/
Distributions($) |
Registered Investment Companies; | | | | |
Dreyfus Institutional Preferred Government Plus Money Market Fund | 1,828,720 | 157,786,467 | (152,335,243) | 7,279,944 | 1.8 | 67,447 |
Investment of Cash Collateral for Securities Loaned; | | |
Dreyfus Institutional Preferred Government Plus Money Market Fund | 39,073,059 | 285,827,752 | (299,057,225) | 25,843,586 | 6.3 | - |
Total | 40,901,779 | 443,614,219 | (451,392,468) | 33,123,530 | 8.1 | 67,447 |
† Includes reinvested dividends/distributions.
See notes to financial statements.
13
STATEMENT OF ASSETS AND LIABILITIES
August 31, 2020
| | | | | | | |
| | | | | | |
| | | Cost | | Value | |
Assets ($): | | | | |
Investments in securities—See Statement of Investments
(including securities on loan, valued at $75,686,370)—Note 1(c): | | | |
Unaffiliated issuers | 336,854,098 | | 399,347,849 | |
Affiliated issuers | | 33,123,530 | | 33,123,530 | |
Receivable for investment securities sold | | 5,098,277 | |
Dividends and securities lending income receivable | | 308,098 | |
Receivable for shares of Common Stock subscribed | | 128,518 | |
Tax reclaim receivable | | 3,197 | |
Prepaid expenses | | | | | 30,644 | |
| | | | | 438,040,113 | |
Liabilities ($): | | | | |
Due to BNY Mellon Investment Adviser, Inc. and affiliates—Note 3(b) | | 333,232 | |
Liability for securities on loan—Note 1(c) | | 25,843,586 | |
Payable for investment securities purchased | | 1,711,030 | |
Payable for shares of Common Stock redeemed | | 563,548 | |
Directors’ fees and expenses payable | | 10,867 | |
Other accrued expenses | | | | | 97,559 | |
| | | | | 28,559,822 | |
Net Assets ($) | | | 409,480,291 | |
Composition of Net Assets ($): | | | | |
Paid-in capital | | | | | 428,568,727 | |
Total distributable earnings (loss) | | | | | (19,088,436) | |
Net Assets ($) | | | 409,480,291 | |
| | | | | |
Net Asset Value Per Share | Investor Shares | Class I | Class Y | |
Net Assets ($) | 248,200,811 | 21,447,545 | 139,831,935 | |
Shares Outstanding | 9,103,858 | 781,292 | 5,083,061 | |
Net Asset Value Per Share ($) | 27.26 | 27.45 | 27.51 | |
| | | | |
See notes to financial statements. | | | | |
14
STATEMENT OF OPERATIONS
Year Ended August 31, 2020
| | | | | | | |
| | | | | | |
| | | | | | |
Investment Income ($): | | | | |
Income: | | | | |
Cash dividends (net of $41,482 foreign taxes withheld at source): | |
Unaffiliated issuers | | | 4,848,551 | |
Affiliated issuers | | | 66,005 | |
Income from securities lending—Note 1(c) | | | 666,664 | |
Interest | | | 32,147 | |
Total Income | | | 5,613,367 | |
Expenses: | | | | |
Management fee—Note 3(a) | | | 3,350,321 | |
Shareholder servicing costs—Note 3(b) | | | 833,953 | |
Professional fees | | | 88,185 | |
Registration fees | | | 53,079 | |
Directors’ fees and expenses—Note 3(c) | | | 44,545 | |
Prospectus and shareholders’ reports | | | 42,521 | |
Custodian fees—Note 3(b) | | | 35,483 | |
Chief Compliance Officer fees—Note 3(b) | | | 13,975 | |
Loan commitment fees—Note 2 | | | 10,084 | |
Interest expense—Note 2 | | | 811 | |
Miscellaneous | | | 38,646 | |
Total Expenses | | | 4,511,603 | |
Investment Income—Net | | | 1,101,764 | |
Realized and Unrealized Gain (Loss) on Investments—Note 4 ($): | | |
Net realized gain (loss) on investments | (28,063,447) | |
Capital gain distributions from affiliated issuers | 1,442 | |
Net Realized Gain (Loss) | | | (28,062,005) | |
Net change in unrealized appreciation (depreciation) on investments | 60,356,865 | |
Net Realized and Unrealized Gain (Loss) on Investments | | | 32,294,860 | |
Net Increase in Net Assets Resulting from Operations | | 33,396,624 | |
| | | | | | |
See notes to financial statements. | | | | | |
15
STATEMENT OF CHANGES IN NET ASSETS
| | | | | | | | | | |
| | | | Year Ended August 31, |
| | | | 2020 | | 2019 | |
Operations ($): | | | | | | | | |
Investment income—net | | | 1,101,764 | | | | 1,787,915 | |
Net realized gain (loss) on investments | | (28,062,005) | | | | (16,185,991) | |
Net change in unrealized appreciation
(depreciation) on investments | | 60,356,865 | | | | (233,328,921) | |
Net Increase (Decrease) in Net Assets
Resulting from Operations | 33,396,624 | | | | (247,726,997) | |
Distributions ($): | |
Distributions to shareholders: | | | | | | | | |
Investor Shares | | | (488,150) | | | | (86,926,217) | |
Class I | | | (130,530) | | | | (11,657,022) | |
Class Y | | | (1,251,443) | | | | (80,115,063) | |
Total Distributions | | | (1,870,123) | | | | (178,698,302) | |
Capital Stock Transactions ($): | |
Net proceeds from shares sold: | | | | | | | | |
Investor Shares | | | 7,295,543 | | | | 19,199,291 | |
Class I | | | 6,522,699 | | | | 14,069,728 | |
Class Y | | | 30,488,985 | | | | 47,811,478 | |
Distributions reinvested: | | | | | | | | |
Investor Shares | | | 471,182 | | | | 83,831,912 | |
Class I | | | 127,615 | | | | 11,244,679 | |
Class Y | | | 378,484 | | | | 35,893,606 | |
Cost of shares redeemed: | | | | | | | | |
Investor Shares | | | (65,006,607) | | | | (251,420,986) | |
Class I | | | (15,634,714) | | | | (44,124,433) | |
Class Y | | | (110,254,028) | | | | (260,267,336) | |
Increase (Decrease) in Net Assets
from Capital Stock Transactions | (145,610,841) | | | | (343,762,061) | |
Total Increase (Decrease) in Net Assets | (114,084,340) | | | | (770,187,360) | |
Net Assets ($): | |
Beginning of Period | | | 523,564,631 | | | | 1,293,751,991 | |
End of Period | | | 409,480,291 | | | | 523,564,631 | |
16
| | | | | | | | | | |
| | | | Year Ended August 31, |
| | | | 2020 | | 2019 | |
Capital Share Transactions (Shares): | |
Investor Sharesa | | | | | | | | |
Shares sold | | | 330,667 | | | | 638,235 | |
Shares issued for distributions reinvested | | | 17,336 | | | | 3,488,633 | |
Shares redeemed | | | (2,590,456) | | | | (8,620,024) | |
Net Increase (Decrease) in Shares Outstanding | (2,242,453) | | | | (4,493,156) | |
Class Ia | | | | | | | | |
Shares sold | | | 269,889 | | | | 496,288 | |
Shares issued for distributions reinvested | | | 4,668 | | | | 464,848 | |
Shares redeemed | | | (619,659) | | | | (1,643,184) | |
Net Increase (Decrease) in Shares Outstanding | (345,102) | | | | (682,048) | |
Class Ya | | | | | | | | |
Shares sold | | | 1,399,059 | | | | 1,757,757 | |
Shares issued for distributions reinvested | | | 13,828 | | | | 1,481,371 | |
Shares redeemed | | | (4,555,417) | | | | (9,539,980) | |
Net Increase (Decrease) in Shares Outstanding | (3,142,530) | | | | (6,300,852) | |
| | | | | | | | | |
aDuring the period ended August 31, 2020, 87,903 Class Y shares representing $2,248,248 were exchanged for 88,901 Class I shares and 718 Class Y shares representing $14,052 were exchanged for 724 Investor shares. During the period ended August 31, 2019, 117,362 Class Y shares representing $3,601,116 were exchanged for 115,955 Class I shares and 14,594 class Y shares representing $514,778 were exchanged for 14,686 Investor shares. | |
See notes to financial statements. | | | | | | | | |
17
FINANCIAL HIGHLIGHTS
The following tables describe the performance for each share class for the fiscal periods indicated. All information (except portfolio turnover rate) reflects financial results for a single fund share. Total return shows how much your investment in the fund would have increased (or decreased) during each period, assuming you had reinvested all dividends and distributions. These figures have been derived from the fund’s financial statements.
| | | | | | | | | | |
| | | | |
| | |
Investor Shares | | Year Ended August 31, |
| | 2020 | 2019 | 2018 | 2017a | 2016 |
Per Share Data ($): | | | | | | |
Net asset value, beginning of period | | 25.18 | 40.10 | 36.53 | 29.66 | 30.45 |
Investment Operations: | | | | | | |
Investment income (loss)—netb | | .03 | .03 | (.16) | (.15) | (.05) |
Net realized and unrealized gain
(loss) on investments | | 2.10 | (8.16) | 8.29 | 7.16 | .43 |
Total from Investment Operations | | 2.13 | (8.13) | 8.13 | 7.01 | .38 |
Distributions: | | | | | | |
Dividends from
investment income—net | | (.05) | - | - | - | (.10) |
Dividends from net realized
gain on investments | | - | (6.79) | (4.56) | (.14) | (1.07) |
Total Distributions | | (.05) | (6.79) | (4.56) | (.14) | (1.17) |
Net asset value, end of period | | 27.26 | 25.18 | 40.10 | 36.53 | 29.66 |
Total Return (%) | | 8.44 | (19.47) | 23.51 | 23.67 | 1.34 |
Ratios/Supplemental Data (%): | | | | | | |
Ratio of total expenses
to average net assets | | 1.13 | 1.13 | 1.09 | 1.10 | 1.11 |
Ratio of net investment income
(loss) to average net assets | | .11 | .12 | (.43) | (.44) | (.17) |
Portfolio Turnover Rate | | 95.32 | 83.97 | 74.02 | 84.96 | 82.01 |
Net Assets, end of period ($ x 1,000) | | 248,201 | 285,688 | 635,221 | 488,507 | 802,741 |
a On September 30, 2016, the fund redesignated existing shares as Investor shares.
b Based on average shares outstanding.
See notes to financial statements.
18
| | | | | | | | | | |
| | | | |
| | | |
Class I Shares | | | Year Ended August 31, |
| | | 2020 | 2019 | 2018 | 2017a |
Per Share Data ($): | | | | | | |
Net asset value, beginning of period | | | 25.38 | 40.28 | 36.60 | 30.62 |
Investment Operations: | | | | | | |
Investment income (loss)—netb | | | .08 | .08 | (.08) | (.07) |
Net realized and unrealized gain
(loss) on investments | | | 2.11 | (8.19) | 8.32 | 6.19 |
Total from Investment Operations | | | 2.19 | (8.11) | 8.24 | 6.12 |
Distributions: | | | | | | |
Dividends from
investment income—net | | | (.12) | - | - | - |
Dividends from net realized
gain on investments | | | - | (6.79) | (4.56) | (.14) |
Total Distributions | | | (.12) | (6.79) | (4.56) | (.14) |
Net asset value, end of period | | | 27.45 | 25.38 | 40.28 | 36.60 |
Total Return (%) | | | 8.63 | (19.31) | 23.78 | 20.02c |
Ratios/Supplemental Data (%): | | | | | | |
Ratio of total expenses
to average net assets | | | .96 | .93 | .87 | .95d |
Ratio of net investment income
(loss) to average net assets | | | .30 | .26 | (.20) | (.23)d |
Portfolio Turnover Rate | | | 95.32 | 83.97 | 74.02 | 84.96 |
Net Assets, end of period ($ x 1,000) | | | 21,448 | 28,586 | 72,845 | 53,194 |
a From September 30, 2016 (commencement of initial offering) to August 31, 2017.
b Based on average shares outstanding.
c Not annualized.
d Annualized.
See notes to financial statements.
19
FINANCIAL HIGHLIGHTS (continued)
| | | | | | | | | | |
| | | | |
| | | |
Class Y Shares | | | Year Ended August 31, |
| | | 2020 | 2019 | 2018 | 2017a |
Per Share Data ($): | | | | | | |
Net asset value, beginning of period | | | 25.44 | 40.32 | 36.60 | 30.62 |
Investment Operations: | | | | | | |
Investment income (loss)—netb | | | .11 | .11 | (.04) | (.01) |
Net realized and unrealized gain
(loss) on investments | | | 2.13 | (8.20) | 8.32 | 6.13 |
Total from Investment Operations | | | 2.24 | (8.09) | 8.28 | 6.12 |
Distributions: | | | | | | |
Dividends from
investment income—net | | | (.17) | - | - | - |
Dividends from net realized
gain on investments | | | - | (6.79) | (4.56) | (.14) |
Total Distributions | | | (.17) | (6.79) | (4.56) | (.14) |
Net asset value, end of period | | | 27.51 | 25.44 | 40.32 | 36.60 |
Total Return (%) | | | 8.81 | (19.23) | 23.90 | 20.02c |
Ratios/Supplemental Data (%): | | | | | | |
Ratio of total expenses
to average net assets | | | .83 | .81 | .79 | .81d |
Ratio of net investment income
(loss) to average net assets | | | .45 | .38 | (.12) | (.03)d |
Portfolio Turnover Rate | | | 95.32 | 83.97 | 74.02 | 84.96 |
Net Assets, end of period ($ x 1,000) | | | 139,832 | 209,291 | 585,686 | 467,673 |
a From September 30, 2016 (commencement of initial offering) to August 31, 2017.
b Based on average shares outstanding.
c Not annualized.
d Annualized.
See notes to financial statements.
20
NOTES TO FINANCIAL STATEMENTS
NOTE 1—Significant Accounting Policies:
BNY Mellon Opportunistic Small Cap Fund (the “fund”) is a separate diversified series of BNY Mellon Advantage Funds, Inc. (the “Company”), which is registered under the Investment Company Act of 1940, as amended (the “Act”), as an open-end management investment company and operates as a series company currently offering nine series, including the fund. The fund’s investment objective is to seek capital appreciation. BNY Mellon Investment Adviser, Inc. (the “Adviser”), a wholly-owned subsidiary of The Bank of New York Mellon Corporation (“BNY Mellon”), serves as the fund’s investment adviser.
BNY Mellon Securities Corporation (the “Distributor”), a wholly-owned subsidiary of the Adviser, is the distributor of the fund’s shares, which are sold without a sales charge. The fund is authorized to issue 400 million shares of $.001 par value Common Stock. The fund currently has authorized three classes of shares: Investor (200 million shares authorized), Class I (100 million shares authorized) and Class Y shares (100 million shares authorized). Investor shares are sold primarily to retail investors through financial intermediaries and bear Shareholder Services Plan fees. Class I and Y shares are sold at net asset value per share generally to institutional investors. Other differences between the classes include the services offered to and the expenses borne by each class, the allocation of certain transfer agency costs, and certain voting rights. Income, expenses (other than expenses attributable to a specific class), and realized and unrealized gains or losses on investments are allocated to each class of shares based on its relative net assets.
The Company accounts separately for the assets, liabilities and operations of each series. Expenses directly attributable to each series are charged to that series’ operations; expenses which are applicable to all series are allocated among them on a pro rata basis.
The Financial Accounting Standards Board (“FASB”) Accounting Standards Codification (“ASC”) is the exclusive reference of authoritative U.S. generally accepted accounting principles (“GAAP”) recognized by the FASB to be applied by nongovernmental entities. Rules and interpretive releases of the Securities and Exchange Commission (“SEC”) under authority of federal laws are also sources of authoritative GAAP for SEC registrants. The fund is an investment company and applies the accounting and reporting guidance of the FASB ASC Topic 946 Financial Services-Investment Companies. The fund’s financial statements are prepared in accordance with GAAP, which may require the use of management
21
NOTES TO FINANCIAL STATEMENTS (continued)
estimates and assumptions. Actual results could differ from those estimates.
The Company enters into contracts that contain a variety of indemnifications. The fund’s maximum exposure under these arrangements is unknown. The fund does not anticipate recognizing any loss related to these arrangements.
(a) Portfolio valuation: The fair value of a financial instrument is the amount that would be received to sell an asset or paid to transfer a liability in an orderly transaction between market participants at the measurement date (i.e., the exit price). GAAP establishes a fair value hierarchy that prioritizes the inputs of valuation techniques used to measure fair value. This hierarchy gives the highest priority to unadjusted quoted prices in active markets for identical assets or liabilities (Level 1 measurements) and the lowest priority to unobservable inputs (Level 3 measurements).
Additionally, GAAP provides guidance on determining whether the volume and activity in a market has decreased significantly and whether such a decrease in activity results in transactions that are not orderly. GAAP requires enhanced disclosures around valuation inputs and techniques used during annual and interim periods.
Various inputs are used in determining the value of the fund’s investments relating to fair value measurements. These inputs are summarized in the three broad levels listed below:
Level 1—unadjusted quoted prices in active markets for identical investments.
Level 2—other significant observable inputs (including quoted prices for similar investments, interest rates, prepayment speeds, credit risk, etc.).
Level 3—significant unobservable inputs (including the fund’s own assumptions in determining the fair value of investments).
The inputs or methodology used for valuing securities are not necessarily an indication of the risk associated with investing in those securities.
Changes in valuation techniques may result in transfers in or out of an assigned level within the disclosure hierarchy. Valuation techniques used to value the fund’s investments are as follows:
Investments in equity securities are valued at the last sales price on the securities exchange or national securities market on which such securities are primarily traded. Securities listed on the National Market System for which market quotations are available are valued at the official closing
22
price or, if there is no official closing price that day, at the last sales price. For open short positions, asked prices are used for valuation purposes. Bid price is used when no asked price is available. Registered investment companies that are not traded on an exchange are valued at their net asset value. All of the preceding securities are generally categorized within Level 1 of the fair value hierarchy.
Securities not listed on an exchange or the national securities market, or securities for which there were no transactions, are valued at the average of the most recent bid and asked prices. These securities are generally categorized within Level 2 of the fair value hierarchy.
Fair valuing of securities may be determined with the assistance of a pricing service using calculations based on indices of domestic securities and other appropriate indicators, such as prices of relevant ADRs and futures. Utilizing these techniques may result in transfers between Level 1 and Level 2 of the fair value hierarchy.
When market quotations or official closing prices are not readily available, or are determined not to accurately reflect fair value, such as when the value of a security has been significantly affected by events after the close of the exchange or market on which the security is principally traded (for example, a foreign exchange or market), but before the fund calculates its net asset value, the fund may value these investments at fair value as determined in accordance with the procedures approved by the Company’s Board of Directors (the “Board”). Certain factors may be considered when fair valuing investments such as: fundamental analytical data, the nature and duration of restrictions on disposition, an evaluation of the forces that influence the market in which the securities are purchased and sold, and public trading in similar securities of the issuer or comparable issuers. These securities are either categorized within Level 2 or 3 of the fair value hierarchy depending on the relevant inputs used.
For securities where observable inputs are limited, assumptions about market activity and risk are used and such securities are generally categorized within Level 3 of the fair value hierarchy.
The following is a summary of the inputs used as of August 31, 2020 in valuing the fund’s investments:
23
NOTES TO FINANCIAL STATEMENTS (continued)
| | | | | |
| | Level 1 - Unadjusted Quoted Prices | Level 2 - Other Significant Observable Inputs | Level 3 -Significant Unobservable Inputs | Total |
Assets ($) | | | | |
Investments in Securities: † | | |
Equity Securities- Common Stocks | 396,695,125 | - | - | 396,695,125 |
Exchange-Traded Funds | 2,652,724 | - | - | 2,652,724 |
Investment Companies | 33,123,530 | - | - | 33,123,530 |
† See Statement of Investments for additional detailed categorizations, if any.
(b) Foreign Taxes: The fund may be subject to foreign taxes (a portion of which may be reclaimable) on income, stock dividends, realized and unrealized capital gains on investments or certain foreign currency transactions. Foreign taxes are recorded in accordance with the fund’s understanding of the applicable foreign tax regulations and rates that exist in the foreign jurisdictions in which the fund invests. These foreign taxes, if any, are paid by the fund and are reflected in the Statement of Operations. Foreign taxes payable or deferred as of August 31, 2020, if any, are disclosed in the fund’s Statement of Assets and Liabilities.
(c) Securities transactions and investment income: Securities transactions are recorded on a trade date basis. Realized gains and losses from securities transactions are recorded on the identified cost basis. Dividend income is recognized on the ex-dividend date and interest income, including, where applicable, accretion of discount and amortization of premium on investments, is recognized on the accrual basis.
Pursuant to a securities lending agreement with The Bank of New York Mellon, a subsidiary of BNY Mellon and an affiliate of the Adviser, the fund may lend securities to qualified institutions. It is the fund’s policy that, at origination, all loans are secured by collateral of at least 102% of the value of U.S. securities loaned and 105% of the value of foreign securities loaned. Collateral equivalent to at least 100% of the market value of securities on loan is maintained at all times. Collateral is either in the form of cash, which can be invested in certain money market mutual funds managed by the Adviser, or U.S. Government and Agency securities. The fund is entitled to receive all dividends, interest and distributions on securities loaned, in addition to income earned as a result of the lending transaction. Should a borrower fail to return the securities in a timely manner, The Bank of New York Mellon is required to replace the securities for the benefit of the fund or credit the fund with the market
24
value of the unreturned securities and is subrogated to the fund’s rights against the borrower and the collateral. Additionally, the contractual maturity of security lending transactions are on an overnight and continuous basis. During the period ended August 31, 2020, The Bank of New York Mellon earned $123,486 from the lending of the fund’s portfolio securities, pursuant to the securities lending agreement.
(d) Affiliated issuers: Investments in other investment companies advised by the Adviser are considered “affiliated” under the Act.
(e) Risk: Certain events particular to the industries in which the fund’s investments conduct their operations, as well as general economic, political and public health conditions, may have a significant negative impact on the investee’s operations and profitability. In addition, turbulence in financial markets and reduced liquidity in equity, credit and/or fixed income markets may negatively affect many issuers, which could adversely affect the fund. Global economies and financial markets are becoming increasingly interconnected, and conditions and events in one country, region or financial market may adversely impact issuers in a different country, region or financial market. These risks may be magnified if certain events or developments adversely interrupt the global supply chain; in these and other circumstances, such risks might affect companies worldwide. Recent examples include pandemic risks related to COVID-19 and aggressive measures taken world-wide in response by governments, including closing borders, restricting international and domestic travel, and the imposition of prolonged quarantines of large populations, and by businesses, including changes to operations and reducing staff. To the extent the fund may overweight its investments in certain countries, companies, industries or market sectors, such positions will increase the fund’s exposure to risk of loss from adverse developments affecting those countries, companies, industries or sectors.
(f) Dividends and distributions to shareholders: Dividends and distributions are recorded on the ex-dividend date. Dividends from investment income-net and dividends from net realized capital gains, if any, are normally declared and paid annually, but the fund may make distributions on a more frequent basis to comply with the distribution requirements of the Internal Revenue Code of 1986, as amended (the “Code”). To the extent that net realized capital gains can be offset by capital loss carryovers, it is the policy of the fund not to distribute such gains. Income and capital gain distributions are determined in accordance with income tax regulations, which may differ from GAAP.
(g) Federal income taxes: It is the policy of the fund to continue to qualify as a regulated investment company, if such qualification is in the
25
NOTES TO FINANCIAL STATEMENTS (continued)
best interests of its shareholders, by complying with the applicable provisions of the Code, and to make distributions of taxable income and net realized capital gain sufficient to relieve it from substantially all federal income and excise taxes.
As of and during the period ended August 31, 2020, the fund did not have any liabilities for any uncertain tax positions. The fund recognizes interest and penalties, if any, related to uncertain tax positions as income tax expense in the Statement of Operations. During the period ended August 31, 2020, the fund did not incur any interest or penalties.
Each tax year in the four-year period ended August 31, 2020 remains subject to examination by the Internal Revenue Service and state taxing authorities.
At August 31, 2020, the components of accumulated earnings on a tax basis were as follows: undistributed ordinary income $1,386,205, accumulated capital losses $77,022,935 and unrealized appreciation $56,548,294.
The fund is permitted to carry forward capital losses for an unlimited period. Furthermore, capital loss carryovers retain their character as either short-term or long-term capital losses.
The accumulated capital loss carryover is available for federal income tax purposes to be applied against future net realized capital gains, if any, realized subsequent to August 31, 2020. The fund has $47,692,989 of short-term capital losses and $29,329,946 of long-term capital losses which can be carried forward for an unlimited period.
The tax character of distributions paid to shareholders during the fiscal periods ended August 31, 2020 and August 31, 2019 were as follows: ordinary income $1,870,123 and $40,691,332, and long-term capital gains $0 and $138,006,970, respectively.
NOTE 2—Bank Lines of Credit:
The fund participates with other long-term open-end funds managed by the Adviser in a $927 million unsecured credit facility led by Citibank, N.A. (the “Citibank Credit Facility”) and a $300 million unsecured credit facility provided by The Bank of New York Mellon (the “BNYM Credit Facility”), each to be utilized primarily for temporary or emergency purposes, including the financing of redemptions (each, a “Facility”). The Citibank Credit Facility is available in two tranches: (i) Tranche A is in an amount equal to $747 million and is available to all long-term open-ended funds, including the fund, and (ii) Tranche B is an amount equal to $180 million and is available only to BNY Mellon Floating Rate Income Fund, a series
26
of BNY Mellon Investment Funds IV, Inc. Prior to March 11, 2020, the Citibank Credit Facility was $1.030 billion with Tranche A available in an amount equal to $830 million and Tranche B available in an amount equal to $200 million. In connection therewith, the fund has agreed to pay its pro rata portion of commitment fees for Tranche A of the Citibank Credit Facility and the BNYM Credit Facility. Interest is charged to the fund based on rates determined pursuant to the terms of the respective Facility at the time of borrowing.
The average amount of borrowings outstanding under the Facilities during the period ended August 31, 2020 was approximately $30,601 with a related weighted average annualized interest rate of 2.65%.
NOTE 3—Management Fee and Other Transactions with Affiliates:
(a) Pursuant to a management agreement with the Adviser, the management fee is computed at the annual rate of .75% of the value of the fund’s average daily net assets and is payable monthly.
(b) Under the Shareholder Services Plan, Investor shares pay the Distributor at an annual rate of .25% of the value of its average daily net assets for the provision of certain services. The services provided may include personal services relating to shareholder accounts, such as answering shareholder inquiries regarding the fund and providing reports and other information, and services related to the maintenance of shareholder accounts, such as recordkeeping and sub-accounting services. The Distributor may make payments to Service Agents (securities dealers, financial institutions or other industry professionals) with respect to these services. The Distributor determines the amounts to be paid to Service Agents. During the period ended August 31, 2020, the fund was charged $632,799 pursuant to the Shareholder Services Plan.
The fund has an arrangement with the transfer agent whereby the fund may receive earnings credits when positive cash balances are maintained, which are used to offset transfer agency fees. For financial reporting purposes, the fund includes net earnings credits, if any, as an expense offset in the Statement of Operations.
The fund has an arrangement with the custodian whereby the fund will receive interest income or be charged an overdraft fees when cash balances are maintained. For financial reporting purposes, the fund includes this interest income and overdraft fees, if any, as interest income in the Statement of Operations.
27
NOTES TO FINANCIAL STATEMENTS (continued)
The fund compensates BNY Mellon Transfer, Inc., a wholly-owned subsidiary of the Adviser, under a transfer agency agreement for providing transfer agency and cash management services for the fund. The majority of transfer agency fees are comprised of amounts paid on a per account basis, while cash management fees are related to fund subscriptions and redemptions. During the period ended August 31, 2020, the fund was charged $67,492 for transfer agency services. These fees are included in Shareholder servicing costs in the Statement of Operations.
The fund compensates The Bank of New York Mellon under a custody agreement for providing custodial services for the fund. These fees are determined based on net assets, geographic region and transaction activity. During the period ended August 31, 2020, the fund was charged $35,483 pursuant to the custody agreement.
During the period ended August 31, 2020, the fund was charged $13,975 for services performed by the Chief Compliance Officer and his staff. These fees are included in Chief Compliance Officer fees in the Statement of Operations.
The components of “Due to BNY Mellon Investment Adviser, Inc. and affiliates” in the Statement of Assets and Liabilities consist of: management fees of $259,947, Shareholder Services Plan fees of $52,225, custodian fees of $7,247, Chief Compliance Officer fees of $2,273 and transfer agency fees of $11,540.
(c) Each Board member also serves as a Board member of other funds in the BNY Mellon Family of Funds complex. Annual retainer fees and attendance fees are allocated to each fund based on net assets.
NOTE 4—Securities Transactions:
The aggregate amount of purchases and sales of investment securities, excluding short-term securities, during the period ended August 31, 2020, amounted to $417,932,268 and $570,230,898, respectively.
At August 31, 2020, the cost of investments for federal income tax purposes was $375,923,085; accordingly, accumulated net unrealized appreciation on investments was $56,548,294, consisting of $105,099,503 gross unrealized appreciation and $48,551,209 gross unrealized depreciation.
28
REPORT OF INDEPENDENT REGISTERED PUBLIC ACCOUNTING FIRM
To the Shareholders and the Board of Directors of BNY Mellon Opportunistic Small Cap Fund
Opinion on the Financial Statements
We have audited the accompanying statement of assets and liabilities of BNY Mellon Opportunistic Small Cap Fund (the “Fund”) (one of the funds constituting BNY Mellon Advantage Funds, Inc.), including the statements of investments and investments in affiliated issuers, as of August 31, 2020, and the related statement of operations for the year then ended, the statements of changes in net assets for each of the two years in the period then ended, the financial highlights for each of the five years in the period then ended and the related notes (collectively referred to as the “financial statements”). In our opinion, the financial statements present fairly, in all material respects, the financial position of the Fund (one of the funds constituting BNY Mellon Advantage Funds, Inc.) at August 31, 2020, the results of its operations for the year then ended, the changes in its net assets for each of the two years in the period then ended and its financial highlights for each of the five years in the period then ended, in conformity with U.S. generally accepted accounting principles.
Basis for Opinion
These financial statements are the responsibility of the Fund’s management. Our responsibility is to express an opinion on the Fund’s financial statements based on our audits. We are a public accounting firm registered with the Public Company Accounting Oversight Board (United States) (“PCAOB”) and are required to be independent with respect to the Fund in accordance with the U.S. federal securities laws and the applicable rules and regulations of the Securities and Exchange Commission and the PCAOB.
We conducted our audits in accordance with the standards of the PCAOB. Those standards require that we plan and perform the audit to obtain reasonable assurance about whether the financial statements are free of material misstatement, whether due to error or fraud. The Fund is not required to have, nor were we engaged to perform, an audit of the Fund’s internal control over financial reporting. As part of our audits, we are required to obtain an understanding of internal control over financial reporting, but not for the purpose of expressing an opinion on the effectiveness of the Fund’s internal control over financial reporting. Accordingly, we express no such opinion.
Our audits included performing procedures to assess the risks of material misstatement of the financial statements, whether due to error or fraud, and performing procedures that respond to those risks. Such procedures included examining, on a test basis, evidence regarding the amounts and disclosures in the financial statements. Our procedures included confirmation of securities owned as of August 31, 2020, by correspondence with the custodian and others or by other appropriate auditing procedures where replies from others were not received. Our audits also included evaluating the accounting principles used and significant estimates made by management, as well as evaluating the overall presentation of the financial statements. We believe that our audits provide a reasonable basis for our opinion.

We have served as the auditor of one or more investment companies in the BNY Mellon Family of Funds since at least 1957, but we are unable to determine the specific year.
New York, New York
October 27, 2020
29
IMPORTANT TAX INFORMATION (Unaudited)
For federal tax purposes, the fund hereby reports 100% of the ordinary dividends paid during the fiscal year ended August 31, 2020 as qualifying for the corporate dividends received deduction. Also, certain dividends paid by the fund may be subject to a maximum tax rate of 15%, as provided for by the Jobs and Growth Tax Relief Reconciliation Act of 2003. Of the distributions paid during the fiscal year, $1,870,123 resents the maximum amount that may be considered qualified dividend income. Shareholders will receive notification in early 2021 of the percentage applicable to the preparation of their 2020 income tax returns.
30
INFORMATION ABOUT THE RENEWAL OF THE FUND’S MANAGEMENT AGREEMENT (Unaudited)
At a meeting of the fund’s Board of Directors held on July 28, 2020, the Board considered the renewal of the fund’s Management Agreement pursuant to which the Adviser provides the fund with investment advisory and administrative services (the “Agreement”). The Board members, none of whom are “interested persons” (as defined in the Investment Company Act of 1940, as amended) of the fund, were assisted in their review by independent legal counsel and met with counsel in executive session separate from representatives of the Adviser. In considering the renewal of the Agreement, the Board considered several factors that it believed to be relevant, including those discussed below. The Board did not identify any one factor as dispositive, and each Board member may have attributed different weights to the factors considered.
Analysis of Nature, Extent, and Quality of Services Provided to the Fund. The Board considered information provided to it at the meeting and in previous presentations from representatives of the Adviser regarding the nature, extent, and quality of the services provided to funds in the BNY Mellon fund complex, including the fund. The Adviser provided the number of open accounts in the fund, the fund’s asset size and the allocation of fund assets among distribution channels. The Adviser also had previously provided information regarding the diverse intermediary relationships and distribution channels of funds in the BNY Mellon fund complex (such as retail direct or intermediary, in which intermediaries typically are paid by the fund and/or the Adviser) and the Adviser’s corresponding need for broad, deep, and diverse resources to be able to provide ongoing shareholder services to each intermediary or distribution channel, as applicable to the fund.
The Board also considered research support available to, and portfolio management capabilities of, the fund’s portfolio management personnel and that the Adviser also provides oversight of day-to-day fund operations, including fund accounting and administration and assistance in meeting legal and regulatory requirements. The Board also considered the Adviser’s extensive administrative, accounting and compliance infrastructures. The Board also considered portfolio management’s brokerage policies and practices (including policies and practices regarding soft dollars) and the standards applied in seeking best execution.
Comparative Analysis of the Fund’s Performance and Management Fee and Expense Ratio. The Board reviewed reports prepared by Broadridge Financial Solutions, Inc. (“Broadridge”), an independent provider of investment company data based on classifications provided by Thomson Reuters Lipper, which included information comparing (1) the performance of the fund’s Investor Class shares with the performance of a group of retail no-load small-cap core funds selected by Broadridge as comparable to the fund (the “Performance Group”) and with a broader group of funds consisting of all retail and institutional small-cap core funds (the “Performance Universe”), all for various periods ended June 30, 2020, and (2) the fund’s actual and contractual management fees and total expenses with those of the same group of funds in the Performance Group (the “Expense Group”) and with a broader group of all retail no-load small-cap core funds, excluding outliers (the “Expense Universe”), the
31
INFORMATION ABOUT THE RENEWAL OF THE FUND’S MANAGEMENT AGREEMENT (Unaudited) (continued)
information for which was derived in part from fund financial statements available to Broadridge as of the date of its analysis. The Adviser previously had furnished the Board with a description of the methodology Broadridge used to select the Performance Group and Performance Universe and the Expense Group and Expense Universe.
Performance Comparisons. Representatives of the Adviser stated that the usefulness of performance comparisons may be affected by a number of factors, including different investment limitations and policies that may be applicable to the fund and comparison funds and the end date selected. The Board discussed with representatives of the Adviser the results of the comparisons and considered that the fund’s total return performance was above the Performance Group and Performance Universe medians for all periods, except the two- and five-year periods when performance was below the Performance Group and Performance Universe medians, although the Board noted the relative proximity of the fund’s performance to the Performance Group and Performance Universe medians in the five-year period. The Adviser also provided a comparison of the fund’s calendar year total returns to the returns of the fund’s benchmark index.
Management Fee and Expense Ratio Comparisons. The Board reviewed and considered the contractual management fee rate payable by the fund to the Adviser in light of the nature, extent and quality of the management services provided by the Adviser. In addition, the Board reviewed and considered the actual management fee rate paid by the fund over the fund’s last fiscal year. The Board also reviewed the range of actual and contractual management fees and total expenses as a percentage of average net assets of the Expense Group and Expense Universe funds and discussed the results of the comparisons. The Board considered that the fund’s contractual management fee was lower than the Expense Group median contractual management fee, the fund’s actual management fee was lower than the Expense Group and Expense Universe actual management fee medians and the fund’s total expenses were slightly higher than the Expense Group and lower than the Expense Universe total expenses medians.
Representatives of the Adviser reviewed with the Board the management or investment advisory fees (1) paid by funds advised or administered by the Adviser that are in the same Lipper category as the fund and (2) paid to the Adviser, or the primary employer of the fund’s primary portfolio manager(s) that is affiliated with the Adviser, for advising any separate accounts and/or other types of client portfolios that are considered to have similar investment strategies and policies as the fund (the “Similar Clients”), and explained the nature of the Similar Clients. They discussed differences in fees paid and the relationship of the fees paid in light of any differences in the services provided and other relevant factors. The Board considered the relevance of the fee information provided for the Similar Clients to evaluate the appropriateness of the fund’s management fee.
Analysis of Profitability and Economies of Scale. Representatives of the Adviser reviewed the expenses allocated and profit received by the Adviser and its affiliates and the resulting profitability percentage for managing the fund and the aggregate profitability percentage to the Adviser and its affiliates for managing the funds in the
32
BNY Mellon fund complex, and the method used to determine the expenses and profit. The Board concluded that the profitability results were not excessive, given the services rendered and service levels provided by the Adviser and its affiliates. The Board also had been provided with information prepared by an independent consulting firm regarding the Adviser’s approach to allocating costs to, and determining the profitability of, individual funds and the entire BNY Mellon fund complex. The consulting firm also had analyzed where any economies of scale might emerge in connection with the management of a fund.
The Board considered, on the advice of its counsel, the profitability analysis (1) as part of its evaluation of whether the fees under the Agreement, considered in relation to the mix of services provided by the Adviser, including the nature, extent and quality of such services, supported the renewal of the Agreement and (2) in light of the relevant circumstances for the fund and the extent to which economies of scale would be realized if the fund grows and whether fee levels reflect these economies of scale for the benefit of fund shareholders. Representatives of the Adviser stated that a discussion of economies of scale is predicated on a fund having achieved a substantial size with increasing assets and that, if a fund’s assets had been stable or decreasing, the possibility that the Adviser may have realized any economies of scale would be less. Representatives of the Adviser also stated that, as a result of shared and allocated costs among funds in the BNY Mellon fund complex, the extent of economies of scale could depend substantially on the level of assets in the complex as a whole, so that increases and decreases in complex-wide assets can affect potential economies of scale in a manner that is disproportionate to, or even in the opposite direction from, changes in the fund’s asset level. The Board also considered potential benefits to the Adviser from acting as investment adviser and took into consideration the soft dollar arrangements in effect for trading the fund’s investments.
At the conclusion of these discussions, the Board agreed that it had been furnished with sufficient information to make an informed business decision with respect to the renewal of the Agreement. Based on the discussions and considerations as described above, the Board concluded and determined as follows.
· The Board concluded that the nature, extent and quality of the services provided by the Adviser are adequate and appropriate.
· The Board generally was satisfied with the fund’s improved performance.
· The Board concluded that the fee paid to the Adviser continued to be appropriate under the circumstances and in light of the factors and the totality of the services provided as discussed above, subject to review no later than the next renewal consideration.
· The Board determined that the economies of scale which may accrue to the Adviser and its affiliates in connection with the management of the fund had been adequately considered by the Adviser in connection with the fee rate charged to the fund pursuant to the Agreement and that, to the extent in the
33
INFORMATION ABOUT THE RENEWAL OF THE FUND’S MANAGEMENT AGREEMENT (Unaudited) (continued)
future it were determined that material economies of scale had not been shared with the fund, the Board would seek to have those economies of scale shared with the fund.
In evaluating the Agreement, the Board considered these conclusions and determinations and also relied on its previous knowledge, gained through meetings and other interactions with the Adviser and its affiliates, of the Adviser and the services provided to the fund by the Adviser. The Board also relied on information received on a routine and regular basis throughout the year relating to the operations of the fund and the investment management and other services provided under the Agreement, including information on the investment performance of the fund in comparison to similar mutual funds and benchmark performance indices; general market outlook as applicable to the fund; and compliance reports. In addition, the Board’s consideration of the contractual fee arrangements for the fund had the benefit of a number of years of reviews of the Agreement for the fund, or substantially similar agreements for other BNY Mellon funds that the Board oversees, during which lengthy discussions took place between the Board and representatives of the Adviser. Certain aspects of the arrangements may receive greater scrutiny in some years than in others, and the Board’s conclusions may be based, in part, on their consideration of the fund’s arrangements, or substantially similar arrangements for other BNY Mellon funds that the Board oversees, in prior years. The Board determined to renew the Agreement for the remainder of the one-year term.
34
LIQUIDITY RISK MANAGEMENT PROGRAM (Unaudited)
Effective June 1, 2019, the fund adopted a liquidity risk management program (the “Liquidity Risk Management Program”) pursuant to the requirements of Rule 22e-4 under the Investment Company Act of 1940, as amended. Rule 22e-4 requires registered open-end funds, including mutual funds and exchange-traded funds but not money market funds, to establish liquidity risk management programs in order to effectively manage fund liquidity and shareholder redemptions. The rule is designed to mitigate the risk that a fund could not meet redemption requests without significantly diluting the interests of remaining investors.
The rule requires the funds to assess, manage and review their liquidity risk at least annually considering applicable factors such as investment strategy and liquidity during normal and foreseeable stressed conditions, including whether the strategy is appropriate for an open-end fund and whether the fund has a relatively concentrated portfolio or large positions in particular issuers. The fund must also assess its use of borrowings and derivatives, short-term and long-term cash flow projections in normal and stressed conditions, holdings of cash and cash equivalents, and borrowing arrangements and other funding sources.
The rule also requires the fund to classify its investments as highly liquid, moderately liquid, less liquid or illiquid based on the number of days the fund expects it would take to liquidate the investment, and to review these classifications at least monthly or more often under certain conditions. The periods range from three or fewer business days for a highly liquid investment to greater than seven calendar days for settlement of a less liquid investment. Illiquid investments are those a fund does not expect to be able to sell or dispose of within seven calendar days without significantly changing the market value. The fund is prohibited from acquiring an investment if, after the acquisition, its holdings of illiquid assets will exceed 15% of its net assets. In addition, if a fund permits redemptions in-kind, the rule requires the fund to establish redemption in-kind policies and procedures governing how and when it will engage in such redemptions.
Pursuant to the rule’s requirements, the Liquidity Risk Management Program has been reviewed and approved by the fund’s board. Furthermore, the board has received a written report prepared by the Program’s Administrator that addresses the operation of the Program, assesses its adequacy and effectiveness and describes any material changes made to the Program.
Assessment of Program
In the opinion of the Program Administrator, the Program approved by the fund board continues to be adequate for the fund and the Program has been implemented effectively. The Program Administrator has monitored the fund’s liquidity risk and the liquidity classification of the securities held by the fund and has determined that the Program is operating effectively.
During the period from June 1, 2019 to March 31, 2020, there were no material changes to the Program and no material liquidity events that impacted the fund. During the period, the fund held sufficient highly liquid assets to meet fund redemptions.
35
LIQUIDITY RISK MANAGEMENT PROGRAM (Unaudited) (continued)
Under normal expected foreseeable fund redemption forecasts and foreseeable stressed fund redemption forecasts, the Program Administrator believes that the fund maintains sufficient highly liquid assets to meet expected fund redemptions.
36
BOARD MEMBERS INFORMATION (Unaudited)
INDEPENDENT BOARD MEMBERS
Joseph S. DiMartino (76)
Chairman of the Board (1995)
Principal Occupation During Past 5 Years:
· Director or Trustee of funds in the BNY Mellon Family of Funds and certain other entities (as described in the fund’s Statement of Additional Information) (1995-Present)
Other Public Company Board Memberships During Past 5 Years:
· CBIZ, Inc., a public company providing professional business services, products and solutions, Director (1997-Present)
No. of Portfolios for which Board Member Serves: 111
———————
Peggy C. Davis (77)
Board Member (2006)
Principal Occupation During Past 5 Years:
· Shad Professor of Law, New York University School of Law (1983-present)
No. of Portfolios for which Board Member Serves: 39
———————
Gina D. France (62)
Board Member (2019)
Principal Occupation During Past 5 Years:
· Founder, President and Chief Executive Officer, France Strategic Partners, a strategy and advisory firm serving corporate clients across the United States (2003 –Present)
· Corporate Director and Trustee (2004 – Present)
Other Public Company Board Memberships During Past 5 Years:
· Huntington Bancshares, a bank holding company headquartered in Columbus, Ohio, Director (2016 – Present)
· Cedar Fair, L.P., a publicly-traded partnership that owns and operates amusement parks and hotels in the U.S. and Canada, Director (2011 – Present)
· CBIZ, Inc., a public company providing professional business services, products and solutions, Director (2015 – Present)
· Baldwin Wallace University, Trustee (2013- 2019)
· FirstMerit Corporation, a diversified financial services company, Director (2004 – 2016)
No. of Portfolios for which Board Member Serves: 25
———————
37
BOARD MEMBERS INFORMATION (Unaudited) (continued)
INDEPENDENT BOARD MEMBERS (continued)
Joan Gulley (72)
Board Member (2017)
Principal Occupation During Past 5 Years:
· PNC Financial Services Group, Inc.(1993-2014), Executive Vice President and Chief Human Resources Officer and Executive Committee Member (2008-2014)
· Director, Nantucket Library (2015-Present)
No. of Portfolios for which Board Member Serves: 44
———————
Robin A. Melvin (56)
Board Member (2012)
Principal Occupation During Past 5 Years:
· Co-chairman, Mentor Illinois, a non-profit organization dedicated to increasing the quantity and quality of mentoring services in Illinois; (2014-Present); Board member (2013-Present)
No. of Portfolios for which Board Member Serves: 89
———————
Once elected all Board Members serve for an indefinite term, but achieve Emeritus status upon reaching age 80. The address of the Board Members and Officers is c/o BNY Mellon Investment Adviser, Inc. 240 Greenwich Street, New York, New York 10286. Additional information about the Board Members is available in the fund’s Statement of Additional Information which can be obtained from the Adviser free of charge by calling this toll free number: 1-800-373-9387.
David P. Feldman, Emeritus Board Member
James F. Henry, Emeritus Board Member
Ehud Houminer, Emeritus Board Member
Lynn Martin, Emeritus Board Member
Dr. Martin Peretz, Emeritus Board Member
Philip L. Toia, Emeritus Board Member
38
OFFICERS OF THE FUND (Unaudited)
RENEE LAROCHE-MORRIS, President since May 2019.
President and a director of BNY Mellon Investment Adviser, Inc. since January 2018. She is an officer of 62 investment companies (comprised of 111 portfolios) managed by the Adviser. She is 49 years old and has been an employee of BNY Mellon since 2003.
JAMES WINDELS, Treasurer since November 2001.
Director-BNY Mellon Fund Administration, and an officer of 64 investment companies (comprised of 142 portfolios) managed by the Adviser or an affiliate of the Adviser. He is 61 years old and has been an employee of the Adviser since April 1985.
BENNETT A. MACDOUGALL, Chief Legal Officer since October 2015.
Chief Legal Officer of the Adviser and Associate General Counsel and Managing Director of BNY Mellon since June 2015; Director and Associate General Counsel of Deutsche Bank–Asset & Wealth Management Division from June 2005 to June 2015, and as Chief Legal Officer of Deutsche Investment Management Americas Inc. from June 2012 to May 2015. He is an officer of 64 investment companies (comprised of 142 portfolios) managed by the Adviser or an affiliate of the Adviser. He is 48 years old and has been an employee of the Adviser since June 2015.
DAVID DIPETRILLO, Vice President since May 2019.
Head of North America Product, BNY Mellon Investment Management since January 2018, Director of Product Strategy, BNY Mellon Investment Management from January 2016 to December 2017; Head of US Retail Product and Channel Marketing, BNY Mellon Investment Management from January 2014 to December 2015. He is an officer of 63 investment companies (comprised of 119 portfolios) managed by the Adviser or an affiliate of the Adviser. He is 42 years old and has been an employee of BNY Mellon since 2005.
JAMES BITETTO, Vice President since August 2005 and Secretary since February 2018.
Senior Managing Counsel of BNY Mellon since December 2019; Managing Counsel of BNY Mellon from April 2014 to December 2019; Secretary of the Adviser, and an officer of 64 investment companies (comprised of 142 portfolios) managed by the Adviser or an affiliate of the Adviser. He is 54 years old and has been an employee of the Adviser since December 1996.
SONALEE CROSS, Vice President and Assistant Secretary since March 2018.
Counsel of BNY Mellon since October 2016; Associate at Proskauer Rose LLP from April 2016 to September 2016; Attorney at EnTrust Capital from August 2015 to February 2016; Associate at Sidley Austin LLP from September 2013 to August 2015. She is an officer of 64 investment companies (comprised of 142 portfolios) managed by the Adviser or an affiliate of the Adviser. She is 32 years old and has been an employee of the Adviser since October 2016.
DEIRDRE CUNNANE, Vice President and Assistant Secretary since March 2019.
Counsel of BNY Mellon since August 2018; Senior Regulatory Specialist at BNY Mellon Investment Management Services from February 2016 to August 2018; Trustee Associate at BNY Mellon Trust Company (Ireland) Limited from August 2013 to February 2016. She is an officer of 64 investment companies (comprised of 142 portfolios) managed by the Adviser or an affiliate of the Adviser. She is 30 years old and has been an employee of the Adviser since August 2018.
SARAH S. KELLEHER, Vice President and Assistant Secretary since April 2014.
Managing Counsel of BNY Mellon since December 2017, Senior Counsel of BNY Mellon from March 2013 to December 2017. She is an officer of 64 investment companies (comprised of 142 portfolios) managed by the Adviser or an affiliate of the Adviser. She is 44 years old and has been an employee of the Adviser since March 2013.
JEFF PRUSNOFSKY, Vice President and Assistant Secretary since August 2005.
Senior Managing Counsel of BNY Mellon, and an officer of 64 investment companies (comprised of 142 portfolios) managed by the Adviser or an affiliate of the Adviser. He is 55 years old and has been an employee of the Adviser since October 1990.
AMANDA QUINN, Vice President and Assistant Secretary since March 2020.
Counsel of BNY Mellon since June 2019; Regulatory Administration Manager at BNY Mellon Investment Management Services from September 2018 to May 2019; Senior Regulatory Specialist at BNY Mellon Investment Management Services from April 2015 to August 2018. She is an officer of 64 investment companies (comprised of 142 portfolios) managed by the Adviser or an affiliate of the Adviser. She is 35 years old and has been an employee of the Adviser since June 2019.
39
OFFICERS OF THE FUND (Unaudited) (continued)
PETER M. SULLIVAN, Vice President and Assistant Secretary since March 2019.
Managing Counsel of BNY Mellon since March 2009, Senior Counsel of BNY Mellon from April 2004 to March 2009, and an officer of 64 investment companies (comprised of 142 portfolios) managed by the Adviser or an affiliate of the Adviser. He is 52 years old and has been an employee of the Adviser since January 2019.
NATALYA ZELENSKY, Vice President and Assistant Secretary since March 2017.
Managing Counsel of BNY Mellon since December 2019; Counsel of BNY Mellon from May 2016 to December 2019; Attorney at Wildermuth Endowment Strategy Fund/Wildermuth Advisory, LLC from November 2015 to May 2016 and Assistant General Counsel at RCS Advisory Services from July 2014 to November 2015. She is an officer of 64 investment companies (comprised of 142 portfolios) managed by the Adviser or an affiliate of the Adviser. She is 35 years old and has been an employee of the Adviser since May 2016.
GAVIN C. REILLY, Assistant Treasurer since December 2005.
Tax Manager-BNY Mellon Fund Administration, and an officer of 64 investment companies (comprised of 142 portfolios) managed by the Adviser or an affiliate of the Adviser. He is 52 years old and has been an employee of the Adviser since April 1991.
ROBERT S. ROBOL, Assistant Treasurer since August 2005.
Senior Accounting Manager-BNY Mellon Fund Administration, and an officer of 64 investment companies (comprised of 142 portfolios) managed by the Adviser or an affiliate of the Adviser. He is 56 years old and has been an employee of the Adviser since October 1988.
ROBERT SALVIOLO, Assistant Treasurer since July 2007.
Senior Accounting Manager–BNY Mellon Fund Administration, and an officer of 64 investment companies (comprised of 142 portfolios) managed by the Adviser or an affiliate of the Adviser. He is 53 years old and has been an employee of the Adviser since June 1989.
ROBERT SVAGNA, Assistant Treasurer since December 2002.
Senior Accounting Manager–BNY Mellon Fund Administration, and an officer of 64 investment companies (comprised of 142 portfolios) managed by the Adviser or an affiliate of the Adviser. He is 53 years old and has been an employee of the Adviser since November 1990.
JOSEPH W. CONNOLLY, Chief Compliance Officer since October 2004.
Chief Compliance Officer of the Adviser, the BNY Mellon Family of Funds and BNY Mellon Funds Trust (63 investment companies, comprised of 134 portfolios). He is 63 years old and has served in various capacities with the Adviser since 1980, including manager of the firm’s Fund Accounting Department from 1997 through October 2001.
CARIDAD M. CAROSELLA, Anti-Money Laundering Compliance Officer since January 2016.
Anti-Money Laundering Compliance Officer of the BNY Mellon Family of Funds and BNY Mellon Funds Trust since January 2016; from May 2015 to December 2015, Interim Anti-Money Laundering Compliance Officer of the BNY Mellon Family of Funds and BNY Mellon Funds Trust and the Distributor; from January 2012 to May 2015, AML Surveillance Officer of the Distributor. She is an officer of 57 investment companies (comprised of 135 portfolios) managed by the Adviser or an affiliate of the Adviser. She is 52 years old and has been an employee of the Distributor since 1997.
40
This page intentionally left blank.
41
BNY Mellon Opportunistic Small Cap Fund
240 Greenwich Street
New York, NY 10286
Adviser
BNY Mellon Investment Adviser, Inc.
240 Greenwich Street
New York, NY 10286
Custodian
The Bank of New York Mellon
240 Greenwich Street
New York, NY 10286
Transfer Agent &
Dividend Disbursing Agent
BNY Mellon Transfer, Inc.
240 Greenwich Street
New York, NY 10286
Distributor
BNY Mellon Securities Corporation
240 Greenwich Street
New York, NY 10286
| | |
Ticker Symbols: | Investor: DSCVX Class I: DOPIX Class Y: DSCYX |
Telephone Call your financial representative or 1-800-373-9387
Mail The BNY Mellon Family of Funds, 144 Glenn Curtiss Boulevard, Uniondale, NY 11556-0144
E-mail Send your request to info@bnymellon.com
Internet Information can be viewed online or downloaded at www.bnymellonim.com/us
The fund files its complete schedule of portfolio holdings with the Securities and Exchange Commission (“SEC”) for the first and third quarters of each fiscal year on Form N-PORT. The fund’s Forms N-PORT are available on the SEC’s website at www.sec.gov.
A description of the policies and procedures that the fund uses to determine how to vote proxies relating to portfolio securities and information regarding how the fund voted these proxies for the most recent 12-month period ended June 30 is available at www.bnymellonim.com/us and on the SEC’s website at www.sec.gov and without charge, upon request, by calling 1-800-373-9387.
| | |
© 2020 BNY Mellon Securities Corporation
0253AR0820 | 
|
BNY Mellon Structured Midcap Fund
| |
ANNUAL REPORT August 31, 2020 |
| |
Save time. Save paper. View your next shareholder report online as soon as it’s available. Log into www.bnymellonim.com/us and sign up for eCommunications. It’s simple and only takes a few minutes. |
| |
The views expressed in this report reflect those of the portfolio manager(s) only through the end of the period covered and do not necessarily represent the views of BNY Mellon Investment Adviser, Inc. or any other person in the BNY Mellon Investment Adviser, Inc. organization. Any such views are subject to change at any time based upon market or other conditions and BNY Mellon Investment Adviser, Inc. disclaims any responsibility to update such views. These views may not be relied on as investment advice and, because investment decisions for a fund in the BNY Mellon Family of Funds are based on numerous factors, may not be relied on as an indication of trading intent on behalf of any fund in the BNY Mellon Family of Funds. |
| |
Not FDIC-Insured • Not Bank-Guaranteed • May Lose Value |
Contents
THE FUND
FOR MORE INFORMATION
Back Cover
| | | | |
| |
BNY Mellon Structured Midcap Fund
| | The Fund |
A LETTER FROM THE PRESIDENT OF BNY MELLON INVESTMENT ADVISER, INC.
Dear Shareholder:
We are pleased to present this annual report for BNY Mellon Structured Midcap Fund, covering the 12-month period from September 1, 2019 through August 31, 2020. For information about how the fund performed during the reporting period, as well as general market perspectives, we provide a Discussion of Fund Performance on the pages that follow.
Early in the reporting period, positive investor sentiment fueled an equity rally. Accommodative rate policies from the U.S. Federal Reserve (the “Fed”) and progress towards a U.S./China trade deal stoked optimism about future economic growth prospects. As the calendar year turned over, this optimism turned to concern, as COVID-19 began to spread across China, adjacent areas of the Pacific Rim and parts of Europe. When the virus spread throughout the U.S. in March 2020, stocks began to show signs of volatility and posted historic losses during the month. Investor angst over the possible economic impact of a widespread quarantine worked to depress equity valuations. Global central banks and governments worked to enact emergency stimulus measures to support their respective economies and equity valuations began to rebound, trending upward for the remainder of the period.
In fixed-income markets, interest rates were heavily influenced by changes in Fed policy and investor concern over COVID-19. In 2019, as stocks rallied in response to Fed rate cuts, risk-asset valuations also rose while Treasuries lagged. When COVID-19 began to emerge, a flight to quality ensued and Treasury rates fell significantly. March 2020 brought extreme volatility and risk-asset spread widening. The Fed cut rates twice in March, resulting in an overnight lending target rate of nearly zero, and the government launched a large stimulus package; many governments and central banks around the globe followed suit. At their meeting in August 2020, the Fed confirmed their commitment to a “lower-for-longer” rate policy.
We believe the near-term outlook for the U.S. will be challenging, as the country curbs the spread of COVID-19. However, we are confident that ongoing central bank and government policy responses can continue to support economic progress. As always, we will monitor relevant data for any signs of a change. We encourage you to discuss the risks and opportunities in today’s investment environment with your financial advisor.
Thank you for your continued confidence and support.
Sincerely,

Renee LaRoche-Morris
President
BNY Mellon Investment Adviser, Inc.
September 15, 2020
2
DISCUSSION OF FUND PERFORMANCE (Unaudited)
For the period from September 1, 2019 through August 31, 2020, as provided by the fund’s primary portfolio managers, Adam Logan, CFA, Chris Yao, CFA, Peter D. Goslin, CFA, and Syed A. Zamil, CFA, of BNY Mellon Investments Corporation, Sub-Investment Adviser
Market and Fund Performance Overview
For the 12-month period ended August 31, 2020, BNY Mellon Structured Midcap Fund’s Class A shares produced a total return of -1.01%, Class C shares returned -1.82%, Class I shares returned -0.80% and Class Y shares returned -0.77%.1 In comparison, the fund’s benchmark, the S&P MidCap 400® Index (the “Index”), posted a total return of 4.22% for the same period.2
Mid-cap stocks gained ground over the reporting period, despite pockets of extreme volatility caused in part by COVID-19. The fund trailed the Index, mainly due to security selection shortfalls in the energy, industrials and consumer discretionary sectors.
The Fund’s Investment Approach
The fund seeks long-term capital growth. To pursue its goal, the fund normally invests at least 80% of its net assets, plus any borrowings for investment purposes, in the stocks of companies included in the Index or the Russell Midcap® Index.
The fund’s portfolio managers select stocks through a “bottom-up,” structured approach that seeks to identify undervalued securities using a quantitative screening process. This process is driven by a proprietary quantitative model that measures a diverse set of characteristics of stocks to identify and rank stocks based on relative value, momentum/sentiment, and earnings quality measures. Next, the fund’s portfolio managers construct the portfolio through a risk controlled process, focusing on stock selection as opposed to making proactive decisions as to industry and sector exposure. The fund seeks to maintain a portfolio that has exposure to industries and market capitalizations that are generally similar to those of the S&P Midcap 400 Index. Finally, within each sector and style subset, the fund seeks to overweight the most attractive stocks and underweight or not hold the stocks that have been ranked least attractive.
Central Bank Policy and Pandemic Influence Markets
Equity markets were affected by an array of geopolitical developments in 2019, ranging from civil protests in Hong Kong and attacks on Saudi Arabia’s oil infrastructure, to an impeachment inquiry against the U.S. president and the Brexit saga in the U.K. The continuing trade tensions between the U.S. and China remained a key influencer of investor sentiment and equity market valuations for much of the period. Equity markets stalled throughout the summer and fall of 2019, due in part to investor concern over slowing economic growth. In an attempt to reassure investors and stoke economic growth, the U.S. Federal Reserve (the “Fed”) cut the overnight federal funds lending rate twice during the early part of the period, each time by 25 basis points. These cuts occurred in September and October 2019. After the cuts, the Fed signaled it would pause, and expectations for better growth prospects in 2020 emerged. Investor optimism helped fuel a rally that pushed U.S. equity indices to new record highs at the end of 2019.
Markets gave way to extreme risk aversion in early 2020, as the global scope of the COVID-19 pandemic, and its alarming humanitarian and economic implications, became apparent. Equity valuations in the U.S. remained robust throughout January and February 2020, while markets in areas that experienced the COVID-19 pandemic earlier, such as China, began to experience volatility closer to the start of the calendar year. Financial markets also had to contend with a second major shock in the form of an oil-price war between Saudi Arabia and Russia, which
3
DISCUSSION OF FUND PERFORMANCE (Unaudited) (continued)
resulted in the oil price falling precipitously in March 2020. Central bank responses to the crisis ramped up dramatically, as financial markets became progressively more distressed. Governments were also proactive and launched an unprecedented array of fiscal initiatives that sought to offset the economic impact of widespread lockdown measures. Such action latterly provided some comfort, and indices began to rally towards the end of March 2020. Supported by central bank and government intervention, U.S. equities generally went on to stage a recovery. Investors began to anticipate a move towards economic normalization as lockdown measures eased. Despite some temporary setbacks, markets generally rallied through the end of the period. However, the recovery was company- and sector-specific, as several industries that remained affected by COVID-19 prevention procedures did not fully participate. In addition, growth-oriented companies were highly favored by investors, leaving many value-oriented and dividend-paying companies behind.
In this environment, large-cap stocks generally outperformed their mid- and small-cap counterparts.
Security Selections Impact Fund Performance
Stock choices in the energy, industrials and consumer discretionary sectors detracted from relative returns during the period. In industrials, negative selection was most pronounced within the construction and engineering and aerospace and defense industries. Our holdings in both industries experienced setbacks due to the spread of COVID-19. Within the consumer discretionary sector, underweight exposure to the outperforming Domino’s Pizza was a leading source of relative underperformance. The energy sector experienced negative stock selection across the oil, gas and consumable fuels industry. The price of oil fell precipitously in March 2020, when a combination of falling demand due to decreased commuter activity and a disagreement between Saudi Arabia and Russia disrupted the market. Elsewhere in the markets, a position in AMC Networks was also among the top individual detractors, as was real estate company Weingarten Realty Investors. Investor speculations over how the economic shutdown may impact tenant lease payments to the company weighed on Weingarten’s stock price. Financial company MGIC Investment was also a top individual detractor. Concerns about the impact of mortgage delinquencies on the mortgage insurer worked to depress the stock.
Conversely, the fund’s relative performance was helped by successful positioning in the real estate and financials sectors. Within the real estate sector, stock choices across the sector boosted performance. An underweight to the financials sector was also beneficial. The sector generally performed poorly during the 12 months, so the fund’s underweight exposure was helpful. In addition, positive stock selection results within the insurance industry was accretive to relative returns. In other sectors, information technology company Tech Data’s stock rose after it agreed to be acquired, bolstering fund returns. We no longer hold the position. Health care company Bio-Rad Laboratories was also a leading contributor. The company beat earnings expectations in May and July, leading to an increase in stock price. Biopharmaceutical company Incyte Corporation was also among the leading contributors. The company announced trials for a COVID-19 therapy drug in April, and also announced positive phase 3 trial data for a dermatology drug. The stock price moved higher throughout the end of the period, and we have closed the position.
A Disciplined Approach to Stock Picking
As of the reporting period’s end, our quantitative models have continued to identify what we believe are attractive investment opportunities across a broad spectrum of mid-cap companies and industry groups. Stock market volatility experienced during the period may have provided opportunities to purchase the stocks of companies ranked highly by our process. When the fund’s
4
holdings reach what we perceive to be fuller valuations, we expect to replace them with high-quality companies that display then-currently attractive valuations in our model. In addition, we continue to maintain a broadly diversified portfolio.
September 15, 2020
1 Total return includes reinvestment of dividends and any capital gains paid and does not take into consideration the maximum initial sales charge in the case of Class A shares or the applicable contingent deferred sales charge imposed on redemptions in the case of Class C shares. Past performance is no guarantee of future results. Share price, yield and investment return fluctuate such that upon redemption, fund shares may be worth more or less than their original cost. The fund’s return reflects the absorption of certain fund expenses by BNY Mellon Investment Adviser, Inc. pursuant to an agreement in effect through December 31, 2020, at which time it may be extended, modified or terminated. Had these expenses not been absorbed, returns would have been lower.
2 Source: Lipper Inc. — The S&P MidCap 400® Index provides investors with a benchmark for midsized companies. The Index measures the performance of midsized companies, reflecting the distinctive risk and return characteristics of this market segment. Investors cannot invest directly in any index.
Please note: the position in any security highlighted with italicized typeface was sold during the reporting period.
Equities are subject generally to market, market sector, market liquidity, issuer and investment style risks, among other factors, to varying degrees, all of which are more fully described in the fund’s prospectus.
Recent market risks include pandemic risks related to COVID-19. The effects of COVID-19 have contributed to increased volatility in global markets and will likely affect certain countries, companies, industries and market sectors more dramatically than others. To the extent the fund may overweight its investments in certain countries, companies, industries or market sectors, such positions will increase the fund’s exposure to risk of loss from adverse developments affecting those countries, companies, industries or sectors.
Stocks of small- and/ or mid-cap companies often experience sharper price fluctuations than stocks of large-cap companies.
5
FUND PERFORMANCE (Unaudited)
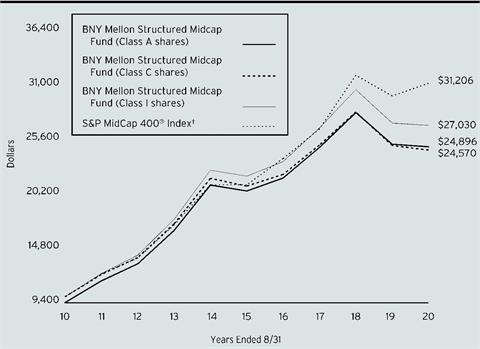
Comparison of change in value of a $10,000 investment in Class A shares, Class C shares, and Class I shares of BNY Mellon Structured Midcap Fund with a hypothetical investment of $10,000 in the S&P MidCap 400® Index Index (the “Index”)
† Source: Lipper Inc.
Past performance is not predictive of future performance.
The above graph compares a hypothetical $10,000 investment made in each of the Class A shares, Class C shares, and Class I shares of BNY Mellon Structured Midcap Fund on 8/31/10 to a hypothetical investment of $10,000 made in the Index on that date. All dividends and capital gain distributions are reinvested.
The fund’s performance shown in the line graph above takes into account the maximum initial sales charge on Class A shares and all other applicable fees and expenses on all classes. The Index provides investors with a benchmark for mid-sized companies. The Index measures the performance of mid-sized companies, reflecting the distinctive risk and return characteristics of this market segment. Unlike a mutual fund, the Index is not subject to charges, fees and other expenses. Investors cannot invest directly in any index. Further information relating to fund performance, including expense reimbursements, if applicable, is contained in the Financial Highlights section of the prospectus and elsewhere in this report.
6

Comparison of change in value of a $1,000,000 investment in Class Y shares of BNY Mellon Structured Midcap Fund with a hypothetical investment of $1,000,000 in the S&P MidCap 400® Index (the “Index”)
† Source: Lipper Inc.
†† The total return figures presented for Class Y shares of the fund reflect the performance of the fund’s Class A shares for the period prior to 7/1/13 (the inception date for Class Y shares), not reflecting the applicable sales charges for Class A shares.
Past performance is not predictive of future performance.
The above graph compares a hypothetical $1,000,000 investment made in Class Y shares of BNY Mellon Structured Midcap Fund on 8/31/10 to a hypothetical investment of $1,000,000 made in the Index on that date. All dividends and capital gain distributions are reinvested.
The fund’s performance shown in the line graph above takes into account all other applicable fees and expenses on Class Y shares. The Index provides investors with a benchmark for mid-sized companies. The Index measures the performance of mid-sized companies, reflecting the distinctive risk and return characteristics of this market segment. Unlike a mutual fund, the Index is not subject to charges, fees and other expenses. Investors cannot invest directly in any index. Further information relating to fund performance, including expense reimbursements, if applicable, is contained in the Financial Highlights section of the prospectus and elsewhere in this report.
7
FUND PERFORMANCE (Unaudited) (continued)
| | | | | |
Average Annual Total Returns as of 8/31/2020 |
| | Inception
Date | 1 Year | 5 Years | 10 Years |
Class A shares | | | | |
with maximum sales charge (5.75%) | 6/29/01 | -6.72% | 2.73% | 9.55% |
without sales charge | 6/29/01 | -1.01% | 3.96% | 10.20% |
Class C shares | | | | |
with applicable redemption charge † | 6/29/01 | -2.75% | 3.19% | 9.41% |
without redemption | 6/29/01 | -1.82% | 3.19% | 9.41% |
Class I shares | 6/29/01 | -0.80% | 4.22% | 10.46% |
Class Y shares | 7/1/13 | -0.77% | 4.33% | 10.65%†† |
S & P MidCap 400® Index | | 4.22% | 8.11% | 12.05% |
† The maximum contingent deferred sales charge for Class C shares is 1% for shares redeemed within one year of the date of purchase.
†† The total return performance figures presented for Class Y shares of the fund reflect the performance of the fund’s Class A shares for the period prior to 7/1/13 (the inception date for Class Y shares), not reflecting the applicable sales charges for Class A shares.
The performance data quoted represents past performance, which is no guarantee of future results. Share price and investment return fluctuate and an investor’s shares may be worth more or less than original cost upon redemption. Current performance may be lower or higher than the performance quoted. Go to www.bnymellonim.com/us for the fund’s most recent month-end returns.
The fund’s performance shown in the graphs and table does not reflect the deduction of taxes that a shareholder would pay on fund distributions or the redemption of fund shares. In addition to the performance of Class A shares shown with and without a maximum sales charge, the fund’s performance shown in the table takes into account all other applicable fees and expenses on all classes.
8
UNDERSTANDING YOUR FUND’S EXPENSES (Unaudited)
As a mutual fund investor, you pay ongoing expenses, such as management fees and other expenses. Using the information below, you can estimate how these expenses affect your investment and compare them with the expenses of other funds. You also may pay one-time transaction expenses, including sales charges (loads) and redemption fees, which are not shown in this section and would have resulted in higher total expenses. For more information, see your fund’s prospectus or talk to your financial adviser.
Review your fund’s expenses
The table below shows the expenses you would have paid on a $1,000 investment in BNY Mellon Structured Midcap Fund from March 1, 2020 to August 31, 2020. It also shows how much a $1,000 investment would be worth at the close of the period, assuming actual returns and expenses.
| | | | | | | |
Expenses and Value of a $1,000 Investment | |
Assume actual returns for the six months ended August 31, 2020 | |
| | | | | | |
| | Class A | Class C | Class I | Class Y | |
Expense paid per $1,000† | $5.88 | $9.69 | $4.60 | $4.60 | |
Ending value (after expenses) | $1,034.00 | $1,029.60 | $1,035.30 | $1,034.60 | |
COMPARING YOUR FUND’S EXPENSES
WITH THOSE OF OTHER FUNDS (Unaudited)
Using the SEC’s method to compare expenses
The Securities and Exchange Commission (“SEC”) has established guidelines to help investors assess fund expenses. Per these guidelines, the table below shows your fund’s expenses based on a $1,000 investment, assuming a hypothetical 5% annualized return. You can use this information to compare the ongoing expenses (but not transaction expenses or total cost) of investing in the fund with those of other funds. All mutual fund shareholder reports will provide this information to help you make this comparison. Please note that you cannot use this information to estimate your actual ending account balance and expenses paid during the period.
| | | | | | | |
Expenses and Value of a $1,000 Investment | |
Assuming a hypothetical 5% annualized return for the six months ended August 31, 2020 | |
| | | | | | |
| | Class A | Class C | Class I | Class Y | |
Expense paid per $1,000† | $5.84 | $9.63 | $4.57 | $4.57 | |
Ending value (after expenses) | $1,019.36 | $1,015.58 | $1,020.61 | $1,020.61 | |
†Expenses are equal to the fund’s annualized expense ratio of 1.15% for Class A, 1.90% for Class C, .90% for Class I and .90% for Class Y, multiplied by the average account value over the period, multiplied by 184/366 (to reflect the one-half year period). |
9
STATEMENT OF INVESTMENTS
August 31, 2020
| | | | | | | | |
| |
Description | | | | Shares | | Value ($) | |
Common Stocks - 99.7% | | | | | |
Automobiles & Components - 2.0% | | | | | |
Adient | | | | 9,100 | a | 157,794 | |
Dana | | | | 21,425 | | 298,879 | |
Gentex | | | | 38,910 | | 1,052,515 | |
Harley-Davidson | | | | 2,190 | b | 60,685 | |
Thor Industries | | | | 2,540 | b | 239,852 | |
Visteon | | | | 1,180 | a | 89,007 | |
| | | | | 1,898,732 | |
Banks - 5.7% | | | | | |
Associated Banc-Corp | | | | 16,420 | | 220,685 | |
Bank of Hawaii | | | | 1,360 | b | 74,854 | |
Bank OZK | | | | 4,880 | | 112,435 | |
Cathay General Bancorp | | | | 37,405 | | 923,529 | |
CIT Group | | | | 10,090 | | 198,470 | |
Comerica | | | | 6,460 | | 255,364 | |
Commerce Bancshares | | | | 1,140 | | 67,910 | |
East West Bancorp | | | | 2,230 | | 82,019 | |
Essent Group | | | | 11,690 | | 417,333 | |
First Citizens Bancshares, Cl. A | | | | 670 | | 263,411 | |
First Financial Bankshares | | | | 6,270 | | 189,824 | |
Home BancShares | | | | 3,730 | | 60,463 | |
International Bancshares | | | | 13,210 | | 417,172 | |
KeyCorp | | | | 26,000 | | 320,320 | |
MGIC Investment | | | | 26,500 | | 243,005 | |
New York Community Bancorp | | | | 37,720 | | 341,366 | |
Popular | | | | 1,305 | | 48,337 | |
Prosperity Bancshares | | | | 3,850 | | 209,902 | |
Regions Financial | | | | 29,210 | | 337,668 | |
Signature Bank | | | | 460 | | 44,634 | |
Trustmark | | | | 16,140 | | 378,967 | |
Western Alliance Bancorp | | | | 9,000 | | 317,700 | |
| | | | | 5,525,368 | |
Capital Goods - 11.3% | | | | | |
Acuity Brands | | | | 6,960 | b | 760,658 | |
AECOM | | | | 3,030 | a | 119,715 | |
Allison Transmission Holdings | | | | 7,410 | | 265,797 | |
Axon Enterprise | | | | 1,770 | a | 151,653 | |
Carlisle | | | | 9,220 | | 1,207,359 | |
Colfax | | | | 6,610 | a,b | 219,981 | |
Curtiss-Wright | | | | 6,785 | | 694,241 | |
Donaldson | | | | 1,480 | | 74,533 | |
EMCOR Group | | | | 10,715 | | 803,732 | |
10
| | | | | | | | |
| |
Description | | | | Shares | | Value ($) | |
Common Stocks - 99.7% (continued) | | | | | |
Capital Goods - 11.3% (continued) | | | | | |
Fortune Brands Home & Security | | | | 3,080 | | 258,966 | |
GATX | | | | 3,830 | b | 256,150 | |
Generac Holdings | | | | 3,760 | a | 714,325 | |
Hubbell | | | | 2,040 | | 295,637 | |
ITT | | | | 9,380 | | 589,158 | |
Lincoln Electric Holdings | | | | 2,570 | | 248,545 | |
MasTec | | | | 9,755 | a,b | 450,779 | |
Mercury Systems | | | | 1,030 | a | 78,012 | |
Nordson | | | | 2,330 | | 434,522 | |
Owens Corning | | | | 2,930 | | 198,185 | |
Regal Beloit | | | | 3,250 | | 321,295 | |
Teledyne Technologies | | | | 1,870 | a | 586,451 | |
The Timken Company | | | | 15,560 | | 843,196 | |
Trex | | | | 3,460 | a,b | 517,235 | |
Univar Solutions | | | | 10,120 | a | 184,083 | |
Valmont Industries | | | | 4,110 | | 522,176 | |
Watsco | | | | 270 | | 66,147 | |
| | | | | 10,862,531 | |
Commercial & Professional Services - 2.4% | | | | | |
Clean Harbors | | | | 5,530 | a | 337,883 | |
CoreLogic | | | | 3,870 | | 256,968 | |
FTI Consulting | | | | 1,530 | a | 175,583 | |
Healthcare Services Group | | | | 5,990 | | 124,592 | |
Herman Miller | | | | 4,530 | | 107,950 | |
HNI | | | | 15,715 | | 500,523 | |
Insperity | | | | 3,170 | | 213,563 | |
Manpowergroup | | | | 3,480 | | 255,119 | |
MSA Safety | | | | 950 | | 119,653 | |
Tetra Tech | | | | 2,360 | | 217,852 | |
| | | | | 2,309,686 | |
Consumer Durables & Apparel - 4.5% | | | | | |
Brunswick | | | | 6,000 | | 371,340 | |
Carter's | | | | 2,530 | | 201,439 | |
Deckers Outdoor | | | | 4,235 | a | 863,389 | |
Helen of Troy | | | | 1,280 | a | 264,730 | |
Polaris | | | | 6,000 | | 606,240 | |
PulteGroup | | | | 3,330 | | 148,485 | |
Tempur Sealy International | | | | 10,520 | a | 899,881 | |
TopBuild | | | | 2,320 | a | 356,816 | |
TRI Pointe Group | | | | 30,600 | a,b | 516,528 | |
Whirlpool | | | | 510 | | 90,637 | |
| | | | | 4,319,485 | |
11
STATEMENT OF INVESTMENTS (continued)
| | | | | | | | |
| |
Description | | | | Shares | | Value ($) | |
Common Stocks - 99.7% (continued) | | | | | |
Consumer Services - 5.0% | | | | | |
Adtalem Global Education | | | | 5,020 | a | 166,664 | |
Boyd Gaming | | | | 13,530 | | 362,333 | |
Caesars Entertainment | | | | 8,760 | a,b | 401,208 | |
Churchill Downs | | | | 2,240 | b | 391,462 | |
Domino's Pizza | | | | 1,060 | | 433,498 | |
Dunkin' Brands Group | | | | 2,780 | | 211,502 | |
Graham Holdings, Cl. B | | | | 730 | | 312,404 | |
Grand Canyon Education | | | | 1,840 | a | 173,034 | |
Jack in the Box | | | | 6,515 | b | 536,771 | |
Marriott Vacations Worldwide | | | | 1,250 | | 118,338 | |
Norwegian Cruise Line Holdings | | | | 6,440 | a,b | 110,188 | |
Papa John's International | | | | 2,500 | | 245,725 | |
Penn National Gaming | | | | 7,700 | a,b | 393,470 | |
Scientific Games | | | | 6,050 | a | 125,144 | |
Service Corp. International | | | | 10,280 | | 469,282 | |
Strategic Education | | | | 890 | | 91,287 | |
WW International | | | | 3,020 | a | 70,910 | |
Wyndham Destinations | | | | 6,000 | | 173,940 | |
| | | | | 4,787,160 | |
Diversified Financials - 3.3% | | | | | |
Eaton Vance | | | | 4,780 | | 196,076 | |
Evercore, Cl. A | | | | 3,810 | | 235,763 | |
Federated Hermes | | | | 20,900 | | 499,719 | |
Interactive Brokers Group, Cl. A | | | | 1,540 | | 81,651 | |
Janus Henderson Group | | | | 7,780 | | 161,202 | |
Jefferies Financial Group | | | | 16,260 | | 285,200 | |
Navient | | | | 21,310 | | 193,708 | |
OneMain Holdings | | | | 9,260 | | 269,281 | |
SEI Investments | | | | 18,020 | | 943,527 | |
State Street | | | | 710 | | 48,344 | |
Stifel Financial | | | | 4,520 | | 229,209 | |
Synchrony Financial | | | | 1,985 | | 49,248 | |
| | | | | 3,192,928 | |
Energy - 2.3% | | | | | |
Antero Midstream | | | | 7,210 | | 48,812 | |
ChampionX | | | | 12,010 | a | 122,982 | |
CNX Resources | | | | 17,090 | a | 187,306 | |
Devon Energy | | | | 18,250 | | 198,378 | |
EQT | | | | 13,300 | | 211,071 | |
Equitrans Midstream | | | | 12,010 | | 123,463 | |
Helmerich & Payne | | | | 2,420 | | 39,882 | |
Marathon Oil | | | | 45,920 | | 242,458 | |
Murphy Oil | | | | 14,450 | b | 198,543 | |
12
| | | | | | | | |
| |
Description | | | | Shares | | Value ($) | |
Common Stocks - 99.7% (continued) | | | | | |
Energy - 2.3% (continued) | | | | | |
National Oilwell Varco | | | | 7,440 | | 89,280 | |
PBF Energy, Cl. A | | | | 8,660 | | 74,130 | |
The Williams Companies | | | | 11,640 | | 241,646 | |
World Fuel Services | | | | 7,995 | | 211,068 | |
WPX Energy | | | | 34,410 | a | 191,320 | |
| | | | | 2,180,339 | |
Food & Staples Retailing - .9% | | | | | |
BJ's Wholesale Club Holdings | | | | 8,320 | a,b | 369,491 | |
Casey's General Stores | | | | 1,005 | | 178,739 | |
Sprouts Farmers Market | | | | 12,730 | a | 297,246 | |
| | | | | 845,476 | |
Food, Beverage & Tobacco - 1.6% | | | | | |
Campbell Soup | | | | 3,290 | | 173,087 | |
Conagra Brands | | | | 1,520 | | 58,307 | |
Darling Ingredients | | | | 10,470 | a | 334,726 | |
Flowers Foods | | | | 22,970 | | 561,846 | |
Tootsie Roll Industries | | | | 8,099 | b | 259,087 | |
TreeHouse Foods | | | | 3,420 | a | 146,410 | |
| | | | | 1,533,463 | |
Health Care Equipment & Services - 6.4% | | | | | |
Acadia Healthcare | | | | 4,030 | a | 124,567 | |
Amedisys | | | | 2,040 | a | 493,476 | |
AmerisourceBergen | | | | 2,380 | | 230,934 | |
Chemed | | | | 1,560 | | 806,692 | |
DaVita | | | | 2,390 | a | 207,356 | |
Globus Medical, Cl. A | | | | 3,830 | a | 216,472 | |
Haemonetics | | | | 960 | a | 86,074 | |
HealthEquity | | | | 2,050 | a | 117,834 | |
Hill-Rom Holdings | | | | 6,215 | | 582,905 | |
LHC Group | | | | 1,510 | a | 314,744 | |
Masimo | | | | 1,235 | a | 276,640 | |
McKesson | | | | 1,170 | | 179,525 | |
Molina Healthcare | | | | 2,490 | a | 460,575 | |
NuVasive | | | | 3,530 | a | 184,019 | |
Quidel | | | | 2,460 | a | 432,862 | |
STERIS | | | | 6,270 | | 1,000,943 | |
Tenet Healthcare | | | | 7,630 | a | 215,013 | |
West Pharmaceutical Services | | | | 830 | | 235,687 | |
| | | | | 6,166,318 | |
Household & Personal Products - .9% | | | | | |
Edgewell Personal Care | | | | 6,440 | a | 184,892 | |
Energizer Holdings | | | | 1,540 | b | 71,287 | |
Nu Skin Enterprises, Cl. A | | | | 9,680 | | 457,574 | |
13
STATEMENT OF INVESTMENTS (continued)
| | | | | | | | |
| |
Description | | | | Shares | | Value ($) | |
Common Stocks - 99.7% (continued) | | | | | |
Household & Personal Products - .9% (continued) | | | | | |
The Clorox Company | | | | 620 | | 138,570 | |
| | | | | 852,323 | |
Insurance - 4.7% | | | | | |
American Financial Group | | | | 4,770 | | 318,875 | |
Fidelity National Financial | | | | 3,870 | | 127,052 | |
First American Financial | | | | 8,110 | | 426,343 | |
Globe Life | | | | 5,925 | | 488,694 | |
Kemper | | | | 7,350 | | 570,801 | |
Primerica | | | | 11,470 | | 1,432,029 | |
Reinsurance Group of America | | | | 2,200 | | 201,696 | |
RenaissanceRe Holdings | | | | 1,460 | | 268,260 | |
RLI | | | | 2,670 | | 250,419 | |
Selective Insurance Group | | | | 3,600 | | 215,316 | |
The Hanover Insurance Group | | | | 2,180 | | 223,428 | |
Unum Group | | | | 3,000 | | 55,440 | |
| | | | | 4,578,353 | |
Materials - 5.7% | | | | | |
Avient | | | | 16,960 | | 432,819 | |
Compass Minerals International | | | | 810 | | 46,113 | |
Crown Holdings | | | | 680 | a | 52,258 | |
Eagle Materials | | | | 5,620 | | 459,547 | |
FMC | | | | 730 | | 78,008 | |
Graphic Packaging Holding | | | | 19,890 | | 278,062 | |
Ingevity | | | | 1,270 | a | 71,336 | |
Louisiana-Pacific | | | | 8,670 | | 285,590 | |
NewMarket | | | | 610 | | 227,219 | |
Packaging Corp. of America | | | | 1,120 | | 113,389 | |
Reliance Steel & Aluminum | | | | 8,005 | | 839,484 | |
Royal Gold | | | | 2,170 | | 295,814 | |
Sensient Technologies | | | | 13,480 | | 744,366 | |
Silgan Holdings | | | | 8,510 | | 323,891 | |
The Chemours Company | | | | 4,550 | b | 94,003 | |
The Scotts Miracle-Gro Company | | | | 1,960 | | 330,319 | |
Valvoline | | | | 32,905 | | 671,262 | |
Worthington Industries | | | | 4,525 | | 187,923 | |
| | | | | 5,531,403 | |
Media & Entertainment - 2.3% | | | | | |
AMC Networks, Cl. A | | | | 7,920 | a,b | 192,377 | |
Cable One | | | | 220 | | 404,873 | |
Cinemark Holdings | | | | 13,660 | b | 200,119 | |
Liberty Media Corp-Liberty SiriusXM, Cl. C | | | | 3,240 | a | 116,624 | |
Take-Two Interactive Software | | | | 570 | a | 97,578 | |
14
| | | | | | | | |
| |
Description | | | | Shares | | Value ($) | |
Common Stocks - 99.7% (continued) | | | | | |
Media & Entertainment - 2.3% (continued) | | | | | |
TEGNA | | | | 17,425 | | 218,161 | |
The Interpublic Group of Companies | | | | 4,840 | | 85,958 | |
The New York Times Company, Cl. A | | | | 12,440 | | 539,025 | |
TripAdvisor | | | | 4,260 | a | 99,556 | |
World Wrestling Entertainment, Cl. A | | | | 2,240 | b | 98,717 | |
Yelp | | | | 3,610 | a | 83,463 | |
Zynga, Cl. A | | | | 8,920 | a | 80,815 | |
| | | | | 2,217,266 | |
Pharmaceuticals Biotechnology & Life Sciences - 5.5% | | | | | |
ACADIA Pharmaceuticals | | | | 820 | a,b | 32,464 | |
Arrowhead Pharmaceuticals | | | | 4,180 | a,b | 176,563 | |
BioMarin Pharmaceutical | | | | 390 | a | 30,432 | |
Bio-Rad Laboratories, Cl. A | | | | 1,080 | a | 549,277 | |
Bio-Techne | | | | 650 | | 166,049 | |
Catalent | | | | 5,280 | a | 488,400 | |
Charles River Laboratories International | | | | 5,150 | a | 1,127,592 | |
Emergent BioSolutions | | | | 2,760 | a | 314,778 | |
Exelixis | | | | 14,920 | a | 331,522 | |
Jazz Pharmaceuticals | | | | 2,610 | a | 350,758 | |
Ligand Pharmaceuticals | | | | 800 | a | 81,600 | |
Mettler-Toledo International | | | | 250 | a | 242,695 | |
Moderna | | | | 710 | a,b | 46,072 | |
Neurocrine Biosciences | | | | 810 | a | 94,300 | |
PRA Health Sciences | | | | 3,950 | a | 422,295 | |
Prestige Consumer Healthcare | | | | 4,790 | a | 174,500 | |
Repligen | | | | 2,430 | a | 376,431 | |
Syneos Health | | | | 4,120 | a | 259,972 | |
United Therapeutics | | | | 840 | a | 89,846 | |
| | | | | 5,355,546 | |
Real Estate - 9.9% | | | | | |
Apple Hospitality REIT | | | | 5,120 | c | 52,070 | |
Brandywine Realty Trust | | | | 74,540 | c | 829,630 | |
Brixmor Property Group | | | | 4,640 | c | 54,752 | |
Camden Property Trust | | | | 8,400 | c | 763,896 | |
CoreSite Realty | | | | 950 | c | 116,328 | |
Corporate Office Properties Trust | | | | 35,360 | c | 871,270 | |
Cousins Properties | | | | 8,460 | c | 252,531 | |
CyrusOne | | | | 1,460 | c | 121,954 | |
EastGroup Properties | | | | 3,740 | c | 498,018 | |
First Industrial Realty Trust | | | | 35,285 | c | 1,504,905 | |
Gaming & Leisure Properties | | | | 1,900 | c | 69,065 | |
Healthcare Realty Trust | | | | 4,710 | c | 135,884 | |
Highwoods Properties | | | | 12,740 | c | 474,692 | |
15
STATEMENT OF INVESTMENTS (continued)
| | | | | | | | |
| |
Description | | | | Shares | | Value ($) | |
Common Stocks - 99.7% (continued) | | | | | |
Real Estate - 9.9% (continued) | | | | | |
Lamar Advertising, Cl. A | | | | 14,280 | c | 988,604 | |
Life Storage | | | | 3,830 | c | 403,797 | |
Omega Healthcare Investors | | | | 13,420 | c | 415,617 | |
PS Business Parks | | | | 7,435 | c | 938,297 | |
Sabra Health Care REIT | | | | 12,300 | c | 182,409 | |
Service Properties Trust | | | | 21,040 | c | 172,738 | |
The GEO Group | | | | 16,210 | c | 180,904 | |
Weingarten Realty Investors | | | | 28,370 | c | 495,624 | |
| | | | | 9,522,985 | |
Retailing - 4.2% | | | | | |
Aaron's | | | | 5,440 | | 304,042 | |
AutoNation | | | | 7,480 | a | 425,313 | |
Etsy | | | | 7,770 | a | 930,069 | |
Foot Locker | | | | 4,580 | | 138,911 | |
Kohl's | | | | 8,710 | b | 186,046 | |
LKQ | | | | 2,620 | a | 83,159 | |
Murphy USA | | | | 2,340 | a | 315,572 | |
Nordstrom | | | | 7,100 | b | 113,600 | |
Pool | | | | 1,540 | | 504,874 | |
RH | | | | 1,430 | a,b | 472,687 | |
Sally Beauty Holdings | | | | 7,430 | a | 82,919 | |
Williams-Sonoma | | | | 5,210 | | 457,230 | |
| | | | | 4,014,422 | |
Semiconductors & Semiconductor Equipment - 5.7% | | | | | |
Cirrus Logic | | | | 7,480 | a | 453,213 | |
Enphase Energy | | | | 6,300 | a,b | 486,549 | |
Inphi | | | | 440 | a | 50,151 | |
MKS Instruments | | | | 3,490 | | 417,160 | |
Monolithic Power Systems | | | | 2,580 | | 689,195 | |
Qorvo | | | | 1,030 | a | 132,118 | |
Semtech | | | | 4,440 | a | 260,406 | |
Silicon Laboratories | | | | 4,105 | a | 420,393 | |
SolarEdge Technologies | | | | 2,750 | a | 608,162 | |
Synaptics | | | | 4,300 | a | 366,919 | |
Teradyne | | | | 16,480 | | 1,400,306 | |
Universal Display | | | | 960 | | 168,480 | |
| | | | | 5,453,052 | |
Software & Services - 6.0% | | | | | |
ACI Worldwide | | | | 6,040 | a | 177,455 | |
Blackbaud | | | | 4,610 | | 294,349 | |
CACI International, Cl. A | | | | 2,945 | a | 689,690 | |
CDK Global | | | | 3,280 | | 152,914 | |
Ceridian HCM Holding | | | | 3,460 | a | 275,139 | |
16
| | | | | | | | |
| |
Description | | | | Shares | | Value ($) | |
Common Stocks - 99.7% (continued) | | | | | |
Software & Services - 6.0% (continued) | | | | | |
Fair Isaac | | | | 2,570 | a | 1,081,430 | |
FleetCor Technologies | | | | 190 | a | 47,776 | |
Fortinet | | | | 1,030 | a | 135,965 | |
J2 Global | | | | 8,050 | a,b | 563,419 | |
KBR | | | | 14,465 | | 361,480 | |
Leidos Holdings | | | | 2,735 | | 247,490 | |
Manhattan Associates | | | | 4,880 | a | 474,580 | |
Paylocity Holding | | | | 2,700 | a | 397,575 | |
Perspecta | | | | 1,990 | | 41,332 | |
Qualys | | | | 2,850 | a | 302,499 | |
Sabre | | | | 7,740 | b | 54,103 | |
WEX | | | | 3,010 | a | 480,727 | |
| | | | | 5,777,923 | |
Technology Hardware & Equipment - 3.8% | | | | | |
Arrow Electronics | | | | 4,140 | a | 325,238 | |
Ciena | | | | 15,840 | a | 899,237 | |
Cognex | | | | 5,920 | | 409,605 | |
Jabil | | | | 3,360 | | 114,744 | |
Lumentum Holdings | | | | 4,750 | a | 408,500 | |
NETSCOUT Systems | | | | 6,270 | a | 145,088 | |
SYNNEX | | | | 2,480 | | 315,332 | |
Trimble | | | | 10,850 | a | 568,648 | |
Zebra Technologies, Cl. A | | | | 1,670 | a | 478,505 | |
| | | �� | | 3,664,897 | |
Transportation - 1.5% | | | | | |
Avis Budget Group | | | | 5,520 | a,b | 188,287 | |
Kansas City Southern | | | | 480 | | 87,379 | |
Old Dominion Freight Line | | | | 1,330 | | 268,899 | |
Schneider National, Cl. B | | | | 3,600 | | 97,416 | |
Werner Enterprises | | | | 5,100 | | 234,651 | |
XPO Logistics | | | | 6,250 | a | 551,688 | |
| | | | | 1,428,320 | |
Utilities - 4.1% | | | | | |
Hawaiian Electric Industries | | | | 5,410 | | 187,240 | |
IDACORP | | | | 11,775 | | 1,058,572 | |
MDU Resources Group | | | | 28,155 | | 665,021 | |
NorthWestern | | | | 2,600 | | 134,264 | |
OGE Energy | | | | 33,370 | | 1,063,168 | |
ONE Gas | | | | 6,810 | | 504,757 | |
Spire | | | | 6,240 | | 363,230 | |
| | | | | 3,976,252 | |
Total Common Stocks (cost $89,909,013) | | | | 95,994,228 | |
17
STATEMENT OF INVESTMENTS (continued)
| | | | | | | | |
| |
Description | | 1-Day
Yield (%) | | Shares | | Value ($) | |
Investment Companies - .4% | | | | | |
Registered Investment Companies - .4% | | | | | |
Dreyfus Institutional Preferred Government Plus Money Market Fund
(cost $360,413) | | 0.20 | | 360,413 | d | 360,413 | |
| | | | | | | | |
Investment of Cash Collateral for Securities Loaned - 1.2% | | | | | |
Registered Investment Companies - 1.2% | | | | | |
Dreyfus Institutional Preferred Government Plus Money Market Fund
(cost $1,189,990) | | 0.20 | | 1,189,990 | d | 1,189,990 | |
Total Investments (cost $91,459,416) | | 101.3% | | 97,544,631 | |
Liabilities, Less Cash and Receivables | | (1.3%) | | (1,257,971) | |
Net Assets | | 100.0% | | 96,286,660 | |
REIT—Real Estate Investment Trust
aNon-income producing security.
bSecurity, or portion thereof, on loan. At August 31, 2020, the value of the fund’s securities on loan was $7,741,693 and the value of the collateral was $8,092,757, consisting of cash collateral of $1,189,990 and U.S. Government & Agency securities valued at $6,902,767.
cInvestment in real estate investment trust within the United States.
dInvestment in affiliated issuer. The investment objective of this investment company is publicly available and can be found within the investment company’s prospectus.
| | |
Portfolio Summary (Unaudited) † | Value (%) |
Consumer Discretionary | 15.6 |
Information Technology | 15.5 |
Industrials | 15.2 |
Financials | 13.8 |
Health Care | 12.0 |
Real Estate | 9.9 |
Materials | 5.7 |
Utilities | 4.1 |
Consumer Staples | 3.3 |
Communication Services | 2.3 |
Energy | 2.3 |
Investment Companies | 1.6 |
| | 101.3 |
† Based on net assets.
See notes to financial statements.
18
STATEMENT OF INVESTMENTS IN AFFILIATED ISSUERS
| | | | | | | |
Investment Companies | Value
8/31/19($) | Purchases($)† | Sales ($) | Value
8/31/20($) | Net
Assets(%) | Dividends/
Distributions($) |
Registered Investment Companies; | | | | |
Dreyfus Institutional Preferred Government Plus Money Market Fund | 673,884 | 24,591,665 | (24,905,136) | 360,413 | .4 | 4,882 |
Investment of Cash Collateral for Securities Loaned; | | |
Dreyfus Institutional Preferred Government Plus Money Market Fund | 1,205,834 | 9,446,634 | (9,462,478) | 1,189,990 | 1.2 | - |
Total | 1,879,718 | 34,038,299 | (34,367,614) | 1,550,403 | 1.6 | 4,882 |
† Includes reinvested dividends/distributions.
See notes to financial statements.
19
STATEMENT OF ASSETS AND LIABILITIES
August 31, 2020
| | | | | | | |
| | | | | | |
| | | Cost | | Value | |
Assets ($): | | | | |
Investments in securities—See Statement of Investments
(including securities on loan, valued at $7,741,693)—Note 1(c): | | | |
Unaffiliated issuers | 89,909,013 | | 95,994,228 | |
Affiliated issuers | | 1,550,403 | | 1,550,403 | |
Dividends and securities lending income receivable | | 126,142 | |
Receivable for shares of Common Stock subscribed | | 6,435 | |
Prepaid expenses | | | | | 36,735 | |
| | | | | 97,713,943 | |
Liabilities ($): | | | | |
Due to BNY Mellon Investment Adviser, Inc. and affiliates—Note 3(c) | | 59,974 | |
Liability for securities on loan—Note 1(c) | | 1,189,990 | |
Payable for shares of Common Stock redeemed | | 51,996 | |
Directors’ fees and expenses payable | | 2,300 | |
Other accrued expenses | | | | | 123,023 | |
| | | | | 1,427,283 | |
Net Assets ($) | | | 96,286,660 | |
Composition of Net Assets ($): | | | | |
Paid-in capital | | | | | 91,461,096 | |
Total distributable earnings (loss) | | | | | 4,825,564 | |
Net Assets ($) | | | 96,286,660 | |
| | | | | | |
Net Asset Value Per Share | Class A | Class C | Class I | Class Y | |
Net Assets ($) | 62,966,174 | 3,303,841 | 29,205,348 | 811,297 | |
Shares Outstanding | 2,624,924 | 163,970 | 1,187,703 | 33,200 | |
Net Asset Value Per Share ($) | 23.99 | 20.15 | 24.59 | 24.44 | |
| | | | | |
See notes to financial statements. | | | | | |
20
STATEMENT OF OPERATIONS
Year Ended August 31, 2020
| | | | | | | |
| | | | | | |
| | | | | | |
Investment Income ($): | | | | |
Income: | | | | |
Cash dividends (net of $2,925 foreign taxes withheld at source): | |
Unaffiliated issuers | | | 1,807,906 | |
Affiliated issuers | | | 4,810 | |
Income from securities lending—Note 1(c) | | | 22,927 | |
Interest | | | 12,509 | |
Total Income | | | 1,848,152 | |
Expenses: | | | | |
Management fee—Note 3(a) | | | 828,451 | |
Shareholder servicing costs—Note 3(c) | | | 479,433 | |
Professional fees | | | 89,962 | |
Registration fees | | | 65,284 | |
Distribution fees—Note 3(b) | | | 35,985 | |
Prospectus and shareholders’ reports | | | 15,946 | |
Chief Compliance Officer fees—Note 3(c) | | | 13,975 | |
Directors’ fees and expenses—Note 3(d) | | | 10,793 | |
Custodian fees—Note 3(c) | | | 8,512 | |
Loan commitment fees—Note 2 | | | 3,077 | |
Interest expense—Note 2 | | | 785 | |
Miscellaneous | | | 19,777 | |
Total Expenses | | | 1,571,980 | |
Less—reduction in expenses due to undertaking—Note 3(a) | | | (290,892) | |
Net Expenses | | | 1,281,088 | |
Investment Income—Net | | | 567,064 | |
Realized and Unrealized Gain (Loss) on Investments—Note 4 ($): | | |
Net realized gain (loss) on investments | (481,101) | |
Capital gain distributions from affiliated issuers | 72 | |
Net Realized Gain (Loss) | | | (481,029) | |
Net change in unrealized appreciation (depreciation) on investments | (1,664,345) | |
Net Realized and Unrealized Gain (Loss) on Investments | | | (2,145,374) | |
Net (Decrease) in Net Assets Resulting from Operations | | (1,578,310) | |
| | | | | | |
See notes to financial statements. | | | | | |
21
STATEMENT OF CHANGES IN NET ASSETS
| | | | | | | | | | |
| | | | Year Ended August 31, |
| | | | 2020 | | 2019 | |
Operations ($): | | | | | | | | |
Investment income—net | | | 567,064 | | | | 576,582 | |
Net realized gain (loss) on investments | | (481,029) | | | | 7,195,927 | |
Net change in unrealized appreciation
(depreciation) on investments | | (1,664,345) | | | | (29,460,488) | |
Net Increase (Decrease) in Net Assets
Resulting from Operations | (1,578,310) | | | | (21,687,979) | |
Distributions ($): | |
Distributions to shareholders: | | | | | | | | |
Class A | | | (3,461,274) | | | | (9,315,569) | |
Class C | | | (286,033) | | | | (1,059,498) | |
Class I | | | (1,839,840) | | | | (6,774,294) | |
Class Y | | | (174,801) | | | | (492,156) | |
Total Distributions | | | (5,761,948) | | | | (17,641,517) | |
Capital Stock Transactions ($): | |
Net proceeds from shares sold: | | | | | | | | |
Class A | | | 4,166,953 | | | | 5,440,433 | |
Class C | | | 128,111 | | | | 560,296 | |
Class I | | | 9,171,526 | | | | 11,104,539 | |
Class Y | | | 1,938,347 | | | | 2,023,064 | |
Distributions reinvested: | | | | | | | | |
Class A | | | 3,209,481 | | | | 8,609,378 | |
Class C | | | 243,578 | | | | 945,517 | |
Class I | | | 1,748,107 | | | | 6,535,000 | |
Class Y | | | 163,186 | | | | 341,035 | |
Cost of shares redeemed: | | | | | | | | |
Class A | | | (17,181,368) | | | | (22,001,004) | |
Class C | | | (3,050,517) | | | | (3,737,211) | |
Class I | | | (28,309,089) | | | | (34,538,004) | |
Class Y | | | (3,933,273) | | | | (3,191,107) | |
Increase (Decrease) in Net Assets
from Capital Stock Transactions | (31,704,958) | | | | (27,908,064) | |
Total Increase (Decrease) in Net Assets | (39,045,216) | | | | (67,237,560) | |
Net Assets ($): | |
Beginning of Period | | | 135,331,876 | | | | 202,569,436 | |
End of Period | | | 96,286,660 | | | | 135,331,876 | |
22
| | | | | | | | | | |
| | | | Year Ended August 31, |
| | | | 2020 | | 2019 | |
Capital Share Transactions (Shares): | |
Class Aa,b | | | | | | | | |
Shares sold | | | 176,744 | | | | 206,493 | |
Shares issued for distributions reinvested | | | 121,339 | | | | 369,501 | |
Shares redeemed | | | (722,327) | | | | (819,354) | |
Net Increase (Decrease) in Shares Outstanding | (424,244) | | | | (243,360) | |
Class Cb | | | | | | | | |
Shares sold | | | 6,098 | | | | 24,407 | |
Shares issued for distributions reinvested | | | 10,904 | | | | 47,514 | |
Shares redeemed | | | (151,447) | | | | (163,717) | |
Net Increase (Decrease) in Shares Outstanding | (134,445) | | | | (91,796) | |
Class Ia | | | | | | | | |
Shares sold | | | 365,933 | | | | 398,792 | |
Shares issued for distributions reinvested | | | 64,698 | | | | 274,349 | |
Shares redeemed | | | (1,118,849) | | | | (1,254,024) | |
Net Increase (Decrease) in Shares Outstanding | (688,218) | | | | (580,883) | |
Class Y | | | | | | | | |
Shares sold | | | 72,049 | | | | 70,164 | |
Shares issued for distributions reinvested | | | 6,132 | | | | 14,359 | |
Shares redeemed | | | (160,317) | | | | (116,824) | |
Net Increase (Decrease) in Shares Outstanding | (82,136) | | | | (32,301) | |
| | | | | | | | | |
aDuring the period ended August 31, 2020, 3,301 Class A shares representing $84,527 were exchanged for 3,224 Class I shares. | |
bDuring the period ended August 31, 2020, 1,114 Class C shares representing $21,497 were automatically converted to 940 Class A share and during the period ended August 31, 2019, 2,361 Class C shares representing $55,506 were automatically converted to 2,028 Class A shares. | |
See notes to financial statements. | | | | | | | | |
23
FINANCIAL HIGHLIGHTS
The following tables describe the performance for each share class for the fiscal periods indicated. All information (except portfolio turnover rate) reflects financial results for a single fund share. Total return shows how much your investment in the fund would have increased (or decreased) during each period, assuming you had reinvested all dividends and distributions. These figures have been derived from the fund’s financial statements.
| | | | | | | | | |
| | | | |
| | | |
Class A Shares | | Year Ended August 31, |
| | 2020 | 2019 | 2018 | 2017 | 2016 |
Per Share Data ($): | | | | | | |
Net asset value, beginning of period | | 25.33 | 32.17 | 31.03 | 27.43 | 28.21 |
Investment Operations: | | | | | | |
Investment income—neta | | .11 | .08 | .02 | .04 | .23 |
Net realized and unrealized
gain (loss) on investments | | (.25) | (3.92) | 4.23 | 3.78 | 1.43 |
Total from Investment Operations | | (.14) | (3.84) | 4.25 | 3.82 | 1.66 |
Distributions: | | | | | | |
Dividends from
investment income—net | | (.10) | (.01) | (.02) | (.22) | - |
Dividends from net realized
gain on investments | | (1.10) | (2.99) | (3.09) | - | (2.44) |
Total Distributions | | (1.20) | (3.00) | (3.11) | (.22) | (2.44) |
Net asset value, end of period | | 23.99 | 25.33 | 32.17 | 31.03 | 27.43 |
Total Return (%)b | | (1.01) | (11.12) | 13.96 | 13.95 | 6.27 |
Ratios/Supplemental Data (%): | | | | | | |
Ratio of total expenses
to average net assets | | 1.55 | 1.36 | 1.42 | 1.32 | 1.29 |
Ratio of net expenses
to average net assets | | 1.21 | 1.25 | 1.25 | 1.25 | 1.25 |
Ratio of net investment income
to average net assets | | .47 | .29 | .07 | .13 | .87 |
Portfolio Turnover Rate | | 85.49 | 78.15 | 66.61 | 63.25 | 71.27 |
Net Assets, end of period ($ x 1,000) | | 62,966 | 77,249 | 105,934 | 98,978 | 108,588 |
a Based on average shares outstanding.
b Exclusive of sales charge.
See notes to financial statements.
24
| | | | | | | | | |
| | | | |
| | | |
Class C Shares | | Year Ended August 31, |
| | 2020 | 2019 | 2018 | 2017 | 2016 |
Per Share Data ($): | | | | | | |
Net asset value, beginning of period | | 21.52 | 28.06 | 27.59 | 24.42 | 25.55 |
Investment Operations: | | | | | | |
Investment income (loss)—neta | | (.06) | (.10) | (.17) | (.16) | .03 |
Net realized and unrealized
gain (loss) on investments | | (.21) | (3.45) | 3.73 | 3.37 | 1.28 |
Total from Investment Operations | | (.27) | (3.55) | 3.56 | 3.21 | 1.31 |
Distributions: | | | | | | |
Dividends from
investment income—net | | - | - | - | (.04) | - |
Dividends from net realized
gain on investments | | (1.10) | (2.99) | (3.09) | - | (2.44) |
Total Distributions | | (1.10) | (2.99) | (3.09) | (.04) | (2.44) |
Net asset value, end of period | | 20.15 | 21.52 | 28.06 | 27.59 | 24.42 |
Total Return (%)b | | (1.82) | (11.76) | 13.14 | 13.14 | 5.50 |
Ratios/Supplemental Data (%): | | | | | | |
Ratio of total expenses
to average net assets | | 2.13 | 2.09 | 1.99 | 1.98 | 2.00 |
Ratio of net expenses
to average net assets | | 1.96 | 2.00 | 1.97 | 1.97 | 1.99 |
Ratio of net investment income
(loss) to average net assets | | (.30) | (.44) | (.62) | (.59) | .13 |
Portfolio Turnover Rate | | 85.49 | 78.15 | 66.61 | 63.25 | 71.27 |
Net Assets, end of period ($ x 1,000) | | 3,304 | 6,422 | 10,949 | 25,077 | 31,817 |
a Based on average shares outstanding.
b Exclusive of sales charge.
See notes to financial statements.
25
FINANCIAL HIGHLIGHTS (continued)
| | | | | | | | | | | | |
| | | | | | | |
| | | |
Class I Shares | | Year Ended August 31, |
| | 2020 | 2019 | 2018 | 2017 | 2016 |
Per Share Data ($): | | | | | | |
Net asset value, beginning of period | | 25.95 | 32.90 | 31.67 | 28.02 | 28.73 |
Investment Operations: | | | | | | |
Investment income—neta | | .17 | .15 | .10 | .12 | .31 |
Net realized and unrealized
gain (loss) on investments | | (.26) | (4.00) | 4.32 | 3.87 | 1.45 |
Total from Investment Operations | | (.09) | (3.85) | 4.42 | 3.99 | 1.76 |
Distributions: | | | | | | |
Dividends from
investment income—net | | (.17) | (.11) | (.10) | (.34) | (.03) |
Dividends from net realized
gain on investments | | (1.10) | (2.99) | (3.09) | - | (2.44) |
Total Distributions | | (1.27) | (3.10) | (3.19) | (.34) | (2.47) |
Net asset value, end of period | | 24.59 | 25.95 | 32.90 | 31.67 | 28.02 |
Total Return (%) | | (.80) | (10.88) | 14.24 | 14.28 | 6.54 |
Ratios/Supplemental Data (%): | | | | | | |
Ratio of total expenses
to average net assets | | 1.10 | 1.01 | 1.06 | 1.03 | 1.09 |
Ratio of net expenses
to average net assets | | .96 | 1.00 | 1.00 | .99 | 1.00 |
Ratio of net investment income
to average net assets | | .70 | .55 | .31 | .39 | 1.15 |
Portfolio Turnover Rate | | 85.49 | 78.15 | 66.61 | 63.25 | 71.27 |
Net Assets, end of period ($ x 1,000) | | 29,205 | 48,674 | 80,835 | 64,572 | 62,094 |
a Based on average shares outstanding.
See notes to financial statements.
26
| | | | | | | | | |
| | | | |
| | | |
Class Y Shares | | Year Ended August 31, |
| | 2020 | 2019 | 2018 | 2017 | 2016 |
Per Share Data ($): | | | | | | |
Net asset value, beginning of period | | 25.89 | 32.86 | 31.62 | 28.02 | 28.75 |
Investment Operations: | | | | | | |
Investment income—neta | | .17 | .19 | .15 | .16 | .33 |
Net realized and unrealized
gain (loss) on investments | | (.27) | (4.02) | 4.32 | 3.86 | 1.48 |
Total from Investment Operations | | (.10) | (3.83) | 4.47 | 4.02 | 1.81 |
Distributions: | | | | | | |
Dividends from
investment income—net | | (.25) | (.15) | (.14) | (.42) | (.10) |
Dividends from net realized
gain on investments | | (1.10) | (2.99) | (3.09) | - | (2.44) |
Total Distributions | | (1.35) | (3.14) | (3.23) | (.42) | (2.54) |
Net asset value, end of period | | 24.44 | 25.89 | 32.86 | 31.62 | 28.02 |
Total Return (%) | | (.77) | (10.82) | 14.43 | 14.39 | 6.71 |
Ratios/Supplemental Data (%): | | | | | | |
Ratio of total expenses
to average net assets | | .96 | .90 | .86 | .86 | .87 |
Ratio of net expenses
to average net assets | | .96 | .90 | .86 | .86 | .87 |
Ratio of net investment income
to average net assets | | .70 | .66 | .47 | .52 | 1.24 |
Portfolio Turnover Rate | | 85.49 | 78.15 | 66.61 | 63.25 | 71.27 |
Net Assets, end of period ($ x 1,000) | | 811 | 2,986 | 4,851 | 15,265 | 14,073 |
a Based on average shares outstanding.
See notes to financial statements.
27
NOTES TO FINANCIAL STATEMENTS
NOTE 1—Significant Accounting Policies:
BNY Mellon Structured Midcap Fund (the “fund”) is a separate diversified series of BNY Mellon Advantage Funds, Inc. (the “Company”), which is registered under the Investment Company Act of 1940, as amended (the “Act”), as an open-end management investment company and operates as a series company currently offering nine series, including the fund. The fund’s investment objective is to seek long-term capital growth. BNY Mellon Investment Adviser, Inc. (the “Adviser”), a wholly-owned subsidiary of The Bank of New York Mellon Corporation (“BNY Mellon”), serves as the fund’s investment adviser. Mellon Investments Corporation (the “Sub-Adviser”), a wholly-owned subsidiary of BNY Mellon and an affiliate of the Adviser, serves as the fund’s sub-investment adviser.
The Company’s Board of Directors (the “Board”) approved, effective December 31, 2019 (the “Effective Date”), the termination of the fund’s authorized Class T shares. Prior to the Effective Date, the fund did not offer such Class T shares for purchase. The authorized Class T shares were reallocated to authorized Class I shares and Class Y shares, increasing authorized Class I shares from 200 million to 250 million and increasing authorized Class Y shares from 100 million to 150 million.
BNY Mellon Securities Corporation (the “Distributor”), a wholly-owned subsidiary of the Adviser, is the distributor of the fund’s shares. The fund is authorized to issue 700 million shares of $.001 par value Common Stock. The fund currently has authorized four classes of shares: Class A (200 million shares authorized), Class C (100 million shares authorized), Class I (250 million shares authorized), and Class Y (150 million shares authorized). Class A shares generally are subject to a sales charge imposed at the time of purchase. Class C shares are subject to a contingent deferred sales charge (“CDSC”) imposed on Class C shares redeemed within one year of purchase. Class C shares automatically convert to Class A shares ten years after the date of purchase, without the imposition of a sales charge. Class I and Class Y shares are sold at net asset value per share generally to institutional investors. Other differences between the classes include the services offered to and the expenses borne by each class, the allocation of certain transfer agency costs, and certain voting rights. Income, expenses (other than expenses attributable to a specific class), and realized and unrealized gains or losses on investments are allocated to each class of shares based on its relative net assets.
The Company accounts separately for the assets, liabilities and operations of each series. Expenses directly attributable to each series are charged to
28
that series’ operations; expenses which are applicable to all series are allocated among them on a pro rata basis.
The Financial Accounting Standards Board (“FASB”) Accounting Standards Codification (“ASC”) is the exclusive reference of authoritative U.S. generally accepted accounting principles (“GAAP”) recognized by the FASB to be applied by nongovernmental entities. Rules and interpretive releases of the Securities and Exchange Commission (“SEC”) under authority of federal laws are also sources of authoritative GAAP for SEC registrants. The fund is an investment company and applies the accounting and reporting guidance of the FASB ASC Topic 946 Financial Services-Investment Companies. The fund’s financial statements are prepared in accordance with GAAP, which may require the use of management estimates and assumptions. Actual results could differ from those estimates.
The Company enters into contracts that contain a variety of indemnifications. The fund’s maximum exposure under these arrangements is unknown. The fund does not anticipate recognizing any loss related to these arrangements.
(a) Portfolio valuation: The fair value of a financial instrument is the amount that would be received to sell an asset or paid to transfer a liability in an orderly transaction between market participants at the measurement date (i.e., the exit price). GAAP establishes a fair value hierarchy that prioritizes the inputs of valuation techniques used to measure fair value. This hierarchy gives the highest priority to unadjusted quoted prices in active markets for identical assets or liabilities (Level 1 measurements) and the lowest priority to unobservable inputs (Level 3 measurements).
Additionally, GAAP provides guidance on determining whether the volume and activity in a market has decreased significantly and whether such a decrease in activity results in transactions that are not orderly. GAAP requires enhanced disclosures around valuation inputs and techniques used during annual and interim periods.
Various inputs are used in determining the value of the fund’s investments relating to fair value measurements. These inputs are summarized in the three broad levels listed below:
Level 1—unadjusted quoted prices in active markets for identical investments.
Level 2—other significant observable inputs (including quoted prices for similar investments, interest rates, prepayment speeds, credit risk, etc.).
Level 3—significant unobservable inputs (including the fund’s own assumptions in determining the fair value of investments).
29
NOTES TO FINANCIAL STATEMENTS (continued)
The inputs or methodology used for valuing securities are not necessarily an indication of the risk associated with investing in those securities.
Changes in valuation techniques may result in transfers in or out of an assigned level within the disclosure hierarchy. Valuation techniques used to value the fund’s investments are as follows:
Investments in equity securities are valued at the last sales price on the securities exchange or national securities market on which such securities are primarily traded. Securities listed on the National Market System for which market quotations are available are valued at the official closing price or, if there is no official closing price that day, at the last sales price. For open short positions, asked prices are used for valuation purposes. Bid price is used when no asked price is available. Registered investment companies that are not traded on an exchange are valued at their net asset value. All of the preceding securities are generally categorized within Level 1 of the fair value hierarchy.
Securities not listed on an exchange or the national securities market, or securities for which there were no transactions, are valued at the average of the most recent bid and asked prices. These securities are generally categorized within Level 2 of the fair value hierarchy.
Fair valuing of securities may be determined with the assistance of a pricing service using calculations based on indices of domestic securities and other appropriate indicators, such as prices of relevant American Depository Receipts and futures. Utilizing these techniques may result in transfers between Level 1 and Level 2 of the fair value hierarchy.
When market quotations or official closing prices are not readily available, or are determined not to accurately reflect fair value, such as when the value of a security has been significantly affected by events after the close of the exchange or market on which the security is principally traded (for example, a foreign exchange or market), but before the fund calculates its net asset value, the fund may value these investments at fair value as determined in accordance with the procedures approved by the Board. Certain factors may be considered when fair valuing investments such as: fundamental analytical data, the nature and duration of restrictions on disposition, an evaluation of the forces that influence the market in which the securities are purchased and sold, and public trading in similar securities of the issuer or comparable issuers. These securities are either categorized within Level 2 or 3 of the fair value hierarchy depending on the relevant inputs used.
30
For securities where observable inputs are limited, assumptions about market activity and risk are used and such securities are generally categorized within Level 3 of the fair value hierarchy.
The following is a summary of the inputs used as of August 31, 2020 in valuing the fund’s investments:
| | | | | |
| | Level 1 - Unadjusted Quoted Prices | Level 2 - Other Significant Observable Inputs | Level 3 -Significant Unobservable Inputs | Total |
Assets ($) | | | | |
Investments in Securities:† | | | |
Equity Securities -
Common Stocks | 95,994,228 | - | - | 95,994,228 |
Investment Companies | 1,550,403 | - | - | 1,550,403 |
† See Statement of Investments for additional detailed categorizations, if any.
(b) Foreign Taxes: The fund may be subject to foreign taxes (a portion of which may be reclaimable) on income, stock dividends, realized and unrealized capital gains on investments or certain foreign currency transactions. Foreign taxes are recorded in accordance with the fund’s understanding of the applicable foreign tax regulations and rates that exist in the foreign jurisdictions in which the fund invests. These foreign taxes, if any, are paid by the fund and are reflected in the Statement of Operations. Foreign taxes payable or deferred as of August 31, 2020, if any, are disclosed in the fund’s Statement of Assets and Liabilities.
(c) Securities transactions and investment income: Securities transactions are recorded on a trade date basis. Realized gains and losses from securities transactions are recorded on the identified cost basis. Dividend income is recognized on the ex-dividend date and interest income, including, where applicable, accretion of discount and amortization of premium on investments, is recognized on the accrual basis.
Pursuant to a securities lending agreement with The Bank of New York Mellon, a subsidiary of BNY Mellon and an affiliate of the Adviser, the fund may lend securities to qualified institutions. It is the fund’s policy that, at origination, all loans are secured by collateral of at least 102% of the value of U.S. securities loaned and 105% of the value of foreign securities loaned. Collateral equivalent to at least 100% of the market value of securities on loan is maintained at all times. Collateral is either in the form of cash, which can be invested in certain money market mutual funds managed by the Adviser, or U.S. Government and Agency securities. The fund is entitled to receive all dividends, interest and distributions on
31
NOTES TO FINANCIAL STATEMENTS (continued)
securities loaned, in addition to income earned as a result of the lending transaction. Should a borrower fail to return the securities in a timely manner, The Bank of New York Mellon is required to replace the securities for the benefit of the fund or credit the fund with the market value of the unreturned securities and is subrogated to the fund’s rights against the borrower and the collateral. Additionally, the contractual maturity of security lending transactions are on an overnight and continuous basis. During the period ended August 31, 2020, The Bank of New York Mellon earned $4,672 from the lending of the fund’s portfolio securities, pursuant to the securities lending agreement.
(d) Affiliated issuers: Investments in other investment companies advised by the Adviser are considered “affiliated” under the Act.
(e) Risk: Certain events particular to the industries in which the fund’s investments conduct their operations, as well as general economic, political and public health conditions, may have a significant negative impact on the investee’s operations and profitability. In addition, turbulence in financial markets and reduced liquidity in equity, credit and/or fixed income markets may negatively affect many issuers, which could adversely affect the fund. Global economies and financial markets are becoming increasingly interconnected, and conditions and events in one country, region or financial market may adversely impact issuers in a different country, region or financial market. These risks may be magnified if certain events or developments adversely interrupt the global supply chain; in these and other circumstances, such risks might affect companies worldwide. Recent examples include pandemic risks related to COVID-19 and aggressive measures taken world-wide in response by governments, including closing borders, restricting international and domestic travel, and the imposition of prolonged quarantines of large populations, and by businesses, including changes to operations and reducing staff. To the extent the fund may overweight its investments in certain countries, companies, industries or market sectors, such positions will increase the fund’s exposure to risk of loss from adverse developments affecting those countries, companies, industries or sectors.
(f) Dividends and distributions to shareholders: Dividends and distributions are recorded on the ex-dividend date. Dividends from investment income-net and dividends from net realized capital gains, if any, are normally declared and paid annually, but the fund may make distributions on a more frequent basis to comply with the distribution requirements of the Internal Revenue Code of 1986, as amended (the “Code”). To the extent that net realized capital gains can be offset by capital loss carryovers, it is the policy of the fund not to distribute such
32
gains. Income and capital gain distributions are determined in accordance with income tax regulations, which may differ from GAAP.
(g) Federal income taxes: It is the policy of the fund to continue to qualify as a regulated investment company, if such qualification is in the best interests of its shareholders, by complying with the applicable provisions of the Code, and to make distributions of taxable income and net realized capital gain sufficient to relieve it from substantially all federal income and excise taxes.
As of and during the period ended August 31, 2020, the fund did not have any liabilities for any uncertain tax positions. The fund recognizes interest and penalties, if any, related to uncertain tax positions as income tax expense in the Statement of Operations. During the period ended August 31, 2020, the fund did not incur any interest or penalties.
Each tax year in the four-year period ended August 31, 2020 remains subject to examination by the Internal Revenue Service and state taxing authorities.
At August 31, 2020, the components of accumulated earnings on a tax basis were as follows: undistributed ordinary income $485,580, and unrealized appreciation $6,008,991. In addition, the fund had $1,669,007 of capital losses realized after October 31, 2019, which were deferred for tax purposes to the first day of the following year.
The tax character of distributions paid to shareholders during the fiscal periods ended August 31, 2020 and August 31, 2019 were as follows: ordinary income $595,743 and $921,333, and long-term capital gains $5,166,205 and $16,720,184, respectively.
NOTE 2—Bank Lines of Credit:
The fund participates with other long-term open-end funds managed by the Adviser in a $927 million unsecured credit facility led by Citibank, N.A. (the “Citibank Credit Facility”) and a $300 million unsecured credit facility provided by The Bank of New York Mellon (the “BNYM Credit Facility”), each to be utilized primarily for temporary or emergency purposes, including the financing of redemptions (each, a “Facility”). The Citibank Credit Facility is available in two tranches: (i) Tranche A is in an amount equal to $747 million and is available to all long-term open-ended funds, including the fund, and (ii) Tranche B is an amount equal to $180 million and is available only to BNY Mellon Floating Rate Income Fund, a series of BNY Mellon Investment Funds IV, Inc. Prior to March 11, 2020, the Citibank Credit Facility was $1.030 billion with Tranche A available in an amount equal to $830 million and Tranche B available in an amount equal
33
NOTES TO FINANCIAL STATEMENTS (continued)
to $200 million. In connection therewith, the fund has agreed to pay its pro rata portion of commitment fees for Tranche A of the Citibank Credit Facility and the BNYM Credit Facility. Interest is charged to the fund based on rates determined pursuant to the terms of the respective Facility at the time of borrowing.
The average amount of borrowings outstanding under the Facilities during the period ended August 31, 2020 was approximately $33,334 with a related weighted average annualized interest rate of 2.35%.
NOTE 3—Management Fee, Sub-Investment Advisory Fee and Other Transactions with Affiliates:
(a) Pursuant to a management agreement with the Adviser, the management fee is computed at the annual rate of .75% of the value of the fund’s average daily net assets and is payable monthly. The Adviser has contractually agreed, from September 1, 2019 through February 29, 2020, to waive receipt of its fees and/or assume the direct expenses of the fund, so that the direct expenses of none of the classes (excluding Rule 12b-1 Distribution Plan fees, Shareholder Services Plan fees, taxes, interest expense, brokerage commissions, commitment fees on borrowings and extraordinary expenses) exceed 1.00% of the fund’s average daily net assets. Effective March 1, 2020, the fund’s investment adviser, the Adviser, has contractually agreed, from March 1, 2020 through December 31, 2020, to waive receipt of its fees and/or assume the direct expenses of the fund so that direct expenses of none of the classes (excluding Rule 12b-1 Distribution Plan fees, Shareholder Services Plan fees, taxes, interest expense, brokerage commissions, commitment fees on borrowings and extraordinary expenses) exceed .90% of the fund’s average daily net assets. On or after December 31, 2020, the Adviser may terminate this expense limitation agreement at any time. The reduction in expenses, pursuant to the undertaking, amounted to $290,892 during the period ended August 31, 2020.
Pursuant to a sub-investment advisory agreement between the Adviser and the Sub-Adviser, the sub-investment advisory fee is payable monthly by the Adviser, and is based upon the value of the fund’s average daily net assets, computed at the following annual rates:
Average Net Assets
0 up to $100 million .25%
$100 million up to $1 billion .20%
$1 billion up to $1.5 billion .16%
In excess of $1.5 billion .10%
34
During the period ended August 31, 2020, the Distributor retained $292 from commissions earned on sales of the fund’s Class A shares and $964 from CDSC fees on redemptions of the fund’s Class C shares.
(b) Under the Distribution Plan adopted pursuant to Rule 12b-1 under the Act, Class C shares pay the Distributor for distributing its shares at an annual rate of .75% of the value of its average daily net assets. During the period ended August 31, 2020, Class C shares were charged $35,985 pursuant to the Distribution Plan.
(c) Under the Shareholder Services Plan, Class A and Class C shares pay the Distributor at an annual rate of .25% of the value of their average daily net assets for the provision of certain services. The services provided may include personal services relating to shareholder accounts, such as answering shareholder inquiries regarding the fund and providing reports and other information, and services related to the maintenance of shareholder accounts. The Distributor may make payments to Service Agents (securities dealers, financial institutions or other industry professionals) with respect to these services. The Distributor determines the amounts to be paid to Service Agents. During the period ended August 31, 2020, Class A and Class C shares were charged $170,906 and $11,995, respectively, pursuant to the Shareholder Services Plan.
The fund has an arrangement with the transfer agent whereby the fund may receive earnings credits when positive cash balances are maintained, which are used to offset transfer agency fees. For financial reporting purposes, the fund includes net earnings credits, if any, as an expense offset in the Statement of Operations.
The fund has an arrangement with the custodian whereby the fund will receive interest income or be charged an overdraft fees when cash balances are maintained. For financial reporting purposes, the fund includes this interest income and overdraft fees, if any, as interest income in the Statement of Operations.
The fund compensates BNY Mellon Transfer, Inc., a wholly-owned subsidiary of the Adviser, under a transfer agency agreement for providing transfer agency and cash management services for the fund. The majority of transfer agency fees are comprised of amounts paid on a per account basis, while cash management fees are related to fund subscriptions and redemptions. During the period ended August 31, 2020, the fund was charged $28,422 for transfer agency services. These fees are included in Shareholder servicing costs in the Statement of Operations.
The fund compensates The Bank of New York Mellon under a custody agreement for providing custodial services for the fund. These fees are
35
NOTES TO FINANCIAL STATEMENTS (continued)
determined based on net assets, geographic region and transaction activity. During the period ended August 31, 2020, the fund was charged $8,512 pursuant to the custody agreement.
During the period ended August 31, 2020, the fund was charged $13,975 for services performed by the Chief Compliance Officer and his staff. These fees are included in Chief Compliance Officer fees in the Statement of Operations.
The components of “Due to BNY Mellon Investment Adviser, Inc. and affiliates” in the Statement of Assets and Liabilities consist of: management fees of $61,744, Distribution Plan fees of $2,154, Shareholder Services Plan fees of $14,160, custodian fees of $3,584, Chief Compliance Officer fees of $2,273 and transfer agency fees of $5,624, which are offset against an expense reimbursement currently in effect in the amount of $29,565.
(d) Each Board member also serves as a Board member of other funds in the BNY Mellon Family of Funds complex. Annual retainer fees and attendance fees are allocated to each fund based on net assets.
NOTE 4—Securities Transactions:
The aggregate amount of purchases and sales of investment securities, excluding short-term securities, during the period ended August 31, 2020, amounted to $94,375,195 and $131,352,647, respectively.
At August 31, 2020, the cost of investments for federal income tax purposes was $91,535,640; accordingly, accumulated net unrealized appreciation on investments was $6,008,991, consisting of $13,348,911 gross unrealized appreciation and $7,339,920 gross unrealized depreciation.
36
REPORT OF INDEPENDENT REGISTERED PUBLIC ACCOUNTING FIRM
To the Shareholders and the Board of Directors of BNY Mellon Structured Midcap Fund
Opinion on the Financial Statements
We have audited the accompanying statement of assets and liabilities of BNY Mellon Structured Midcap Fund (the “Fund”) (one of the funds constituting BNY Mellon Advantage Funds, Inc.), including the statements of investments and investments in affiliated issuers, as of August 31, 2020, and the related statement of operations for the year then ended, the statements of changes in net assets for each of the two years in the period then ended, the financial highlights for each of the five years in the period then ended and the related notes (collectively referred to as the “financial statements”). In our opinion, the financial statements present fairly, in all material respects, the financial position of the Fund (one of the funds constituting BNY Mellon Advantage Funds, Inc.) at August 31, 2020, the results of its operations for the year then ended, the changes in its net assets for each of the two years in the period then ended and its financial highlights for each of the five years in the period then ended, in conformity with U.S. generally accepted accounting principles.
Basis for Opinion
These financial statements are the responsibility of the Fund’s management. Our responsibility is to express an opinion on the Fund’s financial statements based on our audits. We are a public accounting firm registered with the Public Company Accounting Oversight Board (United States) (“PCAOB”) and are required to be independent with respect to the Fund in accordance with the U.S. federal securities laws and the applicable rules and regulations of the Securities and Exchange Commission and the PCAOB.
We conducted our audits in accordance with the standards of the PCAOB. Those standards require that we plan and perform the audit to obtain reasonable assurance about whether the financial statements are free of material misstatement, whether due to error or fraud. The Fund is not required to have, nor were we engaged to perform, an audit of the Fund’s internal control over financial reporting. As part of our audits, we are required to obtain an understanding of internal control over financial reporting, but not for the purpose of expressing an opinion on the effectiveness of the Fund’s internal control over financial reporting. Accordingly, we express no such opinion.
Our audits included performing procedures to assess the risks of material misstatement of the financial statements, whether due to error or fraud, and performing procedures that respond to those risks. Such procedures included examining, on a test basis, evidence regarding the amounts and disclosures in the financial statements. Our procedures included confirmation of securities owned as of August 31, 2020, by correspondence with the custodian and others or by other appropriate auditing procedures where replies from others were not received. Our audits also included evaluating the accounting principles used and significant estimates made by management, as well as evaluating the overall presentation of the financial statements. We believe that our audits provide a reasonable basis for our opinion.

We have served as the auditor of one or more investment companies in the BNY Mellon Family of Funds since at least 1957, but we are unable to determine the specific year.
New York, New York
October 27, 2020
37
IMPORTANT TAX INFORMATION (Unaudited)
For federal tax purposes, the fund hereby reports 100% of the ordinary dividends paid during the fiscal year ended August 31, 2020 as qualifying for the corporate dividends received deduction. Also certain dividends paid by the fund may be subject to a maximum tax rate of 15%, as provided for by the Jobs and Growth Tax Relief Reconciliation Act of 2003. Of the distributions paid during the fiscal year, $595,743 represents the maximum amount that may be considered qualified dividend income. The fund also hereby reports $1.0961 per share as a long-term capital gain distribution paid on December 19, 2019. Shareholders will receive notification in early 2021 of the percentage applicable to the preparation of their 2020 income tax returns.
38
INFORMATION ABOUT THE RENEWAL OF THE FUND’S MANAGEMENT AND SUB–INVESTMENT ADVISORY AGREEMENTS (Unaudited)
At a meeting of the fund’s Board of Directors held on July 28, 2020, the Board considered the renewal of the fund’s Management Agreement, pursuant to which the Adviser provides the fund with investment advisory and administrative services (the “Agreement”), and the Sub-Investment Advisory Agreement (together, the “Agreements”), pursuant to which Mellon Investments Corporation (the “Subadviser”) provides day-to-day management of the fund’s investments. The Board members, none of whom are “interested persons” (as defined in the Investment Company Act of 1940, as amended) of the fund, were assisted in their review by independent legal counsel and met with counsel in executive session separate from representatives of the Adviser and the Subadviser. In considering the renewal of the Agreements, the Board considered several factors that it believed to be relevant, including those discussed below. The Board did not identify any one factor as dispositive, and each Board member may have attributed different weights to the factors considered.
Analysis of Nature, Extent, and Quality of Services Provided to the Fund. The Board considered information provided to it at the meeting and in previous presentations from representatives of the Adviser regarding the nature, extent, and quality of the services provided to funds in the BNY Mellon fund complex, including the fund. The Adviser provided the number of open accounts in the fund, the fund’s asset size and the allocation of fund assets among distribution channels. The Adviser also had previously provided information regarding the diverse intermediary relationships and distribution channels of funds in the BNY Mellon fund complex (such as retail direct or intermediary, in which intermediaries typically are paid by the fund and/or the Adviser) and the Adviser’s corresponding need for broad, deep, and diverse resources to be able to provide ongoing shareholder services to each intermediary or distribution channel, as applicable to the fund.
The Board also considered research support available to, and portfolio management capabilities of, the fund’s portfolio management personnel and that the Adviser also provides oversight of day-to-day fund operations, including fund accounting and administration and assistance in meeting legal and regulatory requirements. The Board also considered the Adviser’s extensive administrative, accounting and compliance infrastructures, as well as the Adviser’s supervisory activities over the Subadviser. The Board also considered portfolio management’s brokerage policies and practices (including policies and practices regarding soft dollars) and the standards applied in seeking best execution.
Comparative Analysis of the Fund’s Performance and Management Fee and Expense Ratio. The Board reviewed reports prepared by Broadridge Financial Solutions, Inc. (“Broadridge”), an independent provider of investment company data based on classifications provided by Thomson Reuters Lipper, which included information comparing (1) the performance of the fund’s Class I shares with the performance of a group of institutional mid-cap core funds selected by Broadridge as comparable to the fund (the “Performance Group”) and with a broader group of funds consisting of all retail and institutional mid-cap core funds (the “Performance Universe”), all for various
39
INFORMATION ABOUT THE RENEWAL OF THE FUND’S MANAGEMENT AND SUB–INVESTMENT ADVISORY AGREEMENTS (Unaudited) (continued)
periods ended June 30, 2020, and (2) the fund’s actual and contractual management fees and total expenses with those of the same group of funds in the Performance Group (the “Expense Group”) and with a broader group of all institutional mid-cap core funds, excluding outliers (the “Expense Universe”), the information for which was derived in part from fund financial statements available to Broadridge as of the date of its analysis. The Adviser previously had furnished the Board with a description of the methodology Broadridge used to select the Performance Group and Performance Universe and the Expense Group and Expense Universe.
Performance Comparisons. Representatives of the Adviser stated that the usefulness of performance comparisons may be affected by a number of factors, including different investment limitations and policies that may be applicable to the fund and comparison funds and the end date selected. They also considered that performance generally should be considered over longer periods of time, although it is possible that long-term performance can be adversely affected by even one period of significant underperformance so that a single investment decision or theme has the ability to affect disproportionately long-term performance. The Board discussed with representatives of the Adviser and the Subadviser the results of the comparisons and considered that the fund’s total return performance was below the Performance Group and Performance Universe medians for all periods, except the six-month and ten-year periods when it was above the Performance Group and Performance Universe medians, respectively. The Board considered the relative proximity of the fund’s performance to the Performance Group and/or Performance Universe medians (e.g., ranking in the third quartile) in certain periods when performance was below median. The Adviser also provided a comparison of the fund’s calendar year total returns to the returns of the fund’s benchmark index, and it was noted that the fund’s returns were above the returns of the index in six of the ten calendar years shown.
Management Fee and Expense Ratio Comparisons. The Board reviewed and considered the contractual management fee rate payable by the fund to the Adviser in light of the nature, extent and quality of the management and sub-advisory services provided by the Adviser and the Subadviser, respectively. In addition, the Board reviewed and considered the actual management fee rate paid by the fund over the fund’s last fiscal year. The Board also reviewed the range of actual and contractual management fees and total expenses as a percentage of average net assets of the Expense Group and Expense Universe funds and discussed the results of the comparisons. The Board considered that the fund’s contractual management fee was lower than the Expense Group median contractual management fee, the fund’s actual management fee was lower than the Expense Group and Expense Universe actual management fee medians and the fund’s total expenses were higher than the Expense Group and Expense Universe total expenses medians.
Representatives of the Adviser stated that the Adviser has contractually agreed, until December 31, 2020, to waive receipt of its fees and/or assume the direct expenses of the fund so that the direct expenses of none of its classes (excluding Rule 12b-1 fees, shareholder services fees, taxes, interest, brokerage commissions, commitment fees on
40
borrowings and extraordinary expenses) exceed .90% of the fund’s average daily net assets.
Representatives of the Adviser reviewed with the Board the management or investment advisory fees paid by a fund advised or administered by the Adviser that are in the same Lipper category as the fund (the “Similar Fund”), and explained the nature of the Similar Fund. They discussed differences in fees paid and the relationship of the fees paid in light of any differences in the services provided and other relevant factors. The Board considered the relevance of the fee information provided for the Similar Fund to evaluate the appropriateness of the fund’s management fee. Representatives of the Adviser noted that there were no separate accounts and/or other types of client portfolios advised by the Adviser or the Subadviser or its affiliates that are considered to have similar investment strategies and policies as the fund.
The Board considered the fee to the Subadviser in relation to the fee paid to the Adviser by the fund and the respective services provided by the Subadviser and the Adviser. The Board also took into consideration that the Subadviser’s fee is paid by the Adviser (out of its fee from the fund) and not the fund.
Analysis of Profitability and Economies of Scale. Representatives of the Adviser reviewed the expenses allocated and profit received by the Adviser and its affiliates and the resulting profitability percentage for managing the fund and the aggregate profitability percentage to the Adviser and its affiliates for managing the funds in the BNY Mellon fund complex, and the method used to determine the expenses and profit. The Board concluded that the profitability results were not excessive, given the services rendered and service levels provided by the Adviser and its affiliates. The Board also considered the expense limitation arrangement and its effect on the profitability of the Adviser and its affiliates. The Board also had been provided with information prepared by an independent consulting firm regarding the Adviser’s approach to allocating costs to, and determining the profitability of, individual funds and the entire BNY Mellon fund complex. The consulting firm also had analyzed where any economies of scale might emerge in connection with the management of a fund.
The Board considered, on the advice of its counsel, the profitability analysis (1) as part of its evaluation of whether the fees under the Agreements, considered in relation to the mix of services provided by the Adviser and the Subadviser, including the nature, extent and quality of such services, supported the renewal of the Agreements and (2) in light of the relevant circumstances for the fund and the extent to which economies of scale would be realized if the fund grows and whether fee levels reflect these economies of scale for the benefit of fund shareholders. Since the Adviser, and not the fund, pays the Subadviser pursuant to the Sub-Investment Advisory Agreement, the Board did not consider the Subadviser’s profitability to be relevant to its deliberations. Representatives of the Adviser stated that a discussion of economies of scale is predicated on a fund having achieved a substantial size with increasing assets and that, if a fund’s assets had been stable or decreasing, the possibility that the Adviser may have realized any economies of scale would be less. Representatives of the Adviser also stated that, as a result of shared and allocated costs among funds in the BNY Mellon fund complex, the
41
INFORMATION ABOUT THE RENEWAL OF THE FUND’S MANAGEMENT AND SUB–INVESTMENT ADVISORY AGREEMENTS (Unaudited) (continued)
extent of economies of scale could depend substantially on the level of assets in the complex as a whole, so that increases and decreases in complex-wide assets can affect potential economies of scale in a manner that is disproportionate to, or even in the opposite direction from, changes in the fund’s asset level. The Board also considered potential benefits to the Adviser and the Subadviser from acting as investment adviser and sub-investment adviser, respectively, and took into consideration the soft dollar arrangements in effect for trading the fund’s investments.
At the conclusion of these discussions, the Board agreed that it had been furnished with sufficient information to make an informed business decision with respect to the renewal of the Agreements. Based on the discussions and considerations as described above, the Board concluded and determined as follows.
· The Board concluded that the nature, extent and quality of the services provided by the Adviser and the Subadviser are adequate and appropriate.
· The Board considered the Adviser’s efforts to improve fund performance, as discussed in connection with the prior consideration of the Agreement, and noted the improvement in the six-month performance relative to the Performance Group.
· The Board concluded that the fees paid to the Adviser and the Subadviser continued to be appropriate under the circumstances and in light of the factors and the totality of the services provided as discussed above, subject to review no later than the next renewal consideration.
· The Board determined that the economies of scale which may accrue to the Adviser and its affiliates in connection with the management of the fund had been adequately considered by the Adviser in connection with the fee rate charged to the fund pursuant to the Agreement and that, to the extent in the future it were determined that material economies of scale had not been shared with the fund, the Board would seek to have those economies of scale shared with the fund.
In evaluating the Agreements, the Board considered these conclusions and determinations and also relied on its previous knowledge, gained through meetings and other interactions with the Adviser and its affiliates and the Subadviser, of the Adviser and the Subadviser and the services provided to the fund by the Adviser and the Subadviser. The Board also relied on information received on a routine and regular basis throughout the year relating to the operations of the fund and the investment management and other services provided under the Agreements, including information on the investment performance of the fund in comparison to similar mutual funds and benchmark performance indices; general market outlook as applicable to the fund; and compliance reports. In addition, the Board’s consideration of the contractual fee arrangements for the fund had the benefit of a number of years of reviews of the Agreements for the fund, or substantially similar agreements for other BNY Mellon funds that the Board oversees, during which lengthy discussions took place between the Board and representatives of the Adviser. Certain aspects of the arrangements may receive greater scrutiny in some years than in others, and the Board’s conclusions may
42
be based, in part, on their consideration of the fund’s arrangements, or substantially similar arrangements for other BNY Mellon funds that the Board oversees, in prior years. The Board determined to renew the Agreements for the remainder of the one-year term.
43
LIQUIDITY RISK MANAGEMENT PROGRAM (Unaudited)
Effective June 1, 2019, the fund adopted a liquidity risk management program (the “Liquidity Risk Management Program”) pursuant to the requirements of Rule 22e-4 under the Investment Company Act of 1940, as amended. Rule 22e-4 requires registered open-end funds, including mutual funds and exchange-traded funds but not money market funds, to establish liquidity risk management programs in order to effectively manage fund liquidity and shareholder redemptions. The rule is designed to mitigate the risk that a fund could not meet redemption requests without significantly diluting the interests of remaining investors.
The rule requires the funds to assess, manage and review their liquidity risk at least annually considering applicable factors such as investment strategy and liquidity during normal and foreseeable stressed conditions, including whether the strategy is appropriate for an open-end fund and whether the fund has a relatively concentrated portfolio or large positions in particular issuers. The fund must also assess its use of borrowings and derivatives, short-term and long-term cash flow projections in normal and stressed conditions, holdings of cash and cash equivalents, and borrowing arrangements and other funding sources.
The rule also requires the fund to classify its investments as highly liquid, moderately liquid, less liquid or illiquid based on the number of days the fund expects it would take to liquidate the investment, and to review these classifications at least monthly or more often under certain conditions. The periods range from three or fewer business days for a highly liquid investment to greater than seven calendar days for settlement of a less liquid investment. Illiquid investments are those a fund does not expect to be able to sell or dispose of within seven calendar days without significantly changing the market value. The fund is prohibited from acquiring an investment if, after the acquisition, its holdings of illiquid assets will exceed 15% of its net assets. In addition, if a fund permits redemptions in-kind, the rule requires the fund to establish redemption in-kind policies and procedures governing how and when it will engage in such redemptions.
Pursuant to the rule’s requirements, the Liquidity Risk Management Program has been reviewed and approved by the fund’s board. Furthermore, the board has received a written report prepared by the Program’s Administrator that addresses the operation of the Program, assesses its adequacy and effectiveness and describes any material changes made to the Program.
Assessment of Program
In the opinion of the Program Administrator, the Program approved by the fund board continues to be adequate for the fund and the Program has been implemented effectively. The Program Administrator has monitored the fund’s liquidity risk and the liquidity classification of the securities held by the fund and has determined that the Program is operating effectively.
During the period from June 1, 2019 to March 31, 2020, there were no material changes to the Program and no material liquidity events that impacted the fund. During the period, the fund held sufficient highly liquid assets to meet fund redemptions.
44
Under normal expected foreseeable fund redemption forecasts and foreseeable stressed fund redemption forecasts, the Program Administrator believes that the fund maintains sufficient highly liquid assets to meet expected fund redemptions.
45
BOARD MEMBERS INFORMATION (Unaudited)
INDEPENDENT BOARD MEMBERS
Joseph S. DiMartino (76)
Chairman of the Board (1995)
Principal Occupation During Past 5 Years:
· Director or Trustee of funds in the BNY Mellon Family of Funds and certain other entities (as described in the fund’s Statement of Additional Information) (1995-Present)
Other Public Company Board Memberships During Past 5 Years:
· CBIZ, Inc., a public company providing professional business services, products and solutions, Director (1997-Present)
No. of Portfolios for which Board Member Serves: 111
———————
Peggy C. Davis (77)
Board Member (2006)
Principal Occupation During Past 5 Years:
· Shad Professor of Law, New York University School of Law (1983-present)
No. of Portfolios for which Board Member Serves: 39
———————
Gina D. France (62)
Board Member (2019)
Principal Occupation During Past 5 Years:
· Founder, President and Chief Executive Officer, France Strategic Partners, a strategy and advisory firm serving corporate clients across the United States (2003 –Present)
· Corporate Director and Trustee (2004 – Present)
Other Public Company Board Memberships During Past 5 Years:
· Huntington Bancshares, a bank holding company headquartered in Columbus, Ohio, Director (2016 – Present)
· Cedar Fair, L.P., a publicly-traded partnership that owns and operates amusement parks and hotels in the U.S. and Canada, Director (2011 – Present)
· CBIZ, Inc., a public company providing professional business services, products and solutions, Director (2015 – Present)
· Baldwin Wallace University, Trustee (2013- 2019)
· FirstMerit Corporation, a diversified financial services company, Director (2004 – 2016)
No. of Portfolios for which Board Member Serves: 25
———————
46
Joan Gulley (72)
Board Member (2017)
Principal Occupation During Past 5 Years:
· PNC Financial Services Group, Inc.(1993-2014), Executive Vice President and Chief Human Resources Officer and Executive Committee Member (2008-2014)
· Director, Nantucket Library (2015-Present)
No. of Portfolios for which Board Member Serves: 44
———————
Robin A. Melvin (56)
Board Member (2012)
Principal Occupation During Past 5 Years:
· Co-chairman, Mentor Illinois, a non-profit organization dedicated to increasing the quantity and quality of mentoring services in Illinois; (2014-Present); Board member (2013-Present)
No. of Portfolios for which Board Member Serves: 89
———————
Once elected all Board Members serve for an indefinite term, but achieve Emeritus status upon reaching age 80. The address of the Board Members and Officers is c/o BNY Mellon Investment Adviser, Inc. 240 Greenwich Street, New York, New York 10286. Additional information about the Board Members is available in the fund’s Statement of Additional Information which can be obtained from the Adviser free of charge by calling this toll free number: 1-800-373-9387.
David P. Feldman, Emeritus Board Member
James F. Henry, Emeritus Board Member
Ehud Houminer, Emeritus Board Member
Lynn Martin, Emeritus Board Member
Dr. Martin Peretz, Emeritus Board Member
Philip L. Toia, Emeritus Board Member
47
OFFICERS OF THE FUND (Unaudited)
RENEE LAROCHE-MORRIS, President since May 2019.
President and a director of BNY Mellon Investment Adviser, Inc. since January 2018. She is an officer of 62 investment companies (comprised of 111 portfolios) managed by the Adviser. She is 49 years old and has been an employee of BNY Mellon since 2003.
JAMES WINDELS, Treasurer since November 2001.
Director-BNY Mellon Fund Administration, and an officer of 64 investment companies (comprised of 142 portfolios) managed by the Adviser or an affiliate of the Adviser. He is 61 years old and has been an employee of the Adviser since April 1985.
BENNETT A. MACDOUGALL, Chief Legal Officer since October 2015.
Chief Legal Officer of the Adviser and Associate General Counsel and Managing Director of BNY Mellon since June 2015; Director and Associate General Counsel of Deutsche Bank–Asset & Wealth Management Division from June 2005 to June 2015, and as Chief Legal Officer of Deutsche Investment Management Americas Inc. from June 2012 to May 2015. He is an officer of 64 investment companies (comprised of 142 portfolios) managed by the Adviser or an affiliate of the Adviser. He is 48 years old and has been an employee of the Adviser since June 2015.
DAVID DIPETRILLO, Vice President since May 2019.
Head of North America Product, BNY Mellon Investment Management since January 2018, Director of Product Strategy, BNY Mellon Investment Management from January 2016 to December 2017; Head of US Retail Product and Channel Marketing, BNY Mellon Investment Management from January 2014 to December 2015. He is an officer of 63 investment companies (comprised of 119 portfolios) managed by the Adviser or an affiliate of the Adviser. He is 42 years old and has been an employee of BNY Mellon since 2005.
JAMES BITETTO, Vice President since August 2005 and Secretary since February 2018.
Senior Managing Counsel of BNY Mellon since December 2019; Managing Counsel of BNY Mellon from April 2014 to December 2019; Secretary of the Adviser, and an officer of 64 investment companies (comprised of 142 portfolios) managed by the Adviser or an affiliate of the Adviser. He is 54 years old and has been an employee of the Adviser since December 1996.
SONALEE CROSS, Vice President and Assistant Secretary since March 2018.
Counsel of BNY Mellon since October 2016; Associate at Proskauer Rose LLP from April 2016 to September 2016; Attorney at EnTrust Capital from August 2015 to February 2016; Associate at Sidley Austin LLP from September 2013 to August 2015. She is an officer of 64 investment companies (comprised of 142 portfolios) managed by the Adviser or an affiliate of the Adviser. She is 32 years old and has been an employee of the Adviser since October 2016.
DEIRDRE CUNNANE, Vice President and Assistant Secretary since March 2019.
Counsel of BNY Mellon since August 2018; Senior Regulatory Specialist at BNY Mellon Investment Management Services from February 2016 to August 2018; Trustee Associate at BNY Mellon Trust Company (Ireland) Limited from August 2013 to February 2016. She is an officer of 64 investment companies (comprised of 142 portfolios) managed by the Adviser or an affiliate of the Adviser. She is 30 years old and has been an employee of the Adviser since August 2018.
SARAH S. KELLEHER, Vice President and Assistant Secretary since April 2014.
Managing Counsel of BNY Mellon since December 2017, Senior Counsel of BNY Mellon from March 2013 to December 2017. She is an officer of 64 investment companies (comprised of 142 portfolios) managed by the Adviser or an affiliate of the Adviser. She is 44 years old and has been an employee of the Adviser since March 2013.
JEFF PRUSNOFSKY, Vice President and Assistant Secretary since August 2005.
Senior Managing Counsel of BNY Mellon, and an officer of 64 investment companies (comprised of 142 portfolios) managed by the Adviser or an affiliate of the Adviser. He is 55 years old and has been an employee of the Adviser since October 1990.
AMANDA QUINN, Vice President and Assistant Secretary since March 2020.
Counsel of BNY Mellon since June 2019; Regulatory Administration Manager at BNY Mellon Investment Management Services from September 2018 to May 2019; Senior Regulatory Specialist at BNY Mellon Investment Management Services from April 2015 to August 2018. She is an officer of 64 investment companies (comprised of 142 portfolios) managed by the Adviser or an affiliate of the Adviser. She is 35 years old and has been an employee of the Adviser since June 2019.
48
PETER M. SULLIVAN, Vice President and Assistant Secretary since March 2019.
Managing Counsel of BNY Mellon since March 2009, Senior Counsel of BNY Mellon from April 2004 to March 2009, and an officer of 64 investment companies (comprised of 142 portfolios) managed by the Adviser or an affiliate of the Adviser. He is 52 years old and has been an employee of the Adviser since January 2019.
NATALYA ZELENSKY, Vice President and Assistant Secretary since March 2017.
Managing Counsel of BNY Mellon since December 2019; Counsel of BNY Mellon from May 2016 to December 2019; Attorney at Wildermuth Endowment Strategy Fund/Wildermuth Advisory, LLC from November 2015 to May 2016 and Assistant General Counsel at RCS Advisory Services from July 2014 to November 2015. She is an officer of 64 investment companies (comprised of 142 portfolios) managed by the Adviser or an affiliate of the Adviser. She is 35 years old and has been an employee of the Adviser since May 2016.
GAVIN C. REILLY, Assistant Treasurer since December 2005.
Tax Manager-BNY Mellon Fund Administration, and an officer of 64 investment companies (comprised of 142 portfolios) managed by the Adviser or an affiliate of the Adviser. He is 52 years old and has been an employee of the Adviser since April 1991.
ROBERT S. ROBOL, Assistant Treasurer since August 2005.
Senior Accounting Manager-BNY Mellon Fund Administration, and an officer of 64 investment companies (comprised of 142 portfolios) managed by the Adviser or an affiliate of the Adviser. He is 56 years old and has been an employee of the Adviser since October 1988.
ROBERT SALVIOLO, Assistant Treasurer since July 2007.
Senior Accounting Manager–BNY Mellon Fund Administration, and an officer of 64 investment companies (comprised of 142 portfolios) managed by the Adviser or an affiliate of the Adviser. He is 53 years old and has been an employee of the Adviser since June 1989.
ROBERT SVAGNA, Assistant Treasurer since December 2002.
Senior Accounting Manager–BNY Mellon Fund Administration, and an officer of 64 investment companies (comprised of 142 portfolios) managed by the Adviser or an affiliate of the Adviser. He is 53 years old and has been an employee of the Adviser since November 1990.
JOSEPH W. CONNOLLY, Chief Compliance Officer since October 2004.
Chief Compliance Officer of the Adviser, the BNY Mellon Family of Funds and BNY Mellon Funds Trust (63 investment companies, comprised of 134 portfolios). He is 63 years old and has served in various capacities with the Adviser since 1980, including manager of the firm’s Fund Accounting Department from 1997 through October 2001.
CARIDAD M. CAROSELLA, Anti-Money Laundering Compliance Officer since January 2016.
Anti-Money Laundering Compliance Officer of the BNY Mellon Family of Funds and BNY Mellon Funds Trust since January 2016; from May 2015 to December 2015, Interim Anti-Money Laundering Compliance Officer of the BNY Mellon Family of Funds and BNY Mellon Funds Trust and the Distributor; from January 2012 to May 2015, AML Surveillance Officer of the Distributor. She is an officer of 57 investment companies (comprised of 135 portfolios) managed by the Adviser or an affiliate of the Adviser. She is 52 years old and has been an employee of the Distributor since 1997.
49
BNY Mellon Structured Midcap Fund
240 Greenwich Street
New York, NY 10286
Adviser
BNY Mellon Investment Adviser, Inc.
240 Greenwich Street
New York, NY 10286
Sub-Adviser
Mellon Investments Corporation
BNY Mellon Center
One Boston Place
Boston, MA 02108-4408
Custodian
The Bank of New York Mellon
240 Greenwich Street
New York, NY 10286
Transfer Agent &
Dividend Disbursing Agent
BNY Mellon Transfer, Inc.
240 Greenwich Street
New York, NY 10286
Distributor
BNY Mellon Securities Corporation
240 Greenwich Street
New York, NY 10286
| | |
Ticker Symbols: | Class A: DPSAX Class C: DPSCX Class I: DPSRX Class Y: DPSYX |
Telephone Call your financial representative or 1-800-373-9387
Mail The BNY Mellon Family of Funds, 144 Glenn Curtiss Boulevard, Uniondale, NY 11556-0144
E-mail Send your request to info@bnymellon.com
Internet Information can be viewed online or downloaded at www.bnymellonim.com/us
The fund files its complete schedule of portfolio holdings with the Securities and Exchange Commission (“SEC”) for the first and third quarters of each fiscal year on Form N-PORT. The fund’s Forms N-PORT are available on the SEC’s website at www.sec.gov.
A description of the policies and procedures that the fund uses to determine how to vote proxies relating to portfolio securities and information regarding how the fund voted these proxies for the most recent 12-month period ended June 30 is available at www.bnymellonim.com/us and on the SEC’s website at www.sec.gov and without charge, upon request, by calling 1-800-373-9387.
| | |
© 2020 BNY Mellon Securities Corporation
0936AR0820 | 
|
BNY Mellon Technology Growth Fund
| |
ANNUAL REPORT August 31, 2020 |
| |
Save time. Save paper. View your next shareholder report online as soon as it’s available. Log into www.bnymellonim.com/us and sign up for eCommunications. It’s simple and only takes a few minutes. |
| |
The views expressed in this report reflect those of the portfolio manager(s) only through the end of the period covered and do not necessarily represent the views of BNY Mellon Investment Adviser, Inc. or any other person in the BNY Mellon Investment Adviser, Inc. organization. Any such views are subject to change at any time based upon market or other conditions and BNY Mellon Investment Adviser, Inc. disclaims any responsibility to update such views. These views may not be relied on as investment advice and, because investment decisions for a fund in the BNY Mellon Family of Funds are based on numerous factors, may not be relied on as an indication of trading intent on behalf of any fund in the BNY Mellon Family of Funds. |
| |
Not FDIC-Insured • Not Bank-Guaranteed • May Lose Value |
Contents
THE FUND
FOR MORE INFORMATION
Back Cover
| | | | |
| |
BNY Mellon Technology Growth Fund
| | The Fund |
A LETTER FROM THE PRESIDENT OF BNY MELLON INVESTMENT ADVISER, INC.
Dear Shareholder:
We are pleased to present this annual report for BNY Mellon Technology Growth Fund, covering the 12-month period from September 1, 2019 through August 31, 2020. For information about how the fund performed during the reporting period, as well as general market perspectives, we provide a Discussion of Fund Performance on the pages that follow.
Early in the reporting period, positive investor sentiment fueled an equity rally. Accommodative rate policies from the U.S. Federal Reserve (the “Fed”) and progress towards a U.S./China trade deal stoked optimism about future economic growth prospects. As the calendar year turned over, this optimism turned to concern, as COVID-19 began to spread across China, adjacent areas of the Pacific Rim and parts of Europe. When the virus spread throughout the U.S. in March 2020, stocks began to show signs of volatility and posted historic losses during the month. Investor angst over the possible economic impact of a widespread quarantine worked to depress equity valuations. Global central banks and governments worked to enact emergency stimulus measures to support their respective economies and equity valuations began to rebound, trending upward for the remainder of the period.
In fixed-income markets, interest rates were heavily influenced by changes in Fed policy and investor concern over COVID-19. In 2019, as stocks rallied in response to Fed rate cuts, risk-asset valuations also rose while Treasuries lagged. When COVID-19 began to emerge, a flight to quality ensued and Treasury rates fell significantly. March 2020 brought extreme volatility and risk-asset spread widening. The Fed cut rates twice in March, resulting in an overnight lending target rate of nearly zero, and the government launched a large stimulus package; many governments and central banks around the globe followed suit. At their meeting in August 2020, the Fed confirmed their commitment to a “lower-for-longer” rate policy.
We believe the near-term outlook for the U.S. will be challenging, as the country curbs the spread of COVID-19. However, we are confident that ongoing central bank and government policy responses can continue to support economic progress. As always, we will monitor relevant data for any signs of a change. We encourage you to discuss the risks and opportunities in today’s investment environment with your financial advisor.
Thank you for your continued confidence and support.
Sincerely,

Renee LaRoche-Morris
President
BNY Mellon Investment Adviser, Inc.
September 15, 2020
2
DISCUSSION OF FUND PERFORMANCE (Unaudited)
For the period from September 1, 2019 through August 31, 2020, as provided by Erik Swords, Matthew Griffin, and Justin Sumner, Portfolio Managers.
Market and Fund Performance Overview
For the 12-month period ended August 31, 2020, BNY Mellon Technology Growth Fund’s Class A shares produced a total return of 67.36%, Class C shares returned 66.16%, Class I shares returned 67.73% and Class Y shares returned 67.91%.1 In comparison, the fund’s benchmarks, the NYSE® Technology Index and the S&P 500® Index, produced total returns of 72.67% and 21.93%, respectively, over the same period.2,3
Equities gained ground as the economy continued to show signs of recovery, and technology stocks outperformed the broader market. The fund lagged the NYSE® Technology Index due to the timing of stock selections.
The Fund’s Investment Approach
The fund seeks capital appreciation. To pursue its goal, the fund normally invests at least 80% of its net assets, plus any borrowings for investment purposes, in the stocks of growth companies of any size that BNY Mellon Investment Adviser, Inc. believes to be leading producers or beneficiaries of technological innovation. Up to 25% of the fund’s assets may be invested in foreign securities. In choosing stocks, the fund looks for technology companies with the potential for strong earnings or revenue growth rates. The fund’s investment process centers on a multidimensional approach that looks for opportunities across emerging growth, cyclical or stable growth companies.
Technology Leads Stock Rebound
The reporting period began with the market continuing to benefit from a shift in Federal Reserve (the “Fed”) policy, which had been prompted by concerns about economic growth and corporate earnings. Late in 2019, the Fed implemented three rate cuts, as trade tensions and other geopolitical concerns appeared to be weighing on economic growth. Other major central banks also enacted supportive policies. Stocks also benefited from the announcement of a “Phase One” trade deal between the U.S. and China, and from the approval of the new U.S.-Mexico-Canada Trade Agreement.
Early in 2020, developed markets experienced a correction amid growing concerns about the COVID-19 pandemic, erasing the gain that occurred late in 2019. As a result, the Fed reduced the federal funds target rate twice in March 2020, bringing the target rate down to 0.00-0.25%. In addition, the Fed and other central banks initiated various programs to ease liquidity concerns in certain markets, and government authorities introduced programs to keep small businesses afloat. Steps were also taken to provide relief to employees who had lost their jobs as a result of government-mandated business shutdowns.
In the second half of the reporting period, the economy began to show signs of recovery. Retail sales rebounded, and the outlook for manufacturing also improved dramatically. Job creation also surged, beating economists’ expectations. Unemployment dropped sharply, and markets began to rebound as relief programs took effect, government shutdowns began to ease, and hope for a COVID-19 vaccine or effective therapy take hold.
Technology stocks, in particular, performed well during the rebound. Many stocks in technology sector benefited from trends in e-commerce and accelerated working-from-home during the pandemic.
Stock Selections Drove Performance
Returns were hindered somewhat by certain stock selections. The fund’s position in Tesla was the largest detractor from performance, but this was in part due to the timing of the purchase. The fund owned the stock prior to the reporting period and benefited from the stock’s gain. But the stock
3
DISCUSSION OF FUND PERFORMANCE (Unaudited) (continued)
bottomed around the start of the reporting period, rebounding strongly over the subsequent months. As a result, while the stock rose approximately 1,000% from the bottom, it rose only about 500% from the price at which the fund had earlier purchased it. Thus, while the holding contributed positively to performance on an absolute basis, it detracted from performance on a relative basis. In addition, Proofpoint, an email security firm, contributed negatively to fund results because it reduced its revenue guidance more than expected. Finally, although the long-term outlook for Twitter remains positive, it hindered performance during the reporting period because of difficulty monetizing its growing user base.
On a more positive note, the fund’s performance was helped by a variety of positions in companies that continued to benefit from long-term technological trends. Positions in chipmakers Advanced Micro Devices and NVIDIA were particularly beneficial. In e-commerce infrastructure, positions in Shopify, Square and Twilio were also advantageous. Shares of JD.com, a Chinese e-commerce company, also contributed positively, rising 100% during the reporting period.
COVID-19 Accelerates the Adoption of Technology
While long-term technological trends have been driving the performance of technology companies, COVID-19 has accelerated these trends. Younger consumers had been taking to these technologies readily, but with COVID-19, even older consumers have been pushed into adopting them, in part because companies have been forced to enable remote working and e-commerce. In the longer term, small and medium-sized businesses will find it increasingly necessary to accelerate the digital transformation of their operations. More broadly, these technologies are infiltrating all industries worldwide, suggesting that a strong pace of growth will continue.
September 15, 2020
1 Total return includes reinvestment of dividends and any capital gains paid and does not take into consideration the maximum initial sales charge in the case of Class A shares, or the applicable contingent deferred sales charge imposed on redemptions in the case of Class C shares. Had these charges been reflected, returns would have been lower. Past performance is no guarantee of future results. Share price, yield and investment return fluctuate such that upon redemption, fund shares may be worth more or less than their original cost.
2 Source: Bloomberg L.P. — The NYSE® Technology Index is an equal-dollar-weighted index designed to objectively represent the technology sector by holding 35 of the leading U.S. technology-related companies. Investors cannot invest directly in any index.
3 Source: Lipper Inc. — The S&P 500® Index is widely regarded as the best single gauge of large-cap U.S. equities. The index includes 500 leading companies and captures approximately 80% coverage of available market capitalization. Investors cannot invest directly in any index.
Equities are subject generally to market, market sector, market liquidity, issuer and investment style risks, among other factors, to varying degrees, all of which are more fully described in the fund’s prospectus.
The technology sector has been among the most volatile sectors of the stock market. Technology companies involve greater risk because their revenue and/or earnings tend to be less predictable, and some companies may be experiencing significant losses.
Recent market risks include pandemic risks related to COVID-19. The effects of COVID-19 have contributed to increased volatility in global markets and will likely affect certain countries, companies, industries and market sectors more dramatically than others. To the extent the fund may overweight its investments in certain countries, companies, industries or market sectors, such positions will increase the fund’s exposure to risk of loss from adverse developments affecting those countries, companies, industries or sectors.
4
FUND PERFORMANCE (Unaudited)
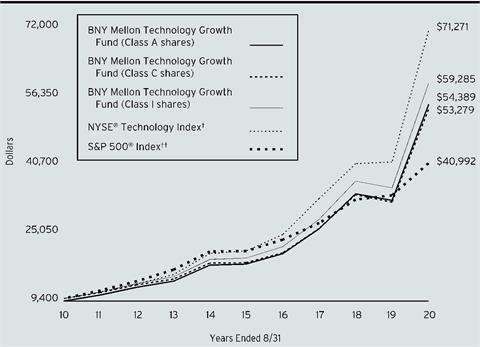
Comparison of change in value of a $10,000 investment in Class A shares, Class C shares, and Class I shares of BNY Mellon Technology Growth Fund with a hypothetical investment of $10,000 in the NYSE® Technology Index and S&P 500® Index.
† Source: Bloomberg L.P.
†† Source: Lipper Inc.
Past performance is not predictive of future performance.
The above graph compares a hypothetical $10,000 investment made in each of the Class A shares, Class C shares and Class I shares of BNY Mellon Technology Growth Fund on 8/31/10 to a hypothetical investment of $10,000 made in each of the NYSE® Technology Index and S&P 500® Index on that date. All dividends and capital gain distributions are reinvested.
The fund’s performance shown in the line graph above takes into account the maximum initial sales charge on Class A shares and all other applicable fees and expenses on Class A shares, Class C shares, and Class I shares. The NYSE® Technology Index is an equal-dollar weighted index designed to objectively represent the technology sector by holding 35 of the leading U.S. technology-related companies. The S&P 500® Index is widely regarded as the best single gauge of large-cap U.S. equities. The index includes 500 leading companies and captures approximately 80% coverage of available market capitalization. Unlike a mutual fund, the indices are not subject to charges, fees and other expenses. Investors cannot invest directly in any index. Further information relating to fund performance, including expense reimbursements, if applicable, is contained in the Financial Highlights section of the prospectus and elsewhere in this report.
5
FUND PERFORMANCE (Unaudited) (continued)
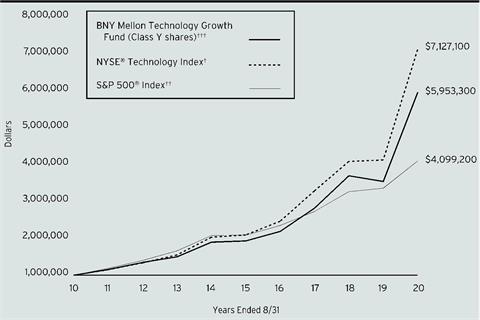
Comparison of change in value of a $1,000,000 investment in Class Y shares of BNY Mellon Technology Growth Fund with a hypothetical investment of $1,000,000 in the NYSE® Technology Index and S&P 500® Index.
† Source: Bloomberg L.P.
†† Source: Lipper Inc.
††† The total return figures presented for Class Y shares of the fund reflect the performance of the fund’s Class I shares for the period prior to 9/30/16 (the inception date for Class Y shares).
Past performance is not predictive of future performance.
The above graph compares a hypothetical $1,000,000 investment made in Class Y shares of BNY Mellon Technology Growth Fund on 8/31/10 to a hypothetical investment of $1,000,000 made in each of the NYSE® Technology Index and S&P 500® Index on that date. All dividends and capital gain distributions are reinvested.
The fund’s performance shown in the line graph above takes into account all applicable fees and expenses on Class Y shares. The NYSE® Technology Index is an equal-dollar weighted index designed to objectively represent the technology sector by holding 35 of the leading U.S. technology-related companies. The S&P 500® Index is widely regarded as the best single gauge of large-cap U.S. equities. The index includes 500 leading companies and captures approximately 80% coverage of available market capitalization. Unlike a mutual fund, the indices are not subject to charges, fees and other expenses. Investors cannot invest directly in any index. Further information relating to fund performance, including expense reimbursements, if applicable, is contained in the Financial Highlights section of the prospectus and elsewhere in this report.
6
| | | | | |
Average Annual Total Returns as of 8/31/2020 |
| | Inception Date | 1 Year | 5 Years | 10 Years |
Class A shares | | | | |
with maximum sales charge (5.75%) | 10/13/1997 | 57.74% | 23.42% | 18.45% |
without sales charge | 10/13/1997 | 67.36% | 24.89% | 19.16% |
Class C shares | | | | |
with applicable redemption charge† | 4/15/1999 | 65.16% | 23.93% | 18.21% |
without redemption | 4/15/1999 | 66.16% | 23.93% | 18.21% |
Class I shares | 4/15/1999 | 67.73% | 25.19% | 19.48% |
Class Y shares | 9/30/2016 | 67.91% | 25.29%†† | 19.53%†† |
NYSE® Technology Index | | 72.67% | 27.76% | 21.68% |
S&P 500® Index | | 21.93% | 14.45% | 15.15% |
† The maximum contingent deferred sales charge for Class C shares is 1% for shares redeemed within one year of the date of purchase.
†† The total return performance figures presented for Class Y shares of the fund reflect the performance of the fund’s Class I shares for the period prior to 9/30/16 (the inception date for Class Y shares).
The performance data quoted represents past performance, which is no guarantee of future results. Share price and investment return fluctuate and an investor’s shares may be worth more or less than original cost upon redemption. Current performance may be lower or higher than the performance quoted. Go to www.bnymellonim.com/us for the fund’s most recent month-end returns.
The fund’s performance shown in the graphs and table does not reflect the deduction of taxes that a shareholder would pay on fund distributions or the redemption of fund shares. In addition to the performance of Class A shares shown with and without a maximum sales charge, the fund’s performance shown in the table takes into account all other applicable fees and expenses on all classes.
7
UNDERSTANDING YOUR FUND’S EXPENSES (Unaudited)
As a mutual fund investor, you pay ongoing expenses, such as management fees and other expenses. Using the information below, you can estimate how these expenses affect your investment and compare them with the expenses of other funds. You also may pay one-time transaction expenses, including sales charges (loads) and redemption fees, which are not shown in this section and would have resulted in higher total expenses. For more information, see your fund’s prospectus or talk to your financial adviser.
Review your fund’s expenses
The table below shows the expenses you would have paid on a $1,000 investment in BNY Mellon Technology Growth Fund from March 1, 2020 to August 31, 2020. It also shows how much a $1,000 investment would be worth at the close of the period, assuming actual returns and expenses.
| | | | | | | |
Expenses and Value of a $1,000 Investment | |
Assume actual returns for the six months ended August 31, 2020 | |
| | | | | | |
| | Class A | Class C | Class I | Class Y | |
Expense paid per $1,000† | $7.67 | $12.57 | $6.27 | $5.63 | |
Ending value (after expenses) | $1,543.60 | $1,538.10 | $1,545.40 | $1,546.10 | |
COMPARING YOUR FUND’S EXPENSES
WITH THOSE OF OTHER FUNDS (Unaudited)
Using the SEC’s method to compare expenses
The Securities and Exchange Commission (“SEC”) has established guidelines to help investors assess fund expenses. Per these guidelines, the table below shows your fund’s expenses based on a $1,000 investment, assuming a hypothetical 5% annualized return. You can use this information to compare the ongoing expenses (but not transaction expenses or total cost) of investing in the fund with those of other funds. All mutual fund shareholder reports will provide this information to help you make this comparison. Please note that you cannot use this information to estimate your actual ending account balance and expenses paid during the period.
| | | | | | | |
Expenses and Value of a $1,000 Investment | |
Assuming a hypothetical 5% annualized return for the six months ended August 31, 2020 | |
| | | | | | |
| | Class A | Class C | Class I | Class Y | |
Expense paid per $1,000† | $6.09 | $9.98 | $4.98 | $4.47 | |
Ending value (after expenses) | $1,019.10 | $1,015.23 | $1,020.21 | $1,020.71 | |
†Expenses are equal to the fund’s annualized expense ratio of 1.20% for Class A, 1.97% for Class C, .98% for Class I and .88% for Class Y, multiplied by the average account value over the period, multiplied by 184/366 (to reflect the one-half year period). |
8
STATEMENT OF INVESTMENTS
August 31, 2020
| | | | | | | | |
| |
Description | | | | Shares | | Value ($) | |
Common Stocks - 97.7% | | | | | |
Alternative Carriers - .8% | | | | | |
Bandwidth, Cl. A | | | | 21,080 | a,b | 3,319,678 | |
Application Software - 17.9% | | | | | |
Adobe | | | | 29,318 | b | 15,051,568 | |
Everbridge | | | | 20,949 | a,b | 3,113,231 | |
HubSpot | | | | 14,745 | b | 4,418,782 | |
Medallia | | | | 120,096 | b | 4,346,274 | |
OneConnect Financial Technology, ADR | | | | 196,150 | a,b | 4,230,955 | |
salesforce.com | | | | 76,243 | b | 20,787,654 | |
Slack Technologies, Cl. A | | | | 291,373 | b | 9,568,689 | |
Splunk | | | | 59,237 | a,b | 12,992,451 | |
Zoom Video Communications, CI. A | | | | 7,727 | b | 2,512,048 | |
| | | | | 77,021,652 | |
Auto Parts & Equipment - .6% | | | | | |
Workhorse Group | | | | 137,972 | a,b | 2,498,673 | |
Automobile Manufacturers - 5.6% | | | | | |
Tesla | | | | 48,390 | b | 24,113,705 | |
Data Processing & Outsourced Services - 1.3% | | | | | |
Square, Cl. A | | | | 34,979 | b | 5,581,249 | |
Electronic Equipment & Instruments - .9% | | | | | |
Cognex | | | | 54,362 | | 3,761,307 | |
Interactive Media & Services - 11.1% | | | | | |
Alphabet, Cl. C | | | | 8,146 | b | 13,312,030 | |
Facebook, Cl. A | | | | 71,210 | b | 20,878,772 | |
Snap, Cl. A | | | | 320,628 | b | 7,242,987 | |
Twitter | | | | 151,027 | b | 6,128,676 | |
| | | | | 47,562,465 | |
Internet & Direct Marketing Research - 12.5% | | | | | |
Alibaba Group Holding, ADR | | | | 50,810 | b | 14,583,994 | |
Amazon.com | | | | 5,587 | b | 19,280,514 | |
JD.com, ADR | | | | 252,559 | b | 19,861,240 | |
| | | | | 53,725,748 | |
Internet Services & Infrastructure - 5.4% | | | | | |
Shopify, Cl. A | | | | 17,610 | b | 18,779,656 | |
Twilio, Cl. A | | | | 16,054 | b | 4,330,727 | |
| | | | | 23,110,383 | |
Semiconductor Equipment - 5.3% | | | | | |
Applied Materials | | | | 218,958 | | 13,487,813 | |
KLA | | | | 44,310 | | 9,089,753 | |
| | | | | 22,577,566 | |
Semiconductors - 22.6% | | | | | |
Advanced Micro Devices | | | | 248,718 | b | 22,588,569 | |
9
STATEMENT OF INVESTMENTS (continued)
| | | | | | | | |
| |
Description | | | | Shares | | Value ($) | |
Common Stocks - 97.7% (continued) | | | | | |
Semiconductors - 22.6% (continued) | | | | | |
Diodes | | | | 49,150 | b | 2,401,469 | |
Micron Technology | | | | 86,569 | b | 3,939,755 | |
NVIDIA | | | | 44,817 | | 23,976,199 | |
NXP Semiconductors | | | | 104,662 | | 13,162,293 | |
Qualcomm | | | | 104,688 | | 12,468,341 | |
Semtech | | | | 46,714 | b | 2,739,776 | |
Taiwan Semiconductor Manufacturing, ADR | | | | 200,232 | a | 15,868,386 | |
| | | | | 97,144,788 | |
Systems Software - 8.0% | | | | | |
Microsoft | | | | 67,882 | | 15,309,427 | |
Proofpoint | | | | 26,948 | b | 2,955,387 | |
ServiceNow | | | | 33,283 | b | 16,043,072 | |
| | | | | 34,307,886 | |
Technology Hardware, Storage & Equipment - 5.7% | | | | | |
Apple | | | | 188,992 | | 24,387,528 | |
Total Common Stocks (cost $208,878,421) | | | | 419,112,628 | |
| | | 1-Day
Yield (%) | | | | | |
Investment Companies - 2.4% | | | | | |
Registered Investment Companies - 2.4% | | | | | |
Dreyfus Institutional Preferred Government Plus Money Market Fund
(cost $10,242,835) | | 0.20 | | 10,242,835 | c | 10,242,835 | |
| | | | | | | | |
Investment of Cash Collateral for Securities Loaned - 1.1% | | | | | |
Registered Investment Companies - 1.1% | | | | | |
Dreyfus Institutional Preferred Government Plus Money Market Fund
(cost $4,698,453) | | 0.20 | | 4,698,453 | c | 4,698,453 | |
Total Investments (cost $223,819,709) | | 101.2% | | 434,053,916 | |
Liabilities, Less Cash and Receivables | | (1.2%) | | (5,077,387) | |
Net Assets | | 100.0% | | 428,976,529 | |
ADR—American Depository Receipt
aSecurity, or portion thereof, on loan. At August 31, 2020, the value of the fund’s securities on loan was $27,147,421 and the value of the collateral was $27,714,994, consisting of cash collateral of $4,698,453 and U.S. Government & Agency securities valued at $23,016,541.
bNon-income producing security.
cInvestment in affiliated issuer. The investment objective of this investment company is publicly available and can be found within the investment company’s prospectus.
10
| | |
Portfolio Summary (Unaudited) † | Value (%) |
Information Technology | 67.1 |
Consumer Discretionary | 18.7 |
Communication Services | 11.9 |
Investment Companies | 3.5 |
| | 101.2 |
† Based on net assets.
See notes to financial statements.
11
STATEMENT OF INVESTMENTS IN AFFILIATED ISSUERS
| | | | | | | |
Investment Companies | Value
8/31/19 ($) | Purchases ($)† | Sales ($) | Value
8/31/20 ($) | Net
Assets (%) | Dividends/
Distributions ($) |
Registered Investment Companies; |
Dreyfus Institutional Preferred Government Plus Money Market Fund | 2,339,842 | 89,240,388 | (81,337,395) | 10,242,835 | 2.4 | 34,705 |
Investment of Cash Collateral for Securities Loaned; |
Dreyfus Institutional Preferred Government Plus Money Market Fund | 6,016,391 | 63,869,473 | (65,187,411) | 4,698,453 | 1.1 | - |
Total | 8,356,233 | 153,109,861 | (146,524,806) | 14,941,288 | 3.5 | 34,705 |
† Includes reinvested dividends/distributions.
See notes to financial statements.
12
STATEMENT OF ASSETS AND LIABILITIES
August 31, 2020
| | | | | | | |
| | | | | | |
| | | Cost | | Value | |
Assets ($): | | | | |
Investments in securities—See Statement of Investments
(including securities on loan, valued at $27,147,421)—Note 1(c): | | | |
Unaffiliated issuers | 208,878,421 | | 419,112,628 | |
Affiliated issuers | | 14,941,288 | | 14,941,288 | |
Cash denominated in foreign currency | | | 46,344 | | 46,801 | |
Receivable for shares of Common Stock subscribed | | 458,056 | |
Dividends and securities lending income receivable | | 132,123 | |
Prepaid expenses | | | | | 58,192 | |
| | | | | 434,749,088 | |
Liabilities ($): | | | | |
Due to BNY Mellon Investment Adviser, Inc. and affiliates—Note 3(c) | | 355,042 | |
Liability for securities on loan—Note 1(c) | | 4,698,453 | |
Payable for shares of Common Stock redeemed | | 603,434 | |
Directors’ fees and expenses payable | | 7,205 | |
Other accrued expenses | | | | | 108,425 | |
| | | | | 5,772,559 | |
Net Assets ($) | | | 428,976,529 | |
Composition of Net Assets ($): | | | | |
Paid-in capital | | | | | 197,144,769 | |
Total distributable earnings (loss) | | | | | 231,831,760 | |
Net Assets ($) | | | 428,976,529 | |
| | | | | | |
Net Asset Value Per Share | Class A | Class C | Class I | Class Y | |
Net Assets ($) | 392,204,208 | 7,576,390 | 28,877,159 | 318,772 | |
Shares Outstanding | 6,318,823 | 191,382 | 398,409 | 4,373 | |
Net Asset Value Per Share ($) | 62.07 | 39.59 | 72.48 | 72.90 | |
| | | | | |
See notes to financial statements. | | | | | |
13
STATEMENT OF OPERATIONS
Year Ended August 31, 2020
| | | | | | | |
| | | | | | |
| | | | | | |
Investment Income ($): | | | | |
Income: | | | | |
Cash dividends (net of $77,929 foreign taxes withheld at source): | |
Unaffiliated issuers | | | 1,891,207 | |
Affiliated issuers | | | 33,584 | |
Income from securities lending—Note 1(c) | | | 879,259 | |
Interest | | | 45,321 | |
Total Income | | | 2,849,371 | |
Expenses: | | | | |
Management fee—Note 3(a) | | | 2,309,825 | |
Shareholder servicing costs—Note 3(c) | | | 1,051,558 | |
Professional fees | | | 89,556 | |
Registration fees | | | 67,598 | |
Prospectus and shareholders’ reports | | | 60,379 | |
Distribution fees—Note 3(b) | | | 57,486 | |
Directors’ fees and expenses—Note 3(d) | | | 25,746 | |
Chief Compliance Officer fees—Note 3(c) | | | 13,975 | |
Custodian fees—Note 3(c) | | | 11,948 | |
Loan commitment fees—Note 2 | | | 6,848 | |
Interest expense—Note 2 | | | 101 | |
Miscellaneous | | | 22,668 | |
Total Expenses | | | 3,717,688 | |
Investment (Loss)—Net | | | (868,317) | |
Realized and Unrealized Gain (Loss) on Investments—Note 4 ($): | | |
Net realized gain (loss) on investments and foreign currency transactions | 22,462,515 | |
Net realized gain (loss) on forward foreign currency exchange contracts | (681) | |
Capital gain distributions from affiliated issuers | 1,121 | |
Net Realized Gain (Loss) | | | 22,462,955 | |
Net change in unrealized appreciation (depreciation) on investments
and foreign currency transactions | 153,013,846 | |
Net Realized and Unrealized Gain (Loss) on Investments | | | 175,476,801 | |
Net Increase in Net Assets Resulting from Operations | | 174,608,484 | |
| | | | | | |
See notes to financial statements. | | | | | |
14
STATEMENT OF CHANGES IN NET ASSETS
| | | | | | | | | | |
| | | | Year Ended August 31, |
| | | | 2020 | | 2019 | |
Operations ($): | | | | | | | | |
Investment (loss)—net | | | (868,317) | | | | (473,601) | |
Net realized gain (loss) on investments | | 22,462,955 | | | | 66,517,652 | |
Net change in unrealized appreciation
(depreciation) on investments | | 153,013,846 | | | | (83,415,357) | |
Net Increase (Decrease) in Net Assets
Resulting from Operations | 174,608,484 | | | | (17,371,306) | |
Distributions ($): | |
Distributions to shareholders: | | | | | | | | |
Class A | | | (39,504,163) | | | | (57,320,868) | |
Class C | | | (1,756,487) | | | | (3,167,730) | |
Class I | | | (2,647,199) | | | | (5,279,305) | |
Class Y | | | (22,507) | | | | (2,445) | |
Total Distributions | | | (43,930,356) | | | | (65,770,348) | |
Capital Stock Transactions ($): | |
Net proceeds from shares sold: | | | | | | | | |
Class A | | | 20,794,708 | | | | 18,810,054 | |
Class C | | | 904,566 | | | | 961,447 | |
Class I | | | 7,311,730 | | | | 8,131,915 | |
Class Y | | | 29,250 | | | | 152,987 | |
Distributions reinvested: | | | | | | | | |
Class A | | | 36,473,417 | | | | 53,076,388 | |
Class C | | | 1,442,943 | | | | 2,756,294 | |
Class I | | | 2,584,614 | | | | 5,172,566 | |
Class Y | | | 21,032 | | | | - | |
Cost of shares redeemed: | | | | | | | | |
Class A | | | (47,818,771) | | | | (46,362,030) | |
Class C | | | (5,482,762) | | | | (4,723,199) | |
Class I | | | (13,475,812) | | | | (17,879,087) | |
Increase (Decrease) in Net Assets
from Capital Stock Transactions | 2,784,915 | | | | 20,097,335 | |
Total Increase (Decrease) in Net Assets | 133,463,043 | | | | (63,044,319) | |
Net Assets ($): | |
Beginning of Period | | | 295,513,486 | | | | 358,557,805 | |
End of Period | | | 428,976,529 | | | | 295,513,486 | |
15
STATEMENT OF CHANGES IN NET ASSETS (continued)
| | | | | | | | | | |
| | | | Year Ended August 31, |
| | | | 2020 | | 2019 | |
Capital Share Transactions (Shares): | |
Class Aa,b | | | | | | | | |
Shares sold | | | 466,068 | | | | 417,502 | |
Shares issued for distributions reinvested | | | 963,121 | | | | 1,363,379 | |
Shares redeemed | | | (1,126,535) | | | | (1,018,096) | |
Net Increase (Decrease) in Shares Outstanding | 302,654 | | | | 762,785 | |
Class Cb | | | | | | | | |
Shares sold | | | 33,024 | | | | 31,320 | |
Shares issued for distributions reinvested | | | 59,406 | | | | 101,002 | |
Shares redeemed | | | (187,940) | | | | (146,739) | |
Net Increase (Decrease) in Shares Outstanding | (95,510) | | | | (14,417) | |
Class Ia | | | | | | | | |
Shares sold | | | 139,490 | | | | 151,559 | |
Shares issued for distributions reinvested | | | 58,539 | | | | 116,741 | |
Shares redeemed | | | (268,118) | | | | (331,836) | |
Net Increase (Decrease) in Shares Outstanding | (70,089) | | | | (63,536) | |
Class Y | | | | | | | | |
Shares sold | | | 595 | | | | 3,087 | |
Shares issued for distributions reinvested | | | 474 | | | | - | |
Net Increase (Decrease) in Shares Outstanding | 1,069 | | | | 3,087 | |
| | | | | | | | | |
aDuring the period ended August 31, 2020, 1,831 Class A shares representing $97,980 were exchanged for 1,574 Class I shares and during the period ended August 31, 2019, 803 Class A shares representing $47,184 were exchanged for 726 Class I shares. | |
bDuring the period ended August 31, 2020, 1,354 Class C shares representing $39,993 were automatically converted to 938 Class A shares and during the period ended August 31, 2019, 2,526 Class C shares representing $82,170 were automatically converted to 1,798 Class A shares. | |
See notes to financial statements. | | | | | | | | |
16
FINANCIAL HIGHLIGHTS
The following tables describe the performance for each share class for the fiscal periods indicated. All information (except portfolio turnover rate) reflects financial results for a single fund share. Total return shows how much your investment in the fund would have increased (or decreased) during each period, assuming you had reinvested all dividends and distributions. These figures have been derived from the fund’s financial statements.
| | | | | | | |
| | |
| | Year Ended August 31, |
Class A Shares | | 2020 | 2019 | 2018 | 2017 | 2016 |
Per Share Data ($): | | | | | | |
Net asset value, beginning of period | | 43.75 | 59.03 | 49.66 | 42.56 | 40.03 |
Investment Operations: | | | | | | |
Investment (loss)—neta | | (.12) | (.07) | (.18) | (.18) | (.21) |
Net realized and unrealized
gain (loss) on investments | | 25.25 | (3.93) | 14.40 | 11.13 | 5.32 |
Total from Investment Operations | | 25.13 | (4.00) | 14.22 | 10.95 | 5.11 |
Distributions: | | | | | | |
Dividends from net realized
gain on investments | | (6.81) | (11.28) | (4.85) | (3.85) | (2.58) |
Net asset value, end of period | | 62.07 | 43.75 | 59.03 | 49.66 | 42.56 |
Total Return (%)b | | 67.36 | (4.38) | 30.67 | 28.34 | 13.23 |
Ratios/Supplemental Data (%): | | | | | | |
Ratio of total expenses
to average net assets | | 1.20 | 1.20 | 1.22 | 1.26 | 1.28 |
Ratio of net expenses
to average net assets | | 1.20 | 1.20 | 1.22 | 1.26 | 1.28 |
Ratio of net investment (loss)
to average net assets | | (.28) | (.15) | (.34) | (.40) | (.53) |
Portfolio Turnover Rate | | 70.24 | 69.92 | 49.14 | 58.27 | 37.76 |
Net Assets, end of period ($ x 1,000) | | 392,204 | 263,227 | 310,110 | 246,693 | 214,185 |
a Based on average shares outstanding.
b Exclusive of sales charge.
See notes to financial statements.
17
FINANCIAL HIGHLIGHTS (continued)
| | | | | | | |
| | | |
| | | Year Ended August 31, |
Class C Shares | | 2020 | 2019 | 2018 | 2017 | 2016 |
Per Share Data ($): | | | | | | |
Net asset value, beginning of period | | 30.51 | 45.44 | 39.52 | 34.92 | 33.55 |
Investment Operations: | | | | | | |
Investment (loss)—neta | | (.30) | (.29) | (.47) | (.43) | (.44) |
Net realized and unrealized
gain (loss) on investments | | 16.19 | (3.36) | 11.24 | 8.88 | 4.39 |
Total from Investment Operations | | 15.89 | (3.65) | 10.77 | 8.45 | 3.95 |
Distributions: | | | | | | |
Dividends from net realized
gain on investments | | (6.81) | (11.28) | (4.85) | (3.85) | (2.58) |
Net asset value, end of period | | 39.59 | 30.51 | 45.44 | 39.52 | 34.92 |
Total Return (%)b | | 66.16 | (5.10) | 29.74 | 27.30 | 12.27 |
Ratios/Supplemental Data (%): | | | | | | |
Ratio of total expenses
to average net assets | | 1.96 | 1.92 | 1.96 | 2.07 | 2.10 |
Ratio of net expenses
to average net assets | | 1.96 | 1.92 | 1.96 | 2.07 | 2.09 |
Ratio of net investment (loss)
to average net assets | | (1.03) | (.88) | (1.14) | (1.21) | (1.34) |
Portfolio Turnover Rate | | 70.24 | 69.92 | 49.14 | 58.27 | 37.76 |
Net Assets, end of period ($ x 1,000) | | 7,576 | 8,754 | 13,692 | 24,060 | 24,544 |
a Based on average shares outstanding.
b Exclusive of sales charge.
See notes to financial statements.
18
| | | | | | | |
| | | |
| | | Year Ended August 31, |
Class I Shares | | 2020 | 2019 | 2018 | 2017 | 2016 |
Per Share Data ($): | | | | | | |
Net asset value, beginning of period | | 49.88 | 65.30 | 54.34 | 46.09 | 43.05 |
Investment Operations: | | | | | | |
Investment income (loss)—neta | | (.03) | .04 | (.07) | (.06) | (.12) |
Net realized and unrealized
gain (loss) on investments | | 29.44 | (4.18) | 15.88 | 12.16 | 5.74 |
Total from Investment Operations | | 29.41 | (4.14) | 15.81 | 12.10 | 5.62 |
Distributions: | | | | | | |
Dividends from net realized
gain on investments | | (6.81) | (11.28) | (4.85) | (3.85) | (2.58) |
Net asset value, end of period | | 72.48 | 49.88 | 65.30 | 54.34 | 46.09 |
Total Return (%) | | 67.73 | (4.16) | 30.97 | 28.69 | 13.49 |
Ratios/Supplemental Data (%): | | | | | | |
Ratio of total expenses
to average net assets | | .98 | .96 | .99 | 1.00 | 1.03 |
Ratio of net expenses
to average net assets | | .98 | .96 | .99 | 1.00 | 1.03 |
Ratio of net investment
income (loss) to average net assets | | (.05) | .08 | (.11) | (.13) | (.27) |
Portfolio Turnover Rate | | 70.24 | 69.92 | 49.14 | 58.27 | 37.76 |
Net Assets, end of period ($ x 1,000) | | 28,877 | 23,367 | 34,742 | 19,572 | 17,675 |
a Based on average shares outstanding.
See notes to financial statements.
19
FINANCIAL HIGHLIGHTS (continued)
| | | | | | |
| | | |
| | | Year Ended August 31, |
Class Y Shares | | 2020 | 2019 | 2018 | 2017a |
Per Share Data ($): | | | | | |
Net asset value, beginning of period | | 50.08 | 65.48 | 54.40 | 46.16 |
Investment Operations: | | | | | |
Investment income—netb | | .03 | .14 | .01 | .00c |
Net realized and unrealized
gain (loss) on investments | | 29.60 | (4.26) | 15.92 | 12.09 |
Total from Investment Operations | | 29.63 | (4.12) | 15.93 | 12.09 |
Distributions: | | | | | |
Dividends from net realized
gain on investments | | (6.81) | (11.28) | (4.85) | (3.85) |
Net asset value, end of period | | 72.90 | 50.08 | 65.48 | 54.40 |
Total Return (%) | | 67.91 | (4.11) | 31.16 | 28.63d |
Ratios/Supplemental Data (%): | | | | | |
Ratio of total expenses
to average net assets | | .88 | .89 | .85 | .89e |
Ratio of net expenses
to average net assets | | .88 | .89 | .85 | .89e |
Ratio of net investment income
to average net assets | | .05 | .26 | .02 | .01e |
Portfolio Turnover Rate | | 70.24 | 69.92 | 49.14 | 58.27 |
Net Assets, end of period ($ x 1,000) | | 319 | 165 | 14 | 12 |
a From September 30, 2016 (commencement of initial offering) to August 31, 2017.
b Based on average shares outstanding.
c Amount represents less than $.01 per share.
d Not annualized.
e Annualized.
See notes to financial statements.
20
NOTES TO FINANCIAL STATEMENTS
NOTE 1—Significant Accounting Policies:
BNY Mellon Technology Growth Fund (the “fund”) is a separate diversified series of BNY Mellon Advantage Funds, Inc. (the “Company”), which is registered under the Investment Company Act of 1940, as amended (the “Act”), as an open-end management investment company and operates as a series company currently offering nine series, including the fund. The fund’s investment objective is to seek capital appreciation. BNY Mellon Investment Adviser, Inc. (the “Adviser”), a wholly-owned subsidiary of The Bank of New York Mellon Corporation (“BNY Mellon”), serves as the fund’s investment adviser.
The Company’s Board of Directors (the “Board”) approved, effective December 31, 2019 (the “Effective Date”), the termination of the fund’s authorized Class T shares. Prior to the Effective Date, the fund did not offer such Class T shares for purchase. The authorized Class T shares were reallocated to authorized Class I shares and Class Y shares, increasing authorized Class I shares from 200 million to 250 million and increasing authorized Class Y shares from 100 million to 150 million.
BNY Mellon Securities Corporation (the “Distributor”), a wholly-owned subsidiary of the Adviser, is the distributor of the fund’s shares. The fund is authorized to issue 700 million shares of $.001 par value Common Stock. The fund currently has authorized four classes of shares: Class A (200 million shares authorized), Class C (100 million shares authorized), Class I (250 million shares authorized), and Class Y (150 million shares authorized). Class A shares generally are subject to a sales charge imposed at the time of purchase. Class C shares are subject to a contingent deferred sales charge (“CDSC”) imposed on Class C shares redeemed within one year of purchase. Class C shares automatically convert to Class A shares ten years after the date of purchase, without the imposition of a sales charge. Class I and Class Y shares are sold at net asset value per share generally to institutional investors. Other differences between the classes include the services offered to and the expenses borne by each class, the allocation of certain transfer agency costs and certain voting rights. Income, expenses (other than expenses attributable to a specific class), and realized and unrealized gains or losses on investments are allocated to each class of shares based on its relative net assets.
The Company accounts separately for the assets, liabilities and operations of each series. Expenses directly attributable to each series are charged to that series’ operations; expenses which are applicable to all series are allocated among them on a pro rata basis.
21
NOTES TO FINANCIAL STATEMENTS (continued)
The Financial Accounting Standards Board (“FASB”) Accounting Standards Codification (“ASC”) is the exclusive reference of authoritative U.S. generally accepted accounting principles (“GAAP”) recognized by the FASB to be applied by nongovernmental entities. Rules and interpretive releases of the Securities and Exchange Commission (“SEC”) under authority of federal laws are also sources of authoritative GAAP for SEC registrants. The fund is an investment company and applies the accounting and reporting guidance of the FASB ASC Topic 946 Financial Services-Investment Companies. The fund’s financial statements are prepared in accordance with GAAP, which may require the use of management estimates and assumptions. Actual results could differ from those estimates.
The Company enters into contracts that contain a variety of indemnifications. The fund’s maximum exposure under these arrangements is unknown. The fund does not anticipate recognizing any loss related to these arrangements.
(a) Portfolio valuation: The fair value of a financial instrument is the amount that would be received to sell an asset or paid to transfer a liability in an orderly transaction between market participants at the measurement date (i.e., the exit price). GAAP establishes a fair value hierarchy that prioritizes the inputs of valuation techniques used to measure fair value. This hierarchy gives the highest priority to unadjusted quoted prices in active markets for identical assets or liabilities (Level 1 measurements) and the lowest priority to unobservable inputs (Level 3 measurements).
Additionally, GAAP provides guidance on determining whether the volume and activity in a market has decreased significantly and whether such a decrease in activity results in transactions that are not orderly. GAAP requires enhanced disclosures around valuation inputs and techniques used during annual and interim periods.
Various inputs are used in determining the value of the fund’s investments relating to fair value measurements. These inputs are summarized in the three broad levels listed below:
Level 1—unadjusted quoted prices in active markets for identical investments.
Level 2—other significant observable inputs (including quoted prices for similar investments, interest rates, prepayment speeds, credit risk, etc.).
Level 3—significant unobservable inputs (including the fund’s own assumptions in determining the fair value of investments).
22
The inputs or methodology used for valuing securities are not necessarily an indication of the risk associated with investing in those securities.
Changes in valuation techniques may result in transfers in or out of an assigned level within the disclosure hierarchy. Valuation techniques used to value the fund’s investments are as follows:
Investments in equity securities are valued at the last sales price on the securities exchange or national securities market on which such securities are primarily traded. Securities listed on the National Market System for which market quotations are available are valued at the official closing price or, if there is no official closing price that day, at the last sales price. For open short positions, asked prices are used for valuation purposes. Bid price is used when no asked price is available. Registered investment companies that are not traded on an exchange are valued at their net asset value. All of the preceding securities are generally categorized within Level 1 of the fair value hierarchy.
Securities not listed on an exchange or the national securities market, or securities for which there were no transactions, are valued at the average of the most recent bid and asked prices. These securities are generally categorized within Level 2 of the fair value hierarchy.
Fair valuing of securities may be determined with the assistance of a pricing service using calculations based on indices of domestic securities and other appropriate indicators, such as prices of relevant American Depository Receipts and futures. Utilizing these techniques may result in transfers between Level 1 and Level 2 of the fair value hierarchy.
When market quotations or official closing prices are not readily available, or are determined not to accurately reflect fair value, such as when the value of a security has been significantly affected by events after the close of the exchange or market on which the security is principally traded (for example, a foreign exchange or market), but before the fund calculates its net asset value, the fund may value these investments at fair value as determined in accordance with the procedures approved by the Board. Certain factors may be considered when fair valuing investments such as: fundamental analytical data, the nature and duration of restrictions on disposition, an evaluation of the forces that influence the market in which the securities are purchased and sold, and public trading in similar securities of the issuer or comparable issuers. These securities are either categorized within Level 2 or 3 of the fair value hierarchy depending on the relevant inputs used.
23
NOTES TO FINANCIAL STATEMENTS (continued)
For securities where observable inputs are limited, assumptions about market activity and risk are used and such securities are generally categorized within Level 3 of the fair value hierarchy.
Investments denominated in foreign currencies are translated to U.S. dollars at the prevailing rates of exchange.
The following is a summary of the inputs used as of August 31, 2020 in valuing the fund’s investments:
| | | | | |
| | Level 1 – Unadjusted
Quoted Prices | Level 2 - Other Significant Observable
Inputs | Level 3 -
Significant Unobservable Inputs | Total |
Investment in Securities:† | | | | |
Equity Securities -
Common Stocks | 419,112,628 | - | - | 419,112,628 |
Investment Companies | 14,941,288 | - | - | 14,941,288 |
† See Statement of Investments for additional detailed categorizations, if any.
(b) Foreign currency transactions: The fund does not isolate that portion of the results of operations resulting from changes in foreign exchange rates on investments from the fluctuations arising from changes in the market prices of securities held. Such fluctuations are included with the net realized and unrealized gain or loss on investments.
Net realized foreign exchange gains or losses arise from sales of foreign currencies, currency gains or losses realized on securities transactions between trade and settlement date, and the difference between the amounts of dividends, interest and foreign withholding taxes recorded on the fund’s books and the U.S. dollar equivalent of the amounts actually received or paid. Net unrealized foreign exchange gains and losses arise from changes in the value of assets and liabilities other than investments resulting from changes in exchange rates. Foreign currency gains and losses on foreign currency transactions are also included with net realized and unrealized gain or loss on investments.
Foreign Taxes: The fund may be subject to foreign taxes (a portion of which may be reclaimable) on income, stock dividends, realized and unrealized capital gains on investments or certain foreign currency transactions. Foreign taxes are recorded in accordance with the fund’s understanding of the applicable foreign tax regulations and rates that exist in the foreign jurisdictions in which the fund invests. These foreign taxes, if any, are paid by the fund and are reflected in the Statement of
24
Operations. Foreign taxes payable or deferred as of August 31, 2020, if any, are disclosed in the fund’s Statement of Assets and Liabilities.
(c) Securities transactions and investment income: Securities transactions are recorded on a trade date basis. Realized gains and losses from securities transactions are recorded on the identified cost basis. Dividend income is recognized on the ex-dividend date and interest income, including, where applicable, accretion of discount and amortization of premium on investments, is recognized on the accrual basis.
Pursuant to a securities lending agreement with The Bank of New York Mellon, a subsidiary of BNY Mellon and an affiliate of the Adviser, the fund may lend securities to qualified institutions. It is the fund’s policy that, at origination, all loans are secured by collateral of at least 102% of the value of U.S. securities loaned and 105% of the value of foreign securities loaned. Collateral equivalent to at least 100% of the market value of securities on loan is maintained at all times. Collateral is either in the form of cash, which can be invested in certain money market mutual funds managed by the Adviser, or U.S. Government and Agency securities. The fund is entitled to receive all dividends, interest and distributions on securities loaned, in addition to income earned as a result of the lending transaction. Should a borrower fail to return the securities in a timely manner, The Bank of New York Mellon is required to replace the securities for the benefit of the fund or credit the fund with the market value of the unreturned securities and is subrogated to the fund’s rights against the borrower and the collateral. Additionally, the contractual maturity of security lending transactions are on an overnight and continuous basis. During the period ended August 31, 2020, The Bank of New York Mellon earned $156,135 from the lending of the fund’s portfolio securities, pursuant to the securities lending agreement.
(d) Affiliated issuers: Investments in other investment companies advised by the Adviser are considered “affiliated” under the Act.
(e) Risk: Certain events particular to the industries in which the fund’s investments conduct their operations, as well as general economic, political and public health conditions, may have a significant negative impact on the investee’s operations and profitability. In addition, turbulence in financial markets and reduced liquidity in equity, credit and/or fixed income markets may negatively affect many issuers, which could adversely affect the fund. Global economies and financial markets are becoming increasingly interconnected, and conditions and events in one country, region or financial market may adversely impact issuers in a different country, region or financial market. These risks may be magnified if certain
25
NOTES TO FINANCIAL STATEMENTS (continued)
events or developments adversely interrupt the global supply chain; in these and other circumstances, such risks might affect companies worldwide. Recent examples include pandemic risks related to COVID-19 and aggressive measures taken world-wide in response by governments, including closing borders, restricting international and domestic travel, and the imposition of prolonged quarantines of large populations, and by businesses, including changes to operations and reducing staff. To the extent the fund may overweight its investments in certain countries, companies, industries or market sectors, such positions will increase the fund’s exposure to risk of loss from adverse developments affecting those countries, companies, industries or sectors.
(f) Dividends and distributions to shareholders: Dividends and distributions are recorded on the ex-dividend date. Dividends from investment income-net and dividends from net realized capital gains, if any, are normally declared and paid annually, but the fund may make distributions on a more frequent basis to comply with the distribution requirements of the Internal Revenue Code of 1986, as amended (the “Code”). To the extent that net realized capital gains can be offset by capital loss carryovers, it is the policy of the fund not to distribute such gains. Income and capital gain distributions are determined in accordance with income tax regulations, which may differ from GAAP.
(g) Federal income taxes: It is the policy of the fund to continue to qualify as a regulated investment company, if such qualification is in the best interests of its shareholders, by complying with the applicable provisions of the Code, and to make distributions of taxable income and net realized capital gain sufficient to relieve it from substantially all federal income and excise taxes.
As of and during the period ended August 31, 2020, the fund did not have any liabilities for any uncertain tax positions. The fund recognizes interest and penalties, if any, related to uncertain tax positions as income tax expense in the Statement of Operations. During the period ended August 31, 2020, the fund did not incur any interest or penalties.
Each tax year in the four-year period ended August 31, 2020 remains subject to examination by the Internal Revenue Service and state taxing authorities.
At August 31, 2020, the components of accumulated earnings on a tax basis were as follows: undistributed capital gains $22,942,793 and unrealized appreciation $209,547,178. In addition, the fund deferred for tax purposes late year ordinary losses of $658,211 to the first day of the following fiscal year.
26
The tax character of distributions paid to shareholders during the fiscal periods ended August 31, 2020 and August 31, 2019 were as follows: ordinary income $0 and $4,457,131, and long-term capital gains $43,930,356 and $61,313,217 respectively.
During the period ended August 31, 2020, as a result of permanent book to tax differences, primarily due to the tax treatment for net operating losses and foreign currency gains and losses, the fund increased total distributable earnings (loss) by $295,462 and decreased paid-in capital by the same amount. Net assets and net asset value per share were not affected by this reclassification.
NOTE 2—Bank Lines of Credit:
The fund participates with other long-term open-end funds managed by the Adviser in a $927 million unsecured credit facility led by Citibank, N.A. (the “Citibank Credit Facility”) and a $300 million unsecured credit facility provided by The Bank of New York Mellon (the “BNYM Credit Facility”), each to be utilized primarily for temporary or emergency purposes, including the financing of redemptions (each, a “Facility”). The Citibank Credit Facility is available in two tranches: (i) Tranche A is in an amount equal to $747 million and is available to all long-term open-ended funds, including the fund, and (ii) Tranche B is an amount equal to $180 million and is available only to BNY Mellon Floating Rate Income Fund, a series of BNY Mellon Investment Funds IV, Inc. Prior to March 11, 2020, the Citibank Credit Facility was $1.030 billion with Tranche A available in an amount equal to $830 million and Tranche B available in an amount equal to $200 million. In connection therewith, the fund has agreed to pay its pro rata portion of commitment fees for Tranche A of the Citibank Credit Facility and the BNYM Credit Facility. Interest is charged to the fund based on rates determined pursuant to the terms of the respective Facility at the time of borrowing.
The average amount of borrowings outstanding under the Facilities during the period ended August 31, 2020 was approximately $4,098 with a related weighted average annualized interest rate of 2.47%.
NOTE 3—Management Fee and Other Transactions with Affiliates:
(a) Pursuant to a management agreement with the Adviser, the management fee is computed at the annual rate of .75% of the value of the fund’s average daily net assets and is payable monthly.
27
NOTES TO FINANCIAL STATEMENTS (continued)
During the period ended August 31, 2020, the Distributor retained $12,052 from commissions earned on sales of the fund’s Class A shares and $1,097 from CDSC fees on redemptions of the fund’s Class C shares.
(b) Under the Distribution Plan adopted pursuant to Rule 12b-1 under the Act, Class C shares pay the Distributor for distributing its shares at an annual rate of .75% of the value of its average daily net assets. During the period ended August 31, 2020, Class C shares were charged $57,486 pursuant to the Distribution Plan.
(c) Under the Shareholder Services Plan, Class A and Class C shares pay the Distributor at an annual rate of .25% of the value of their average daily net assets for the provision of certain services. The services provided may include personal services relating to shareholder accounts, such as answering shareholder inquiries regarding the fund and providing reports and other information, and services related to the maintenance of shareholder accounts. The Distributor may make payments to Service Agents (securities dealers, financial institutions or other industry professionals) with respect to these services. The Distributor determines the amounts to be paid to Service Agents. During the period ended August 31, 2020, Class A and Class C shares were charged $697,515 and $19,162, respectively, pursuant to the Shareholder Services Plan.
The fund has an arrangement with the transfer agent whereby the fund may receive earnings credits when positive cash balances are maintained, which are used to offset transfer agency fees. For financial reporting purposes, the fund includes net earnings credits, if any, as an expense offset in the Statement of Operations.
The fund has an arrangement with the custodian whereby the fund will receive interest income or be charged an overdraft fees when cash balances are maintained. For financial reporting purposes, the fund includes this interest income and overdraft fees, if any, as interest income in the Statement of Operations.
The fund compensates BNY Mellon Transfer, Inc., a wholly-owned subsidiary of the Adviser, under a transfer agency agreement for providing transfer agency and cash management services for the fund. The majority of transfer agency fees are comprised of amounts paid on a per account basis, while cash management fees are related to fund subscriptions and redemptions. During the period ended August 31, 2020, the fund was charged $95,787 for transfer agency services. These fees are included in Shareholder servicing costs in the Statement of Operations.
The fund compensates The Bank of New York Mellon under a custody agreement for providing custodial services for the fund. These fees are
28
determined based on net assets, geographic region and transaction activity. During the period ended August 31, 2020, the fund was charged $11,948 pursuant to the custody agreement.
During the period ended August 31, 2020, the fund was charged $13,975 for services performed by the Chief Compliance Officer and his staff. These fees are included in Chief Compliance Officer fees in the Statement of Operations.
The components of “Due to BNY Mellon Investment Adviser, Inc. and affiliates” in the Statement of Assets and Liabilities consist of: management fees of $251,286, Distribution Plan fees of $4,459, Shareholder Services Plan fees of $77,997, custodian fees of $2,529, Chief Compliance Officer fees of $2,273 and transfer agency fees of $16,498.
(d) Each Board member also serves as a Board member of other funds in the BNY Mellon Family of Funds complex. Annual retainer fees and attendance fees are allocated to each fund based on net assets.
NOTE 4—Securities Transactions:
The aggregate amount of purchases and sales of investment securities, excluding short-term securities and forward foreign currency exchange contracts (“forward contracts”), during the period ended August 31, 2020, amounted to $216,215,323 and $264,198,084, respectively.
Derivatives: A derivative is a financial instrument whose performance is derived from the performance of another asset. The fund enters into International Swaps and Derivatives Association, Inc. Master Agreements or similar agreements (collectively, “Master Agreements”) with its over-the-counter (“OTC”) derivative contract counterparties in order to, among other things, reduce its credit risk to counterparties. Master Agreements include provisions for general obligations, representations, collateral and events of default or termination. Under a Master Agreement, the fund may offset with the counterparty certain derivative financial instruments’ payables and/or receivables with collateral held and/or posted and create one single net payment in the event of default or termination.
Each type of derivative instrument that was held by the fund during the period ended August 31, 2020 is discussed below.
Forward Foreign Currency Exchange Contracts: The fund enters into forward contracts in order to hedge its exposure to changes in foreign currency exchange rates on its foreign portfolio holdings, to settle foreign currency transactions or as a part of its investment strategy. When executing forward contracts, the fund is obligated to buy or sell a foreign currency at a specified rate on a certain date in the future. With respect to
29
NOTES TO FINANCIAL STATEMENTS (continued)
sales of forward contracts, the fund incurs a loss if the value of the contract increases between the date the forward contract is opened and the date the forward contract is closed. The fund realizes a gain if the value of the contract decreases between those dates. With respect to purchases of forward contracts, the fund incurs a loss if the value of the contract decreases between the date the forward contract is opened and the date the forward contract is closed. The fund realizes a gain if the value of the contract increases between those dates. Any realized or unrealized gains or losses which occurred during the period are reflected in the Statement of Operations. The fund is exposed to foreign currency risk as a result of changes in value of underlying financial instruments. The fund is also exposed to credit risk associated with counterparty nonperformance on these forward contracts, which is generally limited to the unrealized gain on each open contract. This risk may be mitigated by Master Agreements, if any, between the fund and the counterparty and the posting of collateral, if any, by the counterparty to the fund to cover the fund’s exposure to the counterparty. At August 31, 2020, there were no forward contracts outstanding.
The following summarizes the average market value of derivatives outstanding during the period ended August 31, 2020:
| | | |
| | Average Market Value ($) |
Forward contracts | | 23,472 |
At August 31, 2020, the cost of investments for federal income tax purposes was $224,507,195; accordingly, accumulated net unrealized appreciation on investments was $209,546,721, consisting of $210,771,300 gross unrealized appreciation and $1,224,579 gross unrealized depreciation.
30
REPORT OF INDEPENDENT REGISTERED PUBLIC ACCOUNTING FIRM
To the Shareholders and the Board of Directors of BNY Mellon Technology Growth Fund
Opinion on the Financial Statements
We have audited the accompanying statement of assets and liabilities of BNY Mellon Technology Growth Fund (the “Fund”) (one of the funds constituting BNY Mellon Advantage Funds, Inc.), including the statements of investments and investments in affiliated issuers, as of August 31, 2020, and the related statement of operations for the year then ended, the statements of changes in net assets for each of the two years in the period then ended, the financial highlights for each of the five years in the period then ended and the related notes (collectively referred to as the “financial statements”). In our opinion, the financial statements present fairly, in all material respects, the financial position of the Fund (one of the funds constituting BNY Mellon Advantage Funds, Inc.) at August 31, 2020, the results of its operations for the year then ended, the changes in its net assets for each of the two years in the period then ended and its financial highlights for each of the five years in the period then ended, in conformity with U.S. generally accepted accounting principles.
Basis for Opinion
These financial statements are the responsibility of the Fund’s management. Our responsibility is to express an opinion on the Fund’s financial statements based on our audits. We are a public accounting firm registered with the Public Company Accounting Oversight Board (United States) (“PCAOB”) and are required to be independent with respect to the Fund in accordance with the U.S. federal securities laws and the applicable rules and regulations of the Securities and Exchange Commission and the PCAOB.
We conducted our audits in accordance with the standards of the PCAOB. Those standards require that we plan and perform the audit to obtain reasonable assurance about whether the financial statements are free of material misstatement, whether due to error or fraud. The Fund is not required to have, nor were we engaged to perform, an audit of the Fund’s internal control over financial reporting. As part of our audits, we are required to obtain an understanding of internal control over financial reporting, but not for the purpose of expressing an opinion on the effectiveness of the Fund’s internal control over financial reporting. Accordingly, we express no such opinion.
Our audits included performing procedures to assess the risks of material misstatement of the financial statements, whether due to error or fraud, and performing procedures that respond to those risks. Such procedures included examining, on a test basis, evidence regarding the amounts and disclosures in the financial statements. Our procedures included confirmation of securities owned as of August 31, 2020, by correspondence with the custodian and others or by other appropriate auditing procedures where replies from others were not received. Our audits also included evaluating the accounting principles used and significant estimates made by management, as well as evaluating the overall presentation of the financial statements. We believe that our audits provide a reasonable basis for our opinion.

We have served as the auditor of one or more investment companies in the BNY Mellon Family of Funds since at least 1957, but we are unable to determine the specific year.
New York, New York
October 27, 2020
31
IMPORTANT TAX INFORMATION (Unaudited)
The fund hereby reports $6.8131 per share as a long-term capital gain distribution paid on December 10, 2019.
32
INFORMATION ABOUT THE RENEWAL OF THE FUND'S MANAGEMENT AGREEMENT (Unaudited)
At a meeting of the fund’s Board of Directors held on July 28, 2020, the Board considered the renewal of the fund’s Management Agreement pursuant to which the Adviser provides the fund with investment advisory and administrative services (the “Agreement”). The Board members, none of whom are “interested persons” (as defined in the Investment Company Act of 1940, as amended) of the fund, were assisted in their review by independent legal counsel and met with counsel in executive session separate from representatives of the Adviser. In considering the renewal of the Agreement, the Board considered several factors that it believed to be relevant, including those discussed below. The Board did not identify any one factor as dispositive, and each Board member may have attributed different weights to the factors considered.
Analysis of Nature, Extent, and Quality of Services Provided to the Fund. The Board considered information provided to it at the meeting and in previous presentations from representatives of the Adviser regarding the nature, extent, and quality of the services provided to funds in the BNY Mellon fund complex, including the fund. The Adviser provided the number of open accounts in the fund, the fund’s asset size and the allocation of fund assets among distribution channels. The Adviser also had previously provided information regarding the diverse intermediary relationships and distribution channels of funds in the BNY Mellon fund complex (such as retail direct or intermediary, in which intermediaries typically are paid by the fund and/or the Adviser) and the Adviser’s corresponding need for broad, deep, and diverse resources to be able to provide ongoing shareholder services to each intermediary or distribution channel, as applicable to the fund.
The Board also considered research support available to, and portfolio management capabilities of, the fund’s portfolio management personnel and that the Adviser also provides oversight of day-to-day fund operations, including fund accounting and administration and assistance in meeting legal and regulatory requirements. The Board also considered the Adviser’s extensive administrative, accounting and compliance infrastructures. The Board also considered portfolio management’s brokerage policies and practices (including policies and practices regarding soft dollars) and the standards applied in seeking best execution.
Comparative Analysis of the Fund’s Performance and Management Fee and Expense Ratio. The Board reviewed reports prepared by Broadridge Financial Solutions, Inc. (“Broadridge”), an independent provider of investment company data based on classifications provided by Thomson Reuters Lipper, which included information comparing (1) the performance of the fund’s Class I shares with the performance of a group of institutional science and technology funds selected by Broadridge as comparable to the fund (the “Performance Group”) and with a broader group of funds consisting of all retail and institutional science and technology funds (the “Performance Universe”), all for various periods ended June 30, 2020, and (2) the fund’s actual and contractual management fees and total expenses with those of the same group of funds in the Performance Group (the “Expense Group”) and with a broader group of all institutional science and technology funds, excluding outliers (the “Expense Universe”),
33
INFORMATION ABOUT THE RENEWAL OF THE FUND'S MANAGEMENT AGREEMENT (Unaudited) (continued)
the information for which was derived in part from fund financial statements available to Broadridge as of the date of its analysis. The Adviser previously had furnished the Board with a description of the methodology Broadridge used to select the Performance Group and Performance Universe and the Expense Group and Expense Universe.
Performance Comparisons. Representatives of the Adviser stated that the usefulness of performance comparisons may be affected by a number of factors, including different investment limitations and policies that may be applicable to the fund and comparison funds and the end date selected. The Board discussed with representatives of the Adviser the results of the comparisons and considered that the fund’s total return performance was above the Performance Group median for the six-month and one-year periods, and above the Performance Universe median for the six-month and one- and three-year periods, and below the Performance Group and Performance Universe median(s) for all other periods. The Adviser also provided a comparison of the fund’s calendar year total returns to the returns of the fund’s benchmark index.
Management Fee and Expense Ratio Comparisons. The Board reviewed and considered the contractual management fee rate payable by the fund to the Adviser in light of the nature, extent and quality of the management services provided by the Adviser. In addition, the Board reviewed and considered the actual management fee rate paid by the fund over the fund’s last fiscal year. The Board also reviewed the range of actual and contractual management fees and total expenses as a percentage of average net assets of the Expense Group and Expense Universe funds and discussed the results of the comparisons. The Board considered that the fund’s contractual management fee was equal to the Expense Group median contractual management fee, the fund’s actual management fee was less than one basis point above the Expense Group median and lower than the Expense Universe median actual management fee and the fund’s total expenses were less than one basis point above the Expense Group and Expense Universe total expenses medians.
Representatives of the Adviser noted that there were no other funds advised or administered by the Adviser that are in the same Lipper category as the fund or separate accounts and/or other types of client portfolios advised by the Adviser that are considered to have similar investment strategies and policies as the fund.
Analysis of Profitability and Economies of Scale. Representatives of the Adviser reviewed the expenses allocated and profit received by the Adviser and its affiliates and the resulting profitability percentage for managing the fund and the aggregate profitability percentage to the Adviser and its affiliates for managing the funds in the BNY Mellon fund complex, and the method used to determine the expenses and profit. The Board concluded that the profitability results were not excessive, given the services rendered and service levels provided by the Adviser and its affiliates. The Board also had been provided with information prepared by an independent consulting firm regarding the Adviser’s approach to allocating costs to, and determining the profitability of, individual funds and the entire BNY Mellon fund complex. The consulting firm also had analyzed where any economies of scale might emerge in connection with the management of a fund.
34
The Board considered, on the advice of its counsel, the profitability analysis (1) as part of its evaluation of whether the fees under the Agreement, considered in relation to the mix of services provided by the Adviser, including the nature, extent and quality of such services, supported the renewal of the Agreement and (2) in light of the relevant circumstances for the fund and the extent to which economies of scale would be realized if the fund grows and whether fee levels reflect these economies of scale for the benefit of fund shareholders. Representatives of the Adviser stated that a discussion of economies of scale is predicated on a fund having achieved a substantial size with increasing assets and that, if a fund’s assets had been stable or decreasing, the possibility that the Adviser may have realized any economies of scale would be less. Representatives of the Adviser also stated that, as a result of shared and allocated costs among funds in the BNY Mellon fund complex, the extent of economies of scale could depend substantially on the level of assets in the complex as a whole, so that increases and decreases in complex-wide assets can affect potential economies of scale in a manner that is disproportionate to, or even in the opposite direction from, changes in the fund’s asset level. The Board also considered potential benefits to the Adviser from acting as investment adviser and took into consideration the soft dollar arrangements in effect for trading the fund’s investments.
At the conclusion of these discussions, the Board agreed that it had been furnished with sufficient information to make an informed business decision with respect to the renewal of the Agreement. Based on the discussions and considerations as described above, the Board concluded and determined as follows.
· The Board concluded that the nature, extent and quality of the services provided by the Adviser are adequate and appropriate.
· The Board generally was satisfied with the fund’s improved performance.
· The Board concluded that the fee paid to the Adviser continued to be appropriate under the circumstances and in light of the factors and the totality of the services provided as discussed above, subject to review no later than the next renewal consideration.
· The Board determined that the economies of scale which may accrue to the Adviser and its affiliates in connection with the management of the fund had been adequately considered by the Adviser in connection with the fee rate charged to the fund pursuant to the Agreement and that, to the extent in the future it were determined that material economies of scale had not been shared with the fund, the Board would seek to have those economies of scale shared with the fund.
In evaluating the Agreement, the Board considered these conclusions and determinations and also relied on its previous knowledge, gained through meetings and other interactions with the Adviser and its affiliates, of the Adviser and the services provided to the fund by the Adviser. The Board also relied on information received on a routine and regular basis throughout the year relating to the operations of the fund and the investment management and other services provided under the Agreement,
35
INFORMATION ABOUT THE RENEWAL OF THE FUND'S MANAGEMENT AGREEMENT (Unaudited) (continued)
including information on the investment performance of the fund in comparison to similar mutual funds and benchmark performance indices; general market outlook as applicable to the fund; and compliance reports. In addition, the Board’s consideration of the contractual fee arrangements for the fund had the benefit of a number of years of reviews of the Agreement for the fund, or substantially similar agreements for other BNY Mellon funds that the Board oversees, during which lengthy discussions took place between the Board and representatives of the Adviser. Certain aspects of the arrangements may receive greater scrutiny in some years than in others, and the Board’s conclusions may be based, in part, on their consideration of the fund’s arrangements, or substantially similar arrangements for other BNY Mellon funds that the Board oversees, in prior years. The Board determined to renew the Agreement for the remainder of the one-year term.
36
LIQUIDITY RISK MANAGEMENT PROGRAM (Unaudited)
Effective June 1, 2019, the fund adopted a liquidity risk management program (the “Liquidity Risk Management Program”) pursuant to the requirements of Rule 22e-4 under the Investment Company Act of 1940, as amended. Rule 22e-4 requires registered open-end funds, including mutual funds and exchange-traded funds but not money market funds, to establish liquidity risk management programs in order to effectively manage fund liquidity and shareholder redemptions. The rule is designed to mitigate the risk that a fund could not meet redemption requests without significantly diluting the interests of remaining investors.
The rule requires the funds to assess, manage and review their liquidity risk at least annually considering applicable factors such as investment strategy and liquidity during normal and foreseeable stressed conditions, including whether the strategy is appropriate for an open-end fund and whether the fund has a relatively concentrated portfolio or large positions in particular issuers. The fund must also assess its use of borrowings and derivatives, short-term and long-term cash flow projections in normal and stressed conditions, holdings of cash and cash equivalents, and borrowing arrangements and other funding sources.
The rule also requires the fund to classify its investments as highly liquid, moderately liquid, less liquid or illiquid based on the number of days the fund expects it would take to liquidate the investment, and to review these classifications at least monthly or more often under certain conditions. The periods range from three or fewer business days for a highly liquid investment to greater than seven calendar days for settlement of a less liquid investment. Illiquid investments are those a fund does not expect to be able to sell or dispose of within seven calendar days without significantly changing the market value. The fund is prohibited from acquiring an investment if, after the acquisition, its holdings of illiquid assets will exceed 15% of its net assets. In addition, if a fund permits redemptions in-kind, the rule requires the fund to establish redemption in-kind policies and procedures governing how and when it will engage in such redemptions.
Pursuant to the rule’s requirements, the Liquidity Risk Management Program has been reviewed and approved by the fund’s board. Furthermore, the board has received a written report prepared by the Program’s Administrator that addresses the operation of the Program, assesses its adequacy and effectiveness and describes any material changes made to the Program.
Assessment of Program
In the opinion of the Program Administrator, the Program approved by the fund board continues to be adequate for the fund and the Program has been implemented effectively. The Program Administrator has monitored the fund’s liquidity risk and the liquidity classification of the securities held by the fund and has determined that the Program is operating effectively.
During the period from June 1, 2019 to March 31, 2020, there were no material changes to the Program and no material liquidity events that impacted the fund. During the period, the fund held sufficient highly liquid assets to meet fund redemptions.
37
LIQUIDITY RISK MANAGEMENT PROGRAM (Unaudited) (continued)
Under normal expected foreseeable fund redemption forecasts and foreseeable stressed fund redemption forecasts, the Program Administrator believes that the fund maintains sufficient highly liquid assets to meet expected fund redemptions.
38
BOARD MEMBERS INFORMATION (Unaudited)
INDEPENDENT BOARD MEMBERS
Joseph S. DiMartino (76)
Chairman of the Board (1995)
Principal Occupation During Past 5 Years:
· Director or Trustee of funds in the BNY Mellon Family of Funds and certain other entities (as described in the fund’s Statement of Additional Information) (1995-Present)
Other Public Company Board Memberships During Past 5 Years:
· CBIZ, Inc., a public company providing professional business services, products and solutions, Director (1997-Present)
No. of Portfolios for which Board Member Serves: 111
———————
Peggy C. Davis (77)
Board Member (2006)
Principal Occupation During Past 5 Years:
· Shad Professor of Law, New York University School of Law (1983-present)
No. of Portfolios for which Board Member Serves: 39
———————
Gina D. France (62)
Board Member (2019)
Principal Occupation During Past 5 Years:
· Founder, President and Chief Executive Officer, France Strategic Partners, a strategy and advisory firm serving corporate clients across the United States (2003 –Present)
· Corporate Director and Trustee (2004 – Present)
Other Public Company Board Memberships During Past 5 Years:
· Huntington Bancshares, a bank holding company headquartered in Columbus, Ohio, Director (2016 – Present)
· Cedar Fair, L.P., a publicly-traded partnership that owns and operates amusement parks and hotels in the U.S. and Canada, Director (2011 – Present)
· CBIZ, Inc., a public company providing professional business services, products and solutions, Director (2015 – Present)
· Baldwin Wallace University, Trustee (2013- 2019)
· FirstMerit Corporation, a diversified financial services company, Director (2004 – 2016)
No. of Portfolios for which Board Member Serves: 25
———————
39
BOARD MEMBERS INFORMATION (Unaudited) (continued)
INDEPENDENT BOARD MEMBERS (continued)
Joan Gulley (72)
Board Member (2017)
Principal Occupation During Past 5 Years:
· PNC Financial Services Group, Inc.(1993-2014), Executive Vice President and Chief Human Resources Officer and Executive Committee Member (2008-2014)
· Director, Nantucket Library (2015-Present)
No. of Portfolios for which Board Member Serves: 44
———————
Robin A. Melvin (56)
Board Member (2012)
Principal Occupation During Past 5 Years:
· Co-chairman, Mentor Illinois, a non-profit organization dedicated to increasing the quantity and quality of mentoring services in Illinois; (2014-Present); Board member (2013-Present)
No. of Portfolios for which Board Member Serves: 89
———————
Once elected all Board Members serve for an indefinite term, but achieve Emeritus status upon reaching age 80. The address of the Board Members and Officers is c/o BNY Mellon Investment Adviser, Inc. 240 Greenwich Street, New York, New York 10286. Additional information about the Board Members is available in the fund’s Statement of Additional Information which can be obtained from the Adviser free of charge by calling this toll free number: 1-800-373-9387.
David P. Feldman, Emeritus Board Member
James F. Henry, Emeritus Board Member
Ehud Houminer, Emeritus Board Member
Lynn Martin, Emeritus Board Member
Dr. Martin Peretz, Emeritus Board Member
Philip L. Toia, Emeritus Board Member
40
OFFICERS OF THE FUND (Unaudited)
RENEE LAROCHE-MORRIS, President since May 2019.
President and a director of BNY Mellon Investment Adviser, Inc. since January 2018. She is an officer of 62 investment companies (comprised of 111 portfolios) managed by the Adviser. She is 49 years old and has been an employee of BNY Mellon since 2003.
JAMES WINDELS, Treasurer since November 2001.
Director-BNY Mellon Fund Administration, and an officer of 64 investment companies (comprised of 142 portfolios) managed by the Adviser or an affiliate of the Adviser. He is 61 years old and has been an employee of the Adviser since April 1985.
BENNETT A. MACDOUGALL, Chief Legal Officer since October 2015.
Chief Legal Officer of the Adviser and Associate General Counsel and Managing Director of BNY Mellon since June 2015; Director and Associate General Counsel of Deutsche Bank–Asset & Wealth Management Division from June 2005 to June 2015, and as Chief Legal Officer of Deutsche Investment Management Americas Inc. from June 2012 to May 2015. He is an officer of 64 investment companies (comprised of 142 portfolios) managed by the Adviser or an affiliate of the Adviser. He is 48 years old and has been an employee of the Adviser since June 2015.
DAVID DIPETRILLO, Vice President since May 2019.
Head of North America Product, BNY Mellon Investment Management since January 2018, Director of Product Strategy, BNY Mellon Investment Management from January 2016 to December 2017; Head of US Retail Product and Channel Marketing, BNY Mellon Investment Management from January 2014 to December 2015. He is an officer of 63 investment companies (comprised of 119 portfolios) managed by the Adviser or an affiliate of the Adviser. He is 42 years old and has been an employee of BNY Mellon since 2005.
JAMES BITETTO, Vice President since August 2005 and Secretary since February 2018.
Senior Managing Counsel of BNY Mellon since December 2019; Managing Counsel of BNY Mellon from April 2014 to December 2019; Secretary of the Adviser, and an officer of 64 investment companies (comprised of 142 portfolios) managed by the Adviser or an affiliate of the Adviser. He is 54 years old and has been an employee of the Adviser since December 1996.
SONALEE CROSS, Vice President and Assistant Secretary since March 2018.
Counsel of BNY Mellon since October 2016; Associate at Proskauer Rose LLP from April 2016 to September 2016; Attorney at EnTrust Capital from August 2015 to February 2016; Associate at Sidley Austin LLP from September 2013 to August 2015. She is an officer of 64 investment companies (comprised of 142 portfolios) managed by the Adviser or an affiliate of the Adviser. She is 32 years old and has been an employee of the Adviser since October 2016.
DEIRDRE CUNNANE, Vice President and Assistant Secretary since March 2019.
Counsel of BNY Mellon since August 2018; Senior Regulatory Specialist at BNY Mellon Investment Management Services from February 2016 to August 2018; Trustee Associate at BNY Mellon Trust Company (Ireland) Limited from August 2013 to February 2016. She is an officer of 64 investment companies (comprised of 142 portfolios) managed by the Adviser or an affiliate of the Adviser. She is 30 years old and has been an employee of the Adviser since August 2018.
SARAH S. KELLEHER, Vice President and Assistant Secretary since April 2014.
Managing Counsel of BNY Mellon since December 2017, Senior Counsel of BNY Mellon from March 2013 to December 2017. She is an officer of 64 investment companies (comprised of 142 portfolios) managed by the Adviser or an affiliate of the Adviser. She is 44 years old and has been an employee of the Adviser since March 2013.
JEFF PRUSNOFSKY, Vice President and Assistant Secretary since August 2005.
Senior Managing Counsel of BNY Mellon, and an officer of 64 investment companies (comprised of 142 portfolios) managed by the Adviser or an affiliate of the Adviser. He is 55 years old and has been an employee of the Adviser since October 1990.
AMANDA QUINN, Vice President and Assistant Secretary since March 2020.
Counsel of BNY Mellon since June 2019; Regulatory Administration Manager at BNY Mellon Investment Management Services from September 2018 to May 2019; Senior Regulatory Specialist at BNY Mellon Investment Management Services from April 2015 to August 2018. She is an officer of 64 investment companies (comprised of 142 portfolios) managed by the Adviser or an affiliate of the Adviser. She is 35 years old and has been an employee of the Adviser since June 2019.
41
OFFICERS OF THE FUND (Unaudited) (continued)
PETER M. SULLIVAN, Vice President and Assistant Secretary since March 2019.
Managing Counsel of BNY Mellon since March 2009, Senior Counsel of BNY Mellon from April 2004 to March 2009, and an officer of 64 investment companies (comprised of 142 portfolios) managed by the Adviser or an affiliate of the Adviser. He is 52 years old and has been an employee of the Adviser since January 2019.
NATALYA ZELENSKY, Vice President and Assistant Secretary since March 2017.
Managing Counsel of BNY Mellon since December 2019; Counsel of BNY Mellon from May 2016 to December 2019; Attorney at Wildermuth Endowment Strategy Fund/Wildermuth Advisory, LLC from November 2015 to May 2016 and Assistant General Counsel at RCS Advisory Services from July 2014 to November 2015. She is an officer of 64 investment companies (comprised of 142 portfolios) managed by the Adviser or an affiliate of the Adviser. She is 35 years old and has been an employee of the Adviser since May 2016.
GAVIN C. REILLY, Assistant Treasurer since December 2005.
Tax Manager-BNY Mellon Fund Administration, and an officer of 64 investment companies (comprised of 142 portfolios) managed by the Adviser or an affiliate of the Adviser. He is 52 years old and has been an employee of the Adviser since April 1991.
ROBERT S. ROBOL, Assistant Treasurer since August 2005.
Senior Accounting Manager-BNY Mellon Fund Administration, and an officer of 64 investment companies (comprised of 142 portfolios) managed by the Adviser or an affiliate of the Adviser. He is 56 years old and has been an employee of the Adviser since October 1988.
ROBERT SALVIOLO, Assistant Treasurer since July 2007.
Senior Accounting Manager–BNY Mellon Fund Administration, and an officer of 64 investment companies (comprised of 142 portfolios) managed by the Adviser or an affiliate of the Adviser. He is 53 years old and has been an employee of the Adviser since June 1989.
ROBERT SVAGNA, Assistant Treasurer since December 2002.
Senior Accounting Manager–BNY Mellon Fund Administration, and an officer of 64 investment companies (comprised of 142 portfolios) managed by the Adviser or an affiliate of the Adviser. He is 53 years old and has been an employee of the Adviser since November 1990.
JOSEPH W. CONNOLLY, Chief Compliance Officer since October 2004.
Chief Compliance Officer of the Adviser, the BNY Mellon Family of Funds and BNY Mellon Funds Trust (63 investment companies, comprised of 134 portfolios). He is 63 years old and has served in various capacities with the Adviser since 1980, including manager of the firm’s Fund Accounting Department from 1997 through October 2001.
CARIDAD M. CAROSELLA, Anti-Money Laundering Compliance Officer since January 2016.
Anti-Money Laundering Compliance Officer of the BNY Mellon Family of Funds and BNY Mellon Funds Trust since January 2016; from May 2015 to December 2015, Interim Anti-Money Laundering Compliance Officer of the BNY Mellon Family of Funds and BNY Mellon Funds Trust and the Distributor; from January 2012 to May 2015, AML Surveillance Officer of the Distributor. She is an officer of 57 investment companies (comprised of 135 portfolios) managed by the Adviser or an affiliate of the Adviser. She is 52 years old and has been an employee of the Distributor since 1997.
42
This page intentionally left blank.
43
This page intentionally left blank.
44
This page intentionally left blank.
45
BNY Mellon Technology Growth Fund
240 Greenwich Street
New York, NY 10286
Adviser
BNY Mellon Investment Adviser, Inc.
240 Greenwich Street
New York, NY 10286
Custodian
The Bank of New York Mellon
240 Greenwich Street
New York, NY 10286
Transfer Agent &
Dividend Disbursing Agent
BNY Mellon Transfer, Inc.
240 Greenwich Street
New York, NY 10286
Distributor
BNY Mellon Securities Corporation
240 Greenwich Street
New York, NY 10286
| | |
Ticker Symbols: | Class A: DTGRX Class C: DTGCX Class I: DGVRX Class Y: DTEYX |
Telephone Call your financial representative or 1-800-373-9387
Mail The BNY Mellon Family of Funds, 144 Glenn Curtiss Boulevard, Uniondale, NY 11556-0144
E-mail Send your request to info@bnymellon.com
Internet Information can be viewed online or downloaded at www.bnymellonim.com/us
The fund files its complete schedule of portfolio holdings with the Securities and Exchange Commission (“SEC”) for the first and third quarters of each fiscal year on Form N-PORT. The fund’s Forms N-PORT are available on the SEC’s website at www.sec.gov.
A description of the policies and procedures that the fund uses to determine how to vote proxies relating to portfolio securities and information regarding how the fund voted these proxies for the most recent 12-month period ended June 30 is available at www.bnymellonim.com/us and on the SEC’s website at www.sec.gov and without charge, upon request, by calling 1-800-373-9387.
| | |
© 2020 BNY Mellon Securities Corporation
0255AR0820 | 
|
Item 2. Code of Ethics.
The Registrant has adopted a code of ethics that applies to the Registrant's principal executive officer, principal financial officer, principal accounting officer or controller, or persons performing similar functions. There have been no amendments to, or waivers in connection with, the Code of Ethics during the period covered by this Report.
Item 3. Audit Committee Financial Expert.
The Registrant's Board has determined that Joseph DiMartino, a member of the Audit Committee of the Board, is an audit committee financial expert as defined by the Securities and Exchange Commission (the "SEC"). Mr. DiMartino is "independent" as defined by the SEC for purposes of audit committee financial expert determinations.
Item 4. Principal Accountant Fees and Services.
(a) Audit Fees. The aggregate fees billed for each of the last two fiscal years (the "Reporting Periods") for professional services rendered by the Registrant's principal accountant (the "Auditor") for the audit of the Registrant's annual financial statements or services that are normally provided by the Auditor in connection with the statutory and regulatory filings or engagements for the Reporting Periods, were $181,690 in 2019 and $174,265 in 2020.
(b) Audit-Related Fees. The aggregate fees billed in the Reporting Periods for assurance and related services by the Auditor that are reasonably related to the performance of the audit of the Registrant's financial statements and are not reported under paragraph (a) of this Item 4 were $35,776 in 2019 and $35,333 in 2020. These services consisted of one or more of the following: (i) agreed upon procedures related to compliance with Internal Revenue Code section 817(h), (ii) security counts required by Rule 17f-2 under the Investment Company Act of 1940, as amended, (iii) advisory services as to the accounting or disclosure treatment of Registrant transactions or events and (iv) advisory services to the accounting or disclosure treatment of the actual or potential impact to the Registrant of final or proposed rules, standards or interpretations by the Securities and Exchange Commission, the Financial Accounting Standards Boards or other regulatory or standard-setting bodies.
The aggregate fees billed in the Reporting Periods for non-audit assurance and related services by the Auditor to the Registrant's investment adviser (not including any sub-investment adviser whose role is primarily portfolio management and is subcontracted with or overseen by another investment adviser), and any entity controlling, controlled by or under common control with the investment adviser that provides ongoing services to the Registrant ("Service Affiliates"), that were reasonably related to the performance of the annual audit of the Service Affiliate, which required pre-approval by the Audit Committee were $0 in 2019 and $0 in 2020.
(c) Tax Fees. The aggregate fees billed in the Reporting Periods for professional services rendered by the Auditor for tax compliance, tax advice, and tax planning ("Tax Services") were $17,271 in 2019 and $13,078 in 2020. These services consisted of: (i) review or preparation of U.S. federal, state, local and excise tax returns; (ii) U.S. federal, state and local tax planning, advice and assistance regarding statutory, regulatory or administrative developments; (iii) tax advice regarding tax qualification matters and/or treatment of various financial instruments held or proposed to be acquired or held, and (iv) determination of Passive Foreign Investment Companies. The aggregate fees billed in the Reporting Periods for Tax Services by the Auditor to Service Affiliates, which required pre-approval by the Audit Committee were $0 in 2019 and $0 in 2020.
(d) All Other Fees. The aggregate fees billed in the Reporting Periods for products and services provided by the Auditor, other than the services reported in paragraphs (a) through (c) of this Item, were $9,291 in 2019 and $0 in 2020. These services consisted of a review of the Registrant's anti-money laundering program.
The aggregate fees billed in the Reporting Periods for Non-Audit Services by the Auditor to Service Affiliates, other than the services reported in paragraphs (b) through (c) of this Item, which required pre-approval by the Audit Committee, were $0 in 2019 and $0 in 2020.
(e)(1) Audit Committee Pre-Approval Policies and Procedures. The Registrant's Audit Committee has established policies and procedures (the "Policy") for pre-approval (within specified fee limits) of the Auditor's engagements for non-audit services to the Registrant and Service Affiliates without specific case-by-case consideration. The pre-approved services in the Policy can include pre-approved audit services, pre-approved audit-related services, pre-approved tax services and pre-approved all other services. Pre-approval considerations include whether the proposed services are compatible with maintaining the Auditor's independence. Pre-approvals pursuant to the Policy are considered annually.
(e)(2) Note. None of the services described in paragraphs (b) through (d) of this Item 4 were approved by the Audit Committee pursuant to paragraph (c)(7)(i)(C) of Rule 2-01 of Regulation S-X.
(f) None of the hours expended on the principal accountant's engagement to audit the registrant's financial statements for the most recent fiscal year were attributed to work performed by persons other than the principal accountant's full-time, permanent employees.
Non-Audit Fees. The aggregate non-audit fees billed by the Auditor for services rendered to the Registrant, and rendered to Service Affiliates, for the Reporting Periods were $811,865 in 2019 and $671,818 in 2020.
Auditor Independence. The Registrant's Audit Committee has considered whether the provision of non-audit services that were rendered to Service Affiliates, which were not pre-approved (not requiring pre-approval), is compatible with maintaining the Auditor's independence.
Item 5. Audit Committee of Listed Registrants.
Not applicable.
Item 6. Investments.
(a) Not applicable.
Item 7. Disclosure of Proxy Voting Policies and Procedures for Closed-End Management Investment Companies.
Not applicable.
Item 8. Portfolio Managers of Closed-End Management Investment Companies.
Not applicable.
Item 9. Purchases of Equity Securities by Closed-End Management Investment Companies and Affiliated Purchasers.
Not applicable.
Item 10. Submission of Matters to a Vote of Security Holders.
There have been no material changes to the procedures applicable to Item 10.
Item 11. Controls and Procedures.
(a) The Registrant's principal executive and principal financial officers have concluded, based on their evaluation of the Registrant's disclosure controls and procedures as of a date within 90 days of the filing date of this report, that the Registrant's disclosure controls and procedures are reasonably designed to ensure that information required to be disclosed by the Registrant on Form N-CSR is recorded, processed, summarized and reported within the required time periods and that information required to be disclosed by the Registrant in the reports that it files or submits on Form N-CSR is accumulated and communicated to the Registrant's management, including its principal executive and principal financial officers, as appropriate to allow timely decisions regarding required disclosure.
(b) There were no changes to the Registrant's internal control over financial reporting that occurred during the second fiscal quarter of the period covered by this report that have materially affected, or are reasonably likely to materially affect, the Registrant's internal control over financial reporting.
Item 12. Disclosure of Securities Lending Activities for Closed-End Management Investment Companies.
Not applicable.
Item 13. Exhibits.
(a)(1) Code of ethics referred to in Item 2.
(a)(2) Certifications of principal executive and principal financial officers as required by Rule 30a-2(a) under the Investment Company Act of 1940.
(a)(3) Not applicable.
(b) Certification of principal executive and principal financial officers as required by Rule 30a-2(b) under the Investment Company Act of 1940.
SIGNATURES
Pursuant to the requirements of the Securities Exchange Act of 1934 and the Investment Company Act of 1940, the Registrant has duly caused this Report to be signed on its behalf by the undersigned, thereunto duly authorized.
BNY Mellon Advantage Funds, Inc.
By: /s/ Renee LaRoche-Morris
Renee LaRoche-Morris
President (Principal Executive Officer)
Date: October 26, 2020
Pursuant to the requirements of the Securities Exchange Act of 1934 and the Investment Company Act of 1940, this Report has been signed below by the following persons on behalf of the Registrant and in the capacities and on the dates indicated.
By: /s/ Renee LaRoche-Morris
Renee LaRoche-Morris
President (Principal Executive Officer)
Date: October 26, 2020
By: /s/ James Windels
James Windels
Treasurer (Principal Financial Officer)
Date: October 26, 2020
EXHIBIT INDEX
(a)(1) Code of ethics referred to in Item 2.
(a)(2) Certifications of principal executive and principal financial officers as required by Rule 30a-2(a) under the Investment Company Act of 1940. (EX-99.CERT)
(b) Certification of principal executive and principal financial officers as required by Rule 30a-2(b) under the Investment Company Act of 1940. (EX-99.906CERT)


