UNITED STATES
SECURITIES AND EXCHANGE COMMISSION
Washington, D.C. 20549
FORM N-CSR
CERTIFIED SHAREHOLDER REPORT OF REGISTERED MANAGEMENT
INVESTMENT COMPANIES
| Investment Company Act file number | 811-07123 |
| | |
| | BNY Mellon Advantage Funds, Inc. | |
| | (Exact name of Registrant as specified in charter) | |
| | | |
| | c/o BNY Mellon Investment Adviser, Inc. 240 Greenwich Street New York, New York 10286 | |
| | (Address of principal executive offices) (Zip code) | |
| | | |
| | Deirdre Cunnane, Esq. 240 Greenwich Street New York, New York 10286 | |
| | (Name and address of agent for service) | |
| |
| Registrant's telephone number, including area code: | (212) 922-6400 |
| | |
Date of fiscal year end: | 10/31 | |
| Date of reporting period: | 10/31/2021 | |
| | | | | | | |
The following N-CSR relates only to the Registrant's series listed below and does not relate to any series of the Registrant with a different fiscal year end and, therefore, different N-CSR reporting requirements. A separate N-CSR will be filed for any series with a different fiscal year end, as appropriate.
BNY Mellon Dynamic Total Return Fund
BNY Mellon Global Dynamic Bond Income Fund
BNY Mellon Global Real Return Fund
BNY Mellon Sustainable Balanced Fund
FORM N-CSR
Item 1. Reports to Stockholders.
BNY Mellon Dynamic Total Return Fund
| |
ANNUAL REPORT October 31, 2021 |
| |
Save time. Save paper. View your next shareholder report online as soon as it’s available. Log into www.im.bnymellon.com and sign up for eCommunications. It’s simple and only takes a few minutes. |
| |
The views expressed in this report reflect those of the portfolio manager(s) only through the end of the period covered and do not necessarily represent the views of BNY Mellon Investment Adviser, Inc. or any other person in the BNY Mellon Investment Adviser, Inc. organization. Any such views are subject to change at any time based upon market or other conditions and BNY Mellon Investment Adviser, Inc. disclaims any responsibility to update such views. These views may not be relied on as investment advice and, because investment decisions for a fund in the BNY Mellon Family of Funds are based on numerous factors, may not be relied on as an indication of trading intent on behalf of any fund in the BNY Mellon Family of Funds. |
| |
Not FDIC-Insured • Not Bank-Guaranteed • May Lose Value |
Contents
THE FUND
FOR MORE INFORMATION
Back Cover
DISCUSSION OF FUND PERFORMANCE (Unaudited)
For the period from November 1, 2020 through October 31, 2021, as provided by portfolio managers Dimitri Curtil, Vassilis Dagioglu, James Stavena and Torrey Zaches of Newton Investment Management North America, LLC, Sub-Investment Adviser
Market and Fund Performance Overview
For the 12-month period ended October 31, 2021, the BNY Mellon Dynamic Total Return Fund’s Class A shares produced a total return of 13.79%, Class C shares returned 12.93%, Class I shares returned 14.02% and Class Y shares returned 14.05%.1 In comparison, the FTSE Three-Month U.S. Treasury Bill Index, the MSCI World Index, and an index comprised of 60% MSCI World Index and 40% FTSE World Government Bond Index (the “Hybrid Index”) returned 0.05%, 40.42% and 21.18%, respectively.2,3,4,5
The main event over the reporting period has been the economic recovery after the pandemic-related lockdown that started in March 2020. The increase in vaccinations and more effective treatments have led to greater economic openings and recovery.
The fund has navigated the aftereffects of the lockdown and subsequent recovery reasonably well. The fund re-risked and maintained a growth exposure of 53% over the period. Global equity earnings recovered strongly, moving from declines of -20% or more at the height of the pandemic in the second quarter of 2020 to growth of more than 20%, especially in the U.S., where earning rose by 25%. Earnings are now substantially higher than before the pandemic.
In some respects, the equity market recovery was ahead of the overall economic recovery by several quarters. Global equities were up over 40% over the period. In the U.S., the S&P 500 Index was up a staggering 42.91%. The big winners have been large-cap technology stocks, commonly referred to as FAANGM (Facebook, Amazon, Apple, Netflix, Google, Microsoft), growing to comprise 26% of the S&P 500. However, we are starting to see greater differentiation within FAANGM, with both Apple and Amazon providing lower guidance and lower valuations. There is also a broader recovery in cyclical and less-favored value stocks.
The Fund’s Investment Approach
The fund seeks total return. To pursue its goal, the fund normally invests in instruments that provide investment exposure to global equity, bond, currency and commodity markets, and in fixed-income securities. The fund may invest in instruments that provide economic exposure to developed and, to a limited extent, emerging-debt and equity markets.
The fund will seek to achieve investment exposure primarily through long and short positions in futures, options, forward contracts, swap agreements or exchange-traded funds (ETFs) and normally will use economic leverage as part of its investment strategy. The fund also may invest in fixed-income securities, such as bonds, notes (including structured notes) and money market instruments, including foreign government obligations and securities of supranational entities, to provide exposure to bond markets and for liquidity and income, as well as hold cash.
The fund’s portfolio managers apply a systematic investment approach designed to identify and exploit relative misevaluations across and within global capital markets. The portfolio
2
managers update, monitor and follow buy or sell recommendations using proprietary investment models. Among equity markets, the portfolio managers employ a bottom-up valuation approach using proprietary models to derive market-level expected returns. For bond markets, the portfolio managers use proprietary models to identify temporary mispricing among global bond markets. For currency markets, the portfolio managers evaluate currencies on a relative valuation basis and overweight exposure to currencies that are undervalued. For commodities, the portfolio managers seek to identify opportunities in commodity markets by measuring and evaluating inventory and term structure, hedging and speculative activity, as well as momentum.
Equity Rally Continues Despite Stubbornly High Inflation
Other than a brief correction in September 2021, global equities trended positively throughout the period. Not only were earnings recovering from pandemic-related lockdowns, but companies with a significant online strategy benefited from increased operational leverage. Many of these technology plays experienced top-line sales growth in the 20-40% range, amply supporting the earnings growth story.
Both loose monetary policy and significant fiscal stimulus also supported a broader and more sustained recovery than they did in the aftermath of the Great Financial Crisis (GFC). The Federal Reserve (the “Fed”) also announced a change in its inflation policy, raising the target rate from an upper limit of 2% to an average of 2%, allowing inflation to run at a higher rate for some time. The Fed wants to avoid a situation in which it has no policy leeway during a recession. In other words, the Fed prefers high average nominal rates of growth so that it can cut interest rates in the event of an extended recession.
The economy is still running at less than its capacity; gross domestic product is below its pre-pandemic potential by 1-2%. However, workers are sitting on the sidelines, with U.S. labor participation stuck at an unusually low 62%. Just 10 years ago, this rate was as high as 67%. Thus, some inflation may be necessary to encourage workers to re-enter the labor force and to incentivize a clearing of supply bottlenecks.
Strong Fund Performance
The fund delivered a strong positive total return during the reporting period. Equities provided a large portion (17.78%) of the return, however, several other exposures were also positive. We entered a credit exposure, specifically to the BBB rated segment, which contributed positively (0.66%). We also increased exposure to commodities in response to higher inflation, which was also positive (1.31%). We also complemented the equity exposure with an allocation to U.S. small-cap stocks and maintained some upside exposure through out-of-the-money equity call options.
Within equities, the exposure to U.S. equities contributed positively (8.55%). In the UK, both the long and short exposure to equities was strongly positive (5.71%) as well as a long position in German equities (1.99%). Within bonds, the other top contributor was a short UK Gilt position (2.14%) and a short Bunds position (2.03%), offset by long U.S. Treasuries (-2.44%) and a long position in Australian government bonds (-3.61%), which detracted.
Among the other strategies, most were positive contributors over the period, with the exception of active currency (-1.52%). The active commodity strategy (1.31%), small cap
3
DISCUSSION OF FUND PERFORMANCE (Unaudited) (continued)
(0.33%), U.S. high yield (0.66%) and active volatility (0.33%) were up over the period, while emerging market equities were flat (0.00%).
The story, however, is the equity recovery from the bottom in April 2020 to new highs in 2021. All the equity positions combined contributed well over 10% to the fund’s returns during the period, with the overweight to U.S. equities the most significant positive contribution.
Over this period, we trailed the fund’s benchmarks, with MSCI World gaining 40.42% and the Hybrid Index gaining 21.18%. However, the fund finished ahead of the long-term annual return of 6%. We trailed the equity-centric portion of the Hybrid Index in large part due to our cautious growth and equity weight during the equity market’s recovery. We felt this was warranted given the uncertain nature of the global pandemic, the new vaccines and the virulent variants.
We believe the recovery will continue, but inflation has remained stubbornly high, and the Fed’s decision to tighten monetary conditions will give investors some uncertainty, particularly in the bond market.
Looking Forward: Inflation Worries
Headline inflation in the U.S. has remained stubbornly high, in excess of 5%. The Fed’s original forecast was for inflation to be high initially due mainly to base effects (i.e., the fact that prices were unusually low a year ago). However, supply bottlenecks kept U.S. inflation high, mainly through food and energy price increases but also through prices for durable goods. Another secondary source has been the rental-equivalent cost, which measures housing inflation. Looking forward, there is the likelihood that sustained wage inflation could be the next leg in the inflation catalyst. The bottom line is that U.S. headline inflation is likely to be higher than the Fed’s original forecast and more sustained, persisting until at least the end of 2022.
This inflation path will likely lead to an earlier-than-expected Fed rate increase in 2022, making bonds less attractive and pushing yields higher. It remains to be seen if this inflation will impact equities. We could see a rotation from “long-duration” growth equities to more cyclical and value equities. Commodities remain one of the better liquid hedges to inflation, and we anticipate continuing to hold commodities in the portfolio for this reason.
We believe the Dynamic Total Return fund continues to play a useful role in investor portfolios, striking a balance between positive returns provided by risky growth exposure and the loss-avoiding exposures that preserve capital during a crisis. The lockdown and subsequent recovery has been a rollercoaster ride for many. Nevertheless, with strong earnings growth this year and relatively high economic growth expected, we are very positive on future prospects. However, we continue to monitor developments regarding inflation and the knock-on effects to the equity/bond correlation. We do not expect runaway inflation, but expect that headline inflation will remain above 2% until at least the end of 2022. We
4
look forward to the remainder of 2021 to both add returns in times of growth and preserve capital as monetary conditions tighten.
November 15, 2021
1 Total return includes reinvestment of dividends and any capital gains paid and does not take into consideration the maximum initial sales charge in the case of Class A shares, or the applicable contingent deferred sales charge imposed on redemptions in the case of Class C shares. Had these charges been reflected, returns would have been lower. Share price, yield and investment return fluctuate such that upon redemption, fund shares may be worth more or less than their original cost. Past performance is no guarantee of future results. The fund’s returns reflect the absorption of certain fund expenses by BNY Mellon Investment Adviser pursuant to an agreement in effect through March 1, 2022, at which time it may be extended, terminated, or modified.
2 Source: Lipper Inc. — Reflects reinvestment of net dividends and, where applicable, capital gain distributions. The MSCI World Index is a free float-adjusted, market capitalization-weighted index that is designed to measure the equity market performance of developed markets. Investors cannot invest directly in any index.
3 Source: Lipper Inc. — The FTSE Three-Month U.S. Treasury Bill Index consists of the last three-month Treasury bill month-end rates. The FTSE Three-Month U.S. Treasury Bill Index measures return equivalents of yield averages. The instruments are not marked to market. Investors cannot invest directly in any index.
4 Source: Lipper Inc. — The FTSE World Government Bond Index (the “WGB Index”) measures the performance of fixed-rate, local-currency, investment-grade sovereign bonds. The WGB Index is a widely used benchmark that currently comprises sovereign debt from over 20 countries, denominated in a variety of currencies, and has more than 25 years of history available. The WGB Index provides a broad benchmark for the global sovereign, fixed-income market. Investors cannot invest directly in any index.
5 Source: FactSet —The Hybrid Index is an unmanaged hybrid index composed of 60% MSCI World Index and 40% WGB Index. Investors cannot invest directly in any index.
Equities are subject generally to market, market sector, market liquidity, issuer and investment style risks, among other factors, to varying degrees, all of which are more fully described in the fund’s prospectus.
Bonds are subject generally to interest-rate, credit, liquidity, call, sector and market risks, to varying degrees, all of which are more fully described in the fund’s prospectus.
Investing internationally involves special risks, including changes in currency exchange rates, political, economic, and social instability, a lack of comprehensive company information, differing auditing and legal standards and less market liquidity. These risks generally are greater with emerging-market countries than with more economically and politically established foreign countries.
The fund may, but is not required to, use derivative instruments. A small investment in derivatives could have a potentially large impact on the fund’s performance. The use of derivatives involves risks different from, or possibly greater than, the risks associated with investing directly in the underlying assets.
Emerging markets tend to be more volatile than the markets of more mature economies and generally have less diverse and less mature economic structures and less stable political systems than those of developed countries. The securities of companies located in emerging markets are often subject to rapid and large changes in price. An investment in this fund should be considered only as a supplement to a complete investment program for those investors willing to accept the greater risks associated with investing in emerging-market countries.
Recent market risks include pandemic risks related to COVID-19. The effects of COVID-19 have contributed to increased volatility in global markets and will likely affect certain countries, companies, industries and market sectors more dramatically than others. To the extent the fund may overweight its investments in certain countries, companies, industries or market sectors, such positions will increase the fund’s exposure to risk of loss from adverse developments affecting those countries, companies, industries or sectors.
5
FUND PERFORMANCE (Unaudited)

Comparison of change in value of a $10,000 investment in Class A shares, Class C shares and Class I shares of BNY Mellon Dynamic Total Return Fund with a hypothetical investment of $10,000 in the MSCI World Index, FTSE Three-Month U.S. Treasury Bill Index and an index comprised of 60% MSCI World Index and 40% FTSE World Government Bond Index (the “Hybrid Index”).
† Source: FactSet
†† Source: Lipper Inc.
Past performance is not predictive of future performance.
The above graph compares a hypothetical investment of $10,000 made in each of the Class A shares, Class C shares and Class I shares of BNY Mellon Dynamic Total Return Fund on 10/31/11 to a hypothetical investment of $10,000 made on that date in each of the following: MSCI World Index, FTSE Three-Month U.S. Treasury Bill Index and the Hybrid Index. Returns assume all dividends and capital gain distributions are reinvested.
The fund’s performance shown in the line graph above takes into account the maximum initial sales charge on Class A shares and all other applicable fees and expenses on all classes. The MSCI World Index is a free float‐adjusted market capitalization-weighted index that is designed to measure the equity market performance of developed markets. The FTSE Three-Month U.S. Treasury Bill Index consists of the last three-month Treasury bill month-end rates. The FTSE Three-Month U.S. Treasury Bill Index measures returns equivalent of yield averages. The instruments are not marked to market. The FTSE World Government Bond Index (the “WGB Index”) measures the performance of fixed-rate, local currency, investment-grade sovereign bonds. The WGB Index is a widely used benchmark that currently comprises sovereign debt from over 20 countries, denominated in a variety of currencies, and has more than 25 years of history available. The WGB Index provides a broad benchmark for the global sovereign fixed income market. Unlike a mutual fund, the indices are not subject to charges, fees and other expenses. Investors cannot invest directly in any index. Further information relating to fund performance, including expense reimbursements, if applicable, is contained in the Financial Highlights section of the prospectus and elsewhere in this report.
6

Comparison of change in value of a $1,000,000 investment in Class Y shares of BNY Mellon Dynamic Total Return Fund with a hypothetical investment of $1,000,000 in the MSCI World Index, FTSE Three-Month U.S. Treasury Bill Index and an index comprised of 60% MSCI World Index and 40% FTSE World Government Bond Index (the “Hybrid Index”).
† Source: FactSet
†† Source: Lipper Inc.
††† The total return figures presented for Class Y shares of the fund reflect the performance of the fund’s Class A shares for the period prior to 7/1/13 (inception date for Class Y shares), not reflecting the applicable sales charges for Class A shares.
Past performance is not predictive of future performance.
The above graph compares a hypothetical investment of $1,000,000 made in Class Y shares of BNY Mellon Dynamic Total Return Fund on 10/31/11 to a hypothetical investment of $1,000,000 made on that date in each of the following: MSCI World Index, FTSE Three-Month U.S. Treasury Bill Index and the Hybrid Index. Returns assume all dividends and capital gain distributions are reinvested.
The fund’s performance shown in the line graph above takes into account all applicable fees and expenses of the fund’s Class Y shares. The MSCI World Index is a free float‐adjusted market capitalization-weighted index that is designed to measure the equity market performance of developed markets. The FTSE Three-Month U.S. Treasury Bill Index consists of the last three-month Treasury bill month-end rates. The FTSE Three-Month U.S. Treasury Bill Index measures returns equivalent of yield averages. The instruments are not marked to market. The FTSE World Government Bond Index (the “WGB Index”) measures the performance of fixed-rate, local currency, investment-grade sovereign bonds. The WGB Index is a widely used benchmark that currently comprises sovereign debt from over 20 countries, denominated in a variety of currencies, and has more than 25 years of history available. The WGB Index provides a broad benchmark for the global sovereign fixed income market. Unlike a mutual fund, the indices are not subject to charges, fees and other expenses. Investors cannot invest directly in any index. Further information relating to fund performance, including expense reimbursements, if applicable, is contained in the Financial Highlights section of the prospectus and elsewhere in this report.
7
FUND PERFORMANCE (Unaudited) (continued)
| | | | | |
Average Annual Total Returns as of 10/31/2021 |
| | Inception | | | |
| | Date | 1 Year | 5 Years | 10 Years |
Class A shares | | | | |
with maximum sales charge (5.75%) | 5/2/06 | 7.27% | 3.41% | 4.71% |
without sales charge | 5/2/06 | 13.79% | 4.64% | 5.34% |
Class C shares | | | | |
with applicable redemption charge † | 5/2/06 | 11.93% | 3.86% | 4.55% |
without redemption | 5/2/06 | 12.93% | 3.86% | 4.55% |
Class I shares | 5/2/06 | 14.02% | 4.89% | 5.63% |
Class Y shares | 7/1/13 | 14.05% | 4.94% | 5.73%†† |
MSCI World Index | | 40.42% | 15.45% | 12.19% |
FTSE Three-Month U.S. Treasury Bill Index | 0.05% | 1.12% | 0.60% |
Hybrid Index | | 21.18% | 10.18% | 7.80% |
† The maximum contingent deferred sales charge for Class C shares is 1% for shares redeemed within one year of the date of purchase.
†† The total return performance figures presented for Class Y shares of the fund reflect the performance of the fund’s Class A shares for the period prior to 7/1/13 (inception date for Class Y shares), not reflecting the applicable sales charges for class A shares.
The performance data quoted represents past performance, which is no guarantee of future results. Share price and investment return fluctuate and an investor’s shares may be worth more or less than original cost upon redemption. Current performance may be lower or higher than the performance quoted. Go to www.im.bnymellon.com for the fund’s most recent month-end returns.
The fund’s performance shown in the graphs and table does not reflect the deduction of taxes that a shareholder would pay on fund distributions or the redemption of fund shares. In addition to the performance of Class A shares shown with and without a maximum sales charge, the fund’s performance shown in the table takes into account all other applicable fees and expenses on all classes.
8
UNDERSTANDING YOUR FUND’S EXPENSES (Unaudited)
As a mutual fund investor, you pay ongoing expenses, such as management fees and other expenses. Using the information below, you can estimate how these expenses affect your investment and compare them with the expenses of other funds. You also may pay one-time transaction expenses, including sales charges (loads) and redemption fees, which are not shown in this section and would have resulted in higher total expenses. For more information, see your fund’s prospectus or talk to your financial adviser.
Review your fund’s expenses
The table below shows the expenses you would have paid on a $1,000 investment in BNY Mellon Dynamic Total Return Fund from May 1, 2021 to October 31, 2021. It also shows how much a $1,000 investment would be worth at the close of the period, assuming actual returns and expenses.
| | | | | | | |
Expenses and Value of a $1,000 Investment | |
Assume actual returns for the six months ended October 31, 2021 | |
| | | | | | |
| | Class A | Class C | Class I | Class Y | |
Expenses paid per $1,000† | $7.29 | $11.17 | $5.99 | $5.99 | |
Ending value (after expenses) | $1,065.10 | $1,061.10 | $1,066.10 | $1,066.90 | |
COMPARING YOUR FUND’S EXPENSES
WITH THOSE OF OTHER FUNDS (Unaudited)
Using the SEC’s method to compare expenses
The Securities and Exchange Commission (“SEC”) has established guidelines to help investors assess fund expenses. Per these guidelines, the table below shows your fund’s expenses based on a $1,000 investment, assuming a hypothetical 5% annualized return. You can use this information to compare the ongoing expenses (but not transaction expenses or total cost) of investing in the fund with those of other funds. All mutual fund shareholder reports will provide this information to help you make this comparison. Please note that you cannot use this information to estimate your actual ending account balance and expenses paid during the period.
| | | | | | | |
Expenses and Value of a $1,000 Investment | |
Assuming a hypothetical 5% annualized return for the six months ended October 31, 2021 | |
| | | | | | |
| | Class A | Class C | Class I | Class Y | |
Expenses paid per $1,000† | $7.12 | $10.92 | $5.85 | $5.85 | |
Ending value (after expenses) | $1,018.15 | $1,014.37 | $1,019.41 | $1,019.41 | |
† | Expenses are equal to the fund’s annualized expense ratio of 1.40% for Class A, 2.15% for Class C, 1.15% for Class I and 1.15% for Class Y, multiplied by the average account value over the period, multiplied by 184/365 (to reflect the one-half year period). |
9
CONSOLIDATED STATEMENT OF INVESTMENTS
October 31, 2021
| | | | | | | | | | |
| |
Description/
Number of Contracts | Exercise
Price | | Expiration
Date | | Notional Amount ($) | | Value ($) | |
Options Purchased - .5% | | | | | |
Call Options - .3% | | | | | |
Standard & Poor's 500 E-mini End of Month Options December Future, Contracts 309 | | 4,600 | | 11/30/2021 | | 71,070,000 | | 996,525 | |
Put Options - .2% | | | | | |
Standard & Poor's 500 E-mini 3rd Week March Future, Contracts 142 | | 4,340 | | 1/21/2022 | | 30,814,000 | | 500,550 | |
Standard & Poor's 500 E-mini End of Month Options December Future, Contracts 150 | | 4,270 | | 11/30/2021 | | 32,025,000 | | 121,875 | |
| | 622,425 | |
Total Options Purchased
(cost $2,199,918) | | 1,618,950 | |
| | Annualized
Yield (%) | | Maturity Date | | Principal Amount ($) | | | |
Short-Term Investments - 85.9% | | | | | |
U.S. Government Securities | | | | | |
U.S. Treasury Bills | | 0.18 | | 11/18/2021 | | 85,888,400 | a | 85,886,575 | |
U.S. Treasury Bills | | 0.11 | | 12/16/2021 | | 76,197,500 | a,b | 76,190,594 | |
U.S. Treasury Bills | | 0.09 | | 12/30/2021 | | 86,596,100 | a | 86,584,748 | |
U.S. Treasury Bills | | 0.20 | | 5/19/2022 | | 24,358,000 | a | 24,348,911 | |
Total Short-Term Investments
(cost $273,021,243) | | 273,010,828 | |
| | 1-Day
Yield (%) | | | | Shares | | | |
Investment Companies - 12.3% | | | | | |
Registered Investment Companies - 12.3% | | | | | |
Dreyfus Institutional Preferred Government Plus Money Market Fund, Institutional Shares
(cost $39,021,299) | | 0.06 | | | | 39,021,299 | c | 39,021,299 | |
Total Investments (cost $314,242,460) | | 98.7% | 313,651,077 | |
Cash and Receivables (Net) | | 1.3% | 4,272,149 | |
Net Assets | | 100.0% | 317,923,226 | |
a Security is a discount security. Income is recognized through the accretion of discount.
b These securities are wholly-owned by the Subsidiary referenced in Note 1.
c Investment in affiliated issuer. The investment objective of this investment company is publicly available and can be found within the investment company’s prospectus.
10
| | |
Portfolio Summary (Unaudited) † | Value (%) |
Government | 85.9 |
Investment Companies | 12.3 |
Options Purchased | .5 |
| | 98.7 |
† Based on net assets.
See notes to consolidated financial statements.
11
CONSOLIDATED STATEMENT OF INVESTMENTS IN AFFILIATED ISSUERS
| | | | | | | |
Investment Companies | Value
10/31/20 ($) | Purchases ($)† | Sales ($) | Value
10/31/21 ($) | Net
Assets (%) | Dividends/
Distributions ($) |
Registered Investment Companies; |
Dreyfus Institutional Preferred Government Plus Money Market Fund, Institutional Shares | 33,701,726 | 337,499,640 | (332,180,067) | 39,021,299 | 12.3 | 24,842 |
† Includes reinvested dividends/distributions.
See notes to consolidated financial statements.
12
CONSOLIDATED STATEMENT OF FUTURES
October 31, 2021
| | | | | | | |
Description | Number of
Contracts | Expiration | Notional
Value ($) | Market
Value ($) | Unrealized Appreciation (Depreciation) ($) | |
Futures Long | | |
Amsterdam Exchange Index | 22 | 11/19/2021 | 4,083,687a | 4,113,473 | 29,786 | |
Australian 10 Year Bond | 668 | 12/15/2021 | 71,072,784a | 67,763,223 | (3,309,561) | |
Brent Crude | 12 | 2/28/2022 | 975,537b | 965,400 | (10,137) | |
CAC 40 10 Euro | 302 | 11/19/2021 | 22,944,907a | 23,832,131 | 887,224 | |
Canadian 10 Year Bond | 349 | 12/20/2021 | 40,306,898a | 39,747,536 | (559,362) | |
Cocoa | 33 | 3/16/2022 | 898,110b | 851,400 | (46,710) | |
Copper | 2 | 12/29/2021 | 212,148b | 218,400 | 6,252 | |
Corn No. 2 Yellow | 37 | 3/14/2022 | 1,010,213b | 1,066,063 | 55,850 | |
Cotton No. 2 | 27 | 3/9/2022 | 1,352,745b | 1,501,470 | 148,725 | |
Crude Oil | 16 | 2/22/2022 | 1,258,277b | 1,255,360 | (2,917) | |
DAX | 22 | 12/17/2021 | 9,661,680a | 9,959,171 | 297,491 | |
E-mini Russell 2000 | 76 | 12/17/2021 | 8,446,307 | 8,722,140 | 275,833 | |
FTSE 100 | 328 | 12/17/2021 | 31,762,031a | 32,427,409 | 665,378 | |
FTSE/MIB Index | 30 | 12/17/2021 | 4,563,567a | 4,637,930 | 74,363 | |
Gasoline | 17 | 2/28/2022 | 1,687,677b | 1,637,845 | (49,832) | |
Gold 100 oz | 16 | 12/29/2021 | 2,857,456b | 2,854,240 | (3,216) | |
Hard Red Winter Wheat | 31 | 3/14/2022 | 1,191,913b | 1,222,950 | 31,037 | |
Japanese 10 Year Bond | 54 | 12/13/2021 | 71,687,624a | 71,693,617 | 5,993 | |
Live Cattle | 4 | 2/28/2022 | 213,130b | 214,760 | 1,630 | |
LME Primary Aluminum | 5 | 3/16/2022 | 361,952b | 339,406 | (22,546) | |
LME Primary Nickel | 1 | 3/16/2022 | 107,481b | 116,436 | 8,955 | |
LME Refined Pig Lead | 1 | 3/16/2022 | 53,591b | 59,188 | 5,597 | |
LME Zinc | 2 | 3/16/2022 | 151,631b | 167,500 | 15,869 | |
Low Sulphur Gas Oil | 24 | 3/10/2022 | 1,661,460b | 1,659,600 | (1,860) | |
Mini MSCI Emerging Markets Index | 104 | 12/17/2021 | 6,762,823 | 6,562,400 | (200,423) | |
Natural Gas | 14 | 2/24/2022 | 751,111b | 720,300 | (30,811) | |
NY Harbor ULSD | 7 | 2/28/2022 | 727,551b | 707,893 | (19,658) | |
Platinum | 29 | 1/27/2022 | 1,456,439b | 1,480,015 | 23,576 | |
Soybean Meal | 8 | 3/14/2022 | 261,450b | 265,120 | 3,670 | |
Standard & Poor's 500 E-mini | 276 | 12/17/2021 | 61,513,585 | 63,438,600 | 1,925,015 | |
Topix | 175 | 12/9/2021 | 30,793,846a | 30,593,332 | (200,514) | |
U.S. Treasury 10 Year Notes | 1,051 | 12/21/2021 | 137,971,405 | 137,368,990 | (602,415) | |
Futures Short | | |
ASX SPI 200 | 143 | 12/16/2021 | 19,616,012a | 19,578,059 | 37,953 | |
Chicago SRW Wheat | 58 | 3/14/2022 | 2,208,246b | 2,276,500 | (68,254) | |
13
CONSOLIDATED STATEMENT OF FUTURES (continued)
| | | | | | | |
Description | Number of
Contracts | Expiration | Notional
Value ($) | Market
Value ($) | Unrealized Appreciation (Depreciation) ($) | |
Futures Short (continued) | | |
Coffee "C" | 4 | 3/21/2022 | 305,011b | 309,975 | (4,964) | |
Crude Soybean Oil | 5 | 3/14/2022 | 182,274b | 181,320 | 954 | |
Euro-Bond | 287 | 12/8/2021 | 56,970,019a | 55,777,509 | 1,192,510 | |
Hang Seng | 40 | 11/29/2021 | 6,675,441a | 6,504,466 | 170,975 | |
IBEX 35 Index | 35 | 11/19/2021 | 3,614,426a | 3,659,850 | (45,424) | |
Lean Hog | 4 | 2/14/2022 | 122,475b | 125,880 | (3,405) | |
Long Gilt | 417 | 12/29/2021 | 71,058,988a | 71,290,014 | (231,026) | |
NYMEX Palladium | 2 | 12/29/2021 | 375,605b | 396,060 | (20,455) | |
S&P/Toronto Stock Exchange 60 Index | 11 | 12/16/2021 | 2,248,448a | 2,240,708 | 7,740 | |
Soybean | 37 | 3/14/2022 | 2,302,910b | 2,329,150 | (26,240) | |
Sugar No. 11 | 52 | 2/28/2022 | 1,152,488b | 1,122,285 | 30,203 | |
Swiss Market Index | 79 | 12/17/2021 | 10,208,949a | 10,434,109 | (225,160) | |
Gross Unrealized Appreciation | | 5,902,579 | |
Gross Unrealized Depreciation | | (5,684,890) | |
a Notional amounts in foreign currency have been converted to USD using relevant foreign exchange rates.
b These securities are wholly-owned by the Subsidiary referenced in Note 1.
See notes to consolidated financial statements.
14
CONSOLIDATED STATEMENT OF OPTIONS WRITTEN
October 31, 2021
| | | | | | | |
Description/ Contracts/ Counterparties | Exercise Price | Expiration Date | Notional Amount | | Value ($) | |
Put Options: | | | | | | |
Standard & Poor's 500 E-mini 3rd Week March Future,
Contracts 284 | 3,870 | 1/21/2022 | 54,954,000 | | (362,100) | |
Total Options Written (premiums received $405,035) | | | | (362,100) | |
See notes to consolidated financial statements.
15
CONSOLIDATED STATEMENT OF FORWARD FOREIGN CURRENCY EXCHANGE CONTRACTS October 31, 2021
| | | | | | |
Counterparty/ Purchased
Currency | Purchased Currency
Amounts | Currency
Sold | Sold
Currency
Amounts | Settlement Date | Unrealized Appreciation (Depreciation) ($) |
Citigroup |
United States Dollar | 1,174,847 | Swedish Krona | 10,144,000 | 12/15/2021 | (7,164) |
British Pound | 13,846,651 | United States Dollar | 19,008,010 | 12/15/2021 | (54,470) |
United States Dollar | 17,655,291 | British Pound | 12,842,000 | 12/15/2021 | 76,935 |
Swiss Franc | 1,858,000 | United States Dollar | 2,013,634 | 12/15/2021 | 18,533 |
Euro | 4,339,000 | United States Dollar | 5,103,627 | 12/15/2021 | (81,833) |
United States Dollar | 18,645,914 | Euro | 16,015,000 | 12/15/2021 | 110,759 |
Japanese Yen | 1,618,032,000 | United States Dollar | 14,500,427 | 12/15/2021 | (296,084) |
United States Dollar | 969,381 | Japanese Yen | 109,806,000 | 12/15/2021 | 5,419 |
Swiss Franc | 1,011,000 | United States Dollar | 1,092,732 | 12/15/2021 | 13,038 |
United States Dollar | 466,575 | Swiss Franc | 427,000 | 12/15/2021 | (452) |
Canadian Dollar | 13,651,000 | United States Dollar | 10,938,695 | 12/15/2021 | 92,546 |
New Zealand Dollar | 2,391,000 | United States Dollar | 1,717,007 | 12/15/2021 | (4,876) |
United States Dollar | 12,828,542 | New Zealand Dollar | 18,264,000 | 12/15/2021 | (249,819) |
Norwegian Krone | 15,377,000 | United States Dollar | 1,781,221 | 12/15/2021 | 38,344 |
United States Dollar | 540,816 | Norwegian Krone | 4,507,000 | 12/15/2021 | 7,501 |
Australian Dollar | 7,776,000 | United States Dollar | 5,747,665 | 12/15/2021 | 102,909 |
United States Dollar | 224,036 | Australian Dollar | 304,000 | 12/15/2021 | (4,690) |
Goldman Sachs |
New Zealand Dollar | 15,787,000 | United States Dollar | 11,113,684 | 12/15/2021 | 190,964 |
United States Dollar | 883,613 | New Zealand Dollar | 1,264,000 | 12/15/2021 | (21,504) |
Euro | 2,661,000 | United States Dollar | 3,139,706 | 12/15/2021 | (59,965) |
United States Dollar | 5,193,518 | Euro | 4,457,000 | 12/15/2021 | 35,155 |
United States Dollar | 3,653,950 | Euro | 3,146,000 | 12/15/2021 | 12,889 |
16
| | | | | | |
Counterparty/ Purchased
Currency | Purchased Currency
Amounts | Currency
Sold | Sold
Currency
Amounts | Settlement Date | Unrealized Appreciation (Depreciation) ($) |
Goldman Sachs(continued) |
Japanese Yen | 1,136,420,000 | United States Dollar | 10,226,915 | 12/15/2021 | (250,536) |
United States Dollar | 20,377,349 | Japanese Yen | 2,249,514,985 | 12/15/2021 | 629,357 |
Swiss Franc | 2,664,000 | United States Dollar | 2,895,628 | 12/15/2021 | 18,092 |
Norwegian Krone | 21,058,000 | United States Dollar | 2,428,810 | 12/15/2021 | 62,990 |
United States Dollar | 3,188,680 | Norwegian Krone | 27,296,000 | 12/15/2021 | (41,264) |
Australian Dollar | 2,441,000 | United States Dollar | 1,754,118 | 12/15/2021 | 82,463 |
United States Dollar | 36,294,869 | Australian Dollar | 49,219,874 | 12/15/2021 | (737,606) |
British Pound | 2,041,000 | United States Dollar | 2,801,436 | 12/15/2021 | (7,679) |
United States Dollar | 15,207,142 | British Pound | 11,066,000 | 12/15/2021 | 59,806 |
Swedish Krona | 9,259,000 | United States Dollar | 1,064,547 | 12/15/2021 | 14,341 |
United States Dollar | 875,586 | Swedish Krona | 7,695,000 | 12/15/2021 | (21,060) |
Canadian Dollar | 2,496,000 | United States Dollar | 1,958,269 | 12/15/2021 | 58,725 |
United States Dollar | 2,203,050 | Canadian Dollar | 2,726,000 | 12/15/2021 | 196 |
HSBC |
Swedish Krona | 16,199,000 | United States Dollar | 1,849,032 | 12/15/2021 | 38,526 |
Canadian Dollar | 5,222,000 | United States Dollar | 4,176,825 | 12/15/2021 | 43,023 |
Japanese Yen | 905,660,000 | United States Dollar | 8,109,821 | 12/15/2021 | (159,233) |
Norwegian Krone | 111,672,218 | United States Dollar | 12,786,842 | 12/15/2021 | 427,367 |
United States Dollar | 1,079,283 | Norwegian Krone | 9,085,000 | 12/15/2021 | 4,252 |
Swiss Franc | 925,000 | United States Dollar | 996,461 | 12/15/2021 | 15,247 |
New Zealand Dollar | 807,000 | United States Dollar | 559,953 | 12/15/2021 | 17,918 |
United States Dollar | 7,332,501 | New Zealand Dollar | 10,349,183 | 12/15/2021 | (78,272) |
Australian Dollar | 1,341,000 | United States Dollar | 981,169 | 12/15/2021 | 27,784 |
Euro | 19,148,635 | United States Dollar | 22,601,664 | 12/15/2021 | (439,758) |
United States Dollar | 8,120,724 | Euro | 7,001,000 | 12/15/2021 | 18,031 |
17
CONSOLIDATED STATEMENT OF FORWARD FOREIGN CURRENCY EXCHANGE CONTRACTS (continued)
| | | | | | |
Counterparty/ Purchased
Currency | Purchased Currency
Amounts | Currency
Sold | Sold
Currency
Amounts | Settlement Date | Unrealized Appreciation (Depreciation) ($) |
HSBC(continued) |
United States Dollar | 8,142,287 | British Pound | 5,966,000 | 12/15/2021 | (24,079) |
Morgan Stanley |
United States Dollar | 4,044,281 | Euro | 3,501,000 | 12/15/2021 | (7,644) |
Swedish Krona | 131,080,085 | United States Dollar | 15,220,244 | 12/15/2021 | 53,620 |
United States Dollar | 1,106,587 | Japanese Yen | 125,708,000 | 12/15/2021 | 3,024 |
Swiss Franc | 403,000 | United States Dollar | 434,085 | 12/15/2021 | 6,692 |
British Pound | 1,173,000 | United States Dollar | 1,590,557 | 12/15/2021 | 15,066 |
RBC Capital Markets |
United States Dollar | 12,000,647 | Canadian Dollar | 15,294,513 | 12/15/2021 | (358,701) |
Standard Chartered Bank |
United States Dollar | 565,071 | British Pound | 419,000 | 12/15/2021 | (8,464) |
Swiss Franc | 17,919,559 | United States Dollar | 19,482,844 | 12/15/2021 | 116,475 |
Japanese Yen | 293,721,000 | United States Dollar | 2,679,965 | 12/15/2021 | (101,454) |
Canadian Dollar | 1,467,000 | United States Dollar | 1,156,076 | 12/15/2021 | 29,393 |
United States Dollar | 7,299,520 | Euro | 6,279,000 | 12/15/2021 | 32,443 |
United States Dollar | 870,433 | Swedish Krona | 7,514,000 | 12/15/2021 | (5,122) |
Gross Unrealized Appreciation | | | 2,479,823 |
Gross Unrealized Depreciation | | | (3,021,729) |
See notes to consolidated financial statements.
18
CONSOLIDATED STATEMENT OF ASSETS AND LIABILITIES
October 31, 2021
| | | | | | | |
| | | | | | |
| | | Cost | | Value | |
Assets ($): | | | | |
Investments in securities—See Consolidated Statement of Investments | | | |
Unaffiliated issuers | 275,221,161 | | 274,629,778 | |
Affiliated issuers | | 39,021,299 | | 39,021,299 | |
Cash | | | | | 3,845,739 | |
Cash denominated in foreign currency | | | 465,449 | | 464,603 | |
Unrealized appreciation on forward foreign
currency exchange contracts—Note 4 | | 2,479,823 | |
Cash collateral held by broker—Note 4 | | 2,394,199 | |
Receivable for shares of Common Stock subscribed | | 96,856 | |
Dividends receivable | | 1,954 | |
Prepaid expenses | | | | | 36,943 | |
| | | | | 322,971,194 | |
Liabilities ($): | | | | |
Due to BNY Mellon Investment Adviser, Inc. and affiliates—Note 3(c) | | 283,903 | |
Unrealized depreciation on forward foreign
currency exchange contracts—Note 4 | | 3,021,729 | |
Payable for shares of Common Stock redeemed | | 710,675 | |
Payable for futures variation margin—Note 4 | | 534,722 | |
Outstanding options written, at value
(premiums received $405,035)—Note 4 | | 362,100 | |
Directors’ fees and expenses payable | | 19,250 | |
Other accrued expenses | | | | | 115,589 | |
| | | | | 5,047,968 | |
Net Assets ($) | | | 317,923,226 | |
Composition of Net Assets ($): | | | | |
Paid-in capital | | | | | 283,924,258 | |
Total distributable earnings (loss) | | | | | 33,998,968 | |
Net Assets ($) | | | 317,923,226 | |
| | | | | | |
Net Asset Value Per Share | Class A | Class C | Class I | Class Y | |
Net Assets ($) | 38,354,224 | 16,334,181 | 141,383,596 | 121,851,225 | |
Shares Outstanding | 2,132,743 | 989,712 | 7,626,784 | 6,585,090 | |
Net Asset Value Per Share ($) | 17.98 | 16.50 | 18.54 | 18.50 | |
| | | | | |
See notes to consolidated financial statements. | | | | | |
19
CONSOLIDATED STATEMENT OF OPERATIONS
Year Ended October 31, 2021
| | | | | | | |
| | | | | | |
| | | | | | |
Investment Income ($): | | | | |
Income: | | | | |
Interest | | | 1,090,934 | |
Dividends from affiliated issuers | | | 24,842 | |
Total Income | | | 1,115,776 | |
Expenses: | | | | |
Management fee—Note 3(a) | | | 4,114,790 | |
Shareholder servicing costs—Note 3(c) | | | 321,984 | |
Subsidiary management fee—Note 3(a) | | | 205,776 | |
Distribution fees—Note 3(b) | | | 149,490 | |
Professional fees | | | 143,060 | |
Registration fees | | | 71,981 | |
Prospectus and shareholders’ reports | | | 49,526 | |
Directors’ fees and expenses—Note 3(d) | | | 33,203 | |
Custodian fees—Note 3(c) | | | 16,685 | |
Chief Compliance Officer fees—Note 3(c) | | | 14,062 | |
Loan commitment fees—Note 2 | | | 12,085 | |
Miscellaneous | | | 39,309 | |
Total Expenses | | | 5,171,951 | |
Less—reduction in expenses due to undertaking—Note 3(a) | | | (517,497) | |
Net Expenses | | | 4,654,454 | |
Investment (Loss)—Net | | | (3,538,678) | |
Realized and Unrealized Gain (Loss) on Investments—Note 4 ($): | | |
Net realized gain (loss) on investments and foreign currency transactions | 6,232,171 | |
Net realized gain (loss) on futures | 46,167,997 | |
Net realized gain (loss) on options transactions | 1,078,007 | |
Net realized gain (loss) on forward foreign currency exchange contracts | (4,698,572) | |
Net Realized Gain (Loss) | | | 48,779,603 | |
Net change in unrealized appreciation (depreciation) on investments
and foreign currency transactions | (3,226,456) | |
Net change in unrealized appreciation (depreciation) on futures | 12,614,191 | |
Net change in unrealized appreciation (depreciation) on
options transactions | (1,669,531) | |
Net change in unrealized appreciation (depreciation) on
forward foreign currency exchange contracts | (1,637,291) | |
Net Change in Unrealized Appreciation (Depreciation) | | | 6,080,913 | |
Net Realized and Unrealized Gain (Loss) on Investments | | | 54,860,516 | |
Net Increase in Net Assets Resulting from Operations | | 51,321,838 | |
| | | | | | |
See notes to consolidated financial statements. | | | | | |
20
CONSOLIDATED STATEMENT OF CHANGES IN NET ASSETS
| | | | | | | | | | |
| | | | Year Ended October 31, |
| | | | 2021 | | 2020 | |
Operations ($): | | | | | | | | |
Investment income (loss)—net | | | (3,538,678) | | | | 822,653 | |
Net realized gain (loss) on investments | | 48,779,603 | | | | 9,601,200 | |
Net change in unrealized appreciation
(depreciation) on investments | | 6,080,913 | | | | (9,354,219) | |
Net Increase (Decrease) in Net Assets
Resulting from Operations | 51,321,838 | | | | 1,069,634 | |
Distributions ($): | |
Distributions to shareholders: | | | | | | | | |
Class A | | | - | | | | (1,173,298) | |
Class C | | | - | | | | (764,108) | |
Class I | | | - | | | | (10,458,201) | |
Class Y | | | - | | | | (18,608,979) | |
Total Distributions | | | - | | | | (31,004,586) | |
Capital Stock Transactions ($): | |
Net proceeds from shares sold: | | | | | | | | |
Class A | | | 5,745,871 | | | | 8,707,854 | |
Class C | | | 266,084 | | | | 784,893 | |
Class I | | | 34,565,477 | | | | 49,194,073 | |
Class Y | | | 5,109,784 | | | | 29,963,103 | |
Distributions reinvested: | | | | | | | | |
Class A | | | - | | | | 1,034,501 | |
Class C | | | - | | | | 639,905 | |
Class I | | | - | | | | 9,177,640 | |
Class Y | | | - | | | | 7,468,482 | |
Cost of shares redeemed: | | | | | | | | |
Class A | | | (7,102,212) | | | | (11,802,115) | |
Class C | | | (8,965,935) | | | | (9,725,038) | |
Class I | | | (83,483,341) | | | | (204,998,518) | |
Class Y | | | (145,730,889) | | | | (343,915,965) | |
Increase (Decrease) in Net Assets
from Capital Stock Transactions | (199,595,161) | | | | (463,471,185) | |
Total Increase (Decrease) in Net Assets | (148,273,323) | | | | (493,406,137) | |
Net Assets ($): | |
Beginning of Period | | | 466,196,549 | | | | 959,602,686 | |
End of Period | | | 317,923,226 | | | | 466,196,549 | |
21
CONSOLIDATED STATEMENT OF CHANGES IN NET ASSETS (continued)
| | | | | | | | | | |
| | | | Year Ended October 31, |
| | | | 2021 | | 2020 | |
Capital Share Transactions (Shares): | |
Class Aa,b | | | | | | | | |
Shares sold | | | 334,928 | | | | 556,989 | |
Shares issued for distributions reinvested | | | - | | | | 64,295 | |
Shares redeemed | | | (418,968) | | | | (747,234) | |
Net Increase (Decrease) in Shares Outstanding | (84,040) | | | | (125,950) | |
Class Ca,b | | | | | | | | |
Shares sold | | | 16,641 | | | | 53,501 | |
Shares issued for distributions reinvested | | | - | | | | 42,746 | |
Shares redeemed | | | (568,980) | | | | (664,437) | |
Net Increase (Decrease) in Shares Outstanding | (552,339) | | | | (568,190) | |
Class Ib | | | | | | | | |
Shares sold | | | 1,965,293 | | | | 3,033,576 | |
Shares issued for distributions reinvested | | | - | | | | 555,884 | |
Shares redeemed | | | (4,761,687) | | | | (12,606,500) | |
Net Increase (Decrease) in Shares Outstanding | (2,796,394) | | | | (9,017,040) | |
Class Yb | | | | | | | | |
Shares sold | | | 292,371 | | | | 1,853,635 | |
Shares issued for distributions reinvested | | | - | | | | 453,460 | |
Shares redeemed | | | (8,443,227) | | | | (21,421,708) | |
Net Increase (Decrease) in Shares Outstanding | (8,150,856) | | | | (19,114,613) | |
| | | | | | | | | |
a | During the period ended October 31, 2021, 31 Class C shares representing $482 were automatically converted to 29 Class A shares and during the period ended October 31, 2020 .42 Class C shares representing $6 were automatically converted to .39 Class A shares. | |
b | During the period ended October 31, 2021, 180,047 Class Y shares representing $3,164,338 were exchanged for 179,705 Class I share and 396 Class Y shares representing $6,706 were exchanged for 406 Class A share. During the period ended October 31, 2020, 948,419 Class Y shares representing $15,260,502 were exchanged for 946,758 Class I share, 993 Class A shares representing $15,789 were exchanged for 966 Class I share and 820 Class C shares representing $11,301 were exchanged for 741 Class I share. | |
See notes to consolidated financial statements. | | | | | | | | |
22
CONSOLIDATED FINANCIAL HIGHLIGHTS
The following tables describe the performance for each share class for the fiscal periods indicated. All information (except portfolio turnover rate) reflects financial results for a single fund share. Net asset value total return is calculated assuming an initial investment made at the net asset value at the beginning of the period, reinvestment of all dividends and distributions at net asset value during the period, and redemption at net asset value on the last day of the period. Net asset value total return includes adjustments in accordance with accounting principles generally accepted in the United States of America and as such, the net asset value for financial reporting purposes and the returns based upon those net asset values may differ from the net asset value and returns for shareholder transactions. These figures have been derived from the fund’s consolidated financial statements.
| | | | | | | |
| | | |
| | | Year Ended October 31, |
Class A Shares | | 2021 | 2020 | 2019 | 2018 | 2017 |
Per Share Data ($): | | | | | | |
Net asset value,
beginning of period | | 15.82 | 16.26 | 15.08 | 16.63 | 15.73 |
Investment Operations: | | | | | | |
Investment income (loss)—neta | | (.19) | (.02) | .15 | .08 | (.09) |
Net realized and unrealized
gain (loss) on investments | | 2.35 | .08 | 1.16 | (.81) | 1.02 |
Total from
Investment Operations | | 2.16 | .06 | 1.31 | (.73) | .93 |
Distributions: | | | | | | |
Dividends from
investment income—net | | - | (.17) | (.13) | – | – |
Dividends from
net realized gain on investments | | - | (.33) | – | (.82) | (.03) |
Total Distributions | | - | (.50) | (.13) | (.82) | (.03) |
Net asset value, end of period | | 17.98 | 15.82 | 16.26 | 15.08 | 16.63 |
Total Return (%)b | | 13.79 | .28 | 8.82 | (4.63) | 5.92 |
Ratios/Supplemental Data (%): | | | | | | |
Ratio of total expenses
to average net assets | | 1.60 | 1.58 | 1.55 | 1.59 | 1.55 |
Ratio of net expenses
to average net assets | | 1.42 | 1.44 | 1.44 | 1.44 | 1.47 |
Ratio of net investment income (loss) to average net assets | | (1.12) | (.14) | .96 | .48 | (.56) |
Portfolio Turnover Rate | | 82.12 | 176.12 | 26.17 | 17.55 | 69.80 |
Net Assets,
end of period ($ x 1,000) | | 38,354 | 35,061 | 38,100 | 47,280 | 73,458 |
a Based on average shares outstanding.
b Exclusive of sales charge.
See notes to consolidated financial statements.
23
CONSOLIDATED FINANCIAL HIGHLIGHTS (continued)
| | | | | | | |
| | | |
| | | Year Ended October 31, |
Class C Shares | | 2021 | 2020 | 2019 | 2018 | 2017 |
Per Share Data ($): | | | | | | |
Net asset value,
beginning of period | | 14.62 | 15.06 | 13.96 | 15.56 | 14.83 |
Investment Operations: | | | | | | |
Investment income (loss)—neta | | (.29) | (.13) | .03 | (.04) | (.19) |
Net realized and unrealized
gain (loss) on investments | | 2.17 | .06 | 1.09 | (.74) | .95 |
Total from
Investment Operations | | 1.88 | (.07) | 1.12 | (.78) | .76 |
Distributions: | | | | | | |
Dividends from
investment income—net | | - | (.04) | (.02) | – | – |
Dividends from
net realized gain on investments | | - | (.33) | – | (.82) | (.03) |
Total Distributions | | - | (.37) | (.02) | (.82) | (.03) |
Net asset value, end of period | | 16.50 | 14.62 | 15.06 | 13.96 | 15.56 |
Total Return (%)b | | 12.93 | (.50) | 8.01 | (5.30) | 5.14 |
Ratios/Supplemental Data (%): | | | | | | |
Ratio of total expenses
to average net assets | | 2.36 | 2.33 | 2.29 | 2.31 | 2.32 |
Ratio of net expenses
to average net assets | | 2.17 | 2.19 | 2.19 | 2.19 | 2.23 |
Ratio of net investment income (loss) to average net assets | | (1.87) | (.87) | .22 | (.27) | (1.26) |
Portfolio Turnover Rate | | 82.12 | 176.12 | 26.17 | 17.55 | 69.80 |
Net Assets,
end of period ($ x 1,000) | | 16,334 | 22,548 | 31,771 | 46,681 | 80,834 |
a Based on average shares outstanding.
b Exclusive of sales charge.
See notes to consolidated financial statements.
24
| | | | | | | |
| | | |
| | | Year Ended October 31, |
Class I Shares | | 2021 | 2020 | 2019 | 2018 | 2017 |
Per Share Data ($): | | | | | | |
Net asset value,
beginning of period | | 16.26 | 16.71 | 15.51 | 17.04 | 16.08 |
Investment Operations: | | | | | | |
Investment income (loss)—neta | | (.15) | .02 | .19 | .12 | (.03) |
Net realized and unrealized
gain (loss) on investments | | 2.43 | .08 | 1.20 | (.83) | 1.02 |
Total from
Investment Operations | | 2.28 | .10 | 1.39 | (.71) | .99 |
Distributions: | | | | | | |
Dividends from
investment income—net | | - | (.22) | (.19) | – | – |
Dividends from
net realized gain on investments | | - | (.33) | – | (.82) | (.03) |
Total Distributions | | - | (.55) | (.19) | (.82) | (.03) |
Net asset value, end of period | | 18.54 | 16.26 | 16.71 | 15.51 | 17.04 |
Total Return (%) | | 14.02 | .53 | 9.04 | (4.33) | 6.17 |
Ratios/Supplemental Data (%): | | | | | | |
Ratio of total expenses
to average net assets | | 1.34 | 1.31 | 1.29 | 1.31 | 1.30 |
Ratio of net expenses
to average net assets | | 1.17 | 1.19 | 1.19 | 1.19 | 1.21 |
Ratio of net investment income (loss) to average net assets | | (.88) | .13 | 1.20 | .73 | (.17) |
Portfolio Turnover Rate | | 82.12 | 176.12 | 26.17 | 17.55 | 69.80 |
Net Assets,
end of period ($ x 1,000) | | 141,384 | 169,485 | 324,848 | 472,940 | 653,752 |
a Based on average shares outstanding.
See notes to consolidated financial statements.
25
CONSOLIDATED FINANCIAL HIGHLIGHTS (continued)
| | | | | | | |
| | | |
| | | Year Ended October 31, |
Class Y Shares | | 2021 | 2020 | 2019 | 2018 | 2017 |
Per Share Data ($): | | | | | | |
Net asset value,
beginning of period | | 16.23 | 16.69 | 15.53 | 17.04 | 16.07 |
Investment Operations: | | | | | | |
Investment income (loss)—neta | | (.15) | .03 | .20 | .13 | (.02) |
Net realized and unrealized
gain (loss) on investments | | 2.42 | .07 | 1.19 | (.82) | 1.02 |
Total from
Investment Operations | | 2.27 | .10 | 1.39 | (.69) | 1.00 |
Distributions: | | | | | | |
Dividends from
investment income—net | | - | (.23) | (.23) | – | – |
Dividends from
net realized gain on investments | | - | (.33) | – | (.82) | (.03) |
Total Distributions | | - | (.56) | (.23) | (.82) | (.03) |
Net asset value, end of period | | 18.50 | 16.23 | 16.69 | 15.53 | 17.04 |
Total Return (%) | | 14.05 | .54 | 9.13 | (4.27) | 6.23 |
Ratios/Supplemental Data (%): | | | | | | |
Ratio of total expenses
to average net assets | | 1.26 | 1.22 | 1.22 | 1.21 | 1.21 |
Ratio of net expenses
to average net assets | | 1.17 | 1.17 | 1.15 | 1.14 | 1.15 |
Ratio of net investment income (loss) to average net assets | | (.86) | .18 | 1.25 | .78 | (.14) |
Portfolio Turnover Rate | | 82.12 | 176.12 | 26.17 | 17.55 | 69.80 |
Net Assets,
end of period ($ x 1,000) | | 121,851 | 239,102 | 564,884 | 733,373 | 787,909 |
a Based on average shares outstanding.
See notes to consolidated financial statements.
26
NOTES TO CONSOLIDATED FINANCIAL STATEMENTS
NOTE 1—Significant Accounting Policies:
BNY Mellon Dynamic Total Return Fund (the “fund”) is a separate diversified series of BNY Mellon Advantage Funds, Inc. (the “Company”), which is registered under the Investment Company Act of 1940, as amended (the “Act”), as an open-end management investment company and operates as a series company currently offering nine series, including the fund. The fund’s investment objective is to seek total return. BNY Mellon Investment Adviser, Inc. (the “Adviser”), a wholly-owned subsidiary of The Bank of New York Mellon Corporation (“BNY Mellon”), serves as the fund’s investment adviser. Prior to September 1, 2021, Mellon Investments Corporation (“Mellon”), a wholly-owned subsidiary of BNY Mellon and an affiliate of the Adviser, served as the fund’s sub-investment adviser. Effective September 1, 2021 (the “Effective Date”), Newton Investment Management North America LLC (the “Sub-Adviser”), a wholly-owned subsidiary of BNY Mellon and an affiliate of the Adviser, serves as the fund’s sub-investment adviser. As the fund’s sub-investment adviser, the Sub-Adviser provides the day-to-day management of the fund’s investments, subject to the Adviser’s supervision and approval. As was the case under the sub-investment advisory agreement between the Adviser and Mellon, the Adviser (and not the fund) pays the Sub-Adviser for its sub-investment advisory services. The rate of sub-investment advisory fee payable by the Adviser to the Sub-Adviser is the same as was paid by the Adviser to Mellon pursuant to the respective sub-investment advisory agreements. As of the Effective Date, portfolio managers responsible for managing the fund’s investments as employees of Mellon became employees of the Sub-Adviser and are no longer employees of Mellon.
The fund may gain investment exposure to global commodity markets through investments in DTR Commodity Fund Ltd., (the “Subsidiary”), a wholly-owned and controlled subsidiary of the fund organized under the laws of the Cayman Islands. The Subsidiary has the ability to invest in commodities and securities consistent with the investment objective of the fund. The Adviser serves as investment adviser for the Subsidiary, the Sub-Adviser serves as the Subsidiary’s sub-investment advisor and Citibank N.A. serves as the Subsidiary’s custodian. The financial statements have been consolidated and include the accounts of the fund and the Subsidiary. Accordingly, all inter-company transactions and balances have been eliminated. A subscription agreement was entered into between the fund and the Subsidiary, comprising the entire issued share capital of the Subsidiary, with the intent that the fund will remain the sole shareholder and retain all rights. Under the Amended and Restated Memorandum and
27
NOTES TO CONSOLIDATED FINANCIAL STATEMENTS (continued)
Articles of Association, shares issued by the Subsidiary confer upon a shareholder the right to receive notice of, to attend and to vote at general meetings of the Subsidiary and shall confer upon the shareholder rights in a winding-up or repayment of capital and the right to participate in the profits or assets of the Subsidiary. The following summarizes the structure and relationship of the Subsidiary at October 31, 2021:
| | | | |
| | Subsidiary Activity |
Consolidated fund Net Assets ($) | | 317,923,226 | |
Subsidiary Percentage of fund Net Assets | | 5.08% | |
Subsidiary Financial Statement Information ($) | | | |
Total assets | | 16,271,150 | |
Total liabilities | | 127,888 | |
Net assets | | 16,143,262 | |
Total income | | 5,302 | |
Total expenses | | 246,933 | |
Investment income—net | | (241,631) | |
Net realized gain (loss) | | 5,128,231 | |
Net change in unrealized appreciation (depreciation) | | 53,098 | |
Net increase (decrease) in net assets resulting from operations | | 4,939,698 | |
BNY Mellon Securities Corporation (the “Distributor”), a wholly-owned subsidiary of the Adviser, is the distributor of the fund’s shares. The fund is authorized to issue 600 million shares of $.001 par value Common Stock. The fund currently has authorized four classes of shares: Class A (200 million shares authorized), Class C (100 million shares authorized), Class I (150 million shares authorized) and Class Y (150 million shares authorized). Class A and Class C shares are sold primarily to retail investors through financial intermediaries and bear Distribution and/or Shareholder Services Plan fees. Class A shares generally are subject to a sales charge imposed at the time of purchase. Class A shares bought without an initial sales charge as part of an investment of $1 million or more may be charged a contingent deferred sales charge (“CDSC”) of 1.00% if redeemed within one year. Class C shares are subject to a CDSC imposed on Class C shares redeemed within one year of purchase. Class C shares automatically convert to Class A shares eight years after the date of purchase, without the imposition of a sales charge. Class I shares are sold primarily to bank trust departments and other financial service providers (including The Bank of New York Mellon, a subsidiary of BNY Mellon and an affiliate of the Adviser, and its affiliates), acting on behalf of customers having a qualified trust or an investment account or relationship at such institution, and bear no Distribution or Shareholder Services Plan fees. Class Y shares are sold at net asset value per share generally to institutional investors, and bear no Distribution or Shareholder Services Plan fees. Class I and Class Y shares are offered without a front-end sales charge or CDSC. Other differences between the classes include the services offered to and the expenses borne by each class, the allocation of
28
certain transfer agency costs, and certain voting rights. Income, expenses (other than expenses attributable to a specific class), and realized and unrealized gains or losses on investments are allocated to each class of shares based on its relative net assets.
The Company accounts separately for the assets, liabilities and operations of each series. Expenses directly attributable to each series are charged to that series’ operations; expenses which are applicable to all series are allocated among them on a pro rata basis.
The Financial Accounting Standards Board (“FASB”) Accounting Standards Codification (“ASC”) is the exclusive reference of authoritative U.S. generally accepted accounting principles (“GAAP”) recognized by the FASB to be applied by nongovernmental entities. Rules and interpretive releases of the SEC under authority of federal laws are also sources of authoritative GAAP for SEC registrants. The fund is an investment company and applies the accounting and reporting guidance of the FASB ASC Topic 946 Financial Services-Investment Companies. The fund’s consolidated financial statements are prepared in accordance with GAAP, which may require the use of management estimates and assumptions. Actual results could differ from those estimates.
The Company enters into contracts that contain a variety of indemnifications. The fund’s maximum exposure under these arrangements is unknown. The fund does not anticipate recognizing any loss related to these arrangements.
(a) Portfolio valuation: The fair value of a financial instrument is the amount that would be received to sell an asset or paid to transfer a liability in an orderly transaction between market participants at the measurement date (i.e., the exit price). GAAP establishes a fair value hierarchy that prioritizes the inputs of valuation techniques used to measure fair value. This hierarchy gives the highest priority to unadjusted quoted prices in active markets for identical assets or liabilities (Level 1 measurements) and the lowest priority to unobservable inputs (Level 3 measurements).
Additionally, GAAP provides guidance on determining whether the volume and activity in a market has decreased significantly and whether such a decrease in activity results in transactions that are not orderly. GAAP requires enhanced disclosures around valuation inputs and techniques used during annual and interim periods.
Various inputs are used in determining the value of the fund’s investments relating to fair value measurements. These inputs are summarized in the three broad levels listed below:
29
NOTES TO CONSOLIDATED FINANCIAL STATEMENTS (continued)
Level 1—unadjusted quoted prices in active markets for identical investments.
Level 2—other significant observable inputs (including quoted prices for similar investments, interest rates, prepayment speeds, credit risk, etc.).
Level 3—significant unobservable inputs (including the fund’s own assumptions in determining the fair value of investments).
The inputs or methodology used for valuing securities are not necessarily an indication of the risk associated with investing in those securities.
Changes in valuation techniques may result in transfers in or out of an assigned level within the disclosure hierarchy. Valuation techniques used to value the fund’s investments are as follows:
Registered investment companies that are not traded on an exchange are valued at their net asset value and are generally categorized within Level 1 of the fair value hierarchy.
Investments in debt securities, excluding short-term investments (other than U.S. Treasury Bills), futures, options and forward foreign currency exchange contracts (“forward contracts”) are valued each business day by one or more independent pricing services (each, a “Service”) approved by the Company’s Board of Directors (the “Board”). Investments for which quoted bid prices are readily available and are representative of the bid side of the market in the judgment of a Service are valued at the mean between the quoted bid prices (as obtained by a Service from dealers in such securities) and asked prices (as calculated by a Service based upon its evaluation of the market for such securities). Securities are valued as determined by a Service, based on methods which include consideration of the following: yields or prices of securities of comparable quality, coupon, maturity and type; indications as to values from dealers; and general market conditions. These securities are generally categorized within Level 2 of the fair value hierarchy.
U.S. Treasury Bills are valued at the mean price between quoted bid prices and asked prices by a Service. These securities are generally categorized within Level 2 of the fair value hierarchy.
Each Service and independent valuation firm is engaged under the general oversight of the Board.
When market quotations or official closing prices are not readily available, or are determined not to accurately reflect fair value, such as when the value of a security has been significantly affected by events after the close
30
of the exchange or market on which the security is principally traded (for example, a foreign exchange or market), but before the fund calculates its net asset value, the fund may value these investments at fair value as determined in accordance with the procedures approved by the Board. Certain factors may be considered when fair valuing investments such as: fundamental analytical data, the nature and duration of restrictions on disposition, an evaluation of the forces that influence the market in which the securities are purchased and sold, and public trading in similar securities of the issuer or comparable issuers. These securities are either categorized within Level 2 or 3 of the fair value hierarchy depending on the relevant inputs used.
For securities where observable inputs are limited, assumptions about market activity and risk are used and such securities are generally categorized within Level 3 of the fair value hierarchy.
Investments denominated in foreign currencies are translated to U.S. dollars at the prevailing rates of exchange.
Forward contracts are valued at the forward rate and are generally categorized within Level 2 of the fair value hierarchy. Futures and options, which are traded on an exchange, are valued at the last sales price on the securities exchange on which such securities are primarily traded or at the last sales price on the national securities market on each business day and are generally categorized within Level 1 of the fair value hierarchy. Options traded over-the-counter (“OTC”) are valued at the mean between the bid and asked price and are generally categorized within Level 2 of the fair value hierarchy.
The following is a summary of the inputs used as of October 31, 2021 in valuing the fund’s investments:
| | | | | | | |
| | Level 1-Unadjusted Quoted Prices | Level 2- Other Significant Observable Inputs | | Level 3-Significant Unobservable Inputs | Total | |
Assets ($) | | |
Investments In Securities:† | | |
Investment Companies | 39,021,299 | - | | - | 39,021,299 | |
U.S. Treasury Securities | - | 273,010,828 | | - | 273,010,828 | |
Other Financial Instruments: | | |
Forward Foreign Currency Exchange Contracts†† | - | 2,479,823 | | - | 2,479,823 | |
31
NOTES TO CONSOLIDATED FINANCIAL STATEMENTS (continued)
| | | | | | | |
| | Level 1-Unadjusted Quoted Prices | Level 2- Other Significant Observable Inputs | | Level 3-Significant Unobservable Inputs | Total | |
Assets ($)(continued) | | |
Other Financial Instruments:(continued) | | |
Futures†† | 5,902,579 | - | | - | 5,902,579 | |
Options Purchased | 1,618,950 | - | | - | 1,618,950 | |
Liabilities ($) | | |
Other Financial Instruments: | | |
Forward Foreign Currency Exchange Contracts†† | - | (3,021,729) | | - | (3,021,729) | |
Futures†† | (5,684,890) | - | | - | (5,684,890) | |
Options Written | (362,100) | - | | - | (362,100) | |
† See Consolidated Statement of Investments for additional detailed categorizations, if any.
†† Amount shown represents unrealized appreciation (depreciation) at period end, but only variation margin on exchanged-traded and centrally cleared derivatives, if any, are reported in the Consolidated Statement of Assets and Liabilities.
(b) Foreign currency transactions: The fund does not isolate that portion of the results of operations resulting from changes in foreign exchange rates on investments from the fluctuations arising from changes in the market prices of securities held. Such fluctuations are included with the net realized and unrealized gain or loss on investments.
Net realized foreign exchange gains or losses arise from sales of foreign currencies, currency gains or losses realized on securities transactions between trade and settlement date, and the difference between the amounts of dividends, interest and foreign withholding taxes recorded on the fund’s books and the U.S. dollar equivalent of the amounts actually received or paid. Net unrealized foreign exchange gains and losses arise from changes in the value of assets and liabilities other than investments resulting from changes in exchange rates. Foreign currency gains and losses on foreign currency transactions are also included with net realized and unrealized gain or loss on investments.
(c) Securities transactions and investment income: Securities transactions are recorded on a trade date basis. Realized gains and losses from securities transactions are recorded on the identified cost basis. Dividend income is recognized on the ex-dividend date and interest income, including, where applicable, accretion of discount and amortization of premium on investments, is recognized on the accrual basis.
32
(d) Affiliated issuers: Investments in other investment companies advised by the Adviser are considered “affiliated” under the Act.
(e) Risk: Investing in foreign markets may involve special risks and considerations not typically associated with investing in the U.S. These risks include revaluation of currencies, high rates of inflation, repatriation restrictions on income and capital, and adverse political, economic developments and public health conditions. Moreover, securities issued in these markets may be less liquid, subject to government ownership controls and delayed settlements, and their prices may be more volatile than those of comparable securities in the U.S. In addition, turbulence in financial markets and reduced liquidity in equity, credit and/or fixed income markets may negatively affect many issuers, which could adversely affect the fund. Global economies and financial markets are becoming increasingly interconnected, and conditions and events in one country, region or financial market may adversely impact issuers in a different country, region or financial market. These risks may be magnified if certain events or developments adversely interrupt the global supply chain; in these and other circumstances, such risks might affect companies world-wide. Recent examples include pandemic risks related to COVID-19 and aggressive measures taken world-wide in response by governments, including closing borders, restricting international and domestic travel, and the imposition of prolonged quarantines of large populations, and by businesses, including changes to operations and reducing staff. The effects of COVID-19 have contributed to increased volatility in global markets and will likely affect certain countries, companies, industries and market sectors more dramatically than others. The COVID-19 pandemic has had, and any other outbreak of an infectious disease or other serious public health concern could have, a significant negative impact on economic and market conditions and could trigger a prolonged period of global economic slowdown. To the extent the fund may overweight its investments in certain countries, companies, industries or market sectors, such positions will increase the fund’s exposure to risk of loss from adverse developments affecting those countries, companies, industries or sectors.
The fund’s investments in commodity-linked financial derivatives instruments may subject the fund to greater market price volatility than investments in traditional securities. The value of commodity-linked financial derivative instruments may be affected by changes in overall market movements, commodity index volatility, changes in interest rates, or factors affecting a particular industry or commodity, such as drought, floods, weather, livestock disease, embargoes, tariffs and international economic, political and regulatory developments.
33
NOTES TO CONSOLIDATED FINANCIAL STATEMENTS (continued)
(f) Dividends and distributions to shareholders: Dividends and distributions are recorded on the ex-dividend date. Dividends from investment income-net and dividends from net realized capital gains, if any, are normally declared and paid annually, but the fund may make distributions on a more frequent basis to comply with the distribution requirements of the Internal Revenue Code of 1986, as amended (the “Code”). To the extent that net realized capital gains can be offset by capital loss carryovers, it is the policy of the fund not to distribute such gains. Income and capital gain distributions are determined in accordance with income tax regulations, which may differ from GAAP.
(g) Federal income taxes: It is the policy of the fund to continue to qualify as a regulated investment company, if such qualification is in the best interests of its shareholders, by complying with the applicable provisions of the Code, and to make distributions of taxable income and net realized capital gain sufficient to relieve it from substantially all federal income and excise taxes.
The Subsidiary is classified as a controlled foreign corporation under Subchapter N of the Code. Therefore, the fund is required to increase its taxable income by its share of the Subsidiary’s income. Net investment losses of the Subsidiary cannot be deducted by the fund in the current period nor carried forward to offset taxable income in future periods.
As of and during the period ended October 31, 2021, the fund did not have any liabilities for any uncertain tax positions. The fund recognizes interest and penalties, if any, related to uncertain tax positions as income tax expense in the Consolidated Statement of Operations. During the period ended October 31, 2021, the fund did not incur any interest or penalties.
Each tax year in the four-year period ended October 31, 2021 remains subject to examination by the Internal Revenue Service and state taxing authorities.
At October 31, 2021, the components of accumulated earnings on a tax basis were as follows: undistributed ordinary income $20,357,825, undistributed capital gains $25,237,998, accumulated other losses $566 and unrealized depreciation $11,596,289.
The tax character of distributions paid to shareholders during the fiscal periods ended October 31, 2021 and October 31, 2020 were as follows: ordinary income $0 and $24,417,490, and long-term capital gains $0 and $6,587,096, respectively.
34
During the period ended October 31, 2021, as a result of permanent book to tax differences, primarily due to the tax treatment for Subpart F income from subsidiary, and treating a portion of the proceeds from redemptions as a distribution for tax purposes, the fund decreased total distributable earnings (loss) by $18,458,975 and increased paid-in capital by the same amount. Net assets and net asset value per share were not affected by this reclassification.
(h) New accounting pronouncements: In March 2020, the FASB issued Accounting Standards Update 2020-04, Reference Rate Reform (Topic 848): Facilitation of the Effects of Reference Rate Reform on Financial Reporting (“ASU 2020-04”), and in January 2021, the FASB issued Accounting Standards Update 2021-01, Reference Rate Reform (Topic 848): Scope (“ASU 2021-01”), which provides optional, temporary relief with respect to the financial reporting of contracts subject to certain types of modifications due to the planned discontinuation of the London Interbank Offered Rate (“LIBOR”) and other interbank offered rates as of the end of 2021. The temporary relief provided by ASU 2020-04 and ASU 2021-01 is effective for certain reference rate-related contract modifications that occur during the period from March 12, 2020 through December 31, 2022. Management is evaluating the impact of ASU 2020-04 and ASU 2021-01 on the fund’s investments, derivatives, debt and other contracts that will undergo reference rate-related modifications as a result of the reference rate reform. Management is also currently actively working with other financial institutions and counterparties to modify contracts as required by applicable regulation and within the regulatory deadlines.
NOTE 2—Bank Lines of Credit:
The fund participates with other long-term open-end funds managed by the Adviser in a $823.5 million unsecured credit facility led by Citibank, N.A. (the “Citibank Credit Facility”) and a $300 million unsecured credit facility provided by The Bank of New York Mellon (the “BNYM Credit Facility”), a subsidiary of BNY Mellon and an affiliate of the Adviser, each to be utilized primarily for temporary or emergency purposes, including the financing of redemptions (each, a “Facility”). The Citibank Credit Facility is available in two tranches: (i) Tranche A is in an amount equal to $688.5 million and is available to all long-term open-ended funds, including the fund, and (ii) Tranche B is an amount equal to $135 million and is available only to BNY Mellon Floating Rate Income Fund, a series of BNY Mellon Investment Funds IV, Inc. In connection therewith, the fund has agreed to pay its pro rata portion of commitment fees for Tranche A of the Citibank Credit Facility and the BNYM Credit Facility. Interest is charged to the fund based on rates determined pursuant to the terms of the respective
35
NOTES TO CONSOLIDATED FINANCIAL STATEMENTS (continued)
Facility at the time of borrowing. During the period ended October 31, 2021, the fund did not borrow under the Facilities.
NOTE 3— Management Fee, Sub-Investment Advisory Fee and Other Transactions with Affiliates:
(a) The Adviser has entered into separate management agreements with the fund and the Subsidiary pursuant to which the Adviser receives a management fee computed at the annual rate of 1.10% of the value of the average daily net assets of each of the fund and the Subsidiary which is payable monthly. In addition, the Adviser has contractually agreed for as long as the fund invests in the Subsidiary, to waive the management fee it receives from the fund in an amount equal to the management fee paid to the Adviser by the Subsidiary. The reduction in expenses, pursuant to the undertaking, amounted to $205,776 during the period ended October 31, 2021.
In addition, the Adviser had contractually agreed, from November 1, 2020 through March 31, 2021, to waive receipt of its fees and/or assume the direct expenses of the fund, so that the direct expenses of none of the classes (excluding Rule 12b-1 Distribution Plan fees, Shareholder Services Plan fees, taxes, interest expense, brokerage commissions, commitment fees on borrowings and extraordinary expenses) exceeded 1.19% of the value of the fund’s average daily net assets. The Adviser has contractually agreed, from April 1, 2021 through March 1, 2022, to waive receipt of its fees and/or assume the direct expenses of the fund, so that the direct expenses of none of the classes (excluding expense describe above) exceed 1.15% of the value of the fund’s average daily net assets. On or after March 1, 2022, the Adviser may terminate this expense limitation at any time. The reduction in expenses, pursuant to the undertaking, amounted to $311,721 during the period ended October 31, 2021.
Prior to the Effective Date, pursuant to a sub-investment advisory agreement between the Adviser and Mellon, the Adviser had paid Mellon an annual fee of the value of the fund’s average daily net assets of each fund and the Subsidiary which is payable monthly. As of the Effective Date, pursuant to a sub-investment advisory agreement between the Adviser and the Sub-Adviser, the Adviser pay the Sub Adviser an annual fee of .65% of the value of the fund’s average daily net assets of each fund and the Subsidiary which is payable monthly.
During the period ended October 31, 2021, the Distributor retained $1,267 from commissions earned on sales of the fund’s Class A shares and $501 from CDSC fees on redemptions of the fund’s Class C shares.
36
(b) Under the Distribution Plan adopted pursuant to Rule 12b-1 under the Act, Class C shares pay the Distributor for distributing its shares at an annual rate of .75% of the value of its average daily net assets. The Distributor may pay one or more Service Agents in respect of advertising, marketing and other distribution services, and determines the amounts, if any, to be paid to Service Agents and the basis on which such payments are made. During the period ended October 31, 2021, Class C shares were charged $149,490 pursuant to the Distribution Plan.
(c) Under the Shareholder Services Plan, Class A and Class C shares pay the Distributor at an annual rate of .25% of the value of their average daily net assets for the provision of certain services. The services provided may include personal services relating to shareholder accounts, such as answering shareholder inquiries regarding the fund, and services related to the maintenance of shareholder accounts. The Distributor may make payments to Service Agents (securities dealers, financial institutions or other industry professionals) with respect to these services. The Distributor determines the amounts to be paid to Service Agents. During the period ended October 31, 2021, Class A and Class C shares were charged $90,962 and $49,830, respectively, pursuant to the Shareholder Services Plan.
The fund has an arrangement with the transfer agent whereby the fund may receive earnings credits when positive cash balances are maintained, which are used to offset transfer agency fees. For financial reporting purposes, the fund includes net earnings credits, if any, as shareholder servicing costs in the Consolidated Statement of Operations.
The fund has an arrangement with the custodian whereby the fund will receive interest income or be charged overdraft fees when cash balances are maintained. For financial reporting purposes, the fund includes this interest income and overdraft fees, if any, as interest income in the Consolidated Statement of Operations.
The fund compensates BNY Mellon Transfer, Inc., a wholly-owned subsidiary of the Adviser, under a transfer agency agreement for providing transfer agency and cash management services inclusive of earnings credits, if any, for the fund. The majority of transfer agency fees are comprised of amounts paid on a per account basis, while cash management fees are related to fund subscriptions and redemptions. During the period ended October 31, 2021, the fund was charged $11,588 for transfer agency services, inclusive of earnings credit, if any. These fees are included in Shareholder servicing costs in the Consolidated Statement of Operations.
37
NOTES TO CONSOLIDATED FINANCIAL STATEMENTS (continued)
The fund compensates The Bank of New York Mellon under a custody agreement for providing custodial services for the fund. These fees are determined based on net assets, geographic region and transaction activity. During the period ended October 31, 2021, the fund was charged $16,685 pursuant to the custody agreement.
During the period ended October 31, 2021, the fund was charged $14,062 for services performed by the Chief Compliance Officer and his staff. These fees are included in Chief Compliance Officer fees in the Consolidated Statement of Operations.
The components of “Due to BNY Mellon Investment Adviser, Inc. and affiliates” in the Consolidated Statement of Assets and Liabilities consist of: management fees of $299,824, Subsidiary management fees of $19,404, Distribution Plan fees of $10,542, Shareholder Services Plan fees of $11,598, custodian fees of $5,000, Chief Compliance Officer fees of $4,718 and transfer agency fees of $1,866, which are offset against an expense reimbursement currently in effect in the amount of $69,049.
(d) Each Board member also serves as a Board member of other funds in the BNY Mellon Family of Funds complex. Annual retainer fees and attendance fees are allocated to each fund based on net assets.
NOTE 4—Securities Transactions:
The aggregate amount of purchases and sales of investment securities, excluding short-term securities, futures, options transactions and forward contracts, during the period ended October 31, 2021, amounted to $28,548,027 and $72,653,969, respectively.
Derivatives: A derivative is a financial instrument whose performance is derived from the performance of another asset. The fund enters into International Swaps and Derivatives Association, Inc. Master Agreements or similar agreements (collectively, “Master Agreements”) with its OTC derivative contract counterparties in order to, among other things, reduce its credit risk to counterparties. Master Agreements include provisions for general obligations, representations, collateral and events of default or termination. Under a Master Agreement, the fund may offset with the counterparty certain derivative financial instruments’ payables and/or receivables with collateral held and/or posted and create one single net payment in the event of default or termination.
Each type of derivative instrument that was held by the fund during the period ended October 31, 2021 is discussed below.
Futures: In the normal course of pursuing its investment objective, the fund is exposed to market risk, including equity price risk, interest rate risk
38
and commodity risk, as a result of changes in value of underlying financial instruments. The fund invests in futures in order to manage its exposure to or protect against changes in the market. A futures contract represents a commitment for the future purchase or a sale of an asset at a specified date. Upon entering into such contracts, these investments require initial margin deposits with a counterparty, which consist of cash or cash equivalents. The amount of these deposits is determined by the exchange or Board of Trade on which the contract is traded and is subject to change. Accordingly, variation margin payments are received or made to reflect daily unrealized gains or losses which are recorded in the Consolidated Statement of Operations. When the contracts are closed, the fund recognizes a realized gain or loss which is reflected in the Consolidated Statement of Operations. There is minimal counterparty credit risk to the fund with futures since they are exchange traded, and the exchange guarantees the futures against default. Futures open at October 31, 2021 are set forth in the Consolidated Statement of Futures.
Options Transactions: The fund purchases and writes (sells) put and call options to hedge against changes in the values of equities and interest or as a substitute for an investment. The fund is subject to market risk and interest risk in the course of pursuing its investment objectives through its investments in options contracts. A call option gives the purchaser of the option the right (but not the obligation) to buy, and obligates the writer to sell, the underlying financial instrument at the exercise price at any time during the option period, or at a specified date. Conversely, a put option gives the purchaser of the option the right (but not the obligation) to sell, and obligates the writer to buy the underlying financial instrument at the exercise price at any time during the option period, or at a specified date.
As a writer of call options, the fund receives a premium at the outset and then bears the market risk of unfavorable changes in the price of the financial instrument underlying the option. Generally, the fund realizes a gain, to the extent of the premium, if the price of the underlying financial instrument decreases between the date the option is written and the date on which the option is terminated. Generally, the fund incurs a loss if the price of the financial instrument increases between those dates. The maximum payout for those contracts is limited to the number of call option contracts written and the related strike prices, respectively.
As a writer of put options, the fund receives a premium at the outset and then bears the market risk of unfavorable changes in the price of the financial instrument underlying the option. Generally, the fund realizes a gain, to the extent of the premium, if the price of the underlying financial instrument increases between the date the option is written and the date on
39
NOTES TO CONSOLIDATED FINANCIAL STATEMENTS (continued)
which the option is terminated. Generally, the fund incurs a loss if the price of the financial instrument decreases between those dates. The maximum payout for those contracts is limited to the number of put option contracts written and the related strike prices, respectively.
As a writer of an option, the fund has no control over whether the underlying financial instrument may be sold (call) or purchased (put) and as a result bears the market risk of an unfavorable change in the price of the financial instrument underlying the written option. There is a risk of loss from a change in value of such options which may exceed the related premiums received. This risk may be mitigated by Master Agreements, if any, between the fund and the counterparty and the posting of collateral, if any, by the counterparty to the fund to cover the fund’s exposure to the counterparty. The Consolidated Statement of Operations reflects any unrealized gains or losses which occurred during the period as well as any realized gains or losses which occurred upon the expiration or closing of the option transaction. Options purchased open at October 31, 2021 are set forth in the Consolidated Statements of Investments and options written open at October 31, 2021 are set forth in the Consolidated Statement of Options Written.
Forward Foreign Currency Exchange Contracts: The fund enters into forward contracts in order to hedge its exposure to changes in foreign currency exchange rates on its foreign portfolio holdings, to settle foreign currency transactions or as a part of its investment strategy. When executing forward contracts, the fund is obligated to buy or sell a foreign currency at a specified rate on a certain date in the future. With respect to sales of forward contracts, the fund incurs a loss if the value of the contract increases between the date the forward contract is opened and the date the forward contract is closed. The fund realizes a gain if the value of the contract decreases between those dates. With respect to purchases of forward contracts, the fund incurs a loss if the value of the contract decreases between the date the forward contract is opened and the date the forward contract is closed. The fund realizes a gain if the value of the contract increases between those dates. Any realized or unrealized gains or losses which occurred during the period are reflected in the Consolidated Statement of Operations. The fund is exposed to foreign currency risk as a result of changes in value of underlying financial instruments. The fund is also exposed to credit risk associated with counterparty nonperformance on these forward contracts, which is generally limited to the unrealized gain on each open contract. This risk may be mitigated by Master Agreements, if any, between the fund and the counterparty and the posting of collateral, if any, by the counterparty to the fund to cover the fund’s exposure to the counterparty. Forward contracts open at October 31, 2021
40
are set forth in the Consolidated Statement of Forward Foreign Currency Exchange Contracts.
The following tables show the fund’s exposure to different types of market risk as it relates to the Consolidated Statement of Assets and Liabilities and the Consolidated Statement of Operations, respectively.
Fair value of derivative instruments as of October 31, 2021 is shown below:
| | | | | | | | |
| | Derivative
Assets ($) | | | | Derivative
Liabilities ($) | |
Interest rate risk | 1,198,503 | 1 | Interest rate risk | (4,702,364) | 1 |
Equity risk | 5,990,708 | 1,2 | Equity risk | (1,033,621) | 1,3 |
Foreign exchange risk | 2,479,823 | 4 | Foreign exchange risk | (3,021,729) | 4 |
Commodity risk | 332,318 | 1 | Commodity risk | (311,005) | 1 |
Gross fair value of
derivative contracts | 10,001,352 | | | | (9,068,719) | |
| | | | | | |
| Consolidated Statement of Assets and Liabilities location: | |
1 | Includes cumulative appreciation (depreciation) on futures as reported in the
Consolidated Statement of Futures, but only the unpaid variation margin is reported in
the Consolidated Statement of Assets and Liabilities. |
2 | Options purchased are included in Investments in securities—Unaffiliated issuers, at value. |
3 | Outstanding options written, at value. | |
4 | Unrealized appreciation (depreciation) on forward foreign currency exchange contracts. |
The effect of derivative instruments in the Consolidated Statement of Operations during the period ended October 31, 2021 is shown below:
| | | | | | | | | |
Amount of realized gain (loss) on derivatives recognized in income ($) | |
Underlying
risk | Futures | 1 | Options
Transactions | 2 | Forward
Contracts | 3 | Total | |
Interest rate | (8,698,440) | | (281,645) | | - | | (8,980,085) | |
Equity | 49,737,523 | | 1,359,652 | | - | | 51,097,175 | |
Foreign
exchange | - | | - | | (4,543,520) | | (4,543,520) | |
Commodity | 5,128,914 | | - | | - | | 5,128,914 | |
Total | 46,167,997 | | 1,078,007 | | (4,543,520) | | 42,702,484 | |
| | | | | | | | |
41
NOTES TO CONSOLIDATED FINANCIAL STATEMENTS (continued)
| | | | | | | | | | |
Net change in unrealized appreciation (depreciation)
on derivatives recognized in income ($) | |
Underlying
risk | Futures | 4 | Options
Transactions | 5 | Forward
Contracts | 6 | Total | |
Interest rate | (2,473,366) | | (1,131,498) | | - | | (3,604,864) | |
Equity | 15,033,873 | | (538,033) | | - | | 14,495,840 | |
Foreign
exchange | - | | - | | (1,637,291) | | (1,637,291) | |
Commodity | 53,684 | | - | | - | | 53,684 | |
Total | 12,614,191 | | (1,669,531) | | (1,637,291) | | 9,307,369 | |
| | | | | | | | | |
| Consolidated Statement of Operations location: | |
1 | Net realized gain (loss) on futures. |
2 | Net realized gain (loss) on options transactions. |
3 | Net realized gain (loss) on forward foreign currency exchange contracts. |
4 | Net change in unrealized appreciation (depreciation) on futures. |
5 | Net change in unrealized appreciation (depreciation) on options transactions. |
6 | Net change in unrealized appreciation (depreciation) on forward foreign currency exchange contracts. |
The provisions of ASC Topic 210 “Disclosures about Offsetting Assets and Liabilities” require disclosure on the offsetting of financial assets and liabilities. These disclosures are required for certain investments, including derivative financial instruments subject to Master Agreements which are eligible for offsetting in the Consolidated Statement of Assets and Liabilities and require the fund to disclose both gross and net information with respect to such investments. For financial reporting purposes, the fund does not offset derivative assets and derivative liabilities that are subject to Master Agreements in the Consolidated Statement of Assets and Liabilities.
At October 31, 2021, derivative assets and liabilities (by type) on a gross basis are as follows:
| | | | | | |
Derivative Financial Instruments: | | Assets ($) | | Liabilities ($) | |
Futures | | 5,902,579 | | (5,684,890) | |
Options | | 1,618,950 | | (362,100) | |
Forward contracts | | 2,479,823 | | (3,021,729) | |
Total gross amount of derivative | | | | | |
assets and liabilities in the | | | | | |
Consolidated Statement of Assets and Liabilities | | 10,001,352 | | (9,068,719) | |
Derivatives not subject to | | | | | |
Master Agreements | | (7,521,529) | | 6,046,990 | |
Total gross amount of assets | | | | | |
and liabilities subject to | | | | | |
Master Agreements | | 2,479,823 | | (3,021,729) | |
42
The following tables present derivative assets and liabilities net of amounts available for offsetting under Master Agreements and net of related collateral received or pledged, if any, as of October 31, 2021:
| | | | | | | |
| | | Financial | | | |
| | | Instruments | | | |
| | | and Derivatives | | | |
| Gross Amount of | | Available | Collateral | | Net Amount of |
Counterparty | Assets ($) | 1 | for Offset ($) | Received ($) | 2 | Assets ($) |
Citigroup | 465,984 | | (465,984) | - | | - |
Goldman Sachs | 1,164,978 | | (1,139,614) | - | | 25,364 |
HSBC | 592,148 | | (592,148) | - | | - |
Morgan Stanley | 78,402 | | (7,644) | - | | 70,758 |
Standard
Chartered Bank | 178,311 | | (115,040) | - | | 63,271 |
Total | 2,479,823 | | (2,320,430) | - | | 159,393 |
| | | | | | |
| | | Financial | | | |
| | | Instruments | | | |
| | | and Derivatives | | | |
| Gross Amount of | | Available | Collateral | | Net Amount of |
Counterparty | Liabilities ($) | 1 | for Offset ($) | Pledged ($) | 2 | Liabilities ($) |
Citigroup | (699,388) | | 465,984 | 233,404 | | - |
Goldman Sachs | (1,139,614) | | 1,139,614 | - | | - |
HSBC | (701,342) | | 592,148 | - | | (109,194) |
Morgan Stanley | (7,644) | | 7,644 | - | | - |
RBC Capital Markets | (358,701) | | - | 270,000 | | (88,701) |
Standard
Chartered Bank | (115,040) | | 115,040 | - | | - |
Total | (3,021,729) | | 2,320,430 | 503,404 | | (197,895) |
| | | | | | |
1 Absent a default event or early termination, OTC derivative assets and liabilities are presented at gross amounts
and are not offset in the Consolidated Statement of Assets and Liabilities. |
2 In some instances, the actual collateral received and/or pledged may be more than the amount shown due to
over collateralization. |
The following summarizes the average market value of derivatives outstanding during the period ended October 31, 2021:
| | | |
| | Average Market Value ($) |
Equity futures | | 328,075,340 |
Equity options contracts | | 2,282,829 |
Interest rate futures | | 843,741,568 |
Interest rate options contracts | | 21,484 |
Forward contracts | | 549,142,947 |
Commodity futures | | 28,169,146 |
At October 31, 2021, the cost of investments for federal income tax purposes was $322,367,007; accordingly, accumulated net unrealized
43
NOTES TO CONSOLIDATED FINANCIAL STATEMENTS (continued)
depreciation on investments inclusive of derivative contracts was $11,595,443, consisting of $8,464,331 gross unrealized appreciation and $20,059,774 gross unrealized depreciation.
44
REPORT OF INDEPENDENT REGISTERED PUBLIC ACCOUNTING FIRM
To the Shareholders and the Board of Directors of BNY Mellon Dynamic Total Return Fund
Opinion on the Financial Statements
We have audited the accompanying consolidated statement of assets and liabilities of BNY Mellon Dynamic Total Return Fund (the “Fund”) (one of the funds constituting BNY Mellon Advantage Funds, Inc.), including the consolidated statements of investments, investments in affiliated issuers, futures, options written and forward foreign currency exchange contracts, as of October 31, 2021, and the related consolidated statement of operations for the year then ended, the consolidated statements of changes in net assets for each of the two years in the period then ended, the consolidated financial highlights for each of the five years in the period then ended and the related notes (collectively referred to as the “financial statements”). In our opinion, the financial statements present fairly, in all material respects, the consolidated financial position of the Fund (one of the funds constituting BNY Mellon Advantage Funds, Inc.) at October 31, 2021, the consolidated results of its operations for the year then ended, the consolidated changes in its net assets for each of the two years in the period then ended and its consolidated financial highlights for each of the five years in the period then ended, in conformity with U.S. generally accepted accounting principles.
Basis for Opinion
These financial statements are the responsibility of the Fund’s management. Our responsibility is to express an opinion on the Fund’s financial statements based on our audits. We are a public accounting firm registered with the Public Company Accounting Oversight Board (United States) (“PCAOB”) and are required to be independent with respect to the Fund in accordance with the U.S. federal securities laws and the applicable rules and regulations of the Securities and Exchange Commission and the PCAOB.
We conducted our audits in accordance with the standards of the PCAOB. Those standards require that we plan and perform the audit to obtain reasonable assurance about whether the financial statements are free of material misstatement, whether due to error or fraud. The Fund is not required to have, nor were we engaged to perform, an audit of the Fund’s internal control over financial reporting. As part of our audits, we are required to obtain an understanding of internal control over financial reporting, but not for the purpose of expressing an opinion on the effectiveness of the Fund’s internal control over financial reporting. Accordingly, we express no such opinion.
Our audits included performing procedures to assess the risks of material misstatement of the financial statements, whether due to error or fraud, and performing procedures that respond to those risks. Such procedures included examining, on a test basis, evidence regarding the amounts and disclosures in the financial statements. Our procedures included confirmation of securities owned as of October 31, 2021, by correspondence with the custodian and others or by other appropriate auditing procedures where replies from others were not received. Our audits also included evaluating the accounting principles used and significant estimates made by management, as well as evaluating the overall presentation of the financial statements. We believe that our audits provide a reasonable basis for our opinion.

We have served as the auditor of one or more investment companies in the BNY Mellon Family of Funds since at least 1957, but we are unable to determine the specific year.
New York, New York
December 23, 2021
45
INFORMATION ABOUT THE APPROVAL AND RENEWAL OF THE FUND’S MANAGEMENT AGREEMENT AND APPROVAL OF THE SUB-INVESTMENT ADVISORY AGREEMENT (Unaudited)
At a meeting of the fund’s Board of Directors held on May 11, 2021 (the “Meeting”), the Board discussed with representatives of the Adviser plans to realign Mellon Investments Corporation’s (“Mellon”) equities and multi-asset capabilities with Newton Investment Management North America, LLC (“Newton US”) (the “Firm Realignment”), with such realignment scheduled to occur, subject to regulatory requirements, in the third quarter of 2021 (the “Effective Date”). The Adviser noted that, as a result of the Firm Realignment, the portfolio managers who are currently responsible for managing the investments of the fund as employees of Mellon as a sub-investment adviser pursuant to a sub-investment advisory agreement with the Adviser (the “Current Sub-Advisory Agreement”), will become employees of Newton US as of the Effective Date. Consequently, the Adviser proposed to engage Newton US to serve as the fund’s sub-investment adviser, pursuant to a sub-investment advisory agreement between the Adviser and Newton US (the “New Sub-Advisory Agreement”), to be effective on the Effective Date. In addition, the Adviser proposed amending the fund’s current management agreement (the “Current Management Agreement”) to reflect the engagement of Newton US as sub-investment adviser to the fund (as proposed to be amended, the “Amended Management Agreement”), to be effective on the Effective Date.
At the Meeting, the Adviser recommended the approval of the New Sub-Advisory Agreement, pursuant to which Newton US would serve as sub-investment adviser to the fund, and the Amended Management Agreement. The recommendation for the approval of the New Sub-Advisory Agreement and the Amended Management Agreement was based on the following considerations, among others: (i) approval of the New Sub-Advisory Agreement and the Amended Management Agreement would permit the fund’s current portfolio managers to continue to be responsible for the day-to-day management of the fund’s portfolio after the Effective Date as employees of Newton US; (ii) there will be no material changes to the fund’s investment objective, strategies or policies, no reduction in the nature or level of services provided to the fund, and no increases in the management fee payable by the fund as a result of the proposed changes to the investment advisory arrangements; and (iii) the rate of the sub-investment advisory fee payable by the Adviser to Newton US under the New Sub-Advisory Agreement will be the same as that currently payable by the Adviser to Mellon under the Current Sub-Advisory Agreement and all material terms and conditions of the New Sub-Advisory Agreement are substantially identical to those of the Current Sub-Advisory Agreement, and the Adviser (and not the fund) will pay Newton US for its sub-investment advisory services. The Board also considered the fact that the Adviser stated that it believes there are no material changes to the information the Board had previously considered at a Board meeting on March 8-9, 2021 (the “15(c) Meeting”), at which the Board re-approved the Current Sub-Advisory Agreement and the Current Management Agreement through September 30, 2021, other than the information about the Firm Realignment and Newton US.
46
At the Meeting, the Board members, none of whom are “interested persons” (as defined in the Investment Company Act of 1940, as amended (the “1940 Act”)) of the fund (the “Independent Directors”) considered and approved the New Sub-Advisory Agreement and the Amended Management Agreement. In determining whether to approve the New Sub-Advisory Agreement and the Amended Management Agreement, the Board considered the materials prepared by the Adviser received in advance of the Meeting and other information presented at the Meeting, which included: (i) a form of the New Sub-Advisory Agreement and a form of the Amended Management Agreement; (ii) information regarding the Firm Realignment and how it is expected to enhance investment capabilities; (iii) information regarding Newton US; and (iv) an opinion of counsel that the proposed changes to the investment advisory arrangements would not result in an “assignment” of the Current Sub-Advisory Agreement or the Current Management Agreement under the 1940 Act and the Investment Advisers Act of 1940, as amended, and, therefore, do not require the approval of fund shareholders. The Board also considered the substance of discussions with representatives of the Adviser at the Meeting and the 15(c) Meeting.
Nature, Extent and Quality of Services to be Provided. In examining the nature, extent and quality of the services that were expected to be provided by Newton US to the fund under the New Sub-Advisory Agreement, the Board considered: (i) Newton US’s organization, qualification and background, as well as the qualifications of its personnel; (ii) the expertise of the personnel providing portfolio management services, which would remain the same after the Effective Date; and (iii) the investment strategy for the fund, which would remain the same after the Effective Date. The Board also considered the review process undertaken by the Adviser and the Adviser’s favorable assessment of the nature and quality of the sub-investment advisory services expected to be provided to the fund by Newton US after the Effective Date. Based on their consideration and review of the foregoing information, the Board concluded that the nature, extent and quality of the sub-investment advisory services to be provided by Newton US under the New Sub-Advisory Agreement, as well as Newton US’s ability to render such services based on its resources and the experience of the investment team, which will include the fund’s current portfolio managers, were adequate and appropriate for the fund in light of the fund’s investment objective, and supported a decision to approve the New Sub-Advisory Agreement. The Board also considered, as it related to the Amended Management Agreement, that the nature, extent and quality of the services that are provided by the Adviser are expected to remain the same, including the Adviser’s extensive administrative, accounting and compliance infrastructures, as well as the Adviser’s supervisory activities over the fund’s portfolio management personnel.
Investment Performance. The Board had considered the fund’s investment performance and that of the investment team managing the fund’s portfolio at the 15(c) Meeting (including comparative data provided by Broadridge Financial Solutions, Inc. (“Broadridge”), an independent provider of investment company data). The Board considered the performance and that the same investment professionals would continue to manage the fund’s assets after the Effective Date, as factors in evaluating the services to be provided by Newton US under the New Sub-Advisory Agreement after the
47
INFORMATION ABOUT THE APPROVAL AND RENEWAL OF THE FUND’S MANAGEMENT AGREEMENT AND APPROVAL OF THE SUB-INVESTMENT ADVISORY AGREEMENT (Unaudited) (continued)
Effective Date, and determined that these factors, when viewed together with the other factors considered by the Board, supported a decision to approve the New Sub-Advisory Agreement and the Amended Management Agreement.
Costs of Services to be Provided and Profitability. The Board considered the proposed fee payable under the New Sub-Advisory Agreement (which was the same as that payable under the Current Sub-Advisory Agreement and had been considered at the 15(c) Meeting), noting that the proposed fee would be paid by the Adviser and, thus, would not impact the fees paid by the fund or the Adviser’s profitability. The Board considered the fee payable to Newton US in relation to the fee paid to the Adviser by the fund and the respective services provided by Newton US and the Adviser. The Board recognized that, because Newton US’s fee would be paid by the Adviser, and not the fund, an analysis of profitability was more appropriate in the context of the Board’s consideration of the fund’s Current Management Agreement, and that the Board had received and considered a profitability analysis of the Adviser and its affiliates, including Newton US, at the 15(c) Meeting. The Board concluded that the proposed fee payable to Newton US by the Adviser was appropriate and the Adviser’s profitability was not excessive in light of the nature, extent and quality of the services to be provided to the fund by the Adviser under the Amended Management Agreement and Newton US under the New Sub-Advisory Agreement.
Economies of Scale to be Realized. The Board recognized that, because the fee payable to Newton US would continue to be paid by the Adviser, and not the fund, an analysis of economies of scale was more appropriate in the context of the Board’s consideration of the Current Management Agreement, which had been done at the 15(c) Meeting. At the 15(c) Meeting, the Board determined that the economies of scale which may accrue to the Adviser and its affiliates in connection with the management of the fund had been adequately considered by the Adviser in connection with the fee rate charged to the fund pursuant to the Current Management Agreement and that, to the extent in the future it were determined that material economies of scale had not been shared with the fund, the Board would seek to have those economies of scale shared with the fund.
The Board also considered whether there were any ancillary benefits that would accrue to Newton US as a result of its relationship with the fund, and such ancillary benefits, if any, were determined to be reasonable.
In considering the materials and information described above, the Independent Directors received assistance from, and met separately with, their independent legal counsel, and were provided with a written description of their statutory responsibilities and the legal standards that are applicable to the approval of investment advisory and sub-investment advisory agreements.
After full consideration of the factors discussed above, with no single factor identified as being of paramount importance, the Board members, all of whom are Independent Directors, with the assistance of independent legal counsel, approved the New Sub-Advisory Agreement and Amended Management Agreement for the fund effective as of the Effective Date.
48
*******************************************************************************
At a meeting of the fund’s Board of Directors held on August 17, 2021, the Board considered the renewal of the fund’s Current Management Agreement pursuant to which the Adviser provides the fund with investment advisory and administrative services, and the Current Sub-Investment Advisory Agreement (together, the “Current Agreements”), pursuant to which Mellon (the “Subadviser”) provides day-to-day management of the fund’s investments. The Board members, all of whom are Independent Directors, were assisted in their review by independent legal counsel and met with counsel in executive session separate from representatives of the Adviser and the Subadviser. The fund may gain investment exposure to global commodity markets through investments in a wholly-owned and controlled subsidiary of the fund (the “Subsidiary”) that principally invests directly in commodity-related instruments, including futures and options contracts, swap agreements and other derivatives that provide exposure to the commodity markets. The Subsidiary has the same investment objective, investment adviser and sub-investment adviser as the fund, although the Subsidiary’s agreements with the Adviser and the Subadviser are not subject to approval by the Board. In considering the renewal of the Current Agreements, the Board considered several factors that it believed to be relevant, including those discussed below. The Board did not identify any one factor as dispositive, and each Board member may have attributed different weights to the factors considered.
Analysis of Nature, Extent, and Quality of Services Provided to the Fund. The Board considered information provided to it at the meeting and in previous presentations from representatives of the Adviser regarding the nature, extent, and quality of the services provided to funds in the BNY Mellon fund complex, including the fund. The Adviser provided the number of open accounts in the fund, the fund’s asset size and the allocation of fund assets among distribution channels. The Adviser also had previously provided information regarding the diverse intermediary relationships and distribution channels of funds in the BNY Mellon fund complex (such as retail direct or intermediary, in which intermediaries typically are paid by the fund and/or the Adviser) and the Adviser’s corresponding need for broad, deep, and diverse resources to be able to provide ongoing shareholder services to each intermediary or distribution channel, as applicable to the fund.
The Board also considered research support available to, and portfolio management capabilities of, the fund’s portfolio management personnel and that the Adviser also provides oversight of day-to-day fund operations, including fund accounting and administration and assistance in meeting legal and regulatory requirements. The Board also considered the Adviser’s extensive administrative, accounting and compliance infrastructures, as well as the Adviser’s supervisory activities over the Subadviser. The Board also considered portfolio management’s brokerage policies and practices (including policies and practices regarding soft dollars) and the standards applied in seeking best execution.
Comparative Analysis of the Fund’s Performance and Management Fee and Expense Ratio. The Board reviewed reports prepared by Broadridge based on classifications
49
INFORMATION ABOUT THE APPROVAL AND RENEWAL OF THE FUND’S MANAGEMENT AGREEMENT AND APPROVAL OF THE SUB-INVESTMENT ADVISORY AGREEMENT (Unaudited) (continued)
provided by Thomson Reuters Lipper, which included information comparing (1) the performance of the fund’s Class I shares with the performance of a group of institutional alternative global macro funds selected by Broadridge as comparable to the fund (the “Performance Group”) and with a broader group of funds consisting of all retail and institutional alternative global macro funds (the “Performance Universe”), all for various periods ended June 30, 2021, and (2) the fund’s actual and contractual management fees and total expenses with those of the same group of funds in the Performance Group (the “Expense Group”) and with a broader group of all institutional alternative global macro funds, excluding outliers (the “Expense Universe”), the information for which was derived in part from fund financial statements available to Broadridge as of the date of its analysis. The Adviser previously had furnished the Board with a description of the methodology Broadridge used to select the Performance Group and Performance Universe and the Expense Group and Expense Universe.
Performance Comparisons. Representatives of the Adviser stated that the usefulness of performance comparisons may be affected by a number of factors, including different investment limitations and policies that may be applicable to the fund and comparison funds and the end date selected. They also considered that performance generally should be considered over longer periods of time, although it is possible that long-term performance can be adversely affected by even one period of significant underperformance so that a single investment decision or theme has the ability to affect disproportionately long-term performance. The Board discussed with representatives of the Adviser and the Subadviser the results of the comparisons and considered that the fund’s total return performance was above the Performance Group median and at the Performance Universe median for the ten-year period and below the Performance Group and Performance Universe medians for all other periods. The Board considered the relative proximity of the fund’s performance to the Performance Group and/or Performance Universe median in certain periods when performance was below median and that the fund’s total return performance ranked in the third quartile of the Performance Group and Performance Universe for all periods when performance was below median. It also was noted that, based on its risk-adjusted returns, the fund had a five star Morningstar rating for the ten-year period and four star ratings overall and for the five-year period. The Adviser also provided a comparison of the fund’s calendar year total returns to the returns of the fund’s benchmark index, and it was noted that the fund’s returns were above the returns of the index in four of the ten calendar years shown.
Management Fee and Expense Ratio Comparisons. The Board reviewed and considered the contractual management fee rate payable by the fund to the Adviser in light of the nature, extent and quality of the management and sub-advisory services provided by the Adviser and the Subadviser, respectively. In addition, the Board reviewed and considered the actual management fee rate paid by the fund over the fund’s last fiscal year which included reductions for a fee waiver arrangement in place that reduced the investment advisory fee paid to the Adviser. The Board also reviewed the range of actual and contractual management fees and total expenses as a percentage of average
50
net assets of the Expense Group and Expense Universe funds and discussed the results of the comparisons.
The Board considered that the fund’s contractual management fee was higher than the Expense Group median contractual management fee, the fund’s actual management fee was higher than the Expense Group median and the Expense Universe median actual management fee and the fund’s total expenses were higher than the Expense Group median and the Expense Universe median total expenses.
Representatives of the Adviser stated that the Adviser has contractually agreed, until March 1, 2022, to waive receipt of its fees and/or assume the direct expenses of the fund so that the direct expenses of none of its classes (excluding Rule 12b-1 fees, shareholder services fees, taxes, interest, brokerage commissions, commitment fees on borrowings and extraordinary expenses) exceed 1.15% of the fund’s average daily net assets. In addition, the Adviser has contractually agreed, for so long as the fund invests in the Subsidiary, to waive the management fee it receives from the fund in the amount equal to the management fee paid to the Adviser by the Subsidiary.
Representatives of the Adviser reviewed with the Board the management or investment advisory fees paid to the Adviser or the Subadviser or its affiliates for advising the one separate account or other type of client portfolio that is considered to have similar investment strategies and policies as the fund (the “Similar Client”), and explained the nature of the Similar Client. They discussed differences in fees paid and the relationship of the fees paid in light of any differences in the services provided and other relevant factors. The Board considered the relevance of the fee information provided for the Similar Client to evaluate the appropriateness of the fund’s management fee. Representatives of the Adviser noted that there were no other funds advised or administered by the Adviser that are in the same Lipper category as the fund.
The Board considered the fee payable to the Subadviser in relation to the fee payable to the Adviser by the fund and the respective services provided by the Subadviser and the Adviser. The Board also took into consideration that the Subadviser’s fee is paid by the Adviser, out of its fee from the fund, and not the fund.
Analysis of Profitability and Economies of Scale. Representatives of the Adviser reviewed the expenses allocated and profit received by the Adviser and its affiliates and the resulting profitability percentage for managing the fund and the aggregate profitability percentage to the Adviser and its affiliates for managing the funds in the BNY Mellon fund complex, and the method used to determine the expenses and profit. The Board concluded that the profitability results were not excessive, given the services rendered and service levels provided by the Adviser and its affiliates. The Board also considered the expense limitation arrangement and its effect on the profitability of the Adviser and its affiliates. The Board also had been provided with information prepared by an independent consulting firm regarding the Adviser’s approach to allocating costs to, and determining the profitability of, individual funds and the entire BNY Mellon fund complex. The consulting firm also had analyzed where any economies of scale might emerge in connection with the management of a fund.
51
INFORMATION ABOUT THE APPROVAL AND RENEWAL OF THE FUND’S MANAGEMENT AGREEMENT AND APPROVAL OF THE SUB-INVESTMENT ADVISORY AGREEMENT (Unaudited) (continued)
The Board considered, on the advice of its counsel, the profitability analysis (1) as part of its evaluation of whether the fees under the Current Agreements, considered in relation to the mix of services provided by the Adviser and the Subadviser, including the nature, extent and quality of such services, supported the renewal of the Current Agreements and (2) in light of the relevant circumstances for the fund and the extent to which economies of scale would be realized if the fund grows and whether fee levels reflect these economies of scale for the benefit of fund shareholders. Since the Adviser, and not the fund, pays the Subadviser pursuant to the Sub-Investment Advisory Agreement, the Board did not consider the Subadviser’s profitability to be relevant to its deliberations. Representatives of the Adviser stated that a discussion of economies of scale is predicated on a fund having achieved a substantial size with increasing assets and that, if a fund’s assets had been stable or decreasing, the possibility that the Adviser may have realized any economies of scale would be less. Representatives of the Adviser also stated that, as a result of shared and allocated costs among funds in the BNY Mellon fund complex, the extent of economies of scale could depend substantially on the level of assets in the complex as a whole, so that increases and decreases in complex-wide assets can affect potential economies of scale in a manner that is disproportionate to, or even in the opposite direction from, changes in the fund’s asset level. The Board also considered potential benefits to the Adviser and the Subadviser from acting as investment adviser and sub-investment adviser, respectively, and took into consideration the soft dollar arrangements in effect for trading the fund’s investments.
At the conclusion of these discussions, the Board agreed that it had been furnished with sufficient information to make an informed business decision with respect to the renewal of the Current Agreements. Based on the discussions and considerations as described above, the Board concluded and determined as follows.
· The Board concluded that the nature, extent and quality of the services provided by the Adviser and the Subadviser are adequate and appropriate.
· The Board generally was satisfied with the fund’s improved performance.
· The Board concluded that the fees paid to the Adviser and the Subadviser continued to be appropriate under the circumstances and in light of the factors and the totality of the services provided as discussed above.
· The Board determined that the economies of scale which may accrue to the Adviser and its affiliates in connection with the management of the fund had been adequately considered by the Adviser in connection with the fee rate charged to the fund pursuant to the Agreement and that, to the extent in the future it were determined that material economies of scale had not been shared with the fund, the Board would seek to have those economies of scale shared with the fund.
In evaluating the Current Agreements, the Board considered these conclusions and determinations and also relied on its previous knowledge, gained through meetings and other interactions with the Adviser and its affiliates and the Subadviser, of the Adviser
52
and the Subadviser and the services provided to the fund by the Adviser and the Subadviser. The Board also relied on information received on a routine and regular basis throughout the year relating to the operations of the fund and the investment management and other services provided under the Current Agreements, including information on the investment performance of the fund in comparison to similar mutual funds and benchmark performance indices; general market outlook as applicable to the fund; and compliance reports. In addition, the Board’s consideration of the contractual fee arrangements for the fund had the benefit of a number of years of reviews of the Current Agreements for the fund, or substantially similar agreements for other BNY Mellon funds that the Board oversees, during which lengthy discussions took place between the Board and representatives of the Adviser. Certain aspects of the arrangements may receive greater scrutiny in some years than in others, and the Board’s conclusions may be based, in part, on their consideration of the fund’s arrangements, or substantially similar arrangements for other BNY Mellon funds that the Board oversees, in prior years. The Board determined to renew the Current Agreements for the remainder of the one-year term.
53
LIQUIDITY RISK MANAGEMENT PROGRAM (Unaudited)
Effective June 1, 2019, the fund adopted a liquidity risk management program (the “Liquidity Risk Management Program”) pursuant to the requirements of Rule 22e-4 under the Investment Company Act of 1940, as amended. Rule 22e-4 requires registered open-end funds, including mutual funds and exchange-traded funds but not money market funds, to establish liquidity risk management programs in order to effectively manage fund liquidity and shareholder redemptions. The rule is designed to mitigate the risk that a fund could not meet redemption requests without significantly diluting the interests of remaining investors.
The rule requires the fund to assess, manage and review their liquidity risk at least annually considering applicable factors such as investment strategy and liquidity during normal and foreseeable stressed conditions, including whether the strategy is appropriate for an open-end fund and whether the fund has a relatively concentrated portfolio or large positions in particular issuers. The fund must also assess its use of borrowings and derivatives, short-term and long-term cash flow projections in normal and stressed conditions, holdings of cash and cash equivalents, and borrowing arrangements and other funding sources.
The rule also requires the fund to classify its investments as highly liquid, moderately liquid, less liquid or illiquid based on the number of days the fund expects it would take to liquidate the investment, and to review these classifications at least monthly or more often under certain conditions. The periods range from three or fewer business days for a highly liquid investment to greater than seven calendar days for settlement of a less liquid investment. Illiquid investments are those a fund does not expect to be able to sell or dispose of within seven calendar days without significantly changing the market value. The fund is prohibited from acquiring an investment if, after the acquisition, its holdings of illiquid assets will exceed 15% of its net assets. In addition, if a fund permits redemptions in-kind, the rule requires the fund to establish redemption in-kind policies and procedures governing how and when it will engage in such redemptions.
Pursuant to the rule’s requirements, the Liquidity Risk Management Program has been reviewed and approved by the Board. Furthermore, the Board has received a written report prepared by the Program’s Administrator that addresses the operation of the Program, assesses its adequacy and effectiveness and describes any material changes made to the Program.
Assessment of Program
In the opinion of the Program Administrator, the Program approved by the Board continues to be adequate for the fund and the Program has been implemented effectively. The Program Administrator has monitored the fund’s liquidity risk and the liquidity classification of the securities held by the fund and has determined that the Program is operating effectively.
During the period from January 1, 2020 to December 31, 2020, there were no material changes to the Program and no material liquidity events that impacted the fund. During the period, the fund held sufficient highly liquid assets to meet fund redemptions.
Under normal expected foreseeable fund redemption forecasts and foreseeable stressed fund redemption forecasts, the Program Administrator believes that the fund maintains sufficient highly liquid assets to meet expected fund redemptions.
54
BOARD MEMBERS INFORMATION (Unaudited)
Independent Board Members
Joseph S. DiMartino (78)
Chairman of the Board (1995)
Principal Occupation During Past 5 Years:
· Director or Trustee of funds in the BNY Mellon Family of Funds and certain other entities (as described in the fund’s Statement of Additional Information) (1995-Present)
Other Public Company Board Memberships During Past 5 Years:
· CBIZ, Inc., a public company providing professional business services, products and solutions, Director (1997-Present)
No. of Portfolios for which Board Member Serves: 98
———————
Peggy C. Davis (78)
Board Member (2006)
Principal Occupation During Past 5 Years:
· Shad Professor of Law, New York University School of Law (1983-Present)
No. of Portfolios for which Board Member Serves: 35
———————
Gina D. France (63)
Board Member (2019)
Principal Occupation During Past 5 Years:
· France Strategic Partners, a strategy and advisory firm serving corporate clients across the United States, Founder, President and Chief Executive Officer (2003-Present)
Other Public Company Board Memberships During Past 5 Years:
· Huntington Bancshares, a bank holding company headquartered in Columbus, Ohio, Director (2016-Present)
· Cedar Fair, L.P., a publicly-traded partnership that owns and operates amusement parks and hotels in the U.S. and Canada, Director (2011-Present)
· CBIZ, Inc., a public company providing professional business services, products and solutions, Director (2015-Present)
· FirstMerit Corporation, a diversified financial services company, Director (2004-2016)
No. of Portfolios for which Board Member Serves: 25
———————
Joan Gulley (74)
Board Member (2017)
Principal Occupation During Past 5 Years:
· Nantucket Atheneum, public library, Chair (2018-June 2021) and Director (2015-June 2021)
· Orchard Island Club, golf and beach club, Governor (2016-Present)
No. of Portfolios for which Board Member Serves: 43
———————
55
BOARD MEMBERS INFORMATION (Unaudited) (continued)
Robin A. Melvin (58)
Board Member (2012)
Principal Occupation During Past 5 Years:
· Westover School, a private girls’ boarding school in Middlebury, Connecticut, Trustee (2019-Present)
· Mentor Illinois, a non-profit organization dedicated to increasing the quality of mentoring services in Illinois. Co-Chair (2014–2020); Board Member, Mentor Illinois (2013-2020)
· JDRF, a non-profit juvenile diabetes research foundation, Board Member (June 2021-Present)
Other Public Company Board Memberships During Past 5 Years:
· HPS Corporate Lending Fund, a closed-end management investment company regulated as a business development company, Trustee (August 2021-Present)
No. of Portfolios for which Board Member Serves: 76
———————
Once elected all Board Members serve for an indefinite term, but achieve Emeritus status upon reaching age 80. The address of the Board Members and Officers is c/o BNY Mellon Investment Adviser, Inc. 240 Greenwich Street, New York, New York 10286. Additional information about the Board Members is available in the fund’s Statement of Additional Information which can be obtained from the Adviser free of charge by calling this toll free number: 1-800-373-9387.
David P. Feldman, Emeritus Board Member
Ehud Houminer, Emeritus Board Member
Lynn Martin, Emeritus Board Member
Dr. Martin Peretz, Emeritus Board Member
Philip L. Toia, Emeritus Board Member
56
OFFICERS OF THE FUND (Unaudited)
DAVID DIPETRILLO, President since January 2021.
Vice President and Director of the Adviser since February 2021; Head of North America Product, BNY Mellon Investment Management since January 2018; Director of Product Strategy, BNY Mellon Investment Management from January 2016 to December 2017. He is an officer of 57 investment companies (comprised of 107 portfolios) managed by the Adviser or an affiliate of the Adviser. He is 43 years old and has been an employee of BNY Mellon since 2005.
JAMES WINDELS, Treasurer since November 2001.
Vice President of the Adviser since September 2020; Director - BNY Mellon Fund Administration, and an officer of 58 investment companies (comprised of 129 portfolios) managed by the Adviser or an affiliate of the Adviser. He is 63 years old and has been an employee of the Adviser since April 1985.
PETER M. SULLIVAN, Chief Legal Officer since July 2021 and Vice President and Assistant Secretary since March 2019.
Chief Legal Officer of the Adviser since July 2021, Associate General Counsel of BNY Mellon since July 2021; Senior Managing Counsel of BNY Mellon from December 2020 to July 2021; Managing Counsel of BNY Mellon from March 2009 to December 2020, and an officer of 58 investment companies (comprised of 129 portfolios) managed by the Adviser or an affiliate of the Adviser. He is 53 years old and has been an employee of BNY Mellon since April 2004.
JAMES BITETTO, Vice President since August 2005 and Secretary since February 2018.
Senior Managing Counsel of BNY Mellon since December 2019; Managing Counsel of BNY Mellon from April 2014 to December 2019; Secretary of the Adviser, and an officer of 58 investment companies (comprised of 129 portfolios) managed by the Adviser or an affiliate of the Adviser. He is 55 years old and has been an employee of the Adviser since December 1996.
DEIRDRE CUNNANE, Vice President and Assistant Secretary since March 2019.
Counsel of BNY Mellon since August 2018; Senior Regulatory Specialist at BNY Mellon Investment Management Services from February 2016 to August 2018. She is an officer of 58 investment companies (comprised of 129 portfolios) managed by the Adviser or an affiliate of the Adviser. She is 31 years old and has been an employee of the Adviser since August 2018.
SARAH S. KELLEHER, Vice President and Assistant Secretary since April 2014.
Vice President since February 2020 of BNY Mellon ETF Investment Adviser; LLC, Senior Managing Counsel of BNY Mellon since September 2021; Managing Counsel from December 2017 to September 2021; Senior Counsel of BNY Mellon from March 2013 to December 2017. She is an officer of 58 investment companies (comprised of 129 portfolios) managed by the Adviser or an affiliate of the Adviser. She is 46 years old and has been an employee of the Adviser since March 2013.
JEFF PRUSNOFSKY, Vice President and Assistant Secretary since August 2005.
Senior Managing Counsel of BNY Mellon, and an officer of 58 investment companies (comprised of 129 portfolios) managed by the Adviser or an affiliate of the Adviser. He is 56 years old and has been an employee of the Adviser since October 1990.
AMANDA QUINN, Vice President and Assistant Secretary since March 2020.
Counsel of BNY Mellon since June 2019; Regulatory Administration Manager at BNY Mellon Investment Management Services from September 2018 to May 2019; Senior Regulatory Specialist at BNY Mellon Investment Management Services from April 2015 to August 2018. She is an officer of 58 investment companies (comprised of 129 portfolios) managed by the Adviser or an affiliate of the Adviser. She is 36 years old and has been an employee of the Adviser since June 2019.
57
OFFICERS OF THE FUND (Unaudited) (continued)
NATALYA ZELENSKY, Vice President and Assistant Secretary since March 2017.
Chief Compliance Officer since August 2021 and Vice President since February 2020 of BNY Mellon ETF Investment Adviser, LLC; Chief Compliance Officer since August 2021 and Vice President and Assistant Secretary since February 2020 of BNY Mellon ETF Trust; Managing Counsel from December 2019 to August 2021 of BNY Mellon; Counsel from May 2016 to December 2019 of BNY Mellon; Assistant Secretary of the Adviser from April 2018 to August 2021. She is an officer of 57 investment companies (comprised of 128 portfolios) managed by the Adviser or an affiliate of the Adviser. She is 36 years old and has been an employee of BNY Mellon since May 2016.
GAVIN C. REILLY, Assistant Treasurer since December 2005.
Tax Manager-BNY Mellon Fund Administration, and an officer of 58 investment companies (comprised of 129 portfolios) managed by the Adviser or an affiliate of the Adviser. He is 53 years old and has been an employee of the Adviser since April 1991.
ROBERT SALVIOLO, Assistant Treasurer since July 2007.
Senior Accounting Manager–BNY Mellon Fund Administration, and an officer of 58 investment companies (comprised of 129 portfolios) managed by the Adviser or an affiliate of the Adviser. He is 54 years old and has been an employee of the Adviser since June 1989.
ROBERT SVAGNA, Assistant Treasurer since December 2002.
Senior Accounting Manager–BNY Mellon Fund Administration, and an officer of 58 investment companies (comprised of 129 portfolios) managed by the Adviser or an affiliate of the Adviser. He is 54 years old and has been an employee of the Adviser since November 1990.
JOSEPH W. CONNOLLY, Chief Compliance Officer since October 2004.
Chief Compliance Officer of the BNY Mellon Family of Funds and BNY Mellon Funds Trust since 2004, Chief Compliance Officer of the Adviser from 2004 until June 2021. He is an officer of 57 investment companies (comprised of 120 portfolios) managed by the Adviser. He is 64 years old.
CARIDAD M. CAROSELLA, Anti-Money Laundering Compliance Officer since January 2016.
Anti-Money Laundering Compliance Officer of the BNY Mellon Family of Funds and BNY Mellon Funds Trust. She is an officer of 50 investment companies (comprised of 121 portfolios) managed by the Adviser or an affiliate of the Adviser. She is 53 years old and has been an employee of the Distributor since 1997.
58
This page intentionally left blank.
59
This page intentionally left blank.
60
This page intentionally left blank.
61
BNY Mellon Dynamic Total Return Fund
240 Greenwich Street
New York, NY 10286
Adviser
BNY Mellon Investment Adviser, Inc.
240 Greenwich Street
New York, NY 10286
Sub-Adviser
Newton Investment Management
North America, LLC
BNY Mellon Center
201 Washington Place
Boston, MA 02108
Custodian
The Bank of New York Mellon
240 Greenwich Street
New York, NY 10286
Transfer Agent &
Dividend Disbursing Agent
BNY Mellon Transfer, Inc.
240 Greenwich Street
New York, NY 10286
Distributor
BNY Mellon Securities Corporation
240 Greenwich Street
New York, NY 10286
| | |
Ticker Symbols: | Class A: AVGAX Class C: AVGCX Class I: AVGRX Class Y: AVGYX |
Telephone Call your financial representative or 1-800-373-9387
Mail The BNY Mellon Family of Funds, 144 Glenn Curtiss Boulevard, Uniondale, NY 11556-0144
E-mail Send your request to info@bnymellon.com
Internet Information can be viewed online or downloaded at www.im.bnymellon.com
The fund files its complete schedule of portfolio holdings with the Securities and Exchange Commission (“SEC”) for the first and third quarters of each fiscal year on Form N-PORT. The fund’s Forms N-PORT are available on the SEC’s website at www.sec.gov.
A description of the policies and procedures that the fund uses to determine how to vote proxies relating to portfolio securities and information regarding how the fund voted these proxies for the most recent 12-month period ended June 30 is available at www.im.bnymellon.com and on the SEC’s website at www.sec.gov and without charge, upon request, by calling 1-800-373-9387.
| | |
© 2021 BNY Mellon Securities Corporation
6140AR1021 | 
|
BNY Mellon Global Dynamic Bond Income Fund
| |
ANNUAL REPORT October 31, 2021 |
| |
Save time. Save paper. View your next shareholder report online as soon as it’s available. Log into www.im.bnymellon.com and sign up for eCommunications. It’s simple and only takes a few minutes. |
| |
The views expressed in this report reflect those of the portfolio manager(s) only through the end of the period covered and do not necessarily represent the views of BNY Mellon Investment Adviser, Inc. or any other person in the BNY Mellon Investment Adviser, Inc. organization. Any such views are subject to change at any time based upon market or other conditions and BNY Mellon Investment Adviser, Inc. disclaims any responsibility to update such views. These views may not be relied on as investment advice and, because investment decisions for a fund in the BNY Mellon Family of Funds are based on numerous factors, may not be relied on as an indication of trading intent on behalf of any fund in the BNY Mellon Family of Funds. |
| |
Not FDIC-Insured • Not Bank-Guaranteed • May Lose Value |
Contents
THE FUND
FOR MORE INFORMATION
Back Cover
DISCUSSION OF FUND PERFORMANCE (Unaudited)
For the period from November 1, 2020 through October 31, 2021, as provided by portfolio managers Paul Brain, Parmeshwar Chadha, and Howard Cunningham of Newton Investment Management Limited, Sub-Investment Adviser.
Market and Fund Performance Overview
For the 12-month period ended October 31, 2021, BNY Mellon Global Dynamic Bond Income Fund’s Class A shares produced a total return of 1.71%, Class C shares returned 0.91%, Class I shares returned 1.96% and Class Y shares returned 2.18%.1 In comparison, the fund’s benchmark, the FTSE One-Month U.S. Treasury Bill Index (the “Index”), produced a total return of 0.04% for the same period.2
Global bond markets produced mixed performance during the period, with the negative impact of rising rates pitted against central bank accommodation, improving corporate earnings and economic re-openings. The fund outperformed the Index, largely due to positions in corporate bonds.
The Fund’s Investment Approach
The fund seeks total return (consisting of income and capital appreciation). To pursue its goal, the fund normally invests at least 80% of its net assets, plus any borrowings for investment purposes, in bonds and other instruments that provide investment exposure to global bond markets. The fund normally invests opportunistically in bonds and derivatives and other instruments that provide investment exposure to global bond and currency markets, in seeking to produce positive returns across economic cycles. The fund’s investments will be focused globally among the developed- and emerging-capital markets of the world. The fund ordinarily invests in at least three countries, and, at times, may invest a substantial portion of its assets in a single country.
The fund’s investments are focused globally among the developed and emerging capital markets of the world. The fund’s portfolio managers employ a dynamic approach in allocating the fund’s assets globally, principally among government bonds, foreign country sovereign debt, debt obligations of supranational entities, emerging market sovereign debt, investment grade and high yield (“junk”) corporate instruments, and currencies. Under normal market conditions, the fund invests significantly (at least 40% of its net assets) in issuers organized or located outside the United States, whose primary listing exchange for securities is located outside the United States, whose largest amount of revenues are derived from countries outside the United States or whose reporting currencies are other than U.S. dollars.
The fund’s portfolio managers have considerable latitude in allocating the fund’s investments and in selecting securities and derivative instruments to implement the fund’s investment approach. The fund, however, normally invests at least 10% of its net assets in each of government bonds, emerging market sovereign debt, and investment grade and high yield corporate instruments
2
Economic Improvement and Rising Rates Drive Bond Markets
November 2020 began with all eyes watching the approach of the U.S. election and market expectations of a ‘blue wave’ (Democrat control of both Congress and the White House). The election results, which were favorably received by the market, were quickly followed by news that the COVID-19 vaccines under development by Pfizer and Moderna had achieved efficacy rates above 90%. These positive developments drove a sharp sell-off in government bonds, as investors bet on an accelerating economic rebound, a trend soon accentuated by the rollout of COVID-19 vaccines and President Biden’s proposed US$1.9 trillion relief package. In early 2021, a spike in real yields drove bond-market volatility higher. Equity-market volatility followed suit, to the detriment of ‘risk’ appetite, particularly with respect to emerging markets as the U.S. dollar rallied. However, in the second quarter of 2021, volatility and inflation concerns moderated, supporting both government bonds and risk assets. Meanwhile, global growth continued to recover, with activity particularly strong in developed markets, aided by relatively advanced vaccination programs versus much of the developing world. Later in the period, concerns surfaced regarding the spread of the Delta variant of the COVID-19 virus. Emerging-markets corporate bonds also came under pressure due to widening concerns regarding a crisis in the Chinese real estate sector.
High Yield Holdings Drive Outperformance
The standout contribution to performance during the period came from the fund’s exposure to the high yield asset class. Within high yield, the fund saw positive performance across the board, with the strongest contributors in the lower-rated, single-B category. Travel-sector exposure made a strong contribution to relative performance, led by holding such as the American Airlines 2025 bond and the Carnival Corporation 2023 bond. The fund’s holdings in bank-contingent convertible capital instruments (CoCos) also enhanced performance.
The main detractors from performance included the fund’s exposure to government bonds as well as some emerging-markets sovereign bonds. Short positions in certain government bond markets, maintained through derivatives, helped offset some of these losses. The fund also maintained a short position in the U.S. dollar in the first half of the period, which detracted from performance. Toward the end of the period, the fund’s Chinese corporate real estate exposure, which represented less than 2% of portfolio, was undermined by the stress in the country’s overall real estate sector due to uncertainty regarding the potentially imminent default of Evergrande, the largest corporate borrower in the world.
Anticipating Global Growth
We believe bonds will continue to face headwinds into the year-end, with inflation remaining a key risk and the drumbeat of central banks’ hawkish statements getting louder. However, these trends may abate if evidence shows that the current inflation surge is transitory. While the impact of the slowdown in China needs watching, and growth is decelerating elsewhere, overall, we expect the economic backdrop to remain
3
DISCUSSION OF FUND PERFORMANCE (Unaudited) (continued)
supportive of higher-yielding, shorter-maturity corporate bonds. Given prevailing conditions, we favor high yield credit, floating-rate notes and inflation-linked securities.
Accordingly, as of the end of the reporting period, the fund is predominantly weighted toward high yield and shorter maturity corporate bonds, as well as maintaining some exposure to inflation-linked securities. In case of a sudden, unexpected slowdown in global growth, the fund also continues to hold U.S. Treasury 30-year bond call options as protection. Among currencies, the fund is long a small number of Euro-funded emerging-markets currencies in which we believe there is potential for appreciation.
November 15, 2021
1 Total return includes reinvestment of dividends and any capital gains paid and does not take into consideration the maximum initial sales charge in the case of Class A shares or the applicable contingent deferred sales charge imposed on redemptions in the case of Class C shares. Had these charges been reflected, returns would have been lower. Class I and Class Y shares are not subject to any initial or deferred sales charge. The fund’s return reflects the absorption of certain fund expenses by BNY Mellon Investment Adviser, Inc. pursuant to an agreement in effect through March 1, 2022, at which time it may be extended, modified or terminated. Had these expenses not been absorbed, returns would have been lower. Past performance is no guarantee of future results.
2 Source: Lipper Inc. — The FTSE One-Month U.S. Treasury Bill Index consists of the last, one-month, Treasury bill month-end rates. The FTSE One-Month U.S. Treasury Bill Index measures return equivalents of yield averages. The instruments are not marked to market. Investors cannot invest directly in any index.
Please note: the position in any security highlighted with italicized typeface was sold during the reporting period.
Bonds are subject generally to interest-rate, credit, liquidity and market risks, to varying degrees, all of which are more fully described in the fund’s prospectus. Generally, all other factors being equal, bond prices are inversely related to interest-rate changes, and rate increases can cause price declines.
Recent market risks include pandemic risks related to COVID-19. The effects of COVID-19 have contributed to increased volatility in global markets and will likely affect certain countries, companies, industries and market sectors more dramatically than others. To the extent the fund may overweight its investments in certain countries, companies, industries or market sectors, such positions will increase the fund’s exposure to risk of loss from adverse developments affecting those countries, companies, industries or sectors.
High yield bonds are subject to increased credit risk and are considered speculative in terms of the issuer’s perceived ability to continue making interest payments on a timely basis and to repay principal upon maturity.
Foreign bonds are subject to special risks, including exposure to currency fluctuations, changing political and economic conditions, and potentially less liquidity.
Investments in foreign currencies are subject to the risk that those currencies will decline in value relative to the U.S. dollar, or, in the case of hedged positions, that the U.S. dollar will decline relative to the currency being hedged. Currency rates in foreign countries may fluctuate significantly over short periods of time. A decline in the value of foreign currencies relative to the U.S. dollar will reduce the value of securities held by the fund and denominated in those currencies. The use of leverage may magnify the fund’s gains or losses. For derivatives with a leveraging component, adverse changes in the value or level of the underlying asset can result in a loss that is much greater than the original investment in the derivative.
The fund may at times invest a substantial portion of its assets in a single country.
The fund may, but is not required to, use derivative instruments. A small investment in derivatives could have a potentially large impact on the fund’s performance. The use of derivatives involves risks different from, or possibly greater than, the risks associated with investing directly in the underlying assets.
4
FUND PERFORMANCE (Unaudited)

Comparison of change in value of a $10,000 investment in Class A shares, Class C shares, and Class I shares of BNY Mellon Global Dynamic Bond Income Fund with a hypothetical investment of $10,000 in the FTSE One-Month U.S. Treasury Bill Index (the “Index”).
† Source: Lipper Inc.
Past performance is not predictive of future performance.
The above graph compares a hypothetical investment of $10,000 made in each of the Class A shares, Class C shares, and Class I shares of BNY Mellon Global Dynamic Bond Income Fund on 10/31/11 to a hypothetical investment of $10,000 made in the Index on that date. All dividends and capital gain distributions are reinvested.
The fund’s performance shown in the line graph above takes into account the maximum initial sales charge on Class A shares and all other applicable fees and expenses on Class A shares, Class C shares, and Class I shares. The Index consists of the last one-month Treasury bill month-end rates. The FTSE One-Month U.S. Treasury Bill Index measures return equivalents of yield averages. The instruments are not marked to market. Unlike a mutual fund, the Index is not subject to charges, fees and other expenses. Investors cannot invest directly in any index. Further information relating to fund performance, including expense reimbursements, if applicable, is contained in the Financial Highlights section of the prospectus and elsewhere in this report.
5
FUND PERFORMANCE (Unaudited) (continued)

Comparison of change in value of a $1,000,000 investment in Class Y shares of BNY Mellon Global Dynamic Bond Income Fund with a hypothetical investment of $1,000,000 in the FTSE One-Month U.S. Treasury Bill Index (the “Index”).
† Source: Lipper Inc.
†† The total return figures presented for Class Y shares of the fund reflect the performance of the fund’s Class A shares for the period prior to 7/1/13 (the inception date for Class Y shares), not reflecting the applicable sales charges for Class A shares.
Past performance is not predictive of future performance.
The above graph compares a hypothetical investment of $1,000,000 made in Class Y shares of BNY Mellon Global Dynamic Bond Income Fund on 10/31/11 to a hypothetical investment of $1,000,000 made in the Index on that date. All dividends and capital gain distributions are reinvested.
The fund’s performance shown in the line graph above takes into account all applicable fees and expenses of the fund’s Class Y shares. The Index consists of the last one-month Treasury bill month-end rates. The FTSE One-Month U.S. Treasury Bill Index measures return equivalents of yield averages. The instruments are not marked to market. Unlike a mutual fund, the Index is not subject to charges, fees and other expenses. Investors cannot invest directly in any index. Further information relating to fund performance, including expense reimbursements, if applicable, is contained in the Financial Highlights section of the prospectus and elsewhere in this report.
6
| | | | | | |
Average Annual Total Returns as of 10/31/2021 |
| Inception
Date | 1 Year | 5 Years | 10 Years | |
Class A shares | | | | | |
with maximum sales charge (4.5%) | 3/25/11 | -2.85% | 2.13% | 2.64% | |
without sales charge | 3/25/11 | 1.71% | 3.07% | 3.11% | |
Class C shares | | | | | |
with applicable redemption charge † | 3/25/11 | -0.09% | 2.29% | 2.34% | |
without redemption | 3/25/11 | 0.91% | 2.29% | 2.34% | |
Class I shares | 3/25/11 | 1.96% | 3.31% | 3.36% | |
Class Y shares | 7/1/13 | 2.18% | 3.37% | 3.36%†† | |
FTSE One-Month U.S. Treasury Bill Index | | 0.04% | 1.07% | 0.56% | |
† The maximum contingent deferred sales charge for Class C shares is 1% for shares redeemed within one year of the date of purchase.
†† The total return performance figures presented for Class Y shares of the fund reflect the performance of the fund’s Class A shares for the period prior to 7/1/13 (the inception date for Class Y shares), not reflecting the applicable sales charges for Class A shares.
The performance data quoted represents past performance, which is no guarantee of future results. Share price and investment return fluctuate and an investor’s shares may be worth more or less than original cost upon redemption. Current performance may be lower or higher than the performance quoted. Go to www.im.bnymellon.com for the fund’s most recent month-end returns.
The fund’s performance shown in the graphs and table does not reflect the deduction of taxes that a shareholder would pay on fund distributions or the redemption of fund shares. In addition to the performance of Class A shares shown with and without a maximum sales charge, the fund’s performance shown in the table takes into account all other applicable fees and expenses on all classes.
7
UNDERSTANDING YOUR FUND’S EXPENSES (Unaudited)
As a mutual fund investor, you pay ongoing expenses, such as management fees and other expenses. Using the information below, you can estimate how these expenses affect your investment and compare them with the expenses of other funds. You also may pay one-time transaction expenses, including sales charges (loads) and redemption fees, which are not shown in this section and would have resulted in higher total expenses. For more information, see your fund’s prospectus or talk to your financial adviser.
Review your fund’s expenses
The table below shows the expenses you would have paid on a $1,000 investment in BNY Mellon Global Dynamic Bond Income Fund from May 1, 2021 to October 31, 2021. It also shows how much a $1,000 investment would be worth at the close of the period, assuming actual returns and expenses.
| | | | | | | |
Expenses and Value of a $1,000 Investment | |
Assume actual returns for the six months ended October 31, 2021 | |
| | | | | | |
| | Class A | Class C | Class I | Class Y | |
Expenses paid per $1,000† | $5.29 | $9.05 | $4.03 | $3.18 | |
Ending value (after expenses) | $999.20 | $995.00 | $1,000.00 | $1,000.80 | |
COMPARING YOUR FUND’S EXPENSES
WITH THOSE OF OTHER FUNDS (Unaudited)
Using the SEC’s method to compare expenses
The Securities and Exchange Commission (“SEC”) has established guidelines to help investors assess fund expenses. Per these guidelines, the table below shows your fund’s expenses based on a $1,000 investment, assuming a hypothetical 5% annualized return. You can use this information to compare the ongoing expenses (but not transaction expenses or total cost) of investing in the fund with those of other funds. All mutual fund shareholder reports will provide this information to help you make this comparison. Please note that you cannot use this information to estimate your actual ending account balance and expenses paid during the period.
| | | | | | | |
Expenses and Value of a $1,000 Investment | |
Assuming a hypothetical 5% annualized return for the six months ended October 31, 2021 | |
| | | | | | |
| | Class A | Class C | Class I | Class Y | |
Expenses paid per $1,000† | $5.35 | $9.15 | $4.08 | $3.21 | |
Ending value (after expenses) | $1,019.91 | $1,016.13 | $1,021.17 | $1,022.03 | |
† | Expenses are equal to the fund’s annualized expense ratio of 1.05% for Class A, 1.80% for Class C, .80% for Class I and .63% for Class Y, multiplied by the average account value over the period, multiplied by 184/365 (to reflect the one-half year period). |
8
STATEMENT OF INVESTMENTS
October 31, 2021
| | | | | | | | | | |
| |
Description | Coupon
Rate (%) | | Maturity Date | | Principal Amount ($) | a | Value ($) | |
Bonds and Notes - 90.5% | | | | | |
Australia - 1.7% | | | | | |
Australia, Bonds, Ser. 133 | AUD | 5.50 | | 4/21/2023 | | 1,290,000 | | 1,040,145 | |
Australia, Sr. Unscd. Bonds, Ser. 25CI | AUD | 3.00 | | 9/20/2025 | | 1,340,000 | b | 1,480,114 | |
| | 2,520,259 | |
Austria - .2% | | | | | |
CA Immobilien Anlagen, Sr. Unscd. Notes | EUR | 0.88 | | 2/5/2027 | | 200,000 | | 231,793 | |
Azerbaijan - 1.1% | | | | | |
Azerbaijan, Sr. Unscd. Bonds | | 5.13 | | 9/1/2029 | | 693,000 | | 771,920 | |
Azerbaijan, Sr. Unscd. Notes | | 4.75 | | 3/18/2024 | | 734,000 | | 788,316 | |
| | 1,560,236 | |
Bahrain - .6% | | | | | |
Bahrain, Sr. Unscd. Notes | | 4.25 | | 1/25/2028 | | 881,000 | | 867,895 | |
Bolivia - .4% | | | | | |
Bolivia, Sr. Unscd. Notes | | 4.50 | | 3/20/2028 | | 700,000 | | 630,350 | |
British Virgin - .3% | | | | | |
Greenland Global Investment, Gtd. Notes | | 6.13 | | 4/22/2023 | | 640,000 | | 446,365 | |
Canada - 4.5% | | | | | |
Canada, Bonds | CAD | 4.00 | | 12/1/2031 | | 1,342,004 | b | 1,554,652 | |
Canada Housing Trust No. 1, Govt. Gtd. Bonds | CAD | 2.35 | | 9/15/2023 | | 5,340,000 | c | 4,414,177 | |
First Quantum Minerals, Gtd. Notes | | 6.88 | | 3/1/2026 | | 530,000 | c | 552,525 | |
| | 6,521,354 | |
Cayman Islands - 2.1% | | | | | |
Agile Group Holdings, Sr. Scd. Notes | | 6.70 | | 3/7/2022 | | 465,000 | d | 425,475 | |
Country Garden Holdings, Sr. Scd. Notes | | 7.13 | | 1/27/2022 | | 460,000 | | 462,064 | |
CSN Inova Ventures, Gtd. Notes | | 6.75 | | 1/28/2028 | | 329,000 | | 349,809 | |
Sable International Finance, Sr. Scd. Notes | | 5.75 | | 9/7/2027 | | 476,000 | c | 496,230 | |
Shimao Group Holdings, Sr. Scd. Bonds | | 4.75 | | 7/3/2022 | | 465,000 | | 450,985 | |
Wynn Macau, Sr. Unscd. Notes | | 5.50 | | 1/15/2026 | | 870,000 | | 819,444 | |
| | 3,004,007 | |
Chile - .5% | | | | | |
VTR Comunicaciones, Sr. Scd. Notes | | 4.38 | | 4/15/2029 | | 703,000 | c | 709,819 | |
Colombia - 2.1% | | | | | |
Colombia, Bonds | COP | 6.00 | | 4/28/2028 | | 2,876,000,000 | | 701,361 | |
Colombia, Bonds | COP | 7.00 | | 6/30/2032 | | 5,750,800,000 | | 1,417,890 | |
Colombia, Sr. Unscd. Notes | | 4.50 | | 3/15/2029 | | 880,000 | | 931,330 | |
| | 3,050,581 | |
9
STATEMENT OF INVESTMENTS (continued)
| | | | | | | | | | |
| |
Description | Coupon
Rate (%) | | Maturity Date | | Principal Amount ($) | a | Value ($) | |
Bonds and Notes - 90.5% (continued) | | | | | |
Czech Republic - 2.1% | | | | | |
Czech Republic, Bonds, Ser. 120 | CZK | 1.25 | | 2/14/2025 | | 39,050,000 | | 1,673,646 | |
Czech Republic, Bonds, Ser. 97 | CZK | 0.45 | | 10/25/2023 | | 32,770,000 | | 1,410,499 | |
| | 3,084,145 | |
Denmark - .1% | | | | | |
Orsted, Sub. Notes | GBP | 2.50 | | 2/18/2033 | | 132,000 | | 174,884 | |
Dominican Republic - .8% | | | | | |
Dominican Republic, Sr. Unscd. Bonds | | 7.45 | | 4/30/2044 | | 520,000 | | 620,755 | |
Dominican Republic, Sr. Unscd. Notes | | 4.88 | | 9/23/2032 | | 500,000 | | 506,875 | |
| | 1,127,630 | |
Ecuador - .4% | | | | | |
Ecuador, Sr. Unscd. Notes | | 0.00 | | 7/31/2030 | | 64,221 | c,e | 34,600 | |
Ecuador, Sr. Unscd. Notes | | 0.50 | | 7/31/2040 | | 224,730 | c | 134,978 | |
Ecuador, Sr. Unscd. Notes | | 1.00 | | 7/31/2035 | | 490,347 | c | 325,473 | |
Ecuador, Sr. Unscd. Notes | | 5.00 | | 7/31/2030 | | 187,110 | c | 155,769 | |
| | 650,820 | |
France - 6.3% | | | | | |
Altice France, Sr. Scd. Bonds | EUR | 4.13 | | 1/15/2029 | | 363,000 | | 414,033 | |
Altice France, Sr. Scd. Notes | EUR | 3.38 | | 1/15/2028 | | 143,000 | | 158,758 | |
Banijay Entertainment, Sr. Scd. Bonds | EUR | 3.50 | | 3/1/2025 | | 694,000 | | 802,529 | |
BNP Paribas, Jr. Sub. Notes | | 7.38 | | 8/19/2025 | | 550,000 | f | 631,507 | |
Chrome Bidco SASU, Sr. Scd. Bonds | EUR | 3.50 | | 5/31/2028 | | 186,000 | | 215,430 | |
Electricite de France, Jr. Sub. Notes | GBP | 6.00 | | 1/29/2026 | | 200,000 | f | 298,768 | |
France, Bonds | EUR | 0.10 | | 3/1/2025 | | 3,509,385 | b | 4,307,218 | |
Iliad Holding, Sr. Scd. Notes | EUR | 5.63 | | 10/15/2028 | | 313,000 | | 374,040 | |
Loxam, Sr. Scd. Notes | EUR | 2.88 | | 4/15/2026 | | 580,000 | | 660,923 | |
Picard Groupe SAS, Sr. Scd. Bonds | EUR | 3.88 | | 7/1/2026 | | 347,000 | | 403,084 | |
Societe Generale, Jr. Sub. Bonds | | 7.88 | | 12/18/2023 | | 800,000 | f | 883,440 | |
| | 9,149,730 | |
Germany - 1.7% | | | | | |
Infineon Technologies, Jr. Sub. Bonds | EUR | 3.63 | | 4/1/2028 | | 200,000 | f | 253,336 | |
Infineon Technologies, Jr. Sub. Notes | EUR | 2.88 | | 4/1/2025 | | 300,000 | f | 361,641 | |
KION Group, Sr. Unscd. Notes | EUR | 1.63 | | 9/24/2025 | | 300,000 | | 363,559 | |
PCF GmbH, Sr. Scd. Bonds | EUR | 4.75 | | 4/15/2026 | | 350,000 | | 412,469 | |
Peach Property Finance, Sr. Unscd. Notes | EUR | 4.38 | | 11/15/2025 | | 396,000 | | 468,322 | |
TK Elevator Midco GmbH, Sr. Scd. Bonds | EUR | 4.38 | | 7/15/2027 | | 563,000 | | 670,564 | |
| | 2,529,891 | |
Guernsey - .5% | | | | | |
Summit Properties, Sr. Unscd. Bonds | EUR | 2.00 | | 1/31/2025 | | 700,000 | | 792,478 | |
10
| | | | | | | | | | |
| |
Description | Coupon
Rate (%) | | Maturity Date | | Principal Amount ($) | a | Value ($) | |
Bonds and Notes - 90.5% (continued) | | | | | |
India - 1.0% | | | | | |
GMR Hyderabad International Airport, Sr. Scd. Notes | | 4.25 | | 10/27/2027 | | 776,000 | | 749,229 | |
Housing Development Finance, Sr. Unscd. Notes | INR | 8.22 | | 3/28/2022 | | 30,000,000 | | 404,826 | |
National Highways Authority of India, Sr. Unscd. Bonds | INR | 7.30 | | 5/18/2022 | | 20,000,000 | | 269,852 | |
| | 1,423,907 | |
Indonesia - 2.0% | | | | | |
Indonesia, Bonds, Ser. FR81 | IDR | 6.50 | | 6/15/2025 | | 23,277,000,000 | | 1,732,528 | |
Indonesia, Sr. Unscd. Notes | | 5.88 | | 1/15/2024 | | 1,050,000 | | 1,163,036 | |
| | 2,895,564 | |
Ireland - 1.2% | | | | | |
Bank of Ireland Group, Jr. Sub. Notes | EUR | 7.50 | | 11/19/2025 | | 280,000 | f | 377,572 | |
LCPR Senior Secured Financing DAC, Sr. Scd. Notes | | 5.13 | | 7/15/2029 | | 200,000 | c | 201,770 | |
Silverback Finance, Sr. Scd. Bonds | EUR | 3.13 | | 2/25/2037 | | 400,614 | | 483,735 | |
Virgin Media Vendor Financing Notes III, Gtd. Bonds | GBP | 4.88 | | 7/15/2028 | | 530,000 | | 729,230 | |
| | 1,792,307 | |
Italy - 2.4% | | | | | |
Cedacri Mergeco, Sr. Scd. Notes, 3 Month EURIBOR +4.63% | EUR | 4.63 | | 5/15/2028 | | 204,000 | g | 237,593 | |
Intesa Sanpaolo, Gtd. Notes | | 7.70 | | 9/17/2025 | | 325,000 | c,f | 363,594 | |
Leather 2, Sr. Scd. Bonds, 3 Month EURIBOR +4.50% | EUR | 4.50 | | 9/30/2028 | | 380,000 | g | 439,192 | |
Nexi, Sr. Unscd. Notes | EUR | 1.63 | | 4/30/2026 | | 624,000 | | 718,549 | |
Telecom Italia, Sr. Unscd. Notes | | 5.30 | | 5/30/2024 | | 400,000 | c | 426,500 | |
UniCredit, Jr. Sub. Bonds | | 8.00 | | 6/3/2024 | | 560,000 | f | 612,945 | |
UniCredit, Jr. Sub. Notes | EUR | 3.88 | | 6/3/2027 | | 600,000 | f | 667,326 | |
| | 3,465,699 | |
Japan - 1.6% | | | | | |
Japan, Bonds, Ser. 23 | JPY | 0.10 | | 3/10/2028 | | 175,350,300 | b | 1,590,191 | |
Softbank Group Corp., Sr. Unscd. Notes | EUR | 2.88 | | 1/6/2027 | | 610,000 | | 685,447 | |
| | 2,275,638 | |
Jersey - .5% | | | | | |
CPUK Finance, Scd. Notes | GBP | 4.88 | | 8/28/2025 | | 500,000 | | 686,829 | |
Luxembourg - 4.5% | | | | | |
Adler Group, Sr. Unscd. Notes | EUR | 2.25 | | 4/27/2027 | | 300,000 | | 302,193 | |
Adler Group, Sr. Unscd. Notes | EUR | 3.25 | | 8/5/2025 | | 300,000 | d | 322,004 | |
Albion Financing 1, Sr. Scd. Notes | EUR | 5.25 | | 10/15/2026 | | 119,000 | | 138,327 | |
Altice Financing, Sr. Scd. Bonds | EUR | 3.00 | | 1/15/2028 | | 340,000 | | 373,660 | |
AnaCap Financial Europe, Sr. Scd. Notes, 3 Month EURIBOR +5.00% | EUR | 5.00 | | 8/1/2024 | | 400,000 | g | 446,431 | |
11
STATEMENT OF INVESTMENTS (continued)
| | | | | | | | | | |
| |
Description | Coupon
Rate (%) | | Maturity Date | | Principal Amount ($) | a | Value ($) | |
Bonds and Notes - 90.5% (continued) | | | | | |
Luxembourg - 4.5% (continued) | | | | | |
CBRE Global Investors Open-Ended Fund SCA SICAV-SIF Pan European Core Fund, Sr. Unscd. Notes | EUR | 0.50 | | 1/27/2028 | | 294,000 | | 330,619 | |
Cirsa Finance International, Sr. Scd. Bonds | EUR | 4.75 | | 5/22/2025 | | 492,000 | | 567,344 | |
Dana Financing Luxembourg, Gtd. Notes | EUR | 3.00 | | 7/15/2029 | | 618,000 | | 719,470 | |
DH Europe Finance II, Gtd. Bonds | EUR | 0.45 | | 3/18/2028 | | 293,000 | | 336,829 | |
Kleopatra Finco, Sr. Scd. Bonds | EUR | 4.25 | | 3/1/2026 | | 410,000 | | 455,901 | |
Matterhorn Telecom, Sr. Scd. Notes | EUR | 3.13 | | 9/15/2026 | | 339,000 | | 388,416 | |
Millicom International Cellular, Sr. Unscd. Notes | | 4.50 | | 4/27/2031 | | 201,000 | c | 206,532 | |
Prologis International Funding II, Gtd. Notes | EUR | 1.63 | | 6/17/2032 | | 126,000 | | 153,193 | |
Sani/Ikos Financial Holdings 1 Sarl, Sr. Scd. Bonds | EUR | 5.63 | | 12/15/2026 | | 500,000 | | 591,005 | |
SELP Finance, Gtd. Bonds | EUR | 1.25 | | 10/25/2023 | | 535,000 | | 632,025 | |
Summer BC Holdco B, Sr. Scd. Bonds | EUR | 5.75 | | 10/31/2026 | | 536,000 | | 648,041 | |
| | 6,611,990 | |
Malaysia - 1.4% | | | | | |
Malaysia, Bonds, Ser. 419 | MYR | 3.83 | | 7/5/2034 | | 8,550,000 | | 2,001,594 | |
Mexico - 2.7% | | | | | |
Cemex, Gtd. Notes | | 3.88 | | 7/11/2031 | | 1,000,000 | | 1,004,950 | |
Mexican Bonos, Bonds, Ser. M | MXN | 7.75 | | 5/29/2031 | | 22,100,000 | | 1,090,981 | |
Mexican Bonos, Sr. Unscd. Bonds, Ser. M20 | MXN | 8.50 | | 5/31/2029 | | 21,724,100 | | 1,119,124 | |
Sigma Alimentos, Gtd. Bonds | EUR | 2.63 | | 2/7/2024 | | 536,000 | | 647,801 | |
| | 3,862,856 | |
Mongolia - .7% | | | | | |
Mongolia, Sr. Unscd. Bonds | | 5.13 | | 4/7/2026 | | 930,000 | | 966,878 | |
Netherlands - 4.3% | | | | | |
H&M Finance, Gtd. Notes | EUR | 0.25 | | 8/25/2029 | | 192,000 | | 215,105 | |
IHS Netherlands Holdco, Gtd. Notes | | 7.13 | | 3/18/2025 | | 675,000 | | 699,469 | |
ING Groep, Jr. Sub. Bonds | | 6.75 | | 4/16/2024 | | 850,000 | f | 926,225 | |
Nobel Bidco, Sr. Scd. Bonds | EUR | 3.13 | | 6/15/2028 | | 625,000 | | 696,306 | |
Nobian Finance BV, Sr. Scd. Bonds | EUR | 3.63 | | 7/15/2026 | | 867,000 | | 973,437 | |
Telefonica Europe, Gtd. Notes | EUR | 4.38 | | 3/14/2025 | | 400,000 | f | 498,113 | |
United Group, Sr. Scd. Notes | EUR | 4.88 | | 7/1/2024 | | 247,000 | | 289,093 | |
United Group, Sr. Scd. Notes, 3 Month EURIBOR +4.13% | EUR | 4.13 | | 5/15/2025 | | 370,000 | g | 428,948 | |
Volkswagen International Finance, Gtd. Notes | EUR | 3.88 | | 6/17/2029 | | 600,000 | f | 757,212 | |
Ziggo, Sr. Scd. Notes | | 5.50 | | 1/15/2027 | | 710,000 | c | 728,638 | |
| | 6,212,546 | |
12
| | | | | | | | | | |
| |
Description | Coupon
Rate (%) | | Maturity Date | | Principal Amount ($) | a | Value ($) | |
Bonds and Notes - 90.5% (continued) | | | | | |
New Zealand - 1.8% | | | | | |
New Zealand, Bonds, Ser. 551 | NZD | 2.75 | | 5/15/2051 | | 1,420,000 | | 968,002 | |
New Zealand, Bonds, Ser. 930 | NZD | 3.00 | | 9/20/2030 | | 1,750,000 | b | 1,719,560 | |
| | 2,687,562 | |
Oman - .3% | | | | | |
Oman, Sr. Unscd. Notes | | 4.88 | | 2/1/2025 | | 444,000 | | 463,994 | |
Qatar - .8% | | | | | |
Qatar, Sr. Unscd. Notes | | 3.40 | | 4/16/2025 | | 1,042,000 | | 1,116,545 | |
Singapore - .5% | | | | | |
Mulhacen, Sr. Scd. Bonds | EUR | 6.50 | | 8/1/2023 | | 422,840 | h | 406,806 | |
Singapore Airlines, Sr. Unscd. Notes | | 3.00 | | 7/20/2026 | | 328,000 | | 334,431 | |
| | 741,237 | |
Spain - 1.6% | | | | | |
Banco Bilbao Vizcaya Argentaria, Jr. Sub. Bonds | EUR | 5.88 | | 5/24/2022 | | 600,000 | f | 710,919 | |
Banco Santander, Jr. Sub. Bonds | EUR | 5.25 | | 9/29/2023 | | 400,000 | f | 485,520 | |
Cellnex Telecom, Sr. Unscd. Notes | EUR | 1.88 | | 6/26/2029 | | 600,000 | | 690,584 | |
Lorca Telecom Bondco, Sr. Scd. Bonds | EUR | 4.00 | | 9/18/2027 | | 431,000 | | 502,396 | |
| | 2,389,419 | |
Supranational - 6.6% | | | | | |
Ardagh Metal Packaging Finance USA, Sr. Unscd. Notes | EUR | 3.00 | | 9/1/2029 | | 277,000 | | 314,349 | |
Ardagh Metal Packaging Finance USA, Sr. Unscd. Notes | | 4.00 | | 9/1/2029 | | 495,000 | c | 492,847 | |
Asian Development Bank, Sr. Unscd. Notes | CNH | 2.72 | | 1/16/2023 | | 11,000,000 | | 1,713,651 | |
Asian Development Bank, Sr. Unscd. Notes | CNH | 2.90 | | 3/5/2024 | | 5,500,000 | | 854,916 | |
Asian Development Bank, Sr. Unscd. Notes, 3 Month SOFR +1.00% | | 1.05 | | 8/27/2026 | | 1,460,000 | g | 1,519,272 | |
Clarios Global, Sr. Scd. Bonds | EUR | 4.38 | | 5/15/2026 | | 555,000 | | 657,696 | |
European Bank for Reconstruction & Development, Sr. Unscd. Notes | IDR | 6.45 | | 12/13/2022 | | 17,800,000,000 | | 1,284,728 | |
International Bank for Reconstruction & Development, Sr. Unscd. Notes | GBP | 4.88 | | 12/7/2028 | | 870,000 | | 1,491,268 | |
International Finance, Sr. Unscd. Notes | INR | 6.30 | | 11/25/2024 | | 98,010,000 | | 1,341,234 | |
| | 9,669,961 | |
Sweden - 1.4% | | | | | |
Akelius Residential Property, Sub. Notes | EUR | 2.25 | | 5/17/2081 | | 640,000 | | 729,937 | |
Heimstaden Bostad, Jr. Sub. Bonds | EUR | 2.63 | | 5/1/2027 | | 450,000 | f | 493,113 | |
Samhallsbyggnadsbolaget i Norden, Jr. Sub. Notes | EUR | 2.63 | | 3/14/2026 | | 355,000 | f | 400,281 | |
13
STATEMENT OF INVESTMENTS (continued)
| | | | | | | | | | |
| |
Description | Coupon
Rate (%) | | Maturity Date | | Principal Amount ($) | a | Value ($) | |
Bonds and Notes - 90.5% (continued) | | | | | |
Sweden - 1.4% (continued) | | | | | |
Verisure Holding, Sr. Scd. Bonds | EUR | 3.25 | | 2/15/2027 | | 324,000 | | 374,081 | |
| | 1,997,412 | |
Switzerland - 1.1% | | | | | |
Credit Suisse Group, Jr. Sub. Notes | | 7.25 | | 9/12/2025 | | 570,000 | f | 632,694 | |
Credit Suisse Group, Jr. Sub. Notes | | 7.50 | | 12/11/2023 | | 340,000 | f | 371,450 | |
UBS Group, Jr. Sub. Bonds | | 5.00 | | 1/31/2023 | | 630,000 | f | 634,478 | |
| | 1,638,622 | |
United Kingdom - 14.2% | | | | | |
Anglian Water Services Financing, Sr. Scd. Notes | GBP | 1.63 | | 8/10/2025 | | 435,000 | | 606,024 | |
BCP V Modular Services Finance II, Sr. Scd. Bonds | EUR | 4.75 | | 11/30/2028 | | 296,000 | | 342,210 | |
Bellis Acquisition, Sr. Scd. Bonds | GBP | 3.25 | | 2/16/2026 | | 529,000 | | 695,070 | |
Coventry Building Society, Jr. Sub. Bonds | GBP | 6.88 | | 9/18/2024 | | 450,000 | f | 672,428 | |
Coventry Building Society, Sr. Unscd. Notes | GBP | 1.00 | | 9/21/2025 | | 640,000 | | 862,574 | |
Deuce Finco, Sr. Scd. Bonds | GBP | 5.50 | | 6/15/2027 | | 306,000 | | 417,081 | |
eG Global Finance, Sr. Scd. Notes | EUR | 4.38 | | 2/7/2025 | | 491,000 | | 561,854 | |
Heathrow Finance, Sr. Scd. Notes | GBP | 6.25 | | 3/3/2025 | | 266,000 | | 393,970 | |
Iceland Bondco, Sr. Scd. Bonds | GBP | 4.38 | | 5/15/2028 | | 250,000 | d | 299,798 | |
Iceland Bondco, Sr. Scd. Notes | GBP | 4.63 | | 3/15/2025 | | 350,000 | d | 442,469 | |
INEOS Quattro Finance 2, Sr. Scd. Bonds | EUR | 2.50 | | 1/15/2026 | | 236,000 | | 272,697 | |
International Finance Facility for Immunisation, Sr. Unscd. Notes | | 1.00 | | 4/21/2026 | | 869,000 | | 859,804 | |
Investec, Jr. Sub. Notes | GBP | 6.75 | | 12/5/2024 | | 400,000 | f | 570,453 | |
Iron Mountain UK, Gtd. Notes | GBP | 3.88 | | 11/15/2025 | | 289,000 | | 398,922 | |
Jerrold Finco, Sr. Scd. Bonds | GBP | 4.88 | | 1/15/2026 | | 165,000 | | 229,614 | |
Jerrold Finco, Sr. Scd. Bonds | GBP | 5.25 | | 1/15/2027 | | 375,000 | | 523,822 | |
Lloyds Banking Group, Jr. Sub. Bonds | EUR | 4.95 | | 6/27/2025 | | 550,000 | f | 693,779 | |
Lloyds Banking Group, Jr. Sub. Notes | GBP | 5.13 | | 12/27/2024 | | 760,000 | f | 1,081,624 | |
Mitchells & Butlers Finance, Scd. Bonds, Ser. B2 | GBP | 6.01 | | 12/15/2028 | | 421,939 | | 628,090 | |
National Express Group, Gtd. Notes | GBP | 2.38 | | 11/20/2028 | | 644,000 | | 894,049 | |
National Express Group, Gtd. Notes | GBP | 2.50 | | 11/11/2023 | | 520,000 | | 727,635 | |
National Express Group, Sub. Notes | GBP | 4.25 | | 11/26/2025 | | 160,000 | f | 224,328 | |
Nationwide Building Society, Jr. Sub. Bonds | GBP | 5.88 | | 6/20/2025 | | 650,000 | f | 962,946 | |
Natwest Group, Jr. Sub. Notes | | 6.00 | | 12/29/2025 | | 613,000 | f | 679,161 | |
Nomad Foods Bondco, Sr. Scd. Bonds | EUR | 2.50 | | 6/24/2028 | | 244,000 | | 280,775 | |
Ocado Group, Gtd. Notes | GBP | 3.88 | | 10/8/2026 | | 534,000 | | 715,287 | |
14
| | | | | | | | | | |
| |
Description | Coupon
Rate (%) | | Maturity Date | | Principal Amount ($) | a | Value ($) | |
Bonds and Notes - 90.5% (continued) | | | | | |
United Kingdom - 14.2% (continued) | | | | | |
Pinewood Finance, Sr. Scd. Bonds | GBP | 3.25 | | 9/30/2025 | | 287,000 | | 394,133 | |
Stonegate Pub Co. Financing, Sr. Scd. Bonds | GBP | 8.25 | | 7/31/2025 | | 303,000 | | 431,263 | |
TESCO, Sr. Unscd. Notes | GBP | 3.32 | | 11/5/2025 | | 100,000 | b | 294,355 | |
Tesco Property Finance 3, Sr. Scd. Bonds | GBP | 5.74 | | 4/13/2040 | | 141,002 | | 252,533 | |
Travis Perkins, Sr. Unscd. Notes | GBP | 3.75 | | 2/17/2026 | | 163,000 | | 232,759 | |
Tritax Big Box REIT, Sr. Unscd. Notes | GBP | 1.50 | | 11/27/2033 | | 389,000 | | 504,490 | |
Tritax EuroBox , Gtd. Notes | EUR | 0.95 | | 6/2/2026 | | 446,000 | | 517,726 | |
UNITE USAF II, Mortgage Backed Notes | GBP | 3.37 | | 6/30/2023 | | 500,000 | | 708,639 | |
Virgin Money UK, Sr. Unscd. Notes | GBP | 3.13 | | 6/22/2025 | | 580,000 | | 820,837 | |
Vmed O2 UK Financing I, Sr. Scd. Bonds | GBP | 4.00 | | 1/31/2029 | | 273,000 | | 369,785 | |
Vodafone Group, Jr. Sub. Bonds | EUR | 3.10 | | 1/3/2079 | | 120,000 | | 143,521 | |
Vodafone Group, Jr. Sub. Bonds | GBP | 4.88 | | 10/3/2078 | | 194,000 | | 281,117 | |
Vodafone Group, Jr. Sub. Notes | | 7.00 | | 4/4/2079 | | 400,000 | | 483,965 | |
Vodafone Group, Sub. Notes | | 3.25 | | 6/4/2081 | | 200,000 | | 200,344 | |
| | 20,671,931 | |
United States - 13.4% | | | | | |
American Airlines, Sr. Scd. Notes | | 11.75 | | 7/15/2025 | | 671,000 | c | 832,041 | |
Apple, Sr. Unscd. Notes | | 1.13 | | 5/11/2025 | | 684,000 | | 684,013 | |
Ball, Gtd. Notes | | 2.88 | | 8/15/2030 | | 360,000 | | 346,500 | |
Best Buy, Sr. Unscd. Notes | | 4.45 | | 10/1/2028 | | 398,000 | | 454,824 | |
CCO Holdings, Sr. Unscd. Notes | | 4.75 | | 3/1/2030 | | 281,000 | c | 290,484 | |
CCO Holdings, Sr. Unscd. Notes | | 5.50 | | 5/1/2026 | | 360,000 | c | 372,330 | |
Citigroup, Sub. Notes | | 5.50 | | 9/13/2025 | | 700,000 | | 798,717 | |
CommScope, Sr. Scd. Notes | | 6.00 | | 3/1/2026 | | 420,000 | c | 433,125 | |
Dell International, Gtd. Notes | | 7.13 | | 6/15/2024 | | 602,000 | c | 612,776 | |
Diamond Sports Group, Sr. Scd. Notes | | 5.38 | | 8/15/2026 | | 620,000 | c | 351,543 | |
Ford Motor Credit, Sr. Unscd. Notes | GBP | 2.75 | | 6/14/2024 | | 232,000 | | 318,523 | |
Ford Motor Credit, Sr. Unscd. Notes | | 3.37 | | 11/17/2023 | | 400,000 | | 411,000 | |
Ford Motor Credit, Sr. Unscd. Notes, 3 Month EURIBOR +.37% | EUR | 0.00 | | 12/1/2021 | | 600,000 | g | 693,454 | |
General Electric, Sr. Unscd. Notes | GBP | 6.44 | | 11/15/2022 | | 7,700 | | 10,766 | |
IQVIA, Gtd. Notes | EUR | 2.88 | | 6/15/2028 | | 622,000 | | 735,332 | |
Iron Mountain, Gtd. Notes | | 4.50 | | 2/15/2031 | | 388,000 | c | 392,382 | |
JPMorgan Chase & Co., Sr. Unscd. Notes | | 2.08 | | 4/22/2026 | | 1,000,000 | | 1,020,334 | |
Lumen Technologies, Sr. Unscd. Notes, Ser. T | | 5.80 | | 3/15/2022 | | 800,000 | | 810,104 | |
Mauser Packaging Solutions Holding, Sr. Scd. Notes | | 5.50 | | 4/15/2024 | | 500,000 | c | 501,725 | |
15
STATEMENT OF INVESTMENTS (continued)
| | | | | | | | | | |
| |
Description | Coupon
Rate (%) | | Maturity Date | | Principal Amount ($) | a | Value ($) | |
Bonds and Notes - 90.5% (continued) | | | | | |
United States - 13.4% (continued) | | | | | |
Metropolitan Life Global Funding I, Sr. Scd. Notes | | 0.70 | | 9/27/2024 | | 469,000 | | 466,134 | |
Metropolitan Life Global Funding I, Sr. Scd. Notes | | 0.70 | | 9/27/2024 | | 307,000 | c | 305,124 | |
Mileage Plus Holdings, Sr. Scd. Notes | | 6.50 | | 6/20/2027 | | 90,000 | c | 98,065 | |
Mozart Debt Merger Sub, Sr. Scd. Notes | | 3.88 | | 4/1/2029 | | 281,000 | c | 279,946 | |
Mozart Debt Merger Sub, Sr. Unscd. Notes | | 5.25 | | 10/1/2029 | | 122,000 | c | 123,983 | |
Netflix, Sr. Unscd. Notes | EUR | 3.63 | | 6/15/2030 | | 425,000 | | 588,351 | |
NextEra Energy Capital Holdings, Gtd. Notes | | 3.25 | | 4/1/2026 | | 101,000 | | 107,910 | |
Olympus Water US Holding Corp., Sr. Scd. Notes | EUR | 3.88 | | 10/1/2028 | | 200,000 | | 230,635 | |
Olympus Water US Holding Corp., Sr. Unscd. Notes | EUR | 5.38 | | 10/1/2029 | | 375,000 | | 421,167 | |
Pacific Life Global Funding II, Scd. Notes | | 1.38 | | 4/14/2026 | | 970,000 | | 969,330 | |
PG&E, Sr. Scd. Notes | | 5.00 | | 7/1/2028 | | 660,000 | | 687,225 | |
Radiate Holdco, Sr. Scd. Notes | | 4.50 | | 9/15/2026 | | 375,000 | c | 381,484 | |
Sprint, Gtd. Notes | | 7.88 | | 9/15/2023 | | 260,000 | | 288,600 | |
Sprint Capital, Gtd. Notes | | 8.75 | | 3/15/2032 | | 338,000 | | 506,324 | |
Sprint Communications, Gtd. Notes | | 11.50 | | 11/15/2021 | | 235,000 | | 236,140 | |
T-Mobile USA, Gtd. Notes | | 3.38 | | 4/15/2029 | | 471,000 | | 484,541 | |
U.S. Treasury Inflation Indexed Notes, US CPI Urban Consumers Not Seasonally Adjusted | | 0.63 | | 4/15/2023 | | 1,376,687 | b | 1,447,859 | |
Verizon Communications, Sr. Unscd. Notes, 3 Month SOFR +.79% | | 0.84 | | 3/20/2026 | | 491,000 | g | 500,116 | |
Viatris, Gtd. Notes | | 2.30 | | 6/22/2027 | | 150,000 | c | 151,590 | |
Windstream Escrow, Sr. Scd. Notes | | 7.75 | | 8/15/2028 | | 402,000 | c,d | 425,710 | |
Zayo Group Holdings, Sr. Scd. Notes | | 4.00 | | 3/1/2027 | | 660,000 | c | 641,850 | |
| | 19,412,057 | |
Uzbekistan - .9% | | | | | |
Uzbekistan, Sr. Unscd. Notes | | 4.75 | | 2/20/2024 | | 1,300,000 | | 1,363,824 | |
Vietnam - .2% | | | | | |
Vietnam, Sr. Unscd. Bonds | | 4.80 | | 11/19/2024 | | 213,000 | | 234,248 | |
Total Bonds and Notes
(cost $131,798,446) | | 131,634,857 | |
Description /Number of Contracts | Exercise
Price | | Expiration Date | | Notional Amount ($) | | Value ($) | |
Options Purchased - .1% | | | | | |
Call Options - .1% | | | | | |
U.S. Treasury Bond, Contracts 22 | | 162.00 | | 11/26/2021 | | 2,200,000 | | 24,063 | |
16
| | | | | | | | | | |
| |
Description /Number of Contracts | Exercise
Price | | Expiration Date | | Notional Amount ($) | | Value ($) | |
Options Purchased - .1% (continued) | | | | | |
Call Options - .1% (continued) | | | | | |
U.S. Treasury Bond, Contracts 33 | | 159.00 | | 11/26/2021 | | 3,300,000 | | 91,265 | |
Total Options Purchased
(cost $68,622) | | 115,328 | |
Description | | | | | Shares | | | |
Exchange-Traded Funds - 1.7% | | | | | |
United States - 1.7% | | | | | |
iShares iBoxx High Yield Corporate Bond ETF | | | | | | 11,668 | | 1,014,299 | |
SPDR Bloomberg Emerging Markets Local Bond ETF | | | | | | 58,232 | | 1,449,394 | |
Total Exchange-Traded Funds
(cost $2,522,006) | | 2,463,693 | |
| | 1-Day
Yield (%) | | | | | | | |
Investment Companies - 5.2% | | | | | |
Registered Investment Companies - 5.2% | | | | | |
Dreyfus Institutional Preferred Government Plus Money Market Fund, Institutional Shares
(cost $7,554,811) | | 0.06 | | | | 7,554,811 | i | 7,554,811 | |
17
STATEMENT OF INVESTMENTS (continued)
| | | | | | | | | | |
| |
Description | 1-Day
Yield (%) | | | | Shares | | Value ($) | |
Investment of Cash Collateral for Securities Loaned - 1.0% | | | | | |
Registered Investment Companies - 1.0% | | | | | |
Dreyfus Institutional Preferred Government Plus Money Market Fund, SL Shares
(cost $1,458,222) | | 0.02 | | | | 1,458,222 | i | 1,458,222 | |
Total Investments (cost $143,402,107) | | 98.5% | 143,226,911 | |
Cash and Receivables (Net) | | 1.5% | 2,173,239 | |
Net Assets | | 100.0% | 145,400,150 | |
ETF—Exchange-Traded Fund
EURIBOR—Euro Interbank Offered Rate
REIT—Real Estate Investment Trust
SOFR—Secured Overnight Financing Rate
SPDR—Standard & Poor's Depository Receipt
AUD—Australian Dollar
CAD—Canadian Dollar
COP—Colombian Peso
CZK—Czech Koruna
EUR—Euro
GBP—British Pound
IDR—Indonesian Rupiah
INR—Indian Rupee
JPY—Japanese Yen
MXN—Mexican Peso
MYR—Malaysian Ringgit
NZD—New Zealand Dollar
a Amount stated in U.S. Dollars unless otherwise noted above.
b Principal amount for accrual purposes is periodically adjusted based on changes in the Consumer Price Index.
c Security exempt from registration pursuant to Rule 144A under the Securities Act of 1933. These securities may be resold in transactions exempt from registration, normally to qualified institutional buyers. At October 31, 2021, these securities were valued at $15,437,610 or 10.62% of net assets.
d Security, or portion thereof, on loan. At October 31, 2021, the value of the fund’s securities on loan was $1,380,711 and the value of the collateral was $1,458,222. In addition, the value of collateral may include peding sales that are also on loan.
e Security issued with a zero coupon. Income is recognized through the accretion of discount.
f Security is a perpetual bond with no specified maturity date. Maturity date shown is next reset date of the bond.
g Variable rate security—interest rate resets periodically and rate shown is the interest rate in effect at period end. Security description also includes the reference rate and spread if published and available.
h Payment-in-kind security and interest may be paid in additional par.
i Investment in affiliated issuer. The investment objective of this investment company is publicly available and can be found within the investment company’s prospectus.
18
| | |
Portfolio Summary (Unaudited) † | Value (%) |
Foreign Governmental | 27.2 |
Banks | 10.6 |
Investment Companies | 7.9 |
Telecommunication Services | 6.8 |
Supranational Bank | 6.2 |
Real Estate | 5.8 |
Consumer Discretionary | 3.6 |
Media | 2.8 |
Automobiles & Components | 2.7 |
Food Products | 2.6 |
Industrial | 2.5 |
Diversified Financials | 2.4 |
Retailing | 1.6 |
Commercial & Professional Services | 1.5 |
Materials | 1.5 |
Chemicals | 1.3 |
Utilities | 1.3 |
Transportation | 1.3 |
Health Care | 1.3 |
Insurance | 1.2 |
U.S. Treasury Securities | 1.0 |
Building Materials | 1.0 |
Internet Software & Services | .9 |
Technology Hardware & Equipment | .9 |
Airlines | .9 |
Metals & Mining | .6 |
Advertising | .4 |
Semiconductors & Semiconductor Equipment | .4 |
Information Technology | .2 |
Options Purchased | .1 |
| | 98.5 |
† Based on net assets.
See notes to financial statements.
19
STATEMENT OF INVESTMENTS IN AFFILIATED ISSUERS
| | | | | | | |
Investment Companies | Value
10/31/20($) | Purchases($)† | Sales ($) | Value
10/31/21($) | Net
Assets(%) | Dividends/
Distributions($) |
Registered Investment Companies; | | | |
Dreyfus Institutional Preferred Government Plus Money Market Fund, Institutional Shares | 1,443,494 | 110,760,253 | (104,648,936) | 7,554,811 | 5.2 | 3,863 |
Investment of Cash Collateral for Securities Loaned:†† | | |
Dreyfus Institutional Preferred Government Plus Money Market Fund, Institutional Shares | 2,229,178 | 3,307,333 | (5,536,511) | - | - | - |
Dreyfus Institutional Preferred Government Plus Money Market Fund, SL Shares | - | 41,391,492 | (39,933,270) | 1,458,222 | 1.0 | 14,813††† |
Total | 3,672,672 | 155,459,078 | (150,118,717) | 9,013,033 | 6.2 | 18,676 |
† Includes reinvested dividends/distributions.
†† Effective November 9, 2020, cash collateral for securities lending was transferred from Dreyfus Institutional Preferred Government Plus Money Market Fund, Institutional Shares to Dreyfus Institutional Preferred Government Plus Money Market Fund, SL Shares.
††† Represents securities lending income earned from the reinvestment of cash collateral from loaned securities, net of fees and collateral investment expenses, and other payments to and from borrowers of securities.
See notes to financial statements.
20
STATEMENT OF FUTURES
October 31, 2021
| | | | | | | |
Description | Number of
Contracts | Expiration | Notional
Value ($) | Market
Value ($) | Unrealized Appreciation (Depreciation) ($) | |
Futures Short | | |
Euro-Bond | 32 | 12/8/2021 | 6,386,613a | 6,219,095 | 167,518 | |
Long Gilt | 22 | 12/29/2021 | 3,832,680a | 3,761,104 | 71,576 | |
U.S. Treasury 5 Year Notes | 55 | 12/31/2021 | 6,692,196 | 6,696,250 | (4,054) | |
Gross Unrealized Appreciation | | 239,094 | |
Gross Unrealized Depreciation | | (4,054) | |
a Notional amounts in foreign currency have been converted to USD using relevant foreign exchange rates.
See notes to financial statements.
21
STATEMENT OF FORWARD FOREIGN CURRENCY EXCHANGE CONTRACTS October 31, 2021
| | | | | | |
Counterparty/ Purchased
Currency | Purchased Currency
Amounts | Currency
Sold | Sold
Currency
Amounts | Settlement Date | Unrealized Appreciation (Depreciation) ($) |
CIBC World Markets |
Indian Rupee | 8,367,000 | United States Dollar | 111,664 | 11/16/2021 | (151) |
Euro | 652,798 | United States Dollar | 771,780 | 11/16/2021 | (16,889) |
United States Dollar | 3,310,532 | Euro | 2,841,101 | 11/16/2021 | 25,100 |
British Pound | 500,523 | United States Dollar | 689,671 | 11/16/2021 | (4,672) |
United States Dollar | 6,039,839 | Canadian Dollar | 7,557,968 | 11/16/2021 | (67,046) |
Citigroup |
United States Dollar | 148,674 | British Pound | 107,034 | 11/16/2021 | 2,191 |
HSBC |
United States Dollar | 2,354,581 | Mexican Peso | 47,572,603 | 11/16/2021 | 50,163 |
United States Dollar | 1,503,508 | South African Rand | 21,900,558 | 11/16/2021 | 72,739 |
United States Dollar | 25,035,702 | British Pound | 18,033,415 | 11/16/2021 | 355,757 |
RBS Securities |
British Pound | 906,203 | United States Dollar | 1,249,809 | 11/16/2021 | (9,609) |
United States Dollar | 360,850 | British Pound | 265,283 | 11/16/2021 | (2,207) |
United States Dollar | 982,465 | New Zealand Dollar | 1,399,375 | 11/16/2021 | (20,095) |
Euro | 1,024,626 | United States Dollar | 1,185,261 | 11/16/2021 | (389) |
United States Dollar | 451,017 | Euro | 390,145 | 11/16/2021 | (145) |
Norwegian Krone | 1,322,306 | United States Dollar | 154,305 | 11/16/2021 | 2,204 |
United States Dollar | 149,630 | Norwegian Krone | 1,322,286 | 11/16/2021 | (6,876) |
State Street Bank and Trust Company |
Hungarian Forint | 661,891,639 | United States Dollar | 2,201,611 | 11/16/2021 | (76,888) |
United States Dollar | 1,629,400 | Japanese Yen | 178,477,010 | 11/16/2021 | 63,283 |
United States Dollar | 2,190,533 | Indian Rupee | 165,035,817 | 11/16/2021 | (9,013) |
British Pound | 1,363,463 | United States Dollar | 1,856,023 | 11/16/2021 | 9,968 |
22
| | | | | | |
Counterparty/ Purchased
Currency | Purchased Currency
Amounts | Currency
Sold | Sold
Currency
Amounts | Settlement Date | Unrealized Appreciation (Depreciation) ($) |
State Street Bank and Trust Company(continued) |
United States Dollar | 247,316 | British Pound | 179,858 | 11/16/2021 | 1,169 |
United States Dollar | 2,615,814 | Chinese Yuan Renminbi | 17,018,484 | 11/16/2021 | (40,171) |
Australian Dollar | 5,522,819 | United States Dollar | 4,112,444 | 11/16/2021 | 42,394 |
United States Dollar | 3,763,895 | Australian Dollar | 5,101,661 | 11/16/2021 | (74,104) |
South Korean Won | 1,577,205,000 | United States Dollar | 1,378,193 | 11/16/2021 | (29,149) |
Canadian Dollar | 2,740,818 | United States Dollar | 2,187,270 | 11/16/2021 | 27,328 |
United States Dollar | 2,159,805 | Canadian Dollar | 2,669,725 | 11/16/2021 | 2,651 |
United States Dollar | 1,484,120 | Czech Koruna | 31,833,112 | 11/16/2021 | 51,616 |
Philippine Peso | 112,062,087 | United States Dollar | 2,205,513 | 11/16/2021 | 16,784 |
United States Dollar | 2,204,211 | Philippine Peso | 112,062,087 | 11/16/2021 | (18,086) |
United States Dollar | 2,040,355 | Malaysian Ringgit | 8,567,652 | 11/16/2021 | (26,952) |
Singapore Dollar | 2,991,292 | United States Dollar | 2,219,845 | 11/16/2021 | (1,779) |
United States Dollar | 2,193,206 | Singapore Dollar | 2,991,241 | 11/16/2021 | (24,822) |
United States Dollar | 1,134,531 | Indonesian Rupiah | 16,611,808,458 | 11/16/2021 | (36,020) |
Mexican Peso | 36,260,919 | United States Dollar | 1,805,068 | 11/16/2021 | (48,588) |
United States Dollar | 3,198,750 | New Zealand Dollar | 4,482,384 | 11/16/2021 | (12,583) |
Colombian Peso | 8,138,647,600 | United States Dollar | 2,143,950 | 11/16/2021 | 14,515 |
United States Dollar | 2,110,645 | Colombian Peso | 8,138,647,600 | 11/16/2021 | (47,820) |
United States Dollar | 726,039 | South African Rand | 10,871,347 | 11/16/2021 | 15,811 |
Euro | 4,821,973 | United States Dollar | 5,669,281 | 11/16/2021 | (93,181) |
United States Dollar | 49,758,346 | Euro | 41,929,914 | 11/16/2021 | 1,270,849 |
UBS Securities |
Euro | 129,609 | United States Dollar | 153,040 | 11/16/2021 | (3,160) |
United States Dollar | 1,823,328 | Czech Koruna | 39,213,693 | 11/16/2021 | 58,695 |
23
STATEMENT OF FORWARD FOREIGN CURRENCY EXCHANGE CONTRACTS (continued)
| | | | | | |
Counterparty/ Purchased
Currency | Purchased Currency
Amounts | Currency
Sold | Sold
Currency
Amounts | Settlement Date | Unrealized Appreciation (Depreciation) ($) |
UBS Securities(continued) |
United States Dollar | 1,395,794 | New Zealand Dollar | 1,977,627 | 11/16/2021 | (21,046) |
Swedish Krona | 4,665 | United States Dollar | 542 | 11/16/2021 | 1 |
Gross Unrealized Appreciation | | | 2,083,218 |
Gross Unrealized Depreciation | | | (691,441) |
See notes to financial statements.
24
STATEMENT OF ASSETS AND LIABILITIES
October 31, 2021
| | | | | | | |
| | | | | | |
| | | Cost | | Value | |
Assets ($): | | | | |
Investments in securities—See Statement of Investments
(including securities on loan, valued at $1,380,711)—Note 1(c): | | | |
Unaffiliated issuers | 134,389,074 | | 134,213,878 | |
Affiliated issuers | | 9,013,033 | | 9,013,033 | |
Cash denominated in foreign currency | | | 87,915 | | 88,102 | |
Unrealized appreciation on forward foreign
currency exchange contracts—Note 4 | | 2,083,218 | |
Receivable for investment securities sold | | 1,702,379 | |
Dividends, interest and securities lending income receivable | | 1,590,519 | |
Cash collateral held by broker—Note 4 | | 225,533 | |
Receivable for shares of Common Stock subscribed | | 119,548 | |
Receivable for futures variation margin—Note 4 | | 50,645 | |
Tax reclaim receivable—Note 1(b) | | 16,197 | |
Prepaid expenses | | | | | 25,361 | |
| | | | | 149,128,413 | |
Liabilities ($): | | | | |
Due to BNY Mellon Investment Adviser, Inc. and affiliates—Note 3(c) | | 43,849 | |
Cash overdraft due to Custodian | | | | | 20,290 | |
Liability for securities on loan—Note 1(c) | | 1,458,222 | |
Payable for investment securities purchased | | 1,353,073 | |
Unrealized depreciation on forward foreign
currency exchange contracts—Note 4 | | 691,441 | |
Payable for shares of Common Stock redeemed | | 22,024 | |
Directors’ fees and expenses payable | | 3,225 | |
Other accrued expenses | | | | | 136,139 | |
| | | | | 3,728,263 | |
Net Assets ($) | | | 145,400,150 | |
Composition of Net Assets ($): | | | | |
Paid-in capital | | | | | 144,007,844 | |
Total distributable earnings (loss) | | | | | 1,392,306 | |
Net Assets ($) | | | 145,400,150 | |
| | | | | | |
Net Asset Value Per Share | Class A | Class C | Class I | Class Y | |
Net Assets ($) | 4,392,711 | 193,451 | 45,867,704 | 94,946,284 | |
Shares Outstanding | 357,375 | 16,029 | 3,711,124 | 7,667,206 | |
Net Asset Value Per Share ($) | 12.29 | 12.07 | 12.36 | 12.38 | |
| | | | | |
See notes to financial statements. | | | | | |
25
STATEMENT OF OPERATIONS
Year Ended October 31, 2021
| | | | | | | |
| | | | | | |
| | | | | | |
Investment Income ($): | | | | |
Income: | | | | |
Interest (net of $13,413 foreign taxes withheld at source) | | | 4,336,513 | |
Dividends: | |
Unaffiliated issuers | | | 294,511 | |
Affiliated issuers | | | 3,863 | |
Income from securities lending—Note 1(c) | | | 14,813 | |
Total Income | | | 4,649,700 | |
Expenses: | | | | |
Management fee—Note 3(a) | | | 587,945 | |
Shareholder servicing costs—Note 3(c) | | | 375,061 | |
Professional fees | | | 125,713 | |
Registration fees | | | 65,562 | |
Custodian fees—Note 3(c) | | | 39,162 | |
Chief Compliance Officer fees—Note 3(c) | | | 14,062 | |
Prospectus and shareholders’ reports | | | 12,039 | |
Directors’ fees and expenses—Note 3(d) | | | 10,541 | |
Loan commitment fees—Note 2 | | | 2,877 | |
Distribution fees—Note 3(b) | | | 1,686 | |
Interest expense—Note 2 | | | 944 | |
Miscellaneous | | | 45,883 | |
Total Expenses | | | 1,281,475 | |
Less—reduction in expenses due to undertaking—Note 3(a) | | | (271,698) | |
Net Expenses | | | 1,009,777 | |
Investment Income—Net | | | 3,639,923 | |
Realized and Unrealized Gain (Loss) on Investments—Note 4 ($): | | |
Net realized gain (loss) on investments and foreign currency transactions | 1,847,856 | |
Net realized gain (loss) on futures | 141,301 | |
Net realized gain (loss) on options transactions | 95,370 | |
Net realized gain (loss) on forward foreign currency exchange contracts | (1,677,061) | |
Net Realized Gain (Loss) | | | 407,466 | |
Net change in unrealized appreciation (depreciation) on investments
and foreign currency transactions | (2,162,794) | |
Net change in unrealized appreciation (depreciation) on futures | 281,977 | |
Net change in unrealized appreciation (depreciation) on
options transactions | 43,220 | |
Net change in unrealized appreciation (depreciation) on
forward foreign currency exchange contracts | 278,732 | |
Net Change in Unrealized Appreciation (Depreciation) | | | (1,558,865) | |
Net Realized and Unrealized Gain (Loss) on Investments | | | (1,151,399) | |
Net Increase in Net Assets Resulting from Operations | | 2,488,524 | |
| | | | | | |
See notes to financial statements. | | | | | |
26
STATEMENT OF CHANGES IN NET ASSETS
| | | | | | | | | | |
| | | | Year Ended October 31, |
| | | | 2021 | | 2020 | |
Operations ($): | | | | | | | | |
Investment income—net | | | 3,639,923 | | | | 3,322,993 | |
Net realized gain (loss) on investments | | 407,466 | | | | (582,401) | |
Net change in unrealized appreciation
(depreciation) on investments | | (1,558,865) | | | | 1,317,029 | |
Net Increase (Decrease) in Net Assets
Resulting from Operations | 2,488,524 | | | | 4,057,621 | |
Distributions ($): | |
Distributions to shareholders: | | | | | | | | |
Class A | | | (110,168) | | | | (126,644) | |
Class C | | | (4,560) | | | | (8,859) | |
Class I | | | (654,567) | | | | (442,714) | |
Class Y | | | (2,480,618) | | | | (4,421,224) | |
Total Distributions | | | (3,249,913) | | | | (4,999,441) | |
Capital Stock Transactions ($): | |
Net proceeds from shares sold: | | | | | | | | |
Class A | | | 611,943 | | | | 5,044,040 | |
Class C | | | - | | | | 23,514 | |
Class I | | | 52,066,551 | | | | 26,963,740 | |
Class Y | | | 19,854,322 | | | | 43,512,518 | |
Distributions reinvested: | | | | | | | | |
Class A | | | 109,565 | | | | 123,083 | |
Class C | | | 2,939 | | | | 6,198 | |
Class I | | | 594,347 | | | | 331,724 | |
Class Y | | | 1,095,473 | | | | 2,237,696 | |
Cost of shares redeemed: | | | | | | | | |
Class A | | | (2,021,399) | | | | (1,426,327) | |
Class C | | | (81,725) | | | | (66,458) | |
Class I | | | (33,822,101) | | | | (9,409,928) | |
Class Y | | | (30,082,421) | | | | (47,252,513) | |
Increase (Decrease) in Net Assets
from Capital Stock Transactions | 8,327,494 | | | | 20,087,287 | |
Total Increase (Decrease) in Net Assets | 7,566,105 | | | | 19,145,467 | |
Net Assets ($): | |
Beginning of Period | | | 137,834,045 | | | | 118,688,578 | |
End of Period | | | 145,400,150 | | | | 137,834,045 | |
27
STATEMENT OF CHANGES IN NET ASSETS (continued)
| | | | | | | | | | |
| | | | Year Ended October 31, |
| | | | 2021 | | 2020 | |
Capital Share Transactions (Shares): | |
Class A | | | | | | | | |
Shares sold | | | 49,386 | | | | 415,772 | |
Shares issued for distributions reinvested | | | 8,846 | | | | 10,122 | |
Shares redeemed | | | (162,472) | | | | (116,448) | |
Net Increase (Decrease) in Shares Outstanding | (104,240) | | | | 309,446 | |
Class C | | | | | | | | |
Shares sold | | | - | | | | 1,935 | |
Shares issued for distributions reinvested | | | 240 | | | | 513 | |
Shares redeemed | | | (6,643) | | | | (5,465) | |
Net Increase (Decrease) in Shares Outstanding | (6,403) | | | | (3,017) | |
Class Ia | | | | | | | | |
Shares sold | | | 4,179,089 | | | | 2,182,436 | |
Shares issued for distributions reinvested | | | 47,805 | | | | 27,078 | |
Shares redeemed | | | (2,731,308) | | | | (778,131) | |
Net Increase (Decrease) in Shares Outstanding | 1,495,586 | | | | 1,431,383 | |
Class Ya | | | | | | | | |
Shares sold | | | 1,594,837 | | | | 3,594,178 | |
Shares issued for distributions reinvested | | | 88,119 | | | | 182,611 | |
Shares redeemed | | | (2,420,879) | | | | (3,881,369) | |
Net Increase (Decrease) in Shares Outstanding | (737,923) | | | | (104,580) | |
| | | | | | | | | |
a | During the period ended October 31, 2021, 134,605 Class Y shares representing $1,672,042 were exchanged for 134,708 Class I shares and during the period ended October 31, 2020, 26,412 Class Y shares representing $326,931 were exchanged for 26,418 Class I shares. | |
See notes to financial statements. | | | | | | | | |
28
FINANCIAL HIGHLIGHTS
The following tables describe the performance for each share class for the fiscal periods indicated. All information (except portfolio turnover rate) reflects financial results for a single fund share. Net asset value total return is calculated assuming an initial investment made at the net asset value at the beginning of the period, reinvestment of all dividends and distributions at net asset value during the period, and redemption at net asset value on the last day of the period. Net asset value total return includes adjustments in accordance with accounting principles generally accepted in the United States of America and as such, the net asset value for financial reporting purposes and the returns based upon those net asset values may differ from the net asset value and returns for shareholder transactions. These figures have been derived from the fund’s financial statements.
| | | | | | | |
| |
| | | Year Ended October 31, |
Class A Shares | | 2021 | 2020 | 2019 | 2018 | 2017 |
Per Share Data ($): | | | | | | |
Net asset value, beginning of period | | 12.35 | 12.48 | 12.04 | 12.23 | 12.30 |
Investment Operations: | | | | | | |
Investment income—neta | | .26 | .25 | .29 | .32 | .19 |
Net realized and unrealized
gain (loss) on investments | | (.05) | .09 | .70 | (.31) | .10 |
Total from Investment Operations | | .21 | .34 | .99 | .01 | .29 |
Distributions: | | | | | | |
Dividends from
investment income—net | | (.27) | (.47) | (.55) | (.20) | (.36) |
Dividends from net realized
gain on investments | | - | - | - | - | (.00)b |
Total Distributions | | (.27) | (.47) | (.55) | (.20) | (.36) |
Net asset value, end of period | | 12.29 | 12.35 | 12.48 | 12.04 | 12.23 |
Total Return (%)c | | 1.71 | 2.77 | 8.54 | .08 | 2.45 |
Ratios/Supplemental Data (%): | | | | | | |
Ratio of total expenses
to average net assets | | 6.80d | 4.86 | 1.07 | 1.39 | 1.37 |
Ratio of net expenses
to average net assets | | 1.05d | 1.00 | .75 | .75 | .89 |
Ratio of net investment income
to average net assets | | 2.11d | 2.03 | 2.42 | 2.60 | 1.65 |
Portfolio Turnover Rate | | 80.39 | 94.27 | 83.73 | 114.73 | 145.88 |
Net Assets, end of period ($ x 1,000) | | 4,393 | 5,703 | 1,900 | 858 | 682 |
a Based on average shares outstanding.
b Amount represents less than $.01 per share.
c Exclusive of sales charge.
d Amounts do not include the expenses of the underlying funds.
See notes to financial statements.
29
FINANCIAL HIGHLIGHTS (continued)
| | | | | | | | |
| | | |
| | | Year Ended October 31, |
Class C Shares | | 2021 | 2020 | 2019 | 2018 | 2017 |
Per Share Data ($): | | | | | | |
Net asset value, beginning of period | | 12.18 | 12.30 | 11.86 | 12.06 | 12.18 |
Investment Operations: | | | | | | |
Investment income—neta | | .17 | .19 | .25 | .24 | .11 |
Net realized and unrealized
gain (loss) on investments | | (.06) | .06 | .64 | (.33) | .08 |
Total from Investment Operations | | .11 | .25 | .89 | (.09) | .19 |
Distributions: | | | | | | |
Dividends from
investment income—net | | (.22) | (.37) | (.45) | (.11) | (.31) |
Dividends from net realized
gain on investments | | - | - | - | - | (.00)b |
Total Distributions | | (.22) | (.37) | (.45) | (.11) | (.31) |
Net asset value, end of period | | 12.07 | 12.18 | 12.30 | 11.86 | 12.06 |
Total Return (%)c | | .91 | 2.06 | 7.70 | (.64) | 1.59 |
Ratios/Supplemental Data (%): | | | | | | |
Ratio of total expenses
to average net assets | | 1.84d | 1.81 | 1.85 | 2.07 | 2.09 |
Ratio of net expenses
to average net assets | | 1.80d | 1.70 | 1.50 | 1.50 | 1.64 |
Ratio of net investment income
to average net assets | | 1.36d | 1.59 | 2.11 | 2.00 | .90 |
Portfolio Turnover Rate | | 80.39 | 94.27 | 83.73 | 114.73 | 145.88 |
Net Assets, end of period ($ x 1,000) | | 193 | 273 | 313 | 428 | 702 |
a Based on average shares outstanding.
b Amount represents less than $.01 per share.
c Exclusive of sales charge.
d Amounts do not include the expenses of the underlying funds.
See notes to financial statements.
30
| | | | | | | | |
| | | |
| | | Year Ended October 31, |
Class I Shares | | 2021 | 2020 | 2019 | 2018 | 2017 |
Per Share Data ($): | | | | | | |
Net asset value, beginning of period | | 12.41 | 12.53 | 12.09 | 12.27 | 12.33 |
Investment Operations: | | | | | | |
Investment income—neta | | .29 | .24 | .32 | .37 | .23 |
Net realized and unrealized
gain (loss) on investments | | (.05) | .13 | .71 | (.33) | .08 |
Total from Investment Operations | | .24 | .37 | 1.03 | .04 | .31 |
Distributions: | | | | | | |
Dividends from
investment income—net | | (.29) | (.49) | (.59) | (.22) | (.37) |
Dividends from net realized
gain on investments | | - | - | - | - | (.00)b |
Total Distributions | | (.29) | (.49) | (.59) | (.22) | (.37) |
Net asset value, end of period | | 12.36 | 12.41 | 12.53 | 12.09 | 12.27 |
Total Return (%) | | 1.96 | 3.06 | 8.79 | .38 | 2.57 |
Ratios/Supplemental Data (%): | | | | | | |
Ratio of total expenses
to average net assets | | .81c | .70 | .78 | 1.10 | 1.14 |
Ratio of net expenses
to average net assets | | .80c | .64 | .50 | .50 | .65 |
Ratio of net investment income
to average net assets | | 2.35c | 2.01 | 2.63 | 3.03 | 1.91 |
Portfolio Turnover Rate | | 80.39 | 94.27 | 83.73 | 114.73 | 145.88 |
Net Assets, end of period ($ x 1,000) | | 45,868 | 27,500 | 9,827 | 2,555 | 3,815 |
a Based on average shares outstanding.
b Amount represents less than $.01 per share.
c Amounts do not include the expenses of the underlying funds.
See notes to financial statements.
31
FINANCIAL HIGHLIGHTS (continued)
| | | | | | | | |
| | | |
| | | Year Ended October 31, |
Class Y Shares | | 2021 | 2020 | 2019 | 2018 | 2017 |
Per Share Data ($): | | | | | | |
Net asset value, beginning of period | | 12.42 | 12.53 | 12.09 | 12.27 | 12.33 |
Investment Operations: | | | | | | |
Investment income—neta | | .32 | .33 | .37 | .33 | .23 |
Net realized and unrealized
gain (loss) on investments | | (.06) | .05 | .66 | (.29) | .08 |
Total from Investment Operations | | .26 | .38 | 1.03 | .04 | .31 |
Distributions: | | | | | | |
Dividends from
investment income—net | | (.30) | (.49) | (.59) | (.22) | (.37) |
Dividends from net realized
gain on investments | | - | - | - | - | (.00)b |
Total Distributions | | (.30) | (.49) | (.59) | (.22) | (.37) |
Net asset value, end of period | | 12.38 | 12.42 | 12.53 | 12.09 | 12.27 |
Total Return (%) | | 2.18 | 3.07 | 8.81 | .30 | 2.67 |
Ratios/Supplemental Data (%): | | | | | | |
Ratio of total expenses
to average net assets | | .62c | .62 | .68 | .96 | .98 |
Ratio of net expenses
to average net assets | | .62c | .58 | .50 | .50 | .64 |
Ratio of net investment income
to average net assets | | 2.55c | 2.65 | 3.00 | 2.70 | 1.90 |
Portfolio Turnover Rate | | 80.39 | 94.27 | 83.73 | 114.73 | 145.88 |
Net Assets, end of period ($ x 1,000) | | 94,946 | 104,358 | 106,649 | 64,151 | 40,741 |
a Based on average shares outstanding.
b Amount represents less than $.01 per share.
c Amounts do not include the expenses of the underlying funds.
See notes to financial statements.
32
NOTES TO FINANCIAL STATEMENTS
NOTE 1—Significant Accounting Policies:
BNY Mellon Global Dynamic Bond Income Fund (the “fund”) is a separate diversified series of BNY Mellon Advantage Funds, Inc. (the “Company”), which is registered under the Investment Company Act of 1940, as amended (the “Act”), as an open-end management investment company and operates as a series company currently offering nine series, including the fund. The fund’s investment objective is to seek total return (consisting of income and capital appreciation). BNY Mellon Investment Adviser, Inc. (the “Adviser”), a wholly-owned subsidiary of The Bank of New York Mellon Corporation (“BNY Mellon”), serves as the fund’s investment adviser. Newton Investment Management Limited (the “Sub-Adviser”), a wholly-owned subsidiary of BNY Mellon and an affiliate of the Adviser, serves as the sub-investment adviser.
BNY Mellon Securities Corporation (the “Distributor”), a wholly-owned subsidiary of the Adviser, is the distributor of the fund’s shares. The fund is authorized to issue 500 million shares of $.001 par value Common Stock. The fund currently has authorized four classes of shares: Class A (100 million shares authorized), Class C (100 million shares authorized), Class I (150 million shares authorized) and Class Y (150 million shares authorized). Class A and Class C shares are sold primarily to retail investors through financial intermediaries and bear Distribution and/or Shareholder Services Plan fees. Class A shares generally are subject to a sales charge imposed at the time of purchase. Class A shares bought without an initial sales charge as part of an investment of $1 million or more may be charged a contingent deferred sales charge (“CDSC”) of 1.00% if redeemed within one year. Class C shares are subject to a CDSC imposed on Class C shares redeemed within one year of purchase. Class C shares automatically convert to Class A shares eight years after the date of purchase, without the imposition of a sales charge. Class I shares are sold primarily to bank trust departments and other financial service providers (including The Bank of New York Mellon, a subsidiary of BNY Mellon and an affiliate of the Adviser, and its affiliates), acting on behalf of customers having a qualified trust or an investment account or relationship at such institution, and bear no Distribution or Shareholder Services Plan fees. Class Y shares are sold at net asset value per share generally to institutional investors, and bear no Distribution or Shareholder Services Plan fees. Class I and Class Y shares are offered without a front-end sales charge or CDSC. Other differences between the classes include the services offered to and the expenses borne by each class, the allocation of certain transfer agency costs, and certain voting rights. Income, expenses
33
NOTES TO FINANCIAL STATEMENTS (continued)
(other than expenses attributable to a specific class), and realized and unrealized gains or losses on investments are allocated to each class of shares based on its relative net assets.
As of October 31, 2021, MBC Investments Corporation, an indirect subsidiary of BNY Mellon, held 7,267 Class C shares of the fund.
The Company accounts separately for the assets, liabilities and operations of each series. Expenses directly attributable to each series are charged to that series’ operations; expenses which are applicable to all series are allocated among them on a pro rata basis.
The Financial Accounting Standards Board (“FASB”) Accounting Standards Codification (“ASC”) is the exclusive reference of authoritative U.S. generally accepted accounting principles (“GAAP”) recognized by the FASB to be applied by nongovernmental entities. Rules and interpretive releases of the SEC under authority of federal laws are also sources of authoritative GAAP for SEC registrants. The fund is an investment company and applies the accounting and reporting guidance of the FASB ASC Topic 946 Financial Services-Investment Companies. The fund’s financial statements are prepared in accordance with GAAP, which may require the use of management estimates and assumptions. Actual results could differ from those estimates.
The Company enters into contracts that contain a variety of indemnifications. The fund’s maximum exposure under these arrangements is unknown. The fund does not anticipate recognizing any loss related to these arrangements.
(a) Portfolio valuation: The fair value of a financial instrument is the amount that would be received to sell an asset or paid to transfer a liability in an orderly transaction between market participants at the measurement date (i.e., the exit price). GAAP establishes a fair value hierarchy that prioritizes the inputs of valuation techniques used to measure fair value. This hierarchy gives the highest priority to unadjusted quoted prices in active markets for identical assets or liabilities (Level 1 measurements) and the lowest priority to unobservable inputs (Level 3 measurements).
Additionally, GAAP provides guidance on determining whether the volume and activity in a market has decreased significantly and whether such a decrease in activity results in transactions that are not orderly. GAAP requires enhanced disclosures around valuation inputs and techniques used during annual and interim periods.
34
Various inputs are used in determining the value of the fund’s investments relating to fair value measurements. These inputs are summarized in the three broad levels listed below:
Level 1—unadjusted quoted prices in active markets for identical investments.
Level 2—other significant observable inputs (including quoted prices for similar investments, interest rates, prepayment speeds, credit risk, etc.).
Level 3—significant unobservable inputs (including the fund’s own assumptions in determining the fair value of investments).
The inputs or methodology used for valuing securities are not necessarily an indication of the risk associated with investing in those securities.
Changes in valuation techniques may result in transfers in or out of an assigned level within the disclosure hierarchy. Valuation techniques used to value the fund’s investments are as follows:
Registered investment companies that are not traded on an exchange are valued at their net asset value and are generally categorized within Level 1 of the fair value hierarchy.
Investments in debt securities, excluding short-term investments (other than U.S. Treasury Bills), futures, options and forward foreign currency exchange contracts (“forward contracts”) are valued each business day by one or more independent pricing services (each, a “Service”) approved by the Company’s Board of Directors (the “Board”). Investments for which quoted bid prices are readily available and are representative of the bid side of the market in the judgment of a Service are valued at the mean between the quoted bid prices (as obtained by a Service from dealers in such securities) and asked prices (as calculated by a Service based upon its evaluation of the market for such securities). Securities are valued as determined by a Service, based on methods which include consideration of the following: yields or prices of securities of comparable quality, coupon, maturity and type; indications as to values from dealers; and general market conditions. These securities are generally categorized within Level 2 of the fair value hierarchy.
Each Service and independent valuation firm is engaged under the general oversight of the Board.
When market quotations or official closing prices are not readily available, or are determined not to accurately reflect fair value, such as when the value of a security has been significantly affected by events after the close
35
NOTES TO FINANCIAL STATEMENTS (continued)
of the exchange or market on which the security is principally traded (for example, a foreign exchange or market), but before the fund calculates its net asset value, the fund may value these investments at fair value as determined in accordance with the procedures approved by the Board. Certain factors may be considered when fair valuing investments such as: fundamental analytical data, the nature and duration of restrictions on disposition, an evaluation of the forces that influence the market in which the securities are purchased and sold, and public trading in similar securities of the issuer or comparable issuers. These securities are either categorized within Level 2 or 3 of the fair value hierarchy depending on the relevant inputs used.
For securities where observable inputs are limited, assumptions about market activity and risk are used and such securities are generally categorized within Level 3 of the fair value hierarchy.
Investments denominated in foreign currencies are translated to U.S. dollars at the prevailing rates of exchange.
Forward contracts are valued at the forward rate and are generally categorized within Level 2 of the fair value hierarchy. Futures and options, which are traded on an exchange, are valued at the last sales price on the securities exchange on which such securities are primarily traded or at the last sales price on the national securities market on each business day and are generally categorized within Level 1 of the fair value hierarchy. Options traded over-the-counter (“OTC”) are valued at the mean between the bid and asked price and are generally categorized within Level 2 of the fair value hierarchy.
The following is a summary of the inputs used as of October 31, 2021 in valuing the fund’s investments:
| | | | | | | |
| | Level 1-Unadjusted Quoted Prices | Level 2- Other Significant Observable Inputs | | Level 3-Significant Unobservable Inputs | Total | |
Assets ($) | | |
Investments In Securities:† | | |
Corporate Bonds | - | 90,618,678 | | - | 90,618,678 | |
Exchange-Traded Funds | 2,463,693 | - | | - | 2,463,693 | |
Foreign Governmental | - | 39,568,320 | | - | 39,568,320 | |
Investment Companies | 9,013,033 | - | | - | 9,013,033 | |
U.S. Treasury Securities | - | 1,447,859 | | - | 1,447,859 | |
36
| | | | | | | | |
| | Level 1-Unadjusted Quoted Prices | Level 2- Other Significant Observable Inputs | | Level 3-Significant Unobservable Inputs | Total | |
Assets ($)(continued) | | |
Other Financial Instruments: | | |
Forward Foreign Currency Exchange Contracts†† | - | 2,083,218 | | - | 2,083,218 | |
Futures†† | 239,094 | - | | - | 239,094 | |
Options Purchased | 115,328 | - | | - | 115,328 | |
Liabilities ($) | | |
Other Financial Instruments: | | |
Forward Foreign Currency Exchange Contracts†† | - | (691,441) | | - | (691,441) | |
Futures†† | (4,054) | - | | - | (4,054) | |
† See Statement of Investments for additional detailed categorizations, if any.
†† Amount shown represents unrealized appreciation (depreciation) at period end, but only variation margin on exchanged-traded and centrally cleared derivatives, if any, are reported in the Statement of Assets and Liabilities.
(b) Foreign currency transactions: The fund does not isolate that portion of the results of operations resulting from changes in foreign exchange rates on investments from the fluctuations arising from changes in the market prices of securities held. Such fluctuations are included with the net realized and unrealized gain or loss on investments.
Net realized foreign exchange gains or losses arise from sales of foreign currencies, currency gains or losses realized on securities transactions between trade and settlement date, and the difference between the amounts of dividends, interest and foreign withholding taxes recorded on the fund’s books and the U.S. dollar equivalent of the amounts actually received or paid. Net unrealized foreign exchange gains and losses arise from changes in the value of assets and liabilities other than investments resulting from changes in exchange rates. Foreign currency gains and losses on foreign currency transactions are also included with net realized and unrealized gain or loss on investments.
Foreign taxes: The fund may be subject to foreign taxes (a portion of which may be reclaimable) on income, stock dividends, realized and unrealized capital gains on investments or certain foreign currency transactions. Foreign taxes are recorded in accordance with the applicable foreign tax regulations and rates that exist in the foreign jurisdictions in which the fund invests. These foreign taxes, if any, are paid by the fund
37
NOTES TO FINANCIAL STATEMENTS (continued)
and are reflected in the Statement of Operations, if applicable. Foreign taxes payable or deferred or those subject to reclaims as of October 31, 2021, if any, are disclosed in the fund’s Statement of Assets and Liabilities.
(c) Securities transactions and investment income: Securities transactions are recorded on a trade date basis. Realized gains and losses from securities transactions are recorded on the identified cost basis. Dividend income is recognized on the ex-dividend date and interest income, including, where applicable, accretion of discount and amortization of premium on investments, is recognized on the accrual basis.
Pursuant to a securities lending agreement with The Bank of New York Mellon, the fund may lend securities to qualified institutions. It is the fund’s policy that, at origination, all loans are secured by collateral of at least 102% of the value of U.S. securities loaned and 105% of the value of foreign securities loaned. Collateral equivalent to at least 100% of the market value of securities on loan is maintained at all times. Collateral is either in the form of cash, which can be invested in certain money market mutual funds managed by the Adviser, or U.S. Government and Agency securities. The fund is entitled to receive all dividends, interest and distributions on securities loaned, in addition to income earned as a result of the lending transaction. Should a borrower fail to return the securities in a timely manner, The Bank of New York Mellon is required to replace the securities for the benefit of the fund or credit the fund with the market value of the unreturned securities and is subrogated to the fund’s rights against the borrower and the collateral. Additionally, the contractual maturity of security lending transactions are on an overnight and continuous basis. During the period ended October 31, 2021, The Bank of New York Mellon earned $1,993 from the lending of the fund’s portfolio securities, pursuant to the securities lending agreement.
(d) Affiliated issuers: Investments in other investment companies advised by the Adviser are considered “affiliated” under the Act.
Certain affiliated investment companies may also invest in the fund. At October 31, 2021, BNY Mellon Yield Enhancement Strategy Fund, an affiliate of the fund, held 2,326,235 Class Y shares representing approximately 19.8% of the fund’s net assets.
(e) Risk: Investing in foreign markets may involve special risks and considerations not typically associated with investing in the U.S. These risks include revaluation of currencies, high rates of inflation, repatriation restrictions on income and capital, and adverse political, economic developments and public health conditions. Moreover, securities issued in
38
these markets may be less liquid, subject to government ownership controls and delayed settlements, and their prices may be more volatile than those of comparable securities in the U.S. In addition, turbulence in financial markets and reduced liquidity in equity, credit and/or fixed income markets may negatively affect many issuers, which could adversely affect the fund. Global economies and financial markets are becoming increasingly interconnected, and conditions and events in one country, region or financial market may adversely impact issuers in a different country, region or financial market. These risks may be magnified if certain events or developments adversely interrupt the global supply chain; in these and other circumstances, such risks might affect companies world-wide. Recent examples include pandemic risks related to COVID-19 and aggressive measures taken world-wide in response by governments, including closing borders, restricting international and domestic travel, and the imposition of prolonged quarantines of large populations, and by businesses, including changes to operations and reducing staff. The effects of COVID-19 have contributed to increased volatility in global markets and will likely affect certain countries, companies, industries and market sectors more dramatically than others. The COVID-19 pandemic has had, and any other outbreak of an infectious disease or other serious public health concern could have, a significant negative impact on economic and market conditions and could trigger a prolonged period of global economic slowdown. To the extent the fund may overweight its investments in certain countries, companies, industries or market sectors, such positions will increase the fund’s exposure to risk of loss from adverse developments affecting those countries, companies, industries or sectors.
(f) Dividends and distributions to shareholders: Dividends and distributions are recorded on the ex-dividend date. Dividends from investment income-net are normally declared and paid quarterly. Dividends from net realized capital gains, if any, are normally declared and paid annually, but the fund may make distributions on a more frequent basis to comply with the distribution requirements of the Internal Revenue Code of 1986, as amended (the “Code”). To the extent that net realized capital gains can be offset by capital loss carryovers, it is the policy of the fund not to distribute such gains. Income and capital gain distributions are determined in accordance with income tax regulations, which may differ from GAAP.
On October 29, 2021, the Board declared a cash dividend of $.043, $.016, $.049 and $.055 per share from undistributed investment income-net for Class A, Class C, Class I and Class Y shares, respectively, payable on November 1, 2021, to shareholders of record as of the close of business on October 29, 2021. The ex-dividend date was November 1, 2021.
39
NOTES TO FINANCIAL STATEMENTS (continued)
(g) Federal income taxes: It is the policy of the fund to continue to qualify as a regulated investment company, if such qualification is in the best interests of its shareholders, by complying with the applicable provisions of the Code, and to make distributions of taxable income and net realized capital gain sufficient to relieve it from substantially all federal income and excise taxes.
As of and during the period ended October 31, 2021, the fund did not have any liabilities for any uncertain tax positions. The fund recognizes interest and penalties, if any, related to uncertain tax positions as income tax expense in the Statement of Operations. During the period ended October 31, 2021, the fund did not incur any interest or penalties.
Each tax year in the four-year period ended October 31, 2021 remains subject to examination by the Internal Revenue Service and state taxing authorities.
At October 31, 2021, the components of accumulated earnings on a tax basis were as follows: undistributed ordinary income $1,258,818, undistributed capital gains $1,831,775, accumulated other losses $244,584 and unrealized depreciation $1,453,703.
The tax character of distributions paid to shareholders during the fiscal periods ended October 31, 2021 and October 31, 2020 were as follows: ordinary income $3,249,913 and $4,999,441, respectively.
(h) New accounting pronouncements: In March 2020, the FASB issued Accounting Standards Update 2020-04, Reference Rate Reform (Topic 848): Facilitation of the Effects of Reference Rate Reform on Financial Reporting (“ASU 2020-04”), and in January 2021, the FASB issued Accounting Standards Update 2021-01, Reference Rate Reform (Topic 848): Scope (“ASU 2021-01”), which provides optional, temporary relief with respect to the financial reporting of contracts subject to certain types of modifications due to the planned discontinuation of the London Interbank Offered Rate (“LIBOR”) and other interbank offered rates as of the end of 2021. The temporary relief provided by ASU 2020-04 and ASU 2021-01 is effective for certain reference rate-related contract modifications that occur during the period from March 12, 2020 through December 31, 2022. Management is evaluating the impact of ASU 2020-04 and ASU 2021-01 on the fund’s investments, derivatives, debt and other contracts that will undergo reference rate-related modifications as a result of the reference rate reform. Management is also currently actively working with other financial institutions and counterparties to modify contracts as required by applicable regulation and within the regulatory deadlines.
40
NOTE 2—Bank Lines of Credit:
The fund participates with other long-term open-end funds managed by the Adviser in a $823.5 million unsecured credit facility led by Citibank, N.A. (the “Citibank Credit Facility”) and a $300 million unsecured credit facility provided by The Bank of New York Mellon (the “BNYM Credit Facility”), a subsidiary of BNY Mellon and an affiliate of the Adviser, each to be utilized primarily for temporary or emergency purposes, including the financing of redemptions (each, a “Facility”). The Citibank Credit Facility is available in two tranches: (i) Tranche A is in an amount equal to $688.5 million and is available to all long-term open-ended funds, including the fund, and (ii) Tranche B is an amount equal to $135 million and is available only to BNY Mellon Floating Rate Income Fund, a series of BNY Mellon Investment Funds IV, Inc. In connection therewith, the fund has agreed to pay its pro rata portion of commitment fees for Tranche A of the Citibank Credit Facility and the BNYM Credit Facility. Interest is charged to the fund based on rates determined pursuant to the terms of the respective Facility at the time of borrowing.
The average amount of borrowings outstanding under the Facilities during the period ended October 31, 2021 was approximately $76,712 with a related weighted average annualized interest rate of 1.23%.
NOTE 3—Management Fee, Sub-Investment Advisory Fee and Other Transactions with Affiliates:
(a) Pursuant to a management agreement with the Adviser, the management fee is computed at the annual rate of .40% of the value of the fund’s average daily net assets and is payable monthly. The Adviser had contractually agreed, from November 1, 2020 through March 1, 2022, to waive receipt of its fees and/or assume the direct expenses of the fund, so that the expenses of none of the classes (excluding Rule 12b-1 Distribution Plan fees, Shareholder Services Plan fees, taxes, interest expense, brokerage commissions, commitment fees on borrowings and extraordinary expenses) exceed .80% of the value of the fund’s average daily net assets. On or after March 1, 2022, the Adviser may terminate this expense limitation agreement at any time. The reduction in expenses, pursuant to the undertaking, amounted to $271,698 during the period ended October 31, 2021.
Pursuant to a sub-investment advisory agreement between the Adviser and the Sub-Adviser, the Adviser pays the Sub-Adviser a monthly fee at an annual rate of .19% of the value of the fund’s average daily net assets.
During the period ended October 31, 2021, the Distributor retained $1 from commissions earned on sales of the fund’s Class A shares.
41
NOTES TO FINANCIAL STATEMENTS (continued)
(b) Under the Distribution Plan adopted pursuant to Rule 12b-1 under the Act, Class C shares pay the Distributor for distributing its shares at an annual rate of .75% of the value of its average daily net assets. The Distributor may pay one or more Service Agents in respect of advertising, marketing and other distribution services, and determines the amounts, if any, to be paid to Service Agents and the basis on which such payments are made. During the period ended October 31, 2021, Class C shares were charged $1,686 pursuant to the Distribution Plan.
(c) Under the Shareholder Services Plan, Class A and Class C shares pay the Distributor at an annual rate of .25% of the value of their average daily net assets for the provision of certain services. The services provided may include personal services relating to shareholder accounts, such as answering shareholder inquiries regarding the fund, and services related to the maintenance of shareholder accounts. The Distributor may make payments to Service Agents (securities dealers, financial institutions or other industry professionals) with respect to these services. The Distributor determines the amounts to be paid to Service Agents. During the period ended October 31, 2021, Class A and Class C shares were charged $11,749 and $562, respectively, pursuant to the Shareholder Services Plan.
The fund has an arrangement with the transfer agent whereby the fund may receive earnings credits when positive cash balances are maintained, which are used to offset transfer agency fees. For financial reporting purposes, the fund includes net earnings credits, if any, as shareholder servicing costs in the Statement of Operations.
The fund has an arrangement with the custodian whereby the fund will receive interest income or be charged overdraft fees when cash balances are maintained. For financial reporting purposes, the fund includes this interest income and overdraft fees, if any, as interest income in the Statement of Operations.
The fund compensates BNY Mellon Transfer, Inc., a wholly-owned subsidiary of the Adviser, under a transfer agency agreement for providing transfer agency and cash management services inclusive of earnings credits, if any, for the fund. The majority of transfer agency fees are comprised of amounts paid on a per account basis, while cash management fees are related to fund subscriptions and redemptions. During the period ended October 31, 2021, the fund was charged $3,642 for transfer agency services, inclusive of earnings credit, if any. These fees are included in Shareholder servicing costs in the Statement of Operations.
42
The fund compensates The Bank of New York Mellon under a custody agreement for providing custodial services for the fund. These fees are determined based on net assets, geographic region and transaction activity. During the period ended October 31, 2021, the fund was charged $39,162 pursuant to the custody agreement.
During the period ended October 31, 2021, the fund was charged $14,062 for services performed by the Chief Compliance Officer and his staff. These fees are included in Chief Compliance Officer fees in the Statement of Operations.
The components of “Due to BNY Mellon Investment Adviser, Inc. and affiliates” in the Statement of Assets and Liabilities consist of: management fees of $49,445, Distribution Plan fees of $130, Shareholder Services Plan fees of $980, custodian fees of $9,000, Chief Compliance Officer fees of $4,718 and transfer agency fees of $585, which are offset against an expense reimbursement currently in effect in the amount of $21,009.
(d) Each Board member also serves as a Board member of other funds in the BNY Mellon Family of Funds complex. Annual retainer fees and attendance fees are allocated to each fund based on net assets.
NOTE 4—Securities Transactions:
The aggregate amount of purchases and sales of investment securities, excluding short-term securities, futures, options transactions and forward contracts, during the period ended October 31, 2021, amounted to $111,851,997 and $111,493,414, respectively.
Derivatives: A derivative is a financial instrument whose performance is derived from the performance of another asset. The fund enters into International Swaps and Derivatives Association, Inc. Master Agreements or similar agreements (collectively, “Master Agreements”) with its OTC derivative contract counterparties in order to, among other things, reduce its credit risk to counterparties. Master Agreements include provisions for general obligations, representations, collateral and events of default or termination. Under a Master Agreement, the fund may offset with the counterparty certain derivative financial instruments’ payables and/or receivables with collateral held and/or posted and create one single net payment in the event of default or termination.
Each type of derivative instrument that was held by the fund during the period ended October 31, 2021 is discussed below.
Futures: In the normal course of pursuing its investment objective, the fund is exposed to market risk, including interest rate risk, as a result of changes in value of underlying financial instruments. The fund invests in
43
NOTES TO FINANCIAL STATEMENTS (continued)
futures in order to manage its exposure to or protect against changes in the market. A futures contract represents a commitment for the future purchase or a sale of an asset at a specified date. Upon entering into such contracts, these investments require initial margin deposits with a counterparty, which consist of cash or cash equivalents. The amount of these deposits is determined by the exchange or Board of Trade on which the contract is traded and is subject to change. Accordingly, variation margin payments are received or made to reflect daily unrealized gains or losses which are recorded in the Statement of Operations. When the contracts are closed, the fund recognizes a realized gain or loss which is reflected in the Statement of Operations. There is minimal counterparty credit risk to the fund with futures since they are exchange traded, and the exchange guarantees the futures against default. Futures open at October 31, 2021 are set forth in the Statement of Futures.
Options Transactions: The fund purchases and writes (sells) put and call options to hedge against changes in the values of interest rates, or as a substitute for an investment. The fund is subject to market risk and interest rate risk in the course of pursuing its investment objectives through its investments in options contracts. A call option gives the purchaser of the option the right (but not the obligation) to buy, and obligates the writer to sell, the underlying financial instrument at the exercise price at any time during the option period, or at a specified date. Conversely, a put option gives the purchaser of the option the right (but not the obligation) to sell, and obligates the writer to buy the underlying financial instrument at the exercise price at any time during the option period, or at a specified date.
As a writer of call options, the fund receives a premium at the outset and then bears the market risk of unfavorable changes in the price of the financial instrument underlying the option. Generally, the fund realizes a gain, to the extent of the premium, if the price of the underlying financial instrument decreases between the date the option is written and the date on which the option is terminated. Generally, the fund incurs a loss if the price of the financial instrument increases between those dates. The maximum payout for those contracts is limited to the number of call option contracts written and the related strike prices, respectively.
As a writer of put options, the fund receives a premium at the outset and then bears the market risk of unfavorable changes in the price of the financial instrument underlying the option. Generally, the fund realizes a gain, to the extent of the premium, if the price of the underlying financial instrument increases between the date the option is written and the date on which the option is terminated. Generally, the fund incurs a loss if the price of the financial instrument decreases between those dates. The
44
maximum payout for those contracts is limited to the number of put option contracts written and the related strike prices, respectively.
As a writer of an option, the fund has no control over whether the underlying financial instrument may be sold (call) or purchased (put) and as a result bears the market risk of an unfavorable change in the price of the financial instrument underlying the written option. There is a risk of loss from a change in value of such options which may exceed the related premiums received. This risk may be mitigated by Master Agreements, if any, between the fund and the counterparty and the posting of collateral, if any, by the counterparty to the fund to cover the fund’s exposure to the counterparty. The Statement of Operations reflects any unrealized gains or losses which occurred during the period as well as any realized gains or losses which occurred upon the expiration or closing of the option transaction. Options purchased open at October 31, 2021 are set forth in the Statement of Investments and at October 31, 2021, there were no options written outstanding.
Forward Foreign Currency Exchange Contracts: The fund enters into forward contracts in order to hedge its exposure to changes in foreign currency exchange rates on its foreign portfolio holdings, to settle foreign currency transactions or as a part of its investment strategy. When executing forward contracts, the fund is obligated to buy or sell a foreign currency at a specified rate on a certain date in the future. With respect to sales of forward contracts, the fund incurs a loss if the value of the contract increases between the date the forward contract is opened and the date the forward contract is closed. The fund realizes a gain if the value of the contract decreases between those dates. With respect to purchases of forward contracts, the fund incurs a loss if the value of the contract decreases between the date the forward contract is opened and the date the forward contract is closed. The fund realizes a gain if the value of the contract increases between those dates. Any realized or unrealized gains or losses which occurred during the period are reflected in the Statement of Operations. The fund is exposed to foreign currency risk as a result of changes in value of underlying financial instruments. The fund is also exposed to credit risk associated with counterparty nonperformance on these forward contracts, which is generally limited to the unrealized gain on each open contract. This risk may be mitigated by Master Agreements, if any, between the fund and the counterparty and the posting of collateral, if any, by the counterparty to the fund to cover the fund’s exposure to the counterparty. Forward contracts open at October 31, 2021 are set forth in the Statement of Forward Foreign Currency Exchange Contracts.
45
NOTES TO FINANCIAL STATEMENTS (continued)
The following tables show the fund’s exposure to different types of market risk as it relates to the Statement of Assets and Liabilities and the Statement of Operations, respectively.
Fair value of derivative instruments as of October 31, 2021 is shown below:
| | | | | | | | |
| | Derivative
Assets ($) | | | | Derivative
Liabilities ($) | |
Interest rate risk | 354,422 | 1,2 | Interest rate risk | (4,054) | 1 |
Foreign exchange risk | 2,083,218 | 3 | Foreign exchange risk | (691,441) | 3 |
Gross fair value of
derivative contracts | 2,437,640 | | | | (695,495) | |
| | | | | | |
| Statement of Assets and Liabilities location: | |
1 | Includes cumulative appreciation (depreciation) on futures as reported in the Statement of Futures, but only the
unpaid variation margin is reported in the Statement of Assets and Liabilities. |
2 | Options purchased are included in Investments in securities—Unaffiliated issuers, at value. |
3 | Unrealized appreciation (depreciation) on forward foreign currency exchange contracts. |
The effect of derivative instruments in the Statement of Operations during the period ended October 31, 2021 is shown below:
| | | | | | | | | | |
Amount of realized gain (loss) on derivatives recognized in income ($) | |
Underlying
risk | Futures | 1 | Options
Transactions | 2 | Forward
Contracts | 3 | Total | |
Interest rate | 141,301 | | 95,370 | | - | | 236,671 | |
Foreign
exchange | - | | - | | (1,677,061) | | (1,677,061) | |
Total | 141,301 | | 95,370 | | (1,677,061) | | (1,440,390) | |
| | | | | | | | |
Net change in unrealized appreciation (depreciation)
on derivatives recognized in income ($) | |
Underlying
risk | Futures | 4 | Options
Transactions | 5 | Forward
Contracts | 6 | Total | |
Interest rate | 281,977 | | 43,220 | | - | | 325,197 | |
Foreign
exchange | - | | - | | 278,732 | | 278,732 | |
Total | 281,977 | | 43,220 | | 278,732 | | 603,929 | |
| | | | | | | | | |
| Statement of Operations location: | |
1 | Net realized gain (loss) on futures. |
2 | Net realized gain (loss) on options transactions. |
3 | Net realized gain (loss) on forward foreign currency exchange contracts. |
4 | Net change in unrealized appreciation (depreciation) on futures. |
5 | Net change in unrealized appreciation (depreciation) on options transactions. |
6 | Net change in unrealized appreciation (depreciation) on forward foreign currency exchange contracts. |
The provisions of ASC Topic 210 “Disclosures about Offsetting Assets and Liabilities” require disclosure on the offsetting of financial assets and liabilities. These disclosures are required for certain investments, including
46
derivative financial instruments subject to Master Agreements which are eligible for offsetting in the Statement of Assets and Liabilities and require the fund to disclose both gross and net information with respect to such investments. For financial reporting purposes, the fund does not offset derivative assets and derivative liabilities that are subject to Master Agreements in the Statement of Assets and Liabilities.
At October 31, 2021, derivative assets and liabilities (by type) on a gross basis are as follows:
| | | | | | |
Derivative Financial Instruments: | | Assets ($) | | Liabilities ($) | |
Futures | | 239,094 | | (4,054) | |
Options | | 115,328 | | - | |
Forward contracts | | 2,083,218 | | (691,441) | |
Total gross amount of derivative | | | | | |
assets and liabilities in the | | | | | |
Statement of Assets and Liabilities | | 2,437,640 | | (695,495) | |
Derivatives not subject to | | | | | |
Master Agreements | | (354,422) | | 4,054 | |
Total gross amount of assets | | | | | |
and liabilities subject to | | | | | |
Master Agreements | | 2,083,218 | | (691,441) | |
The following tables present derivative assets and liabilities net of amounts available for offsetting under Master Agreements and net of related collateral received or pledged, if any, as of October 31, 2021:
| | | | | | | |
| | | Financial | | | |
| | | Instruments | | | |
| | | and Derivatives | | | |
| Gross Amount of | | Available | Collateral | | Net Amount of |
Counterparty | Assets ($) | 1 | for Offset ($) | Received ($) | 2 | Assets ($) |
CIBC World Markets | 25,100 | | (25,100) | - | | - |
Citigroup | 2,191 | | - | - | | 2,191 |
HSBC | 478,659 | | - | (180,000) | | 298,659 |
RBS Securities | 2,204 | | (2,204) | - | | - |
State Street Bank
and Trust Company | 1,516,368 | | (539,156) | (550,000) | | 427,212 |
UBS Securities | 58,696 | | (24,206) | - | | 34,490 |
Total | 2,083,218 | | (590,666) | (730,000) | | 762,552 |
| | | | | | |
47
NOTES TO FINANCIAL STATEMENTS (continued)
| | | | | | | |
| | | Financial | | | |
| | | Instruments | | | |
| | | and Derivatives | | | |
| Gross Amount of | | Available | Collateral | | Net Amount of |
Counterparty | Liabilities ($) | 1 | for Offset ($) | Pledged ($) | 2 | Liabilities ($) |
CIBC World Markets | (88,758) | | 25,100 | - | | (63,658) |
RBS Securities | (39,321) | | 2,204 | - | | (37,117) |
State Street Bank
and Trust Company | (539,156) | | 539,156 | - | | - |
UBS Securities | (24,206) | | 24,206 | - | | - |
Total | (691,441) | | 590,666 | - | | (100,775) |
| | | | | | |
1 Absent a default event or early termination, OTC derivative assets and liabilities are presented at gross amounts
and are not offset in the Statement of Assets and Liabilities. |
2 In some instances, the actual collateral received and/or pledged may be more than the amount shown due to
over collateralization. |
The following summarizes the average market value of derivatives outstanding during the period ended October 31, 2021:
| | | |
| | Average Market Value ($) |
Interest rate futures | | 13,651,247 |
Interest rate options contracts | | 74,653 |
Forward contracts | | 119,201,439 |
At October 31, 2021, the cost of investments for federal income tax purposes was $144,581,042; accordingly, accumulated net unrealized depreciation on investments inclusive of derivative contracts was $1,445,006, consisting of $4,669,125 gross unrealized appreciation and $6,114,131 gross unrealized depreciation.
48
REPORT OF INDEPENDENT REGISTERED PUBLIC ACCOUNTING FIRM
To the Shareholders and the Board of Directors of BNY Mellon Global Dynamic Bond Income Fund
Opinion on the Financial Statements
We have audited the accompanying statement of assets and liabilities of BNY Mellon Global Dynamic Bond Income Fund (the “Fund”) (one of the funds constituting BNY Mellon Advantage Funds, Inc.), including the statements of investments, investments in affiliated issuers, futures and forward foreign currency exchange contracts, as of October 31, 2021, and the related statement of operations for the year then ended, the statements of changes in net assets for each of the two years in the period then ended, the financial highlights for each of the five years in the period then ended and the related notes (collectively referred to as the “financial statements”). In our opinion, the financial statements present fairly, in all material respects, the financial position of the Fund (one of the funds constituting BNY Mellon Advantage Funds, Inc.) at October 31, 2021, the results of its operations for the year then ended, the changes in its net assets for each of the two years in the period then ended and its financial highlights for each of the five years in the period then ended, in conformity with U.S. generally accepted accounting principles.
Basis for Opinion
These financial statements are the responsibility of the Fund’s management. Our responsibility is to express an opinion on the Fund’s financial statements based on our audits. We are a public accounting firm registered with the Public Company Accounting Oversight Board (United States) (“PCAOB”) and are required to be independent with respect to the Fund in accordance with the U.S. federal securities laws and the applicable rules and regulations of the Securities and Exchange Commission and the PCAOB.
We conducted our audits in accordance with the standards of the PCAOB. Those standards require that we plan and perform the audit to obtain reasonable assurance about whether the financial statements are free of material misstatement, whether due to error or fraud. The Fund is not required to have, nor were we engaged to perform, an audit of the Fund’s internal control over financial reporting. As part of our audits, we are required to obtain an understanding of internal control over financial reporting, but not for the purpose of expressing an opinion on the effectiveness of the Fund’s internal control over financial reporting. Accordingly, we express no such opinion.
Our audits included performing procedures to assess the risks of material misstatement of the financial statements, whether due to error or fraud, and performing procedures that respond to those risks. Such procedures included examining, on a test basis, evidence regarding the amounts and disclosures in the financial statements. Our procedures included confirmation of securities owned as of October 31, 2021, by correspondence with the custodian and others or by other appropriate auditing procedures where replies from others were not received. Our audits also included evaluating the accounting principles used and significant estimates made by management, as well as evaluating the overall presentation of the financial statements. We believe that our audits provide a reasonable basis for our opinion.

We have served as the auditor of one or more investment companies in the BNY Mellon Family of Funds since at least 1957, but we are unable to determine the specific year.
New York, New York
December 23, 2021
49
LIQUIDITY RISK MANAGEMENT PROGRAM (Unaudited)
Effective June 1, 2019, the fund adopted a liquidity risk management program (the “Liquidity Risk Management Program”) pursuant to the requirements of Rule 22e-4 under the Investment Company Act of 1940, as amended. Rule 22e-4 requires registered open-end funds, including mutual funds and exchange-traded funds but not money market funds, to establish liquidity risk management programs in order to effectively manage fund liquidity and shareholder redemptions. The rule is designed to mitigate the risk that a fund could not meet redemption requests without significantly diluting the interests of remaining investors.
The rule requires the fund to assess, manage and review their liquidity risk at least annually considering applicable factors such as investment strategy and liquidity during normal and foreseeable stressed conditions, including whether the strategy is appropriate for an open-end fund and whether the fund has a relatively concentrated portfolio or large positions in particular issuers. The fund must also assess its use of borrowings and derivatives, short-term and long-term cash flow projections in normal and stressed conditions, holdings of cash and cash equivalents, and borrowing arrangements and other funding sources.
The rule also requires the fund to classify its investments as highly liquid, moderately liquid, less liquid or illiquid based on the number of days the fund expects it would take to liquidate the investment, and to review these classifications at least monthly or more often under certain conditions. The periods range from three or fewer business days for a highly liquid investment to greater than seven calendar days for settlement of a less liquid investment. Illiquid investments are those a fund does not expect to be able to sell or dispose of within seven calendar days without significantly changing the market value. The fund is prohibited from acquiring an investment if, after the acquisition, its holdings of illiquid assets will exceed 15% of its net assets. In addition, if a fund permits redemptions in-kind, the rule requires the fund to establish redemption in-kind policies and procedures governing how and when it will engage in such redemptions.
Pursuant to the rule’s requirements, the Liquidity Risk Management Program has been reviewed and approved by the Board. Furthermore, the Board has received a written report prepared by the Program’s Administrator that addresses the operation of the Program, assesses its adequacy and effectiveness and describes any material changes made to the Program.
Assessment of Program
In the opinion of the Program Administrator, the Program approved by the Board continues to be adequate for the fund and the Program has been implemented effectively. The Program Administrator has monitored the fund’s liquidity risk and the liquidity classification of the securities held by the fund and has determined that the Program is operating effectively.
During the period from January 1, 2020 to December 31, 2020, there were no material changes to the Program and no material liquidity events that impacted the fund. During the period, the fund held sufficient highly liquid assets to meet fund redemptions.
Under normal expected foreseeable fund redemption forecasts and foreseeable stressed fund redemption forecasts, the Program Administrator believes that the fund maintains sufficient highly liquid assets to meet expected fund redemptions.
50
BOARD MEMBERS INFORMATION (Unaudited)
Independent Board Members
Joseph S. DiMartino (78)
Chairman of the Board (1995)
Principal Occupation During Past 5 Years:
· Director or Trustee of funds in the BNY Mellon Family of Funds and certain other entities (as described in the fund’s Statement of Additional Information) (1995-Present)
Other Public Company Board Memberships During Past 5 Years:
· CBIZ, Inc., a public company providing professional business services, products and solutions, Director (1997-Present)
No. of Portfolios for which Board Member Serves: 98
———————
Peggy C. Davis (78)
Board Member (2006)
Principal Occupation During Past 5 Years:
· Shad Professor of Law, New York University School of Law (1983-Present)
No. of Portfolios for which Board Member Serves: 35
———————
Gina D. France (63)
Board Member (2019)
Principal Occupation During Past 5 Years:
· France Strategic Partners, a strategy and advisory firm serving corporate clients across the United States, Founder, President and Chief Executive Officer (2003-Present)
Other Public Company Board Memberships During Past 5 Years:
· Huntington Bancshares, a bank holding company headquartered in Columbus, Ohio, Director (2016-Present)
· Cedar Fair, L.P., a publicly-traded partnership that owns and operates amusement parks and hotels in the U.S. and Canada, Director (2011-Present)
· CBIZ, Inc., a public company providing professional business services, products and solutions, Director (2015-Present)
· FirstMerit Corporation, a diversified financial services company, Director (2004-2016)
No. of Portfolios for which Board Member Serves: 25
———————
Joan Gulley (74)
Board Member (2017)
Principal Occupation During Past 5 Years:
· Nantucket Atheneum, public library, Chair (2018-June 2021) and Director (2015-June 2021)
· Orchard Island Club, golf and beach club, Governor (2016-Present)
No. of Portfolios for which Board Member Serves: 43
———————
51
BOARD MEMBERS INFORMATION (Unaudited) (continued)
Robin A. Melvin (58)
Board Member (2012)
Principal Occupation During Past 5 Years:
· Westover School, a private girls’ boarding school in Middlebury, Connecticut, Trustee (2019-Present)
· Mentor Illinois, a non-profit organization dedicated to increasing the quality of mentoring services in Illinois. Co-Chair (2014–2020); Board Member, Mentor Illinois (2013-2020)
· JDRF, a non-profit juvenile diabetes research foundation, Board Member (June 2021-Present)
Other Public Company Board Memberships During Past 5 Years:
· HPS Corporate Lending Fund, a closed-end management investment company regulated as a business development company, Trustee (August 2021-Present)
No. of Portfolios for which Board Member Serves: 76
———————
Once elected all Board Members serve for an indefinite term, but achieve Emeritus status upon reaching age 80. The address of the Board Members and Officers is c/o BNY Mellon Investment Adviser, Inc. 240 Greenwich Street, New York, New York 10286. Additional information about the Board Members is available in the fund’s Statement of Additional Information which can be obtained from the Adviser free of charge by calling this toll free number: 1-800-373-9387.
David P. Feldman, Emeritus Board Member
Ehud Houmier, Emeritus Board Member
Lynn Martin, Emeritus Board Member
Dr. Martin Peretz, Emeritus Board Member
Philip L. Toia, Emeritus Board Member
52
OFFICERS OF THE FUND (Unaudited)
DAVID DIPETRILLO, President since January 2021.
Vice President and Director of the Adviser since February 2021; Head of North America Product, BNY Mellon Investment Management since January 2018; Director of Product Strategy, BNY Mellon Investment Management from January 2016 to December 2017. He is an officer of 57 investment companies (comprised of 107 portfolios) managed by the Adviser or an affiliate of the Adviser. He is 43 years old and has been an employee of BNY Mellon since 2005.
JAMES WINDELS, Treasurer since November 2001.
Vice President of the Adviser since September 2020; Director - BNY Mellon Fund Administration, and an officer of 58 investment companies (comprised of 129 portfolios) managed by the Adviser or an affiliate of the Adviser. He is 63 years old and has been an employee of the Adviser since April 1985.
PETER M. SULLIVAN, Chief Legal Officer since July 2021 and Vice President and Assistant Secretary since March 2019.
Chief Legal Officer of the Adviser since July 2021, Associate General Counsel of BNY Mellon since July 2021; Senior Managing Counsel of BNY Mellon from December 2020 to July 2021; Managing Counsel of BNY Mellon from March 2009 to December 2020, and an officer of 58 investment companies (comprised of 129 portfolios) managed by the Adviser or an affiliate of the Adviser. He is 53 years old and has been an employee of BNY Mellon since April 2004.
JAMES BITETTO, Vice President since August 2005 and Secretary since February 2018.
Senior Managing Counsel of BNY Mellon since December 2019; Managing Counsel of BNY Mellon from April 2014 to December 2019; Secretary of the Adviser, and an officer of 58 investment companies (comprised of 129 portfolios) managed by the Adviser or an affiliate of the Adviser. He is 55 years old and has been an employee of the Adviser since December 1996.
DEIRDRE CUNNANE, Vice President and Assistant Secretary since March 2019.
Counsel of BNY Mellon since August 2018; Senior Regulatory Specialist at BNY Mellon Investment Management Services from February 2016 to August 2018. She is an officer of 58 investment companies (comprised of 129 portfolios) managed by the Adviser or an affiliate of the Adviser. She is 31 years old and has been an employee of the Adviser since August 2018.
SARAH S. KELLEHER, Vice President and Assistant Secretary since April 2014.
Vice President since February 2020 of BNY Mellon ETF Investment Adviser; LLC, Senior Managing Counsel of BNY Mellon since September 2021; Managing Counsel from December 2017 to September 2021; Senior Counsel of BNY Mellon from March 2013 to December 2017. She is an officer of 58 investment companies (comprised of 129 portfolios) managed by the Adviser or an affiliate of the Adviser. She is 46 years old and has been an employee of the Adviser since March 2013.
JEFF PRUSNOFSKY, Vice President and Assistant Secretary since August 2005.
Senior Managing Counsel of BNY Mellon, and an officer of 58 investment companies (comprised of 129 portfolios) managed by the Adviser or an affiliate of the Adviser. He is 56 years old and has been an employee of the Adviser since October 1990.
AMANDA QUINN, Vice President and Assistant Secretary since March 2020.
Counsel of BNY Mellon since June 2019; Regulatory Administration Manager at BNY Mellon Investment Management Services from September 2018 to May 2019; Senior Regulatory Specialist at BNY Mellon Investment Management Services from April 2015 to August 2018. She is an officer of 58 investment companies (comprised of 129 portfolios) managed by the Adviser or an affiliate of the Adviser. She is 36 years old and has been an employee of the Adviser since June 2019.
53
OFFICERS OF THE FUND (Unaudited) (continued)
NATALYA ZELENSKY, Vice President and Assistant Secretary since March 2017.
Chief Compliance Officer since August 2021 and Vice President since February 2020 of BNY Mellon ETF Investment Adviser, LLC; Chief Compliance Officer since August 2021 and Vice President and Assistant Secretary since February 2020 of BNY Mellon ETF Trust; Managing Counsel from December 2019 to August 2021 of BNY Mellon; Counsel from May 2016 to December 2019 of BNY Mellon; Assistant Secretary of the Adviser from April 2018 to August 2021. She is an officer of 57 investment companies (comprised of 128 portfolios) managed by the Adviser or an affiliate of the Adviser. She is 36 years old and has been an employee of BNY Mellon since May 2016.
GAVIN C. REILLY, Assistant Treasurer since December 2005.
Tax Manager-BNY Mellon Fund Administration, and an officer of 58 investment companies (comprised of 129 portfolios) managed by the Adviser or an affiliate of the Adviser. He is 53 years old and has been an employee of the Adviser since April 1991.
ROBERT SALVIOLO, Assistant Treasurer since July 2007.
Senior Accounting Manager–BNY Mellon Fund Administration, and an officer of 58 investment companies (comprised of 129 portfolios) managed by the Adviser or an affiliate of the Adviser. He is 54 years old and has been an employee of the Adviser since June 1989.
ROBERT SVAGNA, Assistant Treasurer since December 2002.
Senior Accounting Manager–BNY Mellon Fund Administration, and an officer of 58 investment companies (comprised of 129 portfolios) managed by the Adviser or an affiliate of the Adviser. He is 54 years old and has been an employee of the Adviser since November 1990.
JOSEPH W. CONNOLLY, Chief Compliance Officer since October 2004.
Chief Compliance Officer of the BNY Mellon Family of Funds and BNY Mellon Funds Trust since 2004, Chief Compliance Officer of the Adviser from 2004 until June 2021. He is an officer of 57 investment companies (comprised of 120 portfolios) managed by the Adviser. He is 64 years old.
CARIDAD M. CAROSELLA, Anti-Money Laundering Compliance Officer since January 2016.
Anti-Money Laundering Compliance Officer of the BNY Mellon Family of Funds and BNY Mellon Funds Trust. She is an officer of 50 investment companies (comprised of 121 portfolios) managed by the Adviser or an affiliate of the Adviser. She is 53 years old and has been an employee of the Distributor since 1997.
54
This page intentionally left blank.
55
This page intentionally left blank.
56
This page intentionally left blank.
57
BNY Mellon Global Dynamic Bond Income Fund
240 Greenwich Street
New York, NY 10286
Adviser
BNY Mellon Investment Adviser, Inc.
240 Greenwich Street
New York, NY 10286
Sub-Adviser
Newton Investment Management Limited
160 Queen Victoria Street
London, EC4V, 4LA, UK
Custodian
The Bank of New York Mellon
240 Greenwich Street
New York, NY 10286
Transfer Agent &
Dividend Disbursing Agent
BNY Mellon Transfer, Inc.
240 Greenwich Street
New York, NY 10286
Distributor
BNY Mellon Securities Corporation
240 Greenwich Street
New York, NY 10286
| | |
Ticker Symbols: | Class A: DGDAX Class C: DGDCX Class I: DGDIX Class Y: DGDYX |
Telephone Call your financial representative or 1-800-373-9387
Mail The BNY Mellon Family of Funds, 144 Glenn Curtiss Boulevard, Uniondale, NY 11556-0144
E-mail Send your request to info@bnymellon.com
Internet Information can be viewed online or downloaded at www.im.bnymellon.com
The fund files its complete schedule of portfolio holdings with the Securities and Exchange Commission (“SEC”) for the first and third quarters of each fiscal year on Form N-PORT. The fund’s Forms N-PORT are available on the SEC’s website at www.sec.gov.
A description of the policies and procedures that the fund uses to determine how to vote proxies relating to portfolio securities and information regarding how the fund voted these proxies for the most recent 12-month period ended June 30 is available at www.im.bnymellon.com and on the SEC’s website at www.sec.gov and without charge, upon request, by calling 1-800-373-9387.
| | |
© 2021 BNY Mellon Securities Corporation
6298AR1021 | 
|
BNY Mellon Global Real Return Fund
| |
ANNUAL REPORT October 31, 2021 |
| |
Save time. Save paper. View your next shareholder report online as soon as it’s available. Log into www.im.bnymellon.com and sign up for eCommunications. It’s simple and only takes a few minutes. |
| |
The views expressed in this report reflect those of the portfolio manager(s) only through the end of the period covered and do not necessarily represent the views of BNY Mellon Investment Adviser, Inc. or any other person in the BNY Mellon Investment Adviser, Inc. organization. Any such views are subject to change at any time based upon market or other conditions and BNY Mellon Investment Adviser, Inc. disclaims any responsibility to update such views. These views may not be relied on as investment advice and, because investment decisions for a fund in the BNY Mellon Family of Funds are based on numerous factors, may not be relied on as an indication of trading intent on behalf of any fund in the BNY Mellon Family of Funds. |
| |
Not FDIC-Insured • Not Bank-Guaranteed • May Lose Value |
Contents
THE FUND
FOR MORE INFORMATION
Back Cover
DISCUSSION OF FUND PERFORMANCE (Unaudited)
For the period from November 1, 2020 through October 31, 2021, as provided by portfolio managers Suzanne Hutchins, Aron Pataki and Andrew Warwick of Newton Investment Management Limited, Sub-Investment Adviser
Market and Fund Performance Overview
For the 12-month period ended October 31, 2021, BNY Mellon Global Real Return Fund’s Class A shares produced a total return of 14.60%, Class C shares returned 13.72%, Class I shares returned 14.83% and Class Y shares returned 15.03%.1 In comparison, the fund’s benchmark, the FTSE One-Month U.S. Treasury Bill Index, and the fund’s performance baseline benchmark, the USD One-Month LIBOR, produced total returns of 0.04% and 0.11%, respectively, for the same period.2,3
Global equity markets gained ground during the reporting period, while global bonds produced mixed returns amid accommodative central bank policies, strong corporate earnings, rising interest rates and improving investor sentiment as vaccines for the COVID-19 pandemic rolled out. The fund outperformed its benchmark, largely due to its positioning in the return-seeking core of the portfolio.
The Fund’s Investment Approach
The fund seeks total return (consisting of capital appreciation and income). To pursue its goal, the fund uses an actively managed, multi-asset strategy to produce absolute or real returns with less volatility than major equity markets over a complete market cycle, typically a period of five years. Rather than trying to track a benchmark index, the fund seeks to provide returns that are largely independent of market moves.
The fund allocates its investments among global equities, bonds and cash, and, generally to a lesser extent, other asset classes, including real estate, commodities, currencies, and alternative or non-traditional asset classes and strategies, primarily those accessed through derivative instruments.
The fund’s portfolio managers combine a top-down approach, emphasizing economic trends and current investment themes on a global basis, with bottom-up security selection, based on fundamental research, to allocate the fund’s investments among and within asset classes. In choosing investments, the portfolio managers consider key trends in global economic variables, such as gross domestic product, inflation and interest rates; investment themes, such as changing demographics, the impact of new technologies and the globalization of industries and brands; relative valuations of equity securities, bonds and cash; long-term trends in currency movements; and company fundamentals.
Stocks Outperform and Bond Yields Rise as Economies Reopen
The rebound in risk assets following the early-2020 pandemic-induced trough continued in November and December 2020, despite a sharp acceleration in COVID-19 infection rates and the reintroduction of further lockdowns. Investors, however, looked beyond these near-term challenges, thanks to a raft of positive vaccine news that heralded the
2
prospect of economic and social normalization, combined with a relatively benign outcome of the U.S. presidential election. As 2021 began, investors anticipated a dialing back of the exceptional levels of stimulus witnessed in the aftermath of the onset of the pandemic, resulting in a significant move in U.S. Treasury yields. The rise in bond yields was closely correlated with the marked outperformance of financials and energy stocks, while equities in areas such as technology, which had benefited from a combination of the stay-at-home economy and deeply negative real yields, relinquished some of their earlier gains. As the year progressed, a number of relatively short-lived bouts of equity-market weakness occurred as more hawkish commentary regarding the potential for asset-purchase tapering and interest-rate hikes emerged from the U.S. Federal Reserve. These comments prompted a resumption in the rise in bond yields and renewed fears of more prolonged inflationary pressures.
Equity Holdings Lead Gains
The return-seeking core of the portfolio produced robust performance over the reporting period, with the portfolio’s equity holdings doing the heavy lifting. More economically-sensitive stocks featured among the top performers, including oil and gas producer ConocoPhillips, semiconductor equipment maker ASML Holding, and capital markets firm The Goldman Sachs Group, although secular growth names such as Internet advertising firm Alphabet and enterprise software giant Microsoft also delivered robust returns. All other areas of the core, including alternatives, corporate bonds and emerging- markets debt also performed well, buoyed by the risk-on sentiment prevailing over much of the period.
Conversely, the stabilizing layer of the portfolio detracted from relative performance. Despite being accretive to returns in January 2021, derivative protection represented a cost over the period as a whole in the context of equity market strength. We use derivatives for risk management purposes, both for protection on the downside and selectively to gain upside exposure, when we consider it efficient to do so as a means of expressing a constructive view. Other areas of the stabilizing layer also detracted from relative returns. Gold traced a less glittering path than in previous quarters, taking a decisive leg down as 2021 progressed. Index-linked bonds were a marginal negative as yields drifted higher.
Adopting a Constructive Position
As of the end of the period, the Fund’s positioning reflects a constructive view of the prevailing economic backdrop, with a sizeable, return-seeking core versus historic levels. Equity exposure remains well balanced between cyclical, secular growth and defensive names, against the potential for a shift in market leadership. Within the stabilizing layer, we continue to employ a combination of direct and indirect protection, the former having gained proportionately more prominence after exiting our government bond and gold positions due to the headwind of rising real rates. Cash stands at relatively elevated levels to take advantage of opportunities as they emerge in both the return-seeking and risk-mitigating layers of the portfolio.
3
DISCUSSION OF FUND PERFORMANCE (Unaudited) (continued)
While the Fund currently maintains a constructive position, we are mindful of the absolute return nature of our mandate. We remain vigilant on behalf of clients, ready to take dynamic steps to change the fund’s asset allocations if required, as we have done in the past.
November 15, 2021
1 DUE TO RECENT MARKET VOLATILITY, CURRENT PERFORMANCE MAY BE DIFFERENT THAN THE FIGURES SHOWN. Total return includes reinvestment of dividends and any capital gains paid, and does not take into consideration the maximum initial sales charge in the case of Class A shares, or the applicable contingent deferred sales charge imposed on redemptions in the case of Class C shares. Share price and investment return fluctuate such that upon redemption, fund shares may be worth more or less than their original cost. The fund’s return reflects the absorption of certain fund expenses by BNY Mellon Investment Adviser, Inc. pursuant to an agreement in effect through March 1, 2022, at which time it may be extended, modified or terminated. Had these expenses not been absorbed, returns would have been lower. Past performance is no guarantee of future results.
2 Source: FactSet — The London Interbank Offered Rate (LIBOR) is the average interest rate at which leading banks borrow funds of a sizable amount from other banks in the London market. LIBOR is the most widely used “benchmark” or reference rate for short-term interest rates. Investors cannot invest directly in any index.
3 Source: Lipper, Inc. — The FTSE One-Month U.S. Treasury Bill Index consists of the last one-month Treasury bill month-end rates. The FTSE One-Month U.S. Treasury Bill Index measures return equivalents of yield averages. The instruments are not marked to market. Investors cannot invest directly in any index.
Equities are subject generally to market, market sector, market liquidity, issuer and investment style risks, among other factors, to varying degrees, all of which are more fully described in the fund’s prospectus.
Bonds are subject generally to interest-rate, credit, liquidity and market risks, to varying degrees, all of which are more fully described in the fund’s prospectus. Generally, all other factors being equal, bond prices are inversely related to interest-rate changes, and rate increases can cause price declines.
Small and midsized company stocks tend to be more volatile and less liquid than larger company stocks as these companies are less established and have more volatile earnings histories.
Recent market risks include pandemic risks related to COVID-19. The effects of COVID-19 have contributed to increased volatility in global markets and will likely affect certain countries, companies, industries and market sectors more dramatically than others. To the extent the fund may overweight its investments in certain countries, companies, industries or market sectors, such positions will increase the fund’s exposure to risk of loss from adverse developments affecting those countries, companies, industries or sectors.
The fund’s performance will be influenced by political, social and economic factors affecting investments in foreign companies. Special risks associated with such companies include exposure to currency fluctuations, less liquidity, less developed or less efficient trading markets, lack of comprehensive company information, political instability and differing auditing and legal standards.
Because the fund seeks to provide exposure to alternative or non-traditional (i.e., satellite) asset categories or investment strategies, the fund’s performance will be linked to the performance of these highly volatile asset categories and strategies. Accordingly, investors should consider purchasing shares of the fund only as part of an overall diversified portfolio and should be willing to assume the risks of potentially significant fluctuations in the value of fund shares.
The fund may, but is not required to, use derivative instruments. A small investment in derivatives could have a potentially large impact on the fund’s performance. The use of derivatives involves risks different from, or possibly greater than, the risks associated with investing directly in the underlying assets.
4
FUND PERFORMANCE (Unaudited)

Comparison of change in value of a $10,000 investment in Class A shares, Class C shares, and Class I shares of BNY Mellon Global Real Return Fund with a hypothetical investment of $10,000 in the FTSE One-Month U.S. Treasury Bill Index and USD 1-Month LIBOR.
† Source: FactSet
†† Source: Lipper Inc.
Past performance is not predictive of future performance.
The above graph compares a hypothetical investment of $10,000 made in each of the Class A shares, Class C shares, and Class I shares of BNY Mellon Global Real Return Fund on 10/31/11 to a hypothetical investment of $10,000 made in the FTSE One-Month U.S. Treasury Bill Index and USD 1-Month LIBOR on that date. All dividends and capital gain distributions are reinvested.
The fund’s performance shown in the line graph above takes into account the maximum initial sales charge on Class A shares and all other applicable fees and expenses on Class A shares, Class C shares, and Class I shares. The FTSE One-Month U.S. Treasury Bill Index consists of the last one-month Treasury bill month-end rates. The FTSE One-Month U.S. Treasury Bill Index measures return equivalents of yield averages. The instruments are not marked to market. The London Interbank Offered Rate (LIBOR) is the average interest rate at which leading banks borrow funds of a sizable amount from other banks in the London market. LIBOR is the most widely used "benchmark" or reference rate for short-term interest rates. Unlike a mutual fund, the indices are not subject to charges, fees and other expenses. Investors cannot invest directly in any index. Further information relating to fund performance, including expense reimbursements, if applicable, is contained in the Financial Highlights section of the prospectus and elsewhere in this report.
5
FUND PERFORMANCE (Unaudited) (continued)

Comparison of change in value of a $1,000,000 investment in Class Y shares of BNY Mellon Global Real Return Fund with a hypothetical investment of $1,000,000 in the FTSE One-Month U.S. Treasury Bill Index and USD 1-Month LIBOR.
† Source: FactSet
†† Source: Lipper Inc.
††† The total return figures presented for Class Y shares of the fund reflect the performance of the fund’s Class A shares for the period prior to 7/1/13 (the inception date for Class Y shares), not reflecting the applicable sales charges for Class A shares.
Past performance is not predictive of future performance.
The above graph compares a hypothetical investment of $1,000,000 made in Class Y shares of BNY Mellon Global Real Return Fund on 10/31/11 to a hypothetical investment of $1,000,000 made in the FTSE One-Month U.S. Treasury Bill Index and USD 1-Month LIBOR on that date. All dividends and capital gain distributions are reinvested.
The fund’s performance shown in the line graph above takes into account all applicable fees and expenses of the fund’s Class Y shares. The FTSE One-Month U.S. Treasury Bill Index consists of the last one-month Treasury bill month-end rates. The FTSE One-Month U.S. Treasury Bill Index measures return equivalents of yield averages. The instruments are not marked to market. The London Interbank Offered Rate (LIBOR) is the average interest rate at which leading banks borrow funds of a sizable amount from other banks in the London market. LIBOR is the most widely used "benchmark" or reference rate for short-term interest rates. Unlike a mutual fund, the indices are not subject to charges, fees and other expenses. Investors cannot invest directly in any index. Further information relating to fund performance, including expense reimbursements, if applicable, is contained in the Financial Highlights section of the prospectus and elsewhere in this report.
6
| | | | | |
Average Annual Total Returns as of 10/31/2021 |
| Inception
Date | 1 Year | 5 Years | 10 Years |
Class A shares | | | | |
with maximum sales charge (5.75%) | 5/12/10 | 8.01% | 4.47% | 4.26% |
without sales charge | 5/12/10 | 14.60% | 5.72% | 4.88% |
Class C shares | | | | |
with applicable redemption charge† | 5/12/10 | 12.72% | 4.91% | 4.09% |
without redemption | 5/12/10 | 13.72% | 4.91% | 4.09% |
Class I shares | 5/12/10 | 14.83% | 5.98% | 5.16% |
Class Y shares | 7/1/13 | 15.03% | 6.08% | 5.20%†† |
USD 1-Month LIBOR Index | | 0.11% | 1.24% | 0.74% |
FTSE One-Month U.S. Treasury
Bill Index | | 0.04% | 1.07% | 0.56% |
† The maximum contingent deferred sales charge for Class C shares is 1% for shares redeemed within one year of the date of purchase.
†† The total return performance figures presented for Class Y shares of the fund reflect the performance of the fund’s Class A shares for the period prior to 7/1/13 (the inception date for Class Y shares), not reflecting the applicable sales charges for Class A shares.
The performance data quoted represents past performance, which is no guarantee of future results. Share price and investment return fluctuate and an investor’s shares may be worth more or less than original cost upon redemption. Current performance may be lower or higher than the performance quoted. Go to www.im.bnymellon.com for the fund’s most recent month-end returns.
The fund’s performance shown in the graphs and table does not reflect the deduction of taxes that a shareholder would pay on fund distributions or the redemption of fund shares. In addition to the performance of Class A shares shown with and without a maximum sales charge, the fund's performance shown in the table takes into account all other applicable fees and expenses on all classes.
7
UNDERSTANDING YOUR FUND’S EXPENSES (Unaudited)
As a mutual fund investor, you pay ongoing expenses, such as management fees and other expenses. Using the information below, you can estimate how these expenses affect your investment and compare them with the expenses of other funds. You also may pay one-time transaction expenses, including sales charges (loads) and redemption fees, which are not shown in this section and would have resulted in higher total expenses. For more information, see your fund’s prospectus or talk to your financial adviser.
Review your fund’s expenses
The table below shows the expenses you would have paid on a $1,000 investment in BNY Mellon Global Real Return Fund from May 1, 2021 to October 31, 2021. It also shows how much a $1,000 investment would be worth at the close of the period, assuming actual returns and expenses.
| | | | | | | |
Expenses and Value of a $1,000 Investment | |
Assume actual returns for the six months ended October 31, 2021 | |
| | | | | | |
| | Class A | Class C | Class I | Class Y | |
Expenses paid per $1,000† | $5.63 | $9.55 | $4.56 | $4.05 | |
Ending value (after expenses) | $1,031.60 | $1,027.10 | $1,032.70 | $1,033.20 | |
COMPARING YOUR FUND’S EXPENSES
WITH THOSE OF OTHER FUNDS (Unaudited)
Using the SEC’s method to compare expenses
The Securities and Exchange Commission (“SEC”) has established guidelines to help investors assess fund expenses. Per these guidelines, the table below shows your fund’s expenses based on a $1,000 investment, assuming a hypothetical 5% annualized return. You can use this information to compare the ongoing expenses (but not transaction expenses or total cost) of investing in the fund with those of other funds. All mutual fund shareholder reports will provide this information to help you make this comparison. Please note that you cannot use this information to estimate your actual ending account balance and expenses paid during the period.
| | | | | | | |
Expenses and Value of a $1,000 Investment | |
Assuming a hypothetical 5% annualized return for the six months ended October 31, 2021 | |
| | | | | | |
| | Class A | Class C | Class I | Class Y | |
Expenses paid per $1,000† | $5.60 | $9.50 | $4.53 | $4.02 | |
Ending value (after expenses) | $1,019.66 | $1,015.78 | $1,020.72 | $1,021.22 | |
† | Expenses are equal to the fund’s annualized expense ratio of 1.10% for Class A, 1.87% for Class C, .89% for Class I and .79% for Class Y, multiplied by the average account value over the period, multiplied by 184/365 (to reflect the one-half year period). |
8
CONSOLIDATED STATEMENT OF INVESTMENTS
October 31, 2021
| | | | | | | | | | |
| |
Description | Coupon
Rate (%) | | Maturity Date | | Principal Amount ($) | a | Value ($) | |
Bonds and Notes - 15.7% | | | | | |
France - .3% | | | | | |
Altice France, Sr. Scd. Bonds | EUR | 4.13 | | 1/15/2029 | | 4,944,000 | | 5,639,062 | |
Banijay Entertainment, Sr. Scd. Notes | | 5.38 | | 3/1/2025 | | 500,000 | b | 515,000 | |
Iliad Holding, Sr. Scd. Notes | EUR | 5.63 | | 10/15/2028 | | 5,576,000 | | 6,663,404 | |
| | 12,817,466 | |
Germany - .1% | | | | | |
TK Elevator Midco GmbH, Sr. Scd. Bonds | EUR | 4.38 | | 7/15/2027 | | 2,718,000 | | 3,237,289 | |
India - .1% | | | | | |
National Highways Authority of India, Sr. Unscd. Bonds | INR | 7.30 | | 5/18/2022 | | 160,000,000 | | 2,158,813 | |
Italy - .7% | | | | | |
Intesa Sanpaolo, Gtd. Notes | | 7.70 | | 9/17/2025 | | 9,506,000 | b,c,d | 10,634,837 | |
UniCredit, Jr. Sub. Bonds | | 8.00 | | 6/3/2024 | | 5,625,000 | d | 6,156,816 | |
UniCredit, Jr. Sub. Notes | EUR | 3.88 | | 6/3/2027 | | 8,882,000 | d | 9,878,645 | |
| | 26,670,298 | |
Luxembourg - .2% | | | | | |
Summer BC Holdco B, Sr. Scd. Bonds | EUR | 5.75 | | 10/31/2026 | | 6,583,000 | | 7,959,054 | |
Mexico - .4% | | | | | |
Sigma Alimentos, Gtd. Notes | | 4.13 | | 5/2/2026 | | 13,823,000 | | 14,859,863 | |
Netherlands - 2.5% | | | | | |
BNP Paribas Issuance, Bank Gtd., Ser. F | | 0.00 | | 11/18/2021 | | 87,561,000 | e | 89,145,854 | |
Ziggo, Sr. Scd. Bonds | EUR | 2.88 | | 1/15/2030 | | 3,571,000 | | 4,129,323 | |
| | 93,275,177 | |
Spain - .8% | | | | | |
Banco Bilbao Vizcaya Argentaria, Jr. Sub. Bonds | EUR | 5.88 | | 9/24/2023 | | 6,000,000 | c,d | 7,404,180 | |
Banco Bilbao Vizcaya Argentaria, Jr. Sub. Notes | EUR | 6.00 | | 3/29/2024 | | 7,200,000 | d | 8,999,460 | |
Banco Santander, Jr. Sub. Bonds | EUR | 4.75 | | 3/19/2025 | | 7,800,000 | c,d | 9,333,109 | |
Banco Santander, Jr. Sub. Bonds | EUR | 5.25 | | 9/29/2023 | | 5,200,000 | d | 6,311,760 | |
| | 32,048,509 | |
United Kingdom - 4.4% | | | | | |
Barclays Bank, Structured Notes, Ser. 000S | | 0.00 | | 8/15/2022 | | 71,827,500 | e | 73,240,477 | |
Barclays Bank, Structured Notes, Ser. GN0U | | 0.00 | | 8/12/2022 | | 71,827,500 | e | 73,757,278 | |
Lloyds Banking Group, Jr. Sub. Bonds | EUR | 4.95 | | 6/27/2025 | | 8,562,000 | c,d | 10,800,241 | |
TESCO, Sr. Unscd. Notes | GBP | 6.13 | | 2/24/2022 | | 74,000 | | 103,073 | |
9
CONSOLIDATED STATEMENT OF INVESTMENTS (continued)
| | | | | | | | | | |
| |
Description | Coupon
Rate (%) | | Maturity Date | | Principal Amount ($) | a | Value ($) | |
Bonds and Notes - 15.7% (continued) | | | | | |
United Kingdom - 4.4% (continued) | | | | | |
Vmed O2 UK Financing I, Sr. Scd. Bonds | GBP | 4.00 | | 1/31/2029 | | 7,588,000 | | 10,278,116 | |
| | 168,179,185 | |
United States - 6.2% | | | | | |
Ball, Gtd. Notes | | 2.88 | | 8/15/2030 | | 6,402,000 | | 6,161,925 | |
CCO Holdings, Sr. Unscd. Notes | | 5.50 | | 5/1/2026 | | 3,125,000 | b | 3,232,031 | |
Sprint, Gtd. Notes | | 7.13 | | 6/15/2024 | | 3,786,000 | | 4,282,913 | |
Sprint Capital, Gtd. Notes | | 8.75 | | 3/15/2032 | | 4,597,000 | | 6,886,306 | |
U.S. Treasury Notes | | 2.00 | | 2/15/2022 | | 211,000,000 | c | 212,175,038 | |
United Airlines, Sr. Scd. Notes | | 4.38 | | 4/15/2026 | | 1,224,000 | b | 1,267,721 | |
| | 234,005,934 | |
Total Bonds and Notes
(cost $578,783,906) | | 595,211,588 | |
Description | | | | | Shares | | Value ($) | |
Common Stocks - 64.6% | | | | | |
Australia - .2% | | | | | |
The Star Entertainment Group | | | | | | 3,436,921 | | 9,462,651 | |
China - 2.8% | | | | | |
Alibaba Group Holding | | | | | | 664,469 | f | 13,920,500 | |
Flat Glass Group, Cl. H | | | | | | 2,211,000 | c | 11,935,223 | |
Foshan Haitian Flavouring & Food, Cl. A | | | | | | 682,002 | | 12,471,344 | |
LONGi Green Energy Technology, CI. A | | | | | | 1,675,428 | | 25,576,635 | |
NARI Technology, Cl. A | | | | | | 1,871,440 | | 11,384,864 | |
Tencent Holdings | | | | | | 144,695 | | 8,945,221 | |
Tencent Music Entertainment Group, ADR | | | | | | 1,033,487 | f | 8,123,208 | |
Yum China Holdings | | | | | | 266,402 | | 15,206,226 | |
| | 107,563,221 | |
Denmark - 1.2% | | | | | |
Novozymes, Cl. B | | | | | | 267,368 | | 19,661,000 | |
Orsted | | | | | | 186,477 | b | 26,312,528 | |
| | 45,973,528 | |
France - 3.1% | | | | | |
Air Liquide | | | | | | 95,357 | | 15,899,963 | |
Bureau Veritas | | | | | | 622,501 | | 19,760,522 | |
Legrand | | | | | | 187,963 | | 20,476,960 | |
L'Oreal | | | | | | 65,629 | | 29,963,721 | |
LVMH | | | | | | 39,152 | | 30,649,877 | |
| | 116,751,043 | |
Germany - 2.5% | | | | | |
Bayer | | | | | | 510,172 | | 28,703,562 | |
10
| | | | | | | | | | |
| |
Description | | | | | Shares | | Value ($) | |
Common Stocks - 64.6% (continued) | | | | | |
Germany - 2.5% (continued) | | | | | |
Continental | | | | | | 244,820 | | 28,731,370 | |
RWE | | | | | | 976,704 | | 37,564,153 | |
| | 94,999,085 | |
Guernsey - .0% | | | | | |
Amedeo Air Four Plus | | | | | | 2,671,187 | | 913,913 | |
Hong Kong - 1.6% | | | | | |
AIA Group | | | | | | 3,373,800 | | 38,093,738 | |
Link REIT | | | | | | 2,685,500 | | 23,815,886 | |
| | 61,909,624 | |
India - .7% | | | | | |
Housing Development Finance | | | | | | 733,347 | | 27,859,474 | |
Ireland - 3.7% | | | | | |
Accenture, Cl. A | | | | | | 102,392 | | 36,737,226 | |
Kerry Group, Cl. A | | | | | | 113,701 | | 15,259,993 | |
Medtronic | | | | | | 345,807 | | 41,448,427 | |
Ryanair Holdings, ADR | | | | | | 296,488 | f | 33,654,353 | |
Trane Technologies | | | | | | 62,966 | | 11,392,438 | |
| | 138,492,437 | |
Japan - 2.3% | | | | | |
Advantest | | | | | | 307,100 | | 25,139,224 | |
Sony Group | | | | | | 376,200 | | 43,371,511 | |
Suzuki Motor | | | | | | 402,300 | | 17,913,336 | |
| | 86,424,071 | |
Netherlands - 1.7% | | | | | |
ASML Holding | | | | | | 58,577 | | 47,434,366 | |
Universal Music Group | | | | | | 645,649 | | 18,745,089 | |
| | 66,179,455 | |
Norway - .3% | | | | | |
TOMRA Systems | | | | | | 180,916 | | 11,675,730 | |
South Korea - .9% | | | | | |
Samsung SDI | | | | | | 53,033 | | 33,311,559 | |
Switzerland - 4.2% | | | | | |
Alcon | | | | | | 430,117 | | 35,542,434 | |
Lonza Group | | | | | | 32,341 | | 26,512,838 | |
Novartis | | | | | | 188,938 | | 15,608,639 | |
TE Connectivity | | | | | | 316,592 | | 46,222,432 | |
Zurich Insurance Group | | | | | | 77,838 | | 34,506,820 | |
| | 158,393,163 | |
Taiwan - .3% | | | | | |
Taiwan Semiconductor Manufacturing, ADR | | | | | | 84,107 | | 9,562,966 | |
United Kingdom - 12.6% | | | | | |
3i Group | | | | | | 916,362 | | 17,105,750 | |
11
CONSOLIDATED STATEMENT OF INVESTMENTS (continued)
| | | | | | | | | | |
| |
Description | | | | | Shares | | Value ($) | |
Common Stocks - 64.6% (continued) | | | | | |
United Kingdom - 12.6% (continued) | | | | | |
Associated British Foods | | | | | | 482,190 | | 11,799,032 | |
AstraZeneca | | | | | | 471,446 | | 58,674,254 | |
BAE Systems | | | | | | 1,874,492 | | 14,155,524 | |
Barratt Developments | | | | | | 1,834,268 | | 16,643,206 | |
Diageo | | | | | | 769,933 | | 38,270,086 | |
Ferguson | | | | | | 125,630 | | 18,903,806 | |
Informa | | | | | | 1,819,576 | f | 12,933,999 | |
Linde | | | | | | 211,913 | | 67,642,630 | |
Octopus Renewables Infrastructure Trust | | | | | | 19,607,364 | | 29,356,022 | |
Persimmon | | | | | | 498,248 | | 18,553,881 | |
Prudential | | | | | | 2,297,573 | | 46,992,214 | |
RELX | | | | | | 1,112,581 | | 34,507,234 | |
SDCL Energy Efficiency Income Trust | | | | | | 18,719,270 | | 29,204,813 | |
Taylor Wimpey | | | | | | 8,362,126 | | 17,686,683 | |
Travis Perkins | | | | | | 834,584 | | 17,623,682 | |
Unilever | | | | | | 475,814 | | 25,472,398 | |
Wickes Group | | | | | | 865,511 | | 2,539,557 | |
| | 478,064,771 | |
United States - 26.5% | | | | | |
Abbott Laboratories | | | | | | 228,286 | | 29,423,783 | |
Alphabet, Cl. A | | | | | | 18,171 | f | 53,802,877 | |
Amazon.com | | | | | | 10,285 | f | 34,685,443 | |
American Tower | | | | | | 35,041 | g | 9,880,511 | |
Brixmor Property Group | | | | | | 1,096,822 | g | 25,709,508 | |
Citigroup | | | | | | 437,580 | | 30,263,033 | |
CME Group | | | | | | 220,906 | | 48,720,818 | |
ConocoPhillips | | | | | | 1,204,750 | | 89,741,827 | |
Dominion Energy | | | | | | 232,634 | | 17,663,900 | |
Ecolab | | | | | | 171,288 | | 38,063,619 | |
Elanco Animal Health | | | | | | 470,699 | f | 15,476,583 | |
Eversource Energy | | | | | | 169,496 | | 14,390,210 | |
Fidelity National Information Services | | | | | | 225,891 | | 25,015,169 | |
IDEXX Laboratories | | | | | | 33,897 | f | 22,580,148 | |
JPMorgan Chase & Co. | | | | | | 390,944 | | 66,417,476 | |
Lockheed Martin | | | | | | 38,658 | | 12,846,827 | |
Mastercard, Cl. A | | | | | | 76,496 | | 25,665,938 | |
Microsoft | | | | | | 148,342 | | 49,193,174 | |
Morgan Stanley | | | | | | 190,288 | | 19,557,801 | |
NIKE, Cl. B | | | | | | 256,683 | | 42,940,499 | |
Norfolk Southern | | | | | | 205,258 | | 60,150,857 | |
Otis Worldwide | | | | | | 500,361 | | 40,183,992 | |
12
| | | | | | | | | | |
| |
Description | | | | | Shares | | Value ($) | |
Common Stocks - 64.6% (continued) | | | | | |
United States - 26.5% (continued) | | | | | |
salesforce.com | | | | | | 109,114 | f | 32,700,375 | |
Texas Instruments | | | | | | 136,567 | | 25,603,581 | |
The Cooper Companies | | | | | | 42,475 | | 17,708,677 | |
The Goldman Sachs Group | | | | | | 74,631 | | 30,848,724 | |
The Home Depot | | | | | | 99,061 | | 36,824,936 | |
The Sherwin-Williams Company | | | | | | 88,746 | | 28,097,871 | |
Thermo Fisher Scientific | | | | | | 68,352 | | 43,271,601 | |
Zoetis | | | | | | 75,020 | | 16,219,324 | |
| | 1,003,649,082 | |
Total Common Stocks
(cost $1,899,612,238) | | 2,451,185,773 | |
Description /Number of Contracts | Exercise
Price | | Expiration Date | | Notional
Amount ($) | a | | |
Options Purchased - .3% | | | | | |
Call Options - .3% | | | | | |
Euro Stoxx 50 Price EUR, Contracts 7,690 | EUR | 4,200 | | 12/17/2021 | | 322,980,000 | | 10,169,748 | |
Put Options - .0% | | | | | |
Nasdaq 100 Stock Index, Contracts 62 | | 14,250 | | 11/19/2021 | | 88,350,000 | | 147,250 | |
S&P 500 Index, Contracts 1,647 | | 3,950 | | 12/17/2021 | | 650,565,000 | | 2,141,100 | |
| | 2,288,350 | |
Total Options Purchased
(cost $29,977,730) | | 12,458,098 | |
| | Preferred Dividend
Yield (%) | | | | Shares | | | |
Preferred Stocks - 1.3% | | | | | |
Germany - 1.3% | | | | | |
Volkswagen
(cost $42,191,354) | | 2.56 | | | | 220,700 | | 49,449,142 | |
| | | | | | | | | |
Exchange-Traded Funds - .3% | | | | | |
United States - .3% | | | | | |
U.S. Copper Index Fund
(cost $9,314,077) | | | | | | 370,235 | f,h | 9,937,107 | |
13
CONSOLIDATED STATEMENT OF INVESTMENTS (continued)
| | | | | | | | | | |
| |
Description | 1-Day
Yield (%) | | | | Shares | | Value ($) | |
Investment Companies - 15.5% | | | | | |
Closed-end Investment Companies - 5.1% | | | | | |
BBGI Global Infrastructure | | | | | | 5,358,752 | | 12,643,333 | |
Cordiant Digital Infrastructure | | | | | | 6,045,321 | b,f | 9,390,223 | |
Cordiant Digital Infrastructure, Cl. C | | | | | | 3,374,229 | f | 4,917,958 | |
Greencoat UK Wind | | | | | | 17,551,603 | | 34,252,871 | |
JLEN Environmental Assets Group | | | | | | 4,341,058 | | 6,190,475 | |
Riverstone Credit Opportunities Income | | | | | | 3,871,998 | | 3,358,958 | |
The Aquila European Renewables Income Fund | | | | | | 19,049,880 | | 22,462,095 | |
The BioPharma Credit Fund | | | | | | 19,756,560 | | 19,262,646 | |
The Gresham House Energy Storage Fund | | | | | | 7,915,000 | | 14,190,016 | |
The Hipgnosis Songs Fund | | | | | | 12,996,706 | | 22,055,436 | |
The Renewables Infrastructure Group | | | | | | 18,605,023 | | 33,711,561 | |
US Solar Fund | | | | | | 12,016,238 | c | 11,944,141 | |
| | 194,379,713 | |
Registered Investment Companies - 10.4% | | | | | |
Dreyfus Institutional Preferred Government Plus Money Market Fund, Institutional Shares | | 0.06 | | | | 395,768,872 | i | 395,768,872 | |
Total Investment Companies
(cost $576,036,119) | | 590,148,585 | |
14
| | | | | | | | | | |
| |
Description | 1-Day
Yield (%) | | | | Shares | | Value ($) | |
Investment of Cash Collateral for Securities Loaned - .9% | | | | | |
Registered Investment Companies - .9% | | | | | |
Dreyfus Institutional Preferred Government Plus Money Market Fund, SL Shares
(cost $33,593,991) | | 0.02 | | | | 33,593,991 | i | 33,593,991 | |
Total Investments (cost $3,169,509,415) | | 98.6% | 3,741,984,284 | |
Cash and Receivables (Net) | | 1.4% | 51,418,591 | |
Net Assets | | 100.0% | 3,793,402,875 | |
ADR—American Depository Receipt
ETF—Exchange-Traded Fund
REIT—Real Estate Investment Trust
EUR—Euro
GBP—British Pound
INR—Indian Rupee
a Amount stated in U.S. Dollars unless otherwise noted above.
b Security exempt from registration pursuant to Rule 144A under the Securities Act of 1933. These securities may be resold in transactions exempt from registration, normally to qualified institutional buyers. At October 31, 2021, these securities were valued at $51,352,340 or 1.35% of net assets.
c Security, or portion thereof, on loan. At October 31, 2021, the value of the fund’s securities on loan was $40,602,728 and the value of the collateral was $43,350,413, consisting of cash collateral of $33,593,991 and U.S. Government & Agency securities valued at $9,756,422. In addition, the value of collateral may include pending sales that are also on loan.
d Security is a perpetual bond with no specified maturity date. Maturity date shown is next reset date of the bond.
e Security issued with a zero coupon. Income is recognized through the accretion of discount.
f Non-income producing security.
g Investment in real estate investment trust within the United States.
h These securities are wholly-owned by the Subsidiary referenced in Note 1.
i Investment in affiliated issuer. The investment objective of this investment company is publicly available and can be found within the investment company’s prospectus.
15
CONSOLIDATED STATEMENT OF INVESTMENTS (continued)
| | |
Portfolio Summary (Unaudited) † | Value (%) |
Investment Companies | 16.7 |
Banks | 10.6 |
Health Care | 9.3 |
U.S. Treasury Securities | 5.6 |
Diversified Financials | 5.6 |
Chemicals | 4.5 |
Consumer Discretionary | 4.3 |
Insurance | 3.1 |
Information Technology | 3.1 |
Energy | 3.0 |
Internet Software & Services | 2.9 |
Semiconductors & Semiconductor Equipment | 2.8 |
Automobiles & Components | 2.5 |
Utilities | 2.5 |
Electronic Components | 2.1 |
Consumer Durables & Apparel | 1.9 |
Industrial | 1.8 |
Telecommunication Services | 1.8 |
Transportation | 1.6 |
Real Estate | 1.6 |
Consumer Staples | 1.5 |
Retailing | 1.4 |
Food Products | 1.4 |
Commercial & Professional Services | 1.4 |
Beverage Products | 1.0 |
Technology Hardware & Equipment | 1.0 |
Airlines | .9 |
Aerospace & Defense | .7 |
Media | .5 |
Financials | .4 |
Options Purchased | .3 |
Environmental Control | .3 |
Advertising | .2 |
Materials | .2 |
Foreign Governmental | .1 |
| | 98.6 |
† Based on net assets.
See notes to consolidated financial statements.
16
CONSOLIDATED STATEMENT OF INVESTMENTS IN AFFILIATED ISSUERS
| | | | | | | |
Investment Companies | Value
10/31/20($) | Purchases($)† | Sales($) | Value
10/31/21($) | Net
Assets(%) | Dividends/
Distributions($) |
Registered Investment Companies: | | | |
Dreyfus Institutional Preferred Government Plus Money Market Fund, Institutional Shares | 166,110,617 | 2,131,863,951 | (1,902,205,696) | 395,768,872 | 10.4 | 162,943 |
Investment of Cash Collateral for Securities Loaned;†† | | | |
Dreyfus Institutional Preferred Government Plus Money Market Fund, Institutional Shares | 11,929,337 | 13,140,803 | (25,070,140) | - | - | - |
Dreyfus Institutional Preferred Government Plus Money Market Fund, SL Shares | - | 157,925,451 | (124,331,460) | 33,593,991 | .9 | 212,408††† |
Total | 178,039,954 | 2,302,930,205 | (2,051,607,296) | 429,362,863 | 11.3 | 375,351 |
† Includes reinvested dividends/distributions.
†† Effective November 9, 2020, cash collateral for securities lending was transferred from Dreyfus Institutional Preferred GovernmentPlus Money Market Fund, Institutional Shares to Dreyfus Institutional Preferred Government Plus Money Market Fund, SL Shares.
††† Represents securities lending income earned from the reinvestment of cash collateral from loaned securities, net of fees and collateral investment expenses, and other payments to and from borrowers of securities to consolidated financial statements.
See notes to consolidated financial statements.
17
CONSOLIDATED STATEMENT OF FUTURES
October 31, 2021
| | | | | | | |
Description | Number of
Contracts | Expiration | Notional
Value ($) | Market
Value ($) | Unrealized Appreciation (Depreciation) ($) | |
Futures Long | | |
E-mini Russell 2000 | 529 | 12/17/2021 | 59,435,073 | 60,710,685 | 1,275,612 | |
FTSE 250 Index | 535 | 12/17/2021 | 34,873,855a | 33,790,574 | (1,083,281) | |
Nikkei 225 Index | 348 | 12/9/2021 | 91,177,682a | 87,874,007 | (3,303,675) | |
Futures Short | | |
E-mini Nasdaq-100 | 126 | 12/17/2021 | 36,598,283 | 39,913,020 | (3,314,737) | |
Gross Unrealized Appreciation | | 1,275,612 | |
Gross Unrealized Depreciation | | (7,701,693) | |
a Notional amounts in foreign currency have been converted to USD using relevant foreign exchange rates.
See notes to consolidated financial statements.
18
CONSOLIDATED STATEMENT OF OPTIONS WRITTEN
October 31, 2021
| | | | | | | |
Description/ Contracts/ Counterparties | Exercise Price | Expiration Date | Notional Amount | a | Value ($) | |
Call Options: | | | | | | |
Euro Stoxx 50 Price EUR,
Contracts 7,838 | 4,325 | 12/17/2021 | 338,993,500 | EUR | (3,887,052) | |
Put Options: | | | | | | |
Euro Stoxx 50 Price EUR,
Contracts 5,660 | 3,900 | 12/17/2021 | 220,740,000 | EUR | (1,701,169) | |
Total Options Written (premiums received $8,285,442) | | | | (5,588,221) | |
a Notional amount stated in U.S. Dollars unless otherwise indicated.
EUR—Euro
See notes to consolidated financial statements.
19
CONSOLIDATED STATEMENT OF FORWARD FOREIGN CURRENCY EXCHANGE CONTRACTS October 31, 2021
| | | | | | |
Counterparty/ Purchased
Currency | Purchased Currency
Amounts | Currency
Sold | Sold
Currency
Amounts | Settlement Date | Unrealized Appreciation (Depreciation) ($) |
Barclays Capital |
United States Dollar | 20,480,997 | Swiss Franc | 18,659,516 | 11/16/2021 | 92,192 |
United States Dollar | 5,931,943 | British Pound | 4,295,835 | 1/14/2022 | 51,228 |
United States Dollar | 34,797,882 | Euro | 29,637,484 | 11/16/2021 | 525,277 |
Euro | 8,607,435 | United States Dollar | 9,972,001 | 1/14/2022 | (1,761) |
United States Dollar | 44,686,820 | Euro | 38,010,539 | 11/16/2021 | 731,665 |
CIBC World Markets |
Hungarian Forint | 7,563,712,305 | United States Dollar | 25,283,716 | 11/16/2021 | (1,003,619) |
United States Dollar | 492,075,884 | British Pound | 360,822,069 | 1/14/2022 | (1,865,712) |
Euro | 33,120,597 | United States Dollar | 38,495,455 | 1/14/2022 | (130,915) |
United States Dollar | 1,016,849 | Euro | 877,457 | 1/14/2022 | 465 |
Hong Kong Dollar | 3,983,671 | United States Dollar | 511,917 | 11/16/2021 | 115 |
United States Dollar | 73,775,449 | Hong Kong Dollar | 573,583,118 | 11/16/2021 | 51,277 |
Citigroup |
United States Dollar | 100,523,262 | Swiss Franc | 91,051,558 | 11/16/2021 | 1,033,410 |
Danish Krone | 4,947,101 | United States Dollar | 771,243 | 12/15/2021 | (1,505) |
J.P. Morgan Securities |
Swiss Franc | 3,395,458 | United States Dollar | 3,695,327 | 11/16/2021 | 14,808 |
RBS Securities |
United States Dollar | 25,832,266 | Japanese Yen | 2,834,497,072 | 11/16/2021 | 959,848 |
United States Dollar | 39,064,180 | Danish Krone | 244,437,072 | 12/15/2021 | 1,031,316 |
Swiss Franc | 5,306,080 | United States Dollar | 5,728,567 | 11/16/2021 | 69,259 |
United States Dollar | 13,059,249 | Euro | 11,246,933 | 1/14/2022 | 31,602 |
State Street Bank and Trust Company |
United States Dollar | 38,284,466 | British Pound | 27,891,119 | 1/14/2022 | 103,365 |
United States Dollar | 1,167,269 | Danish Krone | 7,450,819 | 12/15/2021 | 7,969 |
20
| | | | | | |
Counterparty/ Purchased
Currency | Purchased Currency
Amounts | Currency
Sold | Sold
Currency
Amounts | Settlement Date | Unrealized Appreciation (Depreciation) ($) |
State Street Bank and Trust Company(continued) |
United States Dollar | 30,442,956 | Indian Rupee | 2,306,723,652 | 1/14/2022 | (85,072) |
United States Dollar | 2,919,459 | Swiss Franc | 2,681,419 | 11/16/2021 | (10,463) |
Russian Ruble | 2,018,086,956 | United States Dollar | 27,977,577 | 1/14/2022 | 22,485 |
United States Dollar | 44,883,806 | Chinese Yuan Renminbi | 289,186,362 | 1/14/2022 | 685 |
Euro | 3,251,147 | United States Dollar | 3,800,041 | 1/14/2022 | (34,144) |
United States Dollar | 649,807,851 | Euro | 558,971,106 | 1/14/2022 | 2,335,541 |
Indian Rupee | 1,769,595,558 | United States Dollar | 23,862,664 | 12/15/2021 | (357,507) |
United States Dollar | 23,331,757 | Indian Rupee | 1,769,595,558 | 12/15/2021 | (173,400) |
Indonesian Rupiah | 400,468,400,096 | United States Dollar | 28,415,315 | 12/15/2021 | (274,551) |
United States Dollar | 27,823,553 | Indonesian Rupiah | 400,881,745,000 | 12/15/2021 | (346,257) |
United States Dollar | 19,311,667 | Euro | 16,409,008 | 11/16/2021 | 336,390 |
UBS Securities |
United States Dollar | 1,503,178 | Hong Kong Dollar | 11,687,488 | 11/16/2021 | 954 |
United States Dollar | 24,083,155 | Hungarian Forint | 7,564,278,229 | 11/16/2021 | (198,759) |
Swiss Franc | 666,789 | United States Dollar | 717,561 | 11/16/2021 | 11,024 |
Gross Unrealized Appreciation | | | 7,410,875 |
Gross Unrealized Depreciation | | | (4,483,665) |
See notes to consolidated financial statements.
21
CONSOLIDATED STATEMENT OF ASSETS AND LIABILITIES
October 31, 2021
| | | | | | | |
| | | | | | |
| | | Cost | | Value | |
Assets ($): | | | | |
Investments in securities—See Consolidated Statement of Investments
(including securities on loan, valued at $40,602,728)—Note 1(c): | | | |
Unaffiliated issuers | 2,740,146,552 | | 3,312,621,421 | |
Affiliated issuers | | 429,362,863 | | 429,362,863 | |
Cash | | | | | 5,684,112 | |
Cash denominated in foreign currency | | | 6,361,642 | | 6,326,982 | |
Cash collateral held by broker—Note 4 | | 55,647,523 | |
Receivable for shares of Common Stock subscribed | | 10,713,255 | |
Receivable for investment securities sold | | 9,314,397 | |
Unrealized appreciation on forward foreign
currency exchange contracts—Note 4 | | 7,410,875 | |
Dividends, interest and securities lending income receivable | | 7,144,090 | |
Tax reclaim receivable—Note 1(b) | | 2,347,670 | |
Prepaid expenses | | | | | 62,998 | |
| | | | | 3,846,636,186 | |
Liabilities ($): | | | | |
Due to BNY Mellon Investment Adviser, Inc. and affiliates—Note 3(c) | | 2,558,300 | |
Liability for securities on loan—Note 1(c) | | 33,593,991 | |
Outstanding options written, at value
(premiums received $8,285,442)—Note 4 | | 5,588,221 | |
Payable for shares of Common Stock redeemed | | 5,385,780 | |
Unrealized depreciation on forward foreign
currency exchange contracts—Note 4 | | 4,483,665 | |
Foreign capital gains tax payable—Note 1(b) | | 660,448 | |
Payable for futures variation margin—Note 4 | | 209,552 | |
Payable for investment securities purchased | | 119,154 | |
Directors’ fees and expenses payable | | 41,083 | |
Other accrued expenses | | | | | 593,117 | |
| | | | | 53,233,311 | |
Net Assets ($) | | | 3,793,402,875 | |
Composition of Net Assets ($): | | | | |
Paid-in capital | | | | | 3,265,341,065 | |
Total distributable earnings (loss) | | | | | 528,061,810 | |
Net Assets ($) | | | 3,793,402,875 | |
| | | | | | |
Net Asset Value Per Share | Class A | Class C | Class I | Class Y | |
Net Assets ($) | 73,054,654 | 37,946,547 | 2,667,773,227 | 1,014,628,447 | |
Shares Outstanding | 4,146,120 | 2,226,744 | 150,797,753 | 57,230,430 | |
Net Asset Value Per Share ($) | 17.62 | 17.04 | 17.69 | 17.73 | |
| | | | | |
See notes to consolidated financial statements. | | | | | |
22
CONSOLIDATED STATEMENT OF OPERATIONS
Year Ended October 31, 2021
| | | | | | | |
| | | | | | |
| | | | | | |
Investment Income ($): | | | | |
Income: | | | | |
Dividends (net of $1,360,930 foreign taxes withheld at source): | |
Unaffiliated issuers | | | 45,289,977 | |
Affiliated issuers | | | 162,943 | |
Interest (net of $420,415 foreign taxes withheld at source) | | | 13,959,222 | |
Income from securities lending—Note 1(c) | | | 212,408 | |
Total Income | | | 59,624,550 | |
Expenses: | | | | |
Management fee—Note 3(a) | | | 25,406,700 | |
Shareholder servicing costs—Note 3(c) | | | 2,583,873 | |
Subsidiary management fee—Note 3(a) | | | 1,673,234 | |
Custodian fees—Note 3(c) | | | 352,405 | |
Professional fees | | | 332,327 | |
Distribution fees—Note 3(b) | | | 249,304 | |
Registration fees | | | 232,460 | |
Directors’ fees and expenses—Note 3(d) | | | 213,301 | |
Prospectus and shareholders’ reports | | | 193,990 | |
Loan commitment fees—Note 2 | | | 84,551 | |
Chief Compliance Officer fees—Note 3(c) | | | 14,062 | |
Miscellaneous | | | 121,763 | |
Total Expenses | | | 31,457,970 | |
Less—reduction in expenses due to undertaking—Note 3(a) | | | (1,673,234) | |
Net Expenses | | | 29,784,736 | |
Investment Income—Net | | | 29,839,814 | |
Realized and Unrealized Gain (Loss) on Investments—Note 4 ($): | | |
Net realized gain (loss) on investments and foreign currency transactions | 190,563,372 | |
Net realized gain (loss) on futures | (28,037,463) | |
Net realized gain (loss) on options transactions | (22,145,406) | |
Net realized gain (loss) on forward foreign currency exchange contracts | (1,530,490) | |
Net Realized Gain (Loss) | | | 138,850,013 | |
Net change in unrealized appreciation (depreciation) on investments
and foreign currency transactions | 317,083,190 | |
Net change in unrealized appreciation (depreciation) on futures | (17,449,199) | |
Net change in unrealized appreciation (depreciation) on
options transactions | (17,394,313) | |
Net change in unrealized appreciation (depreciation) on
forward foreign currency exchange contracts | (2,932,111) | |
Net Change in Unrealized Appreciation (Depreciation) | | | 279,307,567 | |
Net Realized and Unrealized Gain (Loss) on Investments | | | 418,157,580 | |
Net Increase in Net Assets Resulting from Operations | | 447,997,394 | |
| | | | | | |
See notes to consolidated financial statements. | | | | | |
23
CONSOLIDATED STATEMENT OF CHANGES IN NET ASSETS
| | | | | | | | | | |
| | | | Year Ended October 31, |
| | | | 2021 | | 2020 | |
Operations ($): | | | | | | | | |
Investment income—net | | | 29,839,814 | | | | 40,253,690 | |
Net realized gain (loss) on investments | | 138,850,013 | | | | (39,837,106) | |
Net change in unrealized appreciation
(depreciation) on investments | | 279,307,567 | | | | 87,421,054 | |
Net Increase (Decrease) in Net Assets
Resulting from Operations | 447,997,394 | | | | 87,837,638 | |
Distributions ($): | |
Distributions to shareholders: | | | | | | | | |
Class A | | | (561,895) | | | | (827,874) | |
Class C | | | (154,628) | | | | (399,635) | |
Class I | | | (30,566,690) | | | | (38,698,098) | |
Class Y | | | (13,223,639) | | | | (30,081,580) | |
Total Distributions | | | (44,506,852) | | | | (70,007,187) | |
Capital Stock Transactions ($): | |
Net proceeds from shares sold: | | | | | | | | |
Class A | | | 40,595,185 | | | | 21,789,512 | |
Class C | | | 11,777,126 | | | | 6,542,042 | |
Class I | | | 1,208,545,792 | | | | 1,111,948,733 | |
Class Y | | | 273,834,891 | | | | 185,422,581 | |
Distributions reinvested: | | | | | | | | |
Class A | | | 539,652 | | | | 744,385 | |
Class C | | | 126,788 | | | | 331,035 | |
Class I | | | 28,393,091 | | | | 36,636,497 | |
Class Y | | | 6,310,075 | | | | 17,674,049 | |
Cost of shares redeemed: | | | | | | | | |
Class A | | | (15,565,669) | | | | (17,544,407) | |
Class C | | | (5,651,629) | | | | (7,001,574) | |
Class I | | | (783,999,472) | | | | (775,625,491) | |
Class Y | | | (260,449,611) | | | | (597,200,783) | |
Increase (Decrease) in Net Assets
from Capital Stock Transactions | 504,456,219 | | | | (16,283,421) | |
Total Increase (Decrease) in Net Assets | 907,946,761 | | | | 1,547,030 | |
Net Assets ($): | |
Beginning of Period | | | 2,885,456,114 | | | | 2,883,909,084 | |
End of Period | | | 3,793,402,875 | | | | 2,885,456,114 | |
24
| | | | | | | | | | |
| | | | Year Ended October 31, |
| | | | 2021 | | 2020 | |
Capital Share Transactions (Shares): | |
Class Aa,b | | | | | | | | |
Shares sold | | | 2,397,868 | | | | 1,414,797 | |
Shares issued for distributions reinvested | | | 32,667 | | | | 48,716 | |
Shares redeemed | | | (915,321) | | | | (1,163,981) | |
Net Increase (Decrease) in Shares Outstanding | 1,515,214 | | | | 299,532 | |
Class Ca | | | | | | | | |
Shares sold | | | 715,629 | | | | 440,063 | |
Shares issued for distributions reinvested | | | 7,885 | | | | 22,232 | |
Shares redeemed | | | (344,112) | | | | (483,379) | |
Net Increase (Decrease) in Shares Outstanding | 379,402 | | | | (21,084) | |
Class Ib | | | | | | | | |
Shares sold | | | 71,199,085 | | | | 72,867,315 | |
Shares issued for distributions reinvested | | | 1,715,595 | | | | 2,392,978 | |
Shares redeemed | | | (46,297,262) | | | | (52,277,731) | |
Net Increase (Decrease) in Shares Outstanding | 26,617,418 | | | | 22,982,562 | |
Class Yb | | | | | | | | |
Shares sold | | | 16,063,664 | | | | 12,111,223 | |
Shares issued for distributions reinvested | | | 380,584 | | | | 1,153,659 | |
Shares redeemed | | | (15,321,100) | | | | (38,676,481) | |
Net Increase (Decrease) in Shares Outstanding | 1,123,148 | | | | (25,411,599) | |
| | | | | | | | | |
a | During the period ended October 31, 2021, 84 Class C shares representing $1,357 were automatically converted to 82 Class A shares. | |
b | During the period ended October 31, 2021, 647 Class Y shares representing $10,623 were exchanged for 650 Class A shares and 758,608 Class Y shares representing $12,882,167 were exchanged for 759,920 Class I shares. During the period ended October 31, 2020, 67,249 Class A shares representing $1,027,572 were exchanged for 66,899 Class Y shares and 846,764 Class Y shares representing $12,738,422 were exchanged for 847,747 Class I shares. | |
See notes to consolidated financial statements. | | | | | | | | |
25
CONSOLIDATED FINANCIAL HIGHLIGHTS
The following tables describe the performance for each share class for the fiscal periods indicated. All information (except portfolio turnover rate) reflects financial results for a single fund share. Net asset value total return is calculated assuming an initial investment made at the net asset value at the beginning of the period, reinvestment of all dividends and distributions at net asset value during the period, and redemption at net asset value on the last day of the period. Net asset value total return includes adjustments in accordance with accounting principles generally accepted in the United States of America and as such, the net asset value for financial reporting purposes and the returns based upon those net asset values may differ from the net asset value and returns for shareholder transactions. These figures have been derived from the fund’s consolidated financial statements.
| | | | | | | |
| | |
| | | Year Ended October 31, |
Class A Shares | | 2021 | 2020 | 2019 | 2018 | 2017 |
Per Share Data ($): | | | | | | |
Net asset value, beginning of period | | 15.56 | 15.37 | 14.32 | 14.39 | 14.72 |
Investment Operations: | | | | | | |
Investment income—neta | | .11 | .17 | .23 | .22 | .15 |
Net realized and unrealized
gain (loss) on investments | | 2.15 | .35 | 1.29 | (.23) | (.09) |
Total from Investment Operations | | 2.26 | .52 | 1.52 | (.01) | .06 |
Distributions: | | | | | | |
Dividends from
investment income—net | | (.20) | (.33) | (.47) | (.06) | (.39) |
Net asset value, end of period | | 17.62 | 15.56 | 15.37 | 14.32 | 14.39 |
Total Return (%)b | | 14.60 | 3.42 | 10.97 | (.05) | .47 |
Ratios/Supplemental Data (%): | | | | | | |
Ratio of total expenses
to average net assets | | 1.15c | 1.21 | 1.12 | 1.13 | 1.17 |
Ratio of net expenses to
average net assets | | 1.10c | 1.12 | 1.11 | 1.13 | 1.15 |
Ratio of net investment income
to average net assets | | .66c | 1.11 | 1.59 | 1.55 | 1.09 |
Portfolio Turnover Rate | | 71.67 | 91.18 | 99.45 | 85.64 | 79.00 |
Net Assets, end of period ($ x 1,000) | | 73,055 | 40,929 | 35,843 | 26,380 | 41,008 |
a Based on average shares outstanding.
b Exclusive of sales charge.
c Amounts do not include the expenses of the underlying funds.
See notes to consolidated financial statements.
26
| | | | | | | |
| | |
| | | Year Ended October 31, |
Class C Shares | | 2021 | 2020 | 2019 | 2018 | 2017 |
Per Share Data ($): | | | | | | |
Net asset value, beginning of period | | 15.06 | 14.89 | 13.87 | 13.99 | 14.34 |
Investment Operations: | | | | | | |
Investment income (loss)—neta | | (.02) | .05 | .12 | .11 | .08 |
Net realized and unrealized
gain (loss) on investments | | 2.08 | .33 | 1.26 | (.23) | (.12) |
Total from Investment Operations | | 2.06 | .38 | 1.38 | (.12) | (.04) |
Distributions: | | | | | | |
Dividends from
investment income—net | | (.08) | (.21) | (.36) | - | (.31) |
Net asset value, end of period | | 17.04 | 15.06 | 14.89 | 13.87 | 13.99 |
Total Return (%)b | | 13.72 | 2.57 | 10.17 | (.86) | (.23) |
Ratios/Supplemental Data (%): | | | | | | |
Ratio of total expenses
to average net assets | | 1.93c | 1.99 | 1.91 | 1.90 | 1.92 |
Ratio of net expenses
to average net assets | | 1.88c | 1.90 | 1.90 | 1.89 | 1.90 |
Ratio of net investment income (loss) to average net assets | | (.12)c | .34 | .84 | .82 | .58 |
Portfolio Turnover Rate | | 71.67 | 91.18 | 99.45 | 85.64 | 79.00 |
Net Assets, end of period ($ x 1,000) | | 37,947 | 27,814 | 27,817 | 27,739 | 34,240 |
a Based on average shares outstanding.
b Exclusive of sales charge.
c Amounts do not include the expenses of the underlying funds.
See notes to consolidated financial statements.
27
CONSOLIDATED FINANCIAL HIGHLIGHTS (continued)
| | | | | | | |
| | |
| | Year Ended October 31, |
Class I Shares | | 2021 | 2020 | 2019 | 2018 | 2017 |
Per Share Data ($): | | | | | | |
Net asset value, beginning of period | | 15.62 | 15.42 | 14.36 | 14.47 | 14.78 |
Investment Operations: | | | | | | |
Investment income—neta | | .15 | .20 | .27 | .26 | .23 |
Net realized and unrealized
gain (loss) on investments | | 2.15 | .36 | 1.30 | (.24) | (.13) |
Total from Investment Operations | | 2.30 | .56 | 1.57 | .02 | .10 |
Distributions: | | | | | | |
Dividends from
investment income—net | | (.23) | (.36) | (.51) | (.13) | (.41) |
Net asset value, end of period | | 17.69 | 15.62 | 15.42 | 14.36 | 14.47 |
Total Return (%) | | 14.83 | 3.65 | 11.28 | .11 | .82 |
Ratios/Supplemental Data (%): | | | | | | |
Ratio of total expenses
to average net assets | | .94b | 1.00 | .92 | .90 | .90 |
Ratio of net expenses
to average net assets | | .89b | .90 | .90 | .90 | .90 |
Ratio of net investment income
to average net assets | | .86b | 1.34 | 1.82 | 1.81 | 1.61 |
Portfolio Turnover Rate | | 71.67 | 91.18 | 99.45 | 85.64 | 79.00 |
Net Assets, end of period ($ x 1,000) | | 2,667,773 | 1,939,181 | 1,560,814 | 688,369 | 701,598 |
a Based on average shares outstanding.
b Amounts do not include the expenses of the underlying funds.
See notes to consolidated financial statements.
28
| | | | | | | |
| | |
| | Year Ended October 31, |
Class Y Shares | | 2021 | 2020 | 2019 | 2018 | 2017 |
Per Share Data ($): | | | | | | |
Net asset value, beginning of period | | 15.64 | 15.45 | 14.39 | 14.49 | 14.79 |
Investment Operations: | | | | | | |
Investment income—neta | | .17 | .22 | .29 | .28 | .24 |
Net realized and unrealized
gain (loss) on investments | | 2.16 | .34 | 1.29 | (.25) | (.12) |
Total from Investment Operations | | 2.33 | .56 | 1.58 | .03 | .12 |
Distributions: | | | | | | |
Dividends from
investment income—net | | (.24) | (.37) | (.52) | (.13) | (.42) |
Net asset value, end of period | | 17.73 | 15.64 | 15.45 | 14.39 | 14.49 |
Total Return (%) | | 15.03 | 3.66 | 11.36 | .24 | .92 |
Ratios/Supplemental Data (%): | | | | | | |
Ratio of total expenses
to average net assets | | .84b | .89 | .81 | .80 | .82 |
Ratio of net expenses
to average net assets | | .79b | .81 | .80 | .80 | .82 |
Ratio of net investment income
to average net assets | | .97b | 1.44 | 1.92 | 1.92 | 1.67 |
Portfolio Turnover Rate | | 71.67 | 91.18 | 99.45 | 85.64 | 79.00 |
Net Assets, end of period ($ x 1,000) | | 1,014,628 | 877,533 | 1,259,436 | 803,690 | 789,983 |
a Based on average shares outstanding.
b Amounts do not include the expenses of the underlying funds.
See notes to consolidated financial statements.
29
NOTES TO CONSOLIDATED FINANCIAL STATEMENTS
NOTE 1—Significant Accounting Policies:
BNY Mellon Global Real Return Fund (the “fund”) is a separate diversified series of BNY Mellon Advantage Funds, Inc. (the “Company”), which is registered under the Investment Company Act of 1940, as amended (the “Act”), as an open-end management investment company and operates as a series company currently offering nine series, including the fund. The fund’s investment objective is to seek total return (consisting of capital appreciation and income). BNY Mellon Investment Adviser, Inc. (the “Adviser”), a wholly-owned subsidiary of The Bank of New York Mellon Corporation (“BNY Mellon”), serves as the fund’s investment adviser. Newton Investment Management Limited (the “Sub-Adviser”), a wholly-owned subsidiary of BNY Mellon and an affiliate of the Adviser, serves as the fund’s sub-investment adviser.
The fund may gain investment exposure to global commodity markets through investments in GRR Commodity Fund Ltd., (the “Subsidiary”), a wholly-owned and controlled subsidiary of the fund organized under the laws of the Cayman Islands. The Subsidiary has the ability to invest in commodities and securities consistent with the investment objective of the fund. The Adviser serves as investment adviser for the Subsidiary, the Sub-Adviser serves as the Subsidiary’s sub-investment advisor and Citibank N.A. serves as the Subsidiary’s custodian. The financial statements have been consolidated and include the accounts of the fund and the Subsidiary. Accordingly, all inter-company transactions and balances have been eliminated. A subscription agreement was entered into between the fund and the Subsidiary, comprising the entire issued share capital of the Subsidiary, with the intent that the fund will remain the sole shareholder and retain all rights. Under the Amended and Restated Memorandum and Articles of Association, shares issued by the Subsidiary confer upon a shareholder the right to receive notice of, to attend and to vote at general meetings of the Subsidiary and shall confer upon the shareholder rights in a winding-up or repayment of capital and the right to participate in the profits or assets of the Subsidiary. The following summarizes the structure and relationship of the Subsidiary at October 31, 2021:
30
| | | | |
| | Subsidiary Activity |
Consolidated fund Net Assets ($) | | 3,793,402,875 | |
Subsidiary Percentage of fund Net Assets | | .40% | |
Subsidiary Financial Statement Information ($) | | | |
Total assets | | 15,240,315 | |
Total liabilities | | 68,721 | |
Net assets | | 15,171,594 | |
Total income | | - | |
Total expenses | | 1,708,291 | |
Investment (loss)—net | | (1,708,291) | |
Net realized gain (loss) | | 17,909,116 | |
Net change in unrealized appreciation (depreciation) | | (49,999,046) | |
Net increase (decrease) in net assets resulting from operations | | (33,798,221) | |
BNY Mellon Securities Corporation (the “Distributor”), a wholly-owned subsidiary of the Adviser, is the distributor of the fund’s shares. The fund is authorized to issue 500 million shares of $.001 par value Common Stock. The fund currently has authorized five classes of shares: Class A (45 million shares authorized), Class C (45 million shares authorized), Class I (205 million shares authorized) and Class Y (205 million shares authorized). Class A and Class C shares are sold primarily to retail investors through financial intermediaries and bear Distribution and/or Shareholder Services Plan fees. Class A shares generally are subject to a sales charge imposed at the time of purchase. Class A shares bought without an initial sales charge as part of an investment of $1 million or more may be charged a contingent deferred sales charge (“CDSC”) of 1.00% if redeemed within one year. Class C shares are subject to a CDSC imposed on Class C shares redeemed within one year of purchase. Class C shares automatically convert to Class A shares eight years after the date of purchase, without the imposition of a sales charge. Class I shares are sold primarily to bank trust departments and other financial service providers (including The Bank of New York Mellon, a subsidiary of BNY Mellon and an affiliate of the Adviser, and its affiliates), acting on behalf of customers having a qualified trust or an investment account or relationship at such institution, and bear no Distribution or Shareholder Services Plan fees. Class Y shares are sold at net asset value per share generally to institutional investors, and bear no Distribution or Shareholder Services Plan fees. Class I and Class Y shares are offered without a front-end sales charge or CDSC. Other differences between the classes include the services offered to and the expenses borne by each class, the allocation of certain transfer agency costs and certain voting rights. Income, expenses (other than expenses attributable to a specific class), and realized and unrealized gains or losses on investments are allocated to each class of shares based on its relative net assets.
31
NOTES TO CONSOLIDATED FINANCIAL STATEMENTS (continued)
The Company accounts separately for the assets, liabilities and operations of each series. Expenses directly attributable to each series are charged to that series’ operations; expenses which are applicable to all series are allocated among them on a pro rata basis.
The Financial Accounting Standards Board (“FASB”) Accounting Standards Codification (“ASC”) is the exclusive reference of authoritative U.S. generally accepted accounting principles (“GAAP”) recognized by the FASB to be applied by nongovernmental entities. Rules and interpretive releases of the SEC under authority of federal laws are also sources of authoritative GAAP for SEC registrants. The fund is an investment company and applies the accounting and reporting guidance of the FASB ASC Topic 946 Financial Services-Investment Companies. The fund’s consolidated financial statements are prepared in accordance with GAAP, which may require the use of management estimates and assumptions. Actual results could differ from those estimates.
The Company enters into contracts that contain a variety of indemnifications. The fund’s maximum exposure under these arrangements is unknown. The fund does not anticipate recognizing any loss related to these arrangements.
(a) Portfolio valuation: The fair value of a financial instrument is the amount that would be received to sell an asset or paid to transfer a liability in an orderly transaction between market participants at the measurement date (i.e., the exit price). GAAP establishes a fair value hierarchy that prioritizes the inputs of valuation techniques used to measure fair value. This hierarchy gives the highest priority to unadjusted quoted prices in active markets for identical assets or liabilities (Level 1 measurements) and the lowest priority to unobservable inputs (Level 3 measurements).
Additionally, GAAP provides guidance on determining whether the volume and activity in a market has decreased significantly and whether such a decrease in activity results in transactions that are not orderly. GAAP requires enhanced disclosures around valuation inputs and techniques used during annual and interim periods.
Various inputs are used in determining the value of the fund’s investments relating to fair value measurements. These inputs are summarized in the three broad levels listed below:
Level 1—unadjusted quoted prices in active markets for identical investments.
32
Level 2—other significant observable inputs (including quoted prices for similar investments, interest rates, prepayment speeds, credit risk, etc.).
Level 3—significant unobservable inputs (including the fund’s own assumptions in determining the fair value of investments).
The inputs or methodology used for valuing securities are not necessarily an indication of the risk associated with investing in those securities.
Changes in valuation techniques may result in transfers in or out of an assigned level within the disclosure hierarchy. Valuation techniques used to value the fund’s investments are as follows:
Investments in debt securities excluding short-term investments (other than U.S. Treasury Bills), forward foreign currency exchange contracts (“forward contracts”), futures and options, are valued each business day by one or more independent pricing services (each, a “Service”) approved by the Company’s Board of Directors (the “Board”). Investments for which quoted bid prices are readily available and are representative of the bid side of the market in the judgment of a Service are valued at the mean between the quoted bid prices (as obtained by a Service from dealers in such securities) and asked prices (as calculated by a Service based upon its evaluation of the market for such securities). Securities are valued as determined by a Service, based on methods which include consideration of the following: yields or prices of securities of comparable quality, coupon, maturity and type; indications as to values from dealers; and general market conditions. These securities are generally categorized within Level 2 of the fair value hierarchy.
Investments in equity securities are valued at the last sales price on the securities exchange or national securities market on which such securities are primarily traded. Securities listed on the National Market System for which market quotations are available are valued at the official closing price or, if there is no official closing price that day, at the last sales price. For open short positions, asked prices are used for valuation purposes. Bid price is used when no asked price is available. Registered investment companies that are not traded on an exchange are valued at their net asset value. All of the preceding securities are generally categorized within Level 1 of the fair value hierarchy.
Securities not listed on an exchange or the national securities market, or securities for which there were no transactions, are valued at the average of the most recent bid and asked prices. These securities are generally categorized within Level 2 of the fair value hierarchy.
33
NOTES TO CONSOLIDATED FINANCIAL STATEMENTS (continued)
Each Service and independent valuation firm is engaged under the general oversight of the Board.
Fair valuing of securities may be determined with the assistance of a Service using calculations based on indices of domestic securities and other appropriate indicators, such as prices of relevant ADRs and futures. Utilizing these techniques may result in transfers between Level 1 and Level 2 of the fair value hierarchy.
When market quotations or official closing prices are not readily available, or are determined not to accurately reflect fair value, such as when the value of a security has been significantly affected by events after the close of the exchange or market on which the security is principally traded (for example, a foreign exchange or market), but before the fund calculates its net asset value, the fund may value these investments at fair value as determined in accordance with the procedures approved by the Board. Certain factors may be considered when fair valuing investments such as: fundamental analytical data, the nature and duration of restrictions on disposition, an evaluation of the forces that influence the market in which the securities are purchased and sold, and public trading in similar securities of the issuer or comparable issuers. These securities are either categorized within Level 2 or 3 of the fair value hierarchy depending on the relevant inputs used.
For securities where observable inputs are limited, assumptions about market activity and risk are used and such securities are generally categorized within Level 3 of the fair value hierarchy.
Investments denominated in foreign currencies are translated to U.S. dollars at the prevailing rates of exchange.
Forward contracts are valued at the forward rate and are generally categorized within Level 2 of the fair value hierarchy. Futures and options, which are traded on an exchange, are valued at the last sales price on the securities exchange on which such securities are primarily traded or at the last sales price on the national securities market on each business day and are generally categorized within Level 1 of the fair value hierarchy. Options traded over-the-counter (“OTC”) are valued at the mean between the bid and asked price and are generally categorized within Level 2 of the fair value hierarchy.
The following is a summary of the inputs used as of October 31, 2021 in valuing the fund’s investments:
34
| | | | | | | |
| | Level 1-Unadjusted Quoted Prices | Level 2- Other Significant Observable Inputs | | Level 3-Significant Unobservable Inputs | Total | |
Assets ($) | | |
Investments In Securities:† | | |
Corporate Bonds | - | 380,877,737 | | - | 380,877,737 | |
Equity Securities - Common Stocks | 2,451,185,773 | - | | - | 2,451,185,773 | |
Equity Securities - Preferred Stocks | 49,449,142 | - | | - | 49,449,142 | |
Exchange-Traded Funds | 9,937,107 | - | | - | 9,937,107 | |
Foreign Governmental | - | 2,158,813 | | - | 2,158,813 | |
Investment Companies | 623,742,576 | - | | - | 623,742,576 | |
U.S. Treasury Securities | - | 212,175,038 | | - | 212,175,038 | |
Other Financial Instruments: | | |
Forward Foreign Currency Exchange Contracts†† | - | 7,410,875 | | - | 7,410,875 | |
Futures†† | 1,275,612 | - | | - | 1,275,612 | |
Options Purchased | 12,458,098 | - | | - | 12,458,098 | |
Liabilities ($) | | |
Other Financial Instruments: | | |
Forward Foreign Currency Exchange Contracts†† | - | (4,483,665) | | - | (4,483,665) | |
Futures†† | (7,701,693) | - | | - | (7,701,693) | |
Options Written | (5,588,221) | - | | - | (5,588,221) | |
† See Consolidated Statement of Investments for additional detailed categorizations, if any.
†† Amount shown represents unrealized appreciation (depreciation) at period end, but only variation margin on exchanged-traded and centrally cleared derivatives, if any, are reported in the Consolidated Statement of Assets and Liabilities.
(b) Foreign currency transactions: The fund does not isolate that portion of the results of operations resulting from changes in foreign exchange rates on investments from the fluctuations arising from changes in the market prices of securities held. Such fluctuations are included with the net realized and unrealized gain or loss on investments.
Net realized foreign exchange gains or losses arise from sales of foreign currencies, currency gains or losses realized on securities transactions between trade and settlement date, and the difference between the
35
NOTES TO CONSOLIDATED FINANCIAL STATEMENTS (continued)
amounts of dividends, interest and foreign withholding taxes recorded on the fund’s books and the U.S. dollar equivalent of the amounts actually received or paid. Net unrealized foreign exchange gains and losses arise from changes in the value of assets and liabilities other than investments resulting from changes in exchange rates. Foreign currency gains and losses on foreign currency transactions are also included with net realized and unrealized gain or loss on investments.
Foreign taxes: The fund may be subject to foreign taxes (a portion of which may be reclaimable) on income, stock dividends, realized and unrealized capital gains on investments or certain foreign currency transactions. Foreign taxes are recorded in accordance with the applicable foreign tax regulations and rates that exist in the foreign jurisdictions in which the fund invests. These foreign taxes, if any, are paid by the fund and are reflected in the Consolidated Statement of Operations, if applicable. Foreign taxes payable or deferred or those subject to reclaims as of October 31, 2021, if any, are disclosed in the fund’s Consolidated Statement of Assets and Liabilities.
(c) Securities transactions and investment income: Securities transactions are recorded on a trade date basis. Realized gains and losses from securities transactions are recorded on the identified cost basis. Dividend income is recognized on the ex-dividend date and interest income, including, where applicable, accretion of discount and amortization of premium on investments, is recognized on the accrual basis.
Pursuant to a securities lending agreement with The Bank of New York Mellon, the fund may lend securities to qualified institutions. It is the fund’s policy that, at origination, all loans are secured by collateral of at least 102% of the value of U.S. securities loaned and 105% of the value of foreign securities loaned. Collateral equivalent to at least 100% of the market value of securities on loan is maintained at all times. Collateral is either in the form of cash, which can be invested in certain money market mutual funds managed by the Adviser, or U.S. Government and Agency securities. The fund is entitled to receive all dividends, interest and distributions on securities loaned, in addition to income earned as a result of the lending transaction. Should a borrower fail to return the securities in a timely manner, The Bank of New York Mellon is required to replace the securities for the benefit of the fund or credit the fund with the market value of the unreturned securities and is subrogated to the fund’s rights against the borrower and the collateral. Additionally, the contractual maturity of security lending transactions are on an overnight and continuous basis. During the period ended October 31, 2021, The Bank of
36
New York Mellon earned $28,852 from the lending of the fund’s portfolio securities, pursuant to the securities lending agreement.
(d) Affiliated issuers: Investments in other investment companies advised by the Adviser are considered “affiliated” under the Act.
(e) Risk: Investing in foreign markets may involve special risks and considerations not typically associated with investing in the U.S. These risks include revaluation of currencies, high rates of inflation, repatriation restrictions on income and capital, and adverse political, economic developments and public health conditions. Moreover, securities issued in these markets may be less liquid, subject to government ownership controls and delayed settlements, and their prices may be more volatile than those of comparable securities in the U.S. In addition, turbulence in financial markets and reduced liquidity in equity, credit and/or fixed income markets may negatively affect many issuers, which could adversely affect the fund. Global economies and financial markets are becoming increasingly interconnected, and conditions and events in one country, region or financial market may adversely impact issuers in a different country, region or financial market. These risks may be magnified if certain events or developments adversely interrupt the global supply chain; in these and other circumstances, such risks might affect companies world-wide. Recent examples include pandemic risks related to COVID-19 and aggressive measures taken world-wide in response by governments, including closing borders, restricting international and domestic travel, and the imposition of prolonged quarantines of large populations, and by businesses, including changes to operations and reducing staff. The effects of COVID-19 have contributed to increased volatility in global markets and will likely affect certain countries, companies, industries and market sectors more dramatically than others. The COVID-19 pandemic has had, and any other outbreak of an infectious disease or other serious public health concern could have, a significant negative impact on economic and market conditions and could trigger a prolonged period of global economic slowdown. To the extent the fund may overweight its investments in certain countries, companies, industries or market sectors, such positions will increase the fund’s exposure to risk of loss from adverse developments affecting those countries, companies, industries or sectors.
(f) Dividends and distributions to shareholders: Dividends and distributions are recorded on the ex-dividend date. Dividends from investment income-net and dividends from net realized capital gains, if any, are normally declared and paid annually, but the fund may make distributions on a more frequent basis to comply with the distribution requirements of the Internal Revenue Code of 1986, as amended (the
37
NOTES TO CONSOLIDATED FINANCIAL STATEMENTS (continued)
“Code”). To the extent that net realized capital gains can be offset by capital loss carryovers, it is the policy of the fund not to distribute such gains. Income and capital gain distributions are determined in accordance with income tax regulations, which may differ from GAAP.
(g) Federal income taxes: It is the policy of the fund to continue to qualify as a regulated investment company, if such qualification is in the best interests of its shareholders, by complying with the applicable provisions of the Code, and to make distributions of taxable income and net realized capital gain sufficient to relieve it from substantially all federal income and excise taxes.
The Subsidiary is classified as a controlled foreign corporation under Subchapter N of the Code. Therefore, the fund is required to increase its taxable income by its share of the Subsidiary’s income. Net investment losses of the Subsidiary cannot be deducted by the fund in the current period nor carried forward to offset taxable income in future periods.
As of and during the period ended October 31, 2021, the fund did not have any liabilities for any uncertain tax positions. The fund recognizes interest and penalties, if any, related to uncertain tax positions as income tax expense in the Consolidated Statement of Operations. During the period ended October 31, 2021, the fund did not incur any interest or penalties.
Each tax year in the four-year period ended October 31, 2021 remains subject to examination by the Internal Revenue Service and state taxing authorities.
At October 31, 2021, the components of accumulated earnings on a tax basis were as follows: undistributed ordinary income $60,544,795, accumulated capital losses $52,711,236 and unrealized appreciation $520,228,251.
The fund is permitted to carry forward capital losses for an unlimited period. Furthermore, capital loss carryovers retain their character as either short-term or long-term capital losses.
The accumulated capital loss carryover is available for federal income tax purposes to be applied against future net realized capital gains, if any, realized subsequent to October 31, 2021. If not applied, the fund has $52,711,236 of short-term capital losses which can be carried forward for an unlimited period.
The tax character of distributions paid to shareholders during the fiscal periods ended October 31, 2021 and October 31, 2020 were as follows: ordinary income $44,506,852 and $70,007,187, respectively.
38
During the period ended October 31, 2021, as a result of permanent book to tax differences, primarily due to the tax treatment for Subpart F income from the subsidiary, the fund decreased total distributable earnings (loss) by $16,200,825 and increased paid-in capital by the same amount. Net assets and net asset value per share were not affected by this reclassification.
(h) New accounting pronouncements: In March 2020, the FASB issued Accounting Standards Update 2020-04, Reference Rate Reform (Topic 848): Facilitation of the Effects of Reference Rate Reform on Financial Reporting (“ASU 2020-04”), and in January 2021, the FASB issued Accounting Standards Update 2021-01, Reference Rate Reform (Topic 848): Scope (“ASU 2021-01”), which provides optional, temporary relief with respect to the financial reporting of contracts subject to certain types of modifications due to the planned discontinuation of the London Interbank Offered Rate (“LIBOR”) and other interbank offered rates as of the end of 2021. The temporary relief provided by ASU 2020-04 and ASU 2021-01 is effective for certain reference rate-related contract modifications that occur during the period from March 12, 2020 through December 31, 2022. Management is evaluating the impact of ASU 2020-04 and ASU 2021-01 on the fund’s investments, derivatives, debt and other contracts that will undergo reference rate-related modifications as a result of the reference rate reform. Management is also currently actively working with other financial institutions and counterparties to modify contracts as required by applicable regulation and within the regulatory deadlines.
NOTE 2—Bank Lines of Credit:
The fund participates with other long-term open-end funds managed by the Adviser in a $823.5 million unsecured credit facility led by Citibank, N.A. (the “Citibank Credit Facility”) and a $300 million unsecured credit facility provided by The Bank of New York Mellon (the “BNYM Credit Facility”), a subsidiary of BNY Mellon and an affiliate of the Adviser, each to be utilized primarily for temporary or emergency purposes, including the financing of redemptions (each, a “Facility”). The Citibank Credit Facility is available in two tranches: (i) Tranche A is in an amount equal to $688.5 million and is available to all long-term open-ended funds, including the fund, and (ii) Tranche B is an amount equal to $135 million and is available only to BNY Mellon Floating Rate Income Fund, a series of BNY Mellon Investment Funds IV, Inc. In connection therewith, the fund has agreed to pay its pro rata portion of commitment fees for Tranche A of the Citibank Credit Facility and the BNYM Credit Facility. Interest is charged to the fund based on rates determined pursuant to the terms of the respective
39
NOTES TO CONSOLIDATED FINANCIAL STATEMENTS (continued)
Facility at the time of borrowing. During the period ended October 31, 2021, the fund did not borrow under the Facilities.
NOTE 3—Management Fee, Sub-Investment Advisory Fee and Other Transactions with Affiliates:
(a) The Adviser has entered into separate management agreements with the fund and the Subsidiary pursuant to which the Adviser receives a management fee computed at the annual rate of .75% of the value of the average daily net assets of each of the fund and the Subsidiary which is payable monthly. In addition, the Adviser has contractually agreed for as long as the fund invests in the Subsidiary, to waive the management fee it receives from the fund in an amount equal to the management fee paid to the Adviser by the Subsidiary. The reduction in expenses, pursuant to the undertaking, amounted to $1,673,234 during the period ended October 31, 2021.
The Adviser has also contractually agreed, from November 1, 2020 through March 1, 2022, to waive receipt of its fees and/or assume the direct expenses of the fund, so that the direct expenses of none of the classes (excluding Rule 12b-1 Distribution Plan fees, Shareholder Services Plan fees, taxes, interest expense, brokerage commissions, commitment fees on borrowings and extraordinary expenses) exceed .90% of the value of the fund’s average daily net assets. On or after March 1, 2022, the Adviser may terminate this expense limitation at any time. During the period ended October 31, 2021, there were no reduction in expense pursuant to the undertaking.
Pursuant to a sub-investment advisory agreement between the Adviser and Sub-Adviser, the Adviser pays Sub-Adviser a monthly fee at an annual rate of .36% of the value of the fund’s average daily net assets.
During the period ended October 31, 2021, the Distributor retained $1,920 from commissions earned on sales of the fund’s Class A shares and $1,890 from CDSC fees on redemptions of the fund’s Class A shares.
(b) Under the Distribution Plan adopted pursuant to Rule 12b-1 under the Act, Class C shares pay the Distributor for distributing its shares at an annual rate of .75% of the value of its average daily net assets. The Distributor may pay one or more Service Agents in respect of advertising, marketing and other distribution services, and determines the amounts, if any, to be paid to Service Agents and the basis on which such payments are made. During the period ended October 31, 2021, Class C shares were charged $249,304 pursuant to the Distribution Plan.
40
(c) Under the Shareholder Services Plan, Class A and Class C shares pay the Distributor at an annual rate of .25% of the value of their average daily net assets for the provision of certain services. The services provided may include personal services relating to shareholder accounts, such as answering shareholder inquiries regarding the fund, and services related to the maintenance of shareholder accounts. The Distributor may make payments to Service Agents (securities dealers, financial institutions or other industry professionals) with respect to these services. The Distributor determines the amounts to be paid to Service Agents. During the period ended October 31, 2021, Class A and Class C shares were charged $147,354 and $83,101, respectively, pursuant to the Shareholder Services Plan.
The fund has an arrangement with the transfer agent whereby the fund may receive earnings credits when positive cash balances are maintained, which are used to offset transfer agency fees. For financial reporting purposes, the fund includes net earnings credits, if any, as shareholder servicing costs in the Consolidated Statement of Operations.
The fund has an arrangement with the custodian whereby the fund will receive interest income or be charged overdraft fees when cash balances are maintained. For financial reporting purposes, the fund includes this interest income and overdraft fees, if any, as interest income in the Consolidated Statement of Operations.
The fund compensates BNY Mellon Transfer, Inc., a wholly-owned subsidiary of the Adviser, under a transfer agency agreement for providing transfer agency and cash management services inclusive of earnings credits, if any, for the fund. The majority of transfer agency fees are comprised of amounts paid on a per account basis, while cash management fees are related to fund subscriptions and redemptions. During the period ended October 31, 2021, the fund was charged $16,353 for transfer agency services, inclusive of earnings credit, if any. These fees are included in Shareholder servicing costs in the Consolidated Statement of Operations.
The fund compensates The Bank of New York Mellon under a custody agreement for providing custodial services for the fund. These fees are determined based on net assets, geographic region and transaction activity. During the period ended October 31, 2021, the fund was charged $352,405 pursuant to the custody agreement.
During the period ended October 31, 2021, the fund was charged $14,062 for services performed by the Chief Compliance Officer and his staff. These fees are included in Chief Compliance Officer fees in the Consolidated Statement of Operations.
41
NOTES TO CONSOLIDATED FINANCIAL STATEMENTS (continued)
The components of “Due to BNY Mellon Investment Adviser, Inc. and affiliates” in the Consolidated Statement of Assets and Liabilities consist of: management fees of $2,398,504, Subsidiary management fee of $40,211, Distribution Plan fees of $23,662, Shareholder Services Plan fees of $23,111, custodian fees of $105,500, Chief Compliance Officer fees of $4,718 and transfer agency fees of $2,805, which are offset against an expense reimbursement currently in effect in the amount of $40,211.
(d) Each Board member also serves as a Board member of other funds in the BNY Mellon Family of Funds complex. Annual retainer fees and attendance fees are allocated to each fund based on net assets.
NOTE 4—Securities Transactions:
The aggregate amount of purchases and sales of investment securities, excluding short-term securities, futures, options transactions and forward contracts, during the period ended October 31, 2021, amounted to $2,205,075,779 and $2,381,989,532, respectively.
Derivatives: A derivative is a financial instrument whose performance is derived from the performance of another asset. The fund enters into International Swaps and Derivatives Association, Inc. Master Agreements or similar agreements (collectively, “Master Agreements”) with its OTC derivative contract counterparties in order to, among other things, reduce its credit risk to counterparties. Master Agreements include provisions for general obligations, representations, collateral and events of default or termination. Under a Master Agreement, the fund may offset with the counterparty certain derivative financial instruments’ payables and/or receivables with collateral held and/or posted and create one single net payment in the event of default or termination.
Each type of derivative instrument that was held by the fund during the period ended October 31, 2021 is discussed below.
Futures: In the normal course of pursuing its investment objective, the fund is exposed to market risk, including equity risk and interest risk, as a result of changes in value of underlying financial instruments. The fund invests in futures in order to manage its exposure to or protect against changes in the market. A futures contract represents a commitment for the future purchase or a sale of an asset at a specified date. Upon entering into such contracts, these investments require initial margin deposits with a counterparty, which consist of cash or cash equivalents. The amount of these deposits is determined by the exchange or Board of Trade on which the contract is traded and is subject to change. Accordingly, variation margin payments are received or made to reflect daily unrealized gains or losses which are recorded in the Consolidated Statement of Operations.
42
When the contracts are closed, the fund recognizes a realized gain or loss which is reflected in the Consolidated Statement of Operations. There is minimal counterparty credit risk to the fund with futures since they are exchange traded, and the exchange guarantees the futures against default. Futures open at October 31, 2021 are set forth in the Consolidated Statement of Futures.
Options Transactions: The fund purchases and writes (sells) put and call options to hedge against changes in the values of equities and interest risk or as a substitute for an investment. The fund is subject to market risk and interest risk in the course of pursuing its investment objectives through its investments in options contracts. A call option gives the purchaser of the option the right (but not the obligation) to buy, and obligates the writer to sell, the underlying financial instrument at the exercise price at any time during the option period, or at a specified date. Conversely, a put option gives the purchaser of the option the right (but not the obligation) to sell, and obligates the writer to buy the underlying financial instrument at the exercise price at any time during the option period, or at a specified date.
As a writer of call options, the fund receives a premium at the outset and then bears the market risk of unfavorable changes in the price of the financial instrument underlying the option. Generally, the fund realizes a gain, to the extent of the premium, if the price of the underlying financial instrument decreases between the date the option is written and the date on which the option is terminated. Generally, the fund incurs a loss if the price of the financial instrument increases between those dates. The maximum payout for those contracts is limited to the number of call option contracts written and the related strike prices, respectively.
As a writer of put options, the fund receives a premium at the outset and then bears the market risk of unfavorable changes in the price of the financial instrument underlying the option. Generally, the fund realizes a gain, to the extent of the premium, if the price of the underlying financial instrument increases between the date the option is written and the date on which the option is terminated. Generally, the fund incurs a loss if the price of the financial instrument decreases between those dates. The maximum payout for those contracts is limited to the number of put option contracts written and the related strike prices, respectively.
As a writer of an option, the fund has no control over whether the underlying financial instrument may be sold (call) or purchased (put) and as a result bears the market risk of an unfavorable change in the price of the financial instrument underlying the written option. There is a risk of loss from a change in value of such options which may exceed the related premiums received. This risk may be mitigated by Master Agreements, if
43
NOTES TO CONSOLIDATED FINANCIAL STATEMENTS (continued)
any, between the fund and the counterparty and the posting of collateral, if any, by the counterparty to the fund to cover the fund’s exposure to the counterparty. The Consolidated Statement of Operations reflects any unrealized gains or losses which occurred during the period as well as any realized gains or losses which occurred upon the expiration or closing of the option transaction. Options purchased open at October 31, 2021 are set forth in the Consolidated Statements of Investments and options written open at October 31, 2021 are set forth in the Consolidated Statement of Options Written.
Forward Foreign Currency Exchange Contracts: The fund enters into forward contracts in order to hedge its exposure to changes in foreign currency exchange rates on its foreign portfolio holdings, to settle foreign currency transactions or as a part of its investment strategy. When executing forward contracts, the fund is obligated to buy or sell a foreign currency at a specified rate on a certain date in the future. With respect to sales of forward contracts, the fund incurs a loss if the value of the contract increases between the date the forward contract is opened and the date the forward contract is closed. The fund realizes a gain if the value of the contract decreases between those dates. With respect to purchases of forward contracts, the fund incurs a loss if the value of the contract decreases between the date the forward contract is opened and the date the forward contract is closed. The fund realizes a gain if the value of the contract increases between those dates. Any realized or unrealized gains or losses which occurred during the period are reflected in the Consolidated Statement of Operations. The fund is exposed to foreign currency risk as a result of changes in value of underlying financial instruments. The fund is also exposed to credit risk associated with counterparty nonperformance on these forward contracts, which is generally limited to the unrealized gain on each open contract. This risk may be mitigated by Master Agreements, if any, between the fund and the counterparty and the posting of collateral, if any, by the counterparty to the fund to cover the fund’s exposure to the counterparty. Forward contracts open at October 31, 2021 are set forth in the Consolidated Statement of Forward Foreign Currency Exchange Contracts.
The following tables show the fund’s exposure to different types of market risk as it relates to the Consolidated Statement of Assets and Liabilities and the Consolidated Statement of Operations, respectively.
44
Fair value of derivative instruments as of October 31, 2021 is shown below:
| | | | | | | | |
| | Derivative
Assets ($) | | | | Derivative
Liabilities ($) | |
Equity risk | 13,733,710 | 1,2 | Equity risk | (13,289,914) | 1,3 |
Foreign exchange risk | 7,410,875 | 4 | Foreign exchange risk | (4,483,665) | 4 |
Gross fair value of
derivative contracts | 21,144,585 | | | | (17,773,579) | |
| | | | | | |
| Consolidated Statement of Assets and Liabilities location: | |
1 | Includes cumulative appreciation (depreciation) on futures as reported in the
Consolidated Statement of Futures, but only the unpaid variation margin is reported in
the Consolidated Statement of Assets and Liabilities. |
2 | Options purchased are included in Investments in securities—Unaffiliated issuers, at value. |
3 | Outstanding options written, at value. | |
4 | Unrealized appreciation (depreciation) on forward foreign currency exchange contracts. |
The effect of derivative instruments in the Consolidated Statement of Operations during the period ended October 31, 2021 is shown below:
| | | | | | | | | | |
Amount of realized gain (loss) on derivatives recognized in income ($) | |
Underlying
risk | Futures | 1 | Options
Transactions | 2 | Forward
Contracts | 3 | Total | |
Interest rate | (19,886,773) | | (419,370) | | - | | (20,306,143) | |
Equity | (8,150,690) | | (21,726,036) | | - | | (29,876,726) | |
Foreign
exchange | - | | - | | (1,530,490) | | (1,530,490) | |
Total | (28,037,463) | | (22,145,406) | | (1,530,490) | | (51,713,359) | |
| | | | | | | | |
Net change in unrealized appreciation (depreciation)
on derivatives recognized in income ($) | |
Underlying
risk | Futures | 4 | Options
Transactions | 5 | Forward
Contracts | 6 | Total | |
Interest rate | 5,254,181 | | 175,380 | | - | | 5,429,561 | |
Equity | (22,703,380) | | (17,569,693) | | - | | (40,273,073) | |
Foreign
exchange | - | | - | | (2,932,111) | | (2,932,111) | |
Total | (17,449,199) | | (17,394,313) | | (2,932,111) | | (37,775,623) | |
| | | | | | | | | |
| Consolidated Statement of Operations location: | |
1 | Net realized gain (loss) on futures. |
2 | Net realized gain (loss) on options transactions. |
3 | Net realized gain (loss) on forward foreign currency exchange contracts. |
4 | Net change in unrealized appreciation (depreciation) on futures. |
5 | Net change in unrealized appreciation (depreciation) on options transactions. |
6 | Net change in unrealized appreciation (depreciation) on forward foreign currency exchange contracts. |
The provisions of ASC Topic 210 “Disclosures about Offsetting Assets and Liabilities” require disclosure on the offsetting of financial assets and liabilities. These disclosures are required for certain investments, including derivative financial instruments subject to Master Agreements which are
45
NOTES TO CONSOLIDATED FINANCIAL STATEMENTS (continued)
eligible for offsetting in the Consolidated Statement of Assets and Liabilities and require the fund to disclose both gross and net information with respect to such investments. For financial reporting purposes, the fund does not offset derivative assets and derivative liabilities that are subject to Master Agreements in the Consolidated Statement of Assets and Liabilities.
At October 31, 2021, derivative assets and liabilities (by type) on a gross basis are as follows:
| | | | | | |
Derivative Financial Instruments: | | Assets ($) | | Liabilities ($) | |
Futures | | 1,275,612 | | (7,701,693) | |
Options | | 12,458,098 | | (5,588,221) | |
Forward contracts | | 7,410,875 | | (4,483,665) | |
Total gross amount of derivative | | | | | |
assets and liabilities in the | | | | | |
Consolidated Statement of
Assets and Liabilities | | 21,144,585 | | (17,773,579) | |
Derivatives not subject to | | | | | |
Master Agreements | | (13,733,710) | | 13,289,914 | |
Total gross amount of assets | | | | | |
and liabilities subject to | | | | | |
Master Agreements | | 7,410,875 | | (4,483,665) | |
The following tables present derivative assets and liabilities net of amounts available for offsetting under Master Agreements and net of related collateral received or pledged, if any, as of October 31, 2021:
| | | | | | | |
| | | Financial | | | |
| | | Instruments | | | |
| | | and Derivatives | | | |
| Gross Amount of | | Available | Collateral | | Net Amount of |
Counterparty | Assets ($) | 1 | for Offset ($) | Received ($) | 2 | Assets ($) |
Barclays Capital | 1,400,362 | | (1,761) | (660,000) | | 738,601 |
CIBC World Markets | 51,857 | | (51,857) | - | | - |
Citigroup | 1,033,410 | | (1,505) | (840,000) | | 191,905 |
J.P. Morgan Securities | 14,808 | | - | - | | 14,808 |
RBS Securities | 2,092,025 | | - | (1,500,000) | | 592,025 |
State Street Bank
and Trust Company | 2,806,435 | | (1,281,394) | (1,525,041) | | - |
UBS Securities | 11,978 | | (11,978) | - | | - |
Total | 7,410,875 | | (1,348,495) | (4,525,041) | | 1,537,339 |
| | | | | | |
46
| | | | | | | |
| | | Financial | | | |
| | | Instruments | | | |
| | | and Derivatives | | | |
| Gross Amount of | | Available | Collateral | | Net Amount of |
Counterparty | Liabilities ($) | 1 | for Offset ($) | Pledged ($) | 2 | Liabilities ($) |
Barclays Capital | (1,761) | | 1,761 | - | | - |
CIBC World Markets | (3,000,246) | | 51,857 | 2,948,389 | | - |
Citigroup | (1,505) | | 1,505 | - | | - |
State Street Bank
and Trust Company | (1,281,394) | | 1,281,394 | - | | - |
UBS Securities | (198,759) | | 11,978 | 186,781 | | - |
Total | (4,483,665) | | 1,348,495 | 3,135,170 | | - |
| | | | | | |
1 Absent a default event or early termination, OTC derivative assets and liabilities are presented at gross amounts
and are not offset in the Consolidated Statement of Assets and Liabilities. |
2 In some instances, the actual collateral received and/or pledged may be more than the amount shown due to
over collateralization. |
The following summarizes the average market value of derivatives outstanding during the period ended October 31, 2021:
| | | |
| | Average Market Value ($) |
Equity futures | | 170,795,911 |
Equity options contracts | | 47,545,397 |
Interest rate futures | | 230,274,057 |
Interest rate options contracts | | 96,942 |
Forward contracts | | 1,449,107,310 |
At October 31, 2021, the cost of investments for federal income tax purposes was $3,221,561,374; accordingly, accumulated net unrealized appreciation on investments inclusive of derivative contracts was $520,892,228, consisting of $643,730,259 gross unrealized appreciation and $122,838,031 gross unrealized depreciation.
47
REPORT OF INDEPENDENT REGISTERED PUBLIC ACCOUNTING FIRM
To the Shareholders and the Board of Directors of BNY Mellon Global Real Return Fund
Opinion on the Financial Statements
We have audited the accompanying consolidated statement of assets and liabilities of BNY Mellon Global Real Return Fund (the “Fund”) (one of the funds constituting BNY Mellon Advantage Funds, Inc.), including the consolidated statements of investments, investments in affiliated issuers, futures, options written and forward foreign currency exchange contracts, as of October 31, 2021, and the related consolidated statement of operations for the year then ended, the consolidated statements of changes in net assets for each of the two years in the period then ended, the consolidated financial highlights for each of the five years in the period then ended and the related notes (collectively referred to as the “financial statements”). In our opinion, the financial statements present fairly, in all material respects, the consolidated financial position of the Fund (one of the funds constituting BNY Mellon Advantage Funds, Inc.) at October 31, 2021, the consolidated results of its operations for the year then ended, the consolidated changes in its net assets for each of the two years in the period then ended and its consolidated financial highlights for each of the five years in the period then ended, in conformity with U.S. generally accepted accounting principles.
Basis for Opinion
These financial statements are the responsibility of the Fund’s management. Our responsibility is to express an opinion on the Fund’s financial statements based on our audits. We are a public accounting firm registered with the Public Company Accounting Oversight Board (United States) (“PCAOB”) and are required to be independent with respect to the Fund in accordance with the U.S. federal securities laws and the applicable rules and regulations of the Securities and Exchange Commission and the PCAOB.
We conducted our audits in accordance with the standards of the PCAOB. Those standards require that we plan and perform the audit to obtain reasonable assurance about whether the financial statements are free of material misstatement, whether due to error or fraud. The Fund is not required to have, nor were we engaged to perform, an audit of the Fund’s internal control over financial reporting. As part of our audits, we are required to obtain an understanding of internal control over financial reporting, but not for the purpose of expressing an opinion on the effectiveness of the Fund’s internal control over financial reporting. Accordingly, we express no such opinion.
Our audits included performing procedures to assess the risks of material misstatement of the financial statements, whether due to error or fraud, and performing procedures that respond to those risks. Such procedures included examining, on a test basis, evidence regarding the amounts and disclosures in the financial statements. Our procedures included confirmation of securities owned as of October 31, 2021, by correspondence with the custodian and others or by other appropriate auditing procedures where replies from others were not received. Our audits also included evaluating the accounting principles used and significant estimates made by management, as well as evaluating the overall presentation of the financial statements. We believe that our audits provide a reasonable basis for our opinion.

We have served as the auditor of one or more investment companies in the BNY Mellon Family of Funds since at least 1957, but we are unable to determine the specific year.
New York, New York
December 23, 2021
48
IMPORTANT TAX INFORMATION (Unaudited)
In accordance with federal tax law, the fund elects to provide each shareholder with their portion of the fund’s foreign taxes paid and the income sourced from foreign countries. Accordingly, the fund hereby reports the following information regarding its fiscal year ended October 31, 2021:
- the total amount of taxes paid to foreign countries was $1,993,241
- the total amount of income sourced from foreign countries was $52,825,496
Where required by Federal tax law rules, shareholders will receive notification of their proportionate share of foreign taxes paid and foreign sourced income for the 2021 calendar year with Form 1099-DIV which will be mailed in early 2021. For the fiscal year ended October 31, 2021, certain dividends paid by the fund may be subject to a maximum tax rate of 15%, as provided for by the Jobs and Growth Tax Relief Reconciliation Act of 2003. Of the distributions paid during the fiscal year, $23,774,666 represents the maximum amount that may be considered qualified dividend income.
49
LIQUIDITY RISK MANAGEMENT PROGRAM (Unaudited)
Effective June 1, 2019, the fund adopted a liquidity risk management program (the “Liquidity Risk Management Program”) pursuant to the requirements of Rule 22e-4 under the Investment Company Act of 1940, as amended. Rule 22e-4 requires registered open-end funds, including mutual funds and exchange-traded funds but not money market funds, to establish liquidity risk management programs in order to effectively manage fund liquidity and shareholder redemptions. The rule is designed to mitigate the risk that a fund could not meet redemption requests without significantly diluting the interests of remaining investors.
The rule requires the fund to assess, manage and review their liquidity risk at least annually considering applicable factors such as investment strategy and liquidity during normal and foreseeable stressed conditions, including whether the strategy is appropriate for an open-end fund and whether the fund has a relatively concentrated portfolio or large positions in particular issuers. The fund must also assess its use of borrowings and derivatives, short-term and long-term cash flow projections in normal and stressed conditions, holdings of cash and cash equivalents, and borrowing arrangements and other funding sources.
The rule also requires the fund to classify its investments as highly liquid, moderately liquid, less liquid or illiquid based on the number of days the fund expects it would take to liquidate the investment, and to review these classifications at least monthly or more often under certain conditions. The periods range from three or fewer business days for a highly liquid investment to greater than seven calendar days for settlement of a less liquid investment. Illiquid investments are those a fund does not expect to be able to sell or dispose of within seven calendar days without significantly changing the market value. The fund is prohibited from acquiring an investment if, after the acquisition, its holdings of illiquid assets will exceed 15% of its net assets. In addition, if a fund permits redemptions in-kind, the rule requires the fund to establish redemption in-kind policies and procedures governing how and when it will engage in such redemptions.
Pursuant to the rule’s requirements, the Liquidity Risk Management Program has been reviewed and approved by the Board. Furthermore, the Board has received a written report prepared by the Program’s Administrator that addresses the operation of the Program, assesses its adequacy and effectiveness and describes any material changes made to the Program.
Assessment of Program
In the opinion of the Program Administrator, the Program approved by the Board continues to be adequate for the fund and the Program has been implemented effectively. The Program Administrator has monitored the fund’s liquidity risk and the liquidity classification of the securities held by the fund and has determined that the Program is operating effectively.
During the period from January 1, 2020 to December 31, 2020, there were no material changes to the Program and no material liquidity events that impacted the fund. During the period, the fund held sufficient highly liquid assets to meet fund redemptions.
Under normal expected foreseeable fund redemption forecasts and foreseeable stressed fund redemption forecasts, the Program Administrator believes that the fund maintains sufficient highly liquid assets to meet expected fund redemptions.
50
BOARD MEMBERS INFORMATION (Unaudited)
Independent Board Members
Joseph S. DiMartino (78)
Chairman of the Board (1995)
Principal Occupation During Past 5 Years:
· Director or Trustee of funds in the BNY Mellon Family of Funds and certain other entities (as described in the fund’s Statement of Additional Information) (1995-Present)
Other Public Company Board Memberships During Past 5 Years:
· CBIZ, Inc., a public company providing professional business services, products and solutions, Director (1997-Present)
No. of Portfolios for which Board Member Serves: 98
———————
Peggy C. Davis (78)
Board Member (2006)
Principal Occupation During Past 5 Years:
· Shad Professor of Law, New York University School of Law (1983-Present)
No. of Portfolios for which Board Member Serves: 35
———————
Gina D. France (63)
Board Member (2019)
Principal Occupation During Past 5 Years:
· France Strategic Partners, a strategy and advisory firm serving corporate clients across the United States, Founder, President and Chief Executive Officer (2003-Present)
Other Public Company Board Memberships During Past 5 Years:
· Huntington Bancshares, a bank holding company headquartered in Columbus, Ohio, Director (2016-Present)
· Cedar Fair, L.P., a publicly-traded partnership that owns and operates amusement parks and hotels in the U.S. and Canada, Director (2011-Present)
· CBIZ, Inc., a public company providing professional business services, products and solutions, Director (2015-Present)
· FirstMerit Corporation, a diversified financial services company, Director (2004-2016)
No. of Portfolios for which Board Member Serves: 25
———————
Joan Gulley (74)
Board Member (2017)
Principal Occupation During Past 5 Years:
· Nantucket Atheneum, public library, Chair (2018-June 2021) and Director (2015-June 2021)
· Orchard Island Club, golf and beach club, Governor (2016-Present)
No. of Portfolios for which Board Member Serves: 43
———————
51
BOARD MEMBERS INFORMATION (Unaudited) (continued)
Robin A. Melvin (58)
Board Member (2012)
Principal Occupation During Past 5 Years:
· Westover School, a private girls’ boarding school in Middlebury, Connecticut, Trustee (2019-Present)
· Mentor Illinois, a non-profit organization dedicated to increasing the quality of mentoring services in Illinois. Co-Chair (2014–2020); Board Member, Mentor Illinois (2013-2020)
· JDRF, a non-profit juvenile diabetes research foundation, Board Member (June 2021-Present)
Other Public Company Board Memberships During Past 5 Years:
· HPS Corporate Lending Fund, a closed-end management investment company regulated as a business development company, Trustee (August 2021-Present)
No. of Portfolios for which Board Member Serves: 76
———————
Once elected all Board Members serve for an indefinite term, but achieve Emeritus status upon reaching age 80. The address of the Board Members and Officers is c/o BNY Mellon Investment Adviser, Inc. 240 Greenwich Street, New York, New York 10286. Additional information about the Board Members is available in the fund’s Statement of Additional Information which can be obtained from the Adviser free of charge by calling this toll free number: 1-800-373-9387.
David P. Feldman, Emeritus Board Member
Ehud Houmier, Emeritus Board Member
Lynn Martin, Emeritus Board Member
Dr. Martin Peretz, Emeritus Board Member
Philip L. Toia, Emeritus Board Member
52
OFFICERS OF THE FUND (Unaudited)
DAVID DIPETRILLO, President since January 2021.
Vice President and Director of the Adviser since February 2021; Head of North America Product, BNY Mellon Investment Management since January 2018; Director of Product Strategy, BNY Mellon Investment Management from January 2016 to December 2017. He is an officer of 57 investment companies (comprised of 107 portfolios) managed by the Adviser or an affiliate of the Adviser. He is 43 years old and has been an employee of BNY Mellon since 2005.
JAMES WINDELS, Treasurer since November 2001.
Vice President of the Adviser since September 2020; Director - BNY Mellon Fund Administration, and an officer of 58 investment companies (comprised of 129 portfolios) managed by the Adviser or an affiliate of the Adviser. He is 63 years old and has been an employee of the Adviser since April 1985.
PETER M. SULLIVAN, Chief Legal Officer since July 2021 and Vice President and Assistant Secretary since March 2019.
Chief Legal Officer of the Adviser since July 2021, Associate General Counsel of BNY Mellon since July 2021; Senior Managing Counsel of BNY Mellon from December 2020 to July 2021; Managing Counsel of BNY Mellon from March 2009 to December 2020, and an officer of 58 investment companies (comprised of 129 portfolios) managed by the Adviser or an affiliate of the Adviser. He is 53 years old and has been an employee of BNY Mellon since April 2004.
JAMES BITETTO, Vice President since August 2005 and Secretary since February 2018.
Senior Managing Counsel of BNY Mellon since December 2019; Managing Counsel of BNY Mellon from April 2014 to December 2019; Secretary of the Adviser, and an officer of 58 investment companies (comprised of 129 portfolios) managed by the Adviser or an affiliate of the Adviser. He is 55 years old and has been an employee of the Adviser since December 1996.
DEIRDRE CUNNANE, Vice President and Assistant Secretary since March 2019.
Counsel of BNY Mellon since August 2018; Senior Regulatory Specialist at BNY Mellon Investment Management Services from February 2016 to August 2018. She is an officer of 58 investment companies (comprised of 129 portfolios) managed by the Adviser or an affiliate of the Adviser. She is 31 years old and has been an employee of the Adviser since August 2018.
SARAH S. KELLEHER, Vice President and Assistant Secretary since April 2014.
Vice President since February 2020 of BNY Mellon ETF Investment Adviser; LLC, Senior Managing Counsel of BNY Mellon since September 2021; Managing Counsel from December 2017 to September 2021; Senior Counsel of BNY Mellon from March 2013 to December 2017. She is an officer of 58 investment companies (comprised of 129 portfolios) managed by the Adviser or an affiliate of the Adviser. She is 46 years old and has been an employee of the Adviser since March 2013.
JEFF PRUSNOFSKY, Vice President and Assistant Secretary since August 2005.
Senior Managing Counsel of BNY Mellon, and an officer of 58 investment companies (comprised of 129 portfolios) managed by the Adviser or an affiliate of the Adviser. He is 56 years old and has been an employee of the Adviser since October 1990.
AMANDA QUINN, Vice President and Assistant Secretary since March 2020.
Counsel of BNY Mellon since June 2019; Regulatory Administration Manager at BNY Mellon Investment Management Services from September 2018 to May 2019; Senior Regulatory Specialist at BNY Mellon Investment Management Services from April 2015 to August 2018. She is an officer of 58 investment companies (comprised of 129 portfolios) managed by the Adviser or an affiliate of the Adviser. She is 36 years old and has been an employee of the Adviser since June 2019.
53
OFFICERS OF THE FUND (Unaudited) (continued)
NATALYA ZELENSKY, Vice President and Assistant Secretary since March 2017.
Chief Compliance Officer since August 2021 and Vice President since February 2020 of BNY Mellon ETF Investment Adviser, LLC; Chief Compliance Officer since August 2021 and Vice President and Assistant Secretary since February 2020 of BNY Mellon ETF Trust; Managing Counsel from December 2019 to August 2021 of BNY Mellon; Counsel from May 2016 to December 2019 of BNY Mellon; Assistant Secretary of the Adviser from April 2018 to August 2021. She is an officer of 57 investment companies (comprised of 128 portfolios) managed by the Adviser or an affiliate of the Adviser. She is 36 years old and has been an employee of BNY Mellon since May 2016.
GAVIN C. REILLY, Assistant Treasurer since December 2005.
Tax Manager-BNY Mellon Fund Administration, and an officer of 58 investment companies (comprised of 129 portfolios) managed by the Adviser or an affiliate of the Adviser. He is 53 years old and has been an employee of the Adviser since April 1991.
ROBERT SALVIOLO, Assistant Treasurer since July 2007.
Senior Accounting Manager–BNY Mellon Fund Administration, and an officer of 58 investment companies (comprised of 129 portfolios) managed by the Adviser or an affiliate of the Adviser. He is 54 years old and has been an employee of the Adviser since June 1989.
ROBERT SVAGNA, Assistant Treasurer since December 2002.
Senior Accounting Manager–BNY Mellon Fund Administration, and an officer of 58 investment companies (comprised of 129 portfolios) managed by the Adviser or an affiliate of the Adviser. He is 54 years old and has been an employee of the Adviser since November 1990.
JOSEPH W. CONNOLLY, Chief Compliance Officer since October 2004.
Chief Compliance Officer of the BNY Mellon Family of Funds and BNY Mellon Funds Trust since 2004, Chief Compliance Officer of the Adviser from 2004 until June 2021. He is an officer of 57 investment companies (comprised of 120 portfolios) managed by the Adviser. He is 64 years old.
CARIDAD M. CAROSELLA, Anti-Money Laundering Compliance Officer since January 2016.
Anti-Money Laundering Compliance Officer of the BNY Mellon Family of Funds and BNY Mellon Funds Trust. She is an officer of 50 investment companies (comprised of 121 portfolios) managed by the Adviser or an affiliate of the Adviser. She is 53 years old and has been an employee of the Distributor since 1997.
54
This page intentionally left blank.
55
This page intentionally left blank.
56
This page intentionally left blank.
57
BNY Mellon Global Real Return Fund
240 Greenwich Street
New York, NY 10286
Adviser
BNY Mellon Investment Adviser, Inc.
240 Greenwich Street
New York, NY 10286
Sub-Adviser
Newton Investment Management Limited
160 Queen Victoria Street
London, EC4V, 4LA, UK
Custodian
The Bank of New York Mellon
240 Greenwich Street
New York, NY 10286
Transfer Agent &
Dividend Disbursing Agent
BNY Mellon Transfer, Inc.
240 Greenwich Street
New York, NY 10286
Distributor
BNY Mellon Securities Corporation
240 Greenwich Street
New York, NY 10286
| | |
Ticker Symbols: | Class A: DRRAX Class C: DRRCX Class I: DRRIX Class Y: DRRYX |
Telephone Call your financial representative or 1-800-373-9387
Mail The BNY Mellon Family of Funds, 144 Glenn Curtiss Boulevard, Uniondale, NY 11556-0144
E-mail Send your request to info@bnymellon.com
Internet Information can be viewed online or downloaded at www.im.bnymellon.com
The fund files its complete schedule of portfolio holdings with the Securities and Exchange Commission (“SEC”) for the first and third quarters of each fiscal year on Form N-PORT. The fund’s Forms N-PORT are available on the SEC’s website at www.sec.gov.
A description of the policies and procedures that the fund uses to determine how to vote proxies relating to portfolio securities and information regarding how the fund voted these proxies for the most recent 12-month period ended June 30 is available at www.im.bnymellon.com and on the SEC’s website at www.sec.gov and without charge, upon request, by calling 1-800-373-9387.
| | |
© 2021 BNY Mellon Securities Corporation
6278AR1021 | 
|
BNY Mellon Sustainable Balanced Fund
| |
ANNUAL REPORT October 31, 2021 |
| |
Save time. Save paper. View your next shareholder report online as soon as it’s available. Log into www.im.bnymellon.com and sign up for eCommunications. It’s simple and only takes a few minutes. |
| |
The views expressed in this report reflect those of the portfolio manager(s) only through the end of the period covered and do not necessarily represent the views of BNY Mellon Investment Adviser, Inc. or any other person in the BNY Mellon Investment Adviser, Inc. organization. Any such views are subject to change at any time based upon market or other conditions and BNY Mellon Investment Adviser, Inc. disclaims any responsibility to update such views. These views may not be relied on as investment advice and, because investment decisions for a fund in the BNY Mellon Family of Funds are based on numerous factors, may not be relied on as an indication of trading intent on behalf of any fund in the BNY Mellon Family of Funds. |
| |
Not FDIC-Insured • Not Bank-Guaranteed • May Lose Value |
Contents
THE FUND
FOR MORE INFORMATION
Back Cover
DISCUSSION OF FUND PERFORMANCE (Unaudited)
For the period from November 1, 2020 through October 31, 2021, as provided by equity portfolio managers Yuko Takano and Rob Stewart of Newton Investment Management Limited, Sub-Investment Adviser, and fixed-income portfolio manager Nancy G. Rogers, CFA, of Mellon Investments Corporation.
Market and Fund Performance Overview
For the 12-month period ended October 31, 2021, BNY Mellon Sustainable Balanced Fund’s Class K shares produced a total return of 20.91% and Service shares returned 20.63%.1 In comparison, the fund’s benchmark, the MSCI All Country World Index (NDR), the fund’s Customized Blended Index, a blend of 60% MSCI All Country World Index (NDR)/40% Bloomberg MSCI U.S. Aggregate ESG Select Index (the “Index”) and Bloomberg MSCI U.S. Aggregate ESG Select Index, produced total returns of 37.28%, 20.84% and -0.88%, respectively, for the same period.2,3
Equities gained ground during the reporting period while bonds delivered mildly negative performance, amid central bank policies that supported investor confidence, rising rates, the implementation of a COVID-19 vaccine rollout and impending economic reopening. The fund underperformed its benchmark, the Customized Blended Index. In equities, marginal underperformance was primarily due to lack of energy exposure and stock selection in the consumer discretionary and health care sectors. In fixed income, the difference in returns between the fund and the Bloomberg MSCI U.S. Aggregate ESG Select Index was primarily the result of operating expenses that are not reflected in the Index’s results.
The Fund’s Investment Approach
The fund seeks long-term capital appreciation. To pursue its goal, the fund uses a global, multi-asset strategy. The fund normally invests 80% of its net assets, plus any borrowings for investment purposes, in the equity securities of issuers that demonstrate attractive attributes and sustainable business practices and have no material, unresolvable, environmental, social or governance (ESG) issues, and in debt securities included in the Bloomberg MSCI U.S. Aggregate ESG Select Sector Neutral Index. Under normal market conditions, generally 60% of the fund’s net assets will be allocated to equity and equity-related investments and 40% of the fund’s net assets will be allocated to debt and debt-related securities.
The fund’s assets allocated to equity and equity-related investments are actively managed by Newton Investment Management Limited (“Newton”). Newton invests its allocated portion of the fund’s assets in companies it considers to be engaged in “sustainable business practices.” When determining whether a company engages in “sustainable business practices,” Newton considers whether the company (i) engages in business practices that are, in Newton’s view, sustainable in an economic sense (i.e., the company’s strategy, operations and finances are stable and durable) and (ii) takes appropriate measures to manage any material consequences or impact of its policies and operations in relation to ESG matters (e.g., the company’s environmental footprint, labor standards, board structure, etc.), as determined through Newton’s ESG quality review. Newton also may invest in companies where it believes it can promote sustainable business practices through ongoing company engagement and active proxy voting, such as by encouraging the company’s management to improve the company’s environmental footprint or voting the shares it holds of a company to improve the company’s governance structure.
2
The fund’s assets allocated to debt and debt-related investments are managed by Mellon Investments Corporation (“Mellon”) , using an indexed approach. For the portion of the fund’s assets allocated to debt and debt-related investments, Mellon seeks to track the investment results, before fees and expenses, of the Bloomberg MSCI U.S. Aggregate ESG Select Sector Neutral Index. Mellon selects investments for its allocated portion of the fund’s assets by a “sampling” process, which is a statistical process used to select debt securities so that this portion of the fund’s assets has investment characteristics that closely approximate those of the Index (e.g., duration, liquidity, quality, sector, industry, yield and market beta). Specifically, Mellon selects those securities that it determines best correspond to the Index’s aggregate risk metrics of duration, yield/spread, sector and quality, while seeking to mitigate such risks by investing in a diversified number of securities and issuers.
The fund changed its investment objective and strategy on April 1, 2019. Prior to April 1, 2019, the fund’s investment objective was to provide current income, while maintaining the potential for long-term capital appreciation. To pursue these goals, until April 1, 2019, the fund used an actively managed, global multi-asset strategy that focused on income generation. In addition, until April 1, 2019, Newton was the sole sub-adviser for the fund. Newton allocated the fund’s investments among equity and equity-related securities, debt and debt-related securities, and, generally to a lesser extent, real estate, commodities and infrastructure in developed and emerging markets.
Markets Respond to Stimulus, Economic Reopening and Rising Rates
Global equities continued their recovery over the 12-month review period. Globally, monetary policy remained highly accommodative given near-term economic headwinds arising from COVID-19 restrictions, and was thus firmly supportive of risk assets. Increased risk appetite also reflected two additional developments: first, a relatively benign outcome to the U.S. presidential election; and later, the widespread rollout of COVID-19 vaccinations, which opened the door to the normalization of social and economic activity. Additional impetus was provided as the long-running, political wrangle between the European Union and the UK over the Brexit deal was settled.
With reflation underway, investors began to anticipate a dialing back of the exceptional levels of monetary stimulus witnessed over the last 12 months, which contributed to a sharp rise in government-bond yields during the first quarter of 2021. Longer-dated government bond yields subsequently declined after hawkish comments from U.S. Federal Reserve officials prompted investors to discount a weaker outlook for medium-term growth. However, toward the end of the review period, higher energy prices, goods shortages and wage-inflation numbers ensured central banks adopted a less-dovish tone, with major central banks in the U.S. and UK highlighting prospects that monetary stimulus could be ‘tapered’ and interest rates moved higher over the coming year.
Energy, Consumer Discretionary and Health Care Drive Underperformance
Lack of exposure to the energy sector detracted from the fund’s relative performance as optimism around a rapid, global economic recovery boosted the commodity price backdrop. Some disappointing stock selections in consumer discretionary and health care also weighed on relative returns. China-based Internet retailer Alibaba Group Holding fell as the listing of affiliate Ant Group was suspended amid growing regulatory scrutiny of the company’s
3
DISCUSSION OF FUND PERFORMANCE (Unaudited) (continued)
ecosystem. The overhang of an ongoing antitrust investigation into the company’s practices continued to hamper investor sentiment for the remainder of the review period. Despite these headwinds, we find it difficult to envisage a scenario in which Alibaba Group Holding will not continue to be the leading e-commerce and cloud platform in China. A zero weighting in Tesla detracted, with the electric vehicle maker’s stock price rising to a record high during the period after it posted its highest-ever quarterly profit. The defensive attributes of the health care sector proved less alluring against a backdrop of stimulus tailwinds and improving coronavirus trends.
Conversely the fund benefited most from stock selection in the information technology and materials sectors. Within the former, Applied Materials outperformed, supported by robust demand for the company’s semiconductor systems and services. Given the positive implications for sales, the stock received a further boost on news of Taiwan Semiconductor Manufacturing’s plans to increase capital spending to $25-$28 billion in 2021. Software developer Intuit also performed well, driven by strong execution and supported by key thematic tailwinds in the SME (small and mid-size enterprise) space. In addition, the company announced the acquisition of online marketing business Mailchimp, a strategic positive in terms of accelerating growth potential. Lithium producer Albemarle benefited from rising lithium prices in a strong demand environment for electric vehicles, as the return profile of the company’s growth projects and current contract pricing received a firm underpinning.
Within fixed income, bonds generally posted weak results during the period, led by Treasury securities, which make up approximately 40% of the Index. Treasury bonds posted a loss due to the large run-up in yields. This rise stemmed from the increase in risk appetite that led investors into other segments of the fixed-income market and other risk assets, particularly during the first half of the period. On the other hand, other spread sectors of the market performed relatively well, with corporate bonds benefiting from a strong corporate earnings environment and low default rates. Lower-credit-rated issues generally outperformed their investment-grade counterparts.
Focused on Long-Term, High-Conviction Investments
Despite rising coronavirus infections in some regions around the globe, we remain positive on the prospects of an economic recovery led by a U.S.-driven, major stimulus package and an increasing pace of vaccinations. A key question remains the extent to which such a recovery has been built into valuations already and, as we move toward the end of the year, we anticipate that the market will need to see the beginnings of earnings progression in those more cyclically exposed names that have performed well of late.
While short-term market gyrations remain a consideration, our primary focus continues to be on those companies in which we have a strong, long-term conviction. In this context, our thematic framework is able to serve as a valuable guide to our stock picking. Although we retain a particular focus on companies that have an exposure to attractive structural growth trends and possess strong, robust business models, these longer-term secular growth situations continue to be represented in the portfolio alongside businesses with more leverage to an eventual recovery.
4
In fixed income, as an index fund, we attempt to match closely the returns of the Index by approximating its composition and credit quality.
November 15, 2021
1 DUE TO RECENT MARKET VOLATILITY, CURRENT PERFORMANCE MAY BE DIFFERENT THAN THE FIGURES SHOWN. Total return includes reinvestment of dividends and any capital gains paid and does not take into consideration any maximum initial sales charge. Past performance is no guarantee of future results. Share price and investment return fluctuate such that upon redemption, fund shares may be worth more or less than their original cost. The fund’s return reflects the absorption of certain fund expenses by BNY Mellon Investment Adviser, Inc. pursuant to an agreement in effect through March 1, 2022, at which time it may be extended, modified or terminated. Had these expenses not been absorbed, returns would have been lower. Had these expenses not been absorbed, returns would have been lower.
2 Source: Lipper Inc. — The MSCI ACWI Index captures large- and mid-cap representation across Developed Market (DM) countries and Emerging-Market (EM) countries. It reflects reinvestment of net dividends and, where applicable, capital gain distributions. Investors cannot invest directly in index.
3 Source: FactSet — The Bloomberg MSCI U.S. Aggregate ESG Select Index is a fixed-rate, investment grade bond benchmark that follows the rules of the Bloomberg US Aggregate Index and applies additional sector and ESG criteria for security eligibility. In addition treasury, securitized, and class 2 government-related (agency, local authority, sovereign, supranational) and corporate (industrial, utility, and financial) sectors are weighted to match the individual sector exposures of the Bloomberg US Aggregate Index. Investors cannot invest directly in any index.
Equities are subject generally to market, market sector, market liquidity, issuer and investment style risks, among other factors, to varying degrees, all of which are more fully described in the fund’s prospectus.
Bonds are subject generally to interest-rate, credit, liquidity and market risks, to varying degrees, all of which are more fully described in the fund’s prospectus. Generally, all other factors being equal, bond prices are inversely related to interest-rate changes, and rate increases can cause price declines.
Currencies are subject to the risk that those currencies will decline in value relative to a local currency, or, in the case of hedged positions, that the local currency will decline relative to the currency being hedged. Each of these risks could increase the fund’s volatility.
Recent market risks include pandemic risks related to COVID-19. The effects of COVID-19 have contributed to increased volatility in global markets and will likely affect certain countries, companies, industries and market sectors more dramatically than others. To the extent the fund may overweight its investments in certain countries, companies, industries or market sectors, such positions will increase the fund’s exposure to risk of loss from adverse developments affecting those countries, companies, industries or sectors.
Indexing does not attempt to manage market volatility, use defensive strategies or reduce the effects of any long-term periods of poor index performance. The correlation between fund and index performance may be affected by the fund’s expenses and use of sampling techniques, changes in securities markets, changes in the composition of the index and the timing of purchases and redemptions of fund shares.
The fund’s performance will be influenced by political, social and economic factors affecting investments in foreign companies. Special risks associated with such companies include exposure to currency fluctuations, less liquidity, less developed or less efficient trading markets, lack of comprehensive company information, political instability, and differing auditing and legal standards.
Emerging markets tend to be more volatile than the markets of more mature economies and generally have less diverse and less mature economic structures and less stable political systems than those of developed countries. The securities of companies located in emerging markets are often subject to rapid and large changes in price.
Environmental, social and governance (ESG) managers may take into consideration factors beyond traditional financial information to select securities, which could result in relative investment performance deviating from other strategies or broad market benchmarks, depending on whether such sectors or investments are in or out of favor in the market. Further, ESG strategies may rely on certain values-based criteria to eliminate exposures found in similar strategies or broad market benchmarks, which could also result in relative investment performance deviating.
The fund may, but is not required to, use derivative instruments. A small investment in derivatives could have a potentially large impact on the fund’s performance. The use of derivatives involves risks different from, or possibly greater than, the risks associated with investing directly in the underlying assets.
5
FUND PERFORMANCE (Unaudited)
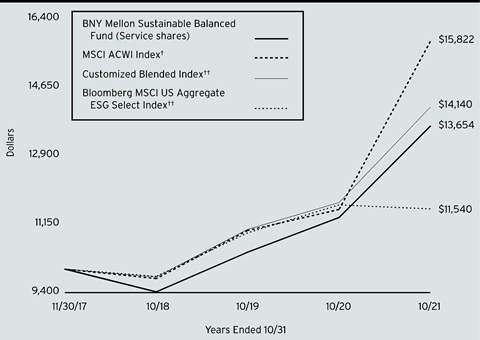
Comparison of change in value of a $10,000 investment in Services shares of BNY Mellon Sustainable Balanced Fund with a hypothetical investment of $10,000 in the MSCI ACWI Index, its Customized Blended Index, a blend of 60% MSCI ACWI Index/40% Bloomberg MSCI US Aggregate ESG Select Index and Bloomberg MSCI US Aggregate ESG Select Index.
† Source: Lipper Inc.
†† Source: FactSet.
Past performance is not predictive of future performance.
The above graph compares a hypothetical $10,000 investment made in Services shares of BNY Mellon Sustainable Balanced Fund on 11/30/17 (inception date) to a hypothetical investment of $10,000 made in the MSCI ACWI Index, Customized Blended Index and Bloomberg MSCI US Aggregate ESG Select Index on that date. All dividends and capital gain distributions are reinvested.
The fund’s performance shown in the line graph above takes into account all other applicable fees and expenses of the fund’s Services shares. The MSCI ACWI Index captures large and mid-cap representation across Developed Market (DM) countries and Emerging Market (EM) countries. The Bloomberg MSCI US Aggregate ESG Select Index is a fixed-rate, investment grade bond benchmark that follows the rules of the Bloomberg US Aggregate Index and applies additional sector and ESG criteria for security eligibility. In addition treasury, securitized, and class 2 government-related (agency, local authority, sovereign, supranational) and corporate (industrial, utility, and financial) sectors are weighted to match the individual sector exposures of the Bloomberg US Aggregate Index. Unlike a mutual fund, indices are not subject to charges, fees and other expenses. Investors cannot invest directly in any indices. Further information relating to fund performance, including expense reimbursements, if applicable, is contained in the Financial Highlights section of the prospectus and elsewhere in this report.
6
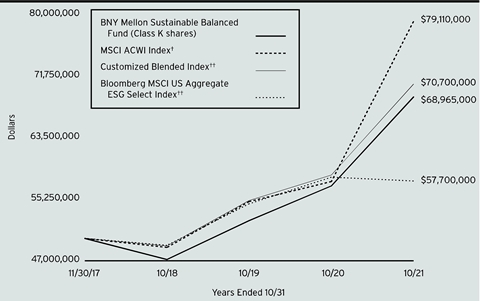
Comparison of change in value of a $50,000,000 investment in Class K shares of BNY Mellon Sustainable Balanced Fund with a hypothetical investment of $50,000,000 in the MSCI ACWI Index, its Customized Blended Index, a blend of 60% MSCI ACWI Index/40% Bloomberg MSCI US Aggregate ESG Select Index and Bloomberg MSCI US Aggregate ESG Select Index.
† Source: Lipper Inc.
†† Source: FactSet.
Past performance is not predictive of future performance.
The above graph compares a hypothetical $50,000,000 investment made in Class K shares of BNY Mellon Sustainable Balanced Fund on 11/30/17 (inception date) to a hypothetical investment of $50,000,000 made in the MSCI ACWI Index, Customized Blended Index and Bloomberg MSCI US Aggregate ESG Select Index on that date. All dividends and capital gain distributions are reinvested.
The fund’s performance shown in the line graph above takes into account all other applicable fees and expenses of the fund’s Class K shares. The MSCI ACWI Index captures large and mid-cap representation across Developed Market (DM) countries and Emerging Market (EM) countries. The Bloomberg MSCI US Aggregate ESG Select Index is a fixed-rate, investment grade bond benchmark that follows the rules of the Bloomberg US Aggregate Index and applies additional sector and ESG criteria for security eligibility. In addition treasury, securitized, and class 2 government-related (agency, local authority, sovereign, supranational) and corporate (industrial, utility, and financial) sectors are weighted to match the individual sector exposures of the Bloomberg US Aggregate Index. Unlike a mutual fund, indices are not subject to charges, fees and other expenses. Investors cannot invest directly in any indices. Further information relating to fund performance, including expense reimbursements, if applicable, is contained in the Financial Highlights section of the prospectus and elsewhere in this report.
7
FUND PERFORMANCE (Unaudited) (continued)
| | | | | |
Average Annual Total Returns as of 10/31/2021 |
| Inception
Date | 1 Year | | From
Inception |
Services shares | 11/30/17 | 20.63% | | 8.27% |
Class K shares | 11/30/17 | 20.91% | | 8.55% |
MSCI ACWI Index | | 37.28% | | 12.43% |
Customized Blended Index | | 20.84% | | 9.25% |
Bloomberg MSCI US
Aggregate ESG Select Index | | -0.88% | | 3.72% |
The performance data quoted represents past performance, which is no guarantee of future results. Share price and investment return fluctuate and an investor’s shares may be worth more or less than original cost upon redemption. Current performance may be lower or higher than the performance quoted. Go to www.im.bnymellon.com for the fund’s most recent month-end returns.
The fund’s performance shown in the graphs and table does not reflect the deduction of taxes that a shareholder would pay on fund distributions or the redemption of fund shares.
8
UNDERSTANDING YOUR FUND’S EXPENSES (Unaudited)
As a mutual fund investor, you pay ongoing expenses, such as management fees and other expenses. Using the information below, you can estimate how these expenses affect your investment and compare them with the expenses of other funds. You also may pay one-time transaction expenses, including sales charges (loads) and redemption fees, which are not shown in this section and would have resulted in higher total expenses. For more information, see your fund’s prospectus or talk to your financial adviser.
Review your fund’s expenses
The table below shows the expenses you would have paid on a $1,000 investment in BNY Mellon Sustainable Balanced Fund from May 1, 2021 to October 31, 2021. It also shows how much a $1,000 investment would be worth at the close of the period, assuming actual returns and expenses.
| | | | | |
Expenses and Value of a $1,000 Investment | |
Assume actual returns for the six months ended October 31, 2021 | |
| | | | |
| | Class K | Service Shares | |
Expenses paid per $1,000† | $.77 | $2.06 | |
Ending value (after expenses) | $1,048.60 | $1,047.40 | |
COMPARING YOUR FUND’S EXPENSES
WITH THOSE OF OTHER FUNDS (Unaudited)
Using the SEC’s method to compare expenses
The Securities and Exchange Commission (“SEC”) has established guidelines to help investors assess fund expenses. Per these guidelines, the table below shows your fund’s expenses based on a $1,000 investment, assuming a hypothetical 5% annualized return. You can use this information to compare the ongoing expenses (but not transaction expenses or total cost) of investing in the fund with those of other funds. All mutual fund shareholder reports will provide this information to help you make this comparison. Please note that you cannot use this information to estimate your actual ending account balance and expenses paid during the period.
| | | | | |
Expenses and Value of a $1,000 Investment | |
Assuming a hypothetical 5% annualized return for the six months ended October 31, 2021 | |
| | | | |
| | Class K | Service Shares | |
Expenses paid per $1,000† | $.77 | $2.04 | |
Ending value (after expenses) | $1,024.45 | $1,023.19 | |
† | Expenses are equal to the fund’s annualized expense ratio of .15% for Class K and .40% for Service Shares, multiplied by the average account value over the period, multiplied by 184/365 (to reflect the one-half year period). |
9
STATEMENT OF INVESTMENTS
October 31, 2021
| | | | | | | | | | |
| |
Description | Coupon
Rate (%) | | Maturity Date | | Principal Amount ($) | | Value ($) | |
Bonds and Notes - 35.7% | | | | | |
Australia - .1% | | | | | |
Westpac Banking, Sr. Unscd. Notes | | 2.00 | | 1/13/2023 | | 15,000 | | 15,282 | |
Canada - .6% | | | | | |
Bank of Montreal, Sub. Notes | | 4.34 | | 10/5/2028 | | 15,000 | | 15,937 | |
Canadian Imperial Bank of Commerce, Sr. Unscd. Notes | | 3.10 | | 4/2/2024 | | 10,000 | | 10,524 | |
Province of Ontario, Sr. Unscd. Bonds | | 2.50 | | 4/27/2026 | | 25,000 | | 26,344 | |
Province of Ontario, Sr. Unscd. Notes | | 1.60 | | 2/25/2031 | | 10,000 | | 9,831 | |
Province of Quebec, Unscd. Bonds | | 0.60 | | 7/23/2025 | | 20,000 | | 19,664 | |
Rogers Communications, Gtd. Notes | | 2.90 | | 11/15/2026 | | 15,000 | | 15,711 | |
The Toronto-Dominion Bank, Sr. Unscd. Notes | | 3.25 | | 3/11/2024 | | 5,000 | | 5,275 | |
| | 103,286 | |
Germany - .4% | | | | | |
KfW, Govt. Gtd. Bonds | | 0.00 | | 4/18/2036 | | 15,000 | a | 11,514 | |
KfW, Govt. Gtd. Bonds | | 0.38 | | 7/18/2025 | | 10,000 | | 9,768 | |
KfW, Govt. Gtd. Notes | | 2.63 | | 2/28/2024 | | 25,000 | | 26,129 | |
Landwirtschaftliche Rentenbank, Govt. Gtd. Notes | | 2.00 | | 1/13/2025 | | 15,000 | | 15,539 | |
| | 62,950 | |
Ireland - .0% | | | | | |
Shire Acquisitions Investments Ireland, Gtd. Notes | | 2.88 | | 9/23/2023 | | 10,000 | | 10,367 | |
Japan - .1% | | | | | |
Mitsubishi UFJ Financial Group, Sr. Unscd. Notes | | 3.78 | | 3/2/2025 | | 25,000 | | 27,030 | |
Panama - .1% | | | | | |
Panama, Sr. Unscd. Bonds | | 9.38 | | 4/1/2029 | | 10,000 | | 14,518 | |
Peru - .1% | | | | | |
Peru, Sr. Unscd. Bonds | | 2.78 | | 1/23/2031 | | 15,000 | | 14,955 | |
Poland - .1% | | | | | |
Poland, Sr. Unscd. Notes | | 3.25 | | 4/6/2026 | | 15,000 | | 16,133 | |
Supranational - .6% | | | | | |
Asian Development Bank, Sr. Unscd. Notes | | 1.50 | | 10/18/2024 | | 15,000 | | 15,315 | |
European Bank for Reconstruction & Development, Sr. Unscd. Notes | | 2.75 | | 3/7/2023 | | 10,000 | | 10,318 | |
European Investment Bank, Sr. Unscd. Notes | | 0.88 | | 5/17/2030 | | 10,000 | | 9,482 | |
European Investment Bank, Sr. Unscd. Notes | | 1.88 | | 2/10/2025 | | 10,000 | | 10,329 | |
10
| | | | | | | | | | |
| |
Description | Coupon
Rate (%) | | Maturity Date | | Principal Amount ($) | | Value ($) | |
Bonds and Notes - 35.7% (continued) | | | | | |
Supranational - .6% (continued) | | | | | |
Inter-American Development Bank, Sr. Unscd. Notes | | 2.50 | | 1/18/2023 | | 15,000 | | 15,386 | |
International Bank for Reconstruction & Development, Sr. Unscd. Notes | | 0.88 | | 7/15/2026 | | 25,000 | | 24,609 | |
NXP, Gtd. Notes | | 2.50 | | 5/11/2031 | | 10,000 | b | 9,947 | |
| | 95,386 | |
United Kingdom - .3% | | | | | |
AstraZeneca, Sr. Unscd. Notes | | 6.45 | | 9/15/2037 | | 10,000 | | 14,909 | |
Vodafone Group, Sr. Unscd. Notes | | 4.38 | | 5/30/2028 | | 15,000 | | 17,108 | |
Vodafone Group, Sr. Unscd. Notes | | 5.25 | | 5/30/2048 | | 10,000 | | 13,195 | |
| | 45,212 | |
United States - 33.2% | | | | | |
3M, Sr. Unscd. Notes | | 2.88 | | 10/15/2027 | | 15,000 | | 16,026 | |
AbbVie, Sr. Unscd. Notes | | 2.90 | | 11/6/2022 | | 5,000 | | 5,115 | |
AbbVie, Sr. Unscd. Notes | | 3.20 | | 11/21/2029 | | 5,000 | | 5,347 | |
AbbVie, Sr. Unscd. Notes | | 4.88 | | 11/14/2048 | | 5,000 | | 6,586 | |
Amazon.com, Sr. Unscd. Notes | | 4.05 | | 8/22/2047 | | 10,000 | | 12,300 | |
Amazon.com, Sr. Unscd. Notes | | 4.80 | | 12/5/2034 | | 10,000 | | 12,721 | |
American Express, Sr. Unscd. Notes | | 3.40 | | 2/22/2024 | | 25,000 | | 26,390 | |
American Tower, Sr. Unscd. Notes | | 3.50 | | 1/31/2023 | | 25,000 | | 25,893 | |
American Water Capital, Sr. Unscd. Notes | | 2.80 | | 5/1/2030 | | 15,000 | | 15,628 | |
American Water Capital, Sr. Unscd. Notes | | 3.75 | | 9/1/2047 | | 10,000 | | 11,390 | |
American Water Capital, Sr. Unscd. Notes | | 4.15 | | 6/1/2049 | | 10,000 | | 12,106 | |
American Water Capital, Sr. Unscd. Notes | | 4.20 | | 9/1/2048 | | 15,000 | | 18,379 | |
Amgen, Sr. Unscd. Notes | | 4.56 | | 6/15/2048 | | 10,000 | | 12,520 | |
Apple, Sr. Unscd. Notes | | 3.25 | | 2/23/2026 | | 15,000 | | 16,183 | |
Bank of America, Sr. Unscd. Notes | | 2.46 | | 10/22/2025 | | 25,000 | | 25,863 | |
Bank of America, Sr. Unscd. Notes | | 3.95 | | 1/23/2049 | | 10,000 | | 11,814 | |
Becton Dickinson & Co., Sr. Unscd. Notes | | 2.82 | | 5/20/2030 | | 10,000 | | 10,409 | |
Boston Properties, Sr. Unscd. Notes | | 4.50 | | 12/1/2028 | | 15,000 | | 17,146 | |
Bristol-Myers Squibb, Sr. Unscd. Notes | | 3.88 | | 8/15/2025 | | 10,000 | | 10,942 | |
Bristol-Myers Squibb, Sr. Unscd. Notes | | 4.13 | | 6/15/2039 | | 10,000 | | 11,964 | |
Carrier Global, Sr. Unscd. Notes | | 3.58 | | 4/5/2050 | | 10,000 | | 10,850 | |
Centerpoint Energy Houston Electric, Mortgage Bonds | | 3.55 | | 8/1/2042 | | 10,000 | | 11,210 | |
Cigna, Gtd. Notes | | 4.13 | | 11/15/2025 | | 15,000 | | 16,505 | |
Cigna, Gtd. Notes | | 4.38 | | 10/15/2028 | | 15,000 | | 17,204 | |
11
STATEMENT OF INVESTMENTS (continued)
| | | | | | | | | | |
| |
Description | Coupon
Rate (%) | | Maturity Date | | Principal Amount ($) | | Value ($) | |
Bonds and Notes - 35.7% (continued) | | | | | |
United States - 33.2% (continued) | | | | | |
Cisco Systems, Sr. Unscd. Notes | | 5.50 | | 1/15/2040 | | 5,000 | | 7,033 | |
Citigroup, Sr. Unscd. Notes | | 3.20 | | 10/21/2026 | | 20,000 | | 21,269 | |
Citigroup, Sr. Unscd. Notes | | 3.98 | | 3/20/2030 | | 10,000 | | 11,158 | |
Citigroup, Sr. Unscd. Notes | | 4.41 | | 3/31/2031 | | 15,000 | | 17,202 | |
Citigroup, Sub. Notes | | 4.75 | | 5/18/2046 | | 10,000 | | 12,671 | |
Commonwealth Edison, First Mortgage Bonds | | 3.00 | | 3/1/2050 | | 10,000 | | 10,317 | |
Conagra Brands, Sr. Unscd. Notes | | 5.30 | | 11/1/2038 | | 5,000 | | 6,347 | |
Credit Suisse USA, Gtd. Notes | | 7.13 | | 7/15/2032 | | 10,000 | | 14,143 | |
Crown Castle International, Sr. Unscd. Bonds | | 3.80 | | 2/15/2028 | | 10,000 | | 10,971 | |
CVS Health, Sr. Unscd. Notes | | 5.05 | | 3/25/2048 | | 20,000 | | 26,330 | |
Deere & Co., Sr. Unscd. Notes | | 3.90 | | 6/9/2042 | | 10,000 | | 12,062 | |
Dell International, Sr. Scd. Notes | | 4.90 | | 10/1/2026 | | 15,000 | | 17,098 | |
DuPont de Nemours, Sr. Unscd. Notes | | 4.49 | | 11/15/2025 | | 10,000 | | 11,130 | |
eBay, Sr. Unscd. Notes | | 2.75 | | 1/30/2023 | | 10,000 | | 10,251 | |
Eli Lilly & Co., Sr. Unscd. Notes | | 2.25 | | 5/15/2050 | | 10,000 | | 9,282 | |
Federal Home Loan Bank, Bonds | | 2.50 | | 2/13/2024 | | 25,000 | | 26,113 | |
Federal Home Loan Mortgage Corp. Multifamily Structured Pass Through Certificates, Ser. K077, Cl. A2 | | 3.85 | | 5/25/2028 | | 30,000 | c | 34,230 | |
Federal Home Loan Mortgage Corp. Multifamily Structured Pass Through Certificates, Ser. K126, Cl. A2 | | 2.07 | | 1/25/2031 | | 10,000 | c | 10,337 | |
Federal National Mortgage Association, Notes | | 0.50 | | 6/17/2025 | | 10,000 | c | 9,842 | |
Federal National Mortgage Association, Notes | | 6.63 | | 11/15/2030 | | 20,000 | c | 28,336 | |
FedEx, Gtd. Notes | | 5.25 | | 5/15/2050 | | 15,000 | | 20,322 | |
Fiserv, Sr. Unscd. Notes | | 4.40 | | 7/1/2049 | | 10,000 | | 12,092 | |
General Mills, Sr. Unscd. Notes | | 4.20 | | 4/17/2028 | | 5,000 | | 5,667 | |
Gilead Sciences, Sr. Unscd. Notes | | 3.50 | | 2/1/2025 | | 5,000 | | 5,332 | |
GlaxoSmithKline Capital, Gtd. Notes | | 3.88 | | 5/15/2028 | | 15,000 | | 16,954 | |
HCA, Sr. Scd. Notes | | 5.25 | | 6/15/2049 | | 10,000 | | 12,983 | |
Hewlett Packard Enterprise, Sr. Unscd. Notes | | 4.45 | | 10/2/2023 | | 10,000 | | 10,642 | |
HP, Sr. Unscd. Notes | | 3.40 | | 6/17/2030 | | 10,000 | | 10,571 | |
Humana, Sr. Unscd. Notes | | 3.85 | | 10/1/2024 | | 10,000 | | 10,741 | |
Intel, Sr. Unscd. Notes | | 3.10 | | 2/15/2060 | | 10,000 | | 10,117 | |
Intel, Sr. Unscd. Notes | | 3.15 | | 5/11/2027 | | 10,000 | | 10,830 | |
Intel, Sr. Unscd. Notes | | 3.90 | | 3/25/2030 | | 10,000 | | 11,339 | |
12
| | | | | | | | | | |
| |
Description | Coupon
Rate (%) | | Maturity Date | | Principal Amount ($) | | Value ($) | |
Bonds and Notes - 35.7% (continued) | | | | | |
United States - 33.2% (continued) | | | | | |
Intercontinental Exchange, Gtd. Notes | | 3.75 | | 12/1/2025 | | 15,000 | | 16,336 | |
International Business Machines, Sr. Unscd. Notes | | 4.00 | | 6/20/2042 | | 5,000 | | 5,771 | |
International Business Machines, Sr. Unscd. Notes | | 5.88 | | 11/29/2032 | | 10,000 | | 13,282 | |
ITC Holdings, Sr. Unscd. Notes | | 3.35 | | 11/15/2027 | | 15,000 | | 16,062 | |
Johnson & Johnson, Sr. Unscd. Notes | | 2.63 | | 1/15/2025 | | 15,000 | | 15,762 | |
JPMorgan Chase & Co., Sr. Unscd. Notes | | 2.53 | | 11/19/2041 | | 10,000 | | 9,511 | |
JPMorgan Chase & Co., Sr. Unscd. Notes | | 3.96 | | 11/15/2048 | | 10,000 | | 11,809 | |
JPMorgan Chase & Co., Sr. Unscd. Notes | | 4.45 | | 12/5/2029 | | 20,000 | | 22,838 | |
JPMorgan Chase & Co., Sub. Notes | | 3.88 | | 9/10/2024 | | 10,000 | | 10,754 | |
Lowe's, Sr. Unscd. Notes | | 4.50 | | 4/15/2030 | | 10,000 | | 11,666 | |
Lowe's, Sr. Unscd. Notes | | 4.65 | | 4/15/2042 | | 10,000 | | 12,391 | |
Marsh & McLennan, Sr. Unscd. Notes | | 4.75 | | 3/15/2039 | | 15,000 | | 19,028 | |
Mastercard, Sr. Unscd. Notes | | 2.00 | | 3/3/2025 | | 10,000 | | 10,294 | |
McDonald's, Sr. Unscd. Notes | | 3.70 | | 2/15/2042 | | 10,000 | | 11,183 | |
Merck & Co., Sr. Unscd. Notes | | 3.90 | | 3/7/2039 | | 5,000 | | 5,859 | |
Microsoft, Sr. Unscd. Notes | | 2.68 | | 6/1/2060 | | 5,000 | | 4,982 | |
Microsoft, Sr. Unscd. Notes | | 2.88 | | 2/6/2024 | | 10,000 | | 10,466 | |
Microsoft, Sr. Unscd. Notes | | 4.25 | | 2/6/2047 | | 10,000 | | 13,034 | |
Morgan Stanley, Sr. Unscd. Notes | | 4.38 | | 1/22/2047 | | 10,000 | | 12,635 | |
Morgan Stanley, Sr. Unscd. Notes | | 4.43 | | 1/23/2030 | | 20,000 | | 22,911 | |
Morgan Stanley, Sub. Notes | | 4.10 | | 5/22/2023 | | 15,000 | | 15,769 | |
Motorola Solutions, Sr. Unscd. Notes | | 2.75 | | 5/24/2031 | | 10,000 | | 10,105 | |
Northern Trust, Sr. Unscd. Notes | | 3.15 | | 5/3/2029 | | 20,000 | | 21,786 | |
Novartis Capital, Gtd. Notes | | 2.00 | | 2/14/2027 | | 10,000 | | 10,241 | |
Oncor Electric Delivery, Sr. Scd. Notes | | 3.10 | | 9/15/2049 | | 10,000 | | 10,815 | |
Oncor Electric Delivery, Sr. Scd. Notes | | 3.70 | | 11/15/2028 | | 15,000 | | 16,750 | |
Oracle, Sr. Unscd. Notes | | 1.65 | | 3/25/2026 | | 10,000 | | 10,037 | |
Oracle, Sr. Unscd. Notes | | 2.95 | | 4/1/2030 | | 10,000 | | 10,372 | |
Oracle, Sr. Unscd. Notes | | 4.00 | | 11/15/2047 | | 10,000 | | 10,829 | |
Parker-Hannifin, Sr. Unscd. Notes | | 3.25 | | 6/14/2029 | | 15,000 | | 16,083 | |
PepsiCo, Sr. Unscd. Notes | | 2.75 | | 4/30/2025 | | 15,000 | | 15,808 | |
Prologis, Sr. Unscd. Notes | | 2.25 | | 4/15/2030 | | 10,000 | | 10,100 | |
Prudential Financial, Sr. Unscd. Notes | | 4.35 | | 2/25/2050 | | 5,000 | | 6,381 | |
Target, Sr. Unscd. Notes | | 2.50 | | 4/15/2026 | | 15,000 | | 15,851 | |
Texas Instruments, Sr. Unscd. Notes | | 3.88 | | 3/15/2039 | | 10,000 | | 11,872 | |
13
STATEMENT OF INVESTMENTS (continued)
| | | | | | | | | | |
| |
Description | Coupon
Rate (%) | | Maturity Date | | Principal Amount ($) | | Value ($) | |
Bonds and Notes - 35.7% (continued) | | | | | |
United States - 33.2% (continued) | | | | | |
The Coca-Cola Company, Sr. Unscd. Notes | | 3.45 | | 3/25/2030 | | 10,000 | | 11,142 | |
The Dow Chemical Company, Sr. Unscd. Notes | | 2.10 | | 11/15/2030 | | 10,000 | | 9,836 | |
The Goldman Sachs Group, Sr. Unscd. Notes | | 3.85 | | 1/26/2027 | | 20,000 | | 21,666 | |
The Home Depot, Sr. Unscd. Notes | | 3.50 | | 9/15/2056 | | 10,000 | | 11,403 | |
The Home Depot, Sr. Unscd. Notes | | 3.90 | | 12/6/2028 | | 10,000 | | 11,377 | |
The Mosaic Company, Sr. Unscd. Notes | | 4.25 | | 11/15/2023 | | 10,000 | | 10,604 | |
The PNC Financial Services Group, Sr. Unscd. Notes | | 3.45 | | 4/23/2029 | | 10,000 | | 11,006 | |
The Walt Disney Company, Gtd. Notes | | 2.00 | | 9/1/2029 | | 15,000 | | 15,021 | |
The Walt Disney Company, Gtd. Notes | | 3.80 | | 5/13/2060 | | 10,000 | | 11,858 | |
Truist Financial, Sr. Unscd. Notes | | 3.75 | | 12/6/2023 | | 10,000 | | 10,601 | |
TWDC Enterprises 18, Gtd. Notes | | 4.13 | | 6/1/2044 | | 10,000 | | 11,945 | |
Tyson Foods, Sr. Unscd. Notes | | 4.55 | | 6/2/2047 | | 10,000 | | 12,547 | |
U.S. Treasury Bonds | | 1.13 | | 8/15/2040 | | 12,000 | | 10,377 | |
U.S. Treasury Bonds | | 1.13 | | 5/15/2040 | | 10,000 | | 8,662 | |
U.S. Treasury Bonds | | 1.25 | | 5/15/2050 | | 12,000 | | 10,156 | |
U.S. Treasury Bonds | | 1.38 | | 8/15/2050 | | 15,000 | | 13,088 | |
U.S. Treasury Bonds | | 1.38 | | 11/15/2040 | | 25,000 | | 22,579 | |
U.S. Treasury Bonds | | 1.63 | | 11/15/2050 | | 15,000 | | 13,920 | |
U.S. Treasury Bonds | | 1.75 | | 8/15/2041 | | 5,000 | | 4,815 | |
U.S. Treasury Bonds | | 1.88 | | 2/15/2051 | | 13,000 | | 12,793 | |
U.S. Treasury Bonds | | 1.88 | | 2/15/2041 | | 5,000 | | 4,916 | |
U.S. Treasury Bonds | | 2.00 | | 2/15/2050 | | 22,000 | | 22,272 | |
U.S. Treasury Bonds | | 2.00 | | 8/15/2051 | | 7,000 | | 7,102 | |
U.S. Treasury Bonds | | 2.25 | | 8/15/2049 | | 9,000 | | 9,601 | |
U.S. Treasury Bonds | | 2.38 | | 5/15/2051 | | 10,000 | | 10,994 | |
U.S. Treasury Bonds | | 2.38 | | 11/15/2049 | | 10,000 | | 10,951 | |
U.S. Treasury Bonds | | 2.50 | | 2/15/2045 | | 10,000 | | 10,963 | |
U.S. Treasury Bonds | | 2.75 | | 8/15/2047 | | 40,000 | | 46,520 | |
U.S. Treasury Bonds | | 2.75 | | 11/15/2042 | | 5,000 | | 5,657 | |
U.S. Treasury Bonds | | 2.88 | | 5/15/2049 | | 13,000 | | 15,614 | |
U.S. Treasury Bonds | | 3.00 | | 2/15/2048 | | 30,000 | | 36,551 | |
U.S. Treasury Bonds | | 3.00 | | 8/15/2048 | | 3,000 | | 3,664 | |
U.S. Treasury Bonds | | 3.00 | | 2/15/2049 | | 17,000 | | 20,845 | |
U.S. Treasury Bonds | | 3.13 | | 11/15/2041 | | 18,000 | | 21,490 | |
U.S. Treasury Bonds | | 3.13 | | 5/15/2048 | | 32,000 | | 39,909 | |
U.S. Treasury Bonds | | 3.13 | | 2/15/2042 | | 35,000 | | 41,885 | |
U.S. Treasury Bonds | | 3.38 | | 11/15/2048 | | 5,000 | | 6,530 | |
14
| | | | | | | | | | |
| |
Description | Coupon
Rate (%) | | Maturity Date | | Principal Amount ($) | | Value ($) | |
Bonds and Notes - 35.7% (continued) | | | | | |
United States - 33.2% (continued) | | | | | |
U.S. Treasury Bonds | | 3.63 | | 2/15/2044 | | 10,000 | | 12,976 | |
U.S. Treasury Bonds | | 3.88 | | 8/15/2040 | | 11,000 | | 14,446 | |
U.S. Treasury Bonds | | 4.38 | | 11/15/2039 | | 7,000 | | 9,714 | |
U.S. Treasury Bonds | | 4.38 | | 5/15/2040 | | 28,000 | | 39,052 | |
U.S. Treasury Bonds | | 4.50 | | 2/15/2036 | | 5,000 | | 6,877 | |
U.S. Treasury Notes | | 0.13 | | 10/15/2023 | | 25,000 | | 24,829 | |
U.S. Treasury Notes | | 0.13 | | 9/15/2023 | | 15,000 | | 14,908 | |
U.S. Treasury Notes | | 0.13 | | 1/31/2023 | | 50,000 | | 49,923 | |
U.S. Treasury Notes | | 0.13 | | 12/31/2022 | | 50,000 | | 49,947 | |
U.S. Treasury Notes | | 0.13 | | 1/15/2024 | | 10,000 | | 9,903 | |
U.S. Treasury Notes | | 0.13 | | 7/15/2023 | | 10,000 | | 9,954 | |
U.S. Treasury Notes | | 0.13 | | 7/31/2023 | | 25,000 | | 24,873 | |
U.S. Treasury Notes | | 0.13 | | 5/15/2023 | | 20,000 | | 19,931 | |
U.S. Treasury Notes | | 0.13 | | 12/15/2023 | | 10,000 | | 9,912 | |
U.S. Treasury Notes | | 0.25 | | 7/31/2025 | | 10,000 | | 9,733 | |
U.S. Treasury Notes | | 0.25 | | 4/15/2023 | | 20,000 | | 19,980 | |
U.S. Treasury Notes | | 0.38 | | 7/31/2027 | | 25,000 | | 23,720 | |
U.S. Treasury Notes | | 0.38 | | 11/30/2025 | | 10,000 | | 9,725 | |
U.S. Treasury Notes | | 0.38 | | 12/31/2025 | | 12,000 | | 11,657 | |
U.S. Treasury Notes | | 0.50 | | 2/28/2026 | | 25,000 | | 24,360 | |
U.S. Treasury Notes | | 0.50 | | 4/30/2027 | | 15,000 | | 14,377 | |
U.S. Treasury Notes | | 0.50 | | 6/30/2027 | | 20,000 | | 19,131 | |
U.S. Treasury Notes | | 0.50 | | 3/15/2023 | | 25,000 | | 25,069 | |
U.S. Treasury Notes | | 0.63 | | 12/31/2027 | | 15,000 | | 14,332 | |
U.S. Treasury Notes | | 0.63 | | 5/15/2030 | | 17,000 | | 15,799 | |
U.S. Treasury Notes | | 0.63 | | 3/31/2027 | | 20,000 | | 19,341 | |
U.S. Treasury Notes | | 0.63 | | 8/15/2030 | | 25,000 | | 23,173 | |
U.S. Treasury Notes | | 0.75 | | 4/30/2026 | | 15,000 | | 14,749 | |
U.S. Treasury Notes | | 0.75 | | 3/31/2026 | | 15,000 | | 14,759 | |
U.S. Treasury Notes | | 0.88 | | 11/15/2030 | | 30,000 | | 28,352 | |
U.S. Treasury Notes | | 0.88 | | 6/30/2026 | | 25,000 | | 24,676 | |
U.S. Treasury Notes | | 0.88 | | 9/30/2026 | | 25,000 | | 24,638 | |
U.S. Treasury Notes | | 1.13 | | 2/15/2031 | | 35,000 | | 33,764 | |
U.S. Treasury Notes | | 1.25 | | 8/15/2031 | | 32,000 | | 31,100 | |
U.S. Treasury Notes | | 1.25 | | 5/31/2028 | | 25,000 | | 24,726 | |
U.S. Treasury Notes | | 1.38 | | 1/31/2025 | | 25,000 | | 25,438 | |
U.S. Treasury Notes | | 1.38 | | 8/31/2026 | | 10,000 | | 10,099 | |
U.S. Treasury Notes | | 1.38 | | 2/15/2023 | | 15,000 | | 15,215 | |
U.S. Treasury Notes | | 1.50 | | 1/15/2023 | | 15,000 | | 15,229 | |
U.S. Treasury Notes | | 1.50 | | 2/15/2030 | | 15,000 | | 15,019 | |
U.S. Treasury Notes | | 1.50 | | 11/30/2024 | | 20,000 | | 20,434 | |
U.S. Treasury Notes | | 1.50 | | 3/31/2023 | | 25,000 | | 25,417 | |
U.S. Treasury Notes | | 1.50 | | 8/15/2026 | | 15,000 | | 15,232 | |
15
STATEMENT OF INVESTMENTS (continued)
| | | | | | | | | | |
| |
Description | Coupon
Rate (%) | | Maturity Date | | Principal Amount ($) | | Value ($) | |
Bonds and Notes - 35.7% (continued) | | | | | |
United States - 33.2% (continued) | | | | | |
U.S. Treasury Notes | | 1.63 | | 11/15/2022 | | 15,000 | | 15,228 | |
U.S. Treasury Notes | | 1.63 | | 5/15/2026 | | 25,000 | | 25,548 | |
U.S. Treasury Notes | | 1.63 | | 12/15/2022 | | 15,000 | | 15,240 | |
U.S. Treasury Notes | | 1.63 | | 5/15/2031 | | 20,000 | | 20,145 | |
U.S. Treasury Notes | | 1.63 | | 2/15/2026 | | 10,000 | | 10,225 | |
U.S. Treasury Notes | | 1.63 | | 8/15/2029 | | 25,000 | | 25,293 | |
U.S. Treasury Notes | | 1.63 | | 11/30/2026 | | 25,000 | | 25,528 | |
U.S. Treasury Notes | | 1.75 | | 12/31/2026 | | 20,000 | | 20,544 | |
U.S. Treasury Notes | | 1.75 | | 12/31/2024 | | 15,000 | | 15,444 | |
U.S. Treasury Notes | | 1.88 | | 6/30/2026 | | 5,000 | | 5,167 | |
U.S. Treasury Notes | | 1.88 | | 8/31/2024 | | 55,000 | | 56,779 | |
U.S. Treasury Notes | | 2.00 | | 2/15/2025 | | 30,000 | | 31,133 | |
U.S. Treasury Notes | | 2.00 | | 6/30/2024 | | 65,000 | | 67,262 | |
U.S. Treasury Notes | | 2.00 | | 5/31/2024 | | 65,000 | | 67,213 | |
U.S. Treasury Notes | | 2.00 | | 4/30/2024 | | 100,000 | | 103,363 | |
U.S. Treasury Notes | | 2.00 | | 8/15/2025 | | 25,000 | | 25,954 | |
U.S. Treasury Notes | | 2.13 | | 11/30/2024 | | 30,000 | | 31,218 | |
U.S. Treasury Notes | | 2.13 | | 9/30/2024 | | 18,000 | | 18,714 | |
U.S. Treasury Notes | | 2.13 | | 7/31/2024 | | 50,000 | | 51,943 | |
U.S. Treasury Notes | | 2.13 | | 5/31/2026 | | 10,000 | | 10,444 | |
U.S. Treasury Notes | | 2.25 | | 11/15/2024 | | 45,000 | | 47,005 | |
U.S. Treasury Notes | | 2.25 | | 10/31/2024 | | 30,000 | | 31,325 | |
U.S. Treasury Notes | | 2.25 | | 3/31/2026 | | 25,000 | | 26,233 | |
U.S. Treasury Notes | | 2.25 | | 11/15/2025 | | 10,000 | | 10,485 | |
U.S. Treasury Notes | | 2.25 | | 12/31/2024 | | 25,000 | | 26,126 | |
U.S. Treasury Notes | | 2.38 | | 5/15/2027 | | 25,000 | | 26,469 | |
U.S. Treasury Notes | | 2.38 | | 5/15/2029 | | 28,000 | | 29,798 | |
U.S. Treasury Notes | | 2.38 | | 8/15/2024 | | 25,000 | | 26,149 | |
U.S. Treasury Notes | | 2.63 | | 2/15/2029 | | 15,000 | | 16,206 | |
U.S. Treasury Notes | | 2.75 | | 2/15/2028 | | 5,000 | | 5,414 | |
U.S. Treasury Notes | | 2.75 | | 2/28/2025 | | 20,000 | | 21,243 | |
U.S. Treasury Notes | | 2.88 | | 8/15/2028 | | 25,000 | | 27,348 | |
U.S. Treasury Notes | | 2.88 | | 5/15/2028 | | 40,000 | | 43,673 | |
U.S. Treasury Notes | | 3.13 | | 11/15/2028 | | 35,000 | | 38,933 | |
United Parcel Service, Sr. Unscd. Notes | | 3.05 | | 11/15/2027 | | 15,000 | | 16,296 | |
Verizon Communications, Sr. Unscd. Notes | | 1.75 | | 1/20/2031 | | 15,000 | | 14,174 | |
Verizon Communications, Sr. Unscd. Notes | | 2.65 | | 11/20/2040 | | 10,000 | | 9,462 | |
Verizon Communications, Sr. Unscd. Notes | | 2.99 | | 10/30/2056 | | 5,000 | | 4,757 | |
16
| | | | | | | | | | |
| |
Description | Coupon
Rate (%) | | Maturity Date | | Principal Amount ($) | | Value ($) | |
Bonds and Notes - 35.7% (continued) | | | | | |
United States - 33.2% (continued) | | | | | |
Verizon Communications, Sr. Unscd. Notes | | 4.33 | | 9/21/2028 | | 10,000 | | 11,420 | |
Verizon Communications, Sr. Unscd. Notes | | 5.01 | | 8/21/2054 | | 10,000 | | 13,933 | |
Verizon Owner Trust, Ser. 2020-B, Cl. A | | 0.47 | | 2/20/2025 | | 5,000 | | 5,000 | |
Viacomcbs, Sr. Unscd. Debs. | | 5.85 | | 9/1/2043 | | 10,000 | | 13,626 | |
Visa, Sr. Unscd. Notes | | 3.15 | | 12/14/2025 | | 15,000 | | 16,125 | |
WW Grainger, Sr. Unscd. Notes | | 1.85 | | 2/15/2025 | | 10,000 | | 10,250 | |
Zoetis, Sr. Unscd. Notes | | 3.90 | | 8/20/2028 | | 15,000 | | 16,805 | |
Federal Home Loan Mortgage Corp.: | | | |
2.00%, 11/1/2036-3/1/2051 | | | 72,317 | c | 73,109 | |
2.50%, 5/1/2035-8/1/2050 | | | 76,729 | c | 79,078 | |
3.00%, 6/1/2035-6/1/2050 | | | 53,432 | c | 56,095 | |
3.50%, 11/1/2047-7/1/2049 | | | 37,915 | c | 40,231 | |
4.00%, 5/1/2049 | | | 7,095 | c | 7,587 | |
5.00%, 10/1/2049 | | | 9,529 | c | 10,536 | |
Federal National Mortgage Association: | | | |
1.50% | | | 75,000 | c,d | 74,496 | |
1.50%, 6/1/2051 | | | 24,641 | c | 23,927 | |
2.00% | | | 275,000 | c,d | 276,274 | |
2.00%, 9/1/2040-9/1/2051 | | | 91,571 | c | 91,748 | |
2.50%, 11/1/2031-5/1/2051 | | | 103,390 | c | 106,665 | |
2.50% | | | 125,000 | c,d | 128,327 | |
3.00%, 6/1/2034-6/1/2050 | | | 100,229 | c | 105,372 | |
3.00% | | | 50,000 | c,d | 52,164 | |
3.50%, 9/1/2037-11/1/2049 | | | 93,210 | c | 99,123 | |
4.00% | | | 25,000 | c,d | 26,767 | |
4.00%, 1/1/2048-8/1/2049 | | | 45,239 | c | 48,591 | |
4.50% | | | 25,000 | c,d | 27,026 | |
4.50%, 8/1/2047 | | | 7,377 | c | 8,008 | |
5.50%, 9/1/2049 | | | 11,827 | c | 13,245 | |
Government National Mortgage Association II: | | | |
2.00% | | | 25,000 | d | 25,318 | |
2.00%, 3/20/2051-7/20/2051 | | | 48,637 | | 49,299 | |
2.50% | | | 75,000 | d | 77,102 | |
2.50%, 7/20/2051 | | | 24,671 | | 25,384 | |
3.00%, 11/20/2045-8/20/2050 | | | 64,332 | | 67,169 | |
3.50%, 11/20/2046-6/20/2049 | | | 44,544 | | 46,843 | |
3.50% | | | 25,000 | d | 26,152 | |
4.00%, 4/20/2049-10/20/2049 | | | 24,712 | | 26,244 | |
4.50%, 2/20/2049-6/20/2049 | | | 11,477 | | 12,279 | |
17
STATEMENT OF INVESTMENTS (continued)
| | | | | | | | | | |
| |
Description | Coupon
Rate (%) | | Maturity Date | | Principal Amount ($) | | Value ($) | |
Bonds and Notes - 35.7% (continued) | | | | | |
United States - 33.2% (continued) | | | | | |
5.00%, 6/20/2049 | | | 6,472 | | 7,008 | |
| | 5,522,732 | |
Uruguay - .1% | | | | | |
Uruguay, Sr. Unscd. Bonds | | 4.98 | | 4/20/2055 | | 10,000 | | 12,833 | |
Total Bonds and Notes
(cost $5,851,192) | | 5,940,684 | |
Description | | | | | Shares | | Value ($) | |
Common Stocks - 62.3% | | | | | |
Australia - 1.6% | | | | | |
Australia & New Zealand Banking Group | | | | | | 1,266 | | 26,799 | |
CSL | | | | | | 234 | | 52,894 | |
Dexus | | | | | | 10,513 | | 85,964 | |
Insurance Australia Group | | | | | | 9,947 | | 35,917 | |
National Australia Bank | | | | | | 1,145 | | 24,729 | |
Westpac Banking | | | | | | 2,101 | | 40,571 | |
| | 266,874 | |
Canada - .5% | | | | | |
Intact Financial | | | | | | 151 | | 20,243 | |
The Toronto-Dominion Bank | | | | | | 876 | | 63,591 | |
| | 83,834 | |
China - 1.9% | | | | | |
3SBio | | | | | | 54,000 | b,e | 49,416 | |
Alibaba Group Holding | | | | | | 3,476 | e | 72,822 | |
Meituan, Cl. B | | | | | | 2,215 | b,e | 76,751 | |
Ping An Insurance Group Company of China, Cl. H | | | | | | 2,500 | | 17,962 | |
Tencent Holdings | | | | | | 1,689 | | 104,416 | |
| | 321,367 | |
Denmark - 1.5% | | | | | |
Chr. Hansen Holding | | | | | | 874 | | 69,540 | |
Novo Nordisk, Cl. B | | | | | | 217 | | 23,750 | |
Novozymes, Cl. B | | | | | | 1,197 | | 88,022 | |
Orsted | | | | | | 451 | b | 63,638 | |
| | 244,950 | |
France - 2.7% | | | | | |
BNP Paribas | | | | | | 749 | | 50,132 | |
Bureau Veritas | | | | | | 619 | | 19,649 | |
Danone | | | | | | 655 | | 42,667 | |
Kering | | | | | | 50 | | 37,466 | |
Legrand | | | | | | 886 | | 96,522 | |
L'Oreal | | | | | | 259 | | 118,250 | |
LVMH | | | | | | 25 | | 19,571 | |
18
| | | | | | | | | | |
| |
Description | | | | | Shares | | Value ($) | |
Common Stocks - 62.3% (continued) | | | | | |
France - 2.7% (continued) | | | | | |
Sanofi | | | | | | 651 | | 65,043 | |
| | 449,300 | |
Germany - 2.3% | | | | | |
Allianz | | | | | | 82 | | 19,067 | |
Brenntag | | | | | | 712 | | 67,689 | |
Continental | | | | | | 486 | | 57,036 | |
Fresenius Medical Care & Co. | | | | | | 261 | | 17,337 | |
Infineon Technologies | | | | | | 2,782 | | 129,910 | |
SAP | | | | | | 622 | | 90,109 | |
Vitesco Technologies Group | | | | | | 97 | e | 5,562 | |
| | 386,710 | |
Hong Kong - .6% | | | | | |
AIA Group | | | | | | 7,800 | | 88,070 | |
Link REIT | | | | | | 2,100 | | 18,623 | |
| | 106,693 | |
Ireland - 1.7% | | | | | |
Accenture, Cl. A | | | | | | 408 | | 146,386 | |
Kerry Group, Cl. A | | | | | | 322 | | 43,216 | |
Medtronic | | | | | | 718 | | 86,059 | |
| | 275,661 | |
Japan - 4.0% | | | | | |
Ebara | | | | | | 2,100 | | 114,236 | |
Fast Retailing | | | | | | 100 | | 66,251 | |
Honda Motor | | | | | | 1,500 | | 44,075 | |
KDDI | | | | | | 1,600 | | 49,527 | |
M3 | | | | | | 800 | | 47,084 | |
Mitsubishi UFJ Financial Group | | | | | | 3,800 | | 20,755 | |
Nippon Telegraph & Telephone | | | | | | 600 | | 16,783 | |
Recruit Holdings | | | | | | 1,300 | | 86,366 | |
Sony Group | | | | | | 200 | | 23,058 | |
Sugi Holdings | | | | | | 300 | | 21,478 | |
Sumitomo Mitsui Financial Group | | | | | | 500 | | 16,324 | |
Suntory Beverage & Food | | | | | | 1,600 | | 61,978 | |
Takeda Pharmaceutical | | | | | | 900 | | 25,292 | |
Toyota Industries | | | | | | 200 | | 16,951 | |
Toyota Motor | | | | | | 3,000 | | 52,814 | |
| | 662,972 | |
Netherlands - 1.1% | | | | | |
ASML Holding | | | | | | 196 | | 158,716 | |
Wolters Kluwer | | | | | | 203 | | 21,270 | |
| | 179,986 | |
Norway - .6% | | | | | |
DNB Bank | | | | | | 1,238 | | 29,426 | |
19
STATEMENT OF INVESTMENTS (continued)
| | | | | | | | | | |
| |
Description | | | | | Shares | | Value ($) | |
Common Stocks - 62.3% (continued) | | | | | |
Norway - .6% (continued) | | | | | |
Mowi | | | | | | 2,597 | | 75,193 | |
| | 104,619 | |
South Africa - .2% | | | | | |
Naspers, Cl. N | | | | | | 152 | | 25,774 | |
South Korea - .4% | | | | | |
Samsung SDI | | | | | | 94 | | 59,044 | |
Spain - .6% | | | | | |
Banco Santander | | | | | | 12,851 | | 48,675 | |
Iberdrola | | | | | | 4,191 | | 49,490 | |
| | 98,165 | |
Switzerland - 1.6% | | | | | |
Lonza Group | | | | | | 69 | | 56,566 | |
Nestle | | | | | | 460 | | 60,700 | |
Roche Holding | | | | | | 328 | | 126,833 | |
Zurich Insurance Group | | | | | | 42 | | 18,619 | |
| | 262,718 | |
Taiwan - .9% | | | | | |
Taiwan Semiconductor Manufacturing | | | | | | 7,000 | | 148,516 | |
Thailand - .3% | | | | | |
Kasikornbank | | | | | | 13,100 | | 55,665 | |
United Kingdom - 5.1% | | | | | |
3i Group | | | | | | 1,146 | | 21,392 | |
Ascential | | | | | | 7,489 | | 41,406 | |
AstraZeneca | | | | | | 178 | | 22,153 | |
Aviva | | | | | | 11,443 | | 61,811 | |
Barclays | | | | | | 16,739 | | 46,332 | |
Barratt Developments | | | | | | 4,110 | | 37,292 | |
Bunzl | | | | | | 1,376 | | 50,882 | |
Ferguson | | | | | | 464 | | 69,819 | |
Genus | | | | | | 268 | | 20,282 | |
GlaxoSmithKline | | | | | | 1,049 | | 21,658 | |
HSBC Holdings | | | | | | 3,323 | | 20,078 | |
Informa | | | | | | 10,230 | e | 72,717 | |
Linde | | | | | | 411 | | 131,191 | |
Prudential | | | | | | 2,146 | | 43,892 | |
RELX | | | | | | 1,545 | | 47,870 | |
Taylor Wimpey | | | | | | 23,537 | | 49,783 | |
Travis Perkins | | | | | | 3,741 | | 78,998 | |
Unilever | | | | | | 359 | | 19,220 | |
| | 856,776 | |
United States - 34.7% | | | | | |
Abbott Laboratories | | | | | | 589 | | 75,916 | |
20
| | | | | | | | | | |
| |
Description | | | | | Shares | | Value ($) | |
Common Stocks - 62.3% (continued) | | | | | |
United States - 34.7% (continued) | | | | | |
Adobe | | | | | | 138 | e | 89,750 | |
Albemarle | | | | | | 478 | | 119,725 | |
Alphabet, Cl. C | | | | | | 82 | e | 243,164 | |
Amazon.com | | | | | | 56 | e | 188,856 | |
American Express | | | | | | 332 | | 57,695 | |
American Tower | | | | | | 215 | f | 60,624 | |
Amgen | | | | | | 208 | | 43,050 | |
Apple | | | | | | 2,916 | | 436,817 | |
Applied Materials | | | | | | 869 | | 118,749 | |
AT&T | | | | | | 2,514 | | 63,504 | |
Automatic Data Processing | | | | | | 245 | | 55,000 | |
Becton Dickinson & Co. | | | | | | 81 | | 19,407 | |
Beyond Meat | | | | | | 356 | e | 35,237 | |
Biogen | | | | | | 141 | e | 37,602 | |
BlackRock | | | | | | 62 | | 58,495 | |
Booking Holdings | | | | | | 25 | e | 60,519 | |
Bristol-Myers Squibb | | | | | | 921 | | 53,786 | |
Brixmor Property Group | | | | | | 2,332 | f | 54,662 | |
Cigna | | | | | | 206 | | 44,004 | |
Citigroup | | | | | | 1,796 | | 124,211 | |
CME Group | | | | | | 102 | | 22,496 | |
CMS Energy | | | | | | 1,618 | | 97,646 | |
Colgate-Palmolive | | | | | | 604 | | 46,019 | |
Costco Wholesale | | | | | | 143 | | 70,290 | |
Dollar General | | | | | | 102 | | 22,595 | |
Ecolab | | | | | | 496 | | 110,221 | |
Eli Lilly & Co. | | | | | | 223 | | 56,811 | |
Emerson Electric | | | | | | 639 | | 61,989 | |
Eversource Energy | | | | | | 1,217 | | 103,323 | |
Fidelity National Information Services | | | | | | 344 | | 38,095 | |
Intel | | | | | | 1,363 | | 66,787 | |
Intuit | | | | | | 233 | | 145,856 | |
Jackson Financial, Cl. A | | | | | | 53 | e | 1,435 | |
JPMorgan Chase & Co. | | | | | | 1,118 | | 189,937 | |
Laureate Education, Cl. A | | | | | | 2,110 | e | 36,545 | |
Lowe's | | | | | | 326 | | 76,225 | |
Mastercard, Cl. A | | | | | | 392 | | 131,524 | |
Merck & Co. | | | | | | 1,701 | | 149,773 | |
Microsoft | | | | | | 1,435 | | 475,875 | |
Morgan Stanley | | | | | | 607 | | 62,387 | |
NIKE, Cl. B | | | | | | 464 | | 77,623 | |
Norfolk Southern | | | | | | 431 | | 126,305 | |
21
STATEMENT OF INVESTMENTS (continued)
| | | | | | | | | | |
| |
Description | | | | | Shares | | Value ($) | |
Common Stocks - 62.3% (continued) | | | | | |
United States - 34.7% (continued) | | | | | |
Otis Worldwide | | | | | | 974 | | 78,222 | |
PayPal Holdings | | | | | | 335 | e | 77,918 | |
PepsiCo | | | | | | 854 | | 138,006 | |
Prologis | | | | | | 445 | f | 64,507 | |
S&P Global | | | | | | 54 | | 25,605 | |
salesforce.com | | | | | | 515 | e | 154,340 | |
Starbucks | | | | | | 504 | | 53,459 | |
Texas Instruments | | | | | | 668 | | 125,237 | |
The Estee Lauder Companies, Cl. A | | | | | | 163 | | 52,866 | |
The Goldman Sachs Group | | | | | | 259 | | 107,058 | |
The Home Depot | | | | | | 346 | | 128,622 | |
The PNC Financial Services Group | | | | | | 257 | | 54,235 | |
The Procter & Gamble Company | | | | | | 399 | | 57,053 | |
The TJX Companies | | | | | | 764 | | 50,034 | |
The Walt Disney Company | | | | | | 503 | e | 85,042 | |
Thermo Fisher Scientific | | | | | | 145 | | 91,795 | |
Union Pacific | | | | | | 270 | | 65,178 | |
United Parcel Service, Cl. B | | | | | | 204 | | 43,548 | |
Verizon Communications | | | | | | 847 | | 44,883 | |
Visa, Cl. A | | | | | | 328 | | 69,461 | |
| | 5,777,599 | |
Total Common Stocks
(cost $7,326,057) | | 10,367,223 | |
22
| | | | | | | | | | |
| |
Description | 1-Day
Yield (%) | | | | Shares | | Value ($) | |
Investment Companies - 6.1% | | | | | |
Registered Investment Companies - 6.1% | | | | | |
Dreyfus Institutional Preferred Government Plus Money Market Fund, Institutional Shares
(cost $1,019,711) | | 0.06 | | | | 1,019,711 | g | 1,019,711 | |
Total Investments (cost $14,196,960) | | 104.1% | 17,327,618 | |
Liabilities, Less Cash and Receivables | | (4.1%) | (674,741) | |
Net Assets | | 100.0% | 16,652,877 | |
REIT—Real Estate Investment Trust
a Security issued with a zero coupon. Income is recognized through the accretion of discount.
b Security exempt from registration pursuant to Rule 144A under the Securities Act of 1933. These securities may be resold in transactions exempt from registration, normally to qualified institutional buyers. At October 31, 2021, these securities were valued at $199,752 or 1.2% of net assets.
c The Federal Housing Finance Agency (“FHFA”) placed the Federal Home Loan Mortgage Corporation and Federal National Mortgage Association into conservatorship with FHFA as the conservator. As such, the FHFA oversees the continuing affairs of these companies.
d Purchased on a forward commitment basis.
e Non-income producing security.
f Investment in real estate investment trust within the United States.
g Investment in affiliated issuer. The investment objective of this investment company is publicly available and can be found within the investment company’s prospectus.
23
STATEMENT OF INVESTMENTS (continued)
| | |
Portfolio Summary (Unaudited) † | Value (%) |
U.S. Treasury Securities | 13.8 |
U.S. Government Agencies Mortgage-Backed | 10.3 |
Information Technology | 8.4 |
Health Care | 8.2 |
Banks | 7.4 |
Investment Companies | 6.1 |
Internet Software & Services | 4.5 |
Technology Hardware & Equipment | 4.0 |
Semiconductors & Semiconductor Equipment | 3.9 |
Chemicals | 3.7 |
Diversified Financials | 3.6 |
Retailing | 2.6 |
Utilities | 2.6 |
Consumer Discretionary | 2.2 |
Telecommunication Services | 2.1 |
Real Estate | 2.1 |
Insurance | 1.9 |
Consumer Staples | 1.8 |
Food Products | 1.7 |
Transportation | 1.6 |
Commercial & Professional Services | 1.6 |
Industrial | 1.4 |
Media | 1.4 |
Beverage Products | 1.4 |
Automobiles & Components | 1.1 |
Electronic Components | 1.0 |
Consumer Durables & Apparel | .8 |
Foreign Governmental | .7 |
Supranational Bank | .5 |
Food & Staples Retailing | .4 |
U.S. Government Agencies Obligations | .4 |
U.S. Government Agencies Collateralized Municipal-Backed Securities | .3 |
Advertising | .3 |
Financials | .1 |
Agriculture | .1 |
Building Materials | .1 |
Asset-Backed Certificates | .0 |
| | 104.1 |
† Based on net assets.
See notes to financial statements.
24
STATEMENT OF INVESTMENTS IN AFFILIATED ISSUERS
| | | | | | | |
Investment Companies | Value
10/31/20($) | Purchases($)† | Sales($) | Value
10/31/21($) | Net
Assets (%) | Dividends/
Distributions($) |
Registered Investment Companies; | | | | |
Dreyfus Institutional Preferred Government Plus Money Market Fund, Institutional Shares | 495,326 | 5,720,268 | (5,195,883) | 1,019,711 | 6.1 | 557 |
† Includes reinvested dividends/distributions.
See notes to financial statements.
25
STATEMENT OF ASSETS AND LIABILITIES
October 31, 2021
| | | | | | | |
| | | | | | |
| | | Cost | | Value | |
Assets ($): | | | | |
Investments in securities—See Statement of Investments | | | |
Unaffiliated issuers | 13,177,249 | | 16,307,907 | |
Affiliated issuers | | 1,019,711 | | 1,019,711 | |
Cash | | | | | 46,925 | |
Cash denominated in foreign currency | | | 22,762 | | 22,865 | |
Receivable for investment securities sold | | 72,498 | |
Dividends and interest receivable | | 32,850 | |
Tax reclaim receivable—Note 1(b) | | 19,615 | |
Receivable for shares of Common Stock subscribed | | 2,461 | |
Due from BNY Mellon Investment Adviser, Inc. and affiliates—Note 3(b) | | 6,587 | |
Prepaid expenses | | | | | 429 | |
| | | | | 17,531,848 | |
Liabilities ($): | | | | |
Payable for investment securities purchased | | 806,833 | |
Directors’ fees and expenses payable | | 300 | |
Other accrued expenses | | | | | 71,838 | |
| | | | | 878,971 | |
Net Assets ($) | | | 16,652,877 | |
Composition of Net Assets ($): | | | | |
Paid-in capital | | | | | 13,408,173 | |
Total distributable earnings (loss) | | | | | 3,244,704 | |
Net Assets ($) | | | 16,652,877 | |
| | | | |
Net Asset Value Per Share | Class K | Service Shares | |
Net Assets ($) | 15,379,312 | 1,273,565 | |
Shares Outstanding | 963,138 | 80,000 | |
Net Asset Value Per Share ($) | 15.97 | 15.92 | |
| | | |
See notes to financial statements. | | | |
26
STATEMENT OF OPERATIONS
Year Ended October 31, 2021
| | | | | | | |
| | | | | | |
| | | | | | |
Investment Income ($): | | | | |
Income: | | | | |
Dividends (net of $7,653 foreign taxes withheld at source): | |
Unaffiliated issuers | | | 158,479 | |
Affiliated issuers | | | 557 | |
Interest | | | 80,281 | |
Total Income | | | 239,317 | |
Expenses: | | | | |
Management fee—Note 3(a) | | | 17,176 | |
Professional fees | | | 124,396 | |
Custodian fees—Note 3(b) | | | 16,477 | |
Chief Compliance Officer fees—Note 3(b) | | | 14,062 | |
Pricing fees | | | 13,820 | |
Prospectus and shareholders’ reports | | | 6,278 | |
Shareholder servicing costs—Note 3(b) | | | 3,100 | |
Directors’ fees and expenses—Note 3(c) | | | 869 | |
Loan commitment fees—Note 2 | | | 400 | |
Registration fees | | | 383 | |
Miscellaneous | | | 15,945 | |
Total Expenses | | | 212,906 | |
Less—reduction in expenses due to undertaking—Note 3(a) | | | (186,091) | |
Net Expenses | | | 26,815 | |
Investment Income—Net | | | 212,502 | |
Realized and Unrealized Gain (Loss) on Investments—Note 4 ($): | | |
Net realized gain (loss) on investments and foreign currency transactions | 773,794 | |
Net realized gain (loss) on forward foreign currency exchange contracts | 379 | |
Net Realized Gain (Loss) | | | 774,173 | |
Net change in unrealized appreciation (depreciation) on investments
and foreign currency transactions | 1,865,611 | |
Net Realized and Unrealized Gain (Loss) on Investments | | | 2,639,784 | |
Net Increase in Net Assets Resulting from Operations | | 2,852,286 | |
| | | | | | |
See notes to financial statements. | | | | | |
27
STATEMENT OF CHANGES IN NET ASSETS
| | | | | | | | | | |
| | | | Year Ended October 31, |
| | | | 2021 | | 2020 | |
Operations ($): | | | | | | | | |
Investment income—net | | | 212,502 | | | | 220,457 | |
Net realized gain (loss) on investments | | 774,173 | | | | 242,206 | |
Net change in unrealized appreciation
(depreciation) on investments | | 1,865,611 | | | | 647,062 | |
Net Increase (Decrease) in Net Assets
Resulting from Operations | 2,852,286 | | | | 1,109,725 | |
Distributions ($): | |
Distributions to shareholders: | | | | | | | | |
Class K | | | (251,294) | | | | (200,188) | |
Service Shares | | | (18,752) | | | | (14,896) | |
Total Distributions | | | (270,046) | | | | (215,084) | |
Capital Stock Transactions ($): | |
Net proceeds from shares sold: | | | | | | | | |
Class K | | | 392,850 | | | | 38,092 | |
Distributions reinvested: | | | | | | | | |
Class K | | | 1,190 | | | | 31 | |
Cost of shares redeemed: | | | | | | | | |
Class K | | | (10,426) | | | | (1,229) | |
Increase (Decrease) in Net Assets
from Capital Stock Transactions | 383,614 | | | | 36,894 | |
Total Increase (Decrease) in Net Assets | 2,965,854 | | | | 931,535 | |
Net Assets ($): | |
Beginning of Period | | | 13,687,023 | | | | 12,755,488 | |
End of Period | | | 16,652,877 | | | | 13,687,023 | |
Capital Share Transactions (Shares): | |
Class K | | | | | | | | |
Shares sold | | | 25,567 | | | | 2,881 | |
Shares issued for distributions reinvested | | | 82 | | | | 3 | |
Shares redeemed | | | (683) | | | | (96) | |
Net Increase (Decrease) in Shares Outstanding | 24,966 | | | | 2,788 | |
| | | | | | | | | |
See notes to financial statements. | | | | | | | | |
28
FINANCIAL HIGHLIGHTS
The following tables describe the performance for each share class for the fiscal periods indicated. All information (except portfolio turnover rate) reflects financial results for a single fund share. Net asset value total return is calculated assuming an initial investment made at the net asset value at the beginning of the period, reinvestment of all dividends and distributions at net asset value during the period, and redemption at net asset value on the last day of the period. Net asset value total return includes adjustments in accordance with accounting principles generally accepted in the United States of America and as such, the net asset value for financial reporting purposes and the returns based upon those net asset values may differ from the net asset value and returns for shareholder transactions. These figures have been derived from the fund’s financial statements.
| | | | | | | |
| | | | |
| | | | Year Ended October 31, |
Class K Shares | | | 2021 | 2020 | 2019a | 2018b |
Per Share Data ($): | | | | | | |
Net asset value, beginning of period | | | 13.45 | 12.56 | 11.57 | 12.50 |
Investment Operations: | | | | | | |
Investment income—netc | | | .21 | .22 | .26 | .37 |
Net realized and unrealized
gain (loss) on investments | | | 2.58 | .88 | .97 | (1.05) |
Total from Investment Operations | | | 2.79 | 1.10 | 1.23 | (.68) |
Distributions: | | | | | | |
Dividends from
investment income—net | | | (.27) | (.21) | (.24) | (.25) |
Net asset value, end of period | | | 15.97 | 13.45 | 12.56 | 11.57 |
Total Return (%) | | | 20.91 | 8.88 | 11.03 | (5.64)d |
Ratios/Supplemental Data (%): | | | | | | |
Ratio of total expenses
to average net assets | | | 1.34 | 1.42 | 2.11 | 2.19e |
Ratio of net expenses
to average net assets | | | .15 | .15 | .40 | .71e |
Ratio of net investment income
to average net assets | | | 1.38 | 1.70 | 2.16 | 3.10e |
Portfolio Turnover Rate | | | 88.59f | 87.52f | 220.33 | 81.07d |
Net Assets, end of period ($ x 1,000) | | | 15,379 | 12,614 | 11,753 | 5,412 |
a Effective April 1, 2019, Class Y shares were redesignated as Class K Shares.
b From November 30, 2017 (commencement of operations) to October 31, 2018.
c Based on average shares outstanding.
d Not annualized.
e Annualized.
f The portfolio turnover rates excluding mortgage dollar roll transactions for the periods ended October 31, 2021and 2020 were 57.21% and 52.86%, respectively.
See notes to financial statements.
29
FINANCIAL HIGHLIGHTS (continued)
| | | | | | | |
| | | | |
| | | | Year Ended October 31, |
Service Shares | | | 2021 | 2020 | 2019a | 2018b |
Per Share Data ($): | | | | | | |
Net asset value, beginning of period | | | 13.41 | 12.53 | 11.56 | 12.50 |
Investment Operations: | | | | | | |
Investment income—netc | | | .17 | .19 | .23 | .32 |
Net realized and unrealized
gain (loss) on investments | | | 2.57 | .88 | .97 | (1.03) |
Total from Investment Operations | | | 2.74 | 1.07 | 1.20 | (.71) |
Distributions: | | | | | | |
Dividends from
investment income—net | | | (.23) | (.19) | (.23) | (.23) |
Net asset value, end of period | | | 15.92 | 13.41 | 12.53 | 11.56 |
Total Return (%) | | | 20.63 | 8.50 | 10.73 | (5.79)d |
Ratios/Supplemental Data (%): | | | | | | |
Ratio of total expenses
to average net assets | | | 1.59 | 1.67 | 2.34 | 2.56e |
Ratio of net expenses
to average net assets | | | .40 | .40 | .62 | .96e |
Ratio of net investment income
to average net assets | | | 1.14 | 1.45 | 1.95 | 2.78e |
Portfolio Turnover Rate | | | 88.59f | 87.52f | 220.33 | 81.07d |
Net Assets, end of period ($ x 1,000) | | | 1,274 | 1,073 | 1,003 | 925 |
a Effective April 1, 2019, Class A shares were redesignated as Service Shares.
b From November 30, 2017 (commencement of operations) to October 31, 2018.
c Based on average shares outstanding.
d Not annualized.
e Annualized.
f The portfolio turnover rates excluding mortgage dollar roll transactions for the periods ended October 31, 2021 and 2020 were 57.21% and 52.86%, respectively.
See notes to financial statements.
30
NOTES TO FINANCIAL STATEMENTS
NOTE 1—Significant Accounting Policies:
BNY Mellon Sustainable Balanced Fund (the “fund”) is a separate diversified series of BNY Mellon Advantage Funds, Inc. (the “Company”), which is registered under the Investment Company Act of 1940, as amended (the “Act”), as an open-end management investment company and operates as a series company currently offering nine series, including the fund. The fund’s investment objective is to seek long-term capital appreciation. BNY Mellon Investment Adviser, Inc. (the “Adviser”), a wholly-owned subsidiary of The Bank of New York Mellon Corporation (“BNY Mellon”), serves as the fund’s investment adviser. Each of Newton Investment Management Limited (“Newton”) and Mellon Investments Corporation (“Mellon”), each a wholly-owned subsidiary of BNY Mellon and an affiliate of the Adviser, serve as the fund’s sub-investment advisers (the “Sub-Advisers”).
BNY Mellon Securities Corporation (the “Distributor”), a wholly-owned subsidiary of the Adviser, is the distributor of the fund’s shares. The fund is authorized to issue 400 million shares of $.001 par value Common Stock. The fund currently has authorized two classes of shares: Class K and Service. Class K shares (300 million shares authorized) and Service shares (100 million shares authorized). Class K shares are generally only offered to state-sponsored retirement plans. Service Class shares are generally offered only to holders of Class K who terminate their relationship with state-sponsored retirement plans. Each class of shares has identical rights and privileges, except with respect to the Shareholder Services Plan and the expenses borne by each class, the allocation of certain transfer agency costs, and certain voting rights. Income, expenses (other than expenses attributable to a specific class), and realized and unrealized gains or losses on investments are allocated to each class of shares based on its relative net assets.
As of October 31, 2021, MBC Investments Corporation, an indirect subsidiary of BNY Mellon, held 935,314 of Class K shares and all of the outstanding Service shares of the fund.
The Company accounts separately for the assets, liabilities and operations of each series. Expenses directly attributable to each series are charged to that series’ operations; expenses which are applicable to all series are allocated among them on a pro rata basis.
The Financial Accounting Standards Board (“FASB”) Accounting Standards Codification (“ASC”) is the exclusive reference of authoritative
31
NOTES TO FINANCIAL STATEMENTS (continued)
U.S. generally accepted accounting principles (“GAAP”) recognized by the FASB to be applied by nongovernmental entities. Rules and interpretive releases of the SEC under authority of federal laws are also sources of authoritative GAAP for SEC registrants. The fund is an investment company and applies the accounting and reporting guidance of the FASB ASC Topic 946 Financial Services-Investment Companies. The fund’s financial statements are prepared in accordance with GAAP, which may require the use of management estimates and assumptions. Actual results could differ from those estimates.
The Company enters into contracts that contain a variety of indemnifications. The fund’s maximum exposure under these arrangements is unknown. The fund does not anticipate recognizing any loss related to these arrangements.
(a) Portfolio valuation: The fair value of a financial instrument is the amount that would be received to sell an asset or paid to transfer a liability in an orderly transaction between market participants at the measurement date (i.e., the exit price). GAAP establishes a fair value hierarchy that prioritizes the inputs of valuation techniques used to measure fair value. This hierarchy gives the highest priority to unadjusted quoted prices in active markets for identical assets or liabilities (Level 1 measurements) and the lowest priority to unobservable inputs (Level 3 measurements).
Additionally, GAAP provides guidance on determining whether the volume and activity in a market has decreased significantly and whether such a decrease in activity results in transactions that are not orderly. GAAP requires enhanced disclosures around valuation inputs and techniques used during annual and interim periods.
Various inputs are used in determining the value of the fund’s investments relating to fair value measurements. These inputs are summarized in the three broad levels listed below:
Level 1—unadjusted quoted prices in active markets for identical investments.
Level 2—other significant observable inputs (including quoted prices for similar investments, interest rates, prepayment speeds, credit risk, etc.).
Level 3—significant unobservable inputs (including the fund’s own assumptions in determining the fair value of investments).
The inputs or methodology used for valuing securities are not necessarily an indication of the risk associated with investing in those securities.
32
Changes in valuation techniques may result in transfers in or out of an assigned level within the disclosure hierarchy. Valuation techniques used to value the fund’s investments are as follows:
Investments in debt securities excluding short-term investments (other than U.S. Treasury Bills), are valued each business day by one or more independent pricing services (each, a “Service”) approved by the Company’s Board of Directors (the “Board”). Investments for which quoted bid prices are readily available and are representative of the bid side of the market in the judgment of a Service are valued at the mean between the quoted bid prices (as obtained by a Service from dealers in such securities) and asked prices (as calculated by a Service based upon its evaluation of the market for such securities). Securities are valued as determined by a Service, based on methods which include consideration of the following: yields or prices of securities of comparable quality, coupon, maturity and type; indications as to values from dealers; and general market conditions. These securities are generally categorized within Level 2 of the fair value hierarchy.
Investments in equity securities are valued at the last sales price on the securities exchange or national securities market on which such securities are primarily traded. Securities listed on the National Market System for which market quotations are available are valued at the official closing price or, if there is no official closing price that day, at the last sales price. For open short positions, asked prices are used for valuation purposes. Bid price is used when no asked price is available. Registered investment companies that are not traded on an exchange are valued at their net asset value. All of the preceding securities are generally categorized within Level 1 of the fair value hierarchy.
Securities not listed on an exchange or the national securities market, or securities for which there were no transactions, are valued at the average of the most recent bid and asked prices. These securities are generally categorized within Level 2 of the fair value hierarchy.
Each Service and independent valuation firm is engaged under the general oversight of the Board.
Fair valuing of securities may be determined with the assistance of a Service using calculations based on indices of domestic securities and other appropriate indicators, such as prices of relevant American Depository Receipts and futures. Utilizing these techniques may result in transfers between Level 1 and Level 2 of the fair value hierarchy.
When market quotations or official closing prices are not readily available, or are determined not to accurately reflect fair value, such as when the
33
NOTES TO FINANCIAL STATEMENTS (continued)
value of a security has been significantly affected by events after the close of the exchange or market on which the security is principally traded (for example, a foreign exchange or market), but before the fund calculates its net asset value, the fund may value these investments at fair value as determined in accordance with the procedures approved by the Board. Certain factors may be considered when fair valuing investments such as: fundamental analytical data, the nature and duration of restrictions on disposition, an evaluation of the forces that influence the market in which the securities are purchased and sold, and public trading in similar securities of the issuer or comparable issuers. These securities are either categorized within Level 2 or 3 of the fair value hierarchy depending on the relevant inputs used.
For securities where observable inputs are limited, assumptions about market activity and risk are used and such securities are generally categorized within Level 3 of the fair value hierarchy.
Investments denominated in foreign currencies are translated to U.S. dollars at the prevailing rates of exchange.
The following is a summary of the inputs used as of October 31, 2021 in valuing the fund’s investments:
| | | | | | | |
| | Level 1-Unadjusted Quoted Prices | Level 2- Other Significant Observable Inputs | | Level 3-Significant Unobservable Inputs | Total | |
Assets ($) | | |
Investments In Securities:† | | |
Asset-Backed Securities | - | 5,000 | | - | 5,000 | |
Corporate Bonds | - | 1,704,246 | | - | 1,704,246 | |
Equity Securities - Common Stocks | 10,367,223 | - | | - | 10,367,223 | |
Foreign Governmental | - | 114,278 | | - | 114,278 | |
Investment Companies | 1,019,711 | - | | - | 1,019,711 | |
U.S. Government Agencies Collateralized Municipal-Backed Securities | - | 44,567 | | - | 44,567 | |
U.S. Government Agencies Mortgage-Backed | - | 1,711,167 | | - | 1,711,167 | |
34
| | | | | | | |
| | Level 1-Unadjusted Quoted Prices | Level 2- Other Significant Observable Inputs | | Level 3-Significant Unobservable Inputs | Total | |
Assets ($)(continued) | | |
Investments In Securities:†(continued) | | |
U.S. Government Agencies Obligations | - | 64,291 | | - | 64,291 | |
U.S. Treasury Securities | - | 2,297,135 | | - | 2,297,135 | |
† See Statement of Investments for additional detailed categorizations, if any.
(b) Foreign currency transactions: The fund does not isolate that portion of the results of operations resulting from changes in foreign exchange rates on investments from the fluctuations arising from changes in the market prices of securities held. Such fluctuations are included with the net realized and unrealized gain or loss on investments.
Net realized foreign exchange gains or losses arise from sales of foreign currencies, currency gains or losses realized on securities transactions between trade and settlement date, and the difference between the amounts of dividends, interest and foreign withholding taxes recorded on the fund’s books and the U.S. dollar equivalent of the amounts actually received or paid. Net unrealized foreign exchange gains and losses arise from changes in the value of assets and liabilities other than investments resulting from changes in exchange rates. Foreign currency gains and losses on foreign currency transactions are also included with net realized and unrealized gain or loss on investments.
Foreign taxes: The fund may be subject to foreign taxes (a portion of which may be reclaimable) on income, stock dividends, realized and unrealized capital gains on investments or certain foreign currency transactions. Foreign taxes are recorded in accordance with the applicable foreign tax regulations and rates that exist in the foreign jurisdictions in which the fund invests. These foreign taxes, if any, are paid by the fund and are reflected in the Statement of Operations, if applicable. Foreign taxes payable or deferred or those subject to reclaims as of October 31, 2021, if any, are disclosed in the fund’s Statement of Assets and Liabilities.
(c) Securities transactions and investment income: Securities transactions are recorded on a trade date basis. Realized gains and losses from securities transactions are recorded on the identified cost basis. Dividend income is recognized on the ex-dividend date and interest income, including, where applicable, accretion of discount and
35
NOTES TO FINANCIAL STATEMENTS (continued)
amortization of premium on investments, is recognized on the accrual basis.
(d) Affiliated issuers: Investments in other investment companies advised by the Adviser are considered “affiliated” under the Act.
(e) Risk: Investing in foreign markets may involve special risks and considerations not typically associated with investing in the U.S. These risks include revaluation of currencies, high rates of inflation, repatriation restrictions on income and capital, and adverse political, economic developments and public health conditions. Moreover, securities issued in these markets may be less liquid, subject to government ownership controls and delayed settlements, and their prices may be more volatile than those of comparable securities in the U.S. In addition, turbulence in financial markets and reduced liquidity in equity, credit and/or fixed income markets may negatively affect many issuers, which could adversely affect the fund. Global economies and financial markets are becoming increasingly interconnected, and conditions and events in one country, region or financial market may adversely impact issuers in a different country, region or financial market. These risks may be magnified if certain events or developments adversely interrupt the global supply chain; in these and other circumstances, such risks might affect companies world-wide. Recent examples include pandemic risks related to COVID-19 and aggressive measures taken world-wide in response by governments, including closing borders, restricting international and domestic travel, and the imposition of prolonged quarantines of large populations, and by businesses, including changes to operations and reducing staff. The effects of COVID-19 have contributed to increased volatility in global markets and will likely affect certain countries, companies, industries and market sectors more dramatically than others. The COVID-19 pandemic has had, and any other outbreak of an infectious disease or other serious public health concern could have, a significant negative impact on economic and market conditions and could trigger a prolonged period of global economic slowdown. To the extent the fund may overweight its investments in certain countries, companies, industries or market sectors, such positions will increase the fund’s exposure to risk of loss from adverse developments affecting those countries, companies, industries or sectors.
(f) Dividends and distributions to shareholders: Dividends and distributions are recorded on the ex-dividend date. Dividends from investment income-net are normally declared and paid on a monthly basis. Dividends from net realized capital gains, if any, are normally declared and paid annually, but the fund may make distributions on a more frequent basis to comply with the distribution requirements of the Internal Revenue
36
Code of 1986, as amended (the “Code”). To the extent that net realized capital gains can be offset by capital loss carryovers, it is the policy of the fund not to distribute such gains. Income and capital gain distributions are determined in accordance with income tax regulations, which may differ from GAAP.
(g) Federal income taxes: It is the policy of the fund to continue to qualify as a regulated investment company, if such qualification is in the best interests of its shareholders, by complying with the applicable provisions of the Code, and to make distributions of taxable income and net realized capital gain sufficient to relieve it from substantially all federal income and excise taxes.
As of and during the period ended October 31, 2021, the fund did not have any liabilities for any uncertain tax positions. The fund recognizes interest and penalties, if any, related to uncertain tax positions as income tax expense in the Statement of Operations. During the period ended October 31, 2021, the fund did not incur any interest or penalties.
Each tax year in the four years period ended October 31, 2021 remains subject to examination by the Internal Revenue Service and state taxing authorities.
At October 31, 2021, the components of accumulated earnings on a tax basis were as follows: undistributed ordinary income $199,706, accumulated capital losses $49,596 and unrealized appreciation $3,094,594.
The fund is permitted to carry forward capital losses for an unlimited period. Furthermore, capital loss carryovers retain their character as either short-term or long-term capital losses.
The accumulated capital loss carryover is available for federal income tax purposes to be applied against future net realized capital gains, if any, realized subsequent to October 31, 2021. If not applied, the fund has $49,596 of long-term capital losses which can be carried forward for an unlimited period.
The tax character of distributions paid to shareholders during the fiscal period ended October 31, 2021 and October 31, 2020 were as follows: ordinary income $270,046 and $215,084, respectively.
(h) New accounting pronouncements: In March 2020, the FASB issued Accounting Standards Update 2020-04, Reference Rate Reform (Topic 848): Facilitation of the Effects of Reference Rate Reform on Financial Reporting (“ASU 2020-04”), and in January 2021, the FASB issued Accounting Standards Update 2021-01, Reference Rate Reform (Topic 848): Scope (“ASU 2021-01”), which provides optional, temporary relief
37
NOTES TO FINANCIAL STATEMENTS (continued)
with respect to the financial reporting of contracts subject to certain types of modifications due to the planned discontinuation of the London Interbank Offered Rate (“LIBOR”) and other interbank offered rates as of the end of 2021. The temporary relief provided by ASU 2020-04 and ASU 2021-01 is effective for certain reference rate-related contract modifications that occur during the period from March 12, 2020 through December 31, 2022. Management is evaluating the impact of ASU 2020-04 and ASU 2021-01 on the fund’s investments, derivatives, debt and other contracts that will undergo reference rate-related modifications as a result of the reference rate reform. Management is also currently actively working with other financial institutions and counterparties to modify contracts as required by applicable regulation and within the regulatory deadlines.
NOTE 2—Bank Lines of Credit:
The fund participates with other long-term open-end funds managed by the Adviser in a $823.5 million unsecured credit facility led by Citibank, N.A. (the “Citibank Credit Facility”) and a $300 million unsecured credit facility provided by The Bank of New York Mellon (the “BNYM Credit Facility”), a subsidiary of BNY Mellon and an affiliate of the Adviser, each to be utilized primarily for temporary or emergency purposes, including the financing of redemptions (each, a “Facility”). The Citibank Credit Facility is available in two tranches: (i) Tranche A is in an amount equal to $688.5 million and is available to all long-term open-ended funds, including the fund, and (ii) Tranche B is an amount equal to $135 million and is available only to BNY Mellon Floating Rate Income Fund, a series of BNY Mellon Investment Funds IV, Inc. In connection therewith, the fund has agreed to pay its pro rata portion of commitment fees for Tranche A of the Citibank Credit Facility and the BNYM Credit Facility. Interest is charged to the fund based on rates determined pursuant to the terms of the respective Facility at the time of borrowing. During the period ended October 31, 2021, the fund did not borrow under the Facilities.
NOTE 3—Management Fee, Sub-Investment Advisory Fee and Other Transactions with Affiliates:
(a) Pursuant to a management agreement with the Adviser, the management fee is computed at the annual rate of .11% of the value of the fund’s average daily net assets and is payable monthly. The Adviser has contractually agreed, from November 1, 2020 through March 1, 2022, to waive receipt of its fees and/or assume the direct expenses of the fund, so that the direct expenses of neither class (excluding Shareholder Services Plan fees, taxes, interest expense, brokerage commissions, commitment fees on borrowings and extraordinary expenses) exceed .15% of the value of the fund’s average daily net assets. On or after March 1, 2022, the
38
Adviser may terminate this expense limitation at any time. The reduction in expenses, pursuant to the undertaking, amounted to $186,091 during the period ended October 31, 2021.
Pursuant to sub-investment advisory agreements between the Adviser and the respective Sub-Advisers, Newton and Mellon each serve as the fund’s sub-investment adviser responsible for the day-to-day management of a portion of the fund’s portfolio. The Adviser pays each of Newton and Mellon a monthly fee at an annual percentage of the value of the fund’s average daily net assets. The Adviser has obtained an exemptive order from the SEC (the “Order”), upon which the fund may rely, to use a manager of managers approach that permits the Adviser, subject to certain conditions and approval by the Board, to enter into and materially amend sub-investment advisory agreements with one or more sub-investment advisers who are either unaffiliated with the Adviser or are wholly-owned subsidiaries (as defined under the Act) of the Adviser’s ultimate parent company, BNY Mellon, without obtaining shareholder approval. The Order also allows the fund to disclose the sub-investment advisory fee paid by the Adviser to any unaffiliated sub-investment adviser in the aggregate with other unaffiliated sub-investment advisers in documents filed with the SEC and provided to shareholders. In addition, pursuant to the Order, it is not necessary to disclose the sub-investment advisory fee payable by the Adviser separately to a sub-investment adviser that is a wholly-owned subsidiary of BNY Mellon in documents filed with the SEC and provided to shareholders; such fees are to be aggregated with fees payable to the Adviser. The Adviser has ultimate responsibility (subject to oversight by the Board) to supervise any sub-investment adviser and recommend the hiring, termination, and replacement of any sub-investment adviser to the Board.
(b) Under the Shareholder Services Plan, Service shares pay the Distributor at an annual rate of .25% of the value of their average daily net assets for the provision of certain services. The services provided may include personal services relating to shareholder accounts, such as answering shareholder inquiries regarding the fund, and services related to the maintenance of shareholder accounts. Pursuant to the Plan, the Distributor may make payments to Service Agents (securities dealers, financial institutions or other industry professionals) with respect to these services. The Distributor determines the amounts to be paid to Service Agents. During the period ended October 31, 2021, the fund was charged $3,032 pursuant to the Shareholder Services Plan.
The fund has an arrangement with the transfer agent whereby the fund may receive earnings credits when positive cash balances are maintained,
39
NOTES TO FINANCIAL STATEMENTS (continued)
which are used to offset transfer agency fees. For financial reporting purposes, the fund includes net earnings credits, if any, as shareholder servicing costs in the Statement of Operations.
The fund has an arrangement with the custodian whereby the fund will receive interest income or be charged overdraft fees when cash balances are maintained. For financial reporting purposes, the fund includes this interest income and overdraft fees, if any, as interest income in the Statement of Operations.
The fund compensates BNY Mellon Transfer, Inc., a wholly-owned subsidiary of the Adviser, under a transfer agency agreement for providing transfer agency and cash management services inclusive of earnings credits, if any, for the fund. The majority of transfer agency fees are comprised of amounts paid on a per account basis, while cash management fees are related to fund subscriptions and redemptions. During the period ended October 31, 2021, the fund was charged $63 for transfer agency services, inclusive of earnings credit, if any. These fees are included in Shareholder servicing costs in the Statement of Operations.
The fund compensates The Bank of New York Mellon under a custody agreement for providing custodial services for the fund. These fees are determined based on net assets, geographic region and transaction activity. During the period ended October 31, 2021, the fund was charged $16,477 pursuant to the custody agreement.
During the period ended October 31, 2021, the fund was charged $14,062 for services performed by the Chief Compliance Officer and his staff. These fees are included in Chief Compliance Officer fees in the Statement of Operations.
The components of “Due from BNY Mellon Investment Adviser, Inc. and affiliates” in the Statement of Assets and Liabilities consist of: management fees of $1,530, Shareholder Services Plan fees of $266, custodian fees of $3,000, Chief Compliance Officer fees of $4,718 and transfer agency fees of $13, which are offset against an expense reimbursement currently in effect in the amount of $16,114.
(c) Each Board member also serves as a Board member of other funds in the BNY Mellon Family of Funds complex. Annual retainer fees and attendance fees are allocated to each fund based on net assets.
NOTE 4—Securities Transactions:
The aggregate amount of purchases and sales (including paydowns) of investment securities, excluding short-term securities and forward contracts, during the period ended October 31, 2021, amounted to
40
$13,732,059 and $13,481,281, respectively, of which $4,771,435 in purchases and $4,774,870 in sales were from mortgage dollar roll transactions.
Mortgage Dollar Rolls: A mortgage dollar roll transaction involves a sale by the fund of mortgage related securities that it holds with an agreement by the fund to repurchase similar securities at an agreed upon price and date. The securities purchased will bear the same interest rate as those sold, but generally will be collateralized by pools of mortgages with different prepayment histories than those securities sold. The fund accounts for mortgage dollar rolls as purchases and sales transactions. The fund executes mortgage dollar rolls entirely in the To-Be-Announced (“TBA”) market.
Derivatives: A derivative is a financial instrument whose performance is derived from the performance of another asset. The fund enters into International Swaps and Derivatives Association, Inc. Master Agreements or similar agreements (collectively, “Master Agreements”) with its over-the-counter (“OTC”) derivative contract counterparties in order to, among other things, reduce its credit risk to counterparties. Master Agreements include provisions for general obligations, representations, collateral and events of default or termination. Under a Master Agreement, the fund may offset with the counterparty certain derivative financial instruments’ payables and/or receivables with collateral held and/or posted and create one single net payment in the event of default or termination.
Each type of derivative instrument that was held by the fund during the period ended October 31, 2021 is discussed below.
Forward Foreign Currency Exchange Contracts: The fund enters into forward contracts in order to hedge its exposure to changes in foreign currency exchange rates on its foreign portfolio holdings, to settle foreign currency transactions or as a part of its investment strategy. When executing forward contracts, the fund is obligated to buy or sell a foreign currency at a specified rate on a certain date in the future. With respect to sales of forward contracts, the fund incurs a loss if the value of the contract increases between the date the forward contract is opened and the date the forward contract is closed. The fund realizes a gain if the value of the contract decreases between those dates. With respect to purchases of forward contracts, the fund incurs a loss if the value of the contract decreases between the date the forward contract is opened and the date the forward contract is closed. The fund realizes a gain if the value of the contract increases between those dates. Any realized or unrealized gains or losses which occurred during the period are reflected in the Statement of Operations. The fund is exposed to foreign currency risk as a result of
41
NOTES TO FINANCIAL STATEMENTS (continued)
changes in value of underlying financial instruments. The fund is also exposed to credit risk associated with counterparty nonperformance on these forward contracts, which is generally limited to the unrealized gain on each open contract. This risk may be mitigated by Master Agreements, if any, between the fund and the counterparty and the posting of collateral, if any, by the counterparty to the fund to cover the fund’s exposure to the counterparty. At October 31, 2021 there were no forward contracts outstanding.
The following summarizes the average market value of derivatives outstanding during the period ended October 31, 2021:
| | | |
| | Average Market Value ($) |
Forward contracts | | 299 |
At October 31, 2021, the cost of investments for federal income tax purposes was $14,233,007; accordingly, accumulated net unrealized appreciation on investments was $3,094,611, consisting of $3,295,379 gross unrealized appreciation and $200,768 gross unrealized depreciation.
42
REPORT OF INDEPENDENT REGISTERED PUBLIC ACCOUNTING FIRM
To the Shareholders and the Board of Directors of BNY Mellon Sustainable Balanced Fund
Opinion on the Financial Statements
We have audited the accompanying statement of assets and liabilities of BNY Mellon Sustainable Balanced Fund (the “Fund”) (one of the funds constituting BNY Mellon Advantage Funds, Inc.), including the statements of investments and investments in affiliated issuers, as of October 31, 2021, and the related statement of operations for the year then ended, the statements of changes in net assets for each of the two years in the period then ended, the financial highlights for each of the three years in the period then ended and the period from November 30, 2017 (commencement of operations) through October 31, 2018 and the related notes (collectively referred to as the “financial statements”). In our opinion, the financial statements present fairly, in all material respects, the financial position of the Fund (one of the funds constituting BNY Mellon Advantage Funds, Inc.) at October 31, 2021, the results of its operations for the year then ended, the changes in its net assets for each of the two years in the period then ended and its financial highlights for each of the three years in the period then ended and the period from November 30, 2017 (commencement of operations) through October 31, 2018, in conformity with U.S. generally accepted accounting principles.
Basis for Opinion
These financial statements are the responsibility of the Fund’s management. Our responsibility is to express an opinion on the Fund’s financial statements based on our audits. We are a public accounting firm registered with the Public Company Accounting Oversight Board (United States) (“PCAOB”) and are required to be independent with respect to the Fund in accordance with the U.S. federal securities laws and the applicable rules and regulations of the Securities and Exchange Commission and the PCAOB.
We conducted our audits in accordance with the standards of the PCAOB. Those standards require that we plan and perform the audit to obtain reasonable assurance about whether the financial statements are free of material misstatement, whether due to error or fraud. The Fund is not required to have, nor were we engaged to perform, an audit of the Fund’s internal control over financial reporting. As part of our audits, we are required to obtain an understanding of internal control over financial reporting, but not for the purpose of expressing an opinion on the effectiveness of the Fund’s internal control over financial reporting. Accordingly, we express no such opinion.
Our audits included performing procedures to assess the risks of material misstatement of the financial statements, whether due to error or fraud, and performing procedures that respond to those risks. Such procedures included examining, on a test basis, evidence regarding the amounts and disclosures in the financial statements. Our procedures included confirmation of securities owned as of October 31, 2021, by correspondence with the custodian and others or by other appropriate auditing procedures where replies from others were not received. Our audits also included evaluating the accounting principles used and significant estimates made by management, as well as evaluating the overall presentation of the financial statements. We believe that our audits provide a reasonable basis for our opinion.

We have served as the auditor of one or more investment companies in the BNY Mellon Family of Funds since at least 1957, but we are unable to determine the specific year.
New York, New York
December 23, 2021
43
IMPORTANT TAX INFORMATION (Unaudited)
For federal tax purposes, the fund hereby reports 26.04% of the ordinary dividends paid during the fiscal year ended October 31, 2021 as qualifying for the corporate dividends received deduction. Also certain dividends paid by the fund may be subject to a maximum tax rate of 15%, as provided for by the Jobs and Growth Tax Relief Reconciliation Act of 2003. Of the distributions paid during the fiscal year, $146,241 represents the maximum amount that may be considered qualified dividend income. Shareholders will receive notification in early 2022 of the percentage applicable to the preparation of their 2021 income tax returns.
44
LIQUIDITY RISK MANAGEMENT PROGRAM (Unaudited)
Effective June 1, 2019, the fund adopted a liquidity risk management program (the “Liquidity Risk Management Program”) pursuant to the requirements of Rule 22e-4 under the Investment Company Act of 1940, as amended. Rule 22e-4 requires registered open-end funds, including mutual funds and exchange-traded funds but not money market funds, to establish liquidity risk management programs in order to effectively manage fund liquidity and shareholder redemptions. The rule is designed to mitigate the risk that a fund could not meet redemption requests without significantly diluting the interests of remaining investors.
The rule requires the fund to assess, manage and review their liquidity risk at least annually considering applicable factors such as investment strategy and liquidity during normal and foreseeable stressed conditions, including whether the strategy is appropriate for an open-end fund and whether the fund has a relatively concentrated portfolio or large positions in particular issuers. The fund must also assess its use of borrowings and derivatives, short-term and long-term cash flow projections in normal and stressed conditions, holdings of cash and cash equivalents, and borrowing arrangements and other funding sources.
The rule also requires the fund to classify its investments as highly liquid, moderately liquid, less liquid or illiquid based on the number of days the fund expects it would take to liquidate the investment, and to review these classifications at least monthly or more often under certain conditions. The periods range from three or fewer business days for a highly liquid investment to greater than seven calendar days for settlement of a less liquid investment. Illiquid investments are those a fund does not expect to be able to sell or dispose of within seven calendar days without significantly changing the market value. The fund is prohibited from acquiring an investment if, after the acquisition, its holdings of illiquid assets will exceed 15% of its net assets. In addition, if a fund permits redemptions in-kind, the rule requires the fund to establish redemption in-kind policies and procedures governing how and when it will engage in such redemptions.
Pursuant to the rule’s requirements, the Liquidity Risk Management Program has been reviewed and approved by the Board. Furthermore, the Board has received a written report prepared by the Program’s Administrator that addresses the operation of the Program, assesses its adequacy and effectiveness and describes any material changes made to the Program.
Assessment of Program
In the opinion of the Program Administrator, the Program approved by the Board continues to be adequate for the fund and the Program has been implemented effectively. The Program Administrator has monitored the fund’s liquidity risk and the liquidity classification of the securities held by the fund and has determined that the Program is operating effectively.
During the period from January 1, 2020 to December 31, 2020, there were no material changes to the Program and no material liquidity events that impacted the fund. During the period, the fund held sufficient highly liquid assets to meet fund redemptions.
Under normal expected foreseeable fund redemption forecasts and foreseeable stressed fund redemption forecasts, the Program Administrator believes that the fund maintains sufficient highly liquid assets to meet expected fund redemptions.
45
BOARD MEMBERS INFORMATION (Unaudited)
Independent Board Members
Joseph S. DiMartino (78)
Chairman of the Board (1995)
Principal Occupation During Past 5 Years:
· Director or Trustee of funds in the BNY Mellon Family of Funds and certain other entities (as described in the fund’s Statement of Additional Information) (1995-Present)
Other Public Company Board Memberships During Past 5 Years:
· CBIZ, Inc., a public company providing professional business services, products and solutions, Director (1997-Present)
No. of Portfolios for which Board Member Serves: 98
———————
Peggy C. Davis (78)
Board Member (2006)
Principal Occupation During Past 5 Years:
· Shad Professor of Law, New York University School of Law (1983-Present)
No. of Portfolios for which Board Member Serves: 35
———————
Gina D. France (63)
Board Member (2019)
Principal Occupation During Past 5 Years:
· France Strategic Partners, a strategy and advisory firm serving corporate clients across the United States, Founder, President and Chief Executive Officer (2003-Present)
Other Public Company Board Memberships During Past 5 Years:
· Huntington Bancshares, a bank holding company headquartered in Columbus, Ohio, Director (2016-Present)
· Cedar Fair, L.P., a publicly-traded partnership that owns and operates amusement parks and hotels in the U.S. and Canada, Director (2011-Present)
· CBIZ, Inc., a public company providing professional business services, products and solutions, Director (2015-Present)
· FirstMerit Corporation, a diversified financial services company, Director (2004-2016)
No. of Portfolios for which Board Member Serves: 25
———————
Joan Gulley (74)
Board Member (2017)
Principal Occupation During Past 5 Years:
· Nantucket Atheneum, public library, Chair (2018-June 2021) and Director (2015-June 2021)
· Orchard Island Club, golf and beach club, Governor (2016-Present)
No. of Portfolios for which Board Member Serves: 43
———————
46
Robin A. Melvin (58)
Board Member (2012)
Principal Occupation During Past 5 Years:
· Westover School, a private girls’ boarding school in Middlebury, Connecticut, Trustee (2019-Present)
· Mentor Illinois, a non-profit organization dedicated to increasing the quality of mentoring services in Illinois. Co-Chair (2014–2020); Board Member, Mentor Illinois (2013-2020)
· JDRF, a non-profit juvenile diabetes research foundation, Board Member (June 2021-Present)
Other Public Company Board Memberships During Past 5 Years:
· HPS Corporate Lending Fund, a closed-end management investment company regulated as a business development company, Trustee (August 2021-Present)
No. of Portfolios for which Board Member Serves: 76
———————
Once elected all Board Members serve for an indefinite term, but achieve Emeritus status upon reaching age 80. The address of the Board Members and Officers is c/o BNY Mellon Investment Adviser, Inc. 240 Greenwich Street, New York, New York 10286. Additional information about the Board Members is available in the fund’s Statement of Additional Information which can be obtained from the Adviser free of charge by calling this toll free number: 1-800-373-9387.
David Feldman, Emeritus Board Member
Ehud Houminer, Emeritus Board Member
Lynn Martin, Emeritus Board Member
Dr. Martin Peretz, Emeritus Board Member
Philip L. Toia, Emeritus Board Member
47
OFFICERS OF THE FUND (Unaudited)
DAVID DIPETRILLO, President since January 2021.
Vice President and Director of the Adviser since February 2021; Head of North America Product, BNY Mellon Investment Management since January 2018; Director of Product Strategy, BNY Mellon Investment Management from January 2016 to December 2017. He is an officer of 57 investment companies (comprised of 107 portfolios) managed by the Adviser or an affiliate of the Adviser. He is 43 years old and has been an employee of BNY Mellon since 2005.
JAMES WINDELS, Treasurer since November 2001.
Vice President of the Adviser since September 2020; Director - BNY Mellon Fund Administration, and an officer of 58 investment companies (comprised of 129 portfolios) managed by the Adviser or an affiliate of the Adviser. He is 63 years old and has been an employee of the Adviser since April 1985.
PETER M. SULLIVAN, Chief Legal Officer since July 2021 and Vice President and Assistant Secretary since March 2019.
Chief Legal Officer of the Adviser since July 2021, Associate General Counsel of BNY Mellon since July 2021; Senior Managing Counsel of BNY Mellon from December 2020 to July 2021; Managing Counsel of BNY Mellon from March 2009 to December 2020, and an officer of 58 investment companies (comprised of 129 portfolios) managed by the Adviser or an affiliate of the Adviser. He is 53 years old and has been an employee of BNY Mellon since April 2004.
JAMES BITETTO, Vice President since August 2005 and Secretary since February 2018.
Senior Managing Counsel of BNY Mellon since December 2019; Managing Counsel of BNY Mellon from April 2014 to December 2019; Secretary of the Adviser, and an officer of 58 investment companies (comprised of 129 portfolios) managed by the Adviser or an affiliate of the Adviser. He is 55 years old and has been an employee of the Adviser since December 1996.
DEIRDRE CUNNANE, Vice President and Assistant Secretary since March 2019.
Counsel of BNY Mellon since August 2018; Senior Regulatory Specialist at BNY Mellon Investment Management Services from February 2016 to August 2018. She is an officer of 58 investment companies (comprised of 129 portfolios) managed by the Adviser or an affiliate of the Adviser. She is 31 years old and has been an employee of the Adviser since August 2018.
SARAH S. KELLEHER, Vice President and Assistant Secretary since April 2014.
Vice President since February 2020 of BNY Mellon ETF Investment Adviser; LLC, Senior Managing Counsel of BNY Mellon since September 2021; Managing Counsel from December 2017 to September 2021; Senior Counsel of BNY Mellon from March 2013 to December 2017. She is an officer of 58 investment companies (comprised of 129 portfolios) managed by the Adviser or an affiliate of the Adviser. She is 46 years old and has been an employee of the Adviser since March 2013.
JEFF PRUSNOFSKY, Vice President and Assistant Secretary since August 2005.
Senior Managing Counsel of BNY Mellon, and an officer of 58 investment companies (comprised of 129 portfolios) managed by the Adviser or an affiliate of the Adviser. He is 56 years old and has been an employee of the Adviser since October 1990.
AMANDA QUINN, Vice President and Assistant Secretary since March 2020.
Counsel of BNY Mellon since June 2019; Regulatory Administration Manager at BNY Mellon Investment Management Services from September 2018 to May 2019; Senior Regulatory Specialist at BNY Mellon Investment Management Services from April 2015 to August 2018. She is an officer of 58 investment companies (comprised of 129 portfolios) managed by the Adviser or an affiliate of the Adviser. She is 36 years old and has been an employee of the Adviser since June 2019.
48
NATALYA ZELENSKY, Vice President and Assistant Secretary since March 2017.
Chief Compliance Officer since August 2021 and Vice President since February 2020 of BNY Mellon ETF Investment Adviser, LLC; Chief Compliance Officer since August 2021 and Vice President and Assistant Secretary since February 2020 of BNY Mellon ETF Trust; Managing Counsel from December 2019 to August 2021 of BNY Mellon; Counsel from May 2016 to December 2019 of BNY Mellon; Assistant Secretary of the Adviser from April 2018 to August 2021. She is an officer of 57 investment companies (comprised of 128 portfolios) managed by the Adviser or an affiliate of the Adviser. She is 36 years old and has been an employee of BNY Mellon since May 2016.
GAVIN C. REILLY, Assistant Treasurer since December 2005.
Tax Manager-BNY Mellon Fund Administration, and an officer of 58 investment companies (comprised of 129 portfolios) managed by the Adviser or an affiliate of the Adviser. He is 53 years old and has been an employee of the Adviser since April 1991.
ROBERT SALVIOLO, Assistant Treasurer since July 2007.
Senior Accounting Manager–BNY Mellon Fund Administration, and an officer of 58 investment companies (comprised of 129 portfolios) managed by the Adviser or an affiliate of the Adviser. He is 54 years old and has been an employee of the Adviser since June 1989.
ROBERT SVAGNA, Assistant Treasurer since December 2002.
Senior Accounting Manager–BNY Mellon Fund Administration, and an officer of 58 investment companies (comprised of 129 portfolios) managed by the Adviser or an affiliate of the Adviser. He is 54 years old and has been an employee of the Adviser since November 1990.
JOSEPH W. CONNOLLY, Chief Compliance Officer since October 2004.
Chief Compliance Officer of the BNY Mellon Family of Funds and BNY Mellon Funds Trust since 2004, Chief Compliance Officer of the Adviser from 2004 until June 2021. He is an officer of 57 investment companies (comprised of 120 portfolios) managed by the Adviser. He is 64 years old.
CARIDAD M. CAROSELLA, Anti-Money Laundering Compliance Officer since January 2016.
Anti-Money Laundering Compliance Officer of the BNY Mellon Family of Funds and BNY Mellon Funds Trust. She is an officer of 50 investment companies (comprised of 121 portfolios) managed by the Adviser or an affiliate of the Adviser. She is 53 years old and has been an employee of the Distributor since 1997.
49
BNY Mellon Sustainable Balanced Fund
240 Greenwich Street
New York, NY 10286
Adviser
BNY Mellon Investment Adviser, Inc.
240 Greenwich Street
New York, NY 10286
Sub-Advisers
Newton Investment Management Limited
160 Queen Victoria Street
London, EC4V, 4LA, UK
Mellon Investment Corporation
BNY Mellon Center
One Boston Place
Boston, MA 02108
Custodian
The Bank of New York Mellon
240 Greenwich Street
New York, NY 10286
Transfer Agent &
Dividend Disbursing Agent
BNY Mellon Transfer, Inc.
240 Greenwich Street
New York, NY 10286
Distributor
BNY Mellon Securities Corporation
240 Greenwich Street
New York, NY 10286
| | |
Ticker Symbols: | Class K: DRAKX Service: DRASX |
Telephone Call your financial representative or 1-800-373-9387
Mail The BNY Mellon Family of Funds, 144 Glenn Curtiss Boulevard, Uniondale, NY 11556-0144
E-mail Send your request to info@bnymellon.com
Internet Information can be viewed online or downloaded at www.im.bnymellon.com
The fund files its complete schedule of portfolio holdings with the Securities and Exchange Commission (“SEC”) for the first and third quarters of each fiscal year on Form N-PORT. The fund’s Forms N-PORT are available on the SEC’s website at www.sec.gov.
A description of the policies and procedures that the fund uses to determine how to vote proxies relating to portfolio securities and information regarding how the fund voted these proxies for the most recent 12-month period ended June 30 is available at www.im.bnymellon.com and on the SEC’s website at www.sec.gov and without charge, upon request, by calling 1-800-373-9387.
| | |
© 2021 BNY Mellon Securities Corporation
4120AR1021 | 
|
Item 2. Code of Ethics.
The Registrant has adopted a code of ethics that applies to the Registrant's principal executive officer, principal financial officer, principal accounting officer or controller, or persons performing similar functions. There have been no amendments to, or waivers in connection with, the Code of Ethics during the period covered by this Report.
Item 3. Audit Committee Financial Expert.
The Registrant's Board has determined that Gina France, a member of the Audit Committee of the Board, is an audit committee financial expert as defined by the Securities and Exchange Commission (the "SEC"). Ms. France is "independent" as defined by the SEC for purposes of audit committee financial expert determinations.
Item 4. Principal Accountant Fees and Services.
(a) Audit Fees. The aggregate fees billed for each of the last two fiscal years (the "Reporting Periods") for professional services rendered by the Registrant's principal accountant (the "Auditor") for the audit of the Registrant's annual financial statements or services that are normally provided by the Auditor in connection with the statutory and regulatory filings or engagements for the Reporting Periods, were $200,487 in 2020 and $200,486 in 2021.
(b) Audit-Related Fees. The aggregate fees billed in the Reporting Periods for assurance and related services by the Auditor that are reasonably related to the performance of the audit of the Registrant's financial statements and are not reported under paragraph (a) of this Item 4 were $36,149 in 2020 and $62,212 in 2021. These services consisted of one or more of the following: (i) agreed upon procedures related to compliance with Internal Revenue Code section 817(h), (ii) security counts required by Rule 17f-2 under the Investment Company Act of 1940, as amended, (iii) advisory services as to the accounting or disclosure treatment of Registrant transactions or events and (iv) advisory services to the accounting or disclosure treatment of the actual or potential impact to the Registrant of final or proposed rules, standards or interpretations by the Securities and Exchange Commission, the Financial Accounting Standards Boards or other regulatory or standard-setting bodies.
The aggregate fees billed in the Reporting Periods for non-audit assurance and related services by the Auditor to the Registrant's investment adviser (not including any sub-investment adviser whose role is primarily portfolio management and is subcontracted with or overseen by another investment adviser), and any entity controlling, controlled by or under common control with the investment adviser that provides ongoing services to the Registrant ("Service Affiliates"), that were reasonably related to the performance of the annual audit of the Service Affiliate, which required pre-approval by the Audit Committee were $0 in 2020 and $0 in 2021.
(c) Tax Fees. The aggregate fees billed in the Reporting Periods for professional services rendered by the Auditor for tax compliance, tax advice, and tax planning ("Tax Services") were $14,789 in 2020 and $19,008 in 2021. These services consisted of: (i) review or preparation of U.S. federal, state, local and excise tax returns; (ii) U.S. federal, state and local tax planning, advice and assistance regarding statutory, regulatory or administrative developments; (iii) tax advice regarding tax qualification matters and/or treatment of various financial instruments held or proposed to be acquired or held, and (iv) determination of Passive Foreign Investment Companies. The aggregate fees billed in the Reporting Periods for Tax Services by the Auditor to Service Affiliates, which required pre-approval by the Audit Committee were $0 in 2020 and $10,960 in 2021.
(d) All Other Fees. The aggregate fees billed in the Reporting Periods for products and services provided by the Auditor, other than the services reported in paragraphs (a) through (c) of this Item, were $0 in 2020 and $857 in 2021. These services consisted of a review of the Registrant's anti-money laundering program.
The aggregate fees billed in the Reporting Periods for Non-Audit Services by the Auditor to Service Affiliates, other than the services reported in paragraphs (b) through (c) of this Item, which required pre-approval by the Audit Committee, were $0 in 2020 and $0 in 2021.
(e)(1) Audit Committee Pre-Approval Policies and Procedures. The Registrant's Audit Committee has established policies and procedures (the "Policy") for pre-approval (within specified fee limits) of the Auditor's engagements for non-audit services to the Registrant and Service Affiliates without specific case-by-case consideration. The pre-approved services in the Policy can include pre-approved audit services, pre-approved audit-related services, pre-approved tax services and pre-approved all other services. Pre-approval considerations include whether the proposed services are compatible with maintaining the Auditor's independence. Pre-approvals pursuant to the Policy are considered annually.
(e)(2) Note. None of the services described in paragraphs (b) through (d) of this Item 4 were approved by the Audit Committee pursuant to paragraph (c)(7)(i)(C) of Rule 2-01 of Regulation S-X.
(f) None of the hours expended on the principal accountant's engagement to audit the registrant's financial statements for the most recent fiscal year were attributed to work performed by persons other than the principal accountant's full-time, permanent employees.
Non-Audit Fees. The aggregate non-audit fees billed by the Auditor for services rendered to the Registrant, and rendered to Service Affiliates, for the Reporting Periods were $1,174,149 in 2020 and $2,476,929 in 2021.
Auditor Independence. The Registrant's Audit Committee has considered whether the provision of non-audit services that were rendered to Service Affiliates, which were not pre-approved (not requiring pre-approval), is compatible with maintaining the Auditor's independence.
Item 5. Audit Committee of Listed Registrants.
Not applicable.
Item 6. Investments.
(a) Not applicable.
| Item 7. | Disclosure of Proxy Voting Policies and Procedures for Closed-End Management Investment Companies. |
Not applicable.
Item 8. Portfolio Managers of Closed-End Management Investment Companies.
Not applicable.
| Item 9. | Purchases of Equity Securities by Closed-End Management Investment Companies and Affiliated Purchasers. |
Not applicable.
| Item 10. | Submission of Matters to a Vote of Security Holders. |
There have been no material changes to the procedures applicable to Item 10.
| Item 11. | Controls and Procedures. |
(a) The Registrant's principal executive and principal financial officers have concluded, based on their evaluation of the Registrant's disclosure controls and procedures as of a date within 90 days of the filing date of this report, that the Registrant's disclosure controls and procedures are reasonably designed to ensure that information required to be disclosed by the Registrant on Form N-CSR is recorded, processed, summarized and reported within the required time periods and that information required to be disclosed by the Registrant in the reports that it files or submits on Form N-CSR is accumulated and communicated to the Registrant's management, including its principal executive and principal financial officers, as appropriate to allow timely decisions regarding required disclosure.
(b) There were no changes to the Registrant's internal control over financial reporting that occurred during the period covered by this report that have materially affected, or are reasonably likely to materially affect, the Registrant's internal control over financial reporting.
| Item 12. | Disclosure of Securities Lending Activities for Closed-End Management Investment Companies. |
Not applicable.
(a)(1) Code of ethics referred to in Item 2.
(a)(2) Certifications of principal executive and principal financial officers as required by Rule 30a-2(a) under the Investment Company Act of 1940.
(a)(3) Not applicable.
(b) Certification of principal executive and principal financial officers as required by Rule 30a-2(b) under the Investment Company Act of 1940.
SIGNATURES
Pursuant to the requirements of the Securities Exchange Act of 1934 and the Investment Company Act of 1940, the Registrant has duly caused this Report to be signed on its behalf by the undersigned, thereunto duly authorized.
BNY Mellon Advantage Funds, Inc.
By: /s/ David DiPetrillo
David DiPetrillo
President (Principal Executive Officer)
Date: December 28, 2021
Pursuant to the requirements of the Securities Exchange Act of 1934 and the Investment Company Act of 1940, this Report has been signed below by the following persons on behalf of the Registrant and in the capacities and on the dates indicated.
By: /s/ David DiPetrillo
David DiPetrillo
President (Principal Executive Officer)
Date: December 28, 2021
By: /s/ James Windels
James Windels
Treasurer (Principal Financial Officer)
Date: December 27, 2021
EXHIBIT INDEX
(a)(1) Code of ethics referred to in Item 2.
(a)(2) Certifications of principal executive and principal financial officers as required by Rule 30a-2(a) under the Investment Company Act of 1940. (EX-99.CERT)
(b) Certification of principal executive and principal financial officers as required by Rule 30a-2(b) under the Investment Company Act of 1940. (EX-99.906CERT)