UNITED STATES
SECURITIES AND EXCHANGE COMMISSION
Washington, D.C. 20549
FORM N-CSR
CERTIFIED SHAREHOLDER REPORT OF REGISTERED MANAGEMENT
INVESTMENT COMPANIES
| Investment Company Act file number | 811-07123 |
| | |
| | BNY Mellon Advantage Funds, Inc. | |
| | (Exact name of Registrant as specified in charter) | |
| | | |
| | c/o BNY Mellon Investment Adviser, Inc. 240 Greenwich Street New York, New York 10286 | |
| | (Address of principal executive offices) (Zip code) | |
| | | |
| | Deirdre Cunnane, Esq. 240 Greenwich Street New York, New York 10286 | |
| | (Name and address of agent for service) | |
| |
| Registrant's telephone number, including area code: | (212) 922-6400 |
| | |
Date of fiscal year end: | 08/31 | |
| Date of reporting period: | 08/31/23 | |
| | | | | | | |
The following N-CSR relates only to the Registrant's series listed below and does not relate to any series of the Registrant with a different fiscal year end and, therefore, different N-CSR reporting requirements. A separate N-CSR will be filed for any series with a different fiscal year end, as appropriate.
BNY Mellon Dynamic Value Fund
BNY Mellon Opportunistic Midcap Value Fund
BNY Mellon Opportunistic Small Cap Fund
BNY Mellon Technology Growth Fund
FORM N-CSR
Item 1. Reports to Stockholders.
BNY Mellon Dynamic Value Fund
| |
ANNUAL REPORT August 31, 2023 |
| |
Save time. Save paper. View your next shareholder report online as soon as it’s available. Log into www.im.bnymellon.com and sign up for eCommunications. It’s simple and only takes a few minutes. |
| |
The views expressed in this report reflect those of the portfolio manager(s) only through the end of the period covered and do not necessarily represent the views of BNY Mellon Investment Adviser, Inc. or any other person in the BNY Mellon Investment Adviser, Inc. organization. Any such views are subject to change at any time based upon market or other conditions and BNY Mellon Investment Adviser, Inc. disclaims any responsibility to update such views. These views may not be relied on as investment advice and, because investment decisions for a fund in the BNY Mellon Family of Funds are based on numerous factors, may not be relied on as an indication of trading intent on behalf of any fund in the BNY Mellon Family of Funds. |
| |
Not FDIC-Insured • Not Bank-Guaranteed • May Lose Value |
Contents
THE FUND
FOR MORE INFORMATION
Back Cover
DISCUSSION OF FUND PERFORMANCE (Unaudited)
For the period from September 1, 2022, through August 31, 2023, as provided by Brian C. Ferguson, John C. Bailer, CFA and Keith Howell, CFA portfolio managers of Newton Investment Management North America, LLC, sub-adviser.
Market and Fund Performance Overview
For the 12-month period ended August 31, 2023, BNY Mellon Dynamic Value Fund’s (the “fund”) Class A shares produced a total return of 14.27%, Class C shares returned 13.40%, Class I shares returned 14.56% and Class Y shares returned 14.60%.1 The fund’s benchmark, the Russell 1000® Value Index (the “Index”), produced a total return of 8.59% for the same period.2
Stocks posted gains as investors began to anticipate an easing of tighter monetary policy that has occurred over the past year. The fund outperformed the Index, primarily due to stock selection in the health care, energy, utilities and communication services sectors.
The Fund’s Investment Approach
The fund seeks capital appreciation. To pursue its goal, the fund normally invests at least 80% of its net assets, plus any borrowings for investment purposes, in stocks. The fund may invest up to 30% of its assets in foreign securities. We identify potential investments through extensive quantitative and fundamental research. We focus on individual stock selection (a “bottom-up” approach), emphasizing three key factors: value, sound business fundamentals and positive business momentum.
Market Supported by Easing Inflation, Economic Resilience
The reporting period was marked by a range of factors that affected returns. Early in the period, the dominant theme was the Federal Reserve’s (the “Fed”) continued monetary tightening policies aimed at curbing inflation. Added to this was the banking crisis that emerged early in 2023. Uncertainty about the outcome of the debt ceiling standoff in the Congress also weighed on markets, as did some weaker-than-expected performance of China’s economy. Easing inflation, continued economic growth, the anticipated end to the Fed’s rate hikes and the emergence of the artificial intelligence (“AI”) theme provided markets with support.
The Fed raised the federal funds rate seven times during the period but reduced the size of the increase from 75 basis points to just 25 basis points for the last four hikes. The smaller rate hikes late in the period disappointed markets somewhat, as many investors were hoping for an end to the hiking cycle, given some signs of economic slowing.
Economic data showed that as pricing pressures continued to weaken from their peak in June 2022, the labor market also began to soften. Though unemployment remained relatively low, some large technology companies announced layoffs or paused hiring amid a more cautious macroeconomic outlook.
The banking crisis that emerged early in 2023 gave investors another reason to believe the Fed’s tightening policy would not continue. Three regional banks—Silicon Valley Bank, Signature Bank and First Republic Bank—faced mounting losses in their long-dated bond holdings as interest rates rose. Uninsured depositors were spooked by the headlines and lost confidence, choosing to move their money into larger money center banks.
In May 2023, the debate in Congress over the federal debt ceiling reached an apparent standoff, resulting in some market volatility. While an agreement was eventually reached, providing the
2
market with some relief, the run-up caused some turmoil as the prospect of a default was threatened.
In addition to easing inflation and investors’ growing anticipation of the end to the Fed’s tightening cycle, the possibility the economy could avoid recession also provided some support as a widely expected recession failed to arrive. China’s weaker-than-expected rebound from its Zero-COVID-19 policies, however, disappointed investors somewhat.
The market was also supported by the launch of ChatGPT by Open AI, which drew investors’ attention to the promise of artificial intelligence and its likely enhancement of productivity and economic growth. While the most immediate beneficiaries of this news were large-cap growth stocks in the information technology sector, their performance provided support to the market as a whole.
Performance Helped by Health Care, Energy, Utilities and Communication Services
The fund’s outperformance versus the Index was driven primarily by stock selections in the health care, energy, utilities and communication services sectors. In the health care sector, stock performance was driven by a decision to avoid pharmaceutical company Pfizer was beneficial as the company continued to be hurt by the end of the COVID-19 pandemic. In addition, shares of Eli Lilly & Co. gained on strong results from Mounjaro, a diabetes drug, which also holds promise as a weight loss treatment. The company also has an abundance of products in its pipeline, including an Alzheimer’s drug that is likely to receive FDA approval. A decision to avoid shares of CVS Health Corp. also supported performance. The company has experienced some turnover in management and has performed poorly in capital allocation decisions. In addition, the retail operation has been hurt by inventory shrinkage due to rampant shoplifting. In the health care equipment and supplies industry, medical device companies, especially Medtronic PLC and Boston Scientific Corp., also contributed to performance. In the energy sector, performance benefited from decisions by oil and gas companies to focus more on investor returns in the form of dividends and share buybacks. The fund’s positions in Hess Corp., Marathon Petroleum Corp. and Schlumberger NV, an oilfield services company, were especially advantageous. In the utilities sector, the fund’s position in Constellation Energy Corp. was the primary contributor. The company is the largest owner and operator of nuclear power plants, which are receiving financial incentives passed in 2022 as part of the Inflation Reduction Act. In the communication services sector, the fund’s position in Meta Platforms, Inc., parent company of Facebook, was beneficial. Shares rose more than 100% due to investor interest in the advent of artificial intelligence.
On a less positive note, the materials sector was the primary detractor from relative returns. It was the only sector that posted a negative performance during the reporting period, and much of this was a result of the poor performance of Alcoa Corp. This aluminum-maker was hurt primarily by weak economic performance in China despite the lifting of its Zero-COVID-19 policy. Another major detractor came from the financial sector, where shares of The Allstate Corp. were a drag on the fund’s performance. The property and casualty insurance company has struggled with pricing that has been weak relative to the cost of covering losses.
An Increased Focus on Fundamentals
While it is always important to focus on company fundamentals, we believe that in the current environment this focus is critical. Given that borrowing costs have risen dramatically, many companies will increasingly come under pressure as interest expenses increase. This is especially true of companies whose business models may have been built on an assumption of low funding
3
DISCUSSION OF FUND PERFORMANCE (Unaudited) (continued)
costs. Given this new environment, we are focused on companies that self-fund or have access to low-cost capital, and whose balance sheets are suited to these new economic conditions.
We are currently finding value in the financials sector, especially in the insurance and reinsurance industry. We are underweight in banking, however, as most of this industry will come under pressure due to higher funding costs.
We are also seeing opportunities in the health care sector, particularly among medical device companies. We are overweight in the energy sector as well because balance sheets in this sector are the strongest in decades, and the new focus on generating investor returns should prove beneficial.
In contrast, we are underweight the consumer staples and real estate sectors. Real estate investment trusts in particular are likely to remain under pressure, given their heavy reliance on debt.
September 15, 2023
1 Total return includes reinvestment of dividends and any capital gains paid and does not take into consideration the maximum initial sales charge in the case of Class A shares, or the applicable contingent deferred sales charges imposed on redemptions in the case of Class C shares. Had these charges been reflected, returns would have been lower. Past performance is no guarantee of future results. Share price and investment return fluctuate such that upon redemption, fund shares may be worth more or less than their original cost. The fund’s returns reflect the absorption of certain fund expenses by BNY Mellon Investment Adviser, Inc. pursuant to an agreement in effect through December 30, 2023, at which time it may be extended, terminated or modified. Had these expenses not been absorbed, the fund’s returns would have been lower.
2 Source: Lipper Inc. — The Russell 1000® Value Index measures the performance of the large-cap value segment of the U.S. equity universe. It includes those Russell 1000 companies that are considered more value-oriented relative to the overall market, as defined by Russell’s leading style methodology. The Russell 1000® Value Index is constructed to provide a comprehensive and unbiased barometer for the large-cap value segment. The index is completely reconstituted annually to ensure new and growing equities are included, and that the represented companies continue to reflect value characteristics. Investors cannot invest directly in any index.
Please note: the position in any security highlighted with italicized typeface was sold during the reporting period.
Equities are subject generally to market, market sector, market liquidity, issuer and investment style risks, among other factors, to varying degrees, all of which are more fully described in the fund’s prospectus.
The fund’s performance will be influenced by political, social and economic factors affecting investments in foreign companies. Special risks associated with investments in foreign companies include exposure to currency fluctuations, less liquidity, less developed or less efficient trading markets, lack of comprehensive company information, political instability and differing auditing and legal standards. These risks are enhanced in emerging market countries. Please read the prospectus for further discussion of these risks.
4
FUND PERFORMANCE (Unaudited)
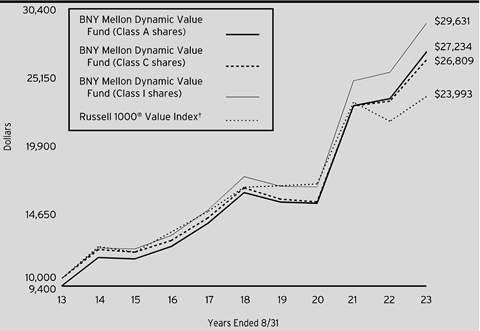
Comparison of change in value of a $10,000 investment in Class A shares, Class C shares and Class I shares of BNY Mellon Dynamic Value Fund with a hypothetical investment of $10,000 in the Russell 1000® Value Index (the “Index”).
† Source: Lipper Inc.
Past performance is not predictive of future performance.
The above graph compares a hypothetical $10,000 investment made in each of the Class A shares, Class C shares and Class I shares of BNY Mellon Dynamic Value Fund on 8/31/13 to a hypothetical investment of $10,000 made in the Index on that date. All dividends and capital gain distributions are reinvested.
The fund’s performance shown in the line graph above takes into account the maximum initial sales charge on Class A shares and all other applicable fees and expenses on Class A shares, Class C shares and Class I shares. The Index measures the performance of the large-cap value segment of the U.S. equity universe. It includes those Russell 1000 companies that are considered more value-oriented relative to the overall market as defined by Russell’s leading style methodology. The Russell 1000® Value Index is constructed to provide a comprehensive and unbiased barometer for the large-cap value segment. The index is completely reconstituted annually to ensure new and growing equities are included and that the represented companies continue to reflect value characteristics. Unlike a mutual fund, the Index is not subject to charges, fees and other expenses. Investors cannot invest directly in any index. Further information relating to fund performance, including expense reimbursements, if applicable, is contained in the Financial Highlights section of the prospectus and elsewhere in this report.
5
FUND PERFORMANCE (Unaudited) (continued)

Comparison of change in value of a $1,000,000 investment in Class Y shares of BNY Mellon Dynamic Value Fund with a hypothetical investment of $1,000,000 in the Russell 1000® Value Index (the “Index”).
† Source: Lipper Inc.
Past performance is not predictive of future performance.
The above graph compares a hypothetical $1,000,000 investment made in Class Y shares of BNY Mellon Dynamic Value Fund on 8/31/13 to a hypothetical investment of $1,000,000 made in the Index on that date. All dividends and capital gain distributions are reinvested.
The fund’s performance shown in the line graph above takes into account all applicable fees and expenses on Class Y shares. The Index measures the performance of the large-cap value segment of the U.S. equity universe. It includes those Russell 1000 companies that are considered more value-oriented relative to the overall market as defined by Russell’s leading style methodology. The Russell 1000® Value Index is constructed to provide a comprehensive and unbiased barometer for the large-cap value segment. The index is completely reconstituted annually to ensure new and growing equities are included and that the represented companies continue to reflect value characteristics. Unlike a mutual fund, the Index is not subject to charges, fees and other expenses. Investors cannot invest directly in any index. Further information relating to fund performance, including expense reimbursements, if applicable, is contained in the Financial Highlights section of the prospectus and elsewhere in this report.
6
| | | | | | | | |
Average Annual Total Returns as of 8/31/2023 | | |
| | | | | | |
| | | 1 Year | 5 Years | 10 Years |
| | | | | | |
Class A shares | | | | |
with maximum sales charge (5.75%) without sales charge | | 7.68% | 9.12% | 10.57% |
| | 14.27% | 10.41% | 11.19% |
Class C shares | | | | |
with applicable redemption charge † | | 12.40% | 9.59% | 10.36% |
without redemption | | 13.40% | 9.59% | 10.36% |
Class I shares | | 14.56% | 10.69% | 11.47% |
Class Y shares | | 14.60% | 10.74% | 11.50% |
Russell 1000® Value Index | | 8.59% | 7.11% | 9.15% |
† The maximum contingent deferred sales charge for Class C shares is 1% for shares redeemed within one year of the date of purchase.
The performance data quoted represents past performance, which is no guarantee of future results. Share price and investment return fluctuate and an investor’s shares may be worth more or less than original cost upon redemption. Current performance may be lower or higher than the performance quoted. Go to www.im.bnymellon.com for the fund’s most recent month-end returns.
The fund’s performance shown in the graphs and table does not reflect the deduction of taxes that a shareholder would pay on fund distributions or the redemption of fund shares. In addition to the performance of Class A shares shown with and without a maximum sales charge, the fund’s performance shown in the table takes into account all other applicable fees and expenses on all classes.
7
UNDERSTANDING YOUR FUND’S EXPENSES (Unaudited)
As a mutual fund investor, you pay ongoing expenses, such as management fees and other expenses. Using the information below, you can estimate how these expenses affect your investment and compare them with the expenses of other funds. You also may pay one-time transaction expenses, including sales charges (loads) and redemption fees, which are not shown in this section and would have resulted in higher total expenses. For more information, see your fund’s prospectus or talk to your financial adviser.
Review your fund’s expenses
The table below shows the expenses you would have paid on a $1,000 investment in BNY Mellon Dynamic Value Fund from March 1, 2023 to August 31, 2023. It also shows how much a $1,000 investment would be worth at the close of the period, assuming actual returns and expenses.
| | | | | | | |
Expenses and Value of a $1,000 Investment | |
Assume actual returns for the six months ended August 31, 2023 | |
| | | | | | |
| | Class A | Class C | Class I | Class Y | |
Expenses paid per $1,000† | $4.79 | $8.68 | $3.49 | $3.28 | |
Ending value (after expenses) | $1,065.30 | $1,061.50 | $1,066.70 | $1,066.90 | |
COMPARING YOUR FUND’S EXPENSES WITH THOSE OF OTHER FUNDS (Unaudited)
Using the SEC’s method to compare expenses
The Securities and Exchange Commission (“SEC”) has established guidelines to help investors assess fund expenses. Per these guidelines, the table below shows your fund’s expenses based on a $1,000 investment, assuming a hypothetical 5% annualized return. You can use this information to compare the ongoing expenses (but not transaction expenses or total cost) of investing in the fund with those of other funds. All mutual fund shareholder reports will provide this information to help you make this comparison. Please note that you cannot use this information to estimate your actual ending account balance and expenses paid during the period.
| | | | | | | |
Expenses and Value of a $1,000 Investment | |
Assuming a hypothetical 5% annualized return for the six months ended August 31, 2023 | |
| | | | | | |
| | Class A | Class C | Class I | Class Y | |
Expenses paid per $1,000† | $4.69 | $8.49 | $3.41 | $3.21 | |
Ending value (after expenses) | $1,020.57 | $1,016.79 | $1,021.83 | $1,022.03 | |
† | Expenses are equal to the fund’s annualized expense ratio of .92% for Class A, 1.67% for Class C, .67% for Class I and .63% for Class Y, multiplied by the average account value over the period, multiplied by 184/365 (to reflect the one-half year period). |
8
STATEMENT OF INVESTMENTS
August 31, 2023
| | | | | | | | |
| |
Description | | | | Shares | | Value ($) | |
Common Stocks - 98.5% | | | | | |
Automobiles & Components - .7% | | | | | |
General Motors Co. | | | | 667,265 | | 22,360,050 | |
Banks - 3.8% | | | | | |
JPMorgan Chase & Co. | | | | 831,605 | | 121,688,760 | |
Capital Goods - 5.9% | | | | | |
Eaton Corp. PLC | | | | 203,530 | | 46,887,206 | |
Howmet Aerospace, Inc. | | | | 522,354 | | 25,840,852 | |
Hubbell, Inc. | | | | 53,699 | | 17,508,559 | |
Northrop Grumman Corp. | | | | 113,853 | | 49,308,596 | |
The Boeing Company | | | | 216,314 | a | 48,460,825 | |
| | | | | 188,006,038 | |
Commercial & Professional Services - 1.0% | | | | | |
CACI International, Inc., Cl. A | | | | 92,942 | a | 30,485,905 | |
Consumer Durables & Apparel - .5% | | | | | |
Hasbro, Inc. | | | | 229,637 | | 16,533,864 | |
Consumer Services - 2.8% | | | | | |
International Game Technology PLC | | | | 997,050 | | 31,925,541 | |
Las Vegas Sands Corp. | | | | 1,054,163 | | 57,831,382 | |
| | | | | 89,756,923 | |
Energy - 13.8% | | | | | |
ConocoPhillips | | | | 462,213 | | 55,017,213 | |
EQT Corp. | | | | 1,500,313 | b | 64,843,528 | |
Hess Corp. | | | | 431,018 | | 66,592,281 | |
Marathon Petroleum Corp. | | | | 502,915 | | 71,801,175 | |
Occidental Petroleum Corp. | | | | 1,204,573 | | 75,635,139 | |
Schlumberger NV | | | | 779,704 | | 45,971,348 | |
Shell PLC, ADR | | | | 980,109 | | 60,854,968 | |
| | | | | 440,715,652 | |
Financial Services - 15.0% | | | | | |
Ameriprise Financial, Inc. | | | | 92,784 | | 31,322,023 | |
Ares Management Corp., Cl. A | | | | 305,868 | | 31,638,986 | |
Berkshire Hathaway, Inc., Cl. B | | | | 419,758 | a | 151,196,832 | |
CME Group, Inc. | | | | 360,200 | | 73,005,336 | |
LPL Financial Holdings, Inc. | | | | 168,625 | | 38,883,239 | |
Morgan Stanley | | | | 355,232 | | 30,248,005 | |
The Charles Schwab Corp. | | | | 776,316 | | 45,919,091 | |
The Goldman Sachs Group, Inc. | | | | 75,847 | | 24,855,820 | |
Voya Financial, Inc. | | | | 736,739 | | 51,335,973 | |
| | | | | 478,405,305 | |
Food, Beverage & Tobacco - 1.9% | | | | | |
Bunge Ltd. | | | | 299,072 | | 34,189,911 | |
9
STATEMENT OF INVESTMENTS (continued)
| | | | | | | | |
| |
Description | | | | Shares | | Value ($) | |
Common Stocks - 98.5% (continued) | | | | | |
Food, Beverage & Tobacco - 1.9% (continued) | | | | | |
Philip Morris International, Inc. | | | | 257,782 | | 24,762,539 | |
| | | | | 58,952,450 | |
Health Care Equipment & Services - 12.0% | | | | | |
Alcon, Inc. | | | | 278,282 | | 23,094,623 | |
Baxter International, Inc. | | | | 392,676 | | 15,942,646 | |
Becton, Dickinson & Co. | | | | 320,659 | | 89,608,158 | |
Boston Scientific Corp. | | | | 821,566 | a | 44,315,270 | |
Centene Corp. | | | | 528,665 | a | 32,592,197 | |
GE HealthCare Technologies, Inc. | | | | 321,498 | | 22,649,534 | |
Globus Medical, Inc., Cl. A | | | | 262,664 | a | 14,210,122 | |
McKesson Corp. | | | | 67,055 | | 27,648,118 | |
Medtronic PLC | | | | 1,049,664 | | 85,547,616 | |
The Cooper Companies, Inc. | | | | 71,573 | | 26,481,294 | |
| | | | | 382,089,578 | |
Household & Personal Products - 1.7% | | | | | |
Kenvue, Inc. | | | | 2,288,977 | | 52,760,920 | |
Insurance - 9.5% | | | | | |
American International Group, Inc. | | | | 622,703 | | 36,440,580 | |
Aon PLC, Cl. A | | | | 127,152 | | 42,391,205 | |
Assurant, Inc. | | | | 396,508 | | 55,245,460 | |
Everest Group Ltd. | | | | 100,484 | | 36,242,569 | |
RenaissanceRe Holdings Ltd. | | | | 246,819 | | 46,374,822 | |
The Allstate Corp. | | | | 323,096 | | 34,832,980 | |
The Progressive Corp. | | | | 385,710 | | 51,480,714 | |
| | | | | 303,008,330 | |
Materials - 2.1% | | | | | |
Freeport-McMoRan, Inc. | | | | 1,710,860 | | 68,280,423 | |
Media & Entertainment - 3.3% | | | | | |
Alphabet, Inc., Cl. A | | | | 289,849 | a | 39,468,738 | |
Meta Platforms, Inc., Cl. A | | | | 49,245 | a | 14,571,103 | |
Omnicom Group, Inc. | | | | 311,943 | | 25,270,502 | |
The Interpublic Group of Companies, Inc. | | | | 770,187 | b | 25,115,798 | |
| | | | | 104,426,141 | |
Pharmaceuticals, Biotechnology & Life Sciences - 10.4% | | | | | |
AbbVie, Inc. | | | | 404,265 | | 59,410,784 | |
Alnylam Pharmaceuticals, Inc. | | | | 89,573 | a | 17,719,331 | |
Biogen, Inc. | | | | 74,964 | a | 20,042,375 | |
BioMarin Pharmaceutical, Inc. | | | | 281,955 | a | 25,765,048 | |
Danaher Corp. | | | | 361,039 | | 95,675,335 | |
Gilead Sciences, Inc. | | | | 511,605 | | 39,127,550 | |
Regeneron Pharmaceuticals, Inc. | | | | 53,672 | a | 44,359,371 | |
Sanofi, ADR | | | | 579,235 | | 30,803,717 | |
| | | | | 332,903,511 | |
10
| | | | | | | | |
| |
Description | | | | Shares | | Value ($) | |
Common Stocks - 98.5% (continued) | | | | | |
Semiconductors & Semiconductor Equipment - 4.8% | | | | | |
Applied Materials, Inc. | | | | 390,145 | | 59,598,550 | |
Intel Corp. | | | | 901,411 | | 31,675,582 | |
Lam Research Corp. | | | | 23,187 | | 16,286,549 | |
Micron Technology, Inc. | | | | 664,001 | | 46,440,230 | |
| | | | | 154,000,911 | |
Software & Services - 3.3% | | | | | |
Akamai Technologies, Inc. | | | | 325,525 | a | 34,209,422 | |
Check Point Software Technologies Ltd. | | | | 178,825 | a | 24,068,057 | |
Dolby Laboratories, Inc., Cl. A | | | | 273,793 | | 23,127,295 | |
International Business Machines Corp. | | | | 163,772 | | 24,046,643 | |
| | | | | 105,451,417 | |
Technology Hardware & Equipment - 2.5% | | | | | |
Cisco Systems, Inc. | | | | 1,363,606 | | 78,202,804 | |
Transportation - 1.5% | | | | | |
FedEx Corp. | | | | 188,933 | | 49,315,292 | |
Utilities - 2.0% | | | | | |
Constellation Energy Corp. | | | | 626,708 | | 65,277,905 | |
Total Common Stocks (cost $2,793,694,703) | | | | 3,142,622,179 | |
| | | 1-Day
Yield (%) | | | | | |
Investment Companies - 1.4% | | | | | |
Registered Investment Companies - 1.4% | | | | | |
Dreyfus Institutional Preferred Government Plus Money Market Fund, Institutional Shares
(cost $44,146,863) | | 5.41 | | 44,146,863 | c | 44,146,863 | |
Total Investments (cost $2,837,841,566) | | 99.9% | | 3,186,769,042 | |
Cash and Receivables (Net) | | .1% | | 2,322,668 | |
Net Assets | | 100.0% | | 3,189,091,710 | |
ADR—American Depositary Receipt
a Non-income producing security.
b Security, or portion thereof, on loan. At August 31, 2023, the value of the fund’s securities on loan was $53,351,877 and the value of the collateral was $54,550,391, consisting of U.S. Government & Agency securities. In addition, the value of collateral may include pending sales that are also on loan.
c Investment in affiliated issuer. The investment objective of this investment company is publicly available and can be found within the investment company’s prospectus.
11
STATEMENT OF INVESTMENTS (continued)
| | |
Portfolio Summary (Unaudited) † | Value (%) |
Financials | 28.3 |
Health Care | 22.4 |
Energy | 13.8 |
Information Technology | 10.6 |
Industrials | 8.4 |
Consumer Discretionary | 4.0 |
Consumer Staples | 3.5 |
Communication Services | 3.3 |
Materials | 2.1 |
Utilities | 2.1 |
Investment Companies | 1.4 |
| | 99.9 |
† Based on net assets.
See notes to financial statements.
| | | | | | | |
Affiliated Issuers | | | |
Description | Value ($) 8/31/2022 | Purchases ($)† | Sales ($) | Value ($) 8/31/2023 | Dividends/
Distributions ($) | |
Registered Investment Companies - 1.4% | | |
Dreyfus Institutional Preferred Government Plus Money Market Fund, Institutional Shares - 1.4% | 15,035,152 | 889,458,681 | (860,346,970) | 44,146,863 | 896,298 | |
Investment of Cash Collateral for Securities Loaned - .0%†† | | |
Dreyfus Institutional Preferred Government Plus Money Market Fund, Institutional Shares - .0% | - | 94,012,056 | (94,012,056) | - | 502,734 | ††† |
12
| | | | | | | |
Affiliated Issuers (continued) | | | |
Description | Value ($) 8/31/2022 | Purchases ($)† | Sales ($) | Value ($) 8/31/2023 | Dividends/
Distributions ($) | |
Investment of Cash Collateral for Securities Loaned - .0%†† (continued) | | |
Dreyfus Institutional Preferred Government Plus Money Market Fund, SL Shares - .0% | 187,600 | 195,515,985 | (195,703,585) | - | 13,704 | ††† |
Total - 1.4% | 15,222,752 | 1,178,986,722 | (1,150,062,611) | 44,146,863 | 1,412,736 | |
† Includes reinvested dividends/distributions.
†† Effective July 3, 2023, cash collateral for securities lending was transferred from Dreyfus Institutional Preferred Government Plus Money Market Fund, SL Shares to Dreyfus Institutional Preferred Government Plus Money Market Fund, Institutional Shares.
††† Represents securities lending income earned from the reinvestment of cash collateral from loaned securities, net of fees and collateral investment expenses, and other payments to and from borrowers of securities.
See notes to financial statements.
13
STATEMENT OF ASSETS AND LIABILITIES
August 31, 2023
| | | | | | | |
| | | | | | |
| | | Cost | | Value | |
Assets ($): | | | | |
Investments in securities—See Statement of Investments
(including securities on loan, valued at $53,351,877)—Note 1(c): | | | |
Unaffiliated issuers | 2,793,694,703 | | 3,142,622,179 | |
Affiliated issuers | | 44,146,863 | | 44,146,863 | |
Receivable for investment securities sold | | 29,944,085 | |
Receivable for shares of Common Stock subscribed | | 16,583,190 | |
Dividends and securities lending income receivable | | 4,785,301 | |
Tax reclaim receivable—Note 1(b) | | 226,741 | |
Prepaid expenses | | | | | 160,121 | |
| | | | | 3,238,468,480 | |
Liabilities ($): | | | | |
Due to BNY Mellon Investment Adviser, Inc. and affiliates—Note 3(c) | | 1,812,141 | |
Payable for investment securities purchased | | 43,993,290 | |
Payable for shares of Common Stock redeemed | | 3,064,252 | |
Directors’ fees and expenses payable | | 42,521 | |
Other accrued expenses | | | | | 464,566 | |
| | | | | 49,376,770 | |
Net Assets ($) | | | 3,189,091,710 | |
Composition of Net Assets ($): | | | | |
Paid-in capital | | | | | 2,718,203,762 | |
Total distributable earnings (loss) | | | | | 470,887,948 | |
Net Assets ($) | | | 3,189,091,710 | |
| | | | | | |
Net Asset Value Per Share | Class A | Class C | Class I | Class Y | |
Net Assets ($) | 1,021,796,796 | 33,012,533 | 1,856,783,846 | 277,498,535 | |
Shares Outstanding | 24,764,672 | 906,328 | 44,649,495 | 6,688,854 | |
Net Asset Value Per Share ($) | 41.26 | 36.42 | 41.59 | 41.49 | |
| | | | | |
See notes to financial statements. | | | | | |
14
STATEMENT OF OPERATIONS
Year Ended August 31, 2023
| | | | | | | |
| | | | | | |
| | | | | | |
Investment Income ($): | | | | |
Income: | | | | |
Cash dividends (net of $301,063 foreign taxes withheld at source): | |
Unaffiliated issuers | | | 48,020,789 | |
Affiliated issuers | | | 896,298 | |
Income from securities lending—Note 1(c) | | | 516,438 | |
Total Income | | | 49,433,525 | |
Expenses: | | | | |
Management fee—Note 3(a) | | | 15,624,262 | |
Shareholder servicing costs—Note 3(c) | | | 4,158,871 | |
Registration fees | | | 368,817 | |
Directors’ fees and expenses—Note 3(d) | | | 213,172 | |
Distribution fees—Note 3(b) | | | 184,668 | |
Prospectus and shareholders’ reports | | | 97,450 | |
Professional fees | | | 93,241 | |
Loan commitment fees—Note 2 | | | 66,367 | |
Custodian fees—Note 3(c) | | | 65,514 | |
Interest expense—Note 2 | | | 24,143 | |
Chief Compliance Officer fees—Note 3(c) | | | 21,224 | |
Miscellaneous | | | 86,419 | |
Total Expenses | | | 21,004,148 | |
Less—reduction in expenses due to undertaking—Note 3(a) | | | (639,847) | |
Less—reduction in fees due to earnings credits—Note 3(c) | | | (142,557) | |
Net Expenses | | | 20,221,744 | |
Net Investment Income | | | 29,211,781 | |
Realized and Unrealized Gain (Loss) on Investments—Note 4 ($): | | |
Net realized gain (loss) on investments and foreign currency transactions | 124,493,258 | |
Net change in unrealized appreciation (depreciation) on investments
and foreign currency transactions | 197,353,064 | |
Net Realized and Unrealized Gain (Loss) on Investments | | | 321,846,322 | |
Net Increase in Net Assets Resulting from Operations | | 351,058,103 | |
| | | | | | |
See notes to financial statements. | | | | | |
15
STATEMENT OF CHANGES IN NET ASSETS
| | | | | | | | | | |
| | | | Year Ended August 31, |
| | | | 2023 | | 2022 | |
Operations ($): | | | | | | | | |
Net investment income | | | 29,211,781 | | | | 15,424,531 | |
Net realized gain (loss) on investments | | 124,493,258 | | | | 255,088,410 | |
Net change in unrealized appreciation
(depreciation) on investments | | 197,353,064 | | | | (234,045,533) | |
Net Increase (Decrease) in Net Assets
Resulting from Operations | 351,058,103 | | | | 36,467,408 | |
Distributions ($): | |
Distributions to shareholders: | | | | | | | | |
Class A | | | (82,406,100) | | | | (172,945,161) | |
Class C | | | (1,747,344) | | | | (1,451,936) | |
Class I | | | (94,067,152) | | | | (97,232,481) | |
Class Y | | | (20,632,403) | | | | (66,006,827) | |
Total Distributions | | | (198,852,999) | | | | (337,636,405) | |
Capital Stock Transactions ($): | |
Net proceeds from shares sold: | | | | | | | | |
Class A | | | 160,101,228 | | | | 97,741,023 | |
Class C | | | 25,244,240 | | | | 7,564,168 | |
Class I | | | 1,503,418,033 | | | | 434,795,690 | |
Class Y | | | 116,795,687 | | | | 85,318,056 | |
Distributions reinvested: | | | | | | | | |
Class A | | | 77,017,420 | | | | 161,208,223 | |
Class C | | | 1,656,007 | | | | 1,256,179 | |
Class I | | | 88,854,229 | | | | 91,981,560 | |
Class Y | | | 16,158,925 | | | | 33,442,482 | |
Cost of shares redeemed: | | | | | | | | |
Class A | | | (158,170,478) | | | | (91,470,743) | |
Class C | | | (6,781,231) | | | | (2,668,266) | |
Class I | | | (583,867,642) | | | | (154,340,139) | |
Class Y | | | (109,842,575) | | | | (161,056,793) | |
Increase (Decrease) in Net Assets
from Capital Stock Transactions | 1,130,583,843 | | | | 503,771,440 | |
Total Increase (Decrease) in Net Assets | 1,282,788,947 | | | | 202,602,443 | |
Net Assets ($): | |
Beginning of Period | | | 1,906,302,763 | | | | 1,703,700,320 | |
End of Period | | | 3,189,091,710 | | | | 1,906,302,763 | |
16
| | | | | | | | | | |
| | | | Year Ended August 31, |
| | | | 2023 | | 2022 | |
Capital Share Transactions (Shares): | |
Class Aa,b | | | | | | | | |
Shares sold | | | 4,061,975 | | | | 2,415,677 | |
Shares issued for distributions reinvested | | | 2,001,492 | | | | 4,062,707 | |
Shares redeemed | | | (4,027,566) | | | | (2,180,376) | |
Net Increase (Decrease) in Shares Outstanding | 2,035,901 | | | | 4,298,008 | |
Class Ca | | | | | | | | |
Shares sold | | | 722,248 | | | | 205,774 | |
Shares issued for distributions reinvested | | | 48,478 | | | | 35,138 | |
Shares redeemed | | | (196,062) | | | | (69,322) | |
Net Increase (Decrease) in Shares Outstanding | 574,664 | | | | 171,590 | |
Class Ib | | | | | | | | |
Shares sold | | | 38,041,141 | | | | 10,622,754 | |
Shares issued for distributions reinvested | | | 2,295,382 | | | | 2,305,302 | |
Shares redeemed | | | (14,758,742) | | | | (3,757,002) | |
Net Increase (Decrease) in Shares Outstanding | 25,577,781 | | | | 9,171,054 | |
Class Yb | | | | | | | | |
Shares sold | | | 2,954,760 | | | | 2,061,074 | |
Shares issued for distributions reinvested | | | 418,517 | | | | 840,475 | |
Shares redeemed | | | (2,758,559) | | | | (3,870,709) | |
Net Increase (Decrease) in Shares Outstanding | 614,718 | | | | (969,160) | |
| | | | | | | | | |
a | During the period ended August 31, 2023, 1,627 Class C shares representing $56,584 were automatically converted to 1,455 Class A shares and during the period ended August 31, 2022, 1,056 Class C shares representing $39,636 were automatically converted to 951 Class A shares. | |
b | During the period ended August 31, 2023, 44,051 Class Y shares representing $1,754,656 were exchanged for 43,942 Class I shares, 5,457 Class A shares representing $225,051 were exchanged for 5,415 Class I shares and during the period ended August 31, 2022, 87,969 Class Y shares representing $3,670,947 were exchanged for 87,775 Class I shares, 439 Class A shares representing $17,582 were exchanged for 437 Class I shares. | |
See notes to financial statements. | | | | | | | | |
17
FINANCIAL HIGHLIGHTS
The following tables describe the performance for each share class for the fiscal periods indicated. All information (except portfolio turnover rate) reflects financial results for a single fund share. Net asset value total return is calculated assuming an initial investment made at the net asset value at the beginning of the period, reinvestment of all dividends and distributions at net asset value during the period, and redemption at net asset value on the last day of the period. Net asset value total return includes adjustments in accordance with accounting principles generally accepted in the United States of America and as such, the net asset value for financial reporting purposes and the returns based upon those net asset values may differ from the net asset value and returns for shareholder transactions. These figures have been derived from the fund’s financial statements.
| | | | | | | | |
| | Year Ended August 31, |
| |
Class A Shares | | 2023 | 2022 | 2021 | 2020 | 2019 |
Per Share Data ($): | | | | | | |
Net asset value, beginning of period | | 39.43 | 47.84 | 33.28 | 34.61 | 42.18 |
Investment Operations: | | | | | | |
Net investment incomea | | .38 | .32 | .36 | .47 | .57 |
Net realized and unrealized gain
(loss) on investments | | 4.99 | .86 | 15.20 | (.56) | (2.67) |
Total from Investment Operations | | 5.37 | 1.18 | 15.56 | (.09) | (2.10) |
Distributions: | | | | | | |
Dividends from net investment
income | | (.28) | (.46) | (.22) | (.57) | (.63) |
Dividends from net realized gain
on investments | | (3.26) | (9.13) | (.78) | (.67) | (4.84) |
Total Distributions | | (3.54) | (9.59) | (1.00) | (1.24) | (5.47) |
Net asset value, end of period | | 41.26 | 39.43 | 47.84 | 33.28 | 34.61 |
Total Return (%)b | | 14.27 | 2.34 | 47.60 | (.55) | (4.40) |
Ratios/Supplemental Data (%): | | | | | | |
Ratio of total expenses to
average net assets | | .94 | .94 | .95 | .97 | .96 |
Ratio of net expenses to
average net assets | | .93 | .93 | .93 | .93 | .93 |
Ratio of net investment income to
average net assets | | .97 | .76 | .88 | 1.42 | 1.58 |
Portfolio Turnover Rate | | 106.44 | 115.23 | 108.10 | 103.12 | 97.03 |
Net Assets, end of period ($ x 1,000) | | 1,021,797 | 896,291 | 881,741 | 648,545 | 728,146 |
a Based on average shares outstanding.
b Exclusive of sales charge.
See notes to financial statements.
18
| | | | | | | | | | | |
| | | | | | |
| | Year Ended August 31, |
Class C Shares | | 2023 | 2022 | 2021 | 2020 | 2019 |
Per Share Data ($): | | | | | | |
Net asset value, beginning of period | | 35.34 | 43.80 | 30.58 | 31.84 | 39.20 |
Investment Operations: | | | | | | |
Net investment incomea | | .08 | .01 | .04 | .20 | .27 |
Net realized and unrealized gain
(loss) on investments | | 4.42 | .79 | 13.96 | (.53) | (2.48) |
Total from Investment Operations | | 4.50 | .80 | 14.00 | (.33) | (2.21) |
Distributions: | | | | | | |
Dividends from net investment
income | | (.16) | (.13) | - | (.26) | (.31) |
Dividends from net realized gain
on investments | | (3.26) | (9.13) | (.78) | (.67) | (4.84) |
Total Distributions | | (3.42) | (9.26) | (.78) | (.93) | (5.15) |
Net asset value, end of period | | 36.42 | 35.34 | 43.80 | 30.58 | 31.84 |
Total Return (%)b | | 13.40 | 1.59 | 46.48 | (1.29) | (5.12) |
Ratios/Supplemental Data (%): | | | | | | |
Ratio of total expenses to
average net assets | | 1.73 | 1.72 | 1.73 | 1.73 | 1.71 |
Ratio of net expenses to
average net assets | | 1.68 | 1.68 | 1.68 | 1.68 | 1.68 |
Ratio of net investment income to
average net assets | | .23 | .02 | .11 | .66 | .83 |
Portfolio Turnover Rate | | 106.44 | 115.23 | 108.10 | 103.12 | 97.03 |
Net Assets, end of period ($ x 1,000) | | 33,013 | 11,719 | 7,011 | 9,372 | 16,615 |
a Based on average shares outstanding.
b Exclusive of sales charge.
See notes to financial statements.
19
FINANCIAL HIGHLIGHTS (continued)
| | | | | | | | | | |
| | | | |
| | Year Ended August 31, |
Class I Shares | | 2023 | 2022 | 2021 | 2020 | 2019 |
Per Share Data ($): | | | | | | |
Net asset value, beginning of period | | 39.72 | 48.13 | 33.47 | 34.80 | 42.33 |
Investment Operations: | | | | | | |
Net investment incomea | | .49 | .43 | .47 | .56 | .66 |
Net realized and unrealized gain
(loss) on investments | | 5.02 | .86 | 15.28 | (.56) | (2.68) |
Total from Investment Operations | | 5.51 | 1.29 | 15.75 | (.00)b | (2.02) |
Distributions: | | | | | | |
Dividends from net investment
income | | (.38) | (.57) | (.31) | (.66) | (.67) |
Dividends from net realized gain
on investments | | (3.26) | (9.13) | (.78) | (.67) | (4.84) |
Total Distributions | | (3.64) | (9.70) | (1.09) | (1.33) | (5.51) |
Net asset value, end of period | | 41.59 | 39.72 | 48.13 | 33.47 | 34.80 |
Total Return (%) | | 14.56 | 2.60 | 47.97 | (.30) | (4.16) |
Ratios/Supplemental Data (%): | | | | | | |
Ratio of total expenses to
average net assets | | .72 | .69 | .70 | .71 | .71 |
Ratio of net expenses to
average net assets | | .68 | .68 | .68 | .68 | .68 |
Ratio of net investment income to
average net assets | | 1.22 | 1.02 | 1.13 | 1.67 | 1.83 |
Portfolio Turnover Rate | | 106.44 | 115.23 | 108.10 | 103.12 | 97.03 |
Net Assets, end of period ($ x 1,000) | | 1,856,784 | 757,567 | 476,540 | 342,508 | 452,432 |
a Based on average shares outstanding.
b Amount represents less than $.01 per share.
See notes to financial statements.
20
| | | | | | | | | | |
| | | | |
| | Year Ended August 31, |
Class Y Shares | | 2023 | 2022 | 2021 | 2020 | 2019 |
Per Share Data ($): | | | | | | |
Net asset value, beginning of period | | 39.63 | 48.05 | 33.41 | 34.74 | 42.35 |
Investment Operations: | | | | | | |
Net investment incomea | | .50 | .45 | .49 | .57 | .67 |
Net realized and unrealized gain
(loss) on investments | | 5.01 | .85 | 15.25 | (.56) | (2.68) |
Total from Investment Operations | | 5.51 | 1.30 | 15.74 | .01 | (2.01) |
Distributions: | | | | | | |
Dividends from net investment
income | | (.39) | (.59) | (.32) | (.67) | (.76) |
Dividends from net realized gain
on investments | | (3.26) | (9.13) | (.78) | (.67) | (4.84) |
Total Distributions | | (3.65) | (9.72) | (1.10) | (1.34) | (5.60) |
Net asset value, end of period | | 41.49 | 39.63 | 48.05 | 33.41 | 34.74 |
Total Return (%) | | 14.60 | 2.64 | 48.06 | (.27) | (4.13) |
Ratios/Supplemental Data (%): | | | | | | |
Ratio of total expenses to
average net assets | | .64 | .63 | .64 | .65 | .65 |
Ratio of net expenses to
average net assets | | .63 | .63 | .64 | .65 | .65 |
Ratio of net investment income to
average net assets | | 1.26 | 1.04 | 1.18 | 1.70 | 1.84 |
Portfolio Turnover Rate | | 106.44 | 115.23 | 108.10 | 103.12 | 97.03 |
Net Assets, end of period ($ x 1,000) | | 277,499 | 240,726 | 338,408 | 204,901 | 240,163 |
a Based on average shares outstanding.
See notes to financial statements.
21
NOTES TO FINANCIAL STATEMENTS
NOTE 1—Significant Accounting Policies:
BNY Mellon Dynamic Value Fund (the “fund”) is a separate diversified series of BNY Mellon Advantage Funds, Inc. (the “Company”), which is registered under the Investment Company Act of 1940, as amended (the “Act”), as an open-end management investment company and operates as a series company currently offering seven series, including the fund. The fund’s investment objective is to seek capital appreciation. BNY Mellon Investment Adviser, Inc. (the “Adviser”), a wholly-owned subsidiary of The Bank of New York Mellon Corporation (“BNY Mellon”), serves as the fund’s investment adviser. Newton Investment Management North America, LLC (the “Sub-Adviser”), an indirect wholly-owned subsidiary of BNY Mellon and an affiliate of the Adviser, serves as the fund’s sub-adviser.
Effective March 31, 2023, the Sub-Adviser, entered into a sub-sub-investment advisory agreement with its affiliate, Newton Investment Management Limited (“NIM”), to enable NIM to provide certain advisory services to the Sub-Adviser for the benefit of the fund, including, but not limited to, portfolio management services. NIM is subject to the supervision of the Sub-Adviser and the Adviser. NIM is also an affiliate of the Adviser. NIM, located at 160 Queen Victoria Street, London, EC4V, 4LA, England, was formed in 1978. NIM is an indirect subsidiary of BNY Mellon.
BNY Mellon Securities Corporation (the “Distributor”), a wholly-owned subsidiary of the Adviser, is the distributor of the fund’s shares. The fund is authorized to issue 800 million shares of $.001 par value Common Stock. The fund currently has authorized four classes of shares: Class A (300 million shares authorized), Class C (100 million shares authorized), Class I (250 million shares authorized), and Class Y (150 million shares authorized). Class A and Class C shares are sold primarily to retail investors through financial intermediaries and bear Distribution and/or Shareholder Services Plan fees. Class A shares generally are subject to a sales charge imposed at the time of purchase. Class A shares bought without an initial sales charge as part of an investment of $1 million or more may be charged a contingent deferred sales charge (“CDSC”) of 1.00% if redeemed within one year. Class C shares are subject to a CDSC imposed on Class C shares redeemed within one year of purchase. Class C shares automatically convert to Class A shares eight years after the date of purchase, without the imposition of a sales charge. Class I shares are sold primarily to bank trust departments and other financial service providers (including BNY Mellon and its affiliates), acting on behalf of customers having a qualified trust or an investment account or relationship at such
22
institution, and bear no Distribution or Shareholder Services Plan fees. Class Y shares are sold at net asset value per share generally to institutional investors, and bear no Distribution or Shareholder Services Plan fees. Class I and Class Y shares are offered without a front-end sales charge or CDSC. Other differences between the classes include the services offered to and the expenses borne by each class, the allocation of certain transfer agency costs and certain voting rights. Income, expenses (other than expenses attributable to a specific class), and realized and unrealized gains or losses on investments are allocated to each class of shares based on its relative net assets.
The Company accounts separately for the assets, liabilities and operations of each series. Expenses directly attributable to each series are charged to that series’ operations; expenses which are applicable to all series are allocated among them on a pro rata basis.
The Financial Accounting Standards Board (“FASB”) Accounting Standards Codification (“ASC”) is the exclusive reference of authoritative U.S. generally accepted accounting principles (“GAAP”) recognized by the FASB to be applied by nongovernmental entities. Rules and interpretive releases of the SEC under authority of federal laws are also sources of authoritative GAAP for SEC registrants. The fund is an investment company and applies the accounting and reporting guidance of the FASB ASC Topic 946 Financial Services-Investment Companies. The fund’s financial statements are prepared in accordance with GAAP, which may require the use of management estimates and assumptions. Actual results could differ from those estimates.
The Company enters into contracts that contain a variety of indemnifications. The fund’s maximum exposure under these arrangements is unknown. The fund does not anticipate recognizing any loss related to these arrangements.
(a) Portfolio valuation: The fair value of a financial instrument is the amount that would be received to sell an asset or paid to transfer a liability in an orderly transaction between market participants at the measurement date (i.e., the exit price). GAAP establishes a fair value hierarchy that prioritizes the inputs of valuation techniques used to measure fair value. This hierarchy gives the highest priority to unadjusted quoted prices in active markets for identical assets or liabilities (Level 1 measurements) and the lowest priority to unobservable inputs (Level 3 measurements).
Additionally, GAAP provides guidance on determining whether the volume and activity in a market has decreased significantly and whether such a decrease in activity results in transactions that are not orderly.
23
NOTES TO FINANCIAL STATEMENTS (continued)
GAAP requires enhanced disclosures around valuation inputs and techniques used during annual and interim periods.
Various inputs are used in determining the value of the fund’s investments relating to fair value measurements. These inputs are summarized in the three broad levels listed below:
Level 1—unadjusted quoted prices in active markets for identical investments.
Level 2—other significant observable inputs (including quoted prices for similar investments, interest rates, prepayment speeds, credit risk, etc.).
Level 3—significant unobservable inputs (including the fund’s own assumptions in determining the fair value of investments).
The inputs or methodology used for valuing securities are not necessarily an indication of the risk associated with investing in those securities.
Changes in valuation techniques may result in transfers in or out of an assigned level within the disclosure hierarchy. Valuation techniques used to value the fund’s investments are as follows:
The Company’s Board of Directors (the “Board”) has designated the Adviser as the fund’s valuation designee, effective September 8, 2022, to make all fair value determinations with respect to the fund’s portfolio investments, subject to the Board’s oversight and pursuant to Rule 2a-5 under the Act.
Investments in equity securities are valued at the last sales price on the securities exchange or national securities market on which such securities are primarily traded. Securities listed on the National Market System for which market quotations are available are valued at the official closing price or, if there is no official closing price that day, at the last sales price. For open short positions, asked prices are used for valuation purposes. Bid price is used when no asked price is available. Registered investment companies that are not traded on an exchange are valued at their net asset value. All of the preceding securities are generally categorized within Level 1 of the fair value hierarchy.
Securities not listed on an exchange or the national securities market, or securities for which there were no transactions, are valued at the average of the most recent bid and asked prices. These securities are generally categorized within Level 2 of the fair value hierarchy.
Fair valuing of securities may be determined with the assistance of a pricing service using calculations based on indices of domestic securities
24
and other appropriate indicators, such as prices of relevant ADRs and futures. Utilizing these techniques may result in transfers between Level 1 and Level 2 of the fair value hierarchy.
When market quotations or official closing prices are not readily available, or are determined not to accurately reflect fair value, such as when the value of a security has been significantly affected by events after the close of the exchange or market on which the security is principally traded (for example, a foreign exchange or market), but before the fund calculates its net asset value, the fund may value these investments at fair value as determined in accordance with the procedures approved by the Board. Certain factors may be considered when fair valuing investments such as: fundamental analytical data, the nature and duration of restrictions on disposition, an evaluation of the forces that influence the market in which the securities are purchased and sold, and public trading in similar securities of the issuer or comparable issuers. These securities are either categorized within Level 2 or 3 of the fair value hierarchy depending on the relevant inputs used.
For securities where observable inputs are limited, assumptions about market activity and risk are used and such securities are generally categorized within Level 3 of the fair value hierarchy.
Investments denominated in foreign currencies are translated to U.S. dollars at the prevailing rates of exchange.
The following is a summary of the inputs used as of August 31, 2023 in valuing the fund’s investments:
| | | | | | | |
| | Level 1-Unadjusted Quoted Prices | Level 2- Other Significant Observable Inputs | | Level 3-Significant Unobservable Inputs | Total | |
Assets ($) | | |
Investments in Securities:† | | |
Equity Securities - Common Stocks | 3,142,622,179 | - | | - | 3,142,622,179 | |
Investment Companies | 44,146,863 | - | | - | 44,146,863 | |
† See Statement of Investments for additional detailed categorizations, if any.
(b) Foreign currency transactions: The fund does not isolate that portion of the results of operations resulting from changes in foreign exchange rates on investments from the fluctuations arising from changes in the market prices of securities held. Such fluctuations are included with the net realized and unrealized gain or loss on investments.
25
NOTES TO FINANCIAL STATEMENTS (continued)
Net realized foreign exchange gains or losses arise from sales of foreign currencies, currency gains or losses realized on securities transactions between trade and settlement date, and the difference between the amounts of dividends, interest and foreign withholding taxes recorded on the fund’s books and the U.S. dollar equivalent of the amounts actually received or paid. Net unrealized foreign exchange gains and losses arise from changes in the value of assets and liabilities other than investments resulting from changes in exchange rates. Foreign currency gains and losses on foreign currency transactions are also included with net realized and unrealized gain or loss on investments.
Foreign taxes: The fund may be subject to foreign taxes (a portion of which may be reclaimable) on income, stock dividends, realized and unrealized capital gains on investments or certain foreign currency transactions. Foreign taxes are recorded in accordance with the applicable foreign tax regulations and rates that exist in the foreign jurisdictions in which the fund invests. These foreign taxes, if any, are paid by the fund and are reflected in the Statement of Operations, if applicable. Foreign taxes payable or deferred or those subject to reclaims as of August 31, 2023, if any, are disclosed in the fund’s Statement of Assets and Liabilities.
(c) Securities transactions and investment income: Securities transactions are recorded on a trade date basis. Realized gains and losses from securities transactions are recorded on the identified cost basis. Dividend income is recognized on the ex-dividend date and interest income, including, where applicable, accretion of discount and amortization of premium on investments, is recognized on the accrual basis.
Pursuant to a securities lending agreement with BNY Mellon, the fund may lend securities to qualified institutions. It is the fund’s policy that, at origination, all loans are secured by collateral of at least 102% of the value of U.S. securities loaned and 105% of the value of foreign securities loaned. Collateral equivalent to at least 100% of the market value of securities on loan is maintained at all times. Collateral is either in the form of cash, which can be invested in certain money market mutual funds managed by the Adviser, or U.S. Government and Agency securities. The fund is entitled to receive all dividends, interest and distributions on securities loaned, in addition to income earned as a result of the lending transaction. Should a borrower fail to return the securities in a timely manner, BNY Mellon is required to replace the securities for the benefit of the fund or credit the fund with the market value of the unreturned securities and is subrogated to the fund’s rights against the borrower and the collateral. Additionally, the contractual maturity of security lending
26
transactions are on an overnight and continuous basis. During the period ended August 31, 2023, BNY Mellon earned $70,423 from the lending of the fund’s portfolio securities, pursuant to the securities lending agreement.
(d) Affiliated issuers: Investments in other investment companies advised by the Adviser are considered “affiliated” under the Act.
(e) Market Risk: The value of the securities in which the fund invests may be affected by political, regulatory, economic and social developments, and developments that impact specific economic sectors, industries or segments of the market. The value of a security may also decline due to general market conditions that are not specifically related to a particular company or industry, such as real or perceived adverse economic conditions, changes in the general outlook for corporate earnings, changes in interest or currency rates, changes to inflation, adverse changes to credit markets or adverse investor sentiment generally. In addition, turbulence in financial markets and reduced liquidity in equity, credit and/or fixed-income markets may negatively affect many issuers, which could adversely affect the fund. Global economies and financial markets are becoming increasingly interconnected, and conditions and events in one country, region or financial market may adversely impact issuers in a different country, region or financial market. These risks may be magnified if certain events or developments adversely interrupt the global supply chain; in these and other circumstances, such risks might affect companies world-wide.
Foreign Investment Risk: To the extent the fund invests in foreign securities, the fund’s performance will be influenced by political, social and economic factors affecting investments in foreign issuers. Special risks associated with investments in foreign issuers include exposure to currency fluctuations, less liquidity, less developed or less efficient trading markets, lack of comprehensive company information, political and economic instability and differing auditing and legal standards.
(f) Dividends and distributions to shareholders: Dividends and distributions are recorded on the ex-dividend date. Dividends from net investment income and dividends from net realized capital gains, if any, are normally declared and paid annually, but the fund may make distributions on a more frequent basis to comply with the distribution requirements of the Internal Revenue Code of 1986, as amended (the “Code”). To the extent that net realized capital gains can be offset by capital loss carryovers, it is the policy of the fund not to distribute such gains. Income and capital gain distributions are determined in accordance with income tax regulations, which may differ from GAAP.
27
NOTES TO FINANCIAL STATEMENTS (continued)
(g) Federal income taxes: It is the policy of the fund to continue to qualify as a regulated investment company, if such qualification is in the best interests of its shareholders, by complying with the applicable provisions of the Code, and to make distributions of taxable income and net realized capital gain sufficient to relieve it from substantially all federal income and excise taxes.
As of and during the period ended August 31, 2023, the fund did not have any liabilities for any uncertain tax positions. The fund recognizes interest and penalties, if any, related to uncertain tax positions as income tax expense in the Statement of Operations. During the period ended August 31, 2023, the fund did not incur any interest or penalties.
Each tax year in the four-year period ended August 31, 2023 remains subject to examination by the Internal Revenue Service and state taxing authorities.
At August 31, 2023, the components of accumulated earnings on a tax basis were as follows: undistributed ordinary income $22,773,285, undistributed capital gains $125,265,653 and unrealized appreciation $322,849,010.
The tax character of distributions paid to shareholders during the fiscal years ended August 31, 2023 and August 31, 2022 were as follows: ordinary income $41,551,859 and $102,630,678, and long-term capital gains $157,301,140 and $235,005,727, respectively.
NOTE 2—Bank Lines of Credit:
The fund participates with other long-term open-end funds managed by the Adviser in a $823.5 million unsecured credit facility led by Citibank, N.A. (the “Citibank Credit Facility”) and a $300 million unsecured credit facility provided by BNY Mellon (the “BNYM Credit Facility”), each to be utilized primarily for temporary or emergency purposes, including the financing of redemptions (each, a “Facility”). The Citibank Credit Facility is available in two tranches: (i) Tranche A is in an amount equal to $688.5 million and is available to all long-term open-ended funds, including the fund, and (ii) Tranche B is an amount equal to $135 million and is available only to BNY Mellon Floating Rate Income Fund, a series of BNY Mellon Investment Funds IV, Inc. In connection therewith, the fund has agreed to pay its pro rata portion of commitment fees for Tranche A of the Citibank Credit Facility and the BNYM Credit Facility. Interest is charged to the fund based on rates determined pursuant to the terms of the respective Facility at the time of borrowing.
28
During the period ended August 31, 2023, the fund was charged $24,143 for interest expense. These fees are included in Interest expense in the Statement of Operations. The average amount of borrowings outstanding under the Facilities during the period ended August 31, 2023 was approximately $423,288 with a related weighted average annualized interest rate of 5.70%.
NOTE 3—Management Fee, Sub-Advisory Fee and Other Transactions with Affiliates:
(a) Pursuant to a management agreement with the Adviser the management fee is computed at the annual rate of .60% of the value of the fund’s average daily net assets and is payable monthly. The Adviser has contractually agreed, from September 1, 2022 through December 30, 2023, to waive receipt of its fees and/or assume the direct expenses of the fund so that the direct expenses of none of the fund’s share classes (excluding Rule 12b-1 Distribution plan fees, Shareholder Services plan fees, taxes, interest expense, brokerage commissions, commitment fees on borrowings and extraordinary expenses) exceed .68% of the value of the fund’s average daily net assets. On or after December 30, 2023, the Adviser may terminate this expense limitation agreement at any time. The reduction in expenses, pursuant to the undertaking amounted to $639,847 during the period ended August 31, 2023.
Pursuant to a sub-investment advisory agreement between the Adviser and the Sub-Adviser, the Adviser pays the Sub-Adviser a monthly fee at an annual rate of .288% of the value of the fund’s average daily net assets.
During the period ended August 31, 2023, the Distributor retained $84,385 from commissions earned on sales of the fund’s Class A shares, $2,963 and $17,433 from CDSC fees on redemptions of the fund’s Class A and Class C shares, respectively.
(b) Under the Distribution Plan adopted pursuant to Rule 12b-1 under the Act, Class C shares pay the Distributor for distributing its shares at an annual rate of .75% of the value of its average daily net assets. The Distributor may pay one or more Service Agents in respect of advertising, marketing and other distribution services, and determines the amounts, if any, to be paid to Service Agents and the basis on which such payments are made. During the period ended August 31, 2023, Class C shares were charged $184,668 pursuant to the Distribution Plan.
(c) Under the Shareholder Services Plan, Class A and Class C shares pay the Distributor at an annual rate of .25% of the value of their average daily net assets for the provision of certain services. The services provided may include personal services relating to shareholder accounts, such as
29
NOTES TO FINANCIAL STATEMENTS (continued)
answering shareholder inquiries regarding the fund, and services related to the maintenance of shareholder accounts. The Distributor may make payments to Service Agents (securities dealers, financial institutions or other industry professionals) with respect to these services. The Distributor determines the amounts to be paid to Service Agents. During the period ended August 31, 2023, Class A and Class C shares were charged $2,442,860 and $61,556, respectively, pursuant to the Shareholder Services Plan.
The fund has an arrangement with BNY Mellon Transfer, Inc., (the “Transfer Agent”), a subsidiary of BNY Mellon and an affiliate of the Adviser, whereby the fund may receive earnings credits when positive cash balances are maintained, which are used to offset Transfer Agent fees. For financial reporting purposes, the fund includes transfer agent net earnings credits, if any, as an expense offset in the Statement of Operations.
The fund has an arrangement with The Bank of New York Mellon (the “Custodian”), a subsidiary of BNY Mellon and an affiliate of the Adviser, whereby the fund will receive interest income or be charged overdraft fees when cash balances are maintained. For financial reporting purposes, the fund includes this interest income and overdraft fees, if any, as interest income in the Statement of Operations.
The fund compensates the Transfer Agent, under a transfer agency agreement, for providing transfer agency and cash management services for the fund. The majority of Transfer Agent fees are comprised of amounts paid on a per account basis, while cash management fees are related to fund subscriptions and redemptions. During the period ended August 31, 2023, the fund was charged $164,425 for transfer agency services. These fees are included in Shareholder servicing costs in the Statement of Operations. These fees were partially offset by earnings credits of $142,557.
The fund compensates the Custodian, under a custody agreement, for providing custodial services for the fund. These fees are determined based on net assets, geographic region and transaction activity. During the period ended August 31, 2023, the fund was charged $65,514 pursuant to the custody agreement.
During the period ended August 31, 2023, the fund was charged $21,224 for services performed by the fund’s Chief Compliance Officer and his staff. These fees are included in Chief Compliance Officer fees in the Statement of Operations.
The components of “Due to BNY Mellon Investment Adviser, Inc. and affiliates” in the Statement of Assets and Liabilities consist of: management
30
fee of $1,600,768, Distribution Plan fees of $20,770, Shareholder Services plan fees of $223,691, Custodian fees of $16,800 and Chief Compliance Officer fees of $3,833, which are offset against an expense reimbursement currently in effect in the amount of $53,721.
(d) Each board member also serves as a board member of other funds in the BNY Mellon Family of Funds complex. Annual retainer fees and attendance fees are allocated to each fund based on net assets.
NOTE 4—Securities Transactions:
The aggregate amount of purchases and sales of investment securities, excluding short-term securities, during the period ended August 31, 2023, amounted to $3,695,554,743 and $2,748,676,968, respectively.
At August 31, 2023, the cost of investments for federal income tax purposes was $2,863,921,440; accordingly, accumulated net unrealized appreciation on investments was $322,847,602, consisting of $382,610,410 gross unrealized appreciation and $59,762,808 gross unrealized depreciation.
31
REPORT OF INDEPENDENT REGISTERED PUBLIC ACCOUNTING FIRM
To the Shareholders and the Board of Directors of BNY Mellon Dynamic Value Fund
Opinion on the Financial Statements
We have audited the accompanying statement of assets and liabilities of BNY Mellon Dynamic Value Fund (the “Fund”) (one of the funds constituting BNY Mellon Advantage Funds, Inc. (the “Company”)), including the statement of investments, as of August 31, 2023, and the related statement of operations for the year then ended, the statements of changes in net assets for each of the two years in the period then ended, the financial highlights for each of the five years in the period then ended and the related notes (collectively referred to as the “financial statements”). In our opinion, the financial statements present fairly, in all material respects, the financial position of the Fund (one of the funds constituting BNY Mellon Advantage Funds, Inc.) at August 31, 2023, the results of its operations for the year then ended, the changes in its net assets for each of the two years in the period then ended and its financial highlights for each of the five years in the period then ended, in conformity with U.S. generally accepted accounting principles.
Basis for Opinion
These financial statements are the responsibility of the Company’s management. Our responsibility is to express an opinion on the Fund’s financial statements based on our audits. We are a public accounting firm registered with the Public Company Accounting Oversight Board (United States) (“PCAOB”) and are required to be independent with respect to the Company in accordance with the U.S. federal securities laws and the applicable rules and regulations of the Securities and Exchange Commission and the PCAOB.
We conducted our audits in accordance with the standards of the PCAOB. Those standards require that we plan and perform the audit to obtain reasonable assurance about whether the financial statements are free of material misstatement, whether due to error or fraud. The Company is not required to have, nor were we engaged to perform, an audit of the Company’s internal control over financial reporting. As part of our audits, we are required to obtain an understanding of internal control over financial reporting but not for the purpose of expressing an opinion on the effectiveness of the Company’s internal control over financial reporting. Accordingly, we express no such opinion.
Our audits included performing procedures to assess the risks of material misstatement of the financial statements, whether due to error or fraud, and performing procedures that respond to those risks. Such procedures included examining, on a test basis, evidence regarding the amounts and disclosures in the financial statements. Our procedures included confirmation of securities owned as of August 31, 2023, by correspondence with the custodian, brokers and others; when replies were not received from brokers and others, we performed other auditing procedures. Our audits also included evaluating the accounting principles used and significant estimates made by management, as well as evaluating the overall presentation of the financial statements. We believe that our audits provide a reasonable basis for our opinion.

We have served as the auditor of one or more investment companies in the BNY Mellon Family of Funds since at least 1957, but we are unable to determine the specific year.
New York, New York
October 23, 2023
32
IMPORTANT TAX INFORMATION (Unaudited)
For federal tax purposes, the fund hereby reports 65.79% of the ordinary dividends paid during the fiscal year ended August 31, 2023 as qualifying for the corporate dividends received deduction. Also certain dividends paid by the fund may be subject to a maximum tax rate of 15%, as provided for by the Jobs and Growth Tax Relief Reconciliation Act of 2003. Of the distributions paid during the fiscal year, $29,169,517 represents the maximum amount that may be considered qualified dividend income. The fund also hereby reports $.417 per share as a short-term capital gain distribution and $2.8456 per share as a long-term capital gain distribution paid on December 6, 2022. Shareholders will receive notification in early 2024 of the percentage applicable to the preparation of their 2023 income tax returns.
33
INFORMATION ABOUT THE RENEWAL OF THE FUND’S MANAGEMENT AND SUB-INVESTMENT ADVISORY AGREEMENTS AND THE APPROVAL OF THE FUND’S SUB- SUB-INVESTMENT ADVISORY AGREEMENT (Unaudited)
At a meeting of the fund’s Board of Directors held on March 14-15, 2023, the Board considered the renewal of the fund’s Management Agreement, pursuant to which the Adviser provides the fund with investment advisory and administrative services, and the Sub-Investment Advisory Agreement (together with the Management Agreement, the “Agreements”), pursuant to which Newton Investment Management North America, LLC (the “Sub-Adviser” or “NIMNA”) provides day-to-day management of the fund’s investments. The Board members, none of whom are “interested persons” (as defined in the Investment Company Act of 1940, as amended (the “1940 Act”)) of the fund, were assisted in their review by independent legal counsel and met with counsel in executive session separate from representatives of the Adviser and the Sub-Adviser. In considering the renewal of the Agreements, the Board considered several factors that it believed to be relevant, including those discussed below. The Board did not identify any one factor as dispositive, and each Board member may have attributed different weights to the factors considered.
Analysis of Nature, Extent, and Quality of Services Provided to the Fund. The Board considered information provided to it at the meeting and in previous presentations from representatives of the Adviser regarding the nature, extent, and quality of the services provided to funds in the BNY Mellon fund complex, including the fund. The Adviser provided the number of open accounts in the fund, the fund’s asset size and the allocation of fund assets among distribution channels. The Adviser also had previously provided information regarding the diverse intermediary relationships and distribution channels of funds in the BNY Mellon fund complex (such as retail direct or intermediary, in which intermediaries typically are paid by the fund and/or the Adviser) and the Adviser’s corresponding need for broad, deep, and diverse resources to be able to provide ongoing shareholder services to each intermediary or distribution channel, as applicable to the fund.
The Board also considered research support available to, and portfolio management capabilities of, the fund’s portfolio management personnel and that the Adviser also provides oversight of day-to-day fund operations, including fund accounting and administration and assistance in meeting legal and regulatory requirements. The Board also considered the Adviser’s extensive administrative, accounting and compliance infrastructures, as well as the Adviser’s supervisory activities over the Sub-Adviser. The Board also considered portfolio management’s brokerage policies and practices (including policies and practices regarding soft dollars) and the standards applied in seeking best execution.
Comparative Analysis of the Fund’s Performance and Management Fee and Expense Ratio. The Board reviewed reports prepared by Broadridge Financial Solutions, Inc. (“Broadridge”), an independent provider of investment company data based on classifications provided by Thomson Reuters Lipper (“Lipper”), which included information comparing (1) the performance of the fund’s Class I shares with the
34
performance of a group of institutional multi-cap value funds selected by Broadridge as comparable to the fund (the “Performance Group”) and with a broader group of funds consisting of all retail and institutional multi-cap value funds (the “Performance Universe”), all for various periods ended December 31, 2022, and (2) the fund’s actual and contractual management fees and total expenses with those of the same group of funds in the Performance Group (the “Expense Group”) and with a broader group of all institutional multi-cap value funds, excluding outliers (the “Expense Universe”), the information for which was derived in part from fund financial statements available to Broadridge as of the date of its analysis. The Adviser previously had furnished the Board with a description of the methodology Broadridge used to select the Performance Group and Performance Universe and the Expense Group and Expense Universe.
Performance Comparisons. Representatives of the Adviser stated that the usefulness of performance comparisons may be affected by a number of factors, including different investment limitations and policies that may be applicable to the fund and comparison funds and the end date selected. The Board also considered the fund’s performance in light of overall financial market conditions. The Board discussed with representatives of the Adviser and the Sub-Adviser the results of the comparisons and considered that the fund’s total return performance was above the Performance Group and Performance Universe medians, and ranked in the first quartile for all periods and ranked first in the Performance Group for the one-, three- four- and ten-year periods. The Adviser also provided a comparison of the fund’s calendar year total returns to the returns of the fund’s benchmark index, and it was noted that the fund’s returns were above the returns of the index in eight of the ten calendar years shown. The Board noted that the fund had a five star rating for each of the three- and ten-year periods and a five star overall rating from Morningstar based on Morningstar’s risk-adjusted return measures.
Management Fee and Expense Ratio Comparisons. The Board reviewed and considered the contractual management fee rate payable by the fund to the Adviser in light of the nature, extent and quality of the management services and the sub-advisory services provided by the Adviser and the Sub-Adviser, respectively. In addition, the Board reviewed and considered the actual management fee rate paid by the fund over the fund’s last fiscal year, which included reductions for a fee waiver arrangement in place that reduced the management fee paid to the Adviser. The Board also reviewed the range of actual and contractual management fees and total expenses as a percentage of average net assets of the Expense Group and Expense Universe funds and discussed the results of the comparisons.
The Board considered that the fund’s contractual management fee was lower than the Expense Group median contractual management fee, the fund’s actual management fee was lower than the Expense Group median and equal to the Expense Universe median actual management fee, and the fund’s total expenses were lower than the Expense Group median and lower than the Expense Universe median total expenses.
Representatives of the Adviser stated that the Adviser has contractually agreed, until December 30, 2023, to waive receipt of its fees and/or assume the direct expenses of the fund so that the direct expenses of none of the fund’s share classes (excluding Rule
35
INFORMATION ABOUT THE RENEWAL OF THE FUND’S MANAGEMENT AND SUB-INVESTMENT ADVISORY AGREEMENTS AND THE APPROVAL OF THE FUND’S SUB- SUB-INVESTMENT ADVISORY AGREEMENT (Unaudited) (continued)
12b-1 fees, shareholder services fees, taxes, interest, brokerage commissions, commitment fees on borrowings and extraordinary expenses) exceed .68% of the fund’s average daily net assets.
Representatives of the Adviser reviewed with the Board the management or investment advisory fees paid to the Adviser or the Sub-Adviser or its affiliates for advising any separate accounts and/or other types of client portfolios that are considered to have similar investment strategies and policies as the fund (the “Similar Clients”), and explained the nature of the Similar Clients. They discussed differences in fees paid and the relationship of the fees paid in light of any differences in the services provided and other relevant factors. The Board considered the relevance of the fee information provided for the Similar Clients to evaluate the appropriateness of the fund’s management fee. Representatives of the Adviser noted that there were no other funds advised by the Adviser that are in the same Lipper category as the fund.
The Board considered the fee payable to the Sub-Adviser in relation to the fee payable to the Adviser by the fund and the respective services provided by the Sub-Adviser and the Adviser. The Board also took into consideration that the Sub-Adviser’s fee is paid by the Adviser, out of its fee from the fund, and not the fund.
Analysis of Profitability and Economies of Scale. Representatives of the Adviser reviewed the expenses allocated and profit received by the Adviser and its affiliates and the resulting profitability percentage for managing the fund and the aggregate profitability percentage to the Adviser and its affiliates for managing the funds in the BNY Mellon fund complex, and the method used to determine the expenses and profit. The Board concluded that the profitability results were not excessive, given the services rendered and service levels provided by the Adviser and its affiliates. The Board also considered the expense limitation arrangement and its effect on the profitability of the Adviser and its affiliates. The Board also had been provided with information prepared by an independent consulting firm regarding the Adviser’s approach to allocating costs to, and determining the profitability of, individual funds and the entire BNY Mellon fund complex. The consulting firm also had analyzed where any economies of scale might emerge in connection with the management of a fund.
The Board considered, on the advice of its counsel, the profitability analysis (1) as part of its evaluation of whether the fees under the Agreements, considered in relation to the mix of services provided by the Adviser and the Sub-Adviser, including the nature, extent and quality of such services, supported the renewal of the Agreements and (2) in light of the relevant circumstances for the fund and the extent to which economies of scale would be realized if the fund grows and whether fee levels reflect these economies of scale for the benefit of fund shareholders. Since the Adviser, and not the fund, pays the Sub-Adviser pursuant to the Sub-Investment Advisory Agreement, the Board did not consider the Sub-Adviser’s profitability to be relevant to its deliberations. Representatives of the Adviser also stated that, as a result of shared and allocated costs among funds in the BNY Mellon fund complex, the extent of economies of scale could depend substantially on the level of assets in the complex as a whole, so that increases and decreases in complex-wide assets can affect potential economies of scale in a
36
manner that is disproportionate to, or even in the opposite direction from, changes in the fund’s asset level. The Board also considered potential benefits to the Adviser and the Sub-Adviser from acting as investment adviser and sub-investment adviser, respectively, and took into consideration the soft dollar arrangements in effect for trading the fund’s investments.
At the conclusion of these discussions, the Board agreed that it had been furnished with sufficient information to make an informed business decision with respect to the renewal of the Agreements. Based on the discussions and considerations as described above, the Board concluded and determined as follows.
· The Board concluded that the nature, extent and quality of the services provided by the Adviser and the Sub-Adviser are adequate and appropriate.
· The Board was satisfied with the fund’s performance.
· The Board concluded that the fees paid to the Adviser and the Sub-Adviser continued to be appropriate under the circumstances and in light of the factors and the totality of the services provided as discussed above.
· The Board determined that the economies of scale which may accrue to the Adviser and its affiliates in connection with the management of the fund had been adequately considered by the Adviser in connection with the fee rate charged to the fund pursuant to the Management Agreement and that, to the extent in the future it were determined that material economies of scale had not been shared with the fund, the Board would seek to have those economies of scale shared with the fund.
In evaluating the Agreements, the Board considered these conclusions and determinations and also relied on its previous knowledge, gained through meetings and other interactions with the Adviser and its affiliates and the Sub-Adviser, of the Adviser and the Sub-Adviser and the services provided to the fund by the Adviser and the Sub-Adviser. The Board also relied on information received on a routine and regular basis throughout the year relating to the operations of the fund and the investment management and other services provided under the Agreements, including information on the investment performance of the fund in comparison to similar mutual funds and benchmark performance indices; general market outlook as applicable to the fund; and compliance reports. In addition, the Board’s consideration of the contractual fee arrangements for the fund had the benefit of a number of years of reviews of the Agreements for the fund, or substantially similar agreements for other BNY Mellon funds that the Board oversees, during which lengthy discussions took place between the Board and representatives of the Adviser. Certain aspects of the arrangements may receive greater scrutiny in some years than in others, and the Board’s conclusions may be based, in part, on its consideration of the fund’s arrangements, or substantially similar arrangements for other BNY Mellon funds that the Board oversees, in prior years. The Board determined to renew the Agreements.
*******
37
INFORMATION ABOUT THE RENEWAL OF THE FUND’S MANAGEMENT AND SUB-INVESTMENT ADVISORY AGREEMENTS AND THE APPROVAL OF THE FUND’S SUB- SUB-INVESTMENT ADVISORY AGREEMENT (Unaudited) (continued)
At the meeting of the fund’s Board held on March 14-15, 2023, the Board also considered the approval of a delegation arrangement between NIMNA and its affiliate, Newton Investment Management Limited (“NIM”), which permits NIMNA, as the fund’s sub-investment adviser, to use the investment advisory personnel, resources and capabilities (“Investment Advisory Services”) available at its sister company, NIM, in providing the day-to-day management of the fund’s investments. In connection therewith, the Board considered the approval of a sub-sub-investment advisory agreement (the “SSIA Agreement”) between NIMNA and NIM, with respect to the fund. In considering the approval of the SSIA Agreement, the Board considered several factors that it believed to be relevant, including those discussed below. The Board did not identify any one factor as dispositive, and each Board member may have attributed different weights to the factors considered.
At the meeting, the Adviser and the Sub-Adviser recommended the approval of the SSIA Agreement to enable NIM to provide Investment Advisory Services to the Sub-Adviser for the benefit of the fund, including, but not limited to, portfolio management services, subject to the supervision of the Sub-Adviser and the Adviser. The recommendation for the approval of the SSIA Agreement was based on the following considerations, among others: (i) approval of the SSIA Agreement would permit the Sub-Adviser to use investment personnel employed primarily by NIM as primary portfolio managers of the fund and to use the investment research services of NIM in the day-to-day management of the fund’s investments; and (ii) there would be no material changes to the fund’s investment objective, strategies or policies, no reduction in the nature or level of services provided to the fund, and no increases in the management fee payable by the fund or the sub-advisory fee payable by the Adviser to the Sub-Adviser as a result of the delegation arrangement. The Board also considered the fact that the Adviser stated that it believed there were no material changes to the information the Board had previously considered at the meeting in connection with the Board’s re-approval of the Agreements for the ensuing year, other than the information about the delegation arrangement and NIM.
In determining whether to approve the SSIA Agreement, the Board considered the materials prepared by the Adviser and the Sub-Adviser received in advance of the meeting and other information presented at the meeting, which included: (i) a form of the SSIA Agreement; (ii) information regarding the delegation arrangement and how it is expected to enhance investment capabilities for the benefit of the fund; (iii) information regarding NIM; and (iv) an opinion of counsel that the proposed delegation arrangement would not result in an “assignment” of the Sub-Investment Advisory Agreement under the 1940 Act and the Investment Advisers Act of 1940, as amended, and, therefore, did not require the approval of fund shareholders. The Board also considered the substance of discussions with representatives of the Adviser and the Sub-Adviser at the meeting in connection with the Board’s re-approval of the Agreements.
Nature, Extent and Quality of Services to be Provided. In examining the nature, extent and quality of the services that were expected to be provided by NIM under the SSIA
38
Agreement, the Board considered: (i) NIM’s organization, qualification and background, as well as the qualifications of its personnel; (ii) the expertise of the personnel providing portfolio management services; (iii) information regarding NIM’s compliance program; and (iv) the investment strategy for the fund, which would remain the same. The Board also considered that enabling the Sub-Adviser to use the proposed Investment Advisory Services provided by NIM, the Sub-Adviser would provide investment and portfolio management services of at least the same nature, extent and quality that it currently provides to the fund without the ability to use the Investment Advisory Services of its sister company. Based on the considerations and review of the foregoing information, the Board concluded that the nature, extent and quality of the sub-investment advisory services to be provided by the Sub-Adviser having the ability to use the Investment Advisory Services supported a decision to approve the SSIA Agreement.
Investment Performance. The Board considered the fund’s investment performance and that of the investment team managing the fund’s portfolio (including comparative data provided by Broadridge) at the meeting in connection with the Board’s re-approval of the Agreements. The Board considered that the same investment professionals would continue to manage the fund’s assets and that enabling the Sub-Adviser to use the Investment Advisory Services pursuant to the SSIA Agreement for the benefit of the fund supported a decision to approve the SSIA Agreement.
Costs of Services to be Provided and Profitability. The Board considered the contractual management fee payable by the fund to the Adviser pursuant to the Management Agreement and the contractual sub-investment advisory fee payable by the Adviser to the Sub-Adviser pursuant to the Sub-Investment Advisory Agreement at the meeting in connection with the Board’s re-approval of the Agreements. The Board noted that the contractual management fee payable by the fund to the Adviser and the sub-investment advisory fee payable by the Adviser to the Sub-Adviser, would not change in connection with the proposed delegation arrangement. The Board recognized that, because the fees payable would not change, an analysis of profitability was more appropriate in the context of the Board’s consideration of the Agreements, and that the Board had received and considered a profitability analysis of the Adviser and its affiliates, including NIMNA, at the meeting in connection with the Board’s re-approval of the Agreements. The Board concluded that the Adviser’s profitability was not excessive in light of the nature, extent and quality of the services to be provided to the fund by the Adviser and the Sub-Adviser under the Agreements.
Economies of Scale to be Realized. The Board recognized that, because the fees payable by the fund to the Adviser pursuant to the Management Agreement and the contractual sub-investment advisory fee payable by the Adviser to the Sub-Adviser pursuant to the Sub-Investment Advisory Agreement would not change in connection with the proposed delegation arrangement, an analysis of economies of scale was more appropriate in the context of the Board’s consideration of the Agreements, which had been done at the meeting in connection with the Board’s re-approval of the Agreements. At the meeting, the Board determined that the economies of scale which may accrue to the Adviser and its affiliates in connection with the management of the
39
INFORMATION ABOUT THE RENEWAL OF THE FUND’S MANAGEMENT AND SUB-INVESTMENT ADVISORY AGREEMENTS AND THE APPROVAL OF THE FUND’S SUB- SUB-INVESTMENT ADVISORY AGREEMENT (Unaudited) (continued)
fund had been adequately considered by the Adviser in connection with the fee rate charged to the fund pursuant to the Agreements and that, to the extent in the future it were determined that material economies of scale had not been shared with the fund, the Board would seek to have those economies of scale shared with the fund.
The Board also considered whether there were any ancillary benefits that would accrue to the Sub-Adviser as a result of its relationship with the fund after the delegation arrangement, and such ancillary benefits, if any, were determined to be reasonable.
After full consideration of the factors discussed above, with no single factor identified as being of paramount importance, the Board, with the assistance of independent legal counsel, approved the delegation arrangement and the SSIA Agreement for the fund.
40
LIQUIDITY RISK MANAGEMENT PROGRAM (Unaudited)
The fund adopted a liquidity risk management program (the “Liquidity Risk Management Program”) pursuant to the requirements of Rule 22e-4 under the Investment Company Act of 1940, as amended. Rule 22e-4 requires registered open-end funds, including mutual funds and exchange-traded funds but not money market funds, to establish liquidity risk management programs in order to effectively manage fund liquidity and shareholder redemptions. The rule is designed to mitigate the risk that a fund could not meet redemption requests without significantly diluting the interests of remaining investors.
The rule requires the fund to assess, manage and review their liquidity risk at least annually considering applicable factors such as investment strategy and liquidity during normal and foreseeable stressed conditions, including whether the strategy is appropriate for an open-end fund and whether the fund has a relatively concentrated portfolio or large positions in particular issuers. The fund must also assess its use of borrowings and derivatives, short-term and long-term cash flow projections in normal and stressed conditions, holdings of cash and cash equivalents, and borrowing arrangements and other funding sources.
The rule also requires the fund to classify its investments as highly liquid, moderately liquid, less liquid or illiquid based on the number of days the fund expects it would take to liquidate the investment, and to review these classifications at least monthly or more often under certain conditions. The periods range from three or fewer business days for a highly liquid investment to greater than seven calendar days for settlement of a less liquid investment. Illiquid investments are those a fund does not expect to be able to sell or dispose of within seven calendar days without significantly changing the market value. The fund is prohibited from acquiring an investment if, after the acquisition, its holdings of illiquid assets will exceed 15% of its net assets. In addition, if a fund permits redemptions in-kind, the rule requires the fund to establish redemption in-kind policies and procedures governing how and when it will engage in such redemptions.
Pursuant to the rule’s requirements, the Liquidity Risk Management Program has been reviewed and approved by the Board. Furthermore, the Board has received a written report prepared by the Program’s Administrator that addresses the operation of the Program, assesses its adequacy and effectiveness and describes any material changes made to the Program.
Assessment of Program
In the opinion of the Program Administrator, the Program approved by the Board continues to be adequate for the fund and the Program has been implemented effectively. The Program Administrator has monitored the fund’s liquidity risk and the liquidity classification of the securities held by the fund and has determined that the Program is operating effectively.
During the period from January 1, 2022 to December 31, 2022, there were no material changes to the Program and no material liquidity events that impacted the fund. During the period, the fund held sufficient highly liquid assets to meet fund redemptions.
Under normal expected foreseeable fund redemption forecasts and foreseeable stressed fund redemption forecasts, the Program Administrator believes that the fund maintains sufficient highly liquid assets to meet expected fund redemptions.
41
BOARD MEMBERS INFORMATION (Unaudited)
Independent Board Members
Joseph S. DiMartino (79)
Chairman of the Board (1995)
Principal Occupation During Past 5 Years:
· Director or Trustee of funds in the BNY Mellon Family of Funds and certain other entities (as described in the fund’s Statement of Additional Information) (1995-Present)
Other Public Company Board Memberships During Past 5 Years:
· CBIZ, Inc., a public company providing professional business services, products and solutions, Director (1997-May 2023)
No. of Portfolios for which Board Member Serves: 86
———————
Peggy C. Davis (80)
Board Member (2006)
Principal Occupation During Past 5 Years:
· Shad Professor of Law, New York University School of Law (1983-Present)
No. of Portfolios for which Board Member Serves: 29
———————
Gina D. France (65)
Board Member (2019)
Principal Occupation During Past 5 Years:
· France Strategic Partners, a strategy and advisory firm serving corporate clients across the United States, Founder, President and Chief Executive Officer (2003-Present)
Other Public Company Board Memberships During Past 5 Years:
· Huntington Bancshares, a bank holding company headquartered in Columbus, Ohio, Director (2016-Present)
· Cedar Fair, L.P., a publicly-traded partnership that owns and operates amusement parks and hotels in the U.S. and Canada, Director (2011-May 2023)
· CBIZ, Inc., a public company providing professional business services, products and solutions, Director (2015-Present)
No. of Portfolios for which Board Member Serves: 22
———————
Joan Gulley (75)
Board Member (2017)
Principal Occupation During Past 5 Years:
· Nantucket Atheneum, public library, Chair (June 2018-June 2021) and Director (2015-June 2021)
· Orchard Island Club, golf and beach club, Governor (2016-Present) and President (February 2023-Present)
No. of Portfolios for which Board Member Serves: 39
———————
42
Robin A. Melvin (59)
Board Member (2012)
Principal Occupation During Past 5 Years:
· Westover School, a private girls’ boarding school in Middlebury, Connecticut, Trustee (2019-June 2023)
· Mentor Illinois, a non-profit organization dedicated to increasing the quantity and quality of mentoring services in Illinois, Co-Chair (2014–2020); Board Member (2013-2020)
· JDRF, a non-profit juvenile diabetes research foundation, Board Member (June 2021-June 2022)
Other Public Company Board Memberships During Past 5 Years:
· HPS Corporate Lending Fund, a closed-end management investment company regulated as a business development company, Trustee (August 2021-Present)
No. of Portfolios for which Board Member Serves: 68
———————
Michael D. DiLecce (61)
Advisory Board Member (2022)
Principal Occupation During Past 5 Years:
· Retired since July 2022. Global Asset Management Assurance Leader, Ernst & Young LLP (2015-2022)
· Americas Regional Talent Managing Partner for Ernst & Young’s Financial Service Practice (2017-2021)
· Partner, Ernst & Young LLP (1997-2022)
No. of Portfolios for which Board Member Serves: 22
———————
The address of the Board Members and Officers is c/o BNY Mellon Investment Adviser, Inc., 240 Greenwich Street, New York, New York 10286. Additional information about each Board Member is available in the fund’s Statement of Additional Information which can be obtained from the Adviser free of charge by calling this toll free number: 1-800-373-9387.
43
OFFICERS OF THE FUND (Unaudited)
DAVID DIPETRILLO, President since January 2021.
Vice President and Director of the Adviser since February 2021; Head of North America Distribution, BNY Investment Management since February 2023; and Head of North America Product, BNY Mellon Investment Management from January 2018 to February 2023. He is an officer of 53 investment companies (comprised of 103 portfolios) managed by the Adviser or an affiliate of the Adviser. He is 45 years old and has been an employee of BNY Mellon since 2005.
JAMES WINDELS, Treasurer since November 2001.
Director of the Adviser since February 2023; Vice President of the Adviser since September 2020; and Director–BNY Mellon Fund Administration. He is an officer of 54 investment companies (comprised of 122 portfolios) managed by the Adviser or an affiliate of the Adviser. He is 64 years old and has been an employee of the Adviser since April 1985.
PETER M. SULLIVAN, Chief Legal Officer since July 2021 and Vice President and Assistant Secretary since March 2019.
Chief Legal Officer of the Adviser and Associate General Counsel of BNY Mellon since July 2021; Senior Managing Counsel of BNY Mellon from December 2020 to July 2021; and Managing Counsel of BNY Mellon from March 2009 to December 2020. He is an officer of 54 investment companies (comprised of 122 portfolios) managed by the Adviser or an affiliate of the Adviser. He is 55 years old and has been an employee of BNY Mellon since April 2004.
JAMES BITETTO, Vice President since August 2005 and Secretary since February 2018.
Senior Managing Counsel of BNY Mellon since December 2019; Managing Counsel of BNY Mellon from April 2014 to December 2019; and Secretary of the Adviser. He is an officer of 54 investment companies (comprised of 122 portfolios) managed by the Adviser or an affiliate of the Adviser. He is 57 years old and has been an employee of the Adviser since December 1996.
DEIRDRE CUNNANE, Vice President and Assistant Secretary since March 2019.
Managing Counsel of BNY Mellon since December 2021; and Counsel of BNY Mellon from August 2018 to December 2021. She is an officer of 54 investment companies (comprised of 122 portfolios) managed by the Adviser or an affiliate of the Adviser. She is 33 years old and has been an employee of BNY Mellon since August 2013.
SARAH S. KELLEHER, Vice President and Assistant Secretary since April 2014.
Vice President of BNY Mellon ETF Investment Adviser; LLC since February 2020; Senior Managing Counsel of BNY Mellon since September 2021; and Managing Counsel of BNY Mellon from December 2017 to September 2021. She is an officer of 54 investment companies (comprised of 122 portfolios) managed by the Adviser or an affiliate of the Adviser. She is 47 years old and has been an employee of BNY Mellon since March 2013.
JEFF PRUSNOFSKY, Vice President and Assistant Secretary since August 2005.
Senior Managing Counsel of BNY Mellon. He is an officer of 54 investment companies (comprised of 122 portfolios) managed by the Adviser or an affiliate of the Adviser. He is 58 years old and has been an employee of the Adviser since October 1990.
AMANDA QUINN, Vice President and Assistant Secretary since March 2020.
Counsel of BNY Mellon since June 2019; Regulatory Administration Manager at BNY Mellon Investment Management Services from September 2018 to May 2019; and Senior Regulatory Specialist at BNY Mellon Investment Management Services from April 2015 to August 2018. She is an officer of 54 investment companies (comprised of 122 portfolios) managed by the Adviser or an affiliate of the Adviser. She is 38 years old and has been an employee of BNY Mellon since June 2012.
JOANNE SKERRETT, Vice President and Assistant Secretary since March 2023.
Managing Counsel of BNY Mellon since June 2022; and Senior Counsel with the Mutual Fund Directors Forum, a leading funds industry organization, from 2016 to June 2022. She is an officer of 54 investment companies (comprised of 122 portfolios) managed by the Adviser or an affiliate of the Adviser. She is 51 years old and has been an employee of the Adviser since June 2022.
44
NATALYA ZELENSKY, Vice President and Assistant Secretary since March 2017.
Chief Compliance Officer since August 2021 and Vice President since February 2020 of BNY Mellon ETF Investment Adviser, LLC; Chief Compliance Officer since August 2021 and Vice President and Assistant Secretary since February 2020 of BNY Mellon ETF Trust; Managing Counsel of BNY Mellon from December 2019 to August 2021; Counsel of BNY Mellon from May 2016 to December 2019; and Assistant Secretary of the Adviser from April 2018 to August 2021. She is an officer of 54 investment companies (comprised of 122 portfolios) managed by the Adviser or an affiliate of the Adviser. She is 38 years old and has been an employee of BNY Mellon since May 2016.
DANIEL GOLDSTEIN, Vice President since March 2022.
Head of Product Development of North America Distribution, BNY Mellon Investment Management since January 2018; Executive Vice President of North America Product, BNY Mellon Investment Management since April 2023; and Senior Vice President, Development & Oversight of North America Product, BNY Mellon Investment Management from 2010 to March 2023. He is an officer of 53 investment companies (comprised of 103 portfolios) managed by the Adviser or an affiliate of the Adviser. He is 54 years old and has been an employee of the Distributor since 1991.
JOSEPH MARTELLA, Vice President since March 2022.
Vice President of the Adviser since December 2022; Head of Product Management of North America Distribution, BNY Mellon Investment Management since January 2018; Executive Vice President of North America Product, BNY Mellon Investment Management since April 2023; and Senior Vice President of North America Product, BNY Mellon Investment Management from 2010 to March 2023. He is an officer of 53 investment companies (comprised of 103 portfolios) managed by the Adviser or an affiliate of the Adviser. He is 46 years old and has been an employee of the Distributor since 1999.
GAVIN C. REILLY, Assistant Treasurer since December 2005.
Tax Manager–BNY Mellon Fund Administration. He is an officer of 54 investment companies (comprised of 122 portfolios) managed by the Adviser or an affiliate of the Adviser. He is 55 years old and has been an employee of the Adviser since April 1991.
ROBERT SALVIOLO, Assistant Treasurer since July 2007.
Senior Accounting Manager–BNY Mellon Fund Administration. He is an officer of 54 investment companies (comprised of 122 portfolios) managed by the Adviser or an affiliate of the Adviser. He is 56 years old and has been an employee of the Adviser since June 1989.
ROBERT SVAGNA, Assistant Treasurer since December 2002.
Senior Accounting Manager–BNY Mellon Fund Administration. He is an officer of 54 investment companies (comprised of 122 portfolios) managed by the Adviser or an affiliate of the Adviser. He is 56 years old and has been an employee of the Adviser since November 1990.
JOSEPH W. CONNOLLY, Chief Compliance Officer since October 2004.
Chief Compliance Officer of the BNY Mellon Family of Funds and BNY Mellon Funds Trust since 2004; and Chief Compliance Officer of the Adviser from 2004 until June 2021. He is the Chief Compliance Officer of 53 investment companies (comprised of 105 portfolios) managed by the Adviser. He is 66 years old.
CARIDAD M. CAROSELLA, Anti-Money Laundering Compliance Officer since January 2016.
Anti-Money Laundering Compliance Officer of the BNY Mellon Family of Funds and BNY Mellon Funds Trust. She is an officer of 47 investment companies (comprised of 115 portfolios) managed by the Adviser or an affiliate of the Adviser. She is 55 years old and has been an employee of the Distributor since 1997.
45
BNY Mellon Dynamic Value Fund
240 Greenwich Street
New York, NY 10286
Adviser
BNY Mellon Investment Adviser, Inc.
240 Greenwich Street
New York, NY 10286
Sub-Adviser
Newton Investment Management
North America, LLC
BNY Mellon Center
201 Washington Street
Boston, MA 02108
Custodian
The Bank of New York Mellon
240 Greenwich Street
New York, NY 10286
Transfer Agent &
Dividend Disbursing Agent
BNY Mellon Transfer, Inc.
240 Greenwich Street
New York, NY 10286
Distributor
BNY Mellon Securities Corporation
240 Greenwich Street
New York, NY 10286
| | |
Ticker Symbols: | Class A:DAGVX Class C:DCGVX Class I:DRGVX Class Y:DRGYX |
Telephone Call your financial representative or 1-800-373-9387
Mail The BNY Mellon Family of Funds, 144 Glenn Curtiss Boulevard, Uniondale, NY 11556-0144
E-mail Send your request to info@bnymellon.com
Internet Information can be viewed online or downloaded at www.im.bnymellon.com
The fund files its complete schedule of portfolio holdings with the Securities and Exchange Commission (“SEC”) for the first and third quarters of each fiscal year on Form N-PORT. The fund’s Forms N-PORT are available on the SEC’s website at www.sec.gov.
A description of the policies and procedures that the fund uses to determine how to vote proxies relating to portfolio securities and information regarding how the fund voted these proxies for the most recent 12-month period ended June 30 is available at www.im.bnymellon.com and on the SEC’s website at www.sec.gov and without charge, upon request, by calling 1-800-373-9387.
| | |
© 2023 BNY Mellon Securities Corporation
0257AR0823 | 
|
BNY Mellon Opportunistic Midcap Value Fund
| |
ANNUAL REPORT August 31, 2023 |
| |
Save time. Save paper. View your next shareholder report online as soon as it’s available. Log into www.im.bnymellon.com and sign up for eCommunications. It’s simple and only takes a few minutes. |
| |
The views expressed in this report reflect those of the portfolio manager(s) only through the end of the period covered and do not necessarily represent the views of BNY Mellon Investment Adviser, Inc. or any other person in the BNY Mellon Investment Adviser, Inc. organization. Any such views are subject to change at any time based upon market or other conditions and BNY Mellon Investment Adviser, Inc. disclaims any responsibility to update such views. These views may not be relied on as investment advice and, because investment decisions for a fund in the BNY Mellon Family of Funds are based on numerous factors, may not be relied on as an indication of trading intent on behalf of any fund in the BNY Mellon Family of Funds. |
| |
Not FDIC-Insured • Not Bank-Guaranteed • May Lose Value |
Contents
THE FUND
FOR MORE INFORMATION
Back Cover
DISCUSSION OF FUND PERFORMANCE (Unaudited)
For the period from September 1, 2022, through August 31, 2023, as provided by R. Patrick Kent and Andrew Leger, portfolio managers of Newton Investment Management North America, LLC, sub-adviser.
Market and Fund Performance Overview
For the 12-month period ended August 31, 2023, BNY Mellon Opportunistic Midcap Value Fund’s (the “fund”) A shares produced a total return of 6.56%, Class C shares returned 5.67%, Class I shares returned 6.73% and Class Y shares returned 6.89%.1 In comparison, the fund’s benchmark, the Russell Midcap® Value Index (the “Index”), produced a 5.65% total return for the same period.2
Mid-cap stocks posted gains over the reporting period as investors began to anticipate the end of the Federal Reserve’s (the “Fed”) monetary tightening policy. The fund shares outperformed the Index due to favorable asset allocation and security selection.
The Fund’s Investment Approach
In constructing the fund’s portfolio, the fund seeks to surpass the performance of the Index. To pursue this goal, the fund normally invests at least 80% of its net assets, plus any borrowings for investment purposes, in equity securities of mid-cap companies. The fund currently considers mid-cap companies to be those companies with market capitalizations, at the time of purchase, within the market capitalization range of companies comprising the Index.
In constructing the fund’s portfolio, the fund’s portfolio managers identify potential investments through extensive fundamental and quantitative research. The fund focuses on individual stock selection (a “bottom-up” approach), emphasizing three key factors: relative value, business health and business momentum.
The fund’s portfolio managers use an opportunistic value approach to identify stocks whose current market prices trade at a large discount to their intrinsic value, as calculated by the portfolio managers. The opportunistic value style attempts to benefit from valuation inefficiencies and underappreciated, fundamental prospects present in the marketplace. The portfolio managers use mid-cycle estimates, growth prospects, the identification of a revaluation catalyst and competitive advantages as some of the factors in the valuation assessment.
Market Supported by Easing Inflation, Economic Resilience
The reporting period was marked by a range of factors that affected returns. Early in the period, the dominant theme was the Fed’s continued monetary tightening policies aimed at curbing inflation. Added to this was the banking crisis that emerged early in 2023. Uncertainty about the outcome of the debt ceiling standoff in the Congress also weighed on markets, as did some weaker-than-expected performance of China’s economy. Easing inflation, continued economic growth, the anticipated end to the Fed’s rate hikes and the emergence of the artificial intelligence (“AI”) theme provided markets with support.
The Fed raised the federal funds rate seven times during the period but reduced the size of the increase from 75 basis points to just 25 basis points for the last four hikes. The smaller
2
rate hikes late in the period disappointed markets somewhat, as many investors were hoping for an end to the hiking cycle, given some signs of economic slowing.
Economic data showed that as pricing pressures continued to weaken from their peak in June 2022, the labor market also began to soften. Though unemployment remained relatively low, some large technology companies announced layoffs or paused hiring amid a more cautious macroeconomic outlook.
The banking crisis that emerged early in 2023 gave investors another reason to believe the Fed’s tightening policy would not continue. Three regional banks—Silicon Valley Bank, Signature Bank and First Republic Bank—faced mounting losses in their long-dated bond holdings as interest rates rose. Uninsured depositors were spooked by the headlines and lost confidence, choosing to move their money into larger money center banks.
In May 2023, the debate in Congress over the federal debt ceiling reached an apparent standoff, resulting in some market volatility. While an agreement was eventually reached, providing the market with some relief, the run-up caused some turmoil as the prospect of a default was threatened.
In addition to easing inflation and investors’ growing anticipation of the end of the Fed’s tightening cycle, the possibility the economy could avoid recession also provided some support as a widely expected recession failed to arrive. China’s weaker-than-expected rebound from its Zero-COVID policies, however, disappointed investors somewhat.
The market was also supported by the launch of ChatGPT by Open AI, which drew investors’ attention to the promise of artificial intelligence and its likely enhancement of productivity and economic growth. While the most immediate beneficiaries of this news were large-cap growth stocks in the information technology sector, their performance provided support to the market as a whole.
Financials and Utilities Contributed
The fund outperformed the Index over the reporting period due to both favorable asset allocation and stock selection. In the financials sector, an underweight to the banking industry and an overweight in the financial services industry were positive. A position in Ares Management Corp., an alternative asset manager, was beneficial as the company continues to execute well. In the utilities sector, a position in Constellation Energy Corp., an owner and operator of nuclear power plants, performed well. The company is likely to benefit from financial incentives for nuclear power passed in 2022 as part of the Inflation Reduction Act. In the real estate sector, an underweight was beneficial as was a position in Digital Realty Trust Inc., a real estate investment trust that is focused on data center properties. Shares of Zillow Group, Inc., the online real estate service, also contributed.
On a less positive note, allocation and stock selection also hampered performance. An underweight allocation to the industrials sector and an overweight in health care detracted somewhat, while in health care, selections were also detrimental. A position in Centene Corp., a Medicaid-focused health maintenance organization, was hurt by a risk-on rotation out of defensive sectors. The company also lost contracts in certain regions. Shares of Syneos Health also hurt returns. This contract researcher was hurt by a slowdown in research by biotechnology companies. In the consumer discretionary sector, shares of toymaker Hasbro, Inc. hampered returns. The company’s sales have struggled since the end of the pandemic.
3
DISCUSSION OF FUND PERFORMANCE (Unaudited) (continued)
The fund continues to own these shares given the valuable intellectual property, which will likely produce new revenue streams in the future. A lack of exposure to the homebuilding industry also hindered returns.
Focused on Defensive Sectors and Recurring Cash Flows
The revenue and profit outlook depends on whether employment can remain full while inflation continues to move lower. This would allow the Fed to stop rate increases and remain on hold.
Unfortunately, leading indicators point to continued slowdown, and the inversion in the Treasury yield curve also points to a high probability of recession in the coming months. In addition, consumer spending growth will also be challenged. Interest rates on credit cards have risen dramatically, and balances have gone up as well, resulting in increasing payment delinquencies. Energy prices are beginning to increase, and the national average gasoline price has risen substantially from the start of the year. Student loan payments are due to begin again in the coming month, presenting another a drag on consumer spending.
If the Fed fails to achieve a soft landing, and a recession unfolds in the next 12 to 24 months, as appears likely, we believe it will change the downside analysis for many equities. For companies in the S&P 500, the median decline in earnings during a recession is approximately 22%. For this reason, we are focused on companies in sectors and industries in which the cash flow is more resilient, including health care, utilities and off-price retailers, as well as other segments with high recurring revenues.
September 15, 2023
1 Total return includes reinvestment of dividends and any capital gains paid and does not take into consideration the maximum initial sales charge in the case of Class A shares, or the applicable contingent deferred sales charge imposed on redemptions in the case of Class C shares. Had these charges been reflected, returns would have been lower. Past performance is no guarantee of future results. Share price and investment return fluctuate such that upon redemption, fund shares may be worth more or less than their original cost.
2 Source: Lipper Inc. — The Russell Midcap® Value Index measures the performance of the mid-cap value segment of the U.S. equity universe. It includes those Russell Midcap® Index companies that are considered more value-oriented relative to the overall market, as defined by Russell’s leading style methodology. The Index is constructed to provide a comprehensive and unbiased barometer of the mid-cap value market. The Index is completely reconstituted annually to ensure larger stocks do not distort the performance and characteristics of the true mid-cap value market. Investors cannot invest directly in any index.
Please note: the position in any security highlighted with italicized typeface was sold during the reporting period.
Stocks of small- and/or mid-cap companies often experience sharper price fluctuations than stocks of large-cap companies.
Equities are subject to market, market sector, market liquidity, issuer and investment style risks, among other factors, to varying degrees. Investing in foreign denominated and/or domiciled securities involves special risks, including changes in currency exchange rates, political, economic, and social instability, limited company information, differing auditing and legal standards, and less market liquidity. These risks generally are greater with emerging market countries.
4
FUND PERFORMANCE (Unaudited)

Comparison of change in value of a $10,000 investment in Class A shares, Class C shares and Class I shares of BNY Mellon Opportunistic Midcap Value Fund with a hypothetical investment of $10,000 in the Russell Midcap® Value Index (the “Index”).
† Source: Lipper Inc.
Past performance is not predictive of future performance.
The above graph compares a hypothetical $10,000 investment made in each of the Class A shares, Class C shares and Class I shares of BNY Mellon Opportunistic Midcap Value Fund on 8/31/13 to a hypothetical investment of $10,000 made in the Index on that date. All dividends and capital gain distributions are reinvested.
The fund’s performance shown in the line graph above takes into account the maximum initial sales charge on Class A shares and all other applicable fees and expenses on Class A shares, Class C shares and Class I shares. The Index measures the performance of the mid-cap value segment of the U.S. equity universe. It includes those Russell Midcap® Index companies that are considered more value-oriented relative to the overall market as defined by Russell’s leading style methodology. The Index is constructed to provide a comprehensive and unbiased barometer of the mid-cap value market. The Index is completely reconstituted annually to ensure larger stocks do not distort the performance and characteristics of the true mid-cap value market. Unlike a mutual fund, the Index is not subject to charges, fees and other expenses. Investors cannot invest directly in any index. Further information relating to fund performance, including expense reimbursements, if applicable, is contained in the Financial Highlights section of the prospectus and elsewhere in this report.
5
FUND PERFORMANCE (Unaudited) (continued)
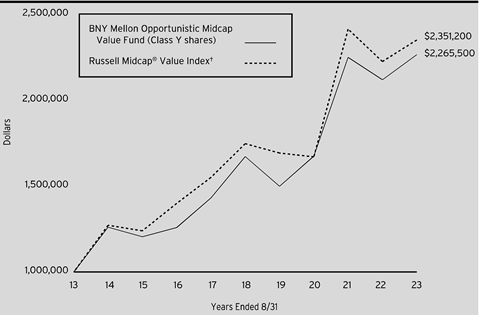
Comparison of change in value of a $1,000,000 investment in Class Y shares of BNY Mellon Opportunistic Midcap Value Fund with a hypothetical investment of $1,000,000 in the Russell Midcap® Value Index (the “Index”).
† Source: Lipper Inc.
Past performance is not predictive of future performance.
The above graph compares a hypothetical $1,000,000 investment made in Class Y shares of BNY Mellon Opportunistic Midcap Value Fund on 8/31/13 to a hypothetical investment of $1,000,000 made in the Index on that date. All dividends and capital gain distributions are reinvested.
The fund’s performance shown in the line graph above takes into account all applicable fees and expenses on Class Y shares. The Index measures the performance of the mid-cap value segment of the U.S. equity universe. It includes those Russell Midcap® Index companies that are considered more value-oriented relative to the overall market as defined by Russell’s leading style methodology. The Index is constructed to provide a comprehensive and unbiased barometer of the mid-cap value market. The Index is completely reconstituted annually to ensure larger stocks do not distort the performance and characteristics of the true mid-cap value market. Unlike a mutual fund, the Index is not subject to charges, fees and other expenses. Investors cannot invest directly in any index. Further information relating to fund performance, including expense reimbursements, if applicable, is contained in the Financial Highlights section of the prospectus and elsewhere in this report.
6
| | | | | | | |
Average Annual Total Returns as of 8/31/2023 | |
| | | 1 Year | 5 Years | 10 Years | |
Class A shares | | | | | |
with maximum sales charge (5.75%) | | .44% | 4.68% | 7.48% | |
without sales charge | | 6.56% | 5.92% | 8.12% | |
Class C shares | | | | | |
with applicable redemption charge † | | 4.69% | 5.09% | 7.29% | |
without redemption | | 5.67% | 5.09% | 7.29% | |
Class I shares | | 6.73% | 6.14% | 8.38% | |
Class Y shares | | 6.89% | 6.26% | 8.52% | |
Russell Midcap® Value Index | | 5.65% | 6.12% | 8.93% | |
† The maximum contingent deferred sales charge for Class C shares is 1% for shares redeemed within one year of the date of purchase.
The performance data quoted represents past performance, which is no guarantee of future results. Share price and investment return fluctuate and an investor’s shares may be worth more or less than original cost upon redemption. Current performance may be lower or higher than the performance quoted. Go to www.im.bnymellon.com for the fund’s most recent month-end returns.
The fund's performance shown in the graphs and table does not reflect the deduction of taxes that a shareholder would pay on fund distributions or the redemption of fund shares. In addition to the performance of Class A shares shown with and without a maximum sales charge, the fund's performance shown in the table takes into account all other applicable fees and expenses on all classes.
7
UNDERSTANDING YOUR FUND’S EXPENSES (Unaudited)
As a mutual fund investor, you pay ongoing expenses, such as management fees and other expenses. Using the information below, you can estimate how these expenses affect your investment and compare them with the expenses of other funds. You also may pay one-time transaction expenses, including sales charges (loads) and redemption fees, which are not shown in this section and would have resulted in higher total expenses. For more information, see your fund’s prospectus or talk to your financial adviser.
Review your fund’s expenses
The table below shows the expenses you would have paid on a $1,000 investment in BNY Mellon Opportunistic Midcap Value Fund from March 1, 2023 to August 31, 2023. It also shows how much a $1,000 investment would be worth at the close of the period, assuming actual returns and expenses.
| | | | | | | |
Expenses and Value of a $1,000 Investment | |
Assume actual returns for the six months ended August 31, 2023 | |
| | | | | | |
| | Class A | Class C | Class I | Class Y | |
Expenses paid per $1,000† | $5.89 | $10.05 | $4.91 | $4.34 | |
Ending value (after expenses) | $1,049.50 | $1,045.50 | $1,050.60 | $1,051.20 | |
COMPARING YOUR FUND’S EXPENSES WITH THOSE OF OTHER FUNDS (Unaudited)
Using the SEC’s method to compare expenses
The Securities and Exchange Commission (“SEC”) has established guidelines to help investors assess fund expenses. Per these guidelines, the table below shows your fund’s expenses based on a $1,000 investment, assuming a hypothetical 5% annualized return. You can use this information to compare the ongoing expenses (but not transaction expenses or total cost) of investing in the fund with those of other funds. All mutual fund shareholder reports will provide this information to help you make this comparison. Please note that you cannot use this information to estimate your actual ending account balance and expenses paid during the period.
| | | | | | | |
Expenses and Value of a $1,000 Investment | |
Assuming a hypothetical 5% annualized return for the six months ended August 31, 2023 | |
| | | | | | |
| | Class A | Class C | Class I | Class Y | |
Expenses paid per $1,000† | $5.80 | $9.91 | $4.84 | $4.28 | |
Ending value (after expenses) | $1,019.46 | $1,015.38 | $1,020.42 | $1,020.97 | |
† | Expenses are equal to the fund’s annualized expense ratio of 1.14% for Class A, 1.95% for Class C, .95% for Class I and .84% for Class Y, multiplied by the average account value over the period, multiplied by 184/365 (to reflect the one-half year period). |
8
STATEMENT OF INVESTMENTS
August 31, 2023
| | | | | | | | |
| |
Description | | | | Shares | | Value ($) | |
Common Stocks - 97.5% | | | | | |
Automobiles & Components - .7% | | | | | |
Mobileye Global, Inc., Cl. A | | | | 77,998 | a,b | 2,769,709 | |
Banks - 1.4% | | | | | |
Popular, Inc. | | | | 83,183 | | 5,679,735 | |
Capital Goods - 4.5% | | | | | |
CNH Industrial NV | | | | 378,105 | | 5,210,287 | |
Huntington Ingalls Industries, Inc. | | | | 21,289 | | 4,690,392 | |
Quanta Services, Inc. | | | | 37,875 | | 7,948,826 | |
| | | | | 17,849,505 | |
Commercial & Professional Services - 8.5% | | | | | |
CACI International, Inc., Cl. A | | | | 18,329 | b | 6,012,095 | |
Clarivate PLC | | | | 575,533 | a,b | 4,276,210 | |
Equifax, Inc. | | | | 36,966 | | 7,640,872 | |
Rentokil Initial PLC, ADR | | | | 231,640 | | 8,790,738 | |
Waste Connections, Inc. | | | | 49,346 | | 6,759,909 | |
| | | | | 33,479,824 | |
Consumer Discretionary Distribution - 2.0% | | | | | |
Ross Stores, Inc. | | | | 65,022 | | 7,920,330 | |
Consumer Durables & Apparel - 3.3% | | | | | |
Hasbro, Inc. | | | | 99,445 | | 7,160,040 | |
Skechers USA, Inc., Cl. A | | | | 114,946 | b | 5,782,933 | |
| | | | | 12,942,973 | |
Consumer Services - 5.2% | | | | | |
ADT, Inc. | | | | 491,955 | a | 3,158,351 | |
Aramark | | | | 278,357 | | 10,349,313 | |
Expedia Group, Inc. | | | | 62,870 | b | 6,814,479 | |
| | | | | 20,322,143 | |
Consumer Staples Distribution - 2.0% | | | | | |
Dollar Tree, Inc. | | | | 63,049 | b | 7,714,676 | |
Energy - 9.4% | | | | | |
EQT Corp. | | | | 202,795 | | 8,764,800 | |
Hess Corp. | | | | 34,312 | | 5,301,204 | |
NOV, Inc. | | | | 350,434 | | 7,404,670 | |
Pioneer Natural Resources Co. | | | | 30,063 | | 7,152,890 | |
Valero Energy Corp. | | | | 64,812 | | 8,419,079 | |
| | | | | 37,042,643 | |
Equity Real Estate Investment - 4.5% | | | | | |
Alexandria Real Estate Equities, Inc. | | | | 32,379 | c | 3,766,973 | |
Digital Realty Trust, Inc. | | | | 67,087 | c | 8,836,700 | |
Equity Residential | | | | 81,337 | c | 5,273,078 | |
| | | | | 17,876,751 | |
9
STATEMENT OF INVESTMENTS (continued)
| | | | | | | | |
| |
Description | | | | Shares | | Value ($) | |
Common Stocks - 97.5% (continued) | | | | | |
Financial Services - 10.3% | | | | | |
Ares Management Corp., Cl. A | | | | 77,763 | | 8,043,805 | |
Euronet Worldwide, Inc. | | | | 63,157 | b | 5,517,395 | |
Fidelity National Information Services, Inc. | | | | 38,267 | | 2,137,595 | |
Global Payments, Inc. | | | | 70,933 | | 8,986,502 | |
LPL Financial Holdings, Inc. | | | | 34,051 | | 7,851,820 | |
Voya Financial, Inc. | | | | 115,334 | | 8,036,473 | |
| | | | | 40,573,590 | |
Food, Beverage & Tobacco - 3.8% | | | | | |
Conagra Brands, Inc. | | | | 187,967 | | 5,616,454 | |
Molson Coors Beverage Co., Cl. B | | | | 89,420 | | 5,677,276 | |
Tyson Foods, Inc., Cl. A | | | | 71,522 | | 3,809,977 | |
| | | | | 15,103,707 | |
Health Care Equipment & Services - 7.6% | | | | | |
Baxter International, Inc. | | | | 123,196 | | 5,001,758 | |
Centene Corp. | | | | 121,802 | b | 7,509,093 | |
Encompass Health Corp. | | | | 107,159 | | 7,612,575 | |
Laboratory Corp. of America Holdings | | | | 18,649 | | 3,880,857 | |
Zimmer Biomet Holdings, Inc. | | | | 49,340 | | 5,877,381 | |
| | | | | 29,881,664 | |
Insurance - 5.2% | | | | | |
Arch Capital Group Ltd. | | | | 121,126 | b | 9,309,744 | |
Assurant, Inc. | | | | 38,987 | | 5,432,059 | |
Reinsurance Group of America, Inc. | | | | 42,808 | | 5,934,045 | |
| | | | | 20,675,848 | |
Materials - 3.1% | | | | | |
Freeport-McMoRan, Inc. | | | | 127,879 | | 5,103,651 | |
Newmont Corp. | | | | 178,030 | | 7,017,943 | |
| | | | | 12,121,594 | |
Media & Entertainment - 1.5% | | | | | |
Warner Music Group Corp., Cl. A | | | | 182,059 | | 6,062,565 | |
Pharmaceuticals, Biotechnology & Life Sciences - 4.4% | | | | | |
Neurocrine Biosciences, Inc. | | | | 42,953 | b | 4,677,152 | |
Sarepta Therapeutics, Inc. | | | | 56,542 | b | 6,842,147 | |
United Therapeutics Corp. | | | | 26,808 | b | 6,014,643 | |
| | | | | 17,533,942 | |
Real Estate Management & Development - 2.5% | | | | | |
CBRE Group, Inc., Cl. A | | | | 66,596 | b | 5,663,990 | |
Zillow Group, Inc., Cl. C | | | | 83,603 | b | 4,360,732 | |
| | | | | 10,024,722 | |
Semiconductors & Semiconductor Equipment - 1.6% | | | | | |
MKS Instruments, Inc. | | | | 62,917 | | 6,306,171 | |
10
| | | | | | | | |
| |
Description | | | | Shares | | Value ($) | |
Common Stocks - 97.5% (continued) | | | | | |
Software & Services - 4.6% | | | | | |
Akamai Technologies, Inc. | | | | 56,010 | b | 5,886,091 | |
Dolby Laboratories, Inc., Cl. A | | | | 55,190 | | 4,661,899 | |
Splunk, Inc. | | | | 61,814 | b | 7,495,566 | |
| | | | | 18,043,556 | |
Technology Hardware & Equipment - 1.4% | | | | | |
Western Digital Corp. | | | | 119,679 | b | 5,385,555 | |
Transportation - 2.1% | | | | | |
Knight-Swift Transportation Holdings, Inc. | | | | 70,783 | | 3,880,324 | |
Lyft, Inc., Cl. A | | | | 381,703 | b | 4,496,461 | |
| | | | | 8,376,785 | |
Utilities - 7.9% | | | | | |
Constellation Energy Corp. | | | | 117,731 | | 12,262,861 | |
Dominion Energy, Inc. | | | | 109,342 | | 5,307,461 | |
Exelon Corp. | | | | 143,621 | | 5,762,074 | |
Vistra Corp. | | | | 250,568 | | 7,872,847 | |
| | | | | 31,205,243 | |
Total Common Stocks (cost $320,278,438) | | | | 384,893,231 | |
| | | | | | | | |
Private Equity - .5% | | | | | |
Software & Services - .5% | | | | | |
Databricks, Inc.
(cost $2,398,743) | | | | 32,643 | b,d | 2,171,086 | |
| | | 1-Day
Yield (%) | | | | | |
Investment Companies - 1.8% | | | | | |
Registered Investment Companies - 1.8% | | | | | |
Dreyfus Institutional Preferred Government Plus Money Market Fund, Institutional Shares
(cost $7,196,897) | | 5.41 | | 7,196,897 | e | 7,196,897 | |
11
STATEMENT OF INVESTMENTS (continued)
| | | | | | | | |
| |
Description | | 1-Day
Yield (%) | | Shares | | Value ($) | |
Investment of Cash Collateral for Securities Loaned - .7% | | | | | |
Registered Investment Companies - .7% | | | | | |
Dreyfus Institutional Preferred Government Plus Money Market Fund, Institutional Shares
(cost $2,741,239) | | 5.41 | | 2,741,239 | e | 2,741,239 | |
Total Investments (cost $332,615,317) | | 100.5% | | 397,002,453 | |
Liabilities, Less Cash and Receivables | | (.5%) | | (2,080,009) | |
Net Assets | | 100.0% | | 394,922,444 | |
ADR—American Depositary Receipt
a Security, or portion thereof, on loan. At August 31, 2023, the value of the fund’s securities on loan was $5,692,349 and the value of the collateral was $5,716,855, consisting of cash collateral of $2,741,239 and U.S. Government & Agency securities valued at $2,975,616. In addition, the value of collateral may include pending sales that are also on loan.
b Non-income producing security.
c Investment in real estate investment trust within the United States.
d The fund held Level 3 securities at August 31, 2023. These securities were valued at $2,171,086 or ..5% of net assets.
e Investment in affiliated issuer. The investment objective of this investment company is publicly available and can be found within the investment company’s prospectus.
| | |
Portfolio Summary (Unaudited) † | Value (%) |
Financials | 16.9 |
Industrials | 15.1 |
Health Care | 12.0 |
Consumer Discretionary | 11.1 |
Energy | 9.4 |
Utilities | 7.9 |
Information Technology | 7.5 |
Real Estate | 7.1 |
Consumer Staples | 5.8 |
Materials | 3.1 |
Investment Companies | 2.5 |
Communication Services | 1.5 |
Technology | .6 |
| | 100.5 |
† Based on net assets.
See notes to financial statements.
12
| | | | | | | |
Affiliated Issuers | | | |
Description | Value ($) 8/31/2022 | Purchases ($)† | Sales ($) | Value ($) 8/31/2023 | Dividends/
Distributions ($) | |
Registered Investment Companies - 1.8% | | |
Dreyfus Institutional Preferred Government Plus Money Market Fund, Institutional Shares - 1.8% | 13,031,737 | 99,139,343 | (104,974,183) | 7,196,897 | 381,560 | |
Investment of Cash Collateral for Securities Loaned - .7%†† | | |
Dreyfus Institutional Preferred Government Plus Money Market Fund, Institutional Shares - .7% | - | 22,274,370 | (19,533,131) | 2,741,239 | 5,562 | ††† |
Dreyfus Institutional Preferred Government Plus Money Market Fund, SL Shares - .0% | 5,590,302 | 134,780,442 | (140,370,744) | - | 35,226 | ††† |
Total - 2.5% | 18,622,039 | 256,194,155 | (264,878,058) | 9,938,136 | 422,348 | |
† Includes reinvested dividends/distributions.
†† Effective July 3, 2023, cash collateral for securities lending was transferred from Dreyfus Institutional Preferred Government Plus Money Market Fund, SL Shares to Dreyfus Institutional Preferred Government Plus Money Market Fund, Institutional Shares.
††† Represents securities lending income earned from the reinvestment of cash collateral from loaned securities, net of fees and collateral investment expenses, and other payments to and from borrowers of securities.
See notes to financial statements.
13
STATEMENT OF ASSETS AND LIABILITIES
August 31, 2023
| | | | | | | |
| | | | | | |
| | | Cost | | Value | |
Assets ($): | | | | |
Investments in securities—See Statement of Investments
(including securities on loan, valued at $5,692,349)—Note 1(c): | | | |
Unaffiliated issuers | 322,677,181 | | 387,064,317 | |
Affiliated issuers | | 9,938,136 | | 9,938,136 | |
Dividends and securities lending income receivable | | 603,280 | |
Receivable for investment securities sold | | 452,753 | |
Receivable for shares of Common Stock subscribed | | 65,653 | |
Tax reclaim receivable—Note 1(b) | | 38,132 | |
Prepaid expenses | | | | | 55,683 | |
| | | | | 398,217,954 | |
Liabilities ($): | | | | |
Due to BNY Mellon Investment Adviser, Inc. and affiliates—Note 3(c) | | 320,709 | |
Liability for securities on loan—Note 1(c) | | 2,741,239 | |
Payable for shares of Common Stock redeemed | | 97,115 | |
Directors’ fees and expenses payable | | 6,703 | |
Other accrued expenses | | | | | 129,744 | |
| | | | | 3,295,510 | |
Net Assets ($) | | | 394,922,444 | |
Composition of Net Assets ($): | | | | |
Paid-in capital | | | | | 320,264,683 | |
Total distributable earnings (loss) | | | | | 74,657,761 | |
Net Assets ($) | | | 394,922,444 | |
| | | | | | |
Net Asset Value Per Share | Class A | Class C | Class I | Class Y | |
Net Assets ($) | 282,946,914 | 5,032,717 | 104,788,283 | 2,154,530 | |
Shares Outstanding | 9,537,735 | 221,250 | 3,551,056 | 72,923 | |
Net Asset Value Per Share ($) | 29.67 | 22.75 | 29.51 | 29.55 | |
| | | | | |
See notes to financial statements. | | | | | |
14
STATEMENT OF OPERATIONS
Year Ended August 31, 2023
| | | | | | | |
| | | | | | |
| | | | | | |
Investment Income ($): | | | | |
Income: | | | | |
Cash dividends (net of $48,015 foreign taxes withheld at source): | |
Unaffiliated issuers | | | 6,645,830 | |
Affiliated issuers | | | 381,560 | |
Income from securities lending—Note 1(c) | | | 40,788 | |
Total Income | | | 7,068,178 | |
Expenses: | | | | |
Management fee—Note 3(a) | | | 3,012,390 | |
Shareholder servicing costs—Note 3(c) | | | 1,132,989 | |
Professional fees | | | 86,558 | |
Registration fees | | | 69,122 | |
Distribution fees—Note 3(b) | | | 46,641 | |
Prospectus and shareholders’ reports | | | 43,851 | |
Directors’ fees and expenses—Note 3(d) | | | 31,694 | |
Chief Compliance Officer fees—Note 3(c) | | | 19,460 | |
Loan commitment fees—Note 2 | | | 10,226 | |
Custodian fees—Note 3(c) | | | 7,740 | |
Miscellaneous | | | 32,367 | |
Total Expenses | | | 4,493,038 | |
Less—reduction in expenses due to undertaking—Note 3(a) | | | (68,081) | |
Less—reduction in fees due to earnings credits—Note 3(c) | | | (49,513) | |
Net Expenses | | | 4,375,444 | |
Net Investment Income | | | 2,692,734 | |
Realized and Unrealized Gain (Loss) on Investments—Note 4 ($): | | |
Net realized gain (loss) on investments and foreign currency transactions | 10,169,450 | |
Net change in unrealized appreciation (depreciation) on investments
and foreign currency transactions | 12,009,527 | |
Net Realized and Unrealized Gain (Loss) on Investments | | | 22,178,977 | |
Net Increase in Net Assets Resulting from Operations | | 24,871,711 | |
| | | | | | |
See notes to financial statements. | | | | | |
15
STATEMENT OF CHANGES IN NET ASSETS
| | | | | | | | | | |
| | | | Year Ended August 31, |
| | | | 2023 | | 2022 | |
Operations ($): | | | | | | | | |
Net investment income | | | 2,692,734 | | | | 1,368,539 | |
Net realized gain (loss) on investments | | 10,169,450 | | | | 28,607,669 | |
Net change in unrealized appreciation
(depreciation) on investments | | 12,009,527 | | | | (57,226,212) | |
Net Increase (Decrease) in Net Assets
Resulting from Operations | 24,871,711 | | | | (27,250,004) | |
Distributions ($): | |
Distributions to shareholders: | | | | | | | | |
Class A | | | (18,374,302) | | | | (39,143,599) | |
Class C | | | (544,018) | | | | (1,884,850) | |
Class I | | | (7,575,781) | | | | (16,364,696) | |
Class Y | | | (125,326) | | | | (673,118) | |
Total Distributions | | | (26,619,427) | | | | (58,066,263) | |
Capital Stock Transactions ($): | |
Net proceeds from shares sold: | | | | | | | | |
Class A | | | 11,085,467 | | | | 15,364,820 | |
Class C | | | 276,690 | | | | 503,328 | |
Class I | | | 15,105,410 | | | | 22,809,995 | |
Class Y | | | 835,567 | | | | 646,566 | |
Distributions reinvested: | | | | | | | | |
Class A | | | 17,446,253 | | | | 36,818,716 | |
Class C | | | 533,414 | | | | 1,859,138 | |
Class I | | | 7,210,248 | | | | 15,754,358 | |
Class Y | | | 67,690 | | | | 554,777 | |
Cost of shares redeemed: | | | | | | | | |
Class A | | | (38,336,640) | | | | (47,904,282) | |
Class C | | | (3,615,008) | | | | (6,773,252) | |
Class I | | | (35,974,627) | | | | (42,404,164) | |
Class Y | | | (553,514) | | | | (4,274,866) | |
Increase (Decrease) in Net Assets
from Capital Stock Transactions | (25,919,050) | | | | (7,044,866) | |
Total Increase (Decrease) in Net Assets | (27,666,766) | | | | (92,361,133) | |
Net Assets ($): | |
Beginning of Period | | | 422,589,210 | | | | 514,950,343 | |
End of Period | | | 394,922,444 | | | | 422,589,210 | |
16
| | | | | | | | | | |
| | | | Year Ended August 31, |
| | | | 2023 | | 2022 | |
Capital Share Transactions (Shares): | |
Class Aa,b | | | | | | | | |
Shares sold | | | 388,457 | | | | 477,218 | |
Shares issued for distributions reinvested | | | 621,084 | | | | 1,166,626 | |
Shares redeemed | | | (1,342,544) | | | | (1,486,957) | |
Net Increase (Decrease) in Shares Outstanding | (333,003) | | | | 156,887 | |
Class Ca | | | | | | | | |
Shares sold | | | 12,726 | | | | 19,674 | |
Shares issued for distributions reinvested | | | 24,615 | | | | 74,604 | |
Shares redeemed | | | (162,950) | | | | (262,548) | |
Net Increase (Decrease) in Shares Outstanding | (125,609) | | | | (168,270) | |
Class Ib | | | | | | | | |
Shares sold | | | 533,703 | | | | 722,440 | |
Shares issued for distributions reinvested | | | 258,339 | | | | 502,211 | |
Shares redeemed | | | (1,269,791) | | | | (1,307,473) | |
Net Increase (Decrease) in Shares Outstanding | (477,749) | | | | (82,822) | |
Class Y | | | | | | | | |
Shares sold | | | 29,768 | | | | 20,390 | |
Shares issued for distributions reinvested | | | 2,425 | | | | 17,674 | |
Shares redeemed | | | (19,369) | | | | (135,789) | |
Net Increase (Decrease) in Shares Outstanding | 12,824 | | | | (97,725) | |
| | | | | | | | | |
a | During the period ended August 31, 2023, 26 Class C shares representing $561 were automatically converted to 20 Class A shares. | |
b | During the period ended August 31, 2023, 198 Class I shares representing $5,577 were exchanged for 197 Class A shares and during the period ended August 31, 2022, 1,805 Class A shares representing $56,801 were exchanged for 1,814 Class I shares. | |
See notes to financial statements. | | | | | | | | |
17
FINANCIAL HIGHLIGHTS
The following tables describe the performance for each share class for the fiscal periods indicated. All information (except portfolio turnover rate) reflects financial results for a single fund share. Net asset value total return is calculated assuming an initial investment made at the net asset value at the beginning of the period, reinvestment of all dividends and distributions at net asset value during the period, and redemption at net asset value on the last day of the period. Net asset value total return includes adjustments in accordance with accounting principles generally accepted in the United States of America and as such, the net asset value for financial reporting purposes and the returns based upon those net asset values may differ from the net asset value and returns for shareholder transactions. These figures have been derived from the fund’s financial statements.
| | | | | | | | |
| | |
| | |
| | Year Ended August 31, |
Class A Shares | | 2023 | 2022 | 2021 | 2020 | 2019 |
Per Share Data ($): | | | | | | |
Net asset value,
beginning of period | | 29.73 | 35.79 | 26.76 | 24.10 | 35.32 |
Investment Operations: | | | | | | |
Net investment incomea | | .18 | .08 | .01 | .03 | .03 |
Net realized and unrealized gain
(loss) on investments | | 1.66 | (2.00) | 9.05 | 2.70 | (4.32) |
Total from Investment Operations | | 1.84 | (1.92) | 9.06 | 2.73 | (4.29) |
Distributions: | | | | | | |
Dividends from net investment income | | (.08) | (.01) | (.03) | (.07) | - |
Dividends from net realized gain
on investments | | (1.82) | (4.13) | - | - | (6.93) |
Total Distributions | | (1.90) | (4.14) | (.03) | (.07) | (6.93) |
Net asset value, end of period | | 29.67 | 29.73 | 35.79 | 26.76 | 24.10 |
Total Return (%)b | | 6.56 | (6.05) | 33.88 | 11.34 | (10.64) |
Ratios/Supplemental Data (%): | | | | | | |
Ratio of total expenses to
average net assets | | 1.16 | 1.14 | 1.14 | 1.18 | 1.15 |
Ratio of net expenses to
average net assets | | 1.13 | 1.12 | 1.14 | 1.18 | 1.15 |
Ratio of net investment income
to average net assets | | .62 | .25 | .04 | .13 | .12 |
Portfolio Turnover Rate | | 32.73 | 28.31 | 63.23 | 91.55 | 98.59 |
Net Assets,
end of period ($ x 1,000) | | 282,947 | 293,476 | 347,690 | 288,719 | 343,673 |
a Based on average shares outstanding.
b Exclusive of sales charge.
See notes to financial statements.
18
| | | | | | | | | |
| | |
| | |
| | Year Ended August 31, |
Class C Shares | | 2023 | 2022 | 2021 | 2020 | 2019 |
Per Share Data ($): | | | | | | | |
Net asset value, beginning of period | | | 23.34 | 29.19 | 21.97 | 19.89 | 30.80 |
Investment Operations: | | | | | | | |
Net investment (loss)a | | | (.03) | (.14) | (.20) | (.13) | (.14) |
Net realized and unrealized gain
(loss) on investments | | | 1.26 | (1.58) | 7.42 | 2.21 | (3.84) |
Total from Investment Operations | | | 1.23 | (1.72) | 7.22 | 2.08 | (3.98) |
Distributions: | | | | | | | |
Dividends from net investment income | | | - | - | - | (.00)b | - |
Dividends from net realized gain
on investments | | | (1.82) | (4.13) | - | - | (6.93) |
Total Distributions | | | (1.82) | (4.13) | - | (.00)b | (6.93) |
Net asset value, end of period | | | 22.75 | 23.34 | 29.19 | 21.97 | 19.89 |
Total Return (%)c | | | 5.67 | (6.79) | 32.86 | 10.46 | (11.34) |
Ratios/Supplemental Data (%): | | | | | | | |
Ratio of total expenses to
average net assets | | | 1.97 | 1.94 | 1.94 | 1.97 | 1.91 |
Ratio of net expenses to
average net assets | | | 1.94 | 1.92 | 1.94 | 1.97 | 1.91 |
Ratio of net investment (loss)
to average net assets | | | (.16) | (.54) | (.75) | (.64) | (.65) |
Portfolio Turnover Rate | | | 32.73 | 28.31 | 63.23 | 91.55 | 98.59 |
Net Assets, end of period ($ x 1,000) | | | 5,033 | 8,094 | 15,035 | 18,431 | 29,892 |
a Based on average shares outstanding.
b Amount represents less than $.01 per share.
c Exclusive of sales charge.
See notes to financial statements.
19
FINANCIAL HIGHLIGHTS (continued)
| | | | | | | | |
| | |
| | |
| | Year Ended August 31, |
Class I Shares | | 2023 | 2022 | 2021 | 2020 | 2019 |
Per Share Data ($): | | | | | | |
Net asset value, beginning of period | | 29.60 | 35.65 | 26.65 | 24.00 | 35.14 |
Investment Operations: | | | | | | |
Net investment incomea | | .24 | .15 | .08 | .09 | .11 |
Net realized and unrealized gain
(loss) on investments | | 1.64 | (1.99) | 9.01 | 2.68 | (4.32) |
Total from Investment Operations | | 1.88 | (1.84) | 9.09 | 2.77 | (4.21) |
Distributions: | | | | | | |
Dividends from net investment income | | (.15) | (.08) | (.09) | (.12) | (.00)b |
Dividends from net realized gain
on investments | | (1.82) | (4.13) | - | - | (6.93) |
Total Distributions | | (1.97) | (4.21) | (.09) | (.12) | (6.93) |
Net asset value, end of period | | 29.51 | 29.60 | 35.65 | 26.65 | 24.00 |
Total Return (%) | | 6.73 | (5.84) | 34.17 | 11.55 | (10.42) |
Ratios/Supplemental Data (%): | | | | | | |
Ratio of total expenses to
average net assets | | .97 | .94 | .94 | .96 | .90 |
Ratio of net expenses to
average net assets | | .94 | .92 | .94 | .96 | .90 |
Ratio of net investment income
to average net assets | | .83 | .45 | .24 | .35 | .40 |
Portfolio Turnover Rate | | 32.73 | 28.31 | 63.23 | 91.55 | 98.59 |
Net Assets, end of period ($ x 1,000) | | 104,788 | 119,238 | 146,592 | 121,710 | 197,290 |
a Based on average shares outstanding.
b Amount represents less than $.01 per share.
See notes to financial statements.
20
| | | | | | | | |
| | |
| | |
| | Year Ended August 31, |
Class Y Shares | | 2023 | 2022 | 2021 | 2020 | 2019 |
Per Share Data ($): | | | | | | |
Net asset value, beginning of period | | 29.63 | 35.70 | 26.69 | 24.05 | 35.22 |
Investment Operations: | | | | | | |
Net investment incomea | | .26 | .21 | .12 | .12 | .12 |
Net realized and unrealized gain
(loss) on investments | | 1.66 | (2.03) | 9.02 | 2.69 | (4.31) |
Total from Investment Operations | | 1.92 | (1.82) | 9.14 | 2.81 | (4.19) |
Distributions: | | | | | | |
Dividends from net investment income | | (.18) | (.12) | (.13) | (.17) | (.05) |
Dividends from net realized gain
on investments | | (1.82) | (4.13) | - | - | (6.93) |
Total Distributions | | (2.00) | (4.25) | (.13) | (.17) | (6.98) |
Net asset value, end of period | | 29.55 | 29.63 | 35.70 | 26.69 | 24.05 |
Total Return (%) | | 6.89 | (5.78) | 34.33 | 11.71 | (10.34) |
Ratios/Supplemental Data (%): | | | | | | |
Ratio of total expenses to
average net assets | | .86 | .83 | .83 | .84 | .81 |
Ratio of net expenses to
average net assets | | .83 | .81 | .83 | .84 | .81 |
Ratio of net investment income to average net assets | | .92 | .65 | .36 | .47 | .45 |
Portfolio Turnover Rate | | 32.73 | 28.31 | 63.23 | 91.55 | 98.59 |
Net Assets, end of period ($ x 1,000) | | 2,155 | 1,781 | 5,634 | 5,215 | 9,176 |
a Based on average shares outstanding.
See notes to financial statements.
21
NOTES TO FINANCIAL STATEMENTS
NOTE 1—Significant Accounting Policies:
BNY Mellon Opportunistic Midcap Value Fund (the “fund”) is a separate diversified series of BNY Mellon Advantage Funds, Inc. (the “Company”), which is registered under the Investment Company Act of 1940, as amended (the “Act”), as an open-end management investment company and operates as a series company currently offering seven series, including the fund. The fund’s investment objective is to seek to surpass the performance of the Russell Midcap® Value Index. BNY Mellon Investment Adviser, Inc. (the “Adviser”), a wholly-owned subsidiary of The Bank of New York Mellon Corporation (“BNY Mellon”), serves as the fund’s investment adviser. Newton Investment Management North America, LLC (the “Sub-Adviser”), an indirect wholly-owned subsidiary of BNY Mellon and an affilate of the Adviser, serves as the fund’s sub-adviser.
Effective March 31, 2023, the Sub-Adviser, entered into a sub-sub-investment advisory agreement with its affiliate, Newton Investment Management Limited (“NIM”), to enable NIM to provide certain advisory services to the Sub-Adviser for the benefit of the fund, including, but not limited to, portfolio management services. NIM is subject to the supervision of the Sub-Adviser and the Adviser. NIM is also an affiliate of the Adviser. NIM, located at 160 Queen Victoria Street, London, EC4V, 4LA, England, was formed in 1978. NIM is an indirect subsidiary of BNY Mellon.
BNY Mellon Securities Corporation (the “Distributor”), a wholly-owned subsidiary of the Adviser, is the distributor of the fund’s shares. The fund is authorized to issue 800 million shares of $.001 par value Common Stock. The fund currently has authorized four classes of shares: Class A (350 million shares authorized), Class C (125 million shares authorized), Class I (175 million shares authorized) and Class Y (150 million shares authorized). Class A and Class C shares are sold primarily to retail investors through financial intermediaries and bear Distribution and/or Shareholder Services Plan fees. Class A shares generally are subject to a sales charge imposed at the time of purchase. Class A shares bought without an initial sales charge as part of an investment of $1 million or more may be charged a contingent deferred sales charge (“CDSC”) of 1.00% if redeemed within one year. Class C shares are subject to a CDSC imposed on Class C shares redeemed within one year of purchase. Class C shares automatically convert to Class A shares eight years after the date of purchase, without the imposition of a sales charge. Class I shares are sold primarily to bank trust departments and other financial service providers (including BNY Mellon and its affiliates), acting on behalf of customers having a qualified trust or an investment account or relationship at such
22
institution, and bear no Distribution or Shareholder Services Plan fees. Class Y shares are sold at net asset value per share generally to institutional investors, and bear no Distribution or Shareholder Services Plan fees. Class I and Class Y shares are offered without a front-end sales charge or CDSC. Other differences between the classes include the services offered to and the expenses borne by each class, the allocation of certain transfer agency costs and certain voting rights. Income, expenses (other than expenses attributable to a specific class), and realized and unrealized gains or losses on investments are allocated to each class of shares based on its relative net assets.
The Company accounts separately for the assets, liabilities and operations of each series. Expenses directly attributable to each series are charged to that series’ operations; expenses which are applicable to all series are allocated among them on a pro rata basis.
The Financial Accounting Standards Board (“FASB”) Accounting Standards Codification (“ASC”) is the exclusive reference of authoritative U.S. generally accepted accounting principles (“GAAP”) recognized by the FASB to be applied by nongovernmental entities. Rules and interpretive releases of the SEC under authority of federal laws are also sources of authoritative GAAP for SEC registrants. The fund is an investment company and applies the accounting and reporting guidance of the FASB ASC Topic 946 Financial Services-Investment Companies. The fund’s financial statements are prepared in accordance with GAAP, which may require the use of management estimates and assumptions. Actual results could differ from those estimates.
The Company enters into contracts that contain a variety of indemnifications. The fund’s maximum exposure under these arrangements is unknown. The fund does not anticipate recognizing any loss related to these arrangements.
(a) Portfolio valuation: The fair value of a financial instrument is the amount that would be received to sell an asset or paid to transfer a liability in an orderly transaction between market participants at the measurement date (i.e., the exit price). GAAP establishes a fair value hierarchy that prioritizes the inputs of valuation techniques used to measure fair value. This hierarchy gives the highest priority to unadjusted quoted prices in active markets for identical assets or liabilities (Level 1 measurements) and the lowest priority to unobservable inputs (Level 3 measurements).
Additionally, GAAP provides guidance on determining whether the volume and activity in a market has decreased significantly and whether such a decrease in activity results in transactions that are not orderly.
23
NOTES TO FINANCIAL STATEMENTS (continued)
GAAP requires enhanced disclosures around valuation inputs and techniques used during annual and interim periods.
Various inputs are used in determining the value of the fund’s investments relating to fair value measurements. These inputs are summarized in the three broad levels listed below:
Level 1—unadjusted quoted prices in active markets for identical investments.
Level 2—other significant observable inputs (including quoted prices for similar investments, interest rates, prepayment speeds, credit risk, etc.).
Level 3—significant unobservable inputs (including the fund’s own assumptions in determining the fair value of investments).
The inputs or methodology used for valuing securities are not necessarily an indication of the risk associated with investing in those securities.
Changes in valuation techniques may result in transfers in or out of an assigned level within the disclosure hierarchy. Valuation techniques used to value the fund’s investments are as follows:
The Company’s Board of Directors (the “Board”) has designated the Adviser as the fund’s valuation designee, effective September 8, 2022, to make all fair value determinations with respect to the fund’s portfolio investments, subject to the Board’s oversight and pursuant to Rule 2a-5 under the Act.
Investments in equity securities are valued at the last sales price on the securities exchange or national securities market on which such securities are primarily traded. Securities listed on the National Market System for which market quotations are available are valued at the official closing price or, if there is no official closing price that day, at the last sales price. For open short positions, asked prices are used for valuation purposes. Bid price is used when no asked price is available. Registered investment companies that are not traded on an exchange are valued at their net asset value. All of the preceding securities are generally categorized within Level 1 of the fair value hierarchy.
Securities not listed on an exchange or the national securities market, or securities for which there were no transactions, are valued at the average of the most recent bid and asked prices. These securities are generally categorized within Level 2 of the fair value hierarchy.
Fair valuing of securities may be determined with the assistance of a pricing service using calculations based on indices of domestic securities
24
and other appropriate indicators, such as prices of relevant ADRs and futures. Utilizing these techniques may result in transfers between Level 1 and Level 2 of the fair value hierarchy.
When market quotations or official closing prices are not readily available, or are determined not to accurately reflect fair value, such as when the value of a security has been significantly affected by events after the close of the exchange or market on which the security is principally traded, but before the fund calculates its net asset value, the fund may value these investments at fair value as determined in accordance with the procedures approved by the Board. Certain factors may be considered when fair valuing investments such as: fundamental analytical data, the nature and duration of restrictions on disposition, an evaluation of the forces that influence the market in which the securities are purchased and sold, and public trading in similar securities of the issuer or comparable issuers. These securities are either categorized within Level 2 or 3 of the fair value hierarchy depending on the relevant inputs used.
For securities where observable inputs are limited, assumptions about market activity and risk are used and such securities are generally categorized within Level 3 of the fair value hierarchy.
Investment in private equity securities will be fair valued by the Board in accordance with valuation procedures approved by the Board. Those portfolio valuations will be based on unobservable inputs and certain assumptions about how market participants would price the instrument. The fund expects that inputs into the determination of fair value of those investments will require significant management judgment or estimation. Because valuations may fluctuate over short periods of time and may be based on estimates, fair value determinations may differ materially from the value received in an actual transaction. Additionally, valuations of private companies are inherently uncertain. The fund’s net asset value could be adversely affected if the fund’s determinations regarding the fair value of those investments were materially higher or lower than the values that it ultimately realized upon the disposal of such investments. These securities are categorized within Level 3 of the fair value hierarchy.
Investments denominated in foreign currencies are translated to U.S. dollars at the prevailing rates of exchange.
The following is a summary of the inputs used as of August 31, 2023 in valuing the fund’s investments:
25
NOTES TO FINANCIAL STATEMENTS (continued)
| | | | | | | |
| | Level 1-Unadjusted Quoted Prices | Level 2- Other Significant Observable Inputs | | Level 3-Significant Unobservable Inputs | Total | |
Assets ($) | | |
Investments in Securities:† | | |
Equity Securities - Common Stocks | 384,893,231 | - | | - | 384,893,231 | |
Equity Securities - Private Equity | - | - | | 2,171,086 | 2,171,086 | |
Investment Companies | 9,938,136 | - | | - | 9,938,136 | |
† See Statement of Investments for additional detailed categorizations, if any.
The following is a reconciliation of Level 3 assets for which significant unobservable inputs were used to determine fair value:
| | |
| | Equity Securities-Private Equity ($) |
Balance as of 8/31/2022† | 1,474,158 |
Purchases/Issuances | - |
Sales/Dispositions | - |
Net realized gain (loss) | - |
Change in unrealized appreciation (depreciation) | 696,928 |
Transfers into Level 3 | - |
Transfer out of Level 3 | - |
Balances as of 8/31/2023† | 2,171,086 |
The amount of total net realized gains (loss) for the period included in earnings attributable to the net change in unrealized appreciation (depreciation) relating to investments still held at 8/31/2023 | 696,928 |
† Securities deemed as Level 3 due to the lack of observable inputs by management assessment.
The following table summarizes the significant unobservable inputs the fund used to value its investment categorized within Level 3 as of August 31, 2023. In addition to the techniques and inputs noted in the table below, according to the fund’s valuation policy, other valuation techniques and methodologies when determining the fund’s fair value measurements may be used. The below table is not intended to be all-inclusive, but rather provide information on the significant unobservable inputs as they are to the fund’s determination of fair values.
26
| | | | | | | | | | | | |
Asset Category- Issuer Name | Value ($) | Valuation
Techniques/
Methodologies | Unobservable
Inputs | Range | |
Low | High | |
Private Equity: | | | | | |
Databricks | 2,171,086 | Public Comparables/ Enterprise Value | Enterprise Value as Multiple of Revenue | 6.9x | 16.3x |
(b) Foreign currency transactions: The fund does not isolate that portion of the results of operations resulting from changes in foreign exchange rates on investments from the fluctuations arising from changes in the market prices of securities held. Such fluctuations are included with the net realized and unrealized gain or loss on investments.
Net realized foreign exchange gains or losses arise from sales of foreign currencies, currency gains or losses realized on securities transactions between trade and settlement date, and the difference between the amounts of dividends, interest and foreign withholding taxes recorded on the fund’s books and the U.S. dollar equivalent of the amounts actually received or paid. Net unrealized foreign exchange gains and losses arise from changes in the value of assets and liabilities other than investments resulting from changes in exchange rates. Foreign currency gains and losses on foreign currency transactions are also included with net realized and unrealized gain or loss on investments.
Foreign taxes: The fund may be subject to foreign taxes (a portion of which may be reclaimable) on income, stock dividends, realized and unrealized capital gains on investments or certain foreign currency transactions. Foreign taxes are recorded in accordance with the applicable foreign tax regulations and rates that exist in the foreign jurisdictions in which the fund invests. These foreign taxes, if any, are paid by the fund and are reflected in the Statement of Operations, if applicable. Foreign taxes payable or deferred or those subject to reclaims as of August 31, 2023, if any, are disclosed in the fund’s Statement of Assets and Liabilities.
(c) Securities transactions and investment income: Securities transactions are recorded on a trade date basis. Realized gains and losses from securities transactions are recorded on the identified cost basis. Dividend income is recognized on the ex-dividend date and interest income, including, where applicable, accretion of discount and amortization of premium on investments, is recognized on the accrual basis.
Pursuant to a securities lending agreement with BNY Mellon, the fund may lend securities to qualified institutions. It is the fund’s policy that, at
27
NOTES TO FINANCIAL STATEMENTS (continued)
origination, all loans are secured by collateral of at least 102% of the value of U.S. securities loaned and 105% of the value of foreign securities loaned. Collateral equivalent to at least 100% of the market value of securities on loan is maintained at all times. Collateral is either in the form of cash, which can be invested in certain money market mutual funds managed by the Adviser, or U.S. Government and Agency securities. The fund is entitled to receive all dividends, interest and distributions on securities loaned, in addition to income earned as a result of the lending transaction. Should a borrower fail to return the securities in a timely manner, BNY Mellon is required to replace the securities for the benefit of the fund or credit the fund with the market value of the unreturned securities and is subrogated to the fund’s rights against the borrower and the collateral. Additionally, the contractual maturity of security lending transactions are on an overnight and continuous basis. During the period ended August 31, 2023, BNY Mellon earned $5,561 from the lending of the fund’s portfolio securities, pursuant to the securities lending agreement.
(d) Affiliated issuers: Investments in other investment companies advised by the Adviser are considered “affiliated” under the Act.
(e) Market Risk: The value of the securities in which the fund invests may be affected by political, regulatory, economic and social developments, and developments that impact specific economic sectors, industries or segments of the market. The value of a security may also decline due to general market conditions that are not specifically related to a particular company or industry, such as real or perceived adverse economic conditions, changes in the general outlook for corporate earnings, changes in interest or currency rates, changes to inflation, adverse changes to credit markets or adverse investor sentiment generally. In addition, turbulence in financial markets and reduced liquidity in equity, credit and/or fixed-income markets may negatively affect many issuers, which could adversely affect the fund. Global economies and financial markets are becoming increasingly interconnected, and conditions and events in one country, region or financial market may adversely impact issuers in a different country, region or financial market. These risks may be magnified if certain events or developments adversely interrupt the global supply chain; in these and other circumstances, such risks might affect companies world-wide.
(f) Dividends and distributions to shareholders: Dividends and distributions are recorded on the ex-dividend date. Dividends from net investment income and dividends from net realized capital gains, if any, are normally declared and paid annually, but the fund may make distributions on a more frequent basis to comply with the distribution requirements of
28
the Internal Revenue Code of 1986, as amended (the “Code”). To the extent that net realized capital gains can be offset by capital loss carryovers, it is the policy of the fund not to distribute such gains. Income and capital gain distributions are determined in accordance with income tax regulations, which may differ from GAAP.
(g) Federal income taxes: It is the policy of the fund to continue to qualify as a regulated investment company, if such qualification is in the best interests of its shareholders, by complying with the applicable provisions of the Code, and to make distributions of taxable income and net realized capital gain sufficient to relieve it from substantially all federal income and excise taxes.
As of and during the period ended August 31, 2023, the fund did not have any liabilities for any uncertain tax positions. The fund recognizes interest and penalties, if any, related to uncertain tax positions as income tax expense in the Statement of Operations. During the period ended August 31, 2023, the fund did not incur any interest or penalties.
Each tax year in the four-year period ended August 31, 2023 remains subject to examination by the Internal Revenue Service and state taxing authorities.
At August 31, 2023, the components of accumulated earnings on a tax basis were as follows: undistributed ordinary income $2,676,492, undistributed capital gains $8,355,525 and unrealized appreciation $63,625,744.
The tax character of distributions paid to shareholders during the fiscal years ended August 31, 2023 and August 31, 2022 were as follows: ordinary income $1,349,670 and $365,007 and long-term capital gains $25,269,757 and $57,701,256, respectively.
NOTE 2—Bank Lines of Credit:
The fund participates with other long-term open-end funds managed by the Adviser in a $823.5 million unsecured credit facility led by Citibank, N.A. (the “Citibank Credit Facility”) and a $300 million unsecured credit facility provided by BNY Mellon (the “BNYM Credit Facility”), each to be utilized primarily for temporary or emergency purposes, including the financing of redemptions (each, a “Facility”). The Citibank Credit Facility is available in two tranches: (i) Tranche A is in an amount equal to $688.5 million and is available to all long-term open-ended funds, including the fund, and (ii) Tranche B is an amount equal to $135 million and is available only to BNY Mellon Floating Rate Income Fund, a series of BNY Mellon Investment Funds IV, Inc. In connection therewith, the fund has agreed to
29
NOTES TO FINANCIAL STATEMENTS (continued)
pay its pro rata portion of commitment fees for Tranche A of the Citibank Credit Facility and the BNYM Credit Facility. Interest is charged to the fund based on rates determined pursuant to the terms of the respective Facility at the time of borrowing. During the period ended August 31, 2023, the fund did not borrow under the Facilities.
NOTE 3—Management Fee, Sub-Advisory Fee and Other Transactions with Affiliates:
(a) Pursuant to a management agreement with the Adviser, the management fee is computed at the annual rate of .75% of the value of the fund's average daily net assets and is payable monthly. The Adviser had contractually agreed from September 1, 2022 through December 31, 2022, to waive receipt of a portion of its management fee in the amount of .05% of the value of the fund’s average daily net assets. On December 31, 2022, the Adviser terminated this waiver agreement. The reduction in expenses, pursuant to the undertaking, amounted to $68,081 during the period ended August 31, 2023.
Pursuant to a sub-investment advisory agreement between the Adviser and the Sub-Adviser, the Adviser pays the Sub-Adviser a monthly fee at an annual rate of .36% of the value of the fund’s average daily net assets.
During the period ended August 31, 2023, the Distributor retained $2,374 from commissions earned on sales of the fund’s Class A shares and $5 from CDSC fees on redemptions of the fund’s Class C shares.
(b) Under the Distribution Plan adopted pursuant to Rule 12b-1 under the Act, Class C shares pay the Distributor for distributing its shares at an annual rate of .75% of the value of its average daily net assets. The Distributor may pay one or more Service Agents in respect of advertising, marketing and other distribution services, and determines the amounts, if any, to be paid to Service Agents and the basis on which such payments are made. During the period ended August 31, 2023, Class C shares were charged $46,641 pursuant to the Distribution Plan.
(c) Under the Shareholder Services Plan, Class A and Class C shares pay the Distributor at an annual rate of .25% of the value of their average daily net assets for the provision of certain services. The services provided may include personal services relating to shareholder accounts, such as answering shareholder inquiries regarding the fund, and services related to the maintenance of shareholder accounts. The Distributor may make payments to Service Agents (securities dealers, financial institutions or other industry professionals) with respect to these services. The Distributor determines the amounts to be paid to Service Agents. During the period ended August 31, 2023, Class A and Class C shares were
30
charged $707,455 and $15,547, respectively, pursuant to the Shareholder Services Plan.
The fund has an arrangement with BNY Mellon Transfer, Inc., (the “Transfer Agent”), a subsidiary of BNY Mellon and an affiliate of the Adviser, whereby the fund may receive earnings credits when positive cash balances are maintained, which are used to offset Transfer Agent fees. For financial reporting purposes, the fund includes transfer agent net earnings credits, if any, as an expense offset in the Statement of Operations.
The fund has an arrangement with The Bank of New York Mellon (the “Custodian”), a subsidiary of BNY Mellon and an affiliate of the Adviser, whereby the fund will receive interest income or be charged overdraft fees when cash balances are maintained. For financial reporting purposes, the fund includes this interest income and overdraft fees, if any, as interest income in the Statement of Operations.
The fund compensates the Transfer Agent, under a transfer agency agreement, for providing transfer agency and cash management services for the fund. The majority of Transfer Agent fees are comprised of amounts paid on a per account basis, while cash management fees are related to fund subscriptions and redemptions. During the period ended August 31, 2023, the fund was charged $59,504 for transfer agency services. These fees are included in Shareholder servicing costs in the Statement of Operations. These fees were partially offset by earnings credits of $49,513.
The fund compensates the Custodian, under a custody agreement, for providing custodial services for the fund. These fees are determined based on net assets, geographic region and transaction activity. During the period ended August 31, 2023, the fund was charged $7,740 pursuant to the custody agreement.
During the period ended August 31, 2023, the fund was charged $19,460 for services performed by the fund’s Chief Compliance Officer and his staff. These fees are included in Chief Compliance Officer fees in the Statement of Operations.
The components of “Due to BNY Mellon Investment Adviser, Inc. and affiliates” in the Statement of Assets and Liabilities consist of: management fee of $250,724, Distribution Plan fees of $3,208, Shareholder Services Plan fees of $60,847, Custodian fees of $2,800 and Chief Compliance Officer fees of $3,130.
31
NOTES TO FINANCIAL STATEMENTS (continued)
(d) Each board member also serves as a board member of other funds in the BNY Mellon Family of Funds complex. Annual retainer fees and attendance fees are allocated to each fund based on net assets.
NOTE 4—Securities Transactions:
The aggregate amount of purchases and sales of investment securities, excluding short-term securities, during the period ended August 31, 2023, amounted to $128,759,393 and $171,946,244, respectively.
At August 31, 2023, the cost of investments for federal income tax purposes was $333,376,955; accordingly, accumulated net unrealized appreciation on investments was $63,625,498, consisting of $86,409,955 gross unrealized appreciation and $22,784,457 gross unrealized depreciation.
32
REPORT OF INDEPENDENT REGISTERED PUBLIC ACCOUNTING FIRM
To the Shareholders and the Board of Directors of BNY Mellon Opportunistic Midcap Value Fund
Opinion on the Financial Statements
We have audited the accompanying statement of assets and liabilities of BNY Mellon Opportunistic Midcap Value Fund (the “Fund”) (one of the funds constituting BNY Mellon Advantage Funds, Inc. (the “Company”)), including the statement of investments, as of August 31, 2023, and the related statement of operations for the year then ended, the statements of changes in net assets for each of the two years in the period then ended, the financial highlights for each of the five years in the period then ended and the related notes (collectively referred to as the “financial statements”). In our opinion, the financial statements present fairly, in all material respects, the financial position of the Fund (one of the funds constituting BNY Mellon Advantage Funds, Inc.) at August 31, 2023, the results of its operations for the year then ended, the changes in its net assets for each of the two years in the period then ended and its financial highlights for each of the five years in the period then ended, in conformity with U.S. generally accepted accounting principles.
Basis for Opinion
These financial statements are the responsibility of the Company’s management. Our responsibility is to express an opinion on the Fund’s financial statements based on our audits. We are a public accounting firm registered with the Public Company Accounting Oversight Board (United States) (“PCAOB”) and are required to be independent with respect to the Company in accordance with the U.S. federal securities laws and the applicable rules and regulations of the Securities and Exchange Commission and the PCAOB.
We conducted our audits in accordance with the standards of the PCAOB. Those standards require that we plan and perform the audit to obtain reasonable assurance about whether the financial statements are free of material misstatement, whether due to error or fraud. The Company is not required to have, nor were we engaged to perform, an audit of the Company’s internal control over financial reporting. As part of our audits, we are required to obtain an understanding of internal control over financial reporting but not for the purpose of expressing an opinion on the effectiveness of the Company’s internal control over financial reporting. Accordingly, we express no such opinion.
Our audits included performing procedures to assess the risks of material misstatement of the financial statements, whether due to error or fraud, and performing procedures that respond to those risks. Such procedures included examining, on a test basis, evidence regarding the amounts and disclosures in the financial statements. Our procedures included confirmation of securities owned as of August 31, 2023, by correspondence with the custodian, brokers and others; when replies were not received from brokers and others, we performed other auditing procedures. Our audits also included evaluating the accounting principles used and significant estimates made by management, as well as evaluating the overall presentation of the financial statements. We believe that our audits provide a reasonable basis for our opinion.

We have served as the auditor of one or more investment companies in the BNY Mellon Family of Funds since at least 1957, but we are unable to determine the specific year.
New York, New York
October 23, 2023
33
IMPORTANT TAX INFORMATION (Unaudited)
For federal tax purposes, the fund hereby reports 100% of the ordinary dividends paid during the fiscal year ended August 31, 2023 as qualifying for the corporate dividends received deduction. Also, certain dividends paid by the fund may be subject to a maximum tax rate of 15%, as provided for by the Jobs and Growth Tax Relief Reconciliation Act of 2003. Of the distributions paid during the fiscal year, $1,349,670 represents the maximum amount that may be considered qualified dividend income. Shareholders will receive notification in early 2024 of the percentage applicable to the preparation of their 2023 income tax returns. The fund also hereby reports $1.8222 per share as a long-term capital gain distribution paid on December 8, 2022.
34
INFORMATION ABOUT THE RENEWAL OF THE FUND’S MANAGEMENT AND SUB-INVESTMENT ADVISORY AGREEMENTS AND THE APPROVAL OF THE FUND’S SUB- SUB-INVESTMENT ADVISORY AGREEMENT (Unaudited)
At a meeting of the fund’s Board of Directors held on March 14-15, 2023, the Board considered the renewal of the fund’s Management Agreement, pursuant to which the Adviser provides the fund with investment advisory and administrative services, and the Sub-Investment Advisory Agreement (together with the Management Agreement, the “Agreements”), pursuant to which Newton Investment Management North America, LLC (the “Sub-Adviser” or “NIMNA”) provides day-to-day management of the fund’s investments. The Board members, none of whom are “interested persons” (as defined in the Investment Company Act of 1940, as amended (the “1940 Act”)) of the fund, were assisted in their review by independent legal counsel and met with counsel in executive session separate from representatives of the Adviser and the Sub-Adviser. In considering the renewal of the Agreements, the Board considered several factors that it believed to be relevant, including those discussed below. The Board did not identify any one factor as dispositive, and each Board member may have attributed different weights to the factors considered.
Analysis of Nature, Extent, and Quality of Services Provided to the Fund. The Board considered information provided to it at the meeting and in previous presentations from representatives of the Adviser regarding the nature, extent, and quality of the services provided to funds in the BNY Mellon fund complex, including the fund. The Adviser provided the number of open accounts in the fund, the fund’s asset size and the allocation of fund assets among distribution channels. The Adviser also had previously provided information regarding the diverse intermediary relationships and distribution channels of funds in the BNY Mellon fund complex (such as retail direct or intermediary, in which intermediaries typically are paid by the fund and/or the Adviser) and the Adviser’s corresponding need for broad, deep, and diverse resources to be able to provide ongoing shareholder services to each intermediary or distribution channel, as applicable to the fund.
The Board also considered research support available to, and portfolio management capabilities of, the fund’s portfolio management personnel and that the Adviser also provides oversight of day-to-day fund operations, including fund accounting and administration and assistance in meeting legal and regulatory requirements. The Board also considered the Adviser’s extensive administrative, accounting and compliance infrastructures, as well as the Adviser’s supervisory activities over the Sub-Adviser. The Board also considered portfolio management’s brokerage policies and practices (including policies and practices regarding soft dollars) and the standards applied in seeking best execution.
Comparative Analysis of the Fund’s Performance and Management Fee and Expense Ratio. The Board reviewed reports prepared by Broadridge Financial Solutions, Inc. (“Broadridge”), an independent provider of investment company data based on classifications provided by Thomson Reuters Lipper (“Lipper”), which included information comparing (1) the performance of the fund’s Class I shares with the
35
INFORMATION ABOUT THE RENEWAL OF THE FUND’S MANAGEMENT AND SUB-INVESTMENT ADVISORY AGREEMENTS AND THE APPROVAL OF THE FUND’S SUB- SUB-INVESTMENT ADVISORY AGREEMENT (Unaudited) (continued)
performance of a group of institutional mid-cap core funds selected by Broadridge as comparable to the fund (the “Performance Group”) and with a broader group of funds consisting of all retail and institutional mid-cap core funds (the “Performance Universe”), all for various periods ended December 31, 2022, and (2) the fund’s actual and contractual management fees and total expenses with those of the same group of funds in the Performance Group (the “Expense Group”) and with a broader group of all institutional mid-cap core funds, excluding outliers (the “Expense Universe”), the information for which was derived in part from fund financial statements available to Broadridge as of the date of its analysis. The Adviser previously had furnished the Board with a description of the methodology Broadridge used to select the Performance Group and Performance Universe and the Expense Group and Expense Universe.
Performance Comparisons. Representatives of the Adviser stated that the usefulness of performance comparisons may be affected by a number of factors, including different investment limitations and policies that may be applicable to the fund and comparison funds and the end date selected. The Board also considered the fund’s performance in light of overall financial market conditions. The Board discussed with representatives of the Adviser and the Sub-Adviser the results of the comparisons and considered that the fund’s total return performance was above the Performance Group median for all periods, except for the two- and ten-year periods when the fund’s total return performance was below the Performance Group median, and was above the Performance Universe median for all periods, except for the two-year period when the fund’s total return performance was below the Performance Universe median. The Adviser also provided a comparison of the fund’s calendar year total returns to the returns of the fund’s benchmark index.
Management Fee and Expense Ratio Comparisons. The Board reviewed and considered the contractual management fee rate payable by the fund to the Adviser in light of the nature, extent and quality of the management services and the sub-advisory services provided by the Adviser and the Sub-Adviser, respectively. In addition, the Board reviewed and considered the actual management fee rate paid by the fund over the fund’s last fiscal year, which included reductions for a fee waiver arrangement in place that reduced the management fee paid to the Adviser. The Board also reviewed the range of actual and contractual management fees and total expenses as a percentage of average net assets of the Expense Group and Expense Universe funds and discussed the results of the comparisons.
The Board considered that the fund’s contractual management fee was lower than the Expense Group median contractual management fee, the fund’s actual management fee was lower than the Expense Group median and higher than the Expense Universe median actual management fee, and the fund’s total expenses were higher than the Expense Group median and higher than the Expense Universe median total expenses.
Representatives of the Adviser reviewed with the Board the management or investment advisory fees paid to the Adviser or the Sub-Adviser or its affiliates for advising any separate accounts and/or other types of client portfolios that are considered to have similar investment strategies and policies as the fund (the “Similar Clients”), and
36
explained the nature of the Similar Clients. They discussed differences in fees paid and the relationship of the fees paid in light of any differences in the services provided and other relevant factors. The Board considered the relevance of the fee information provided for the Similar Clients to evaluate the appropriateness of the fund’s management fee. Representatives of the Adviser noted that there were no other funds advised by the Adviser that are in the same Lipper category as the fund.
The Board considered the fee payable to the Sub-Adviser in relation to the fee payable to the Adviser by the fund and the respective services provided by the Sub-Adviser and the Adviser. The Board also took into consideration that the Sub-Adviser’s fee is paid by the Adviser, out of its fee from the fund, and not the fund.
Analysis of Profitability and Economies of Scale. Representatives of the Adviser reviewed the expenses allocated and profit received by the Adviser and its affiliates and the resulting profitability percentage for managing the fund and the aggregate profitability percentage to the Adviser and its affiliates for managing the funds in the BNY Mellon fund complex, and the method used to determine the expenses and profit. The Board concluded that the profitability results were not excessive, given the services rendered and service levels provided by the Adviser and its affiliates. The Board also considered the fee waiver arrangement and its effect on the profitability of the Adviser and its affiliates. The Board also had been provided with information prepared by an independent consulting firm regarding the Adviser’s approach to allocating costs to, and determining the profitability of, individual funds and the entire BNY Mellon fund complex. The consulting firm also had analyzed where any economies of scale might emerge in connection with the management of a fund.
The Board considered, on the advice of its counsel, the profitability analysis (1) as part of its evaluation of whether the fees under the Agreements, considered in relation to the mix of services provided by the Adviser and the Sub-Adviser, including the nature, extent and quality of such services, supported the renewal of the Agreements and (2) in light of the relevant circumstances for the fund and the extent to which economies of scale would be realized if the fund grows and whether fee levels reflect these economies of scale for the benefit of fund shareholders. Since the Adviser, and not the fund, pays the Sub-Adviser pursuant to the Sub-Investment Advisory Agreement, the Board did not consider the Sub-Adviser’s profitability to be relevant to its deliberations. Representatives of the Adviser stated that a discussion of economies of scale is predicated on a fund having achieved a substantial size with increasing assets and that, if a fund’s assets had been stable or decreasing, the possibility that the Adviser may have realized any economies of scale would be less. Representatives of the Adviser also stated that, as a result of shared and allocated costs among funds in the BNY Mellon fund complex, the extent of economies of scale could depend substantially on the level of assets in the complex as a whole, so that increases and decreases in complex-wide assets can affect potential economies of scale in a manner that is disproportionate to, or even in the opposite direction from, changes in the fund’s asset level. The Board also considered potential benefits to the Adviser and the Sub-Adviser from acting as
37
INFORMATION ABOUT THE RENEWAL OF THE FUND’S MANAGEMENT AND SUB-INVESTMENT ADVISORY AGREEMENTS AND THE APPROVAL OF THE FUND’S SUB- SUB-INVESTMENT ADVISORY AGREEMENT (Unaudited) (continued)
investment adviser and sub-investment adviser, respectively, and took into consideration the soft dollar arrangements in effect for trading the fund’s investments.
At the conclusion of these discussions, the Board agreed that it had been furnished with sufficient information to make an informed business decision with respect to the renewal of the Agreements. Based on the discussions and considerations as described above, the Board concluded and determined as follows.
· The Board concluded that the nature, extent and quality of the services provided by the Adviser and the Sub-Adviser are adequate and appropriate.
· The Board was satisfied with the fund’s performance.
· The Board concluded that the fees paid to the Adviser and the Sub-Adviser continued to be appropriate under the circumstances and in light of the factors and the totality of the services provided as discussed above.
· The Board determined that the economies of scale which may accrue to the Adviser and its affiliates in connection with the management of the fund had been adequately considered by the Adviser in connection with the fee rate charged to the fund pursuant to the Management Agreement and that, to the extent in the future it were determined that material economies of scale had not been shared with the fund, the Board would seek to have those economies of scale shared with the fund.
In evaluating the Agreements, the Board considered these conclusions and determinations and also relied on its previous knowledge, gained through meetings and other interactions with the Adviser and its affiliates and the Sub-Adviser, of the Adviser and the Sub-Adviser and the services provided to the fund by the Adviser and the Sub-Adviser. The Board also relied on information received on a routine and regular basis throughout the year relating to the operations of the fund and the investment management and other services provided under the Agreements, including information on the investment performance of the fund in comparison to similar mutual funds and benchmark performance indices; general market outlook as applicable to the fund; and compliance reports. In addition, the Board’s consideration of the contractual fee arrangements for the fund had the benefit of a number of years of reviews of the Agreements for the fund, or substantially similar agreements for other BNY Mellon funds that the Board oversees, during which lengthy discussions took place between the Board and representatives of the Adviser. Certain aspects of the arrangements may receive greater scrutiny in some years than in others, and the Board’s conclusions may be based, in part, on its consideration of the fund’s arrangements, or substantially similar arrangements for other BNY Mellon funds that the Board oversees, in prior years. The Board determined to renew the Agreements.
*******
38
At the meeting of the fund’s Board held on March 14-15, 2023, the Board also considered the approval of a delegation arrangement between NIMNA and its affiliate, Newton Investment Management Limited (“NIM”), which permits NIMNA, as the fund’s sub-investment adviser, to use the investment advisory personnel, resources and capabilities (“Investment Advisory Services”) available at its sister company, NIM, in providing the day-to-day management of the fund’s investments. In connection therewith, the Board considered the approval of a sub-sub-investment advisory agreement (the “SSIA Agreement”) between NIMNA and NIM, with respect to the fund. In considering the approval of the SSIA Agreement, the Board considered several factors that it believed to be relevant, including those discussed below. The Board did not identify any one factor as dispositive, and each Board member may have attributed different weights to the factors considered.
At the meeting, the Adviser and the Sub-Adviser recommended the approval of the SSIA Agreement to enable NIM to provide Investment Advisory Services to the Sub-Adviser for the benefit of the fund, including, but not limited to, portfolio management services, subject to the supervision of the Sub-Adviser and the Adviser. The recommendation for the approval of the SSIA Agreement was based on the following considerations, among others: (i) approval of the SSIA Agreement would permit the Sub-Adviser to use investment personnel employed primarily by NIM as primary portfolio managers of the fund and to use the investment research services of NIM in the day-to-day management of the fund’s investments; and (ii) there would be no material changes to the fund’s investment objective, strategies or policies, no reduction in the nature or level of services provided to the fund, and no increases in the management fee payable by the fund or the sub-advisory fee payable by the Adviser to the Sub-Adviser as a result of the delegation arrangement. The Board also considered the fact that the Adviser stated that it believed there were no material changes to the information the Board had previously considered at the meeting in connection with the Board’s re-approval of the Agreements for the ensuing year, other than the information about the delegation arrangement and NIM.
In determining whether to approve the SSIA Agreement, the Board considered the materials prepared by the Adviser and the Sub-Adviser received in advance of the meeting and other information presented at the meeting, which included: (i) a form of the SSIA Agreement; (ii) information regarding the delegation arrangement and how it is expected to enhance investment capabilities for the benefit of the fund; (iii) information regarding NIM; and (iv) an opinion of counsel that the proposed delegation arrangement would not result in an “assignment” of the Sub-Investment Advisory Agreement under the 1940 Act and the Investment Advisers Act of 1940, as amended, and, therefore, did not require the approval of fund shareholders. The Board also considered the substance of discussions with representatives of the Adviser and the Sub-Adviser at the meeting in connection with the Board’s re-approval of the Agreements.
Nature, Extent and Quality of Services to be Provided. In examining the nature, extent and quality of the services that were expected to be provided by NIM under the SSIA
39
INFORMATION ABOUT THE RENEWAL OF THE FUND’S MANAGEMENT AND SUB-INVESTMENT ADVISORY AGREEMENTS AND THE APPROVAL OF THE FUND’S SUB- SUB-INVESTMENT ADVISORY AGREEMENT (Unaudited) (continued)
Agreement, the Board considered: (i) NIM’s organization, qualification and background, as well as the qualifications of its personnel; (ii) the expertise of the personnel providing portfolio management services; (iii) information regarding NIM’s compliance program; and (iv) the investment strategy for the fund, which would remain the same. The Board also considered that enabling the Sub-Adviser to use the proposed Investment Advisory Services provided by NIM, the Sub-Adviser would provide investment and portfolio management services of at least the same nature, extent and quality that it currently provides to the fund without the ability to use the Investment Advisory Services of its sister company. Based on the considerations and review of the foregoing information, the Board concluded that the nature, extent and quality of the sub-investment advisory services to be provided by the Sub-Adviser having the ability to use the Investment Advisory Services supported a decision to approve the SSIA Agreement.
Investment Performance. The Board considered the fund’s investment performance and that of the investment team managing the fund’s portfolio (including comparative data provided by Broadridge) at the meeting in connection with the Board’s re-approval of the Agreements. The Board considered that the same investment professionals would continue to manage the fund’s assets and that enabling the Sub-Adviser to use the Investment Advisory Services pursuant to the SSIA Agreement for the benefit of the fund supported a decision to approve the SSIA Agreement.
Costs of Services to be Provided and Profitability. The Board considered the contractual management fee payable by the fund to the Adviser pursuant to the Management Agreement and the contractual sub-investment advisory fee payable by the Adviser to the Sub-Adviser pursuant to the Sub-Investment Advisory Agreement at the meeting in connection with the Board’s re-approval of the Agreements. The Board noted that the contractual management fee payable by the fund to the Adviser and the sub-investment advisory fee payable by the Adviser to the Sub-Adviser, would not change in connection with the proposed delegation arrangement. The Board recognized that, because the fees payable would not change, an analysis of profitability was more appropriate in the context of the Board’s consideration of the Agreements, and that the Board had received and considered a profitability analysis of the Adviser and its affiliates, including NIMNA, at the meeting in connection with the Board’s re-approval of the Agreements. The Board concluded that the Adviser’s profitability was not excessive in light of the nature, extent and quality of the services to be provided to the fund by the Adviser and the Sub-Adviser under the Agreements.
Economies of Scale to be Realized. The Board recognized that, because the fees payable by the fund to the Adviser pursuant to the Management Agreement and the contractual sub-investment advisory fee payable by the Adviser to the Sub-Adviser pursuant to the Sub-Investment Advisory Agreement would not change in connection with the proposed delegation arrangement, an analysis of economies of scale was more appropriate in the context of the Board’s consideration of the Agreements, which had been done at the meeting in connection with the Board’s re-approval of the Agreements. At the meeting, the Board determined that the economies of scale which may accrue to the Adviser and its affiliates in connection with the management of the
40
fund had been adequately considered by the Adviser in connection with the fee rate charged to the fund pursuant to the Agreements and that, to the extent in the future it were determined that material economies of scale had not been shared with the fund, the Board would seek to have those economies of scale shared with the fund.
The Board also considered whether there were any ancillary benefits that would accrue to the Sub-Adviser as a result of its relationship with the fund after the delegation arrangement, and such ancillary benefits, if any, were determined to be reasonable.
After full consideration of the factors discussed above, with no single factor identified as being of paramount importance, the Board, with the assistance of independent legal counsel, approved the delegation arrangement and the SSIA Agreement for the fund.
41
LIQUIDITY RISK MANAGEMENT PROGRAM (Unaudited)
The fund adopted a liquidity risk management program (the “Liquidity Risk Management Program”) pursuant to the requirements of Rule 22e-4 under the Investment Company Act of 1940, as amended. Rule 22e-4 requires registered open-end funds, including mutual funds and exchange-traded funds but not money market funds, to establish liquidity risk management programs in order to effectively manage fund liquidity and shareholder redemptions. The rule is designed to mitigate the risk that a fund could not meet redemption requests without significantly diluting the interests of remaining investors.
The rule requires the fund to assess, manage and review their liquidity risk at least annually considering applicable factors such as investment strategy and liquidity during normal and foreseeable stressed conditions, including whether the strategy is appropriate for an open-end fund and whether the fund has a relatively concentrated portfolio or large positions in particular issuers. The fund must also assess its use of borrowings and derivatives, short-term and long-term cash flow projections in normal and stressed conditions, holdings of cash and cash equivalents, and borrowing arrangements and other funding sources.
The rule also requires the fund to classify its investments as highly liquid, moderately liquid, less liquid or illiquid based on the number of days the fund expects it would take to liquidate the investment, and to review these classifications at least monthly or more often under certain conditions. The periods range from three or fewer business days for a highly liquid investment to greater than seven calendar days for settlement of a less liquid investment. Illiquid investments are those a fund does not expect to be able to sell or dispose of within seven calendar days without significantly changing the market value. The fund is prohibited from acquiring an investment if, after the acquisition, its holdings of illiquid assets will exceed 15% of its net assets. In addition, if a fund permits redemptions in-kind, the rule requires the fund to establish redemption in-kind policies and procedures governing how and when it will engage in such redemptions.
Pursuant to the rule’s requirements, the Liquidity Risk Management Program has been reviewed and approved by the Board. Furthermore, the Board has received a written report prepared by the Program’s Administrator that addresses the operation of the Program, assesses its adequacy and effectiveness and describes any material changes made to the Program.
Assessment of Program
In the opinion of the Program Administrator, the Program approved by the Board continues to be adequate for the fund and the Program has been implemented effectively. The Program Administrator has monitored the fund’s liquidity risk and the liquidity classification of the securities held by the fund and has determined that the Program is operating effectively.
During the period from January 1, 2022 to December 31, 2022, there were no material changes to the Program and no material liquidity events that impacted the fund. During the period, the fund held sufficient highly liquid assets to meet fund redemptions.
Under normal expected foreseeable fund redemption forecasts and foreseeable stressed fund redemption forecasts, the Program Administrator believes that the fund maintains sufficient highly liquid assets to meet expected fund redemptions.
42
BOARD MEMBERS INFORMATION (Unaudited)
Independent Board Members
Joseph S. DiMartino (79)
Chairman of the Board (1995)
Principal Occupation During Past 5 Years:
· Director or Trustee of funds in the BNY Mellon Family of Funds and certain other entities (as described in the fund’s Statement of Additional Information) (1995-Present)
Other Public Company Board Memberships During Past 5 Years:
· CBIZ, Inc., a public company providing professional business services, products and solutions, Director (1997-May 2023)
No. of Portfolios for which Board Member Serves: 86
———————
Peggy C. Davis (80)
Board Member (2006)
Principal Occupation During Past 5 Years:
· Shad Professor of Law, New York University School of Law (1983-Present)
No. of Portfolios for which Board Member Serves: 29
———————
Gina D. France (65)
Board Member (2019)
Principal Occupation During Past 5 Years:
· France Strategic Partners, a strategy and advisory firm serving corporate clients across the United States, Founder, President and Chief Executive Officer (2003-Present)
Other Public Company Board Memberships During Past 5 Years:
· Huntington Bancshares, a bank holding company headquartered in Columbus, Ohio, Director (2016-Present)
· Cedar Fair, L.P., a publicly-traded partnership that owns and operates amusement parks and hotels in the U.S. and Canada, Director (2011-May 2023)
· CBIZ, Inc., a public company providing professional business services, products and solutions, Director (2015-Present)
No. of Portfolios for which Board Member Serves: 22
———————
Joan Gulley (75)
Board Member (2017)
Principal Occupation During Past 5 Years:
· Nantucket Atheneum, public library, Chair (June 2018-June 2021) and Director (2015-June 2021)
· Orchard Island Club, golf and beach club, Governor (2016-Present) and President (February 2023-Present)
No. of Portfolios for which Board Member Serves: 39
———————
43
BOARD MEMBERS INFORMATION (Unaudited) (continued)
Robin A. Melvin (59)
Board Member (2012)
Principal Occupation During Past 5 Years:
· Westover School, a private girls’ boarding school in Middlebury, Connecticut, Trustee (2019-June 2023)
· Mentor Illinois, a non-profit organization dedicated to increasing the quantity and quality of mentoring services in Illinois, Co-Chair (2014–2020); Board Member (2013-2020)
· JDRF, a non-profit juvenile diabetes research foundation, Board Member (June 2021-June 2022)
Other Public Company Board Memberships During Past 5 Years:
· HPS Corporate Lending Fund, a closed-end management investment company regulated as a business development company, Trustee (August 2021-Present)
No. of Portfolios for which Board Member Serves: 68
———————
Michael D. DiLecce (61)
Advisory Board Member (2022)
Principal Occupation During Past 5 Years:
· Retired since July 2022. Global Asset Management Assurance Leader, Ernst & Young LLP (2015-2022)
· Americas Regional Talent Managing Partner for Ernst & Young’s Financial Service Practice (2017-2021)
· Partner, Ernst & Young LLP (1997-2022)
No. of Portfolios for which Board Member Serves: 22
———————
The address of the Board Members and Officers is c/o BNY Mellon Investment Adviser, Inc., 240 Greenwich Street, New York, New York 10286. Additional information about each Board Member is available in the fund’s Statement of Additional Information which can be obtained from the Adviser free of charge by calling this toll free number: 1-800-373-9387.
44
OFFICERS OF THE FUND (Unaudited)
DAVID DIPETRILLO, President since January 2021.
Vice President and Director of the Adviser since February 2021; Head of North America Distribution, BNY Investment Management since February 2023; and Head of North America Product, BNY Mellon Investment Management from January 2018 to February 2023. He is an officer of 53 investment companies (comprised of 103 portfolios) managed by the Adviser or an affiliate of the Adviser. He is 45 years old and has been an employee of BNY Mellon since 2005.
JAMES WINDELS, Treasurer since November 2001.
Director of the Adviser since February 2023; Vice President of the Adviser since September 2020; and Director–BNY Mellon Fund Administration. He is an officer of 54 investment companies (comprised of 122 portfolios) managed by the Adviser or an affiliate of the Adviser. He is 64 years old and has been an employee of the Adviser since April 1985.
PETER M. SULLIVAN, Chief Legal Officer since July 2021 and Vice President and Assistant Secretary since March 2019.
Chief Legal Officer of the Adviser and Associate General Counsel of BNY Mellon since July 2021; Senior Managing Counsel of BNY Mellon from December 2020 to July 2021; and Managing Counsel of BNY Mellon from March 2009 to December 2020. He is an officer of 54 investment companies (comprised of 122 portfolios) managed by the Adviser or an affiliate of the Adviser. He is 55 years old and has been an employee of BNY Mellon since April 2004.
JAMES BITETTO, Vice President since August 2005 and Secretary since February 2018.
Senior Managing Counsel of BNY Mellon since December 2019; Managing Counsel of BNY Mellon from April 2014 to December 2019; and Secretary of the Adviser. He is an officer of 54 investment companies (comprised of 122 portfolios) managed by the Adviser or an affiliate of the Adviser. He is 57 years old and has been an employee of the Adviser since December 1996.
DEIRDRE CUNNANE, Vice President and Assistant Secretary since March 2019.
Managing Counsel of BNY Mellon since December 2021; and Counsel of BNY Mellon from August 2018 to December 2021. She is an officer of 54 investment companies (comprised of 122 portfolios) managed by the Adviser or an affiliate of the Adviser. She is 33 years old and has been an employee of BNY Mellon since August 2013.
SARAH S. KELLEHER, Vice President and Assistant Secretary since April 2014.
Vice President of BNY Mellon ETF Investment Adviser; LLC since February 2020; Senior Managing Counsel of BNY Mellon since September 2021; and Managing Counsel of BNY Mellon from December 2017 to September 2021. She is an officer of 54 investment companies (comprised of 122 portfolios) managed by the Adviser or an affiliate of the Adviser. She is 47 years old and has been an employee of BNY Mellon since March 2013.
JEFF PRUSNOFSKY, Vice President and Assistant Secretary since August 2005.
Senior Managing Counsel of BNY Mellon. He is an officer of 54 investment companies (comprised of 122 portfolios) managed by the Adviser or an affiliate of the Adviser. He is 58 years old and has been an employee of the Adviser since October 1990.
AMANDA QUINN, Vice President and Assistant Secretary since March 2020.
Counsel of BNY Mellon since June 2019; Regulatory Administration Manager at BNY Mellon Investment Management Services from September 2018 to May 2019; and Senior Regulatory Specialist at BNY Mellon Investment Management Services from April 2015 to August 2018. She is an officer of 54 investment companies (comprised of 122 portfolios) managed by the Adviser or an affiliate of the Adviser. She is 38 years old and has been an employee of BNY Mellon since June 2012.
JOANNE SKERRETT, Vice President and Assistant Secretary since March 2023.
Managing Counsel of BNY Mellon since June 2022; and Senior Counsel with the Mutual Fund Directors Forum, a leading funds industry organization, from 2016 to June 2022. She is an officer of 54 investment companies (comprised of 122 portfolios) managed by the Adviser or an affiliate of the Adviser. She is 51 years old and has been an employee of the Adviser since June 2022.
45
OFFICERS OF THE FUND (Unaudited) (continued)
NATALYA ZELENSKY, Vice President and Assistant Secretary since March 2017.
Chief Compliance Officer since August 2021 and Vice President since February 2020 of BNY Mellon ETF Investment Adviser, LLC; Chief Compliance Officer since August 2021 and Vice President and Assistant Secretary since February 2020 of BNY Mellon ETF Trust; Managing Counsel of BNY Mellon from December 2019 to August 2021; Counsel of BNY Mellon from May 2016 to December 2019; and Assistant Secretary of the Adviser from April 2018 to August 2021. She is an officer of 54 investment companies (comprised of 122 portfolios) managed by the Adviser or an affiliate of the Adviser. She is 38 years old and has been an employee of BNY Mellon since May 2016.
DANIEL GOLDSTEIN, Vice President since March 2022.
Head of Product Development of North America Distribution, BNY Mellon Investment Management since January 2018; Executive Vice President of North America Product, BNY Mellon Investment Management since April 2023; and Senior Vice President, Development & Oversight of North America Product, BNY Mellon Investment Management from 2010 to March 2023. He is an officer of 53 investment companies (comprised of 103 portfolios) managed by the Adviser or an affiliate of the Adviser. He is 54 years old and has been an employee of the Distributor since 1991.
JOSEPH MARTELLA, Vice President since March 2022.
Vice President of the Adviser since December 2022; Head of Product Management of North America Distribution, BNY Mellon Investment Management since January 2018; Executive Vice President of North America Product, BNY Mellon Investment Management since April 2023; and Senior Vice President of North America Product, BNY Mellon Investment Management from 2010 to March 2023. He is an officer of 53 investment companies (comprised of 103 portfolios) managed by the Adviser or an affiliate of the Adviser. He is 46 years old and has been an employee of the Distributor since 1999.
GAVIN C. REILLY, Assistant Treasurer since December 2005.
Tax Manager–BNY Mellon Fund Administration. He is an officer of 54 investment companies (comprised of 122 portfolios) managed by the Adviser or an affiliate of the Adviser. He is 55 years old and has been an employee of the Adviser since April 1991.
ROBERT SALVIOLO, Assistant Treasurer since July 2007.
Senior Accounting Manager–BNY Mellon Fund Administration. He is an officer of 54 investment companies (comprised of 122 portfolios) managed by the Adviser or an affiliate of the Adviser. He is 56 years old and has been an employee of the Adviser since June 1989.
ROBERT SVAGNA, Assistant Treasurer since December 2002.
Senior Accounting Manager–BNY Mellon Fund Administration. He is an officer of 54 investment companies (comprised of 122 portfolios) managed by the Adviser or an affiliate of the Adviser. He is 56 years old and has been an employee of the Adviser since November 1990.
JOSEPH W. CONNOLLY, Chief Compliance Officer since October 2004.
Chief Compliance Officer of the BNY Mellon Family of Funds and BNY Mellon Funds Trust since 2004; and Chief Compliance Officer of the Adviser from 2004 until June 2021. He is the Chief Compliance Officer of 53 investment companies (comprised of 105 portfolios) managed by the Adviser. He is 66 years old.
CARIDAD M. CAROSELLA, Anti-Money Laundering Compliance Officer since January 2016.
Anti-Money Laundering Compliance Officer of the BNY Mellon Family of Funds and BNY Mellon Funds Trust. She is an officer of 47 investment companies (comprised of 115 portfolios) managed by the Adviser or an affiliate of the Adviser. She is 55 years old and has been an employee of the Distributor since 1997.
46
This page intentionally left blank.
47
This page intentionally left blank.
48
This page intentionally left blank.
49
BNY Mellon Opportunistic Midcap Value Fund
240 Greenwich Street
New York, NY 10286
Adviser
BNY Mellon Investment Adviser, Inc.
240 Greenwich Street
New York, NY 10286
Sub-Adviser
Newton Investment Management
North America, LLC
BNY Mellon Center
201 Washington Street
Boston, MA 02108
Custodian
The Bank of New York Mellon
240 Greenwich Street
New York, NY 10286
Transfer Agent &
Dividend Disbursing Agent
BNY Mellon Transfer, Inc.
240 Greenwich Street
New York, NY 10286
Distributor
BNY Mellon Securities Corporation
240 Greenwich Street
New York, NY 10286
| | |
Ticker Symbols: | Class A: DMCVX Class C: DVLCX Class I: DVLIX Class Y: DMCYX |
Telephone Call your financial representative or 1-800-373-9387
Mail The BNY Mellon Family of Funds, 144 Glenn Curtiss Boulevard, Uniondale, NY 11556-0144
E-mail Send your request to info@bnymellon.com
Internet Information can be viewed online or downloaded at www.im.bnymellon.com
The fund files its complete schedule of portfolio holdings with the Securities and Exchange Commission (“SEC”) for the first and third quarters of each fiscal year on Form N-PORT. The fund’s Forms N-PORT are available on the SEC’s website at www.sec.gov.
A description of the policies and procedures that the fund uses to determine how to vote proxies relating to portfolio securities and information regarding how the fund voted these proxies for the most recent 12-month period ended June 30 is available at www.im.bnymellon.com and on the SEC’s website at www.sec.gov and without charge, upon request, by calling 1-800-373-9387.
| | |
© 2023 BNY Mellon Securities Corporation
0258AR0823 | 
|
BNY Mellon Opportunistic Small Cap Fund
| |
ANNUAL REPORT August 31, 2023 |
| |
Save time. Save paper. View your next shareholder report online as soon as it’s available. Log into www.im.bnymellon.com and sign up for eCommunications. It’s simple and only takes a few minutes. |
| |
The views expressed in this report reflect those of the portfolio manager(s) only through the end of the period covered and do not necessarily represent the views of BNY Mellon Investment Adviser, Inc. or any other person in the BNY Mellon Investment Adviser, Inc. organization. Any such views are subject to change at any time based upon market or other conditions and BNY Mellon Investment Adviser, Inc. disclaims any responsibility to update such views. These views may not be relied on as investment advice and, because investment decisions for a fund in the BNY Mellon Family of Funds are based on numerous factors, may not be relied on as an indication of trading intent on behalf of any fund in the BNY Mellon Family of Funds. |
| |
Not FDIC-Insured • Not Bank-Guaranteed • May Lose Value |
Contents
THE FUND
FOR MORE INFORMATION
Back Cover
DISCUSSION OF FUND PERFORMANCE (Unaudited)
For the period from September 1, 2022, through August 31, 2023, as provided by R. Patrick Kent, lead portfolio manager, and Andrew Leger, portfolio manager of Newton Investment Management North America, LLC, sub-adviser.
Market and Fund Performance Overview
For the 12-month period ended August 31, 2023, BNY Mellon Opportunistic Small Cap Fund’s (the “fund”) Investor shares achieved a total return of 3.36%, Class I shares returned 3.53% and Class Y shares returned 3.69%.1 In comparison, the fund’s benchmark, the Russell 2000® Index (the “Index”), produced a total return of 4.65% for the same period.2
Small-cap stocks gained ground over the reporting period as inflation eased, investors began to anticipate the end of the Federal Reserve’s (the “Fed”) monetary tightening program and the economy remained buoyant. The fund underperformed the Index, mainly due to unfavorable asset allocation and stock selection.
The Fund’s Investment Approach
The fund seeks capital appreciation. To pursue its goal, the fund normally invests at least 80% of its net assets, plus any borrowings for investment purposes, in the stocks of small-cap companies. The fund currently considers small-cap companies to be those companies with market capitalizations that fall within the range of companies in the Index. Stocks are selected for the fund’s portfolio based primarily on bottom-up, fundamental analysis. The fund’s portfolio managers use a disciplined investment process that relies, in general, on proprietary fundamental research and valuation. Generally, elements of the process include analysis of mid-cycle business prospects, estimation of the intrinsic value of the company and the identification of a revaluation trigger. The fund’s portfolio managers invest in securities and sectors that they perceive to be attractive from a valuation and fundamental standpoint.
Market Supported by Easing Inflation, Economic Resilience
The reporting period was marked by a range of factors that affected returns. Early in the period, the dominant theme was the Fed’s continued monetary tightening policies aimed at curbing inflation. Added to this was the banking crisis that emerged early in 2023. Uncertainty about the outcome of the debt ceiling standoff in the Congress also weighed on markets, as did some weaker-than-expected performance of China’s economy. Easing inflation, continued economic growth, the anticipated end to the Fed’s rate hikes and the emergence of the artificial intelligence (“AI”) theme provided markets with support.
The Fed raised the federal funds rate seven times during the period but reduced the size of the increase from 75 basis points to just 25 basis points for the last four hikes. The smaller rate hikes late in the period disappointed markets somewhat, as many investors were hoping for an end to the hiking cycle, given some signs of economic slowing.
Economic data showed that as pricing pressures continued to weaken from their peak in June 2022, the labor market also began to soften. Though unemployment remained relatively low, some large technology companies announced layoffs or paused hiring amid a more cautious macroeconomic outlook.
2
The banking crisis that emerged early in 2023 gave investors another reason to believe the Fed’s tightening policy would not continue. Three regional banks—Silicon Valley Bank, Signature Bank and First Republic Bank—faced mounting losses in their long-dated bond holdings as interest rates rose. Uninsured depositors were spooked by the headlines and lost confidence, choosing to move their money into larger money center banks.
In May 2023, the debate in Congress over the federal debt ceiling reached an apparent standoff, resulting in some market volatility. While an agreement was eventually reached, providing the market with some relief, the run-up caused some turmoil as the prospect of a default was threatened.
In addition to easing inflation and investors’ growing anticipation of the end to the Fed’s tightening cycle, the possibility the economy could avoid recession also provided some support as a widely expected recession failed to arrive. China’s weaker-than-expected rebound from its Zero-COVID policies, however, disappointed investors somewhat.
The market was also supported by the launch of ChatGPT by Open AI, which drew investors’ attention to the promise of artificial intelligence and its likely enhancement of productivity and economic growth. While the most immediate beneficiaries of this news were large-cap growth stocks in the information technology sector, their performance provided support to the market as a whole.
Performance Hurt by Allocation and Stock Selection
The fund’s underperformance versus the Index stemmed from poor sector allocation and stock selection. Underweight allocations in the industrial and information technology sectors were detrimental, as was an overweight to utilities. In information technology, the underweight effect was most pronounced in the semiconductor and semiconductor equipment industry, which gained 23% over the period.
As for the selection effect, in the information technology sector, shares of Edgio, Inc., a content delivery service network, lagged as a result of an acquisition that has weighed on performance. However, the company is expected to benefit from increasing interest in AI, as AI will involve more “edge” computing, which maintains content closer to the end user. Selections in the utilities sector also detracted, especially among independent power producers, which were hurt by rising interest rates. In the consumer discretionary sector, the fund’s position in Allbirds, Inc., a footwear and apparel company, also detracted, as did shares of pet supply retailer Petco Health & Wellness, which were hurt by unfavorable comparisons with financial results during the COVID-19 pandemic.
On a more positive note, stock choices in certain sectors made significant contributions. In the industrial sector, positions in SkyWest, Inc., a regional carrier, and in Fluor Corp., an engineering and construction firm, contributed most. In the materials sector, the fund’s position in Alamos Gold, Inc., a mining company, posted strong gains on rising gold prices and good execution. In the communication services sector, shares of EventBrite, Inc., an online event ticketing company, benefited from continued recovery from the pandemic.
3
DISCUSSION OF FUND PERFORMANCE (Unaudited) (continued)
Focused on Defensive Sectors and Recurring Cash Flows
The revenue and profit outlook depends on whether employment can remain full while inflation continues to move lower. This would allow the Fed to stop rate increases and remain on hold.
Unfortunately, leading indicators point to continued slowdown, and the inversion in the Treasury yield curve also points to a high probability of recession in the coming months. In addition, consumer spending growth will also be challenged. Interest rates on credit cards have risen dramatically, and balances have gone up as well, resulting in increasing payment delinquencies. Energy prices are beginning to increase, and the national average gasoline price has risen substantially from the start of the year. Student loan payments are due to begin again in the coming month, presenting another a drag on consumer spending.
If the Fed fails to achieve a soft landing, and a recession unfolds in the next 12 to 24 months, as appears likely, we believe it will change the downside analysis for many equities. For companies in the S&P 500, the median decline in earnings during a recession is approximately 22%. For this reason, we are focused on companies in sectors and industries in which the cash flow is more resilient, including health care, utilities and off-price retailers as well as other segments with high recurring revenues.
September 15, 2023
1 Total return includes reinvestment of dividends and any capital gains paid. Past performance is no guarantee of future results. Share price and investment return fluctuate such that upon redemption, fund shares may be worth more or less than their original cost.
2 Source: Lipper Inc. — The Russell 2000® Index measures the performance of the small-cap segment of the U.S. equity universe. The Russell 2000® Index is a subset of the Russell 3000® Index representing approximately 10% of the total market capitalization of that Index. It includes approximately 2,000 of the smallest securities based on a combination of their market cap and current index membership. The Russell 2000 is constructed to provide a comprehensive and unbiased, small-cap barometer and is completely reconstituted annually to ensure larger stocks do not distort the performance and characteristics of the true small-cap opportunity set. Investors cannot invest directly in any index.
Please note: the position in any security highlighted with italicized typeface was sold during the reporting period.
Equities are subject generally to market, market sector, market liquidity, issuer and investment style risks, among other factors, to varying degrees, all of which are more fully described in the fund’s prospectus.
Stocks of small- and/or mid-cap companies often experience sharper price fluctuations than stocks of large-cap companies.
4
FUND PERFORMANCE (Unaudited)

Comparison of change in value of a $10,000 investment in Investor shares and Class I shares of BNY Mellon Opportunistic Small Cap Fund with a hypothetical investment of $10,000 in the Russell 2000® Index (the “Index”).
† Source: Lipper Inc.
†† The total return figures presented for Class I shares of the fund reflect the performance of the fund’s Investor shares for the period prior to 9/30/16 (the inception date for Class I shares).
Past performance is not predictive of future performance.
The above graph compares a hypothetical $10,000 investment made in each of the Investor shares and Class I shares of BNY Mellon Opportunistic Small Cap Fund on 8/31/13 to a hypothetical investment of $10,000 made in the Index on that date. All dividends and capital gain distributions are reinvested.
The fund’s performance shown in the line graph above takes into account all applicable fees and expenses on Investor shares and Class I shares. The Index measures the performance of the small-cap segment of the U.S. equity universe. The Index is a subset of the Russell 3000® Index representing approximately 10% of the total market capitalization of that index. It includes approximately 2,000 of the smallest securities based on a combination of their market cap and current index membership. The Index is constructed to provide a comprehensive and unbiased small-cap barometer and is completely reconstituted annually to ensure larger stocks do not distort the performance and characteristics of the true small-cap opportunity set. Unlike a mutual fund, the Index is not subject to charges, fees and other expenses. Investors cannot invest directly in any index. Further information relating to fund performance, including expense reimbursements, if applicable, is contained in the Financial Highlights section of the prospectus and elsewhere in this report.
5
FUND PERFORMANCE (Unaudited) (continued)
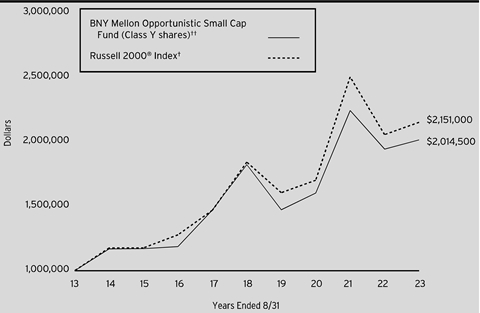
Comparison of change in value of a $1,000,000 investment in Class Y shares of BNY Mellon Opportunistic Small Cap Fund with a hypothetical investment of $1,000,000 in the Russell 2000® Index (the “Index”).
† Source: Lipper Inc.
†† The total return figures presented for Class Y shares of the fund reflect the performance of the fund’s Investor shares for the period prior to 9/30/16 (the inception date for Class Y shares).
Past performance is not predictive of future performance.
The above graph compares a hypothetical $1,000,000 investment made in Class Y shares of BNY Mellon Opportunistic Small Cap Fund on 8/31/13 to a hypothetical investment of $1,000,000 made in the Index on that date. All dividends and capital gain distributions are reinvested.
The fund’s performance shown in the line graph above takes into account all applicable fees and expenses on Class Y shares. The Index measures the performance of the small-cap segment of the U.S. equity universe. The Index is a subset of the Russell 3000® Index representing approximately 10% of the total market capitalization of that index. It includes approximately 2,000 of the smallest securities based on a combination of their market cap and current index membership. The Index is constructed to provide a comprehensive and unbiased small-cap barometer and is completely reconstituted annually to ensure larger stocks do not distort the performance and characteristics of the true small-cap opportunity set. Unlike a mutual fund, the Index is not subject to charges, fees and other expenses. Investors cannot invest directly in any index. Further information relating to fund performance, including expense reimbursements, if applicable, is contained in the Financial Highlights section of the prospectus and elsewhere in this report.
6
| | | | | |
Average Annual Total Returns as of 8/31/2023 | |
| Inception
Date | 1 Year | 5 Years | 10 Years |
Investor shares | 11/16/1993 | 3.36% | 1.70% | 7.03% |
Class I shares | 9/30/2016 | 3.53% | 1.89% | 7.18%† |
Class Y shares | 9/30/2016 | 3.69% | 2.02% | 7.26%† |
Russell 2000® Index | | 4.65% | 3.14% | 7.96% |
† The total return performance figures presented for Class I shares of the fund reflect the performance of the fund’s Investor shares for the period prior to 9/30/16 (the inception date for Class I shares).
The total return performance figures presented for Class Y shares of the fund reflect the performance of the fund’s Investor shares for the period prior to 9/30/16 (the inception date for Class Y shares).
The performance data quoted represents past performance, which is no guarantee of future results. Share price and investment return fluctuate and an investor’s shares may be worth more or less than original cost upon redemption. Current performance may be lower or higher than the performance quoted. Go to www.im.bnymellon.com for the fund’s most recent month-end returns.
The fund's performance shown in the graphs and table does not reflect the deduction of taxes that a shareholder would pay on fund distributions or the redemption of fund shares.
7
UNDERSTANDING YOUR FUND’S EXPENSES (Unaudited)
As a mutual fund investor, you pay ongoing expenses, such as management fees and other expenses. Using the information below, you can estimate how these expenses affect your investment and compare them with the expenses of other funds. You also may pay one-time transaction expenses, including sales charges (loads) and redemption fees, which are not shown in this section and would have resulted in higher total expenses. For more information, see your fund’s prospectus or talk to your financial adviser.
Review your fund’s expenses
The table below shows the expenses you would have paid on a $1,000 investment in BNY Mellon Opportunistic Small Cap Fund from March 1, 2023 to August 31, 2023. It also shows how much a $1,000 investment would be worth at the close of the period, assuming actual returns and expenses.
| | | | | | |
Expenses and Value of a $1,000 Investment | |
Assume actual returns for the six months ended August 31, 2023 | |
| | | | | |
| | Investor Shares | Class I | Class Y | |
Expenses paid per $1,000† | $5.55 | $4.65 | $4.05 | |
Ending value (after expenses) | $982.40 | $983.30 | $984.00 | |
COMPARING YOUR FUND’S EXPENSES WITH THOSE OF OTHER FUNDS (Unaudited)
Using the SEC’s method to compare expenses
The Securities and Exchange Commission (“SEC”) has established guidelines to help investors assess fund expenses. Per these guidelines, the table below shows your fund’s expenses based on a $1,000 investment, assuming a hypothetical 5% annualized return. You can use this information to compare the ongoing expenses (but not transaction expenses or total cost) of investing in the fund with those of other funds. All mutual fund shareholder reports will provide this information to help you make this comparison. Please note that you cannot use this information to estimate your actual ending account balance and expenses paid during the period.
| | | | | | |
Expenses and Value of a $1,000 Investment | |
Assuming a hypothetical 5% annualized return for the six months ended August 31, 2023 | |
| | | | | |
| | Investor Shares | Class I | Class Y | |
Expenses paid per $1,000† | $5.65 | $4.74 | $4.13 | |
Ending value (after expenses) | $1,019.61 | $1,020.52 | $1,021.12 | |
† | Expenses are equal to the fund’s annualized expense ratio of 1.11% for Investor Shares, .93% for Class I and .81% for Class Y, multiplied by the average account value over the period, multiplied by 184/365 (to reflect the one-half year period). |
8
STATEMENT OF INVESTMENTS
August 31, 2023
| | | | | | | | |
| |
Description | | | | Shares | | Value ($) | |
Common Stocks - 97.6% | | | | | |
Automobiles & Components - .8% | | | | | |
Stoneridge, Inc. | | | | 128,366 | a | 2,637,921 | |
Banks - 7.2% | | | | | |
BankUnited, Inc. | | | | 159,784 | | 4,194,330 | |
First Bancorp / Puerto Rico | | | | 462,896 | | 6,415,739 | |
First Interstate BancSystem, Inc., Cl. A | | | | 108,155 | | 2,802,296 | |
First Merchants Corp. | | | | 94,006 | | 2,805,139 | |
Synovus Financial Corp. | | | | 129,280 | | 4,002,509 | |
Texas Capital Bancshares, Inc. | | | | 67,846 | a | 4,236,304 | |
| | | | | 24,456,317 | |
Capital Goods - 8.3% | | | | | |
EnerSys | | | | 51,044 | | 5,358,599 | |
Flowserve Corp. | | | | 104,362 | | 4,129,604 | |
Fluor Corp. | | | | 289,379 | a | 10,125,371 | |
Matrix Service Co. | | | | 364,951 | a | 3,032,743 | |
SiteOne Landscape Supply, Inc. | | | | 13,404 | a | 2,294,631 | |
Spirit AeroSystems Holdings, Inc., Cl. A | | | | 159,479 | b | 3,400,092 | |
| | | | | 28,341,040 | |
Commercial & Professional Services - 1.8% | | | | | |
The Brink's Company | | | | 79,047 | | 5,992,553 | |
Consumer Discretionary Distribution - 3.3% | | | | | |
Citi Trends, Inc. | | | | 45,644 | a | 987,280 | |
Designer Brands, Inc., Cl. A | | | | 241,553 | | 2,538,722 | |
Ollie's Bargain Outlet Holdings, Inc. | | | | 99,789 | a | 7,691,736 | |
| | | | | 11,217,738 | |
Consumer Durables & Apparel - 1.7% | | | | | |
GoPro, Inc., Cl. A | | | | 636,632 | a | 2,314,157 | |
Topgolf Callaway Brands Corp. | | | | 189,974 | a | 3,313,147 | |
| | | | | 5,627,304 | |
Consumer Services - 6.3% | | | | | |
Bloomin' Brands, Inc. | | | | 199,999 | | 5,611,972 | |
Bright Horizons Family Solutions, Inc. | | | | 35,536 | a | 3,355,309 | |
Genius Sports Ltd. | | | | 1,000,003 | a | 6,640,020 | |
Papa John's International, Inc. | | | | 37,674 | | 2,851,922 | |
Six Flags Entertainment Corp. | | | | 133,433 | a | 3,063,622 | |
| | | | | 21,522,845 | |
Consumer Staples Distribution - .6% | | | | | |
The Chefs' Warehouse, Inc. | | | | 75,945 | a | 2,167,470 | |
Energy - 10.0% | | | | | |
CNX Resources Corp. | | | | 307,053 | a | 6,862,635 | |
Dril-Quip, Inc. | | | | 178,756 | a | 4,930,090 | |
Expro Group Holdings NV | | | | 111,361 | a | 2,618,097 | |
9
STATEMENT OF INVESTMENTS (continued)
| | | | | | | | |
| |
Description | | | | Shares | | Value ($) | |
Common Stocks - 97.6% (continued) | | | | | |
Energy - 10.0% (continued) | | | | | |
Frontline PLC | | | | 149,274 | b | 2,630,208 | |
PBF Energy, Inc., Cl. A | | | | 134,933 | | 6,327,008 | |
Transocean Ltd. | | | | 603,177 | a,b | 4,933,988 | |
Viper Energy Partners LP | | | | 208,325 | | 5,795,601 | |
| | | | | 34,097,627 | |
Equity Real Estate Investment - 2.9% | | | | | |
EPR Properties | | | | 82,300 | c | 3,685,394 | |
Equity Commonwealth | | | | 157,563 | c | 2,998,424 | |
Pebblebrook Hotel Trust | | | | 211,029 | b,c | 3,053,590 | |
| | | | | 9,737,408 | |
Financial Services - 4.6% | | | | | |
Essent Group Ltd. | | | | 123,345 | | 6,194,386 | |
PJT Partners, Inc., Cl. A | | | | 76,095 | | 6,010,744 | |
PRA Group, Inc. | | | | 176,040 | a | 3,429,259 | |
| | | | | 15,634,389 | |
Health Care Equipment & Services - 11.8% | | | | | |
Acadia Healthcare Co., Inc. | | | | 56,223 | a | 4,334,793 | |
CONMED Corp. | | | | 27,301 | | 3,042,969 | |
Globus Medical, Inc., Cl. A | | | | 60,297 | a | 3,262,068 | |
ModivCare, Inc. | | | | 41,332 | a | 1,326,757 | |
Omnicell, Inc. | | | | 70,414 | a | 4,003,740 | |
Privia Health Group, Inc. | | | | 262,424 | a | 6,888,630 | |
R1 RCM, Inc. | | | | 420,251 | a | 7,245,127 | |
Select Medical Holdings Corp. | | | | 197,479 | | 5,768,362 | |
TransMedics Group, Inc. | | | | 64,528 | a | 4,234,973 | |
| | | | | 40,107,419 | |
Household & Personal Products - 2.3% | | | | | |
Spectrum Brands Holdings, Inc. | | | | 95,997 | | 7,984,070 | |
Insurance - 2.7% | | | | | |
BRP Group, Inc., Cl. A | | | | 208,339 | a | 5,539,734 | |
The Hanover Insurance Group, Inc. | | | | 33,053 | | 3,527,416 | |
| | | | | 9,067,150 | |
Materials - 5.8% | | | | | |
Alamos Gold, Inc., Cl. A | | | | 867,962 | | 11,144,632 | |
Largo, Inc. | | | | 329,627 | a,b | 1,104,250 | |
The Chemours Company | | | | 125,249 | | 4,260,971 | |
Tronox Holdings PLC | | | | 235,792 | | 3,216,203 | |
| | | | | 19,726,056 | |
Media & Entertainment - 2.5% | | | | | |
Eventbrite, Inc., Cl. A | | | | 457,984 | a | 4,639,378 | |
Magnite, Inc. | | | | 479,911 | a | 3,959,266 | |
| | | | | 8,598,644 | |
10
| | | | | | | | |
| |
Description | | | | Shares | | Value ($) | |
Common Stocks - 97.6% (continued) | | | | | |
Pharmaceuticals, Biotechnology & Life Sciences - 5.6% | | | | | |
Alkermes PLC | | | | 313,719 | a | 9,157,458 | |
Denali Therapeutics, Inc. | | | | 166,582 | a | 3,846,378 | |
Insmed, Inc. | | | | 188,344 | a | 4,122,850 | |
Pacific Biosciences of California, Inc. | | | | 166,661 | a | 1,879,936 | |
| | | | | 19,006,622 | |
Real Estate Management & Development - 1.2% | | | | | |
Colliers International Group, Inc. | | | | 34,655 | | 4,001,266 | |
Semiconductors & Semiconductor Equipment - 2.0% | | | | | |
MaxLinear, Inc. | | | | 110,525 | a | 2,597,338 | |
Synaptics, Inc. | | | | 46,246 | a | 4,048,375 | |
| | | | | 6,645,713 | |
Software & Services - 5.5% | | | | | |
DoubleVerify Holdings, Inc. | | | | 177,186 | a | 5,990,659 | |
Edgio, Inc. | | | | 1,577,138 | a | 1,362,647 | |
JFrog Ltd. | | | | 258,444 | a | 7,414,758 | |
Zuora, Inc., Cl. A | | | | 440,725 | a | 4,015,005 | |
| | | | | 18,783,069 | |
Technology Hardware & Equipment - 3.6% | | | | | |
ADTRAN Holdings, Inc. | | | | 324,209 | | 2,771,987 | |
Itron, Inc. | | | | 100,475 | a | 6,873,495 | |
Knowles Corp. | | | | 146,872 | a | 2,354,358 | |
Ondas Holdings, Inc. | | | | 109,208 | a,b | 109,208 | |
| | | | | 12,109,048 | |
Transportation - 2.7% | | | | | |
Heartland Express, Inc. | | | | 173,679 | | 2,620,816 | |
SkyWest, Inc. | | | | 146,518 | a | 6,607,962 | |
| | | | | 9,228,778 | |
Utilities - 4.4% | | | | | |
Atlantica Sustainable Infrastructure PLC | | | | 71,927 | | 1,614,761 | |
Clearway Energy, Inc., Cl. C | | | | 254,869 | | 6,313,105 | |
NextEra Energy Partners LP | | | | 138,232 | b | 6,895,012 | |
| | | | | 14,822,878 | |
Total Common Stocks (cost $314,283,297) | | | | 331,513,325 | |
| | | | | | | | |
Private Equity - .5% | | | | | |
Food, Beverage & Tobacco - .2% | | | | | |
Supplying Demand, Inc. | | | | 66,937 | a,d | 710,202 | |
Real Estate - .1% | | | | | |
Roofstock | | | | 41,269 | a,d | 383,389 | |
Software & Services - .2% | | | | | |
Locus Robotics | | | | 14,518 | a,d | 696,719 | |
Total Private Equity (cost $2,487,393) | | | | 1,790,310 | |
11
STATEMENT OF INVESTMENTS (continued)
| | | | | | | | |
| |
Description | | 1-Day
Yield (%) | | Shares | | Value ($) | |
Investment Companies - 1.6% | | | | | |
Registered Investment Companies - 1.6% | | | | | |
Dreyfus Institutional Preferred Government Plus Money Market Fund, Institutional Shares
(cost $5,378,402) | | 5.41 | | 5,378,402 | e | 5,378,402 | |
| | | | | | | | |
Investment of Cash Collateral for Securities Loaned - .6% | | | | | |
Registered Investment Companies - .6% | | | | | |
Dreyfus Institutional Preferred Government Plus Money Market Fund, Institutional Shares
(cost $2,097,644) | | 5.41 | | 2,097,644 | e | 2,097,644 | |
Total Investments (cost $324,246,736) | | 100.3% | | 340,779,681 | |
Liabilities, Less Cash and Receivables | | (.3%) | | (1,002,791) | |
Net Assets | | 100.0% | | 339,776,890 | |
a Non-income producing security.
b Security, or portion thereof, on loan. At August 31, 2023, the value of the fund’s securities on loan was $3,376,306 and the value of the collateral was $3,490,617, consisting of cash collateral of $2,097,644 and U.S. Government & Agency securities valued at $1,392,973. In addition, the value of collateral may include pending sales that are also on loan.
c Investment in real estate investment trust within the United States.
d The fund held Level 3 securities at August 31, 2023. These securities were valued at $1,790,310 or ..5% of net assets.
e Investment in affiliated issuer. The investment objective of this investment company is publicly available and can be found within the investment company’s prospectus.
| | |
Portfolio Summary (Unaudited) † | Value (%) |
Health Care | 17.4 |
Financials | 14.5 |
Industrials | 12.8 |
Consumer Discretionary | 12.1 |
Information Technology | 11.2 |
Energy | 10.0 |
Materials | 5.8 |
Utilities | 4.4 |
Real Estate | 4.2 |
Consumer Staples | 3.0 |
Communication Services | 2.5 |
Investment Companies | 2.2 |
Consumer, Non-cyclical | .2 |
| | 100.3 |
† Based on net assets.
See notes to financial statements.
12
| | | | | | | |
Affiliated Issuers | | | |
Description | Value ($) 8/31/2022 | Purchases ($)† | Sales ($) | Value ($) 8/31/2023 | Dividends/
Distributions ($) | |
Registered Investment Companies - 1.6% | | |
Dreyfus Institutional Preferred Government Plus Money Market Fund, Institutional Shares - 1.6% | 9,640,347 | 75,474,390 | (79,736,335) | 5,378,402 | 453,637 | |
Investment of Cash Collateral for Securities Loaned - .6%†† | | |
Dreyfus Institutional Preferred Government Plus Money Market Fund, Institutional Shares - .6% | - | 20,247,466 | (18,149,822) | 2,097,644 | 6,287 | ††† |
Dreyfus Institutional Preferred Government Plus Money Market Fund, SL Shares - .0% | 6,992,538 | 122,995,332 | (129,987,870) | - | 45,346 | ††† |
Total - 2.2% | 16,632,885 | 218,717,188 | (227,874,027) | 7,476,046 | 505,270 | |
† Includes reinvested dividends/distributions.
†† Effective July 3, 2023, cash collateral for securities lending was transferred from Dreyfus Institutional Preferred Government Plus Money Market Fund, SL Shares to Dreyfus Institutional Preferred Government Plus Money Market Fund, Institutional Shares.
††† Represents securities lending income earned from the reinvestment of cash collateral from loaned securities, net of fees and collateral investment expenses, and other payments to and from borrowers of securities.
See notes to financial statements.
13
STATEMENT OF ASSETS AND LIABILITIES
August 31, 2023
| | | | | | | |
| | | | | | |
| | | Cost | | Value | |
Assets ($): | | | | |
Investments in securities—See Statement of Investments
(including securities on loan, valued at $3,376,306)—Note 1(c): | | | |
Unaffiliated issuers | 316,770,690 | | 333,303,635 | |
Affiliated issuers | | 7,476,046 | | 7,476,046 | |
Receivable for investment securities sold | | 953,356 | |
Dividends and securities lending income receivable | | 486,561 | |
Receivable for shares of Common Stock subscribed | | 80,341 | |
Tax reclaim receivable—Note 1(b) | | 297 | |
Prepaid expenses | | | | | 38,146 | |
| | | | | 342,338,382 | |
Liabilities ($): | | | | |
Due to BNY Mellon Investment Adviser, Inc. and affiliates—Note 3(b) | | 273,812 | |
Liability for securities on loan—Note 1(c) | | 2,097,644 | |
Payable for shares of Common Stock redeemed | | 68,391 | |
Directors’ fees and expenses payable | | 9,581 | |
Other accrued expenses | | | | | 112,064 | |
| | | | | 2,561,492 | |
Net Assets ($) | | | 339,776,890 | |
Composition of Net Assets ($): | | | | |
Paid-in capital | | | | | 320,236,329 | |
Total distributable earnings (loss) | | | | | 19,540,561 | |
Net Assets ($) | | | 339,776,890 | |
| | | | | |
Net Asset Value Per Share | Investor Shares | Class I | Class Y | |
Net Assets ($) | 230,627,792 | 21,765,233 | 87,383,865 | |
Shares Outstanding | 7,779,796 | 725,148 | 2,898,649 | |
Net Asset Value Per Share ($) | 29.64 | 30.01 | 30.15 | |
| | | | |
See notes to financial statements. | | | | |
14
STATEMENT OF OPERATIONS
Year Ended August 31, 2023
| | | | | | | |
| | | | | | |
| | | | | | |
Investment Income ($): | | | | |
Income: | | | | |
Cash dividends (net of $47,135 foreign taxes withheld at source): | |
Unaffiliated issuers | | | 4,565,789 | |
Affiliated issuers | | | 453,637 | |
Income from securities lending—Note 1(c) | | | 51,633 | |
Interest | | | 267 | |
Total Income | | | 5,071,326 | |
Expenses: | | | | |
Management fee—Note 3(a) | | | 2,638,113 | |
Shareholder servicing costs—Note 3(b) | | | 759,928 | |
Professional fees | | | 92,739 | |
Registration fees | | | 53,380 | |
Directors’ fees and expenses—Note 3(c) | | | 28,593 | |
Prospectus and shareholders’ reports | | | 25,415 | |
Chief Compliance Officer fees—Note 3(b) | | | 19,926 | |
Custodian fees—Note 3(b) | | | 10,383 | |
Loan commitment fees—Note 2 | | | 7,081 | |
Miscellaneous | | | 35,682 | |
Total Expenses | | | 3,671,240 | |
Less—reduction in fees due to earnings credits—Note 3(b) | | | (59,942) | |
Net Expenses | | | 3,611,298 | |
Net Investment Income | | | 1,460,028 | |
Realized and Unrealized Gain (Loss) on Investments—Note 4 ($): | | |
Net realized gain (loss) on investments | 3,178,939 | |
Net change in unrealized appreciation (depreciation) on investments | 5,986,260 | |
Net Realized and Unrealized Gain (Loss) on Investments | | | 9,165,199 | |
Net Increase in Net Assets Resulting from Operations | | 10,625,227 | |
| | | | | | |
See notes to financial statements. | | | | | |
15
STATEMENT OF CHANGES IN NET ASSETS
| | | | | | | | | | |
| | | | Year Ended August 31, |
| | | | 2023 | | 2022 | |
Operations ($): | | | | | | | | |
Net investment income (loss) | | | 1,460,028 | | | | (145,489) | |
Net realized gain (loss) on investments | | 3,178,939 | | | | 14,037,620 | |
Net change in unrealized appreciation
(depreciation) on investments | | 5,986,260 | | | | (78,907,153) | |
Net Increase (Decrease) in Net Assets
Resulting from Operations | 10,625,227 | | | | (65,015,022) | |
Distributions ($): | |
Distributions to shareholders: | | | | | | | | |
Investor Shares | | | (8,919,043) | | | | (26,496,039) | |
Class I | | | (922,135) | | | | (3,965,477) | |
Class Y | | | (3,895,688) | | | | (14,710,233) | |
Total Distributions | | | (13,736,866) | | | | (45,171,749) | |
Capital Stock Transactions ($): | |
Net proceeds from shares sold: | | | | | | | | |
Investor Shares | | | 1,382,237 | | | | 6,488,488 | |
Class I | | | 3,094,535 | | | | 30,120,782 | |
Class Y | | | 10,359,498 | | | | 15,231,210 | |
Distributions reinvested: | | | | | | | | |
Investor Shares | | | 8,509,335 | | | | 25,369,412 | |
Class I | | | 904,017 | | | | 3,866,182 | |
Class Y | | | 1,971,901 | | | | 7,111,581 | |
Cost of shares redeemed: | | | | | | | | |
Investor Shares | | | (18,798,663) | | | | (45,188,016) | |
Class I | | | (8,222,203) | | | | (21,679,898) | |
Class Y | | | (34,223,649) | | | | (47,138,645) | |
Increase (Decrease) in Net Assets
from Capital Stock Transactions | (35,022,992) | | | | (25,818,904) | |
Total Increase (Decrease) in Net Assets | (38,134,631) | | | | (136,005,675) | |
Net Assets ($): | |
Beginning of Period | | | 377,911,521 | | | | 513,917,196 | |
End of Period | | | 339,776,890 | | | | 377,911,521 | |
16
| | | | | | | | | | |
| | | | Year Ended August 31, |
| | | | 2023 | | 2022 | |
Capital Share Transactions (Shares): | |
Investor Sharesa | | | | | | | | |
Shares sold | | | 47,379 | | | | 180,736 | |
Shares issued for distributions reinvested | | | 305,432 | | | | 740,713 | |
Shares redeemed | | | (649,680) | | | | (1,232,440) | |
Net Increase (Decrease) in Shares Outstanding | (296,869) | | | | (310,991) | |
Class Ia | | | | | | | | |
Shares sold | | | 106,662 | | | | 770,533 | |
Shares issued for distributions reinvested | | | 32,091 | | | | 111,869 | |
Shares redeemed | | | (282,608) | | | | (668,126) | |
Net Increase (Decrease) in Shares Outstanding | (143,855) | | | | 214,276 | |
Class Ya | | | | | | | | |
Shares sold | | | 349,175 | | | | 443,530 | |
Shares issued for distributions reinvested | | | 69,752 | | | | 205,359 | |
Shares redeemed | | | (1,185,766) | | | | (1,430,350) | |
Net Increase (Decrease) in Shares Outstanding | (766,839) | | | | (781,461) | |
| | | | | | | | | |
a | During the period ended August 31, 2023, 52,090 Class Y shares representing $1,533,694 were exchanged for 52,286 Investor shares and 348 Class Y shares representing $9,696 were exchanged for 353 Class I shares. During the period ended August 31, 2022, 5,031 Investor shares representing $189,372 were exchanged for 4,981 Class Y shares and 316 Investor shares representing $9,238 were exchanged for 313 Class I shares and 80,162 Class Y shares representing $2,769,844 were exchanged for 80,339 Class I shares. | |
See notes to financial statements. | | | | | | | | |
17
FINANCIAL HIGHLIGHTS
The following tables describe the performance for each share class for the fiscal periods indicated. All information (except portfolio turnover rate) reflects financial results for a single fund share. Net asset value total return is calculated assuming an initial investment made at the net asset value at the beginning of the period, reinvestment of all dividends and distributions at net asset value during the period, and redemption at net asset value on the last day of the period. Net asset value total return includes adjustments in accordance with accounting principles generally accepted in the United States of America and as such, the net asset value for financial reporting purposes and the returns based upon those net asset values may differ from the net asset value and returns for shareholder transactions. These figures have been derived from the fund’s financial statements.
| | | | | | | | |
| | |
Investor Shares | | Year Ended August 31, |
| | 2023 | 2022 | 2021 | 2020 | 2019 |
Per Share Data ($): | | | | | | |
Net asset value, beginning of period | | 29.83 | 37.97 | 27.26 | 25.18 | 40.10 |
Investment Operations: | | | | | | |
Net investment income (loss)a | | .09 | (.05) | (.13) | .03 | .03 |
Net realized and unrealized gain
(loss) on investments | | .84 | (4.69) | 10.91 | 2.10 | (8.16) |
Total from Investment Operations | | .93 | (4.74) | 10.78 | 2.13 | (8.13) |
Distributions: | | | | | | |
Dividends from
net investment income | | - | - | (.07) | (.05) | - |
Dividends from net realized
gain on investments | | (1.12) | (3.40) | - | - | (6.79) |
Total Distributions | | (1.12) | (3.40) | (.07) | (.05) | (6.79) |
Net asset value, end of period | | 29.64 | 29.83 | 37.97 | 27.26 | 25.18 |
Total Return (%) | | 3.36 | (13.63) | 39.58 | 8.44 | (19.47) |
Ratios/Supplemental Data (%): | | | | | | |
Ratio of total expenses
to average net assets | | 1.14 | 1.11 | 1.11 | 1.13 | 1.13 |
Ratio of net expenses
to average net assets | | 1.12 | 1.11 | 1.11 | 1.13 | 1.13 |
Ratio of net investment income
(loss) to average net assets | | .32 | (.14) | (.37) | .11 | .12 |
Portfolio Turnover Rate | | 38.26 | 41.25 | 85.56 | 95.32 | 83.97 |
Net Assets, end of period ($ x 1,000) | | 230,628 | 240,926 | 318,464 | 248,201 | 285,688 |
a Based on average shares outstanding.
See notes to financial statements.
18
| | | | | | | | |
| | |
Class I Shares | | Year Ended August 31, |
| | 2023 | 2022 | 2021 | 2020 | 2019 |
Per Share Data ($): | | | | | | |
Net asset value, beginning of period | | 30.14 | 38.25 | 27.45 | 25.38 | 40.28 |
Investment Operations: | | | | | | |
Net investment income (loss)a | | .15 | .01 | (.07) | .08 | .08 |
Net realized and unrealized gain
(loss) on investments | | .84 | (4.72) | 10.98 | 2.11 | (8.19) |
Total from Investment Operations | | .99 | (4.71) | 10.91 | 2.19 | (8.11) |
Distributions: | | | | | | |
Dividends from
net investment income | | - | - | (.11) | (.12) | - |
Dividends from net realized
gain on investments | | (1.12) | (3.40) | - | - | (6.79) |
Total Distributions | | (1.12) | (3.40) | (.11) | (.12) | (6.79) |
Net asset value, end of period | | 30.01 | 30.14 | 38.25 | 27.45 | 25.38 |
Total Return (%) | | 3.53 | (13.44) | 39.80 | 8.63 | (19.31) |
Ratios/Supplemental Data (%): | | | | | | |
Ratio of total expenses
to average net assets | | .96 | .93 | .93 | .96 | .93 |
Ratio of net expenses
to average net assets | | .94 | .93 | .93 | .96 | .93 |
Ratio of net investment income
(loss) to average net assets | | .50 | .03 | (.19) | .30 | .26 |
Portfolio Turnover Rate | | 38.26 | 41.25 | 85.56 | 95.32 | 83.97 |
Net Assets, end of period ($ x 1,000) | | 21,765 | 26,191 | 25,047 | 21,448 | 28,586 |
a Based on average shares outstanding.
See notes to financial statements.
19
FINANCIAL HIGHLIGHTS (continued)
| | | | | | | | | |
| | | |
Class Y Shares | | Year Ended August 31, |
| | 2023 | 2022 | 2021 | 2020 | 2019 |
Per Share Data ($): | | | | | | |
Net asset value, beginning of period | | 30.23 | 38.32 | 27.51 | 25.44 | 40.32 |
Investment Operations: | | | | | | |
Net investment income (loss)a | | .18 | .05 | (.03) | .11 | .11 |
Net realized and unrealized gain
(loss) on investments | | .86 | (4.74) | 11.00 | 2.13 | (8.20) |
Total from Investment Operations | | 1.04 | (4.69) | 10.97 | 2.24 | (8.09) |
Distributions: | | | | | | |
Dividends from
net investment income | | - | - | (.16) | (.17) | - |
Dividends from net realized
gain on investments | | (1.12) | (3.40) | - | - | (6.79) |
Total Distributions | | (1.12) | (3.40) | (.16) | (.17) | (6.79) |
Net asset value, end of period | | 30.15 | 30.23 | 38.32 | 27.51 | 25.44 |
Total Return (%) | | 3.69 | (13.36) | 39.97 | 8.81 | (19.23) |
Ratios/Supplemental Data (%): | | | | | | |
Ratio of total expenses
to average net assets | | .84 | .82 | .82 | .83 | .81 |
Ratio of net expenses
to average net assets | | .82 | .82 | .82 | .83 | .81 |
Ratio of net investment income
(loss) to average net assets | | .62 | .15 | (.08) | .45 | .38 |
Portfolio Turnover Rate | | 38.26 | 41.25 | 85.56 | 95.32 | 83.97 |
Net Assets, end of period ($ x 1,000) | | 87,384 | 110,795 | 170,407 | 139,832 | 209,291 |
a Based on average shares outstanding.
See notes to financial statements.
20
NOTES TO FINANCIAL STATEMENTS
NOTE 1—Significant Accounting Policies:
BNY Mellon Opportunistic Small Cap Fund (the “fund”) is a separate diversified series of BNY Mellon Advantage Funds, Inc. (the “Company”), which is registered under the Investment Company Act of 1940, as amended (the “Act”), as an open-end management investment company and operates as a series company currently offering seven series, including the fund. The fund’s investment objective is to seek capital appreciation. BNY Mellon Investment Adviser, Inc. (the “Adviser”), a wholly-owned subsidiary of The Bank of New York Mellon Corporation (“BNY Mellon”), serves as the fund’s investment adviser. Newton Investment Management North America, LLC (the “Sub-Adviser”), an indirect wholly-owned subsidiary of BNY Mellon and an affiliate of the Adviser, serves as the fund’s sub-adviser.
Effective March 31, 2023, the Sub-Adviser, entered into a sub-sub-investment advisory agreement with its affiliate, Newton Investment Management Limited (“NIM”), to enable NIM to provide certain advisory services to the Sub-Adviser for the benefit of the fund, including, but not limited to, portfolio management services. NIM is subject to the supervision of the Sub-Adviser and the Adviser. NIM is also an affiliate of the Adviser. NIM, located at 160 Queen Victoria Street, London, EC4V, 4LA, England, was formed in 1978. NIM is an indirect subsidiary of BNY Mellon.
BNY Mellon Securities Corporation (the “Distributor”), a wholly-owned subsidiary of the Adviser, is the distributor of the fund’s shares, which are sold without a sales charge. The fund is authorized to issue 400 million shares of $.001 par value Common Stock. The fund currently has authorized three classes of shares: Investor (200 million shares authorized), Class I (100 million shares authorized) and Class Y shares (100 million shares authorized). Investor shares are sold primarily to retail investors through financial intermediaries and bear Shareholder Services Plan fees. Class I shares are sold primarily to bank trust departments and other financial service providers (including BNY Mellon and its affiliates), acting on behalf of customers having a qualified trust or an investment account or relationship at such institution, and bear no Shareholder Services Plan fees. Class Y shares are sold at net asset value per share generally to institutional investors, and bear no Shareholder Services Plan fees. Other differences between the classes include the services offered to and the expenses borne by each class, the allocation of certain transfer agency costs and certain voting rights. Income, expenses (other than expenses
21
NOTES TO FINANCIAL STATEMENTS (continued)
attributable to a specific class), and realized and unrealized gains or losses on investments are allocated to each class of shares based on its relative net assets.
The Company accounts separately for the assets, liabilities and operations of each series. Expenses directly attributable to each series are charged to that series’ operations; expenses which are applicable to all series are allocated among them on a pro rata basis.
The Financial Accounting Standards Board (“FASB”) Accounting Standards Codification (“ASC”) is the exclusive reference of authoritative U.S. generally accepted accounting principles (“GAAP”) recognized by the FASB to be applied by nongovernmental entities. Rules and interpretive releases of the SEC under authority of federal laws are also sources of authoritative GAAP for SEC registrants. The fund is an investment company and applies the accounting and reporting guidance of the FASB ASC Topic 946 Financial Services-Investment Companies. The fund’s financial statements are prepared in accordance with GAAP, which may require the use of management estimates and assumptions. Actual results could differ from those estimates.
The Company enters into contracts that contain a variety of indemnifications. The fund’s maximum exposure under these arrangements is unknown. The fund does not anticipate recognizing any loss related to these arrangements.
(a) Portfolio valuation: The fair value of a financial instrument is the amount that would be received to sell an asset or paid to transfer a liability in an orderly transaction between market participants at the measurement date (i.e., the exit price). GAAP establishes a fair value hierarchy that prioritizes the inputs of valuation techniques used to measure fair value. This hierarchy gives the highest priority to unadjusted quoted prices in active markets for identical assets or liabilities (Level 1 measurements) and the lowest priority to unobservable inputs (Level 3 measurements).
Additionally, GAAP provides guidance on determining whether the volume and activity in a market has decreased significantly and whether such a decrease in activity results in transactions that are not orderly. GAAP requires enhanced disclosures around valuation inputs and techniques used during annual and interim periods.
Various inputs are used in determining the value of the fund’s investments relating to fair value measurements. These inputs are summarized in the three broad levels listed below:
22
Level 1—unadjusted quoted prices in active markets for identical investments.
Level 2—other significant observable inputs (including quoted prices for similar investments, interest rates, prepayment speeds, credit risk, etc.).
Level 3—significant unobservable inputs (including the fund’s own assumptions in determining the fair value of investments).
The inputs or methodology used for valuing securities are not necessarily an indication of the risk associated with investing in those securities.
Changes in valuation techniques may result in transfers in or out of an assigned level within the disclosure hierarchy. Valuation techniques used to value the fund’s investments are as follows:
The Company’s Board of Directors (the “Board”) has designated the Adviser as the fund’s valuation designee, effective September 8, 2022, to make all fair value determinations with respect to the fund’s portfolio investments, subject to the Board’s oversight and pursuant to Rule 2a-5 under the Act.
Investments in equity securities are valued at the last sales price on the securities exchange or national securities market on which such securities are primarily traded. Securities listed on the National Market System for which market quotations are available are valued at the official closing price or, if there is no official closing price that day, at the last sales price. For open short positions, asked prices are used for valuation purposes. Bid price is used when no asked price is available. Registered investment companies that are not traded on an exchange are valued at their net asset value. All of the preceding securities are generally categorized within Level 1 of the fair value hierarchy.
Securities not listed on an exchange or the national securities market, or securities for which there were no transactions, are valued at the average of the most recent bid and asked prices. These securities are generally categorized within Level 2 of the fair value hierarchy.
Fair valuing of securities may be determined with the assistance of a pricing service using calculations based on indices of domestic securities and other appropriate indicators, such as prices of relevant American Depositary Receipts and futures. Utilizing these techniques may result in transfers between Level 1 and Level 2 of the fair value hierarchy.
When market quotations or official closing prices are not readily available, or are determined not to accurately reflect fair value, such as when the
23
NOTES TO FINANCIAL STATEMENTS (continued)
value of a security has been significantly affected by events after the close of the exchange or market on which the security is principally traded, but before the fund calculates its net asset value, the fund may value these investments at fair value as determined in accordance with the procedures approved by the Board. Certain factors may be considered when fair valuing investments such as: fundamental analytical data, the nature and duration of restrictions on disposition, an evaluation of the forces that influence the market in which the securities are purchased and sold, and public trading in similar securities of the issuer or comparable issuers. These securities are either categorized within Level 2 or 3 of the fair value hierarchy depending on the relevant inputs used.
For securities where observable inputs are limited, assumptions about market activity and risk are used and such securities are generally categorized within Level 3 of the fair value hierarchy.
Investment in private equity securities will be fair valued by the Board in accordance with valuation procedures approved by the Board. Those portfolio valuations will be based on unobservable inputs and certain assumptions about how market participants would price the instrument. The fund expects that inputs into the determination of fair value of those investments will require significant management judgment or estimation. Because valuations may fluctuate over short periods of time and may be based on estimates, fair value determinations may differ materially from the value received in an actual transaction. Additionally, valuations of private companies are inherently uncertain. The fund’s net asset value could be adversely affected if the fund’s determinations regarding the fair value of those investments were materially higher or lower than the values that it ultimately realized upon the disposal of such investments. These securities are categorized within Level 3 of the fair value hierarchy.
The following is a summary of the inputs used as of August 31, 2023 in valuing the fund’s investments:
24
| | | | | | | |
| | Level 1-Unadjusted Quoted Prices | Level 2- Other Significant Observable Inputs | | Level 3-Significant Unobservable Inputs | Total | |
Assets ($) | | |
Investments in Securities:† | | |
Equity Securities - Common Stocks | 331,513,325 | - | | - | 331,513,325 | |
Equity Securities - Private Equity | - | - | | 1,790,310 | 1,790,310 | |
Investment Companies | 7,476,046 | - | | - | 7,476,046 | |
† See Statement of Investments for additional detailed categorizations, if any.
The following is a reconciliation of Level 3 assets for which significant unobservable inputs were used to determine fair value:
| | |
Equity Securities-
Private Equity ($) |
Balance as of 8/31/2022† | 690,018 |
Purchases/Issuances | 1,270,571 |
Sales/Dispositions | - |
Net realized gain (loss) | - |
Change in unrealized appreciation (depreciation) | (170,279) |
Transfers into Level 3 | - |
Transfers out of Level 3 | - |
Balances as of 8/31/2023† | 1,790,310 |
The amount of total net realized gains (loss) for the period included in earnings attributable to the net change in unrealized appreciation (depreciation) relating to investments still held at 8/31/2023 | (170,279) |
† Securities deemed as Level 3 due to the lack of observable inputs by management assessment.
The following table summarizes the significant unobservable inputs the fund used to value its investment categorized within Level 3 as of August 31, 2023. In addition to the techniques and inputs noted in the table below, according to the fund’s valuation policy, other valuation techniques and methodologies when determining the fund’s fair value measurements may be used. The below table is not intended to be all-inclusive, but rather provide information on the significant unobservable inputs as they are to the fund’s determination of fair values.
25
NOTES TO FINANCIAL STATEMENTS (continued)
| | | | | | | | |
Asset Category- Issuer Name | Value ($) | Valuation
Techniques/
Methodologies | Unobservable
Inputs | Range |
Low | High |
Private Equity: | | | | | |
Locus Robotics | 696,719 | Public
Comparables/
Enterprise Value | Enterprise Value
as Multiple
of Revenue | 1.5x | 5.8x |
Roofstock | 383,389 | Public
Comparables/
Enterprise Value | Enterprise Value
as Multiple
of Revenue | 0.3x | 11.9x |
Supplying
Demand, Inc. | 710,202 | Public
Comparables/
Enterprise Value | Enterprise Value
as Multiple
of Revenue | 3.1x | 11.3x |
(b) Foreign taxes: The fund may be subject to foreign taxes (a portion of which may be reclaimable) on income, stock dividends, realized and unrealized capital gains on investments or certain foreign currency transactions. Foreign taxes are recorded in accordance with the applicable foreign tax regulations and rates that exist in the foreign jurisdictions in which the fund invests. These foreign taxes, if any, are paid by the fund and are reflected in the Statement of Operations, if applicable. Foreign taxes payable or deferred or those subject to reclaims as of August 31, 2023, if any, are disclosed in the fund’s Statement of Assets and Liabilities.
(c) Securities transactions and investment income: Securities transactions are recorded on a trade date basis. Realized gains and losses from securities transactions are recorded on the identified cost basis. Dividend income is recognized on the ex-dividend date and interest income, including, where applicable, accretion of discount and amortization of premium on investments, is recognized on the accrual basis.
Pursuant to a securities lending agreement with BNY Mellon, the fund may lend securities to qualified institutions. It is the fund’s policy that, at origination, all loans are secured by collateral of at least 102% of the value of U.S. securities loaned and 105% of the value of foreign securities loaned. Collateral equivalent to at least 100% of the market value of securities on loan is maintained at all times. Collateral is either in the form of cash, which can be invested in certain money market mutual funds managed by the Adviser, or U.S. Government and Agency securities. The fund is entitled to receive all dividends, interest and distributions on securities loaned, in addition to income earned as a result of the lending transaction. Should a borrower fail to return the securities in a timely manner, BNY Mellon is required to replace the securities for the benefit of the fund or credit the fund with the market value of the unreturned securities and is subrogated to the fund’s rights against the borrower and
26
the collateral. Additionally, the contractual maturity of security lending transactions are on an overnight and continuous basis. During the period ended August 31, 2023, BNY Mellon earned $7,037 from the lending of the fund’s portfolio securities, pursuant to the securities lending agreement.
(d) Affiliated issuers: Investments in other investment companies advised by the Adviser are considered “affiliated” under the Act.
(e) Market Risk: The value of the securities in which the fund invests may be affected by political, regulatory, economic and social developments, and developments that impact specific economic sectors, industries or segments of the market. The value of a security may also decline due to general market conditions that are not specifically related to a particular company or industry, such as real or perceived adverse economic conditions, changes in the general outlook for corporate earnings, changes in interest or currency rates, changes to inflation, adverse changes to credit markets or adverse investor sentiment generally. In addition, turbulence in financial markets and reduced liquidity in equity, credit and/or fixed-income markets may negatively affect many issuers, which could adversely affect the fund. Global economies and financial markets are becoming increasingly interconnected, and conditions and events in one country, region or financial market may adversely impact issuers in a different country, region or financial market. These risks may be magnified if certain events or developments adversely interrupt the global supply chain; in these and other circumstances, such risks might affect companies world-wide.
(f) Dividends and distributions to shareholders: Dividends and distributions are recorded on the ex-dividend date. Dividends from net investment income and dividends from net realized capital gains, if any, are normally declared and paid annually, but the fund may make distributions on a more frequent basis to comply with the distribution requirements of the Internal Revenue Code of 1986, as amended (the “Code”). To the extent that net realized capital gains can be offset by capital loss carryovers, it is the policy of the fund not to distribute such gains. Income and capital gain distributions are determined in accordance with income tax regulations, which may differ from GAAP.
(g) Federal income taxes: It is the policy of the fund to continue to qualify as a regulated investment company, if such qualification is in the best interests of its shareholders, by complying with the applicable provisions of the Code, and to make distributions of taxable income and net realized capital gain sufficient to relieve it from substantially all federal income and excise taxes.
27
NOTES TO FINANCIAL STATEMENTS (continued)
As of and during the period ended August 31, 2023, the fund did not have any liabilities for any uncertain tax positions. The fund recognizes interest and penalties, if any, related to uncertain tax positions as income tax expense in the Statement of Operations. During the period ended August 31, 2023, the fund did not incur any interest or penalties.
Each tax year in the four-year period ended August 31, 2023 remains subject to examination by the Internal Revenue Service and state taxing authorities.
At August 31, 2023, the components of accumulated earnings on a tax basis were as follows: undistributed ordinary income $1,460,028, undistributed capital gains $3,063,545 and unrealized appreciation $15,016,988.
The tax character of distributions paid to shareholders during the fiscal years ended August 31, 2023 and August 31, 2022 were as follows: long-term capital gains $13,736,866 and $45,171,749, respectively.
NOTE 2—Bank Lines of Credit:
The fund participates with other long-term open-end funds managed by the Adviser in a $823.5 million unsecured credit facility led by Citibank, N.A. (the “Citibank Credit Facility”) and a $300 million unsecured credit facility provided by BNY Mellon (the “BNYM Credit Facility”), each to be utilized primarily for temporary or emergency purposes, including the financing of redemptions (each, a “Facility”). The Citibank Credit Facility is available in two tranches: (i) Tranche A is in an amount equal to $688.5 million and is available to all long-term open-ended funds, including the fund, and (ii) Tranche B is an amount equal to $135 million and is available only to BNY Mellon Floating Rate Income Fund, a series of BNY Mellon Investment Funds IV, Inc. In connection therewith, the fund has agreed to pay its pro rata portion of commitment fees for Tranche A of the Citibank Credit Facility and the BNYM Credit Facility. Interest is charged to the fund based on rates determined pursuant to the terms of the respective Facility at the time of borrowing. During the period ended August 31, 2023, the fund did not borrow under the Facilities.
NOTE 3—Management Fee, Sub–Advisory Fee and Other Transactions with Affiliates:
(a) Pursuant to a management agreement with the Adviser, the management fee is computed at the annual rate of .75% of the value of the fund’s average daily net assets and is payable monthly.
28
Pursuant to a sub-investment advisory agreement between the Adviser and the Sub-Adviser, the Adviser pays the Sub-Adviser a monthly fee at an annual rate of .36% of the value of the fund’s average daily net assets.
(b) Under the Shareholder Services Plan, Investor shares pay the Distributor at an annual rate of .25% of the value of its average daily net assets for the provision of certain services. The services provided may include personal services relating to shareholder accounts, such as answering shareholder inquiries regarding the fund, and services related to the maintenance of shareholder accounts. The Distributor may make payments to Service Agents (securities dealers, financial institutions or other industry professionals) with respect to these services. The Distributor determines the amounts to be paid to Service Agents. During the period ended August 31, 2023, the fund was charged $579,091 pursuant to the Shareholder Services Plan.
The fund has an arrangement with BNY Mellon Transfer, Inc., (the “Transfer Agent”), a subsidiary of BNY Mellon and an affiliate of the Adviser, whereby the fund may receive earnings credits when positive cash balances are maintained, which are used to offset Transfer Agent fees. For financial reporting purposes, the fund includes transfer agent net earnings credits, if any, as an expense offset in the Statement of Operations.
The fund has an arrangement with The Bank of New York Mellon (the “Custodian”), a subsidiary of BNY Mellon and an affiliate of the Adviser, whereby the fund will receive interest income or be charged overdraft fees when cash balances are maintained. For financial reporting purposes, the fund includes this interest income and overdraft fees, if any, as interest income in the Statement of Operations.
The fund compensates the Transfer Agent, under a transfer agency agreement, for providing transfer agency and cash management services for the fund. The majority of Transfer Agent fees are comprised of amounts paid on a per account basis, while cash management fees are related to fund subscriptions and redemptions. During the period ended August 31, 2023, the fund was charged $69,593 for transfer agency services. These fees are included in Shareholder servicing costs in the Statement of Operations. These fees were partially offset by earnings credits of $59,942.
The fund compensates the Custodian, under a custody agreement, for providing custodial services for the fund. These fees are determined based on net assets, geographic region and transaction activity. During the period ended August 31, 2023, the fund was charged $10,383 pursuant to the custody agreement.
29
NOTES TO FINANCIAL STATEMENTS (continued)
During the period ended August 31, 2023, the fund was charged $19,926 for services performed by the fund’s Chief Compliance Officer and his staff. These fees are included in Chief Compliance Officer fees in the Statement of Operations.
The components of “Due to BNY Mellon Investment Adviser, Inc. and affiliates” in the Statement of Assets and Liabilities consist of: management fee of $216,858, Shareholder Services Plan fees of $48,804, Custodian fees of $4,800, Chief Compliance Officer fees of $3,350.
(c) Each board member also serves as a board member of other funds in the BNY Mellon Family of Funds complex. Annual retainer fees and attendance fees are allocated to each fund based on net assets.
NOTE 4—Securities Transactions:
The aggregate amount of purchases and sales of investment securities, excluding short-term securities, during the period ended August 31, 2023, amounted to $131,535,893 and $175,138,034, respectively.
At August 31, 2023, the cost of investments for federal income tax purposes was $325,762,693; accordingly, accumulated net unrealized appreciation on investments was $15,016,988, consisting of $66,780,694 gross unrealized appreciation and $51,763,706 gross unrealized depreciation.
30
REPORT OF INDEPENDENT REGISTERED PUBLIC ACCOUNTING FIRM
To the Shareholders and the Board of Directors of BNY Mellon Opportunistic Small Cap Fund
Opinion on the Financial Statements
We have audited the accompanying statement of assets and liabilities of BNY Mellon Opportunistic Small Cap Fund (the “Fund”) (one of the funds constituting BNY Mellon Advantage Funds, Inc. (the “Company”)), including the statement of investments, as of August 31, 2023, and the related statement of operations for the year then ended, the statements of changes in net assets for each of the two years in the period then ended, the financial highlights for each of the five years in the period then ended and the related notes (collectively referred to as the “financial statements”). In our opinion, the financial statements present fairly, in all material respects, the financial position of the Fund (one of the funds constituting BNY Mellon Advantage Funds, Inc.) at August 31, 2023, the results of its operations for the year then ended, the changes in its net assets for each of the two years in the period then ended and its financial highlights for each of the five years in the period then ended, in conformity with U.S. generally accepted accounting principles.
Basis for Opinion
These financial statements are the responsibility of the Company’s management. Our responsibility is to express an opinion on the Fund’s financial statements based on our audits. We are a public accounting firm registered with the Public Company Accounting Oversight Board (United States) (“PCAOB”) and are required to be independent with respect to the Company in accordance with the U.S. federal securities laws and the applicable rules and regulations of the Securities and Exchange Commission and the PCAOB.
We conducted our audits in accordance with the standards of the PCAOB. Those standards require that we plan and perform the audit to obtain reasonable assurance about whether the financial statements are free of material misstatement, whether due to error or fraud. The Company is not required to have, nor were we engaged to perform, an audit of the Company’s internal control over financial reporting. As part of our audits, we are required to obtain an understanding of internal control over financial reporting but not for the purpose of expressing an opinion on the effectiveness of the Company’s internal control over financial reporting. Accordingly, we express no such opinion.
Our audits included performing procedures to assess the risks of material misstatement of the financial statements, whether due to error or fraud, and performing procedures that respond to those risks. Such procedures included examining, on a test basis, evidence regarding the amounts and disclosures in the financial statements. Our procedures included confirmation of securities owned as of August 31, 2023, by correspondence with the custodian, brokers and others; when replies were not received from brokers and others, we performed other auditing procedures. Our audits also included evaluating the accounting principles used and significant estimates made by management, as well as evaluating the overall presentation of the financial statements. We believe that our audits provide a reasonable basis for our opinion.

We have served as the auditor of one or more investment companies in the BNY Mellon Family of Funds since at least 1957, but we are unable to determine the specific year.
New York, New York
October 23, 2023
31
IMPORTANT TAX INFORMATION (Unaudited)
The fund hereby reports $1.121 per share as a long-term capital gain distribution paid on December 9, 2022.
32
INFORMATION ABOUT THE RENEWAL OF THE FUND'S MANAGEMENT AND SUB-INVESTMENT ADVISORY AGREEMENTS AND THE APPROVAL OF THE FUND’S SUB- SUB-INVESTMENT ADVISORY AGREEMENT (Unaudited)
At a meeting of the fund’s Board of Directors held on March 14-15, 2023, the Board considered the renewal of the fund’s Management Agreement, pursuant to which the Adviser provides the fund with investment advisory and administrative services, and the Sub-Investment Advisory Agreement (together with the Management Agreement, the “Agreements”), pursuant to which Newton Investment Management North America, LLC (the “Sub-Adviser” or “NIMNA”) provides day-to-day management of the fund’s investments. The Board members, none of whom are “interested persons” (as defined in the Investment Company Act of 1940, as amended (the “1940 Act”)) of the fund, were assisted in their review by independent legal counsel and met with counsel in executive session separate from representatives of the Adviser and the Sub-Adviser. In considering the renewal of the Agreements, the Board considered several factors that it believed to be relevant, including those discussed below. The Board did not identify any one factor as dispositive, and each Board member may have attributed different weights to the factors considered.
Analysis of Nature, Extent, and Quality of Services Provided to the Fund. The Board considered information provided to it at the meeting and in previous presentations from representatives of the Adviser regarding the nature, extent, and quality of the services provided to funds in the BNY Mellon fund complex, including the fund. The Adviser provided the number of open accounts in the fund, the fund’s asset size and the allocation of fund assets among distribution channels. The Adviser also had previously provided information regarding the diverse intermediary relationships and distribution channels of funds in the BNY Mellon fund complex (such as retail direct or intermediary, in which intermediaries typically are paid by the fund and/or the Adviser) and the Adviser’s corresponding need for broad, deep, and diverse resources to be able to provide ongoing shareholder services to each intermediary or distribution channel, as applicable to the fund.
The Board also considered research support available to, and portfolio management capabilities of, the fund’s portfolio management personnel and that the Adviser also provides oversight of day-to-day fund operations, including fund accounting and administration and assistance in meeting legal and regulatory requirements. The Board also considered the Adviser’s extensive administrative, accounting and compliance infrastructures, as well as the Adviser’s supervisory activities over the Sub-Adviser. The Board also considered portfolio management’s brokerage policies and practices (including policies and practices regarding soft dollars) and the standards applied in seeking best execution.
Comparative Analysis of the Fund’s Performance and Management Fee and Expense Ratio. The Board reviewed reports prepared by Broadridge Financial Solutions, Inc. (“Broadridge”), an independent provider of investment company data based on classifications provided by Thomson Reuters Lipper (“Lipper”), which included information comparing (1) the performance of the fund’s Investor shares with the performance of a group of retail no-load small-cap core funds selected by Broadridge as
33
INFORMATION ABOUT THE RENEWAL OF THE FUND'S MANAGEMENT AND SUB-INVESTMENT ADVISORY AGREEMENTS AND THE APPROVAL OF THE FUND’S SUB- SUB-INVESTMENT ADVISORY AGREEMENT (Unaudited) (continued)
comparable to the fund (the “Performance Group”) and with a broader group of funds consisting of all retail and institutional small-cap core funds (the “Performance Universe”), all for various periods ended December 31, 2022, and (2) the fund’s actual and contractual management fees and total expenses with those of the same group of funds in the Performance Group (the “Expense Group”) and with a broader group of all retail no-load small-cap core funds, excluding outliers (the “Expense Universe”), the information for which was derived in part from fund financial statements available to Broadridge as of the date of its analysis. The Adviser previously had furnished the Board with a description of the methodology Broadridge used to select the Performance Group and Performance Universe and the Expense Group and Expense Universe.
Performance Comparisons. Representatives of the Adviser stated that the usefulness of performance comparisons may be affected by a number of factors, including different investment limitations and policies that may be applicable to the fund and comparison funds and the end date selected. The Board also considered the fund’s performance in light of overall financial market conditions. The Board discussed with representatives of the Adviser and the Sub-Adviser the results of the comparisons and considered that the fund’s total return performance was below the Performance Group median and the Performance Universe median for all periods. The Board discussed with representatives of the Adviser and the Sub-Adviser the reasons for the fund’s underperformance versus the Performance Group and Performance Universe during the periods under review and noted that the portfolio managers are very experienced and continued to apply a consistent investment strategy. The Adviser also provided a comparison of the fund’s calendar year total returns to the returns of the fund’s benchmark index.
Management Fee and Expense Ratio Comparisons. The Board reviewed and considered the contractual management fee rate payable by the fund to the Adviser in light of the nature, extent and quality of the management services and the sub-advisory services provided by the Adviser and the Sub-Adviser, respectively. In addition, the Board reviewed and considered the actual management fee rate paid by the fund over the fund’s last fiscal year. The Board also reviewed the range of actual and contractual management fees and total expenses as a percentage of average net assets of the Expense Group and Expense Universe funds and discussed the results of the comparisons.
The Board considered that the fund’s contractual management fee was lower than the Expense Group median contractual management fee, the fund’s actual management fee was lower than the Expense Group median and lower than the Expense Universe median actual management fee, and the fund’s total expenses were slightly higher than the Expense Group median and lower than the Expense Universe median total expenses.
Representatives of the Adviser reviewed with the Board the management or investment advisory fees (1) paid by funds advised by the Adviser that are in the same Lipper category as the fund and (2) paid to the Adviser or the Sub-Adviser or its affiliates for advising any separate accounts and/or other types of client portfolios that are considered to have similar investment strategies and policies as the fund (the “Similar
34
Clients”), and explained the nature of the Similar Clients. They discussed differences in fees paid and the relationship of the fees paid in light of any differences in the services provided and other relevant factors. The Board considered the relevance of the fee information provided for the Similar Clients to evaluate the appropriateness of the fund’s management fee.
The Board considered the fee payable to the Sub-Adviser in relation to the fee payable to the Adviser by the fund and the respective services provided by the Sub-Adviser and the Adviser. The Board also took into consideration that the Sub-Adviser’s fee is paid by the Adviser, out of its fee from the fund, and not the fund.
Analysis of Profitability and Economies of Scale. Representatives of the Adviser reviewed the expenses allocated and profit received by the Adviser and its affiliates and the resulting profitability percentage for managing the fund and the aggregate profitability percentage to the Adviser and its affiliates for managing the funds in the BNY Mellon fund complex, and the method used to determine the expenses and profit. The Board concluded that the profitability results were not excessive, given the services rendered and service levels provided by the Adviser and its affiliates. The Board also had been provided with information prepared by an independent consulting firm regarding the Adviser’s approach to allocating costs to, and determining the profitability of, individual funds and the entire BNY Mellon fund complex. The consulting firm also had analyzed where any economies of scale might emerge in connection with the management of a fund.
The Board considered, on the advice of its counsel, the profitability analysis (1) as part of its evaluation of whether the fees under the Agreements, considered in relation to the mix of services provided by the Adviser and the Sub-Adviser, including the nature, extent and quality of such services, supported the renewal of the Agreements and (2) in light of the relevant circumstances for the fund and the extent to which economies of scale would be realized if the fund grows and whether fee levels reflect these economies of scale for the benefit of fund shareholders. Since the Adviser, and not the fund, pays the Sub-Adviser pursuant to the Sub-Investment Advisory Agreement, the Board did not consider the Sub-Adviser’s profitability to be relevant to its deliberations. Representatives of the Adviser stated that a discussion of economies of scale is predicated on a fund having achieved a substantial size with increasing assets and that, if a fund’s assets had been stable or decreasing, the possibility that the Adviser may have realized any economies of scale would be less. Representatives of the Adviser also stated that, as a result of shared and allocated costs among funds in the BNY Mellon fund complex, the extent of economies of scale could depend substantially on the level of assets in the complex as a whole, so that increases and decreases in complex-wide assets can affect potential economies of scale in a manner that is disproportionate to, or even in the opposite direction from, changes in the fund’s asset level. The Board also considered potential benefits to the Adviser and the Sub-Adviser from acting as investment adviser and sub-investment adviser, respectively, and took into consideration the soft dollar arrangements in effect for trading the fund’s investments.
35
INFORMATION ABOUT THE RENEWAL OF THE FUND'S MANAGEMENT AND SUB-INVESTMENT ADVISORY AGREEMENTS AND THE APPROVAL OF THE FUND’S SUB- SUB-INVESTMENT ADVISORY AGREEMENT (Unaudited) (continued)
At the conclusion of these discussions, the Board agreed that it had been furnished with sufficient information to make an informed business decision with respect to the renewal of the Agreements. Based on the discussions and considerations as described above, the Board concluded and determined as follows.
· The Board concluded that the nature, extent and quality of the services provided by the Adviser and the Sub-Adviser are adequate and appropriate.
· The Board determined to continue to monitor the fund’s performance.
· The Board concluded that the fees paid to the Adviser and the Sub-Adviser continued to be appropriate under the circumstances and in light of the factors and the totality of the services provided as discussed above.
· The Board determined that the economies of scale which may accrue to the Adviser and its affiliates in connection with the management of the fund had been adequately considered by the Adviser in connection with the fee rate charged to the fund pursuant to the Management Agreement and that, to the extent in the future it were determined that material economies of scale had not been shared with the fund, the Board would seek to have those economies of scale shared with the fund.
In evaluating the Agreements, the Board considered these conclusions and determinations and also relied on its previous knowledge, gained through meetings and other interactions with the Adviser and its affiliates and the Sub-Adviser, of the Adviser and the Sub-Adviser and the services provided to the fund by the Adviser and the Sub-Adviser. The Board also relied on information received on a routine and regular basis throughout the year relating to the operations of the fund and the investment management and other services provided under the Agreements, including information on the investment performance of the fund in comparison to similar mutual funds and benchmark performance indices; general market outlook as applicable to the fund; and compliance reports. In addition, the Board’s consideration of the contractual fee arrangements for the fund had the benefit of a number of years of reviews of the Agreements for the fund, or substantially similar agreements for other BNY Mellon funds that the Board oversees, during which lengthy discussions took place between the Board and representatives of the Adviser. Certain aspects of the arrangements may receive greater scrutiny in some years than in others, and the Board’s conclusions may be based, in part, on its consideration of the fund’s arrangements, or substantially similar arrangements for other BNY Mellon funds that the Board oversees, in prior years. The Board determined to renew the Agreements.
*******
At the meeting of the fund’s Board held on March 14-15, 2023, the Board also considered the approval of a delegation arrangement between NIMNA and its affiliate, Newton Investment Management Limited (“NIM”), which permits NIMNA, as the fund’s sub-investment adviser, to use the investment advisory personnel, resources and capabilities (“Investment Advisory Services”) available at its sister company, NIM, in
36
providing the day-to-day management of the fund’s investments. In connection therewith, the Board considered the approval of a sub-sub-investment advisory agreement (the “SSIA Agreement”) between NIMNA and NIM, with respect to the fund. In considering the approval of the SSIA Agreement, the Board considered several factors that it believed to be relevant, including those discussed below. The Board did not identify any one factor as dispositive, and each Board member may have attributed different weights to the factors considered.
At the meeting, the Adviser and the Sub-Adviser recommended the approval of the SSIA Agreement to enable NIM to provide Investment Advisory Services to the Sub-Adviser for the benefit of the fund, including, but not limited to, portfolio management services, subject to the supervision of the Sub-Adviser and the Adviser. The recommendation for the approval of the SSIA Agreement was based on the following considerations, among others: (i) approval of the SSIA Agreement would permit the Sub-Adviser to use investment personnel employed primarily by NIM as primary portfolio managers of the fund and to use the investment research services of NIM in the day-to-day management of the fund’s investments; and (ii) there would be no material changes to the fund’s investment objective, strategies or policies, no reduction in the nature or level of services provided to the fund, and no increases in the management fee payable by the fund or the sub-advisory fee payable by the Adviser to the Sub-Adviser as a result of the delegation arrangement. The Board also considered the fact that the Adviser stated that it believed there were no material changes to the information the Board had previously considered at the meeting in connection with the Board’s re-approval of the Agreements for the ensuing year, other than the information about the delegation arrangement and NIM.
In determining whether to approve the SSIA Agreement, the Board considered the materials prepared by the Adviser and the Sub-Adviser received in advance of the meeting and other information presented at the meeting, which included: (i) a form of the SSIA Agreement; (ii) information regarding the delegation arrangement and how it is expected to enhance investment capabilities for the benefit of the fund; (iii) information regarding NIM; and (iv) an opinion of counsel that the proposed delegation arrangement would not result in an “assignment” of the Sub-Investment Advisory Agreement under the 1940 Act and the Investment Advisers Act of 1940, as amended, and, therefore, did not require the approval of fund shareholders. The Board also considered the substance of discussions with representatives of the Adviser and the Sub-Adviser at the meeting in connection with the Board’s re-approval of the Agreements.
Nature, Extent and Quality of Services to be Provided. In examining the nature, extent and quality of the services that were expected to be provided by NIM under the SSIA Agreement, the Board considered: (i) NIM’s organization, qualification and background, as well as the qualifications of its personnel; (ii) the expertise of the personnel providing portfolio management services; (iii) information regarding NIM’s compliance program; and (iv) the investment strategy for the fund, which would remain the same. The Board also considered that enabling the Sub-Adviser to use the proposed Investment Advisory
37
INFORMATION ABOUT THE RENEWAL OF THE FUND'S MANAGEMENT AND SUB-INVESTMENT ADVISORY AGREEMENTS AND THE APPROVAL OF THE FUND’S SUB- SUB-INVESTMENT ADVISORY AGREEMENT (Unaudited) (continued)
Services provided by NIM, the Sub-Adviser would provide investment and portfolio management services of at least the same nature, extent and quality that it currently provides to the fund without the ability to use the Investment Advisory Services of its sister company. Based on the considerations and review of the foregoing information, the Board concluded that the nature, extent and quality of the sub-investment advisory services to be provided by the Sub-Adviser having the ability to use the Investment Advisory Services supported a decision to approve the SSIA Agreement.
Investment Performance. The Board considered the fund’s investment performance and that of the investment team managing the fund’s portfolio (including comparative data provided by Broadridge) at the meeting in connection with the Board’s re-approval of the Agreements. The Board considered that the same investment professionals would continue to manage the fund’s assets and that enabling the Sub-Adviser to use the Investment Advisory Services pursuant to the SSIA Agreement for the benefit of the fund supported a decision to approve the SSIA Agreement.
Costs of Services to be Provided and Profitability. The Board considered the contractual management fee payable by the fund to the Adviser pursuant to the Management Agreement and the contractual sub-investment advisory fee payable by the Adviser to the Sub-Adviser pursuant to the Sub-Investment Advisory Agreement at the meeting in connection with the Board’s re-approval of the Agreements. The Board noted that the contractual management fee payable by the fund to the Adviser and the sub-investment advisory fee payable by the Adviser to the Sub-Adviser, would not change in connection with the proposed delegation arrangement. The Board recognized that, because the fees payable would not change, an analysis of profitability was more appropriate in the context of the Board’s consideration of the Agreements, and that the Board had received and considered a profitability analysis of the Adviser and its affiliates, including NIMNA, at the meeting in connection with the Board’s re-approval of the Agreements. The Board concluded that the Adviser’s profitability was not excessive in light of the nature, extent and quality of the services to be provided to the fund by the Adviser and the Sub-Adviser under the Agreements.
Economies of Scale to be Realized. The Board recognized that, because the fees payable by the fund to the Adviser pursuant to the Management Agreement and the contractual sub-investment advisory fee payable by the Adviser to the Sub-Adviser pursuant to the Sub-Investment Advisory Agreement would not change in connection with the proposed delegation arrangement, an analysis of economies of scale was more appropriate in the context of the Board’s consideration of the Agreements, which had been done at the meeting in connection with the Board’s re-approval of the Agreements. At the meeting, the Board determined that the economies of scale which may accrue to the Adviser and its affiliates in connection with the management of the fund had been adequately considered by the Adviser in connection with the fee rate charged to the fund pursuant to the Agreements and that, to the extent in the future it were determined that material economies of scale had not been shared with the fund, the Board would seek to have those economies of scale shared with the fund.
38
The Board also considered whether there were any ancillary benefits that would accrue to the Sub-Adviser as a result of its relationship with the fund after the delegation arrangement, and such ancillary benefits, if any, were determined to be reasonable.
After full consideration of the factors discussed above, with no single factor identified as being of paramount importance, the Board, with the assistance of independent legal counsel, approved the delegation arrangement and the SSIA Agreement for the fund.
39
LIQUIDITY RISK MANAGEMENT PROGRAM (Unaudited)
The fund adopted a liquidity risk management program (the “Liquidity Risk Management Program”) pursuant to the requirements of Rule 22e-4 under the Investment Company Act of 1940, as amended. Rule 22e-4 requires registered open-end funds, including mutual funds and exchange-traded funds but not money market funds, to establish liquidity risk management programs in order to effectively manage fund liquidity and shareholder redemptions. The rule is designed to mitigate the risk that a fund could not meet redemption requests without significantly diluting the interests of remaining investors.
The rule requires the fund to assess, manage and review their liquidity risk at least annually considering applicable factors such as investment strategy and liquidity during normal and foreseeable stressed conditions, including whether the strategy is appropriate for an open-end fund and whether the fund has a relatively concentrated portfolio or large positions in particular issuers. The fund must also assess its use of borrowings and derivatives, short-term and long-term cash flow projections in normal and stressed conditions, holdings of cash and cash equivalents, and borrowing arrangements and other funding sources.
The rule also requires the fund to classify its investments as highly liquid, moderately liquid, less liquid or illiquid based on the number of days the fund expects it would take to liquidate the investment, and to review these classifications at least monthly or more often under certain conditions. The periods range from three or fewer business days for a highly liquid investment to greater than seven calendar days for settlement of a less liquid investment. Illiquid investments are those a fund does not expect to be able to sell or dispose of within seven calendar days without significantly changing the market value. The fund is prohibited from acquiring an investment if, after the acquisition, its holdings of illiquid assets will exceed 15% of its net assets. In addition, if a fund permits redemptions in-kind, the rule requires the fund to establish redemption in-kind policies and procedures governing how and when it will engage in such redemptions.
Pursuant to the rule’s requirements, the Liquidity Risk Management Program has been reviewed and approved by the Board. Furthermore, the Board has received a written report prepared by the Program’s Administrator that addresses the operation of the Program, assesses its adequacy and effectiveness and describes any material changes made to the Program.
Assessment of Program
In the opinion of the Program Administrator, the Program approved by the Board continues to be adequate for the fund and the Program has been implemented effectively. The Program Administrator has monitored the fund’s liquidity risk and the liquidity classification of the securities held by the fund and has determined that the Program is operating effectively.
During the period from January 1, 2022 to December 31, 2022, there were no material changes to the Program and no material liquidity events that impacted the fund. During the period, the fund held sufficient highly liquid assets to meet fund redemptions.
Under normal expected foreseeable fund redemption forecasts and foreseeable stressed fund redemption forecasts, the Program Administrator believes that the fund maintains sufficient highly liquid assets to meet expected fund redemptions.
40
BOARD MEMBERS INFORMATION (Unaudited)
Independent Board Members
Joseph S. DiMartino (79)
Chairman of the Board (1995)
Principal Occupation During Past 5 Years:
· Director or Trustee of funds in the BNY Mellon Family of Funds and certain other entities (as described in the fund’s Statement of Additional Information) (1995-Present)
Other Public Company Board Memberships During Past 5 Years:
· CBIZ, Inc., a public company providing professional business services, products and solutions, Director (1997-May 2023)
No. of Portfolios for which Board Member Serves: 86
———————
Peggy C. Davis (80)
Board Member (2006)
Principal Occupation During Past 5 Years:
· Shad Professor of Law, New York University School of Law (1983-Present)
No. of Portfolios for which Board Member Serves: 29
———————
Gina D. France (65)
Board Member (2019)
Principal Occupation During Past 5 Years:
· France Strategic Partners, a strategy and advisory firm serving corporate clients across the United States, Founder, President and Chief Executive Officer (2003-Present)
Other Public Company Board Memberships During Past 5 Years:
· Huntington Bancshares, a bank holding company headquartered in Columbus, Ohio, Director (2016-Present)
· Cedar Fair, L.P., a publicly-traded partnership that owns and operates amusement parks and hotels in the U.S. and Canada, Director (2011-May 2023)
· CBIZ, Inc., a public company providing professional business services, products and solutions, Director (2015-Present)
No. of Portfolios for which Board Member Serves: 22
———————
Joan Gulley (75)
Board Member (2017)
Principal Occupation During Past 5 Years:
· Nantucket Atheneum, public library, Chair (June 2018-June 2021) and Director (2015-June 2021)
· Orchard Island Club, golf and beach club, Governor (2016-Present) and President (February 2023-Present)
No. of Portfolios for which Board Member Serves: 39
———————
41
BOARD MEMBERS INFORMATION (Unaudited) (continued)
Robin A. Melvin (59)
Board Member (2012)
Principal Occupation During Past 5 Years:
· Westover School, a private girls’ boarding school in Middlebury, Connecticut, Trustee (2019-June 2023)
· Mentor Illinois, a non-profit organization dedicated to increasing the quantity and quality of mentoring services in Illinois, Co-Chair (2014–2020); Board Member (2013-2020)
· JDRF, a non-profit juvenile diabetes research foundation, Board Member (June 2021-June 2022)
Other Public Company Board Memberships During Past 5 Years:
· HPS Corporate Lending Fund, a closed-end management investment company regulated as a business development company, Trustee (August 2021-Present)
No. of Portfolios for which Board Member Serves: 68
———————
Michael D. DiLecce (61)
Advisory Board Member (2022)
Principal Occupation During Past 5 Years:
· Retired since July 2022. Global Asset Management Assurance Leader, Ernst & Young LLP (2015-2022)
· Americas Regional Talent Managing Partner for Ernst & Young’s Financial Service Practice (2017-2021)
· Partner, Ernst & Young LLP (1997-2022)
No. of Portfolios for which Board Member Serves: 22
———————
The address of the Board Members and Officers is c/o BNY Mellon Investment Adviser, Inc., 240 Greenwich Street, New York, New York 10286. Additional information about each Board Member is available in the fund’s Statement of Additional Information which can be obtained from the Adviser free of charge by calling this toll free number: 1-800-373-9387.
42
OFFICERS OF THE FUND (Unaudited)
DAVID DIPETRILLO, President since January 2021.
Vice President and Director of the Adviser since February 2021; Head of North America Distribution, BNY Investment Management since February 2023; and Head of North America Product, BNY Mellon Investment Management from January 2018 to February 2023. He is an officer of 53 investment companies (comprised of 103 portfolios) managed by the Adviser or an affiliate of the Adviser. He is 45 years old and has been an employee of BNY Mellon since 2005.
JAMES WINDELS, Treasurer since November 2001.
Director of the Adviser since February 2023; Vice President of the Adviser since September 2020; and Director–BNY Mellon Fund Administration. He is an officer of 54 investment companies (comprised of 122 portfolios) managed by the Adviser or an affiliate of the Adviser. He is 64 years old and has been an employee of the Adviser since April 1985.
PETER M. SULLIVAN, Chief Legal Officer since July 2021 and Vice President and Assistant Secretary since March 2019.
Chief Legal Officer of the Adviser and Associate General Counsel of BNY Mellon since July 2021; Senior Managing Counsel of BNY Mellon from December 2020 to July 2021; and Managing Counsel of BNY Mellon from March 2009 to December 2020. He is an officer of 54 investment companies (comprised of 122 portfolios) managed by the Adviser or an affiliate of the Adviser. He is 55 years old and has been an employee of BNY Mellon since April 2004.
JAMES BITETTO, Vice President since August 2005 and Secretary since February 2018.
Senior Managing Counsel of BNY Mellon since December 2019; Managing Counsel of BNY Mellon from April 2014 to December 2019; and Secretary of the Adviser. He is an officer of 54 investment companies (comprised of 122 portfolios) managed by the Adviser or an affiliate of the Adviser. He is 57 years old and has been an employee of the Adviser since December 1996.
DEIRDRE CUNNANE, Vice President and Assistant Secretary since March 2019.
Managing Counsel of BNY Mellon since December 2021; and Counsel of BNY Mellon from August 2018 to December 2021. She is an officer of 54 investment companies (comprised of 122 portfolios) managed by the Adviser or an affiliate of the Adviser. She is 33 years old and has been an employee of BNY Mellon since August 2013.
SARAH S. KELLEHER, Vice President and Assistant Secretary since April 2014.
Vice President of BNY Mellon ETF Investment Adviser; LLC since February 2020; Senior Managing Counsel of BNY Mellon since September 2021; and Managing Counsel of BNY Mellon from December 2017 to September 2021. She is an officer of 54 investment companies (comprised of 122 portfolios) managed by the Adviser or an affiliate of the Adviser. She is 47 years old and has been an employee of BNY Mellon since March 2013.
JEFF PRUSNOFSKY, Vice President and Assistant Secretary since August 2005.
Senior Managing Counsel of BNY Mellon. He is an officer of 54 investment companies (comprised of 122 portfolios) managed by the Adviser or an affiliate of the Adviser. He is 58 years old and has been an employee of the Adviser since October 1990.
AMANDA QUINN, Vice President and Assistant Secretary since March 2020.
Counsel of BNY Mellon since June 2019; Regulatory Administration Manager at BNY Mellon Investment Management Services from September 2018 to May 2019; and Senior Regulatory Specialist at BNY Mellon Investment Management Services from April 2015 to August 2018. She is an officer of 54 investment companies (comprised of 122 portfolios) managed by the Adviser or an affiliate of the Adviser. She is 38 years old and has been an employee of BNY Mellon since June 2012.
JOANNE SKERRETT, Vice President and Assistant Secretary since March 2023.
Managing Counsel of BNY Mellon since June 2022; and Senior Counsel with the Mutual Fund Directors Forum, a leading funds industry organization, from 2016 to June 2022. She is an officer of 54 investment companies (comprised of 122 portfolios) managed by the Adviser or an affiliate of the Adviser. She is 51 years old and has been an employee of the Adviser since June 2022.
43
OFFICERS OF THE FUND (Unaudited) (continued)
NATALYA ZELENSKY, Vice President and Assistant Secretary since March 2017.
Chief Compliance Officer since August 2021 and Vice President since February 2020 of BNY Mellon ETF Investment Adviser, LLC; Chief Compliance Officer since August 2021 and Vice President and Assistant Secretary since February 2020 of BNY Mellon ETF Trust; Managing Counsel of BNY Mellon from December 2019 to August 2021; Counsel of BNY Mellon from May 2016 to December 2019; and Assistant Secretary of the Adviser from April 2018 to August 2021. She is an officer of 54 investment companies (comprised of 122 portfolios) managed by the Adviser or an affiliate of the Adviser. She is 38 years old and has been an employee of BNY Mellon since May 2016.
DANIEL GOLDSTEIN, Vice President since March 2022.
Head of Product Development of North America Distribution, BNY Mellon Investment Management since January 2018; Executive Vice President of North America Product, BNY Mellon Investment Management since April 2023; and Senior Vice President, Development & Oversight of North America Product, BNY Mellon Investment Management from 2010 to March 2023. He is an officer of 53 investment companies (comprised of 103 portfolios) managed by the Adviser or an affiliate of the Adviser. He is 54 years old and has been an employee of the Distributor since 1991.
JOSEPH MARTELLA, Vice President since March 2022.
Vice President of the Adviser since December 2022; Head of Product Management of North America Distribution, BNY Mellon Investment Management since January 2018; Executive Vice President of North America Product, BNY Mellon Investment Management since April 2023; and Senior Vice President of North America Product, BNY Mellon Investment Management from 2010 to March 2023. He is an officer of 53 investment companies (comprised of 103 portfolios) managed by the Adviser or an affiliate of the Adviser. He is 46 years old and has been an employee of the Distributor since 1999.
GAVIN C. REILLY, Assistant Treasurer since December 2005.
Tax Manager–BNY Mellon Fund Administration. He is an officer of 54 investment companies (comprised of 122 portfolios) managed by the Adviser or an affiliate of the Adviser. He is 55 years old and has been an employee of the Adviser since April 1991.
ROBERT SALVIOLO, Assistant Treasurer since July 2007.
Senior Accounting Manager–BNY Mellon Fund Administration. He is an officer of 54 investment companies (comprised of 122 portfolios) managed by the Adviser or an affiliate of the Adviser. He is 56 years old and has been an employee of the Adviser since June 1989.
ROBERT SVAGNA, Assistant Treasurer since December 2002.
Senior Accounting Manager–BNY Mellon Fund Administration. He is an officer of 54 investment companies (comprised of 122 portfolios) managed by the Adviser or an affiliate of the Adviser. He is 56 years old and has been an employee of the Adviser since November 1990.
JOSEPH W. CONNOLLY, Chief Compliance Officer since October 2004.
Chief Compliance Officer of the BNY Mellon Family of Funds and BNY Mellon Funds Trust since 2004; and Chief Compliance Officer of the Adviser from 2004 until June 2021. He is the Chief Compliance Officer of 53 investment companies (comprised of 105 portfolios) managed by the Adviser. He is 66 years old.
CARIDAD M. CAROSELLA, Anti-Money Laundering Compliance Officer since January 2016.
Anti-Money Laundering Compliance Officer of the BNY Mellon Family of Funds and BNY Mellon Funds Trust. She is an officer of 47 investment companies (comprised of 115 portfolios) managed by the Adviser or an affiliate of the Adviser. She is 55 years old and has been an employee of the Distributor since 1997.
44
This page intentionally left blank.
45
BNY Mellon Opportunistic Small Cap Fund
240 Greenwich Street
New York, NY 10286
Adviser
BNY Mellon Investment Adviser, Inc.
240 Greenwich Street
New York, NY 10286
Sub-Adviser
Newton Investment Management
North America, LLC
BNY Mellon Center
201 Washington Street
Boston, MA 02108
Custodian
The Bank of New York Mellon
240 Greenwich Street
New York, NY 10286
Transfer Agent &
Dividend Disbursing Agent
BNY Mellon Transfer, Inc.
240 Greenwich Street
New York, NY 10286
Distributor
BNY Mellon Securities Corporation
240 Greenwich Street
New York, NY 10286
| | |
Ticker Symbols: | Investor: DSCVX Class I: DOPIX Class Y: DSCYX |
Telephone Call your financial representative or 1-800-373-9387
Mail The BNY Mellon Family of Funds, 144 Glenn Curtiss Boulevard, Uniondale, NY 11556-0144
E-mail Send your request to info@bnymellon.com
Internet Information can be viewed online or downloaded at www.im.bnymellon.com
The fund files its complete schedule of portfolio holdings with the Securities and Exchange Commission (“SEC”) for the first and third quarters of each fiscal year on Form N-PORT. The fund’s Forms N-PORT are available on the SEC’s website at www.sec.gov.
A description of the policies and procedures that the fund uses to determine how to vote proxies relating to portfolio securities and information regarding how the fund voted these proxies for the most recent 12-month period ended June 30 is available at www.im.bnymellon.com and on the SEC’s website at www.sec.gov and without charge, upon request, by calling 1-800-373-9387.
| | |
© 2023 BNY Mellon Securities Corporation
0253AR0823 | 
|
BNY Mellon Technology Growth Fund
| |
ANNUAL REPORT August 31, 2023 |
| |
Save time. Save paper. View your next shareholder report online as soon as it’s available. Log into www.im.bnymellon.com and sign up for eCommunications. It’s simple and only takes a few minutes. |
| |
The views expressed in this report reflect those of the portfolio manager(s) only through the end of the period covered and do not necessarily represent the views of BNY Mellon Investment Adviser, Inc. or any other person in the BNY Mellon Investment Adviser, Inc. organization. Any such views are subject to change at any time based upon market or other conditions and BNY Mellon Investment Adviser, Inc. disclaims any responsibility to update such views. These views may not be relied on as investment advice and, because investment decisions for a fund in the BNY Mellon Family of Funds are based on numerous factors, may not be relied on as an indication of trading intent on behalf of any fund in the BNY Mellon Family of Funds. |
| |
Not FDIC-Insured • Not Bank-Guaranteed • May Lose Value |
Contents
THE FUND
FOR MORE INFORMATION
Back Cover
DISCUSSION OF FUND PERFORMANCE (Unaudited)
For the period from September 1, 2022, through August 31, 2023, as provided by Jonathan Piskorowski and Robert C. Zeuthen, portfolio managers of Newton Investment Management North America, LLC, sub-adviser.
Market and Fund Performance Overview
For the 12-month period ended August 31, 2023, BNY Mellon Technology Growth Fund’s (the “fund”) Class A shares produced a total return of 24.81%, Class C shares returned 23.73%, Class I shares returned 25.05% and Class Y shares returned 25.01%.1 In comparison, the fund’s benchmarks, the NYSE® Technology Index and the S&P 500® Index, produced total returns of 35.15% and 15.93%, respectively, over the same period.2,3
Equities posted gains as investors began to anticipate the end of the Federal Reserve’s (the “Fed”) monetary tightening program. The fund underperformed the NYSE Technology Index primarily due to unfavorable stock selection.
The Fund’s Investment Approach
The fund seeks capital appreciation. To pursue its goal, the fund normally invests at least 80% of its net assets, plus any borrowings for investment purposes, in the stocks of growth companies of any size that Newton Investment Management North America, LLC, the fund’s sub-adviser, believes to be leading producers or beneficiaries of technological innovation. Up to 25% of the fund’s assets may be invested in foreign securities. In choosing stocks, the fund’s portfolio managers look for technology companies with the potential for strong earnings or revenue growth rates. The fund’s investment process centers on a multidimensional approach that looks for opportunities across emerging-growth, cyclical or stable-growth companies.
Market Supported by Easing Inflation, Economic Resilience
The reporting period was marked by a range of factors that affected returns. Early in the period, the dominant theme was the Fed’s continued monetary tightening policies aimed at curbing inflation. Added to this was the banking crisis that emerged early in 2023. Uncertainty about the outcome of the debt ceiling standoff in the Congress also weighed on markets, as did some weaker-than-expected performance of China’s economy. Easing inflation, continued economic growth, the anticipated end to the Fed’s rate hikes and the emergence of the artificial intelligence (“AI”) theme provided markets with support.
The Fed raised the federal funds rate seven times during the period but reduced the size of the increase from 75 basis points to just 25 basis points for the last four hikes. The smaller rate hikes late in the period disappointed markets somewhat, as many investors were hoping for an end to the hiking cycle, given some signs of economic slowing.
Economic data showed that as pricing pressures continued to weaken from their peak in June 2022, the labor market also began to soften. Though unemployment remained relatively low, some large technology companies announced layoffs or paused hiring amid a more cautious macroeconomic outlook.
The banking crisis that emerged early in 2023 gave investors another reason to believe the Fed’s tightening policy would not continue. Three regional banks Silicon Valley Bank, Signature Bank and First Republic Bank faced mounting losses in their long-dated bond holdings as interest rates rose. Uninsured depositors were spooked by the headlines and lost confidence, choosing to move their money into larger money center banks.
In May 2023, the debate in Congress over the federal debt ceiling reached an apparent standoff, resulting in some market volatility. While an agreement was eventually reached, providing the market with some relief, the run-up caused some turmoil as the prospect of a default was threatened.
In addition to easing inflation and investors’ growing anticipation of the end to the Fed’s tightening cycle, the possibility the economy could avoid recession also provided some support as a widely
2
expected recession failed to arrive. China’s weaker-than-expected rebound from its Zero-COVID policies, however, disappointed investors somewhat.
The market was also supported by the launch of ChatGPT by Open AI, which drew investors’ attention to the promise of artificial intelligence and its likely enhancement of productivity and economic growth. While the most immediate beneficiaries of this news were large-cap growth stocks in the information technology sector, their performance provided support to the market as a whole.
Stock Selection Hindered Performance
Returns were hindered by stock selections in a variety of industries. One leading detractor was PayPal Holdings, Inc., which declined on lower payment volumes and on increasing competition from Apple Pay. (PayPal was in the IT services industry but has since been reclassified as a member of the financial sector.) A lack of exposure to Oracle, a database company, and Broadcom, a chipmaker, was also detrimental as these and certain other legacy technology companies outperformed due to increased interest in AI. An underweight position in Meta Platforms, Inc., parent of Facebook, also detracted. Share performed strongly as the company expected to benefit from the emergence of AI.
On a more positive note, an underweight to the consumer discretionary sector was beneficial, as were certain stock selections. In consumer discretionary, shares of China-based companies such as Alibaba Group Holding, Ltd. and JD.com Inc. performed poorly. The fund’s position in Shopify Inc., which provides online shopping services, benefited from strength in its payments business and a decision to drop its struggling fulfilment operations. Shares of HubSpot Inc., which provides sales and marketing services to small and mid-sized businesses, also contributed positively. In the semiconductor and semiconductor equipment industry, Applied Materials Inc., a manufacturer of semiconductor equipment, also performed well, benefiting from interest in AI.
Positioned to Capitalize on AI
We continue to position the portfolio to capitalize on secular growth themes. We have added to positions in companies that are likely to be leaders or beneficiaries of AI. As with other revolutionary technologies, the market will eventually reward the winners, and in these early stages of AI, we are focused on finding winners and positioning the fund to benefit from their growth trajectory.
In addition, we have trimmed or sold positions in companies that appear to be threatened by AI, such as online travel booking services. We have also sold or trimmed prominent companies in the fintech industry.
We are also emphasizing the mobility and Internet of Things theme, including self-driving vehicles. “Edge computing,” which will remain a significant trend as AI progresses, is another theme we are focusing on.
September 15, 2023
1 Total return includes reinvestment of dividends and any capital gains paid and does not take into consideration the maximum initial sales charge in the case of Class A shares, or the applicable contingent deferred sales charge imposed on redemptions in the case of Class C shares. Had these charges been reflected, returns would have been lower. Past performance is no guarantee of future results. Share price, yield and investment return fluctuate such that upon redemption, fund shares may be worth more or less than their original cost. Return figures provided reflect an undertaking for the absorption of certain fund expenses by BNY Mellon Investment Adviser, Inc. through December 30, 2023, at which time it may be extended, terminated or modified.
2 Source: Bloomberg L.P. — The NYSE® Technology Index is an equal-dollar-weighted index designed to objectively represent the technology sector by holding 35 of the leading U.S. technology-related companies. Investors cannot invest directly in any index.
3 Source: Lipper Inc. — The S&P 500® Index is widely regarded as the best single gauge of large-cap U.S. equities. The index includes 500 leading companies and captures approximately 80% coverage of available market capitalization. Investors cannot invest directly in any index.
Please note: the position in any security highlighted with italicized typeface was sold during the reporting period.
Equities are subject generally to market, market sector, market liquidity, issuer and investment style risks, among other factors, to varying degrees, all of which are more fully described in the fund’s prospectus.
The technology sector has been among the most volatile sectors of the stock market. Technology companies involve greater risk because their revenue and/or earnings tend to be less predictable, and some companies may be experiencing significant losses.
3
FUND PERFORMANCE (Unaudited)
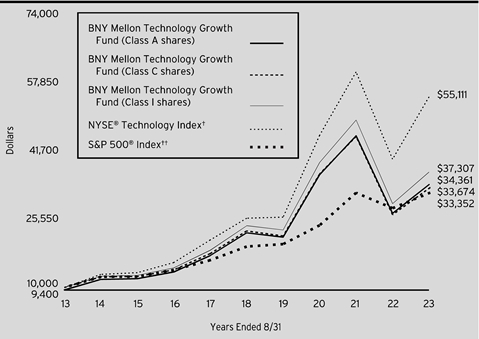
Comparison of change in value of a $10,000 investment in Class A shares, Class C shares and Class I shares of BNY Mellon Technology Growth Fund with a hypothetical investment of $10,000 in the NYSE® Technology Index and S&P 500® Index.
† Source: Bloomberg L.P.
†† Source: Lipper Inc.
Past performance is not predictive of future performance.
The above graph compares a hypothetical $10,000 investment made in each of the Class A shares, Class C shares and Class I shares of BNY Mellon Technology Growth Fund on 8/31/13 to a hypothetical investment of $10,000 made in each of the NYSE® Technology Index and S&P 500® Index on that date. All dividends and capital gain distributions are reinvested.
The fund’s performance shown in the line graph above takes into account the maximum initial sales charge on Class A shares and all other applicable fees and expenses on Class A shares, Class C shares and Class I shares. The NYSE® Technology Index is an equal-dollar weighted index designed to objectively represent the technology sector by holding 35 of the leading U.S. technology-related companies. The S&P 500® Index is widely regarded as the best single gauge of large-cap U.S. equities. The index includes 500 leading companies and captures approximately 80% coverage of available market capitalization. Unlike a mutual fund, the indices are not subject to charges, fees and other expenses. Investors cannot invest directly in any index. Further information relating to fund performance, including expense reimbursements, if applicable, is contained in the Financial Highlights section of the prospectus and elsewhere in this report.
4
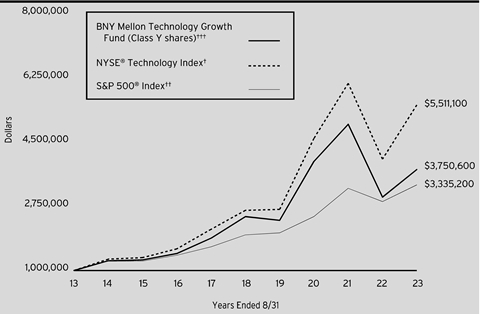
Comparison of change in value of a $1,000,000 investment in Class Y shares of BNY Mellon Technology Growth Fund with a hypothetical investment of $1,000,000 in the NYSE® Technology Index and S&P 500® Index.
† Source: Bloomberg L.P.
†† Source: Lipper Inc.
††† The total return figures presented for Class Y shares of the fund reflect the performance of the fund’s Class I shares for the period prior to 9/30/16 (the inception date for Class Y shares).
Past performance is not predictive of future performance.
The above graph compares a hypothetical $1,000,000 investment made in Class Y shares of BNY Mellon Technology Growth Fund on 8/31/13 to a hypothetical investment of $1,000,000 made in each of the NYSE® Technology Index and S&P 500® Index on that date. All dividends and capital gain distributions are reinvested.
The fund’s performance shown in the line graph above takes into account all applicable fees and expenses on Class Y shares. The NYSE® Technology Index is an equal-dollar weighted index designed to objectively represent the technology sector by holding 35 of the leading U.S. technology-related companies. The S&P 500® Index is widely regarded as the best single gauge of large-cap U.S. equities. The index includes 500 leading companies and captures approximately 80% coverage of available market capitalization. Unlike a mutual fund, the indices are not subject to charges, fees and other expenses. Investors cannot invest directly in any index. Further information relating to fund performance, including expense reimbursements, if applicable, is contained in the Financial Highlights section of the prospectus and elsewhere in this report.
5
FUND PERFORMANCE (Unaudited) (continued)
| | | | | |
Average Annual Total Returns as of 8/31/2023 |
| | Inception Date | 1 Year | 5 Years | 10 Years |
Class A shares | | | | |
with maximum sales charge (5.75%) | 10/13/1997 | 17.62% | 7.15% | 13.14% |
without sales charge | 10/13/1997 | 24.81% | 8.42% | 13.81% |
Class C shares | | | | |
with applicable redemption charge† | 4/15/1999 | 22.73% | 7.57% | 12.91% |
without redemption | 4/15/1999 | 23.73% | 7.57% | 12.91% |
Class I shares | 4/15/1999 | 25.05% | 8.66% | 14.07% |
Class Y shares | 9/30/2016 | 25.01% | 8.72% | 14.13%†† |
NYSE® Technology Index | | 35.15% | 15.86% | 18.59% |
S&P 500® Index | | 15.93% | 11.12% | 12.80% |
† The maximum contingent deferred sales charge for Class C shares is 1% for shares redeemed within one year of the date of purchase.
†† The total return performance figures presented for Class Y shares of the fund reflect the performance of the fund’s Class I shares for the period prior to 9/30/16 (the inception date for Class Y shares).
The performance data quoted represents past performance, which is no guarantee of future results. Share price and investment return fluctuate and an investor’s shares may be worth more or less than original cost upon redemption. Current performance may be lower or higher than the performance quoted. Go to www.im.bnymellon.com for the fund’s most recent month-end returns.
The fund’s performance shown in the graphs and table does not reflect the deduction of taxes that a shareholder would pay on fund distributions or the redemption of fund shares. In addition to the performance of Class A shares shown with and without a maximum sales charge, the fund’s performance shown in the table takes into account all other applicable fees and expenses on all classes.
6
UNDERSTANDING YOUR FUND’S EXPENSES (Unaudited)
As a mutual fund investor, you pay ongoing expenses, such as management fees and other expenses. Using the information below, you can estimate how these expenses affect your investment and compare them with the expenses of other funds. You also may pay one-time transaction expenses, including sales charges (loads) and redemption fees, which are not shown in this section and would have resulted in higher total expenses. For more information, see your fund’s prospectus or talk to your financial adviser.
Review your fund’s expenses
The table below shows the expenses you would have paid on a $1,000 investment in BNY Mellon Technology Growth Fund from March 1, 2023 to August 31, 2023. It also shows how much a $1,000 investment would be worth at the close of the period, assuming actual returns and expenses.
| | | | | | | |
Expenses and Value of a $1,000 Investment | |
Assume actual returns for the six months ended August 31, 2023 | |
| | | | | | |
| | Class A | Class C | Class I | Class Y | |
Expenses paid per $1,000† | $6.08 | $10.88 | $4.88 | $4.88 | |
Ending value (after expenses) | $1,276.70 | $1,270.90 | $1,278.00 | $1,277.70 | |
COMPARING YOUR FUND’S EXPENSES WITH THOSE OF OTHER FUNDS (Unaudited)
Using the SEC’s method to compare expenses
The Securities and Exchange Commission (“SEC”) has established guidelines to help investors assess fund expenses. Per these guidelines, the table below shows your fund’s expenses based on a $1,000 investment, assuming a hypothetical 5% annualized return. You can use this information to compare the ongoing expenses (but not transaction expenses or total cost) of investing in the fund with those of other funds. All mutual fund shareholder reports will provide this information to help you make this comparison. Please note that you cannot use this information to estimate your actual ending account balance and expenses paid during the period.
| | | | | | | |
Expenses and Value of a $1,000 Investment | |
Assuming a hypothetical 5% annualized return for the six months ended August 31, 2023 | |
| | | | | | |
| | Class A | Class C | Class I | Class Y | |
Expenses paid per $1,000† | $5.40 | $9.65 | $4.33 | $4.33 | |
Ending value (after expenses) | $1,019.86 | $1,015.63 | $1,020.92 | $1,020.92 | |
† | Expenses are equal to the fund’s annualized expense ratio of 1.06% for Class A, 1.90% for Class C, .85% for Class I and .85% for Class Y, multiplied by the average account value over the period, multiplied by 184/365 (to reflect the one-half year period). |
7
STATEMENT OF INVESTMENTS
August 31, 2023
| | | | | | | | |
| |
Description | | | | Shares | | Value ($) | |
Common Stocks - 97.9% | | | | | |
Application Software - 10.8% | | | | | |
Adobe, Inc. | | | | 14,825 | a | 8,292,215 | |
DoubleVerify Holdings, Inc. | | | | 73,173 | a | 2,473,979 | |
HubSpot, Inc. | | | | 13,512 | a | 7,384,578 | |
Intuit, Inc. | | | | 14,071 | | 7,623,809 | |
Salesforce, Inc. | | | | 34,014 | a | 7,532,740 | |
| | | | | 33,307,321 | |
Automotive Parts & Equipment - 1.7% | | | | | |
Mobileye Global, Inc., Cl. A | | | | 146,030 | a,b | 5,185,525 | |
Broadline Retail - 6.8% | | | | | |
Alibaba Group Holding Ltd., ADR | | | | 66,258 | a | 6,155,368 | |
Amazon.com, Inc. | | | | 91,264 | a | 12,595,345 | |
JD.com, Inc., ADR | | | | 74,126 | b | 2,461,724 | |
| | | | | 21,212,437 | |
Health Care Equipment - .9% | | | | | |
Intuitive Surgical, Inc. | | | | 8,656 | a | 2,706,558 | |
Hotels, Resorts & Cruise Lines - 2.5% | | | | | |
Airbnb, Inc., Cl. A | | | | 58,363 | a | 7,677,653 | |
Interactive Media & Services - 8.4% | | | | | |
Alphabet, Inc., Cl. C | | | | 90,919 | a | 12,487,725 | |
Meta Platforms, Inc., Cl. A | | | | 45,491 | a | 13,460,332 | |
| | | | | 25,948,057 | |
Internet Services & Infrastructure - 10.1% | | | | | |
Akamai Technologies, Inc. | | | | 28,355 | a | 2,979,827 | |
Shopify, Inc., Cl. A | | | | 229,356 | a | 15,249,880 | |
Snowflake, Inc., Cl. A | | | | 49,776 | a | 7,807,366 | |
Twilio, Inc., Cl. A | | | | 81,870 | a | 5,215,938 | |
| | | | | 31,253,011 | |
Life Sciences Tools & Services - 1.0% | | | | | |
Illumina, Inc. | | | | 19,740 | a | 3,261,443 | |
Movies & Entertainment - 4.0% | | | | | |
Netflix, Inc. | | | | 28,561 | a | 12,386,334 | |
Passenger Ground Transportation - 4.7% | | | | | |
Uber Technologies, Inc. | | | | 310,976 | a | 14,687,396 | |
Real Estate Services - 1.7% | | | | | |
CoStar Group, Inc. | | | | 62,777 | a | 5,147,086 | |
Semiconductor Materials & Equipment - 11.6% | | | | | |
Applied Materials, Inc. | | | | 111,170 | | 16,982,329 | |
ASML Holding NV | | | | 8,196 | | 5,413,704 | |
Lam Research Corp. | | | | 15,012 | | 10,544,429 | |
MKS Instruments, Inc. | | | | 28,402 | b | 2,846,732 | |
| | | | | 35,787,194 | |
8
| | | | | | | | |
| |
Description | | | | Shares | | Value ($) | |
Common Stocks - 97.9% (continued) | | | | | |
Semiconductors - 18.3% | | | | | |
Infineon Technologies AG, ADR | | | | 90,204 | | 3,236,520 | |
Micron Technology, Inc. | | | | 89,455 | | 6,256,483 | |
NVIDIA Corp. | | | | 38,267 | | 18,886,678 | |
ON Semiconductor Corp. | | | | 33,608 | a | 3,309,044 | |
Qualcomm, Inc. | | | | 58,812 | | 6,735,738 | |
Synaptics, Inc. | | | | 43,785 | a | 3,832,939 | |
Taiwan Semiconductor Manufacturing Co. Ltd., ADR | | | | 155,320 | | 14,533,292 | |
| | | | | 56,790,694 | |
Systems Software - 11.9% | | | | | |
JFrog Ltd. | | | | 198,221 | a | 5,686,960 | |
Microsoft Corp. | | | | 47,547 | | 15,584,005 | |
ServiceNow, Inc. | | | | 26,202 | a | 15,428,524 | |
| | | | | 36,699,489 | |
Technology Hardware, Storage & Equipment - 3.5% | | | | | |
Apple, Inc. | | | | 58,442 | | 10,979,499 | |
Total Common Stocks (cost $202,617,132) | | | | 303,029,697 | |
| | | | | | | | |
Private Equity - .8% | | | | | |
Real Estate - .1% | | | | | |
Roofstock | | | | 35,162 | a,c | 326,655 | |
Software - .7% | | | | | |
Databricks, Inc. | | | | 31,884 | a,c | 2,120,605 | |
Total Private Equity (cost $3,379,723) | | | | 2,447,260 | |
| | | 1-Day
Yield (%) | | | | | |
Investment Companies - 1.3% | | | | | |
Registered Investment Companies - 1.3% | | | | | |
Dreyfus Institutional Preferred Government Plus Money Market Fund, Institutional Shares
(cost $4,066,974) | | 5.41 | | 4,066,974 | d | 4,066,974 | |
9
STATEMENT OF INVESTMENTS (continued)
| | | | | | | | |
| |
Description | | 1-Day
Yield (%) | | Shares | | Value ($) | |
Investment of Cash Collateral for Securities Loaned - 1.7% | | | | | |
Registered Investment Companies - 1.7% | | | | | |
Dreyfus Institutional Preferred Government Plus Money Market Fund, Institutional Shares
(cost $5,132,199) | | 5.41 | | 5,132,199 | d | 5,132,199 | |
Total Investments (cost $215,196,028) | | 101.7% | | 314,676,130 | |
Liabilities, Less Cash and Receivables | | (1.7%) | | (5,167,607) | |
Net Assets | | 100.0% | | 309,508,523 | |
ADR—American Depositary Receipt
a Non-income producing security.
b Security, or portion thereof, on loan. At August 31, 2023, the value of the fund’s securities on loan was $7,928,304 and the value of the collateral was $8,013,011, consisting of cash collateral of $5,132,199 and U.S. Government & Agency securities valued at $2,880,812. In addition, the value of collateral may include pending sales that are also on loan.
c The fund held Level 3 securities at August 31, 2023. These securities were valued at $2,447,260 or ..8% of net assets.
d Investment in affiliated issuer. The investment objective of this investment company is publicly available and can be found within the investment company’s prospectus.
| | |
Portfolio Summary (Unaudited) † | Value (%) |
Information Technology | 66.2 |
Communication Services | 12.4 |
Consumer Discretionary | 11.0 |
Industrials | 4.7 |
Investment Companies | 3.0 |
Health Care | 1.9 |
Real Estate | 1.8 |
Technology | .7 |
| | 101.7 |
† Based on net assets.
See notes to financial statements.
10
| | | | | | | |
Affiliated Issuers | | | |
Description | Value ($) 8/31/2022 | Purchases ($)† | Sales ($) | Value ($) 8/31/2023 | Dividends/
Distributions ($) | |
Registered Investment Companies - 1.3% | | |
Dreyfus Institutional Preferred Government Plus Money Market Fund, Institutional Shares - 1.3% | 9,493,659 | 71,288,314 | (76,714,999) | 4,066,974 | 154,008 | |
Investment of Cash Collateral for Securities Loaned - 1.7%†† | | |
Dreyfus Institutional Preferred Government Plus Money Market Fund, Institutional Shares - 1.7% | - | 5,975,046 | (842,847) | 5,132,199 | 1,459 | ††† |
Dreyfus Institutional Preferred Government Plus Money Market Fund, SL Shares - .0% | - | 16,697,096 | (16,697,096) | - | 9,920 | ††† |
Total - 3.0% | 9,493,659 | 93,960,456 | (94,254,942) | 9,199,173 | 165,387 | |
† Includes reinvested dividends/distributions.
†† Effective July 3, 2023, cash collateral for securities lending was transferred from Dreyfus Institutional Preferred Government Plus Money Market Fund, SL Shares to Dreyfus Institutional Preferred Government Plus Money Market Fund, Institutional Shares.
††† Represents securities lending income earned from the reinvestment of cash collateral from loaned securities, net of fees and collateral investment expenses, and other payments to and from borrowers of securities.
See notes to financial statements.
11
STATEMENT OF ASSETS AND LIABILITIES
August 31, 2023
| | | | | | | |
| | | | | | |
| | | Cost | | Value | |
Assets ($): | | | | |
Investments in securities—See Statement of Investments
(including securities on loan, valued at $7,928,304)—Note 1(c): | | | |
Unaffiliated issuers | 205,996,855 | | 305,476,957 | |
Affiliated issuers | | 9,199,173 | | 9,199,173 | |
Cash denominated in foreign currency | | | 46,344 | | 46,252 | |
Dividends and securities lending income receivable | | 138,470 | |
Receivable for shares of Common Stock subscribed | | 121,380 | |
Tax reclaim receivable—Note 1(b) | | 13,486 | |
Prepaid expenses | | | | | 55,514 | |
| | | | | 315,051,232 | |
Liabilities ($): | | | | |
Due to BNY Mellon Investment Adviser, Inc. and affiliates—Note 3(c) | | 231,593 | |
Liability for securities on loan—Note 1(c) | | 5,132,199 | |
Payable for shares of Common Stock redeemed | | 88,277 | |
Directors’ fees and expenses payable | | 5,142 | |
Other accrued expenses | | | | | 85,498 | |
| | | | | 5,542,709 | |
Net Assets ($) | | | 309,508,523 | |
Composition of Net Assets ($): | | | | |
Paid-in capital | | | | | 222,026,638 | |
Total distributable earnings (loss) | | | | | 87,481,885 | |
Net Assets ($) | | | 309,508,523 | |
| | | | | | |
Net Asset Value Per Share | Class A | Class C | Class I | Class Y | |
Net Assets ($) | 287,165,775 | 2,743,840 | 19,586,738 | 12,170 | |
Shares Outstanding | 6,300,215 | 115,134 | 351,595 | 216.64 | |
Net Asset Value Per Share ($) | 45.58 | 23.83 | 55.71 | 56.18 | |
| | | | | |
See notes to financial statements. | | | | | |
12
STATEMENT OF OPERATIONS
Year Ended August 31, 2023
| | | | | | | |
| | | | | | |
| | | | | | |
Investment Income ($): | | | | |
Income: | | | | |
Cash dividends (net of $72,161 foreign taxes withheld at source): | |
Unaffiliated issuers | | | 1,226,162 | |
Affiliated issuers | | | 154,008 | |
Income from securities lending—Note 1(c) | | | 11,379 | |
Total Income | | | 1,391,549 | |
Expenses: | | | | |
Management fee—Note 3(a) | | | 1,997,208 | |
Shareholder servicing costs—Note 3(c) | | | 923,693 | |
Professional fees | | | 97,435 | |
Registration fees | | | 69,963 | |
Prospectus and shareholders’ reports | | | 59,072 | |
Directors’ fees and expenses—Note 3(d) | | | 21,552 | |
Chief Compliance Officer fees—Note 3(c) | | | 19,567 | |
Distribution fees—Note 3(b) | | | 18,730 | |
Custodian fees—Note 3(c) | | | 7,560 | |
Loan commitment fees—Note 2 | | | 6,020 | |
Interest expense—Note 2 | | | 215 | |
Miscellaneous | | | 27,435 | |
Total Expenses | | | 3,248,450 | |
Less—reduction in expenses due to undertaking—Note 3(a) | | | (266,211) | |
Less—reduction in fees due to earnings credits—Note 3(c) | | | (77,183) | |
Net Expenses | | | 2,905,056 | |
Net Investment (Loss) | | | (1,513,507) | |
Realized and Unrealized Gain (Loss) on Investments—Note 4 ($): | | |
Net realized gain (loss) on investments | 6,849,843 | |
Net change in unrealized appreciation (depreciation) on investments
and foreign currency transactions | 55,058,312 | |
Net Realized and Unrealized Gain (Loss) on Investments | | | 61,908,155 | |
Net Increase in Net Assets Resulting from Operations | | 60,394,648 | |
| | | | | | |
See notes to financial statements. | | | | | |
13
STATEMENT OF CHANGES IN NET ASSETS
| | | | | | | | | | |
| | | | Year Ended August 31, |
| | | | 2023 | | 2022 | |
Operations ($): | | | | | | | | |
Net investment (loss) | | | (1,513,507) | | | | (3,046,316) | |
Net realized gain (loss) on investments | | 6,849,843 | | | | (10,118,659) | |
Net change in unrealized appreciation
(depreciation) on investments | | 55,058,312 | | | | (180,452,367) | |
Net Increase (Decrease) in Net Assets
Resulting from Operations | 60,394,648 | | | | (193,617,342) | |
Distributions ($): | |
Distributions to shareholders: | | | | | | | | |
Class A | | | - | | | | (79,738,309) | |
Class C | | | - | | | | (1,625,975) | |
Class I | | | - | | | | (6,222,702) | |
Class Y | | | - | | | | (58,917) | |
Total Distributions | | | - | | | | (87,645,903) | |
Capital Stock Transactions ($): | |
Net proceeds from shares sold: | | | | | | | | |
Class A | | | 7,509,297 | | | | 16,444,712 | |
Class C | | | 557,385 | | | | 1,002,584 | |
Class I | | | 6,769,094 | | | | 11,607,531 | |
Class Y | | | - | | | | 25,000 | |
Distributions reinvested: | | | | | | | | |
Class A | | | - | | | | 72,668,371 | |
Class C | | | - | | | | 1,597,295 | |
Class I | | | - | | | | 6,095,060 | |
Class Y | | | - | | | | 56,126 | |
Cost of shares redeemed: | | | | | | | | |
Class A | | | (27,653,010) | | | | (46,322,341) | |
Class C | | | (957,161) | | | | (1,841,717) | |
Class I | | | (13,424,786) | | | | (12,325,997) | |
Class Y | | | (51,794) | | | | (319,476) | |
Increase (Decrease) in Net Assets
from Capital Stock Transactions | (27,250,975) | | | | 48,687,148 | |
Total Increase (Decrease) in Net Assets | 33,143,673 | | | | (232,576,097) | |
Net Assets ($): | |
Beginning of Period | | | 276,364,850 | | | | 508,940,947 | |
End of Period | | | 309,508,523 | | | | 276,364,850 | |
14
| | | | | | | | | | |
| | | | Year Ended August 31, |
| | | | 2023 | | 2022 | |
Capital Share Transactions (Shares): | |
Class Aa | | | | | | | | |
Shares sold | | | 192,295 | | | | 321,634 | |
Shares issued for distributions reinvested | | | - | | | | 1,160,466 | |
Shares redeemed | | | (748,788) | | | | (932,258) | |
Net Increase (Decrease) in Shares Outstanding | (556,493) | | | | 549,842 | |
Class C | | | | | | | | |
Shares sold | | | 27,916 | | | | 33,675 | |
Shares issued for distributions reinvested | | | - | | | | 48,082 | |
Shares redeemed | | | (48,350) | | | | (69,367) | |
Net Increase (Decrease) in Shares Outstanding | (20,434) | | | | 12,390 | |
Class Ia | | | | | | | | |
Shares sold | | | 139,427 | | | | 182,419 | |
Shares issued for distributions reinvested | | | - | | | | 79,914 | |
Shares redeemed | | | (309,978) | | | | (203,314) | |
Net Increase (Decrease) in Shares Outstanding | (170,551) | | | | 59,019 | |
Class Y | | | | | | | | |
Shares sold | | | - | | | | 546 | |
Shares issued for distributions reinvested | | | - | | | | 730 | |
Shares redeemed | | | (1,274) | | | | (4,359) | |
Net Increase (Decrease) in Shares Outstanding | (1,274) | | | | (3,083) | |
| | | | | | | | | |
a | During the period ended August 31, 2022, 1,044 Class A shares representing $51,570 were exchanged for 866 Class I shares. | |
See notes to financial statements. | | | | | | | | |
15
FINANCIAL HIGHLIGHTS
The following tables describe the performance for each share class for the fiscal periods indicated. All information (except portfolio turnover rate) reflects financial results for a single fund share. Net asset value total return is calculated assuming an initial investment made at the net asset value at the beginning of the period, reinvestment of all dividends and distributions at net asset value during the period, and redemption at net asset value on the last day of the period. Net asset value total return includes adjustments in accordance with accounting principles generally accepted in the United States of America and as such, the net asset value for financial reporting purposes and the returns based upon those net asset values may differ from the net asset value and returns for shareholder transactions. These figures have been derived from the fund’s financial statements.
| | | | | | | |
| | |
| | Year Ended August 31, |
Class A Shares | | 2023 | 2022 | 2021 | 2020 | 2019 |
Per Share Data ($): | | | | | | |
Net asset value, beginning of period | | 36.52 | 73.40 | 62.07 | 43.75 | 59.03 |
Investment Operations: | | | | | | |
Net investment (loss)a | | (.22) | (.41) | (.56) | (.12) | (.07) |
Net realized and unrealized
gain (loss) on investments | | 9.28 | (23.59) | 15.57 | 25.25 | (3.93) |
Total from Investment Operations | | 9.06 | (24.00) | 15.01 | 25.13 | (4.00) |
Distributions: | | | | | | |
Dividends from net realized
gain on investments | | - | (12.88) | (3.68) | (6.81) | (11.28) |
Net asset value, end of period | | 45.58 | 36.52 | 73.40 | 62.07 | 43.75 |
Total Return (%)b | | 24.81 | (40.01) | 25.06 | 67.36 | (4.38) |
Ratios/Supplemental Data (%): | | | | | | |
Ratio of total expenses
to average net assets | | 1.22 | 1.16 | 1.15 | 1.20 | 1.20 |
Ratio of net expenses
to average net assets | | 1.10 | 1.16 | 1.15 | 1.20 | 1.20 |
Ratio of net investment (loss)
to average net assets | | (.57) | (.79) | (.85) | (.28) | (.15) |
Portfolio Turnover Rate | | 54.77 | 43.78 | 54.26 | 70.24 | 69.92 |
Net Assets, end of period ($ x 1,000) | | 287,166 | 250,424 | 462,897 | 392,204 | 263,227 |
a Based on average shares outstanding.
b Exclusive of sales charge.
See notes to financial statements.
16
| | | | | | | |
| | | |
| | | Year Ended August 31, |
Class C Shares | | 2023 | 2022 | 2021 | 2020 | 2019 |
Per Share Data ($): | | | | | | |
Net asset value, beginning of period | | 19.26 | 44.92 | 39.59 | 30.51 | 45.44 |
Investment Operations: | | | | | | |
Net investment (loss)a | | (.28) | (.46) | (.65) | (.30) | (.29) |
Net realized and unrealized
gain (loss) on investments | | 4.85 | (12.32) | 9.66 | 16.19 | (3.36) |
Total from Investment Operations | | 4.57 | (12.78) | 9.01 | 15.89 | (3.65) |
Distributions: | | | | | | |
Dividends from net realized
gain on investments | | - | (12.88) | (3.68) | (6.81) | (11.28) |
Net asset value, end of period | | 23.83 | 19.26 | 44.92 | 39.59 | 30.51 |
Total Return (%)b | | 23.73 | (40.50) | 24.07 | 66.16 | (5.10) |
Ratios/Supplemental Data (%): | | | | | | |
Ratio of total expenses
to average net assets | | 2.08 | 1.97 | 1.94 | 1.96 | 1.92 |
Ratio of net expenses
to average net assets | | 1.95 | 1.97 | 1.94 | 1.96 | 1.92 |
Ratio of net investment (loss)
to average net assets | | (1.43) | (1.60) | (1.64) | (1.03) | (.88) |
Portfolio Turnover Rate | | 54.77 | 43.78 | 54.26 | 70.24 | 69.92 |
Net Assets, end of period ($ x 1,000) | | 2,744 | 2,611 | 5,533 | 7,576 | 8,754 |
a Based on average shares outstanding.
b Exclusive of sales charge.
See notes to financial statements.
17
FINANCIAL HIGHLIGHTS (continued)
| | | | | | | |
| | | |
| | | Year Ended August 31, |
Class I Shares | | 2023 | 2022 | 2021 | 2020 | 2019 |
Per Share Data ($): | | | | | | |
Net asset value, beginning of period | | 44.55 | 86.61 | 72.48 | 49.88 | 65.30 |
Investment Operations: | | | | | | |
Net investment income (loss)a | | (.17) | (.36) | (.49) | (.03) | .04 |
Net realized and unrealized
gain (loss) on investments | | 11.33 | (28.82) | 18.30 | 29.44 | (4.18) |
Total from Investment Operations | | 11.16 | (29.18) | 17.81 | 29.41 | (4.14) |
Distributions: | | | | | | |
Dividends from net realized
gain on investments | | - | (12.88) | (3.68) | (6.81) | (11.28) |
Net asset value, end of period | | 55.71 | 44.55 | 86.61 | 72.48 | 49.88 |
Total Return (%) | | 25.05 | (39.88) | 25.33 | 67.73 | (4.16) |
Ratios/Supplemental Data (%): | | | | | | |
Ratio of total expenses
to average net assets | | 1.03 | .94 | .93 | .98 | .96 |
Ratio of net expenses
to average net assets | | .90 | .94 | .93 | .98 | .96 |
Ratio of net investment
income (loss) to average net assets | | (.38) | (.57) | (.62) | (.05) | .08 |
Portfolio Turnover Rate | | 54.77 | 43.78 | 54.26 | 70.24 | 69.92 |
Net Assets, end of period ($ x 1,000) | | 19,587 | 23,262 | 40,112 | 28,877 | 23,367 |
a Based on average shares outstanding.
See notes to financial statements.
18
| | | | | | | |
| | | |
| | | Year Ended August 31, |
Class Y Shares | | 2023 | 2022 | 2021 | 2020 | 2019 |
Per Share Data ($): | | | | | | |
Net asset value, beginning of period | | 44.94 | 87.21 | 72.90 | 50.08 | 65.48 |
Investment Operations: | | | | | | |
Net investment income (loss)a | | (.17) | (.40) | (.43) | .03 | .14 |
Net realized and unrealized
gain (loss) on investments | | 11.41 | (28.99) | 18.42 | 29.60 | (4.26) |
Total from Investment Operations | | 11.24 | (29.39) | 17.99 | 29.63 | (4.12) |
Distributions: | | | | | | |
Dividends from net realized
gain on investments | | - | (12.88) | (3.68) | (6.81) | (11.28) |
Net asset value, end of period | | 56.18 | 44.94 | 87.21 | 72.90 | 50.08 |
Total Return (%) | | 25.01 | (39.84) | 25.43 | 67.91 | (4.11) |
Ratios/Supplemental Data (%): | | | | | | |
Ratio of total expenses
to average net assets | | 1.03 | .87 | .85 | .88 | .89 |
Ratio of net expenses
to average net assets | | .90 | .87 | .85 | .88 | .89 |
Ratio of net investment income
(loss) to average net assets | | (.38) | (.51) | (.55) | .05 | .26 |
Portfolio Turnover Rate | | 54.77 | 43.78 | 54.26 | 70.24 | 69.92 |
Net Assets, end of period ($ x 1,000) | | 12 | 67 | 399 | 319 | 165 |
a Based on average shares outstanding.
See notes to financial statements.
19
NOTES TO FINANCIAL STATEMENTS
NOTE 1—Significant Accounting Policies:
BNY Mellon Technology Growth Fund (the “fund”) is a separate diversified series of BNY Mellon Advantage Funds, Inc. (the “Company”), which is registered under the Investment Company Act of 1940, as amended (the “Act”), as an open-end management investment company and operates as a series company currently offering seven series, including the fund. The fund’s investment objective is to seek capital appreciation. BNY Mellon Investment Adviser, Inc. (the “Adviser”), a wholly-owned subsidiary of The Bank of New York Mellon Corporation (“BNY Mellon”), serves as the fund’s investment adviser. Newton Investment Management North America, LLC (the “Sub-Adviser”), an indirect wholly-owned subsidiary of BNY Mellon and an affiliate of the Adviser, serves as the fund’s sub-adviser.
Effective March 31, 2023, the Sub-Adviser, entered into a sub-sub-investment advisory agreement with its affiliate, Newton Investment Management Limited (“NIM”), to enable NIM to provide certain advisory services to the Sub-Adviser for the benefit of the fund, including, but not limited to, portfolio management services. NIM is subject to the supervision of the Sub-Adviser and the Adviser. NIM is also an affiliate of the Adviser. NIM, located at 160 Queen Victoria Street, London, EC4V, 4LA, England, was formed in 1978. NIM is an indirect subsidiary of BNY Mellon.
BNY Mellon Securities Corporation (the “Distributor”), a wholly-owned subsidiary of the Adviser, is the distributor of the fund’s shares. The fund is authorized to issue 700 million shares of $.001 par value Common Stock. The fund currently has authorized four classes of shares: Class A (200 million shares authorized), Class C (100 million shares authorized), Class I (250 million shares authorized), and Class Y (150 million shares authorized). Class A and Class C shares are sold primarily to retail investors through financial intermediaries and bear Distribution and/or Shareholder Services Plan fees. Class A shares generally are subject to a sales charge imposed at the time of purchase. Class A shares bought without an initial sales charge as part of an investment of $1 million or more may be charged a contingent deferred sales charge (“CDSC”) of 1.00% if redeemed within one year. Class C shares are subject to a CDSC imposed on Class C shares redeemed within one year of purchase. Class C shares automatically convert to Class A shares eight years after the date of purchase, without the imposition of a sales charge. Class I shares are sold primarily to bank trust departments and other financial service providers
20
(including BNY Mellon and its affiliates), acting on behalf of customers having a qualified trust or an investment account or relationship at such institution, and bear no Distribution or Shareholder Services Plan fees. Class Y shares are sold at net asset value per share generally to institutional investors, and bear no Distribution or Shareholder Services Plan fees. Class I and Class Y shares are offered without a front-end sales charge or CDSC. Other differences between the classes include the services offered to and the expenses borne by each class, the allocation of certain transfer agency costs and certain voting rights. Income, expenses (other than expenses attributable to a specific class), and realized and unrealized gains or losses on investments are allocated to each class of shares based on its relative net assets.
As of August 31, 2023, MBC Investments Corporation, an indirect subsidiary of BNY Mellon, held all of the outstanding Class Y shares of the fund.
The Company accounts separately for the assets, liabilities and operations of each series. Expenses directly attributable to each series are charged to that series’ operations; expenses which are applicable to all series are allocated among them on a pro rata basis.
The Financial Accounting Standards Board (“FASB”) Accounting Standards Codification (“ASC”) is the exclusive reference of authoritative U.S. generally accepted accounting principles (“GAAP”) recognized by the FASB to be applied by nongovernmental entities. Rules and interpretive releases of the SEC under authority of federal laws are also sources of authoritative GAAP for SEC registrants. The fund is an investment company and applies the accounting and reporting guidance of the FASB ASC Topic 946 Financial Services-Investment Companies. The fund’s financial statements are prepared in accordance with GAAP, which may require the use of management estimates and assumptions. Actual results could differ from those estimates.
The Company enters into contracts that contain a variety of indemnifications. The fund’s maximum exposure under these arrangements is unknown. The fund does not anticipate recognizing any loss related to these arrangements.
(a) Portfolio valuation: The fair value of a financial instrument is the amount that would be received to sell an asset or paid to transfer a liability in an orderly transaction between market participants at the measurement date (i.e., the exit price). GAAP establishes a fair value hierarchy that prioritizes the inputs of valuation techniques used to measure fair value. This hierarchy gives the highest priority to unadjusted quoted prices in
21
NOTES TO FINANCIAL STATEMENTS (continued)
active markets for identical assets or liabilities (Level 1 measurements) and the lowest priority to unobservable inputs (Level 3 measurements).
Additionally, GAAP provides guidance on determining whether the volume and activity in a market has decreased significantly and whether such a decrease in activity results in transactions that are not orderly. GAAP requires enhanced disclosures around valuation inputs and techniques used during annual and interim periods.
Various inputs are used in determining the value of the fund’s investments relating to fair value measurements. These inputs are summarized in the three broad levels listed below:
Level 1—unadjusted quoted prices in active markets for identical investments.
Level 2—other significant observable inputs (including quoted prices for similar investments, interest rates, prepayment speeds, credit risk, etc.).
Level 3—significant unobservable inputs (including the fund’s own assumptions in determining the fair value of investments).
The inputs or methodology used for valuing securities are not necessarily an indication of the risk associated with investing in those securities.
Changes in valuation techniques may result in transfers in or out of an assigned level within the disclosure hierarchy. Valuation techniques used to value the fund’s investments are as follows:
The Company’s Board of Directors (the “Board”) has designated the Adviser as the fund’s valuation designee, effective September 8, 2022, to make all fair value determinations with respect to the fund’s portfolio investments, subject to the Board’s oversight and pursuant to Rule 2a-5 under the Act.
Investments in equity securities are valued at the last sales price on the securities exchange or national securities market on which such securities are primarily traded. Securities listed on the National Market System for which market quotations are available are valued at the official closing price or, if there is no official closing price that day, at the last sales price. For open short positions, asked prices are used for valuation purposes. Bid price is used when no asked price is available. Registered investment companies that are not traded on an exchange are valued at their net asset value. All of the preceding securities are generally categorized within Level 1 of the fair value hierarchy.
22
Securities not listed on an exchange or the national securities market, or securities for which there were no transactions, are valued at the average of the most recent bid and asked prices. These securities are generally categorized within Level 2 of the fair value hierarchy.
Fair valuing of securities may be determined with the assistance of a pricing service using calculations based on indices of domestic securities and other appropriate indicators, such as prices of relevant ADRs and futures. Utilizing these techniques may result in transfers between Level 1 and Level 2 of the fair value hierarchy.
When market quotations or official closing prices are not readily available, or are determined not to accurately reflect fair value, such as when the value of a security has been significantly affected by events after the close of the exchange or market on which the security is principally traded (for example, a foreign exchange or market), but before the fund calculates its net asset value, the fund may value these investments at fair value as determined in accordance with the procedures approved by the Board. Certain factors may be considered when fair valuing investments such as: fundamental analytical data, the nature and duration of restrictions on disposition, an evaluation of the forces that influence the market in which the securities are purchased and sold, and public trading in similar securities of the issuer or comparable issuers. These securities are either categorized within Level 2 or 3 of the fair value hierarchy depending on the relevant inputs used.
For securities where observable inputs are limited, assumptions about market activity and risk are used and such securities are generally categorized within Level 3 of the fair value hierarchy.
Investment in private equity securities will be fair valued by the Board in accordance with valuation procedures approved by the Board. Those portfolio valuations will be based on unobservable inputs and certain assumptions about how market participants would price the instrument. The fund expects that inputs into the determination of fair value of those investments will require significant management judgment or estimation. Because valuations may fluctuate over short periods of time and may be based on estimates, fair value determinations may differ materially from the value received in an actual transaction. Additionally, valuations of private companies are inherently uncertain. The fund’s net asset value could be adversely affected if the fund’s determinations regarding the fair value of those investments were materially higher or lower than the values that it ultimately realized upon the disposal of such investments. These securities are categorized within Level 3 of the fair value hierarchy.
23
NOTES TO FINANCIAL STATEMENTS (continued)
Investments denominated in foreign currencies are translated to U.S. dollars at the prevailing rates of exchange.
The following is a summary of the inputs used as of August 31, 2023 in valuing the fund’s investments:
| | | | | | | |
| | Level 1-Unadjusted Quoted Prices | Level 2- Other Significant Observable Inputs | | Level 3-Significant Unobservable Inputs | Total | |
Assets ($) | | |
Investments in Securities:† | | |
Equity Securities - Common Stocks | 303,029,697 | - | | - | 303,029,697 | |
Equity Securities - Private Equity | - | - | | 2,447,260 | 2,447,260 | |
Investment Companies | 9,199,173 | - | | - | 9,199,173 | |
† See Statement of Investments for additional detailed categorizations, if any.
The following is a reconciliation of Level 3 assets for which significant unobservable inputs were used to determine fair value:
| | |
| | Equity Securities-Private Equity ($) |
Balance as of 8/31/2022† | 2,027,790 |
Purchases/Issuances | - |
Sales/Dispositions | - |
Net realized gain (loss) | - |
Change in unrealized appreciation (depreciation) | 419,470 |
Transfers into Level 3 | - |
Transfers out of Level 3 | - |
Balances as of 8/31/2023† | 2,447,260 |
The amount of total net realized gains (loss) for the period included in earnings attributable to the net change in unrealized appreciation (depreciation) relating to investments still held at 8/31/2023 | 419,470 |
† Securities deemed as Level 3 due to the lack of observable inputs by management assessment.
The following table summarizes the significant unobservable inputs the fund used to value its investment categorized within Level 3 as of August 31, 2023. In addition to the techniques and inputs noted in the table below, according to the fund’s valuation policy, other valuation techniques and methodologies when determining the fund’s fair value measurements may be used. The below table is not intended to be all-inclusive, but rather
24
provide information on the significant unobservable inputs as they are to the fund’s determination of fair values.
| | | | | | |
| | | | | Range |
Asset Category- Issuer Name | Value ($) | Valuation
Techniques/
Methodologies | Unobservable
Inputs | Low | High |
Private Equity: | | | | | |
Roofstock | 326,655 | Public Comparables/
Enterprise Value | Enterprise Value as Multiple of Revenue | 0.3x | 11.9x |
Databricks | 2,120,605 | Public Comparables/
Enterprise Value | Enterprise Value as Multiple of Revenue | 6.9x | 16.3x |
(b) Foreign currency transactions: The fund does not isolate that portion of the results of operations resulting from changes in foreign exchange rates on investments from the fluctuations arising from changes in the market prices of securities held. Such fluctuations are included with the net realized and unrealized gain or loss on investments.
Net realized foreign exchange gains or losses arise from sales of foreign currencies, currency gains or losses realized on securities transactions between trade and settlement date, and the difference between the amounts of dividends, interest and foreign withholding taxes recorded on the fund’s books and the U.S. dollar equivalent of the amounts actually received or paid. Net unrealized foreign exchange gains and losses arise from changes in the value of assets and liabilities other than investments resulting from changes in exchange rates. Foreign currency gains and losses on foreign currency transactions are also included with net realized and unrealized gain or loss on investments.
Foreign taxes: The fund may be subject to foreign taxes (a portion of which may be reclaimable) on income, stock dividends, realized and unrealized capital gains on investments or certain foreign currency transactions. Foreign taxes are recorded in accordance with the applicable foreign tax regulations and rates that exist in the foreign jurisdictions in which the fund invests. These foreign taxes, if any, are paid by the fund and are reflected in the Statement of Operations, if applicable. Foreign taxes payable or deferred or those subject to reclaims as of August 31, 2023, if any, are disclosed in the fund’s Statement of Assets and Liabilities.
(c) Securities transactions and investment income: Securities transactions are recorded on a trade date basis. Realized gains and losses from securities transactions are recorded on the identified cost basis. Dividend income is recognized on the ex-dividend date and interest
25
NOTES TO FINANCIAL STATEMENTS (continued)
income, including, where applicable, accretion of discount and amortization of premium on investments, is recognized on the accrual basis.
Pursuant to a securities lending agreement with BNY Mellon, the fund may lend securities to qualified institutions. It is the fund’s policy that, at origination, all loans are secured by collateral of at least 102% of the value of U.S. securities loaned and 105% of the value of foreign securities loaned. Collateral equivalent to at least 100% of the market value of securities on loan is maintained at all times. Collateral is either in the form of cash, which can be invested in certain money market mutual funds managed by the Adviser, or U.S. Government and Agency securities. The fund is entitled to receive all dividends, interest and distributions on securities loaned, in addition to income earned as a result of the lending transaction. Should a borrower fail to return the securities in a timely manner, BNY Mellon is required to replace the securities for the benefit of the fund or credit the fund with the market value of the unreturned securities and is subrogated to the fund’s rights against the borrower and the collateral. Additionally, the contractual maturity of security lending transactions are on an overnight and continuous basis. During the period ended August 31, 2023, BNY Mellon earned $1,551 from the lending of the fund’s portfolio securities, pursuant to the securities lending agreement.
(d) Affiliated issuers: Investments in other investment companies advised by the Adviser are considered “affiliated” under the Act.
(e) Market Risk: The value of the securities in which the fund invests may be affected by political, regulatory, economic and social developments, and developments that impact specific economic sectors, industries or segments of the market. The value of a security may also decline due to general market conditions that are not specifically related to a particular company or industry, such as real or perceived adverse economic conditions, changes in the general outlook for corporate earnings, changes in interest or currency rates, changes to inflation, adverse changes to credit markets or adverse investor sentiment generally. In addition, turbulence in financial markets and reduced liquidity in equity, credit and/or fixed-income markets may negatively affect many issuers, which could adversely affect the fund. Global economies and financial markets are becoming increasingly interconnected, and conditions and events in one country, region or financial market may adversely impact issuers in a different country, region or financial market. These risks may be magnified if certain events or developments adversely interrupt the global supply chain; in these and other circumstances, such risks might affect companies world-wide.
26
Foreign Investment Risk: To the extent the fund invests in foreign securities, the fund’s performance will be influenced by political, social and economic factors affecting investments in foreign issuers. Special risks associated with investments in foreign issuers include exposure to currency fluctuations, less liquidity, less developed or less efficient trading markets, lack of comprehensive company information, political and economic instability and differing auditing and legal standards.
Technology Company Risk: The technology sector has been among the most volatile sectors of the stock market. Because the fund’s investments are concentrated in the technology sector, its performance will be significantly affected by developments in that sector. Technology companies, especially small-cap technology companies, involve greater risk because their revenue and/or earnings tend to be less predictable (and some companies may be experiencing significant losses) and their share prices tend to be more volatile. Certain technology companies may have limited product lines, markets or financial resources, or may depend on a limited management group. In addition, these companies are strongly affected by worldwide technological developments, and their products and services may not be economically successful or may quickly become outdated. Investor perception may play a greater role in determining the day-to-day value of tech stocks than it does in other sectors. Fund investments made in anticipation of future products and services may decline dramatically in value if the anticipated products or services are delayed or cancelled. The risks associated with technology companies are magnified in the case of small-cap technology companies. The shares of smaller technology companies tend to trade less frequently than those of larger, more established companies, which can have an adverse effect on the pricing of these securities and on the fund’s ability to sell these securities.
(f) Dividends and distributions to shareholders: Dividends and distributions are recorded on the ex-dividend date. Dividends from net investment income and dividends from net realized capital gains, if any, are normally declared and paid annually, but the fund may make distributions on a more frequent basis to comply with the distribution requirements of the Internal Revenue Code of 1986, as amended (the “Code”). To the extent that net realized capital gains can be offset by capital loss carryovers, it is the policy of the fund not to distribute such gains. Income and capital gain distributions are determined in accordance with income tax regulations, which may differ from GAAP.
(g) Federal income taxes: It is the policy of the fund to continue to qualify as a regulated investment company, if such qualification is in the
27
NOTES TO FINANCIAL STATEMENTS (continued)
best interests of its shareholders, by complying with the applicable provisions of the Code, and to make distributions of taxable income and net realized capital gain sufficient to relieve it from substantially all federal income and excise taxes.
As of and during the period ended August 31, 2023, the fund did not have any liabilities for any uncertain tax positions. The fund recognizes interest and penalties, if any, related to uncertain tax positions as income tax expense in the Statement of Operations. During the period ended August 31, 2023, the fund did not incur any interest or penalties.
Each tax year in the four-year period ended August 31, 2023 remains subject to examination by the Internal Revenue Service and state taxing authorities.
At August 31, 2023, the components of accumulated earnings on a tax basis were as follows: accumulated capital losses $10,651,539 and unrealized appreciation $99,272,239. In addition, the fund had $1,138,815 of late year ordinary losses deferred for tax purposes to the first day of the following fiscal year.
The fund is permitted to carry forward capital losses for an unlimited period. Furthermore, capital loss carryovers retain their character as either short-term or long-term capital losses.
The accumulated capital loss carryover is available for federal income tax purposes to be applied against future net realized capital gains, if any, realized subsequent to August 31, 2023. The fund has $10,651,539 of short-term capital losses which can be carried forward for an unlimited period.
The tax character of distributions paid to shareholders during the fiscal years ended August 31, 2023 and August 31, 2022 were as follows: ordinary income $0 and $32,094,668, and long-term capital gains $0 and $55,551,235.
During the period ended August 31, 2023, as a result of permanent book to tax differences, primarily due to the tax treatment for net operating losses, the fund increased total distributable earnings (loss) by $2,115,183 and decreased paid-in capital by the same amount. Net assets and net asset value per share were not affected by this reclassification.
NOTE 2—Bank Lines of Credit:
The fund participates with other long-term open-end funds managed by the Adviser in a $823.5 million unsecured credit facility led by Citibank, N.A. (the “Citibank Credit Facility”) and a $300 million unsecured credit
28
facility provided by BNY Mellon (the “BNYM Credit Facility”), each to be utilized primarily for temporary or emergency purposes, including the financing of redemptions (each, a “Facility”). The Citibank Credit Facility is available in two tranches: (i) Tranche A is in an amount equal to $688.5 million and is available to all long-term open-ended funds, including the fund, and (ii) Tranche B is an amount equal to $135 million and is available only to BNY Mellon Floating Rate Income Fund, a series of BNY Mellon Investment Funds IV, Inc. In connection therewith, the fund has agreed to pay its pro rata portion of commitment fees for Tranche A of the Citibank Credit Facility and the BNYM Credit Facility. Interest is charged to the fund based on rates determined pursuant to the terms of the respective Facility at the time of borrowing.
During the period ended August 31, 2023, the fund was charged $215 for interest expense. These fees are included in Interest expense in the Statement of Operations. The average amount of borrowings outstanding under the Facilities during the period ended August 31, 2023 was approximately $3,836 with a related weighted average annualized interest rate of 5.60%.
NOTE 3—Management Fee, Sub-Advisory Fee and Other Transactions with Affiliates:
(a) Pursuant to a management agreement with the Adviser, the management fee is computed at the annual rate of .75% of the value of the fund’s average daily net assets and is payable monthly. The Adviser has contractually agreed from September 1, 2022 through December 30, 2023, to waive receipt of a portion of its management fee in the amount of .10% of the value of the fund’s average daily net assets. On or after December 30, 2023, the Adviser may terminate this waiver agreement at any time. The reduction in expenses, pursuant to the undertaking, amounted to $266,211 during the period ended August 31, 2023.
Pursuant to a sub-investment advisory agreement between the Adviser and the Sub-Adviser, the Adviser pays the Sub-Adviser a monthly fee at an annual rate of .36% of the value of the fund’s average daily net assets.
During the period ended August 31, 2023, the Distributor retained $3,005 from commissions earned on sales of the fund’s Class A shares and $850 from CDSC fees on redemptions of the fund’s Class C shares.
(b) Under the Distribution Plan adopted pursuant to Rule 12b-1 under the Act, Class C shares pay the Distributor for distributing its shares at an annual rate of .75% of the value of its average daily net assets. The Distributor may pay one or more Service Agents in respect of advertising, marketing and other distribution services, and determines the amounts, if
29
NOTES TO FINANCIAL STATEMENTS (continued)
any, to be paid to Service Agents and the basis on which such payments are made. During the period ended August 31, 2023, Class C shares were charged $18,730 pursuant to the Distribution Plan.
(c) Under the Shareholder Services Plan, Class A and Class C shares pay the Distributor at an annual rate of .25% of the value of their average daily net assets for the provision of certain services. The services provided may include personal services relating to shareholder accounts, such as answering shareholder inquiries regarding the fund, and services related to the maintenance of shareholder accounts. The Distributor may make payments to Service Agents (securities dealers, financial institutions or other industry professionals) with respect to these services. The Distributor determines the amounts to be paid to Service Agents. During the period ended August 31, 2023, Class A and Class C shares were charged $615,649 and $6,243, respectively, pursuant to the Shareholder Services Plan.
The fund has an arrangement with BNY Mellon Transfer, Inc., (the “Transfer Agent”), a subsidiary of BNY Mellon and an affiliate of the Adviser, whereby the fund may receive earnings credits when positive cash balances are maintained, which are used to offset Transfer Agent fees. For financial reporting purposes, the fund includes transfer agent net earnings credits, if any, as an expense offset in the Statement of Operations.
The fund has an arrangement with The Bank of New York Mellon (the “Custodian”), a subsidiary of BNY Mellon and an affiliate of the Adviser, whereby the fund will receive interest income or be charged overdraft fees when cash balances are maintained. For financial reporting purposes, the fund includes this interest income and overdraft fees, if any, as interest income in the Statement of Operations.
The fund compensates the Transfer Agent, under a transfer agency agreement, for providing transfer agency and cash management services for the fund. The majority of Transfer Agent fees are comprised of amounts paid on a per account basis, while cash management fees are related to fund subscriptions and redemptions. During the period ended August 31, 2023, the fund was charged $89,171 for transfer agency services. These fees are included in Shareholder servicing costs in the Statement of Operations. These fees were partially offset by earnings credits of $77,183.
The fund compensates the Custodian, under a custody agreement, for providing custodial services for the fund. These fees are determined based on net assets, geographic region and transaction activity. During the period
30
ended August 31, 2023, the fund was charged $7,560 pursuant to the custody agreement.
During the period ended August 31, 2023, the fund was charged $19,567 for services performed by the fund’s Chief Compliance Officer and his staff. These fees are included in Chief Compliance Officer fees in the Statement of Operations.
The components of “Due to BNY Mellon Investment Adviser, Inc. and affiliates” in the Statement of Assets and Liabilities consist of: management fee of $190,594, Distribution Plan fees of $1,727, Shareholder Services Plan fees of $59,516, Custodian fees of $2,000 and Chief Compliance Officer fees of $3,204, which are offset against an expense reimbursement currently in effect in the amount of 25,448.
(d) Each board member also serves as a board member of other funds in the BNY Mellon Family of Funds complex. Annual retainer fees and attendance fees are allocated to each fund based on net assets.
NOTE 4—Securities Transactions:
The aggregate amount of purchases and sales of investment securities, excluding short-term securities during the period ended August 31, 2023, amounted to $145,558,158 and $169,148,700, respectively.
At August 31, 2023, the cost of investments for federal income tax purposes was $215,403,799; accordingly, accumulated net unrealized appreciation on investments was $99,272,331, consisting of $111,371,857 gross unrealized appreciation and $12,099,526 gross unrealized depreciation.
31
REPORT OF INDEPENDENT REGISTERED PUBLIC ACCOUNTING FIRM
To the Shareholders and the Board of Directors of BNY Mellon Technology Growth Fund
Opinion on the Financial Statements
We have audited the accompanying statement of assets and liabilities of BNY Mellon Technology Growth Fund (the “Fund”) (one of the funds constituting BNY Mellon Advantage Funds, Inc. (the “Company”)), including the statement of investments, as of August 31, 2023, and the related statement of operations for the year then ended, the statements of changes in net assets for each of the two years in the period then ended, the financial highlights for each of the five years in the period then ended and the related notes (collectively referred to as the “financial statements”). In our opinion, the financial statements present fairly, in all material respects, the financial position of the Fund (one of the funds constituting BNY Mellon Advantage Funds, Inc.) at August 31, 2023, the results of its operations for the year then ended, the changes in its net assets for each of the two years in the period then ended and its financial highlights for each of the five years in the period then ended, in conformity with U.S. generally accepted accounting principles.
Basis for Opinion
These financial statements are the responsibility of the Company’s management. Our responsibility is to express an opinion on the Fund’s financial statements based on our audits. We are a public accounting firm registered with the Public Company Accounting Oversight Board (United States) (“PCAOB”) and are required to be independent with respect to the Company in accordance with the U.S. federal securities laws and the applicable rules and regulations of the Securities and Exchange Commission and the PCAOB.
We conducted our audits in accordance with the standards of the PCAOB. Those standards require that we plan and perform the audit to obtain reasonable assurance about whether the financial statements are free of material misstatement, whether due to error or fraud. The Company is not required to have, nor were we engaged to perform, an audit of the Company’s internal control over financial reporting. As part of our audits, we are required to obtain an understanding of internal control over financial reporting but not for the purpose of expressing an opinion on the effectiveness of the Company’s internal control over financial reporting. Accordingly, we express no such opinion.
Our audits included performing procedures to assess the risks of material misstatement of the financial statements, whether due to error or fraud, and performing procedures that respond to those risks. Such procedures included examining, on a test basis, evidence regarding the amounts and disclosures in the financial statements. Our procedures included confirmation of securities owned as of August 31, 2023, by correspondence with the custodian, brokers and others; when replies were not received from brokers and others, we performed other auditing procedures. Our audits also included evaluating the accounting principles used and significant estimates made by management, as well as evaluating the overall presentation of the financial statements. We believe that our audits provide a reasonable basis for our opinion.

We have served as the auditor of one or more investment companies in the BNY Mellon Family of Funds since at least 1957, but we are unable to determine the specific year.
New York, New York
October 23, 2023
32
INFORMATION ABOUT THE RENEWAL OF THE FUND’S MANAGEMENT AND SUB-INVESTMENT ADVISORY AGREEMENTS AND THE APPROVAL OF THE FUND’S SUB- SUB-INVESTMENT ADVISORY AGREEMENT (Unaudited)
At a meeting of the fund’s Board of Directors held on March 14-15, 2023, the Board considered the renewal of the fund’s Management Agreement, pursuant to which the Adviser provides the fund with investment advisory and administrative services, and the Sub-Investment Advisory Agreement (together with the Management Agreement, the “Agreements”), pursuant to which Newton Investment Management North America, LLC (the “Sub-Adviser” or “NIMNA”) provides day-to-day management of the fund’s investments. The Board members, none of whom are “interested persons” (as defined in the Investment Company Act of 1940, as amended (the “1940 Act”)) of the fund, were assisted in their review by independent legal counsel and met with counsel in executive session separate from representatives of the Adviser and the Sub-Adviser. In considering the renewal of the Agreements, the Board considered several factors that it believed to be relevant, including those discussed below. The Board did not identify any one factor as dispositive, and each Board member may have attributed different weights to the factors considered.
Analysis of Nature, Extent, and Quality of Services Provided to the Fund. The Board considered information provided to it at the meeting and in previous presentations from representatives of the Adviser regarding the nature, extent, and quality of the services provided to funds in the BNY Mellon fund complex, including the fund. The Adviser provided the number of open accounts in the fund, the fund’s asset size and the allocation of fund assets among distribution channels. The Adviser also had previously provided information regarding the diverse intermediary relationships and distribution channels of funds in the BNY Mellon fund complex (such as retail direct or intermediary, in which intermediaries typically are paid by the fund and/or the Adviser) and the Adviser’s corresponding need for broad, deep, and diverse resources to be able to provide ongoing shareholder services to each intermediary or distribution channel, as applicable to the fund.
The Board also considered research support available to, and portfolio management capabilities of, the fund’s portfolio management personnel and that the Adviser also provides oversight of day-to-day fund operations, including fund accounting and administration and assistance in meeting legal and regulatory requirements. The Board also considered the Adviser’s extensive administrative, accounting and compliance infrastructures, as well as the Adviser’s supervisory activities over the Sub-Adviser. The Board also considered portfolio management’s brokerage policies and practices (including policies and practices regarding soft dollars) and the standards applied in seeking best execution.
Comparative Analysis of the Fund’s Performance and Management Fee and Expense Ratio. The Board reviewed reports prepared by Broadridge Financial Solutions, Inc. (“Broadridge”), an independent provider of investment company data based on classifications provided by Thomson Reuters Lipper (“Lipper”), which included information comparing (1) the performance of the fund’s Class I shares with the
33
INFORMATION ABOUT THE RENEWAL OF THE FUND’S MANAGEMENT AND SUB-INVESTMENT ADVISORY AGREEMENTS AND THE APPROVAL OF THE FUND’S SUB- SUB-INVESTMENT ADVISORY AGREEMENT (Unaudited) (continued)
performance of a group of institutional science and technology funds selected by Broadridge as comparable to the fund (the “Performance Group”) and with a broader group of funds consisting of all retail and institutional science and technology funds (the “Performance Universe”), all for various periods ended December 31, 2022, and (2) the fund’s actual and contractual management fees and total expenses with those of the same group of funds in the Performance Group (the “Expense Group”) and with a broader group of all institutional science and technology funds, excluding outliers (the “Expense Universe”), the information for which was derived in part from fund financial statements available to Broadridge as of the date of its analysis. The Adviser previously had furnished the Board with a description of the methodology Broadridge used to select the Performance Group and Performance Universe and the Expense Group and Expense Universe.
Performance Comparisons. Representatives of the Adviser stated that the usefulness of performance comparisons may be affected by a number of factors, including different investment limitations and policies that may be applicable to the fund and comparison funds and the end date selected. The Board also considered the fund’s performance in light of overall financial market conditions. The Board discussed with representatives of the Adviser and the Sub-Adviser the results of the comparisons and considered that the fund’s total return performance was below the Performance Group and Performance Universe medians for all periods. The Board discussed with representatives of the Adviser and the Sub-Adviser the reasons for the fund’s underperformance versus the Performance Group and Performance Universe during the periods under review and noted that, effective in March 2022 and October 2022, the fund appointed new primary portfolio managers. The Adviser also provided a comparison of the fund’s calendar year total returns to the returns of the fund’s benchmark index.
Management Fee and Expense Ratio Comparisons. The Board reviewed and considered the contractual management fee rate payable by the fund to the Adviser in light of the nature, extent and quality of the management services and the sub-advisory services provided by the Adviser and the Sub-Adviser, respectively. In addition, the Board reviewed and considered the actual management fee rate paid by the fund over the fund’s last fiscal year. The Board also reviewed the range of actual and contractual management fees and total expenses as a percentage of average net assets of the Expense Group and Expense Universe funds and discussed the results of the comparisons.
The Board considered that the fund’s contractual management fee was lower than the Expense Group median contractual management fee, the fund’s actual management fee was lower than the Expense Group median and lower than the Expense Universe median actual management fee, and the fund’s total expenses were lower than the Expense Group median and slightly higher than the Expense Universe median total expenses.
Representatives of the Adviser stated that the Adviser has contractually agreed, until December 30, 2023, to waive receipt of a portion of its management fee in the amount of .10% of the value of the fund’s average daily net assets.
34
Representatives of the Adviser noted that there were no other funds advised by the Adviser that are in the same Lipper category as the fund or separate accounts and/or other types of client portfolios advised by the Adviser or the Sub-Adviser that are considered to have similar investment strategies and policies as the fund.
The Board considered the fee payable to the Sub-Adviser in relation to the fee payable to the Adviser by the fund and the respective services provided by the Sub-Adviser and the Adviser. The Board also took into consideration that the Sub-Adviser’s fee is paid by the Adviser, out of its fee from the fund, and not the fund.
Analysis of Profitability and Economies of Scale. Representatives of the Adviser reviewed the expenses allocated and profit received by the Adviser and its affiliates and the resulting profitability percentage for managing the fund and the aggregate profitability percentage to the Adviser and its affiliates for managing the funds in the BNY Mellon fund complex, and the method used to determine the expenses and profit. The Board concluded that the profitability results were not excessive, given the services rendered and service levels provided by the Adviser and its affiliates. The Board also considered the fee waiver agreement and its effect on the profitability of the Adviser. The Board also had been provided with information prepared by an independent consulting firm regarding the Adviser’s approach to allocating costs to, and determining the profitability of, individual funds and the entire BNY Mellon fund complex. The consulting firm also had analyzed where any economies of scale might emerge in connection with the management of a fund.
The Board considered, on the advice of its counsel, the profitability analysis (1) as part of its evaluation of whether the fees under the Agreements, considered in relation to the mix of services provided by the Adviser and the Sub-Adviser, including the nature, extent and quality of such services, supported the renewal of the Agreements and (2) in light of the relevant circumstances for the fund and the extent to which economies of scale would be realized if the fund grows and whether fee levels reflect these economies of scale for the benefit of fund shareholders. Since the Adviser, and not the fund, pays the Sub-Adviser pursuant to the Sub-Investment Advisory Agreement, the Board did not consider the Sub-Adviser’s profitability to be relevant to its deliberations. Representatives of the Adviser stated that a discussion of economies of scale is predicated on a fund having achieved a substantial size with increasing assets and that, if a fund’s assets had been stable or decreasing, the possibility that the Adviser may have realized any economies of scale would be less. Representatives of the Adviser also stated that, as a result of shared and allocated costs among funds in the BNY Mellon fund complex, the extent of economies of scale could depend substantially on the level of assets in the complex as a whole, so that increases and decreases in complex-wide assets can affect potential economies of scale in a manner that is disproportionate to, or even in the opposite direction from, changes in the fund’s asset level. The Board also considered potential benefits to the Adviser and the Sub-Adviser from acting as investment adviser and sub-investment adviser, respectively, and took into consideration the soft dollar arrangements in effect for trading the fund’s investments.
35
INFORMATION ABOUT THE RENEWAL OF THE FUND’S MANAGEMENT AND SUB-INVESTMENT ADVISORY AGREEMENTS AND THE APPROVAL OF THE FUND’S SUB- SUB-INVESTMENT ADVISORY AGREEMENT (Unaudited) (continued)
At the conclusion of these discussions, the Board agreed that it had been furnished with sufficient information to make an informed business decision with respect to the renewal of the Agreements. Based on the discussions and considerations as described above, the Board concluded and determined as follows.
· The Board concluded that the nature, extent and quality of the services provided by the Adviser and the Sub-Adviser are adequate and appropriate.
· The Board determined to continue to monitor the fund’s performance, noting the relatively recent appointment of the portfolio management team.
· The Board concluded that the fees paid to the Adviser and the Sub-Adviser continued to be appropriate under the circumstances and in light of the factors and the totality of the services provided as discussed above.
· The Board determined that the economies of scale which may accrue to the Adviser and its affiliates in connection with the management of the fund had been adequately considered by the Adviser in connection with the fee rate charged to the fund pursuant to the Management Agreement and that, to the extent in the future it were determined that material economies of scale had not been shared with the fund, the Board would seek to have those economies of scale shared with the fund.
In evaluating the Agreements, the Board considered these conclusions and determinations and also relied on its previous knowledge, gained through meetings and other interactions with the Adviser and its affiliates and the Sub-Adviser, of the Adviser and the Sub-Adviser and the services provided to the fund by the Adviser and the Sub-Adviser. The Board also relied on information received on a routine and regular basis throughout the year relating to the operations of the fund and the investment management and other services provided under the Agreements, including information on the investment performance of the fund in comparison to similar mutual funds and benchmark performance indices; general market outlook as applicable to the fund; and compliance reports. In addition, the Board’s consideration of the contractual fee arrangements for the fund had the benefit of a number of years of reviews of the Agreements for the fund, or substantially similar agreements for other BNY Mellon funds that the Board oversees, during which lengthy discussions took place between the Board and representatives of the Adviser. Certain aspects of the arrangements may receive greater scrutiny in some years than in others, and the Board’s conclusions may be based, in part, on its consideration of the fund’s arrangements, or substantially similar arrangements for other BNY Mellon funds that the Board oversees, in prior years. The Board determined to renew the Agreements.
*******
At the meeting of the fund’s Board held on March 14-15, 2023, the Board also considered the approval of a delegation arrangement between NIMNA and its affiliate, Newton Investment Management Limited (“NIM”), which permits NIMNA, as the fund’s sub-investment adviser, to use the investment advisory personnel, resources and
36
capabilities (“Investment Advisory Services”) available at its sister company, NIM, in providing the day-to-day management of the fund’s investments. In connection therewith, the Board considered the approval of a sub-sub-investment advisory agreement (the “SSIA Agreement”) between NIMNA and NIM, with respect to the fund. In considering the approval of the SSIA Agreement, the Board considered several factors that it believed to be relevant, including those discussed below. The Board did not identify any one factor as dispositive, and each Board member may have attributed different weights to the factors considered.
At the meeting, the Adviser and the Sub-Adviser recommended the approval of the SSIA Agreement to enable NIM to provide Investment Advisory Services to the Sub-Adviser for the benefit of the fund, including, but not limited to, portfolio management services, subject to the supervision of the Sub-Adviser and the Adviser. The recommendation for the approval of the SSIA Agreement was based on the following considerations, among others: (i) approval of the SSIA Agreement would permit the Sub-Adviser to use investment personnel employed primarily by NIM as primary portfolio managers of the fund and to use the investment research services of NIM in the day-to-day management of the fund’s investments; and (ii) there would be no material changes to the fund’s investment objective, strategies or policies, no reduction in the nature or level of services provided to the fund, and no increases in the management fee payable by the fund or the sub-advisory fee payable by the Adviser to the Sub-Adviser as a result of the delegation arrangement. The Board also considered the fact that the Adviser stated that it believed there were no material changes to the information the Board had previously considered at the meeting in connection with the Board’s re-approval of the Agreements for the ensuing year, other than the information about the delegation arrangement and NIM.
In determining whether to approve the SSIA Agreement, the Board considered the materials prepared by the Adviser and the Sub-Adviser received in advance of the meeting and other information presented at the meeting, which included: (i) a form of the SSIA Agreement; (ii) information regarding the delegation arrangement and how it is expected to enhance investment capabilities for the benefit of the fund; (iii) information regarding NIM; and (iv) an opinion of counsel that the proposed delegation arrangement would not result in an “assignment” of the Sub-Investment Advisory Agreement under the 1940 Act and the Investment Advisers Act of 1940, as amended, and, therefore, did not require the approval of fund shareholders. The Board also considered the substance of discussions with representatives of the Adviser and the Sub-Adviser at the meeting in connection with the Board’s re-approval of the Agreements.
Nature, Extent and Quality of Services to be Provided. In examining the nature, extent and quality of the services that were expected to be provided by NIM under the SSIA Agreement, the Board considered: (i) NIM’s organization, qualification and background, as well as the qualifications of its personnel; (ii) the expertise of the personnel providing portfolio management services; (iii) information regarding NIM’s compliance program; and (iv) the investment strategy for the fund, which would remain the same. The Board
37
INFORMATION ABOUT THE RENEWAL OF THE FUND’S MANAGEMENT AND SUB-INVESTMENT ADVISORY AGREEMENTS AND THE APPROVAL OF THE FUND’S SUB- SUB-INVESTMENT ADVISORY AGREEMENT (Unaudited) (continued)
also considered that enabling the Sub-Adviser to use the proposed Investment Advisory Services provided by NIM, the Sub-Adviser would provide investment and portfolio management services of at least the same nature, extent and quality that it currently provides to the fund without the ability to use the Investment Advisory Services of its sister company. Based on the considerations and review of the foregoing information, the Board concluded that the nature, extent and quality of the sub-investment advisory services to be provided by the Sub-Adviser having the ability to use the Investment Advisory Services supported a decision to approve the SSIA Agreement.
Investment Performance. The Board considered the fund’s investment performance and that of the investment team managing the fund’s portfolio (including comparative data provided by Broadridge) at the meeting in connection with the Board’s re-approval of the Agreements. The Board considered that the same investment professionals would continue to manage the fund’s assets and that enabling the Sub-Adviser to use the Investment Advisory Services pursuant to the SSIA Agreement for the benefit of the fund supported a decision to approve the SSIA Agreement.
Costs of Services to be Provided and Profitability. The Board considered the contractual management fee payable by the fund to the Adviser pursuant to the Management Agreement and the contractual sub-investment advisory fee payable by the Adviser to the Sub-Adviser pursuant to the Sub-Investment Advisory Agreement at the meeting in connection with the Board’s re-approval of the Agreements. The Board noted that the contractual management fee payable by the fund to the Adviser and the sub-investment advisory fee payable by the Adviser to the Sub-Adviser, would not change in connection with the proposed delegation arrangement. The Board recognized that, because the fees payable would not change, an analysis of profitability was more appropriate in the context of the Board’s consideration of the Agreements, and that the Board had received and considered a profitability analysis of the Adviser and its affiliates, including NIMNA, at the meeting in connection with the Board’s re-approval of the Agreements. The Board concluded that the Adviser’s profitability was not excessive in light of the nature, extent and quality of the services to be provided to the fund by the Adviser and the Sub-Adviser under the Agreements.
Economies of Scale to be Realized. The Board recognized that, because the fees payable by the fund to the Adviser pursuant to the Management Agreement and the contractual sub-investment advisory fee payable by the Adviser to the Sub-Adviser pursuant to the Sub-Investment Advisory Agreement would not change in connection with the proposed delegation arrangement, an analysis of economies of scale was more appropriate in the context of the Board’s consideration of the Agreements, which had been done at the meeting in connection with the Board’s re-approval of the Agreements. At the meeting, the Board determined that the economies of scale which may accrue to the Adviser and its affiliates in connection with the management of the fund had been adequately considered by the Adviser in connection with the fee rate charged to the fund pursuant to the Agreements and that, to the extent in the future it were determined that material economies of scale had not been shared with the fund, the Board would seek to have those economies of scale shared with the fund.
38
The Board also considered whether there were any ancillary benefits that would accrue to the Sub-Adviser as a result of its relationship with the fund after the delegation arrangement, and such ancillary benefits, if any, were determined to be reasonable.
After full consideration of the factors discussed above, with no single factor identified as being of paramount importance, the Board, with the assistance of independent legal counsel, approved the delegation arrangement and the SSIA Agreement for the fund.
39
LIQUIDITY RISK MANAGEMENT PROGRAM (Unaudited)
The fund adopted a liquidity risk management program (the “Liquidity Risk Management Program”) pursuant to the requirements of Rule 22e-4 under the Investment Company Act of 1940, as amended. Rule 22e-4 requires registered open-end funds, including mutual funds and exchange-traded funds but not money market funds, to establish liquidity risk management programs in order to effectively manage fund liquidity and shareholder redemptions. The rule is designed to mitigate the risk that a fund could not meet redemption requests without significantly diluting the interests of remaining investors.
The rule requires the fund to assess, manage and review their liquidity risk at least annually considering applicable factors such as investment strategy and liquidity during normal and foreseeable stressed conditions, including whether the strategy is appropriate for an open-end fund and whether the fund has a relatively concentrated portfolio or large positions in particular issuers. The fund must also assess its use of borrowings and derivatives, short-term and long-term cash flow projections in normal and stressed conditions, holdings of cash and cash equivalents, and borrowing arrangements and other funding sources.
The rule also requires the fund to classify its investments as highly liquid, moderately liquid, less liquid or illiquid based on the number of days the fund expects it would take to liquidate the investment, and to review these classifications at least monthly or more often under certain conditions. The periods range from three or fewer business days for a highly liquid investment to greater than seven calendar days for settlement of a less liquid investment. Illiquid investments are those a fund does not expect to be able to sell or dispose of within seven calendar days without significantly changing the market value. The fund is prohibited from acquiring an investment if, after the acquisition, its holdings of illiquid assets will exceed 15% of its net assets. In addition, if a fund permits redemptions in-kind, the rule requires the fund to establish redemption in-kind policies and procedures governing how and when it will engage in such redemptions.
Pursuant to the rule’s requirements, the Liquidity Risk Management Program has been reviewed and approved by the Board. Furthermore, the Board has received a written report prepared by the Program’s Administrator that addresses the operation of the Program, assesses its adequacy and effectiveness and describes any material changes made to the Program.
Assessment of Program
In the opinion of the Program Administrator, the Program approved by the Board continues to be adequate for the fund and the Program has been implemented effectively. The Program Administrator has monitored the fund’s liquidity risk and the liquidity classification of the securities held by the fund and has determined that the Program is operating effectively.
During the period from January 1, 2022 to December 31, 2022, there were no material changes to the Program and no material liquidity events that impacted the fund. During the period, the fund held sufficient highly liquid assets to meet fund redemptions.
Under normal expected foreseeable fund redemption forecasts and foreseeable stressed fund redemption forecasts, the Program Administrator believes that the fund maintains sufficient highly liquid assets to meet expected fund redemptions.
40
BOARD MEMBERS INFORMATION (Unaudited)
Independent Board Members
Joseph S. DiMartino (79)
Chairman of the Board (1995)
Principal Occupation During Past 5 Years:
· Director or Trustee of funds in the BNY Mellon Family of Funds and certain other entities (as described in the fund’s Statement of Additional Information) (1995-Present)
Other Public Company Board Memberships During Past 5 Years:
· CBIZ, Inc., a public company providing professional business services, products and solutions, Director (1997-May 2023)
No. of Portfolios for which Board Member Serves: 86
———————
Peggy C. Davis (80)
Board Member (2006)
Principal Occupation During Past 5 Years:
· Shad Professor of Law, New York University School of Law (1983-Present)
No. of Portfolios for which Board Member Serves: 29
———————
Gina D. France (65)
Board Member (2019)
Principal Occupation During Past 5 Years:
· France Strategic Partners, a strategy and advisory firm serving corporate clients across the United States, Founder, President and Chief Executive Officer (2003-Present)
Other Public Company Board Memberships During Past 5 Years:
· Huntington Bancshares, a bank holding company headquartered in Columbus, Ohio, Director (2016-Present)
· Cedar Fair, L.P., a publicly-traded partnership that owns and operates amusement parks and hotels in the U.S. and Canada, Director (2011-May 2023)
· CBIZ, Inc., a public company providing professional business services, products and solutions, Director (2015-Present)
No. of Portfolios for which Board Member Serves: 22
———————
Joan Gulley (75)
Board Member (2017)
Principal Occupation During Past 5 Years:
· Nantucket Atheneum, public library, Chair (June 2018-June 2021) and Director (2015-June 2021)
· Orchard Island Club, golf and beach club, Governor (2016-Present) and President (February 2023-Present)
No. of Portfolios for which Board Member Serves: 39
———————
41
BOARD MEMBERS INFORMATION (Unaudited) (continued)
Robin A. Melvin (59)
Board Member (2012)
Principal Occupation During Past 5 Years:
· Westover School, a private girls’ boarding school in Middlebury, Connecticut, Trustee (2019-June 2023)
· Mentor Illinois, a non-profit organization dedicated to increasing the quantity and quality of mentoring services in Illinois, Co-Chair (2014–2020); Board Member (2013-2020)
· JDRF, a non-profit juvenile diabetes research foundation, Board Member (June 2021-June 2022)
Other Public Company Board Memberships During Past 5 Years:
· HPS Corporate Lending Fund, a closed-end management investment company regulated as a business development company, Trustee (August 2021-Present)
No. of Portfolios for which Board Member Serves: 68
———————
Michael D. DiLecce (61)
Advisory Board Member (2022)
Principal Occupation During Past 5 Years:
· Retired since July 2022. Global Asset Management Assurance Leader, Ernst & Young LLP (2015-2022)
· Americas Regional Talent Managing Partner for Ernst & Young’s Financial Service Practice (2017-2021)
· Partner, Ernst & Young LLP (1997-2022)
No. of Portfolios for which Board Member Serves: 22
———————
The address of the Board Members and Officers is c/o BNY Mellon Investment Adviser, Inc., 240 Greenwich Street, New York, New York 10286. Additional information about each Board Member is available in the fund’s Statement of Additional Information which can be obtained from the Adviser free of charge by calling this toll free number: 1-800-373-9387.
42
OFFICERS OF THE FUND (Unaudited)
DAVID DIPETRILLO, President since January 2021.
Vice President and Director of the Adviser since February 2021; Head of North America Distribution, BNY Investment Management since February 2023; and Head of North America Product, BNY Mellon Investment Management from January 2018 to February 2023. He is an officer of 53 investment companies (comprised of 103 portfolios) managed by the Adviser or an affiliate of the Adviser. He is 45 years old and has been an employee of BNY Mellon since 2005.
JAMES WINDELS, Treasurer since November 2001.
Director of the Adviser since February 2023; Vice President of the Adviser since September 2020; and Director–BNY Mellon Fund Administration. He is an officer of 54 investment companies (comprised of 122 portfolios) managed by the Adviser or an affiliate of the Adviser. He is 64 years old and has been an employee of the Adviser since April 1985.
PETER M. SULLIVAN, Chief Legal Officer since July 2021 and Vice President and Assistant Secretary since March 2019.
Chief Legal Officer of the Adviser and Associate General Counsel of BNY Mellon since July 2021; Senior Managing Counsel of BNY Mellon from December 2020 to July 2021; and Managing Counsel of BNY Mellon from March 2009 to December 2020. He is an officer of 54 investment companies (comprised of 122 portfolios) managed by the Adviser or an affiliate of the Adviser. He is 55 years old and has been an employee of BNY Mellon since April 2004.
JAMES BITETTO, Vice President since August 2005 and Secretary since February 2018.
Senior Managing Counsel of BNY Mellon since December 2019; Managing Counsel of BNY Mellon from April 2014 to December 2019; and Secretary of the Adviser. He is an officer of 54 investment companies (comprised of 122 portfolios) managed by the Adviser or an affiliate of the Adviser. He is 57 years old and has been an employee of the Adviser since December 1996.
DEIRDRE CUNNANE, Vice President and Assistant Secretary since March 2019.
Managing Counsel of BNY Mellon since December 2021; and Counsel of BNY Mellon from August 2018 to December 2021. She is an officer of 54 investment companies (comprised of 122 portfolios) managed by the Adviser or an affiliate of the Adviser. She is 33 years old and has been an employee of BNY Mellon since August 2013.
SARAH S. KELLEHER, Vice President and Assistant Secretary since April 2014.
Vice President of BNY Mellon ETF Investment Adviser; LLC since February 2020; Senior Managing Counsel of BNY Mellon since September 2021; and Managing Counsel of BNY Mellon from December 2017 to September 2021. She is an officer of 54 investment companies (comprised of 122 portfolios) managed by the Adviser or an affiliate of the Adviser. She is 47 years old and has been an employee of BNY Mellon since March 2013.
JEFF PRUSNOFSKY, Vice President and Assistant Secretary since August 2005.
Senior Managing Counsel of BNY Mellon. He is an officer of 54 investment companies (comprised of 122 portfolios) managed by the Adviser or an affiliate of the Adviser. He is 58 years old and has been an employee of the Adviser since October 1990.
AMANDA QUINN, Vice President and Assistant Secretary since March 2020.
Counsel of BNY Mellon since June 2019; Regulatory Administration Manager at BNY Mellon Investment Management Services from September 2018 to May 2019; and Senior Regulatory Specialist at BNY Mellon Investment Management Services from April 2015 to August 2018. She is an officer of 54 investment companies (comprised of 122 portfolios) managed by the Adviser or an affiliate of the Adviser. She is 38 years old and has been an employee of BNY Mellon since June 2012.
JOANNE SKERRETT, Vice President and Assistant Secretary since March 2023.
Managing Counsel of BNY Mellon since June 2022; and Senior Counsel with the Mutual Fund Directors Forum, a leading funds industry organization, from 2016 to June 2022. She is an officer of 54 investment companies (comprised of 122 portfolios) managed by the Adviser or an affiliate of the Adviser. She is 51 years old and has been an employee of the Adviser since June 2022.
43
OFFICERS OF THE FUND (Unaudited) (continued)
NATALYA ZELENSKY, Vice President and Assistant Secretary since March 2017.
Chief Compliance Officer since August 2021 and Vice President since February 2020 of BNY Mellon ETF Investment Adviser, LLC; Chief Compliance Officer since August 2021 and Vice President and Assistant Secretary since February 2020 of BNY Mellon ETF Trust; Managing Counsel of BNY Mellon from December 2019 to August 2021; Counsel of BNY Mellon from May 2016 to December 2019; and Assistant Secretary of the Adviser from April 2018 to August 2021. She is an officer of 54 investment companies (comprised of 122 portfolios) managed by the Adviser or an affiliate of the Adviser. She is 38 years old and has been an employee of BNY Mellon since May 2016.
DANIEL GOLDSTEIN, Vice President since March 2022.
Head of Product Development of North America Distribution, BNY Mellon Investment Management since January 2018; Executive Vice President of North America Product, BNY Mellon Investment Management since April 2023; and Senior Vice President, Development & Oversight of North America Product, BNY Mellon Investment Management from 2010 to March 2023. He is an officer of 53 investment companies (comprised of 103 portfolios) managed by the Adviser or an affiliate of the Adviser. He is 54 years old and has been an employee of the Distributor since 1991.
JOSEPH MARTELLA, Vice President since March 2022.
Vice President of the Adviser since December 2022; Head of Product Management of North America Distribution, BNY Mellon Investment Management since January 2018; Executive Vice President of North America Product, BNY Mellon Investment Management since April 2023; and Senior Vice President of North America Product, BNY Mellon Investment Management from 2010 to March 2023. He is an officer of 53 investment companies (comprised of 103 portfolios) managed by the Adviser or an affiliate of the Adviser. He is 46 years old and has been an employee of the Distributor since 1999.
GAVIN C. REILLY, Assistant Treasurer since December 2005.
Tax Manager–BNY Mellon Fund Administration. He is an officer of 54 investment companies (comprised of 122 portfolios) managed by the Adviser or an affiliate of the Adviser. He is 55 years old and has been an employee of the Adviser since April 1991.
ROBERT SALVIOLO, Assistant Treasurer since July 2007.
Senior Accounting Manager–BNY Mellon Fund Administration. He is an officer of 54 investment companies (comprised of 122 portfolios) managed by the Adviser or an affiliate of the Adviser. He is 56 years old and has been an employee of the Adviser since June 1989.
ROBERT SVAGNA, Assistant Treasurer since December 2002.
Senior Accounting Manager–BNY Mellon Fund Administration. He is an officer of 54 investment companies (comprised of 122 portfolios) managed by the Adviser or an affiliate of the Adviser. He is 56 years old and has been an employee of the Adviser since November 1990.
JOSEPH W. CONNOLLY, Chief Compliance Officer since October 2004.
Chief Compliance Officer of the BNY Mellon Family of Funds and BNY Mellon Funds Trust since 2004; and Chief Compliance Officer of the Adviser from 2004 until June 2021. He is the Chief Compliance Officer of 53 investment companies (comprised of 105 portfolios) managed by the Adviser. He is 66 years old.
CARIDAD M. CAROSELLA, Anti-Money Laundering Compliance Officer since January 2016.
Anti-Money Laundering Compliance Officer of the BNY Mellon Family of Funds and BNY Mellon Funds Trust. She is an officer of 47 investment companies (comprised of 115 portfolios) managed by the Adviser or an affiliate of the Adviser. She is 55 years old and has been an employee of the Distributor since 1997.
44
This page intentionally left blank.
45
BNY Mellon Technology Growth Fund
240 Greenwich Street
New York, NY 10286
Adviser
BNY Mellon Investment Adviser, Inc.
240 Greenwich Street
New York, NY 10286
Sub-Adviser
Newton Investment Management
North America, LLC
BNY Mellon Center
201 Washington Street
Boston, MA 02108
Custodian
The Bank of New York Mellon
240 Greenwich Street
New York, NY 10286
Transfer Agent &
Dividend Disbursing Agent
BNY Mellon Transfer, Inc.
240 Greenwich Street
New York, NY 10286
Distributor
BNY Mellon Securities Corporation
240 Greenwich Street
New York, NY 10286
| | |
Ticker Symbols: | Class A: DTGRX Class C: DTGCX Class I: DGVRX Class Y: DTEYX |
Telephone Call your financial representative or 1-800-373-9387
Mail The BNY Mellon Family of Funds, 144 Glenn Curtiss Boulevard, Uniondale, NY 11556-0144
E-mail Send your request to info@bnymellon.com
Internet Information can be viewed online or downloaded at www.im.bnymellon.com
The fund files its complete schedule of portfolio holdings with the Securities and Exchange Commission (“SEC”) for the first and third quarters of each fiscal year on Form N-PORT. The fund’s Forms N-PORT are available on the SEC’s website at www.sec.gov.
A description of the policies and procedures that the fund uses to determine how to vote proxies relating to portfolio securities and information regarding how the fund voted these proxies for the most recent 12-month period ended June 30 is available at www.im.bnymellon.com and on the SEC’s website at www.sec.gov and without charge, upon request, by calling 1-800-373-9387.
| | |
© 2023 BNY Mellon Securities Corporation
0255AR0823 | 
|
Item 2. Code of Ethics.
The Registrant has adopted a code of ethics that applies to the Registrant's principal executive officer, principal financial officer, principal accounting officer or controller, or persons performing similar functions. There have been no amendments to, or waivers in connection with, the Code of Ethics during the period covered by this Report.
Item 3. Audit Committee Financial Expert.
The Registrant's Board has determined that Gina D. France, a member of the Audit Committee of the Board, is an audit committee financial expert as defined by the Securities and Exchange Commission (the "SEC"). Gina D. France is "independent" as defined by the SEC for purposes of audit committee financial expert determinations.
Item 4. Principal Accountant Fees and Services.
(a) Audit Fees. The aggregate fees billed for each of the last two fiscal years (the "Reporting Periods") for professional services rendered by the Registrant's principal accountant (the "Auditor") for the audit of the Registrant's annual financial statements or services that are normally provided by the Auditor in connection with the statutory and regulatory filings or engagements for the Reporting Periods, were $142,200 in 2022 and $145,044 in 2023.
(b) Audit-Related Fees. The aggregate fees billed in the Reporting Periods for assurance and related services by the Auditor that are reasonably related to the performance of the audit of the Registrant's financial statements and are not reported under paragraph (a) of this Item 4 were $28,889 in 2022 and $29,900 in 2023. These services consisted of one or more of the following: (i) agreed upon procedures related to compliance with Internal Revenue Code section 817(h), (ii) security counts required by Rule 17f-2 under the Investment Company Act of 1940, as amended, (iii) advisory services as to the accounting or disclosure treatment of Registrant transactions or events and (iv) advisory services to the accounting or disclosure treatment of the actual or potential impact to the Registrant of final or proposed rules, standards or interpretations by the Securities and Exchange Commission, the Financial Accounting Standards Boards or other regulatory or standard-setting bodies.
The aggregate fees billed in the Reporting Periods for non-audit assurance and related services by the Auditor to the Registrant's investment adviser (not including any sub-investment adviser whose role is primarily portfolio management and is subcontracted with or overseen by another investment adviser), and any entity controlling, controlled by or under common control with the investment adviser that provides ongoing services to the Registrant ("Service Affiliates"), that were reasonably related to the performance of the annual audit of the Service Affiliate, which required pre-approval by the Audit Committee were $0 in 2022 and $0 in 2023.
(c) Tax Fees. The aggregate fees billed in the Reporting Periods for professional services rendered by the Auditor for tax compliance, tax advice, and tax planning ("Tax Services") were $19,051 in 2022 and $19,051 in 2023. These services consisted of: (i) review or preparation of U.S. federal, state, local and excise tax returns; (ii) U.S. federal, state and local tax planning, advice and assistance regarding statutory, regulatory or administrative developments; (iii) tax advice regarding tax qualification matters and/or treatment of various financial instruments held or proposed to be acquired or held, and (iv) determination of Passive Foreign Investment Companies. The aggregate fees billed in the Reporting Periods for Tax Services by the Auditor to Service Affiliates, which required pre-approval by the Audit Committee were $26,949 in 2022 and $26,949 in 2023.
(d) All Other Fees. The aggregate fees billed in the Reporting Periods for products and services provided by the Auditor, other than the services reported in paragraphs (a) through (c) of this Item, were $19,641 in 2022 and $11,267 in 2023. These services consisted of a review of the Registrant's anti-money laundering program.
The aggregate fees billed in the Reporting Periods for Non-Audit Services by the Auditor to Service Affiliates, other than the services reported in paragraphs (b) through (c) of this Item, which required pre-approval by the Audit Committee, were $0 in 2022 and $0 in 2023.
(e)(1) Audit Committee Pre-Approval Policies and Procedures. The Registrant's Audit Committee has established policies and procedures (the "Policy") for pre-approval (within specified fee limits) of the Auditor's engagements for non-audit services to the Registrant and Service Affiliates without specific case-by-case consideration. The pre-approved services in the Policy can include pre-approved audit services, pre-approved audit-related services, pre-approved tax services and pre-approved all other services. Pre-approval considerations include whether the proposed services are compatible with maintaining the Auditor's independence. Pre-approvals pursuant to the Policy are considered annually.
(e)(2) Note. None of the services described in paragraphs (b) through (d) of this Item 4 were approved by the Audit Committee pursuant to paragraph (c)(7)(i)(C) of Rule 2-01 of Regulation S-X.
(f) None of the hours expended on the principal accountant's engagement to audit the registrant's financial statements for the most recent fiscal year were attributed to work performed by persons other than the principal accountant's full-time, permanent employees.
Non-Audit Fees. The aggregate non-audit fees billed by the Auditor for services rendered to the Registrant, and rendered to Service Affiliates, for the Reporting Periods were $2,418,678 in 2022 and $1,606,446 in 2023.
Auditor Independence. The Registrant's Audit Committee has considered whether the provision of non-audit services that were rendered to Service Affiliates, which were not pre-approved (not requiring pre-approval), is compatible with maintaining the Auditor's independence.
(j) Not applicable.
Item 5. Audit Committee of Listed Registrants.
Not applicable.
Item 6. Investments.
(a) Not applicable.
| Item 7. | Disclosure of Proxy Voting Policies and Procedures for Closed-End Management Investment Companies. |
Not applicable.
Item 8. Portfolio Managers of Closed-End Management Investment Companies.
Not applicable.
| Item 9. | Purchases of Equity Securities by Closed-End Management Investment Companies and Affiliated Purchasers. |
Not applicable.
| Item 10. | Submission of Matters to a Vote of Security Holders. |
There have been no material changes to the procedures applicable to Item 10.
| Item 11. | Controls and Procedures. |
(a) The Registrant's principal executive and principal financial officers have concluded, based on their evaluation of the Registrant's disclosure controls and procedures as of a date within 90 days of the filing date of this report, that the Registrant's disclosure controls and procedures are reasonably designed to ensure that information required to be disclosed by the Registrant on Form N-CSR is recorded, processed, summarized and reported within the required time periods and that information required to be disclosed by the Registrant in the reports that it files or submits on Form N-CSR is accumulated and communicated to the Registrant's management, including its principal executive and principal financial officers, as appropriate to allow timely decisions regarding required disclosure.
(b) There were no changes to the Registrant's internal control over financial reporting that occurred during the period covered by this report that have materially affected, or are reasonably likely to materially affect, the Registrant's internal control over financial reporting.
| Item 12. | Disclosure of Securities Lending Activities for Closed-End Management Investment Companies. |
Not applicable.
(a)(1) Code of ethics referred to in Item 2.
(a)(2) Certifications of principal executive and principal financial officers as required by Rule 30a-2(a) under the Investment Company Act of 1940.
(a)(3) Not applicable.
(b) Certification of principal executive and principal financial officers as required by Rule 30a-2(b) under the Investment Company Act of 1940.
SIGNATURES
Pursuant to the requirements of the Securities Exchange Act of 1934 and the Investment Company Act of 1940, the Registrant has duly caused this Report to be signed on its behalf by the undersigned, thereunto duly authorized.
BNY Mellon Advantage Funds, Inc.
By: /s/ David J. DiPetrillo
David J. DiPetrillo
President (Principal Executive Officer)
Date: October 23, 2023
Pursuant to the requirements of the Securities Exchange Act of 1934 and the Investment Company Act of 1940, this Report has been signed below by the following persons on behalf of the Registrant and in the capacities and on the dates indicated.
By: /s/ David J. DiPetrillo
David J. DiPetrillo
President (Principal Executive Officer)
Date: October 23, 2023
By: /s/ James Windels
James Windels
Treasurer (Principal Financial Officer)
Date: October 20, 2023
EXHIBIT INDEX
(a)(1) Code of ethics referred to in Item 2.
(a)(2) Certifications of principal executive and principal financial officers as required by Rule 30a-2(a) under the Investment Company Act of 1940. (EX-99.CERT)
(b) Certification of principal executive and principal financial officers as required by Rule 30a-2(b) under the Investment Company Act of 1940. (EX-99.906CERT)