UNITED STATES
SECURITIES AND EXCHANGE COMMISSION
Washington, D.C. 20549
FORM N-CSR
CERTIFIED SHAREHOLDER REPORT OF REGISTERED MANAGEMENT
INVESTMENT COMPANIES
| Investment Company Act file number | 811-07123 |
| | |
| | BNY Mellon Advantage Funds, Inc. | |
| | (Exact name of Registrant as specified in charter) | |
| | | |
| | c/o BNY Mellon Investment Adviser, Inc. 240 Greenwich Street New York, New York 10286 | |
| | (Address of principal executive offices) (Zip code) | |
| | | |
| | Deirdre Cunnane, Esq. 240 Greenwich Street New York, New York 10286 | |
| | (Name and address of agent for service) | |
| |
| Registrant's telephone number, including area code: | (212) 922-6400 |
| | |
Date of fiscal year end: | 10/31 | |
| Date of reporting period: | 10/31/22 | |
| | | | | | | |
The following N-CSR relates only to the Registrant's series listed below and does not relate to any series of the Registrant with a different fiscal year end and, therefore, different N-CSR reporting requirements. A separate N-CSR will be filed for any series with a different fiscal year end, as appropriate.
BNY Mellon Dynamic Total Return Fund
BNY Mellon Global Dynamic Bond Income Fund
BNY Mellon Global Real Return Fund
BNY Mellon Sustainable Balanced Fund
FORM N-CSR
Item 1. Reports to Stockholders.
BNY Mellon Dynamic Total Return Fund
| |
ANNUAL REPORT October 31, 2022 |
| |
Save time. Save paper. View your next shareholder report online as soon as it’s available. Log into www.im.bnymellon.com and sign up for eCommunications. It’s simple and only takes a few minutes. |
| |
The views expressed in this report reflect those of the portfolio manager(s) only through the end of the period covered and do not necessarily represent the views of BNY Mellon Investment Adviser, Inc. or any other person in the BNY Mellon Investment Adviser, Inc. organization. Any such views are subject to change at any time based upon market or other conditions and BNY Mellon Investment Adviser, Inc. disclaims any responsibility to update such views. These views may not be relied on as investment advice and, because investment decisions for a fund in the BNY Mellon Family of Funds are based on numerous factors, may not be relied on as an indication of trading intent on behalf of any fund in the BNY Mellon Family of Funds. |
| |
Not FDIC-Insured • Not Bank-Guaranteed • May Lose Value |
Contents
T H E F U N D
F O R M O R E I N F O R M AT I O N
Back Cover
DISCUSSION OF FUND PERFORMANCE (Unaudited)
For the period from November 1, 2021, through October 31, 2022, as provided by portfolio managers James Stavena, Torrey Zaches, Roberto Croce and Dimitri Curtil of Newton Investment Management North America LLC, sub-adviser.
Market and Fund Performance Overview
For the 12-month period from November 1, 2021 to October 31, 2022, the BNY Mellon Dynamic Total Return Fund’s (the “fund”) Class A shares produced a total return of −10.75%, Class C shares returned −11.44%, Class I shares returned −10.53%, and Class Y shares returned −10.54%.1 In comparison, the FTSE Three-Month U.S. Treasury Bill Index, the MSCI World Index, FTSE World Government Bond Index, and an index comprised of 60% MSCI World Index and 40% FTSE World Government Bond Index (the “Hybrid Index”) returned .88%, -18.48%, -22.23%, and -19.78%, respectively.2,3,4,5
The fund delivered a negative total return over the reporting period but outperformed the Hybrid Index. High inflation, slowing economic growth, the war in Ukraine, and a continuation of disruptions from the ongoing COVID-19 pandemic all contributed to a broad sell-off in risky assets.
The Fund’s Investment Approach
The fund seeks total return. To pursue its goal, the fund normally invests in instruments that provide investment exposure to global equity, bond, currency and commodity markets, and in fixed-income securities. The fund may invest in instruments that provide economic exposure to developed and, to a limited extent, emerging market issuers.
The fund will seek to achieve investment exposure primarily through long and short positions in futures, options, forward contracts, swap agreements, or exchange-traded funds (ETFs), and normally will use economic leverage as part of its investment strategy. The fund also may invest in fixed-income securities, such as bonds, notes (including structured notes) and money market instruments including foreign government obligations and securities of supranational entities, to provide exposure to bond markets and for liquidity and income, as well as hold cash.
The fund’s portfolio managers apply a systematic investment approach designed to identify and exploit relative misvaluations across and within global capital markets. The portfolio managers update, monitor and follow buy or sell recommendations using proprietary investment models of the fund’s sub-adviser. Among equity markets, the portfolio managers employ a bottom-up valuation approach using proprietary models to derive market-level expected returns. For bond markets, the portfolio managers use proprietary models to identify temporary mispricing among global bond markets. For currency markets, the portfolio managers evaluate currencies on a relative valuation basis and overweight exposure to currencies that are undervalued. For commodities, the portfolio managers seek to identify opportunities in commodity markets by measuring and evaluating inventory and term structure, hedging and speculative activity, as well as momentum.
Bonds React to Higher Rates to Deliver Negative Returns
Investors were subjected to a challenging investment backdrop during the period due to the emergence and persistence of high inflation, slowing economic growth, the war in Ukraine,
2
and a continuation of disruptions from the ongoing COVID-19 pandemic, all of which likely contributed to a broad sell-off in risky assets. For the 12-month period ending October 31, 2022, the MSCI World Index returned -18.5%, FTSE World Government Bond Index -22.2%, and Bloomberg Commodity Index -9.8%. Cash outperformed risky assets over the period, with the FTSE Three-Month U.S. Treasury Bill Index returning .9%.
Inflation in the U.S.—as measured by the U.S. Consumer Price Index (CPI)—was above 6.0% year-over-year for the entire reporting period, peaking at 9.1% in June. To combat high inflation, central banks turned decidedly hawkish. The Federal Reserve (the “Fed”) began reversing quantitative easing measures and tightening its target policy rate. Since the beginning of 2022, the Fed increased its target federal rate on five occasions by a total of 300 basis points. This spurred a meaningful and prolonged sell-off in bonds. U.S. 10-year Treasury yields rose from 1.5% to 4.0%, and U.S. 30-year Treasury yields rose from 1.9% to 4.2% during the reporting period.
Equity fundamentals were stronger than the nearly 20% sell-off in the MSCI World Index would imply. Over the reporting period, earnings growth was 6.6% for the S&P 500® Index and 9.8% for the MSCI World Index. The sell-off in stocks was largely driven by worsening consumer sentiment, rising interest rates and growing concerns around an economic “hard landing” scenario emerging from much stricter monetary policy.
Opportunistic Strategies and Real Assets Added to Relative Performance
The fund pursues diversified long-term exposures to global risk premia to maximize risk-adjusted total return. Exposures span four broad categories: growth, defensive, real assets and opportunistic strategies.
Exposures to opportunistic strategies and real assets were the primary positive contributors to performance. Opportunistic strategies, including active currency and active volatility, were the main drivers of relative returns. The fund’s position in real assets helped hedge against inflation, enhancing performance. In the fixed-income arena, relative value positions were also beneficial.
On a less positive note, exposures to the growth and defensive strategies detracted from performance. In the growth category, long exposure to global equities, which varied between approximately 32% and 72% during the period, hampered performance as the MSCI World Index declined -18.5%. Relative-value decisions within growth assets also slightly detracted from performance. Long exposure to global bonds, which varied between 31% and 63% during the reporting period, was also detrimental as the FTSE World Government Bond Index fell 22%.
Anticipating Slow Growth and Continued High Inflation
Newton Multi-Asset Solutions team expects below-average growth, higher-than-average inflation and flat corporate earnings growth in the U.S. over the next 12 months. While a soft economic landing is possible, our confidence in such an outcome has declined as of late. Our estimate of U.S. GDP growth has declined (but is still positive), while inflation has not shown meaningful signs yet of rolling over. While CPI and Core CPI may have peaked, median CPI remains on an unbroken upward trajectory and has surpassed Core CPI. Accordingly, we expect the Fed to continue its tightening campaign even if it comes at the
3
DISCUSSION OF FUND PERFORMANCE (Unaudited) (continued)
expense of economic activity and growth. At the same time, analyst consensus earnings estimates still seem too rosy given the level of uncertainty in the economic outlook.
At the end of the reporting period, the fund’s allocation to stocks was 40.5%, 36.5% to bonds, and 9.9% to commodities. Within growth assets, the UK continues to be the largest long allocation. The fund eliminated its exposure to emerging markets while taking on a small position in high yield bonds. Within bonds/defensive assets, U.S. Treasury bonds continue to be the largest weight in the portfolio. The largest short positions remain in Canadian government bonds and UK gilts. The fund continues to hold exposure to real assets given the persistently high inflationary
environment. Within opportunistic strategies, the U.S. dollar continues to be the largest long position, while the euro is the largest short position.
We believe the fund will continue to play an important role in investor portfolios, as a core allocation that is flexible, diverse and able to access additional liquid strategies and asset classes. As both equities and bonds continue to experience challenges, we believe the fund’s expanded toolkit will continue to serve investors well.
November 15, 2022
1 Total return includes reinvestment of dividends and any capital gains paid and does not take into consideration the maximum initial sales charge in the case of Class A shares, or the applicable contingent deferred sales charge imposed on redemptions in the case of Class C shares. Had these charges been reflected, returns would have been lower. Share price, yield, and investment return fluctuate such that upon redemption, fund shares may be worth more or less than their original cost. Past performance is no guarantee of future results. The fund’s returns reflect the absorption of certain fund expenses by BNY Mellon Investment Adviser pursuant to an agreement in effect through March 1, 2023, at which time it may be extended, terminated, or modified.
The fund’s investment adviser, BNY Mellon Investment Adviser, Inc., has contractually agreed, for so long as the fund invests in the subsidiary, to waive the management fee it receives from the fund in the amount equal to the management fee paid to BNY Mellon Investment Adviser, Inc., by the subsidiary.
2 Source: Lipper Inc. — Reflects reinvestment of net dividends and, where applicable, capital gain distributions. The MSCI World Index is a free float-adjusted market capitalization-weighted index that is designed to measure the equity market performance of developed markets. Investors cannot invest directly in any index.
3 Source: Lipper Inc. — The FTSE Three-Month U.S. Treasury Bill Index consists of the last three-month Treasury bill month-end rates. The FTSE Three-Month U.S. Treasury Bill Index measures return equivalents of yield averages. The instruments are not marked to market. Investors cannot invest directly in any index.
4 Source: Lipper Inc. — The FTSE World Government Bond Index (the “WGB Index”) measures the performance of fixed-rate, local-currency, investment-grade sovereign bonds. The WGB Index is a widely used benchmark that currently comprises sovereign debt from over 20 countries, denominated in a variety of currencies, and has more than 25 years of history available. The WGB Index provides a broad benchmark for the global sovereign, fixed-income market. Investors cannot invest directly in any index.
5 Source: FactSet —The Hybrid Index is an unmanaged hybrid index composed of 60% MSCI World Index and 40% WGB Index. Investors cannot invest directly in any index.
Equities are subject generally to market, market sector, market liquidity, issuer, and investment style risks, among other factors, to varying degrees, all of which are more fully described in the fund’s prospectus.
Bonds are subject generally to interest-rate, credit, liquidity, call, sector, and market risks, to varying degrees, all of which are more fully described in the fund’s prospectus.
Investing internationally involves special risks, including changes in currency exchange rates, political, economic, and social instability, a lack of comprehensive company information, differing auditing and legal standards, and less market liquidity. These risks generally are greater with emerging market countries than with more economically and politically established foreign countries.
Emerging markets tend to be more volatile than the markets of more mature economies and generally have less diverse and less mature economic structures and less stable political systems than those of developed countries. The securities of companies located in emerging markets are often subject to rapid and large changes in price. An investment in this fund should be considered only as a supplement to a complete investment program for those investors willing to accept the greater risks associated with investing in emerging-market countries.
Commodities contain heightened risk including market, political, regulatory, and natural conditions, and may not be appropriate for all investors. Derivatives and commodity-linked derivatives involve risks different from, or possibly greater than, the risks associated with investing directly in the underlying assets.
4
High yield bonds involve increased credit and liquidity risk than higher rated bonds and are considered speculative in terms of the issuer’s ability to pay interest and repay principal on a timely basis.
Short sales involve selling a security the portfolio does not own in anticipation that the security’s price will decline. Short sales may involve risk and leverage, and expose the portfolio to the risk that it will be required to buy the security sold short at a time when the security has appreciated in value, thus resulting in a loss.
Recent market risks include pandemic risks related to COVID-19. The effects of COVID-19 have contributed to increased volatility in global markets and will likely affect certain countries, companies, industries and market sectors more dramatically than others. To the extent the fund may overweight its investments in certain countries, companies, industries or market sectors, such positions will increase the fund’s exposure to risk of loss from adverse developments affecting those countries, companies, industries or sectors.
The fund may, but is not required to, use derivative instruments. A small investment in derivatives could have a potentially large impact on the fund’s performance. The use of derivatives involves risks different from, or possibly greater than, the risks associated with investing directly in the underlying assets.
5
FUND PERFORMANCE (Unaudited)
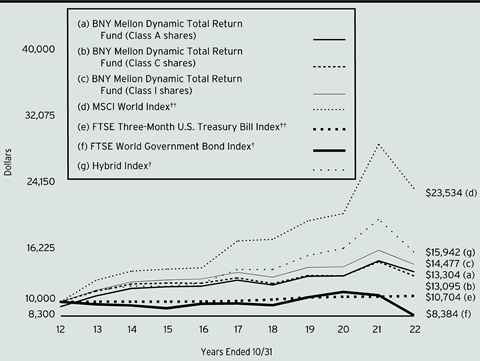
Comparison of change in value of a $10,000 investment in Class A shares, Class C shares and Class I shares of BNY Mellon Dynamic Total Return Fund with a hypothetical investment of $10,000 in the MSCI World Index, FTSE Three-Month U.S. Treasury Bill Index, FTSE World Government Bond Index (the “WGB Index”) and an index comprised of 60% MSCI World Index and 40% the WGB Index (the “Hybrid Index”).
† Source: FactSet
†† Source: Lipper Inc.
Past performance is not predictive of future performance.
The above graph compares a hypothetical investment of $10,000 made in each of the Class A shares, Class C shares and Class I shares of BNY Mellon Dynamic Total Return Fund on 10/31/12 to a hypothetical investment of $10,000 made on that date in each of the following: MSCI World Index, FTSE Three-Month U.S. Treasury Bill Index, the WGB Index and the Hybrid Index. Returns assume all dividends and capital gain distributions are reinvested.
The fund’s performance shown in the line graph above takes into account the maximum initial sales charge on Class A shares and all other applicable fees and expenses on all classes. The MSCI World Index is a free float-adjusted market capitalization-weighted index that is designed to measure the equity market performance of developed markets. The FTSE Three-Month U.S. Treasury Bill Index consists of the last three-month Treasury bill month-end rates. The FTSE Three-Month U.S. Treasury Bill Index measures returns equivalent of yield averages. The instruments are not marked to market. The WGB Index measures the performance of fixed-rate, local currency, investment-grade sovereign bonds. The WGB Index is a widely used benchmark that currently comprises sovereign debt from over 20 countries, denominated in a variety of currencies, and has more than 25 years of history available. The WGB Index provides a broad benchmark for the global sovereign fixed income market. Unlike a mutual fund, the indices are not subject to charges, fees and other expenses. Investors cannot invest directly in any index. Further information relating to fund performance, including expense reimbursements, if applicable, is contained in the Financial Highlights section of the prospectus and elsewhere in this report.
6
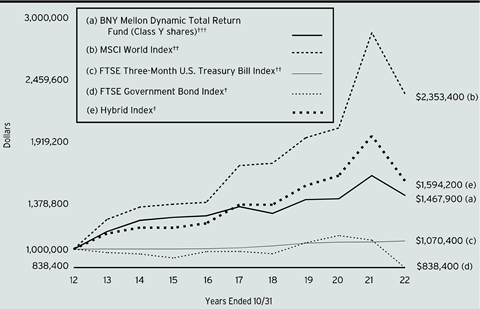
Comparison of change in value of a $1,000,000 investment in Class Y shares of BNY Mellon Dynamic Total Return Fund with a hypothetical investment of $1,000,000 in the MSCI World Index, FTSE Three-Month U.S. Treasury Bill Index, FTSE World Government Bond Index (the “WGB Index”) and an index comprised of 60% MSCI World Index and 40% the WGB Index (the “Hybrid Index”).
† Source: FactSet
†† Source: Lipper Inc.
††† The total return figures presented for Class Y shares of the fund reflect the performance of the fund’s Class A shares for the period prior to 7/1/13 (inception date for Class Y shares), not reflecting the applicable sales charges for Class A shares.
Past performance is not predictive of future performance.
The above graph compares a hypothetical investment of $1,000,000 made in Class Y shares of BNY Mellon Dynamic Total Return Fund on 10/31/12 to a hypothetical investment of $1,000,000 made on that date in each of the following: MSCI World Index, FTSE Three-Month U.S. Treasury Bill Index, the WGB Index and the Hybrid Index. Returns assume all dividends and capital gain distributions are reinvested.
The fund’s performance shown in the line graph above takes into account all applicable fees and expenses of the fund’s Class Y shares. The MSCI World Index is a free float-adjusted market capitalization-weighted index that is designed to measure the equity market performance of developed markets. The FTSE Three-Month U.S. Treasury Bill Index consists of the last three-month Treasury bill month-end rates. The FTSE Three-Month U.S. Treasury Bill Index measures returns equivalent of yield averages. The instruments are not marked to market. The WGB Index measures the performance of fixed-rate, local currency, investment-grade sovereign bonds. The WGB Index is a widely used benchmark that currently comprises sovereign debt from over 20 countries, denominated in a variety of currencies, and has more than 25 years of history available. The WGB Index provides a broad benchmark for the global sovereign fixed income market. Unlike a mutual fund, the indices are not subject to charges, fees and other expenses. Investors cannot invest directly in any index. Further information relating to fund performance, including expense reimbursements, if applicable, is contained in the Financial Highlights section of the prospectus and elsewhere in this report.
7
FUND PERFORMANCE (Unaudited) (continued)
| | | | | |
Average Annual Total Returns as of 10/31/2022 |
| | Inception | | | |
| | Date | 1 Year | 5 Years | 10 Years |
Class A shares | | | | |
with maximum sales charge (5.75%) | 5/2/06 | -15.89% | -.07% | 2.90% |
without sales charge | 5/2/06 | -10.75% | 1.12% | 3.51% |
Class C shares | | | | |
with applicable redemption charge † | 5/2/06 | -12.18% | .36% | 2.73% |
without redemption | 5/2/06 | -11.44% | .36% | 2.73% |
Class I shares | 5/2/06 | -10.53% | 1.36% | 3.77% |
Class Y shares | 7/1/13 | -10.54% | 1.39% | 3.91%†† |
MSCI World Index | | -18.48% | 6.37% | 8.94% |
FTSE Three-Month U.S. Treasury Bill Index | .88% | 1.16% | .68% |
FTSE World Government Bond Index | | -22.23% | -3.07% | -1.75% |
Hybrid Index | | -19.78% | 2.83% | 4.77% |
† The maximum contingent deferred sales charge for Class C shares is 1% for shares redeemed within one year of the date of purchase.
†† The total return performance figures presented for Class Y shares of the fund reflect the performance of the fund’s Class A shares for the period prior to 7/1/13 (inception date for Class Y shares), not reflecting the applicable sales charges for class A shares.
The performance data quoted represents past performance, which is no guarantee of future results. Share price and investment return fluctuate and an investor’s shares may be worth more or less than original cost upon redemption. Current performance may be lower or higher than the performance quoted. Go to www.im.bnymellon.com for the fund’s most recent month-end returns.
The fund’s performance shown in the graphs and table does not reflect the deduction of taxes that a shareholder would pay on fund distributions or the redemption of fund shares. In addition to the performance of Class A shares shown with and without a maximum sales charge, the fund’s performance shown in the table takes into account all other applicable fees and expenses on all classes.
8
UNDERSTANDING YOUR FUND’S EXPENSES (Unaudited)
As a mutual fund investor, you pay ongoing expenses, such as management fees and other expenses. Using the information below, you can estimate how these expenses affect your investment and compare them with the expenses of other funds. You also may pay one-time transaction expenses, including sales charges (loads) and redemption fees, which are not shown in this section and would have resulted in higher total expenses. For more information, see your fund’s prospectus or talk to your financial adviser.
Review your fund’s expenses
The table below shows the expenses you would have paid on a $1,000 investment in BNY Mellon Dynamic Total Return Fund from May 1, 2022 to October 31, 2022. It also shows how much a $1,000 investment would be worth at the close of the period, assuming actual returns and expenses.
| | | | | | | |
Expenses and Value of a $1,000 Investment | |
Assume actual returns for the six months ended October 31, 2022 | |
| | | | | | |
| | Class A | Class C | Class I | Class Y | |
Expenses paid per $1,000† | $6.96 | $10.66 | $5.72 | $5.72 | |
Ending value (after expenses) | $971.30 | $967.40 | $972.30 | $972.90 | |
COMPARING YOUR FUND’S EXPENSES WITH THOSE OF OTHER FUNDS (Unaudited)
Using the SEC’s method to compare expenses
The Securities and Exchange Commission (“SEC”) has established guidelines to help investors assess fund expenses. Per these guidelines, the table below shows your fund’s expenses based on a $1,000 investment, assuming a hypothetical 5% annualized return. You can use this information to compare the ongoing expenses (but not transaction expenses or total cost) of investing in the fund with those of other funds. All mutual fund shareholder reports will provide this information to help you make this comparison. Please note that you cannot use this information to estimate your actual ending account balance and expenses paid during the period.
| | | | | | | |
Expenses and Value of a $1,000 Investment | |
Assuming a hypothetical 5% annualized return for the six months ended October 31, 2022 | |
| | | | | | |
| | Class A | Class C | Class I | Class Y | |
Expenses paid per $1,000† | $7.12 | $10.92 | $5.85 | $5.85 | |
Ending value (after expenses) | $1,018.15 | $1,014.37 | $1,019.41 | $1,019.41 | |
† | Expenses are equal to the fund’s annualized expense ratio of 1.40% for Class A, 2.15% for Class C, 1.15% for Class I and 1.15% for Class Y, multiplied by the average account value over the period, multiplied by 184/365 (to reflect the one-half year period). |
9
CONSOLIDATED STATEMENT OF INVESTMENTS
October 31, 2022
| | | | | | | | | | |
| |
Description | Coupon
Rate (%) | | Maturity Date | | Principal Amount ($) | | Value ($) | |
Options Purchased - 1.0% | | | | | |
Call Options - 1.0% | | | | | |
Standard & Poor's 500 E-mini December Future, Contracts 154 | | 3,890 | | 12/16/2022 | | 29,953,000 | | 1,014,475 | |
Standard & Poor's 500 E-mini December Future, Contracts 120 | | 4,150 | | 12/16/2022 | | 24,900,000 | | 216,000 | |
Standard & Poor's 500 E-mini January Future, Contracts 77 | | 4,150 | | 1/20/2023 | | 15,977,500 | | 283,938 | |
Total Options Purchased
(cost $1,099,949) | | 1,514,413 | |
| | Annualized
Yield (%) | | | | | | | |
Short-Term Investments - 81.7% | | | | | |
U.S. Government Securities | | | | | |
U.S. Treasury Bills | | 9.71 | | 12/15/2022 | | 9,415,000 | a | 9,374,811 | |
U.S. Treasury Bills | | 8.01 | | 11/17/2022 | | 41,741,400 | a | 41,688,719 | |
U.S. Treasury Bills | | 4.26 | | 12/1/2022 | | 78,579,000 | a | 78,353,903 | |
Total Short-Term Investments
(cost $129,558,794) | | 129,417,433 | |
| | 1-Day
Yield (%) | | | | Shares | | | |
Investment Companies - 13.9% | | | | | |
Registered Investment Companies - 13.9% | | | | | |
Dreyfus Institutional Preferred Government Plus Money Market Fund, Institutional Shares
(cost $21,984,479) | | 3.23 | | | | 21,984,479 | b | 21,984,479 | |
Total Investments (cost $152,643,222) | | 96.6% | 152,916,325 | |
Cash and Receivables (Net) | | 3.4% | 5,412,731 | |
Net Assets | | 100.0% | 158,329,056 | |
a Security is a discount security. Income is recognized through the accretion of discount.
b Investment in affiliated issuer. The investment objective of this investment company is publicly available and can be found within the investment company’s prospectus.
| | |
Portfolio Summary (Unaudited) † | Value (%) |
Government | 81.7 |
Investment Companies | 13.9 |
Options Purchased | 1.0 |
| | 96.6 |
† Based on net assets.
See notes to consolidated financial statements.
10
| | | | | | | |
Affiliated Issuers | | | |
Description | Value ($) 10/31/2021 | Purchases ($)† | Sales ($) | Value ($) 10/31/2022 | Dividends/
Distributions ($) | |
Registered Investment Companies - 13.9% | | |
Dreyfus Institutional Preferred Government Plus Money Market Fund, Institutional Shares - 13.9% | 39,021,299 | 316,914,038 | (333,950,858) | 21,984,479 | 274,175 | |
† Includes reinvested dividends/distributions.
See notes to financial statements.
| | | | | | | |
Futures | | | |
Description | Number of
Contracts | Expiration | Notional
Value ($) | Market
Value ($) | Unrealized Appreciation (Depreciation) ($) | |
Futures Long | | |
Australian 10 Year Bond | 207 | 12/15/2022 | 15,603,878a | 15,687,862 | 83,984 | |
Brent Crude | 12 | 2/28/2023 | 1,017,803b | 1,057,560 | 39,757 | |
CAC 40 10 Euro | 309 | 11/18/2022 | 18,682,641a | 19,142,071 | 459,430 | |
Coffee "C" | 6 | 3/21/2023 | 467,891b | 391,613 | (76,278) | |
Copper | 12 | 12/28/2022 | 1,058,286b | 1,012,500 | (45,786) | |
Corn No.2 Yellow | 27 | 3/14/2023 | 928,217b | 940,613 | 12,396 | |
Cotton No.2 | 10 | 3/9/2023 | 435,384b | 358,200 | (77,184) | |
Crude Oil | 14 | 2/21/2023 | 1,193,546b | 1,160,320 | (33,226) | |
Crude Soybean Oil | 25 | 3/14/2023 | 964,807b | 1,021,950 | 57,143 | |
DAX | 5 | 12/16/2022 | 1,546,621a | 1,641,607 | 94,986 | |
E-mini Russell 2000 | 76 | 12/16/2022 | 7,269,732 | 7,041,400 | (228,332) | |
Euro-Bond | 94 | 12/8/2022 | 12,808,052a | 12,860,453 | 52,401 | |
FTSE 100 | 445 | 12/16/2022 | 37,521,347a | 36,271,420 | (1,249,927) | |
FTSE/MIB Index | 25 | 12/16/2022 | 2,650,546a | 2,784,765 | 134,219 | |
Gasoline | 14 | 2/28/2023 | 1,398,678b | 1,437,190 | 38,512 | |
Gold 100 oz | 6 | 12/28/2022 | 1,039,375b | 984,420 | (54,955) | |
Hang Seng | 101 | 11/29/2022 | 9,739,179a | 9,416,579 | (322,600) | |
Hard Red Winter Wheat | 7 | 3/14/2023 | 343,797b | 340,988 | (2,809) | |
IBEX 35 Index | 12 | 11/18/2022 | 901,831a | 942,791 | 40,960 | |
Japanese 10 Year Bond | 24 | 12/13/2022 | 23,951,048a | 24,012,105 | 61,057 | |
Japanese 10 Year Mini Bond | 5 | 12/12/2022 | 498,810a | 499,781 | 971 | |
Lean Hog | 13 | 2/14/2023 | 478,059b | 459,940 | (18,119) | |
11
CONSOLIDATED STATEMENT OF INVESTMENTS (continued)
| | | | | | | |
Description | Number of
Contracts | Expiration | Notional
Value ($) | Market
Value ($) | Unrealized Appreciation (Depreciation) ($) | |
Futures Long(continued) | | |
Live Cattle | 13 | 2/28/2023 | 788,508b | 810,290 | 21,782 | |
LME Primary Aluminum | 12 | 12/21/2022 | 737,111b | 667,800 | (69,311) | |
LME Primary Aluminum | 9 | 3/15/2023 | 529,191b | 502,144 | (27,047) | |
LME Primary Nickel | 4 | 12/21/2022 | 521,100b | 522,048 | 948 | |
LME Primary Nickel | 3 | 3/15/2023 | 410,859b | 394,002 | (16,857) | |
LME Refined Pig Lead | 2 | 12/21/2022 | 98,394b | 98,729 | 335 | |
LME Refined Pig Lead | 1 | 3/15/2023 | 51,647b | 49,277 | (2,370) | |
LME Zinc | 7 | 12/21/2022 | 558,296b | 475,125 | (83,171) | |
LME Zinc | 6 | 3/15/2023 | 462,918b | 402,000 | (60,918) | |
Low Sulphur Gas oil | 10 | 3/10/2023 | 934,170b | 930,250 | (3,920) | |
Natural Gas | 30 | 2/24/2023 | 1,743,951b | 1,715,100 | (28,851) | |
NY Harbor ULSD | 9 | 2/28/2023 | 1,228,820b | 1,233,679 | 4,859 | |
Platinum | 13 | 1/27/2023 | 575,547b | 604,565 | 29,018 | |
S&P/Toronto Stock Exchange 60 Index | 6 | 12/15/2022 | 1,039,149a | 1,037,266 | (1,883) | |
Silver | 5 | 12/28/2022 | 511,694b | 477,975 | (33,719) | |
Soybean Meal | 58 | 3/14/2023 | 2,276,972b | 2,373,940 | 96,968 | |
Sugar No.11 | 43 | 2/28/2023 | 880,913b | 865,435 | (15,478) | |
U.S. Treasury 10 Year Notes | 114 | 12/20/2022 | 12,547,777 | 12,607,688 | 59,911 | |
U.S. Treasury Long Bond | 95 | 12/20/2022 | 11,629,438 | 11,447,500 | (181,938) | |
Futures Short | | |
Amsterdam Exchange Index | 23 | 11/18/2022 | 2,937,770a | 3,040,741 | (102,971) | |
ASX SPI 200 | 15 | 12/15/2022 | 1,641,719a | 1,644,540 | (2,821) | |
Canadian 10 Year Bond | 197 | 12/19/2022 | 17,884,229a | 17,790,516 | 93,713 | |
Chicago SRW Wheat | 7 | 3/14/2023 | 312,829b | 314,738 | (1,909) | |
Cocoa | 12 | 3/16/2023 | 280,840b | 281,160 | (320) | |
LME Primary Aluminum | 12 | 12/21/2022 | 693,305b | 667,800 | 25,505 | |
LME Primary Aluminum | 3 | 3/15/2023 | 166,156b | 167,381 | (1,225) | |
LME Primary Nickel | 4 | 12/21/2022 | 537,618b | 522,048 | 15,570 | |
LME Refined Pig Lead | 2 | 12/21/2022 | 101,438b | 98,729 | 2,709 | |
LME Zinc | 7 | 12/21/2022 | 559,448b | 475,125 | 84,323 | |
Long Gilt | 65 | 12/28/2022 | 7,396,391a | 7,612,974 | (216,583) | |
Soybean | 1 | 3/14/2023 | 70,432b | 71,375 | (943) | |
Standard & Poor's 500 E-mini | 48 | 12/16/2022 | 8,882,404 | 9,319,200 | (436,796) | |
12
| | | | | | | |
Description | Number of
Contracts | Expiration | Notional
Value ($) | Market
Value ($) | Unrealized Appreciation (Depreciation) ($) | |
Futures Short(continued) | | |
Swiss Market Index | 150 | 12/16/2022 | 15,585,299a | 16,206,621 | (621,322) | |
Topix | 65 | 12/8/2022 | 8,252,066a | 8,419,247 | (167,181) | |
Gross Unrealized Appreciation | | 1,511,457 | |
Gross Unrealized Depreciation | | (4,186,750) | |
a Notional amounts in foreign currency have been converted to USD using relevant foreign exchange rates.
b These securities are wholly-owned by the Subsidiary referenced in Note 1.
See notes to consolidated financial statements.
| | | | | | |
Forward Foreign Currency Exchange Contracts | |
Counterparty/ Purchased
Currency | Purchased Currency
Amounts | Currency
Sold | Sold
Currency
Amounts | Settlement Date | Unrealized Appreciation (Depreciation) ($) |
Bank of Montreal |
Australian Dollar | 10,434,126 | United States Dollar | 7,128,741 | 12/21/2022 | (443,242) |
Japanese Yen | 1,293,196,015 | United States Dollar | 9,042,623 | 12/21/2022 | (286,876) |
United States Dollar | 1,807,441 | Swedish Krona | 19,073,915 | 12/21/2022 | 72,210 |
Citigroup Global Markets Inc. |
Japanese Yen | 241,106,000 | United States Dollar | 1,700,769 | 12/21/2022 | (68,330) |
Swedish Krona | 7,224,000 | United States Dollar | 647,083 | 12/21/2022 | 10,113 |
New Zealand Dollar | 542,000 | United States Dollar | 301,522 | 12/21/2022 | 13,847 |
Euro | 2,904,000 | United States Dollar | 2,915,746 | 12/21/2022 | (33,344) |
Canadian Dollar | 1,780,000 | United States Dollar | 1,316,030 | 12/21/2022 | (8,651) |
United States Dollar | 4,643,587 | Canadian Dollar | 6,070,013 | 12/21/2022 | 185,270 |
Swiss Franc | 301,000 | United States Dollar | 315,017 | 12/21/2022 | (12,500) |
British Pound | 618,000 | United States Dollar | 713,945 | 12/21/2022 | (3,922) |
Danish Krone | 1,164,000 | United States Dollar | 157,191 | 12/21/2022 | (1,983) |
Australian Dollar | 488,000 | United States Dollar | 329,339 | 12/21/2022 | (16,661) |
United States Dollar | 1,438,033 | Australian Dollar | 2,281,000 | 12/21/2022 | (23,481) |
Goldman Sachs & Co. LLC |
New Zealand Dollar | 1,939,000 | United States Dollar | 1,110,332 | 12/21/2022 | 17,899 |
13
CONSOLIDATED STATEMENT OF INVESTMENTS (continued)
| | | | | | |
Counterparty/ Purchased
Currency | Purchased Currency
Amounts | Currency
Sold | Sold
Currency
Amounts | Settlement Date | Unrealized Appreciation (Depreciation) ($) |
Goldman Sachs & Co. LLC(continued) |
United States Dollar | 1,146,396 | New Zealand Dollar | 2,009,000 | 12/21/2022 | (22,565) |
United States Dollar | 1,704,091 | Norwegian Krone | 18,077,000 | 12/21/2022 | (37,884) |
United States Dollar | 4,252,213 | Swiss Franc | 4,197,000 | 12/21/2022 | 34,066 |
British Pound | 11,521,000 | United States Dollar | 12,514,547 | 12/21/2022 | 721,975 |
Canadian Dollar | 481,000 | United States Dollar | 350,633 | 12/21/2022 | 2,653 |
United States Dollar | 2,936,192 | Canadian Dollar | 4,009,000 | 12/21/2022 | (8,348) |
Japanese Yen | 432,481,000 | United States Dollar | 2,923,650 | 12/21/2022 | 4,517 |
United States Dollar | 338,519 | Japanese Yen | 48,442,000 | 12/21/2022 | 10,536 |
United States Dollar | 4,470,318 | Australian Dollar | 6,922,000 | 12/21/2022 | 35,157 |
Swedish Krona | 9,526,000 | United States Dollar | 852,867 | 12/21/2022 | 13,751 |
United States Dollar | 1,131,442 | Swedish Krona | 12,744,000 | 12/21/2022 | (27,931) |
HSBC Securities (USA) Inc. |
Norwegian Krone | 84,866,218 | United States Dollar | 8,333,330 | 12/21/2022 | (155,267) |
Japanese Yen | 63,189,000 | United States Dollar | 446,177 | 12/21/2022 | (18,348) |
United States Dollar | 1,641,216 | Japanese Yen | 237,308,000 | 12/21/2022 | 34,492 |
British Pound | 1,610,000 | United States Dollar | 1,800,270 | 12/21/2022 | 49,465 |
United States Dollar | 1,219,239 | British Pound | 1,064,000 | 12/21/2022 | (3,195) |
United States Dollar | 4,090,721 | Swedish Krona | 45,546,000 | 12/21/2022 | (52,781) |
Swiss Franc | 870,000 | United States Dollar | 872,964 | 12/21/2022 | 1,420 |
United States Dollar | 2,981,943 | Swiss Franc | 2,902,000 | 12/21/2022 | 65,321 |
Canadian Dollar | 311,000 | United States Dollar | 225,815 | 12/21/2022 | 2,609 |
United States Dollar | 1,211,040 | Canadian Dollar | 1,650,000 | 12/21/2022 | (856) |
Euro | 1,300,000 | United States Dollar | 1,282,776 | 12/21/2022 | 7,556 |
Australian Dollar | 1,613,000 | United States Dollar | 1,045,622 | 12/21/2022 | (12,118) |
14
| | | | | | |
Counterparty/ Purchased
Currency | Purchased Currency
Amounts | Currency
Sold | Sold
Currency
Amounts | Settlement Date | Unrealized Appreciation (Depreciation) ($) |
HSBC Securities (USA) Inc.(continued) |
United States Dollar | 5,481,026 | Australian Dollar | 8,664,000 | 12/21/2022 | (70,293) |
New Zealand Dollar | 3,507,000 | United States Dollar | 1,995,901 | 12/21/2022 | 44,689 |
Morgan Stanley & Co. LLC |
New Zealand Dollar | 9,688,817 | United States Dollar | 5,844,246 | 12/21/2022 | (206,691) |
Swiss Franc | 554,000 | United States Dollar | 563,758 | 12/21/2022 | (6,967) |
United States Dollar | 1,126,790 | Australian Dollar | 1,749,000 | 12/21/2022 | 6,146 |
Euro | 639,000 | United States Dollar | 631,715 | 12/21/2022 | 2,533 |
British Pound | 2,074,000 | United States Dollar | 2,345,829 | 12/21/2022 | 36,998 |
United States Dollar | 16,051,802 | British Pound | 13,851,349 | 12/21/2022 | 137,933 |
Canadian Dollar | 829,000 | United States Dollar | 604,338 | 12/21/2022 | 4,548 |
United States Dollar | 2,156,937 | Japanese Yen | 319,656,000 | 12/21/2022 | (7,334) |
RBC Capital Markets, LLC |
Swiss Franc | 10,247,059 | United States Dollar | 10,725,615 | 12/21/2022 | (426,925) |
Standard Chartered Securities |
United States Dollar | 29,137,022 | Euro | 28,795,365 | 12/21/2022 | 555,815 |
Gross Unrealized Appreciation | | | 2,071,519 |
Gross Unrealized Depreciation | | | (1,956,493) |
See notes to consolidated financial statements.
15
CONSOLIDATED STATEMENT OF ASSETS AND LIABILITIES
October 31, 2022
| | | | | | | |
| | | | | | |
| | | Cost | | Value | |
Assets ($): | | | | |
Investments in securities—See Consolidated Statement of Investments | | | |
Unaffiliated issuers | 130,658,743 | | 130,931,846 | |
Affiliated issuers | | 21,984,479 | | 21,984,479 | |
Cash | | | | | 2,055,833 | |
Cash denominated in foreign currency | | | 398,635 | | 394,638 | |
Cash collateral held by broker—Note 4 | | 3,084,523 | |
Unrealized appreciation on forward foreign
currency exchange contracts—Note 4 | | 2,071,519 | |
Receivable for investment securities sold | | 283,748 | |
Receivable for shares of Common Stock subscribed | | 129,650 | |
Dividends receivable | | 57,909 | |
Prepaid expenses | | | | | 40,862 | |
| | | | | 161,035,007 | |
Liabilities ($): | | | | |
Due to BNY Mellon Investment Adviser, Inc. and affiliates—Note 3(c) | | 148,171 | |
Unrealized depreciation on forward foreign
currency exchange contracts—Note 4 | | 1,956,493 | |
Payable for shares of Common Stock redeemed | | 319,651 | |
Payable for futures variation margin—Note 4 | | 118,844 | |
Directors’ fees and expenses payable | | 16,950 | |
Other accrued expenses | | | | | 145,842 | |
| | | | | 2,705,951 | |
Net Assets ($) | | | 158,329,056 | |
Composition of Net Assets ($): | | | | |
Paid-in capital | | | | | 200,038,437 | |
Total distributable earnings (loss) | | | | | (41,709,381) | |
Net Assets ($) | | | 158,329,056 | |
| | | | | | |
Net Asset Value Per Share | Class A | Class C | Class I | Class Y | |
Net Assets ($) | 30,234,057 | 7,899,040 | 91,927,633 | 28,268,326 | |
Shares Outstanding | 2,235,031 | 648,524 | 6,556,784 | 2,020,815 | |
Net Asset Value Per Share ($) | 13.53 | 12.18 | 14.02 | 13.99 | |
| | | | | |
See notes to consolidated financial statements. | | | | | |
16
CONSOLIDATED STATEMENT OF OPERATIONS
Year Ended October 31, 2022
| | | | | | | |
| | | | | | |
| | | | | | |
Investment Income ($): | | | | |
Income: | | | | |
Interest | | | 1,182,795 | |
Dividends from affiliated issuers | | | 274,175 | |
Total Income | | | 1,456,970 | |
Expenses: | | | | |
Management fee—Note 3(a) | | | 2,503,369 | |
Shareholder servicing costs—Note 3(c) | | | 273,318 | |
Subsidiary management fees—Note 3(a) | | | 265,640 | |
Professional fees | | | 148,382 | |
Distribution fees—Note 3(b) | | | 85,615 | |
Registration fees | | | 68,156 | |
Directors’ fees and expenses—Note 3(d) | | | 28,900 | |
Prospectus and shareholders’ reports | | | 22,654 | |
Chief Compliance Officer fees—Note 3(c) | | | 17,405 | |
Custodian fees—Note 3(c) | | | 5,162 | |
Loan commitment fees—Note 2 | | | 3,678 | |
Miscellaneous | | | 33,146 | |
Total Expenses | | | 3,455,425 | |
Less—reduction in expenses due to undertaking—Note 3(a) | | | (634,241) | |
Less—reduction in fees due to earnings credits—Note 3(c) | | | (261) | |
Net Expenses | | | 2,820,923 | |
Net Investment (Loss) | | | (1,363,953) | |
Realized and Unrealized Gain (Loss) on Investments—Note 4 ($): | | |
Net realized gain (loss) on investments and foreign currency transactions | (123,232) | |
Net realized gain (loss) on futures | (25,417,152) | |
Net realized gain (loss) on options transactions | (767,697) | |
Net realized gain (loss) on forward foreign currency exchange contracts | 2,056,098 | |
Net Realized Gain (Loss) | | | (24,251,983) | |
Net change in unrealized appreciation (depreciation) on investments
and foreign currency transactions | (134,097) | |
Net change in unrealized appreciation (depreciation) on futures | (2,892,982) | |
Net change in unrealized appreciation (depreciation) on
options transactions | 952,497 | |
Net change in unrealized appreciation (depreciation) on
forward foreign currency exchange contracts | 656,932 | |
Net Change in Unrealized Appreciation (Depreciation) | | | (1,417,650) | |
Net Realized and Unrealized Gain (Loss) on Investments | | | (25,669,633) | |
Net (Decrease) in Net Assets Resulting from Operations | | (27,033,586) | |
| | | | | | |
See notes to consolidated financial statements. | | | | | |
17
CONSOLIDATED STATEMENT OF CHANGES IN NET ASSETS
| | | | | | | | | | |
| | | | Year Ended October 31, |
| | | | 2022 | | 2021 | |
Operations ($): | | | | | | | | |
Net investment (loss) | | | (1,363,953) | | | | (3,538,678) | |
Net realized gain (loss) on investments | | (24,251,983) | | | | 48,779,603 | |
Net change in unrealized appreciation
(depreciation) on investments | | (1,417,650) | | | | 6,080,913 | |
Net Increase (Decrease) in Net Assets
Resulting from Operations | (27,033,586) | | | | 51,321,838 | |
Distributions ($): | |
Distributions to shareholders: | | | | | | | | |
Class A | | | (6,080,213) | | | | - | |
Class C | | | (2,393,723) | | | | - | |
Class I | | | (21,247,593) | | | | - | |
Class Y | | | (15,888,539) | | | | - | |
Total Distributions | | | (45,610,068) | | | | - | |
Capital Stock Transactions ($): | |
Net proceeds from shares sold: | | | | | | | | |
Class A | | | 8,873,859 | | | | 5,745,871 | |
Class C | | | 188,357 | | | | 266,084 | |
Class I | | | 31,639,933 | | | | 34,565,477 | |
Class Y | | | 770,180 | | | | 5,109,784 | |
Distributions reinvested: | | | | | | | | |
Class A | | | 4,789,734 | | | | - | |
Class C | | | 2,362,765 | | | | - | |
Class I | | | 17,048,947 | | | | - | |
Class Y | | | 8,564,294 | | | | - | |
Cost of shares redeemed: | | | | | | | | |
Class A | | | (11,798,075) | | | | (7,102,212) | |
Class C | | | (7,225,560) | | | | (8,965,935) | |
Class I | | | (63,286,554) | | | | (83,483,341) | |
Class Y | | | (78,878,396) | | | | (145,730,889) | |
Increase (Decrease) in Net Assets
from Capital Stock Transactions | (86,950,516) | | | | (199,595,161) | |
Total Increase (Decrease) in Net Assets | (159,594,170) | | | | (148,273,323) | |
Net Assets ($): | |
Beginning of Period | | | 317,923,226 | | | | 466,196,549 | |
End of Period | | | 158,329,056 | | | | 317,923,226 | |
18
| | | | | | | | | | |
| | | | Year Ended October 31, |
| | | | 2022 | | 2021 | |
Capital Share Transactions (Shares): | |
Class Aa,b | | | | | | | | |
Shares sold | | | 593,238 | | | | 334,928 | |
Shares issued for distributions reinvested | | | 317,411 | | | | - | |
Shares redeemed | | | (808,361) | | | | (418,968) | |
Net Increase (Decrease) in Shares Outstanding | 102,288 | | | | (84,040) | |
Class Ca | | | | | | | | |
Shares sold | | | 14,643 | | | | 16,641 | |
Shares issued for distributions reinvested | | | 172,717 | | | | - | |
Shares redeemed | | | (528,548) | | | | (568,980) | |
Net Increase (Decrease) in Shares Outstanding | (341,188) | | | | (552,339) | |
Class Ib | | | | | | | | |
Shares sold | | | 2,078,847 | | | | 1,965,293 | |
Shares issued for distributions reinvested | | | 1,092,181 | | | | - | |
Shares redeemed | | | (4,241,028) | | | | (4,761,687) | |
Net Increase (Decrease) in Shares Outstanding | (1,070,000) | | | | (2,796,394) | |
Class Yb | | | | | | | | |
Shares sold | | | 44,781 | | | | 292,371 | |
Shares issued for distributions reinvested | | | 550,051 | | | | - | |
Shares redeemed | | | (5,159,107) | | | | (8,443,227) | |
Net Increase (Decrease) in Shares Outstanding | (4,564,275) | | | | (8,150,856) | |
| | | | | | | | | |
a | During the period ended October 31, 2021, 31 Class C shares representing $482 were automatically converted to 29 Class A shares. | |
b | During the period ended Octoberl 31, 2022, 39,868 Class Y shares representing $617,930 were exchanged for 39,787 Class I share and 3 Class I shares representing $45 were exchanged for 3 Class A share. During the period ended October 31, 2021, 180,047 Class Y shares representing $3,164,338 were exchanged for 179,705 Class I share and 396 Class Y shares representing $6,706 were exchanged for 406 Class A share. | |
See notes to consolidated financial statements. | | | | | | | | |
19
CONSOLIDATED FINANCIAL HIGHLIGHTS
The following tables describe the performance for each share class for the fiscal periods indicated. All information (except portfolio turnover rate) reflects financial results for a single fund share. Net asset value total return is calculated assuming an initial investment made at the net asset value at the beginning of the period, reinvestment of all dividends and distributions at net asset value during the period, and redemption at net asset value on the last day of the period. Net asset value total return includes adjustments in accordance with accounting principles generally accepted in the United States of America and as such, the net asset value for financial reporting purposes and the returns based upon those net asset values may differ from the net asset value and returns for shareholder transactions. These figures have been derived from the fund’s consolidated financial statements.
| | | | | | | |
| | | |
| | | Year Ended October 31, |
Class A Shares | | 2022 | 2021 | 2020 | 2019 | 2018 |
Per Share Data ($): | | | | | | |
Net asset value,
beginning of period | | 17.98 | 15.82 | 16.26 | 15.08 | 16.63 |
Investment Operations: | | | | | | |
Net investment income (loss)a | | (.11) | (.19) | (.02) | .15 | .08 |
Net realized and unrealized
gain (loss) on investments | | (1.52) | 2.35 | .08 | 1.16 | (.81) |
Total from
Investment Operations | | (1.63) | 2.16 | .06 | 1.31 | (.73) |
Distributions: | | | | | | |
Dividends from
net investment income | | (.08) | - | (.17) | (.13) | - |
Dividends from
net realized gain on investments | | (2.74) | - | (.33) | - | (.82) |
Total Distributions | | (2.82) | - | (.50) | (.13) | (.82) |
Net asset value, end of period | | 13.53 | 17.98 | 15.82 | 16.26 | 15.08 |
Total Return (%)b | | (10.75) | 13.79 | .28 | 8.82 | (4.63) |
Ratios/Supplemental Data (%): | | | | | | |
Ratio of total expenses
to average net assets | | 1.72 | 1.60 | 1.58 | 1.55 | 1.59 |
Ratio of net expenses
to average net assets c | | 1.40 | 1.42 | 1.44 | 1.44 | 1.44 |
Ratio of net investment income (loss) to average net assets | | (.76) | (1.12) | (.14) | .96 | .48 |
Portfolio Turnover Rate | | - | 82.12 | 176.12 | 26.17 | 17.55 |
Net Assets,
end of period ($ x 1,000) | | 30,234 | 38,354 | 35,061 | 38,100 | 47,280 |
a Based on average shares outstanding.
b Exclusive of sales charge
c Reflected is the waiver of the Subsidiary management fee.
See notes to consolidated financial statements.
20
| | | | | | | |
| | | |
| | | Year Ended October 31, |
Class C Shares | | 2022 | 2021 | 2020 | 2019 | 2018 |
Per Share Data ($): | | | | | | |
Net asset value,
beginning of period | | 16.50 | 14.62 | 15.06 | 13.96 | 15.56 |
Investment Operations: | | | | | | |
Net investment income (loss)a | | (.20) | (.29) | (.13) | .03 | (.04) |
Net realized and unrealized
gain (loss) on investments | | (1.38) | 2.17 | .06 | 1.09 | (.74) |
Total from
Investment Operations | | (1.58) | 1.88 | (.07) | 1.12 | (.78) |
Distributions: | | | | | | |
Dividends from
net investment income | | - | - | (.04) | (.02) | - |
Dividends from
net realized gain on investments | | (2.74) | - | (.33) | - | (.82) |
Total Distributions | | (2.74) | - | (.37) | (.02) | (.82) |
Net asset value, end of period | | 12.18 | 16.50 | 14.62 | 15.06 | 13.96 |
Total Return (%)b | | (11.44) | 12.93 | (.50) | 8.01 | (5.30) |
Ratios/Supplemental Data (%): | | | | | | |
Ratio of total expenses
to average net assets | | 2.48 | 2.36 | 2.33 | 2.29 | 2.31 |
Ratio of net expenses
to average net assetsc | | 2.15 | 2.17 | 2.19 | 2.19 | 2.19 |
Ratio of net investment income (loss) to average net assets | | (1.51) | (1.87) | (.87) | .22 | (.27) |
Portfolio Turnover Rate | | - | 82.12 | 176.12 | 26.17 | 17.55 |
Net Assets,
end of period ($ x 1,000) | | 7,899 | 16,334 | 22,548 | 31,771 | 46,681 |
a Based on average shares outstanding.
b Exclusive of sales charge
c Reflected is the waiver of the Subsidiary management fee.
See notes to consolidated financial statements.
21
CONSOLIDATED FINANCIAL HIGHLIGHTS (continued)
| | | | | | | |
| | | |
| | | Year Ended October 31, |
Class I Shares | | 2022 | 2021 | 2020 | 2019 | 2018 |
Per Share Data ($): | | | | | | |
Net asset value,
beginning of period | | 18.54 | 16.26 | 16.71 | 15.51 | 17.04 |
Investment Operations: | | | | | | |
Net investment income (loss)a | | (.08) | (.15) | .02 | .19 | .12 |
Net realized and unrealized
gain (loss) on investments | | (1.58) | 2.43 | .08 | 1.20 | (.83) |
Total from
Investment Operations | | (1.66) | 2.28 | .10 | 1.39 | (.71) |
Distributions: | | | | | | |
Dividends from
net investment income | | (.12) | - | (.22) | (.19) | - |
Dividends from
net realized gain on investments | | (2.74) | - | (.33) | - | (.82) |
Total Distributions | | (2.86) | - | (.55) | (.19) | (.82) |
Net asset value, end of period | | 14.02 | 18.54 | 16.26 | 16.71 | 15.51 |
Total Return (%) | | (10.53) | 14.02 | .53 | 9.04 | (4.33) |
Ratios/Supplemental Data (%): | | | | | | |
Ratio of total expenses
to average net assets | | 1.46 | 1.34 | 1.31 | 1.29 | 1.31 |
Ratio of net expenses
to average net assetsb | | 1.15 | 1.17 | 1.19 | 1.19 | 1.19 |
Ratio of net investment income (loss) to average net assets | | (.51) | (.88) | .13 | 1.20 | .73 |
Portfolio Turnover Rate | | - | 82.12 | 176.12 | 26.17 | 17.55 |
Net Assets,
end of period ($ x 1,000) | | 91,928 | 141,384 | 169,485 | 324,848 | 472,940 |
a Based on average shares outstanding.
b Reflected is the waiver of the Subsidiary management fee.
See notes to consolidated financial statements.
22
| | | | | | | |
| | | |
| | | Year Ended October 31, |
Class Y Shares | | 2022 | 2021 | 2020 | 2019 | 2018 |
Per Share Data ($): | | | | | | |
Net asset value,
beginning of period | | 18.50 | 16.23 | 16.69 | 15.53 | 17.04 |
Investment Operations: | | | | | | |
Net investment income (loss)a | | (.08) | (.15) | .03 | .20 | .13 |
Net realized and unrealized
gain (loss) on investments | | (1.57) | 2.42 | .07 | 1.19 | (.82) |
Total from
Investment Operations | | (1.65) | 2.27 | .10 | 1.39 | (.69) |
Distributions: | | | | | | |
Dividends from
net investment income | | (.12) | - | (.23) | (.23) | - |
Dividends from
net realized gain on investments | | (2.74) | - | (.33) | - | (.82) |
Total Distributions | | (2.86) | - | (.56) | (.23) | (.82) |
Net asset value, end of period | | 13.99 | 18.50 | 16.23 | 16.69 | 15.53 |
Total Return (%) | | (10.54) | 14.05 | .54 | 9.13 | (4.27) |
Ratios/Supplemental Data (%): | | | | | | |
Ratio of total expenses
to average net assets | | 1.35 | 1.26 | 1.22 | 1.22 | 1.21 |
Ratio of net expenses
to average net assetsb | | 1.15 | 1.17 | 1.17 | 1.15 | 1.14 |
Ratio of net investment income (loss) to average net assets | | (.51) | (.86) | .18 | 1.25 | .78 |
Portfolio Turnover Rate | | - | 82.12 | 176.12 | 26.17 | 17.55 |
Net Assets,
end of period ($ x 1,000) | | 28,268 | 121,851 | 239,102 | 564,884 | 733,373 |
a Based on average shares outstanding.
b Reflected is the waiver of the Subsidiary management fee.
See notes to consolidated financial statements.
23
NOTES TO CONSOLIDATED FINANCIAL STATEMENTS
NOTE 1—Significant Accounting Policies:
BNY Mellon Dynamic Total Return Fund (the “fund”) is a separate diversified series of BNY Mellon Advantage Funds, Inc. (the “Company”), which is registered under the Investment Company Act of 1940, as amended (the “Act”), as an open-end management investment company and operates as a series company currently offering eight series, including the fund. The fund’s investment objective is to seek total return. BNY Mellon Investment Adviser, Inc. (the “Adviser”), a wholly-owned subsidiary of The Bank of New York Mellon Corporation (“BNY Mellon”), serves as the fund’s investment adviser. Newton Investment Management North America, LLC (the “Sub-Adviser”), a wholly-owned subsidiary of BNY Mellon and an affiliate of the Adviser, serves as the fund’s sub-adviser.
The fund may gain investment exposure to global commodity markets through investments in DTR Commodity Fund Ltd., (the “Subsidiary”), a wholly-owned and controlled subsidiary of the fund organized under the laws of the Cayman Islands. The Subsidiary has the ability to invest in commodities and securities consistent with the investment objective of the fund. The Adviser serves as investment adviser for the Subsidiary, the Sub-Adviser serves as the Subsidiary’s sub-investment advisor and Citibank N.A. serves as the Subsidiary’s custodian. The financial statements have been consolidated and include the accounts of the fund and the Subsidiary. Accordingly, all inter-company transactions and balances have been eliminated. A subscription agreement was entered into between the fund and the Subsidiary, comprising the entire issued share capital of the Subsidiary, with the intent that the fund will remain the sole shareholder and retain all rights. Under the Amended and Restated Memorandum and Articles of Association, shares issued by the Subsidiary confer upon a shareholder the right to receive notice of, to attend and to vote at general meetings of the Subsidiary and shall confer upon the shareholder rights in a winding-up or repayment of capital and the right to participate in the profits or assets of the Subsidiary. The following summarizes the structure and relationship of the Subsidiary at October 31, 2022:
24
| | | | |
| | Subsidiary Activity |
Consolidated fund Net Assets ($) | | 158,329,056 | |
Subsidiary Percentage of fund Net Assets | | 9.93% | |
Subsidiary Financial Statement Information ($) | | | |
Total Assets | | 15,797,539 | |
Total Liabilities | | 82,843 | |
Net Assets | | 15,714,696 | |
Total Income | | 123,814 | |
Total Expenses | | 313,877 | |
Net Investment (Loss) | | (190,063) | |
Net Realized Gain (Loss) | | 3,254,757 | |
Net Change in Unrealized Appreciation (Depreciation) | | (265,167) | |
Net Increase in Net Assets Resulting from Operations | | 2,799,527 | |
BNY Mellon Securities Corporation (the “Distributor”), a wholly-owned subsidiary of the Adviser, is the distributor of the fund’s shares. The fund is authorized to issue 600 million shares of $.001 par value Common Stock. The fund currently has authorized four classes of shares: Class A (200 million shares authorized), Class C (100 million shares authorized), Class I (150 million shares authorized) and Class Y (150 million shares authorized). Class A and Class C shares are sold primarily to retail investors through financial intermediaries and bear Distribution and/or Shareholder Services Plan fees. Class A shares generally are subject to a sales charge imposed at the time of purchase. Class A shares bought without an initial sales charge as part of an investment of $1 million or more may be charged a contingent deferred sales charge (“CDSC”) of 1.00% if redeemed within one year. Class C shares are subject to a CDSC imposed on Class C shares redeemed within one year of purchase. Class C shares automatically convert to Class A shares eight years after the date of purchase, without the imposition of a sales charge. Class I shares are sold primarily to bank trust departments and other financial service providers (including BNY Mellon and its affiliates), acting on behalf of customers having a qualified trust or an investment account or relationship at such institution, and bear no Distribution or Shareholder Services Plan fees. Class Y shares are sold at net asset value per share generally to institutional investors, and bear no Distribution or Shareholder Services Plan fees. Class I and Class Y shares are offered without a front-end sales charge or CDSC. Other differences between the classes include the services offered to and the expenses borne by each class, the allocation of certain transfer agency costs, and certain voting rights. Income, expenses (other than expenses attributable to a specific class), and realized and unrealized gains or losses on investments are allocated to each class of shares based on its relative net assets.
The Company accounts separately for the assets, liabilities and operations of each series. Expenses directly attributable to each series are charged to
25
NOTES TO CONSOLIDATED FINANCIAL STATEMENTS (continued)
that series’ operations; expenses which are applicable to all series are allocated among them on a pro rata basis.
The Financial Accounting Standards Board (“FASB”) Accounting Standards Codification (“ASC”) is the exclusive reference of authoritative U.S. generally accepted accounting principles (“GAAP”) recognized by the FASB to be applied by nongovernmental entities. Rules and interpretive releases of the SEC under authority of federal laws are also sources of authoritative GAAP for SEC registrants. The fund is an investment company and applies the accounting and reporting guidance of the FASB ASC Topic 946 Financial Services-Investment Companies. The fund’s consolidated financial statements are prepared in accordance with GAAP, which may require the use of management estimates and assumptions. Actual results could differ from those estimates.
The Company enters into contracts that contain a variety of indemnifications. The fund’s maximum exposure under these arrangements is unknown. The fund does not anticipate recognizing any loss related to these arrangements.
(a) Portfolio valuation: The fair value of a financial instrument is the amount that would be received to sell an asset or paid to transfer a liability in an orderly transaction between market participants at the measurement date (i.e., the exit price). GAAP establishes a fair value hierarchy that prioritizes the inputs of valuation techniques used to measure fair value. This hierarchy gives the highest priority to unadjusted quoted prices in active markets for identical assets or liabilities (Level 1 measurements) and the lowest priority to unobservable inputs (Level 3 measurements).
Additionally, GAAP provides guidance on determining whether the volume and activity in a market has decreased significantly and whether such a decrease in activity results in transactions that are not orderly. GAAP requires enhanced disclosures around valuation inputs and techniques used during annual and interim periods.
Various inputs are used in determining the value of the fund’s investments relating to fair value measurements. These inputs are summarized in the three broad levels listed below:
Level 1—unadjusted quoted prices in active markets for identical investments.
Level 2—other significant observable inputs (including quoted prices for similar investments, interest rates, prepayment speeds, credit risk, etc.).
26
Level 3—significant unobservable inputs (including the fund’s own assumptions in determining the fair value of investments).
The inputs or methodology used for valuing securities are not necessarily an indication of the risk associated with investing in those securities.
Changes in valuation techniques may result in transfers in or out of an assigned level within the disclosure hierarchy. Valuation techniques used to value the fund’s investments are as follows:
The Company’s Board of Directors (the “Board”) has designated the Adviser as the fund’s valuation designee, effective September 8, 2022, to make all fair value determinations with respect to the fund’s portfolio investments, subject to the Board’s oversight and pursuant to Rule 2a-5 under the Act.
Registered investment companies that are not traded on an exchange are valued at their net asset value and are generally categorized within Level 1 of the fair value hierarchy.
Investments in debt securities, excluding short-term investments (other than U.S. Treasury Bills), futures, options and forward foreign currency exchange contracts (“forward contracts”) are valued each business day by one or more independent pricing services (each, a “Service”) approved by the Board. Investments for which quoted bid prices are readily available and are representative of the bid side of the market in the judgment of a Service are valued at the mean between the quoted bid prices (as obtained by a Service from dealers in such securities) and asked prices (as calculated by a Service based upon its evaluation of the market for such securities). Securities are valued as determined by a Service, based on methods which include consideration of the following: yields or prices of securities of comparable quality, coupon, maturity and type; indications as to values from dealers; and general market conditions. The Services are engaged under the general supervision of the Board. These securities are generally categorized within Level 2 of the fair value hierarchy. U.S. Treasury Bills are valued at the mean price between quoted bid prices and asked prices by a Service. These securities are generally categorized within Level 2 of the fair value hierarchy.
When market quotations or official closing prices are not readily available, or are determined not to accurately reflect fair value, such as when the value of a security has been significantly affected by events after the close of the exchange or market on which the security is principally traded, but before the fund calculates its net asset value, the fund may value these investments at fair value as determined in accordance with the procedures approved by the Board. Certain factors may be considered when fair
27
NOTES TO CONSOLIDATED FINANCIAL STATEMENTS (continued)
valuing investments such as: fundamental analytical data, the nature and duration of restrictions on disposition, an evaluation of the forces that influence the market in which the securities are purchased and sold, and public trading in similar securities of the issuer or comparable issuers. These securities are either categorized within Level 2 or 3 of the fair value hierarchy depending on the relevant inputs used.
For securities where observable inputs are limited, assumptions about market activity and risk are used and such securities are generally categorized within Level 3 of the fair value hierarchy.
Investments denominated in foreign currencies are translated to U.S. dollars at the prevailing rates of exchange.
Forward contracts are valued at the forward rate and are generally categorized within Level 2 of the fair value hierarchy. Futures and options, which are traded on an exchange, are valued at the last sales price on the securities exchange on which such securities are primarily traded or at the last sales price on the national securities market on each business day and are generally categorized within Level 1 of the fair value hierarchy. Options traded over-the-counter (“OTC”) are valued at the mean between the bid and asked price and are generally categorized within Level 2 of the fair value hierarchy.
The following is a summary of the inputs used as of October 31, 2022 in valuing the fund’s investments:
| | | | | | | |
| | Level 1-Unadjusted Quoted Prices | Level 2- Other Significant Observable Inputs | | Level 3-Significant Unobservable Inputs | Total | |
Assets ($) | | |
Investments in Securities:† | | |
Investment Companies | 21,984,479 | - | | - | 21,984,479 | |
U.S. Treasury Securities | - | 129,417,433 | | - | 129,417,433 | |
Other Financial Instruments: | | |
Forward Foreign Currency Exchange Contracts†† | - | 2,071,519 | | - | 2,071,519 | |
Futures†† | 1,511,457 | - | | - | 1,511,457 | |
Options Purchased | 1,514,413 | - | | - | 1,514,413 | |
| | | |
28
| | | | | | | |
| | Level 1-Unadjusted Quoted Prices | Level 2- Other Significant Observable Inputs | | Level 3-Significant Unobservable Inputs | Total | |
Liabilities ($) | | |
Other Financial Instruments: | | |
Forward Foreign Currency Exchange Contracts†† | - | (1,956,493) | | - | (1,956,493) | |
Futures†† | (4,186,750) | - | | - | (4,186,750) | |
† See Consolidated Statement of Investments for additional detailed categorizations, if any.
†† Amount shown represents unrealized appreciation (depreciation) at period end, but only variation margin on exchange-traded and centrally cleared derivatives, if any, are reported in the Consolidated Statement of Assets and Liabilities.
(b) Foreign currency transactions: The fund does not isolate that portion of the results of operations resulting from changes in foreign exchange rates on investments from the fluctuations arising from changes in the market prices of securities held. Such fluctuations are included with the net realized and unrealized gain or loss on investments.
Net realized foreign exchange gains or losses arise from sales of foreign currencies, currency gains or losses realized on securities transactions between trade and settlement date, and the difference between the amounts of dividends, interest and foreign withholding taxes recorded on the fund’s books and the U.S. dollar equivalent of the amounts actually received or paid. Net unrealized foreign exchange gains and losses arise from changes in the value of assets and liabilities other than investments resulting from changes in exchange rates. Foreign currency gains and losses on foreign currency transactions are also included with net realized and unrealized gain or loss on investments.
(c) Securities transactions and investment income: Securities transactions are recorded on a trade date basis. Realized gains and losses from securities transactions are recorded on the identified cost basis. Dividend income is recognized on the ex-dividend date and interest income, including, where applicable, accretion of discount and amortization of premium on investments, is recognized on the accrual basis.
(d) Affiliated issuers: Investments in other investment companies advised by the Adviser are considered “affiliated” under the Act.
(e) Market Risk: The value of the securities in which fund invests may be affected by political, regulatory, economic and social developments, and developments that impact specific economic sectors, industries or
29
NOTES TO CONSOLIDATED FINANCIAL STATEMENTS (continued)
segments of the market. The value of a security may also decline due to general market conditions that are not specifically related to a particular company or industry, such as real or perceived adverse economic conditions, changes in the general outlook for corporate earnings, changes in interest or currency rates, changes to inflation, adverse changes to credit markets or adverse investor sentiment generally. In addition, turbulence in financial markets and reduced liquidity in equity, credit and/or fixed income markets may negatively affect many issuers, which could adversely affect fund. Global economies and financial markets are becoming increasingly interconnected, and conditions and events in one country, region or financial market may adversely impact issuers in a different country, region or financial market. These risks may be magnified if certain events or developments adversely interrupt the global supply chain; in these and other circumstances, such risks might affect companies world-wide. Recent examples include pandemic risks related to COVID-19 and aggressive measures taken world-wide in response by governments, including closing borders, restricting international and domestic travel, and the imposition of prolonged quarantines of large populations, and by businesses, including changes to operations and reducing staff.
Subsidiary Risk: To the extent the fund invests in the subsidiary, the fund will be indirectly exposed to the risks associated with the subsidiary’s investments. The subsidiary principally invests in commodity-related instruments, including futures and options contracts, swap agreements and pooled investment vehicles that invest in commodities, and the fund’s investment in the subsidiary is subject to the same risks that apply to similar investments if held directly by the fund. Changes in applicable laws governing the subsidiary could prevent the fund or the subsidiary from operating as described in the prospectus and could negatively affect the fund and its shareholders. There also may be federal income tax risks associated with the fund’s investment in the subsidiary.
Commodity Risk: The fund’s investments in commodity-linked financial derivatives instruments may subject the fund to greater market price volatility than investments in traditional securities. The value of commodity-linked financial derivative instruments may be affected by changes in overall market movements, commodity index volatility, changes in interest rates, or factors affecting a particular industry or commodity, such as drought, floods, weather, livestock disease, embargoes, tariffs and international economic, political and regulatory developments.
(f) Dividends and distributions to shareholders: Dividends and distributions are recorded on the ex-dividend date. Dividends from net investment income and dividends from net realized capital gains, if any, are
30
normally declared and paid annually, but the fund may make distributions on a more frequent basis to comply with the distribution requirements of the Internal Revenue Code of 1986, as amended (the “Code”). To the extent that net realized capital gains can be offset by capital loss carryovers, it is the policy of the fund not to distribute such gains. Income and capital gain distributions are determined in accordance with income tax regulations, which may differ from GAAP.
(g) Federal income taxes: It is the policy of the fund to continue to qualify as a regulated investment company, if such qualification is in the best interests of its shareholders, by complying with the applicable provisions of the Code, and to make distributions of taxable income and net realized capital gain sufficient to relieve it from substantially all federal income and excise taxes.
The Subsidiary is classified as a controlled foreign corporation under Subchapter N of the Code. Therefore, the fund is required to increase its taxable income by its share of the Subsidiary’s income. Net investment losses of the Subsidiary cannot be deducted by the fund in the current period nor carried forward to offset taxable income in future periods.
As of and during the period ended October 31, 2022, the fund did not have any liabilities for any uncertain tax positions. The fund recognizes interest and penalties, if any, related to uncertain tax positions as income tax expense in the Consolidated Statement of Operations. During the period ended October 31, 2022, the fund did not incur any interest or penalties.
Each tax year in the four-year period ended October 31, 2022 remains subject to examination by the Internal Revenue Service and state taxing authorities.
At October 31, 2022, the components of accumulated earnings on a tax basis were as follows: undistributed ordinary income $1,714,462, accumulated capital losses $31,661,157 and unrealized depreciation $11,762,686.
The fund is permitted to carry forward capital losses for an unlimited period. Furthermore, capital loss carryovers retain their character as either short-term or long-term capital losses.
The accumulated capital loss carryover is available for federal income tax purposes to be applied against future net realized capital gains, if any, realized subsequent to October 31, 2022. The fund has $18,411,364 of short-term capital losses and $13,249,793 of long-term capital losses which can be carried forward for an unlimited period.
31
NOTES TO CONSOLIDATED FINANCIAL STATEMENTS (continued)
The tax character of distributions paid to shareholders during the fiscal years ended October 31, 2022 and October 31, 2021 were as follows: ordinary income $20,372,070 and $0, and long-term capital gains $25,237,998 and $0, respectively.
During the period ended October 31, 2022, as a result of permanent book to tax differences, primarily due to the tax treatment for Subpart F income from subsidiary, the fund decreased total distributable earnings (loss) by $3,064,695 and increased paid-in capital by the same amount. Net assets and net asset value per share were not affected by this reclassification.
(h) New accounting pronouncements: In March 2020, the FASB issued Accounting Standards Update 2020-04, Reference Rate Reform (Topic 848): Facilitation of the Effects of Reference Rate Reform on Financial Reporting (“ASU 2020-04”), and in January 2021, the FASB issued Accounting Standards Update 2021-01, Reference Rate Reform (Topic 848): Scope (“ASU 2021-01”), which provides optional, temporary relief with respect to the financial reporting of contracts subject to certain types of modifications due to the planned discontinuation of the London Interbank Offered Rate (“LIBOR”) and other interbank offered rates as of the end of 2021. The temporary relief provided by ASU 2020-04 and ASU 2021-01 is effective for certain reference rate-related contract modifications that occur during the period from March 12, 2020 through December 31, 2022 (“FASB Effective Date”). Management had evaluated the impact of ASU 2020-04 and ASU 2021-01 on the fund’s investments, derivatives, debt and other contracts that will undergo reference rate-related modifications as a result of the Reference Rate Reform. Management will be adopting ASU 2020-04 and ASU 2021-01 on FASB Effective Date or if amended ASU 2020-04 new extended FASB Effective Date, if any. Management will continue to work with other financial institutions and counterparties to modify contracts as required by applicable regulation and within the regulatory deadlines. As of October 31, 2022, management believes these accounting standards have no impact on the fund and does not have any concerns of adopting the regulations by FASB Effective Date.
NOTE 2—Bank Lines of Credit:
The fund participates with other long-term open-end funds managed by the Adviser in a $823.5 million unsecured credit facility led by Citibank, N.A. (the “Citibank Credit Facility”) and a $300 million unsecured credit facility provided by BNY Mellon (the “BNYM Credit Facility”), each to be utilized primarily for temporary or emergency purposes, including the financing of redemptions (each, a “Facility”). The Citibank Credit Facility is available in two tranches: (i) Tranche A is in an amount equal to $688.5
32
million and is available to all long-term open-ended funds, including the fund, and (ii) Tranche B is an amount equal to $135 million and is available only to BNY Mellon Floating Rate Income Fund, a series of BNY Mellon Investment Funds IV, Inc. In connection therewith, the fund has agreed to pay its pro rata portion of commitment fees for Tranche A of the Citibank Credit Facility and the BNYM Credit Facility. Interest is charged to the fund based on rates determined pursuant to the terms of the respective Facility at the time of borrowing. During the period ended October 31, 2022, the fund did not borrow under the Facilities.
NOTE 3— Management Fee, Sub-Advisory Fee and Other Transactions with Affiliates:
(a) The Adviser has entered into separate management agreements with the fund and the Subsidiary pursuant to which the Adviser receives a management fee computed at the annual rate of 1.10% of the value of the average daily net assets of each of the fund and the Subsidiary which is payable monthly. In addition, the Adviser has contractually agreed for as long as the fund invests in the Subsidiary, to waive the management fee it receives from the fund in an amount equal to the management fee paid to the Adviser by the Subsidiary. The reduction in expenses, pursuant to the undertaking, amounted to $265,640 during the period ended October 31, 2022.
In addition, the Adviser has contractually agreed, from November 1, 2021 through March 1, 2023, to waive receipt of its fees and/or assume the direct expenses of the fund, so that the direct expenses of none of the classes (excluding Rule 12b-1 Distribution Plan fees, Shareholder Services Plan fees, taxes, interest expense, brokerage commissions, commitment fees on borrowings and extraordinary expenses) exceed 1.15% of the value of the fund’s average daily net assets. On or after March 1, 2023, the Adviser may terminate this expense limitation at any time. The reduction in expenses, pursuant to the undertaking, amounted to $368,601 during the period ended October 31, 2022.
Pursuant to a sub-investment advisory agreement between the Adviser and the Sub-Adviser, the Adviser pay the Sub-Adviser an annual fee of .65% of the value of the fund’s average daily net assets of each fund and the Subsidiary which is payable monthly.
During the period ended October 31, 2022, the Distributor retained $2,076 from commissions earned on sales of the fund’s Class A shares $290 from CDSC fees on redemptions of the fund’s Class C shares.
(b) Under the Distribution Plan adopted pursuant to Rule 12b-1 under the Act, Class C shares pay the Distributor for distributing its shares at an
33
NOTES TO CONSOLIDATED FINANCIAL STATEMENTS (continued)
annual rate of .75% of the value of its average daily net assets. The Distributor may pay one or more Service Agents in respect of advertising, marketing and other distribution services, and determines the amounts, if any, to be paid to Service Agents and the basis on which such payments are made. During the period ended October 31, 2022, Class C shares were charged $85,615 pursuant to the Distribution Plan.
(c) Under the Shareholder Services Plan, Class A and Class C shares pay the Distributor at an annual rate of .25% of the value of their average daily net assets for the provision of certain services. The services provided may include personal services relating to shareholder accounts, such as answering shareholder inquiries regarding the fund, and services related to the maintenance of shareholder accounts. The Distributor may make payments to Service Agents (securities dealers, financial institutions or other industry professionals) with respect to these services. The Distributor determines the amounts to be paid to Service Agents. During the period ended October 31, 2022, Class A and Class C shares were charged $86,192 and $28,538, respectively, pursuant to the Shareholder Services Plan.
The fund has an arrangement with BNY Mellon Transfer, Inc., (the “Transfer Agent”), a subsidiary of BNY Mellon and an affiliate of the Adviser, whereby the fund may receive earnings credits when positive cash balances are maintained, which are used to offset Transfer Agent fees. For financial reporting purposes, the fund includes transfer agent net earnings credits, if any, as an expense offset in the Consolidated Statement of Operations.
The fund has an arrangement with The Bank of New York Mellon (the “Custodian”), a subsidiary of BNY Mellon and an affiliate of the Adviser, whereby the fund will receive interest income or be charged overdraft fees when cash balances are maintained. For financial reporting purposes, the fund includes this interest income and overdraft fees, if any, as interest income in the Consolidated Statement of Operations.
The fund compensates the Transfer Agent, under a transfer agency agreement, for providing transfer agency and cash management services for the fund. The majority of Transfer Agent fees are comprised of amounts paid on a per account basis, while cash management fees are related to fund subscriptions and redemptions. During the period ended October 31, 2022, the fund was charged $11,079 for transfer agency services. These fees are included in Shareholder servicing costs in the Consolidated Statement of Operations. These fees were partially offset by earnings credits of $261.
34
The fund compensates the Custodian, under a custody agreement, for providing custodial services for the fund. These fees are determined based on net assets, geographic region and transaction activity. During the period ended October 31, 2022, the fund was charged $5,162 pursuant to the custody agreement.
During the period ended October 31, 2022, the fund was charged $17,405 for services performed by the fund’s Chief Compliance Officer and his staff. These fees are included in Chief Compliance Officer fees in the Consolidated Statement of Operations.
The components of “Due to BNY Mellon Investment Adviser, Inc. and affiliates” in the Consolidated Statement of Assets and Liabilities consist of: management fee of $150,447, Subsidiary management fee of $14,735, Distribution Plan fees of $5,243, Shareholder Services Plan fees of $8,138, Custodian fees of $3,373, Chief Compliance Officer fees of $5,078 and Transfer Agent fees of $1,815, which are offset against an expense reimbursement currently in effect in the amount of $40,658.
(d) Each Board member also serves as a Board member of other funds in the BNY Mellon Family of Funds complex. Annual retainer fees and attendance fees are allocated to each fund based on net assets.
NOTE 4—Securities Transactions:
The aggregate amount of purchases and sales of investment securities, excluding short-term securities, futures, options transactions and forward contracts, during the period ended October 31, 2022, amounted to $0 and $0, respectively.
Derivatives: A derivative is a financial instrument whose performance is derived from the performance of another asset. The fund enters into International Swaps and Derivatives Association, Inc. Master Agreements or similar agreements (collectively, “Master Agreements”) with its OTC derivative contract counterparties in order to, among other things, reduce its credit risk to counterparties. Master Agreements include provisions for general obligations, representations, collateral and events of default or termination. Under a Master Agreement, the fund may offset with the counterparty certain derivative financial instruments’ payables and/or receivables with collateral held and/or posted and create one single net payment in the event of default or termination. The SEC recently adopted Rule 18f-4 under the Act, which, effective August 18, 2022, regulates the use of derivatives transactions for certain funds registered under the Act. The fund’s derivative transactions are subject to a value-at-risk leverage limit and certain reporting and other requirements pursuant to a derivatives risk management program adopted by the fund.
35
NOTES TO CONSOLIDATED FINANCIAL STATEMENTS (continued)
Each type of derivative instrument that was held by the fund during the period ended October 31, 2022 is discussed below.
Futures: In the normal course of pursuing its investment objective, the fund is exposed to market risk, including equity price risk, interest rate risk and commodity risk, as a result of changes in value of underlying financial instruments. The fund invests in futures in order to manage its exposure to or protect against changes in the market. A futures contract represents a commitment for the future purchase or a sale of an asset at a specified date. Upon entering into such contracts, these investments require initial margin deposits with a counterparty, which consist of cash or cash equivalents. The amount of these deposits is determined by the exchange or Board of Trade on which the contract is traded and is subject to change. Accordingly, variation margin payments are received or made to reflect daily unrealized gains or losses which are recorded in the Consolidated Statement of Operations. When the contracts are closed, the fund recognizes a realized gain or loss which is reflected in the Consolidated Statement of Operations. There is minimal counterparty credit risk to the fund with futures since they are exchange traded, and the exchange guarantees the futures against default. Futures open at October 31, 2022 are set forth in the Consolidated Statement of Investments.
Options Transactions: The fund purchases and writes (sells) put and call options to hedge against changes in the values of equities or as a substitute for an investment. The fund is subject to market risk in the course of pursuing its investment objectives through its investments in options contracts. A call option gives the purchaser of the option the right (but not the obligation) to buy, and obligates the writer to sell, the underlying financial instrument at the exercise price at any time during the option period, or at a specified date. Conversely, a put option gives the purchaser of the option the right (but not the obligation) to sell, and obligates the writer to buy the underlying financial instrument at the exercise price at any time during the option period, or at a specified date.
As a writer of call options, the fund receives a premium at the outset and then bears the market risk of unfavorable changes in the price of the financial instrument underlying the option. Generally, the fund realizes a gain, to the extent of the premium, if the price of the underlying financial instrument decreases between the date the option is written and the date on which the option is terminated. Generally, the fund incurs a loss if the price of the financial instrument increases between those dates. The maximum payout for those contracts is limited to the number of call option contracts written and the related strike prices, respectively.
36
As a writer of put options, the fund receives a premium at the outset and then bears the market risk of unfavorable changes in the price of the financial instrument underlying the option. Generally, the fund realizes a gain, to the extent of the premium, if the price of the underlying financial instrument increases between the date the option is written and the date on which the option is terminated. Generally, the fund incurs a loss if the price of the financial instrument decreases between those dates. The maximum payout for those contracts is limited to the number of put option contracts written and the related strike prices, respectively.
As a writer of an option, the fund has no control over whether the underlying financial instrument may be sold (call) or purchased (put) and as a result bears the market risk of an unfavorable change in the price of the financial instrument underlying the written option. There is a risk of loss from a change in value of such options which may exceed the related premiums received. This risk may be mitigated by Master Agreements, if any, between the fund and the counterparty and the posting of collateral, if any, by the counterparty to the fund to cover the fund’s exposure to the counterparty. The Consolidated Statement of Operations reflects any unrealized gains or losses which occurred during the period as well as any realized gains or losses which occurred upon the expiration or closing of the option transaction. Options purchased open at October 31, 2022 are set forth in the Consolidated Statements of Investments. As of October 31, 2022, there was no options written outstanding.
Forward Foreign Currency Exchange Contracts: The fund enters into forward contracts in order to hedge its exposure to changes in foreign currency exchange rates on its foreign portfolio holdings, to settle foreign currency transactions or as a part of its investment strategy. When executing forward contracts, the fund is obligated to buy or sell a foreign currency at a specified rate on a certain date in the future. With respect to sales of forward contracts, the fund incurs a loss if the value of the contract increases between the date the forward contract is opened and the date the forward contract is closed. The fund realizes a gain if the value of the contract decreases between those dates. With respect to purchases of forward contracts, the fund incurs a loss if the value of the contract decreases between the date the forward contract is opened and the date the forward contract is closed. The fund realizes a gain if the value of the contract increases between those dates. Any realized or unrealized gains or losses which occurred during the period are reflected in the Consolidated Statement of Operations. The fund is exposed to foreign currency risk as a result of changes in value of underlying financial instruments. The fund is also exposed to credit risk associated with counterparty non-performance on these forward contracts, which is generally limited to the unrealized
37
NOTES TO CONSOLIDATED FINANCIAL STATEMENTS (continued)
gain on each open contract. This risk may be mitigated by Master Agreements, if any, between the fund and the counterparty and the posting of collateral, if any, by the counterparty to the fund to cover the fund’s exposure to the counterparty. Forward contracts open at October 31, 2022 are set forth in the Consolidated Statement of Investments.
The following tables show the fund’s exposure to different types of market risk as it relates to the Consolidated Statement of Assets and Liabilities and the Consolidated Statement of Operations, respectively.
Fair value of derivative instruments as of October 31, 2022 is shown below:
| | | | | | | | |
| | Derivative
Assets ($) | | | | Derivative
Liabilities ($) | |
Interest rate risk | 352,037 | 1 | Interest rate risk | (398,521) | 1 |
Equity risk | 2,244,008 | 1,2 | Equity risk | (3,133,833) | 1 |
Foreign exchange risk | 2,071,519 | 3 | Foreign exchange risk | (1,956,493) | 3 |
Commodity risk | 429,825 | 1 | Commodity risk | (654,396) | 1 |
Gross fair value of
derivative contracts | 5,097,389 | | | | (6,143,243) | |
| | | | | | |
| Consolidated Statement of Assets and Liabilities location: | |
1 | Includes cumulative appreciation (depreciation) on futures as reported in the
Consolidated Statement of Futures, but only the unpaid variation margin is reported in
the Consolidated Statement of Assets and Liabilities. |
2 | Options purchased are included in Investments in securities—Unaffiliated issuers, at value. |
3 | Unrealized appreciation (depreciation) on forward foreign currency exchange contracts. |
The effect of derivative instruments in the Consolidated Statement of Operations during the period ended October 31, 2022 is shown below:
| | | | | | | | | |
Amount of realized gain (loss) on derivatives recognized in income ($) | |
Underlying
risk | Futures | 1 | Options
Transactions | 2 | Forward
Contracts | 3 | Total | |
Interest rate | (14,479,184) | | - | | - | | (14,479,184) | |
Equity | (14,225,089) | | (767,697) | | - | | (14,992,786) | |
Foreign
exchange | - | | - | | 2,056,098 | | 2,056,098 | |
Commodity | 3,287,121 | | - | | - | | 3,287,121 | |
Total | (25,417,152) | | (767,697) | | 2,056,098 | | (24,128,751) | |
| | | | | | | | |
38
| | | | | | | | | | |
Net change in unrealized appreciation (depreciation)
on derivatives recognized in income ($) | |
Underlying
risk | Futures | 4 | Options
Transactions | 5 | Forward
Contracts | 6 | Total | |
Interest rate | 3,457,377 | | - | | - | | 3,457,377 | |
Equity | (6,104,475) | | 952,497 | | - | | (5,151,978) | |
Foreign
exchange | - | | - | | 656,932 | | 656,932 | |
Commodity | (245,884) | | - | | - | | (245,884) | |
Total | (2,892,982) | | 952,497 | | 656,932 | | (1,283,553) | |
| | | | | | | | | |
| Consolidated Statement of Operations location: | |
1 | Net realized gain (loss) on futures. |
2 | Net realized gain (loss) on options transactions. |
3 | Net realized gain (loss) on forward foreign currency exchange contracts. |
4 | Net change in unrealized appreciation (depreciation) on futures. |
5 | Net change in unrealized appreciation (depreciation) on options transactions. |
6 | Net change in unrealized appreciation (depreciation) on forward foreign currency exchange contracts. |
The provisions of ASC Topic 210 “Disclosures about Offsetting Assets and Liabilities” require disclosure on the offsetting of financial assets and liabilities. These disclosures are required for certain investments, including derivative financial instruments subject to Master Agreements which are eligible for offsetting in the Consolidated Statement of Assets and Liabilities and require the fund to disclose both gross and net information with respect to such investments. For financial reporting purposes, the fund does not offset derivative assets and derivative liabilities that are subject to Master Agreements in the Consolidated Statement of Assets and Liabilities.
At October 31, 2022, derivative assets and liabilities (by type) on a gross basis are as follows:
| | | | | | |
Derivative Financial Instruments: | | Assets ($) | | Liabilities ($) | |
Futures | | 1,511,457 | | (4,186,750) | |
Options | | 1,514,413 | | - | |
Forward contracts | | 2,071,519 | | (1,956,493) | |
Total gross amount of derivative | | | | | |
assets and liabilities in the | | | | | |
Consolidated Statement of
Assets and Liabilities | | 5,097,389 | | (6,143,243) | |
Derivatives not subject to | | | | | |
Master Agreements | | (3,025,870) | | 4,186,750 | |
Total gross amount of assets | | | | | |
and liabilities subject to | | | | | |
Master Agreements | | 2,071,519 | | (1,956,493) | |
39
NOTES TO CONSOLIDATED FINANCIAL STATEMENTS (continued)
The following tables present derivative assets and liabilities net of amounts available for offsetting under Master Agreements and net of related collateral received or pledged, if any, as of October 31, 2022:
| | | | | | | |
| | | Financial | | | |
| | | Instruments | | | |
| | | and Derivatives | | | |
| Gross Amount of | | Available | Collateral | | Net Amount of |
Counterparty | Assets ($) | 1 | for Offset ($) | Received ($) | 2 | Assets ($) |
Bank of Montreal | 72,210 | | (72,210) | - | | - |
Citigroup Global
Markets Inc. | 209,230 | | (168,872) | - | | 40,358 |
Goldman
Sachs & Co. LLC | 840,554 | | (96,728) | (700,000) | | 43,826 |
HSBC Securities
(USA) Inc. | 205,552 | | (205,552) | - | | - |
Morgan
Stanley & Co. LLC | 188,158 | | (188,158) | - | | - |
Standard
Chartered Securities | 555,815 | | - | (250,303) | | 305,512 |
Total | 2,071,519 | | (731,520) | (950,303) | | 389,696 |
| | | | | | |
| | | Financial | | | |
| | | Instruments | | | |
| | | and Derivatives | | | |
| Gross Amount of | | Available | Collateral | | Net Amount of |
Counterparty | Liabilities ($) | 1 | for Offset ($) | Pledged ($) | 2 | Liabilities ($) |
Bank of Montreal | (730,118) | | 72,210 | 620,000 | | (37,908) |
Citigroup Global
Markets Inc. | (168,872) | | 168,872 | - | | - |
Goldman
Sachs & Co. LLC | (96,728) | | 96,728 | - | | - |
HSBC Securities
(USA) Inc. | (312,858) | | 205,552 | 107,306 | | - |
Morgan
Stanley & Co. LLC | (220,992) | | 188,158 | - | | (32,834) |
RBC Capital
Markets, LLC | (426,925) | | - | 310,000 | | (116,925) |
Total | (1,956,493) | | 731,520 | 1,037,306 | | (187,667) |
| | | | | | |
1 Absent a default event or early termination, OTC derivative assets and liabilities are presented at gross amounts
and are not offset in the Consolidated Statement of Assets and Liabilities. |
2 In some instances, the actual collateral received and/or pledged may be more than the amount shown due to
over collateralization. |
40
The following summarizes the average market value of derivatives outstanding during the period ended October 31, 2022:
| | | |
| | Average Market Value ($) |
Equity futures | | 208,124,778 |
Equity options contracts | | 820,755 |
Interest rate futures | | 225,217,715 |
Forward contracts | | 464,394,167 |
Commodity futures | | 36,758,551 |
At October 31, 2022, the cost of investments for federal income tax purposes was $164,727,321; accordingly, accumulated net unrealized depreciation on investments inclusive of derivative contracts was $11,758,689, consisting of $2,007,785 gross unrealized appreciation and $13,766,474 gross unrealized depreciation.
41
REPORT OF INDEPENDENT REGISTERED PUBLIC ACCOUNTING FIRM
To the Shareholders and the Board of Directors of BNY Mellon Dynamic Total Return Fund
Opinion on the Financial Statements
We have audited the accompanying consolidated statement of assets and liabilities of BNY Mellon Dynamic Total Return Fund (the “Fund”) (one of the funds constituting BNY Mellon Advantage Funds, Inc.), including the consolidated statement of investments, as of October 31, 2022, and the related consolidated statement of operations for the year then ended, the consolidated statements of changes in net assets for each of the two years in the period then ended, the consolidated financial highlights for each of the five years in the period then ended and the related notes (collectively referred to as the “financial statements”). In our opinion, the financial statements present fairly, in all material respects, the consolidated financial position of the Fund (one of the funds constituting BNY Mellon Advantage Funds, Inc.) at October 31, 2022, the consolidated results of its operations for the year then ended, the consolidated changes in its net assets for each of the two years in the period then ended and its consolidated financial highlights for each of the five years in the period then ended, in conformity with U.S. generally accepted accounting principles.
Basis for Opinion
These financial statements are the responsibility of the Fund’s management. Our responsibility is to express an opinion on the Fund’s financial statements based on our audits. We are a public accounting firm registered with the Public Company Accounting Oversight Board (United States) (“PCAOB”) and are required to be independent with respect to the Fund in accordance with the U.S. federal securities laws and the applicable rules and regulations of the Securities and Exchange Commission and the PCAOB.
We conducted our audits in accordance with the standards of the PCAOB. Those standards require that we plan and perform the audit to obtain reasonable assurance about whether the financial statements are free of material misstatement, whether due to error or fraud. The Fund is not required to have, nor were we engaged to perform, an audit of the Fund’s internal control over financial reporting. As part of our audits, we are required to obtain an understanding of internal control over financial reporting, but not for the purpose of expressing an opinion on the effectiveness of the Fund’s internal control over financial reporting. Accordingly, we express no such opinion.
Our audits included performing procedures to assess the risks of material misstatement of the financial statements, whether due to error or fraud, and performing procedures that respond to those risks. Such procedures included examining, on a test basis, evidence regarding the amounts and disclosures in the financial statements. Our procedures included confirmation of securities owned as of October 31, 2022, by correspondence with the custodian, brokers and others; when replies were not received from brokers and others, we performed other auditing procedures. Our audits also included evaluating the accounting principles used and significant estimates made by management, as well as evaluating the overall presentation of the financial statements. We believe that our audits provide a reasonable basis for our opinion.

We have served as the auditor of one or more investment companies in the BNY Mellon Family of Funds since at least 1957, but we are unable to determine the specific year.
New York, New York
December 27, 2022
42
IMPORTANT TAX INFORMATION (Unaudited)
The fund hereby reports $1.5758 per share as a long-term capital gain distribution and $1.1668 as a short-term capital gain distribution paid on December 20, 2021.
43
LIQUIDITY RISK MANAGEMENT PROGRAM (Unaudited)
Effective June 1, 2019, the fund adopted a liquidity risk management program (the “Liquidity Risk Management Program”) pursuant to the requirements of Rule 22e-4 under the Investment Company Act of 1940, as amended. Rule 22e-4 requires registered open-end funds, including mutual funds and exchange-traded funds but not money market funds, to establish liquidity risk management programs in order to effectively manage fund liquidity and shareholder redemptions. The rule is designed to mitigate the risk that a fund could not meet redemption requests without significantly diluting the interests of remaining investors.
The rule requires the fund to assess, manage and review their liquidity risk at least annually considering applicable factors such as investment strategy and liquidity during normal and foreseeable stressed conditions, including whether the strategy is appropriate for an open-end fund and whether the fund has a relatively concentrated portfolio or large positions in particular issuers. The fund must also assess its use of borrowings and derivatives, short-term and long-term cash flow projections in normal and stressed conditions, holdings of cash and cash equivalents, and borrowing arrangements and other funding sources.
The rule also requires the fund to classify its investments as highly liquid, moderately liquid, less liquid or illiquid based on the number of days the fund expects it would take to liquidate the investment, and to review these classifications at least monthly or more often under certain conditions. The periods range from three or fewer business days for a highly liquid investment to greater than seven calendar days for settlement of a less liquid investment. Illiquid investments are those a fund does not expect to be able to sell or dispose of within seven calendar days without significantly changing the market value. The fund is prohibited from acquiring an investment if, after the acquisition, its holdings of illiquid assets will exceed 15% of its net assets. In addition, if a fund permits redemptions in-kind, the rule requires the fund to establish redemption in-kind policies and procedures governing how and when it will engage in such redemptions.
Pursuant to the rule’s requirements, the Liquidity Risk Management Program has been reviewed and approved by the Board. Furthermore, the Board has received a written report prepared by the Program’s Administrator that addresses the operation of the Program, assesses its adequacy and effectiveness and describes any material changes made to the Program.
Assessment of Program
In the opinion of the Program Administrator, the Program approved by the Board continues to be adequate for the fund and the Program has been implemented effectively. The Program Administrator has monitored the fund’s liquidity risk and the liquidity classification of the securities held by the fund and has determined that the Program is operating effectively.
During the period from January 1, 2021 to December 31, 2021, there were no material changes to the Program and no material liquidity events that impacted the fund. During the period, the fund held sufficient highly liquid assets to meet fund redemptions.
Under normal expected foreseeable fund redemption forecasts and foreseeable stressed fund redemption forecasts, the Program Administrator believes that the fund maintains sufficient highly liquid assets to meet expected fund redemptions.
44
BOARD MEMBERS INFORMATION (Unaudited)
Independent Board Members
Joseph S. DiMartino (79)
Chairman of the Board (1995)
Principal Occupation During Past 5 Years:
· Director or Trustee of funds in the BNY Mellon Family of Funds and certain other entities (as described in the fund’s Statement of Additional Information) (1995-Present)
Other Public Company Board Memberships During Past 5 Years:
· CBIZ, Inc., a public company providing professional business services, products and solutions, Director (1997-Present)
No. of Portfolios for which Board Member Serves: 94
———————
Peggy C. Davis (79)
Board Member (2006)
Principal Occupation During Past 5 Years:
· Shad Professor of Law, New York University School of Law (1983-Present)
No. of Portfolios for which Board Member Serves: 33
———————
Gina D. France (64)
Board Member (2019)
Principal Occupation During Past 5 Years:
· France Strategic Partners, a strategy and advisory firm serving corporate clients across the United States, Founder, President and Chief Executive Officer (2003-Present)
Other Public Company Board Memberships During Past 5 Years:
· Huntington Bancshares, a bank holding company headquartered in Columbus, Ohio, Director (2016-Present)
· Cedar Fair, L.P., a publicly-traded partnership that owns and operates amusement parks and hotels in the U.S. and Canada, Director (2011-Present)
· CBIZ, Inc., a public company providing professional business services, products and solutions, Director (2015-Present)
· FirstMerit Corporation, a diversified financial services company, Director (2004-2016)
No. of Portfolios for which Board Member Serves: 23
———————
Joan Gulley (75)
Board Member (2017)
Principal Occupation During Past 5 Years:
· Nantucket Atheneum, public library, Chair (2018-June 2021) and Director (2015-June 2021)
· Orchard Island Club, golf and beach club, Governor (2016-Present)
No. of Portfolios for which Board Member Serves: 40
———————
45
BOARD MEMBERS INFORMATION (Unaudited) (continued)
Robin A. Melvin (59)
Board Member (2012)
Principal Occupation During Past 5 Years:
· Westover School, a private girls’ boarding school in Middlebury, Connecticut, Trustee (2019-Present)
· Mentor Illinois, a non-profit organization dedicated to increasing the quality of mentoring services in Illinois, Co-Chair (2014–2020); Board Member, Mentor Illinois (2013-2020)
· JDRF, a non-profit juvenile diabetes research foundation, Board Member (June 2021-June 2022)
Other Public Company Board Memberships During Past 5 Years:
· HPS Corporate Lending Fund, a closed-end management investment company regulated as a business development company, Trustee (August 2021-Present)
No. of Portfolios for which Board Member Serves: 72
———————
Michael D. DiLecce (60)
Advisory Board Member (2022)
Principal Occupation During Past 5 Years:
· Retired since July 2022. Global Asset Management Assurance Leader, Ernst & Young LLP (2015-2022)
· Americas Regional Talent Managing Partner for Ernst & Young’s Financial Service Practice (2017-2021)
· Partner, Ernst & Young LLP (1997-2022)
No. of Portfolios for which Board Member Serves: 23
———————
The address of the Board Members and Officers is c/o BNY Mellon Investment Adviser, Inc., 240 Greenwich Street, New York, New York 10286. Additional information about each Board Member is available in the fund’s Statement of Additional Information which can be obtained from the Adviser free of charge by calling this toll free number: 1-800-373-9387.
46
OFFICERS OF THE FUND (Unaudited)
DAVID DIPETRILLO, President since January 2021.
Vice President and Director of the Adviser since February 2021; Head of North America Product, BNY Mellon Investment Management since January 2018; and Director of Product Strategy, BNY Mellon Investment Management from January 2016 to December 2017. He is an officer of 55 investment companies (comprised of 109 portfolios) managed by the Adviser or an affiliate of the Adviser. He is 44 years old and has been an employee of BNY Mellon since 2005.
JAMES WINDELS, Treasurer since November 2001.
Vice President of the Adviser since September 2020; and Director–BNY Mellon Fund Administration. He is an officer of 56 investment companies (comprised of 130 portfolios) managed by the Adviser or an affiliate of the Adviser. He is 64 years old and has been an employee of the Adviser since April 1985.
PETER M. SULLIVAN, Chief Legal Officer since July 2021 and Vice President and Assistant Secretary since March 2019.
Chief Legal Officer of the Adviser and Associate General Counsel of BNY Mellon since July 2021; Senior Managing Counsel of BNY Mellon from December 2020 to July 2021; and Managing Counsel of BNY Mellon from March 2009 to December 2020. He is an officer of 56 investment companies (comprised of 130 portfolios) managed by the Adviser or an affiliate of the Adviser. He is 54 years old and has been an employee of BNY Mellon since April 2004.
JAMES BITETTO, Vice President since August 2005 and Secretary since February 2018.
Senior Managing Counsel of BNY Mellon since December 2019; Managing Counsel of BNY Mellon from April 2014 to December 2019; and Secretary of the Adviser. He is an officer of 56 investment companies (comprised of 130 portfolios) managed by the Adviser or an affiliate of the Adviser. He is 56 years old and has been an employee of the Adviser since December 1996.
DEIRDRE CUNNANE, Vice President and Assistant Secretary since March 2019.
Managing Counsel of BNY Mellon since December 2021, Counsel of BNY Mellon from August 2018 to December 2021; and Senior Regulatory Specialist at BNY Mellon Investment Management Services from February 2016 to August 2018. She is an officer of 56 investment companies (comprised of 130 portfolios) managed by the Adviser or an affiliate of the Adviser. She is 32 years old and has been an employee of the Adviser since August 2018.
SARAH S. KELLEHER, Vice President and Assistant Secretary since April 2014.
Vice President of BNY Mellon ETF Investment Adviser; LLC since February 2020; Senior Managing Counsel of BNY Mellon since September 2021; Managing Counsel of BNY Mellon from December 2017 to September 2021; and Senior Counsel of BNY Mellon from March 2013 to December 2017. She is an officer of 56 investment companies (comprised of 130 portfolios) managed by the Adviser or an affiliate of the Adviser. She is 47 years old and has been an employee of the Adviser since March 2013.
JEFF PRUSNOFSKY, Vice President and Assistant Secretary since August 2005.
Senior Managing Counsel of BNY Mellon. He is an officer of 56 investment companies (comprised of 130 portfolios) managed by the Adviser or an affiliate of the Adviser. He is 57 years old and has been an employee of the Adviser since October 1990.
AMANDA QUINN, Vice President and Assistant Secretary since March 2020.
Counsel of BNY Mellon since June 2019; Regulatory Administration Manager at BNY Mellon Investment Management Services from September 2018 to May 2019; and Senior Regulatory Specialist at BNY Mellon Investment Management Services from April 2015 to August 2018. She is an officer of 56 investment companies (comprised of 130 portfolios) managed by the Adviser or an affiliate of the Adviser. She is 37 years old and has been an employee of the Adviser since June 2019.
47
OFFICERS OF THE FUND (Unaudited) (continued)
NATALYA ZELENSKY, Vice President and Assistant Secretary since March 2017.
Chief Compliance Officer since August 2021 and Vice President since February 2020 of BNY Mellon ETF Investment Adviser, LLC; Chief Compliance Officer since August 2021 and Vice President and Assistant Secretary since February 2020 of BNY Mellon ETF Trust; Managing Counsel of BNY Mellon from December 2019 to August 2021; Counsel of BNY Mellon from May 2016 to December 2019; and Assistant Secretary of the Adviser from April 2018 to August 2021. She is an officer of 55 investment companies (comprised of 129 portfolios) managed by the Adviser or an affiliate of the Adviser. She is 37 years old and has been an employee of BNY Mellon since May 2016.
DANIEL GOLDSTEIN, Vice President since March 2022.
Vice President and Head of Product Development of North America Product, BNY Mellon Investment Management since January 2018; Co-Head of Product Management, Development & Oversight of North America Product, BNY Mellon Investment Management from January 2010 to January 2018; and Senior Vice President, Development & Oversight of North America Product, BNY Mellon Investment Management since 2010. He is an officer of 55 investment companies (comprised of 109 portfolios) managed by the Adviser or an affiliate of the Adviser. He is 53 years old and has been an employee of the Distributor since 1991.
JOSEPH MARTELLA, Vice President since March 2022.
Vice President and Head of Product Management of North America Product, BNY Mellon Investment Management since January 2018; Director of Product Research and Analytics of North America Product, BNY Mellon Investment Management from January 2010 to January 2018; and Senior Vice President of North America Product, BNY Mellon Investment Management since 2010. He is an officer of 55 investment companies (comprised of 109 portfolios) managed by the Adviser or an affiliate of the Adviser. He is 46 years old and has been an employee of the Distributor since 1999.
GAVIN C. REILLY, Assistant Treasurer since December 2005.
Tax Manager–BNY Mellon Fund Administration. He is an officer of 56 investment companies (comprised of 130 portfolios) managed by the Adviser or an affiliate of the Adviser. He is 54 years old and has been an employee of the Adviser since April 1991.
ROBERT SALVIOLO, Assistant Treasurer since July 2007.
Senior Accounting Manager–BNY Mellon Fund Administration. He is an officer of 56 investment companies (comprised of 130 portfolios) managed by the Adviser or an affiliate of the Adviser. He is 55 years old and has been an employee of the Adviser since June 1989.
ROBERT SVAGNA, Assistant Treasurer since December 2002.
Senior Accounting Manager–BNY Mellon Fund Administration. He is an officer of 56 investment companies (comprised of 130 portfolios) managed by the Adviser or an affiliate of the Adviser. He is 55 years old and has been an employee of the Adviser since November 1990.
JOSEPH W. CONNOLLY, Chief Compliance Officer since October 2004.
Chief Compliance Officer of the BNY Mellon Family of Funds and BNY Mellon Funds Trust since 2004; and Chief Compliance Officer of the Adviser from 2004 until June 2021. He is an officer of 55 investment companies (comprised of 115 portfolios) managed by the Adviser. He is 65 years old.
CARIDAD M. CAROSELLA, Anti-Money Laundering Compliance Officer since January 2016.
Anti-Money Laundering Compliance Officer of the BNY Mellon Family of Funds and BNY Mellon Funds Trust. She is an officer of 48 investment companies (comprised of 122 portfolios) managed by the Adviser or an affiliate of the Adviser. She is 54 years old and has been an employee of the Distributor since 1997.
48
This page intentionally left blank.
49
BNY Mellon Dynamic Total Return Fund
240 Greenwich Street
New York, NY 10286
Adviser
BNY Mellon Investment Adviser, Inc.
240 Greenwich Street
New York, NY 10286
Sub-Adviser
Newton Investment Management
North America, LLC
BNY Mellon Center
201 Washington Street
Boston, MA 02108
Custodian
The Bank of New York Mellon
240 Greenwich Street
New York, NY 10286
Transfer Agent &
Dividend Disbursing Agent
BNY Mellon Transfer, Inc.
240 Greenwich Street
New York, NY 10286
Distributor
BNY Mellon Securities Corporation
240 Greenwich Street
New York, NY 10286
| | |
Ticker Symbols: | Class A: AVGAX Class C: AVGCX Class I: AVGRX Class Y: AVGYX |
Telephone Call your financial representative or 1-800-373-9387
Mail The BNY Mellon Family of Funds, 144 Glenn Curtiss Boulevard, Uniondale, NY 11556-0144
E-mail Send your request to info@bnymellon.com
Internet Information can be viewed online or downloaded at www.im.bnymellon.com
The fund files its complete schedule of portfolio holdings with the Securities and Exchange Commission (“SEC”) for the first and third quarters of each fiscal year on Form N-PORT. The fund’s Forms N-PORT are available on the SEC’s website at www.sec.gov.
A description of the policies and procedures that the fund uses to determine how to vote proxies relating to portfolio securities and information regarding how the fund voted these proxies for the most recent 12-month period ended June 30 is available at www.im.bnymellon.com and on the SEC’s website at www.sec.gov and without charge, upon request, by calling 1-800-373-9387.
| | |
© 2022 BNY Mellon Securities Corporation
6140AR1022 | 
|
BNY Mellon Global Dynamic Bond Income Fund
| |
ANNUAL REPORT October 31, 2022 |
| |
Save time. Save paper. View your next shareholder report online as soon as it’s available. Log into www.im.bnymellon.com and sign up for eCommunications. It’s simple and only takes a few minutes. |
| |
The views expressed in this report reflect those of the portfolio manager(s) only through the end of the period covered and do not necessarily represent the views of BNY Mellon Investment Adviser, Inc. or any other person in the BNY Mellon Investment Adviser, Inc. organization. Any such views are subject to change at any time based upon market or other conditions and BNY Mellon Investment Adviser, Inc. disclaims any responsibility to update such views. These views may not be relied on as investment advice and, because investment decisions for a fund in the BNY Mellon Family of Funds are based on numerous factors, may not be relied on as an indication of trading intent on behalf of any fund in the BNY Mellon Family of Funds. |
| |
Not FDIC-Insured • Not Bank-Guaranteed • May Lose Value |
Contents
T H E F U N D
F O R M O R E I N F O R M AT I O N
Back Cover
DISCUSSION OF FUND PERFORMANCE (Unaudited)
For the period from November 1, 2021, through October 31, 2022, as provided by Paul Brain, Parmeshwar Chadha and Howard Cunningham, Portfolio Managers employed by the fund’s sub-adviser, Newton Investment Management Limited
Market and Fund Performance Overview
For the 12-month period ended October 31, 2022, the BNY Mellon Global Dynamic Bond Income Fund’s (the “fund”) Class A shares produced a total return of −11.66%, Class C shares returned −12.39%, Class I shares returned −11.45% and Class Y shares returned −11.30%.1 In comparison, the fund’s benchmark, the FTSE One-Month U.S. Treasury Bill Index (the “Index”), produced a total return of 0.84% for the same period.2
Global bond prices lost ground during the reporting period amid sharply rising inflation, tightening central bank policies, uncertainties related to Russia’s invasion of Ukraine and slowing global economic growth. The fund underperformed the Index, due in large part to high yield corporate bond exposure.
The Fund’s Investment Approach
The fund seeks total return (consisting of income and capital appreciation). To pursue its goal, the fund normally invests at least 80% of its net assets, plus any borrowings for investment purposes, in bonds and other instruments that provide investment exposure to global bond markets. The fund normally invests opportunistically in bonds and derivatives and other instruments that provide investment exposure to global bond and currency markets, in seeking to produce positive returns across economic cycles. The fund’s investments will be focused globally among the developed- and emerging-capital markets of the world. The fund ordinarily invests in at least three countries, and, at times, may invest a substantial portion of its assets in a single country. The fund seeks to provide a minimum average annual total return of USD 30-day Compounded SOFR plus 3%, before fees and expenses, over a five-year period. There can be no guarantee that the fund will be able to provide such returns and you may lose money by investing in the fund.
The fund’s portfolio managers employ a dynamic approach in allocating the fund’s assets globally, principally among government bonds, foreign country sovereign debt, debt obligations of supranational entities, emerging-market sovereign debt, investment-grade and high yield (“junk”) corporate instruments, and currencies. Under normal market conditions, the fund invests significantly (at least 40% of its net assets) in issuers organized or located outside the United States, whose primary listing exchange for securities is located outside the United States, and whose largest amount of revenues is derived from countries outside the United States or whose reporting currencies are other than U.S. dollars.
The fund’s portfolio managers have considerable latitude in allocating the fund’s investments and in selecting securities and derivative instruments to implement the fund’s investment approach. The fund, however, normally invests at least 10% of its net assets in each of government bonds, emerging-market sovereign debt, and investment-grade and high yield corporate instruments.
2
Interest Rate Hikes Undermine Global Markets
Global bond investors faced turbulent geopolitical, macroeconomic and market conditions during the reporting period. Inflationary pressures increased early in the period due to pandemic-related government stimulus and accommodative monetary policies, along with rising commodity prices and supply-chain bottlenecks. These pressures intensified in February 2022 when Russia attacked Ukraine, causing already elevated energy and commodity prices to spike higher, while prices for fixed-income securities and non-commodity-related equities sharply declined. Outbreaks of the Omicron variant of COVID-19 led to lockdowns of varying severity and duration across the globe, particularly in China, interrupting economic activity while adding to supply-chain strains and further exacerbating inflation.
Despite the risks to growth from war and pandemic, central banks felt compelled to act to try to curb rapidly rising inflation. Numerous rate increases took place globally, with more priced in by financial markets. Several central banks also began the process of quantitative tightening. As the period progressed, recessionary fears took center stage, stemming from the pressure of rising prices on consumers, together with declining consumer confidence and the secondary-order effects of rising interest rates on areas such as the housing market. These conditions produced a distinctly unfavorable backdrop for bonds, with no real safe havens. Global bond prices (as viewed in U.S. dollar terms) were further undermined by the steadily rising value of the U.S. dollar relative to most of the world’s currencies.
Underperformance Driven by High Yield Corporate Exposure
High yield corporate exposure produced the most significant underperformance relative to the Index, accounting for a majority of the fund’s total negative return. Within the high yield asset class, Asian exposure detracted most, led by issues from China-based real estate companies Shimao Group Holdings and KWG Group Holdings, and holdings in an Asian high yield ETF. Holdings in certain European high yield issuers—including SBB and Adler Group—undermined returns as well. Other high yield holdings generally performed reasonably well early in the period, but returns later turned negative. Among investment-grade corporates, detractors were skewed toward real estate holdings, such as Tritax Big Box REIT, Akelius Residential Property and Tesco Property Finance. Losses from holdings in U.S. Treasury bonds and Treasury Inflation-Protected Securities (TIPS), along with European and Australasian government bond holdings, were partly offset by profits on futures and options positions. Among emerging-markets holdings, securities from Colombia performed particularly poorly, and a local currency ETF detracted significantly. Smaller exposures to Ecuador and the Dominican Republic also had materially negative impacts.
During a period in which bond markets saw their worst returns in decades, with deeply negative returns from each of the four markets in which the fund invests, there were few positive performance factors. However, as mentioned above, short positions in bond futures in the United States, Germany, Italy and the UK did contribute positively, as did put options on U.S. Treasury futures. A handful of short-dated emerging-markets bonds in both local and hard currencies also eked out small, positive returns.
3
DISCUSSION OF FUND PERFORMANCE (Unaudited) (continued)
Increasing Duration While Reducing Economic Sensitivity
As of October 31, 2022, we are far more positive about the outlook for global bond markets for the next 12 months. Inflation appears to have peaked in some major markets and may fall back as base effects and the cumulative impact of recent and planned interest-rate increases slow economic activity. If so, developed-markets government bonds should find greater support. Such a shift should also help certain hard and local currency emerging-markets issuers, especially those benefiting from higher commodity prices. Within credit, investment-grade spreads have doubled over the past year and offer reasonable protection against a tougher economic outlook.
As rates have risen, we have slowly increased the fund’s duration, partly by reducing short positions in bond futures, but also by adding to holdings in government and investment-grade bonds. That said, we have plenty of scope to further raise the fund’s duration once we are persuaded that the peak in rates is at hand. Similarly, while we have nudged up exposure to commodity-rich emerging market sovereign bonds, we retain some fire power to invest in new issues. We have reduced fund exposure to the more economically sensitive high yield corporate bond market, including Asian and real estate holdings.
November 15, 2022
1 Total return includes reinvestment of dividends and any capital gains paid and does not take into consideration the maximum initial sales charge in the case of Class A shares or the applicable contingent deferred sales charge imposed on redemptions in the case of Class C shares. Had these charges been reflected, returns would have been lower. Class I and Class Y shares are not subject to any initial or deferred sales charge. The fund’s return reflects the absorption of certain fund expenses by BNY Mellon Investment Adviser, Inc. pursuant to an agreement in effect through March 1, 2023, at which time it may be extended, modified or terminated. Had these expenses not been absorbed, returns would have been lower. Past performance is no guarantee of future results.
2 Source: Lipper Inc. — The FTSE One-Month U.S. Treasury Bill Index consists of the last, one-month, Treasury bill month-end rates. The FTSE One-Month U.S. Treasury Bill Index measures return equivalents of yield averages. The instruments are not marked to market. Investors cannot invest directly in any index.
Bonds are subject generally to interest-rate, credit, liquidity and market risks, to varying degrees, all of which are more fully described in the fund’s prospectus. Generally, all other factors being equal, bond prices are inversely related to interest-rate changes, and rate increases can cause price declines.
Recent market risks include pandemic risks related to COVID-19. The effects of COVID-19 have contributed to increased volatility in global markets and will likely affect certain countries, companies, industries and market sectors more dramatically than others. To the extent the fund may overweight its investments in certain countries, companies, industries or market sectors, such positions will increase the fund’s exposure to risk of loss from adverse developments affecting those countries, companies, industries or sectors.
High yield bonds are subject to increased credit risk and are considered speculative in terms of the issuer’s perceived ability to continue making interest payments on a timely basis and to repay principal upon maturity.
Foreign bonds are subject to special risks, including exposure to currency fluctuations, changing political and economic conditions, and potentially less liquidity.
Investments in foreign currencies are subject to the risk that those currencies will decline in value relative to the U.S. dollar, or, in the case of hedged positions, that the U.S. dollar will decline relative to the currency being hedged. Currency rates in foreign countries may fluctuate significantly over short periods of time. A decline in the value of foreign currencies relative to the U.S. dollar will reduce the value of securities held by the fund and denominated in those currencies. The use of leverage may magnify the fund’s gains or losses. For derivatives with a leveraging component, adverse changes in the value or level of the underlying asset can result in a loss that is much greater than the original investment in the derivative.
The fund may at times invest a substantial portion of its assets in a single country.
The fund may, but is not required to, use derivative instruments. A small investment in derivatives could have a potentially large impact on the fund’s performance. The use of derivatives involves risks different from, or possibly greater than, the risks associated with investing directly in the underlying assets.
4
FUND PERFORMANCE (Unaudited)
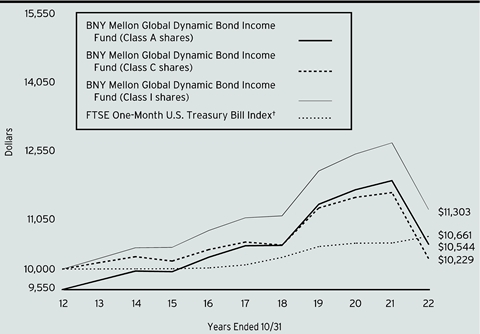
Comparison of change in value of a $10,000 investment in Class A shares, Class C shares, and Class I shares of BNY Mellon Global Dynamic Bond Income Fund with a hypothetical investment of $10,000 in the FTSE One-Month U.S. Treasury Bill Index (the “Index”).
† Source: Lipper Inc.
Past performance is not predictive of future performance.
The above graph compares a hypothetical investment of $10,000 made in each of the Class A shares, Class C shares, and Class I shares of BNY Mellon Global Dynamic Bond Income Fund on 10/31/12 to a hypothetical investment of $10,000 made in the Index on that date. All dividends and capital gain distributions are reinvested.
The fund’s performance shown in the line graph above takes into account the maximum initial sales charge on Class A shares and all other applicable fees and expenses on Class A shares, Class C shares, and Class I shares. The Index consists of the last one-month Treasury bill month-end rates. The FTSE One-Month U.S. Treasury Bill Index measures return equivalents of yield averages. The instruments are not marked to market. Unlike a mutual fund, the Index is not subject to charges, fees and other expenses. Investors cannot invest directly in any index. Further information relating to fund performance, including expense reimbursements, if applicable, is contained in the Financial Highlights section of the prospectus and elsewhere in this report.
5
FUND PERFORMANCE (Unaudited) (continued)
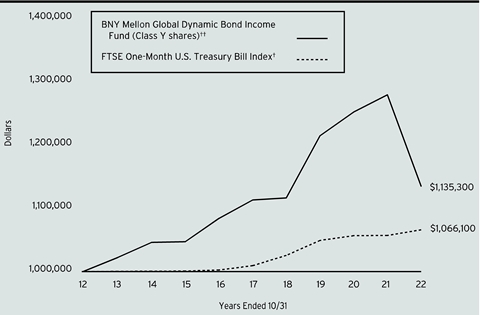
Comparison of change in value of a $1,000,000 investment in Class Y shares of BNY Mellon Global Dynamic Bond Income Fund with a hypothetical investment of $1,000,000 in the FTSE One-Month U.S. Treasury Bill Index (the “Index”).
† Source: Lipper Inc.
†† The total return figures presented for Class Y shares of the fund reflect the performance of the fund’s Class A shares for the period prior to 7/1/13 (the inception date for Class Y shares), not reflecting the applicable sales charges for Class A shares.
Past performance is not predictive of future performance.
The above graph compares a hypothetical investment of $1,000,000 made in Class Y shares of BNY Mellon Global Dynamic Bond Income Fund on 10/31/12 to a hypothetical investment of $1,000,000 made in the Index on that date. All dividends and capital gain distributions are reinvested.
The fund’s performance shown in the line graph above takes into account all applicable fees and expenses of the fund’s Class Y shares. The Index consists of the last one-month Treasury bill month-end rates. The FTSE One-Month U.S. Treasury Bill Index measures return equivalents of yield averages. The instruments are not marked to market. Unlike a mutual fund, the Index is not subject to charges, fees and other expenses. Investors cannot invest directly in any index. Further information relating to fund performance, including expense reimbursements, if applicable, is contained in the Financial Highlights section of the prospectus and elsewhere in this report.
6
| | | | | | |
Average Annual Total Returns as of 10/31/2022 |
| Inception
Date | 1 Year | 5 Years | 10 Years | |
Class A shares | | | | | |
with maximum sales charge (4.50%) | 3/25/11 | -15.64% | -.86% | .53% | |
without sales charge | 3/25/11 | -11.66% | .06% | .99% | |
Class C shares | | | | | |
with applicable redemption charge † | 3/25/11 | -13.25% | -.70% | .23% | |
without redemption | 3/25/11 | -12.39% | -.70% | .23% | |
Class I shares | 3/25/11 | -11.45% | .32% | 1.23% | |
Class Y shares | 7/1/13 | -11.30% | .39% | 1.28%†† | |
FTSE One-Month U.S. Treasury Bill Index | | .84% | 1.10% | .64% | |
† The maximum contingent deferred sales charge for Class C shares is 1% for shares redeemed within one year of the date of purchase.
†† The total return performance figures presented for Class Y shares of the fund reflect the performance of the fund’s Class A shares for the period prior to 7/1/13 (the inception date for Class Y shares), not reflecting the applicable sales charges for Class A shares.
The performance data quoted represents past performance, which is no guarantee of future results. Share price and investment return fluctuate and an investor’s shares may be worth more or less than original cost upon redemption. Current performance may be lower or higher than the performance quoted. Go to www.im.bnymellon.com for the fund’s most recent month-end returns.
The fund’s performance shown in the graphs and table does not reflect the deduction of taxes that a shareholder would pay on fund distributions or the redemption of fund shares. In addition to the performance of Class A shares shown with and without a maximum sales charge, the fund’s performance shown in the table takes into account all other applicable fees and expenses on all classes.
7
UNDERSTANDING YOUR FUND’S EXPENSES (Unaudited)
As a mutual fund investor, you pay ongoing expenses, such as management fees and other expenses. Using the information below, you can estimate how these expenses affect your investment and compare them with the expenses of other funds. You also may pay one-time transaction expenses, including sales charges (loads) and redemption fees, which are not shown in this section and would have resulted in higher total expenses. For more information, see your fund’s prospectus or talk to your financial adviser.
Review your fund’s expenses
The table below shows the expenses you would have paid on a $1,000 investment in BNY Mellon Global Dynamic Bond Income Fund from May 1, 2022 to October 31, 2022. It also shows how much a $1,000 investment would be worth at the close of the period, assuming actual returns and expenses.
| | | | | | | |
Expenses and Value of a $1,000 Investment | |
Assume actual returns for the six months ended October 31, 2022 | |
| | | | | | |
| | Class A | Class C | Class I | Class Y | |
Expenses paid per $1,000† | $5.13 | $8.78 | $3.91 | $3.03 | |
Ending value (after expenses) | $939.20 | $934.90 | $940.90 | $941.00 | |
COMPARING YOUR FUND’S EXPENSES WITH THOSE OF OTHER FUNDS (Unaudited)
Using the SEC’s method to compare expenses
The Securities and Exchange Commission (“SEC”) has established guidelines to help investors assess fund expenses. Per these guidelines, the table below shows your fund’s expenses based on a $1,000 investment, assuming a hypothetical 5% annualized return. You can use this information to compare the ongoing expenses (but not transaction expenses or total cost) of investing in the fund with those of other funds. All mutual fund shareholder reports will provide this information to help you make this comparison. Please note that you cannot use this information to estimate your actual ending account balance and expenses paid during the period.
| | | | | | | |
Expenses and Value of a $1,000 Investment | |
Assuming a hypothetical 5% annualized return for the six months ended October 31, 2022 | |
| | | | | | |
| | Class A | Class C | Class I | Class Y | |
Expenses paid per $1,000† | $5.35 | $9.15 | $4.08 | $3.16 | |
Ending value (after expenses) | $1,019.91 | $1,016.13 | $1,021.17 | $1,022.08 | |
† | Expenses are equal to the fund’s annualized expense ratio of 1.05% for Class A, 1.80% for Class C, .80% for Class I and .62% for Class Y, multiplied by the average account value over the period, multiplied by 184/365 (to reflect the one-half year period). |
8
STATEMENT OF INVESTMENTS
October 31, 2022
| | | | | | | | | | |
| |
Description | Coupon
Rate (%) | | Maturity Date | | Principal Amount ($) | a | Value ($) | |
Bonds and Notes - 90.3% | | | | | |
Australia - 4.5% | | | | | |
Australia, Bonds, Ser. 166 | AUD | 3.00 | | 11/21/2033 | | 3,485,000 | | 2,069,475 | |
Australia, Sr. Unscd. Bonds, Ser. 162 | AUD | 1.75 | | 6/21/2051 | | 4,220,000 | | 1,645,979 | |
Commonwealth Bank of Australia, Covered Bonds | | 3.21 | | 5/27/2025 | | 720,000 | b | 687,583 | |
National Australia Bank Ltd., Sr. Unscd. Notes | | 3.50 | | 6/9/2025 | | 700,000 | c | 673,022 | |
| | 5,076,059 | |
Austria - .1% | | | | | |
CA Immobilien Anlagen AG, Sr. Unscd. Notes | EUR | 0.88 | | 2/5/2027 | | 200,000 | | 151,264 | |
Azerbaijan - 1.3% | | | | | |
Azerbaijan, Sr. Unscd. Bonds | | 5.13 | | 9/1/2029 | | 843,000 | | 771,128 | |
Azerbaijan, Sr. Unscd. Notes | | 4.75 | | 3/18/2024 | | 734,000 | | 719,558 | |
| | 1,490,686 | |
Bahamas - .2% | | | | | |
Bahamas, Sr. Unscd. Notes | | 8.95 | | 10/15/2032 | | 390,000 | | 253,599 | |
Bahrain - .5% | | | | | |
Bahrain, Sr. Unscd. Notes | | 4.25 | | 1/25/2028 | | 691,000 | | 605,381 | |
Bermuda - .3% | | | | | |
Hiscox Ltd., Sr. Unscd. Notes | GBP | 6.00 | | 9/22/2027 | | 265,000 | | 297,831 | |
Bolivia - .6% | | | | | |
Bolivia, Sr. Unscd. Notes | | 4.50 | | 3/20/2028 | | 900,000 | | 715,500 | |
Brazil - .6% | | | | | |
Brazil Letras do Tesouro Nacional, Treasury Bills | BRL | 10.02 | | 1/1/2026 | | 5,000,000 | d | 678,753 | |
British Virgin - .1% | | | | | |
Greenland Global Investment Ltd., Gtd. Notes | | 6.13 | | 4/22/2023 | | 380,000 | | 125,400 | |
Canada - 3.8% | | | | | |
Canada, Bonds | CAD | 4.00 | | 12/1/2031 | | 2,590,015 | e | 2,339,673 | |
Canada Housing Trust No. 1, Govt. Gtd. Bonds | CAD | 2.35 | | 9/15/2023 | | 2,030,000 | b | 1,465,933 | |
First Quantum Minerals Ltd., Gtd. Notes | | 6.88 | | 3/1/2026 | | 530,000 | b | 498,688 | |
| | 4,304,294 | |
Cayman Islands - 1.2% | | | | | |
CSN Inova Ventures, Gtd. Notes | | 6.75 | | 1/28/2028 | | 329,000 | | 282,637 | |
KWG Group Holdings Ltd., Sr. Scd. Bonds | | 7.88 | | 8/30/2024 | | 260,000 | | 46,140 | |
Sable International Finance Ltd., Sr. Scd. Notes | | 5.75 | | 9/7/2027 | | 476,000 | b | 422,593 | |
9
STATEMENT OF INVESTMENTS (continued)
| | | | | | | | | | |
| |
Description | Coupon
Rate (%) | | Maturity Date | | Principal Amount ($) | a | Value ($) | |
Bonds and Notes - 90.3% (continued) | | | | | |
Cayman Islands - 1.2% (continued) | | | | | |
Shimao Group Holdings Ltd., Sr. Scd. Bonds | | 4.75 | | 8/3/2023 | | 465,000 | f | 24,521 | |
Wynn Macau Ltd., Sr. Unscd. Notes | | 5.50 | | 1/15/2026 | | 870,000 | | 604,650 | |
| | 1,380,541 | |
Chile - .3% | | | | | |
VTR Comunicaciones SPA, Sr. Scd. Notes | | 4.38 | | 4/15/2029 | | 703,000 | b | 394,801 | |
Colombia - 1.3% | | | | | |
Colombia, Bonds | COP | 6.00 | | 4/28/2028 | | 3,556,400,000 | | 514,353 | |
Colombia, Bonds | COP | 7.00 | | 6/30/2032 | | 7,236,300,000 | | 948,128 | |
| | 1,462,481 | |
Denmark - 1.7% | | | | | |
Denmark, Bonds | DKK | 2.96 | | 11/15/2031 | | 14,070,000 | | 1,490,220 | |
Orsted AS, Gtd. Notes | EUR | 3.25 | | 9/13/2031 | | 319,000 | | 303,735 | |
Orsted AS, Sub. Notes | GBP | 2.50 | | 2/18/2033 | | 132,000 | g | 95,134 | |
| | 1,889,089 | |
Dominican Republic - .6% | | | | | |
Dominican Republic, Sr. Unscd. Bonds | | 7.45 | | 4/30/2044 | | 750,000 | | 632,051 | |
Ecuador - .3% | | | | | |
Ecuador, Sr. Unscd. Notes | | 0.00 | | 7/31/2030 | | 64,221 | b,h | 20,283 | |
Ecuador, Sr. Unscd. Notes | | 1.50 | | 7/31/2040 | | 224,730 | b | 75,042 | |
Ecuador, Sr. Unscd. Notes | | 2.50 | | 7/31/2035 | | 490,347 | b | 181,671 | |
Ecuador, Sr. Unscd. Notes | | 5.50 | | 7/31/2030 | | 187,110 | b | 100,283 | |
| | 377,279 | |
El Salvador - .2% | | | | | |
El Salvador, Sr. Unscd. Notes | | 6.38 | | 1/18/2027 | | 633,000 | | 252,377 | |
Ethiopia - .2% | | | | | |
Ethiopia, Sr. Unscd. Notes | | 6.63 | | 12/11/2024 | | 382,000 | | 198,911 | |
France - 3.3% | | | | | |
Altice France SA, Sr. Scd. Notes | EUR | 3.38 | | 1/15/2028 | | 273,000 | | 208,261 | |
Banijay Entertainment Sasu, Sr. Scd. Bonds | EUR | 3.50 | | 3/1/2025 | | 694,000 | | 647,477 | |
BNP Paribas SA, Jr. Sub. Notes | | 7.38 | | 8/19/2025 | | 950,000 | g | 921,276 | |
Chrome Bidco SASU, Sr. Scd. Bonds | EUR | 3.50 | | 5/31/2028 | | 186,000 | | 149,480 | |
Cie de Saint-Gobain, Sr. Unscd. Notes | EUR | 1.63 | | 8/10/2025 | | 100,000 | | 94,222 | |
Electricite de France SA, Jr. Sub. Notes | GBP | 6.00 | | 1/29/2026 | | 200,000 | g | 188,964 | |
Iliad Holding SASU, Sr. Scd. Notes | EUR | 5.63 | | 10/15/2028 | | 313,000 | | 278,537 | |
Loxam SAS, Sr. Scd. Notes | EUR | 2.88 | | 4/15/2026 | | 530,000 | | 454,482 | |
Picard Groupe SAS, Sr. Scd. Bonds | EUR | 3.88 | | 7/1/2026 | | 447,000 | | 383,168 | |
Societe Generale SA, Jr. Sub. Bonds | | 7.88 | | 12/18/2023 | | 500,000 | g | 488,056 | |
| | 3,813,923 | |
10
| | | | | | | | | | |
| |
Description | Coupon
Rate (%) | | Maturity Date | | Principal Amount ($) | a | Value ($) | |
Bonds and Notes - 90.3% (continued) | | | | | |
Germany - 1.3% | | | | | |
Infineon Technologies AG, Jr. Sub. Bonds | EUR | 3.63 | | 1/1/2028 | | 400,000 | g | 342,243 | |
Infineon Technologies AG, Jr. Sub. Notes | EUR | 2.88 | | 1/1/2025 | | 400,000 | g | 364,247 | |
Peach Property Finance GmbH, Sr. Unscd. Notes | EUR | 4.38 | | 11/15/2025 | | 396,000 | | 283,727 | |
TK Elevator Midco GmbH, Sr. Scd. Bonds | EUR | 4.38 | | 7/15/2027 | | 563,000 | | 473,082 | |
| | 1,463,299 | |
India - .4% | | | | | |
GMR Hyderabad International Airport Ltd., Sr. Scd. Notes | | 4.25 | | 10/27/2027 | | 576,000 | | 455,040 | |
Indonesia - 2.2% | | | | | |
Indonesia, Bonds, Ser. FR81 | IDR | 6.50 | | 6/15/2025 | | 29,779,000,000 | | 1,890,334 | |
Indonesia, Sr. Unscd. Bonds | EUR | 1.75 | | 4/24/2025 | | 610,000 | | 566,138 | |
| | 2,456,472 | |
Ireland - 1.0% | | | | | |
Bank of Ireland Group PLC, Jr. Sub. Notes | EUR | 7.50 | | 5/19/2025 | | 280,000 | g | 270,495 | |
LCPR Senior Secured Financing DAC, Sr. Scd. Notes | | 5.13 | | 7/15/2029 | | 430,000 | b | 363,320 | |
Virgin Media Vendor Financing Notes III DAC, Gtd. Bonds | GBP | 4.88 | | 7/15/2028 | | 530,000 | | 488,945 | |
| | 1,122,760 | |
Italy - 1.8% | | | | | |
Cedacri Mergeco SPA, Sr. Scd. Notes, 3 Month EURIBOR +4.63% | EUR | 4.95 | | 5/15/2028 | | 204,000 | i | 187,869 | |
FIS Fabbrica Italiana Sintetici SPA, Sr. Scd. Bonds | EUR | 5.63 | | 8/1/2027 | | 630,000 | | 482,552 | |
Leather 2 SPA, Sr. Scd. Bonds, 3 Month EURIBOR +4.50% | EUR | 5.69 | | 9/30/2028 | | 380,000 | i | 265,022 | |
Nexi SPA, Sr. Unscd. Notes | EUR | 1.63 | | 4/30/2026 | | 249,000 | | 220,458 | |
UniCredit SPA, Jr. Sub. Bonds | | 8.00 | | 6/3/2024 | | 560,000 | g | 525,350 | |
UniCredit SPA, Jr. Sub. Notes | EUR | 3.88 | | 6/3/2027 | | 600,000 | g | 421,878 | |
| | 2,103,129 | |
Japan - .4% | | | | | |
Softbank Group Corp., Sr. Unscd. Notes | EUR | 2.88 | | 1/6/2027 | | 610,000 | | 489,470 | |
Jersey - .5% | | | | | |
CPUK Finance Ltd., Scd. Notes | GBP | 4.88 | | 8/28/2025 | | 500,000 | | 520,986 | |
Luxembourg - 3.5% | | | | | |
4finance SA, Gtd. Bonds | EUR | 10.75 | | 10/26/2026 | | 400,000 | | 353,477 | |
Adler Group SA, Sr. Unscd. Notes | EUR | 2.25 | | 4/27/2027 | | 300,000 | | 127,484 | |
Adler Group SA, Sr. Unscd. Notes | EUR | 3.25 | | 8/5/2025 | | 300,000 | c | 135,971 | |
11
STATEMENT OF INVESTMENTS (continued)
| | | | | | | | | | |
| |
Description | Coupon
Rate (%) | | Maturity Date | | Principal Amount ($) | a | Value ($) | |
Bonds and Notes - 90.3% (continued) | | | | | |
Luxembourg - 3.5% (continued) | | | | | |
Albion Financing 1 Sarl, Sr. Scd. Notes | EUR | 5.25 | | 10/15/2026 | | 119,000 | | 101,355 | |
Altice Financing SA, Sr. Scd. Bonds | EUR | 3.00 | | 1/15/2028 | | 340,000 | | 257,867 | |
AnaCap Financial Europe SA, Sr. Scd. Notes, 3 Month EURIBOR +5.00% | EUR | 6.64 | | 8/1/2024 | | 400,000 | c,i | 334,997 | |
CBRE Global Investors Open-Ended Fund SCA SICAV-SIF Pan European Core Fund, Sr. Unscd. Notes | EUR | 0.50 | | 1/27/2028 | | 464,000 | | 344,365 | |
Cirsa Finance International Sarl, Sr. Scd. Bonds | EUR | 4.75 | | 5/22/2025 | | 492,000 | | 454,863 | |
Dana Financing Luxembourg Sarl, Gtd. Notes | EUR | 3.00 | | 7/15/2029 | | 618,000 | | 488,658 | |
Kleopatra Finco Sarl, Sr. Scd. Bonds | EUR | 4.25 | | 3/1/2026 | | 410,000 | | 335,025 | |
Matterhorn Telecom SA, Sr. Scd. Notes | EUR | 3.13 | | 9/15/2026 | | 339,000 | | 295,049 | |
Millicom International Cellular SA, Sr. Unscd. Notes | | 4.50 | | 4/27/2031 | | 201,000 | b | 151,175 | |
Millicom International Cellular SA, Sr. Unscd. Notes | | 4.50 | | 4/27/2031 | | 450,000 | | 338,452 | |
Sani/Ikos Financial Holdings 1 Sarl, Sr. Scd. Bonds | EUR | 5.63 | | 12/15/2026 | | 325,000 | | 299,469 | |
| | 4,018,207 | |
Malaysia - .5% | | | | | |
Malaysia, Bonds, Ser. 419 | MYR | 3.83 | | 7/5/2034 | | 2,780,000 | | 543,790 | |
Mexico - 3.2% | | | | | |
Cemex SAB de CV, Gtd. Notes | | 3.88 | | 7/11/2031 | | 1,000,000 | | 777,585 | |
Mexico, Bonds, Ser. M | MXN | 7.75 | | 5/29/2031 | | 25,000,000 | | 1,111,932 | |
Mexico, Sr. Unscd. Bonds, Ser. M20 | MXN | 8.50 | | 5/31/2029 | | 25,000,000 | | 1,182,071 | |
Sigma Alimentos SA de CV, Gtd. Bonds | EUR | 2.63 | | 2/7/2024 | | 536,000 | | 518,842 | |
| | 3,590,430 | |
Mongolia - .5% | | | | | |
Mongolia, Sr. Unscd. Bonds | | 5.13 | | 4/7/2026 | | 720,000 | | 558,042 | |
Mozambique - .2% | | | | | |
Mozambique, Unscd. Notes | | 5.00 | | 9/15/2031 | | 414,000 | | 283,251 | |
Netherlands - 3.5% | | | | | |
IHS Netherlands Holdco BV, Gtd. Notes | | 8.00 | | 9/18/2027 | | 410,000 | | 320,493 | |
ING Groep NV, Jr. Sub. Bonds | | 6.75 | | 4/16/2024 | | 1,050,000 | g | 996,844 | |
Nobel Bidco BV, Sr. Scd. Bonds | EUR | 3.13 | | 6/15/2028 | | 445,000 | | 263,869 | |
Nobian Finance BV, Sr. Scd. Bonds | EUR | 3.63 | | 7/15/2026 | | 417,000 | | 316,261 | |
Telefonica Europe BV, Gtd. Notes | EUR | 4.38 | | 12/14/2024 | | 400,000 | g | 379,192 | |
United Group BV, Sr. Scd. Notes | EUR | 4.88 | | 7/1/2024 | | 347,000 | | 328,342 | |
12
| | | | | | | | | | |
| |
Description | Coupon
Rate (%) | | Maturity Date | | Principal Amount ($) | a | Value ($) | |
Bonds and Notes - 90.3% (continued) | | | | | |
Netherlands - 3.5% (continued) | | | | | |
United Group BV, Sr. Scd. Notes, 3 Month EURIBOR +4.13% | EUR | 4.45 | | 5/15/2025 | | 370,000 | i | 348,298 | |
Universal Music Group NV, Sr. Unscd. Notes | EUR | 3.00 | | 6/30/2027 | | 620,000 | | 591,478 | |
Volkswagen International Finance NV, Gtd. Notes | EUR | 3.88 | | 6/17/2029 | | 600,000 | g | 496,702 | |
| | 4,041,479 | |
New Zealand - 4.2% | | | | | |
New Zealand, Bonds, Ser. 437 | NZD | 2.75 | | 4/15/2037 | | 2,670,000 | | 1,284,014 | |
New Zealand, Bonds, Ser. 551 | NZD | 2.75 | | 5/15/2051 | | 3,230,000 | | 1,371,303 | |
New Zealand, Bonds, Ser. 930 | NZD | 3.00 | | 9/20/2030 | | 2,170,000 | e | 1,613,603 | |
New Zealand , Govt. Gtd. Bonds | NZD | 2.25 | | 4/15/2024 | | 1,020,000 | | 568,877 | |
| | 4,837,797 | |
Norway - .8% | | | | | |
Kommunalbanken AS, Sr. Unscd. Bonds, 3 Month SOFR +1.00% | | 3.96 | | 6/17/2026 | | 898,000 | i | 915,110 | |
Oman - .4% | | | | | |
Oman, Sr. Unscd. Notes | | 4.88 | | 2/1/2025 | | 444,000 | | 432,589 | |
Qatar - .6% | | | | | |
Qatar, Sr. Unscd. Notes | | 3.40 | | 4/16/2025 | | 672,000 | | 649,217 | |
Saudi Arabia - .5% | | | | | |
Saudi, Sr. Unscd. Notes | | 5.50 | | 10/25/2032 | | 614,000 | | 622,826 | |
Singapore - .3% | | | | | |
Singapore Airlines Ltd., Sr. Unscd. Notes | | 3.00 | | 7/20/2026 | | 328,000 | | 298,785 | |
South Africa - 1.9% | | | | | |
South Africa, Sr. Unscd. Bonds, Ser. 2030 | ZAR | 8.00 | | 1/31/2030 | | 23,630,000 | | 1,104,717 | |
South Africa , Sr. Unscd. Notes | | 4.85 | | 9/30/2029 | | 1,240,000 | | 1,056,430 | |
| | 2,161,147 | |
Spain - 1.5% | | | | | |
Banco Santander SA, Jr. Sub. Bonds | EUR | 5.25 | | 9/29/2023 | | 400,000 | g | 368,167 | |
eDreams ODIGEO SA, Sr. Scd. Notes | EUR | 5.50 | | 7/15/2027 | | 340,000 | | 266,985 | |
Lorca Telecom Bondco SA, Sr. Scd. Bonds | EUR | 4.00 | | 9/18/2027 | | 531,000 | | 468,349 | |
Spain, Sr. Unscd. Bonds | EUR | 1.90 | | 10/31/2052 | | 970,000 | b | 644,898 | |
| | 1,748,399 | |
Supranational - 6.5% | | | | | |
Asian Development Bank, Sr. Unscd. Notes | CNH | 2.72 | | 1/16/2023 | | 11,000,000 | | 1,498,236 | |
Asian Development Bank, Sr. Unscd. Notes | CNH | 2.90 | | 3/5/2024 | | 5,500,000 | | 754,493 | |
Clarios Global LP, Sr. Scd. Bonds | EUR | 4.38 | | 5/15/2026 | | 555,000 | | 514,336 | |
13
STATEMENT OF INVESTMENTS (continued)
| | | | | | | | | | |
| |
Description | Coupon
Rate (%) | | Maturity Date | | Principal Amount ($) | a | Value ($) | |
Bonds and Notes - 90.3% (continued) | | | | | |
Supranational - 6.5% (continued) | | | | | |
European Bank for Reconstruction & Development, Sr. Unscd. Notes | IDR | 6.45 | | 12/13/2022 | | 22,546,700,000 | | 1,445,750 | |
European Union, Sr. Unscd. Notes | EUR | 0.45 | | 7/4/2041 | | 1,444,594 | | 863,405 | |
International Bank for Reconstruction & Development, Sr. Unscd. Notes, 3 Month SOFR +0.29% | | 3.02 | | 11/22/2028 | | 1,240,000 | i | 1,229,272 | |
International Finance Corp., Sr. Unscd. Notes | INR | 6.30 | | 11/25/2024 | | 98,010,000 | | 1,149,651 | |
| | 7,455,143 | |
Sweden - 1.1% | | | | | |
Akelius Residential Property AB, Jr. Sub. Notes | EUR | 2.25 | | 5/17/2081 | | 640,000 | | 475,747 | |
Heimstaden Bostad AB, Jr. Sub. Bonds | EUR | 2.63 | | 2/1/2027 | | 450,000 | g | 231,838 | |
Samhallsbyggnadsbolaget i Norden AB, Jr. Sub. Notes | EUR | 2.63 | | 12/14/2025 | | 455,000 | g | 159,119 | |
Verisure Holding AB, Sr. Scd. Bonds | EUR | 3.25 | | 2/15/2027 | | 424,000 | | 357,429 | |
| | 1,224,133 | |
Switzerland - .4% | | | | | |
Credit Suisse Group AG, Jr. Sub. Notes | | 7.25 | | 9/12/2025 | | 520,000 | g | 407,238 | |
Tajikistan - .2% | | | | | |
Tajikistan, Sr. Unscd. Notes | | 7.13 | | 9/14/2027 | | 375,000 | | 241,265 | |
Tunisia - .2% | | | | | |
Tunisian Republic, Sr. Unscd. Notes | | 5.75 | | 1/30/2025 | | 440,000 | | 279,126 | |
United Arab Emirates - .6% | | | | | |
MDGH GMTN RSC Ltd., Gtd. Notes | | 5.50 | | 4/28/2033 | | 668,000 | | 665,054 | |
United Kingdom - 11.8% | | | | | |
BCP V Modular Services Finance II PLC, Sr. Scd. Bonds | EUR | 4.75 | | 11/30/2028 | | 296,000 | | 242,404 | |
Bellis Acquisition Co., Sr. Scd. Bonds | GBP | 3.25 | | 2/16/2026 | | 249,000 | | 233,428 | |
Close Brothers Finance PLC, Gtd. Notes | GBP | 2.75 | | 10/19/2026 | | 510,000 | | 521,916 | |
Coventry Building Society, Jr. Sub. Bonds | GBP | 6.88 | | 9/18/2024 | | 650,000 | g | 683,350 | |
Coventry Building Society, Sr. Unscd. Notes | GBP | 1.00 | | 9/21/2025 | | 468,000 | | 474,480 | |
Deuce Finco PLC, Sr. Scd. Bonds | GBP | 5.50 | | 6/15/2027 | | 406,000 | | 358,271 | |
Drax Finco PLC, Sr. Scd. Notes | | 6.63 | | 11/1/2025 | | 593,000 | | 552,299 | |
EG Global Finance PLC, Sr. Scd. Notes | EUR | 4.38 | | 2/7/2025 | | 491,000 | | 418,504 | |
Heathrow Finance PLC, Sr. Scd. Notes | GBP | 5.75 | | 3/3/2025 | | 266,000 | | 285,664 | |
Iceland Bondco PLC, Sr. Scd. Notes | GBP | 4.63 | | 3/15/2025 | | 350,000 | c | 319,310 | |
14
| | | | | | | | | | |
| |
Description | Coupon
Rate (%) | | Maturity Date | | Principal Amount ($) | a | Value ($) | |
Bonds and Notes - 90.3% (continued) | | | | | |
United Kingdom - 11.8% (continued) | | | | | |
International Finance Facility for Immunisation Co., Sr. Unscd. Notes | | 1.00 | | 4/21/2026 | | 869,000 | | 767,869 | |
Investec PLC, Jr. Sub. Notes | GBP | 6.75 | | 12/5/2024 | | 400,000 | g | 397,825 | |
Iron Mountain UK PLC, Gtd. Notes | GBP | 3.88 | | 11/15/2025 | | 289,000 | | 297,662 | |
Jerrold Finco PLC, Sr. Scd. Bonds | GBP | 4.88 | | 1/15/2026 | | 165,000 | | 157,291 | |
Jerrold Finco PLC, Sr. Scd. Bonds | GBP | 5.25 | | 1/15/2027 | | 375,000 | | 340,193 | |
Lloyds Banking Group PLC, Jr. Sub. Bonds | EUR | 4.95 | | 6/27/2025 | | 550,000 | g | 506,033 | |
Lloyds Banking Group PLC, Jr. Sub. Notes | GBP | 5.13 | | 12/27/2024 | | 560,000 | g | 564,340 | |
Mitchells & Butlers Finance PLC, Scd. Bonds, Ser. B2 | GBP | 6.01 | | 12/15/2028 | | 399,895 | | 424,982 | |
National Express Group PLC, Gtd. Notes | GBP | 2.38 | | 11/20/2028 | | 644,000 | | 597,124 | |
National Express Group PLC, Gtd. Notes | GBP | 2.50 | | 11/11/2023 | | 620,000 | | 691,213 | |
National Express Group PLC, Sub. Notes | GBP | 4.25 | | 11/26/2025 | | 160,000 | g | 143,848 | |
Nationwide Building Society, Jr. Sub. Bonds | GBP | 5.88 | | 12/20/2024 | | 416,000 | g | 429,362 | |
NatWest Group PLC, Jr. Sub. Bonds | | 8.00 | | 8/10/2025 | | 250,000 | g | 236,219 | |
Ocado Group PLC, Gtd. Notes | GBP | 3.88 | | 10/8/2026 | | 534,000 | | 449,863 | |
Stonegate Pub Co. Financing PLC, Sr. Scd. Bonds | GBP | 8.25 | | 7/31/2025 | | 303,000 | | 315,478 | |
TESCO PLC, Sr. Unscd. Notes | GBP | 3.32 | | 11/5/2025 | | 160,000 | e | 396,521 | |
Tesco Property Finance 3 PLC, Sr. Scd. Bonds | GBP | 5.74 | | 4/13/2040 | | 349,903 | | 366,651 | |
Travis Perkins PLC, Sr. Unscd. Notes | GBP | 3.75 | | 2/17/2026 | | 163,000 | | 161,459 | |
Tritax Big Box REIT PLC, Sr. Unscd. Notes | GBP | 1.50 | | 11/27/2033 | | 389,000 | | 281,944 | |
Tritax EuroBox PLC, Gtd. Notes | EUR | 0.95 | | 6/2/2026 | | 626,000 | | 498,934 | |
Virgin Money UK PLC, Sr. Unscd. Notes | GBP | 3.13 | | 6/22/2025 | | 680,000 | | 726,734 | |
Vodafone Group PLC, Jr. Sub. Notes | | 3.25 | | 6/4/2081 | | 680,000 | | 546,332 | |
| | 13,387,503 | |
United States - 18.1% | | | | | |
American Express Co., Sr. Unscd. Notes | | 3.38 | | 5/3/2024 | | 1,190,000 | | 1,154,582 | |
Apple Inc., Sr. Unscd. Notes | | 1.13 | | 5/11/2025 | | 804,000 | | 735,629 | |
AT&T Inc., Sr. Unscd. Notes | GBP | 2.90 | | 12/4/2026 | | 470,000 | | 488,641 | |
Ball Corp., Gtd. Notes | | 2.88 | | 8/15/2030 | | 470,000 | | 365,801 | |
Best Buy Co., Sr. Unscd. Notes | | 4.45 | | 10/1/2028 | | 398,000 | | 369,508 | |
Callon Petroleum Co., Gtd. Notes | | 8.00 | | 8/1/2028 | | 450,000 | b | 449,446 | |
Chesapeake Energy Corp., Gtd. Notes | | 6.75 | | 4/15/2029 | | 395,000 | b | 387,394 | |
15
STATEMENT OF INVESTMENTS (continued)
| | | | | | | | | | |
| |
Description | Coupon
Rate (%) | | Maturity Date | | Principal Amount ($) | a | Value ($) | |
Bonds and Notes - 90.3% (continued) | | | | | |
United States - 18.1% (continued) | | | | | |
Citigroup Inc., Sub. Notes | | 5.50 | | 9/13/2025 | | 820,000 | | 813,361 | |
Diamond Sports Group LLC, Scd. Notes | | 5.38 | | 8/15/2026 | | 620,000 | b | 124,775 | |
Dollar General Corp., Sr. Unscd. Notes | | 4.63 | | 11/1/2027 | | 340,000 | | 328,592 | |
Ford Motor Credit Co., Sr. Unscd. Notes | GBP | 2.75 | | 6/14/2024 | | 232,000 | | 246,892 | |
General Electric Co., Sr. Unscd. Notes | GBP | 6.44 | | 11/15/2022 | | 2,567 | | 2,942 | |
Graphic Packaging International LLC, Gtd. Bonds | EUR | 2.63 | | 2/1/2029 | | 121,000 | | 97,913 | |
IQVIA Inc., Gtd. Notes | EUR | 2.88 | | 6/15/2028 | | 622,000 | | 542,492 | |
JPMorgan Chase & Co., Sr. Unscd. Notes | | 2.08 | | 4/22/2026 | | 1,180,000 | | 1,074,806 | |
Lowe's Cos., Sr. Unscd. Notes | | 3.00 | | 10/15/2050 | | 540,000 | | 324,122 | |
Medline Borrower LP, Sr. Scd. Notes | | 3.88 | | 4/1/2029 | | 281,000 | b | 230,041 | |
Medline Borrower LP, Sr. Unscd. Notes | | 5.25 | | 10/1/2029 | | 122,000 | b,c | 95,222 | |
Metropolitan Life Global Funding I, Sr. Scd. Notes, 3 Month SOFR +0.91% | | 3.93 | | 3/21/2025 | | 373,000 | b,i | 370,229 | |
Mpt Operating Partnership LP, Gtd. Notes | GBP | 2.55 | | 12/5/2023 | | 340,000 | | 361,693 | |
Netflix Inc., Sr. Unscd. Notes | EUR | 3.63 | | 6/15/2030 | | 575,000 | | 517,287 | |
Olympus Water US Holding Corp., Sr. Scd. Notes | EUR | 3.88 | | 10/1/2028 | | 200,000 | | 149,025 | |
Olympus Water US Holding Corp., Sr. Unscd. Notes | EUR | 5.38 | | 10/1/2029 | | 475,000 | | 333,388 | |
PG&E Corp., Sr. Scd. Notes | | 5.00 | | 7/1/2028 | | 500,000 | | 451,900 | |
U.S. Treasury Bonds | | 3.00 | | 11/15/2045 | | 4,460,000 | | 3,515,734 | |
U.S. Treasury Inflation Indexed Bonds | | 2.13 | | 2/15/2041 | | 1,130,226 | e | 1,180,805 | |
U.S. Treasury Inflation Indexed Notes | | 0.13 | | 4/15/2027 | | 3,923,110 | c,e | 3,660,066 | |
Verizon Communications Inc., Sr. Unscd. Notes, 3 Month SOFR +0.79% | | 3.79 | | 3/20/2026 | | 491,000 | i | 479,333 | |
Warnermedia Holdings Inc., Gtd. Notes | | 3.79 | | 3/15/2025 | | 820,000 | b | 773,610 | |
Windstream Escrow LLC, Sr. Scd. Notes | | 7.75 | | 8/15/2028 | | 492,000 | b | 427,093 | |
Zayo Group Holdings Inc., Sr. Scd. Notes | | 4.00 | | 3/1/2027 | | 660,000 | b | 511,061 | |
| | 20,563,383 | |
Uzbekistan - .9% | | | | | |
Uzbekistan, Sr. Unscd. Notes | | 4.75 | | 2/20/2024 | | 1,080,000 | | 1,031,265 | |
16
| | | | | | | | | | |
| |
Description | Coupon
Rate (%) | | Maturity Date | | Principal Amount ($) | a | Value ($) | |
Bonds and Notes - 90.3% (continued) | | | | | |
Vietnam - .2% | | | | | |
Vietnam, Sr. Unscd. Bonds | | 4.80 | | 11/19/2024 | | 213,000 | | 206,077 | |
Total Bonds and Notes
(cost $127,707,339) | | 102,872,632 | |
Description /Number of Contracts | Exercise
Price | | Expiration Date | | Notional Amount ($) | | | |
Options Purchased - .1% | | | | | |
Put Options - .1% | | | | | |
U.S Treasury 10 Year December Future, Contracts 165
(cost $160,107) | | 110.00 | | 11/25/2022 | | 1,815,000,000 | | 136,641 | |
Description | | | | | Shares | | | |
Exchange-Traded Funds - 3.1% | | | | | |
Singapore - 1.5% | | | | | |
iShares USD Asia High Yield Bond Index ETF | | | | | | 325,655 | | 1,683,490 | |
United States - 1.6% | | | | | |
SPDR Bloomberg Emerging Markets Local Bond ETF | | | | | | 98,232 | | 1,850,691 | |
Total Exchange-Traded Funds
(cost $4,927,098) | | 3,534,181 | |
| | 1-Day
Yield (%) | | | | | | | |
Investment Companies - .9% | | | | | |
Registered Investment Companies - .9% | | | | | |
Dreyfus Institutional Preferred Government Plus Money Market Fund, Institutional Shares
(cost $956,603) | | 3.23 | | | | 956,603 | j | 956,603 | |
17
STATEMENT OF INVESTMENTS (continued)
| | | | | | | | | | |
| |
Description | 1-Day
Yield (%) | | | | Shares | | Value ($) | |
Investment of Cash Collateral for Securities Loaned - 4.0% | | | | | |
Registered Investment Companies - 4.0% | | | | | |
Dreyfus Institutional Preferred Government Plus Money Market Fund, SL Shares
(cost $4,553,899) | | 3.23 | | | | 4,553,899 | j | 4,553,899 | |
Total Investments (cost $138,305,046) | | 98.4% | 112,053,956 | |
Cash and Receivables (Net) | | 1.6% | 1,873,224 | |
Net Assets | | 100.0% | 113,927,180 | |
ETF—Exchange-Traded Fund
EURIBOR—Euro Interbank Offered Rate
REIT—Real Estate Investment Trust
SOFR—Secured Overnight Financing Rate
SPDR—Standard & Poor's Depository Receipt
AUD—Australian Dollar
BRL—Brazilian Real
CAD—Canadian Dollar
COP—Colombian Peso
DKK—Danish Krone
EUR—Euro
GBP—British Pound
IDR—Indonesian Rupiah
INR—Indian Rupee
MXN—Mexican Peso
MYR—Malaysian Ringgit
NZD—New Zealand Dollar
ZAR—South African Rand
a Amount stated in U.S. Dollars unless otherwise noted above.
b Security exempt from registration pursuant to Rule 144A under the Securities Act of 1933. These securities may be resold in transactions exempt from registration, normally to qualified institutional buyers. At October 31, 2022, these securities were valued at $8,375,141 or 7.35% of net assets.
c Security, or portion thereof, on loan. At October 31, 2022, the value of the fund’s securities on loan was $4,992,082 and the value of the collateral was $5,362,880, consisting of cash collateral of $4,553,899 and U.S. Government & Agency securities valued at $808,981. In addition, the value of collateral may include pending sales that are also on loan.
d Security is a discount security. Income is recognized through the accretion of discount.
e Principal amount for accrual purposes is periodically adjusted based on changes in the Consumer Price Index.
f Non-income producing—security in default.
g Security is a perpetual bond with no specified maturity date. Maturity date shown is next reset date of the bond.
h Security issued with a zero coupon. Income is recognized through the accretion of discount.
i Variable rate security—interest rate resets periodically and rate shown is the interest rate in effect at period end. Security description also includes the reference rate and spread if published and available.
j Investment in affiliated issuer. The investment objective of this investment company is publicly available and can be found within the investment company’s prospectus.
18
| | |
Portfolio Summary (Unaudited) † | Value (%) |
Foreign Governmental | 30.4 |
Banks | 10.7 |
Investment Companies | 8.0 |
U.S. Treasury Securities | 7.3 |
Supranational Bank | 6.0 |
Telecommunication Services | 4.8 |
Consumer Discretionary | 4.1 |
Real Estate | 3.1 |
Diversified Financials | 2.9 |
Food Products | 2.0 |
Retailing | 1.9 |
Automobiles & Components | 1.8 |
Media | 1.4 |
Utilities | 1.4 |
Industrial | 1.4 |
Internet Software & Services | 1.3 |
Transportation | 1.3 |
Commercial & Professional Services | 1.2 |
Chemicals | 1.1 |
Health Care | .9 |
Building Materials | .8 |
Energy | .7 |
Materials | .7 |
Metals & Mining | .7 |
Technology Hardware & Equipment | .7 |
Semiconductors & Semiconductor Equipment | .6 |
Insurance | .6 |
Airlines | .3 |
Information Technology | .2 |
Options Purchased | .1 |
| | 98.4 |
† Based on net assets.
See notes to financial statements.
19
STATEMENT OF INVESTMENTS (continued)
| | | | | | | |
Affiliated Issuers | | | |
Description | Value ($) 10/31/2021 | Purchases ($)† | Sales ($) | Value ($) 10/31/2022 | Dividends/
Distributions ($) | |
Registered Investment Companies - .9% | | |
Dreyfus Institutional Preferred Government Plus Money Market Fund, Institutional Shares - .8% | 7,554,811 | 80,886,249 | (87,484,457) | 956,603 | 28,839 | |
Investment of Cash Collateral for Securities Loaned - 4.0% | | |
Dreyfus Institutional Preferred Government Plus Money Market Fund, SL Shares - 4.0% | 1,458,222 | 53,977,433 | (50,881,756) | 4,553,899 | 52,971 | †† |
Total - 4.9% | 9,013,033 | 134,863,682 | (138,366,213) | 5,510,502 | 81,810 | |
† Includes reinvested dividends/distributions.
†† Represents securities lending income earned from the reinvestment of cash collateral from loaned securities, net of fees and collateral investment expenses, and other payments to and from borrowers of securities.
See notes to financial statements.
| | | | | | | |
Futures | | | |
Description | Number of
Contracts | Expiration | Notional
Value ($) | Market
Value ($) | Unrealized Appreciation (Depreciation) ($) | |
Futures Long | | |
U.S. Treasury 10 Year Notes | 10 | 12/20/2022 | 1,138,779 | 1,105,938 | (32,841) | |
U.S. Treasury 5 Year Notes | 19 | 12/30/2022 | 2,107,567 | 2,025,281 | (82,286) | |
Futures Short | | |
Euro BTP Italian Government Bond | 29 | 12/8/2022 | 3,300,395a | 3,285,783 | 14,612 | |
Euro-Schatz | 145 | 12/8/2022 | 15,419,614a | 15,323,384 | 96,230 | |
Long Gilt | 18 | 12/28/2022 | 2,066,119a | 2,108,208 | (42,089) | |
Gross Unrealized Appreciation | | 110,842 | |
Gross Unrealized Depreciation | | (157,216) | |
a Notional amounts in foreign currency have been converted to USD using relevant foreign exchange rates.
See notes to financial statements.
20
| | | | | | |
Forward Foreign Currency Exchange Contracts | |
Counterparty/ Purchased
Currency | Purchased Currency
Amounts | Currency
Sold | Sold
Currency
Amounts | Settlement Date | Unrealized Appreciation (Depreciation) ($) |
CIBC World Markets Corp. |
Norwegian Krone | 17,938,308 | United States Dollar | 1,890,656 | 11/16/2022 | (164,308) |
Euro | 358,112 | United States Dollar | 372,746 | 11/16/2022 | (18,444) |
United States Dollar | 1,059,508 | Euro | 1,040,916 | 11/16/2022 | 29,667 |
Danish Krone | 840,000 | United States Dollar | 110,157 | 11/16/2022 | 1,469 |
Canadian Dollar | 3,068,524 | United States Dollar | 2,255,423 | 11/16/2022 | (2,898) |
United States Dollar | 8,614,476 | Canadian Dollar | 11,004,456 | 11/16/2022 | 536,387 |
United States Dollar | 202,847 | British Pound | 180,000 | 11/16/2022 | (3,666) |
Australian Dollar | 390,000 | United States Dollar | 253,272 | 11/16/2022 | (3,696) |
New Zealand Dollar | 1,643,112 | United States Dollar | 932,103 | 11/16/2022 | 23,468 |
United States Dollar | 4,827,342 | New Zealand Dollar | 7,552,055 | 11/16/2022 | 435,354 |
Citigroup Global Markets Inc. |
United States Dollar | 1,855,640 | Czech Koruna | 45,838,812 | 11/16/2022 | 7,357 |
United States Dollar | 4,838,223 | Indonesian Rupiah | 71,546,178,458 | 11/16/2022 | 252,487 |
United States Dollar | 1,267,081 | Polish Zloty | 5,815,055 | 11/16/2022 | 51,309 |
Canadian Dollar | 1,670,595 | United States Dollar | 1,239,097 | 11/16/2022 | (12,756) |
United States Dollar | 1,682,610 | Colombian Peso | 7,248,767,807 | 11/16/2022 | 218,714 |
United States Dollar | 25,419,173 | Euro | 24,433,604 | 11/16/2022 | 1,245,543 |
United States Dollar | 1,808,496 | Mexican Peso | 36,808,965 | 11/16/2022 | (43,703) |
HSBC Securities (USA) Inc. |
Euro | 880,000 | United States Dollar | 869,325 | 11/16/2022 | 1,312 |
British Pound | 110,000 | United States Dollar | 123,054 | 11/16/2022 | 3,148 |
Swiss Franc | 1,255,261 | United States Dollar | 1,344,744 | 11/16/2022 | (89,031) |
Polish Zloty | 3,350,065 | United States Dollar | 672,979 | 11/16/2022 | 27,429 |
21
STATEMENT OF INVESTMENTS (continued)
| | | | | | |
Counterparty/ Purchased
Currency | Purchased Currency
Amounts | Currency
Sold | Sold
Currency
Amounts | Settlement Date | Unrealized Appreciation (Depreciation) ($) |
J.P. Morgan Securities LLC |
United States Dollar | 140,278 | Euro | 138,132 | 11/16/2022 | 3,616 |
British Pound | 299,316 | United States Dollar | 344,556 | 11/16/2022 | (1,152) |
United States Dollar | 14,255,993 | British Pound | 11,671,071 | 11/16/2022 | 865,832 |
RBS Securities, Inc. |
United States Dollar | 133,958 | New Zealand Dollar | 235,420 | 11/16/2022 | (2,953) |
British Pound | 450,000 | United States Dollar | 488,090 | 11/16/2022 | 28,193 |
United States Dollar | 275,705 | British Pound | 243,001 | 11/16/2022 | (3,089) |
Euro | 174,045 | United States Dollar | 173,188 | 11/16/2022 | (995) |
Japanese Yen | 178,133,578 | United States Dollar | 1,354,607 | 11/16/2022 | (154,510) |
Norwegian Krone | 1,330,000 | United States Dollar | 123,354 | 11/16/2022 | 4,643 |
Canadian Dollar | 952,037 | United States Dollar | 722,405 | 11/16/2022 | (23,539) |
United States Dollar | 1,880,089 | Danish Krone | 13,441,998 | 11/16/2022 | 93,813 |
State Street Bank and Trust Company |
United States Dollar | 1,768,856 | Polish Zloty | 8,804,427 | 11/16/2022 | (71,913) |
United States Dollar | 1,210,993 | Indian Rupee | 97,248,817 | 11/16/2022 | 37,809 |
Euro | 420,000 | United States Dollar | 408,430 | 11/16/2022 | 7,101 |
United States Dollar | 279,996 | Euro | 281,164 | 11/16/2022 | 1,824 |
United States Dollar | 599,639 | Malaysian Ringgit | 2,663,894 | 11/16/2022 | 35,940 |
United States Dollar | 1,817,604 | Norwegian Krone | 19,253,701 | 11/16/2022 | (35,335) |
South Korean Won | 2,471,420,000 | United States Dollar | 1,799,097 | 11/16/2022 | (64,084) |
United States Dollar | 1,888,189 | South Korean Won | 2,479,570,000 | 11/16/2022 | 147,454 |
Indonesian Rupiah | 17,953,071,754 | United States Dollar | 1,212,881 | 11/16/2022 | (62,183) |
Danish Krone | 1,545,024 | United States Dollar | 207,118 | 11/16/2022 | (1,803) |
Canadian Dollar | 2,468,014 | United States Dollar | 1,810,176 | 11/16/2022 | 1,530 |
Brazilian Real | 6,303,619 | United States Dollar | 1,219,009 | 11/16/2022 | (3,197) |
22
| | | | | | |
Counterparty/ Purchased
Currency | Purchased Currency
Amounts | Currency
Sold | Sold
Currency
Amounts | Settlement Date | Unrealized Appreciation (Depreciation) ($) |
State Street Bank and Trust Company(continued) |
United States Dollar | 1,901,123 | Brazilian Real | 9,957,909 | 11/16/2022 | (19,511) |
Swedish Krona | 19,601,244 | United States Dollar | 1,772,440 | 11/16/2022 | 4,663 |
British Pound | 93,916 | United States Dollar | 105,165 | 11/16/2022 | 2,585 |
United States Dollar | 224,845 | British Pound | 199,496 | 11/16/2022 | (4,035) |
United States Dollar | 2,531,571 | Chinese Yuan Renminbi | 17,018,484 | 11/16/2022 | 197,614 |
United States Dollar | 899,535 | Chilean Peso | 844,620,000 | 11/16/2022 | 6,722 |
Australian Dollar | 2,727,444 | United States Dollar | 1,719,517 | 11/16/2022 | 25,879 |
United States Dollar | 6,395,854 | Australian Dollar | 9,015,311 | 11/16/2022 | 626,612 |
New Zealand Dollar | 300,000 | United States Dollar | 170,526 | 11/16/2022 | 3,943 |
United States Dollar | 884,216 | New Zealand Dollar | 1,464,414 | 11/16/2022 | 32,568 |
United States Dollar | 1,300,212 | South African Rand | 21,212,591 | 11/16/2022 | 146,834 |
United States Dollar | 1,282,269 | Swiss Franc | 1,251,423 | 11/16/2022 | 30,396 |
UBS Securities LLC |
United States Dollar | 578,418 | New Zealand Dollar | 1,018,175 | 11/16/2022 | (13,714) |
British Pound | 487,342 | United States Dollar | 564,882 | 11/16/2022 | (5,757) |
United States Dollar | 453,675 | British Pound | 404,728 | 11/16/2022 | (10,668) |
United States Dollar | 542,525 | Mexican Peso | 10,894,571 | 11/16/2022 | (5,681) |
Polish Zloty | 2,543,255 | United States Dollar | 518,600 | 11/16/2022 | 13,126 |
Euro | 1,859,146 | United States Dollar | 1,834,003 | 11/16/2022 | 5,362 |
Gross Unrealized Appreciation | | | 5,157,703 |
Gross Unrealized Depreciation | | | (822,621) |
See notes to financial statements.
23
STATEMENT OF ASSETS AND LIABILITIES
October 31, 2022
| | | | | | | |
| | | | | | |
| | | Cost | | Value | |
Assets ($): | | | | |
Investments in securities—See Statement of Investments
(including securities on loan, valued at $4,992,082)—Note 1(c): | | | |
Unaffiliated issuers | 132,794,544 | | 106,543,454 | |
Affiliated issuers | | 5,510,502 | | 5,510,502 | |
Cash | | | | | 169,813 | |
Cash denominated in foreign currency | | | 107,867 | | 101,888 | |
Unrealized appreciation on forward foreign
currency exchange contracts—Note 4 | | 5,157,703 | |
Dividends, interest and securities lending income receivable | | 1,482,073 | |
Receivable for investment securities sold | | 965,943 | |
Cash collateral held by broker—Note 4 | | 407,786 | |
Receivable for futures variation margin—Note 4 | | 75,566 | |
Tax reclaim receivable—Note 1(b) | | 45,924 | |
Receivable for shares of Common Stock subscribed | | 10,981 | |
Prepaid expenses | | | | | 25,981 | |
| | | | | 120,497,614 | |
Liabilities ($): | | | | |
Due to BNY Mellon Investment Adviser, Inc. and affiliates—Note 3(c) | | 34,229 | |
Liability for securities on loan—Note 1(c) | | 4,553,899 | |
Unrealized depreciation on forward foreign
currency exchange contracts—Note 4 | | 822,621 | |
Payable for shares of Common Stock redeemed | | 492,742 | |
Payable for investment securities purchased | | 483,713 | |
Directors’ fees and expenses payable | | 3,727 | |
Other accrued expenses | | | | | 179,503 | |
| | | | | 6,570,434 | |
Net Assets ($) | | | 113,927,180 | |
Composition of Net Assets ($): | | | | |
Paid-in capital | | | | | 133,743,381 | |
Total distributable earnings (loss) | | | | | (19,816,201) | |
Net Assets ($) | | | 113,927,180 | |
| | | | | | |
Net Asset Value Per Share | Class A | Class C | Class I | Class Y | |
Net Assets ($) | 3,870,750 | 123,796 | 24,673,147 | 85,259,487 | |
Shares Outstanding | 368,294 | 12,000 | 2,334,846 | 8,049,179 | |
Net Asset Value Per Share ($) | 10.51 | 10.32 | 10.57 | 10.59 | |
| | | | | |
See notes to financial statements. | | | | | |
24
STATEMENT OF OPERATIONS
Year Ended October 31, 2022
| | | | | | | |
| | | | | | |
| | | | | | |
Investment Income ($): | | | | |
Income: | | | | |
Interest (net of $9,463 foreign taxes withheld at source) | | | 4,887,536 | |
Dividends: | |
Unaffiliated issuers | | | 323,758 | |
Affiliated issuers | | | 28,839 | |
Income from securities lending—Note 1(c) | | | 52,971 | |
Total Income | | | 5,293,104 | |
Expenses: | | | | |
Management fee—Note 3(a) | | | 532,389 | |
Shareholder servicing costs—Note 3(c) | | | 388,683 | |
Professional fees | | | 108,166 | |
Registration fees | | | 62,195 | |
Custodian fees—Note 3(c) | | | 33,021 | |
Prospectus and shareholders’ reports | | | 18,643 | |
Chief Compliance Officer fees—Note 3(c) | | | 17,405 | |
Directors’ fees and expenses—Note 3(d) | | | 8,894 | |
Loan commitment fees—Note 2 | | | 2,781 | |
Distribution fees—Note 3(b) | | | 1,162 | |
Interest expense—Note 2 | | | 639 | |
Miscellaneous | | | 38,909 | |
Total Expenses | | | 1,212,887 | |
Less—reduction in expenses due to undertaking—Note 3(a) | | | (297,141) | |
Less—reduction in fees due to earnings credits—Note 3(c) | | | (85) | |
Net Expenses | | | 915,661 | |
Net Investment Income | | | 4,377,443 | |
Realized and Unrealized Gain (Loss) on Investments—Note 4 ($): | | |
Net realized gain (loss) on investments and foreign currency transactions | (7,003,205) | |
Net realized gain (loss) on futures | 1,363,517 | |
Net realized gain (loss) on options transactions | 323,560 | |
Net realized gain (loss) on forward foreign currency exchange contracts | 8,153,138 | |
Net Realized Gain (Loss) | | | 2,837,010 | |
Net change in unrealized appreciation (depreciation) on investments
and foreign currency transactions | (26,043,166) | |
Net change in unrealized appreciation (depreciation) on futures | (281,414) | |
Net change in unrealized appreciation (depreciation) on
options transactions | (70,172) | |
Net change in unrealized appreciation (depreciation) on
forward foreign currency exchange contracts | 2,943,305 | |
Net Change in Unrealized Appreciation (Depreciation) | | | (23,451,447) | |
Net Realized and Unrealized Gain (Loss) on Investments | | | (20,614,437) | |
Net (Decrease) in Net Assets Resulting from Operations | | (16,236,994) | |
| | | | | | |
See notes to financial statements. | | | | | |
25
STATEMENT OF CHANGES IN NET ASSETS
| | | | | | | | | | |
| | | | Year Ended October 31, |
| | | | 2022 | | 2021 | |
Operations ($): | | | | | | | | |
Net investment income | | | 4,377,443 | | | | 3,639,923 | |
Net realized gain (loss) on investments | | 2,837,010 | | | | 407,466 | |
Net change in unrealized appreciation
(depreciation) on investments | | (23,451,447) | | | | (1,558,865) | |
Net Increase (Decrease) in Net Assets
Resulting from Operations | (16,236,994) | | | | 2,488,524 | |
Distributions ($): | |
Distributions to shareholders: | | | | | | | | |
Class A | | | (137,015) | | | | (110,168) | |
Class C | | | (4,618) | | | | (4,560) | |
Class I | | | (1,501,812) | | | | (654,567) | |
Class Y | | | (3,328,068) | | | | (2,480,618) | |
Total Distributions | | | (4,971,513) | | | | (3,249,913) | |
Capital Stock Transactions ($): | |
Net proceeds from shares sold: | | | | | | | | |
Class A | | | 778,160 | | | | 611,943 | |
Class C | | | 174 | | | | - | |
Class I | | | 10,332,975 | | | | 52,066,551 | |
Class Y | | | 30,604,627 | | | | 19,854,322 | |
Distributions reinvested: | | | | | | | | |
Class A | | | 137,015 | | | | 109,565 | |
Class C | | | 2,454 | | | | 2,939 | |
Class I | | | 1,359,080 | | | | 594,347 | |
Class Y | | | 1,809,391 | | | | 1,095,473 | |
Cost of shares redeemed: | | | | | | | | |
Class A | | | (798,108) | | | | (2,021,399) | |
Class C | | | (47,640) | | | | (81,725) | |
Class I | | | (26,224,184) | | | | (33,822,101) | |
Class Y | | | (28,218,407) | | | | (30,082,421) | |
Increase (Decrease) in Net Assets
from Capital Stock Transactions | (10,264,463) | | | | 8,327,494 | |
Total Increase (Decrease) in Net Assets | (31,472,970) | | | | 7,566,105 | |
Net Assets ($): | |
Beginning of Period | | | 145,400,150 | | | | 137,834,045 | |
End of Period | | | 113,927,180 | | | | 145,400,150 | |
26
| | | | | | | | | | |
| | | | Year Ended October 31, |
| | | | 2022 | | 2021 | |
Capital Share Transactions (Shares): | |
Class A | | | | | | | | |
Shares sold | | | 69,716 | | | | 49,386 | |
Shares issued for distributions reinvested | | | 11,593 | | | | 8,846 | |
Shares redeemed | | | (70,390) | | | | (162,472) | |
Net Increase (Decrease) in Shares Outstanding | 10,919 | | | | (104,240) | |
Class C | | | | | | | | |
Shares sold | | | 15 | | | | - | |
Shares issued for distributions reinvested | | | 209 | | | | 240 | |
Shares redeemed | | | (4,253) | | | | (6,643) | |
Net Increase (Decrease) in Shares Outstanding | (4,029) | | | | (6,403) | |
Class Ia | | | | | | | | |
Shares sold | | | 883,293 | | | | 4,179,089 | |
Shares issued for distributions reinvested | | | 114,285 | | | | 47,805 | |
Shares redeemed | | | (2,373,856) | | | | (2,731,308) | |
Net Increase (Decrease) in Shares Outstanding | (1,376,278) | | | | 1,495,586 | |
Class Ya | | | | | | | | |
Shares sold | | | 2,736,406 | | | | 1,594,837 | |
Shares issued for distributions reinvested | | | 152,489 | | | | 88,119 | |
Shares redeemed | | | (2,506,922) | | | | (2,420,879) | |
Net Increase (Decrease) in Shares Outstanding | 381,973 | | | | (737,923) | |
| | | | | | | | | |
a | During the period ended October 31, 2022, 28,979 Class Y shares representing $330,424 were exchanged for 29,037 Class I shares and during the period ended October 31, 2021, 134,605 Class Y shares representing $1,672,042 were exchanged for 134,708 Class I shares. | |
See notes to financial statements. | | | | | | | | |
27
FINANCIAL HIGHLIGHTS
The following tables describe the performance for each share class for the fiscal periods indicated. All information (except portfolio turnover rate) reflects financial results for a single fund share. Net asset value total return is calculated assuming an initial investment made at the net asset value at the beginning of the period, reinvestment of all dividends and distributions at net asset value during the period, and redemption at net asset value on the last day of the period. Net asset value total return includes adjustments in accordance with accounting principles generally accepted in the United States of America and as such, the net asset value for financial reporting purposes and the returns based upon those net asset values may differ from the net asset value and returns for shareholder transactions. These figures have been derived from the fund’s financial statements.
| | | | | | | |
| | |
| | | Year Ended October 31, |
Class A Shares | | 2022 | 2021 | 2020 | 2019 | 2018 |
Per Share Data ($): | | | | | | |
Net asset value, beginning of period | | 12.29 | 12.35 | 12.48 | 12.04 | 12.23 |
Investment Operations: | | | | | | |
Net investment incomea | | .33 | .26 | .25 | .29 | .32 |
Net realized and unrealized
gain (loss) on investments | | (1.72) | (.05) | .09 | .70 | (.31) |
Total from Investment Operations | | (1.39) | .21 | .34 | .99 | .01 |
Distributions: | | | | | | |
Dividends from
net investment income | | (.23) | (.27) | (.47) | (.55) | (.20) |
Dividends from net realized
gain on investments | | (.16) | - | - | - | - |
Total Distributions | | (.39) | (.27) | (.47) | (.55) | (.20) |
Net asset value, end of period | | 10.51 | 12.29 | 12.35 | 12.48 | 12.04 |
Total Return (%)b | | (11.66) | 1.71 | 2.77 | 8.54 | .08 |
Ratios/Supplemental Data (%): | | | | | | |
Ratio of total expenses
to average net assets | | 7.95c | 6.80c | 4.86 | 1.07 | 1.39 |
Ratio of net expenses
to average net assets | | 1.05c | 1.05c | 1.00 | .75 | .75 |
Ratio of net investment income
to average net assets | | 2.92c | 2.11c | 2.03 | 2.42 | 2.60 |
Portfolio Turnover Rate | | 91.91 | 80.39 | 94.27 | 83.73 | 114.73 |
Net Assets, end of period ($ x 1,000) | | 3,871 | 4,393 | 5,703 | 1,900 | 858 |
a Based on average shares outstanding.
b Exclusive of sales charge.
c Amounts do not include the expenses of the underlying funds.
See notes to financial statements.
28
| | | | | | | | |
| | | |
| | | Year Ended October 31, |
Class C Shares | | 2022 | 2021 | 2020 | 2019 | 2018 |
Per Share Data ($): | | | | | | |
Net asset value, beginning of period | | 12.07 | 12.18 | 12.30 | 11.86 | 12.06 |
Investment Operations: | | | | | | |
Net investment incomea | | .24 | .17 | .19 | .25 | .24 |
Net realized and unrealized
gain (loss) on investments | | (1.69) | (.06) | .06 | .64 | (.33) |
Total from Investment Operations | | (1.45) | .11 | .25 | .89 | (.09) |
Distributions: | | | | | | |
Dividends from
net investment income | | (.14) | (.22) | (.37) | (.45) | (.11) |
Dividends from net realized
gain on investments | | (.16) | - | - | - | - |
Total Distributions | | (.30) | (.22) | (.37) | (.45) | (.11) |
Net asset value, end of period | | 10.32 | 12.07 | 12.18 | 12.30 | 11.86 |
Total Return (%)b | | (12.39) | .91 | 2.06 | 7.70 | (.64) |
Ratios/Supplemental Data (%): | | | | | | |
Ratio of total expenses
to average net assets | | 1.92c | 1.84c | 1.81 | 1.85 | 2.07 |
Ratio of net expenses
to average net assets | | 1.80c | 1.80c | 1.70 | 1.50 | 1.50 |
Ratio of net investment income
to average net assets | | 2.18c | 1.36c | 1.59 | 2.11 | 2.00 |
Portfolio Turnover Rate | | 91.91 | 80.39 | 94.27 | 83.73 | 114.73 |
Net Assets, end of period ($ x 1,000) | | 124 | 193 | 273 | 313 | 428 |
a Based on average shares outstanding.
b Exclusive of sales charge.
c Amounts do not include the expenses of the underlying funds.
See notes to financial statements.
29
FINANCIAL HIGHLIGHTS (continued)
| | | | | | | | |
| | | |
| | | Year Ended October 31, |
Class I Shares | | 2022 | 2021 | 2020 | 2019 | 2018 |
Per Share Data ($): | | | | | | |
Net asset value, beginning of period | | 12.36 | 12.41 | 12.53 | 12.09 | 12.27 |
Investment Operations: | | | | | | |
Net investment incomea | | .37 | .29 | .24 | .32 | .37 |
Net realized and unrealized
gain (loss) on investments | | (1.74) | (.05) | .13 | .71 | (.33) |
Total from Investment Operations | | (1.37) | .24 | .37 | 1.03 | .04 |
Distributions: | | | | | | |
Dividends from
net investment income | | (.26) | (.29) | (.49) | (.59) | (.22) |
Dividends from net realized
gain on investments | | (.16) | - | - | - | - |
Total Distributions | | (.42) | (.29) | (.49) | (.59) | (.22) |
Net asset value, end of period | | 10.57 | 12.36 | 12.41 | 12.53 | 12.09 |
Total Return (%) | | (11.45) | 1.96 | 3.06 | 8.79 | .38 |
Ratios/Supplemental Data (%): | | | | | | |
Ratio of total expenses
to average net assets | | .85b | .81b | .70 | .78 | 1.10 |
Ratio of net expenses
to average net assets | | .80b | .80b | .64 | .50 | .50 |
Ratio of net investment income
to average net assets | | 3.17b | 2.35b | 2.01 | 2.63 | 3.03 |
Portfolio Turnover Rate | | 91.91 | 80.39 | 94.27 | 83.73 | 114.73 |
Net Assets, end of period ($ x 1,000) | | 24,673 | 45,868 | 27,500 | 9,827 | 2,555 |
a Based on average shares outstanding.
b Amounts do not include the expenses of the underlying funds.
See notes to financial statements.
30
| | | | | | | | |
| | | |
| | | Year Ended October 31, |
Class Y Shares | | 2022 | 2021 | 2020 | 2019 | 2018 |
Per Share Data ($): | | | | | | |
Net asset value, beginning of period | | 12.38 | 12.42 | 12.53 | 12.09 | 12.27 |
Investment Operations: | | | | | | |
Net investment incomea | | .38 | .32 | .33 | .37 | .33 |
Net realized and unrealized
gain (loss) on investments | | (1.73) | (.06) | .05 | .66 | (.29) |
Total from Investment Operations | | (1.35) | .26 | .38 | 1.03 | .04 |
Distributions: | | | | | | |
Dividends from
net investment income | | (.28) | (.30) | (.49) | (.59) | (.22) |
Dividends from net realized
gain on investments | | (.16) | - | - | - | - |
Total Distributions | | (.44) | (.30) | (.49) | (.59) | (.22) |
Net asset value, end of period | | 10.59 | 12.38 | 12.42 | 12.53 | 12.09 |
Total Return (%) | | (11.30) | 2.18 | 3.07 | 8.81 | .30 |
Ratios/Supplemental Data (%): | | | | | | |
Ratio of total expenses
to average net assets | | .62b | .62b | .62 | .68 | .96 |
Ratio of net expenses
to average net assets | | .62b | .62b | .58 | .50 | .50 |
Ratio of net investment income
to average net assets | | 3.36b | 2.55b | 2.65 | 3.00 | 2.70 |
Portfolio Turnover Rate | | 91.91 | 80.39 | 94.27 | 83.73 | 114.73 |
Net Assets, end of period ($ x 1,000) | | 85,259 | 94,946 | 104,358 | 106,649 | 64,151 |
a Based on average shares outstanding.
b Amounts do not include the expenses of the underlying funds.
See notes to financial statements.
31
NOTES TO FINANCIAL STATEMENTS
NOTE 1—Significant Accounting Policies:
BNY Mellon Global Dynamic Bond Income Fund (the “fund”) is a separate diversified series of BNY Mellon Advantage Funds, Inc. (the “Company”), which is registered under the Investment Company Act of 1940, as amended (the “Act”), as an open-end management investment company and operates as a series company currently offering eight series, including the fund. The fund’s investment objective is to seek total return (consisting of income and capital appreciation). BNY Mellon Investment Adviser, Inc. (the “Adviser”), a wholly-owned subsidiary of The Bank of New York Mellon Corporation (“BNY Mellon”), serves as the fund’s investment adviser. Newton Investment Management Limited (the “Sub-Adviser”), a wholly-owned subsidiary of BNY Mellon and an affiliate of the Adviser, serves as the sub-adviser.
BNY Mellon Securities Corporation (the “Distributor”), a wholly-owned subsidiary of the Adviser, is the distributor of the fund’s shares. The fund is authorized to issue 500 million shares of $.001 par value Common Stock. The fund currently has authorized four classes of shares: Class A (100 million shares authorized), Class C (100 million shares authorized), Class I (150 million shares authorized) and Class Y (150 million shares authorized). Class A and Class C shares are sold primarily to retail investors through financial intermediaries and bear Distribution and/or Shareholder Services Plan fees. Class A shares generally are subject to a sales charge imposed at the time of purchase. Class A shares bought without an initial sales charge as part of an investment of $1 million or more may be charged a contingent deferred sales charge (“CDSC”) of 1.00% if redeemed within one year. Class C shares are subject to a CDSC imposed on Class C shares redeemed within one year of purchase. Class C shares automatically convert to Class A shares eight years after the date of purchase, without the imposition of a sales charge. Class I shares are sold primarily to bank trust departments and other financial service providers (including BNY Mellon and its affiliates), acting on behalf of customers having a qualified trust or an investment account or relationship at such institution, and bear no Distribution or Shareholder Services Plan fees. Class Y shares are sold at net asset value per share generally to institutional investors, and bear no Distribution or Shareholder Services Plan fees. Class I and Class Y shares are offered without a front-end sales charge or CDSC. Other differences between the classes include the services offered to and the expenses borne by each class, the allocation of certain transfer agency costs, and certain voting rights. Income, expenses (other than expenses attributable to a specific class), and realized and unrealized gains or losses
32
on investments are allocated to each class of shares based on its relative net assets.
As of October 31, 2022, MBC Investments Corporation, an indirect subsidiary of BNY Mellon, held 7,267 Class C shares of the fund.
The Company accounts separately for the assets, liabilities and operations of each series. Expenses directly attributable to each series are charged to that series’ operations; expenses which are applicable to all series are allocated among them on a pro rata basis.
The Financial Accounting Standards Board (“FASB”) Accounting Standards Codification (“ASC”) is the exclusive reference of authoritative U.S. generally accepted accounting principles (“GAAP”) recognized by the FASB to be applied by nongovernmental entities. Rules and interpretive releases of the SEC under authority of federal laws are also sources of authoritative GAAP for SEC registrants. The fund is an investment company and applies the accounting and reporting guidance of the FASB ASC Topic 946 Financial Services-Investment Companies. The fund’s financial statements are prepared in accordance with GAAP, which may require the use of management estimates and assumptions. Actual results could differ from those estimates.
The Company enters into contracts that contain a variety of indemnifications. The fund’s maximum exposure under these arrangements is unknown. The fund does not anticipate recognizing any loss related to these arrangements.
(a) Portfolio valuation: The fair value of a financial instrument is the amount that would be received to sell an asset or paid to transfer a liability in an orderly transaction between market participants at the measurement date (i.e., the exit price). GAAP establishes a fair value hierarchy that prioritizes the inputs of valuation techniques used to measure fair value. This hierarchy gives the highest priority to unadjusted quoted prices in active markets for identical assets or liabilities (Level 1 measurements) and the lowest priority to unobservable inputs (Level 3 measurements).
Additionally, GAAP provides guidance on determining whether the volume and activity in a market has decreased significantly and whether such a decrease in activity results in transactions that are not orderly. GAAP requires enhanced disclosures around valuation inputs and techniques used during annual and interim periods.
Various inputs are used in determining the value of the fund’s investments relating to fair value measurements. These inputs are summarized in the three broad levels listed below:
33
NOTES TO FINANCIAL STATEMENTS (continued)
Level 1—unadjusted quoted prices in active markets for identical investments.
Level 2—other significant observable inputs (including quoted prices for similar investments, interest rates, prepayment speeds, credit risk, etc.).
Level 3—significant unobservable inputs (including the fund’s own assumptions in determining the fair value of investments).
The inputs or methodology used for valuing securities are not necessarily an indication of the risk associated with investing in those securities.
Changes in valuation techniques may result in transfers in or out of an assigned level within the disclosure hierarchy. Valuation techniques used to value the fund’s investments are as follows:
The Company’s Board of Directors (the “Board”) has designated the Adviser as the fund’s valuation designee, effective September 8, 2022, to make all fair value determinations with respect to the fund’s portfolio investments, subject to the Board’s oversight and pursuant to Rule 2a-5 under the Act.
Registered investment companies that are not traded on an exchange are valued at their net asset value and are generally categorized within Level 1 of the fair value hierarchy.
Investments in debt securities, excluding short-term investments (other than U.S. Treasury Bills), futures, options and forward foreign currency exchange contracts (“forward contracts”) are valued each business day by one or more independent pricing services (each, a “Service”) approved by the Board. Investments for which quoted bid prices are readily available and are representative of the bid side of the market in the judgment of a Service are valued at the mean between the quoted bid prices (as obtained by a Service from dealers in such securities) and asked prices (as calculated by a Service based upon its evaluation of the market for such securities). Securities are valued as determined by a Service, based on methods which include consideration of the following: yields or prices of securities of comparable quality, coupon, maturity and type; indications as to values from dealers; and general market conditions. The Services are engaged under the general supervision of the Board. These securities are generally categorized within Level 2 of the fair value hierarchy.
Fair valuing of securities may be determined with the assistance of a Service using calculations based on indices of domestic securities and other appropriate indicators, such as prices of relevant ADRs and futures.
34
Utilizing these techniques may result in transfers between Level 1 and Level 2 of the fair value hierarchy.
When market quotations or official closing prices are not readily available, or are determined not to accurately reflect fair value, such as when the value of a security has been significantly affected by events after the close of the exchange or market on which the security is principally traded (for example, a foreign exchange or market), but before the fund calculates its net asset value, the fund may value these investments at fair value as determined in accordance with the procedures approved by the Board. Certain factors may be considered when fair valuing investments such as: fundamental analytical data, the nature and duration of restrictions on disposition, an evaluation of the forces that influence the market in which the securities are purchased and sold, and public trading in similar securities of the issuer or comparable issuers. These securities are either categorized within Level 2 or 3 of the fair value hierarchy depending on the relevant inputs used.
For securities where observable inputs are limited, assumptions about market activity and risk are used and such securities are generally categorized within Level 3 of the fair value hierarchy.
Investments denominated in foreign currencies are translated to U.S. dollars at the prevailing rates of exchange.
Forward contracts are valued at the forward rate and are generally categorized within Level 2 of the fair value hierarchy. Futures and options, which are traded on an exchange, are valued at the last sales price on the securities exchange on which such securities are primarily traded or at the last sales price on the national securities market on each business day and are generally categorized within Level 1 of the fair value hierarchy. Options traded over-the-counter (“OTC”) are valued at the mean between the bid and asked price and are generally categorized within Level 2 of the fair value hierarchy.
The following is a summary of the inputs used as of October 31, 2022 in valuing the fund’s investments:
| | | | | | | |
| | Level 1-Unadjusted Quoted Prices | Level 2- Other Significant Observable Inputs | | Level 3-Significant Unobservable Inputs | Total | |
Assets ($) | | |
Investments in Securities:† | | |
Corporate Bonds | - | 60,680,854 | | - | 60,680,854 | |
Exchange-Traded Funds | 1,850,691 | 1,683,490 | †† | - | 3,534,181 | |
35
NOTES TO FINANCIAL STATEMENTS (continued)
| | | | | | | |
| | Level 1-Unadjusted Quoted Prices | Level 2- Other Significant Observable Inputs | | Level 3-Significant Unobservable Inputs | Total | |
Assets ($)(continued) | | |
Investments in Securities:†(continued) | | |
Foreign Governmental | - | 33,835,173 | | - | 33,835,173 | |
Investment Companies | 5,510,502 | - | | - | 5,510,502 | |
U.S. Treasury Securities | - | 8,356,605 | | - | 8,356,605 | |
Other Financial Instruments: | | |
Forward Foreign Currency Exchange Contracts††† | - | 5,157,703 | | - | 5,157,703 | |
Futures††† | 110,842 | - | | - | 110,842 | |
Options Purchased | 136,641 | - | | - | 136,641 | |
Liabilities ($) | | |
Other Financial Instruments: | | |
Forward Foreign Currency Exchange Contracts††† | - | (822,621) | | - | (822,621) | |
Futures††† | (157,216) | - | | - | (157,216) | |
† See Statement of Investments for additional detailed categorizations, if any.
†† Securities classified within Level 2 at period end as the values were determined pursuant to the fund’s fair valuation procedures.
††† Amount shown represents unrealized appreciation (depreciation) at period end, but only variation margin on exchange-traded and centrally cleared derivatives, if any, are reported in the Statement of Assets and Liabilities.
(b) Foreign currency transactions: The fund does not isolate that portion of the results of operations resulting from changes in foreign exchange rates on investments from the fluctuations arising from changes in the market prices of securities held. Such fluctuations are included with the net realized and unrealized gain or loss on investments.
Net realized foreign exchange gains or losses arise from sales of foreign currencies, currency gains or losses realized on securities transactions between trade and settlement date, and the difference between the amounts of dividends, interest and foreign withholding taxes recorded on the fund’s books and the U.S. dollar equivalent of the amounts actually received or paid. Net unrealized foreign exchange gains and losses arise from changes in the value of assets and liabilities other than investments resulting from changes in exchange rates. Foreign currency gains and losses on foreign currency transactions are also included with net realized and unrealized gain or loss on investments.
36
Foreign taxes: The fund may be subject to foreign taxes (a portion of which may be reclaimable) on income, stock dividends, realized and unrealized capital gains on investments or certain foreign currency transactions. Foreign taxes are recorded in accordance with the applicable foreign tax regulations and rates that exist in the foreign jurisdictions in which the fund invests. These foreign taxes, if any, are paid by the fund and are reflected in the Statement of Operations, if applicable. Foreign taxes payable or deferred or those subject to reclaims as of October 31, 2022, if any, are disclosed in the fund’s Statement of Assets and Liabilities.
(c) Securities transactions and investment income: Securities transactions are recorded on a trade date basis. Realized gains and losses from securities transactions are recorded on the identified cost basis. Dividend income is recognized on the ex-dividend date and interest income, including, where applicable, accretion of discount and amortization of premium on investments, is recognized on the accrual basis.
Pursuant to a securities lending agreement with BNY Mellon, the fund may lend securities to qualified institutions. It is the fund’s policy that, at origination, all loans are secured by collateral of at least 102% of the value of U.S. securities loaned and 105% of the value of foreign securities loaned. Collateral equivalent to at least 100% of the market value of securities on loan is maintained at all times. Collateral is either in the form of cash, which can be invested in certain money market mutual funds managed by the Adviser, or U.S. Government and Agency securities. The fund is entitled to receive all dividends, interest and distributions on securities loaned, in addition to income earned as a result of the lending transaction. Should a borrower fail to return the securities in a timely manner, BNY Mellon is required to replace the securities for the benefit of the fund or credit the fund with the market value of the unreturned securities and is subrogated to the fund’s rights against the borrower and the collateral. Additionally, the contractual maturity of security lending transactions are on an overnight and continuous basis. During the period ended October 31, 2022, BNY Mellon earned $7,222 from the lending of the fund’s portfolio securities, pursuant to the securities lending agreement.
(d) Affiliated issuers: Investments in other investment companies advised by the Adviser are considered “affiliated” under the Act.
Certain affiliated investment companies may also invest in the fund. At October 31, 2022, BNY Mellon Yield Enhancement Strategy Fund, an affiliate of the fund, held 3,616,970 Class Y shares representing approximately 33.6% of the fund’s net assets.
37
NOTES TO FINANCIAL STATEMENTS (continued)
(e) Market Risk: The value of the securities in which the fund invests may be affected by political, regulatory, economic and social developments, and developments that impact specific economic sectors, industries or segments of the market. The value of a security may also decline due to general market conditions that are not specifically related to a particular company or industry, such as real or perceived adverse economic conditions, changes in the general outlook for corporate earnings, changes in interest or currency rates, changes to inflation, adverse changes to credit markets or adverse investor sentiment generally. In addition, turbulence in financial markets and reduced liquidity in equity, credit and/or fixed income markets may negatively affect many issuers, which could adversely affect the fund. Global economies and financial markets are becoming increasingly interconnected, and conditions and events in one country, region or financial market may adversely impact issuers in a different country, region or financial market. These risks may be magnified if certain events or developments adversely interrupt the global supply chain; in these and other circumstances, such risks might affect companies world-wide. Recent examples include pandemic risks related to COVID-19 and aggressive measures taken world-wide in response by governments, including closing borders, restricting international and domestic travel, and the imposition of prolonged quarantines of large populations, and by businesses, including changes to operations and reducing staff.
Foreign Investment Risk: To the extent the fund invests in foreign securities, the fund’s performance will be influenced by political, social and economic factors affecting investments in foreign issuers. Special risk associated with investments in foreign issuers include exposure to currency fluctuations, less liquidity, less developed or less efficient trading markets, lack of comprehensive company information, political and economic instability and differing auditing and legal standards.
Debt Risk: The fund invests primarily in debt securities. Failure of an issuer of the debt securities to make timely interest or principal payments, or a decline or the perception of a decline in the credit quality of a debt security, can cause the debt security’s price to fall, potentially lowering the fund’s share price. In addition, the value of debt securities may decline due to general market conditions that are not specifically related to a particular issuer, such as real or perceived adverse economic conditions, changes in outlook for corporate earnings, changes in interest or currency rates or adverse investor sentiment. Such values may also decline because of factors that affect a particular industry or country.
(f) Dividends and distributions to shareholders: Dividends and distributions are recorded on the ex-dividend date. Dividends from net
38
investment income are normally declared and paid quarterly. Dividends from net realized capital gains, if any, are normally declared and paid annually, but the fund may make distributions on a more frequent basis to comply with the distribution requirements of the Internal Revenue Code of 1986, as amended (the “Code”). To the extent that net realized capital gains can be offset by capital loss carryovers, it is the policy of the fund not to distribute such gains. Income and capital gain distributions are determined in accordance with income tax regulations, which may differ from GAAP.
On October 31, 2022, the Board declared a cash dividend of $.119, $.093, $.122 and $.127 per share from undistributed net investment income for Class A, Class C, Class I and Class Y shares, respectively, payable on November 1, 2022, to shareholders of record as of the close of business on October 31, 2022. The ex-dividend date was November 1, 2022.
(g) Federal income taxes: It is the policy of the fund to continue to qualify as a regulated investment company, if such qualification is in the best interests of its shareholders, by complying with the applicable provisions of the Code, and to make distributions of taxable income and net realized capital gain sufficient to relieve it from substantially all federal income and excise taxes.
As of and during the period ended October 31, 2022, the fund did not have any liabilities for any uncertain tax positions. The fund recognizes interest and penalties, if any, related to uncertain tax positions as income tax expense in the Statement of Operations. During the period ended October 31, 2022, the fund did not incur any interest or penalties.
Each tax year in the four-year period ended October 31, 2022 remains subject to examination by the Internal Revenue Service and state taxing authorities.
At October 31, 2022, the components of accumulated earnings on a tax basis were as follows: undistributed ordinary income $8,262,267, accumulated capital and other losses $940,784 and unrealized depreciation $27,137,684.
The fund is permitted to carry forward capital losses for an unlimited period. Furthermore, capital loss carryovers retain their character as either short-term or long-term capital losses.
The accumulated capital loss carryover is available for federal income tax purposes to be applied against future net realized capital gains, if any, realized subsequent to October 31, 2022. The fund has $791,553 of short-
39
NOTES TO FINANCIAL STATEMENTS (continued)
term capital losses and $67,670 of long-term capital losses which can be carried forward for an unlimited period.
The tax character of distributions paid to shareholders during the fiscal years ended October 31, 2022 and October 31, 2021 were as follows: ordinary income $3,139,736 and $3,249,913, and long-term capital gains $1,831,777 and $0, respectively.
(h) New accounting pronouncements: In March 2020, the FASB issued Accounting Standards Update 2020-04, Reference Rate Reform (Topic 848): Facilitation of the Effects of Reference Rate Reform on Financial Reporting (“ASU 2020-04”), and in January 2021, the FASB issued Accounting Standards Update 2021-01, Reference Rate Reform (Topic 848): Scope (“ASU 2021-01”), which provides optional, temporary relief with respect to the financial reporting of contracts subject to certain types of modifications due to the planned discontinuation of the London Interbank Offered Rate (“LIBOR”) and other interbank offered rates as of the end of 2021. The temporary relief provided by ASU 2020-04 and ASU 2021-01 is effective for certain reference rate-related contract modifications that occur during the period from March 12, 2020 through December 31, 2022 (“FASB Effective Date”). Management had evaluated the impact of ASU 2020-04 and ASU 2021-01 on the fund’s investments, derivatives, debt and other contracts that will undergo reference rate-related modifications as a result of the Reference Rate Reform. Management will be adopting ASU 2020-04 and ASU 2021-01 on FASB Effective Date or if amended ASU 2020-04 new extended FASB Effective Date, if any. Management will continue to work with other financial institutions and counterparties to modify contracts as required by applicable regulation and within the regulatory deadlines. As of October 31, 2022, management believes these accounting standards have no impact on the fund and does not have any concerns of adopting the regulations by FASB Effective Date.
NOTE 2—Bank Lines of Credit:
The fund participates with other long-term open-end funds managed by the Adviser in a $823.5 million unsecured credit facility led by Citibank, N.A. (the “Citibank Credit Facility”) and a $300 million unsecured credit facility provided by BNY Mellon (the “BNYM Credit Facility”), each to be utilized primarily for temporary or emergency purposes, including the financing of redemptions (each, a “Facility”). The Citibank Credit Facility is available in two tranches: (i) Tranche A is in an amount equal to $688.5 million and is available to all long-term open-ended funds, including the fund, and (ii) Tranche B is an amount equal to $135 million and is available only to BNY Mellon Floating Rate Income Fund, a series of BNY Mellon
40
Investment Funds IV, Inc. In connection therewith, the fund has agreed to pay its pro rata portion of commitment fees for Tranche A of the Citibank Credit Facility and the BNYM Credit Facility. Interest is charged to the fund based on rates determined pursuant to the terms of the respective Facility at the time of borrowing.
The average amount of borrowings outstanding under the Facilities during the period ended October 31, 2022 was approximately $20,548 with a related weighted average annualized interest rate of 3.11%.
NOTE 3—Management Fee, Sub-Advisory Fee and Other Transactions with Affiliates:
(a) Pursuant to a management agreement with the Adviser, the management fee is computed at the annual rate of .40% of the value of the fund’s average daily net assets and is payable monthly. The Adviser has contractually agreed, from November 1, 2021 through March 1, 2023, to waive receipt of its fees and/or assume the direct expenses of the fund, so that the expenses of none of the classes (excluding Rule 12b-1 Distribution Plan fees, Shareholder Services Plan fees, taxes, interest expense, brokerage commissions, commitment fees on borrowings and extraordinary expenses) exceed .80% of the value of the fund’s average daily net assets. On or after March 1, 2023, the Adviser may terminate this expense limitation agreement at any time. The reduction in expenses, pursuant to the undertaking, amounted to $297,141 during the period ended October 31, 2022.
Pursuant to a sub-investment advisory agreement between the Adviser and the Sub-Adviser, the Adviser pays the Sub-Adviser a monthly fee at an annual rate of .19% of the value of the fund’s average daily net assets.
(b) Under the Distribution Plan adopted pursuant to Rule 12b-1 under the Act, Class C shares pay the Distributor for distributing its shares at an annual rate of .75% of the value of its average daily net assets. The Distributor may pay one or more Service Agents in respect of advertising, marketing and other distribution services, and determines the amounts, if any, to be paid to Service Agents and the basis on which such payments are made. During the period ended October 31, 2022, Class C shares were charged $1,162 pursuant to the Distribution Plan.
(c) Under the Shareholder Services Plan, Class A and Class C shares pay the Distributor at an annual rate of .25% of the value of their average daily net assets for the provision of certain services. The services provided may include personal services relating to shareholder accounts, such as answering shareholder inquiries regarding the fund, and services related to the maintenance of shareholder accounts. The Distributor may make
41
NOTES TO FINANCIAL STATEMENTS (continued)
payments to Service Agents (securities dealers, financial institutions or other industry professionals) with respect to these services. The Distributor determines the amounts to be paid to Service Agents. During the period ended October 31, 2022, Class A and Class C shares were charged $10,113 and $387, respectively, pursuant to the Shareholder Services Plan.
The fund has an arrangement with BNY Mellon Transfer, Inc., (the “Transfer Agent”), a subsidiary of BNY Mellon and an affiliate of the Adviser, whereby the fund may receive earnings credits when positive cash balances are maintained, which are used to offset Transfer Agent fees. For financial reporting purposes, the fund includes transfer agent net earnings credits, if any, as an expense offset in the Statement of Operations.
The fund has an arrangement with The Bank of New York Mellon (the “Custodian”), a subsidiary of BNY Mellon and an affiliate of the Adviser, whereby the fund will receive interest income or be charged overdraft fees when cash balances are maintained. For financial reporting purposes, the fund includes this interest income and overdraft fees, if any, as interest income in the Statement of Operations.
The fund compensates the Transfer Agent, under a transfer agency agreement, for providing transfer agency and cash management services for the fund. The majority of Transfer Agent fees are comprised of amounts paid on a per account basis, while cash management fees are related to fund subscriptions and redemptions. During the period ended October 31, 2022, the fund was charged $4,115 for transfer agency services. These fees are included in Shareholder servicing costs in the Statement of Operations. These fees were partially offset by earnings credits of $85.
The fund compensates the Custodian, under a custody agreement, for providing custodial services for the fund. These fees are determined based on net assets, geographic region and transaction activity. During the period ended October 31, 2022, the fund was charged $33,021 pursuant to the custody agreement.
During the period ended October 31, 2022, the fund was charged $17,405 for services performed by the fund’s Chief Compliance Officer and his staff. These fees are included in Chief Compliance Officer fees in the Statement of Operations.
The components of “Due to BNY Mellon Investment Adviser, Inc. and affiliates” in the Statement of Assets and Liabilities consist of: management fee of $39,226, Distribution Plan fees of $79, Shareholder Services Plan fees of $847, Custodian fees of $15,126, Chief Compliance Officer fees of
42
$5,078 and Transfer Agent fees of $700, which are offset against an expense reimbursement currently in effect in the amount of $26,827.
(d) Each Board member also serves as a Board member of other funds in the BNY Mellon Family of Funds complex. Annual retainer fees and attendance fees are allocated to each fund based on net assets.
NOTE 4—Securities Transactions:
The aggregate amount of purchases and sales of investment securities, excluding short-term securities, futures, options transactions and forward contracts, during the period ended October 31, 2022, amounted to $118,664,425 and $112,942,616, respectively.
Derivatives: A derivative is a financial instrument whose performance is derived from the performance of another asset. The fund enters into International Swaps and Derivatives Association, Inc. Master Agreements or similar agreements (collectively, “Master Agreements”) with its OTC derivative contract counterparties in order to, among other things, reduce its credit risk to counterparties. Master Agreements include provisions for general obligations, representations, collateral and events of default or termination. Under a Master Agreement, the fund may offset with the counterparty certain derivative financial instruments’ payables and/or receivables with collateral held and/or posted and create one single net payment in the event of default or termination. The SEC recently adopted Rule 18f-4 under the Act, which, effective August 18, 2022, regulates the use of derivatives transactions for certain funds registered under the Act. The fund’s derivative transactions are subject to a value-at-risk leverage limit and certain reporting and other requirements pursuant to a derivatives risk management program adopted by the fund.
Each type of derivative instrument that was held by the fund during the period ended October 31, 2022 is discussed below.
Futures: In the normal course of pursuing its investment objective, the fund is exposed to market risk, including interest rate risk, as a result of changes in value of underlying financial instruments. The fund invests in futures in order to manage its exposure to or protect against changes in the market. A futures contract represents a commitment for the future purchase or a sale of an asset at a specified date. Upon entering into such contracts, these investments require initial margin deposits with a counterparty, which consist of cash or cash equivalents. The amount of these deposits is determined by the exchange or Board of Trade on which the contract is traded and is subject to change. Accordingly, variation margin payments are received or made to reflect daily unrealized gains or losses which are recorded in the Statement of Operations. When the
43
NOTES TO FINANCIAL STATEMENTS (continued)
contracts are closed, the fund recognizes a realized gain or loss which is reflected in the Statement of Operations. There is minimal counterparty credit risk to the fund with futures since they are exchange traded, and the exchange guarantees the futures against default. Futures open at October 31, 2022 are set forth in the Statement of Investments.
Options Transactions: The fund purchases and writes (sells) put and call options to hedge against changes in the values of interest rates, or as a substitute for an investment. The fund is subject to market risk and interest rate risk in the course of pursuing its investment objectives through its investments in options contracts. A call option gives the purchaser of the option the right (but not the obligation) to buy, and obligates the writer to sell, the underlying financial instrument at the exercise price at any time during the option period, or at a specified date. Conversely, a put option gives the purchaser of the option the right (but not the obligation) to sell, and obligates the writer to buy the underlying financial instrument at the exercise price at any time during the option period, or at a specified date.
As a writer of call options, the fund receives a premium at the outset and then bears the market risk of unfavorable changes in the price of the financial instrument underlying the option. Generally, the fund realizes a gain, to the extent of the premium, if the price of the underlying financial instrument decreases between the date the option is written and the date on which the option is terminated. Generally, the fund incurs a loss if the price of the financial instrument increases between those dates. The maximum payout for those contracts is limited to the number of call option contracts written and the related strike prices, respectively.
As a writer of put options, the fund receives a premium at the outset and then bears the market risk of unfavorable changes in the price of the financial instrument underlying the option. Generally, the fund realizes a gain, to the extent of the premium, if the price of the underlying financial instrument increases between the date the option is written and the date on which the option is terminated. Generally, the fund incurs a loss if the price of the financial instrument decreases between those dates. The maximum payout for those contracts is limited to the number of put option contracts written and the related strike prices, respectively.
As a writer of an option, the fund has no control over whether the underlying financial instrument may be sold (call) or purchased (put) and as a result bears the market risk of an unfavorable change in the price of the financial instrument underlying the written option. There is a risk of loss from a change in value of such options which may exceed the related premiums received. This risk may be mitigated by Master Agreements, if any, between the fund and the counterparty and the posting of collateral, if
44
any, by the counterparty to the fund to cover the fund’s exposure to the counterparty. The Statement of Operations reflects any unrealized gains or losses which occurred during the period as well as any realized gains or losses which occurred upon the expiration or closing of the option transaction. Options purchased open at October 31, 2022 are set forth in the Statement of Investments. As of October 31, 2022, there were no options written outstanding.
Forward Foreign Currency Exchange Contracts: The fund enters into forward contracts in order to hedge its exposure to changes in foreign currency exchange rates on its foreign portfolio holdings, to settle foreign currency transactions or as a part of its investment strategy. When executing forward contracts, the fund is obligated to buy or sell a foreign currency at a specified rate on a certain date in the future. With respect to sales of forward contracts, the fund incurs a loss if the value of the contract increases between the date the forward contract is opened and the date the forward contract is closed. The fund realizes a gain if the value of the contract decreases between those dates. With respect to purchases of forward contracts, the fund incurs a loss if the value of the contract decreases between the date the forward contract is opened and the date the forward contract is closed. The fund realizes a gain if the value of the contract increases between those dates. Any realized or unrealized gains or losses which occurred during the period are reflected in the Statement of Operations. The fund is exposed to foreign currency risk as a result of changes in value of underlying financial instruments. The fund is also exposed to credit risk associated with counterparty non-performance on these forward contracts, which is generally limited to the unrealized gain on each open contract. This risk may be mitigated by Master Agreements, if any, between the fund and the counterparty and the posting of collateral, if any, by the counterparty to the fund to cover the fund’s exposure to the counterparty. Forward contracts open at October 31, 2022 are set forth in the Statement of Investments.
The following tables show the fund’s exposure to different types of market risk as it relates to the Statement of Assets and Liabilities and the Statement of Operations, respectively.
Fair value of derivative instruments as of October 31, 2022 is shown below:
45
NOTES TO FINANCIAL STATEMENTS (continued)
| | | | | | | | |
| | Derivative
Assets ($) | | | | Derivative
Liabilities ($) | |
Interest rate risk | 247,483 | 1,2 | Interest rate risk | (157,216) | 1 |
Foreign exchange risk | 5,157,703 | 3 | Foreign exchange risk | (822,621) | 3 |
Gross fair value of
derivative contracts | 5,405,186 | | | | (979,837) | |
| | | | | | |
| Statement of Assets and Liabilities location: | |
1 | Includes cumulative appreciation (depreciation) on futures as reported in the Statement of Futures, but only the
unpaid variation margin is reported in the Statement of Assets and Liabilities. |
2 | Options purchased are included in Investments in securities—Unaffiliated issuers, at value. |
3 | Unrealized appreciation (depreciation) on forward foreign currency exchange contracts. |
The effect of derivative instruments in the Statement of Operations during the period ended October 31, 2022 is shown below:
| | | | | | | | | | |
Amount of realized gain (loss) on derivatives recognized in income ($) | |
Underlying
risk | Futures | 1 | Options
Transactions | 2 | Forward
Contracts | 3 | Total | |
Interest rate | 1,363,517 | | 323,560 | | - | | 1,687,077 | |
Foreign
exchange | - | | - | | 8,153,138 | | 8,153,138 | |
Total | 1,363,517 | | 323,560 | | 8,153,138 | | 9,840,215 | |
| | | | | | | | |
Net change in unrealized appreciation (depreciation)
on derivatives recognized in income ($) | |
Underlying
risk | Futures | 4 | Options
Transactions | 5 | Forward
Contracts | 6 | Total | |
Interest rate | (281,414) | | (70,172) | | - | | (351,586) | |
Foreign
exchange | - | | - | | 2,943,305 | | 2,943,305 | |
Total | (281,414) | | (70,172) | | 2,943,305 | | 2,591,719 | |
| | | | | | | | | |
| Statement of Operations location: | |
1 | Net realized gain (loss) on futures. |
2 | Net realized gain (loss) on options transactions. |
3 | Net realized gain (loss) on forward foreign currency exchange contracts. |
4 | Net change in unrealized appreciation (depreciation) on futures. |
5 | Net change in unrealized appreciation (depreciation) on options transactions. |
6 | Net change in unrealized appreciation (depreciation) on forward foreign currency exchange contracts. |
The provisions of ASC Topic 210 “Disclosures about Offsetting Assets and Liabilities” require disclosure on the offsetting of financial assets and liabilities. These disclosures are required for certain investments, including derivative financial instruments subject to Master Agreements which are eligible for offsetting in the Statement of Assets and Liabilities and require the fund to disclose both gross and net information with respect to such investments. For financial reporting purposes, the fund does not offset
46
derivative assets and derivative liabilities that are subject to Master Agreements in the Statement of Assets and Liabilities.
At October 31, 2022, derivative assets and liabilities (by type) on a gross basis are as follows:
| | | | | | |
Derivative Financial Instruments: | | Assets ($) | | Liabilities ($) | |
Futures | | 110,842 | | (157,216) | |
Options | | 136,641 | | - | |
Forward contracts | | 5,157,703 | | (822,621) | |
Total gross amount of derivative | | | | | |
assets and liabilities in the | | | | | |
Statement of Assets and Liabilities | | 5,405,186 | | (979,837) | |
Derivatives not subject to | | | | | |
Master Agreements | | (247,483) | | 157,216 | |
Total gross amount of assets | | | | | |
and liabilities subject to | | | | | |
Master Agreements | | 5,157,703 | | (822,621) | |
The following tables present derivative assets and liabilities net of amounts available for offsetting under Master Agreements and net of related collateral received or pledged, if any, as of October 31, 2022:
| | | | | | | |
| | | Financial | | | |
| | | Instruments | | | |
| | | and Derivatives | | | |
| Gross Amount of | | Available | Collateral | | Net Amount of |
Counterparty | Assets ($) | 1 | for Offset ($) | Received ($) | 2 | Assets ($) |
CIBC World
Markets Corp. | 1,026,345 | | (193,012) | (800,000) | | 33,333 |
Citigroup Global
Markets Inc. | 1,775,410 | | (56,459) | (1,260,000) | | 458,951 |
HSBC Securities
(USA) Inc. | 31,889 | | (31,889) | - | | - |
J.P. Morgan
Securities LLC | 869,448 | | (1,152) | (868,296) | | - |
RBS Securities, Inc. | 126,649 | | (126,649) | - | | - |
State Street Bank
and Trust Company | 1,309,474 | | (262,061) | (1,047,413) | | - |
UBS Securities LLC | 18,488 | | (18,488) | - | | - |
Total | 5,157,703 | | (689,710) | (3,975,709) | | 492,284 |
| | | | | | |
47
NOTES TO FINANCIAL STATEMENTS (continued)
| | | | | | | |
| | | Financial | | | |
| | | Instruments | | | |
| | | and Derivatives | | | |
| Gross Amount of | | Available | Collateral | | Net Amount of |
Counterparty | Liabilities ($) | 1 | for Offset ($) | Pledged ($) | 2 | Liabilities ($) |
CIBC World
Markets Corp. | (193,012) | | 193,012 | - | | - |
Citigroup Global
Markets Inc. | (56,459) | | 56,459 | - | | - |
HSBC Securities
(USA) Inc. | (89,031) | | 31,889 | - | | (57,142) |
J.P. Morgan
Securities LLC | (1,152) | | 1,152 | - | | - |
RBS Securities, Inc. | (185,086) | | 126,649 | - | | (58,437) |
State Street Bank
and Trust Company | (262,061) | | 262,061 | - | | - |
UBS Securities LLC | (35,820) | | 18,488 | - | | (17,332) |
Total | (822,621) | | 689,710 | - | | (132,911) |
| | | | | | |
1 Absent a default event or early termination, OTC derivative assets and liabilities are presented at gross amounts
and are not offset in the Statement of Assets and Liabilities. |
2 In some instances, the actual collateral received and/or pledged may be more than the amount shown due to
over collateralization. |
The following summarizes the average market value of derivatives outstanding during the period ended October 31, 2022:
| | | |
| | Average Market Value ($) |
Interest rate futures | | 13,412,995 |
Interest rate options contracts | | 81,398 |
Forward contracts | | 115,945,831 |
At October 31, 2022, the cost of investments for federal income tax purposes was $139,590,456; accordingly, accumulated net unrealized depreciation on investments inclusive of derivative contracts was $27,091,543, consisting of $5,253,598 gross unrealized appreciation and $32,345,141 gross unrealized depreciation.
48
REPORT OF INDEPENDENT REGISTERED PUBLIC ACCOUNTING FIRM
To the Shareholders and the Board of Directors of BNY Mellon Global Dynamic Bond Income Fund
Opinion on the Financial Statements
We have audited the accompanying statement of assets and liabilities of BNY Mellon Global Dynamic Bond Income Fund (the “Fund”) (one of the funds constituting BNY Mellon Advantage Funds, Inc.), including the statement of investments, as of October 31, 2022, and the related statement of operations for the year then ended, the statements of changes in net assets for each of the two years in the period then ended, the financial highlights for each of the five years in the period then ended and the related notes (collectively referred to as the “financial statements”). In our opinion, the financial statements present fairly, in all material respects, the financial position of the Fund (one of the funds constituting BNY Mellon Advantage Funds, Inc.) at October 31, 2022, the results of its operations for the year then ended, the changes in its net assets for each of the two years in the period then ended and its financial highlights for each of the five years in the period then ended, in conformity with U.S. generally accepted accounting principles.
Basis for Opinion
These financial statements are the responsibility of the Fund’s management. Our responsibility is to express an opinion on the Fund’s financial statements based on our audits. We are a public accounting firm registered with the Public Company Accounting Oversight Board (United States) (“PCAOB”) and are required to be independent with respect to the Fund in accordance with the U.S. federal securities laws and the applicable rules and regulations of the Securities and Exchange Commission and the PCAOB.
We conducted our audits in accordance with the standards of the PCAOB. Those standards require that we plan and perform the audit to obtain reasonable assurance about whether the financial statements are free of material misstatement, whether due to error or fraud. The Fund is not required to have, nor were we engaged to perform, an audit of the Fund’s internal control over financial reporting. As part of our audits, we are required to obtain an understanding of internal control over financial reporting, but not for the purpose of expressing an opinion on the effectiveness of the Fund’s internal control over financial reporting. Accordingly, we express no such opinion.
Our audits included performing procedures to assess the risks of material misstatement of the financial statements, whether due to error or fraud, and performing procedures that respond to those risks. Such procedures included examining, on a test basis, evidence regarding the amounts and disclosures in the financial statements. Our procedures included confirmation of securities owned as of October 31, 2022, by correspondence with the custodian, brokers and others; when replies were not received from brokers and others, we performed other auditing procedures. Our audits also included evaluating the accounting principles used and significant estimates made by management, as well as evaluating the overall presentation of the financial statements. We believe that our audits provide a reasonable basis for our opinion.

We have served as the auditor of one or more investment companies in the BNY Mellon Family of Funds since at least 1957, but we are unable to determine the specific year.
New York, New York
December 27, 2022
49
IMPORTANT TAX INFORMATION (Unaudited)
The fund hereby reports $.1562 per share as a long-term capital gain distribution paid on December 21, 2021.
50
LIQUIDITY RISK MANAGEMENT PROGRAM (Unaudited)
Effective June 1, 2019, the fund adopted a liquidity risk management program (the “Liquidity Risk Management Program”) pursuant to the requirements of Rule 22e-4 under the Investment Company Act of 1940, as amended. Rule 22e-4 requires registered open-end funds, including mutual funds and exchange-traded funds but not money market funds, to establish liquidity risk management programs in order to effectively manage fund liquidity and shareholder redemptions. The rule is designed to mitigate the risk that a fund could not meet redemption requests without significantly diluting the interests of remaining investors.
The rule requires the fund to assess, manage and review their liquidity risk at least annually considering applicable factors such as investment strategy and liquidity during normal and foreseeable stressed conditions, including whether the strategy is appropriate for an open-end fund and whether the fund has a relatively concentrated portfolio or large positions in particular issuers. The fund must also assess its use of borrowings and derivatives, short-term and long-term cash flow projections in normal and stressed conditions, holdings of cash and cash equivalents, and borrowing arrangements and other funding sources.
The rule also requires the fund to classify its investments as highly liquid, moderately liquid, less liquid or illiquid based on the number of days the fund expects it would take to liquidate the investment, and to review these classifications at least monthly or more often under certain conditions. The periods range from three or fewer business days for a highly liquid investment to greater than seven calendar days for settlement of a less liquid investment. Illiquid investments are those a fund does not expect to be able to sell or dispose of within seven calendar days without significantly changing the market value. The fund is prohibited from acquiring an investment if, after the acquisition, its holdings of illiquid assets will exceed 15% of its net assets. In addition, if a fund permits redemptions in-kind, the rule requires the fund to establish redemption in-kind policies and procedures governing how and when it will engage in such redemptions.
Pursuant to the rule’s requirements, the Liquidity Risk Management Program has been reviewed and approved by the Board. Furthermore, the Board has received a written report prepared by the Program’s Administrator that addresses the operation of the Program, assesses its adequacy and effectiveness and describes any material changes made to the Program.
Assessment of Program
In the opinion of the Program Administrator, the Program approved by the Board continues to be adequate for the fund and the Program has been implemented effectively. The Program Administrator has monitored the fund’s liquidity risk and the liquidity classification of the securities held by the fund and has determined that the Program is operating effectively.
During the period from January 1, 2021 to December 31, 2021, there were no material changes to the Program and no material liquidity events that impacted the fund. During the period, the fund held sufficient highly liquid assets to meet fund redemptions.
Under normal expected foreseeable fund redemption forecasts and foreseeable stressed fund redemption forecasts, the Program Administrator believes that the fund maintains sufficient highly liquid assets to meet expected fund redemptions.
51
BOARD MEMBERS INFORMATION (Unaudited)
Independent Board Members
Joseph S. DiMartino (79)
Chairman of the Board (1995)
Principal Occupation During Past 5 Years:
· Director or Trustee of funds in the BNY Mellon Family of Funds and certain other entities (as described in the fund’s Statement of Additional Information) (1995-Present)
Other Public Company Board Memberships During Past 5 Years:
· CBIZ, Inc., a public company providing professional business services, products and solutions, Director (1997-Present)
No. of Portfolios for which Board Member Serves: 94
———————
Peggy C. Davis (79)
Board Member (2006)
Principal Occupation During Past 5 Years:
· Shad Professor of Law, New York University School of Law (1983-Present)
No. of Portfolios for which Board Member Serves: 33
———————
Gina D. France (64)
Board Member (2019)
Principal Occupation During Past 5 Years:
· France Strategic Partners, a strategy and advisory firm serving corporate clients across the United States, Founder, President and Chief Executive Officer (2003-Present)
Other Public Company Board Memberships During Past 5 Years:
· Huntington Bancshares, a bank holding company headquartered in Columbus, Ohio, Director (2016-Present)
· Cedar Fair, L.P., a publicly-traded partnership that owns and operates amusement parks and hotels in the U.S. and Canada, Director (2011-Present)
· CBIZ, Inc., a public company providing professional business services, products and solutions, Director (2015-Present)
· FirstMerit Corporation, a diversified financial services company, Director (2004-2016)
No. of Portfolios for which Board Member Serves: 23
———————
Joan Gulley (75)
Board Member (2017)
Principal Occupation During Past 5 Years:
· Nantucket Atheneum, public library, Chair (2018-June 2021) and Director (2015-June 2021)
· Orchard Island Club, golf and beach club, Governor (2016-Present)
No. of Portfolios for which Board Member Serves: 40
———————
52
Robin A. Melvin (59)
Board Member (2012)
Principal Occupation During Past 5 Years:
· Westover School, a private girls’ boarding school in Middlebury, Connecticut, Trustee (2019-Present)
· Mentor Illinois, a non-profit organization dedicated to increasing the quality of mentoring services in Illinois, Co-Chair (2014–2020); Board Member, Mentor Illinois (2013-2020)
· JDRF, a non-profit juvenile diabetes research foundation, Board Member (June 2021-June 2022)
Other Public Company Board Memberships During Past 5 Years:
· HPS Corporate Lending Fund, a closed-end management investment company regulated as a business development company, Trustee (August 2021-Present)
No. of Portfolios for which Board Member Serves: 72
———————
Michael D. DiLecce (60)
Advisory Board Member (2022)
Principal Occupation During Past 5 Years:
· Retired since July 2022. Global Asset Management Assurance Leader, Ernst & Young LLP (2015-2022)
· Americas Regional Talent Managing Partner for Ernst & Young’s Financial Service Practice (2017-2021)
· Partner, Ernst & Young LLP (1997-2022)
No. of Portfolios for which Board Member Serves: 23
———————
The address of the Board Members and Officers is c/o BNY Mellon Investment Adviser, Inc., 240 Greenwich Street, New York, New York 10286. Additional information about each Board Member is available in the fund’s Statement of Additional Information which can be obtained from the Adviser free of charge by calling this toll free number: 1-800-373-9387.
53
OFFICERS OF THE FUND (Unaudited)
DAVID DIPETRILLO, President since January 2021.
Vice President and Director of the Adviser since February 2021; Head of North America Product, BNY Mellon Investment Management since January 2018; and Director of Product Strategy, BNY Mellon Investment Management from January 2016 to December 2017. He is an officer of 55 investment companies (comprised of 109 portfolios) managed by the Adviser or an affiliate of the Adviser. He is 44 years old and has been an employee of BNY Mellon since 2005.
JAMES WINDELS, Treasurer since November 2001.
Vice President of the Adviser since September 2020; and Director–BNY Mellon Fund Administration. He is an officer of 56 investment companies (comprised of 130 portfolios) managed by the Adviser or an affiliate of the Adviser. He is 64 years old and has been an employee of the Adviser since April 1985.
PETER M. SULLIVAN, Chief Legal Officer since July 2021 and Vice President and Assistant Secretary since March 2019.
Chief Legal Officer of the Adviser and Associate General Counsel of BNY Mellon since July 2021; Senior Managing Counsel of BNY Mellon from December 2020 to July 2021; and Managing Counsel of BNY Mellon from March 2009 to December 2020. He is an officer of 56 investment companies (comprised of 130 portfolios) managed by the Adviser or an affiliate of the Adviser. He is 54 years old and has been an employee of BNY Mellon since April 2004.
JAMES BITETTO, Vice President since August 2005 and Secretary since February 2018.
Senior Managing Counsel of BNY Mellon since December 2019; Managing Counsel of BNY Mellon from April 2014 to December 2019; and Secretary of the Adviser. He is an officer of 56 investment companies (comprised of 130 portfolios) managed by the Adviser or an affiliate of the Adviser. He is 56 years old and has been an employee of the Adviser since December 1996.
DEIRDRE CUNNANE, Vice President and Assistant Secretary since March 2019.
Managing Counsel of BNY Mellon since December 2021, Counsel of BNY Mellon from August 2018 to December 2021; and Senior Regulatory Specialist at BNY Mellon Investment Management Services from February 2016 to August 2018. She is an officer of 56 investment companies (comprised of 130 portfolios) managed by the Adviser or an affiliate of the Adviser. She is 32 years old and has been an employee of the Adviser since August 2018.
SARAH S. KELLEHER, Vice President and Assistant Secretary since April 2014.
Vice President of BNY Mellon ETF Investment Adviser; LLC since February 2020; Senior Managing Counsel of BNY Mellon since September 2021; Managing Counsel of BNY Mellon from December 2017 to September 2021; and Senior Counsel of BNY Mellon from March 2013 to December 2017. She is an officer of 56 investment companies (comprised of 130 portfolios) managed by the Adviser or an affiliate of the Adviser. She is 47 years old and has been an employee of the Adviser since March 2013.
JEFF PRUSNOFSKY, Vice President and Assistant Secretary since August 2005.
Senior Managing Counsel of BNY Mellon. He is an officer of 56 investment companies (comprised of 130 portfolios) managed by the Adviser or an affiliate of the Adviser. He is 57 years old and has been an employee of the Adviser since October 1990.
AMANDA QUINN, Vice President and Assistant Secretary since March 2020.
Counsel of BNY Mellon since June 2019; Regulatory Administration Manager at BNY Mellon Investment Management Services from September 2018 to May 2019; and Senior Regulatory Specialist at BNY Mellon Investment Management Services from April 2015 to August 2018. She is an officer of 56 investment companies (comprised of 130 portfolios) managed by the Adviser or an affiliate of the Adviser. She is 37 years old and has been an employee of the Adviser since June 2019.
54
NATALYA ZELENSKY, Vice President and Assistant Secretary since March 2017.
Chief Compliance Officer since August 2021 and Vice President since February 2020 of BNY Mellon ETF Investment Adviser, LLC; Chief Compliance Officer since August 2021 and Vice President and Assistant Secretary since February 2020 of BNY Mellon ETF Trust; Managing Counsel of BNY Mellon from December 2019 to August 2021; Counsel of BNY Mellon from May 2016 to December 2019; and Assistant Secretary of the Adviser from April 2018 to August 2021. She is an officer of 55 investment companies (comprised of 129 portfolios) managed by the Adviser or an affiliate of the Adviser. She is 37 years old and has been an employee of BNY Mellon since May 2016.
DANIEL GOLDSTEIN, Vice President since March 2022.
Vice President and Head of Product Development of North America Product, BNY Mellon Investment Management since January 2018; Co-Head of Product Management, Development & Oversight of North America Product, BNY Mellon Investment Management from January 2010 to January 2018; and Senior Vice President, Development & Oversight of North America Product, BNY Mellon Investment Management since 2010. He is an officer of 55 investment companies (comprised of 109 portfolios) managed by the Adviser or an affiliate of the Adviser. He is 53 years old and has been an employee of the Distributor since 1991.
JOSEPH MARTELLA, Vice President since March 2022.
Vice President and Head of Product Management of North America Product, BNY Mellon Investment Management since January 2018; Director of Product Research and Analytics of North America Product, BNY Mellon Investment Management from January 2010 to January 2018; and Senior Vice President of North America Product, BNY Mellon Investment Management since 2010. He is an officer of 55 investment companies (comprised of 109 portfolios) managed by the Adviser or an affiliate of the Adviser. He is 46 years old and has been an employee of the Distributor since 1999.
GAVIN C. REILLY, Assistant Treasurer since December 2005.
Tax Manager–BNY Mellon Fund Administration. He is an officer of 56 investment companies (comprised of 130 portfolios) managed by the Adviser or an affiliate of the Adviser. He is 54 years old and has been an employee of the Adviser since April 1991.
ROBERT SALVIOLO, Assistant Treasurer since July 2007.
Senior Accounting Manager–BNY Mellon Fund Administration. He is an officer of 56 investment companies (comprised of 130 portfolios) managed by the Adviser or an affiliate of the Adviser. He is 55 years old and has been an employee of the Adviser since June 1989.
ROBERT SVAGNA, Assistant Treasurer since December 2002.
Senior Accounting Manager–BNY Mellon Fund Administration. He is an officer of 56 investment companies (comprised of 130 portfolios) managed by the Adviser or an affiliate of the Adviser. He is 55 years old and has been an employee of the Adviser since November 1990.
JOSEPH W. CONNOLLY, Chief Compliance Officer since October 2004.
Chief Compliance Officer of the BNY Mellon Family of Funds and BNY Mellon Funds Trust since 2004; and Chief Compliance Officer of the Adviser from 2004 until June 2021. He is an officer of 55 investment companies (comprised of 115 portfolios) managed by the Adviser. He is 65 years old.
CARIDAD M. CAROSELLA, Anti-Money Laundering Compliance Officer since January 2016.
Anti-Money Laundering Compliance Officer of the BNY Mellon Family of Funds and BNY Mellon Funds Trust. She is an officer of 48 investment companies (comprised of 122 portfolios) managed by the Adviser or an affiliate of the Adviser. She is 54 years old and has been an employee of the Distributor since 1997.
55
This page intentionally left blank.
56
This page intentionally left blank.
57
BNY Mellon Global Dynamic Bond Income Fund
240 Greenwich Street
New York, NY 10286
Adviser
BNY Mellon Investment Adviser, Inc.
240 Greenwich Street
New York, NY 10286
Sub-Adviser
Newton Investment Management Limited
160 Queen Victoria Street
London, EC4V, 4LA, UK
Custodian
The Bank of New York Mellon
240 Greenwich Street
New York, NY 10286
Transfer Agent &
Dividend Disbursing Agent
BNY Mellon Transfer, Inc.
240 Greenwich Street
New York, NY 10286
Distributor
BNY Mellon Securities Corporation
240 Greenwich Street
New York, NY 10286
| | |
Ticker Symbols: | Class A: DGDAX Class C: DGDCX Class I: DGDIX Class Y: DGDYX |
Telephone Call your financial representative or 1-800-373-9387
Mail The BNY Mellon Family of Funds, 144 Glenn Curtiss Boulevard, Uniondale, NY 11556-0144
E-mail Send your request to info@bnymellon.com
Internet Information can be viewed online or downloaded at www.im.bnymellon.com
The fund files its complete schedule of portfolio holdings with the Securities and Exchange Commission (“SEC”) for the first and third quarters of each fiscal year on Form N-PORT. The fund’s Forms N-PORT are available on the SEC’s website at www.sec.gov.
A description of the policies and procedures that the fund uses to determine how to vote proxies relating to portfolio securities and information regarding how the fund voted these proxies for the most recent 12-month period ended June 30 is available at www.im.bnymellon.com and on the SEC’s website at www.sec.gov and without charge, upon request, by calling 1-800-373-9387.
| | |
© 2022 BNY Mellon Securities Corporation
6298AR1022 | 
|
BNY Mellon Global Real Return Fund
| |
ANNUAL REPORT October 31, 2022 |
| |
Save time. Save paper. View your next shareholder report online as soon as it’s available. Log into www.im.bnymellon.com and sign up for eCommunications. It’s simple and only takes a few minutes. |
| |
The views expressed in this report reflect those of the portfolio manager(s) only through the end of the period covered and do not necessarily represent the views of BNY Mellon Investment Adviser, Inc. or any other person in the BNY Mellon Investment Adviser, Inc. organization. Any such views are subject to change at any time based upon market or other conditions and BNY Mellon Investment Adviser, Inc. disclaims any responsibility to update such views. These views may not be relied on as investment advice and, because investment decisions for a fund in the BNY Mellon Family of Funds are based on numerous factors, may not be relied on as an indication of trading intent on behalf of any fund in the BNY Mellon Family of Funds. |
| |
Not FDIC-Insured • Not Bank-Guaranteed • May Lose Value |
Contents
T H E F U N D
F O R M O R E I N F O R M AT I O N
Back Cover
DISCUSSION OF FUND PERFORMANCE (Unaudited)
For the period from November 1, 2021, through October 31, 2022, as provided by portfolio managers Aron Pataki and Andrew Warwick of Newton Investment Management Limited, sub-adviser.
Market and Fund Performance Overview
For the 12-month period ended October 31, 2022, the BNY Mellon Global Real Return Fund’s (the “fund”) Class A shares produced a total return of −10.16%, Class C shares returned −10.84%, Class I shares returned −9.97% and Class Y shares returned −9.87%.1 In comparison, the fund’s benchmark, the FTSE One-Month U.S. Treasury Bill Index, and the fund’s performance baseline benchmark, the USD 30-day Compounded SOFR, produced total returns of .84% and .86%, respectively, for the same period.2,3
Global equity and fixed-income markets lost ground during the reporting period amid sharply rising inflation, tightening central bank policies and uncertainties related to Russia’s invasion of Ukraine. The fund underperformed its benchmark, largely due to the negative impact of positions in its return-seeking core, particularly global equity exposure.
The Fund’s Investment Approach
The fund seeks total return (consisting of capital appreciation and income). To pursue its goal, the fund uses an actively managed, multi-asset strategy to produce absolute or real returns with less volatility than major equity markets over a complete market cycle, typically a period of five years. Rather than trying to track a benchmark index, the fund seeks to provide returns that are largely independent of market moves.
The fund allocates its investments among global equities, bonds and cash, and, generally to a lesser extent, other asset classes, including real estate, commodities, currencies, and alternative or non-traditional asset classes and strategies, primarily those accessed through derivative instruments.
The fund’s portfolio managers combine a top-down approach, emphasizing economic trends and current investment themes on a global basis, with bottom-up security selection, based on fundamental research, to allocate the fund’s investments among and within asset classes. In choosing investments, the portfolio managers consider key trends in global economic variables, such as gross domestic product, inflation and interest rates; investment themes, such as changing demographics, the impact of new technologies and the globalization of industries and brands; relative valuations of equity securities, bonds and cash; long-term trends in currency movements; and company fundamentals.
Interest Rate Hikes Undermine Global Markets
International bond investors faced turbulent geopolitical, macroeconomic and market conditions during the reporting period. Inflationary pressures increased early in the period due to pandemic-related government stimulus and accommodative monetary policies, along with rising commodity prices and supply-chain bottlenecks. These pressures intensified in February 2022 when Russia attacked Ukraine, causing already elevated energy and commodity prices to spike higher, while prices for fixed-income securities and non-commodity-related equities sharply declined. Outbreaks of the Omicron variant of COVID-19 led to lockdowns of varying severity and duration across the globe, particularly in China, interrupting economic activity while adding to supply-chain strains and further exacerbating inflation.
Despite the risks to growth from war and pandemic, central banks felt compelled to act to try to curb inflation. Numerous rate increases took place globally, with more priced in by financial
2
markets. Several central banks also began the process of quantitative tightening. As the period progressed, recessionary fears took center stage, stemming from the pressure of rising prices on consumers, together with declining consumer confidence and the secondary-order effects of rising interest rates on areas such as the housing market. These conditions produced a distinctly unfavorable backdrop for both bonds and equities, with no real safe havens other than the U.S. dollar. International bond prices (as viewed in U.S. dollar terms) and equities of non-U.S. multinational corporations were further undermined by the steadily rising value of the U.S. dollar relative to most of the world’s currencies.
Global Equities and Hedges Detract from Relative Performance
The fund took several steps to respond to the evolving market environment during the reporting period. We reduced the size of the fund’s return-seeking core, reflecting our more cautious view on markets, primarily by paring back physical equity exposure and dialing up direct equity-market protection. Moreover, given the sensitivity of the fund’s growth compounder equities to rising bond yields, we took steps to tilt the equity mix from growth-oriented stocks to more value and defensively oriented positions. Within the fund’s stabilizing layer, we reintroduced developed-market government bond duration as bond prices fell, and yields soared. Some of the cash raised from equity sales was deployed into short-dated and longer-dated U.S. Treasuries, as well as Australasian government debt. In addition, we increased the fund’s gold position at the onset of the Russia/Ukraine conflict as a hedge against geopolitical risk. On the derivatives front, we elected to increase protection by expanding the scale of the fund’s short futures positions.
In spite of these moves, the fund’s relative performance suffered amid the sharp, broad-based declines witnessed across all major asset classes during the period. The fund’s return-seeking core detracted most significantly from performance, primarily due to global equity exposure. Key detractors included China-exposed stocks Prudential, Alibaba Group and AIA Group, which were hurt by stringent, renewed COVID-19-related lockdowns imposed by the Chinese government. Other security-level weakness involved long-duration growth stocks, such as Microsoft, affected by rising discount rates. Within the fund’s stabilizing layer, indirect hedges detracted from performance as well, with government bond exposure undermined by stubbornly high inflation and resolutely tight central bank monetary policy, and gold exposure by rising real rates and the dollar’s parabolic ascent.
On the positive side, the fund enhanced relative returns through stock selection, primarily among energy-sector holdings such as ConocoPhillips, Marathon Petroleum and Shell. As geopolitical risks increased and defense spending rose, defense-related holdings also bolstered returns, led by BAE Systems and Lockheed Martin. Performance benefited further from the decision to fully hedge the fund back to the U.S. dollar and to adopt a substantially overweight position in the U.S. dollar by shorting the euro and pound sterling against physical assets held. Finally, the fund’s put option protection cushioned the impact of market volatility, particularly in the second quarter of 2022 and in September, when market selloffs threatened to turn into mini-liquidity events.
Maintaining a Prudent Approach
While the market has derated to a considerable degree thus far, the trend may yet have further to run. In many pockets, valuations still look stretched in the prevailing environment of sticky inflation. In addition, corporate earnings appear threatened as increasingly cost-conscious consumers and other factors squeeze company profits.
As of October 31, 2022, the fund’s net equity stands close to historic lows, with significant direct protection, primarily through short futures on a range of equity market indices. Alternatives and corporate bonds also provide helpful diversification. Alternatives, in particular, offer return
3
DISCUSSION OF FUND PERFORMANCE (Unaudited) (continued)
streams that are relatively uncorrelated with traditional assets in areas such as energy storage, renewable energy and green infrastructure. In the fund’s stabilizing layer, government bond exposure has recently been increased, reflecting a more favorable outlook for fixed income, given the increased probability of a recessionary outcome. Gold exposure continues to provide a hedge against geopolitical risk and monetary debasement.
We believe we have proven our ability to be flexible and dynamic in our allocation of the fund’s assets, and active and discerning in our security selection through the lens of our thematic framework. We expect to continue pursuing a prudent investment approach in this challenging environment, remaining ‘battened down’ in terms of the fund’s level of direct and indirect protection.
November 15, 2022
1 Total return includes reinvestment of dividends and any capital gains paid, and does not take into consideration the maximum initial sales charge in the case of Class A shares, or the applicable contingent deferred sales charge imposed on redemptions in the case of Class C shares. Share price and investment return fluctuate such that upon redemption, fund shares may be worth more or less than their original cost. The fund’s return reflects the absorption of certain fund expenses by BNY Mellon Investment Adviser, Inc. pursuant to an agreement in effect through March 1, 2023, at which time it may be extended, modified or terminated. Had these expenses not been absorbed, returns would have been lower. Past performance is no guarantee of future results.
2 Source: FactSet — The USD 1-Month SOFR + 4% per annum Index reflects the Performance Aim for the strategy underlying the fund, over five-year periods (gross of fees). Intrinsic to absolute return funds is an unconstrained investment approach and an internal performance measurement against a goal that reflects portfolio construction focused on risk management and that is designed to deliver positive returns in changing market environments. By contrast, more traditional “relative return” funds are managed to and measured against broad-based benchmark indices, rather than against “absolute” measures of principal risk. SOFR represents the rate at which the world’s most preferred borrowers are able to borrow money and serves as a benchmark for short-term interest rates. Effective November 1, 2021, the fund’s designated performance baseline benchmark changed from USD 1-Month LIBOR to USD 30-day Compounded SOFR. Investors cannot invest directly in any index.
3 Source: Lipper, Inc. — The FTSE One-Month U.S. Treasury Bill Index consists of the last one-month Treasury bill month-end rates. The FTSE One-Month U.S. Treasury Bill Index measures return equivalents of yield averages. The instruments are not marked to market. Investors cannot invest directly in any index.
Please note: the position in any security highlighted with italicized typeface was sold during the reporting period.
Equities are subject generally to market, market sector, market liquidity, issuer and investment style risks, among other factors, to varying degrees, all of which are more fully described in the fund’s prospectus.
Bonds are subject generally to interest-rate, credit, liquidity and market risks, to varying degrees, all of which are more fully described in the fund’s prospectus. Generally, all other factors being equal, bond prices are inversely related to interest-rate changes, and rate increases can cause price declines.
Small and midsized company stocks tend to be more volatile and less liquid than larger company stocks as these companies are less established and have more volatile earnings histories.
Recent market risks include pandemic risks related to COVID-19. The effects of COVID-19 have contributed to increased volatility in global markets and will likely affect certain countries, companies, industries and market sectors more dramatically than others. To the extent the fund may overweight its investments in certain countries, companies, industries or market sectors, such positions will increase the fund's exposure to risk of loss from adverse developments affecting those countries, companies, industries or sectors.
The fund’s performance will be influenced by political, social and economic factors affecting investments in foreign companies. Special risks associated with such companies include exposure to currency fluctuations, less liquidity, less developed or less efficient trading markets, lack of comprehensive company information, political instability and differing auditing and legal standards.
Because the fund seeks to provide exposure to alternative or non-traditional (i.e., satellite) asset categories or investment strategies, the fund’s performance will be linked to the performance of these highly volatile asset categories and strategies. Accordingly, investors should consider purchasing shares of the fund only as part of an overall diversified portfolio and should be willing to assume the risks of potentially significant fluctuations in the value of fund shares.
The fund may, but is not required to, use derivative instruments. A small investment in derivatives could have a potentially large impact on the fund’s performance. The use of derivatives involves risks different from, or possibly greater than, the risks associated with investing directly in the underlying assets.
4
FUND PERFORMANCE (Unaudited)
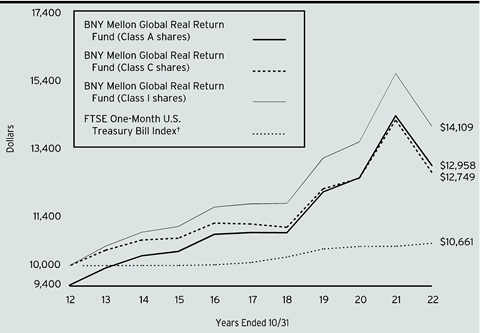
Comparison of change in value of a $10,000 investment in Class A shares, Class C shares, and Class I shares of BNY Mellon Global Real Return Fund with a hypothetical investment of $10,000 in the FTSE One-Month U.S. Treasury Bill Index.
† Source: Lipper Inc.
Past performance is not predictive of future performance.
The above graph compares a hypothetical investment of $10,000 made in each of the Class A shares, Class C shares, and Class I shares of BNY Mellon Global Real Return Fund on 10/31/12 to a hypothetical investment of $10,000 made in the FTSE One-Month U.S. Treasury Bill Index on that date. All dividends and capital gain distributions are reinvested.
The fund’s performance shown in the line graph above takes into account the maximum initial sales charge on Class A shares and all other applicable fees and expenses on Class A shares, Class C shares, and Class I shares. The FTSE One-Month U.S. Treasury Bill Index consists of the last one-month Treasury bill month-end rates. The FTSE One-Month U.S. Treasury Bill Index measures return equivalents of yield averages. The instruments are not marked to market. Unlike a mutual fund, the indices are not subject to charges, fees and other expenses. Investors cannot invest directly in any index. Further information relating to fund performance, including expense reimbursements, if applicable, is contained in the Financial Highlights section of the prospectus and elsewhere in this report.
5
FUND PERFORMANCE (Unaudited) (continued)
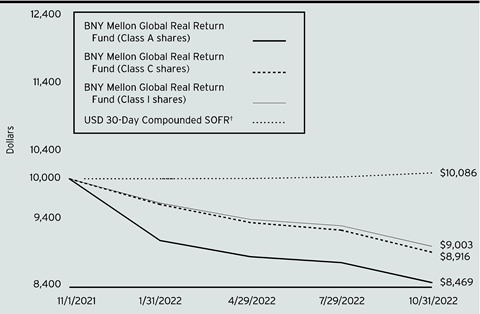
Comparison of change in value of a $10,000 investment in Class A shares, Class C shares, and Class I shares of BNY Mellon Global Real Return Fund with a hypothetical investment of $10,000 in the USD 30-day Compounded SOFR.
† Source: FactSet
Past performance is not predictive of future performance.
The above graph compares a hypothetical investment of $10,000 made in each of the Class A shares, Class C shares, and Class I shares of BNY Mellon Global Real Return Fund on 11/1/21 to a hypothetical investment of $10,000 made in the USD 30-day Compounded SOFR on that date. All dividends and capital gain distributions are reinvested.
Effective 11/1/2021, the fund changed its benchmark from USD 1-Month LIBOR to the USD 30-day Compounded SOFR. Performance information for the fund versus the USD 30-day Compounded SOFR is included in the graph and table on the next page.
The fund’s performance shown in the line graph above takes into account the maximum initial sales charge on Class A shares and all other applicable fees and expenses on Class A shares, Class C shares, and Class I shares. The USD 1-Month SOFR + 4% per annum Index reflects the Performance Aim for the strategy underlying the fund, over five-year periods (gross of fees). Intrinsic to absolute return funds is an unconstrained investment approach and an internal performance measurement against a goal that reflects portfolio construction focused on risk management and that is designed to deliver positive returns in changing market environments. By contrast, more traditional “relative return” funds are managed to and measured against broad-based benchmark indices, rather than against “absolute” measures of principal risk. SOFR represents the rate at which the world’s most preferred borrowers are able to borrow money and serves as a benchmark for short-term interest rates. Unlike a mutual fund, the indices are not subject to charges, fees and other expenses. Investors cannot invest directly in any index. Further information relating to fund performance, including expense reimbursements, if applicable, is contained in the Financial Highlights section of the prospectus and elsewhere in this report.
6
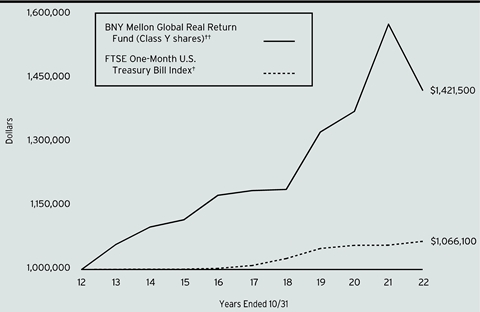
Comparison of change in value of a $1,000,000 investment in Class Y shares of BNY Mellon Global Real Return Fund with a hypothetical investment of $1,000,000 in the FTSE One-Month U.S. Treasury Bill Index.
† Source: Lipper Inc.
†† The total return figures presented for Class Y shares of the fund reflect the performance of the fund’s Class A shares for the period prior to 7/1/13 (the inception date for Class Y shares), not reflecting the applicable sales charges for Class A shares.
Past performance is not predictive of future performance.
The above graph compares a hypothetical investment of $1,000,000 made in Class Y shares of BNY Mellon Global Real Return Fund on 10/31/12 to a hypothetical investment of $1,000,000 made in the FTSE One-Month U.S. Treasury Bill Index on that date. All dividends and capital gain distributions are reinvested.
The fund’s performance shown in the line graph above takes into account all applicable fees and expenses of the fund’s Class Y shares. The FTSE One-Month U.S. Treasury Bill Index consists of the last one-month Treasury bill month-end rates. The FTSE One-Month U.S. Treasury Bill Index measures return equivalents of yield averages. The instruments are not marked to market. Unlike a mutual fund, the indices are not subject to charges, fees and other expenses. Investors cannot invest directly in any index. Further information relating to fund performance, including expense reimbursements, if applicable, is contained in the Financial Highlights section of the prospectus and elsewhere in this report.
7
FUND PERFORMANCE (Unaudited) (continued)
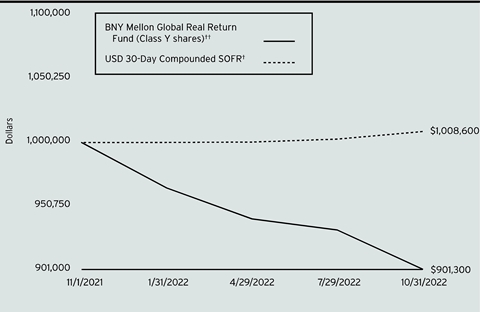
Comparison of change in value of a $1,000,000 investment in Class Y shares of BNY Mellon Global Real Return Fund with a hypothetical investment of $1,000,000 in the USD 30-day Compounded SOFR.
† Source: FactSet
†† The total return figures presented for Class Y shares of the fund reflect the performance of the fund’s Class A shares for the period prior to 7/1/13 (the inception date for Class Y shares), not reflecting the applicable sales charges for Class A shares.
Past performance is not predictive of future performance.
The above graph compares a hypothetical investment of $1,000,000 made in Class Y shares of BNY Mellon Global Real Return Fund on 11/1/21 to a hypothetical investment of $1,000,000 made in the USD 30-day Compounded SOFR on that date. All dividends and capital gain distributions are reinvested.
Effective 11/1/2021, the fund changed its benchmark from USD 1-Month LIBOR to the USD 30-day Compounded SOFR. Performance information for the fund versus the USD 30-day Compounded SOFR is included in the graph and table on the next page. The fund’s performance shown in the line graph above takes into account all applicable fees and expenses of the fund’s Class Y shares. The USD 1-Month SOFR + 4% per annum Index reflects the Performance Aim for the strategy underlying the fund, over five-year periods (gross of fees). Intrinsic to absolute return funds is an unconstrained investment approach and an internal performance measurement against a goal that reflects portfolio construction focused on risk management and that is designed to deliver positive returns in changing market environments. By contrast, more traditional “relative return” funds are managed to and measured against broad-based benchmark indices, rather than against “absolute” measures of principal risk. SOFR represents the rate at which the world’s most preferred borrowers are able to borrow money and serves as a benchmark for short-term interest rates. Unlike a mutual fund, the indices are not subject to charges, fees and other expenses. Investors cannot invest directly in any index. Further information relating to fund performance, including expense reimbursements, if applicable, is contained in the Financial Highlights section of the prospectus and elsewhere in this report.
8
| | | | | |
Average Annual Total Returns as of 10/31/2022 |
| | Inception
Date | 1 Year | 5 Years | 10 Years |
Class A shares | | | | |
with maximum sales charge (5.75%) | 5/12/10 | -15.31% | 2.15% | 2.63% |
without sales charge | 5/12/10 | -10.16% | 3.37% | 3.24% |
Class C shares | | | | |
with applicable redemption charge† | 5/12/10 | -11.72% | 2.57% | 2.46% |
without redemption | 5/12/10 | -10.84% | 2.57% | 2.46% |
Class I shares | 5/12/10 | -9.97% | 3.60% | 3.50% |
Class Y shares | 7/1/13 | -9.87% | 3.70% | 3.58%†† |
FTSE One-Month U.S. Treasury Bill Index | | .84% | 1.10% | .64% |
USD 30-Day Compounded SOFR | 11/1/21 | .86% | - | - |
† The maximum contingent deferred sales charge for Class C shares is 1% for shares redeemed within one year of the date of purchase.
†† The total return performance figures presented for Class Y shares of the fund reflect the performance of the fund’s Class A shares for the period prior to 7/1/13 (the inception date for Class Y shares), not reflecting the applicable sales charges for Class A shares.
The performance data quoted represents past performance, which is no guarantee of future results. Share price and investment return fluctuate and an investor’s shares may be worth more or less than original cost upon redemption. Current performance may be lower or higher than the performance quoted. Go to www.im.bnymellon.com for the fund’s most recent month-end returns.
The fund’s performance shown in the graphs and table does not reflect the deduction of taxes that a shareholder would pay on fund distributions or the redemption of fund shares. In addition to the performance of Class A shares shown with and without a maximum sales charge, the fund’s performance shown in the table takes into account all other applicable fees and expenses on all classes.
9
UNDERSTANDING YOUR FUND’S EXPENSES (Unaudited)
As a mutual fund investor, you pay ongoing expenses, such as management fees and other expenses. Using the information below, you can estimate how these expenses affect your investment and compare them with the expenses of other funds. You also may pay one-time transaction expenses, including sales charges (loads) and redemption fees, which are not shown in this section and would have resulted in higher total expenses. For more information, see your fund’s prospectus or talk to your financial adviser.
Review your fund’s expenses
The table below shows the expenses you would have paid on a $1,000 investment in BNY Mellon Global Real Return Fund from May 1, 2022 to October 31, 2022. It also shows how much a $1,000 investment would be worth at the close of the period, assuming actual returns and expenses.
| | | | | | | |
Expenses and Value of a $1,000 Investment | |
Assume actual returns for the six months ended October 31, 2022 | |
| | | | | | |
| | Class A | Class C | Class I | Class Y | |
Expenses paid per $1,000† | $5.38 | $9.21 | $4.34 | $3.90 | |
Ending value (after expenses) | $957.00 | $953.20 | $957.80 | $958.50 | |
COMPARING YOUR FUND’S EXPENSES WITH THOSE OF OTHER FUNDS (Unaudited)
Using the SEC’s method to compare expenses
The Securities and Exchange Commission (“SEC”) has established guidelines to help investors assess fund expenses. Per these guidelines, the table below shows your fund’s expenses based on a $1,000 investment, assuming a hypothetical 5% annualized return. You can use this information to compare the ongoing expenses (but not transaction expenses or total cost) of investing in the fund with those of other funds. All mutual fund shareholder reports will provide this information to help you make this comparison. Please note that you cannot use this information to estimate your actual ending account balance and expenses paid during the period.
| | | | | | | |
Expenses and Value of a $1,000 Investment | |
Assuming a hypothetical 5% annualized return for the six months ended October 31, 2022 | |
| | | | | | |
| | Class A | Class C | Class I | Class Y | |
Expenses paid per $1,000† | $5.55 | $9.50 | $4.48 | $4.02 | |
Ending value (after expenses) | $1,019.71 | $1,015.78 | $1,020.77 | $1,021.22 | |
† | Expenses are equal to the fund’s annualized expense ratio of 1.09% for Class A, 1.87% for Class C, .88% for Class I and .79% for Class Y, multiplied by the average account value over the period, multiplied by 184/365 (to reflect the one-half year period). |
10
CONSOLIDATED STATEMENT OF INVESTMENTS
October 31, 2022
| | | | | | | | | | |
| |
Description | Coupon
Rate (%) | | Maturity Date | | Principal Amount ($) | a | Value ($) | |
Bonds and Notes - 36.6% | | | | | |
Australia - 1.6% | | | | �� | |
Australia, Sr. Unscd. Bonds, Ser. 144 | AUD | 3.75 | | 4/21/2037 | | 45,513,000 | | 28,390,926 | |
Australia, Sr. Unscd. Bonds, Ser. 150 | AUD | 3.00 | | 3/21/2047 | | 50,670,000 | | 26,899,373 | |
| | 55,290,299 | |
Curacao - 3.3% | | | | | |
Merrill Lynch International & Co. CV, Structured Notes, Ser. 3 | | 0.00 | | 1/24/2025 | | 118,657,400 | b | 117,352,169 | |
France - .2% | | | | | |
Altice France SA, Sr. Scd. Bonds | EUR | 4.13 | | 1/15/2029 | | 4,944,000 | | 3,787,483 | |
Banijay Entertainment SASU, Sr. Scd. Notes | | 5.38 | | 3/1/2025 | | 500,000 | c | 464,055 | |
Iliad Holding SASU, Sr. Scd. Notes | EUR | 5.63 | | 10/15/2028 | | 5,576,000 | | 4,962,051 | |
| | 9,213,589 | |
Germany - .1% | | | | | |
TK Elevator Midco GmbH, Sr. Scd. Bonds | EUR | 4.38 | | 7/15/2027 | | 2,718,000 | | 2,283,901 | |
Italy - .6% | | | | | |
Intesa Sanpaolo SPA, Gtd. Notes | | 7.70 | | 9/17/2025 | | 9,506,000 | c,d | 8,252,949 | |
UniCredit SPA, Jr. Sub. Bonds | | 8.00 | | 6/3/2024 | | 5,625,000 | d | 5,276,953 | |
UniCredit SPA, Jr. Sub. Notes | EUR | 3.88 | | 6/3/2027 | | 8,882,000 | d | 6,245,201 | |
| | 19,775,103 | |
Luxembourg - .1% | | | | | |
Summer BC Holdco B Sarl, Sr. Scd. Bonds | EUR | 5.75 | | 10/31/2026 | | 6,583,000 | | 5,658,796 | |
Mexico - .4% | | | | | |
Sigma Alimentos SA de CV, Gtd. Notes | | 4.13 | | 5/2/2026 | | 13,823,000 | | 12,760,702 | |
Netherlands - .1% | | | | | |
Ziggo BV, Sr. Scd. Bonds | EUR | 2.88 | | 1/15/2030 | | 3,571,000 | | 2,773,875 | |
Spain - .7% | | | | | |
Banco Bilbao Vizcaya Argentaria SA, Jr. Sub. Bonds | EUR | 5.88 | | 9/24/2023 | | 6,000,000 | d | 5,637,709 | |
Banco Bilbao Vizcaya Argentaria SA, Jr. Sub. Notes | EUR | 6.00 | | 3/29/2024 | | 7,200,000 | d | 6,863,479 | |
Banco Santander SA, Jr. Sub. Bonds | EUR | 4.75 | | 3/19/2025 | | 7,800,000 | d | 6,480,603 | |
Banco Santander SA, Jr. Sub. Bonds | EUR | 5.25 | | 9/29/2023 | | 5,200,000 | d | 4,786,166 | |
| | 23,767,957 | |
United Kingdom - 5.0% | | | | | |
Barclays Bank PLC, Structured Notes, Ser. DMTQ | | 0.00 | | 11/10/2023 | | 71,827,500 | b | 76,577,049 | |
Barclays Bank PLC, Structured Notes, Ser. F11A | | 0.00 | | 11/13/2023 | | 71,827,500 | b | 74,349,415 | |
11
CONSOLIDATED STATEMENT OF INVESTMENTS (continued)
| | | | | | | | | | |
| |
Description | Coupon
Rate (%) | | Maturity Date | | Principal Amount ($) | a | Value ($) | |
Bonds and Notes - 36.6% (continued) | | | | | |
United Kingdom - 5.0% (continued) | | | | | |
Lloyds Banking Group PLC, Jr. Sub. Bonds | EUR | 4.95 | | 6/27/2025 | | 8,562,000 | d,e | 7,877,560 | |
Lloyds Banking Group PLC, Sr. Unscd. Notes | GBP | 2.25 | | 10/16/2024 | | 8,469,000 | | 9,134,108 | |
Vmed O2 UK Financing I PLC, Sr. Scd. Bonds | GBP | 4.00 | | 1/31/2029 | | 7,588,000 | | 7,125,287 | |
| | 175,063,419 | |
United States - 24.5% | | | | | |
AT&T Inc., Sr. Unscd. Notes | GBP | 2.90 | | 12/4/2026 | | 1,381,000 | | 1,435,772 | |
Ball Corp., Gtd. Notes | | 2.88 | | 8/15/2030 | | 6,402,000 | | 4,982,676 | |
CCO Holdings LLC, Sr. Unscd. Notes | | 5.50 | | 5/1/2026 | | 3,125,000 | c | 3,012,078 | |
Sprint Capital Corp., Gtd. Notes | | 8.75 | | 3/15/2032 | | 4,597,000 | | 5,401,682 | |
Sprint Corp., Gtd. Notes | | 7.13 | | 6/15/2024 | | 3,786,000 | | 3,832,534 | |
U.S. Treasury Bonds | | 3.25 | | 5/15/2042 | | 99,560,600 | | 84,206,489 | |
U.S. Treasury Floating Rate Notes, 3 Month U.S. T-BILL +0.04% | | 4.15 | | 10/31/2023 | | 390,800,000 | f | 391,149,711 | |
U.S. Treasury Floating Rate Notes, 3 Month U.S. T-BILL -0.08% | | 4.04 | | 4/30/2024 | | 75,000,000 | f | 74,891,089 | |
U.S. Treasury Notes | | 2.50 | | 4/30/2024 | | 300,797,100 | e | 291,561,690 | |
United Airlines Inc., Sr. Scd. Notes | | 4.38 | | 4/15/2026 | | 1,224,000 | c | 1,119,370 | |
| | 861,593,091 | |
Total Bonds and Notes
(cost $1,340,176,105) | | 1,285,532,901 | |
Description | | | | | Shares | | Value ($) | |
Common Stocks - 39.6% | | | | | |
Australia - .4% | | | | | |
OZ Minerals Ltd. | | | | | | 610,138 | | 9,365,383 | |
The Star Entertainment Group Ltd. | | | | | | 3,375,043 | g | 6,323,562 | |
| | 15,688,945 | |
Canada - 1.2% | | | | | |
Alamos Gold Inc., Cl. A | | | | | | 2,277,356 | | 17,968,339 | |
Barrick Gold Corp. | | | | | | 1,566,911 | e | 23,550,672 | |
| | 41,519,011 | |
China - 1.0% | | | | | |
LONGi Green Energy Technology Co., CI. A | | | | | | 2,303,319 | | 15,151,456 | |
NARI Technology Co., Cl. A | | | | | | 2,205,288 | | 7,376,480 | |
Yum China Holdings Inc. | | | | | | 334,050 | | 13,812,968 | |
| | 36,340,904 | |
Denmark - .3% | | | | | |
Orsted AS | | | | | | 108,930 | c | 8,975,474 | |
Finland - .4% | | | | | |
Neste OYJ | | | | | | 315,040 | | 13,791,625 | |
12
| | | | | | | | | | |
| |
Description | | | | | Shares | | Value ($) | |
Common Stocks - 39.6% (continued) | | | | | |
France - 1.2% | | | | | |
LVMH SE | | | | | | 30,094 | | 18,985,584 | |
Sanofi | | | | | | 266,163 | | 22,982,291 | |
| | 41,967,875 | |
Germany - 1.0% | | | | | |
Bayer AG | | | | | | 666,488 | | 35,061,951 | |
Guernsey - .0% | | | | | |
Amedeo Air Four Plus Ltd. | | | | | | 2,136,949 | | 845,310 | |
Hong Kong - 1.0% | | | | | |
AIA Group Ltd. | | | | | | 3,041,800 | | 22,970,756 | |
Link REIT | | | | | | 2,153,100 | | 12,738,002 | |
| | 35,708,758 | |
India - .5% | | | | | |
Housing Development Finance Corp. | | | | | | 586,789 | | 17,493,928 | |
Ireland - 3.0% | | | | | |
Accenture PLC, Cl. A | | | | | | 37,905 | | 10,761,230 | |
ICON PLC | | | | | | 129,012 | g | 25,523,734 | |
Medtronic PLC | | | | | | 300,825 | | 26,274,055 | |
Ryanair Holdings PLC, ADR | | | | | | 334,159 | g | 23,020,213 | |
Trane Technologies PLC | | | | | | 126,260 | | 20,154,884 | |
| | 105,734,116 | |
Israel - .5% | | | | | |
SolarEdge Technologies Inc. | | | | | | 73,310 | g | 16,863,499 | |
Japan - .3% | | | | | |
Sony Group Corp. | | | | | | 129,600 | | 8,775,560 | |
Netherlands - 1.0% | | | | | |
ASML Holding NV | | | | | | 36,878 | | 17,384,951 | |
Universal Music Group NV | | | | | | 896,300 | | 17,563,649 | |
| | 34,948,600 | |
South Korea - .6% | | | | | |
Samsung SDI Co. | | | | | | 42,434 | | 21,886,124 | |
Switzerland - 2.0% | | | | | |
Alcon Inc. | | | | | | 248,828 | | 15,135,791 | |
Lonza Group AG | | | | | | 35,484 | | 18,241,917 | |
Nestle SA | | | | | | 336,228 | | 36,595,519 | |
| | 69,973,227 | |
United Kingdom - 10.2% | | | | | |
3i Group PLC | | | | | | 899,864 | | 11,962,925 | |
Anglo American PLC | | | | | | 259,880 | | 7,774,123 | |
AstraZeneca PLC | | | | | | 426,681 | | 50,058,440 | |
BAE Systems PLC | | | | | | 3,990,646 | | 37,270,795 | |
Burberry Group PLC | | | | | | 723,549 | | 15,060,253 | |
Diageo PLC | | | | | | 593,312 | | 24,459,934 | |
Informa PLC | | | | | | 2,460,923 | | 15,680,068 | |
13
CONSOLIDATED STATEMENT OF INVESTMENTS (continued)
| | | | | | | | | | |
| |
Description | | | | | Shares | | Value ($) | |
Common Stocks - 39.6% (continued) | | | | | |
United Kingdom - 10.2% (continued) | | | | | |
Linde PLC | | | | | | 87,871 | | 26,128,442 | |
Prudential PLC | | | | | | 1,583,018 | | 14,692,368 | |
RELX PLC | | | | | | 1,092,550 | | 29,375,582 | |
SDCL Energy Efficiency Income Trust PLC | | | | | | 18,719,270 | | 21,545,412 | |
Shell PLC | | | | | | 2,334,363 | | 64,704,131 | |
Unilever PLC | | | | | | 839,037 | | 38,301,316 | |
| | 357,013,789 | |
United States - 15.0% | | | | | |
Bank of America Corp. | | | | | | 834,930 | | 30,090,877 | |
Booking Holdings Inc. | | | | | | 15,187 | g | 28,391,793 | |
CME Group Inc. | | | | | | 120,287 | | 20,845,737 | |
ConocoPhillips | | | | | | 664,427 | | 83,777,600 | |
Dominion Energy Inc. | | | | | | 526,952 | | 36,870,831 | |
Ecolab Inc. | | | | | | 95,314 | | 14,970,970 | |
Eli Lilly & Co. | | | | | | 66,383 | | 24,036,621 | |
Exelon Corp. | | | | | | 1,034,768 | | 39,931,697 | |
Hess Corp. | | | | | | 155,076 | | 21,878,122 | |
Hubbell Inc. | | | | | | 109,576 | | 26,022,108 | |
Lockheed Martin Corp. | | | | | | 90,765 | | 44,173,510 | |
Marathon Petroleum Corp. | | | | | | 144,648 | | 16,434,906 | |
Microsoft Corp. | | | | | | 139,330 | | 32,342,673 | |
Newmont Corp. | | | | | | 501,816 | | 21,236,853 | |
NextEra Energy Inc. | | | | | | 207,422 | | 16,075,205 | |
Norfolk Southern Corp. | | | | | | 66,543 | | 15,176,462 | |
TE Connectivity Ltd. | | | | | | 95,435 | | 11,665,020 | |
The Cooper Companies | | | | | | 97,063 | | 26,536,053 | |
The Goldman Sachs Group Inc. | | | | | | 49,274 | | 16,975,386 | |
| | 527,432,424 | |
Total Common Stocks
(cost $1,371,505,318) | | 1,390,021,120 | |
Description /Number of Contracts | Exercise
Price | | Expiration Date | | Notional Amount ($) | a | Value ($) | |
Options Purchased - 1.4% | | | | | |
Call Options - .7% | | | | | |
Dax Index, Contracts 2,908 | EUR | 13,200 | | 12/16/2022 | | 191,928,000 | | 6,852,649 | |
Euro Stoxx 50 Price EUR, Contracts 10,693 | EUR | 3,600 | | 12/16/2022 | | 384,948,000 | | 13,219,764 | |
FTSE 100 Index, Contracts 3,928 | GBP | 7,500 | | 12/16/2022 | | 294,600,000 | | 1,216,250 | |
Hang Seng Index December Future, Contracts 3,038 | HKD | 22,000 | | 12/16/2022 | | 3,341,800,000 | | 19,352 | |
S&P 500 Index, Contracts 939 | | 4,200 | | 12/16/2022 | | 394,380,000 | | 2,464,875 | |
| | 23,772,890 | |
14
| | | | | | | | | | |
| |
Description /Number of Contracts | Exercise
Price | | Expiration Date | | Notional Amount ($) | a | Value ($) | |
Options Purchased - 1.4% (continued) | | | | | |
Put Options - .7% | | | | | |
S&P 500 Index, Contracts 416 | | 4,500 | | 11/18/2022 | | 187,200,000 | | 25,937,600 | |
Total Options Purchased
(cost $83,409,802) | | 49,710,490 | |
Description | | | | | Shares | | | |
Exchange-Traded Funds - 6.4% | | | | | |
United States - 6.4% | | | | | |
iShares Gold Trust | | | | | | 3,648,279 | g,h | 113,023,683 | |
SPDR Gold Shares | | | | | | 743,665 | g,h | 112,970,150 | |
U.S. Copper Index Fund | | | | | | 3,471 | g,h | 70,635 | |
Total Exchange-Traded Funds
(cost $249,376,351) | | 226,064,468 | |
| | 1-Day
Yield (%) | | | | | | | |
Investment Companies - 7.5% | | | | | |
Closed-end Investment Companies - 5.0% | | | | | |
BBGI Global Infrastructure SA | | | | | | 5,358,752 | | 9,731,631 | |
Cordiant Digital Infrastructure Fund Ltd. | | | | | | 9,230,593 | c,e | 9,156,582 | |
Greencoat UK Wind PLC | | | | | | 18,901,726 | e | 31,452,601 | |
JLEN Environmental Assets Group Ltd. Foresight Group Holdings | | | | | | 4,341,058 | | 6,163,314 | |
Riverstone Credit Opportunities Income PLC | | | | | | 3,871,998 | | 3,232,274 | |
The Aquila European Renewables Income Fund PLC | | | | | | 19,049,880 | | 16,625,614 | |
The BioPharma Credit Fund PLC | | | | | | 19,756,560 | | 18,946,541 | |
The Gresham House Energy Storage Fund PLC | | | | | | 7,841,693 | e | 14,555,792 | |
The Hipgnosis Songs Fund Ltd. | | | | | | 12,996,706 | | 13,116,068 | |
The Octopus Renewables Infrastructure Trust Fund PLC | | | | | | 19,607,364 | e | 23,520,068 | |
The Renewables Infrastructure Group Ltd. | | | | | | 13,487,442 | | 20,142,581 | |
US Solar Fund PLC | | | | | | 12,016,238 | | 10,105,444 | |
| | 176,748,510 | |
Registered Investment Companies - 2.5% | | | | | |
Dreyfus Institutional Preferred Government Plus Money Market Fund, Institutional Shares | | 3.23 | | | | 86,218,287 | i | 86,218,287 | |
Total Investment Companies
(cost $286,995,273) | | 262,966,797 | |
15
CONSOLIDATED STATEMENT OF INVESTMENTS (continued)
| | | | | | | | | | |
| |
Description | 1-Day
Yield (%) | | | | Shares | | Value ($) | |
Investment of Cash Collateral for Securities Loaned - .4% | | | | | |
Registered Investment Companies - .4% | | | | | |
Dreyfus Institutional Preferred Government Plus Money Market Fund, SL Shares
(cost $12,105,169) | | 3.23 | | | | 12,105,169 | i | 12,105,169 | |
Total Investments (cost $3,343,568,018) | | 91.9% | 3,226,400,945 | |
Cash and Receivables (Net) | | 8.1% | 286,018,490 | |
Net Assets | | 100.0% | 3,512,419,435 | |
ADR—American Depository Receipt
ETF—Exchange-Traded Fund
REIT—Real Estate Investment Trust
SPDR—Standard & Poor's Depository Receipt
AUD—Australian Dollar
EUR—Euro
GBP—British Pound
HKD—Hong Kong Dollar
a Amount stated in U.S. Dollars unless otherwise noted above.
b Security issued with a zero coupon. Income is recognized through the accretion of discount.
c Security exempt from registration pursuant to Rule 144A under the Securities Act of 1933. These securities may be resold in transactions exempt from registration, normally to qualified institutional buyers. At October 31, 2022, these securities were valued at $30,980,508 or .88% of net assets.
d Security is a perpetual bond with no specified maturity date. Maturity date shown is next reset date of the bond.
e Security, or portion thereof, on loan. At October 31, 2022, the value of the fund’s securities on loan was $206,783,605 and the value of the collateral was $214,988,398, consisting of cash collateral of $12,105,169 and U.S. Government & Agency securities valued at $202,883,229. In addition, the value of collateral may include pending sales that are also on loan.
f Variable rate security—interest rate resets periodically and rate shown is the interest rate in effect at period end. Security description also includes the reference rate and spread if published and available.
g Non-income producing security.
h These securities are wholly-owned by the Subsidiary referenced in Note 1.
i Investment in affiliated issuer. The investment objective of this investment company is publicly available and can be found within the investment company’s prospectus.
16
| | |
Portfolio Summary (Unaudited) † | Value (%) |
U.S. Treasury Securities | 24.0 |
Investment Companies | 14.3 |
Health Care | 6.9 |
Banks | 6.9 |
Energy | 6.6 |
Diversified Financials | 5.5 |
Utilities | 2.9 |
Aerospace & Defense | 2.3 |
Metals & Mining | 2.3 |
Foreign Governmental | 1.6 |
Options Purchased | 1.4 |
Food Products | 1.4 |
Telecommunication Services | 1.4 |
Chemicals | 1.2 |
Consumer Staples | 1.1 |
Electronic Components | 1.1 |
Insurance | 1.1 |
Consumer Durables & Apparel | 1.0 |
Consumer Discretionary | .9 |
Information Technology | .9 |
Industrial | .9 |
Commercial & Professional Services | .8 |
Internet Software & Services | .8 |
Beverage Products | .7 |
Airlines | .7 |
Media | .6 |
Semiconductors & Semiconductor Equipment | .5 |
Transportation | .4 |
Retailing | .4 |
Real Estate | .4 |
Financials | .3 |
Technology Hardware & Equipment | .3 |
Advertising | .2 |
Materials | .1 |
| | 91.9 |
† Based on net assets.
See notes to consolidated financial statements.
17
CONSOLIDATED STATEMENT OF INVESTMENTS (continued)
| | | | | | | |
Affiliated Issuers | | | |
Description | Value ($) 10/31/2021 | Purchases ($)† | Sales ($) | Value ($) 10/31/2022 | Dividends/
Distributions ($) | |
Registered Investment Companies - 2.5% | | |
Dreyfus Institutional Preferred Government Plus Money Market Fund, Institutional Shares - 2.5% | 395,768,872 | 3,540,796,852 | (3,850,347,437) | 86,218,287 | 1,998,016 | |
Investment of Cash Collateral for Securities Loaned - .4% | | |
Dreyfus Institutional Preferred Government Plus Money Market Fund, SL Shares - .4% | 33,593,991 | 807,908,107 | (829,396,929) | 12,105,169 | 231,254 | †† |
Total - 2.9% | 429,362,863 | 4,348,704,959 | (4,679,744,366) | 98,323,456 | 2,229,270 | |
† Includes reinvested dividends/distributions.
†† Represents securities lending income earned from the reinvestment of cash collateral from loaned securities, net of fees and collateral investment expenses, and other payments to and from borrowers of securities.
See notes to financial statements.
| | | | | | | |
Futures | | | |
Description | Number of
Contracts | Expiration | Notional
Value ($) | Market
Value ($) | Unrealized (Depreciation) ($) | |
Futures Long | | |
Australian 10 Year Bond | 1,184 | 12/15/2022 | 90,817,120a | 89,731,541 | (1,085,579) | |
U.S. Treasury Long Bond | 1,113 | 12/20/2022 | 149,276,095 | 134,116,500 | (15,159,595) | |
Futures Short | | |
DAX | 352 | 12/16/2022 | 108,095,132a | 115,569,117 | (7,473,985) | |
DJ Euro Stoxx 50 | 6,843 | 12/16/2022 | 227,407,439a | 244,670,678 | (17,263,239) | |
E-mini Nasdaq-100 | 617 | 12/16/2022 | 140,576,107 | 141,259,065 | (682,958) | |
Standard & Poor's 500 E-mini | 3,114 | 12/16/2022 | 597,888,620 | 604,583,100 | (6,694,480) | |
Gross Unrealized Depreciation | | (48,359,836) | |
a Notional amounts in foreign currency have been converted to USD using relevant foreign exchange rates.
See notes to consolidated financial statements.
18
| | | | | | | |
Options Written | | | |
Description/ Contracts/ Counterparties | Exercise Price | Expiration Date | Notional Amount | a | Value ($) | |
Call Options: | | | | | | |
Dax Index,
Contracts 2,908 | 13,800 | 12/16/2022 | 200,652,000 | EUR | (2,895,384) | |
Euro Stoxx 50 Price EUR,
Contracts 10,693 | 3,800 | 12/16/2022 | 406,334,000 | EUR | (4,311,482) | |
FTSE 100 Index,
Contracts 3,928 | 7,800 | 12/16/2022 | 306,384,000 | GBP | (180,185) | |
Hang Seng Index December Future,
Contracts 3,038 | 24,000 | 12/16/2022 | 3,645,600,000 | HKD | (19,352) | |
S&P 500 Index,
Contracts 939 | 4,500 | 12/16/2022 | 422,550,000 | | (337,101) | |
Put Options: | | | | | | |
Dax Index,
Contracts 1,470 | 11,500 | 11/18/2022 | 84,525,000 | EUR | (78,447) | |
Hang Seng Index December Future,
Contracts 914 | 17,000 | 12/16/2022 | 776,900,000 | HKD | (14,118,145) | |
S&P 500 Index,
Contracts 503 | 3,625 | 11/18/2022 | 182,337,500 | | (892,825) | |
S&P 500 Index,
Contracts 416 | 4,200 | 11/18/2022 | 174,720,000 | | (13,376,480) | |
Total Options Written (premiums received $49,780,308) | | | | (36,209,401) | |
a Notional amount stated in U.S. Dollars unless otherwise indicated.
EUR—Euro
GBP—British Pound
HKD—Hong Kong Dollar
See notes to consolidated financial statements.
19
CONSOLIDATED STATEMENT OF INVESTMENTS (continued)
| | | | | | |
Forward Foreign Currency Exchange Contracts | |
Counterparty/ Purchased
Currency | Purchased Currency
Amounts | Currency
Sold | Sold
Currency
Amounts | Settlement Date | Unrealized Appreciation (Depreciation) ($) |
CIBC World Markets Corp. |
United States Dollar | 89,213,090 | Hong Kong Dollar | 699,029,170 | 11/16/2022 | 132,003 |
Japanese Yen | 854,952,027 | United States Dollar | 5,751,748 | 11/16/2022 | 8,118 |
Euro | 19,248,532 | United States Dollar | 18,969,846 | 1/13/2023 | 173,368 |
United States Dollar | 3,556,380 | Australian Dollar | 5,649,643 | 12/15/2022 | (62,671) |
J.P. Morgan Securities LLC |
Hong Kong Dollar | 68,966,589 | United States Dollar | 8,790,309 | 11/16/2022 | (1,522) |
United States Dollar | 372,352 | Hong Kong Dollar | 2,921,133 | 11/16/2022 | 96 |
RBS Securities, Inc. |
British Pound | 14,078,479 | United States Dollar | 15,896,151 | 1/13/2023 | 291,859 |
United States Dollar | 5,643,542 | Euro | 5,760,180 | 1/13/2023 | (85,121) |
State Street Bank and Trust Company |
United States Dollar | 552,318,956 | British Pound | 498,846,142 | 1/13/2023 | (21,274,719) |
Hong Kong Dollar | 412,241,914 | United States Dollar | 52,536,644 | 11/16/2022 | (2,416) |
United States Dollar | 18,616,381 | Japanese Yen | 2,492,370,371 | 11/16/2022 | 1,825,123 |
United States Dollar | 16,017,351 | South Korean Won | 20,956,781,930 | 11/16/2022 | 1,305,042 |
British Pound | 1,660,561 | United States Dollar | 1,843,883 | 1/13/2023 | 65,498 |
United States Dollar | 4,529,118 | British Pound | 3,900,955 | 1/13/2023 | 43,641 |
United States Dollar | 40,192,684 | Chinese Yuan Renminbi | 289,186,362 | 1/13/2023 | 358,277 |
Euro | 18,904,227 | United States Dollar | 18,549,113 | 1/13/2023 | 251,680 |
United States Dollar | 1,002,439,011 | Euro | 1,024,779,648 | 1/13/2023 | (16,733,577) |
United States Dollar | 27,638,011 | Indian Rupee | 2,306,723,652 | 1/13/2023 | (62,680) |
United States Dollar | 8,326,283 | Danish Krone | 61,838,472 | 12/15/2022 | 86,190 |
United States Dollar | 106,436,490 | Australian Dollar | 157,094,952 | 12/15/2022 | 5,804,533 |
United States Dollar | 23,002,838 | Swiss Franc | 22,856,315 | 11/16/2022 | 138,301 |
20
| | | | | | |
Counterparty/ Purchased
Currency | Purchased Currency
Amounts | Currency
Sold | Sold
Currency
Amounts | Settlement Date | Unrealized Appreciation (Depreciation) ($) |
UBS Securities LLC |
United States Dollar | 4,001,432 | Hong Kong Dollar | 31,383,689 | 11/16/2022 | 2,038 |
United States Dollar | 52,074,158 | Swiss Franc | 49,258,168 | 11/16/2022 | 2,798,270 |
Gross Unrealized Appreciation | | | 13,284,037 |
Gross Unrealized Depreciation | | | (38,222,706) |
See notes to consolidated financial statements.
21
CONSOLIDATED STATEMENT OF ASSETS AND LIABILITIES
October 31, 2022
| | | | | | | |
| | | | | | |
| | | Cost | | Value | |
Assets ($): | | | | |
Investments in securities—See Consolidated Statement of Investments
(including securities on loan, valued at $206,783,605)—Note 1(c): | | | |
Unaffiliated issuers | 3,245,244,562 | | 3,128,077,489 | |
Affiliated issuers | | 98,323,456 | | 98,323,456 | |
Cash | | | | | 518,998 | |
Cash denominated in foreign currency | | | 22,451,653 | | 22,423,011 | |
Cash collateral held by broker—Note 4 | | 320,169,013 | |
Receivable for investment securities sold | | 13,782,495 | |
Unrealized appreciation on forward foreign
currency exchange contracts—Note 4 | | 13,284,037 | |
Receivable for shares of Common Stock subscribed | | 5,833,447 | |
Dividends, interest and securities lending income receivable | | 5,509,247 | |
Receivable for futures variation margin—Note 4 | | 4,988,074 | |
Tax reclaim receivable—Note 1(b) | | 2,272,909 | |
Prepaid expenses | | | | | 74,960 | |
| | | | | 3,615,257,136 | |
Liabilities ($): | | | | |
Due to BNY Mellon Investment Adviser, Inc. and affiliates—Note 3(c) | | 2,494,292 | |
Unrealized depreciation on forward foreign
currency exchange contracts—Note 4 | | 38,222,706 | |
Outstanding options written, at value
(premiums received $49,780,308)—Note 4 | | 36,209,401 | |
Payable for shares of Common Stock redeemed | | 12,877,327 | |
Liability for securities on loan—Note 1(c) | | 12,105,169 | |
Payable for investment securities purchased | | 297,548 | |
Foreign capital gains tax payable—Note 1(b) | | 62,170 | |
Directors’ fees and expenses payable | | 47,424 | |
Other accrued expenses | | | | | 521,664 | |
| | | | | 102,837,701 | |
Net Assets ($) | | | 3,512,419,435 | |
Composition of Net Assets ($): | | | | |
Paid-in capital | | | | | 3,448,172,511 | |
Total distributable earnings (loss) | | | | | 64,246,924 | |
Net Assets ($) | | | 3,512,419,435 | |
| | | | | | |
Net Asset Value Per Share | Class A | Class C | Class I | Class Y | |
Net Assets ($) | 67,258,847 | 30,938,836 | 2,479,354,516 | 934,867,236 | |
Shares Outstanding | 4,312,632 | 2,053,968 | 158,264,366 | 59,542,740 | |
Net Asset Value Per Share ($) | 15.60 | 15.06 | 15.67 | 15.70 | |
| | | | | |
See notes to consolidated financial statements. | | | | | |
22
CONSOLIDATED STATEMENT OF OPERATIONS
Year Ended October 31, 2022
| | | | | | | |
| | | | | | |
| | | | | | |
Investment Income ($): | | | | |
Income: | | | | |
Dividends (net of $1,263,523 foreign taxes withheld at source): | |
Unaffiliated issuers | | | 48,927,364 | |
Affiliated issuers | | | 1,997,760 | |
Interest (net of $7,599 foreign taxes withheld at source) | | | 18,775,522 | |
Income from securities lending—Note 1(c) | | | 231,254 | |
Total Income | | | 69,931,900 | |
Expenses: | | | | |
Management fee—Note 3(a) | | | 28,293,935 | |
Shareholder servicing costs—Note 3(c) | | | 2,917,284 | |
Subsidiary management fees—Note 3(a) | | | 690,692 | |
Custodian fees—Note 3(c) | | | 346,404 | |
Distribution fees—Note 3(b) | | | 268,425 | |
Directors’ fees and expenses—Note 3(d) | | | 257,909 | |
Prospectus and shareholders’ reports | | | 242,597 | |
Professional fees | | | 229,749 | |
Registration fees | | | 156,352 | |
Loan commitment fees—Note 2 | | | 64,987 | |
Chief Compliance Officer fees—Note 3(c) | | | 17,405 | |
Miscellaneous | | | 142,861 | |
Total Expenses | | | 33,628,600 | |
Less—reduction in expenses due to undertaking—Note 3(a) | | | (690,692) | |
Less—reduction in fees due to earnings credits—Note 3(c) | | | (465) | |
Net Expenses | | | 32,937,443 | |
Net Investment Income | | | 36,994,457 | |
Realized and Unrealized Gain (Loss) on Investments—Note 4 ($): | | |
Net realized gain (loss) on investments and foreign currency transactions | 68,526,059 | |
Net realized gain (loss) on futures | (31,884,079) | |
Net realized gain (loss) on options transactions | (36,078,610) | |
Net realized gain (loss) on forward foreign currency exchange contracts | 308,738,991 | |
Net Realized Gain (Loss) | | | 309,302,361 | |
Net change in unrealized appreciation (depreciation) on investments
and foreign currency transactions | (673,137,867) | |
Net change in unrealized appreciation (depreciation) on futures | (41,933,755) | |
Net change in unrealized appreciation (depreciation) on
options transactions | (5,305,994) | |
Net change in unrealized appreciation (depreciation) on
forward foreign currency exchange contracts | (27,865,879) | |
Net Change in Unrealized Appreciation (Depreciation) | | | (748,243,495) | |
Net Realized and Unrealized Gain (Loss) on Investments | | | (438,941,134) | |
Net (Decrease) in Net Assets Resulting from Operations | | (401,946,677) | |
| | | | | | |
See notes to consolidated financial statements. | | | | | |
23
CONSOLIDATED STATEMENT OF CHANGES IN NET ASSETS
| | | | | | | | | | |
| | | | Year Ended October 31, |
| | | | 2022 | | 2021 | |
Operations ($): | | | | | | | | |
Net investment income | | | 36,994,457 | | | | 29,839,814 | |
Net realized gain (loss) on investments | | 309,302,361 | | | | 138,850,013 | |
Net change in unrealized appreciation
(depreciation) on investments | | (748,243,495) | | | | 279,307,567 | |
Net Increase (Decrease) in Net Assets
Resulting from Operations | (401,946,677) | | | | 447,997,394 | |
Distributions ($): | |
Distributions to shareholders: | | | | | | | | |
Class A | | | (1,127,100) | | | | (561,895) | |
Class C | | | (323,421) | | | | (154,628) | |
Class I | | | (44,698,030) | | | | (30,566,690) | |
Class Y | | | (17,354,043) | | | | (13,223,639) | |
Total Distributions | | | (63,502,594) | | | | (44,506,852) | |
Capital Stock Transactions ($): | |
Net proceeds from shares sold: | | | | | | | | |
Class A | | | 27,034,005 | | | | 40,595,185 | |
Class C | | | 5,592,727 | | | | 11,777,126 | |
Class I | | | 1,271,023,808 | | | | 1,208,545,792 | |
Class Y | | | 287,258,281 | | | | 273,834,891 | |
Distributions reinvested: | | | | | | | | |
Class A | | | 957,949 | | | | 539,652 | |
Class C | | | 267,073 | | | | 126,788 | |
Class I | | | 40,958,007 | | | | 28,393,091 | |
Class Y | | | 7,030,103 | | | | 6,310,075 | |
Cost of shares redeemed: | | | | | | | | |
Class A | | | (24,731,219) | | | | (15,565,669) | |
Class C | | | (8,374,910) | | | | (5,651,629) | |
Class I | | | (1,167,656,312) | | | | (783,999,472) | |
Class Y | | | (254,893,681) | | | | (260,449,611) | |
Increase (Decrease) in Net Assets
from Capital Stock Transactions | 184,465,831 | | | | 504,456,219 | |
Total Increase (Decrease) in Net Assets | (280,983,440) | | | | 907,946,761 | |
Net Assets ($): | |
Beginning of Period | | | 3,793,402,875 | | | | 2,885,456,114 | |
End of Period | | | 3,512,419,435 | | | | 3,793,402,875 | |
24
| | | | | | | | | | |
| | | | Year Ended October 31, |
| | | | 2022 | | 2021 | |
Capital Share Transactions (Shares): | |
Class Aa,b | | | | | | | | |
Shares sold | | | 1,620,821 | | | | 2,397,868 | |
Shares issued for distributions reinvested | | | 55,086 | | | | 32,667 | |
Shares redeemed | | | (1,509,395) | | | | (915,321) | |
Net Increase (Decrease) in Shares Outstanding | 166,512 | | | | 1,515,214 | |
Class Ca,b | | | | | | | | |
Shares sold | | | 341,648 | | | | 715,629 | |
Shares issued for distributions reinvested | | | 15,794 | | | | 7,885 | |
Shares redeemed | | | (530,218) | | | | (344,112) | |
Net Increase (Decrease) in Shares Outstanding | (172,776) | | | | 379,402 | |
Class Ia | | | | | | | | |
Shares sold | | | 76,268,845 | | | | 71,199,085 | |
Shares issued for distributions reinvested | | | 2,348,510 | | | | 1,715,595 | |
Shares redeemed | | | (71,150,742) | | | | (46,297,262) | |
Net Increase (Decrease) in Shares Outstanding | 7,466,613 | | | | 26,617,418 | |
Class Ya | | | | | | | | |
Shares sold | | | 17,237,215 | | | | 16,063,664 | |
Shares issued for distributions reinvested | | | 402,410 | | | | 380,584 | |
Shares redeemed | | | (15,327,315) | | | | (15,321,100) | |
Net Increase (Decrease) in Shares Outstanding | 2,312,310 | | | | 1,123,148 | |
| | | | | | | | | |
a | During the period ended October 31, 2022, 1,072,396 Class Y shares representing $17,674,426 were exchanged for 1,074,431 Class I shares, 7,661 Class C shares representing $120,604 were exchanged for 7,393 Class I shares and 6,832 Class I shares representing $106,442 were exchanged for 6,863 Class A shares. During the period ended October 31, 2021, 647 Class Y shares representing $10,623 were exchanged for 650 Class A shares and 758,608 Class Y shares representing $12,882,167 were exchanged for 759,920 Class I shares. | |
b | During the period ended October 31, 2022, 1,092 Class C shares representing $17,668 were automatically converted to 1,059 Class A shares and during the period ended October 31, 2021, 84 Class C shares representing $1,357 were automatically converted to 82 Class A shares. | |
See notes to consolidated financial statements. | | | | | | | | |
25
CONSOLIDATED FINANCIAL HIGHLIGHTS
The following tables describe the performance for each share class for the fiscal periods indicated. All information (except portfolio turnover rate) reflects financial results for a single fund share. Net asset value total return is calculated assuming an initial investment made at the net asset value at the beginning of the period, reinvestment of all dividends and distributions at net asset value during the period, and redemption at net asset value on the last day of the period. Net asset value total return includes adjustments in accordance with accounting principles generally accepted in the United States of America and as such, the net asset value for financial reporting purposes and the returns based upon those net asset values may differ from the net asset value and returns for shareholder transactions. These figures have been derived from the fund’s consolidated financial statements.
| | | | | | | |
| | |
| | | Year Ended October 31, |
Class A Shares | | 2022 | 2021 | 2020 | 2019 | 2018 |
Per Share Data ($): | | | | | | |
Net asset value, beginning of period | | 17.62 | 15.56 | 15.37 | 14.32 | 14.39 |
Investment Operations: | | | | | | |
Net investment incomea | | .13 | .11 | .17 | .23 | .22 |
Net realized and unrealized
gain (loss) on investments | | (1.89) | 2.15 | .35 | 1.29 | (.23) |
Total from Investment Operations | | (1.76) | 2.26 | .52 | 1.52 | (.01) |
Distributions: | | | | | | |
Dividends from net
investment income | | (.26) | (.20) | (.33) | (.47) | (.06) |
Net asset value, end of period | | 15.60 | 17.62 | 15.56 | 15.37 | 14.32 |
Total Return (%)b | | (10.16) | 14.60 | 3.42 | 10.97 | (.05) |
Ratios/Supplemental Data (%): | | | | | | |
Ratio of total expenses
to average net assets | | 1.11c | 1.15c | 1.21 | 1.12 | 1.13 |
Ratio of net expenses to
average net assets | | 1.09c,d | 1.10c,d | 1.12d | 1.11d | 1.13 |
Ratio of net investment income
to average net assets | | .77c | .66c | 1.11 | 1.59 | 1.55 |
Portfolio Turnover Rate | | 73.19 | 71.67 | 91.18 | 99.45 | 85.64 |
Net Assets, end of period ($ x 1,000) | | 67,259 | 73,055 | 40,929 | 35,843 | 26,380 |
a Based on average shares outstanding.
b Exclusive of sales charge.
c Amounts do not include the expenses of the underlying funds.
d Reflected is the waiver of the Subsidiary management fee.
See notes to consolidated financial statements.
26
| | | | | | | |
| | |
| | | Year Ended October 31, |
Class C Shares | | 2022 | 2021 | 2020 | 2019 | 2018 |
Per Share Data ($): | | | | | | |
Net asset value, beginning of period | | 17.04 | 15.06 | 14.89 | 13.87 | 13.99 |
Investment Operations: | | | | | | |
Net investment income (loss)a | | (.01) | (.02) | .05 | .12 | .11 |
Net realized and unrealized
gain (loss) on investments | | (1.83) | 2.08 | .33 | 1.26 | (.23) |
Total from Investment Operations | | (1.84) | 2.06 | .38 | 1.38 | (.12) |
Distributions: | | | | | | |
Dividends from net
investment income | | (.14) | (.08) | (.21) | (.36) | - |
Net asset value, end of period | | 15.06 | 17.04 | 15.06 | 14.89 | 13.87 |
Total Return (%)b | | (10.84) | 13.72 | 2.57 | 10.17 | (.86) |
Ratios/Supplemental Data (%): | | | | | | |
Ratio of total expenses
to average net assets | | 1.89c | 1.93c | 1.99 | 1.91 | 1.90 |
Ratio of net expenses
to average net assets | | 1.87c,d | 1.88c,d | 1.90d | 1.90d | 1.89 |
Ratio of net investment income (loss) to average net assets | | (.03)c | (.12)c | .34 | .84 | .82 |
Portfolio Turnover Rate | | 73.19 | 71.67 | 91.18 | 99.45 | 85.64 |
Net Assets, end of period ($ x 1,000) | | 30,939 | 37,947 | 27,814 | 27,817 | 27,739 |
a Based on average shares outstanding.
b Exclusive of sales charge.
c Amounts do not include the expenses of the underlying funds.
d Reflected is the waiver of the Subsidiary management fee.
See notes to consolidated financial statements.
27
CONSOLIDATED FINANCIAL HIGHLIGHTS (continued)
| | | | | | | |
| | |
| | Year Ended October 31, |
Class I Shares | | 2022 | 2021 | 2020 | 2019 | 2018 |
Per Share Data ($): | | | | | | |
Net asset value, beginning of period | | 17.69 | 15.62 | 15.42 | 14.36 | 14.47 |
Investment Operations: | | | | | | |
Net investment incomea | | .16 | .15 | .20 | .27 | .26 |
Net realized and unrealized
gain (loss) on investments | | (1.89) | 2.15 | .36 | 1.30 | (.24) |
Total from Investment Operations | | (1.73) | 2.30 | .56 | 1.57 | .02 |
Distributions: | | | | | | |
Dividends from net
investment income | | (.29) | (.23) | (.36) | (.51) | (.13) |
Net asset value, end of period | | 15.67 | 17.69 | 15.62 | 15.42 | 14.36 |
Total Return (%) | | (9.97) | 14.83 | 3.65 | 11.28 | .11 |
Ratios/Supplemental Data (%): | | | | | | |
Ratio of total expenses
to average net assets | | .90b | .94b | 1.00 | .92 | .90 |
Ratio of net expenses
to average net assets | | .88b,c | .89b,c | .90c | .90c | .90 |
Ratio of net investment income
to average net assets | | .97b | .86b | 1.34 | 1.82 | 1.81 |
Portfolio Turnover Rate | | 73.19 | 71.67 | 91.18 | 99.45 | 85.64 |
Net Assets, end of period ($ x 1,000) | | 2,479,355 | 2,667,773 | 1,939,181 | 1,560,814 | 688,369 |
a Based on average shares outstanding.
b Amounts do not include the expenses of the underlying funds.
c Reflected is the waiver of the Subsidiary management fee.
See notes to consolidated financial statements.
28
| | | | | | | |
| | |
| | Year Ended October 31, |
Class Y Shares | | 2022 | 2021 | 2020 | 2019 | 2018 |
Per Share Data ($): | | | | | | |
Net asset value, beginning of period | | 17.73 | 15.64 | 15.45 | 14.39 | 14.49 |
Investment Operations: | | | | | | |
Net investment incomea | | .18 | .17 | .22 | .29 | .28 |
Net realized and unrealized
gain (loss) on investments | | (1.91) | 2.16 | .34 | 1.29 | (.25) |
Total from Investment Operations | | (1.73) | 2.33 | .56 | 1.58 | .03 |
Distributions: | | | | | | |
Dividends from net
investment income | | (.30) | (.24) | (.37) | (.52) | (.13) |
Net asset value, end of period | | 15.70 | 17.73 | 15.64 | 15.45 | 14.39 |
Total Return (%) | | (9.87) | 15.03 | 3.66 | 11.36 | .24 |
Ratios/Supplemental Data (%): | | | | | | |
Ratio of total expenses
to average net assets | | .81b | .84b | .89 | .81 | .80 |
Ratio of net expenses
to average net assets | | .79b,c | .79b,c | .81c | .80c | .80 |
Ratio of net investment income
to average net assets | | 1.07b | .97b | 1.44 | 1.92 | 1.92 |
Portfolio Turnover Rate | | 73.19 | 71.67 | 91.18 | 99.45 | 85.64 |
Net Assets, end of period ($ x 1,000) | | 934,867 | 1,014,628 | 877,533 | 1,259,436 | 803,690 |
a Based on average shares outstanding.
b Amounts do not include the expenses of the underlying funds.
c Reflected is the waiver of the Subsidiary management fee.
See notes to consolidated financial statements.
29
NOTES TO CONSOLIDATED FINANCIAL STATEMENTS
NOTE 1—Significant Accounting Policies:
BNY Mellon Global Real Return Fund (the “fund”) is a separate diversified series of BNY Mellon Advantage Funds, Inc. (the “Company”), which is registered under the Investment Company Act of 1940, as amended (the “Act”), as an open-end management investment company and operates as a series company currently offering eight series, including the fund. The fund’s investment objective is to seek total return (consisting of capital appreciation and income). BNY Mellon Investment Adviser, Inc. (the “Adviser”), a wholly-owned subsidiary of The Bank of New York Mellon Corporation (“BNY Mellon”), serves as the fund’s investment adviser. Newton Investment Management Limited (the “Sub-Adviser”), a wholly-owned subsidiary of BNY Mellon and an affiliate of the Adviser, serves as the fund’s sub-adviser.
The fund may gain investment exposure to global commodity markets through investments in GRR Commodity Fund Ltd., (the “Subsidiary”), a wholly-owned and controlled subsidiary of the fund organized under the laws of the Cayman Islands. The Subsidiary has the ability to invest in commodities and securities consistent with the investment objective of the fund. The Adviser serves as investment adviser for the Subsidiary, the Sub-Adviser serves as the Subsidiary’s sub-investment advisor and Citibank N.A. serves as the Subsidiary’s custodian. The financial statements have been consolidated and include the accounts of the fund and the Subsidiary. Accordingly, all inter-company transactions and balances have been eliminated. A subscription agreement was entered into between the fund and the Subsidiary, comprising the entire issued share capital of the Subsidiary, with the intent that the fund will remain the sole shareholder and retain all rights. Under the Amended and Restated Memorandum and Articles of Association, shares issued by the Subsidiary confer upon a shareholder the right to receive notice of, to attend and to vote at general meetings of the Subsidiary and shall confer upon the shareholder rights in a winding-up or repayment of capital and the right to participate in the profits or assets of the Subsidiary. The following summarizes the structure and relationship of the Subsidiary at October 31, 2022:
30
| | | | |
| | Subsidiary Activity |
Consolidated fund Net Assets ($) | | 3,512,419,435 | |
Subsidiary Percentage of fund Net Assets | | 6.44% | |
Subsidiary Financial Statement Information ($) | | | |
Total Assets | | 226,278,965 | |
Total Liabilities | | 148,669 | |
Net Assets | | 226,130,296 | |
Total Income | | - | |
Total Expenses | | 737,961 | |
Net Investment (Loss) | | (737,961) | |
Net Realized gain (Loss) | | (896,424) | |
Net Change in Unrealized Appreciation (Depreciation) | | (23,934,914) | |
Net (Decrease) in Net Assets Resulting from Operations | | (25,569,299) | |
On March 8-9, 2022, the Company’s Board of Directors (the“Board”) approved to reallocate a portion of the fund’s authorized, undesignated and unissued shares of the Company and designate them as Class I shares of the fund increasing the authorized Class I shares from 205 million to 255 million shares.
BNY Mellon Securities Corporation (the “Distributor”), a wholly-owned subsidiary of the Adviser, is the distributor of the fund’s shares. The fund is authorized to issue 550 million shares of $.001 par value Common Stock. The fund currently has authorized five classes of shares: Class A (45 million shares authorized), Class C (45 million shares authorized), Class I (255 million shares authorized) and Class Y (205 million shares authorized). Class A and Class C shares are sold primarily to retail investors through financial intermediaries and bear Distribution and/or Shareholder Services Plan fees. Class A shares generally are subject to a sales charge imposed at the time of purchase. Class A shares bought without an initial sales charge as part of an investment of $1 million or more may be charged a contingent deferred sales charge (“CDSC”) of 1.00% if redeemed within one year. Class C shares are subject to a CDSC imposed on Class C shares redeemed within one year of purchase. Class C shares automatically convert to Class A shares eight years after the date of purchase, without the imposition of a sales charge. Class I shares are sold primarily to bank trust departments and other financial service providers (including BNY Mellon and its affiliates), acting on behalf of customers having a qualified trust or an investment account or relationship at such institution, and bear no Distribution or Shareholder Services Plan fees. Class Y shares are sold at net asset value per share generally to institutional investors, and bear no Distribution or Shareholder Services Plan fees. Class I and Class Y shares are offered without a front-end sales charge or CDSC. Other differences between the classes include the services offered to and the expenses borne by each class, the allocation of certain transfer agency costs and certain voting rights. Income, expenses (other than expenses
31
NOTES TO CONSOLIDATED FINANCIAL STATEMENTS (continued)
attributable to a specific class), and realized and unrealized gains or losses on investments are allocated to each class of shares based on its relative net assets.
The Company accounts separately for the assets, liabilities and operations of each series. Expenses directly attributable to each series are charged to that series’ operations; expenses which are applicable to all series are allocated among them on a pro rata basis.
The Financial Accounting Standards Board (“FASB”) Accounting Standards Codification (“ASC”) is the exclusive reference of authoritative U.S. generally accepted accounting principles (“GAAP”) recognized by the FASB to be applied by nongovernmental entities. Rules and interpretive releases of the SEC under authority of federal laws are also sources of authoritative GAAP for SEC registrants. The fund is an investment company and applies the accounting and reporting guidance of the FASB ASC Topic 946 Financial Services-Investment Companies. The fund’s consolidated financial statements are prepared in accordance with GAAP, which may require the use of management estimates and assumptions. Actual results could differ from those estimates.
The Company enters into contracts that contain a variety of indemnifications. The fund’s maximum exposure under these arrangements is unknown. The fund does not anticipate recognizing any loss related to these arrangements.
(a) Portfolio valuation: The fair value of a financial instrument is the amount that would be received to sell an asset or paid to transfer a liability in an orderly transaction between market participants at the measurement date (i.e., the exit price). GAAP establishes a fair value hierarchy that prioritizes the inputs of valuation techniques used to measure fair value. This hierarchy gives the highest priority to unadjusted quoted prices in active markets for identical assets or liabilities (Level 1 measurements) and the lowest priority to unobservable inputs (Level 3 measurements).
Additionally, GAAP provides guidance on determining whether the volume and activity in a market has decreased significantly and whether such a decrease in activity results in transactions that are not orderly. GAAP requires enhanced disclosures around valuation inputs and techniques used during annual and interim periods.
Various inputs are used in determining the value of the fund’s investments relating to fair value measurements. These inputs are summarized in the three broad levels listed below:
32
Level 1—unadjusted quoted prices in active markets for identical investments.
Level 2—other significant observable inputs (including quoted prices for similar investments, interest rates, prepayment speeds, credit risk, etc.).
Level 3—significant unobservable inputs (including the fund’s own assumptions in determining the fair value of investments).
The inputs or methodology used for valuing securities are not necessarily an indication of the risk associated with investing in those securities.
Changes in valuation techniques may result in transfers in or out of an assigned level within the disclosure hierarchy. Valuation techniques used to value the fund’s investments are as follows:
The Board has designated the Adviser as the fund’s valuation designee, effective September 8, 2022, to make all fair value determinations with respect to the fund’s portfolio investments, subject to the Board’s oversight and pursuant to Rule 2a-5 under the Act.
Investments in debt securities excluding short-term investments (other than U.S. Treasury Bills), forward foreign currency exchange contracts (“forward contracts”), futures and options, are valued each business day by one or more independent pricing services (each, a “Service”) approved by the Board. Investments for which quoted bid prices are readily available and are representative of the bid side of the market in the judgment of a Service are valued at the mean between the quoted bid prices (as obtained by a Service from dealers in such securities) and asked prices (as calculated by a Service based upon its evaluation of the market for such securities). Securities are valued as determined by a Service, based on methods which include consideration of the following: yields or prices of securities of comparable quality, coupon, maturity and type; indications as to values from dealers; and general market conditions. The Services are engaged under the general supervision of the Board. These securities are generally categorized within Level 2 of the fair value hierarchy.
Investments in equity securities are valued at the last sales price on the securities exchange or national securities market on which such securities are primarily traded. Securities listed on the National Market System for which market quotations are available are valued at the official closing price or, if there is no official closing price that day, at the last sales price. For open short positions, asked prices are used for valuation purposes. Bid price is used when no asked price is available. Registered investment companies that are not traded on an exchange are valued at their net asset
33
NOTES TO CONSOLIDATED FINANCIAL STATEMENTS (continued)
value. All of the preceding securities are generally categorized within Level 1 of the fair value hierarchy.
Securities not listed on an exchange or the national securities market, or securities for which there were no transactions, are valued at the average of the most recent bid and asked prices. These securities are generally categorized within Level 2 of the fair value hierarchy.
Fair valuing of securities may be determined with the assistance of a Service using calculations based on indices of domestic securities and other appropriate indicators, such as prices of relevant ADRs and futures. Utilizing these techniques may result in transfers between Level 1 and Level 2 of the fair value hierarchy.
When market quotations or official closing prices are not readily available, or are determined not to accurately reflect fair value, such as when the value of a security has been significantly affected by events after the close of the exchange or market on which the security is principally traded (for example, a foreign exchange or market), but before the fund calculates its net asset value, the fund may value these investments at fair value as determined in accordance with the procedures approved by the Board. Certain factors may be considered when fair valuing investments such as: fundamental analytical data, the nature and duration of restrictions on disposition, an evaluation of the forces that influence the market in which the securities are purchased and sold, and public trading in similar securities of the issuer or comparable issuers. These securities are either categorized within Level 2 or 3 of the fair value hierarchy depending on the relevant inputs used.
For securities where observable inputs are limited, assumptions about market activity and risk are used and such securities are generally categorized within Level 3 of the fair value hierarchy.
Investments denominated in foreign currencies are translated to U.S. dollars at the prevailing rates of exchange.
Forward contracts are valued at the forward rate and are generally categorized within Level 2 of the fair value hierarchy. Futures and options, which are traded on an exchange, are valued at the last sales price on the securities exchange on which such securities are primarily traded or at the last sales price on the national securities market on each business day and are generally categorized within Level 1 of the fair value hierarchy. Options traded over-the-counter (“OTC”) are valued at the mean between the bid and asked price and are generally categorized within Level 2 of the fair value hierarchy.
34
The following is a summary of the inputs used as of October 31, 2022 in valuing the fund’s investments:
| | | | | | | |
| | Level 1-Unadjusted Quoted Prices | Level 2- Other Significant Observable Inputs | | Level 3-Significant Unobservable Inputs | Total | |
Assets ($) | | |
Investments in Securities:† | | |
Corporate Bonds | - | 388,433,623 | | - | 388,433,623 | |
Equity Securities - Common Stocks | 731,490,460 | 658,530,660 | †† | - | 1,390,021,120 | |
Exchange-Traded Funds | 226,064,468 | - | | - | 226,064,468 | |
Foreign Governmental | - | 55,290,299 | | - | 55,290,299 | |
Investment Companies | 98,323,456 | 176,748,510 | †† | - | 275,071,966 | |
U.S. Treasury Securities | - | 841,808,979 | | - | 841,808,979 | |
Other Financial Instruments: | | |
Forward Foreign Currency Exchange Contracts††† | - | 13,284,037 | | - | 13,284,037 | |
Options Purchased | 49,710,490 | - | | - | 49,710,490 | |
Liabilities ($) | | |
Other Financial Instruments: | | |
Forward Foreign Currency Exchange Contracts††† | - | (38,222,706) | | - | (38,222,706) | |
Futures††† | (48,359,836) | - | | - | (48,359,836) | |
Options Written | (36,209,401) | - | | - | (36,209,401) | |
† See Consolidated Statement of Investments for additional detailed categorizations, if any.
†† Securities classified within Level 2 at period end as the values were determined pursuant to the fund’s fair valuation procedures.
††† Amount shown represents unrealized appreciation (depreciation) at period end, but only variation margin on exchange-traded and centrally cleared derivatives, if any, are reported in the Consolidated Statement of Assets and Liabilities.
(b) Foreign currency transactions: The fund does not isolate that portion of the results of operations resulting from changes in foreign exchange rates on investments from the fluctuations arising from changes in the market prices of securities held. Such fluctuations are included with the net realized and unrealized gain or loss on investments.
Net realized foreign exchange gains or losses arise from sales of foreign currencies, currency gains or losses realized on securities transactions
35
NOTES TO CONSOLIDATED FINANCIAL STATEMENTS (continued)
between trade and settlement date, and the difference between the amounts of dividends, interest and foreign withholding taxes recorded on the fund’s books and the U.S. dollar equivalent of the amounts actually received or paid. Net unrealized foreign exchange gains and losses arise from changes in the value of assets and liabilities other than investments resulting from changes in exchange rates. Foreign currency gains and losses on foreign currency transactions are also included with net realized and unrealized gain or loss on investments.
Foreign taxes: The fund may be subject to foreign taxes (a portion of which may be reclaimable) on income, stock dividends, realized and unrealized capital gains on investments or certain foreign currency transactions. Foreign taxes are recorded in accordance with the applicable foreign tax regulations and rates that exist in the foreign jurisdictions in which the fund invests. These foreign taxes, if any, are paid by the fund and are reflected in the Consolidated Statement of Operations, if applicable. Foreign taxes payable or deferred or those subject to reclaims as of October 31, 2022, if any, are disclosed in the fund’s Consolidated Statement of Assets and Liabilities.
(c) Securities transactions and investment income: Securities transactions are recorded on a trade date basis. Realized gains and losses from securities transactions are recorded on the identified cost basis. Dividend income is recognized on the ex-dividend date and interest income, including, where applicable, accretion of discount and amortization of premium on investments, is recognized on the accrual basis.
Pursuant to a securities lending agreement with BNY Mellon, the fund may lend securities to qualified institutions. It is the fund’s policy that, at origination, all loans are secured by collateral of at least 102% of the value of U.S. securities loaned and 105% of the value of foreign securities loaned. Collateral equivalent to at least 100% of the market value of securities on loan is maintained at all times. Collateral is either in the form of cash, which can be invested in certain money market mutual funds managed by the Adviser, or U.S. Government and Agency securities. The fund is entitled to receive all dividends, interest and distributions on securities loaned, in addition to income earned as a result of the lending transaction. Should a borrower fail to return the securities in a timely manner, BNY Mellon is required to replace the securities for the benefit of the fund or credit the fund with the market value of the unreturned securities and is subrogated to the fund’s rights against the borrower and the collateral. Additionally, the contractual maturity of security lending transactions are on an overnight and continuous basis. During the period
36
ended October 31, 2022, BNY Mellon earned $31,533 from the lending of the fund’s portfolio securities, pursuant to the securities lending agreement.
(d) Affiliated issuers: Investments in other investment companies advised by the Adviser are considered “affiliated” under the Act.
(e) Market Risk: The value of the securities in which the fund invests may be affected by political, regulatory, economic and social developments, and developments that impact specific economic sectors, industries or segments of the market. The value of a security may also decline due to general market conditions that are not specifically related to a particular company or industry, such as real or perceived adverse economic conditions, changes in the general outlook for corporate earnings, changes in interest or currency rates, changes to inflation, adverse changes to credit markets or adverse investor sentiment generally. In addition, turbulence in financial markets and reduced liquidity in equity, credit and/or fixed income markets may negatively affect many issuers, which could adversely affect the fund. Global economies and financial markets are becoming increasingly interconnected, and conditions and events in one country, region or financial market may adversely impact issuers in a different country, region or financial market. These risks may be magnified if certain events or developments adversely interrupt the global supply chain; in these and other circumstances, such risks might affect companies world-wide. Recent examples include pandemic risks related to COVID-19 and aggressive measures taken world-wide in response by governments, including closing borders, restricting international and domestic travel, and the imposition of prolonged quarantines of large populations, and by businesses, including changes to operations and reducing staff.
Foreign Investment Risk: To the extent the fund invests in foreign securities, the fund’s performance will be influenced by political, social and economic factors affecting investments in foreign issuers. Special risk associated with investments in foreign issuers include exposure to currency fluctuations, less liquidity, less developed or less efficient trading markets, lack of comprehensive company information, political and economic instability and differing auditing and legal standards.
Subsidiary Risk: To the extent the fund invests in the subsidiary, the fund will be indirectly exposed to the risks associated with the subsidiary’s investments. The subsidiary principally invests in commodity-related instruments, including futures and options contracts, swap agreements and pooled investment vehicles that invest in commodities, and the fund's investment in the subsidiary is subject to the same risks that apply to similar investments if held directly by the fund. Changes in applicable laws governing the subsidiary could prevent the fund or the subsidiary from
37
NOTES TO CONSOLIDATED FINANCIAL STATEMENTS (continued)
operating as described in the prospectus and could negatively affect the fund and its shareholders. There also may be federal income tax risks associated with the fund’s investment in the subsidiary.
(f) Dividends and distributions to shareholders: Dividends and distributions are recorded on the ex-dividend date. Dividends from net investment income and dividends from net realized capital gains, if any, are normally declared and paid annually, but the fund may make distributions on a more frequent basis to comply with the distribution requirements of the Internal Revenue Code of 1986, as amended (the “Code”). To the extent that net realized capital gains can be offset by capital loss carryovers, it is the policy of the fund not to distribute such gains. Income and capital gain distributions are determined in accordance with income tax regulations, which may differ from GAAP.
(g) Federal income taxes: It is the policy of the fund to continue to qualify as a regulated investment company, if such qualification is in the best interests of its shareholders, by complying with the applicable provisions of the Code, and to make distributions of taxable income and net realized capital gain sufficient to relieve it from substantially all federal income and excise taxes.
The Subsidiary is classified as a controlled foreign corporation under Subchapter N of the Code. Therefore, the fund is required to increase its taxable income by its share of the Subsidiary’s income. Net investment losses of the Subsidiary cannot be deducted by the fund in the current period nor carried forward to offset taxable income in future periods.
As of and during the period ended October 31, 2022, the fund did not have any liabilities for any uncertain tax positions. The fund recognizes interest and penalties, if any, related to uncertain tax positions as income tax expense in the Consolidated Statement of Operations. During the period ended October 31, 2022, the fund did not incur any interest or penalties.
Each tax year in the four-year period ended October 31, 2022 remains subject to examination by the Internal Revenue Service and state taxing authorities.
At October 31, 2022, the components of accumulated earnings on a tax basis were as follows: undistributed ordinary income $282,212,661, accumulated capital losses $57,447,604 and unrealized depreciation $160,518,133.
38
The fund is permitted to carry forward capital losses for an unlimited period. Furthermore, capital loss carryovers retain their character as either short-term or long-term capital losses.
The accumulated capital loss carryover is available for federal income tax purposes to be applied against future net realized capital gains, if any, realized subsequent to October 31, 2022. If not applied, the fund has $57,447,604 of short-term capital losses which can be carried forward for an unlimited period.
The tax character of distributions paid to shareholders during the fiscal years ended October 31, 2022 and October 31, 2021 were as follows: ordinary income $63,502,594 and $44,506,852, respectively.
During the period ended October 31, 2022, as a result of permanent book to tax differences, primarily due to the tax treatment for Subpart F income from the subsidiary, the fund increased total distributable earnings (loss) by $1,634,385 and decreased paid-in capital by the same amount. Net assets and net asset value per share were not affected by this reclassification.
(h) New accounting pronouncements: In March 2020, the FASB issued Accounting Standards Update 2020-04, Reference Rate Reform (Topic 848): Facilitation of the Effects of Reference Rate Reform on Financial Reporting (“ASU 2020-04”), and in January 2021, the FASB issued Accounting Standards Update 2021-01, Reference Rate Reform (Topic 848): Scope (“ASU 2021-01”), which provides optional, temporary relief with respect to the financial reporting of contracts subject to certain types of modifications due to the planned discontinuation of the London Interbank Offered Rate (“LIBOR”) and other interbank offered rates as of the end of 2021. The temporary relief provided by ASU 2020-04 and ASU 2021-01 is effective for certain reference rate-related contract modifications that occur during the period from March 12, 2020 through December 31, 2022 (“FASB Effective Date”). Management had evaluated the impact of ASU 2020-04 and ASU 2021-01 on the fund’s investments, derivatives, debt and other contracts that will undergo reference rate-related modifications as a result of the Reference Rate Reform. Management will be adopting ASU 2020-04 and ASU 2021-01 on FASB Effective Date or if amended ASU 2020-04 new extended FASB Effective Date, if any. Management will continue to work with other financial institutions and counterparties to modify contracts as required by applicable regulation and within the regulatory deadlines. As of October 31, 2022, management believes these accounting standards have no impact on the fund and does not have any concerns of adopting the regulations by FASB Effective Date.
39
NOTES TO CONSOLIDATED FINANCIAL STATEMENTS (continued)
NOTE 2—Bank Lines of Credit:
The fund participates with other long-term open-end funds managed by the Adviser in a $823.5 million unsecured credit facility led by Citibank, N.A. (the “Citibank Credit Facility”) and a $300 million unsecured credit facility provided by BNY Mellon (the “BNYM Credit Facility”), each to be utilized primarily for temporary or emergency purposes, including the financing of redemptions (each, a “Facility”). The Citibank Credit Facility is available in two tranches: (i) Tranche A is in an amount equal to $688.5 million and is available to all long-term open-ended funds, including the fund, and (ii) Tranche B is an amount equal to $135 million and is available only to BNY Mellon Floating Rate Income Fund, a series of BNY Mellon Investment Funds IV, Inc. In connection therewith, the fund has agreed to pay its pro rata portion of commitment fees for Tranche A of the Citibank Credit Facility and the BNYM Credit Facility. Interest is charged to the fund based on rates determined pursuant to the terms of the respective Facility at the time of borrowing. During the period ended October 31, 2022, the fund did not borrow under the Facilities.
NOTE 3—Management Fee, Sub-Advisory Fee and Other Transactions with Affiliates:
(a) The Adviser has entered into separate management agreements with the fund and the Subsidiary pursuant to which the Adviser receives a management fee computed at the annual rate of .75% of the value of the average daily net assets of each of the fund and the Subsidiary which is payable monthly. In addition, the Adviser has contractually agreed for as long as the fund invests in the Subsidiary, to waive the management fee it receives from the fund in an amount equal to the management fee paid to the Adviser by the Subsidiary. The reduction in expenses, pursuant to the undertaking, amounted to $690,692 during the period ended October 31, 2022.
The Adviser has also contractually agreed, from November 1, 2021 through March 1, 2023, to waive receipt of its fees and/or assume the direct expenses of the fund, so that the direct expenses of none of the fund’s classes (excluding Rule 12b-1 Distribution Plan fees, Shareholder Services Plan fees, taxes, interest expense, brokerage commissions, commitment fees on borrowings and extraordinary expenses) exceed .90% of the value of the fund’s average daily net assets. On or after March 1, 2023, the Adviser may terminate this expense limitation at any time. Because “acquired fund fees and expenses” are incurred indirectly by the fund, as a result of its investments in underlying funds, such fees and expenses are not included in the expense limitation. During the period
40
ended October 31, 2022, there were no reductions in expense pursuant to the undertaking.
Pursuant to a sub-investment advisory agreement between the Adviser and Sub-Adviser, the Adviser pays Sub-Adviser a monthly fee at an annual rate of .36% of the value of the fund’s average daily net assets.
During the period ended October 31, 2022, the Distributor retained $7,771 from commissions earned on sales of the fund’s Class A shares and $620 and $5,426 from CDSC fees on redemptions of the fund’s Class A and Class C shares, respectively.
(b) Under the Distribution Plan adopted pursuant to Rule 12b-1 under the Act, Class C shares pay the Distributor for distributing its shares at an annual rate of .75% of the value of its average daily net assets. The Distributor may pay one or more Service Agents in respect of advertising, marketing and other distribution services, and determines the amounts, if any, to be paid to Service Agents and the basis on which such payments are made. During the period ended October 31, 2022, Class C shares were charged $268,425 pursuant to the Distribution Plan.
(c) Under the Shareholder Services Plan, Class A and Class C shares pay the Distributor at an annual rate of .25% of the value of their average daily net assets for the provision of certain services. The services provided may include personal services relating to shareholder accounts, such as answering shareholder inquiries regarding the fund, and services related to the maintenance of shareholder accounts. The Distributor may make payments to Service Agents (securities dealers, financial institutions or other industry professionals) with respect to these services. The Distributor determines the amounts to be paid to Service Agents. During the period ended October 31, 2022, Class A and Class C shares were charged $185,585 and $89,475, respectively, pursuant to the Shareholder Services Plan.
The fund has an arrangement with BNY Mellon Transfer, Inc., (the “Transfer Agent”), a subsidiary of BNY Mellon and an affiliate of the Adviser, whereby the fund may receive earnings credits when positive cash balances are maintained, which are used to offset Transfer Agent fees. For financial reporting purposes, the fund includes transfer agent net earnings credits, if any, as an expense offset in the Consolidated Statement of Operations.
The fund has an arrangement with The Bank of New York Mellon (the “Custodian”), a subsidiary of BNY Mellon and an affiliate of the Adviser, whereby the fund will receive interest income or be charged overdraft fees when cash balances are maintained. For financial reporting purposes, the
41
NOTES TO CONSOLIDATED FINANCIAL STATEMENTS (continued)
fund includes this interest income and overdraft fees, if any, as interest income in the Consolidated Statement of Operations.
The fund compensates the Transfer Agent, under a transfer agency agreement, for providing transfer agency and cash management services for the fund. The majority of Transfer Agent fees are comprised of amounts paid on a per account basis, while cash management fees are related to fund subscriptions and redemptions. During the period ended October 31, 2022, the fund was charged $16,690 for transfer agency services. These fees are included in Shareholder servicing costs in the Consolidated Statement of Operations. These fees were partially offset by earnings credits of $465.
The fund compensates the Custodian, under a custody agreement, for providing custodial services for the fund. These fees are determined based on net assets, geographic region and transaction activity. During the period ended October 31, 2022, the fund was charged $346,404 pursuant to the custody agreement.
During the period ended October 31, 2022, the fund was charged $17,405 for services performed by the fund’s Chief Compliance Officer and his staff. These fees are included in Chief Compliance Officer fees in the Consolidated Statement of Operations.
The components of “Due to BNY Mellon Investment Adviser, Inc. and affiliates” in the Consolidated Statement of Assets and Liabilities consist of: management fee of $2,256,964, Subsidiary management fee of $120,150, Distribution Plan fees of $19,843, Shareholder Services Plan fees of $20,947, Custodian fees of $188,891, Chief Compliance Officer fees of $5,078 and Transfer Agent fees of $2,569, which are offset against an expense reimbursement currently in effect in the amount of $120,150.
(d) Each Board member also serves as a Board member of other funds in the BNY Mellon Family of Funds complex. Annual retainer fees and attendance fees are allocated to each fund based on net assets.
NOTE 4—Securities Transactions:
The aggregate amount of purchases and sales of investment securities, excluding short-term securities, futures, options transactions and forward contracts, during the period ended October 31, 2022, amounted to $2,848,397,121 and $2,233,350,746, respectively.
Derivatives: A derivative is a financial instrument whose performance is derived from the performance of another asset. The fund enters into International Swaps and Derivatives Association, Inc. Master Agreements or similar agreements (collectively, “Master Agreements”) with its OTC
42
derivative contract counterparties in order to, among other things, reduce its credit risk to counterparties. Master Agreements include provisions for general obligations, representations, collateral and events of default or termination. Under a Master Agreement, the fund may offset with the counterparty certain derivative financial instruments’ payables and/or receivables with collateral held and/or posted and create one single net payment in the event of default or termination. The SEC recently adopted Rule 18f-4 under the Act, which, effective August 18, 2022, regulates the use of derivatives transactions for certain funds registered under the Act. The fund’s derivative transactions are subject to a value-at-risk leverage limit and certain reporting and other requirements pursuant to a derivatives risk management program adopted by the fund
Each type of derivative instrument that was held by the fund during the period ended October 31, 2022 is discussed below.
Futures: In the normal course of pursuing its investment objective, the fund is exposed to market risk, including equity risk and interest risk, as a result of changes in value of underlying financial instruments. The fund invests in futures in order to manage its exposure to or protect against changes in the market. A futures contract represents a commitment for the future purchase or a sale of an asset at a specified date. Upon entering into such contracts, these investments require initial margin deposits with a counterparty, which consist of cash or cash equivalents. The amount of these deposits is determined by the exchange or Board of Trade on which the contract is traded and is subject to change. Accordingly, variation margin payments are received or made to reflect daily unrealized gains or losses which are recorded in the Consolidated Statement of Operations. When the contracts are closed, the fund recognizes a realized gain or loss which is reflected in the Consolidated Statement of Operations. There is minimal counterparty credit risk to the fund with futures since they are exchange traded, and the exchange guarantees the futures against default. Futures open at October 31, 2022 are set forth in the Consolidated Statement of Investment.
Options Transactions: The fund purchases and writes (sells) put and call options to hedge against changes in the values of equities risk or as a substitute for an investment. The fund is subject to market risk in the course of pursuing its investment objectives through its investments in options contracts. A call option gives the purchaser of the option the right (but not the obligation) to buy, and obligates the writer to sell, the underlying financial instrument at the exercise price at any time during the option period, or at a specified date. Conversely, a put option gives the purchaser of the option the right (but not the obligation) to sell, and
43
NOTES TO CONSOLIDATED FINANCIAL STATEMENTS (continued)
obligates the writer to buy the underlying financial instrument at the exercise price at any time during the option period, or at a specified date.
As a writer of call options, the fund receives a premium at the outset and then bears the market risk of unfavorable changes in the price of the financial instrument underlying the option. Generally, the fund realizes a gain, to the extent of the premium, if the price of the underlying financial instrument decreases between the date the option is written and the date on which the option is terminated. Generally, the fund incurs a loss if the price of the financial instrument increases between those dates. The maximum payout for those contracts is limited to the number of call option contracts written and the related strike prices, respectively.
As a writer of put options, the fund receives a premium at the outset and then bears the market risk of unfavorable changes in the price of the financial instrument underlying the option. Generally, the fund realizes a gain, to the extent of the premium, if the price of the underlying financial instrument increases between the date the option is written and the date on which the option is terminated. Generally, the fund incurs a loss if the price of the financial instrument decreases between those dates. The maximum payout for those contracts is limited to the number of put option contracts written and the related strike prices, respectively.
As a writer of an option, the fund has no control over whether the underlying financial instrument may be sold (call) or purchased (put) and as a result bears the market risk of an unfavorable change in the price of the financial instrument underlying the written option. There is a risk of loss from a change in value of such options which may exceed the related premiums received. This risk may be mitigated by Master Agreements, if any, between the fund and the counterparty and the posting of collateral, if any, by the counterparty to the fund to cover the fund’s exposure to the counterparty. The Consolidated Statement of Operations reflects any unrealized gains or losses which occurred during the period as well as any realized gains or losses which occurred upon the expiration or closing of the option transaction. Options purchased and written open at October 31, 2022 are set forth in the Consolidated Statements of Investments.
Forward Foreign Currency Exchange Contracts: The fund enters into forward contracts in order to hedge its exposure to changes in foreign currency exchange rates on its foreign portfolio holdings, to settle foreign currency transactions or as a part of its investment strategy. When executing forward contracts, the fund is obligated to buy or sell a foreign currency at a specified rate on a certain date in the future. With respect to sales of forward contracts, the fund incurs a loss if the value of the contract increases between the date the forward contract is opened and the
44
date the forward contract is closed. The fund realizes a gain if the value of the contract decreases between those dates. With respect to purchases of forward contracts, the fund incurs a loss if the value of the contract decreases between the date the forward contract is opened and the date the forward contract is closed. The fund realizes a gain if the value of the contract increases between those dates. Any realized or unrealized gains or losses which occurred during the period are reflected in the Consolidated Statement of Operations. The fund is exposed to foreign currency risk as a result of changes in value of underlying financial instruments. The fund is also exposed to credit risk associated with counterparty non-performance on these forward contracts, which is generally limited to the unrealized gain on each open contract. This risk may be mitigated by Master Agreements, if any, between the fund and the counterparty and the posting of collateral, if any, by the counterparty to the fund to cover the fund’s exposure to the counterparty. Forward contracts open at October 31, 2022 are set forth in the Consolidated Statement of Investment.
The following tables show the fund’s exposure to different types of market risk as it relates to the Consolidated Statement of Assets and Liabilities and the Consolidated Statement of Operations, respectively.
Fair value of derivative instruments as of October 31, 2022 is shown below:
| | | | | | | | |
| | Derivative
Assets ($) | | | | Derivative
Liabilities ($) | |
Interest rate risk | - | | Interest rate risk | (16,245,174) | 1 |
Equity risk | 49,710,490 | 2 | Equity risk | (68,324,063) | 1,3 |
Foreign exchange risk | 13,284,037 | 4 | Foreign exchange risk | (38,222,706) | 4 |
Gross fair value of
derivative contracts | 62,994,527 | | | | (122,791,943) | |
| | | | | | |
| Consolidated Statement of Assets and Liabilities location: | |
1 | Includes cumulative appreciation (depreciation) on futures as reported in the
Consolidated Statement of Futures, but only the unpaid variation margin is reported in
the Consolidated Statement of Assets and Liabilities. |
2 | Options purchased are included in Investments in securities—Unaffiliated issuers, at value. |
3 | Outstanding options written, at value. | |
4 | Unrealized appreciation (depreciation) on forward foreign currency exchange contracts. |
45
NOTES TO CONSOLIDATED FINANCIAL STATEMENTS (continued)
The effect of derivative instruments in the Consolidated Statement of Operations during the period ended October 31, 2022 is shown below:
| | | | | | | | | | |
Amount of realized gain (loss) on derivatives recognized in income ($) | |
Underlying
risk | Futures | 1 | Options
Transactions | 2 | Forward
Contracts | 3 | Total | |
Interest rate | (37,972,514) | | - | | - | | (37,972,514) | |
Equity | 6,088,435 | | (36,078,610) | | - | | (29,990,175) | |
Foreign
exchange | - | | - | | 308,738,991 | | 308,738,991 | |
Total | (31,884,079) | | (36,078,610) | | 308,738,991 | | 240,776,302 | |
| | | | | | | | |
Net change in unrealized appreciation (depreciation)
on derivatives recognized in income ($) | |
Underlying
risk | Futures | 4 | Options
Transactions | 5 | Forward
Contracts | 6 | Total | |
Interest rate | (16,245,174) | | - | | - | | (16,245,174) | |
Equity | (25,688,581) | | (5,305,994) | | - | | (30,994,575) | |
Foreign
exchange | - | | - | | (27,865,879) | | (27,865,879) | |
Total | (41,933,755) | | (5,305,994) | | (27,865,879) | | (75,105,628) | |
| | | | | | | | | |
| Consolidated Statement of Operations location: | |
1 | Net realized gain (loss) on futures. |
2 | Net realized gain (loss) on options transactions. |
3 | Net realized gain (loss) on forward foreign currency exchange contracts. |
4 | Net change in unrealized appreciation (depreciation) on futures. |
5 | Net change in unrealized appreciation (depreciation) on options transactions. |
6 | Net change in unrealized appreciation (depreciation) on forward foreign currency exchange contracts. |
The provisions of ASC Topic 210 “Disclosures about Offsetting Assets and Liabilities” require disclosure on the offsetting of financial assets and liabilities. These disclosures are required for certain investments, including derivative financial instruments subject to Master Agreements which are eligible for offsetting in the Consolidated Statement of Assets and Liabilities and require the fund to disclose both gross and net information with respect to such investments. For financial reporting purposes, the fund does not offset derivative assets and derivative liabilities that are subject to Master Agreements in the Consolidated Statement of Assets and Liabilities.
46
At October 31, 2022, derivative assets and liabilities (by type) on a gross basis are as follows:
| | | | | | |
Derivative Financial Instruments: | | Assets ($) | | Liabilities ($) | |
Futures | | - | | (48,359,836) | |
Options | | 49,710,490 | | (36,209,401) | |
Forward contracts | | 13,284,037 | | (38,222,706) | |
Total gross amount of derivative | | | | | |
assets and liabilities in the | | | | | |
Consolidated Statement of
Assets and Liabilities | | 62,994,527 | | (122,791,943) | |
Derivatives not subject to | | | | | |
Master Agreements | | (49,710,490) | | 84,569,237 | |
Total gross amount of assets | | | | | |
and liabilities subject to | | | | | |
Master Agreements | | 13,284,037 | | (38,222,706) | |
The following tables present derivative assets and liabilities net of amounts available for offsetting under Master Agreements and net of related collateral received or pledged, if any, as of October 31, 2022:
| | | | | | | |
| | | Financial | | | |
| | | Instruments | | | |
| | | and Derivatives | | | |
| Gross Amount of | | Available | Collateral | | Net Amount of |
Counterparty | Assets ($) | 1 | for Offset ($) | Received ($) | 2 | Assets ($) |
CIBC World
Markets Corp. | 313,489 | | (62,671) | (250,818) | | - |
J.P. Morgan
Securities LLC | 96 | | (96) | - | | - |
RBS Securities, Inc. | 291,859 | | (85,121) | (206,738) | | - |
State Street Bank
and Trust Company | 9,878,285 | | (9,878,285) | - | | - |
UBS Securities LLC | 2,800,308 | | - | (2,150,000) | | 650,308 |
Total | 13,284,037 | | (10,026,173) | (2,607,556) | | 650,308 |
| | | | | | |
47
NOTES TO CONSOLIDATED FINANCIAL STATEMENTS (continued)
| | | | | | | |
| | | Financial | | | |
| | | Instruments | | | |
| | | and Derivatives | | | |
| Gross Amount of | | Available | Collateral | | Net Amount of |
Counterparty | Liabilities ($) | 1 | for Offset ($) | Pledged ($) | 2 | Liabilities ($) |
CIBC World
Markets Corp. | (62,671) | | 62,671 | - | | - |
J.P. Morgan
Securities LLC | (1,522) | | 96 | 1,426 | | - |
RBS Securities, Inc. | (85,121) | | 85,121 | - | | - |
State Street Bank
and Trust Company | (38,073,392) | | 9,878,285 | 28,195,107 | | - |
Total | (38,222,706) | | 10,026,173 | 28,196,533 | | - |
| | | | | | |
1 Absent a default event or early termination, OTC derivative assets and liabilities are presented at gross amounts
and are not offset in the Consolidated Statement of Assets and Liabilities. |
2 In some instances, the actual collateral received and/or pledged may be more than the amount shown due to
over collateralization. |
The following summarizes the average market value of derivatives outstanding during the period ended October 31, 2022:
| | | |
| | Average Market Value ($) |
Equity futures | | 580,803,114 |
Equity options contracts | | 89,981,483 |
Interest rate futures | | 105,253,203 |
Forward contracts | | 1,995,625,911 |
At October 31, 2022, the cost of investments for federal income tax purposes was $3,363,658,921; accordingly, accumulated net unrealized depreciation on investments inclusive of derivative contracts was $126,479,237, consisting of $215,404,363 gross unrealized appreciation and $341,883,600 gross unrealized depreciation.
48
REPORT OF INDEPENDENT REGISTERED PUBLIC ACCOUNTING FIRM
To the Shareholders and the Board of Directors of BNY Mellon Global Real Return Fund
Opinion on the Financial Statements
We have audited the accompanying consolidated statement of assets and liabilities of BNY Mellon Global Real Return Fund (the “Fund”) (one of the funds constituting BNY Mellon Advantage Funds, Inc.), including the consolidated statement of investments, as of October 31, 2022, and the related consolidated statement of operations for the year then ended, the consolidated statements of changes in net assets for each of the two years in the period then ended, the consolidated financial highlights for each of the five years in the period then ended and the related notes (collectively referred to as the “financial statements”). In our opinion, the financial statements present fairly, in all material respects, the consolidated financial position of the Fund (one of the funds constituting BNY Mellon Advantage Funds, Inc.) at October 31, 2022, the consolidated results of its operations for the year then ended, the consolidated changes in its net assets for each of the two years in the period then ended and its consolidated financial highlights for each of the five years in the period then ended, in conformity with U.S. generally accepted accounting principles.
Basis for Opinion
These financial statements are the responsibility of the Fund’s management. Our responsibility is to express an opinion on the Fund’s financial statements based on our audits. We are a public accounting firm registered with the Public Company Accounting Oversight Board (United States) (“PCAOB”) and are required to be independent with respect to the Fund in accordance with the U.S. federal securities laws and the applicable rules and regulations of the Securities and Exchange Commission and the PCAOB.
We conducted our audits in accordance with the standards of the PCAOB. Those standards require that we plan and perform the audit to obtain reasonable assurance about whether the financial statements are free of material misstatement, whether due to error or fraud. The Fund is not required to have, nor were we engaged to perform, an audit of the Fund’s internal control over financial reporting. As part of our audits, we are required to obtain an understanding of internal control over financial reporting, but not for the purpose of expressing an opinion on the effectiveness of the Fund’s internal control over financial reporting. Accordingly, we express no such opinion.
Our audits included performing procedures to assess the risks of material misstatement of the financial statements, whether due to error or fraud, and performing procedures that respond to those risks. Such procedures included examining, on a test basis, evidence regarding the amounts and disclosures in the financial statements. Our procedures included confirmation of securities owned as of October 31, 2022, by correspondence with the custodian, brokers and others; when replies were not received from brokers and others, we performed other auditing procedures. Our audits also included evaluating the accounting principles used and significant estimates made by management, as well as evaluating the overall presentation of the financial statements. We believe that our audits provide a reasonable basis for our opinion.

We have served as the auditor of one or more investment companies in the BNY Mellon Family of Funds since at least 1957, but we are unable to determine the specific year.
New York, New York
December 27, 2022
49
IMPORTANT TAX INFORMATION (Unaudited)
For federal tax purposes, the fund reports 17.54% of the ordinary dividends paid during the fiscal year ended October 31, 2022 as qualifying for the corporate dividends received deduction. For the fiscal year ended October 31, 2022, certain dividends paid by the fund may be subject to a maximum tax rate of 15%, as provided for by the Jobs and Growth Tax Relief Reconciliation Act of 2003. Of the distributions paid during the fiscal year, $29,606,724 represents the maximum amount that may be considered qualified dividend income.
50
LIQUIDITY RISK MANAGEMENT PROGRAM (Unaudited)
Effective June 1, 2019, the fund adopted a liquidity risk management program (the “Liquidity Risk Management Program”) pursuant to the requirements of Rule 22e-4 under the Investment Company Act of 1940, as amended. Rule 22e-4 requires registered open-end funds, including mutual funds and exchange-traded funds but not money market funds, to establish liquidity risk management programs in order to effectively manage fund liquidity and shareholder redemptions. The rule is designed to mitigate the risk that a fund could not meet redemption requests without significantly diluting the interests of remaining investors.
The rule requires the fund to assess, manage and review their liquidity risk at least annually considering applicable factors such as investment strategy and liquidity during normal and foreseeable stressed conditions, including whether the strategy is appropriate for an open-end fund and whether the fund has a relatively concentrated portfolio or large positions in particular issuers. The fund must also assess its use of borrowings and derivatives, short-term and long-term cash flow projections in normal and stressed conditions, holdings of cash and cash equivalents, and borrowing arrangements and other funding sources.
The rule also requires the fund to classify its investments as highly liquid, moderately liquid, less liquid or illiquid based on the number of days the fund expects it would take to liquidate the investment, and to review these classifications at least monthly or more often under certain conditions. The periods range from three or fewer business days for a highly liquid investment to greater than seven calendar days for settlement of a less liquid investment. Illiquid investments are those a fund does not expect to be able to sell or dispose of within seven calendar days without significantly changing the market value. The fund is prohibited from acquiring an investment if, after the acquisition, its holdings of illiquid assets will exceed 15% of its net assets. In addition, if a fund permits redemptions in-kind, the rule requires the fund to establish redemption in-kind policies and procedures governing how and when it will engage in such redemptions.
Pursuant to the rule’s requirements, the Liquidity Risk Management Program has been reviewed and approved by the Board. Furthermore, the Board has received a written report prepared by the Program’s Administrator that addresses the operation of the Program, assesses its adequacy and effectiveness and describes any material changes made to the Program.
Assessment of Program
In the opinion of the Program Administrator, the Program approved by the Board continues to be adequate for the fund and the Program has been implemented effectively. The Program Administrator has monitored the fund’s liquidity risk and the liquidity classification of the securities held by the fund and has determined that the Program is operating effectively.
During the period from January 1, 2021 to December 31, 2021, there were no material changes to the Program and no material liquidity events that impacted the fund. During the period, the fund held sufficient highly liquid assets to meet fund redemptions.
Under normal expected foreseeable fund redemption forecasts and foreseeable stressed fund redemption forecasts, the Program Administrator believes that the fund maintains sufficient highly liquid assets to meet expected fund redemptions.
51
BOARD MEMBERS INFORMATION (Unaudited)
Independent Board Members
Joseph S. DiMartino (79)
Chairman of the Board (1995)
Principal Occupation During Past 5 Years:
· Director or Trustee of funds in the BNY Mellon Family of Funds and certain other entities (as described in the fund’s Statement of Additional Information) (1995-Present)
Other Public Company Board Memberships During Past 5 Years:
· CBIZ, Inc., a public company providing professional business services, products and solutions, Director (1997-Present)
No. of Portfolios for which Board Member Serves: 94
———————
Peggy C. Davis (79)
Board Member (2006)
Principal Occupation During Past 5 Years:
· Shad Professor of Law, New York University School of Law (1983-Present)
No. of Portfolios for which Board Member Serves: 33
———————
Gina D. France (64)
Board Member (2019)
Principal Occupation During Past 5 Years:
· France Strategic Partners, a strategy and advisory firm serving corporate clients across the United States, Founder, President and Chief Executive Officer (2003-Present)
Other Public Company Board Memberships During Past 5 Years:
· Huntington Bancshares, a bank holding company headquartered in Columbus, Ohio, Director (2016-Present)
· Cedar Fair, L.P., a publicly-traded partnership that owns and operates amusement parks and hotels in the U.S. and Canada, Director (2011-Present)
· CBIZ, Inc., a public company providing professional business services, products and solutions, Director (2015-Present)
· FirstMerit Corporation, a diversified financial services company, Director (2004-2016)
No. of Portfolios for which Board Member Serves: 23
———————
Joan Gulley (75)
Board Member (2017)
Principal Occupation During Past 5 Years:
· Nantucket Atheneum, public library, Chair (2018-June 2021) and Director (2015-June 2021)
· Orchard Island Club, golf and beach club, Governor (2016-Present)
No. of Portfolios for which Board Member Serves: 40
———————
52
Robin A. Melvin (59)
Board Member (2012)
Principal Occupation During Past 5 Years:
· Westover School, a private girls’ boarding school in Middlebury, Connecticut, Trustee (2019-Present)
· Mentor Illinois, a non-profit organization dedicated to increasing the quality of mentoring services in Illinois, Co-Chair (2014–2020); Board Member, Mentor Illinois (2013-2020)
· JDRF, a non-profit juvenile diabetes research foundation, Board Member (June 2021-June 2022)
Other Public Company Board Memberships During Past 5 Years:
· HPS Corporate Lending Fund, a closed-end management investment company regulated as a business development company, Trustee (August 2021-Present)
No. of Portfolios for which Board Member Serves: 72
———————
Michael D. DiLecce (60)
Advisory Board Member (2022)
Principal Occupation During Past 5 Years:
· Retired since July 2022. Global Asset Management Assurance Leader, Ernst & Young LLP (2015-2022)
· Americas Regional Talent Managing Partner for Ernst & Young’s Financial Service Practice (2017-2021)
· Partner, Ernst & Young LLP (1997-2022)
No. of Portfolios for which Board Member Serves: 23
———————
The address of the Board Members and Officers is c/o BNY Mellon Investment Adviser, Inc., 240 Greenwich Street, New York, New York 10286. Additional information about each Board Member is available in the fund’s Statement of Additional Information which can be obtained from the Adviser free of charge by calling this toll free number: 1-800-373-9387.
53
OFFICERS OF THE FUND (Unaudited)
DAVID DIPETRILLO, President since January 2021.
Vice President and Director of the Adviser since February 2021; Head of North America Product, BNY Mellon Investment Management since January 2018; and Director of Product Strategy, BNY Mellon Investment Management from January 2016 to December 2017. He is an officer of 55 investment companies (comprised of 109 portfolios) managed by the Adviser or an affiliate of the Adviser. He is 44 years old and has been an employee of BNY Mellon since 2005.
JAMES WINDELS, Treasurer since November 2001.
Vice President of the Adviser since September 2020; and Director–BNY Mellon Fund Administration. He is an officer of 56 investment companies (comprised of 130 portfolios) managed by the Adviser or an affiliate of the Adviser. He is 64 years old and has been an employee of the Adviser since April 1985.
PETER M. SULLIVAN, Chief Legal Officer since July 2021 and Vice President and Assistant Secretary since March 2019.
Chief Legal Officer of the Adviser and Associate General Counsel of BNY Mellon since July 2021; Senior Managing Counsel of BNY Mellon from December 2020 to July 2021; and Managing Counsel of BNY Mellon from March 2009 to December 2020. He is an officer of 56 investment companies (comprised of 130 portfolios) managed by the Adviser or an affiliate of the Adviser. He is 54 years old and has been an employee of BNY Mellon since April 2004.
JAMES BITETTO, Vice President since August 2005 and Secretary since February 2018.
Senior Managing Counsel of BNY Mellon since December 2019; Managing Counsel of BNY Mellon from April 2014 to December 2019; and Secretary of the Adviser. He is an officer of 56 investment companies (comprised of 130 portfolios) managed by the Adviser or an affiliate of the Adviser. He is 56 years old and has been an employee of the Adviser since December 1996.
DEIRDRE CUNNANE, Vice President and Assistant Secretary since March 2019.
Managing Counsel of BNY Mellon since December 2021, Counsel of BNY Mellon from August 2018 to December 2021; and Senior Regulatory Specialist at BNY Mellon Investment Management Services from February 2016 to August 2018. She is an officer of 56 investment companies (comprised of 130 portfolios) managed by the Adviser or an affiliate of the Adviser. She is 32 years old and has been an employee of the Adviser since August 2018.
SARAH S. KELLEHER, Vice President and Assistant Secretary since April 2014.
Vice President of BNY Mellon ETF Investment Adviser; LLC since February 2020; Senior Managing Counsel of BNY Mellon since September 2021; Managing Counsel of BNY Mellon from December 2017 to September 2021; and Senior Counsel of BNY Mellon from March 2013 to December 2017. She is an officer of 56 investment companies (comprised of 130 portfolios) managed by the Adviser or an affiliate of the Adviser. She is 47 years old and has been an employee of the Adviser since March 2013.
JEFF PRUSNOFSKY, Vice President and Assistant Secretary since August 2005.
Senior Managing Counsel of BNY Mellon. He is an officer of 56 investment companies (comprised of 130 portfolios) managed by the Adviser or an affiliate of the Adviser. He is 57 years old and has been an employee of the Adviser since October 1990.
AMANDA QUINN, Vice President and Assistant Secretary since March 2020.
Counsel of BNY Mellon since June 2019; Regulatory Administration Manager at BNY Mellon Investment Management Services from September 2018 to May 2019; and Senior Regulatory Specialist at BNY Mellon Investment Management Services from April 2015 to August 2018. She is an officer of 56 investment companies (comprised of 130 portfolios) managed by the Adviser or an affiliate of the Adviser. She is 37 years old and has been an employee of the Adviser since June 2019.
54
NATALYA ZELENSKY, Vice President and Assistant Secretary since March 2017.
Chief Compliance Officer since August 2021 and Vice President since February 2020 of BNY Mellon ETF Investment Adviser, LLC; Chief Compliance Officer since August 2021 and Vice President and Assistant Secretary since February 2020 of BNY Mellon ETF Trust; Managing Counsel of BNY Mellon from December 2019 to August 2021; Counsel of BNY Mellon from May 2016 to December 2019; and Assistant Secretary of the Adviser from April 2018 to August 2021. She is an officer of 55 investment companies (comprised of 129 portfolios) managed by the Adviser or an affiliate of the Adviser. She is 37 years old and has been an employee of BNY Mellon since May 2016.
DANIEL GOLDSTEIN, Vice President since March 2022.
Vice President and Head of Product Development of North America Product, BNY Mellon Investment Management since January 2018; Co-Head of Product Management, Development & Oversight of North America Product, BNY Mellon Investment Management from January 2010 to January 2018; and Senior Vice President, Development & Oversight of North America Product, BNY Mellon Investment Management since 2010. He is an officer of 55 investment companies (comprised of 109 portfolios) managed by the Adviser or an affiliate of the Adviser. He is 53 years old and has been an employee of the Distributor since 1991.
JOSEPH MARTELLA, Vice President since March 2022.
Vice President and Head of Product Management of North America Product, BNY Mellon Investment Management since January 2018; Director of Product Research and Analytics of North America Product, BNY Mellon Investment Management from January 2010 to January 2018; and Senior Vice President of North America Product, BNY Mellon Investment Management since 2010. He is an officer of 55 investment companies (comprised of 109 portfolios) managed by the Adviser or an affiliate of the Adviser. He is 46 years old and has been an employee of the Distributor since 1999.
GAVIN C. REILLY, Assistant Treasurer since December 2005.
Tax Manager–BNY Mellon Fund Administration. He is an officer of 56 investment companies (comprised of 130 portfolios) managed by the Adviser or an affiliate of the Adviser. He is 54 years old and has been an employee of the Adviser since April 1991.
ROBERT SALVIOLO, Assistant Treasurer since July 2007.
Senior Accounting Manager–BNY Mellon Fund Administration. He is an officer of 56 investment companies (comprised of 130 portfolios) managed by the Adviser or an affiliate of the Adviser. He is 55 years old and has been an employee of the Adviser since June 1989.
ROBERT SVAGNA, Assistant Treasurer since December 2002.
Senior Accounting Manager–BNY Mellon Fund Administration. He is an officer of 56 investment companies (comprised of 130 portfolios) managed by the Adviser or an affiliate of the Adviser. He is 55 years old and has been an employee of the Adviser since November 1990.
JOSEPH W. CONNOLLY, Chief Compliance Officer since October 2004.
Chief Compliance Officer of the BNY Mellon Family of Funds and BNY Mellon Funds Trust since 2004; and Chief Compliance Officer of the Adviser from 2004 until June 2021. He is an officer of 55 investment companies (comprised of 115 portfolios) managed by the Adviser. He is 65 years old.
CARIDAD M. CAROSELLA, Anti-Money Laundering Compliance Officer since January 2016.
Anti-Money Laundering Compliance Officer of the BNY Mellon Family of Funds and BNY Mellon Funds Trust. She is an officer of 48 investment companies (comprised of 122 portfolios) managed by the Adviser or an affiliate of the Adviser. She is 54 years old and has been an employee of the Distributor since 1997.
55
This page intentionally left blank.
56
This page intentionally left blank.
57
BNY Mellon Global Real Return Fund
240 Greenwich Street
New York, NY 10286
Adviser
BNY Mellon Investment Adviser, Inc.
240 Greenwich Street
New York, NY 10286
Sub-Adviser
Newton Investment Management Limited
160 Queen Victoria Street
London, EC4V, 4LA, UK
Custodian
The Bank of New York Mellon
240 Greenwich Street
New York, NY 10286
Transfer Agent &
Dividend Disbursing Agent
BNY Mellon Transfer, Inc.
240 Greenwich Street
New York, NY 10286
Distributor
BNY Mellon Securities Corporation
240 Greenwich Street
New York, NY 10286
| | |
Ticker Symbols: | Class A: DRRAX Class C: DRRCX Class I: DRRIX Class Y: DRRYX |
Telephone Call your financial representative or 1-800-373-9387
Mail The BNY Mellon Family of Funds, 144 Glenn Curtiss Boulevard, Uniondale, NY 11556-0144
E-mail Send your request to info@bnymellon.com
Internet Information can be viewed online or downloaded at www.im.bnymellon.com
The fund files its complete schedule of portfolio holdings with the Securities and Exchange Commission (“SEC”) for the first and third quarters of each fiscal year on Form N-PORT. The fund’s Forms N-PORT are available on the SEC’s website at www.sec.gov.
A description of the policies and procedures that the fund uses to determine how to vote proxies relating to portfolio securities and information regarding how the fund voted these proxies for the most recent 12-month period ended June 30 is available at www.im.bnymellon.com and on the SEC’s website at www.sec.gov and without charge, upon request, by calling 1-800-373-9387.
| | |
© 2022 BNY Mellon Securities Corporation
6278AR1022 | 
|
BNY Mellon Sustainable Balanced Fund
| |
ANNUAL REPORT October 31, 2022 |
| |
Save time. Save paper. View your next shareholder report online as soon as it’s available. Log into www.im.bnymellon.com and sign up for eCommunications. It’s simple and only takes a few minutes. |
| |
The views expressed in this report reflect those of the portfolio manager(s) only through the end of the period covered and do not necessarily represent the views of BNY Mellon Investment Adviser, Inc. or any other person in the BNY Mellon Investment Adviser, Inc. organization. Any such views are subject to change at any time based upon market or other conditions and BNY Mellon Investment Adviser, Inc. disclaims any responsibility to update such views. These views may not be relied on as investment advice and, because investment decisions for a fund in the BNY Mellon Family of Funds are based on numerous factors, may not be relied on as an indication of trading intent on behalf of any fund in the BNY Mellon Family of Funds. |
| |
Not FDIC-Insured • Not Bank-Guaranteed • May Lose Value |
Contents
T H E F U N D
F O R M O R E I N F O R M AT I O N
Back Cover
DISCUSSION OF FUND PERFORMANCE (Unaudited)
For the period from November 1, 2021, through October 31, 2022, as provided by equity portfolio manager Nick Pope of Newton Investment Management Limited, sub-adviser, and fixed-income portfolio managers David Nieman and Nancy G. Rogers, CFA, of Mellon Investments Corporation, sub-adviser.
Market and Fund Performance Overview
For the 12-month period ended October 31, 2022, The BNY Mellon Sustainable Balanced Fund’s (the “fund”) Class K shares produced a total return of −18.57% and Service shares returned −18.76%.1 In comparison, the fund’s benchmark, the MSCI All Country World Index (NDR), the fund’s Customized Blended Index, a blend of 60% MSCI All Country World Index (NDR)/40% Bloomberg MSCI US Aggregate ESG Select Index (the “Index”), and Bloomberg MSCI US Aggregate ESG Select Index produced total returns of −19.96%, −17.97% and −15.50%, respectively, for the same period.2,3
Global equity and fixed-income markets lost ground during the reporting period amid sharply rising inflation, tightening central bank policies and uncertainties related to Russia’s invasion of Ukraine. In equities, the fund underperformed its benchmark, the Customized Blended Index, primarily due to lack of energy exposure. In fixed income, the difference in returns between the fund and the Bloomberg MSCI US Aggregate ESG Select Index was primarily the result of operating expenses that are not reflected in that Index’s results.
The Fund’s Investment Approach
The fund seeks long-term capital appreciation. To pursue its goal, the fund uses a global, multi-asset strategy. The fund normally invests 80% of its net assets, plus any borrowings for investment purposes, in the equity securities of issuers that demonstrate attractive attributes and sustainable business practices and have no material, unresolvable, environmental, social or governance (ESG) issues, and in debt securities included in the Bloomberg MSCI US Aggregate ESG Select Sector Neutral Index. Under normal market conditions, generally 60% of the fund’s net assets will be allocated to equity and equity-related investments and 40% of the fund’s net assets will be allocated to debt and debt-related securities.
The fund’s assets allocated to equity and equity-related investments are actively managed by the fund’s sub-adviser, Newton Investment Management Limited (NIM), an affiliate of BNY Mellon Investment Adviser, Inc. (BNYM Investment Adviser). NIM invests its allocated portion of the fund’s assets in companies it considers to be engaged in “sustainable business practices.” These are companies whose business practices are, in NIM’s view, sustainable in an economic sense (i.e., the company’s strategy, operations and finances are stable and durable) and that take appropriate measures to manage any material consequences or impact of their policies and operations in relation to ESG matters (e.g., the company’s environmental footprint, labor standards, board structure, etc.). Companies engaged in sustainable business practices also may include companies that have committed explicitly to improving their environmental and/or social impacts that will lead to a transformation of their business models. No investment will be made in a company that is deemed by NIM to have material negative environmental, social or governance issues with its business activities. Examples of such companies include: tobacco companies due to the health implications of smoking; a company with a large carbon footprint that has no emission reduction target; or a company that is in direct conflict with the goals of the UN Global Compact (a voluntary corporate initiative that seeks to advance universal principles on human rights, labor,
2
environment and anti-corruption). NIM also may invest in companies where it believes it can promote sustainable business practices through ongoing company engagement and active proxy voting, such as by encouraging the company’s management to improve the company’s environmental footprint or voting the shares it holds of a company to improve the company’s governance structure.
The fund’s assets allocated to debt and debt-related investments are managed by Mellon Investments Corporation (“Mellon”), using an indexed approach. For the portion of the fund’s assets allocated to debt and debt-related investments, Mellon seeks to track the investment results, before fees and expenses, of the Bloomberg MSCI US Aggregate ESG Select Sector Neutral Index. Mellon selects investments for its allocated portion of the fund’s assets by a “sampling” process, which is a statistical process used to select debt securities so that this portion of the fund’s assets has investment characteristics that closely approximate those of the Index (e.g., duration, liquidity, quality, sector, industry, yield and market beta). Specifically, Mellon selects those securities that it determines best correspond to the Index’s aggregate risk metrics of duration, yield/spread, sector and quality, while seeking to mitigate such risks by investing in a diversified number of securities and issuers.
The fund changed its investment objective and strategy on April 1, 2019. Prior to April 1, 2019, the fund’s investment objective was to provide current income, while maintaining the potential for long-term capital appreciation. To pursue these goals, until April 1, 2019, the fund used an actively managed, global multi-asset strategy that focused on income generation. In addition, until April 1, 2019, NIM was the sole sub-adviser for the fund. NIM allocated the fund’s investments among equity and equity-related securities, debt and debt-related securities, and, generally to a lesser extent, real estate, commodities and infrastructure in developed and emerging markets.
Interest Rate Hikes Undermine Global Markets
International bond investors faced turbulent geopolitical, macroeconomic and market conditions during the reporting period. Inflationary pressures increased early in the period due to pandemic-related government stimulus and accommodative monetary policies, along with rising commodity prices and supply-chain bottlenecks. These pressures intensified in February 2022, when Russia attacked Ukraine, causing already elevated energy and commodity prices to spike higher, while prices for fixed-income securities and non-commodity-related equities sharply declined. Outbreaks of the Omicron variant of COVID-19 led to lockdowns of varying severity and duration across the globe, particularly in China, interrupting economic activity while adding to supply-chain strains and further exacerbating inflation.
Despite the risks to growth from war and pandemic, central banks felt compelled to act to try to curb inflation. Numerous rate increases were implemented globally, with more priced in by financial markets. Several central banks also began the process of quantitative tightening. As the period progressed, recessionary fears took center stage, stemming from the pressure of rising prices on consumers, together with declining consumer confidence and the secondary-order effects of rising interest rates on areas such as the housing market. These conditions produced a distinctly unfavorable backdrop for both bonds and equities, with no real safe havens other than the U.S. dollar. International bond prices (as viewed in U.S. dollar terms) and equities of non-U.S. multinational corporations were further
3
DISCUSSION OF FUND PERFORMANCE (Unaudited) (continued)
undermined by the steadily rising value of the U.S. dollar relative to most of the world’s currencies.
Energy Allocation Drive Underperformance
All of the fund’s underperformance relative to the Index can be approximately attributed to the lack of energy sector exposure during a period in which tight supply/demand conditions were exacerbated by the invasion of Ukraine and its broader consequences. Although stock selection in other sectors bolstered relative performance in the aggregate, selection in consumer staples and industrial weighed on relative returns. Among notable underperforming individual holdings, shares in China-based internet services firm Tencent Holdings came under pressure alongside other China-related equities, as Xi Jinping, the country’s president, revealed a new leadership team that demonstrated his tightening grip on power. UK construction materials company Travis Perkins also underperformed, as investors expected higher inflation and a more uncertain economic environment to deter customers from making home improvements.
The fund’s stock selections outperformed by the greatest margin in the information technology, health care and materials sectors. Higher lithium pricing drove strong results for miner Albemarle. Shares in pharmaceutical company Merck & Co. were supported by the company’s attractive valuation and solid fundamentals, as well as news of a potential acquisition that was welcomed by investors. Lack of exposure to social media company Meta Platforms, a sizeable index constituent of the MSCI All Country World Index (NDR), also bolstered relative performance.
Within fixed income, bond prices generally fell across the board as rapidly mounting inflationary pressures drove yields higher. In the United States, the Federal Reserve sharply raised interest rates, with other central banks following suit in an effort to combat inflation.
In this challenging environment, few fixed-income areas offered investors any shelter, although short-duration instruments tended to suffer milder losses than their longer-duration counterparts.
Maintaining a Balanced Position Amid Uncertainty
Global equity markets continue to face now-familiar headwinds: rising inflation, more hawkish policies from global central banks, political uncertainty and growing concern regarding a potential recession. These headwinds are likely to remain in place over the shorter term although, as we reflect on the extent to which equities have now derated, the focus may soon turn to earnings resilience in a weakening economic environment, with both revenues and margins subject to vulnerability.
With such a degree of uncertainty in the market, we remain fairly balanced in positioning the fund, focusing on highly sustainable businesses that we believe will be long-term winners and that can prove resilient in a wide range of economic outcomes. As of October 31, 2022, the fund’s largest overweight sector position remains in information technology. While prevailing market conditions have not been helpful for the sector of late, we believe that the fundamental business-model strength and growth prospects of the fund’s holdings will reassert in time.
4
In fixed income, as an index fund, we attempt to match closely the returns of the Index by approximating its composition and credit quality.
November 15, 2022
1 Total return includes reinvestment of dividends and any capital gains paid and does not take into consideration any maximum initial sales charge. Past performance is no guarantee of future results. Share price and investment return fluctuate such that upon redemption, fund shares may be worth more or less than their original cost. The fund’s return reflects the absorption of certain fund expenses by BNY Mellon Investment Adviser, Inc. pursuant to an agreement in effect through March 1, 2023, at which time it may be extended, modified or terminated. Had these expenses not been absorbed, returns would have been lower.
2 Source: Lipper Inc. — Reflects reinvestment of net dividends and, where applicable, capital gain distributions. The MSCI ACWI Index captures large- and mid-cap representation across developed market (DM) countries and emerging market (EM) countries. Investors cannot invest directly in any index.
3 Source: FactSet. — The Bloomberg MSCI US Aggregate ESG Select Sector Neutral Index is a fixed-rate, investment-grade bond benchmark that follows the rules of the Bloomberg US Aggregate Index and applies additional sector and ESG criteria for security eligibility. In addition, treasury, securitized, and class 2 government-related (agency, local authority, sovereign, supranational) and corporate (industrial, utility, and financial) sectors are weighted to match the individual sector exposures of the Bloomberg US Aggregate Index. Investors cannot invest directly in any index.
Equities are subject generally to market, market sector, market liquidity, issuer and investment style risks, among other factors, to varying degrees, all of which are more fully described in the fund’s prospectus.
Bonds are subject generally to interest-rate, credit, liquidity and market risks, to varying degrees, all of which are more fully described in the fund’s prospectus. Generally, all other factors being equal, bond prices are inversely related to interest-rate changes, and rate increases can cause price declines.
Currencies are subject to the risk that those currencies will decline in value relative to a local currency, or, in the case of hedged positions, that the local currency will decline relative to the currency being hedged. Each of these risks could increase the fund’s volatility.
Recent market risks include pandemic risks related to COVID-19. The effects of COVID-19 have contributed to increased volatility in global markets and will likely affect certain countries, companies, industries and market sectors more dramatically than others. To the extent the fund may overweight its investments in certain countries, companies, industries or market sectors, such positions will increase the fund’s exposure to risk of loss from adverse developments affecting those countries, companies, industries or sectors.
Indexing does not attempt to manage market volatility, use defensive strategies or reduce the effects of any long-term periods of poor index performance. The correlation between fund and index performance may be affected by the fund’s expenses and use of sampling techniques, changes in securities markets, changes in the composition of the index and the timing of purchases and redemptions of fund shares.
The fund’s performance will be influenced by political, social and economic factors affecting investments in foreign companies. Special risks associated with such companies include exposure to currency fluctuations, less liquidity, less developed or less efficient trading markets, lack of comprehensive company information, political instability, and differing auditing and legal standards.
Emerging markets tend to be more volatile than the markets of more mature economies and generally have less diverse and less mature economic structures and less stable political systems than those of developed countries. The securities of companies located in emerging markets are often subject to rapid and large changes in price.
Environmental, social and governance (ESG) managers may take into consideration factors beyond traditional financial information to select securities, which could result in relative investment performance deviating from other strategies or broad market benchmarks, depending on whether such sectors or investments are in or out of favor in the market. Further, ESG strategies may rely on certain values-based criteria to eliminate exposures found in similar strategies or broad market benchmarks, which could also result in relative investment performance deviating.
The fund may, but is not required to, use derivative instruments. A small investment in derivatives could have a potentially large impact on the fund’s performance. The use of derivatives involves risks different from, or possibly greater than, the risks associated with investing directly in the underlying assets.
5
FUND PERFORMANCE (Unaudited)
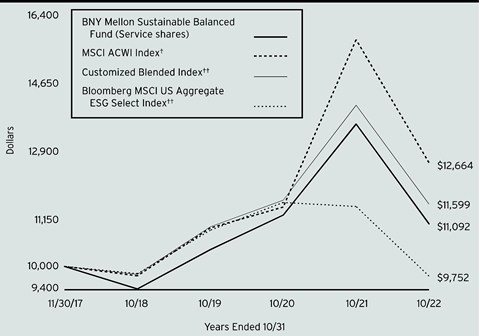
Comparison of change in value of a $10,000 investment in Services shares of BNY Mellon Sustainable Balanced Fund with a hypothetical investment of $10,000 in the MSCI ACWI Index, its Customized Blended Index, a blend of 60% MSCI ACWI Index/40% Bloomberg MSCI US Aggregate ESG Select Index and Bloomberg MSCI US Aggregate ESG Select Index.
† Source: Lipper Inc.
†† Source: FactSet.
Past performance is not predictive of future performance.
The above graph compares a hypothetical $10,000 investment made in Services shares of BNY Mellon Sustainable Balanced Fund on 11/30/17 (inception date) to a hypothetical investment of $10,000 made in the MSCI ACWI Index, Customized Blended Index and Bloomberg MSCI US Aggregate ESG Select Index on that date. All dividends and capital gain distributions are reinvested.
The fund’s performance shown in the line graph above takes into account all other applicable fees and expenses of the fund’s Services shares. The MSCI ACWI Index captures large and mid-cap representation across Developed Market (DM) countries and Emerging Market (EM) countries. The Bloomberg MSCI US Aggregate ESG Select Index is a fixed-rate, investment grade bond benchmark that follows the rules of the Bloomberg US Aggregate Index and applies additional sector and ESG criteria for security eligibility. In addition treasury, securitized, and class 2 government-related (agency, local authority, sovereign, supranational) and corporate (industrial, utility, and financial) sectors are weighted to match the individual sector exposures of the Bloomberg US Aggregate Index. Unlike a mutual fund, indices are not subject to charges, fees and other expenses. Investors cannot invest directly in any indices. Further information relating to fund performance, including expense reimbursements, if applicable, is contained in the Financial Highlights section of the prospectus and elsewhere in this report.
6
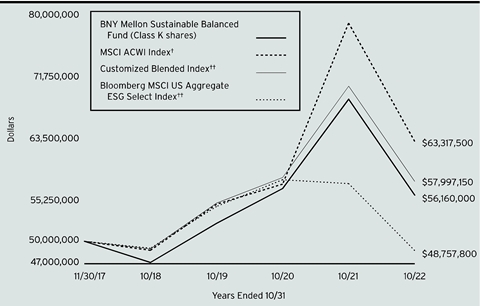
Comparison of change in value of a $50,000,000 investment in Class K shares of BNY Mellon Sustainable Balanced Fund with a hypothetical investment of $50,000,000 in the MSCI ACWI Index, its Customized Blended Index, a blend of 60% MSCI ACWI Index/40% Bloomberg MSCI US Aggregate ESG Select Index and Bloomberg MSCI US Aggregate ESG Select Index.
† Source: Lipper Inc.
†† Source: FactSet.
Past performance is not predictive of future performance.
The above graph compares a hypothetical $50,000,000 investment made in Class K shares of BNY Mellon Sustainable Balanced Fund on 11/30/17 (inception date) to a hypothetical investment of $50,000,000 made in the MSCI ACWI Index, Customized Blended Index and Bloomberg MSCI US Aggregate ESG Select Index on that date. All dividends and capital gain distributions are reinvested.
The fund’s performance shown in the line graph above takes into account all other applicable fees and expenses of the fund’s Class K shares. The MSCI ACWI Index captures large and mid-cap representation across Developed Market (DM) countries and Emerging Market (EM) countries. The Bloomberg MSCI US Aggregate ESG Select Index is a fixed-rate, investment grade bond benchmark that follows the rules of the Bloomberg US Aggregate Index and applies additional sector and ESG criteria for security eligibility. In addition treasury, securitized, and class 2 government-related (agency, local authority, sovereign, supranational) and corporate (industrial, utility, and financial) sectors are weighted to match the individual sector exposures of the Bloomberg US Aggregate Index. Unlike a mutual fund, indices are not subject to charges, fees and other expenses. Investors cannot invest directly in any indices. Further information relating to fund performance, including expense reimbursements, if applicable, is contained in the Financial Highlights section of the prospectus and elsewhere in this report.
7
FUND PERFORMANCE (Unaudited) (continued)
| | | | | |
Average Annual Total Returns as of 10/31/2022 |
| Inception
Date | 1 Year | | From
Inception |
Services shares | 11/30/17 | -18.76% | | 2.13% |
Class K shares | 11/30/17 | -18.57% | | 2.39% |
MSCI ACWI Index | | -19.96% | | 4.92% |
Customized Blended Index | | -17.97% | | 3.06% |
Bloomberg MSCI US
Aggregate ESG Select Index | | -15.50% | | -.51% |
The performance data quoted represents past performance, which is no guarantee of future results. Share price and investment return fluctuate and an investor’s shares may be worth more or less than original cost upon redemption. Current performance may be lower or higher than the performance quoted. Go to www.im.bnymellon.com for the fund’s most recent month-end returns.
The fund’s performance shown in the graphs and table does not reflect the deduction of taxes that a shareholder would pay on fund distributions or the redemption of fund shares.
8
UNDERSTANDING YOUR FUND’S EXPENSES (Unaudited)
As a mutual fund investor, you pay ongoing expenses, such as management fees and other expenses. Using the information below, you can estimate how these expenses affect your investment and compare them with the expenses of other funds. You also may pay one-time transaction expenses, including sales charges (loads) and redemption fees, which are not shown in this section and would have resulted in higher total expenses. For more information, see your fund’s prospectus or talk to your financial adviser.
Review your fund’s expenses
The table below shows the expenses you would have paid on a $1,000 investment in BNY Mellon Sustainable Balanced Fund from May 1, 2022 to October 31, 2022. It also shows how much a $1,000 investment would be worth at the close of the period, assuming actual returns and expenses.
| | | | | |
Expenses and Value of a $1,000 Investment | |
Assume actual returns for the six months ended October 31, 2022 | |
| | | | |
| | Class K | Service Shares | |
Expenses paid per $1,000† | $.73 | $1.94 | |
Ending value (after expenses) | $922.20 | $921.30 | |
COMPARING YOUR FUND’S EXPENSES WITH THOSE OF OTHER FUNDS (Unaudited)
Using the SEC’s method to compare expenses
The Securities and Exchange Commission (“SEC”) has established guidelines to help investors assess fund expenses. Per these guidelines, the table below shows your fund’s expenses based on a $1,000 investment, assuming a hypothetical 5% annualized return. You can use this information to compare the ongoing expenses (but not transaction expenses or total cost) of investing in the fund with those of other funds. All mutual fund shareholder reports will provide this information to help you make this comparison. Please note that you cannot use this information to estimate your actual ending account balance and expenses paid during the period.
| | | | | |
Expenses and Value of a $1,000 Investment | |
Assuming a hypothetical 5% annualized return for the six months ended October 31, 2022 | |
| | | | |
| | Class K | Service Shares | |
Expenses paid per $1,000† | $.77 | $2.04 | |
Ending value (after expenses) | $1,024.45 | $1,023.19 | |
† | Expenses are equal to the fund’s annualized expense ratio of .15% for Class K and .40% for Service Shares, multiplied by the average account value over the period, multiplied by 184/365 (to reflect the one-half year period). |
9
STATEMENT OF INVESTMENTS
October 31, 2022
| | | | | | | | | | |
| |
Description | Coupon
Rate (%) | | Maturity Date | | Principal Amount ($) | | Value ($) | |
Bonds and Notes - 37.3% | | | | | |
Canada - .2% | | | | | |
Canadian Imperial Bank of Commerce, Sr. Unscd. Notes | | 3.10 | | 4/2/2024 | | 10,000 | | 9,694 | |
Rogers Communications Inc., Gtd. Notes | | 2.90 | | 11/15/2026 | | 15,000 | | 13,444 | |
| | 23,138 | |
Japan - .2% | | | | | |
Mitsubishi UFJ Financial Group Inc., Sr. Unscd. Notes | | 3.78 | | 3/2/2025 | | 25,000 | | 24,053 | |
Supranational - .1% | | | | | |
NXP BV, Gtd. Notes | | 2.50 | | 5/11/2031 | | 10,000 | | 7,532 | |
United Kingdom - .2% | | | | | |
AstraZeneca PLC, Sr. Unscd. Notes | | 6.45 | | 9/15/2037 | | 10,000 | | 10,751 | |
Vodafone Group PLC, Sr. Unscd. Notes | | 4.38 | | 5/30/2028 | | 15,000 | | 14,129 | |
Vodafone Group PLC, Sr. Unscd. Notes | | 5.25 | | 5/30/2048 | | 10,000 | | 8,198 | |
| | 33,078 | |
United States - 36.6% | | | | | |
3M Co., Sr. Unscd. Notes | | 2.88 | | 10/15/2027 | | 15,000 | | 13,543 | |
Air Lease Corp., Sr. Unscd. Notes | | 3.13 | | 12/1/2030 | | 15,000 | | 11,649 | |
Amazon.com Inc., Sr. Unscd. Notes | | 4.05 | | 8/22/2047 | | 10,000 | | 8,146 | |
Amazon.com Inc., Sr. Unscd. Notes | | 4.80 | | 12/5/2034 | | 10,000 | | 9,742 | |
American Express Co., Sr. Unscd. Notes | | 3.40 | | 2/22/2024 | | 25,000 | | 24,395 | |
American Water Capital Corp., Sr. Unscd. Notes | | 2.80 | | 5/1/2030 | | 15,000 | | 12,530 | |
American Water Capital Corp., Sr. Unscd. Notes | | 3.75 | | 9/1/2047 | | 10,000 | | 7,261 | |
American Water Capital Corp., Sr. Unscd. Notes | | 4.15 | | 6/1/2049 | | 10,000 | | 7,720 | |
American Water Capital Corp., Sr. Unscd. Notes | | 4.20 | | 9/1/2048 | | 15,000 | | 11,718 | |
Amgen Inc., Sr. Unscd. Notes | | 4.56 | | 6/15/2048 | | 10,000 | | 8,134 | |
Apple Inc., Sr. Unscd. Notes | | 1.20 | | 2/8/2028 | | 20,000 | | 16,672 | |
Apple Inc., Sr. Unscd. Notes | | 3.25 | | 2/23/2026 | | 15,000 | | 14,315 | |
Apple Inc., Sr. Unscd. Notes | | 4.10 | | 8/8/2062 | | 10,000 | | 7,787 | |
Bank of America Corp., Sr. Unscd. Notes | | 2.46 | | 10/22/2025 | | 25,000 | | 23,339 | |
Bank of America Corp., Sr. Unscd. Notes | | 3.95 | | 1/23/2049 | | 10,000 | | 7,223 | |
Bank of America Corp., Sr. Unscd. Notes | | 4.57 | | 4/27/2033 | | 25,000 | | 22,190 | |
10
| | | | | | | | | | |
| |
Description | Coupon
Rate (%) | | Maturity Date | | Principal Amount ($) | | Value ($) | |
Bonds and Notes - 37.3% (continued) | | | | | |
United States - 36.6% (continued) | | | | | |
Becton Dickinson & Co., Sr. Unscd. Notes | | 2.82 | | 5/20/2030 | | 10,000 | | 8,347 | |
Boston Properties LP, Sr. Unscd. Notes | | 4.50 | | 12/1/2028 | | 15,000 | | 13,508 | |
Bristol-Myers Squibb Co., Sr. Unscd. Notes | | 4.13 | | 6/15/2039 | | 10,000 | | 8,494 | |
Carrier Global Corp., Sr. Unscd. Notes | | 3.58 | | 4/5/2050 | | 10,000 | | 6,724 | |
Centerpoint Energy Houston Electric LLC, Mortgage Bonds | | 3.55 | | 8/1/2042 | | 10,000 | | 7,455 | |
Cigna Corp., Gtd. Notes | | 4.13 | | 11/15/2025 | | 15,000 | | 14,511 | |
Cigna Corp., Gtd. Notes | | 4.38 | | 10/15/2028 | | 15,000 | | 14,133 | |
Citigroup Inc., Sr. Unscd. Notes | | 3.20 | | 10/21/2026 | | 20,000 | | 18,229 | |
Citigroup Inc., Sr. Unscd. Notes | | 3.98 | | 3/20/2030 | | 10,000 | | 8,821 | |
Citigroup Inc., Sr. Unscd. Notes | | 4.41 | | 3/31/2031 | | 15,000 | | 13,403 | |
Citigroup Inc., Sub. Notes | | 4.75 | | 5/18/2046 | | 10,000 | | 7,758 | |
Commonwealth Edison Co., First Mortgage Bonds | | 3.00 | | 3/1/2050 | | 10,000 | | 6,372 | |
Credit Suisse USA Inc., Gtd. Notes | | 7.13 | | 7/15/2032 | | 10,000 | | 9,827 | |
Crown Castle Inc., Sr. Unscd. Bonds | | 3.80 | | 2/15/2028 | | 10,000 | | 9,023 | |
CVS Health Corp., Sr. Unscd. Notes | | 5.05 | | 3/25/2048 | | 20,000 | | 17,026 | |
Deere & Co., Sr. Unscd. Notes | | 3.90 | | 6/9/2042 | | 10,000 | | 8,303 | |
DuPont de Nemours Inc., Sr. Unscd. Notes | | 4.49 | | 11/15/2025 | | 10,000 | | 9,803 | |
Eli Lilly & Co., Sr. Unscd. Notes | | 2.25 | | 5/15/2050 | | 10,000 | | 5,983 | |
EMC Corp., Sr. Unscd. Notes | | 4.90 | | 10/1/2026 | | 15,000 | | 14,410 | |
Federal Home Loan Bank, Bonds | | 2.50 | | 2/13/2024 | | 25,000 | | 24,350 | |
FedEx Corp., Gtd. Notes | | 5.25 | | 5/15/2050 | | 15,000 | | 12,719 | |
Fiserv Inc., Sr. Unscd. Notes | | 4.40 | | 7/1/2049 | | 10,000 | | 7,541 | |
GlaxoSmithKline Capital Inc., Gtd. Notes | | 3.88 | | 5/15/2028 | | 15,000 | | 14,096 | |
HCA Inc., Gtd. Notes | | 5.25 | | 6/15/2049 | | 10,000 | | 8,121 | |
HP Inc., Sr. Unscd. Notes | | 3.40 | | 6/17/2030 | | 10,000 | | 8,142 | |
Humana Inc., Sr. Unscd. Notes | | 3.85 | | 10/1/2024 | | 10,000 | | 9,752 | |
Intel Corp., Sr. Unscd. Notes | | 3.10 | | 2/15/2060 | | 10,000 | | 5,676 | |
Intel Corp., Sr. Unscd. Notes | | 3.15 | | 5/11/2027 | | 10,000 | | 9,243 | |
Intel Corp., Sr. Unscd. Notes | | 3.90 | | 3/25/2030 | | 10,000 | | 9,073 | |
Intercontinental Exchange Inc., Gtd. Notes | | 3.75 | | 12/1/2025 | | 15,000 | | 14,420 | |
International Business Machines Corp., Sr. Unscd. Debs. | | 5.88 | | 11/29/2032 | | 10,000 | | 10,227 | |
ITC Holdings Corp., Sr. Unscd. Notes | | 3.35 | | 11/15/2027 | | 15,000 | | 13,534 | |
Johnson & Johnson, Sr. Unscd. Notes | | 2.63 | | 1/15/2025 | | 15,000 | | 14,366 | |
JPMorgan Chase & Co., Sr. Unscd. Notes | | 2.08 | | 4/22/2026 | | 25,000 | | 22,771 | |
11
STATEMENT OF INVESTMENTS (continued)
| | | | | | | | | | |
| |
Description | Coupon
Rate (%) | | Maturity Date | | Principal Amount ($) | | Value ($) | |
Bonds and Notes - 37.3% (continued) | | | | | |
United States - 36.6% (continued) | | | | | |
JPMorgan Chase & Co., Sr. Unscd. Notes | | 2.53 | | 11/19/2041 | | 10,000 | | 6,186 | |
JPMorgan Chase & Co., Sr. Unscd. Notes | | 3.96 | | 11/15/2048 | | 10,000 | | 7,367 | |
JPMorgan Chase & Co., Sr. Unscd. Notes | | 4.45 | | 12/5/2029 | | 20,000 | | 18,261 | |
JPMorgan Chase & Co., Sub. Notes | | 3.88 | | 9/10/2024 | | 10,000 | | 9,745 | |
Lowe's Cos., Sr. Unscd. Notes | | 4.50 | | 4/15/2030 | | 10,000 | | 9,324 | |
Lowe's Cos., Sr. Unscd. Notes | | 4.65 | | 4/15/2042 | | 10,000 | | 8,200 | |
Marsh & McLennan Cos., Sr. Unscd. Notes | | 4.75 | | 3/15/2039 | | 15,000 | | 12,913 | |
Mastercard Inc., Sr. Unscd. Notes | | 2.00 | | 3/3/2025 | | 10,000 | | 9,397 | |
McDonald's Corp., Sr. Unscd. Notes | | 3.70 | | 2/15/2042 | | 10,000 | | 7,478 | |
Microsoft Corp., Sr. Unscd. Notes | | 2.88 | | 2/6/2024 | | 10,000 | | 9,782 | |
Microsoft Corp., Sr. Unscd. Notes | | 4.25 | | 2/6/2047 | | 10,000 | | 8,787 | |
Morgan Stanley, Sr. Unscd. Notes | | 4.38 | | 1/22/2047 | | 10,000 | | 7,791 | |
Morgan Stanley, Sr. Unscd. Notes | | 4.43 | | 1/23/2030 | | 20,000 | | 18,271 | |
Motorola Solutions Inc., Sr. Unscd. Notes | | 2.75 | | 5/24/2031 | | 10,000 | | 7,659 | |
Northern Trust Corp., Sr. Unscd. Notes | | 3.15 | | 5/3/2029 | | 20,000 | | 17,627 | |
Novartis Capital Corp., Gtd. Notes | | 2.00 | | 2/14/2027 | | 10,000 | | 8,941 | |
Oncor Electric Delivery Co., Sr. Scd. Notes | | 3.10 | | 9/15/2049 | | 10,000 | | 6,519 | |
Oncor Electric Delivery Co., Sr. Scd. Notes | | 3.70 | | 11/15/2028 | | 15,000 | | 13,770 | |
Oracle Corp., Sr. Unscd. Notes | | 1.65 | | 3/25/2026 | | 10,000 | | 8,786 | |
Oracle Corp., Sr. Unscd. Notes | | 2.95 | | 4/1/2030 | | 10,000 | | 8,154 | |
Oracle Corp., Sr. Unscd. Notes | | 4.00 | | 11/15/2047 | | 10,000 | | 6,644 | |
Paramount Global, Sr. Unscd. Debs. | | 5.85 | | 9/1/2043 | | 10,000 | | 8,155 | |
Parker-Hannifin Corp., Sr. Unscd. Notes | | 3.25 | | 6/14/2029 | | 15,000 | | 13,022 | |
PepsiCo Inc., Sr. Unscd. Notes | | 2.75 | | 4/30/2025 | | 15,000 | | 14,275 | |
Prologis LP, Sr. Unscd. Notes | | 2.25 | | 4/15/2030 | | 10,000 | | 8,061 | |
Target Corp., Sr. Unscd. Notes | | 2.50 | | 4/15/2026 | | 15,000 | | 13,875 | |
Texas Instruments Inc., Sr. Unscd. Notes | | 3.88 | | 3/15/2039 | | 10,000 | | 8,326 | |
The Coca-Cola Company, Sr. Unscd. Notes | | 3.45 | | 3/25/2030 | | 10,000 | | 9,057 | |
The Goldman Sachs Group Inc., Sr. Unscd. Notes | | 2.62 | | 4/22/2032 | | 15,000 | | 11,461 | |
The Goldman Sachs Group Inc., Sr. Unscd. Notes | | 3.85 | | 1/26/2027 | | 20,000 | | 18,554 | |
The Home Depot Inc., Sr. Unscd. Notes | | 3.50 | | 9/15/2056 | | 10,000 | | 6,800 | |
12
| | | | | | | | | | |
| |
Description | Coupon
Rate (%) | | Maturity Date | | Principal Amount ($) | | Value ($) | |
Bonds and Notes - 37.3% (continued) | | | | | |
United States - 36.6% (continued) | | | | | |
The Home Depot Inc., Sr. Unscd. Notes | | 3.90 | | 12/6/2028 | | 10,000 | | 9,454 | |
The PNC Financial Services Group Inc., Sr. Unscd. Notes | | 3.45 | | 4/23/2029 | | 10,000 | | 8,780 | |
The Sherwin-Williams Company, Sr. Unscd. Notes | | 4.50 | | 6/1/2047 | | 15,000 | | 11,896 | |
The Walt Disney Company, Gtd. Notes | | 2.00 | | 9/1/2029 | | 15,000 | | 12,272 | |
The Walt Disney Company, Gtd. Notes | | 3.80 | | 5/13/2060 | | 10,000 | | 7,145 | |
Truist Financial Corp., Sr. Unscd. Notes | | 3.75 | | 12/6/2023 | | 10,000 | | 9,866 | |
TWDC Enterprises 18 Corp., Gtd. Notes | | 4.13 | | 6/1/2044 | | 10,000 | | 8,072 | |
Tyson Foods Inc., Sr. Unscd. Notes | | 4.55 | | 6/2/2047 | | 10,000 | | 8,141 | |
U.S. Treasury Bonds | | 1.13 | | 8/15/2040 | | 12,000 | | 7,107 | |
U.S. Treasury Bonds | | 1.13 | | 5/15/2040 | | 10,000 | | 5,975 | |
U.S. Treasury Bonds | | 1.25 | | 5/15/2050 | | 12,000 | | 6,188 | |
U.S. Treasury Bonds | | 1.38 | | 11/15/2040 | | 25,000 | | 15,455 | |
U.S. Treasury Bonds | | 1.38 | | 8/15/2050 | | 15,000 | | 8,002 | |
U.S. Treasury Bonds | | 1.63 | | 11/15/2050 | | 15,000 | | 8,584 | |
U.S. Treasury Bonds | | 1.75 | | 8/15/2041 | | 11,000 | | 7,184 | |
U.S. Treasury Bonds | | 1.88 | | 11/15/2051 | | 15,000 | | 9,143 | |
U.S. Treasury Bonds | | 1.88 | | 2/15/2051 | | 13,000 | | 7,964 | |
U.S. Treasury Bonds | | 1.88 | | 2/15/2041 | | 5,000 | | 3,382 | |
U.S. Treasury Bonds | | 2.00 | | 8/15/2051 | | 14,000 | | 8,825 | |
U.S. Treasury Bonds | | 2.00 | | 2/15/2050 | | 22,000 | | 14,009 | |
U.S. Treasury Bonds | | 2.00 | | 11/15/2041 | | 15,000 | | 10,233 | |
U.S. Treasury Bonds | | 2.25 | | 2/15/2052 | | 15,000 | | 10,064 | |
U.S. Treasury Bonds | | 2.25 | | 8/15/2049 | | 9,000 | | 6,123 | |
U.S. Treasury Bonds | | 2.38 | | 11/15/2049 | | 10,000 | | 6,996 | |
U.S. Treasury Bonds | | 2.38 | | 5/15/2051 | | 15,000 | | 10,393 | |
U.S. Treasury Bonds | | 2.50 | | 2/15/2045 | | 10,000 | | 7,202 | |
U.S. Treasury Bonds | | 2.75 | | 11/15/2042 | | 5,000 | | 3,856 | |
U.S. Treasury Bonds | | 2.75 | | 11/15/2047 | | 10,000 | | 7,510 | |
U.S. Treasury Bonds | | 2.75 | | 8/15/2047 | | 20,000 | | 15,012 | |
U.S. Treasury Bonds | | 2.88 | | 5/15/2052 | | 10,000 | | 7,764 | |
U.S. Treasury Bonds | | 2.88 | | 5/15/2049 | | 13,000 | | 10,131 | |
U.S. Treasury Bonds | | 3.00 | | 2/15/2048 | | 30,000 | | 23,701 | |
U.S. Treasury Bonds | | 3.00 | | 8/15/2052 | | 17,000 | | 13,619 | |
U.S. Treasury Bonds | | 3.00 | | 8/15/2048 | | 3,000 | | 2,384 | |
U.S. Treasury Bonds | | 3.00 | | 2/15/2049 | | 17,000 | | 13,574 | |
U.S. Treasury Bonds | | 3.13 | | 2/15/2042 | | 25,000 | | 20,771 | |
U.S. Treasury Bonds | | 3.13 | | 5/15/2048 | | 32,000 | | 25,977 | |
13
STATEMENT OF INVESTMENTS (continued)
| | | | | | | | | | |
| |
Description | Coupon
Rate (%) | | Maturity Date | | Principal Amount ($) | | Value ($) | |
Bonds and Notes - 37.3% (continued) | | | | | |
United States - 36.6% (continued) | | | | | |
U.S. Treasury Bonds | | 3.13 | | 11/15/2041 | | 18,000 | | 14,947 | |
U.S. Treasury Bonds | | 3.38 | | 8/15/2042 | | 20,000 | | 17,259 | |
U.S. Treasury Bonds | | 3.38 | | 11/15/2048 | | 25,000 | | 21,370 | |
U.S. Treasury Bonds | | 3.63 | | 2/15/2044 | | 10,000 | | 8,834 | |
U.S. Treasury Bonds | | 3.88 | | 8/15/2040 | | 11,000 | | 10,344 | |
U.S. Treasury Bonds | | 4.38 | | 11/15/2039 | | 7,000 | | 7,062 | |
U.S. Treasury Bonds | | 4.38 | | 5/15/2040 | | 28,000 | | 28,189 | |
U.S. Treasury Bonds | | 4.50 | | 2/15/2036 | | 25,000 | | 26,055 | |
U.S. Treasury Notes | | 0.13 | | 2/15/2024 | | 50,000 | | 47,205 | |
U.S. Treasury Notes | | 0.13 | | 1/15/2024 | | 10,000 | | 9,473 | |
U.S. Treasury Notes | | 0.13 | | 12/15/2023 | | 10,000 | | 9,515 | |
U.S. Treasury Notes | | 0.25 | | 7/31/2025 | | 50,000 | | 44,656 | |
U.S. Treasury Notes | | 0.25 | | 6/15/2024 | | 20,000 | | 18,645 | |
U.S. Treasury Notes | | 0.38 | | 7/31/2027 | | 25,000 | | 20,874 | |
U.S. Treasury Notes | | 0.38 | | 11/30/2025 | | 10,000 | | 8,843 | |
U.S. Treasury Notes | | 0.38 | | 9/30/2027 | | 30,000 | | 24,877 | |
U.S. Treasury Notes | | 0.38 | | 8/15/2024 | | 25,000 | | 23,203 | |
U.S. Treasury Notes | | 0.38 | | 12/31/2025 | | 12,000 | | 10,587 | |
U.S. Treasury Notes | | 0.50 | | 2/28/2026 | | 25,000 | | 21,992 | |
U.S. Treasury Notes | | 0.50 | | 6/30/2027 | | 20,000 | | 16,835 | |
U.S. Treasury Notes | | 0.50 | | 10/31/2027 | | 35,000 | | 29,121 | |
U.S. Treasury Notes | | 0.50 | | 4/30/2027 | | 15,000 | | 12,700 | |
U.S. Treasury Notes | | 0.50 | | 5/31/2027 | | 35,000 | | 29,539 | |
U.S. Treasury Notes | | 0.63 | | 3/31/2027 | | 20,000 | | 17,076 | |
U.S. Treasury Notes | | 0.63 | | 5/15/2030 | | 17,000 | | 13,215 | |
U.S. Treasury Notes | | 0.63 | | 12/31/2027 | | 30,000 | | 24,993 | |
U.S. Treasury Notes | | 0.63 | | 11/30/2027 | | 50,000 | | 41,770 | |
U.S. Treasury Notes | | 0.63 | | 8/15/2030 | | 25,000 | | 19,314 | |
U.S. Treasury Notes | | 0.75 | | 4/30/2026 | | 15,000 | | 13,238 | |
U.S. Treasury Notes | | 0.75 | | 3/31/2026 | | 15,000 | | 13,276 | |
U.S. Treasury Notes | | 0.88 | | 6/30/2026 | | 25,000 | | 22,054 | |
U.S. Treasury Notes | | 0.88 | | 9/30/2026 | | 25,000 | | 21,895 | |
U.S. Treasury Notes | | 0.88 | | 11/15/2030 | | 30,000 | | 23,600 | |
U.S. Treasury Notes | | 1.13 | | 2/15/2031 | | 31,000 | | 24,795 | |
U.S. Treasury Notes | | 1.25 | | 8/15/2031 | | 32,000 | | 25,439 | |
U.S. Treasury Notes | | 1.25 | | 4/30/2028 | | 25,000 | | 21,331 | |
U.S. Treasury Notes | | 1.25 | | 5/31/2028 | | 25,000 | | 21,297 | |
U.S. Treasury Notes | | 1.38 | | 1/31/2025 | | 50,000 | | 46,747 | |
U.S. Treasury Notes | | 1.38 | | 8/31/2026 | | 10,000 | | 8,955 | |
U.S. Treasury Notes | | 1.38 | | 11/15/2031 | | 35,000 | | 27,932 | |
U.S. Treasury Notes | | 1.50 | | 8/15/2026 | | 15,000 | | 13,503 | |
U.S. Treasury Notes | | 1.50 | | 1/31/2027 | | 20,000 | | 17,827 | |
U.S. Treasury Notes | | 1.50 | | 11/30/2024 | | 20,000 | | 18,815 | |
14
| | | | | | | | | | |
| |
Description | Coupon
Rate (%) | | Maturity Date | | Principal Amount ($) | | Value ($) | |
Bonds and Notes - 37.3% (continued) | | | | | |
United States - 36.6% (continued) | | | | | |
U.S. Treasury Notes | | 1.50 | | 2/15/2030 | | 15,000 | | 12,570 | |
U.S. Treasury Notes | | 1.63 | | 2/15/2026 | | 10,000 | | 9,149 | |
U.S. Treasury Notes | | 1.63 | | 5/15/2026 | | 25,000 | | 22,754 | |
U.S. Treasury Notes | | 1.63 | | 8/15/2029 | | 15,000 | | 12,788 | |
U.S. Treasury Notes | | 1.63 | | 5/15/2031 | | 40,000 | | 33,063 | |
U.S. Treasury Notes | | 1.63 | | 11/30/2026 | | 25,000 | | 22,496 | |
U.S. Treasury Notes | | 1.75 | | 12/31/2026 | | 20,000 | | 18,065 | |
U.S. Treasury Notes | | 1.75 | | 12/31/2024 | | 15,000 | | 14,176 | |
U.S. Treasury Notes | | 1.88 | | 8/31/2024 | | 55,000 | | 52,403 | |
U.S. Treasury Notes | | 1.88 | | 6/30/2026 | | 5,000 | | 4,582 | |
U.S. Treasury Notes | | 1.88 | | 2/15/2032 | | 30,000 | | 24,952 | |
U.S. Treasury Notes | | 2.00 | | 6/30/2024 | | 65,000 | | 62,301 | |
U.S. Treasury Notes | | 2.00 | | 4/30/2024 | | 50,000 | | 48,092 | |
U.S. Treasury Notes | | 2.00 | | 5/31/2024 | | 65,000 | | 62,408 | |
U.S. Treasury Notes | | 2.00 | | 8/15/2025 | | 25,000 | | 23,401 | |
U.S. Treasury Notes | | 2.00 | | 2/15/2025 | | 30,000 | | 28,391 | |
U.S. Treasury Notes | | 2.13 | | 9/30/2024 | | 18,000 | | 17,218 | |
U.S. Treasury Notes | | 2.13 | | 11/30/2024 | | 30,000 | | 28,577 | |
U.S. Treasury Notes | | 2.13 | | 5/31/2026 | | 10,000 | | 9,256 | |
U.S. Treasury Notes | | 2.13 | | 7/31/2024 | | 50,000 | | 47,932 | |
U.S. Treasury Notes | | 2.25 | | 11/15/2024 | | 45,000 | | 43,045 | |
U.S. Treasury Notes | | 2.25 | | 3/31/2026 | | 25,000 | | 23,313 | |
U.S. Treasury Notes | | 2.25 | | 11/15/2025 | | 10,000 | | 9,382 | |
U.S. Treasury Notes | | 2.25 | | 2/15/2027 | | 10,000 | | 9,193 | |
U.S. Treasury Notes | | 2.25 | | 12/31/2024 | | 25,000 | | 23,853 | |
U.S. Treasury Notes | | 2.25 | | 10/31/2024 | | 30,000 | | 28,724 | |
U.S. Treasury Notes | | 2.38 | | 8/15/2024 | | 25,000 | | 24,047 | |
U.S. Treasury Notes | | 2.38 | | 5/15/2027 | | 25,000 | | 23,026 | |
U.S. Treasury Notes | | 2.38 | | 5/15/2029 | | 13,000 | | 11,640 | |
U.S. Treasury Notes | | 2.63 | | 7/31/2029 | | 40,000 | | 36,323 | |
U.S. Treasury Notes | | 2.75 | | 8/15/2032 | | 50,000 | | 44,750 | |
U.S. Treasury Notes | | 2.75 | | 2/28/2025 | | 20,000 | | 19,248 | |
U.S. Treasury Notes | | 2.75 | | 2/15/2028 | | 5,000 | | 4,642 | |
U.S. Treasury Notes | | 2.88 | | 5/15/2032 | | 35,000 | | 31,719 | |
U.S. Treasury Notes | | 2.88 | | 5/15/2028 | | 40,000 | | 37,242 | |
U.S. Treasury Notes | | 2.88 | | 8/15/2028 | | 25,000 | | 23,226 | |
U.S. Treasury Notes | | 3.13 | | 11/15/2028 | | 10,000 | | 9,401 | |
U.S. Treasury Notes | | 3.88 | | 9/30/2029 | | 40,000 | | 39,294 | |
U.S. Treasury Notes | | 4.13 | | 10/31/2027 | | 75,000 | | 74,613 | |
U.S. Treasury Notes | | 4.25 | | 9/30/2024 | | 100,000 | | 99,500 | |
U.S. Treasury Notes | | 4.38 | | 10/31/2024 | | 75,000 | | 74,848 | |
United Parcel Service Inc., Sr. Unscd. Notes | | 3.05 | | 11/15/2027 | | 15,000 | | 13,768 | |
15
STATEMENT OF INVESTMENTS (continued)
| | | | | | | | | | |
| |
Description | Coupon
Rate (%) | | Maturity Date | | Principal Amount ($) | | Value ($) | |
Bonds and Notes - 37.3% (continued) | | | | | |
United States - 36.6% (continued) | | | | | |
Verizon Communications Inc., Sr. Unscd. Notes | | 1.75 | | 1/20/2031 | | 15,000 | | 11,139 | |
Verizon Communications Inc., Sr. Unscd. Notes | | 2.65 | | 11/20/2040 | | 10,000 | | 6,361 | |
Verizon Communications Inc., Sr. Unscd. Notes | | 4.02 | | 12/3/2029 | | 20,000 | | 18,044 | |
Verizon Communications Inc., Sr. Unscd. Notes | | 4.33 | | 9/21/2028 | | 10,000 | | 9,384 | |
Visa Inc., Sr. Unscd. Notes | | 3.15 | | 12/14/2025 | | 15,000 | | 14,306 | |
WW Grainger Inc., Sr. Unscd. Notes | | 1.85 | | 2/15/2025 | | 10,000 | | 9,318 | |
Zoetis Inc., Sr. Unscd. Notes | | 3.90 | | 8/20/2028 | | 15,000 | | 13,838 | |
Federal Home Loan Mortgage Corp.: | | | |
1.50%, 2/1/2036 | | | 22,548 | a | 19,240 | |
2.00%, 11/1/2036-3/1/2052 | | | 179,329 | a | 143,958 | |
2.50%, 5/1/2035-12/1/2051 | | | 85,310 | a | 71,658 | |
3.00%, 6/1/2035-6/1/2050 | | | 40,027 | a | 35,462 | |
3.50%, 11/1/2047-7/1/2049 | | | 27,250 | a | 24,462 | |
4.00%, 5/1/2049 | | | 4,658 | a | 4,309 | |
5.00%, 10/1/2049 | | | 5,620 | a | 5,520 | |
Federal National Mortgage Association: | | | |
1.50% | | | 25,000 | a,b | 21,274 | |
1.50%, 11/1/2050-6/1/2051 | | | 44,185 | a | 32,994 | |
2.00% | | | 125,000 | a,b | 102,918 | |
2.00%, 9/1/2040-9/1/2051 | | | 147,640 | a | 117,542 | |
2.50% | | | 75,000 | a,b | 63,468 | |
2.50%, 11/1/2031-1/1/2052 | | | 196,923 | a | 164,180 | |
3.00% | | | 100,000 | a,b | 85,023 | |
3.00%, 6/1/2034-6/1/2050 | | | 76,438 | a | 66,678 | |
3.50%, 9/1/2037-11/1/2049 | | | 68,378 | a | 61,568 | |
3.50% | | | 25,000 | a,b | 21,978 | |
4.00%, 1/1/2048-8/1/2049 | | | 48,809 | a | 45,333 | |
4.00% | | | 25,000 | a,b | 22,730 | |
4.50%, 8/1/2047-7/1/2048 | | | 20,333 | a | 19,432 | |
4.50% | | | 25,000 | a,b | 23,457 | |
5.00% | | | 25,000 | a,b | 24,114 | |
5.50%, 9/1/2049 | | | 6,561 | a | 6,561 | |
Government National Mortgage Association II: | | | |
2.00% | | | 25,000 | b | 20,543 | |
2.00%, 3/20/2051-1/20/2052 | | | 65,837 | | 54,398 | |
2.50% | | | 50,000 | b | 42,383 | |
2.50%, 7/20/2051-3/20/2052 | | | 45,820 | | 38,948 | |
3.00%, 11/20/2045-8/20/2050 | | | 46,793 | | 41,375 | |
3.00% | | | 25,000 | b | 21,771 | |
16
| | | | | | | | | | |
| |
Description | Coupon
Rate (%) | | Maturity Date | | Principal Amount ($) | | Value ($) | |
Bonds and Notes - 37.3% (continued) | | | | | |
United States - 36.6% (continued) | | | | | |
3.50%, 11/20/2046-6/20/2049 | | | 48,071 | | 43,680 | |
4.00%, 4/20/2049-10/20/2049 | | | 15,502 | | 14,378 | |
4.00% | | | 25,000 | b | 23,043 | |
4.50%, 2/20/2049-6/20/2049 | | | 7,140 | | 6,852 | |
5.00%, 6/20/2049 | | | 3,742 | | 3,670 | |
| | 5,024,325 | |
Total Bonds and Notes
(cost $5,905,855) | | 5,112,126 | |
Description | | | | | Shares | | Value ($) | |
Common Stocks - 62.4% | | | | | |
Australia - 2.0% | | | | | |
Australia & New Zealand Banking Group Ltd. | | | | | | 2,433 | | 39,661 | |
CSL Ltd. | | | | | | 242 | | 43,369 | |
Dexus | | | | | | 9,325 | | 46,488 | |
Insurance Australia Group Ltd. | | | | | | 19,111 | | 59,736 | |
National Australia Bank Ltd. | | | | | | 2,209 | | 45,684 | |
Westpac Banking Corp. | | | | | | 2,887 | | 44,397 | |
| | 279,335 | |
Canada - .4% | | | | | |
The Toronto-Dominion Bank | | | | | | 800 | | 51,200 | |
China - 1.6% | | | | | |
3SBio Inc. | | | | | | 80,000 | c | 56,474 | |
Meituan, Cl. B | | | | | | 2,915 | c,d | 46,370 | |
Ping An Insurance Group Company of China Ltd., Cl. H | | | | | | 10,500 | | 42,019 | |
Tencent Holdings Ltd. | | | | | | 2,689 | | 70,559 | |
| | 215,422 | |
Denmark - 1.3% | | | | | |
Chr. Hansen Holding A/S | | | | | | 1,219 | | 67,610 | |
Novo Nordisk A/S, Cl. B | | | | | | 225 | | 24,452 | |
Novozymes A/S, Cl. B | | | | | | 1,302 | | 68,303 | |
Orsted AS | | | | | | 181 | c | 14,914 | |
| | 175,279 | |
France - 2.1% | | | | | |
BNP Paribas SA | | | | | | 862 | | 40,383 | |
Bureau Veritas SA | | | | | | 640 | | 15,843 | |
Danone SA | | | | | | 789 | | 39,227 | |
Kering SA | | | | | | 33 | | 15,105 | |
Legrand SA | | | | | | 709 | | 53,990 | |
L'Oreal SA | | | | | | 112 | | 35,164 | |
LVMH SE | | | | | | 26 | | 16,403 | |
17
STATEMENT OF INVESTMENTS (continued)
| | | | | | | | | | |
| |
Description | | | | | Shares | | Value ($) | |
Common Stocks - 62.4% (continued) | | | | | |
France - 2.1% (continued) | | | | | |
Sanofi | | | | | | 797 | | 68,818 | |
| | 284,933 | |
Germany - 1.0% | | | | | |
Allianz SE | | | | | | 85 | | 15,303 | |
Brenntag SE | | | | | | 657 | | 39,884 | |
Continental AG | | | | | | 292 | | 15,144 | |
Fresenius Medical Care AG & Co. KGaA | | | | | | 270 | | 7,468 | |
Infineon Technologies AG | | | | | | 1,837 | | 44,725 | |
SAP SE | | | | | | 188 | | 18,151 | |
| | 140,675 | |
Hong Kong - .4% | | | | | |
AIA Group Ltd. | | | | | | 5,000 | | 37,759 | |
Link REIT | | | | | | 2,200 | | 13,015 | |
| | 50,774 | |
Ireland - 2.9% | | | | | |
Accenture PLC, Cl. A | | | | | | 396 | | 112,424 | |
Aptiv PLC | | | | | | 532 | d | 48,449 | |
Kerry Group PLC, Cl. A | | | | | | 333 | | 28,941 | |
Medtronic PLC | | | | | | 976 | | 85,244 | |
Trane Technologies PLC | | | | | | 815 | | 130,098 | |
| | 405,156 | |
Israel - .2% | | | | | |
SolarEdge Technologies Inc. | | | | | | 97 | d | 22,313 | |
Japan - 3.8% | | | | | |
Fast Retailing Co. | | | | | | 100 | | 55,768 | |
Honda Motor Co. | | | | | | 1,800 | | 40,809 | |
KDDI Corp. | | | | | | 1,500 | | 44,293 | |
M3 Inc. | | | | | | 1,200 | | 35,841 | |
Mitsubishi UFJ Financial Group Inc. | | | | | | 7,500 | | 35,555 | |
Nippon Telegraph & Telephone Corp. | | | | | | 600 | | 16,516 | |
Recruit Holdings Co. | | | | | | 1,000 | | 30,692 | |
Sony Group Corp. | | | | | | 500 | | 33,856 | |
Sugi Holdings Co. | | | | | | 400 | | 16,048 | |
Sumitomo Mitsui Financial Group Inc. | | | | | | 800 | | 22,444 | |
Suntory Beverage & Food Ltd. | | | | | | 1,500 | | 50,220 | |
Takeda Pharmaceutical Co. | | | | | | 1,700 | | 45,037 | |
Toyota Industries Corp. | | | | | | 700 | | 36,035 | |
Toyota Motor Corp. | | | | | | 3,900 | | 54,096 | |
| | 517,210 | |
Netherlands - .7% | | | | | |
ASML Holding NV | | | | | | 125 | | 58,927 | |
18
| | | | | | | | | | |
| |
Description | | | | | Shares | | Value ($) | |
Common Stocks - 62.4% (continued) | | | | | |
Netherlands - .7% (continued) | | | | | |
Universal Music Group NV | | | | | | 746 | | 14,618 | |
Wolters Kluwer NV | | | | | | 210 | | 22,320 | |
| | 95,865 | |
Norway - .8% | | | | | |
Mowi ASA | | | | | | 3,718 | | 55,389 | |
TOMRA Systems ASA | | | | | | 3,307 | | 53,068 | |
| | 108,457 | |
Peru - .6% | | | | | |
Credicorp Ltd. | | | | | | 618 | | 90,451 | |
South Korea - .6% | | | | | |
Samsung SDI Co. | | | | | | 174 | | 89,744 | |
Spain - .5% | | | | | |
Banco Santander SA | | | | | | 10,009 | | 25,893 | |
Iberdrola SA | | | | | | 4,337 | | 44,056 | |
| | 69,949 | |
Switzerland - 2.6% | | | | | |
Chubb Ltd. | | | | | | 250 | | 53,723 | |
Lonza Group AG | | | | | | 46 | | 23,648 | |
Nestle SA | | | | | | 1,040 | | 113,195 | |
Roche Holding AG | | | | | | 146 | | 48,523 | |
Zurich Insurance Group AG | | | | | | 266 | | 113,417 | |
| | 352,506 | |
Taiwan - .4% | | | | | |
Taiwan Semiconductor Manufacturing Co. | | | | | | 5,000 | | 60,171 | |
United Kingdom - 4.1% | | | | | |
3i Group PLC | | | | | | 1,185 | | 15,754 | |
Ascential PLC | | | | | | 7,744 | d | 17,010 | |
AstraZeneca PLC | | | | | | 322 | | 37,777 | |
Barclays PLC | | | | | | 16,658 | | 28,361 | |
Barratt Developments PLC | | | | | | 6,718 | | 28,983 | |
Bunzl PLC | | | | | | 1,025 | | 33,365 | |
Burberry Group PLC | | | | | | 1,574 | | 32,762 | |
Croda International PLC | | | | | | 525 | | 40,664 | |
Farfetch Ltd., Cl. A | | | | | | 1,396 | d | 11,838 | |
Genus PLC | | | | | | 566 | | 16,571 | |
HSBC Holdings PLC | | | | | | 3,437 | | 17,629 | |
Informa PLC | | | | | | 7,506 | | 47,825 | |
Linde PLC | | | | | | 402 | | 119,535 | |
Prudential PLC | | | | | | 1,493 | | 13,857 | |
RELX PLC | | | | | | 690 | | 18,547 | |
Taylor Wimpey PLC | | | | | | 33,088 | | 35,549 | |
19
STATEMENT OF INVESTMENTS (continued)
| | | | | | | | | | |
| |
Description | | | | | Shares | | Value ($) | |
Common Stocks - 62.4% (continued) | | | | | |
United Kingdom - 4.1% (continued) | | | | | |
Travis Perkins PLC | | | | | | 4,682 | | 44,179 | |
| | 560,206 | |
United States - 36.4% | | | | | |
Abbott Laboratories | | | | | | 711 | | 70,346 | |
Adobe Inc. | | | | | | 174 | d | 55,419 | |
Albemarle Corp. | | | | | | 463 | | 129,580 | |
Alphabet Inc., Cl. C | | | | | | 1,598 | d | 151,267 | |
Amazon.com Inc. | | | | | | 1,535 | d | 157,245 | |
American Express Co. | | | | | | 319 | | 47,356 | |
American Tower Corp. | | | | | | 235 | e | 48,690 | |
Amgen Inc. | | | | | | 233 | | 62,992 | |
Apple Inc. | | | | | | 2,608 | | 399,911 | |
Applied Materials Inc. | | | | | | 888 | | 78,402 | |
AT&T Inc. | | | | | | 2,891 | | 52,703 | |
Automatic Data Processing Inc. | | | | | | 253 | | 61,150 | |
Becton Dickinson & Co. | | | | | | 202 | | 47,666 | |
Biogen Inc. | | | | | | 199 | d | 56,405 | |
BlackRock Inc. | | | | | | 42 | | 27,128 | |
Booking Holdings Inc. | | | | | | 26 | d | 48,607 | |
Bristol-Myers Squibb Co. | | | | | | 902 | | 69,878 | |
Brixmor Property Group Inc. | | | | | | 3,089 | e | 65,827 | |
Cigna Corp. | | | | | | 219 | | 70,750 | |
CME Group Inc. | | | | | | 105 | | 18,197 | |
CMS Energy Corp. | | | | | | 1,539 | | 87,800 | |
Colgate-Palmolive Co. | | | | | | 624 | | 46,076 | |
Costco Wholesale Corp. | | | | | | 254 | | 127,381 | |
Ecolab Inc. | | | | | | 620 | | 97,383 | |
Eli Lilly & Co. | | | | | | 309 | | 111,886 | |
Emerson Electric Co. | | | | | | 1,140 | | 98,724 | |
Eversource Energy | | | | | | 1,259 | | 96,037 | |
Fidelity National Information Services Inc. | | | | | | 569 | | 47,221 | |
Ingersoll Rand Inc. | | | | | | 2,142 | | 108,171 | |
Intel Corp. | | | | | | 1,410 | | 40,086 | |
Intuit Inc. | | | | | | 267 | | 114,143 | |
JPMorgan Chase & Co. | | | | | | 879 | | 110,649 | |
Laureate Education Inc. | | | | | | 3,928 | | 49,650 | |
Lowe's Cos. | | | | | | 310 | | 60,435 | |
Mastercard Inc., Cl. A | | | | | | 267 | | 87,624 | |
Merck & Co. Inc. | | | | | | 1,510 | | 152,812 | |
MetLife Inc. | | | | | | 1,546 | | 113,183 | |
Microsoft Corp. | | | | | | 1,441 | | 334,499 | |
Morgan Stanley | | | | | | 628 | | 51,603 | |
20
| | | | | | | | | | |
| |
Description | | | | | Shares | | Value ($) | |
Common Stocks - 62.4% (continued) | | | | | |
United States - 36.4% (continued) | | | | | |
NextEra Energy Inc. | | | | | | 1,421 | | 110,128 | |
NIKE Inc., Cl. B | | | | | | 503 | | 46,618 | |
Norfolk Southern Corp. | | | | | | 303 | | 69,105 | |
PayPal Holdings Inc. | | | | | | 535 | d | 44,715 | |
PepsiCo Inc. | | | | | | 474 | | 86,069 | |
Prologis Inc. | | | | | | 287 | e | 31,785 | |
S&P Global Inc. | | | | | | 56 | | 17,990 | |
Salesforce Inc. | | | | | | 601 | d | 97,717 | |
Starbucks Corp. | | | | | | 660 | | 57,149 | |
Texas Instruments Inc. | | | | | | 698 | | 112,120 | |
The Cooper Companies | | | | | | 200 | | 54,678 | |
The Estee Lauder Companies, Cl. A | | | | | | 169 | | 33,883 | |
The PNC Financial Services Group Inc. | | | | | | 266 | | 43,047 | |
The Procter & Gamble Company | | | | | | 488 | | 65,719 | |
The TJX Companies | | | | | | 790 | | 56,959 | |
The Walt Disney Company | | | | | | 603 | d | 64,244 | |
Thermo Fisher Scientific Inc. | | | | | | 86 | | 44,201 | |
Union Pacific Corp. | | | | | | 249 | | 49,088 | |
United Parcel Service Inc., Cl. B | | | | | | 312 | | 52,344 | |
Verizon Communications Inc. | | | | | | 2,702 | | 100,974 | |
Visa Inc., Cl. A | | | | | | 413 | | 85,557 | |
Warner Bros Discovery Inc. | | | | | | 699 | d | 9,087 | |
| | 4,988,059 | |
Total Common Stocks
(cost $8,409,140) | | 8,557,705 | |
21
STATEMENT OF INVESTMENTS (continued)
| | | | | | | | | | |
| |
Description | 1-Day
Yield (%) | | | | Shares | | Value ($) | |
Investment Companies - 4.0% | | | | | |
Registered Investment Companies - 4.0% | | | | | |
Dreyfus Institutional Preferred Government Plus Money Market Fund, Institutional Shares
(cost $551,509) | | 3.23 | | | | 551,509 | f | 551,509 | |
Total Investments (cost $14,866,504) | | 103.7% | 14,221,340 | |
Liabilities, Less Cash and Receivables | | (3.7%) | (508,476) | |
Net Assets | | 100.0% | 13,712,864 | |
REIT—Real Estate Investment Trust
a The Federal Housing Finance Agency (“FHFA”) placed the Federal Home Loan Mortgage Corporation and Federal National Mortgage Association into conservatorship with FHFA as the conservator. As such, the FHFA oversees the continuing affairs of these companies.
b Purchased on a forward commitment basis.
c Security exempt from registration pursuant to Rule 144A under the Securities Act of 1933. These securities may be resold in transactions exempt from registration, normally to qualified institutional buyers. At October 31, 2022, these securities were valued at $117,758 or .86% of net assets.
d Non-income producing security.
e Investment in real estate investment trust within the United States.
f Investment in affiliated issuer. The investment objective of this investment company is publicly available and can be found within the investment company’s prospectus.
22
| | |
Portfolio Summary (Unaudited) † | Value (%) |
U.S. Treasury Securities | 17.8 |
U.S. Government Agencies Mortgage-Backed | 10.9 |
Health Care | 9.8 |
Banks | 6.8 |
Information Technology | 6.5 |
Chemicals | 4.3 |
Technology Hardware & Equipment | 4.3 |
Investment Companies | 4.0 |
Internet Software & Services | 3.4 |
Utilities | 3.2 |
Insurance | 3.1 |
Diversified Financials | 2.9 |
Telecommunication Services | 2.9 |
Semiconductors & Semiconductor Equipment | 2.7 |
Industrial | 2.0 |
Consumer Discretionary | 1.9 |
Food Products | 1.8 |
Retailing | 1.8 |
Real Estate | 1.7 |
Transportation | 1.4 |
Automobiles & Components | 1.4 |
Commercial & Professional Services | 1.4 |
Consumer Staples | 1.3 |
Media | 1.3 |
Beverage Products | 1.2 |
Electronic Components | 1.1 |
Food & Staples Retailing | .9 |
Consumer Durables & Apparel | .8 |
Environmental Control | .4 |
U.S. Government Agencies Obligations | .2 |
Energy | .2 |
Advertising | .1 |
Agriculture | .1 |
Financials | .1 |
Building Materials | .0 |
| | 103.7 |
† Based on net assets.
See notes to financial statements.
23
STATEMENT OF INVESTMENTS IN AFFILIATED ISSUERS
| | | | | | | |
Affiliated Issuers | | | |
Description | Value ($) 10/31/2021 | Purchases ($)† | Sales ($) | Value ($) 10/31/2022 | Dividends/
Distributions ($) | |
Registered Investment Companies - 4.0% | | |
Dreyfus Institutional Preferred Government Plus Money Market Fund, Institutional Shares - 4.0% | 1,019,711 | 3,651,998 | (4,120,200) | 551,509 | 8,649 | |
† Includes reinvested dividends/distributions.
See notes to financial statements.
24
STATEMENT OF ASSETS AND LIABILITIES
October 31, 2022
| | | | | | | |
| | | | | | |
| | | Cost | | Value | |
Assets ($): | | | | |
Investments in securities—See Statement of Investments | | | |
Unaffiliated issuers | 14,314,995 | | 13,669,831 | |
Affiliated issuers | | 551,509 | | 551,509 | |
Cash | | | | | 30,000 | |
Cash denominated in foreign currency | | | 2,313 | | 2,314 | |
Receivable for investment securities sold | | 404,415 | |
Dividends and interest receivable | | 47,229 | |
Tax reclaim receivable—Note 1(b) | | 10,950 | |
Due from BNY Mellon Investment Adviser, Inc. and affiliates—Note 3(b) | | 5,828 | |
Prepaid expenses | | | | | 2,169 | |
| | | | | 14,724,245 | |
Liabilities ($): | | | | |
Payable for investment securities purchased | | 880,846 | |
Payable for shares of Common Stock redeemed | | 33,248 | |
Directors’ fees and expenses payable | | 225 | |
Other accrued expenses | | | | | 97,062 | |
| | | | | 1,011,381 | |
Net Assets ($) | | | 13,712,864 | |
Composition of Net Assets ($): | | | | |
Paid-in capital | | | | | 13,845,687 | |
Total distributable earnings (loss) | | | | | (132,823) | |
Net Assets ($) | | | 13,712,864 | |
| | | | |
Net Asset Value Per Share | Class K | Service Shares | |
Net Assets ($) | 12,692,371 | 1,020,493 | |
Shares Outstanding | 991,902 | 80,000 | |
Net Asset Value Per Share ($) | 12.80 | 12.76 | |
| | | |
See notes to financial statements. | | | |
25
STATEMENT OF OPERATIONS
Year Ended October 31, 2022
| | | | | | | |
| | | | | | |
| | | | | | |
Investment Income ($): | | | | |
Income: | | | | |
Dividends (net of $18,863 foreign taxes withheld at source): | |
Unaffiliated issuers | | | 180,679 | |
Affiliated issuers | | | 8,649 | |
Interest (net of $124 foreign taxes withheld at source) | | | 103,283 | |
Total Income | | | 292,611 | |
Expenses: | | | | |
Management fee—Note 3(a) | | | 16,684 | |
Professional fees | | | 122,527 | |
Custodian fees—Note 3(b) | | | 18,315 | |
Chief Compliance Officer fees—Note 3(b) | | | 17,405 | |
Pricing Fees | | | 17,237 | |
Prospectus and shareholders’ reports | | | 8,508 | |
Shareholder servicing costs—Note 3(b) | | | 2,914 | |
Directors’ fees and expenses—Note 3(c) | | | 869 | |
Registration fees | | | 444 | |
Loan commitment fees—Note 2 | | | 170 | |
Miscellaneous | | | 13,596 | |
Total Expenses | | | 218,669 | |
Less—reduction in expenses due to undertaking—Note 3(a) | | | (192,890) | |
Less—reduction in fees due to earnings credits—Note 3(b) | | | (3) | |
Net Expenses | | | 25,776 | |
Net Investment Income | | | 266,835 | |
Realized and Unrealized Gain (Loss) on Investments—Note 4 ($): | | |
Net realized gain (loss) on investments and foreign currency transactions | 393,481 | |
Net realized gain (loss) on forward foreign currency exchange contracts | (409) | |
Net Realized Gain (Loss) | | | 393,072 | |
Net change in unrealized appreciation (depreciation) on investments
and foreign currency transactions | (3,777,348) | |
Net Realized and Unrealized Gain (Loss) on Investments | | | (3,384,276) | |
Net (Decrease) in Net Assets Resulting from Operations | | (3,117,441) | |
| | | | | | |
See notes to financial statements. | | | | | |
26
STATEMENT OF CHANGES IN NET ASSETS
| | | | | | | | | | |
| | | | Year Ended October 31, |
| | | | 2022 | | 2021 | |
Operations ($): | | | | | | | | |
Net investment income | | | 266,835 | | | | 212,502 | |
Net realized gain (loss) on investments | | 393,072 | | | | 774,173 | |
Net change in unrealized appreciation
(depreciation) on investments | | (3,777,348) | | | | 1,865,611 | |
Net Increase (Decrease) in Net Assets
Resulting from Operations | (3,117,441) | | | | 2,852,286 | |
Distributions ($): | |
Distributions to shareholders: | | | | | | | | |
Class K | | | (243,078) | | | | (251,294) | |
Service Shares | | | (17,008) | | | | (18,752) | |
Total Distributions | | | (260,086) | | | | (270,046) | |
Capital Stock Transactions ($): | |
Net proceeds from shares sold: | | | | | | | | |
Class K | | | 701,666 | | | | 392,850 | |
Distributions reinvested: | | | | | | | | |
Class K | | | 8,127 | | | | 1,190 | |
Cost of shares redeemed: | | | | | | | | |
Class K | | | (272,279) | | | | (10,426) | |
Increase (Decrease) in Net Assets
from Capital Stock Transactions | 437,514 | | | | 383,614 | |
Total Increase (Decrease) in Net Assets | (2,940,013) | | | | 2,965,854 | |
Net Assets ($): | |
Beginning of Period | | | 16,652,877 | | | | 13,687,023 | |
End of Period | | | 13,712,864 | | | | 16,652,877 | |
Capital Share Transactions (Shares): | |
Class K | | | | | | | | |
Shares sold | | | 49,507 | | | | 25,567 | |
Shares issued for distributions reinvested | | | 520 | | | | 82 | |
Shares redeemed | | | (21,263) | | | | (683) | |
Net Increase (Decrease) in Shares Outstanding | 28,764 | | | | 24,966 | |
| | | | | | | | | |
See notes to financial statements. | | | | | | | | |
27
FINANCIAL HIGHLIGHTS
The following tables describe the performance for each share class for the fiscal periods indicated. All information (except portfolio turnover rate) reflects financial results for a single fund share. Net asset value total return is calculated assuming an initial investment made at the net asset value at the beginning of the period, reinvestment of all dividends and distributions at net asset value during the period, and redemption at net asset value on the last day of the period. Net asset value total return includes adjustments in accordance with accounting principles generally accepted in the United States of America and as such, the net asset value for financial reporting purposes and the returns based upon those net asset values may differ from the net asset value and returns for shareholder transactions. These figures have been derived from the fund’s financial statements.
| | | | | | | |
| | | |
| | | Year Ended October 31, |
Class K Shares | | 2022 | 2021 | 2020 | 2019a | 2018b |
Per Share Data ($): | | | | | | |
Net asset value,
beginning of period | | 15.97 | 13.45 | 12.56 | 11.57 | 12.50 |
Investment Operations: | | | | | | |
Net investment incomec | | .25 | .21 | .22 | .26 | .37 |
Net realized and unrealized
gain (loss) on investments | | (3.17) | 2.58 | .88 | .97 | (1.05) |
Total from Investment Operations | | (2.92) | 2.79 | 1.10 | 1.23 | (.68) |
Distributions: | | | | | | |
Dividends from
net investment income | | (.25) | (.27) | (.21) | (.24) | (.25) |
Net asset value, end of period | | 12.80 | 15.97 | 13.45 | 12.56 | 11.57 |
Total Return (%) | | (18.57) | 20.91 | 8.88 | 11.03 | (5.64)d |
Ratios/Supplemental Data (%): | | | | | | |
Ratio of total expenses
to average net assets | | 1.42 | 1.34 | 1.42 | 2.11 | 2.19e |
Ratio of net expenses
to average net assets | | .15 | .15 | .15 | .40 | .71e |
Ratio of net investment income
to average net assets | | 1.78 | 1.38 | 1.70 | 2.16 | 3.10e |
Portfolio Turnover Rate | | 96.40f | 88.59f | 87.52f | 220.33 | 81.07d |
Net Assets,
end of period ($ x 1,000) | | 12,692 | 15,379 | 12,614 | 11,753 | 5,412 |
a Effective April 1, 2019, Class Y shares were redesignated as Class K Shares.
b From November 30, 2017 (commencement of operations) to October 31, 2018.
c Based on average shares outstanding.
d Not annualized.
e Annualized.
f The portfolio turnover rates excluding mortgage dollar roll transactions for the periods ended October 31, 2022, 2021 and 2020 were 58.39%, 57.21% and 52.86%, respectively.
See notes to financial statements.
28
| | | | | | | |
| | | |
| | | Year Ended October 31, |
Service Shares | | 2022 | 2021 | 2020 | 2019a | 2018b |
Per Share Data ($): | | | | | | |
Net asset value,
beginning of period | | 15.92 | 13.41 | 12.53 | 11.56 | 12.50 |
Investment Operations: | | | | | | |
Net investment incomec | | .22 | .17 | .19 | .23 | .32 |
Net realized and unrealized
gain (loss) on investments | | (3.17) | 2.57 | .88 | .97 | (1.03) |
Total from Investment Operations | | (2.95) | 2.74 | 1.07 | 1.20 | (.71) |
Distributions: | | | | | | |
Dividends from
net investment income | | (.21) | (.23) | (.19) | (.23) | (.23) |
Net asset value, end of period | | 12.76 | 15.92 | 13.41 | 12.53 | 11.56 |
Total Return (%) | | (18.76) | 20.63 | 8.50 | 10.73 | (5.79)d |
Ratios/Supplemental Data (%): | | | | | | |
Ratio of total expenses
to average net assets | | 1.67 | 1.59 | 1.67 | 2.34 | 2.56e |
Ratio of net expenses
to average net assets | | .40 | .40 | .40 | .62 | .96e |
Ratio of net investment income
to average net assets | | 1.53 | 1.14 | 1.45 | 1.95 | 2.78e |
Portfolio Turnover Rate | | 96.40f | 88.59f | 87.52f | 220.33 | 81.07d |
Net Assets,
end of period ($ x 1,000) | | 1,020 | 1,274 | 1,073 | 1,003 | 925 |
a Effective April 1, 2019, Class A shares were redesignated as Service Shares.
b From November 30, 2017 (commencement of operations) to October 31, 2018.
c Based on average shares outstanding.
d Not annualized.
e Annualized.
f The portfolio turnover rates excluding mortgage dollar roll transactions for the periods ended October 31, 2022, 2021 and 2020 were 58.39%, 57.21% and 52.86%, respectively.
See notes to financial statements.
29
NOTES TO FINANCIAL STATEMENTS
NOTE 1—Significant Accounting Policies:
BNY Mellon Sustainable Balanced Fund (the “fund”) is a separate diversified series of BNY Mellon Advantage Funds, Inc. (the “Company”), which is registered under the Investment Company Act of 1940, as amended (the “Act”), as an open-end management investment company and operates as a series company currently offering eight series, including the fund. The fund’s investment objective is to seek long-term capital appreciation. BNY Mellon Investment Adviser, Inc. (the “Adviser”), a wholly-owned subsidiary of The Bank of New York Mellon Corporation (“BNY Mellon”), serves as the fund’s investment adviser. Each of Newton Investment Management Limited (“NIM”) and Mellon Investments Corporation (“Mellon”), each a wholly-owned subsidiary of BNY Mellon and an affiliate of the Adviser, serve as the fund’s sub-advisers (the “Sub-Advisers”).
BNY Mellon Securities Corporation (the “Distributor”), a wholly-owned subsidiary of the Adviser, is the distributor of the fund’s shares. The fund is authorized to issue 400 million shares of $.001 par value Common Stock. The fund currently has authorized two classes of shares: Class K and Service. Class K shares (300 million shares authorized) and Service shares (100 million shares authorized). Class K shares are generally only offered to state-sponsored retirement plans. Service Class shares are generally offered only to holders of Class K who terminate their relationship with state-sponsored retirement plans. Each class of shares has identical rights and privileges, except with respect to the Shareholder Services Plan and the expenses borne by each class, the allocation of certain transfer agency costs, and certain voting rights. Income, expenses (other than expenses attributable to a specific class), and realized and unrealized gains or losses on investments are allocated to each class of shares based on its relative net assets.
As of October 31, 2022, MBC Investments Corporation, an indirect subsidiary of BNY Mellon, held 935,314 of Class K shares and all of the outstanding Service shares of the fund.
The Company accounts separately for the assets, liabilities and operations of each series. Expenses directly attributable to each series are charged to that series’ operations; expenses which are applicable to all series are allocated among them on a pro rata basis.
The Financial Accounting Standards Board (“FASB”) Accounting Standards Codification (“ASC”) is the exclusive reference of authoritative
30
U.S. generally accepted accounting principles (“GAAP”) recognized by the FASB to be applied by nongovernmental entities. Rules and interpretive releases of the SEC under authority of federal laws are also sources of authoritative GAAP for SEC registrants. The fund is an investment company and applies the accounting and reporting guidance of the FASB ASC Topic 946 Financial Services-Investment Companies. The fund’s financial statements are prepared in accordance with GAAP, which may require the use of management estimates and assumptions. Actual results could differ from those estimates.
The Company enters into contracts that contain a variety of indemnifications. The fund’s maximum exposure under these arrangements is unknown. The fund does not anticipate recognizing any loss related to these arrangements.
(a) Portfolio valuation: The fair value of a financial instrument is the amount that would be received to sell an asset or paid to transfer a liability in an orderly transaction between market participants at the measurement date (i.e., the exit price). GAAP establishes a fair value hierarchy that prioritizes the inputs of valuation techniques used to measure fair value. This hierarchy gives the highest priority to unadjusted quoted prices in active markets for identical assets or liabilities (Level 1 measurements) and the lowest priority to unobservable inputs (Level 3 measurements).
Additionally, GAAP provides guidance on determining whether the volume and activity in a market has decreased significantly and whether such a decrease in activity results in transactions that are not orderly. GAAP requires enhanced disclosures around valuation inputs and techniques used during annual and interim periods.
Various inputs are used in determining the value of the fund’s investments relating to fair value measurements. These inputs are summarized in the three broad levels listed below:
Level 1—unadjusted quoted prices in active markets for identical investments.
Level 2—other significant observable inputs (including quoted prices for similar investments, interest rates, prepayment speeds, credit risk, etc.).
Level 3—significant unobservable inputs (including the fund’s own assumptions in determining the fair value of investments).
The inputs or methodology used for valuing securities are not necessarily an indication of the risk associated with investing in those securities.
31
NOTES TO FINANCIAL STATEMENTS (continued)
Changes in valuation techniques may result in transfers in or out of an assigned level within the disclosure hierarchy. Valuation techniques used to value the fund’s investments are as follows:
The Company’s Board of Directors (the “Board”) has designated the Adviser as the fund’s valuation designee, effective September 8, 2022, to make all fair value determinations with respect to the fund’s portfolio investments, subject to the Board’s oversight and pursuant to Rule 2a-5 under the Act.
Investments in debt securities excluding short-term investments (other than U.S. Treasury Bills), are valued each business day by one or more independent pricing services (each, a “Service”) approved by the Board. Investments for which quoted bid prices are readily available and are representative of the bid side of the market in the judgment of a Service are valued at the mean between the quoted bid prices (as obtained by a Service from dealers in such securities) and asked prices (as calculated by a Service based upon its evaluation of the market for such securities). Securities are valued as determined by a Service, based on methods which include consideration of the following: yields or prices of securities of comparable quality, coupon, maturity and type; indications as to values from dealers; and general market conditions. The Services are engaged under the general supervision of the Board. These securities are generally categorized within Level 2 of the fair value hierarchy.
Investments in equity securities are valued at the last sales price on the securities exchange or national securities market on which such securities are primarily traded. Securities listed on the National Market System for which market quotations are available are valued at the official closing price or, if there is no official closing price that day, at the last sales price. For open short positions, asked prices are used for valuation purposes. Bid price is used when no asked price is available. Registered investment companies that are not traded on an exchange are valued at their net asset value. All of the preceding securities are generally categorized within Level 1 of the fair value hierarchy.
Securities not listed on an exchange or the national securities market, or securities for which there were no transactions, are valued at the average of the most recent bid and asked prices. These securities are generally categorized within Level 2 of the fair value hierarchy.
Fair valuing of securities may be determined with the assistance of a Service using calculations based on indices of domestic securities and other appropriate indicators, such as prices of relevant American Depository
32
Receipts and futures. Utilizing these techniques may result in transfers between Level 1 and Level 2 of the fair value hierarchy.
When market quotations or official closing prices are not readily available, or are determined not to accurately reflect fair value, such as when the value of a security has been significantly affected by events after the close of the exchange or market on which the security is principally traded (for example, a foreign exchange or market), but before the fund calculates its net asset value, the fund may value these investments at fair value as determined in accordance with the procedures approved by the Board. Certain factors may be considered when fair valuing investments such as: fundamental analytical data, the nature and duration of restrictions on disposition, an evaluation of the forces that influence the market in which the securities are purchased and sold, and public trading in similar securities of the issuer or comparable issuers. These securities are either categorized within Level 2 or 3 of the fair value hierarchy depending on the relevant inputs used.
For securities where observable inputs are limited, assumptions about market activity and risk are used and such securities are generally categorized within Level 3 of the fair value hierarchy.
Investments denominated in foreign currencies are translated to U.S. dollars at the prevailing rates of exchange.
The following is a summary of the inputs used as of October 31, 2022 in valuing the fund’s investments:
| | | | | | | |
| | Level 1-Unadjusted Quoted Prices | Level 2- Other Significant Observable Inputs | | Level 3-Significant Unobservable Inputs | Total | |
Assets ($) | | |
Investments in Securities:† | | |
Corporate Bonds | - | 1,150,948 | | - | 1,150,948 | |
Equity Securities - Common Stocks | 5,713,334 | 2,844,371 | †† | - | 8,557,705 | |
Investment Companies | 551,509 | - | | - | 551,509 | |
U.S. Government Agencies Mortgage-Backed | - | 1,494,900 | | - | 1,494,900 | |
33
NOTES TO FINANCIAL STATEMENTS (continued)
| | | | | | | |
| | Level 1-Unadjusted Quoted Prices | Level 2- Other Significant Observable Inputs | | Level 3-Significant Unobservable Inputs | Total | |
Assets ($)(continued) | | |
Investments in Securities:†(continued) | | |
U.S. Government Agencies Obligations | - | 24,350 | | - | 24,350 | |
U.S. Treasury Securities | - | 2,441,928 | | - | 2,441,928 | |
† See Statement of Investments for additional detailed categorizations, if any.
†† Securities classified within Level 2 at period end as the values were determined pursuant to the fund’s fair valuation procedures.
(b) Foreign currency transactions: The fund does not isolate that portion of the results of operations resulting from changes in foreign exchange rates on investments from the fluctuations arising from changes in the market prices of securities held. Such fluctuations are included with the net realized and unrealized gain or loss on investments.
Net realized foreign exchange gains or losses arise from sales of foreign currencies, currency gains or losses realized on securities transactions between trade and settlement date, and the difference between the amounts of dividends, interest and foreign withholding taxes recorded on the fund’s books and the U.S. dollar equivalent of the amounts actually received or paid. Net unrealized foreign exchange gains and losses arise from changes in the value of assets and liabilities other than investments resulting from changes in exchange rates. Foreign currency gains and losses on foreign currency transactions are also included with net realized and unrealized gain or loss on investments.
Foreign taxes: The fund may be subject to foreign taxes (a portion of which may be reclaimable) on income, stock dividends, realized and unrealized capital gains on investments or certain foreign currency transactions. Foreign taxes are recorded in accordance with the applicable foreign tax regulations and rates that exist in the foreign jurisdictions in which the fund invests. These foreign taxes, if any, are paid by the fund and are reflected in the Statement of Operations, if applicable. Foreign taxes payable or deferred or those subject to reclaims as of October 31, 2022, if any, are disclosed in the fund’s Statement of Assets and Liabilities.
(c) Securities transactions and investment income: Securities transactions are recorded on a trade date basis. Realized gains and losses from securities transactions are recorded on the identified cost basis. Dividend income is recognized on the ex-dividend date and interest income, including, where applicable, accretion of discount and
34
amortization of premium on investments, is recognized on the accrual basis.
(d) Affiliated issuers: Investments in other investment companies advised by the Adviser are considered “affiliated” under the Act.
(e) Market Risk: The value of the securities in which the fund invests may be affected by political, regulatory, economic and social developments, and developments that impact specific economic sectors, industries or segments of the market. The value of a security may also decline due to general market conditions that are not specifically related to a particular company or industry, such as real or perceived adverse economic conditions, changes in the general outlook for corporate earnings, changes in interest or currency rates, changes to inflation, adverse changes to credit markets or adverse investor sentiment generally. In addition, turbulence in financial markets and reduced liquidity in equity, credit and/or fixed income markets may negatively affect many issuers, which could adversely affect the fund. Global economies and financial markets are becoming increasingly interconnected, and conditions and events in one country, region or financial market may adversely impact issuers in a different country, region or financial market. These risks may be magnified if certain events or developments adversely interrupt the global supply chain; in these and other circumstances, such risks might affect companies world-wide. Recent examples include pandemic risks related to COVID-19 and aggressive measures taken world-wide in response by governments, including closing borders, restricting international and domestic travel, and the imposition of prolonged quarantines of large populations, and by businesses, including changes to operations and reducing staff.
Foreign Investment Risk: To the extent the fund invests in foreign securities, the fund’s performance will be influenced by political, social and economic factors affecting investments in foreign issuers. Special risk associated with investments in foreign issuers include exposure to currency fluctuations, less liquidity, less developed or less efficient trading markets, lack of comprehensive company information, political and economic instability and differing auditing and legal standards.
(f) Dividends and distributions to shareholders: Dividends and distributions are recorded on the ex-dividend date. Dividends from net investment income are normally declared and paid on a monthly basis. Dividends from net realized capital gains, if any, are normally declared and paid annually, but the fund may make distributions on a more frequent basis to comply with the distribution requirements of the Internal Revenue Code of 1986, as amended (the “Code”). To the extent that net realized capital gains can be offset by capital loss carryovers, it is the policy of the
35
NOTES TO FINANCIAL STATEMENTS (continued)
fund not to distribute such gains. Income and capital gain distributions are determined in accordance with income tax regulations, which may differ from GAAP.
(g) Federal income taxes: It is the policy of the fund to continue to qualify as a regulated investment company, if such qualification is in the best interests of its shareholders, by complying with the applicable provisions of the Code, and to make distributions of taxable income and net realized capital gain sufficient to relieve it from substantially all federal income and excise taxes.
As of and during the period ended October 31, 2022, the fund did not have any liabilities for any uncertain tax positions. The fund recognizes interest and penalties, if any, related to uncertain tax positions as income tax expense in the Statement of Operations. During the period ended October 31, 2022, the fund did not incur any interest or penalties.
Each tax year in the four year period ended October 31, 2022 remains subject to examination by the Internal Revenue Service and state taxing authorities.
At October 31, 2022, the components of accumulated earnings on a tax basis were as follows: undistributed ordinary income $235,905, undistributed capital gains $333,810 and unrealized depreciation $702,538.
The tax character of distributions paid to shareholders during the fiscal year ended October 31, 2022 and October 31, 2021 were as follows: ordinary income $260,086 and $270,046, respectively.
(h) New accounting pronouncements: In March 2020, the FASB issued Accounting Standards Update 2020-04, Reference Rate Reform (Topic 848): Facilitation of the Effects of Reference Rate Reform on Financial Reporting (“ASU 2020-04”), and in January 2021, the FASB issued Accounting Standards Update 2021-01, Reference Rate Reform (Topic 848): Scope (“ASU 2021-01”), which provides optional, temporary relief with respect to the financial reporting of contracts subject to certain types of modifications due to the planned discontinuation of the London Interbank Offered Rate (“LIBOR”) and other interbank offered rates as of the end of 2021. The temporary relief provided by ASU 2020-04 and ASU 2021-01 is effective for certain reference rate-related contract modifications that occur during the period from March 12, 2020 through December 31, 2022 (“FASB Effective Date”). Management had evaluated the impact of ASU 2020-04 and ASU 2021-01 on the fund’s investments, derivatives, debt and other contracts that will undergo reference rate-related modifications as a result of the Reference Rate Reform. Management will be adopting ASU 2020-04 and ASU 2021-01 on FASB
36
Effective Date or if amended ASU 2020-04 new extended FASB Effective Date, if any. Management will continue to work with other financial institutions and counterparties to modify contracts as required by applicable regulation and within the regulatory deadlines. As of October 31, 2022, management believes these accounting standards have no impact on the fund and does not have any concerns of adopting the regulations by FASB Effective Date.
NOTE 2—Bank Lines of Credit:
The fund participates with other long-term open-end funds managed by the Adviser in a $823.5 million unsecured credit facility led by Citibank, N.A. (the “Citibank Credit Facility”) and a $300 million unsecured credit facility provided by BNY Mellon (the “BNYM Credit Facility”), each to be utilized primarily for temporary or emergency purposes, including the financing of redemptions (each, a “Facility”). The Citibank Credit Facility is available in two tranches: (i) Tranche A is in an amount equal to $688.5 million and is available to all long-term open-ended funds, including the fund, and (ii) Tranche B is an amount equal to $135 million and is available only to BNY Mellon Floating Rate Income Fund, a series of BNY Mellon Investment Funds IV, Inc. In connection therewith, the fund has agreed to pay its pro rata portion of commitment fees for Tranche A of the Citibank Credit Facility and the BNYM Credit Facility. Interest is charged to the fund based on rates determined pursuant to the terms of the respective Facility at the time of borrowing. During the period ended October 31, 2022, the fund did not borrow under the Facilities.
NOTE 3—Management Fee, Sub-Advisory Fee and Other Transactions with Affiliates:
(a) Pursuant to a management agreement with the Adviser, the management fee is computed at the annual rate of .11% of the value of the fund’s average daily net assets and is payable monthly. The Adviser has contractually agreed, from November 1, 2021 through March 1, 2023, to waive receipt of its fees and/or assume the direct expenses of the fund, so that the direct expenses of neither class (excluding Shareholder Services Plan fees, taxes, interest expense, brokerage commissions, commitment fees on borrowings and extraordinary expenses) exceed .15% of the value of the fund’s average daily net assets. On or after March 1, 2023, the Adviser may terminate this expense limitation at any time. The reduction in expenses, pursuant to the undertaking, amounted to $192,890 during the period ended October 31, 2022.
Pursuant to sub-investment advisory agreements between the Adviser and the respective Sub-Advisers, NIM and Mellon each serve as the fund’s sub-
37
NOTES TO FINANCIAL STATEMENTS (continued)
adviser responsible for the day-to-day management of a portion of the fund’s portfolio. The Adviser pays each of NIM and Mellon a monthly fee at an annual percentage of the value of the fund’s average daily net assets. The Adviser has obtained an exemptive order from the SEC (the “Order”), upon which the fund may rely, to use a manager of managers approach that permits the Adviser, subject to certain conditions and approval by the Board, to enter into and materially amend sub-investment advisory agreements with one or more sub-advisers who are either unaffiliated with the Adviser or are wholly-owned subsidiaries (as defined under the Act) of the Adviser’s ultimate parent company, BNY Mellon, without obtaining shareholder approval. The Order also allows the fund to disclose the sub-advisory fee paid by the Adviser to any unaffiliated sub-adviser in the aggregate with other unaffiliated sub-advisers in documents filed with the SEC and provided to shareholders. In addition, pursuant to the Order, it is not necessary to disclose the sub-advisory fee payable by the Adviser separately to a sub-adviser that is a wholly-owned subsidiary of BNY Mellon in documents filed with the SEC and provided to shareholders; such fees are to be aggregated with fees payable to the Adviser. The Adviser has ultimate responsibility (subject to oversight by the Board) to supervise any sub-adviser and recommend the hiring, termination, and replacement of any sub-adviser to the Board.
(b) Under the Shareholder Services Plan, Service shares pay the Distributor at an annual rate of .25% of the value of their average daily net assets for the provision of certain services. The services provided may include personal services relating to shareholder accounts, such as answering shareholder inquiries regarding the fund, and services related to the maintenance of shareholder accounts. Pursuant to the Plan, the Distributor may make payments to Service Agents (securities dealers, financial institutions or other industry professionals) with respect to these services. The Distributor determines the amounts to be paid to Service Agents. During the period ended October 31, 2022, the fund was charged $2,845 pursuant to the Shareholder Services Plan.
The fund has an arrangement with BNY Mellon Transfer, Inc., (the “Transfer Agent”), a subsidiary of BNY Mellon and an affiliate of the Adviser, whereby the fund may receive earnings credits when positive cash balances are maintained, which are used to offset Transfer Agent fees. For financial reporting purposes, the fund includes transfer agent net earnings credits, if any, as an expense offset in the Statement of Operations.
The fund has an arrangement with (the “Custodian”), a subsidiary of BNY Mellon and an affiliate of the Adviser, whereby the fund will receive interest income or be charged overdraft fees when cash balances are
38
maintained. For financial reporting purposes, the fund includes this interest income and overdraft fees, if any, as interest income in the Statement of Operations.
The fund compensates the Transfer Agent, under a transfer agency agreement, for providing transfer agency and cash management services for the fund. The majority of Transfer Agent fees are comprised of amounts paid on a per account basis, while cash management fees are related to fund subscriptions and redemptions. During the period ended October 31, 2022, the fund was charged $64 for transfer agency services. These fees are included in Shareholder servicing costs in the Statement of Operations. These fees were partially offset by earnings credits of $3.
The fund compensates the Custodian, under a custody agreement, for providing custodial services for the fund. These fees are determined based on net assets, geographic region and transaction activity. During the period ended October 31, 2022, the fund was charged $18,315 pursuant to the custody agreement.
During the period ended October 31, 2022, the fund was charged $17,405 for services performed by the fund’s Chief Compliance Officer and his staff. These fees are included in Chief Compliance Officer fees in the Statement of Operations.
The components of “Due from BNY Mellon Investment Adviser, Inc. and affiliates” in the Statement of Assets and Liabilities consist of: management fee of $1,269 Shareholder Services Plan fees of $212, Custodian fees of $7,727, Chief Compliance Officer fees of $5,078 and Transfer Agent fees of $10, which are offset against an expense reimbursement currently in effect in the amount of $20,124.
(c) Each Board member also serves as a Board member of other funds in the BNY Mellon Family of Funds complex. Annual retainer fees and attendance fees are allocated to each fund based on net assets.
NOTE 4—Securities Transactions:
The aggregate amount of purchases and sales (including paydowns) of investment securities, excluding short-term securities and forward foreign currency exchange contracts (“forward contracts”), during the period ended October 31, 2022, amounted to $15,073,064 and $14,335,636, respectively, of which $5,644,522 in purchases and $5,652,866 in sales were from mortgage dollar roll transactions.
Mortgage Dollar Rolls: A mortgage dollar roll transaction involves a sale by the fund of mortgage related securities that it holds with an agreement by the fund to repurchase similar securities at an agreed upon price and
39
NOTES TO FINANCIAL STATEMENTS (continued)
date. The securities purchased will bear the same interest rate as those sold, but generally will be collateralized by pools of mortgages with different prepayment histories than those securities sold. The fund accounts for mortgage dollar rolls as purchases and sales transactions. The fund executes mortgage dollar rolls entirely in the To-Be-Announced (“TBA”) market.
Derivatives: A derivative is a financial instrument whose performance is derived from the performance of another asset. The fund enters into International Swaps and Derivatives Association, Inc. Master Agreements or similar agreements (collectively, “Master Agreements”) with its over-the-counter (“OTC”) derivative contract counterparties in order to, among other things, reduce its credit risk to counterparties. Master Agreements include provisions for general obligations, representations, collateral and events of default or termination. Under a Master Agreement, the fund may offset with the counterparty certain derivative financial instruments’ payables and/or receivables with collateral held and/or posted and create one single net payment in the event of default or termination. The SEC recently adopted Rule 18f-4 under the Act, which, effective August 18, 2022, regulates the use of derivatives transactions for certain funds registered under the Act. The fund is deemed a “limited” derivatives user under the rule and is required to limit its derivatives exposure so that the total notional value of derivatives does not exceed 10% of fund’s net assets, and is subject to certain reporting requirements.
Each type of derivative instrument that was held by the fund during the period ended October 31, 2022 is discussed below.
Forward Foreign Currency Exchange Contracts: The fund enters into forward contracts in order to hedge its exposure to changes in foreign currency exchange rates on its foreign portfolio holdings, to settle foreign currency transactions or as a part of its investment strategy. When executing forward contracts, the fund is obligated to buy or sell a foreign currency at a specified rate on a certain date in the future. With respect to sales of forward contracts, the fund incurs a loss if the value of the contract increases between the date the forward contract is opened and the date the forward contract is closed. The fund realizes a gain if the value of the contract decreases between those dates. With respect to purchases of forward contracts, the fund incurs a loss if the value of the contract decreases between the date the forward contract is opened and the date the forward contract is closed. The fund realizes a gain if the value of the contract increases between those dates. Any realized or unrealized gains or losses which occurred during the period are reflected in the Statement of Operations. The fund is exposed to foreign currency risk as a result of
40
changes in value of underlying financial instruments. The fund is also exposed to credit risk associated with counterparty non-performance on these forward contracts, which is generally limited to the unrealized gain on each open contract. This risk may be mitigated by Master Agreements, if any, between the fund and the counterparty and the posting of collateral, if any, by the counterparty to the fund to cover the fund’s exposure to the counterparty. As of October 31, 2022 there were no forward contracts outstanding.
The following summarizes the average market value of derivatives outstanding during the period ended October 31, 2022:
| | | |
| | Average Market Value ($) |
Forward contracts | | 20,476 |
At October 31, 2022, the cost of investments for federal income tax purposes was $14,922,335; accordingly, accumulated net unrealized depreciation on investments was $700,995, consisting of $1,236,726 gross unrealized appreciation and $1,937,721 gross unrealized depreciation.
NOTE 5—Plan of Liquidation:
The Board has approved the liquidation of fund, a series of the Company, effective on November 15, 2022 (the “Liquidation Date). Before the Liquidation Date, and at the discretion of fund management, the fund’s portfolio securities were sold, and the fund may had ceased to pursue its investment objective and policies. The liquidation of the fund may result in one or more taxable events for shareholders subject to federal income tax.
Accordingly, on August 31, 2022 (the “Closing Date”), the fund was closed to any investments for new accounts, except those new accounts may be established by participants in retirement savings plan programs, 529 plans and ABLE Plans sponsored and/or administered by government or government-related entities, provided the fund is established as an investment option under the plans or programs before the Closing Date.
41
REPORT OF INDEPENDENT REGISTERED PUBLIC ACCOUNTING FIRM
To the Shareholders and the Board of Directors of BNY Mellon Sustainable Balanced Fund
Opinion on the Financial Statements
We have audited the accompanying statement of assets and liabilities of BNY Mellon Sustainable Balanced Fund (the “Fund”) (one of the funds constituting BNY Mellon Advantage Funds, Inc.), including the statement of investments, as of October 31, 2022, and the related statement of operations for the year then ended, the statements of changes in net assets for each of the two years in the period then ended, the financial highlights for each of the four years in the period then ended and the period from November 30, 2017 (commencement of operations) through October 31, 2018 and the related notes (collectively referred to as the “financial statements”). In our opinion, the financial statements present fairly, in all material respects, the financial position of the Fund (one of the funds constituting BNY Mellon Advantage Funds, Inc.) at October 31, 2022, the results of its operations for the year then ended, the changes in its net assets for each of the two years in the period then ended and its financial highlights for each of the four years in the period then ended and the period from November 30, 2017 (commencement of operations) through October 31, 2018, in conformity with U.S. generally accepted accounting principles.
Basis for Opinion
These financial statements are the responsibility of the Fund’s management. Our responsibility is to express an opinion on the Fund’s financial statements based on our audits. We are a public accounting firm registered with the Public Company Accounting Oversight Board (United States) (“PCAOB”) and are required to be independent with respect to the Fund in accordance with the U.S. federal securities laws and the applicable rules and regulations of the Securities and Exchange Commission and the PCAOB.
We conducted our audits in accordance with the standards of the PCAOB. Those standards require that we plan and perform the audit to obtain reasonable assurance about whether the financial statements are free of material misstatement, whether due to error or fraud. The Fund is not required to have, nor were we engaged to perform, an audit of the Fund’s internal control over financial reporting. As part of our audits, we are required to obtain an understanding of internal control over financial reporting, but not for the purpose of expressing an opinion on the effectiveness of the Fund’s internal control over financial reporting. Accordingly, we express no such opinion.
Our audits included performing procedures to assess the risks of material misstatement of the financial statements, whether due to error or fraud, and performing procedures that respond to those risks. Such procedures included examining, on a test basis, evidence regarding the amounts and disclosures in the financial statements. Our procedures included confirmation of securities owned as of October 31, 2022, by correspondence with the custodian, brokers and others; when replies were not received from brokers and others, we performed other auditing procedures. Our audits also included evaluating the accounting principles used and significant estimates made by management, as well as evaluating the overall presentation of the financial statements. We believe that our audits provide a reasonable basis for our opinion.

We have served as the auditor of one or more investment companies in the BNY Mellon Family of Funds since at least 1957, but we are unable to determine the specific year.
New York, New York
December 27, 2022
42
IMPORTANT TAX INFORMATION (Unaudited)
For federal tax purposes, the fund hereby reports 27.57% of the ordinary dividends paid during the fiscal year ended October 31, 2022 as qualifying for the corporate dividends received deduction. Also certain dividends paid by the fund may be subject to a maximum tax rate of 15%, as provided for by the Jobs and Growth Tax Relief Reconciliation Act of 2003. Of the distributions paid during the fiscal year, $151,379 represents the maximum amount that may be considered qualified dividend income. Shareholders will receive notification in early 2023 of the percentage applicable to the preparation of their 2022 income tax returns.
43
LIQUIDITY RISK MANAGEMENT PROGRAM (Unaudited)
Effective June 1, 2019, the fund adopted a liquidity risk management program (the “Liquidity Risk Management Program”) pursuant to the requirements of Rule 22e-4 under the Investment Company Act of 1940, as amended. Rule 22e-4 requires registered open-end funds, including mutual funds and exchange-traded funds but not money market funds, to establish liquidity risk management programs in order to effectively manage fund liquidity and shareholder redemptions. The rule is designed to mitigate the risk that a fund could not meet redemption requests without significantly diluting the interests of remaining investors.
The rule requires the fund to assess, manage and review their liquidity risk at least annually considering applicable factors such as investment strategy and liquidity during normal and foreseeable stressed conditions, including whether the strategy is appropriate for an open-end fund and whether the fund has a relatively concentrated portfolio or large positions in particular issuers. The fund must also assess its use of borrowings and derivatives, short-term and long-term cash flow projections in normal and stressed conditions, holdings of cash and cash equivalents, and borrowing arrangements and other funding sources.
The rule also requires the fund to classify its investments as highly liquid, moderately liquid, less liquid or illiquid based on the number of days the fund expects it would take to liquidate the investment, and to review these classifications at least monthly or more often under certain conditions. The periods range from three or fewer business days for a highly liquid investment to greater than seven calendar days for settlement of a less liquid investment. Illiquid investments are those a fund does not expect to be able to sell or dispose of within seven calendar days without significantly changing the market value. The fund is prohibited from acquiring an investment if, after the acquisition, its holdings of illiquid assets will exceed 15% of its net assets. In addition, if a fund permits redemptions in-kind, the rule requires the fund to establish redemption in-kind policies and procedures governing how and when it will engage in such redemptions.
Pursuant to the rule’s requirements, the Liquidity Risk Management Program has been reviewed and approved by the Board. Furthermore, the Board has received a written report prepared by the Program’s Administrator that addresses the operation of the Program, assesses its adequacy and effectiveness and describes any material changes made to the Program.
Assessment of Program
In the opinion of the Program Administrator, the Program approved by the Board continues to be adequate for the fund and the Program has been implemented effectively. The Program Administrator has monitored the fund’s liquidity risk and the liquidity classification of the securities held by the fund and has determined that the Program is operating effectively.
During the period from January 1, 2021 to December 31, 2021, there were no material changes to the Program and no material liquidity events that impacted the fund. During the period, the fund held sufficient highly liquid assets to meet fund redemptions.
Under normal expected foreseeable fund redemption forecasts and foreseeable stressed fund redemption forecasts, the Program Administrator believes that the fund maintains sufficient highly liquid assets to meet expected fund redemptions.
44
BOARD MEMBERS INFORMATION (Unaudited)
Independent Board Members
Joseph S. DiMartino (79)
Chairman of the Board (1995)
Principal Occupation During Past 5 Years:
· Director or Trustee of funds in the BNY Mellon Family of Funds and certain other entities (as described in the fund’s Statement of Additional Information) (1995-Present)
Other Public Company Board Memberships During Past 5 Years:
· CBIZ, Inc., a public company providing professional business services, products and solutions, Director (1997-Present)
No. of Portfolios for which Board Member Serves: 94
———————
Peggy C. Davis (79)
Board Member (2006)
Principal Occupation During Past 5 Years:
· Shad Professor of Law, New York University School of Law (1983-Present)
No. of Portfolios for which Board Member Serves: 33
———————
Gina D. France (64)
Board Member (2019)
Principal Occupation During Past 5 Years:
· France Strategic Partners, a strategy and advisory firm serving corporate clients across the United States, Founder, President and Chief Executive Officer (2003-Present)
Other Public Company Board Memberships During Past 5 Years:
· Huntington Bancshares, a bank holding company headquartered in Columbus, Ohio, Director (2016-Present)
· Cedar Fair, L.P., a publicly-traded partnership that owns and operates amusement parks and hotels in the U.S. and Canada, Director (2011-Present)
· CBIZ, Inc., a public company providing professional business services, products and solutions, Director (2015-Present)
· FirstMerit Corporation, a diversified financial services company, Director (2004-2016)
No. of Portfolios for which Board Member Serves: 23
———————
Joan Gulley (75)
Board Member (2017)
Principal Occupation During Past 5 Years:
· Nantucket Atheneum, public library, Chair (2018-June 2021) and Director (2015-June 2021)
· Orchard Island Club, golf and beach club, Governor (2016-Present)
No. of Portfolios for which Board Member Serves: 40
———————
45
BOARD MEMBERS INFORMATION (Unaudited) (continued)
Robin A. Melvin (59)
Board Member (2012)
Principal Occupation During Past 5 Years:
· Westover School, a private girls’ boarding school in Middlebury, Connecticut, Trustee (2019-Present)
· Mentor Illinois, a non-profit organization dedicated to increasing the quality of mentoring services in Illinois, Co-Chair (2014–2020); Board Member, Mentor Illinois (2013-2020)
· JDRF, a non-profit juvenile diabetes research foundation, Board Member (June 2021-June 2022)
Other Public Company Board Memberships During Past 5 Years:
· HPS Corporate Lending Fund, a closed-end management investment company regulated as a business development company, Trustee (August 2021-Present)
No. of Portfolios for which Board Member Serves: 72
———————
Michael D. DiLecce (60)
Advisory Board Member (2022)
Principal Occupation During Past 5 Years:
· Retired since July 2022. Global Asset Management Assurance Leader, Ernst & Young LLP (2015-2022)
· Americas Regional Talent Managing Partner for Ernst & Young’s Financial Service Practice (2017-2021)
· Partner, Ernst & Young LLP (1997-2022)
No. of Portfolios for which Board Member Serves: 23
———————
The address of the Board Members and Officers is c/o BNY Mellon Investment Adviser, Inc., 240 Greenwich Street, New York, New York 10286. Additional information about each Board Member is available in the fund’s Statement of Additional Information which can be obtained from the Adviser free of charge by calling this toll free number: 1-800-373-9387.
46
OFFICERS OF THE FUND (Unaudited)
DAVID DIPETRILLO, President since January 2021.
Vice President and Director of the Adviser since February 2021; Head of North America Product, BNY Mellon Investment Management since January 2018; and Director of Product Strategy, BNY Mellon Investment Management from January 2016 to December 2017. He is an officer of 55 investment companies (comprised of 109 portfolios) managed by the Adviser or an affiliate of the Adviser. He is 44 years old and has been an employee of BNY Mellon since 2005.
JAMES WINDELS, Treasurer since November 2001.
Vice President of the Adviser since September 2020; and Director–BNY Mellon Fund Administration. He is an officer of 56 investment companies (comprised of 130 portfolios) managed by the Adviser or an affiliate of the Adviser. He is 64 years old and has been an employee of the Adviser since April 1985.
PETER M. SULLIVAN, Chief Legal Officer since July 2021 and Vice President and Assistant Secretary since March 2019.
Chief Legal Officer of the Adviser and Associate General Counsel of BNY Mellon since July 2021; Senior Managing Counsel of BNY Mellon from December 2020 to July 2021; and Managing Counsel of BNY Mellon from March 2009 to December 2020. He is an officer of 56 investment companies (comprised of 130 portfolios) managed by the Adviser or an affiliate of the Adviser. He is 54 years old and has been an employee of BNY Mellon since April 2004.
JAMES BITETTO, Vice President since August 2005 and Secretary since February 2018.
Senior Managing Counsel of BNY Mellon since December 2019; Managing Counsel of BNY Mellon from April 2014 to December 2019; and Secretary of the Adviser. He is an officer of 56 investment companies (comprised of 130 portfolios) managed by the Adviser or an affiliate of the Adviser. He is 56 years old and has been an employee of the Adviser since December 1996.
DEIRDRE CUNNANE, Vice President and Assistant Secretary since March 2019.
Managing Counsel of BNY Mellon since December 2021, Counsel of BNY Mellon from August 2018 to December 2021; and Senior Regulatory Specialist at BNY Mellon Investment Management Services from February 2016 to August 2018. She is an officer of 56 investment companies (comprised of 130 portfolios) managed by the Adviser or an affiliate of the Adviser. She is 32 years old and has been an employee of the Adviser since August 2018.
SARAH S. KELLEHER, Vice President and Assistant Secretary since April 2014.
Vice President of BNY Mellon ETF Investment Adviser; LLC since February 2020; Senior Managing Counsel of BNY Mellon since September 2021; Managing Counsel of BNY Mellon from December 2017 to September 2021; and Senior Counsel of BNY Mellon from March 2013 to December 2017. She is an officer of 56 investment companies (comprised of 130 portfolios) managed by the Adviser or an affiliate of the Adviser. She is 47 years old and has been an employee of the Adviser since March 2013.
JEFF PRUSNOFSKY, Vice President and Assistant Secretary since August 2005.
Senior Managing Counsel of BNY Mellon. He is an officer of 56 investment companies (comprised of 130 portfolios) managed by the Adviser or an affiliate of the Adviser. He is 57 years old and has been an employee of the Adviser since October 1990.
AMANDA QUINN, Vice President and Assistant Secretary since March 2020.
Counsel of BNY Mellon since June 2019; Regulatory Administration Manager at BNY Mellon Investment Management Services from September 2018 to May 2019; and Senior Regulatory Specialist at BNY Mellon Investment Management Services from April 2015 to August 2018. She is an officer of 56 investment companies (comprised of 130 portfolios) managed by the Adviser or an affiliate of the Adviser. She is 37 years old and has been an employee of the Adviser since June 2019.
47
OFFICERS OF THE FUND (Unaudited) (continued)
NATALYA ZELENSKY, Vice President and Assistant Secretary since March 2017.
Chief Compliance Officer since August 2021 and Vice President since February 2020 of BNY Mellon ETF Investment Adviser, LLC; Chief Compliance Officer since August 2021 and Vice President and Assistant Secretary since February 2020 of BNY Mellon ETF Trust; Managing Counsel of BNY Mellon from December 2019 to August 2021; Counsel of BNY Mellon from May 2016 to December 2019; and Assistant Secretary of the Adviser from April 2018 to August 2021. She is an officer of 55 investment companies (comprised of 129 portfolios) managed by the Adviser or an affiliate of the Adviser. She is 37 years old and has been an employee of BNY Mellon since May 2016.
DANIEL GOLDSTEIN, Vice President since March 2022.
Vice President and Head of Product Development of North America Product, BNY Mellon Investment Management since January 2018; Co-Head of Product Management, Development & Oversight of North America Product, BNY Mellon Investment Management from January 2010 to January 2018; and Senior Vice President, Development & Oversight of North America Product, BNY Mellon Investment Management since 2010. He is an officer of 55 investment companies (comprised of 109 portfolios) managed by the Adviser or an affiliate of the Adviser. He is 53 years old and has been an employee of the Distributor since 1991.
JOSEPH MARTELLA, Vice President since March 2022.
Vice President and Head of Product Management of North America Product, BNY Mellon Investment Management since January 2018; Director of Product Research and Analytics of North America Product, BNY Mellon Investment Management from January 2010 to January 2018; and Senior Vice President of North America Product, BNY Mellon Investment Management since 2010. He is an officer of 55 investment companies (comprised of 109 portfolios) managed by the Adviser or an affiliate of the Adviser. He is 46 years old and has been an employee of the Distributor since 1999.
GAVIN C. REILLY, Assistant Treasurer since December 2005.
Tax Manager–BNY Mellon Fund Administration. He is an officer of 56 investment companies (comprised of 130 portfolios) managed by the Adviser or an affiliate of the Adviser. He is 54 years old and has been an employee of the Adviser since April 1991.
ROBERT SALVIOLO, Assistant Treasurer since July 2007.
Senior Accounting Manager–BNY Mellon Fund Administration. He is an officer of 56 investment companies (comprised of 130 portfolios) managed by the Adviser or an affiliate of the Adviser. He is 55 years old and has been an employee of the Adviser since June 1989.
ROBERT SVAGNA, Assistant Treasurer since December 2002.
Senior Accounting Manager–BNY Mellon Fund Administration. He is an officer of 56 investment companies (comprised of 130 portfolios) managed by the Adviser or an affiliate of the Adviser. He is 55 years old and has been an employee of the Adviser since November 1990.
JOSEPH W. CONNOLLY, Chief Compliance Officer since October 2004.
Chief Compliance Officer of the BNY Mellon Family of Funds and BNY Mellon Funds Trust since 2004; and Chief Compliance Officer of the Adviser from 2004 until June 2021. He is an officer of 55 investment companies (comprised of 115 portfolios) managed by the Adviser. He is 65 years old.
CARIDAD M. CAROSELLA, Anti-Money Laundering Compliance Officer since January 2016.
Anti-Money Laundering Compliance Officer of the BNY Mellon Family of Funds and BNY Mellon Funds Trust. She is an officer of 48 investment companies (comprised of 122 portfolios) managed by the Adviser or an affiliate of the Adviser. She is 54 years old and has been an employee of the Distributor since 1997.
48
This page intentionally left blank.
49
BNY Mellon Sustainable Balanced Fund
240 Greenwich Street
New York, NY 10286
Adviser
BNY Mellon Investment Adviser, Inc.
240 Greenwich Street
New York, NY 10286
Sub-Advisers
Newton Investment Management Limited
160 Queen Victoria Street
London, EC4V, 4LA, UK
Mellon Investment Corporation
BNY Mellon Center
One Boston Place
Boston, MA 02108
Custodian
The Bank of New York Mellon
240 Greenwich Street
New York, NY 10286
Transfer Agent &
Dividend Disbursing Agent
BNY Mellon Transfer, Inc.
240 Greenwich Street
New York, NY 10286
Distributor
BNY Mellon Securities Corporation
240 Greenwich Street
New York, NY 10286
| | |
Ticker Symbols: | Class K: DRAKX Service: DRASX |
Telephone Call your financial representative or 1-800-373-9387
Mail The BNY Mellon Family of Funds, 144 Glenn Curtiss Boulevard, Uniondale, NY 11556-0144
E-mail Send your request to info@bnymellon.com
Internet Information can be viewed online or downloaded at www.im.bnymellon.com
The fund files its complete schedule of portfolio holdings with the Securities and Exchange Commission (“SEC”) for the first and third quarters of each fiscal year on Form N-PORT. The fund’s Forms N-PORT are available on the SEC’s website at www.sec.gov.
A description of the policies and procedures that the fund uses to determine how to vote proxies relating to portfolio securities and information regarding how the fund voted these proxies for the most recent 12-month period ended June 30 is available at www.im.bnymellon.com and on the SEC’s website at www.sec.gov and without charge, upon request, by calling 1-800-373-9387.
| | |
© 2022 BNY Mellon Securities Corporation
4120AR1022 | 
|
Item 2. Code of Ethics.
The Registrant has adopted a code of ethics that applies to the Registrant's principal executive officer, principal financial officer, principal accounting officer or controller, or persons performing similar functions. There have been no amendments to, or waivers in connection with, the Code of Ethics during the period covered by this Report.
Item 3. Audit Committee Financial Expert.
The Registrant's Board has determined that Gina France, a member of the Audit Committee of the Board, is an audit committee financial expert as defined by the Securities and Exchange Commission (the "SEC"). Ms. France is "independent" as defined by the SEC for purposes of audit committee financial expert determinations.
Item 4. Principal Accountant Fees and Services.
(a) Audit Fees. The aggregate fees billed for each of the last two fiscal years (the "Reporting Periods") for professional services rendered by the Registrant's principal accountant (the "Auditor") for the audit of the Registrant's annual financial statements or services that are normally provided by the Auditor in connection with the statutory and regulatory filings or engagements for the Reporting Periods, were $200,486 in 2021 and $204,495 in 2022.
(b) Audit-Related Fees. The aggregate fees billed in the Reporting Periods for assurance and related services by the Auditor that are reasonably related to the performance of the audit of the Registrant's financial statements and are not reported under paragraph (a) of this Item 4 were $62,212 in 2021 and $57,466 in 2022. These services consisted of one or more of the following: (i) agreed upon procedures related to compliance with Internal Revenue Code section 817(h), (ii) security counts required by Rule 17f-2 under the Investment Company Act of 1940, as amended, (iii) advisory services as to the accounting or disclosure treatment of Registrant transactions or events and (iv) advisory services to the accounting or disclosure treatment of the actual or potential impact to the Registrant of final or proposed rules, standards or interpretations by the Securities and Exchange Commission, the Financial Accounting Standards Boards or other regulatory or standard-setting bodies.
The aggregate fees billed in the Reporting Periods for non-audit assurance and related services by the Auditor to the Registrant's investment adviser (not including any sub-investment adviser whose role is primarily portfolio management and is subcontracted with or overseen by another investment adviser), and any entity controlling, controlled by or under common control with the investment adviser that provides ongoing services to the Registrant ("Service Affiliates"), that were reasonably related to the performance of the annual audit of the Service Affiliate, which required pre-approval by the Audit Committee were $0 in 2021 and $0 in 2022.
(c) Tax Fees. The aggregate fees billed in the Reporting Periods for professional services rendered by the Auditor for tax compliance, tax advice, and tax planning ("Tax Services") were $19,008 in 2021 and $17,631 in 2022. These services consisted of: (i) review or preparation of U.S. federal, state, local and excise tax returns; (ii) U.S. federal, state and local tax planning, advice and assistance regarding statutory, regulatory or administrative developments; (iii) tax advice regarding tax qualification matters and/or treatment of various
financial instruments held or proposed to be acquired or held, and (iv) determination of Passive Foreign Investment Companies. The aggregate fees billed in the Reporting Periods for Tax Services by the Auditor to Service Affiliates, which required pre-approval by the Audit Committee were $10,960 in 2021 and $28,369 in 2022.
(d) All Other Fees. The aggregate fees billed in the Reporting Periods for products and services provided by the Auditor, other than the services reported in paragraphs (a) through (c) of this Item, were $857 in 2021 and $405 in 2022. These services consisted of a review of the Registrant's anti-money laundering program.
The aggregate fees billed in the Reporting Periods for Non-Audit Services by the Auditor to Service Affiliates, other than the services reported in paragraphs (b) through (c) of this Item, which required pre-approval by the Audit Committee, were $0 in 2021 and $0 in 2022.
(e)(1) Audit Committee Pre-Approval Policies and Procedures. The Registrant's Audit Committee has established policies and procedures (the "Policy") for pre-approval (within specified fee limits) of the Auditor's engagements for non-audit services to the Registrant and Service Affiliates without specific case-by-case consideration. The pre-approved services in the Policy can include pre-approved audit services, pre-approved audit-related services, pre-approved tax services and pre-approved all other services. Pre-approval considerations include whether the proposed services are compatible with maintaining the Auditor's independence. Pre-approvals pursuant to the Policy are considered annually.
(e)(2) Note. None of the services described in paragraphs (b) through (d) of this Item 4 were approved by the Audit Committee pursuant to paragraph (c)(7)(i)(C) of Rule 2-01 of Regulation S-X.
(f) None of the hours expended on the principal accountant's engagement to audit the registrant's financial statements for the most recent fiscal year were attributed to work performed by persons other than the principal accountant's full-time, permanent employees.
Non-Audit Fees. The aggregate non-audit fees billed by the Auditor for services rendered to the Registrant, and rendered to Service Affiliates, for the Reporting Periods were $2,476,929 in 2021 and $2,189,735 in 2022.
Auditor Independence. The Registrant's Audit Committee has considered whether the provision of non-audit services that were rendered to Service Affiliates, which were not pre-approved (not requiring pre-approval), is compatible with maintaining the Auditor's independence.
(j) Not applicable.
Item 5. Audit Committee of Listed Registrants.
Not applicable.
Item 6. Investments.
| Item 7. | Disclosure of Proxy Voting Policies and Procedures for Closed-End Management Investment Companies. |
Not applicable.
Item 8. Portfolio Managers of Closed-End Management Investment Companies.
Not applicable.
| Item 9. | Purchases of Equity Securities by Closed-End Management Investment Companies and Affiliated Purchasers. |
Not applicable.
| Item 10. | Submission of Matters to a Vote of Security Holders. |
There have been no material changes to the procedures applicable to Item 10.
| Item 11. | Controls and Procedures. |
(a) The Registrant's principal executive and principal financial officers have concluded, based on their evaluation of the Registrant's disclosure controls and procedures as of a date within 90 days of the filing date of this report, that the Registrant's disclosure controls and procedures are reasonably designed to ensure that information required to be disclosed by the Registrant on Form N-CSR is recorded, processed, summarized and reported within the required time periods and that information required to be disclosed by the Registrant in the reports that it files or submits on Form N-CSR is accumulated and communicated to the Registrant's management, including its principal executive and principal financial officers, as appropriate to allow timely decisions regarding required disclosure.
(b) There were no changes to the Registrant's internal control over financial reporting that occurred during the period covered by this report that have materially affected, or are reasonably likely to materially affect, the Registrant's internal control over financial reporting.
| Item 12. | Disclosure of Securities Lending Activities for Closed-End Management Investment Companies. |
Not applicable.
(a)(1) Code of ethics referred to in Item 2.
(a)(2) Certifications of principal executive and principal financial officers as required by Rule 30a-2(a) under the Investment Company Act of 1940.
(a)(3) Not applicable.
(b) Certification of principal executive and principal financial officers as required by Rule 30a-2(b) under the Investment Company Act of 1940.
SIGNATURES
Pursuant to the requirements of the Securities Exchange Act of 1934 and the Investment Company Act of 1940, the Registrant has duly caused this Report to be signed on its behalf by the undersigned, thereunto duly authorized.
BNY Mellon Advantage Funds, Inc.
By: /s/ David J. DiPetrillo
David J. DiPetrillo
President (Principal Executive Officer)
Date: December 21, 2022
Pursuant to the requirements of the Securities Exchange Act of 1934 and the Investment Company Act of 1940, this Report has been signed below by the following persons on behalf of the Registrant and in the capacities and on the dates indicated.
By: /s/ David J. DiPetrillo
David J. DiPetrillo
President (Principal Executive Officer)
Date: December 21, 2022
By: /s/ James Windels
James Windels
Treasurer (Principal Financial Officer)
Date: December 21, 2022
EXHIBIT INDEX
(a)(1) Code of ethics referred to in Item 2.
(a)(2) Certifications of principal executive and principal financial officers as required by Rule 30a-2(a) under the Investment Company Act of 1940. (EX-99.CERT)
(b) Certification of principal executive and principal financial officers as required by Rule 30a-2(b) under the Investment Company Act of 1940. (EX-99.906CERT)