UNITED STATES
SECURITIES AND EXCHANGE COMMISSION
Washington, D.C. 20549
FORM N-CSR
CERTIFIED SHAREHOLDER REPORT OF REGISTERED MANAGEMENT
INVESTMENT COMPANIES
Investment Company Act file number | 811- 7123 |
| |
| Advantage Funds, Inc. | |
| (Exact name of Registrant as specified in charter) | |
| | |
| c/o The Dreyfus Corporation 200 Park Avenue New York, New York 10166 | |
| (Address of principal executive offices) (Zip code) | |
| | |
| Janette E. Farragher, Esq. 200 Park Avenue New York, New York 10166 | |
| (Name and address of agent for service) | |
|
Registrant's telephone number, including area code: | (212) 922-6000 |
| |
Date of fiscal year end: | 8/31 | |
Date of reporting period: | 8/31/2012 | |
| | | | | | | |
The following N-CSR relates only to the Registrant's series listed below and does not affect the other series of the Registrant, which has a different fiscal year end and, therefore, different N-CSR reporting requirements. A separate N-CSR Form will be filed for the remaining series as appropriate.
- DREYFUS INTERNATIONAL VALUE FUND
- DREYFUS OPPORTUNISTIC MIDCAP VALUE FUND
- DREYFUS OPPORTUNISTIC SMALL CAP FUND
- DREYFUS OPPORTUNISTIC U.S. STOCK FUND
- DREYFUS STRATEGIC VALUE FUND
- DREYFUS STRUCTURED MIDCAP FUND
- DREYFUS TECHNOLOGY GROWTH FUND
FORM N-CSR
Item 1. Reports to Stockholders.
Dreyfus
International
Value Fund
ANNUAL REPORT August 31, 2012

Save time. Save paper. View your next shareholder report online as soon as it’s available. Log into www.dreyfus.com and sign up for Dreyfus eCommunications. It’s simple and only takes a few minutes.
The views expressed in this report reflect those of the portfolio manager only through the end of the period covered and do not necessarily represent the views of Dreyfus or any other person in the Dreyfus organization. Any such views are subject to change at any time based upon market or other conditions and Dreyfus disclaims any responsibility to update such views.These views may not be relied on as investment advice and, because investment decisions for a Dreyfus fund are based on numerous factors, may not be relied on as an indication of trading intent on behalf of any Dreyfus fund.
Not FDIC-Insured • Not Bank-Guaranteed • May Lose Value
| |
| | Contents |
| |
| |
| | THE FUND |
| 2 | A Letter from the Chairman and CEO |
| 3 | Discussion of Fund Performance |
| 6 | Fund Performance |
| 8 | Understanding Your Fund’s Expenses |
| 8 | Comparing Your Fund’s Expenses |
| With Those of Other Funds |
| 9 | Statement of Investments |
| 14 | Statement of Assets and Liabilities |
| 15 | Statement of Operations |
| 16 | Statement of Changes in Net Assets |
| 18 | Financial Highlights |
| 21 | Notes to Financial Statements |
| 34 | Report of Independent Registered |
| | Public Accounting Firm |
| 35 | Important Tax Information |
| 36 | Proxy Results |
| 37 | Information About the Renewal of |
| | the Fund’s Management Agreement |
| 42 | Board Members Information |
| 44 | Officers of the Fund |
| |
| FOR MORE INFORMATION |
|
| | Back Cover |
Dreyfus
International Value Fund
The Fund

A LETTER FROM THE CHAIRMAN AND CEO
Dear Shareholder:
We are pleased to present this annual report for Dreyfus International Value Fund, covering the 12-month period from September 1, 2011, throughAugust 31, 2012. For information about how the fund performed during the reporting period, as well as general market perspectives, we provide a Discussion of Fund Performance on the pages that follow.
While they produced flat returns, on average, for the past year overall, international equities proved unusually volatile as prices rose and fell according to investors’ changing expectations of global economic conditions. Europe has remained under severe economic pressure due to a persistent debt crisis and austerity-oriented fiscal policies adopted by many governments. In Japan, a strengthening currency dampened export activity and economic growth. The emerging markets have posted a slower rate of growth, reducing demand for industrial commodities and other goods and services. In contrast, the U.S. economy has grown relatively steadily, albeit at about half the average rate achieved in prior domestic recoveries.
Choppy economic conditions appear likely to persist over the foreseeable future. On one hand, the global economy has responded to a variety of stimulative measures, most notably aggressively accommodative monetary policies in most major markets. On the other hand, headwinds emanating from Europe and China may continue to weigh on economic growth and investor sentiment. Indeed, the ability of governments and economic policymakers to address these issues could go a long way toward shaping the 2013 market environment.As always, we urge you to speak regularly with your financial advisor to discuss how changing global economic conditions may affect your investments.
Thank you for your continued confidence and support.

Jonathan R. Baum
Chairman and Chief Executive Officer
The Dreyfus Corporation
September 17, 2012
2

DISCUSSION OF FUND PERFORMANCE
For the period of September 1, 2011, through August 31, 2012, as provided by D. Kirk Henry, Senior Portfolio Manager
Fund and Market Performance Overview
For the 12-month period ended August 31, 2012, Dreyfus International Value Fund’s Class A shares produced a total return of –5.89%, Class C shares returned –6.55% and Class I shares returned –5.41%.1 In comparison, the fund’s benchmark, the Morgan Stanley Capital International Europe, Australasia, Far East Index (“MSCI EAFE Index”), produced a total return of –0.04% for the same period.2 International stocks encountered heightened volatility throughout the reporting period due to changing economic conditions in Europe and the emerging markets. The fund produced lower returns than its benchmark, primarily due to investors’ preference for growth stocks over their value-oriented counterparts.
The Fund’s Investment Approach
The fund seeks long-term capital growth.The fund ordinarily invests most of its assets in securities of foreign companies which Dreyfus considers to be value companies.
The fund’s investment approach is value-oriented and research-driven. In selecting stocks, we attempt to identify potential investments through extensive quantitative and fundamental research. Emphasizing individual stock selection over economic or industry trends, the fund focuses on three key factors: value, or how a stock is valued relative to its intrinsic worth based on traditional value measures; business health, or overall efficiency and profitability as measured by return on assets and return on equity; and business momentum, or the presence of a catalyst (such as corporate restructuring, change in management or spin-off) that will trigger a price increase near term to midterm.
The fund typically sells a stock when it is no longer considered a value company, appears less likely to benefit from the current market and economic environment, shows deteriorating fundamentals or declining momentum, or falls short of our expectations.
The Fund 3
DISCUSSION OF FUND PERFORMANCE (continued)
Markets Reacted Sharply to Economic Developments
The reporting period began in the midst of major stock market declines throughout the world. The downgrade of one agency’s assessment of long-term U.S. government debt, an intensifying debt crisis in Europe and rising inflationary pressures in China triggered a flight away from stocks and toward traditional safe havens. Fortunately, better U.S. economic data and remedial measures from European and Chinese policymakers generally arrested the decline during the fall of 2011.
By the beginning of 2012, stocks were rallying amid U.S. employment gains, a quantitative easing program in Europe and a shift to less restrictive monetary and fiscal policies in China. Investors grew more tolerant of risks, focusing more intently on company fundamentals, including valuations. However, investors returned to a risk-averse posture during the spring, when measures designed to relieve fiscal pressures in Europe encountered resistance. The summer saw more encouraging global economic data, and the MSCI EAFE Index ended the reporting period close to where it began.
In this tumultuous environment, international investors tended to prefer large-cap companies with high dividend yields and positive earnings momentum. In contrast, investors did not favor the typical type of value companies invested in by the fund.
Mixed Investment Results in Volatile Markets
The fund’s relative performance over the reporting period was undermined by stocks in the United Kingdom, where metals producers Anglo American and Lonmin were hurt by the European debt crisis and reduced demand from the emerging markets. In addition, grocery chain Tesco weighed on results as the company lost market share, catalog retailer Home Retail Group encountered sluggish sales and the fund did not participate in gains posted by U.K. tobacco and spirits producers. In Hong Kong, apparel retailer Esprit Holdings was hurt by the downturn in Europe and overexpansion of its U.S. stores. Results from Finland were dampened by handset maker Nokia. In other areas, the fund suffered shortfalls stemming from Chinese clothing retailer China Dongxiang, Japanese technology company Ricoh, and European grocery chains Delhaize Group and Carrefour.
The fund achieved better results in the Netherlands, where successful positions included Koninklijke Philips Electronics, which posted strong quarterly results after a recent restructuring, and insurer Aegon, which
4
rallied late in the reporting period as the stock market outlook improved. Australia was home to several top performers, including agricultural chemicals producer Nufarm and medical center operator Primary Health Care. Overweighted exposure to Germany bolstered relative results, and successful stock selections there included utilities E.ON and RWE, which rallied from previous weakness, and health care company Bayer, which posted strong results in its pharmaceuticals division. In other parts of the world, the fund benefited from positions in Chinese electric utility Huaneng Power International, Japanese health care and household goods company Medipal Holdings and drug developer Astellas Pharma.
Finding Attractive Valuations Worldwide
The international equity markets’ gyrations have created some compelling valuations among companies we consider fundamentally sound as the market has priced in a worst-case macroeconomic scenario that we believe is unlikely to occur. In our judgment, the fund remains well positioned for a broad-based market rebound as global economic conditions gradually improve.
September 17, 2012
Please note, the position in any security highlighted with italicized typeface was sold during the reporting period.
Equity funds are subject generally to market, market sector, market liquidity, issuer and investment style risks, among other factors, to varying degrees, all of which are more fully described in the fund’s prospectus.
The fund’s performance will be influenced by political, social and economic factors affecting investments in foreign companies. Special risks associated with investments in foreign companies include exposure to currency fluctuations, less liquidity, less developed or less efficient trading markets, lack of comprehensive company information, political instability and differing auditing and legal standards.These risks are enhanced in emerging market countries. Please read the prospectus for further discussion of these risks.
1 Total return includes reinvestment of dividends and any capital gains paid, and does not take into
consideration the maximum initial sales charge in the case of Class A shares, or the applicable
contingent deferred sales charge imposed on redemptions in the case of Class C shares. Had these
charges been reflected, returns would have been lower. Past performance is no guarantee of future
results. Share price, yield and investment return fluctuate such that upon redemption fund shares
may be worth more or less than their original cost.The fund’s returns reflect the absorption of
certain fund expenses by The Dreyfus Corporation pursuant to an agreement in effect through
March 31, 2013, at which time it may be extended, terminated or modified. Had these expenses
not been absorbed, the fund’s returns would have been lower.
2 SOURCE: LIPPER INC. — Reflects reinvestment of net dividends and, where applicable,
capital gain distributions.The Morgan Stanley Capital International Europe,Australasia, Far East
(MSCI EAFE) Index is an unmanaged index composed of a sample of companies representative
of the market structure of European and Pacific Basin countries.The Index does not take into
account fees and expenses to which the fund is subject. Investors cannot invest directly in any index.
The Fund 5
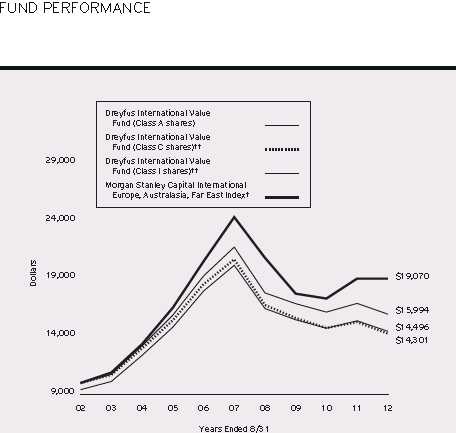
Comparison of change in value of $10,000 investment in Dreyfus International Value Fund Class A shares, Class C shares and Class I shares and the Morgan Stanley Capital International Europe, Australasia, Far East Index
† Source: Lipper Inc.
The total return figures presented for Class C shares of the fund reflect the performance of the fund’s Class A shares
for the period prior to 11/15/02 (the inception date for Class C shares), adjusted to reflect the applicable sales load
for this share class.
The total return figures presented for Class I shares of the fund reflect the performance of the fund’s Class A shares
for the period prior to 11/15/02 (the inception date for Class I shares).
Past performance is not predictive of future performance.
The above graph compares a $10,000 investment made in each of the Class A, Class C and Class I shares of Dreyfus International Value Fund on 8/31/02 to a $10,000 investment made in the Morgan Stanley Capital International Europe,Australasia, Far East Index (the “Index”) on that date.All dividends and capital gain distributions are reinvested. The fund’s performance shown in the line graph above takes into account the maximum initial sales charge on Class A shares and all other applicable fees and expenses on all classes.The Index is an unmanaged index composed of a sample of companies representative of the market structure of European and Pacific Basin countries. Unlike a mutual fund, the Index is not subject to charges, fees and other expenses. Investors can not invest directly in any index. Further information relating to fund performance, including expense reimbursements, if applicable, is contained in the Financial Highlights section of the prospectus and elsewhere in this report.
6
| | | | | | | |
| Average Annual Total Returns as of 8/31/12 | | | | | | |
| |
| Inception |
| | Date | 1 | Year | 5 Years | | 10 Years | |
| Class A shares | | | | | | | |
| with maximum sales charge (5.75%) | 9/29/95 | –11.29 | % | –7.54 | % | 3.78 | % |
| without sales charge | 9/29/95 | –5.89 | % | –6.44 | % | 4.40 | % |
| Class C shares | | | | | | | |
| with applicable redemption charge † | 11/15/02 | –7.47 | % | –7.17 | % | 3.64 | %†† |
| without redemption | 11/15/02 | –6.55 | % | –7.17 | % | 3.64 | %†† |
| Class I shares | 11/15/02 | –5.41 | % | –6.00 | % | 4.81 | %†† |
| Morgan Stanley Capital | | | | | | | |
| International Europe, | | | | | | | |
| Australasia, Far East Index | | –0.04 | % | –4.81 | % | 6.67 | % |
Past performance is not predictive of future performance.The fund’s performance shown in the graph and table does not
reflect the deduction of taxes that a shareholder would pay on fund distributions or the redemption of fund shares.
† The maximum contingent deferred sales charge for Class C shares is 1% for shares redeemed within one year of the
date of purchase.
The total return performance figures presented for Class C shares of the fund reflect the performance of the fund’s
Class A shares for the period prior to 11/15/02 (the inception date for Class C shares), adjusted to reflect the
applicable sales load for this share class.
The total return performance figures presented for Class I shares of the fund reflect the performance of the fund’s Class
A shares for the period prior to 11/15/02 (the inception date for Class I shares).
The Fund 7
UNDERSTANDING YOUR FUND’S EXPENSES (Unaudited)
As a mutual fund investor, you pay ongoing expenses, such as management fees and other expenses. Using the information below, you can estimate how these expenses affect your investment and compare them with the expenses of other funds.You also may pay one-time transaction expenses, including sales charges (loads) and redemption fees, which are not shown in this section and would have resulted in higher total expenses. For more information, see your fund’s prospectus or talk to your financial adviser.
Review your fund’s expenses
The table below shows the expenses you would have paid on a $1,000 investment in Dreyfus International Value Fund from March 1, 2012 to August 31, 2012. It also shows how much a $1,000 investment would be worth at the close of the period, assuming actual returns and expenses.
Expenses and Value of a $1,000 Investment
assuming actual returns for the six months ended August 31, 2012
| | | | | | |
| | | Class A | | Class C | | Class I |
| Expenses paid per $1,000† | | $7.46 | | $11.08 | | $5.33 |
| Ending value (after expenses) | | $927.80 | | $924.20 | | $929.40 |
COMPARING YOUR FUND’S EXPENSES WITH THOSE OF OTHER FUNDS (Unaudited)
Using the SEC’s method to compare expenses
The Securities and Exchange Commission (SEC) has established guidelines to help investors assess fund expenses. Per these guidelines, the table below shows your fund’s expenses based on a $1,000 investment, assuming a hypothetical 5% annualized return. You can use this information to compare the ongoing expenses (but not transaction expenses or total cost) of investing in the fund with those of other funds.All mutual fund shareholder reports will provide this information to help you make this comparison. Please note that you cannot use this information to estimate your actual ending account balance and expenses paid during the period.
Expenses and Value of a $1,000 Investment
assuming a hypothetical 5% annualized return for the six months ended August 31, 2012
| | | | | | |
| | | Class A | | Class C | | Class I |
| Expenses paid per $1,000† | | $7.81 | | $11.59 | | $5.58 |
| Ending value (after expenses) | | $1,017.39 | | $1,013.62 | | $1,019.61 |
† Expenses are equal to the fund’s annualized expense ratio of 1.54% for Class A, 2.29% for Class C and 1.10%
for Class I, multiplied by the average account value over the period, multiplied by 184/366 (to reflect the one-half
year period).
8
STATEMENT OF INVESTMENTS
August 31, 2012
| | | |
| Common Stocks—96.2% | Shares | | Value ($) |
| Australia—3.2% | | | |
| Australia & New Zealand Banking Group | 63,730 | | 1,634,221 |
| Nufarm | 100,026 | | 604,552 |
| Primary Health Care | 349,673 | | 1,347,522 |
| QBE Insurance Group | 128,340 | | 1,727,712 |
| | | | 5,314,007 |
| Belgium—1.1% | | | |
| Delhaize Group | 45,580 | | 1,806,482 |
| Brazil—1.9% | | | |
| Banco Santander Brasil, ADS | 153,900 | | 1,166,562 |
| Oi, ADR | 135,510 | | 504,097 |
| Oi, ADR, Cl. C | 6,491 | | 28,755 |
| Petroleo Brasileiro, ADR | 66,140 | | 1,398,200 |
| | | | 3,097,614 |
| China—2.2% | | | |
| Beijing Capital International Airport, Cl. H | 410,000 | | 280,172 |
| China Railway Group, Cl. H | 987,000 | | 371,591 |
| Foxconn International Holdings | 1,615,000 | a | 508,074 |
| Guangzhou Automobile Group, Cl. H | 1,412,194 | | 985,046 |
| Huaneng Power International, Cl. H | 862,000 | | 594,602 |
| PetroChina, ADR | 7,451 | | 896,355 |
| | | | 3,635,840 |
| France—12.4% | | | |
| Alstom | 33,810 | | 1,203,916 |
| Carrefour | 134,672 | | 2,822,888 |
| Cie de St-Gobain | 40,530 | | 1,390,440 |
| Danone | 19,600 | | 1,221,549 |
| EDF | 49,680 | | 1,011,671 |
| France Telecom | 171,875 | | 2,376,944 |
| GDF Suez | 69,823 | | 1,719,140 |
| Sanofi | 38,411 | | 3,142,780 |
| Societe Generale | 45,374 | a | 1,201,352 |
| Total | 83,820 | | 4,186,045 |
| | | | 20,276,725 |
The Fund 9
STATEMENT OF INVESTMENTS (continued)
| | | |
| Common Stocks (continued) | Shares | | Value ($) |
| Germany—10.1% | | | |
| Aixtron | 65,690 | | 972,494 |
| Allianz | 11,810 | | 1,296,361 |
| Bayer | 13,340 | | 1,034,763 |
| Celesio | 66,340 | | 1,212,834 |
| Daimler | 37,606 | | 1,844,730 |
| Deutsche Bank | 59,920 | | 2,131,010 |
| Deutsche Telekom | 98,900 | | 1,179,899 |
| E.ON | 131,030 | | 3,013,538 |
| Muenchener Rueckversicherungs | 8,010 | | 1,185,823 |
| Siemens | 29,230 | | 2,772,850 |
| | | | 16,644,302 |
| Hong Kong—2.7% | | | |
| China Mobile, ADR | 6,410 | | 344,153 |
| Esprit Holdings | 1,107,070 | | 1,692,875 |
| Hang Seng Bank | 129,700 | | 1,846,180 |
| Pacific Basin Shipping | 1,315,000 | | 547,638 |
| | | | 4,430,846 |
| India—.6% | | | |
| Reliance Industries, GDR | 36,974 | b | 1,011,239 |
| Israel—1.5% | | | |
| Teva Pharmaceutical Industries, ADR | 63,230 | | 2,502,643 |
| Italy—2.0% | | | |
| Eni | 27,045 | | 599,382 |
| Finmeccanica | 161,006 | a | 714,466 |
| Saras | 1,816,710 | a | 1,966,290 |
| | | | 3,280,138 |
| Japan—22.7% | | | |
| Denso | 39,300 | | 1,310,084 |
| East Japan Railway | 15,600 | | 1,044,051 |
| Fujitsu | 374,000 | | 1,519,024 |
| INPEX | 314 | | 1,784,661 |
| Kao | 57,000 | | 1,721,029 |
| Kirin Holdings | 129,000 | | 1,606,424 |
| LIXIL Group | 52,300 | | 1,122,885 |
| Matsumotokiyoshi Holdings | 30,900 | | 740,779 |
| Mitsubishi UFJ Financial Group | 722,500 | | 3,285,140 |
10
| | | |
| Common Stocks (continued) | Shares | | Value ($) |
| Japan (continued) | | | |
| Nippon Electric Glass | 195,000 | | 926,496 |
| Nippon Express | 149,000 | | 584,239 |
| Nomura Holdings | 147,900 | | 487,364 |
| Nomura Research Institute | 46,400 | | 968,951 |
| Omron | 79,100 | | 1,543,710 |
| Panasonic | 60,400 | | 410,407 |
| Ricoh | 164,800 | | 1,296,594 |
| Shimachu | 71,700 | | 1,482,627 |
| Shin-Etsu Chemical | 52,220 | | 2,791,247 |
| Sumitomo Mitsui Financial Group | 65,500 | | 2,027,869 |
| Sumitomo Mitsui Trust Holdings | 369,560 | | 1,028,981 |
| Taiyo Nippon Sanso | 315,000 | | 1,569,066 |
| Tokyo Electron | 25,000 | | 1,173,447 |
| Tokyo Steel Manufacturing | 65,300 | | 212,676 |
| Toyota Motor | 107,800 | | 4,261,332 |
| Yamaha Motor | 155,300 | | 1,344,829 |
| Yamato Holdings | 63,400 | | 1,052,685 |
| | | | 37,296,597 |
| Netherlands—2.6% | | | |
| Aegon | 172,661 | | 886,716 |
| Koninklijke Philips Electronics | 111,861 | | 2,571,970 |
| Royal Dutch Shell, Cl. A | 23,712 | | 829,431 |
| | | | 4,288,117 |
| Norway—.6% | | | |
| Norsk Hydro | 216,268 | | 926,594 |
| Russia—.4% | | | |
| Gazprom, ADR | 60,140 | | 581,253 |
| Singapore—2.0% | | | |
| DBS Group Holdings | 114,539 | | 1,327,789 |
| Oversea-Chinese Banking | 260,000 | | 1,937,746 |
| | | | 3,265,535 |
| South Africa—.7% | | | |
| Murray & Roberts Holdings | 230,503 | a | 598,271 |
| Standard Bank Group | 37,590 | | 496,548 |
| | | | 1,094,819 |
The Fund 11
STATEMENT OF INVESTMENTS (continued)
| | | |
| Common Stocks (continued) | Shares | | Value ($) |
| South Korea—2.4% | | | |
| KB Financial Group | 6,100 | | 197,576 |
| KB Financial Group, ADR | 34,794 | | 1,125,934 |
| Korea Electric Power | 22,070 | a | 478,503 |
| Korea Electric Power, ADR | 65,394 | a | 700,370 |
| Korea Exchange Bank | 86,880 | a | 654,687 |
| KT, ADR | 14,300 | | 216,073 |
| SK Telecom, ADR | 35,330 | | 506,632 |
| | | | 3,879,775 |
| Sweden—3.5% | | | |
| Ericsson, Cl. B | 291,400 | | 2,728,217 |
| Husqvarna, Cl. B | 44,260 | | 212,204 |
| Investor, Cl. B | 26,950 | | 558,355 |
| Svenska Cellulosa, Cl. B | 120,940 | | 2,162,317 |
| | | | 5,661,093 |
| Switzerland—7.4% | | | |
| Adecco | 21,190 | a | 961,063 |
| Clariant | 113,410 | a | 1,272,254 |
| Novartis | 70,026 | | 4,125,864 |
| Roche Holding | 19,760 | | 3,597,243 |
| UBS | 189,628 | a | 2,121,323 |
| | | | 12,077,747 |
| Taiwan—.9% | | | |
| Hon Hai Precision Industry | 279,400 | | 791,063 |
| United Microelectronics | 1,868,720 | | 748,711 |
| | | | 1,539,774 |
| United Kingdom—15.3% | | | |
| Anglo American | 113,648 | | 3,157,992 |
| BP | 352,903 | | 2,473,145 |
| Home Retail Group | 536,056 | | 798,832 |
| HSBC Holdings | 651,257 | | 5,657,574 |
| Reed Elsevier | 111,551 | | 1,045,935 |
| Resolution | 553,287 | | 1,895,890 |
| Royal Dutch Shell, Cl. A | 100,718 | | 3,524,762 |
| Smith & Nephew | 172,857 | | 1,830,728 |
12
| | | | |
| Common Stocks (continued) | Shares | | Value ($) | |
| United Kingdom (continued) | | | | |
| Tesco | 165,435 | | 884,204 | |
| Unilever | 53,166 | | 1,911,268 | |
| Vodafone Group | 673,252 | | 1,940,285 | |
| | | | 25,120,615 | |
| Total Common Stocks | | | | |
| (cost $203,652,220) | | | 157,731,755 | |
| |
| Other Investment—6.9% | | | | |
| Registered Investment Company; | | | | |
| Dreyfus Institutional Preferred | | | | |
| Plus Money Market Fund | | | | |
| (cost $11,340,000) | 11,340,000 | c | 11,340,000 | |
| |
| Total Investments (cost $214,992,220) | 103.1 | % | 169,071,755 | |
| Liabilities, Less Cash and Receivables | (3.1 | %) | (5,030,705 | ) |
| Net Assets | 100.0 | % | 164,041,050 | |
ADR—American Depository Receipts
ADS—American Depository Shares
GDR—Global Depository Receipts
a Non-income producing security.
b Security exempt from registration pursuant to Rule 144A under the Securities Act of 1933.This security may be
resold in transactions exempt from registration, normally to qualified institutional buyers.At August 31, 2012, this
security amounted to $1,011,239 or .6% of net assets.
c Investment in affiliated money market mutual fund.
| | | |
| Portfolio Summary (Unaudited)† | | |
| |
| | Value (%) | | Value (%) |
| Financial | 21.9 | Consumer Staples | 7.8 |
| Energy | 11.7 | Materials | 7.7 |
| Health Care | 11.5 | Money Market Investment | 6.9 |
| Consumer Discretionary | 9.4 | Utilities | 4.6 |
| Industrial | 9.3 | Telecommunication Services | 4.3 |
| Information Technology | 8.0 | | 103.1 |
| |
| † Based on net assets. | | | |
| See notes to financial statements. | | | |
The Fund 13
STATEMENT OF ASSETS AND LIABILITIES
August 31, 2012
| | | | |
| | | Cost | Value | |
| Assets ($): | | | | |
| Investments in securities—See Statement of Investments: | | | |
| Unaffiliated issuers | | 203,652,220 | 157,731,755 | |
| Affiliated issuers | | 11,340,000 | 11,340,000 | |
| Cash | | | 26,006 | |
| Cash denominated in foreign currencies | | 850,996 | 847,691 | |
| Receivable for investment securities sold | | | 683,064 | |
| Dividends receivable | | | 611,683 | |
| Receivable for shares of Common Stock subscribed | | | 59,816 | |
| Unrealized appreciation on forward foreign | | | | |
| currency exchange contracts—Note 4 | | | 2 | |
| Prepaid expenses | | | 22,082 | |
| | | | 171,322,099 | |
| Liabilities ($): | | | | |
| Due to The Dreyfus Corporation and affiliates—Note 3(c) | | 184,176 | |
| Payable for investment securities purchased | | | 6,603,804 | |
| Payable for shares of Common Stock redeemed | | | 395,815 | |
| Unrealized depreciation on forward foreign | | | | |
| currency exchange contracts—Note 4 | | | 1,965 | |
| Accrued expenses | | | 95,289 | |
| | | | 7,281,049 | |
| Net Assets ($) | | | 164,041,050 | |
| Composition of Net Assets ($): | | | | |
| Paid-in capital | | | 301,911,588 | |
| Accumulated undistributed investment income—net | | | 3,417,397 | |
| Accumulated net realized gain (loss) on investments | | | (95,332,171 | ) |
| Accumulated net unrealized appreciation (depreciation) | | | |
| on investments and foreign currency transactions | | | (45,955,764 | ) |
| Net Assets ($) | | | 164,041,050 | |
| |
| |
| Net Asset Value Per Share | | | | |
| | Class A | Class C | Class I | |
| Net Assets ($) | 93,078,260 | 7,998,128 | 62,964,662 | |
| Shares Outstanding | 9,535,075 | 829,618 | 6,463,591 | |
| Net Asset Value Per Share ($) | 9.76 | 9.64 | 9.74 | |
| |
| See notes to financial statements. | | | | |
14
| | |
| STATEMENT OF OPERATIONS | | |
| Year Ended August 31, 2012 | | |
| |
| |
| |
| |
| Investment Income ($): | | |
| Income: | | |
| Cash dividends (net of $573,796 foreign taxes withheld at source): | | |
| Unaffiliated issuers | 5,908,875 | |
| Affiliated issuers | 2,111 | |
| Total Income | 5,910,986 | |
| Expenses: | | |
| Management fee—Note 3(a) | 1,781,710 | |
| Shareholder servicing costs—Note 3(c) | 468,642 | |
| Custodian fees—Note 3(c) | 98,587 | |
| Distribution fees—Note 3(b) | 71,862 | |
| Professional fees | 70,900 | |
| Registration fees | 46,490 | |
| Prospectus and shareholders’ reports | 42,497 | |
| Directors’ fees and expenses—Note 3(d) | 10,524 | |
| Interest expense—Note 2 | 2,841 | |
| Loan commitment fees—Note 2 | 1,601 | |
| Miscellaneous | 33,263 | |
| Total Expenses | 2,628,917 | |
| Less—reduction in expenses due to undertaking—Note 3(a) | (178,171 | ) |
| Less—reduction in fees due to earnings credits—Note 3 (c) | (112 | ) |
| Net Expenses | 2,450,634 | |
| Investment Income—Net | 3,460,352 | |
| Realized and Unrealized Gain (Loss) on Investments—Note 4 ($): | | |
| Net realized gain (loss) on investments and foreign currency transactions | (24,355,231 | ) |
| Net realized gain (loss) on forward foreign currency exchange contracts | (70,921 | ) |
| Net Realized Gain (Loss) | (24,426,152 | ) |
| Net unrealized appreciation (depreciation) on | | |
| investments and foreign currency transactions | 5,564,286 | |
| Net unrealized appreciation (depreciation) on | | |
| forward foreign currency exchange contracts | (1,342 | ) |
| Net Unrealized Appreciation (Depreciation) | 5,562,944 | |
| Net Realized and Unrealized Gain (Loss) on Investments | (18,863,208 | ) |
| Net (Decrease) in Net Assets Resulting from Operations | (15,402,856 | ) |
| |
| See notes to financial statements. | | |
The Fund 15
STATEMENT OF CHANGES IN NET ASSETS
| | | | |
| | Year Ended August 31, | |
| | 2012 | a | 2011 | |
| Operations ($): | | | | |
| Investment income—net | 3,460,352 | | 5,000,966 | |
| Net realized gain (loss) on investments | (24,426,152 | ) | 24,302,402 | |
| Net unrealized appreciation | | | | |
| (depreciation) on investments | 5,562,944 | | (17,601,048 | ) |
| Net Increase (Decrease) in Net Assets | | | | |
| Resulting from Operations | (15,402,856 | ) | 11,702,320 | |
| Dividends to Shareholders from ($): | | | | |
| Investment income—net: | | | | |
| Class A Shares | (2,772,443 | ) | (1,435,975 | ) |
| Class C Shares | (186,447 | ) | (49,595 | ) |
| Class I Shares | (2,975,318 | ) | (1,769,232 | ) |
| Total Dividends | (5,934,208 | ) | (3,254,802 | ) |
| Capital Stock Transactions ($): | | | | |
| Net proceeds from shares sold: | | | | |
| Class A Shares | 20,878,977 | | 16,430,509 | |
| Class B Shares | 13,986 | | 66,687 | |
| Class C Shares | 255,905 | | 421,682 | |
| Class I Shares | 16,118,621 | | 50,489,524 | |
| Dividends reinvested: | | | | |
| Class A Shares | 2,666,058 | | 1,362,852 | |
| Class C Shares | 98,544 | | 24,457 | |
| Class I Shares | 2,622,324 | | 1,536,803 | |
| Cost of shares redeemed: | | | | |
| Class A Shares | (23,471,434 | ) | (32,734,376 | ) |
| Class B Shares | (476,981 | ) | (2,141,296 | ) |
| Class C Shares | (2,885,040 | ) | (4,311,644 | ) |
| Class I Shares | (37,097,091 | ) | (59,952,698 | ) |
| Increase (Decrease) in Net Assets | | | | |
| from Capital Stock Transactions | (21,276,131 | ) | (28,807,500 | ) |
| Total Increase (Decrease) in Net Assets | (42,613,195 | ) | (20,359,982 | ) |
| Net Assets ($): | | | | |
| Beginning of Period | 206,654,245 | | 227,014,227 | |
| End of Period | 164,041,050 | | 206,654,245 | |
| Undistributed investment income—net | 3,417,397 | | 5,768,709 | |
16
| | | | |
| | Year Ended August 31, | |
| | 2012 | a | 2011 | |
| Capital Share Transactions: | | | | |
| Class Ab | | | | |
| Shares sold | 2,047,935 | | 1,392,368 | |
| Shares issued for dividends reinvested | 274,286 | | 119,339 | |
| Shares redeemed | (2,387,133 | ) | (2,777,334 | ) |
| Net Increase (Decrease) in Shares Outstanding | (64,912 | ) | (1,265,627 | ) |
| Class Bb | | | | |
| Shares sold | 1,369 | | 5,686 | |
| Shares redeemed | (46,819 | ) | (182,585 | ) |
| Net Increase (Decrease) in Shares Outstanding | (45,450 | ) | (176,899 | ) |
| Class C | | | | |
| Shares sold | 18,196 | | 35,827 | |
| Shares issued for dividends reinvested | 10,212 | | 2,166 | |
| Shares redeemed | (299,702 | ) | (369,728 | ) |
| Net Increase (Decrease) in Shares Outstanding | (271,294 | ) | (331,735 | ) |
| Class I | | | | |
| Shares sold | 1,535,195 | | 4,200,758 | |
| Shares issued for dividends reinvested | 271,462 | | 135,164 | |
| Shares redeemed | (3,962,000 | ) | (5,117,980 | ) |
| Net Increase (Decrease) in Shares Outstanding | (2,155,343 | ) | (782,058 | ) |
a Effective as of the close of business on March 13, 2012, the fund no longer offers Class B shares.
b During the period ended August 31, 2012, 27,053 Class B shares representing $272,804 were automatically
converted to 26,973 Class A shares and during the period ended August 31, 2011, 74,673 Class B shares
representing $882,387 were automatically converted to 73,675 Class A shares.
See notes to financial statements.
The Fund 17
FINANCIAL HIGHLIGHTS
The following tables describe the performance for each share class for the fiscal periods indicated.All information (except portfolio turnover rate) reflects financial results for a single fund share.Total return shows how much your investment in the fund would have increased (or decreased) during each period, assuming you had reinvested all dividends and distributions.These figures have been derived from the fund’s financial statements.
| | | | | | | | | | |
| | | | Year Ended August 31, | | | |
| Class A Shares | 2012 | | 2011 | | 2010 | | 2009 | | 2008 | |
| Per Share Data ($): | | | | | | | | | | |
| Net asset value, beginning of period | 10.69 | | 10.37 | | 11.02 | | 12.30 | | 20.21 | |
| Investment Operations: | | | | | | | | | | |
| Investment income—neta | .17 | | .20 | | .15 | | .15 | | .27 | |
| Net realized and unrealized | | | | | | | | | | |
| gain (loss) on investments | (.80 | ) | .26 | | (.65 | ) | (1.01 | ) | (2.93 | ) |
| Total from Investment Operations | (.63 | ) | .46 | | (.50 | ) | (.86 | ) | (2.66 | ) |
| Distributions: | | | | | | | | | | |
| Dividends from investment income—net | (.30 | ) | (.14 | ) | (.15 | ) | (.42 | ) | (.32 | ) |
| Dividends from net realized | | | | | | | | | | |
| gain on investments | — | | — | | — | | — | | (4.93 | ) |
| Total Distributions | (.30 | ) | (.14 | ) | (.15 | ) | (.42 | ) | (5.25 | ) |
| Net asset value, end of period | 9.76 | | 10.69 | | 10.37 | | 11.02 | | 12.30 | |
| Total Return (%)b | (5.89 | ) | 4.32 | | (4.66 | ) | (5.97 | ) | (18.56 | ) |
| Ratios/Supplemental Data (%): | | | | | | | | | | |
| Ratio of total expenses | | | | | | | | | | |
| to average net assets | 1.63 | | 1.54 | | 1.54 | | 1.84 | | 1.57 | |
| Ratio of net expenses | | | | | | | | | | |
| to average net assets | 1.53 | | 1.49 | | 1.54 | | 1.84 | | 1.56 | |
| Ratio of net investment income | | | | | | | | | | |
| to average net assets | 1.74 | | 1.70 | | 1.29 | | 1.66 | | 1.71 | |
| Portfolio Turnover Rate | 40.93 | | 60.72 | | 55.35 | | 69.63 | | 46.96 | |
| Net Assets, end of period ($ x 1,000) | 93,078 | | 102,606 | | 112,716 | | 159,260 | | 228,308 | |
a Based on average shares outstanding at each month end.
b Exclusive of sales charge.
See notes to financial statements.
18
| | | | | | | | | | |
| | | | Year Ended August 31, | | | |
| Class C Shares | 2012 | | 2011 | | 2010 | | 2009 | | 2008 | |
| Per Share Data ($): | | | | | | | | | | |
| Net asset value, beginning of period | 10.51 | | 10.19 | | 10.84 | | 11.98 | | 19.79 | |
| Investment Operations: | | | | | | | | | | |
| Investment income—neta | .10 | | .11 | | .06 | | .08 | | .14 | |
| Net realized and unrealized | | | | | | | | | | |
| gain (loss) on investments | (.79 | ) | .25 | | (.65 | ) | (.96 | ) | (2.85 | ) |
| Total from Investment Operations | (.69 | ) | .36 | | (.59 | ) | (.88 | ) | (2.71 | ) |
| Distributions: | | | | | | | | | | |
| Dividends from investment income—net | (.18 | ) | (.04 | ) | (.06 | ) | (.26 | ) | (.17 | ) |
| Dividends from net realized | | | | | | | | | | |
| gain on investments | — | | — | | — | | — | | (4.93 | ) |
| Total Distributions | (.18 | ) | (.04 | ) | (.06 | ) | (.26 | ) | (5.10 | ) |
| Net asset value, end of period | 9.64 | | 10.51 | | 10.19 | | 10.84 | | 11.98 | |
| Total Return (%)b | (6.55 | ) | 3.48 | | (5.49 | ) | (6.71 | ) | (19.16 | ) |
| Ratios/Supplemental Data (%): | | | | | | | | | | |
| Ratio of total expenses | | | | | | | | | | |
| to average net assets | 2.38 | | 2.31 | | 2.33 | | 2.63 | | 2.32 | |
| Ratio of net expenses | | | | | | | | | | |
| to average net assets | 2.28 | | 2.26 | | 2.33 | | 2.63 | | 2.32 | |
| Ratio of net investment income | | | | | | | | | | |
| to average net assets | .99 | | .91 | | .56 | | .87 | | .91 | |
| Portfolio Turnover Rate | 40.93 | | 60.72 | | 55.35 | | 69.63 | | 46.96 | |
| Net Assets, end of period ($ x 1,000) | 7,998 | | 11,573 | | 14,604 | | 18,607 | | 30,965 | |
a Based on average shares outstanding at each month end.
b Exclusive of sales charge.
See notes to financial statements.
The Fund 19
FINANCIAL HIGHLIGHTS (continued)
| | | | | | | | | | |
| | | | Year Ended August 31, | | | |
| Class I Shares | 2012 | | 2011 | | 2010 | | 2009 | | 2008 | |
| Per Share Data ($): | | | | | | | | | | |
| Net asset value, beginning of period | 10.67 | | 10.36 | | 11.02 | | 12.31 | | 20.27 | |
| Investment Operations: | | | | | | | | | | |
| Investment income—neta | .23 | | .28 | | .22 | | .19 | | .34 | |
| Net realized and unrealized | | | | | | | | | | |
| gain (loss) on investments | (.81 | ) | .22 | | (.68 | ) | (.98 | ) | (2.93 | ) |
| Total from Investment Operations | (.58 | ) | .50 | | (.46 | ) | (.79 | ) | (2.59 | ) |
| Distributions: | | | | | | | | | | |
| Dividends from investment income—net | (.35 | ) | (.19 | ) | (.20 | ) | (.50 | ) | (.44 | ) |
| Dividends from net realized | | | | | | | | | | |
| gain on investments | — | | — | | — | | — | | (4.93 | ) |
| Total Distributions | (.35 | ) | (.19 | ) | (.20 | ) | (.50 | ) | (5.37 | ) |
| Net asset value, end of period | 9.74 | | 10.67 | | 10.36 | | 11.02 | | 12.31 | |
| Total Return (%) | (5.41 | ) | 4.67 | | (4.37 | ) | (5.21 | ) | (18.25 | ) |
| Ratios/Supplemental Data (%): | | | | | | | | | | |
| Ratio of total expenses | | | | | | | | | | |
| to average net assets | 1.19 | | 1.15 | | 1.22 | | 1.37 | | 1.21 | |
| Ratio of net expenses | | | | | | | | | | |
| to average net assets | 1.09 | | 1.09 | | 1.22 | | 1.36 | | 1.20 | |
| Ratio of net investment income | | | | | | | | | | |
| to average net assets | 2.29 | | 2.29 | | 1.93 | | 2.09 | | 2.16 | |
| Portfolio Turnover Rate | 40.93 | | 60.72 | | 55.35 | | 69.63 | | 46.96 | |
| Net Assets, end of period ($ x 1,000) | 62,965 | | 91,998 | | 97,429 | | 41,460 | | 42,444 | |
| |
| a Based on average shares outstanding at each month end. | | | | | | | | | |
| See notes to financial statements. | | | | | | | | | | |
20
NOTES TO FINANCIAL STATEMENTS
NOTE 1—Significant Accounting Policies:
Dreyfus International Value Fund (the “fund”) is a separate diversified series of Advantage Funds, Inc. (the “Company”), which is registered under the Investment Company Act of 1940, as amended (the “Act”), as an open-end management investment company and operates as a series company offering thirteen series, including the fund.The fund’s investment objective is to seek long-term capital growth.The Dreyfus Corporation (the “Manager” or “Dreyfus”), a wholly-owned subsidiary of The Bank of New York Mellon Corporation (“BNY Mellon”), serves as the fund’s investment adviser.
MBSC Securities Corporation (the “Distributor”), a wholly-owned subsidiary of the Manager, is the distributor of the fund’s shares. The fund is authorized to issue 500 million shares of $.001 par value Common Stock.The fund currently offers three classes of shares: Class A (300 million shares authorized), Class C (100 million shares authorized) and Class I (100 million shares authorized). Class A shares are subject to a sales charge imposed at the time of purchase. Class C shares are subject to a contingent deferred sales charge (“CDSC”) imposed on Class C shares redeemed within one year of purchase. Class I shares are sold at net asset value per share only to institutional investors. The Company’s Board of Directors approved, effective as of the close of business on March 13, 2012, the transfer of shares authorized from Class B to Class A shares. Class B shares were subject to a CDSC imposed on Class B share redemptions made within six years of purchase and automatically converted to Class A shares after six years.The fund no longer offers Class B shares. Effective March 13, 2012, all outstanding Class B shares were automatically converted to Class A shares. Other differences between the classes include the services offered to and the expenses borne by each class, the allocation of certain transfer agency costs and certain voting rights. Income, expenses (other than expenses attributable to a specific class), and realized and unrealized gains or losses on investments are allocated to each class of shares based on its relative net assets.
The Fund 21
NOTES TO FINANCIAL STATEMENTS (continued)
The Company accounts separately for the assets, liabilities and operations of each series. Expenses directly attributable to each series are charged to that series’ operations; expenses which are applicable to all series are allocated among them on a pro rata basis.
The Financial Accounting Standards Board (“FASB”) Accounting Standards Codification is the exclusive reference of authoritative U.S. generally accepted accounting principles (“GAAP”) recognized by the FASB to be applied by nongovernmental entities. Rules and interpretive releases of the Securities and Exchange Commission (“SEC”) under authority of federal laws are also sources of authoritative GAAP for SEC registrants. The fund’s financial statements are prepared in accordance with GAAP, which may require the use of management estimates and assumptions.Actual results could differ from those estimates.
The Company enters into contracts that contain a variety of indemnifications. The fund’s maximum exposure under these arrangements is unknown.The fund does not anticipate recognizing any loss related to these arrangements.
(a) Portfolio valuation: The fair value of a financial instrument is the amount that would be received to sell an asset or paid to transfer a liability in an orderly transaction between market participants at the measurement date (i.e., the exit price). GAAP establishes a fair value hierarchy that prioritizes the inputs of valuation techniques used to measure fair value.This hierarchy gives the highest priority to unadjusted quoted prices in active markets for identical assets or liabilities (Level 1 measurements) and the lowest priority to unobservable inputs (Level 3 measurements).
Additionally, GAAP provides guidance on determining whether the volume and activity in a market has decreased significantly and whether such a decrease in activity results in transactions that are not orderly. GAAP requires enhanced disclosures around valuation inputs and techniques used during annual and interim periods.
22
Various inputs are used in determining the value of the fund’s investments relating to fair value measurements.These inputs are summarized in the three broad levels listed below:
Level 1—unadjusted quoted prices in active markets for identical investments.
Level 2—other significant observable inputs (including quoted prices for similar investments, interest rates, prepayment speeds, credit risk, etc.).
Level 3—significant unobservable inputs (including the fund’s own assumptions in determining the fair value of investments).
The inputs or methodology used for valuing securities are not necessarily an indication of the risk associated with investing in those securities.
Changes in valuation techniques may result in transfers in or out of an assigned level within the disclosure hierarchy. Valuation techniques used to value the fund’s investments are as follows:
Investments in securities are valued at the last sales price on the securities exchange or national securities market on which such securities are primarily traded. Securities listed on the National Market System for which market quotations are available are valued at the official closing price or, if there is no official closing price that day, at the last sales price. Securities not listed on an exchange or the national securities market, or securities for which there were no transactions, are valued at the average of the most recent bid and asked prices, except for open short positions, where the asked price is used for valuation purposes. Bid price is used when no asked price is available. Registered investment companies that are not traded on an exchange are valued at their net asset value.All of the preceding securities are categorized within Level 1 of the fair value hierarchy.
The Fund 23
NOTES TO FINANCIAL STATEMENTS (continued)
Fair valuing of securities may be determined with the assistance of a pricing service using calculations based on indices of domestic securities and other appropriate indicators, such as prices of relevant ADRs and financial futures. Utilizing these techniques may result in transfers between Level 1 and Level 2 of the fair value hierarchy.
When market quotations or official closing prices are not readily available, or are determined not to reflect accurately fair value, such as when the value of a security has been significantly affected by events after the close of the exchange or market on which the security is principally traded (for example, a foreign exchange or market), but before the fund calculates its net asset value, the fund may value these investments at fair value as determined in accordance with the procedures approved by the Company’s Board of Directors. Certain factors may be considered when fair valuing investments such as: fundamental analytical data, the nature and duration of restrictions on disposition, an evaluation of the forces that influence the market in which the securities are purchased and sold, and public trading in similar securities of the issuer or comparable issuers.These securities are either categorized as Level 2 or 3 depending on the relevant inputs used.
For restricted securities where observable inputs are limited, assumptions about market activity and risk are used and are categorized within Level 3 of the fair value hierarchy.
Investments denominated in foreign currencies are translated to U.S. dollars at the prevailing rates of exchange.
Forward foreign currency exchange contracts (“forward contracts”) are valued at the forward rate. These securities are generally categorized within Level 2 of the fair value hierarchy.
24
The following is a summary of the inputs used as of August 31, 2012 in valuing the fund’s investments:
| | | | | | |
| | | Level 2—Other | | Level 3— | | |
| | Level 1— | Significant | | Significant | | |
| | Unadjusted | Observable | | Unobservable | | |
| | Quoted Prices | Inputs | | Inputs | Total | |
| Assets ($) | | | | | | |
| Investments in Securities: | | | | | |
| Equity Securities— | | | | | | |
| Foreign† | 157,731,755 | — | | — | 157,731,755 | |
| Mutual Funds | 11,340,000 | — | | — | 11,340,000 | |
| Other Financial | | | | | | |
| Instruments: | | | | | | |
| Forward Foreign | | | | | | |
| Currency Exchange | | | | | | |
| Contracts†† | — | 2 | | — | 2 | |
| Liabilities ($) | | | | | | |
| Other Financial | | | | | | |
| Instruments: | | | | | | |
| Forward Foreign | | | | | | |
| Currency Exchange | | | | | | |
| Contracts†† | — | (1,965 | ) | — | (1,965 | ) |
† See Statement of Investments for additional detailed categorizations.
Amount shown represents unrealized appreciation (depreciation) at period end.
At August 31, 2012, there were no transfers between Level 1 and Level 2 of the fair value hierarchy.
(b) Foreign currency transactions: The fund does not isolate that portion of the results of operations resulting from changes in foreign exchange rates on investments from the fluctuations arising from changes in the market prices of securities held. Such fluctuations are included with the net realized and unrealized gain or loss on investments.
The Fund 25
NOTES TO FINANCIAL STATEMENTS (continued)
Net realized foreign exchange gains or losses arise from sales of foreign currencies, currency gains or losses realized on securities transactions between trade and settlement date, and the difference between the amounts of dividends, interest and foreign withholding taxes recorded on the fund’s books and the U.S. dollar equivalent of the amounts actually received or paid. Net unrealized foreign exchange gains and losses arise from changes in the value of assets and liabilities other than investments resulting from changes in exchange rates. Foreign currency gains and losses on investments are included with net realized and unrealized gain or loss on investments.
(c) Securities transactions and investment income: Securities transactions are recorded on a trade date basis. Realized gains and losses from securities transactions are recorded on the identified cost basis. Dividend income is recognized on the ex-dividend date and interest income, including, where applicable, accretion of discount and amortization of premium on investments, is recognized on the accrual basis.
(d) Risk: Investing in foreign markets may involve special risks and considerations not typically associated with investing in the U.S.These risks include revaluation of currencies, high rates of inflation, repatriation restrictions on income and capital, and adverse political and economic developments. Moreover, securities issued in these markets may be less liquid, subject to government ownership controls and delayed settlements, and their prices may be more volatile than those of comparable securities in the U.S.
(e) Affiliated issuers: Investments in other investment companies advised by Dreyfus are defined as “affiliated” in the Act. Investments in affiliated investment companies for the period ended August 31, 2012 were as follows:
| | | | | | |
| Affiliated | | | | | | |
| Investment | Value | | | | Value | Net |
| Company | 8/31/2011 | ($) | Purchases ($) | Sales($) | 8/31/2012 ($) | Assets (%) |
| Dreyfus | | | | | | |
| Institutional | | | | | | |
| Preferred | | | | | | |
| Plus Money | | | | | | |
| Market | | | | | | |
| Fund | 1,100,000 | | 55,125,000 | 44,885,000 | 11,340,000 | 6.9 |
26
(f) Dividends to shareholders: Dividends are recorded on the ex-dividend date. Dividends from investment income-net and dividends from net realized capital gains, if any, are normally declared and paid annually, but the fund may make distributions on a more frequent basis to comply with the distribution requirements of the Internal Revenue Code of 1986, as amended (the “Code”).To the extent that net realized capital gains can be offset by capital loss carryovers, it is the policy of the fund not to distribute such gains. Income and capital gain distributions are determined in accordance with income tax regulations, which may differ from GAAP.
(g) Federal income taxes: It is the policy of the fund to continue to qualify as a regulated investment company, if such qualification is in the best interests of its shareholders, by complying with the applicable provisions of the Code, and to make distributions of taxable income sufficient to relieve it from substantially all federal income and excise taxes.
As of and during the period ended August 31, 2012, the fund did not have any liabilities for any uncertain tax positions.The fund recognizes interest and penalties, if any, related to uncertain tax positions as income tax expense in the Statement of Operations. During the period, the fund did not incur any interest or penalties.
Each of the tax years in the four-year period ended August 31, 2012 remains subject to examination by the Internal Revenue Service and state taxing authorities.
At August 31, 2012, the components of accumulated earnings on a tax basis were as follows: undistributed ordinary income $3,473,906, accumulated capital losses $92,890,109 and unrealized depreciation $48,454,335.
Under the Regulated Investment Company Modernization Act of 2010 (the “2010 Act”), the fund is permitted to carry forward capital losses incurred in taxable years beginning after December 22, 2010 (“post-enactment losses”) for an unlimited period. Furthermore, post-enactment capital loss carryovers retain their character as either short-term or long-
The Fund 27
NOTES TO FINANCIAL STATEMENTS (continued)
term capital losses rather than short-term as they were under previous statute.The 2010 Act requires post-enactment losses to be utilized before the utilization of losses incurred in taxable years prior to the effective date of the 2010 Act (“pre-enactment losses”).As a result of this ordering rule, pre-enactment losses may be more likely to expire unused.
The accumulated capital loss carryover is available for federal income tax purposes to be applied against future net realized capital gains, if any, realized subsequent to August 31, 2012. If not applied, $24,770,979 of the carryover expires in fiscal year 2017 and $41,505,182 expires in fiscal year 2018.The fund has $3,162,451 of post-enactment short-term capital losses and $23,451,497 of post-enactment long-term capital losses that can be carried forward for an unlimited period.
The tax character of distributions paid to shareholders during the fiscal periods ended August 31, 2012 and August 31, 2011 were as follows: ordinary income $5,934,208 and $3,254,802, respectively.
During the period ended August 31, 2012, as a result of permanent book to tax differences, primarily due to the tax treatment for foreign exchange gains and losses and passive foreign investment companies, the fund increased accumulated undistributed investment income-net by $122,544 and decreased accumulated net realized gain (loss) on investments by the same amount. Net assets and net asset value per share were not affected by this reclassification.
(h) New Accounting Pronouncement: In December 2011, FASB issued Accounting Standards Update No. 2011-11 “Disclosures about Offsetting Assets and Liabilities” (“ASU 2011-11”). These disclosure requirements are intended to help investors and other financial statement users to better assess the effect or potential effect of offsetting arrangements on a company’s financial position.They also improve transparency in the reporting of how companies mitigate credit risk, including disclosure of related collateral pledged or received. In addition,ASU 2011-11 facilitates comparison between those entities that prepare their financial statements on the basis of GAAP and those entities that prepare their financial statements on the basis of International Financial Reporting
28
Standards (“IFRS”). ASU 2011-11 requires entities to: disclose both gross and net information about both instruments and transactions eligible for offset in the financial statements; and disclose instruments and transactions subject to an agreement similar to a master netting agreement. ASU 2011-11 is effective for fiscal years beginning on or after January 1, 2013, and interim periods within those annual periods. At this time, management is evaluating the implications of ASU 2011-11 and its impact on the funds’ financial statement disclosures.
NOTE 2—Bank Lines of Credit:
The fund participates with other Dreyfus-managed funds in a $225 million unsecured credit facility led by Citibank, N.A. and a $300 million unsecured credit facility provided by The Bank of NewYork Mellon, a subsidiary of BNY Mellon and an affiliate of Dreyfus (each, a“Facility”), each to be utilized primarily for temporary or emergency purposes, including the financing of redemptions. In connection therewith, the fund has agreed to pay its pro rata portion of commitment fees for each Facility. Interest is charged to the fund based on rates determined pursuant to the terms of the respective Facility at the time of borrowing.
The average amount of borrowings outstanding under the Facilities during the period ended August 31, 2012 was approximately $239,100, with a related weighted average annualized interest rate of 1.19%.
NOTE 3—Management Fee and Other Transactions with Affiliates:
(a) Pursuant to a management agreement with the Manager, the management fee is computed at the annual rate of 1% of the value of the fund’s average daily net assets and is payable monthly.
The Manager has agreed to waive receipt of a portion of the fund’s management fee, in the amount of .10% of the value of the fund’s average daily net assets, until March 31, 2013.The reduction in expenses, pursuant to the undertaking, amounted to $178,171 during the period ended August 31, 2012.
The Fund 29
NOTES TO FINANCIAL STATEMENTS (continued)
During the period ended August 31, 2012, the Distributor retained $1,829 from commissions earned on sales of the fund’s Class A shares, and $65 and $16 from CDSCs on redemptions of the fund’s Class B and Class C shares, respectively.
(b) Under the Distribution Plan adopted pursuant to Rule 12b-1 under the Act, Class B shares paid and Class C shares pay the Distributor for distributing their shares at an annual rate of .75% of the value of the average daily net assets of Class B and Class C shares. During the period ended August 31, 2012, Class B and Class C shares were charged $1,167 and $70,695, respectively, pursuant to the Distribution Plan.
(c) Under the Shareholder Services Plan, Class A and Class C shares pay and Class B shares paid the Distributor at an annual rate of .25% of the value of their average daily net assets for the provision of certain services. The services provided may include personal services relating to shareholder accounts, such as answering shareholder inquiries regarding the fund and providing reports and other information, and services related to the maintenance of shareholder accounts. The Distributor may make payments to Service Agents (securities dealers, financial institutions or other industry professionals) in respect of these services.The Distributor determines the amounts to be paid to Service Agents. During the period ended August 31, 2012, Class A, Class B and Class C shares were charged $221,513, $389 and $23,565, respectively, pursuant to the Shareholder Services Plan.
The fund has arrangements with the transfer agent and the custodian whereby the fund may receive earnings credits when positive cash balances are maintained, which are used to offset transfer agency and custody fees. For financial reporting purposes, the fund includes net earnings credits as an expense offset in the Statement of Operations.
The fund compensates DreyfusTransfer, Inc. (“DTI”), a wholly-owned subsidiary of the Manager, under a transfer agency agreement for providing transfer agency services for the fund and, since May 29, 2012,
30
cash management services related to fund subscriptions and redemptions. During the period ended August 31, 2012, the fund was charged $29,956 for transfer agency services and $321 for cash management services. Cash management fees were partially offset by earnings credits of $38.These fees are included in Shareholder servicing costs in the Statement of Operations.
The fund compensatesThe Bank of NewYork Mellon under a custody agreement for providing custodial services for the fund. During the period ended August 31, 2012, the fund was charged $98,587 pursuant to the custody agreement.
Prior to May 29, 2012, the fund compensated The Bank of New York Mellon under a cash management agreement for performing cash management services related to fund subscriptions and redemptions. During the period ended August 31, 2012, the fund was charged $2,698 pursuant to the cash management agreement, which is included in Shareholder servicing costs in the Statement of Operations. These fees were partially offset by earnings credits of $74.
During the period ended August 31, 2012, the fund was charged $6,392 for services performed by the Chief Compliance Officer and his staff.
The components of “Due to The Dreyfus Corporation and affiliates” in the Statement of Assets and Liabilities consist of: management fees $132,304, Distribution Plan fees $5,172, Shareholder Services Plan fees $19,501, custodian fees $29,436, Chief Compliance Officer fees $4,243 and transfer agency per account fees $6,600, which are offset against an expense reimbursement currently in effect in the amount of $13,080.
(d) Each Board member also serves as a Board member of other funds within the Dreyfus complex. Annual retainer fees and attendance fees are allocated to each fund based on net assets.
The Fund 31
NOTES TO FINANCIAL STATEMENTS (continued)
NOTE 4—Securities Transactions:
The aggregate amount of purchases and sales of investment securities, excluding short-term securities and forward contracts, during the period ended August 31, 2012 amounted to $72,354,691 and $98,884,959, respectively.
Derivatives: A derivative is a financial instrument whose performance is derived from the performance of another asset. Each type of derivative instrument that was held by the fund during the period ended August 31, 2012 is discussed below.
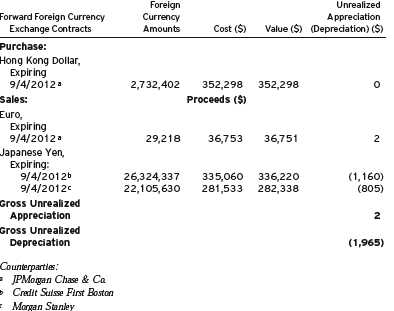
Forward Foreign Currency Exchange Contracts: The fund enters into forward contracts in order to hedge its exposure to changes in foreign currency exchange rates on its foreign portfolio holdings, to settle foreign currency transactions or as a part of its investment strategy.When executing forward contracts, the fund is obligated to buy or sell a foreign currency at a specified rate on a certain date in the future. With respect to sales of forward contracts, the fund incurs a loss if the value of the contract increases between the date the forward contract is opened and the date the forward contract is closed.The fund realizes a gain if the value of the contract decreases between those dates.With respect to purchases of forward contracts, the fund incurs a loss if the value of the contract decreases between the date the forward contract is opened and the date the forward contract is closed.The fund realizes a gain if the value of the contract increases between those dates. Any realized or unrealized gains or losses which occurred during the period are reflected in the Statement of Operations.The fund is exposed to foreign currency risk as a result of changes in value of underlying financial instruments. The fund is also exposed to credit risk associated with counterparty nonperformance on these forward contracts, which is typically limited
32
to the unrealized gain on each open contract.The following summarizes open forward contracts at August 31, 2012:
The following summarizes the average market value of derivatives outstanding during the period ended August 31, 2012:
| |
| | Average Market Value ($) |
| Forward contracts | 1,165,451 |
At August 31, 2012, the cost of investments for federal income tax purposes was $217,490,791; accordingly, accumulated net unrealized depreciation on investments was $48,419,036, consisting of $4,816,476 gross unrealized appreciation and $53,235,512 gross unrealized depreciation.
The Fund 33
REPORT OF INDEPENDENT REGISTERED
PUBLIC ACCOUNTING FIRM
Shareholders and Board of Directors
Dreyfus International Value Fund
We have audited the accompanying statement of assets and liabilities, including the statement of investments, of Dreyfus International Value Fund (one of the series comprising Advantage Funds, Inc.) as of August 31, 2012, and the related statement of operations for the year then ended, the statement of changes in net assets for each of the two years in the period then ended, and the financial highlights for each of the five years in the period then ended. These financial statements and financial highlights are the responsibility of the Fund’s management. Our responsibility is to express an opinion on these financial statements and financial highlights based on our audits.
We conducted our audits in accordance with the standards of the Public Company Accounting Oversight Board (United States).Those standards require that we plan and perform the audit to obtain reasonable assurance about whether the financial statements and financial highlights are free of material misstatement.We were not engaged to perform an audit of the Fund’s internal control over financial reporting. Our audits included consideration of internal control over financial reporting as a basis for designing audit procedures that are appropriate in the circumstances, but not for the purpose of expressing an opinion on the effectiveness of the Fund’s internal control over financial reporting. Accordingly, we express no such opinion.An audit also includes examining, on a test basis, evidence supporting the amounts and disclosures in the financial statements and financial highlights, assessing the accounting principles used and significant estimates made by management, and evaluating the overall financial statement presentation. Our procedures included confirmation of securities owned as of August 31, 2012 by correspondence with the custodian and others. We believe that our audits provide a reasonable basis for our opinion.
In our opinion, the financial statements and financial highlights referred to above present fairly, in all material respects, the financial position of Dreyfus International Value Fund at August 31, 2012, the results of its operations for the year then ended, the changes in its net assets for each of the two years in the period then ended, and the financial highlights for each of the five years in the period then ended, in conformity with U.S. generally accepted accounting principles.

New York, New York
October 29, 2012
34
IMPORTANT TAX INFORMATION (Unaudited)
In accordance with federal tax law, the fund elects to provide each shareholder with their portion of the fund’s foreign taxes paid and the income sourced from foreign countries. Accordingly, the fund hereby reports the following information regarding its fiscal year ended August 31, 2012:
—the total amount of taxes paid to foreign countries was $566,200
—the total amount of income sourced from foreign countries was $6,490,275.
Where required by federal tax law rules, shareholders will receive notification of their proportionate share of foreign taxes paid and foreign sourced income for the 2012 calendar year with Form 1099-DIV which will be mailed in early 2013.Also certain dividends paid by the fund may be subject to a maximum tax rate of 15%, as provided for by the Jobs and GrowthTax Relief Reconciliation Act of 2003. Of the distributions paid during the fiscal year, $5,934,208 represents the maximum amount that may be considered qualified dividend income.
The Fund 35
PROXY RESULTS (Unaudited)
The Company held a special meeting of shareholders on August 3, 2012.The proposal considered at the meeting, and the results, are as follows:
| | | |
| | | Shares | |
| | Votes For | | Authority Withheld |
| To elect additional Board Members: | | | |
| Lynn Martin† | 90,334,756 | | 3,252,629 |
| Robin A. Melvin† | 90,449,622 | | 3,137,763 |
| Philip L. Toia† | 90,229,928 | | 3,357,457 |
† Each new Board Member’s term commenced on September 1, 2012.
In addition Peggy C. Davis, Joseph S. DiMartino, David P. Feldman, Ehud Houminer and Dr. Martin Peretz continue
as Board Members of the Company.
36
INFORMATION ABOUT THE RENEWAL OF THE
FUND’S MANAGEMENT AGREEMENT (Unaudited)
At a meeting of the fund’s Board of Directors held on March 6, 2012, the Board considered the renewal of the fund’s Management Agreement pursuant to which Dreyfus provides the fund with investment advisory and administrative services (the “Agreement”). The Board members, none of whom are “interested persons” (as defined in the Investment Company Act of 1940, as amended) of the fund, were assisted in their review by independent legal counsel and met with counsel in executive session separate from Dreyfus representatives. In considering the renewal of the Agreement, the Board considered all factors that it believed to be relevant, including those discussed below.The Board did not identify any one factor as dispositive, and each Board member may have attributed different weights to the factors considered.
Analysis of Nature, Extent, and Quality of Services Provided to the Fund. The Board considered information previously provided to them in presentations from Dreyfus representatives regarding the nature, extent, and quality of the services provided to funds in the Dreyfus fund complex, and Dreyfus representatives confirmed that there had been no material changes in this information. Dreyfus provided the number of open accounts in the fund, the fund’s asset size and the allocation of fund assets among distribution channels. Dreyfus also had previously provided information regarding the diverse intermediary relationships and distribution channels of funds in the Dreyfus fund complex and Dreyfus’ corresponding need for broad, deep, and diverse resources to be able to provide ongoing shareholder services to each distribution channel, including the distribution channel(s) for the fund.
The Board also considered research support available to, and portfolio management capabilities of, the fund’s portfolio management personnel and that Dreyfus also provides oversight of day-to-day fund operations, including fund accounting and administration and assistance in meeting legal and regulatory requirements.The Board also considered Dreyfus’
The Fund 37
INFORMATION ABOUT THE RENEWAL OF THE FUND’S
MANAGEMENT AGREEMENT (Unaudited) (continued)
extensive administrative, accounting, and compliance infrastructures.The Board also considered portfolio management’s brokerage policies and practices (including policies and practices regarding soft dollars) and the standards applied in seeking best execution.
Comparative Analysis of the Fund’s Performance and Management Fee and Expense Ratio. The Board reviewed reports prepared by Lipper, Inc. (“Lipper”), an independent provider of investment company data, which included information comparing (1) the fund’s performance with the performance of a group of comparable funds (the “Performance Group”) and with a broader group of funds (the “Performance Universe”), all for various periods ended December 31, 2011, and (2) the fund’s actual and contractual management fees and total expenses with those of a group of comparable funds (the “Expense Group”) and with a broader group of funds (the “Expense Universe”), the information for which was derived in part from fund financial statements available to Lipper as of the date of its analysis. Dreyfus previously had furnished the Board with a description of the methodology Lipper used to select the Performance Group and Performance Universe and the Expense Group and Expense Universe.
Dreyfus representatives stated that the usefulness of performance comparisons may be affected by a number of factors, including different investment limitations that may be applicable to the fund and comparison funds.They also noted that performance generally should be considered over longer periods of time, although it is possible that long-term performance can be adversely affected by even one period of significant underperformance so that a single investment decision or theme has the ability to affect disproportionately long-term performance. The Board discussed the results of the comparisons and noted that the fund’s total return performance was variously above and below the Performance Group and Performance Universe medians for the various
38
periods, and ranked in the fourth quartile of the Performance Group and Performance Universe for the three most recent periods ended December 31st. Dreyfus also provided a comparison of the fund’s calendar year total returns to the returns of the fund’s benchmark index. The Board indicated its expectation for improvements in the fund’s performance results in the future.
The Board also reviewed the range of actual and contractual management fees and total expenses of the Expense Group and Expense Universe funds and discussed the results of the comparisons.The Board noted that the fund’s contractual management fee was above the Expense Group median, and the fund’s actual management fee and total expenses were above the Expense Group and Expense Universe medians.
Dreyfus representatives noted that Dreyfus has agreed to waive receipt of a portion of the fund’s management fee in the amount of .10% of the value of the fund’s average daily net assets until September 30, 2012.
Dreyfus representatives reviewed with the Board the management or investment advisory fees (1) paid by funds advised or administered by Dreyfus that are in the same Lipper category as the fund and (2) paid to Dreyfus or the Dreyfus-affiliated primary employer of the fund’s primary portfolio manager(s) for advising any separate accounts and/or other types of client portfolios that are considered to have similar investment strategies and policies as the fund (the “Similar Clients”), and explained the nature of the Similar Clients.They discussed differences in fees paid and the relationship of the fees paid in light of any differences in the services provided and other relevant factors. The Board considered the relevance of the fee information provided for the Similar Clients to evaluate the appropriateness and reasonableness of the fund’s management fee.
The Fund 39
INFORMATION ABOUT THE RENEWAL OF THE FUND’S
MANAGEMENT AGREEMENT (Unaudited) (continued)
Analysis of Profitability and Economies of Scale. Dreyfus representatives reviewed the expenses allocated and profit received by Dreyfus and the resulting profitability percentage for managing the fund, and the method used to determine the expenses and profit. The Board concluded that the profitability results were not unreasonable, given the services rendered and service levels provided by Dreyfus. The Board previously had been provided with information prepared by an independent consulting firm regarding Dreyfus’ approach to allocating costs to, and determining the profitability of, individual funds and the entire Dreyfus fund complex. The consulting firm also had analyzed where any economies of scale might emerge in connection with the management of a fund.
The Board’s counsel stated that the Board should consider the profitability analysis (1) as part of their evaluation of whether the fees under the Agreement bear a reasonable relationship to the mix of services provided by Dreyfus, including the nature, extent and quality of such services, and (2) in light of the relevant circumstances for the fund and the extent to which economies of scale would be realized if the fund grows and whether fee levels reflect these economies of scale for the benefit of fund shareholders. Dreyfus representatives noted that a discussion of economies of scale is predicated on a fund having achieved a substantial size with increasing assets and that, if a fund’s assets had been stable or decreasing, the possibility that Dreyfus may have realized any economies of scale would be less. Dreyfus representatives also noted that, as a result of shared and allocated costs among funds in the Dreyfus fund complex, the extent of economies of scale could depend substantially on the level of assets in the complex as a whole, so that increases and decreases in complex-wide assets can affect potential economies of scale in a manner that is disproportionate to, or even in the opposite direction from, changes in the fund’s asset level. The Board also considered potential benefits to Dreyfus from acting as investment adviser and noted the soft dollar arrangements in effect for trading the fund’s investments.
40
At the conclusion of these discussions, the Board agreed that it had been furnished with sufficient information to make an informed business decision with respect to the renewal of the Agreement. Based on the discussions and considerations as described above, the Board concluded and determined as follows.
The Board concluded that the nature, extent and quality of the services provided by Dreyfus are adequate and appropriate.
The Board agreed to closely monitor performance and determined to approve renewal of the Agreement only through September 30, 2012.
The Board concluded that the fee paid to Dreyfus was reasonable in light of the considerations described above.
The Board determined that the economies of scale which may accrue to Dreyfus and its affiliates in connection with the management of the fund had been adequately considered by Dreyfus in connection with the fee rate charged to the fund pursuant to the Agreement and that, to the extent in the future it were determined that material economies of scale had not been shared with the fund, the Board would seek to have those economies of scale shared with the fund.
The Board considered these conclusions and determinations, along with information received on a routine and regular basis throughout the year. In addition, it should be noted that the Board’s consideration of the contractual fee arrangements for this fund had the benefit of a number of years of reviews of prior or similar agreements during which lengthy discussions took place between the Board and Dreyfus representatives. Certain aspects of the arrangements may receive greater scrutiny in some years than in others, and the Board’s conclusions may be based, in part, on their consideration of the same or similar arrangements in prior years. The Board determined that renewal of the Agreement through September 30, 2012 was in the best interests of the fund and its shareholders.
The Fund 41
BOARD MEMBERS INFORMATION (Unaudited)
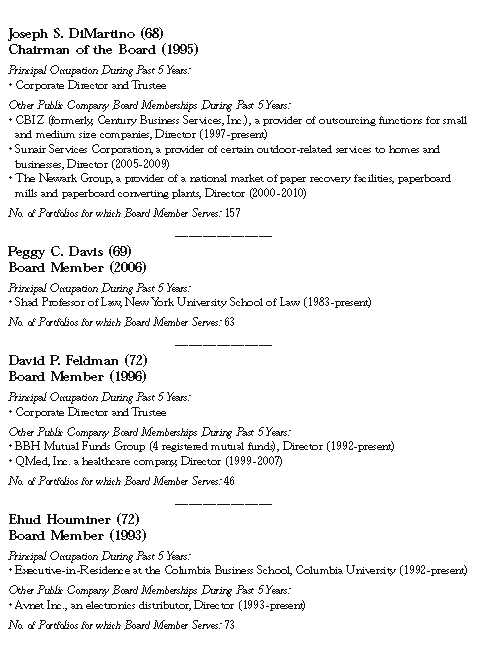
42

The Fund 43
OFFICERS OF THE FUND (Unaudited)
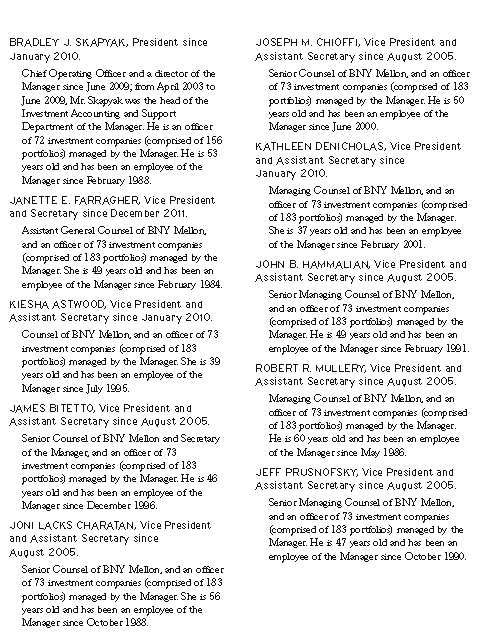
44

The Fund 45
For More Information
Telephone Call your financial representative or 1-800-DREYFUS
Mail The Dreyfus Family of Funds, 144 Glenn Curtiss Boulevard, Uniondale, NY 11556-0144
The fund files its complete schedule of portfolio holdings with the Securities and Exchange Commission (“SEC”) for the first and third quarters of each fiscal year on Form N-Q. The fund’s Forms N-Q are available on the SEC’s website at http://www.sec.gov and may be reviewed and copied at the SEC’s Public Reference Room in Washington, DC. Information on the operation of the Public Reference Room may be obtained by calling 1-800-SEC-0330.
A description of the policies and procedures that the fund uses to determine how to vote proxies relating to portfolio securities, and information regarding how the fund voted these proxies for the most recent 12-month period ended June 30 is available at http://www.dreyfus.com and on the SEC’s website at http://www.sec.gov. The description of the policies and procedures is also available without charge, upon request, by calling 1-800-DREYFUS.

|
| © 2012 MBSC Securities Corporation |
Dreyfus
Opportunistic
Midcap Value Fund
ANNUAL REPORT August 31, 2012

Save time. Save paper. View your next shareholder report online as soon as it’s available. Log into www.dreyfus.com and sign up for Dreyfus eCommunications. It’s simple and only takes a few minutes.
The views expressed in this report reflect those of the portfolio manager only through the end of the period covered and do not necessarily represent the views of Dreyfus or any other person in the Dreyfus organization. Any such views are subject to change at any time based upon market or other conditions and Dreyfus disclaims any responsibility to update such views.These views may not be relied on as investment advice and, because investment decisions for a Dreyfus fund are based on numerous factors, may not be relied on as an indication of trading intent on behalf of any Dreyfus fund.
Not FDIC-Insured • Not Bank-Guaranteed • May Lose Value
| |
| | Contents |
| |
| |
| | THE FUND |
| 2 | A Letter from the Chairman and CEO |
| 3 | Discussion of Fund Performance |
| 6 | Fund Performance |
| 8 | Understanding Your Fund’s Expenses |
| 8 | Comparing Your Fund’s Expenses |
| With Those of Other Funds |
| 9 | Statement of Investments |
| 13 | Statement of Assets and Liabilities |
| 14 | Statement of Operations |
| 15 | Statement of Changes in Net Assets |
| 17 | Financial Highlights |
| 20 | Notes to Financial Statements |
| 30 | Report of Independent Registered |
| | Public Accounting Firm |
| 31 | Important Tax Information |
| 32 | Proxy Results |
| 33 | Information About the Renewal of |
| | the Fund’s Management Agreement |
| 38 | Board Members Information |
| 40 | Officers of the Fund |
| |
| FOR MORE INFORMATION |
|
| | Back Cover |
Dreyfus
Opportunistic
Midcap Value Fund
The Fund

A LETTER FROM THE CHAIRMAN AND CEO
Dear Shareholder:
We are pleased to present this annual report for Dreyfus Opportunistic MidcapValue Fund, covering the 12-month period from September 1, 2011, through August 31, 2012. For information about how the fund performed during the reporting period, as well as general market perspectives, we provide a Discussion of Fund Performance on the pages that follow.
U.S. equities proved unusually volatile over the past year, as prices rose and fell according to investors’ changing expectations of global and domestic economic conditions. When viewed over a longer time frame, however, the pace of U.S. economic growth has been relatively consistent at about half the average rate achieved in prior recoveries. Even U.S. employment numbers, which have been volatile over short periods, averaged slightly better than 150,000 new jobs a month so far in 2012, roughly unchanged from the monthly average in 2011.
The sustained but subpar U.S. expansion appears likely to continue over the foreseeable future. On one hand, the economy has responded to a variety of stimulative measures, most notably an aggressively accommodative monetary policy. On the other hand, the prospect of automatic spending cuts and tax hikes scheduled for the end of 2012 has weighed on economic growth by contributing to a temporary postponement of spending decisions among consumers and businesses. Indeed, the ability of the U.S. political system to address both this “fiscal cliff” and long-term deficit reduction could go a long way toward shaping the 2013 market environment.As always, we urge you to speak regularly with your financial advisor to discuss how changing economic conditions may affect your investments.
Thank you for your continued confidence and support.

Jonathan R. Baum
Chairman and Chief Executive Officer
The Dreyfus Corporation
September 17, 2012
2

DISCUSSION OF FUND PERFORMANCE
For the period of September 1, 2011, through August 31, 2012, as provided by David A. Daglio, Primary Portfolio Manager
Fund and Market Performance Overview
For the 12-month period ended August 31, 2012, Dreyfus Opportunistic Midcap Value Fund’s Class A shares produced a total return of 13.44%, Class C shares returned 12.48% and Class I shares returned 13.71%.1 In comparison, the fund’s benchmark, the Russell MidcapValue Index (the “Index”), produced a 14.80% total return for the same period.2
Changing economic sentiment fueled heightened market volatility as stock market declines in September 2011 and during the spring of 2012 were more than offset by gains at other times of the reporting period. The fund produced lower returns than its benchmark, as gains in the consumer discretionary and materials areas could not offset shortfalls in the health care, financials and telecommunications services sectors.
The Fund’s Investment Approach
The fund seeks to surpass the performance of the Index by investing in midcap companies, which we consider as having market capitalizations between $1 billion and $25 billion at the time of purchase.We identify potential investments through extensive fundamental research conducted by the team’s dedicated sector specialists.
When selecting stocks, the fund will focus on individual stock selection, emphasizing three key factors: discount from intrinsic valuation, strong mid-cycle fundamentals and a revaluation catalyst.
We typically sell a stock when we no longer consider it attractively valued, it shows deteriorating fundamentals, the revaluation catalyst becomes impaired, or a better risk/reward opportunity is presented.
Markets Reacted to Shifting Macroeconomic Developments
The reporting period began in the midst of a major stock market decline. One credit-rating agency’s downgrade of long-term U.S. government debt, an intensifying debt crisis in Europe and inflation-fighting programs
The Fund 3
DISCUSSION OF FUND PERFORMANCE (continued)
in China in the weeks prior to the reporting period triggered a flight away from risky assets in September 2011. Fortunately, better U.S. economic data and remedial measures from European and Chinese policymakers arrested the decline during the fall.
By the beginning of 2012, U.S. stocks were rallying amid domestic employment gains, a quantitative easing program in Europe and less restrictive monetary and fiscal policies in China. Investors grew more tolerant of risks, focusing more intently on company fundamentals and less on macroeconomic news. However, these positive influences were called into question during the spring, when the U.S. labor market’s rebound slowed, measures designed to relieve fiscal pressures in Europe encountered resistance and the Chinese economy remained sluggish. The summer saw the market rally resume amid more encouraging economic data, and the Index ended the reporting period with double-digit gains.
Telecommunication Services and Technology Stocks Dampened Fund Results
Although the fund participated to a significant degree in the midcap market’s gains, its relative performance was hindered by unfortunate stock selection among the telecommunications services providers where rural carrier Frontier Communications proved too slow in executing a turnaround in properties acquired from a larger rival, Verizon Communications.Within technology, disappointing retail sales indicated a potential secular shift away from video games and triggered an elimination of Electronic Arts from the fund. Returns in the health care sector were restrained by laboratory services provider Thermo Fisher Scientific and specialty pharmaceuticals developer Warner Chilcott, when both posted disappointing sales.
The fund achieved better results in the consumer discretionary sector, where homebuilders D.R. Horton,Toll Brothers and PulteGroup climbed as the U.S. housing market showed long-awaited signs of strength. Similarly, carpet maker Mohawk Industries and home improvement retailer Lowe’s benefited from increased construction and renovation activity. Among media companies, CBS saw advertising revenues rise more than most analysts expected, and we sold the stock after it reached
4
a richer valuation. In the retail industry,Dicks Sporting Goods,The Gap and Williams-Sonoma achieved higher same-store sales comparisons.
The fund also fared well in the materials sector, where paint manufacturer Sherwin-Williams reorganized its cost structure and executed a turnaround in sales. Plastics maker LyondellBasell Industries gained value when input costs plunged along with natural gas prices. Finally, in the industrials sector, electrical equipment producers Hubbell and Regal-Beloit advanced amid a recovery in capital spending and construction.
Positioned for Moderate Growth
Although headwinds remain, we ended the reporting period with a guardedly optimistic outlook for the U.S. economy and midcap stocks. We have been especially encouraged by recent improvements in data related to homebuilding, automobile production and other areas where consumer spending is likely to grow. At the same time, valuations of midcap stocks have remained attractive relative to historical averages.
We have identified a number of stocks meeting our investment criteria in some of the market’s more economically sensitive areas, including the information technology, industrials and consumer discretionary sectors. We have found fewer opportunities in the REIT industry and the traditionally defensive utilities and telecommunications services sectors.
September 17, 2012
Please note, the position in any security highlighted with italicized typeface was sold during the reporting period.
Equity funds are subject generally to market, market sector, market liquidity, issuer and investment style risks, among other factors, to varying degrees, all of which are more fully described in the fund’s prospectus.
Stocks of small- and/or midcap companies often experience sharper price fluctuations than stocks of large-cap companies.
1 Total return includes reinvestment of dividends and any capital gains paid and does not take into
consideration the maximum initial sales charge in the case of Class A shares, or the applicable
contingent deferred sales charge imposed on redemptions in the case of Class C shares. Had these
charges been reflected, returns would have been lower. Past performance is no guarantee of future
results. Share price and investment return fluctuate such that upon redemption, fund shares may be
worth more or less than their original cost.
2 SOURCE: LIPPER INC. — Reflects reinvestment of dividends and, where applicable, capital
gain distributions.The Russell Midcap Value Index is a widely accepted, unmanaged index of
medium-cap stock market performance and measures the performance of those Russell midcap
companies with lower price-to-book ratios and lower forecasted growth values. Investors cannot
invest directly in any index.
The Fund 5
FUND PERFORMANCE
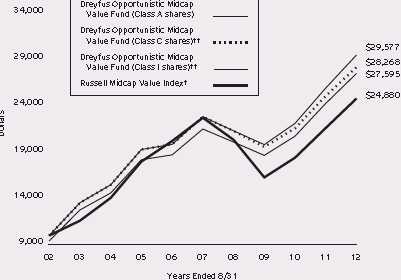
Comparison of change in value of $10,000 investment in Dreyfus Opportunistic Midcap Value Fund Class A shares, Class C shares and Class I shares and the Russell Midcap Value Index
† Source: Lipper Inc.
The total return figures presented for Class C shares of the fund reflect the performance of the fund’s Class A shares
for the period prior to 5/30/08 (the inception date for Class C shares), adjusted to reflect the applicable sales load for
that share class.
The total return figures presented for Class I shares of the fund reflect the performance of the fund’s Class A shares
for the period prior to 5/30/08 (the inception date for Class I shares).
Past performance is not predictive of future performance.
The above graph compares a $10,000 investment made in each of the Class A, Class C and Class I shares of Dreyfus
Opportunistic Midcap Value Fund on 8/31/02 to a $10,000 investment made in the Russell Midcap Value Index (the
“Index”) on that date.All dividends and capital gain distributions are reinvested.
The fund’s performance shown in the line graph above takes into account the maximum initial sales charge on Class A
shares and all other applicable fees and expenses on all classes.The Index is a widely accepted, unmanaged index of
medium-cap stock market performance and measures the performance of those Russell Midcap companies with lower price-
to-book ratios and lower forecasted growth values. Unlike a mutual fund, the Index is not subject to charges, fees and
other expenses. Investors cannot invest directly in any index. Further information relating to fund performance, including
expense reimbursements, if applicable, is contained in the Financial Highlights section of the prospectus and elsewhere in
this report.
6
| | | | | | | |
| Average Annual Total Returns as of 8/31/12 | | | | | | |
| |
| Inception |
| | Date | 1 | Year | 5 Years | | 10 Years | |
| Class A shares | | | | | | | |
| with maximum sales charge (5.75%) | 9/29/95 | 6.92 | % | 3.82 | % | 10.68 | % |
| without sales charge | 9/29/95 | 13.44 | % | 5.05 | % | 11.34 | % |
| Class C shares | | | | | | | |
| with applicable redemption charge † | 5/30/08 | 11.55 | % | 4.32 | %†† | 10.95 | %†† |
| without redemption | 5/30/08 | 12.48 | % | 4.32 | %†† | 10.95 | %†† |
| Class I shares | 5/30/08 | 13.71 | % | 5.27 | %†† | 11.45 | %†† |
| Russell Midcap Value Index | | 14.80 | % | 1.78 | % | 9.54 | % |
Past performance is not predictive of future performance.The fund’s performance shown in the graph and table does not
reflect the deduction of taxes that a shareholder would pay on fund distributions or the redemption of fund shares.
† The maximum contingent deferred sales charge for Class C shares is 1% for shares redeemed within one year of the
date of purchase.
††The total return performance figures presented for Class C shares of the fund reflect the performance of the fund’s
Class A shares for the period prior to 5/30/08 (the inception date for Class C shares), adjusted to reflect the
applicable sales load for that share class.
The total return performance figures presented for Class I shares of the fund reflect the performance of the fund’s
Class A shares for the period prior to 5/30/08 (the inception date for Class I shares).
The Fund 7
UNDERSTANDING YOUR FUND’S EXPENSES (Unaudited)
As a mutual fund investor, you pay ongoing expenses, such as management fees and other expenses. Using the information below, you can estimate how these expenses affect your investment and compare them with the expenses of other funds.You also may pay one-time transaction expenses, including sales charges (loads) and redemption fees, which are not shown in this section and would have resulted in higher total expenses. For more information, see your fund’s prospectus or talk to your financial adviser.
Review your fund’s expenses
The table below shows the expenses you would have paid on a $1,000 investment in Dreyfus Opportunistic Midcap Value Fund from March 1, 2012 to August 31, 2012. It also shows how much a $1,000 investment would be worth at the close of the period, assuming actual returns and expenses.
Expenses and Value of a $1,000 Investment
assuming actual returns for the six months ended August 31, 2012
| | | | | | |
| | | Class A | | Class C | | Class I |
| Expenses paid per $1,000† | | $6.10 | | $10.06 | | $4.74 |
| Ending value (after expenses) | | $1,004.90 | | $1,000.80 | | $1,006.30 |
COMPARING YOUR FUND’S EXPENSES WITH THOSE OF OTHER FUNDS (Unaudited)
Using the SEC’s method to compare expenses
The Securities and Exchange Commission (SEC) has established guidelines to help investors assess fund expenses. Per these guidelines, the table below shows your fund’s expenses based on a $1,000 investment, assuming a hypothetical 5% annualized return. You can use this information to compare the ongoing expenses (but not transaction expenses or total cost) of investing in the fund with those of other funds.All mutual fund shareholder reports will provide this information to help you make this comparison. Please note that you cannot use this information to estimate your actual ending account balance and expenses paid during the period.
Expenses and Value of a $1,000 Investment
assuming a hypothetical 5% annualized return for the six months ended August 31, 2012
| | | | | | |
| | | Class A | | Class C | | Class I |
| Expenses paid per $1,000† | | $6.14 | | $10.13 | | $4.77 |
| Ending value (after expenses) | | $1,019.05 | | $1,015.08 | | $1,020.41 |
† Expenses are equal to the fund’s annualized expense ratio of 1.21% for Class A, 2.00% for Class C and .94%
for Class I, multiplied by the average account value over the period, multiplied by 184/366 (to reflect the one-half
year period).
8
STATEMENT OF INVESTMENTS
August 31, 2012
| | | |
| Common Stocks—98.8% | Shares | | Value ($) |
| Automobiles & Components—4.1% | | | |
| BorgWarner | 225,140 | a | 15,485,129 |
| Dana Holding | 802,727 | | 10,965,251 |
| Delphi Automotive | 701,442 | | 21,246,678 |
| | | | 47,697,058 |
| Banks—2.9% | | | |
| Fifth Third Bancorp | 2,237,600 | | 33,877,264 |
| Capital Goods—10.9% | | | |
| Gardner Denver | 156,450 | | 9,430,806 |
| Ingersoll-Rand | 738,610 | | 34,537,404 |
| Masco | 1,207,650 | | 17,100,324 |
| Oshkosh | 213,400 | a | 5,407,556 |
| Parker Hannifin | 186,720 | | 14,933,866 |
| Regal-Beloit | 350,100 | | 23,827,806 |
| Trinity Industries | 756,640 | | 21,443,178 |
| | | | 126,680,940 |
| Commercial & Professional Services—4.3% | | | |
| Equifax | 483,200 | | 22,120,896 |
| Herman Miller | 235,960 | | 4,615,378 |
| Robert Half International | 891,200 | | 23,438,560 |
| | | | 50,174,834 |
| Consumer Durables & Apparel—13.0% | | | |
| D.R. Horton | 1,592,610 | | 30,243,664 |
| Mohawk Industries | 574,982 | a | 41,427,453 |
| Newell Rubbermaid | 2,063,660 | | 37,001,424 |
| Pulte Group | 837,650 | a | 11,459,052 |
| Toll Brothers | 937,690 | a | 30,681,217 |
| | | | 150,812,810 |
| Consumer Services—1.1% | | | |
| International Game Technology | 996,284 | | 12,244,330 |
| Diversified Financials—3.2% | | | |
| LPL Financial Holdings | 558,170 | | 16,002,734 |
| TD Ameritrade Holding | 1,215,440 | | 20,796,178 |
| | | | 36,798,912 |
The Fund 9
STATEMENT OF INVESTMENTS (continued)
| | | | |
| Common Stocks (continued) | Shares | | | Value ($) |
| Energy—3.6% | | | | |
| Cabot Oil & Gas | 401,710 | | | 16,634,811 |
| National Oilwell Varco | 83,430 | | | 6,574,284 |
| Pioneer Natural Resources | 185,730 | | | 18,082,673 |
| | | | | 41,291,768 |
| Health Care Equipment & Services—7.5% | | | | |
| CareFusion | 464,690 | a | | 12,207,406 |
| Cigna | 653,810 | | | 29,924,884 |
| MEDNAX | 353,060 | a | | 24,459,997 |
| | | |
| St. Jude Medical | 533,720 | | | 20,153,267 |
| | | | | 86,745,554 |
| Household & Personal Products—1.0% | | | | |
| Avon Products | 723,570 | | | 11,179,157 |
| Insurance—6.5% | | | | |
| Allstate | 213,750 | | | 7,968,600 |
| Arthur J. Gallagher & Co. | 929,360 | | | 33,196,739 |
| Brown & Brown | 233,650 | | | 6,130,976 |
| Principal Financial Group | 1,021,130 | | | 28,019,807 |
| | | | | 75,316,122 |
| Materials—4.5% | | | | |
| LyondellBasell Industries, Cl. A | 726,330 | | | 35,473,957 |
| Sherwin-Williams | 113,440 | | | 16,230,995 |
| | | | | 51,704,952 |
| Pharmaceuticals, Biotech & | | | | |
| Life Sciences—3.4% | | | | |
| | | | | |
| Cubist Pharmaceuticals | 134,320 | a | | 6,205,584 |
| Hospira | 332,390 | a | | 11,161,656 |
| Salix Pharmaceuticals | 301,940 | a | | 13,273,282 |
| United Therapeutics | 155,180 | a | | 8,398,342 |
| | | | | 39,038,864 |
| Real Estate—1.7% | | | | |
| CBRE Group, Cl. A | 934,452 | a | | 16,175,364 |
10
| | | | |
| Common Stocks (continued) | Shares | | | Value ($) |
| Real Estate (continued) | | | | |
| Jones Lang LaSalle | 56,210 | | | 4,054,427 |
| | | | | 20,229,791 |
| Retailing—6.2% | | | | |
| Gap | 392,020 | | | 14,042,156 |
| Lowe’s | 1,534,090 | | | 43,690,883 |
| Williams-Sonoma | 327,230 | | | 13,422,975 |
| | | | | 71,156,014 |
| Semiconductors & Semiconductor | | | | |
| Equipment—1.9% | | | | |
| Broadcom, Cl. A | 606,970 | a | | 21,565,644 |
| Software & Services—5.7% | | | | |
| Cognizant Technology Solutions, Cl. A | 263,460 | a | | 16,935,209 |
| Intuit | 478,880 | | | 28,033,635 |
| MICROS Systems | 418,510 | a | | 21,201,717 |
| | | | | 66,170,561 |
| Technology Hardware & Equipment—9.9% | | | | |
| Avnet | 1,064,573 | a | 34,289,896 |
| JDS Uniphase | 2,169,413 | a | | 24,275,731 |
| SanDisk | 412,310 | a | 16,995,418 |
| Seagate Technology | 802,160 | | | 25,677,142 |
| TE Connectivity | 368,380 | | | 12,955,925 |
| | | | | 114,194,112 |
| Transportation—5.9% | | | | |
| C.H. Robinson Worldwide | 453,930 | | | 25,696,977 |
| Con-way | 436,870 | | | 13,241,530 |
| Kirby | 564,870 | a | 29,740,406 |
| | | | | 68,678,913 |
| Utilities—1.5% | | | | |
| Great Plains Energy | 829,723 | | | 17,689,694 |
| Total Common Stocks | | | | |
| (cost $967,059,712) | | | | 1,143,247,294 |
The Fund 11
STATEMENT OF INVESTMENTS (continued)
| | | |
| Other Investment—1.2% | Shares | | Value ($) |
| Registered Investment Company; | | | |
| Dreyfus Institutional Preferred | | | |
| Plus Money Market Fund | | | |
| (cost $13,861,299) | 13,861,299 | b | 13,861,299 |
| |
| Total Investments (cost $980,921,011) | 100.0 | % | 1,157,108,593 |
| Cash and Receivables (Net) | .0 | % | 267,329 |
| Net Assets | 100.0 | % | 1,157,375,922 |
a Non-income producing security.
b Investment in affiliated money market mutual fund.
| | | |
| Portfolio Summary (Unaudited)† | | |
| |
| | Value (%) | | Value (%) |
| Consumer Durables & Apparel | 13.0 | Pharmaceuticals, | |
| Capital Goods | 10.9 | Biotech & Life Sciences | 3.4 |
| Technology Hardware & Equipment | 9.9 | Diversified Financials | 3.2 |
| Health Care Equipment & Services | 7.5 | Banks | 2.9 |
| Insurance | 6.5 | Semiconductors & | |
| Retailing | 6.2 | Semiconductor Equipment | 1.9 |
| Transportation | 5.9 | Real Estate | 1.7 |
| Software & Services | 5.7 | Utilities | 1.5 |
| Materials | 4.5 | Money Market Investment | 1.2 |
| Commercial & Professional Services | 4.3 | Consumer Services | 1.1 |
| Automobiles & Components | 4.1 | Household & Personal Products | 1.0 |
| Energy | 3.6 | | 100.0 |
| |
| † Based on net assets. | | | |
| See notes to financial statements. | | | |
12
STATEMENT OF ASSETS AND LIABILITIES
August 31, 2012
| | | | |
| | | Cost | Value | |
| Assets ($): | | | | |
| Investments in securities—See Statement of Investments: | | | |
| Unaffiliated issuers | | 967,059,712 | 1,143,247,294 | |
| Affiliated issuers | | 13,861,299 | 13,861,299 | |
| Cash | | | 2,982,140 | |
| Dividends receivable | | | 1,387,703 | |
| Receivable for shares of Common Stock subscribed | | 95,584 | |
| Prepaid expenses | | | 111,678 | |
| | | | 1,161,685,698 | |
| Liabilities ($): | | | | |
| Due to The Dreyfus Corporation and affiliates—Note 3(c) | | 1,027,393 | |
| Payable for shares of Common Stock redeemed | | | 2,794,575 | |
| Interest payable—Note 2 | | | 443 | |
| Accrued expenses | | | 487,365 | |
| | | | 4,309,776 | |
| Net Assets ($) | | | 1,157,375,922 | |
| Composition of Net Assets ($): | | | | |
| Paid-in capital | | | 1,031,529,660 | |
| Accumulated undistributed investment income—net | | | 2,942,182 | |
| Accumulated net realized gain (loss) on investments | | (53,283,502 | ) |
| Accumulated net unrealized appreciation | | | | |
| (depreciation) on investments | | | 176,187,582 | |
| Net Assets ($) | | | 1,157,375,922 | |
| |
| |
| Net Asset Value Per Share | | | | |
| | Class A | Class C | Class I | |
| Net Assets ($) | 979,628,192 | 22,537,680 | 155,210,050 | |
| Shares Outstanding | 33,242,005 | 798,522 | 5,283,496 | |
| Net Asset Value Per Share ($) | 29.47 | 28.22 | 29.38 | |
| |
| See notes to financial statements. | | | | |
The Fund 13
| | |
| STATEMENT OF OPERATIONS | | |
| Year Ended August 31, 2012 | | |
| |
| |
| |
| |
| Investment Income ($): | | |
| Income: | | |
| Cash dividends (net of $111,042 foreign taxes withheld at source): | | |
| Unaffiliated issuers | 16,815,795 | |
| Affiliated issuers | 6,462 | |
| Income from securities lending—Note 1(b) | 39,221 | |
| Total Income | 16,861,478 | |
| Expenses: | | |
| Management fee—Note 3(a) | 8,584,071 | |
| Shareholder servicing costs—Note 3(c) | 4,502,572 | |
| Prospectus and shareholders’ reports | 188,068 | |
| Distribution fees—Note 3(b) | 175,394 | |
| Professional fees | 96,827 | |
| Directors’ fees and expenses—Note 3(d) | 94,516 | |
| Registration fees | 88,000 | |
| Custodian fees—Note 3(c) | 87,825 | |
| Loan commitment fees—Note 2 | 12,314 | |
| Interest expense—Note 2 | 8,085 | |
| Miscellaneous | 42,394 | |
| Total Expenses | 13,880,066 | |
| Less—reduction in fees due to | | |
| earnings credits—Note 3(c) | (705 | ) |
| Net Expenses | 13,879,361 | |
| Investment Income—Net | 2,982,117 | |
| Realized and Unrealized Gain (Loss) on Investments—Note 4 ($): | | |
| Net realized gain (loss) on investments | (32,907,887 | ) |
| Net unrealized appreciation (depreciation) on investments | 167,437,544 | |
| Net Realized and Unrealized Gain (Loss) on Investments | 134,529,657 | |
| Net Increase in Net Assets Resulting from Operations | 137,511,774 | |
| |
| See notes to financial statements. | | |
14
STATEMENT OF CHANGES IN NET ASSETS
| | | | |
| | Year Ended August 31, | |
| | 2012 | | 2011 | |
| Operations ($): | | | | |
| Investment income—net | 2,982,117 | | 9,467,655 | |
| Net realized gain (loss) on investments | (32,907,887 | ) | 209,634,155 | |
| Net unrealized appreciation | | | | |
| (depreciation) on investments | 167,437,544 | | (44,876,492 | ) |
| Net Increase (Decrease) in Net Assets | | | | |
| Resulting from Operations | 137,511,774 | | 174,225,318 | |
| Dividends to Shareholders from ($): | | | | |
| Investment income—net: | | | | |
| Class A Shares | (6,968,729 | ) | — | |
| Class C Shares | (120,754 | ) | — | |
| Class I Shares | (1,673,307 | ) | — | |
| Net realized gain on investments: | | | | |
| Class A Shares | (146,600,210 | ) | — | |
| Class C Shares | (3,673,141 | ) | — | |
| Class I Shares | (20,560,305 | ) | — | |
| Total Dividends | (179,596,446 | ) | — | |
| Capital Stock Transactions ($): | | | | |
| Net proceeds from shares sold: | | | | |
| Class A Shares | 172,558,017 | | 432,391,865 | |
| Class C Shares | 7,073,356 | | 22,778,559 | |
| Class I Shares | 139,761,227 | | 112,663,999 | |
| Dividends reinvested: | | | | |
| Class A Shares | 146,128,147 | | — | |
| Class C Shares | 2,928,375 | | — | |
| Class I Shares | 19,261,309 | | — | |
| Cost of shares redeemed: | | | | |
| Class A Shares | (362,373,315 | ) | (628,571,460 | ) |
| Class C Shares | (8,788,493 | ) | (3,870,375 | ) |
| Class I Shares | (76,966,999 | ) | (39,986,018 | ) |
| Increase (Decrease) in Net Assets | | | | |
| from Capital Stock Transactions | 39,581,624 | | (104,593,430 | ) |
| Total Increase (Decrease) in Net Assets | (2,503,048 | ) | 69,631,888 | |
| Net Assets ($): | | | | |
| Beginning of Period | 1,159,878,970 | | 1,090,247,082 | |
| End of Period | 1,157,375,922 | | 1,159,878,970 | |
| Undistributed investment income—net | 2,942,182 | | 8,220,923 | |
The Fund 15
STATEMENT OF CHANGES IN NET ASSETS (continued)
| | | | |
| | Year Ended August 31, | |
| | 2012 | | 2011 | |
| Capital Share Transactions: | | | | |
| Class A | | | | |
| Shares sold | 5,929,326 | | 12,421,736 | |
| Shares issued for dividends reinvested | 5,708,411 | | — | |
| Shares redeemed | (12,297,778 | ) | (18,601,120 | ) |
| Net Increase (Decrease) in Shares Outstanding | (660,041 | ) | (6,179,384 | ) |
| Class C | | | | |
| Shares sold | 255,770 | | 655,348 | |
| Shares issued for dividends reinvested | 118,757 | | — | |
| Shares redeemed | (314,922 | ) | (116,712 | ) |
| Net Increase (Decrease) in Shares Outstanding | 59,605 | | 538,636 | |
| Class I | | | | |
| Shares sold | 4,601,410 | | 3,143,657 | |
| Shares issued for dividends reinvested | 755,923 | | — | |
| Shares redeemed | (2,638,026 | ) | (1,206,834 | ) |
| Net Increase (Decrease) in Shares Outstanding | 2,719,307 | | 1,936,823 | |
| |
| See notes to financial statements. | | | | |
16
FINANCIAL HIGHLIGHTS
The following tables describe the performance for each share class for the fiscal periods indicated.All information (except portfolio turnover rate) reflects financial results for a single fund share.Total return shows how much your investment in the fund would have increased (or decreased) during each period, assuming you had reinvested all dividends and distributions.These figures have been derived from the fund’s financial statements.
| | | | | | | | | |
| | | | Year Ended August 31, | | | |
| Class A Shares | 2012 | | 2011 | 2010 | | 2009 | | 2008 | a |
| Per Share Data ($): | | | | | | | | | |
| Net asset value, beginning of period | 31.19 | | 26.65 | 24.03 | | 25.95 | | 33.32 | |
| Investment Operations: | | | | | | | | | |
| Investment income (loss)—netb | .07 | | .22 | (.01 | ) | .09 | | .03 | |
| Net realized and unrealized | | | | | | | | | |
| gain (loss) on investments | 3.34 | | 4.32 | 2.70 | c | (1.98 | ) | (1.68 | ) |
| Total from Investment Operations | 3.41 | | 4.54 | 2.69 | | (1.89 | ) | (1.65 | ) |
| Distributions: | | | | | | | | | |
| Dividends from | | | | | | | | | |
| investment income—net | (.23 | ) | — | (.07 | ) | (.03 | ) | (.05 | ) |
| Dividends from net realized | | | | | | | | | |
| gain on investments | (4.90 | ) | — | — | | — | | (5.67 | ) |
| Total Distributions | (5.13 | ) | — | (.07 | ) | (.03 | ) | (5.72 | ) |
| Net asset value, end of period | 29.47 | | 31.19 | 26.65 | | 24.03 | | 25.95 | |
| Total Return (%)d | 13.44 | | 17.03 | 11.20 | | (7.22 | ) | (6.59 | ) |
| Ratios/Supplemental Data (%): | | | | | | | | | |
| Ratio of total expenses | | | | | | | | | |
| to average net assets | 1.22 | | 1.17 | 1.18 | | 1.23 | | 1.20 | |
| Ratio of net expenses | | | | | | | | | |
| to average net assets | 1.22 | | 1.17 | 1.18 | | 1.22 | | 1.20 | |
| Ratio of net investment income | | | | | | | | | |
| (loss) to average net assets | .25 | | .64 | (.02 | ) | .48 | | .10 | |
| Portfolio Turnover Rate | 71.25 | | 114.02 | 122.17 | | 170.88 | | 144.14 | |
| Net Assets, end of period | | | | | | | | | |
| ($ x 1,000) | 979,628 | | 1,057,495 | 1,068,338 | | 947,716 | | 776,889 | |
a The fund commenced offering three classes of shares on May 30, 2008 and existing shares were redesignated
Class A shares.
b Based on average shares outstanding at each month end.
c Amount includes litigation proceeds received by the fund amounting to $.02 per share.
d Exclusive of sales charge.
See notes to financial statements.
The Fund 17
FINANCIAL HIGHLIGHTS (continued)
| | | | | | | | | | |
| | | | Year Ended August 31, | | | |
| Class C Shares | 2012 | | 2011 | | 2010 | | 2009 | | 2008 | a |
| Per Share Data ($): | | | | | | | | | | |
| Net asset value, beginning of period | 30.24 | | 26.05 | | 23.72 | | 25.89 | | 28.17 | |
| Investment Operations: | | | | | | | | | | |
| Investment (loss)—netb | (.16 | ) | (.16 | ) | (.23 | ) | (.10 | ) | (.05 | ) |
| Net realized and unrealized | | | | | | | | | | |
| gain (loss) on investments | 3.20 | | 4.35 | | 2.67 | c | (1.99 | ) | (2.23 | ) |
| Total from Investment Operations | 3.04 | | 4.19 | | 2.44 | | (2.09 | ) | (2.28 | ) |
| Distributions: | | | | | | | | | | |
| Dividends from investment income—net | (.16 | ) | — | | (.11 | ) | (.08 | ) | — | |
| Dividends from net realized | | | | | | | | | | |
| gain on investments | (4.90 | ) | — | | — | | — | | — | |
| Total Distributions | (5.06 | ) | — | | (.11 | ) | (.08 | ) | — | |
| Net asset value, end of period | 28.22 | | 30.24 | | 26.05 | | 23.72 | | 25.89 | |
| Total Return (%)d | 12.48 | | 16.09 | | 10.29 | | (7.98 | ) | (8.55 | )e |
| Ratios/Supplemental Data (%): | | | | | | | | | | |
| Ratio of total expenses | | | | | | | | | | |
| to average net assets | 2.03 | | 2.00 | | 2.02 | | 1.88 | | 2.07 | f |
| Ratio of net expenses | | | | | | | | | | |
| to average net assets | 2.03 | | 2.00 | | 2.02 | | 1.88 | | 2.06 | f |
| Ratio of net investment (loss) | | | | | | | | | | |
| to average net assets | (.56 | ) | (.48 | ) | (.83 | ) | (.48 | ) | (.76 | )f |
| Portfolio Turnover Rate | 71.25 | | 114.02 | | 122.17 | | 170.88 | | 144.14 | |
| Net Assets, end of period ($ x 1,000) | 22,538 | | 22,343 | | 5,218 | | 1,398 | | 26 | |
a From May 30, 2008 (commencement of initial offering) to August 31, 2008.
b Based on average shares outstanding at each month end.
c Amount includes litigation proceeds received by the fund amounting to $.02 per share.
d Exclusive of sales charge.
e Not annualized.
f Annualized.
See notes to financial statements.
18
| | | | | | | | | |
| | | | Year Ended August 31, | | | |
| Class I Shares | 2012 | | 2011 | 2010 | | 2009 | | 2008 | a |
| Per Share Data ($): | | | | | | | | | |
| Net asset value, beginning of period | 31.21 | | 26.61 | 23.98 | | 25.95 | | 28.17 | |
| Investment Operations: | | | | | | | | | |
| Investment income—netb | .14 | | .18 | .10 | | .15 | | .00 | c |
| Net realized and unrealized | | | | | | | | | |
| gain (loss) on investments | 3.32 | | 4.42 | 2.69 | d | (2.02 | ) | (2.22 | ) |
| Total from Investment Operations | 3.46 | | 4.60 | 2.79 | | (1.87 | ) | (2.22 | ) |
| Distributions: | | | | | | | | | |
| Dividends from investment income—net | (.39 | ) | — | (.16 | ) | (.10 | ) | — | |
| Dividends from net realized | | | | | | | | | |
| gain on investments | (4.90 | ) | — | — | | — | | — | |
| Total Distributions | (5.29 | ) | — | (.16 | ) | (.10 | ) | — | |
| Net asset value, end of period | 29.38 | | 31.21 | 26.61 | | 23.98 | | 25.95 | |
| Total Return (%) | 13.71 | | 17.29 | 11.64 | | (7.05 | ) | (8.37 | )e |
| Ratios/Supplemental Data (%): | | | | | | | | | |
| Ratio of total expenses | | | | | | | | | |
| to average net assets | 1.00 | | .96 | .84 | | .84 | | 1.17 | f |
| Ratio of net expenses | | | | | | | | | |
| to average net assets | 1.00 | | .96 | .84 | | .83 | | 1.16 | f |
| Ratio of net investment income | | | | | | | | | |
| to average net assets | .48 | | .53 | .38 | | .69 | | .06 | f |
| Portfolio Turnover Rate | 71.25 | | 114.02 | 122.17 | | 170.88 | | 144.14 | |
| Net Assets, end of period ($ x 1,000) | 155,210 | | 80,041 | 16,691 | | 10,775 | | 9 | |
a From May 30, 2008 (commencement of initial offering) to August 31, 2008.
b Based on average shares outstanding at each month end.
c Amount represents less than $.01 per share.
d Amount includes litigation proceeds received by the fund amounting to $.02 per share.
e Not annualized.
f Annualized.
See notes to financial statements.
The Fund 19
NOTES TO FINANCIAL STATEMENTS
NOTE 1—Significant Accounting Policies:
Dreyfus Opportunistic Midcap Value Fund (the “fund”) is a separate diversified series of Advantage Funds, Inc. (the “Company”), which is registered under the Investment Company Act of 1940, as amended (the “Act”), as an open-end management investment company and operates as a series company offering thirteen series, including the fund. The fund’s investment objective seeks to surpass the performance of the Russell Midcap Value Index.The Dreyfus Corporation (the “Manager” or “Dreyfus”), a wholly-owned subsidiary of The Bank of New York Mellon Corporation (“BNY Mellon”), serves as the fund’s investment adviser.
MBSC Securities Corporation (the “Distributor”), a wholly-owned subsidiary of the Manager, is the distributor of the fund’s shares.The fund is authorized to issue 600 million shares of $.001 par value Common Stock.The fund currently offers three classes of shares: Class A (350 million shares authorized), Class C (125 million shares authorized) and Class I (125 million shares authorized). Class A shares are subject to a sales charge imposed at the time of purchase. Class C shares are subject to a contingent deferred sales charge (“CDSC”) imposed on Class C shares redeemed within one year of purchase. Class I shares are sold at net asset value per share only to institutional investors. Other differences between the classes include the services offered to and the expenses borne by each class, the allocation of certain transfer agency costs and certain voting rights. Income, expenses (other than expenses attributable to a specific class), and realized and unrealized gains or losses on investments are allocated to each class of shares based on its relative net assets.
The Company accounts separately for the assets, liabilities and operations of each series. Expenses directly attributable to each series are charged to that series’ operations; expenses which are applicable to all series are allocated among them on a pro rata basis.
20
The Financial Accounting Standards Board (“FASB”) Accounting Standards Codification is the exclusive reference of authoritative U.S. generally accepted accounting principles (“GAAP”) recognized by the FASB to be applied by nongovernmental entities. Rules and interpretive releases of the Securities and Exchange Commission (“SEC”) under authority of federal laws are also sources of authoritative GAAP for SEC registrants. The fund’s financial statements are prepared in accordance with GAAP, which may require the use of management estimates and assumptions.Actual results could differ from those estimates.
The Company enters into contracts that contain a variety of indemnifications.The fund’s maximum exposure under these arrangements is unknown.The fund does not anticipate recognizing any loss related to these arrangements.
(a) Portfolio valuation: The fair value of a financial instrument is the amount that would be received to sell an asset or paid to transfer a liability in an orderly transaction between market participants at the measurement date (i.e., the exit price). GAAP establishes a fair value hierarchy that prioritizes the inputs of valuation techniques used to measure fair value.This hierarchy gives the highest priority to unadjusted quoted prices in active markets for identical assets or liabilities (Level 1 measurements) and the lowest priority to unobservable inputs (Level 3 measurements).
Additionally, GAAP provides guidance on determining whether the volume and activity in a market has decreased significantly and whether such a decrease in activity results in transactions that are not orderly. GAAP requires enhanced disclosures around valuation inputs and techniques used during annual and interim periods.
The Fund 21
NOTES TO FINANCIAL STATEMENTS (continued)
Various inputs are used in determining the value of the fund’s investments relating to fair value measurements.These inputs are summarized in the three broad levels listed below:
Level 1—unadjusted quoted prices in active markets for identical investments.
Level 2—other significant observable inputs (including quoted prices for similar investments, interest rates, prepayment speeds, credit risk, etc.).
Level 3—significant unobservable inputs (including the fund’s own assumptions in determining the fair value of investments).
The inputs or methodology used for valuing securities are not necessarily an indication of the risk associated with investing in those securities.
Changes in valuation techniques may result in transfers in or out of an assigned level within the disclosure hierarchy. Valuation techniques used to value the fund’s investments are as follows:
Investments in securities are valued at the last sales price on the securities exchange or national securities market on which such securities are primarily traded. Securities listed on the National Market System for which market quotations are available are valued at the official closing price or, if there is no official closing price that day, at the last sales price. Securities not listed on an exchange or the national securities market, or securities for which there were no transactions, are valued at the average of the most recent bid and asked prices, except for open short positions, where the asked price is used for valuation purposes. Bid price is used when no asked price is available. Registered investment companies that are not traded on an exchange are valued at their net asset value.All of the preceding securities are categorized within Level 1 of the fair value hierarchy.
Fair valuing of securities may be determined with the assistance of a pricing service using calculations based on indices of domestic securities and other appropriate indicators, such as prices of relevant American Depository Receipts and financial futures. Utilizing these techniques may result in transfers between Level 1 and Level 2 of the fair value hierarchy.
22
When market quotations or official closing prices are not readily available, or are determined not to reflect accurately fair value, such as when the value of a security has been significantly affected by events after the close of the exchange or market on which the security is principally traded (for example, a foreign exchange or market), but before the fund calculates its net asset value, the fund may value these investments at fair value as determined in accordance with the procedures approved by the Company’s Board of Directors. Certain factors may be considered when fair valuing investments such as: fundamental analytical data, the nature and duration of restrictions on disposition, an evaluation of the forces that influence the market in which the securities are purchased and sold, and public trading in similar securities of the issuer or comparable issuers.These securities are either categorized as Level 2 or 3 depending on the relevant inputs used.
For restricted securities where observable inputs are limited, assumptions about market activity and risk are used and are categorized within Level 3 of the fair value hierarchy.
The following is a summary of the inputs used as of August 31, 2012 in valuing the fund’s investments:
| | | | |
| | | Level 2—Other | Level 3— | |
| | Level 1— | Significant | Significant | |
| | Unadjusted | Observable | Unobservable | |
| | Quoted Prices | Inputs | Inputs | Total |
| Assets ($) | | | | |
| Investments in Securities: | | | |
| Equity Securities— | | | | |
| Domestic† | 1,143,247,294 | — | — | 1,143,247,294 |
| Mutual Funds | 13,861,299 | — | — | 13,861,299 |
| † See Statement of Investments for additional detailed categorizations. | |
At August 31, 2012, there were no transfers between Level 1 and Level 2 of the fair value hierarchy.
(b) Securities transactions and investment income: Securities transactions are recorded on a trade date basis. Realized gains and losses from securities transactions are recorded on the identified cost basis.
The Fund 23
NOTES TO FINANCIAL STATEMENTS (continued)
Dividend income is recognized on the ex-dividend date and interest income, including, where applicable, accretion of discount and amortization of premium on investments, is recognized on the accrual basis.
Pursuant to a securities lending agreement withThe Bank of NewYork Mellon, a subsidiary of BNY Mellon and an affiliate of Dreyfus, the fund may lend securities to qualified institutions. It is the fund’s policy that, at origination, all loans are secured by collateral of at least 102% of the value of U.S. securities loaned and 105% of the value of foreign securities loaned. Collateral equivalent to at least 100% of the market value of securities on loan is maintained at all times. Collateral is either in the form of cash, which can be invested in certain money market mutual funds managed by the Manager, U.S. Government and Agency securities or letters of credit.The fund is entitled to receive all income on securities loaned, in addition to income earned as a result of the lending transaction. Although each security loaned is fully collateralized, the fund bears the risk of delay in recovery of, or loss of rights in, the securities loaned should a borrower fail to return the securities in a timely manner. During the period ended August 31, 2012,The Bank of New York Mellon earned $16,809 from lending portfolio securities, pursuant to the securities lending agreement.
(c) Affiliated issuers: Investments in other investment companies advised by Dreyfus are defined as “affiliated” in the Act. Investments in affiliated investment companies for the period ended August 31, 2012 were as follows:
| | | | | | |
| Affiliated | | | | | | |
| Investment | Value | | | Value | | Net |
| Company 8/31/2011 ($) | Purchases ($) | Sales ($) | 8/31/2012 | ($) | Assets (%) |
| Dreyfus | | | | | | |
| Institutional | | | | | | |
| Preferred | | | | | | |
| Plus Money | | | | | | |
| Market Fund | - | 367,073,617 | 353,212,318 | 13,861,299 | | 1.2 |
| Dreyfus | | | | | | |
| Institutional | | | | | | |
| Cash | | | | | | |
| Advantage | | | | | | |
| Fund | — | 728,602,956 | 728,602,956 | — | | — |
| Total | — | 1,095,676,573 | 1,081,815,274 | 13,861,299 | | 1.2 |
24
(d) Dividends to shareholders: Dividends are recorded on the ex-dividend date. Dividends from investment income-net and dividends from net realized capital gains, if any, are normally declared and paid annually, but the fund may make distributions on a more frequent basis to comply with the distribution requirements of the Internal Revenue Code of 1986, as amended (the “Code”).To the extent that net realized capital gains can be offset by capital loss carryovers, it is the policy of the fund not to distribute such gains. Income and capital gain distributions are determined in accordance with income tax regulations, which may differ from GAAP.
(e) Federal income taxes: It is the policy of the fund to continue to qualify as a regulated investment company, if such qualification is in the best interests of its shareholders, by complying with the applicable provisions of the Code, and to make distributions of taxable income sufficient to relieve it from substantially all federal income and excise taxes.
As of and during the period ended August 31, 2012, the fund did not have any liabilities for any uncertain tax positions.The fund recognizes interest and penalties, if any, related to uncertain tax positions as income tax expense in the Statement of Operations. During the period, the fund did not incur any interest or penalties.
Each of the tax years in the four-year period ended August 31, 2012 remains subject to examination by the Internal Revenue Service and state taxing authorities.
At August 31, 2012, the components of accumulated earnings on a tax basis were as follows: undistributed ordinary income $2,942,182, accumulated capital losses $40,595,062 and unrealized appreciation $163,499,142.
Under the Regulated Investment Company Modernization Act of 2010 (the “2010 Act”), the fund is permitted to carry forward capital losses incurred in taxable years beginning after December 22, 2010 (“post-enactment losses”) for an unlimited period. Furthermore, post-enactment capital loss carryovers retain their character as either short-
The Fund 25
NOTES TO FINANCIAL STATEMENTS (continued)
term or long-term capital losses rather than short-term as they were under previous statute.The 2010 Act requires post-enactment losses to be utilized before the utilization of losses incurred in taxable years prior to the effective date of the 2010 Act (“pre-enactment losses”).
The accumulated capital loss carryover is available for federal income tax purposes to be applied against future net realized capital gains, if any, realized subsequent to August 31, 2012.The fund has $40,595,062 of post-enactment short-term capital losses that can be carried forward for an unlimited period.
The tax character of distributions paid to shareholders during the fiscal periods ended August 31, 2012 and August 31, 2011 were as follows: ordinary income $23,015,709 and $0 and long-term capital gains $156,580,737 and $0, respectively.
During the period ended August 31, 2012, as a result of permanent book to tax differences, primarily due to the tax treatment for limited partnerships and dividend reclassification, the fund increased accumulated undistributed investment income-net by $501,932, decreased accumulated net realized gain (loss) on investments by $24,609 and decreased paid-in capital by $477,323. Net assets and net asset value per share were not affected by this reclassification.
NOTE 2—Bank Lines of Credit:
The fund participates with other Dreyfus-managed funds in a $225 million unsecured credit facility led by Citibank, N.A. and a $300 million unsecured credit facility provided by The Bank of New York Mellon (each, a “Facility”), each to be utilized primarily for temporary or emergency purposes, including the financing of redemptions. In connection therewith, the fund has agreed to pay its pro rata portion of commitment fees for each Facility. Interest is charged to the fund based on rates determined pursuant to the terms of the respective Facility at the time of borrowing.
26
The average amount of borrowings outstanding under the Facilities during the period ended August 31, 2012 was approximately $642,100, with a related weighted average annualized interest rate of 1.26%.
NOTE 3—Management Fee and Other Transactions With Affiliates:
(a) Pursuant to a management agreement with the Manager, the management fee is computed at the annual rate of .75% of the value of the fund’s average daily net assets and is payable monthly.
During the period ended August 31, 2012, the Distributor retained $18,097 from commissions earned on sales of the fund’s Class A shares and $10,611 from CDSCs on redemptions of the fund’s Class C shares.
(b) Under the Distribution Plan adopted pursuant to Rule 12b-1 under the Act, Class C shares pay the Distributor for distributing its shares at an annual rate of .75% of the value of its average daily net assets. During the period ended August 31, 2012, Class C shares were charged $175,394, pursuant to the Distribution Plan.
(c) Under the Shareholder Services Plan, Class A and Class C shares pay the Distributor at an annual rate of .25% of the value of their average daily net assets for the provision of certain services.The services provided may include personal services relating to shareholder accounts, such as answering shareholder inquiries regarding the fund and providing reports and other information, and services related to the maintenance of shareholder accounts.The Distributor may make payments to Service Agents (securities dealers, financial institutions or other industry professionals) in respect of these services.The Distributor determines the amounts to be paid to Service Agents. During the period ended August 31, 2012, Class A and Class C shares were charged $2,455,177 and $58,465, respectively, pursuant to the Shareholder Services Plan.
The Fund 27
NOTES TO FINANCIAL STATEMENTS (continued)
The fund has arrangements with the transfer agent and the custodian whereby the fund may receive earnings credits when positive cash balances are maintained, which are used to offset transfer agency and custody fees. For financial reporting purposes, the fund includes net earnings credits as an expense offset in the Statement of Operations.
The fund compensates DreyfusTransfer, Inc. (“DTI”), a wholly-owned subsidiary of the Manager, under a transfer agency agreement for providing transfer agency services for the fund and, since May 29, 2012, cash management services related to fund subscriptions and redemptions. During the period ended August 31, 2012, the fund was charged $163,019 for transfer agency services and $2,092 for cash management services. Cash management fees were partially offset by earnings credits of $247.These fees are included in Shareholder servicing costs in the Statement of Operations.
The fund compensatesThe Bank of NewYork Mellon under a custody agreement for providing custodial services for the fund. During the period ended August 31, 2012, the fund was charged $87,825 pursuant to the custody agreement.
Prior to May 29, 2012, the fund compensated The Bank of New York Mellon under a cash management agreement for performing cash management services related to fund subscriptions and redemptions. During the period ended August 31, 2012, the fund was charged $16,479 pursuant to the cash management agreement, which is included in Shareholder servicing costs in the Statement of Operations.These fees were partially offset by earnings credits of $458.
28
During the period ended August 31, 2012, the fund was charged $6,392 for services performed by the Chief Compliance Officer and his staff.
The components of “Due to The Dreyfus Corporation and affiliates” in the Statement of Assets and Liabilities consist of: management fees $724,661, Distribution Plan fees $14,736, Shareholder Services Plan fees $209,156, custodian fees $31,082, Chief Compliance Officer fees $4,243 and transfer agency per account fees $43,515.
(d) Each Board member also serves as a Board member of other funds within the Dreyfus complex. Annual retainer fees and attendance fees are allocated to each fund based on net assets.
NOTE 4—Securities Transactions:
The aggregate amount of purchases and sales of investment securities, excluding short-term securities, during the period ended August 31, 2012, amounted to $814,824,679 and $959,756,572, respectively.
At August 31, 2012, the cost of investments for federal income tax purposes was $993,609,451; accordingly, accumulated net unrealized appreciation on investments was $163,499,142, consisting of $197,623,743 gross unrealized appreciation and $34,124,601 gross unrealized depreciation.
The Fund 29
REPORT OF INDEPENDENT REGISTERED
PUBLIC ACCOUNTING FIRM
Shareholders and Board of Directors Dreyfus Opportunistic Midcap Value Fund
We have audited the accompanying statement of assets and liabilities, including the statement of investments, of Dreyfus Opportunistic Midcap Value Fund (one of the series comprising Advantage Funds, Inc.) as of August 31, 2012, and the related statement of operations for the year then ended, the statement of changes in net assets for each of the two years in the period then ended, and the financial highlights for each of the periods indicated therein. These financial statements and financial highlights are the responsibility of the Fund’s management. Our responsibility is to express an opinion on these financial statements and financial highlights based on our audits.
We conducted our audits in accordance with the standards of the Public Company Accounting Oversight Board (United States).Those standards require that we plan and perform the audit to obtain reasonable assurance about whether the financial statements and financial highlights are free of material misstatement.We were not engaged to perform an audit of the Fund’s internal control over financial reporting. Our audits included consideration of internal control over financial reporting as a basis for designing audit procedures that are appropriate in the circumstances, but not for the purpose of expressing an opinion on the effectiveness of the Fund’s internal control over financial reporting.Accordingly, we express no such opinion.An audit also includes examining, on a test basis, evidence supporting the amounts and disclosures in the financial statements and financial highlights, assessing the accounting principles used and significant estimates made by management, and evaluating the overall financial statement presentation. Our procedures included confirmation of securities owned as of August 31, 2012 by correspondence with the custodian and others.We believe that our audits provide a reasonable basis for our opinion.
In our opinion, the financial statements and financial highlights referred to above present fairly, in all material respects, the financial position of Dreyfus Opportunistic MidcapValue Fund at August 31, 2012, the results of its operations for the year then ended, the changes in its net assets for each of the two years in the period then ended, and the financial highlights for each of the indicated periods, in conformity with U.S. generally accepted accounting principles.

New York, New York
October 29, 2012
30
IMPORTANT TAX INFORMATION (Unaudited)
For federal tax purposes, the fund hereby reports 61.60% of the ordinary dividends paid during the fiscal year ended August 31, 2012 as qualifying for the corporate dividends received deduction. Also certain dividends paid by the fund may be subject to a maximum tax rate of 15%, as provided for by the Jobs and Growth Tax Relief Reconciliation Act of 2003. Of the distributions paid during the fiscal year, $22,948,939 represents the maximum amount that may be considered qualified dividend income.The fund also hereby reports $.4088 per share as a short-term capital gain distribution and $4.4916 per share as a long-term capital gain distribution paid on December 16, 2011. Shareholders will receive notification in early 2013 of the percentage applicable to the preparation of their 2012 income tax returns.
The Fund 31
PROXY RESULTS (Unaudited)
The Company held a special meeting of shareholders on August 3, 2012.The proposal considered at the meeting, and the results, are as follows:
| | | |
| | | Shares | |
| | Votes For | | Authority Withheld |
| To elect additional Board Members: | | | |
| Lynn Martin† | 90,334,756 | | 3,252,629 |
| Robin A. Melvin† | 90,449,622 | | 3,137,763 |
| Philip L. Toia† | 90,229,928 | | 3,357,457 |
† Each new Board Member’s term commenced on September 1, 2012.
In addition Peggy C. Davis, Joseph S. DiMartino, David P. Feldman, Ehud Houminer and Dr. Martin Peretz continue
as Board Members of the Company.
32
INFORMATION ABOUT THE RENEWAL OF THE
FUND’S MANAGEMENT AGREEMENT (Unaudited)
At a meeting of the fund’s Board of Directors held on March 6, 2012, the Board considered the renewal of the fund’s Management Agreement pursuant to which Dreyfus provides the fund with investment advisory and administrative services (the “Agreement”). The Board members, none of whom are “interested persons” (as defined in the Investment Company Act of 1940, as amended) of the fund, were assisted in their review by independent legal counsel and met with counsel in executive session separate from Dreyfus representatives. In considering the renewal of the Agreement, the Board considered all factors that it believed to be relevant, including those discussed below.The Board did not identify any one factor as dispositive, and each Board member may have attributed different weights to the factors considered.
Analysis of Nature, Extent, and Quality of Services Provided to the Fund.The Board considered information previously provided to them in presentations from Dreyfus representatives regarding the nature, extent, and quality of the services provided to funds in the Dreyfus fund complex, and Dreyfus representatives confirmed that there had been no material changes in this information. Dreyfus provided the number of open accounts in the fund, the fund’s asset size and the allocation of fund assets among distribution channels. Dreyfus also had previously provided information regarding the diverse intermediary relationships and distribution channels of funds in the Dreyfus fund complex and Dreyfus’ corresponding need for broad, deep, and diverse resources to be able to provide ongoing shareholder services to each distribution channel, including the distribution channel(s) for the fund.
The Board also considered research support available to, and portfolio management capabilities of, the fund’s portfolio management personnel and that Dreyfus also provides oversight of day-to-day fund operations, including fund accounting and administration and assistance in meeting legal and regulatory requirements.The Board also considered Dreyfus’ extensive administrative, accounting, and compliance infrastructures. The Board also considered portfolio management’s brokerage policies and practices (including policies and practices regarding soft dollars) and the standards applied in seeking best execution.
The Fund 33
INFORMATION ABOUT THE RENEWAL OF THE FUND’S
MANAGEMENT AGREEMENT (Unaudited) (continued)
Comparative Analysis of the Fund’s Performance and Management Fee and Expense Ratio.The Board reviewed reports prepared by Lipper, Inc. (“Lipper”), an independent provider of investment company data, which included information comparing (1) the fund’s performance with the performance of a group of comparable funds (the “Performance Group”) and with a broader group of funds (the “Performance Universe”), all for various periods ended December 31, 2011, and (2) the fund’s actual and contractual management fees and total expenses with those of a group of comparable funds (the “Expense Group”) and with a broader group of funds (the “Expense Universe”), the information for which was derived in part from fund financial statements available to Lipper as of the date of its analysis. Dreyfus previously had furnished the Board with a description of the methodology Lipper used to select the Performance Group and Performance Universe and the Expense Group and Expense Universe.
Dreyfus representatives stated that the usefulness of performance comparisons may be affected by a number of factors, including different investment limitations that may be applicable to the fund and comparison funds.They also noted that performance generally should be considered over longer periods of time, although it is possible that long-term performance can be adversely affected by even one period of significant underperformance so that a single investment decision or theme has the ability to affect disproportionately long-term performance. The Board discussed the results of the comparisons and noted that the fund’s total return performance was above the Performance Group and Performance Universe medians, except for the one- and two-year periods when the fund’s performance was below the Performance Universe median. Dreyfus also provided a comparison of the fund’s calendar year total returns to the returns of the fund’s benchmark index.
The Board also reviewed the range of actual and contractual management fees and total expenses of the Expense Group and Expense Universe funds and discussed the results of the comparisons.The Board noted that the fund’s contractual management fee was below the Expense Group median, the fund’s actual management fee was at the
34
Expense Group median and above the Expense Universe median and the fund’s total expenses were below the Expense Group and Expense Universe medians.
Dreyfus representatives reviewed with the Board the management or investment advisory fees (1) paid by funds advised or administered by Dreyfus that are in the same Lipper category as the fund and (2) paid to Dreyfus or the Dreyfus-affiliated primary employer of the fund’s primary portfolio manager(s) for advising any separate accounts and/or other types of client portfolios that are considered to have similar investment strategies and policies as the fund (the “Similar Clients”), and explained the nature of the Similar Clients.They discussed differences in fees paid and the relationship of the fees paid in light of any differences in the services provided and other relevant factors. The Board considered the relevance of the fee information provided for the Similar Clients to evaluate the appropriateness and reasonableness of the fund’s management fee.
Analysis of Profitability and Economies of Scale. Dreyfus representatives reviewed the expenses allocated and profit received by Dreyfus and the resulting profitability percentage for managing the fund, and the method used to determine the expenses and profit. The Board concluded that the profitability results were not unreasonable, given the services rendered and service levels provided by Dreyfus. The Board previously had been provided with information prepared by an independent consulting firm regarding Dreyfus’ approach to allocating costs to, and determining the profitability of, individual funds and the entire Dreyfus fund complex. The consulting firm also had analyzed where any economies of scale might emerge in connection with the management of a fund.
The Board’s counsel stated that the Board should consider the profitability analysis (1) as part of their evaluation of whether the fees under the Agreement bear a reasonable relationship to the mix of services provided by Dreyfus, including the nature, extent and quality of such services, and (2) in light of the relevant circumstances for the
The Fund 35
INFORMATION ABOUT THE RENEWAL OF THE FUND’S
MANAGEMENT AGREEMENT (Unaudited) (continued)
fund and the extent to which economies of scale would be realized if the fund grows and whether fee levels reflect these economies of scale for the benefit of fund shareholders. Dreyfus representatives noted that a discussion of economies of scale is predicated on a fund having achieved a substantial size with increasing assets and that, if a fund’s assets had been stable or decreasing, the possibility that Dreyfus may have realized any economies of scale would be less. Dreyfus representatives also noted that, as a result of shared and allocated costs among funds in the Dreyfus fund complex, the extent of economies of scale could depend substantially on the level of assets in the complex as a whole, so that increases and decreases in complex-wide assets can affect potential economies of scale in a manner that is disproportionate to, or even in the opposite direction from, changes in the fund’s asset level.The Board also considered potential benefits to Dreyfus from acting as investment adviser and noted the soft dollar arrangements in effect for trading the fund’s investments.
At the conclusion of these discussions, the Board agreed that it had been furnished with sufficient information to make an informed business decision with respect to the renewal of the Agreement. Based on the discussions and considerations as described above, the Board concluded and determined as follows.
The Board concluded that the nature, extent and quality of the services provided by Dreyfus are adequate and appropriate.
The Board was satisfied with the fund’s performance.
The Board concluded that the fee paid to Dreyfus was reasonable in light of the considerations described above.
The Board determined that the economies of scale which may accrue to Dreyfus and its affiliates in connection with the management of the fund had been adequately considered by Dreyfus in connection with the fee rate charged to the fund pursuant to the Agreement and that, to the extent in the future it were determined that material economies of scale had not been shared with the fund, the Board would seek to have those economies of scale shared with the fund.
36
The Board considered these conclusions and determinations, along with information received on a routine and regular basis throughout the year. In addition, it should be noted that the Board’s consideration of the contractual fee arrangements for this fund had the benefit of a number of years of reviews of prior or similar agreements during which lengthy discussions took place between the Board and Dreyfus representatives. Certain aspects of the arrangements may receive greater scrutiny in some years than in others, and the Board’s conclusions may be based, in part, on their consideration of the same or similar arrangements in prior years.The Board determined that renewal of the Agreement was in the best interests of the fund and its shareholders.
The Fund 37
BOARD MEMBERS INFORMATION (Unaudited)
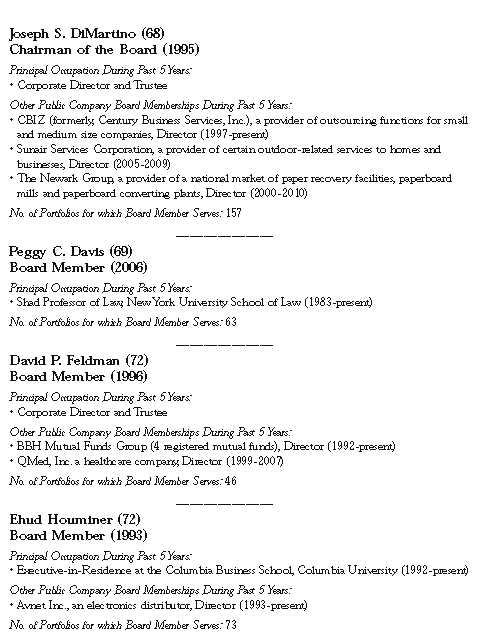
38
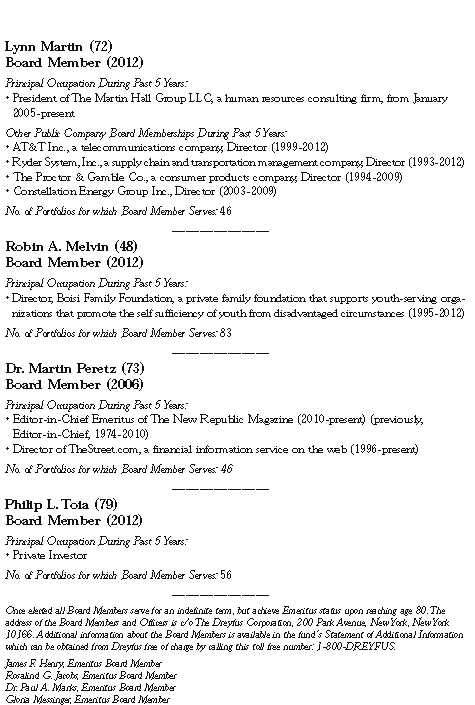
The Fund 39
OFFICERS OF THE FUND (Unaudited)
40
The Fund 41
For More Information
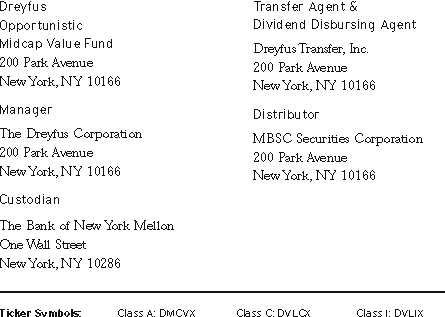
Telephone Call your financial representative or 1-800-DREYFUS
Mail The Dreyfus Family of Funds, 144 Glenn Curtiss Boulevard, Uniondale, NY 11556-0144
The fund files its complete schedule of portfolio holdings with the Securities and Exchange Commission (“SEC”) for the first and third quarters of each fiscal year on Form N-Q. The fund’s Forms N-Q are available on the SEC’s website at http://www.sec.gov and may be reviewed and copied at the SEC’s Public Reference Room in Washington, DC. Information on the operation of the Public Reference Room may be obtained by calling 1-800-SEC-0330.
A description of the policies and procedures that the fund uses to determine how to vote proxies relating to portfolio securities, and information regarding how the fund voted these proxies for the most recent 12-month period ended June 30 is available at http://www.dreyfus.com and on the SEC’s website at http://www.sec.gov. The description of the policies and procedures is also available without charge, upon request, by calling 1-800-DREYFUS.

|
| © 2012 MBSC Securities Corporation |
Dreyfus
Opportunistic
Small Cap Fund
ANNUAL REPORT August 31, 2012

Save time. Save paper. View your next shareholder report online as soon as it’s available. Log into www.dreyfus.com and sign up for Dreyfus eCommunications. It’s simple and only takes a few minutes.
The views expressed in this report reflect those of the portfolio manager only through the end of the period covered and do not necessarily represent the views of Dreyfus or any other person in the Dreyfus organization. Any such views are subject to change at any time based upon market or other conditions and Dreyfus disclaims any responsibility to update such views.These views may not be relied on as investment advice and, because investment decisions for a Dreyfus fund are based on numerous factors, may not be relied on as an indication of trading intent on behalf of any Dreyfus fund.
Not FDIC-Insured • Not Bank-Guaranteed • May Lose Value
| |
| | Contents |
| |
| |
| | THE FUND |
| 2 | A Letter from the Chairman and CEO |
| 3 | Discussion of Fund Performance |
| 6 | Fund Performance |
| 7 | Understanding Your Fund’s Expenses |
| 7 | Comparing Your Fund’s Expenses |
| With Those of Other Funds |
| 8 | Statement of Investments |
| 12 | Statement of Assets and Liabilities |
| 13 | Statement of Operations |
| 14 | Statement of Changes in Net Assets |
| 15 | Financial Highlights |
| 16 | Notes to Financial Statements |
| 26 | Report of Independent Registered |
| | Public Accounting Firm |
| 27 | Important Tax Information |
| 28 | Proxy Results |
| 29 | Information About the Renewal of |
| | the Fund’s Management Agreement |
| 34 | Board Members Information |
| 36 | Officers of the Fund |
| |
| FOR MORE INFORMATION |
|
| | Back Cover |
Dreyfus
Opportunistic
Small Cap Fund
The Fund

A LETTER FROM THE CHAIRMAN AND CEO
Dear Shareholder:
We are pleased to present this annual report for Dreyfus Opportunistic Small Cap Fund, covering the 12-month period from September 1, 2011, through August 31, 2012. For information about how the fund performed during the reporting period, as well as general market perspectives, we provide a Discussion of Fund Performance on the pages that follow.
U.S. equities proved unusually volatile over the past year, as prices rose and fell according to investors’ changing expectations of global and domestic economic conditions. When viewed over a longer time frame, however, the pace of U.S. economic growth has been relatively consistent at about half the average rate achieved in prior recoveries. Even U.S. employment numbers, which have been volatile over short periods, averaged slightly better than 150,000 new jobs a month so far in 2012, roughly unchanged from the monthly average in 2011.
The sustained but subpar U.S. expansion appears likely to continue over the foreseeable future. On one hand, the economy has responded to a variety of stimulative measures, most notably an aggressively accommodative monetary policy. On the other hand, the prospect of automatic spending cuts and tax hikes scheduled for the end of 2012 has weighed on economic growth by contributing to a temporary postponement of spending decisions among consumers and businesses. Indeed, the ability of the U.S. political system to address both this “fiscal cliff” and long-term deficit reduction could go a long way toward shaping the 2013 market environment.As always, we urge you to speak regularly with your financial advisor to discuss how changing economic conditions may affect your investments.
Thank you for your continued confidence and support.

Jonathan R. Baum
Chairman and Chief Executive Officer
The Dreyfus Corporation
September 17, 2012
2

DISCUSSION OF FUND PERFORMANCE
For the period of September 1, 2011, through August 31, 2012, as provided by David A. Daglio, Primary Portfolio Manager
Fund and Market Performance Overview
For the 12-month period ended August 31, 2012, Dreyfus Opportunistic Small Cap Fund produced a total return of 18.81%.1 In comparison, the Russell 2000 Index (the “Index”) produced a total return of 13.40%.The Russell 2000 Value Index returned 14.08% for the same reporting period.2 Changing economic sentiment fueled heightened market volatility as stock market declines in September 2011 and during the spring of 2012 were more than offset by gains at other times of the reporting period. The fund produced higher returns than its benchmark, largely due to favorable stock selections in the consumer discretionary, information technology and materials sectors.
The Fund’s Investment Approach
The fund seeks capital appreciation. The fund normally invests at least 80% of its assets in the stocks of small cap companies. Stocks are selected for the fund’s portfolio based primarily on bottom-up fundamental analysis.The fund’s team of portfolio managers use a disciplined investment process that relies, in general, on proprietary fundamental research and valuation. Generally, elements of the process include analysis of mid-cycle business prospects, estimation of the intrinsic value of the company and the identification of a revaluation trigger. Intrinsic value is based on the combination of the valuation assessment of the company’s operating divisions with the firm’s economic balance sheet. Mid-cycle estimates, growth prospects and competitive advantages are some of the factors used in the valuation assessment.A company’s stated and hidden liabilities and assets are included in the portfolio manager’s economic balance sheet calculation. Sector overweights and underweights are a function of the relative attractiveness of securities within the fund’s investable universe. The fund’s portfolio managers invest in stocks that they believe have attractive reward to risk opportunities and may actively adjust the fund’s portfolio to reflect new developments.
TheFund 3
DISCUSSION OF FUND PERFORMANCE (continued)
Markets Reacted to Shifting Macroeconomic Developments
The reporting period began in the midst of a major stock market decline. One credit-rating agency’s downgrade of long-term U.S. government debt, an intensifying debt crisis in Europe and inflation-fighting programs in China in the weeks prior to the reporting period triggered a flight away from risky assets in September 2011. Fortunately, better U.S. economic data and remedial measures from European and Chinese policymakers arrested the decline during the fall.
By the beginning of 2012, U.S. stocks were rallying amid domestic employment gains, a quantitative easing program in Europe and less restrictive monetary and fiscal policies in China. Investors grew more tolerant of risks, focusing more intently on company fundamentals and less on macroeconomic news. However, these positive influences were called into question during the spring, when the U.S. labor market’s rebound slowed, measures designed to relieve fiscal pressures in Europe encountered resistance and the Chinese economy remained sluggish. The summer saw the market rally resume amid more encouraging economic data, and the Russell 2000 Index ended the reporting period with double-digit gains.
Consumer Discretionary and Technology Stocks Supported Fund Results
In this tumultuous environment, the fund benefited from its security selections in the consumer discretionary sector, where we focused on companies with brands we considered undervalued. For example, apparel maker Fifth & Pacific gained value as investors recognized the intrinsic values of its Kate Spade, Lucky Brand and Juicy Couture segments. Likewise,The Jones Group advanced on the strength of its Jones New York and Nine West product lines. Also in the consumer discretionary sector, homebuilders climbed as the U.S. housing market showed long-awaited signs of strength, driving Standard Pacific and Meritage Homes higher. Gaming equipment maker Shuffle Master encountered rising demand from new casinos and existing ones upgrading their facilities.
A number of holdings in the technology sector delivered on the team’s investment thesis. Dealer Track Holdings, a software company which provides inventory management and financing software for automobile dealerships benefited from rising car sales and a higher level of financing activity.Wright Express, a company which provides processing services to lower fleet vehicle energy and fraud expense saw high demand for its expense management capabilities.
4
The fund also fared well in the materials sector, where plastics manufacturers Georgia Gulf and Omnova Solutions gained value when input costs plunged along with natural gas prices.
Disappointments during the reporting period were concentrated in the industrials sector, where truck axle manufacturer Meritor failed to realize expected improvements in operating efficiencies and pricing power. Satellite imaging provider GeoEye was hurt by defense spending cutbacks. In the financials sector, PrivateBancorp struggled with heavier-than-expected losses in its mortgage portfolio. Finally, the fund did not participate fully in gains among real estate investment trusts (REITs), which we regarded as overvalued.
Positioned for Moderate Growth
Although headwinds remain, we ended the reporting period with a guardedly optimistic outlook for the U.S. economy and small-cap stocks. We have been especially encouraged by recent improvements in data related to homebuilding, automobile production and other areas where consumer spending is likely to grow. At the same time, valuations of small-cap stocks have remained attractive relative to historical averages.
We have identified a number of stocks meeting our investment criteria in some of the market’s more economically sensitive areas, including the information technology, industrials and consumer discretionary sectors. We have found fewer opportunities in the traditionally defensive utilities, consumer staples and telecommunications services sectors.
September 17, 2012
Please note, the position in any security highlighted with italicized typeface was sold during
the period.
Equity funds are subject generally to market, market sector, market liquidity, issuer and investment
style risks, among other factors, to varying degrees, all of which are more fully described in the
fund’s prospectus.
Stocks of small cap companies often experience sharper price fluctuations than stocks of
large-cap companies.
1 Total return includes reinvestment of dividends and any capital gains paid. Past performance is no
guarantee of future results. Share price and investment return fluctuate such that upon redemption
fund shares may be worth more or less than their original cost.
2 SOURCE: LIPPER INC. — Reflects the reinvestment of dividends and, where applicable,
capital gain distributions.The Russell 2000 Index is an unmanaged index of small-cap stock
performance and is composed of the 2,000 smallest companies in the Russell 3000 Index.The
Russell 3000 Index is composed of the 3,000 largest U.S. companies based on total market
capitalization.The Russell 2000 Value Index is an unmanaged index, which measures the
performance of those Russell 2000 companies with lower price-to-book ratios and lower forecasted
growth values. Investors cannot invest directly in any index.
TheFund 5
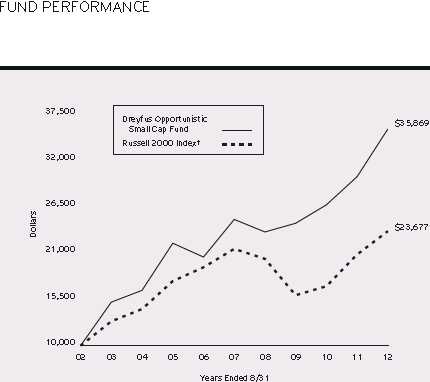
Comparison of change in value of $10,000 investment in Dreyfus Opportunistic Small Cap Fund
and the Russell 2000 Index
| | | | | | |
| Average Annual Total Returns as of 8/31/12 | | | | | |
| | 1 | Year | 5 Years | | 10 Years | |
| Fund | 18.81 | % | 7.42 | % | 13.62 | % |
| Russell 2000 Index | 13.40 | % | 1.90 | % | 9.00 | % |
† Source: Lipper Inc.
Past performance is not predictive of future performance.The fund’s performance shown in the graph and table does not
reflect the deduction of taxes that a shareholder would pay on fund distributions or the redemption of fund shares.
The above graph compares a $10,000 investment made in Dreyfus Opportunistic Small Cap Fund on 8/31/02 to a
$10,000 investment made in the Russell 2000 Index (the “Index”) on that date.All dividends and capital gain
distributions are reinvested.
The fund’s performance shown in the line graph above takes into account all applicable fees and expenses.The Index is
an unmanaged index of small-cap stock performance and is composed of the 2,000 smallest companies in the Russell
3000 Index.The Russell 3000 Index is composed of the 3,000 largest U.S. companies based on total market
capitalization. Unlike a mutual fund, the Index is not subject to charges, fees and other expenses. Investors cannot invest
directly in any index. Further information relating to fund performance, including expense reimbursements, if applicable, is
contained in the Financial Highlights section of the prospectus and elsewhere in this report.
6
UNDERSTANDING YOUR FUND’S EXPENSES (Unaudited)
As a mutual fund investor, you pay ongoing expenses, such as management fees and other expenses. Using the information below, you can estimate how these expenses affect your investment and compare them with the expenses of other funds.You also may pay one-time transaction expenses, including sales charges (loads) and redemption fees, which are not shown in this section and would have resulted in higher total expenses. For more information, see your fund’s prospectus or talk to your financial adviser.
Review your fund’s expenses
The table below shows the expenses you would have paid on a $1,000 investment in Dreyfus Opportunistic Small Cap Fund from March 1, 2012 to August 31, 2012. It also shows how much a $1,000 investment would be worth at the close of the period, assuming actual returns and expenses.
Expenses and Value of a $1,000 Investment
assuming actual returns for the six months ended August 31, 2012
| | |
| Expenses paid per $1,000† | $ | 5.97 |
| Ending value (after expenses) | $ | 1,014.40 |
COMPARING YOUR FUND’S EXPENSES WITH THOSE OF OTHER FUNDS (Unaudited)
Using the SEC’s method to compare expenses
The Securities and Exchange Commission (SEC) has established guidelines to help investors assess fund expenses. Per these guidelines, the table below shows your fund’s expenses based on a $1,000 investment, assuming a hypothetical 5% annualized return. You can use this information to compare the ongoing expenses (but not transaction expenses or total cost) of investing in the fund with those of other funds.All mutual fund shareholder reports will provide this information to help you make this comparison. Please note that you cannot use this information to estimate your actual ending account balance and expenses paid during the period.
Expenses and Value of a $1,000 Investment
assuming a hypothetical 5% annualized return for the six months ended August 31, 2012
| | |
| Expenses paid per $1,000† | $ | 5.99 |
| Ending value (after expenses) | $ | 1,019.20 |
† Expenses are equal to the fund’s annualized expense ratio of 1.18%, multiplied by the average account value over
the period, multiplied by 184/366 (to reflect the one-half year period).
TheFund 7
STATEMENT OF INVESTMENTS
August 31, 2012
| | | | |
| Common Stocks—99.5% | Shares | | | Value ($) |
| Automobiles & Components—3.5% | | | | |
| American Axle & Manufacturing Holdings | 699,343 | a | | 7,811,661 |
| Dana Holding | 791,220 | | | 10,808,065 |
| Tower International | 321,915 | a | | 2,424,020 |
| | | |
| | | | | 21,043,746 |
| Banks—2.7% | | | | |
| First Commonwealth Financial | 1,125,360 | | | 7,832,506 |
| Hancock Holding | 194,860 | | | 5,775,650 |
| SCBT Financial | 66,280 | | | 2,665,119 |
| | | | | 16,273,275 |
| Capital Goods—7.7% | | | | |
| Columbus McKinnon | 210,958 | a | | 3,126,398 |
| Commercial Vehicle Group | 194,364 | a | | 1,642,376 |
| Granite Construction | 485,250 | | | 13,378,342 |
| Orion Marine Group | 353,000 | a | | 2,689,860 |
| Oshkosh | 263,300 | a | | 6,672,022 |
| Trinity Industries | 456,190 | | | 12,928,425 |
| Watts Water Technologies, Cl. A | 151,776 | | | 5,562,590 |
| | | | | 46,000,013 |
| Commercial & Professional Services—7.3% | | | | |
| Equifax | 119,560 | | | 5,473,457 |
| Herman Miller | 194,633 | | | 3,807,021 |
| ICF International | 92,764 | a | | 2,044,519 |
| Portfolio Recovery Associates | 157,863 | a | | 15,841,552 |
| Steelcase, Cl. A | 1,101,090 | | | 10,680,573 |
| TrueBlue | 366,270 | a | | 5,688,173 |
| | | | | 43,535,295 |
| Consumer Durables & Apparel—12.5% | | | | |
| Fifth & Pacific | 1,140,275 | a,b | | 15,108,644 |
| Jones Group | 1,625,230 | b | | 20,591,664 |
| Meritage Homes | 322,600 | a | | 12,023,302 |
| Mohawk Industries | 111,250 | a | | 8,015,562 |
| Newell Rubbermaid | 172,820 | | | 3,098,663 |
| Standard Pacific | 2,321,830 | a,b | | 15,556,261 |
| | | | | 74,394,096 |
8
| | | | |
| Common Stocks (continued) | Shares | | | Value ($) |
| Consumer Services—1.5% | | | | |
| Scientific Games, Cl. A | 465,430 | a | | 3,411,602 |
| Shuffle Master | 364,992 | a | | 5,536,929 |
| | | | | 8,948,531 |
| Diversified Financials—2.7% | | | | |
| DFC Global | 219,915 | a | | 4,094,817 |
| LPL Financial Holdings | 208,030 | | | 5,964,220 |
| Nelnet, Cl. A | 235,656 | | | 5,643,961 |
| | | | | 15,702,998 |
| Energy—2.8% | | | | |
| Approach Resources | 163,700 | a,b | | 4,704,738 |
| Gulfport Energy | 103,363 | a | | 2,718,447 |
| PDC Energy | 328,979 | a | | 9,155,486 |
| | | | | 16,578,671 |
| Food, Beverage & Tobacco—.7% | | | | |
| Dole Food | 312,800 | a,b | | 4,028,864 |
| Health Care Equipment & Services—6.1% | | | | |
| Align Technology | 183,690 | a,b | | 6,236,275 |
| Hanger | 649,291 | a | | 18,576,216 |
| Merit Medical Systems | 792,860 | a | | 11,298,255 |
| | | | | 36,110,746 |
| Insurance—4.3% | | | | |
| Arthur J. Gallagher & Co. | 136,550 | | | 4,877,566 |
| Brown & Brown | 526,750 | | | 13,821,920 |
| Employers Holdings | 365,100 | | | 6,655,773 |
| | | | | 25,355,259 |
| Materials—5.1% | | | | |
| Georgia Gulf | 251,911 | | | 9,985,752 |
| Innospec | 257,260 | a | | 8,093,400 |
| Omnova Solutions | 389,250 | a | | 3,032,257 |
| Zoltek | 1,098,765 | a,b | | 9,372,465 |
| | | | | 30,483,874 |
| Pharmaceuticals, Biotech & Life Sciences—3.9% | | | | |
| Auxilium Pharmaceuticals | 264,020 | a | | 6,151,666 |
| Emergent BioSolutions | 740,206 | a | | 10,903,234 |
TheFund 9
STATEMENT OF INVESTMENTS (continued)
| | | | |
| Common Stocks (continued) | Shares | | | Value ($) |
| Pharmaceuticals, Biotech & | | | | |
| Life Sciences (continued) | | | | |
| Salix Pharmaceuticals | 144,680 | a | | 6,360,133 |
| | | | | 23,415,033 |
| Real Estate—3.1% | | | | |
| Jones Lang LaSalle | 138,946 | | | 10,022,175 |
| St. Joe | 157,960 | a,b | | 3,028,093 |
| Starwood Property Trust | 230,290 | c | | 5,423,329 |
| | | | | 18,473,597 |
| Retailing—2.6% | | | | |
| Gordmans Stores | 147,863 | a | | 2,599,432 |
| Williams-Sonoma | 318,470 | | | 13,063,639 |
| | | | | 15,663,071 |
| Semiconductors & Semiconductor | | | | |
| Equipment—3.5% | | | | |
| Applied Micro Circuits | 2,166,280 | a | | 11,069,691 |
| Microsemi | 499,780 | a | | 9,950,620 |
| | | | | 21,020,311 |
| Software & Services—15.6% | | | | |
| Cardtronics | 99,940 | a | | 2,823,305 |
| CoreLogic | 241,750 | a | | 5,947,050 |
| CSG Systems International | 598,138 | a | | 12,686,507 |
| DealerTrack Holdings | 554,591 | a | | 15,356,625 |
| Kenexa | 230,470 | a | | 10,564,745 |
| LogMeIn | 239,220 | a | | 5,258,056 |
| MICROS Systems | 230,600 | a | | 11,682,196 |
| Take-Two Interactive Software | 345,650 | a | | 3,542,913 |
| Velti | 1,484,601 | a,b | | 10,288,285 |
| Wright Express | 220,640 | a | | 14,526,938 |
| | | | | 92,676,620 |
| Technology Hardware & Equipment—7.3% | | | | |
| Arrow Electronics | 178,310 | a | | 6,463,737 |
| Brocade Communications Systems | 994,760 | a | | 5,769,608 |
| JDS Uniphase | 893,800 | a | | 10,001,622 |
| ScanSource | 467,110 | a | | 14,125,406 |
| Vishay Intertechnology | 756,180 | a | | 7,229,081 |
| | | | | 43,589,454 |
10
| | | | |
| Common Stocks (continued) | Shares | | Value ($) | |
| Transportation—6.6% | | | | |
| Arkansas Best | 371,920 | | 3,414,226 | |
| Avis Budget Group | 180,520 | a | 2,964,138 | |
| Con-way | 242,480 | | 7,349,569 | |
| Landstar System | 234,787 | | 11,098,381 | |
| UTi Worldwide | 1,047,490 | | 14,382,038 | |
| | | | 39,208,352 | |
| Total Common Stocks | | | | |
| (cost $498,241,226) | | | 592,501,806 | |
| |
| Investment of Cash Collateral | | | | |
| for Securities Loaned—7.9% | | | | |
| Registered Investment Company; | | | | |
| Dreyfus Institutional Cash Advantage Fund | | | | |
| (cost $46,673,549) | 46,673,549 | d | 46,673,549 | |
| Total Investments (cost $544,914,775) | 107.4 | % | 639,175,355 | |
| Liabilities, Less Cash and Receivables | (7.4 | %) | (43,838,085 | ) |
| Net Assets | 100.0 | % | 595,337,270 | |
a Non-income producing security.
b Security, or portion thereof, on loan.At August 31, 2012, the value of the fund’s securities on loan was
$46,371,245 and the value of the collateral held by the fund was $46,673,549.
c Investment in real estate investment trust.
d Investment in affiliated money market mutual fund.
| | | |
| Portfolio Summary (Unaudited)† | | |
| |
| Value (%) | | Value (%) |
| Software & Services | 15.6 | Automobiles & Components | 3.5 |
| Consumer Durables & Apparel | 12.5 | Semiconductors & | |
| Money Market Investment | 7.9 | Semiconductor Equipment | 3.5 |
| Capital Goods | 7.7 | Real Estate | 3.1 |
| Commercial & Professional Services | 7.3 | Energy | 2.8 |
| Technology Hardware & Equipment | 7.3 | Banks | 2.7 |
| Transportation | 6.6 | Diversified Financials | 2.7 |
| Health Care Equipment & Services | 6.1 | Retailing | 2.6 |
| Materials | 5.1 | Consumer Services | 1.5 |
| Insurance | 4.3 | Food, Beverage & Tobacco | .7 |
| Pharmaceuticals, Biotech & Life Sciences | 3.9 | | 107.4 |
| |
| † Based on net assets. | | | |
| See notes to financial statements. | | | |
TheFund 11
STATEMENT OF ASSETS AND LIABILITIES
August 31, 2012
| | | |
| | Cost | Value | |
| Assets ($): | | | |
| Investments in securities—See Statement of Investments (including | | | |
| securities on loan, valued at $46,371,245)—Note 1(b): | | | |
| Unaffiliated issuers | 498,241,226 | 592,501,806 | |
| Affiliated issuers | 46,673,549 | 46,673,549 | |
| Receivable for investment securities sold | | 4,365,506 | |
| Dividends and securities lending income receivable | | 236,274 | |
| Receivable for shares of Common Stock subscribed | | 77,753 | |
| Prepaid expenses | | 20,924 | |
| | | 643,875,812 | |
| Liabilities ($): | | | |
| Due to The Dreyfus Corporation and affiliates—Note 3(b) | | 570,477 | |
| Cash overdraft due to Custodian | | 485,009 | |
| Liability for securities on loan—Note 1(b) | | 46,673,549 | |
| Payable for shares of Common Stock redeemed | | 523,828 | |
| Payable for investment securities purchased | | 102,370 | |
| Interest payable—Note 2 | | 42 | |
| Accrued expenses | | 183,267 | |
| | | 48,538,542 | |
| Net Assets ($) | | 595,337,270 | |
| Composition of Net Assets ($): | | | |
| Paid-in capital | | 555,318,841 | |
| Accumulated net realized gain (loss) on investments | | (54,242,151 | ) |
| Accumulated net unrealized appreciation | | | |
| (depreciation) on investments | | 94,260,580 | |
| Net Assets ($) | | 595,337,270 | |
| Shares Outstanding | | | |
| (100 million shares of $.001 par value Common Stock authorized) | | 22,879,465 | |
| Net Asset Value, offering and redemption price per share ($) | | 26.02 | |
| |
| See notes to financial statements. | | | |
12
| | |
| STATEMENT OF OPERATIONS | | |
| Year Ended August 31, 2012 | | |
| |
| |
| |
| |
| Investment Income ($): | | |
| Income: | | |
| Cash dividends: | | |
| Unaffiliated issuers | 3,584,922 | |
| Affiliated issuers | 3,926 | |
| Income from securities lending—Note 1(b) | 302,965 | |
| Total Income | 3,891,813 | |
| Expenses: | | |
| Management fee—Note 3(a) | 4,371,005 | |
| Shareholder servicing costs—Note 3(b) | 2,189,259 | |
| Prospectus and shareholders’ reports | 101,115 | |
| Professional fees | 94,725 | |
| Custodian fees—Note 3(b) | 56,809 | |
| Directors’ fees and expenses—Note 3(c) | 42,581 | |
| Registration fees | 33,557 | |
| Interest expense—Note 2 | 11,127 | |
| Loan commitment fees—Note 2 | 4,661 | |
| Miscellaneous | 10,532 | |
| Total Expenses | 6,915,371 | |
| Less—reduction in fees due to earnings credits—Note 3(b) | (943 | ) |
| Net Expenses | 6,914,428 | |
| Investment (Loss)—Net | (3,022,615 | ) |
| Realized and Unrealized Gain (Loss) on Investments—Note 4 ($): | | |
| Net realized gain (loss) on investments | (24,260,541 | ) |
| Net unrealized appreciation (depreciation) on investments | 126,620,523 | |
| Net Realized and Unrealized Gain (Loss) on Investments | 102,359,982 | |
| Net Increase in Net Assets Resulting from Operations | 99,337,367 | |
| |
| See notes to financial statements. | | |
TheFund 13
STATEMENT OF CHANGES IN NET ASSETS
| | | | |
| | Year Ended August 31, | |
| | 2012 | | 2011 | |
| Operations ($): | | | | |
| Investment (loss)—net | (3,022,615 | ) | (1,685,870 | ) |
| Net realized gain (loss) on investments | (24,260,541 | ) | 67,079,551 | |
| Net unrealized appreciation | | | | |
| (depreciation) on investments | 126,620,523 | | (20,018,223 | ) |
| Net Increase (Decrease) in Net Assets | | | | |
| Resulting from Operations | 99,337,367 | | 45,375,458 | |
| Dividends to Shareholders from ($): | | | | |
| Investment income—net | — | | (69,299 | ) |
| Net realized gain on investments | (60,726,622 | ) | (11,365,014 | ) |
| Total Dividends | (60,726,622 | ) | (11,434,313 | ) |
| Capital Stock Transactions ($): | | | | |
| Net proceeds from shares sold | 101,890,997 | | 419,140,444 | |
| Net assets received in connection | | | | |
| with reorganization—Note 1 | 93,191,816 | | — | |
| Dividends reinvested | 49,552,789 | | 9,688,846 | |
| Cost of shares redeemed | (261,807,519 | ) | (365,811,210 | ) |
| Increase (Decrease) in Net Assets | | | | |
| from Capital Stock Transactions | (17,171,917 | ) | 63,018,080 | |
| Total Increase (Decrease) in Net Assets | 21,438,828 | | 96,959,225 | |
| Net Assets ($): | | | | |
| Beginning of Period | 573,898,442 | | 476,939,217 | |
| End of Period | 595,337,270 | | 573,898,442 | |
| Capital Share Transactions (Shares): | | | | |
| Shares sold | 4,090,655 | | 14,251,667 | |
| Shares received in connection | | | | |
| with reorganization—Note 1 | 4,283,529 | | — | |
| Shares issued for dividends reinvested | 2,248,324 | | 328,681 | |
| Shares redeemed | (10,786,839 | ) | (12,745,878 | ) |
| Net Increase (Decrease) in Shares Outstanding | (164,331 | ) | 1,834,470 | |
| See notes to financial statements. | | | | |
14
FINANCIAL HIGHLIGHTS
The following table describes the performance for the fiscal periods indicated. Total return shows how much your investment in the fund would have increased (or decreased) during each period, assuming you had reinvested all dividends and distributions.These figures have been derived from the fund’s financial statements.
| | | | | | | | | | |
| | | | Year Ended August 31, | | | |
| | 2012 | | 2011 | | 2010 | | 2009 | | 2008 | |
| Per Share Data ($): | | | | | | | | | | |
| Net asset value, beginning of period | 24.90 | | 22.49 | | 20.65 | | 20.20 | | 27.07 | |
| Investment Operations: | | | | | | | | | | |
| Investment income (loss)—neta | (.13 | ) | (.07 | ) | (.04 | ) | (.00 | )b | .06 | |
| Net realized and unrealized | | | | | | | | | | |
| gain (loss) on investments | 4.27 | | 2.97 | | 1.88 | | .73 | | (1.52 | ) |
| Total from Investment Operations | 4.14 | | 2.90 | | 1.84 | | .73 | | (1.46 | ) |
| Distributions: | | | | | | | | | | |
| Dividends from investment income—net | — | | (.00 | )b | — | | (.16 | ) | (.10 | ) |
| Dividends from net realized | | | | | | | | | | |
| gain on investments | (3.02 | ) | (.49 | ) | — | | (.12 | ) | (5.31 | ) |
| Total Distributions | (3.02 | ) | (.49 | ) | — | | (.28 | ) | (5.41 | ) |
| Net asset value, end of period | 26.02 | | 24.90 | | 22.49 | | 20.65 | | 20.20 | |
| Total Return (%) | 18.81 | | 12.57 | | 8.91 | | 4.50 | | (6.04 | ) |
| Ratios/Supplemental Data (%): | | | | | | | | | | |
| Ratio of total expenses | | | | | | | | | | |
| to average net assets | 1.19 | | 1.16 | | 1.22 | | 1.38 | | 1.23 | |
| Ratio of net expenses | | | | | | | | | | |
| to average net assets | 1.19 | | 1.16 | | 1.22 | | 1.37 | | 1.23 | |
| Ratio of net investment income | | | | | | | | | | |
| (loss) to average net assets | (.52 | ) | (.23 | ) | (.15 | ) | (.00 | )c | .26 | |
| Portfolio Turnover Rate | 85.92 | | 123.29 | | 128.47 | | 194.30 | | 175.45 | |
| Net Assets, end of period ($ x 1,000) | 595,337 | | 573,898 | | 476,939 | | 199,399 | | 103,181 | |
a Based on average shares outstanding at each month end.
b Amount represents less than $.01 per share.
c Amount represents less than .01%.
See notes to financial statements.
TheFund 15
NOTES TO FINANCIAL STATEMENTS
NOTE 1—Significant Accounting Policies:
Dreyfus Opportunistic Small Cap Fund (the “fund”) is a separate diversified series of Advantage Funds, Inc. (the “Company”), which is registered under the Investment Company Act of 1940, as amended (the “Act”), as an open-end management investment company and operates as a series company that offers thirteen series, including the fund.The fund’s investment objective is to seek capital appreciation.The Dreyfus Corporation (the “Manager” or “Dreyfus”), a wholly-owned subsidiary of The Bank of New York Mellon Corporation (“BNY Mellon”), serves as the fund’s investment adviser. MBSC Securities Corporation (the “Distributor”), a wholly-owned subsidiary of the Manager, is the distributor of the fund’s shares, which are sold to existing shareholders without a sales charge.
As of the close of business on December 15, 2011, pursuant to an Agreement and Plan of Reorganization previously approved by the Company’s Board of Directors, all of the assets, subject to the liabilities, of Dreyfus Emerging Leaders Fund (“Emerging Leaders”) were transferred to the fund in exchange for shares of Common Stock of the fund of equal value.The purpose of the transaction was to combine two funds with comparable investment objectives and strategies. Shareholders of Emerging Leaders received shares of the fund in an amount equal to the aggregate net asset value of their investment in Emerging Leaders at the time of the exchange. The exchange ratio was .79 to 1. The net asset value of the fund’s shares on the close of business December 15, 2011, after the reorganization was $21.75 and a total of 4,283,529 shares were issued to shareholders of Emerging Leaders in the exchange. The exchange was a tax-free event to the Emerging Leaders shareholders.
The net unrealized appreciation/(depreciation) on investments and net assets prior to the acquisition as of the merger date for Emerging Leaders and the fund, were as follows:
| | | |
| | Unrealized Appreciation | | |
| | (Depreciation) ($) | | Net Assets ($) |
| Emerging Leaders | (9,873,385 | ) | 93,191,816 |
| Dreyfus Opportunistic Small Cap Fund | 10,470,123 | | 478,805,539 |
| Total | 596,738 | | 571,997,355 |
16
Assuming the merger had been completed on September 1, 2011, the fund’s pro forma results in the Statement of Operations during the period ended August 31, 2012 would have been as follows:
| | | |
| Net investment (loss) | $ | (3,316,503 | )1 |
| Net realized and unrealized gain (loss) on investments | | 101,639,0212 | |
| Net increase (decrease) in net assets | | | |
| resulting from operations | | 98,322,518 | |
1 ($3,022,615) as reported in the Statement of Operations plus ($293,888) Emerging Leaders
pre-merger.
2 $102,359,982 as reported in the Statement of Operations plus ($720,961) Emerging Leaders
pre-merger.
Because the combined funds have been managed as a single integrated fund since the merger was completed, it is not practicable to separate the amounts of revenue and earnings of Emerging Leaders that have been included in the fund’s Statement of Operations during the period ended August 31, 2012.
The Company accounts separately for the assets, liabilities and operations of each series. Expenses directly attributable to each series are charged to that series’ operations; expenses which are applicable to all series are allocated among them on a pro rata basis.
The Financial Accounting Standards Board (“FASB”) Accounting Standards Codification is the exclusive reference of authoritative U.S. generally accepted accounting principles (“GAAP”) recognized by the FASB to be applied by nongovernmental entities. Rules and interpretive releases of the Securities and Exchange Commission (“SEC”) under authority of federal laws are also sources of authoritative GAAP for SEC registrants. The fund’s financial statements are prepared in accordance with GAAP, which may require the use of management estimates and assumptions.Actual results could differ from those estimates.
The Company enters into contracts that contain a variety of indemnifications.The fund’s maximum exposure under these arrangements is unknown.The fund does not anticipate recognizing any loss related to these arrangements.
TheFund 17
NOTES TO FINANCIAL STATEMENTS (continued)
(a) Portfolio valuation: The fair value of a financial instrument is the amount that would be received to sell an asset or paid to transfer a liability in an orderly transaction between market participants at the measurement date (i.e., the exit price). GAAP establishes a fair value hierarchy that prioritizes the inputs of valuation techniques used to measure fair value.This hierarchy gives the highest priority to unadjusted quoted prices in active markets for identical assets or liabilities (Level 1 measurements) and the lowest priority to unobservable inputs (Level 3 measurements).
Additionally, GAAP provides guidance on determining whether the volume and activity in a market has decreased significantly and whether such a decrease in activity results in transactions that are not orderly. GAAP requires enhanced disclosures around valuation inputs and techniques used during annual and interim periods.
Various inputs are used in determining the value of the fund’s investments relating to fair value measurements.These inputs are summarized in the three broad levels listed below:
Level 1—unadjusted quoted prices in active markets for identical investments.
Level 2—other significant observable inputs (including quoted prices for similar investments, interest rates, prepayment speeds, credit risk, etc.).
Level 3—significant unobservable inputs (including the fund’s own assumptions in determining the fair value of investments).
The inputs or methodology used for valuing securities are not necessarily an indication of the risk associated with investing in those securities.
Changes in valuation techniques may result in transfers in or out of an assigned level within the disclosure hierarchy. Valuation techniques used to value the fund’s investments are as follows:
Investments in securities are valued at the last sales price on the securities exchange or national securities market on which such securities are primarily traded. Securities listed on the National Market System
18
for which market quotations are available are valued at the official closing price or, if there is no official closing price that day, at the last sales price. Securities not listed on an exchange or the national securities market, or securities for which there were no transactions, are valued at the average of the most recent bid and asked prices, except for open short positions, where the asked price is used for valuation purposes. Bid price is used when no asked price is available. Registered investment companies that are not traded on an exchange are valued at their net asset value. All of the preceding securities are categorized within Level 1 of the fair value hierarchy.
Fair valuing of securities may be determined with the assistance of a pricing service using calculations based on indices of domestic securities and other appropriate indicators, such as prices of relevant American Depository Receipts and financial futures. Utilizing these techniques may result in transfers between Level 1 and Level 2 of the fair value hierarchy.
When market quotations or official closing prices are not readily available, or are determined not to reflect accurately fair value, such as when the value of a security has been significantly affected by events after the close of the exchange or market on which the security is principally traded (for example, a foreign exchange or market), but before the fund calculates its net asset value, the fund may value these investments at fair value as determined in accordance with the procedures approved by the Company’s Board of Directors. Certain factors may be considered when fair valuing investments such as: fundamental analytical data, the nature and duration of restrictions on disposition, an evaluation of the forces that influence the market in which the securities are purchased and sold, and public trading in similar securities of the issuer or comparable issuers.These securities are either categorized as Level 2 or 3 depending on the relevant inputs used.
For restricted securities where observable inputs are limited, assumptions about market activity and risk are used and are categorized within Level 3 of the fair value hierarchy.
TheFund 19
NOTES TO FINANCIAL STATEMENTS (continued)
The following is a summary of the inputs used as of August 31, 2012 in valuing the fund’s investments:
| | | | |
| | | Level 2—Other | Level 3— | |
| | Level 1— | Significant | Significant | |
| | Unadjusted | Observable | Unobservable | |
| | Quoted Prices | Inputs | Inputs | Total |
| Assets ($) | | | | |
| Investments in Securities: | | | |
| Equity Securities— | | | | |
| Domestic† | 567,831,483 | — | — | 567,831,483 |
| Equity Securities— | | | | |
| Foreign† | 24,670,323 | — | — | 24,670,323 |
| Mutual Funds | 46,673,549 | — | — | 46,673,549 |
| † See Statement of Investments for additional detailed categorizations. | |
At August 31, 2012, there were no transfers between Level 1 and Level 2 of the fair value hierarchy.
(b) Securities transactions and investment income: Securities transactions are recorded on a trade date basis. Realized gains and losses from securities transactions are recorded on the identified cost basis. Dividend income is recognized on the ex-dividend date and interest income, including, where applicable, accretion of discount and amortization of premium on investments, is recognized on the accrual basis.
Pursuant to a securities lending agreement with The Bank of New York Mellon, a subsidiary of BNY Mellon and an affiliate of Dreyfus, the fund may lend securities to qualified institutions. It is the fund’s policy that, at origination, all loans are secured by collateral of at least 102% of the value of U.S. securities loaned and 105% of the value of foreign securities loaned. Collateral equivalent to at least 100% of the market value of securities on loan is maintained at all times. Collateral is either in the form of cash, which can be invested in certain money market mutual funds managed by the Manager, U.S. Government and Agency securities or letters of credit.The fund is entitled to receive all income on securities loaned, in addition to income earned as a result
20
of the lending transaction. Although each security loaned is fully collateralized, the fund bears the risk of delay in recovery of, or loss of rights in, the securities loaned should a borrower fail to return the securities in a timely manner. During the period ended August 31, 2012,The Bank of New York Mellon earned $129,842 from lending portfolio securities, pursuant to the securities lending agreement.
(c) Affiliated issuers: Investments in other investment companies advised by Dreyfus are defined as “affiliated” in the Act. Investments in affiliated investment companies for the period ended August 31, 2012 were as follows:
| | | | | | | | |
| Affiliated | | | | | | | | |
| Investment | | Value | | | | Value | | Net |
| Company | | 8/31/2011 | ($) | Purchases ($) | Sales ($) | 8/31/2012 | ($) | Assets (%) |
| Dreyfus | | | | | | | | |
| Institutional | | | | | | | |
| Preferred | | | | | | | | |
| Plus Money | | | | | | | |
| Market Fund | — | | 173,177,989 | 173,177,989 | — | | — |
| Dreyfus | | | | | | | | |
| Institutional | | | | | | | |
| Cash | | | | | | | | |
| Advantage | | | | | | | | |
| Fund | 106,126,483 | | 336,569,441 | 396,022,375 | 46,673,549 | | 7.9 |
| Total | 106,126,483 | | 509,747,430 | 569,200,364 | 46,673,549 | | 7.9 |
(d) Dividends to shareholders: Dividends are recorded on the ex-dividend date. Dividends from investment income-net and dividends from net realized capital gains, if any, are normally declared and paid annually, but the fund may make distributions on a more frequent basis to comply with the distribution requirements of the Internal Revenue Code of 1986, as amended (the “Code”).To the extent that net realized capital gains can be offset by capital loss carryovers, it is the policy of the fund not to distribute such gains. Income and capital gain distributions are determined in accordance with income tax regulations, which may differ from GAAP.
TheFund 21
NOTES TO FINANCIAL STATEMENTS (continued)
(e) Federal income taxes: It is the policy of the fund to continue to qualify as a regulated investment company, if such qualification is in the best interests of its shareholders, by complying with the applicable provisions of the Code, and to make distributions of taxable income sufficient to relieve it from substantially all federal income and excise taxes.
As of and during the period ended August 31, 2012, the fund did not have any liabilities for any uncertain tax positions.The fund recognizes interest and penalties, if any, related to uncertain tax positions as income tax expense in the Statement of Operations. During the period, the fund did not incur any interest or penalties.
Each of the tax years in the four-year period ended August 31, 2012 remains subject to examination by the Internal Revenue Service and state taxing authorities.
At August 31, 2012, the components of accumulated earnings on a tax basis were as follows: accumulated capital losses $43,885,447 and unrealized appreciation $83,903,876.
Under the Regulated Investment Company Modernization Act of 2010 (the “2010 Act”), the fund is permitted to carry forward capital losses incurred in taxable years beginning after December 22, 2010 (“post-enactment losses”) for an unlimited period. Furthermore, post-enactment capital loss carryovers retain their character as either short-term or long-term capital losses rather than short-term as they were under previous statute.
At August 31, 2012, the accumulated capital loss carryover consists of post-enactment short-term capital losses of $22,729,138, which can be applied against future net realized capital gains, if any, realized subsequent to August 31, 2012 and which can be carried forward for an unlimited period.As a result of the fund’s merger with Emerging Leaders, capital losses of $21,156,309 are available to offset future realized gains, if any. Based on certain provisions in the Code, the amount of losses which can be utilized in subsequent years is subject to an annual limitation. If not applied, $18,891,713 of these acquired capital losses expires in fiscal year 2017 and $2,264,596 of post-enactment short-term capital losses can be carried forward for an unlimited period.
22
The tax character of distributions paid to shareholders during the fiscal periods ended August 31, 2012 and August 31, 2011 were as follows: ordinary income $23,935,042 and $3,834,539 and long-term capital gains $36,791,580 and $7,599,774, respectively.
During the period ended August 31, 2012, as a result of permanent book to tax differences, primarily due to the tax treatment for net operating losses, limited partnership adjustments, wash sales from merger and capital loss carryover from merger, the fund increased accumulated undistributed investment income-net by $3,022,615, decreased accumulated net realized gain (loss) on investments by $20,832,638 and increased paid-in capital by $17,810,023. Net assets and net asset value per share were not affected by this reclassification.
NOTE 2—Bank Lines of Credit:
The fund participates with other Dreyfus-managed funds in a $225 million unsecured credit facility led by Citibank, N.A. and a $300 million unsecured credit facility provided by The Bank of New York Mellon (each, a “Facility”), each to be utilized primarily for temporary or emergency purposes, including the financing of redemptions. In connection therewith, the fund has agreed to pay its pro rata portion of commitment fees for each Facility. Interest is charged to the fund based on rates determined pursuant to the terms of the respective Facility at the time of borrowing.
The average amount of borrowings outstanding under the Facilities during the period ended August 31, 2012 was approximately $885,000 with a related weighted average annualized interest rate of 1.26%.
NOTE 3—Management Fee and Other Transactions With Affiliates:
(a) Pursuant to a management agreement with the Manager, the management fee is computed at the annual rate of .75% of the value of the fund’s average daily net assets and is payable monthly.
(b) Under the Shareholder Services Plan, the fund pays the Distributor at an annual rate of .25% of the value of the fund’s average daily net
TheFund 23
NOTES TO FINANCIAL STATEMENTS (continued)
assets for the provision of certain services. The services provided may include personal services relating to shareholder accounts, such as answering shareholder inquiries regarding the fund and providing reports and other information, and services related to the maintenance of shareholder accounts.The Distributor may make payments to Service Agents (securities dealers, financial institutions or other industry professionals) in respect of these services.The Distributor determines the amounts to be paid to Service Agents. During the period ended August 31, 2012, the fund was charged $1,457,002 pursuant to the Shareholder Services Plan.
The fund has arrangements with the transfer agent and the custodian whereby the fund may receive earnings credits when positive cash balances are maintained, which are used to offset transfer agency and custody fees. For financial reporting purposes, the fund includes net earnings credits as an expense offset in the Statement of Operations.
The fund compensates Dreyfus Transfer, Inc. (“DTI”), a wholly-owned subsidiary of the Manager, under a transfer agency agreement for providing transfer agency services for the fund and, since May 29, 2012, cash management services related to fund subscriptions and redemptions. During the period ended August 31, 2012, the fund was charged $205,327 for transfer agency services and $2,760 for cash management services. Cash management fees were partially offset by earnings credits of $325. These fees are included in Shareholder servicing costs in the Statement of Operations.
The fund compensatesThe Bank of NewYork Mellon under a custody agreement for providing custodial services for the fund. During the period ended August 31, 2012, the fund was charged $56,809 pursuant to the custody agreement.
Prior to May 29, 2012, the fund compensated The Bank of New York Mellon under a cash management agreement for performing cash management services related to fund subscriptions and redemptions.
24
During the period ended August 31, 2012, the fund was charged $20,987 pursuant to the cash management agreement, which is included in Shareholder servicing costs in the Statement of Operations.These fees were partially offset by earnings credits of $618.
During the period ended August 31, 2012, the fund was charged $6,392 for services performed by the Chief Compliance Officer and his staff.
The components of “Due to The Dreyfus Corporation and affiliates” in the Statement of Assets and Liabilities consist of: management fees $371,996, Shareholder Services Plan fees $123,999, custodian fees $19,242, Chief Compliance Officer fees $4,243 and transfer agency per account fees $50,997.
(c) Each Board member also serves as a Board member of other funds within the Dreyfus complex. Annual retainer fees and attendance fees are allocated to each fund based on net assets.
NOTE 4—Securities Transactions:
The aggregate amount of purchases and sales of investment securities, excluding short-term securities, during the period ended August 31, 2012 amounted to $498,414,957 and $571,516,169, respectively.
At August 31, 2012, the cost of investments for federal income tax purposes was $555,271,479; accordingly, accumulated net unrealized appreciation on investments was $83,903,876, consisting of $116,668,895 gross unrealized appreciation and $32,765,019 gross unrealized depreciation.
TheFund 25
REPORT OF INDEPENDENT REGISTERED
PUBLIC ACCOUNTING FIRM
Shareholders and Board of Directors Dreyfus Opportunistic Small Cap Fund
We have audited the accompanying statement of assets and liabilities, including the statement of investments, of Dreyfus Opportunistic Small Cap Fund (one of the series comprising Advantage Funds, Inc.) as of August 31, 2012, and the related statement of operations for the year then ended, the statement of changes in net assets for each of the two years in the period then ended, and the financial highlights for each of the five years in the period then ended.These financial statements and financial highlights are the responsibility of the Fund’s management. Our responsibility is to express an opinion on these financial statements and financial highlights based on our audits.
We conducted our audits in accordance with the standards of the Public Company Accounting Oversight Board (United States).Those standards require that we plan and perform the audit to obtain reasonable assurance about whether the financial statements and financial highlights are free of material misstatement.We were not engaged to perform an audit of the Fund’s internal control over financial reporting. Our audits included consideration of internal control over financial reporting as a basis for designing audit procedures that are appropriate in the circumstances, but not for the purpose of expressing an opinion on the effectiveness of the Fund’s internal control over financial reporting.Accordingly, we express no such opinion. An audit also includes examining, on a test basis, evidence supporting the amounts and disclosures in the financial statements and financial highlights, assessing the accounting principles used and significant estimates made by management, and evaluating the overall financial statement presentation. Our procedures included confirmation of securities owned as of August 31, 2012 by correspondence with the custodian and others.We believe that our audits provide a reasonable basis for our opinion.
In our opinion, the financial statements and financial highlights referred to above present fairly, in all material respects, the financial position of Dreyfus Opportunistic Small Cap Fund at August 31, 2012, the results of its operations for the year then ended, the changes in its net assets for each of the two years in the period then ended, and the financial highlights for each of the five years in the period then ended, in conformity with U.S. generally accepted accounting principles.
New York, New York
October 29, 2012
26
IMPORTANT TAX INFORMATION (Unaudited)
For federal tax purposes, the fund hereby reports 16.00% of the ordinary dividends paid during the fiscal year ended August 31, 2012 as qualifying for the corporate dividends received deduction. Also, certain dividends paid by the fund may be subject to a maximum tax rate of 15%, as provided for by the Jobs and Growth Tax Relief Reconciliation Act of 2003. Of the distributions paid during the fiscal year, $2,070 represents the maximum amount that may be considered qualified dividend income.The fund also hereby reports $1.1900 per share as a short-term capital gain distribution and $1.8292 per share as a long-term capital gain distribution paid on December 8, 2011. Shareholders will receive notification in early 2013 of the percentage applicable to the preparation of their 2012 income tax returns.
TheFund 27
PROXY RESULTS (Unaudited)
The Company held a special meeting of shareholders on August 3, 2012.The proposal considered at the meeting, and the results, are as follows:
| | | |
| | | Shares | |
| | Votes For | | Authority Withheld |
| To elect additional Board Members: | | | |
| Lynn Martin† | 90,334,756 | | 3,252,629 |
| Robin A. Melvin† | 90,449,622 | | 3,137,763 |
| Philip L. Toia† | 90,229,928 | | 3,357,457 |
† Each new Board Member’s term commenced on September 1, 2012.
In addition Peggy C. Davis, Joseph S. DiMartino, David P. Feldman, Ehud Houminer and Dr. Martin Peretz continue
as Board Members of the Company.
28
INFORMATION ABOUT THE RENEWAL OF THE
FUND’S MANAGEMENT AGREEMENT (Unaudited)
At a meeting of the fund’s Board of Directors held on March 6, 2012, the Board considered the renewal of the fund’s Management Agreement pursuant to which Dreyfus provides the fund with investment advisory and administrative services (the “Agreement”). The Board members, none of whom are “interested persons” (as defined in the Investment Company Act of 1940, as amended) of the fund, were assisted in their review by independent legal counsel and met with counsel in executive session separate from Dreyfus representatives. In considering the renewal of the Agreement, the Board considered all factors that it believed to be relevant, including those discussed below.The Board did not identify any one factor as dispositive, and each Board member may have attributed different weights to the factors considered.
Analysis of Nature, Extent, and Quality of Services Provided to the Fund.The Board considered information previously provided to them in presentations from Dreyfus representatives regarding the nature, extent, and quality of the services provided to funds in the Dreyfus fund complex, and Dreyfus representatives confirmed that there had been no material changes in this information. Dreyfus provided the number of open accounts in the fund, the fund’s asset size and the allocation of fund assets among distribution channels. Dreyfus also had previously provided information regarding the diverse intermediary relationships and distribution channels of funds in the Dreyfus fund complex and Dreyfus’ corresponding need for broad, deep, and diverse resources to be able to provide ongoing shareholder services to each distribution channel, including the distribution channel(s) for the fund.
The Board also considered research support available to, and portfolio management capabilities of, the fund’s portfolio management personnel and that Dreyfus also provides oversight of day-to-day fund operations, including fund accounting and administration and assistance in meeting legal and regulatory requirements.The Board also considered Dreyfus’ extensive administrative, accounting, and compliance infrastructures. The Board also considered portfolio management’s brokerage policies and practices (including policies and practices regarding soft dollars) and the standards applied in seeking best execution.
TheFund 29
INFORMATION ABOUT THE RENEWAL OF THE FUND’S
MANAGEMENT AGREEMENT (Unaudited) (continued)
Comparative Analysis of the Fund’s Performance and Management Fee and Expense Ratio.The Board reviewed reports prepared by Lipper, Inc. (“Lipper”), an independent provider of investment company data, which included information comparing (1) the fund’s performance with the performance of a group of comparable funds (the “Performance Group”) and with a broader group of funds (the “Performance Universe”), all for various periods ended December 31, 2011, and (2) the fund’s actual and contractual management fees and total expenses with those of a group of comparable funds (the “Expense Group”) and with a broader group of funds (the “Expense Universe”), the information for which was derived in part from fund financial statements available to Lipper as of the date of its analysis. Dreyfus previously had furnished the Board with a description of the methodology Lipper used to select the Performance Group and Performance Universe and the Expense Group and Expense Universe.
Dreyfus representatives stated that the usefulness of performance comparisons may be affected by a number of factors, including different investment limitations that may be applicable to the fund and comparison funds.They also noted that performance generally should be considered over longer periods of time, although it is possible that long-term performance can be adversely affected by even one period of significant underperformance so that a single investment decision or theme has the ability to affect disproportionately long-term performance. The Board discussed the results of the comparisons and noted that the fund’s total return performance was variously above and below the Performance Group and Performance Universe medians, and ranked in the fourth quartile for the one- and two-year periods and ranked in the first quartile for the three-, four- and five-year periods for both the Performance Group and Performance Universe. While the Board expressed concern about recent performance, the Board noted the long tenure and experience of the lead portfolio manager and the fund’s longer-term performance. Dreyfus also provided a comparison of the fund’s calendar year total returns to the returns of
30
the fund’s benchmark index, and the Dreyfus representatives noted that the fund’s total return was above the return of the index in six of the ten years.
The Board also reviewed the range of actual and contractual management fees and total expenses of the Expense Group and Expense Universe funds and discussed the results of the comparisons.The Board noted that the fund’s contractual management fee was below the Expense Group median, the fund’s actual management fee was at the Expense Group median and below the Expense Universe median and the fund’s total expenses were above the Expense Group median and below the Expense Universe median.
Dreyfus representatives reviewed with the Board the management or investment advisory fees (1) paid by funds advised or administered by Dreyfus that are in the same Lipper category as the fund and (2) paid to Dreyfus or the Dreyfus-affiliated primary employer of the fund’s primary portfolio manager(s) for advising any separate accounts and/or other types of client portfolios that are considered to have similar investment strategies and policies as the fund (the “Similar Clients”), and explained the nature of the Similar Clients. They discussed differences in fees paid and the relationship of the fees paid in light of any differences in the services provided and other relevant factors. The Board considered the relevance of the fee information provided for the Similar Clients to evaluate the appropriateness and reasonableness of the fund’s management fee.
Analysis of Profitability and Economies of Scale. Dreyfus representatives reviewed the expenses allocated and profit received by Dreyfus and the resulting profitability percentage for managing the fund, and the method used to determine the expenses and profit. The Board concluded that the profitability results were not unreasonable, given the services rendered and service levels provided by Dreyfus. The Board previously had been provided with information prepared by an
TheFund 31
INFORMATION ABOUT THE RENEWAL OF THE FUND’S
MANAGEMENT AGREEMENT (Unaudited) (continued)
independent consulting firm regarding Dreyfus’ approach to allocating costs to, and determining the profitability of, individual funds and the entire Dreyfus fund complex. The consulting firm also had analyzed where any economies of scale might emerge in connection with the management of a fund.
The Board’s counsel stated that the Board should consider the profitability analysis (1) as part of their evaluation of whether the fees under the Agreement bear a reasonable relationship to the mix of services provided by Dreyfus, including the nature, extent and quality of such services, and (2) in light of the relevant circumstances for the fund and the extent to which economies of scale would be realized if the fund grows and whether fee levels reflect these economies of scale for the benefit of fund shareholders. Dreyfus representatives noted that a discussion of economies of scale is predicated on a fund having achieved a substantial size with increasing assets and that, if a fund’s assets had been stable or decreasing, the possibility that Dreyfus may have realized any economies of scale would be less. Dreyfus representatives also noted that, as a result of shared and allocated costs among funds in the Dreyfus fund complex, the extent of economies of scale could depend substantially on the level of assets in the complex as a whole, so that increases and decreases in complex-wide assets can affect potential economies of scale in a manner that is disproportionate to, or even in the opposite direction from, changes in the fund’s asset level. The Board also considered potential benefits to Dreyfus from acting as investment adviser and noted the soft dollar arrangements in effect for trading the fund’s investments.
At the conclusion of these discussions, the Board agreed that it had been furnished with sufficient information to make an informed business decision with respect to the renewal of the Agreement. Based on the discussions and considerations as described above, the Board concluded and determined as follows.
The Board concluded that the nature, extent and quality of the services provided by Dreyfus are adequate and appropriate.
The Board generally was satisfied with the fund’s overall perfor- mance, although expressed concern about recent performance.
32
The Board concluded that the fee paid to Dreyfus was reasonable in light of the considerations described above.
The Board determined that the economies of scale which may accrue to Dreyfus and its affiliates in connection with the management of the fund had been adequately considered by Dreyfus in connection with the fee rate charged to the fund pursuant to the Agreement and that, to the extent in the future it were determined that material economies of scale had not been shared with the fund, the Board would seek to have those economies of scale shared with the fund.
The Board considered these conclusions and determinations, along with information received on a routine and regular basis throughout the year. In addition, it should be noted that the Board’s consideration of the contractual fee arrangements for this fund had the benefit of a number of years of reviews of prior or similar agreements during which lengthy discussions took place between the Board and Dreyfus representatives. Certain aspects of the arrangements may receive greater scrutiny in some years than in others, and the Board’s conclusions may be based, in part, on their consideration of the same or similar arrangements in prior years.The Board determined that renewal of the Agreement was in the best interests of the fund and its shareholders.
TheFund 33
BOARD MEMBERS INFORMATION (Unaudited)

34

TheFund 35
OFFICERS OF THE FUND (Unaudited)

36
TheFund 37
For More Information
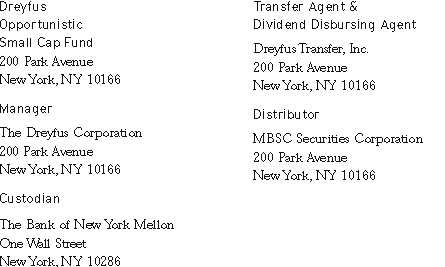
Ticker Symbol: DSCVX
Telephone 1-800-DREYFUS
Mail The Dreyfus Family of Funds, 144 Glenn Curtiss Boulevard, Uniondale, NY 11556-0144
E-mail Send your request to info@dreyfus.com
Internet Information can be viewed online or downloaded at: http://www.dreyfus.com
The fund files its complete schedule of portfolio holdings with the Securities and Exchange
Commission (“SEC”) for the first and third quarters of each fiscal year on Form N-Q. The
fund’s Forms N-Q are available on the SEC’s website at http://www.sec.gov and may be
reviewed and copied at the SEC’s Public Reference Room in Washington, DC. Information on
the operation of the Public Reference Room may be obtained by calling 1-800-SEC-0330.
A description of the policies and procedures that the fund uses to determine how to vote
proxies relating to portfolio securities, and information regarding how the fund voted
these proxies for the most recent 12-month period ended June 30 is available at
http://www.dreyfus.com and on the SEC’s website at http://www.sec.gov. The
description of the policies and procedures is also available without charge,
upon request, by calling 1-800-DREYFUS.

|
| © 2012 MBSC Securities Corporation |
Dreyfus
Opportunistic
U.S. Stock Fund
ANNUAL REPORT August 31, 2012

Save time. Save paper. View your next shareholder report online as soon as it’s available. Log into www.dreyfus.com and sign up for Dreyfus eCommunications. It’s simple and only takes a few minutes.
The views expressed in this report reflect those of the portfolio manager only through the end of the period covered and do not necessarily represent the views of Dreyfus or any other person in the Dreyfus organization. Any such views are subject to change at any time based upon market or other conditions and Dreyfus disclaims any responsibility to update such views.These views may not be relied on as investment advice and, because investment decisions for a Dreyfus fund are based on numerous factors, may not be relied on as an indication of trading intent on behalf of any Dreyfus fund.
Not FDIC-Insured • Not Bank-Guaranteed • May Lose Value
| |
| | Contents |
| |
| | THE FUND |
| 2 | A Letter from the Chairman and CEO |
| 3 | Discussion of Fund Performance |
| 6 | Fund Performance |
| 8 | Understanding Your Fund’s Expenses |
| 8 | Comparing Your Fund’s Expenses |
| With Those of Other Funds |
| 9 | Statement of Investments |
| 12 | Statement of Assets and Liabilities |
| 13 | Statement of Operations |
| 14 | Statement of Changes in Net Assets |
| 15 | Financial Highlights |
| 16 | Notes to Financial Statements |
| 24 | Report of Independent Registered |
| | Public Accounting Firm |
| 25 | Proxy Results |
| 26 | Board Members Information |
| 28 | Officers of the Fund |
| |
| FOR MORE INFORMATION |
|
| | Back Cover |
Dreyfus
Opportunistic
U.S. Stock Fund
The Fund

A LETTER FROM THE CHAIRMAN AND CEO
Dear Shareholder:
We are pleased to present this annual report for Dreyfus Opportunistic U.S. Stock Fund, covering the period between the fund’s inception on December 20, 2011, and the end of its fiscal year on August 31, 2012. For information about how the fund performed during the reporting period, as well as general market perspectives, we provide a Discussion of Fund Performance on the pages that follow.
U.S. equities proved unusually volatile over the past year, as prices rose and fell according to investors’ changing expectations of global and domestic economic conditions. When viewed over a longer time frame, however, the pace of U.S. economic growth has been relatively consistent at about half the average rate achieved in prior recoveries. Even U.S. employment numbers, which have been volatile over short periods, averaged slightly better than 150,000 new jobs a month so far in 2012, roughly unchanged from the monthly average in 2011.
The sustained but subpar U.S. expansion appears likely to continue over the foreseeable future. On one hand, the economy has responded to a variety of stimulative measures, most notably an aggressively accommodative monetary policy. On the other hand, the prospect of automatic spending cuts and tax hikes scheduled for the end of 2012 has weighed on economic growth by contributing to a temporary postponement of spending decisions among consumers and businesses. Indeed, the ability of the U.S. political system to address both this “fiscal cliff” and long-term deficit reduction could go a long way toward shaping the 2013 market environment.As always, we urge you to speak regularly with your financial advisor to discuss how changing economic conditions may affect your investments.
Thank you for your continued confidence and support.

Jonathan R. Baum
Chairman and Chief Executive Officer
The Dreyfus Corporation
September 17, 2012
2

DISCUSSION OF FUND PERFORMANCE
For the period of December 20, 2011, through August 31, 2012, as provided by David A. Daglio, Primary Portfolio Manager
Fund and Market Performance Overview
For the period between the fund’s inception on December 20, 2011, and the end of its fiscal year on August 31, 2012, Dreyfus Opportunistic U.S. Stock Fund’s Class A shares produced a total return of 15.92%, Class C shares returned 15.36% and Class I shares returned 16.16%.1 In comparison, for the period of January 1, 2012, through August 31, 2012, the Russell 3000 Index (the “Index”) produced a total return of 13.15%.2 Changing economic sentiment fueled market volatility as stock market declines during the spring of 2012 were more than offset by gains at other times of the reporting period.The fund produced higher returns than its benchmark, largely due to favorable stock selections in the consumer discretionary, materials and industrials sectors.
The Fund’s Investment Approach
The fund seeks long-term capital appreciation.The fund normally invests at least 80% of its assets in the stocks of publicly traded companies located in the United States.The fund may invest in the stocks of companies of any market capitalization and may hold growth or value stocks or a blend of both.
Stocks are selected for the fund’s portfolio based on a combination of fundamental, bottom-up research, macro insights and risk management. With support from a team of research analysts, we use a disciplined, opportunistic investment approach to identify stocks of companies that we believe to be attractive from a valuation and fundamental standpoint, including those that are trading materially below our estimate of intrinsic market value, those that have strong or improving fundamentals and those that have a revaluation catalyst. We focus on understanding the current fundamentals driving a company’s profits and cash flow, valuing the liabilities most likely to impact the company’s business and evaluating business conditions most likely to affect the company’s prospects for future growth.
The Fund 3
DISCUSSION OF FUND PERFORMANCE (continued)
Markets Reacted to Shifting Macroeconomic Developments
In the wake of sharp declines earlier in 2011, the fund’s operations began near the start of a stock market rebound stemming from U.S. employment gains, a quantitative easing program in Europe and less restrictive monetary and fiscal policies in China. As a result, investors grew more tolerant of risks, focusing more intently on company fundamentals and less on macroeconomic news.
These positive influences were called into question during the spring of 2012, when the U.S. labor market’s rebound slowed and measures designed to relieve fiscal pressures in Europe encountered resistance. The market rally resumed over the summer amid more encouraging economic data, and the Index ended the reporting period with double-digit gains.
Consumer Discretionary and Materials Stocks Supported Fund Results
In this environment, the fund benefited from its security selections in the consumer discretionary sector, particularly homebuilders D.R. Horton, Toll Brothers and PulteGroup, which responded sharply to signs of strength in U.S. housing markets. We also focused on companies with brands we considered undervalued. For example, apparel maker Fifth & Pacific advanced as investors recognized the intrinsic values of its Kate Spade, Lucky Brand and Juicy Couture segments. Likewise, The Jones Group climbed on the strength of its Jones New York and Nine West product lines.
In the materials sector, plastics producer LyondellBasell Industries gained value when input costs plunged along with natural gas prices, and higher corn prices spurred seed sales for Monsanto. In the industrials sector, building products supplier Masco and electrical equipment producers Hubbell and Regal-Beloit benefited from a recovery in capital spending and construction. Debt collector Portfolio Recovery Associates and credit report provider Equifax advanced due to higher collection rates and credit growth, respectively.
Disappointments during the reporting period were concentrated in the information technology sector, where videogame maker Electronic Arts struggled with an industry-wide change in its distribution model. We may have been too early in establishing a position in semiconductor manufacturer Applied Micro Circuits as the stock has not yet responded
4
to expectations of higher sales related to a new product cycle. The financials sector hindered relative results to a lesser degree, as brokerage firms TD Ameritrade Holding and LPL Financial Holdings sat out the rally that lifted other financial institutions.
Positioned for Moderate Growth
Although headwinds remain, we ended the reporting period with a guardedly optimistic outlook for the U.S. economy and stocks in all capitalization ranges. We have been especially encouraged by recent improvements in data related to homebuilding, automobile production and other areas where consumer spending is likely to grow. At the same time, stock valuations have remained attractive relative to historical averages.
We have identified a number of stocks meeting our investment criteria in some of the market’s more economically sensitive areas, including the information technology, consumer discretionary and financials sectors. We have found fewer opportunities in the REIT industry and the traditionally defensive utilities and consumer staples sectors.
September 17, 2012
Please note, the position in any security highlighted with italicized typeface was sold during the
reporting period.
Equity funds are subject generally to market, market sector, market liquidity, issuer and investment
style risks, among other factors, to varying degrees, all of which are more fully described in the
fund’s prospectus.
Stocks of small- and/or midcap companies often experience sharper price fluctuations than stocks
of large-cap companies.
The fund’s performance will be influenced by political, social and economic factors affecting
investments in foreign companies. Special risks associated with investments in foreign companies
include exposure to currency fluctuations, less liquidity, less developed or less efficient trading
markets, lack of comprehensive company information, political instability and differing auditing
and legal standards.These risks are enhanced in emerging market countries. Please read the
prospectus for further discussion of these risks.
1 Total return includes reinvestment of dividends and any capital gains paid and does not take into
consideration the maximum initial sales charge in the case of Class A shares, or the applicable
contingent deferred sales charge imposed on redemptions in the case of Class C shares. Had these
charges been reflected, returns would have been lower. Past performance is no guarantee of future
results. Share price and investment return fluctuate such that upon redemption fund shares may be
worth more or less than their original cost.The fund’s returns reflect the absorption of certain fund
expenses by The Dreyfus Corporation pursuant to an agreement in effect through January 1,
2013, at which time it may be extended, terminated or modified. Had these expenses not been
absorbed, the fund’s returns would have been lower.
2 SOURCE: LIPPER INC. — Reflects the reinvestment of dividends and, where applicable,
capital gain distributions.The Russell 3000 Index is composed of the 3,000 largest U.S.
companies based on total market capitalization. Investors cannot invest directly in any index.
The Fund 5
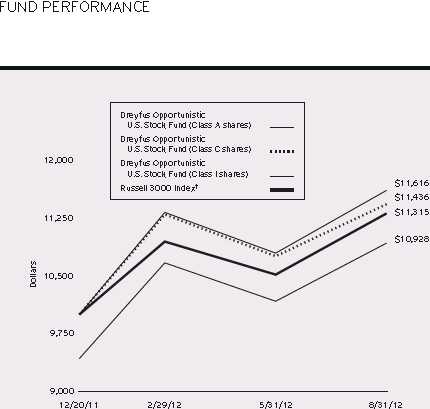
Comparison of change in value of $10,000 investment in Dreyfus Opportunistic U.S. Stock
Fund Class A shares, Class C shares and Class I shares and the Russell 3000 Index
† Source: Lipper Inc.
Past performance is not predictive of future performance.
The above graph compares a $10,000 investment made in each of the Class A, Class C and Class I shares of Dreyfus
Opportunistic U.S. Stock Fund on 12/20/11 (inception date) to a $10,000 investment made in the Russell 3000
Index (the “Index”) on that date.All dividends and capital gain distributions are reinvested.
The fund’s performance shown in the line graph above takes into account the maximum initial sales charge on Class A
shares, the applicable contingent deferred sales charge on Class C shares and all other applicable fees and expenses on all
classes.The Index measures the performance of the largest 3,000 U.S. companies representing approximately 98% of the
investable U.S. equity market. Unlike a mutual fund, the Index is not subject to charges, fees and other expenses.
Investors cannot invest directly in any index. Further information relating to fund expenses, including expense
reimbursements, if applicable, is contained in the Expense section of the prospectus and elsewhere in this report.
6
| | | |
| Actual Aggregate Total Returns as of 8/31/12 | | | |
| |
| | Inception | From | |
| | Date | Inception | |
| Class A shares | | | |
| with maximum sales charge (5.75%) | 12/20/11 | 9.28 | % |
| without sales charge | 12/20/11 | 15.92 | % |
| Class C shares | | | |
| with applicable redemption charge † | 12/20/11 | 14.36 | % |
| without redemption | 12/20/11 | 15.36 | % |
| Class I shares | 12/20/11 | 16.16 | % |
| Russell 3000 Index | 12/31/11 | 13.15 | %†† |
Past performance is not predictive of future performance.The fund’s performance shown in the graph and table does not
reflect the deduction of taxes that a shareholder would pay on fund distributions or the redemption of fund shares.
† The maximum contingent deferred sales charge for Class C shares is 1% for shares redeemed within one year of the
date of purchase.
†† For comparative purposes, the value of the Index on 12/31/11 is used as the beginning value on 12/20/11.
The Fund 7
UNDERSTANDING YOUR FUND’S EXPENSES (Unaudited)
As a mutual fund investor, you pay ongoing expenses, such as management fees and other expenses. Using the information below, you can estimate how these expenses affect your investment and compare them with the expenses of other funds.You also may pay one-time transaction expenses, including sales charges (loads) and redemption fees, which are not shown in this section and would have resulted in higher total expenses. For more information, see your fund’s prospectus or talk to your financial adviser.
Review your fund’s expenses
The table below shows the expenses you would have paid on a $1,000 investment in Dreyfus Opportunistic U.S. Stock Fund from March 1, 2012 to August 31, 2012. It also shows how much a $1,000 investment would be worth at the close of the period, assuming actual returns and expenses.
Expenses and Value of a $1,000 Investment
assuming actual returns for the six months ended August 31, 2012
| | | | | | |
| | | Class A | | Class C | | Class I |
| Expenses paid per $1,000† | | $6.11 | | $9.90 | | $4.84 |
| Ending value (after expenses) | | $1,024.00 | | $1,020.50 | | $1,025.40 |
COMPARING YOUR FUND’S EXPENSES WITH THOSE OF OTHER FUNDS (Unaudited)
Using the SEC’s method to compare expenses
The Securities and Exchange Commission (SEC) has established guidelines to help investors assess fund expenses. Per these guidelines, the table below shows your fund’s expenses based on a $1,000 investment, assuming a hypothetical 5% annualized return. You can use this information to compare the ongoing expenses (but not transaction expenses or total cost) of investing in the fund with those of other funds.All mutual fund shareholder reports will provide this information to help you make this comparison. Please note that you cannot use this information to estimate your actual ending account balance and expenses paid during the period.
Expenses and Value of a $1,000 Investment
assuming a hypothetical 5% annualized return for the six months ended August 31, 2012
| | | | | | |
| | | Class A | | Class C | | Class I |
| Expenses paid per $1,000† | | $6.09 | | $9.88 | | $4.82 |
| Ending value (after expenses) | | $1,019.10 | | $1,015.33 | | $1,020.36 |
† Expenses are equal to the fund’s annualized expense ratio of 1.20% for Class A, 1.95% for Class C and .95%
for Class I, multiplied by the average account value over the period, multiplied by 184/366 (to reflect the one-half
STATEMENT OF INVESTMENTS
August 31, 2012
| | | | |
| Common Stocks—98.2% | Shares | | | Value ($) |
| Banks—4.3% | | | | |
| Fifth Third Bancorp | 6,260 | | | 94,776 |
| Hancock Holding | 1,920 | | | 56,909 |
| | | | | 151,685 |
| Capital Goods—4.3% | | | | |
| Granite Construction | 1,200 | | | 33,084 |
| Regal-Beloit | 1,010 | | | 68,741 |
| Trinity Industries | 1,810 | | | 51,295 |
| | | | | 153,120 |
| Commercial & Professional Services—5.1% | | | | |
| Equifax | 1,070 | | | 48,985 |
| Portfolio Recovery Associates | 1,030 | a | | 103,360 |
| Robert Half International | 1,110 | | | 29,193 |
| | | | | 181,538 |
| Consumer Durables & Apparel—16.7% | | | | |
| D.R. Horton | 4,650 | | | 88,303 |
| Fifth & Pacific | 7,100 | a | | 94,075 |
| Jones Group | 8,010 | | | 101,487 |
| Mohawk Industries | 1,200 | a | | 86,460 |
| Newell Rubbermaid | 3,030 | | | 54,328 |
| Pulte Group | 5,550 | a | | 75,924 |
| Toll Brothers | 2,890 | a | | 94,561 |
| | | | | 595,138 |
| Diversified Financials—3.3% | | | | |
| LPL Financial Holdings | 2,030 | | | 58,200 |
| TD Ameritrade Holding | 3,510 | | | 60,056 |
| | | | | 118,256 |
| Energy—5.2% | | | | |
| Cameron International | 1,210 | a | | 66,199 |
| EOG Resources | 590 | | | 63,897 |
| Occidental Petroleum | 640 | | | 54,406 |
| | | | | 184,502 |
| Food, Beverage & Tobacco—4.3% | | | | |
| PepsiCo | 930 | | | 67,360 |
| Philip Morris International | 950 | | | 84,835 |
| | | | | 152,195 |
The Fund 9
STATEMENT OF INVESTMENTS (continued)
| | | | |
| Common Stocks (continued) | Shares | | | Value ($) |
| Health Care Equipment & Services—2.9% | | | | |
| | | |
| Cerner | 570 | a | | 41,690 |
| Cigna | 1,380 | | | 63,163 |
| | | | | 104,853 |
| Insurance—7.5% | | | | |
| Allstate | 2,240 | | | 83,507 |
| Arthur J. Gallagher & Co. | 1,930 | | | 68,940 |
| Principal Financial Group | 4,100 | | | 112,504 |
| | | | | 264,951 |
| Materials—11.5% | | | | |
| LyondellBasell Industries, Cl. A | 2,680 | | | 130,891 |
| Methanex | 2,690 | | | 80,189 |
| Monsanto | 1,260 | | | 109,759 |
| PPG Industries | 790 | | | 86,916 |
| | | | | 407,755 |
| Pharmaceuticals, Biotech & Life Sciences—3.3% | | | | |
| Vertex Pharmaceuticals | 570 | a | | 30,398 |
| Watson Pharmaceuticals | 1,090 | a | | 88,671 |
| | | | | 119,069 |
| Real Estate—1.2% | | | | |
| CBRE Group, Cl. A | 2,550 | a | | 44,140 |
| Retailing—1.6% | | | | |
| Lowe’s | 1,950 | | | 55,536 |
| Semiconductors & Semiconductor Equipment—1.6% | | | | |
| Applied Micro Circuits | 11,210 | a | | 57,283 |
| Software & Services—6.7% | | | | |
| DealerTrack Holdings | 2,840 | a | | 78,640 |
| Intuit | 1,120 | | | 65,565 |
| Velti | 13,420 | a | | 93,001 |
| | | | |
| | | | | 237,206 |
| Technology Hardware & Equipment—14.6% | | | | |
| Apple | 300 | | | 199,572 |
| Arrow Electronics | 1,750 | a | | 63,437 |
| Ciena | 2,910 | a | | 39,780 |
| F5 Networks | 600 | a | | 58,494 |
| QUALCOMM | 1,060 | | | 65,148 |
| SanDisk | 2,250 | a | | 92,745 |
| | | | | 519,176 |
10
| | | | |
| Common Stocks (continued) | Shares | | Value ($) | |
| Transportation—4.1% | | | | |
| C.H. Robinson Worldwide | 1,590 | | 90,010 | |
| Kirby | 1,090 | a | 57,388 | |
| | | | 147,398 | |
| Total Common Stocks | | | | |
| (cost $3,106,760) | | | 3,493,801 | |
| |
| Other Investment—1.9% | | | | |
| Registered Investment Company; | | | | |
| Dreyfus Institutional Preferred | | | | |
| Plus Money Market Fund | | | | |
| (cost $67,275) | 67,275 | b | 67,275 | |
| |
| Total Investments (cost $3,174,035) | 100.1 | % | 3,561,076 | |
| Liabilities, Less Cash and Receivables | (.1 | %) | (5,132 | ) |
| Net Assets | 100.0 | % | 3,555,944 | |
| a | Non-income producing security. |
| b | Investment in affiliated money market mutual fund. |
| | | |
| Portfolio Summary (Unaudited)† | | |
| |
| | Value (%) | | Value (%) |
| Consumer Durables & Apparel | 16.7 | Diversified Financials | 3.3 |
| Technology Hardware & Equipment | 14.6 | Pharmaceuticals, | |
| Materials | 11.5 | Biotech & Life Sciences | 3.3 |
| Insurance | 7.5 | Health Care Equipment & Services | 2.9 |
| Software & Services | 6.7 | Money Market Investment | 1.9 |
| Energy | 5.2 | Retailing | 1.6 |
| Commercial & Professional Services | 5.1 | Semiconductors & | |
| Banks | 4.3 | Semiconductor Equipment | 1.6 |
| Capital Goods | 4.3 | Real Estate | 1.2 |
| Food, Beverage & Tobacco | 4.3 | | |
| Transportation | 4.1 | | 100.1 |
| |
| † Based on net assets. | | | |
| See notes to financial statements. | | | |
The Fund 11
STATEMENT OF ASSETS AND LIABILITIES
August 31, 2012
| | | |
| | | Cost | Value |
| Assets ($): | | | |
| Investments in securities—See Statement of Investments: | | | |
| Unaffiliated issuers | | 3,106,760 | 3,493,801 |
| Affiliated issuers | | 67,275 | 67,275 |
| Dividends receivable | | | 2,999 |
| Prepaid expenses | | | 33,819 |
| | | | 3,597,894 |
| Liabilities ($): | | | |
| Due to The Dreyfus Corporation and affiliates—Note 2(c) | | | 333 |
| Accrued expenses | | | 41,617 |
| | | | 41,950 |
| Net Assets ($) | | | 3,555,944 |
| Composition of Net Assets ($): | | | |
| Paid-in capital | | | 3,067,342 |
| Accumulated undistributed investment income—net | | | 10,957 |
| Accumulated net realized gain (loss) on investments | | | 90,604 |
| Accumulated net unrealized appreciation | | | |
| (depreciation) on investments | | | 387,041 |
| Net Assets ($) | | | 3,555,944 |
| |
| |
| Net Asset Value Per Share | | | |
| | Class A | Class C | Class I |
| Net Assets ($) | 61,195 | 32,775 | 3,461,974 |
| Shares Outstanding | 4,222 | 2,273 | 238,504 |
| Net Asset Value Per Share ($) | 14.49 | 14.42 | 14.52 |
| See notes to financial statements. | | | |
12
| | |
| STATEMENT OF OPERATIONS | | |
| From December 20, 2011 (commencement of operations) | | |
| to August 31, 2012 | | |
| |
| |
| |
| |
| Investment Income ($): | | |
| Income: | | |
| Cash dividends (net of $565 foreign taxes withheld at source): | | |
| Unaffiliated issuers | 31,929 | |
| Affiliated issuers | 52 | |
| Total Income | 31,981 | |
| Expenses: | | |
| Management fee—Note 2(a) | 17,744 | |
| Legal fees | 55,139 | |
| Registration fees | 39,402 | |
| Auditing fees | 34,630 | |
| Prospectus and shareholders’ reports | 7,060 | |
| Custodian fees—Note 2(c) | 2,139 | |
| Shareholder servicing costs—Note 2(c) | 786 | |
| Distribution fees—Note 2(b) | 121 | |
| Directors’ fees and expenses—Note 2(d) | 74 | |
| Miscellaneous | 11,895 | |
| Total Expenses | 168,990 | |
| Less—reduction in expenses due to undertaking—Note 2(a) | (146,282 | ) |
| Less—reduction in fees due to earnings credits—Note 2(c) | (1 | ) |
| Net Expenses | 22,707 | |
| Investment Income—Net | 9,274 | |
| Realized and Unrealized Gain (Loss) on Investments—Note 3 ($): | | |
| Net realized gain (loss) on investments | 90,604 | |
| Net unrealized appreciation (depreciation) on investments | 387,041 | |
| Net Realized and Unrealized Gain (Loss) on Investments | 477,645 | |
| Net Increase in Net Assets Resulting from Operations | 486,919 | |
| See notes to financial statements. | | |
The Fund 13
STATEMENT OF CHANGES IN NET ASSETS
From December 20, 2011 (commencement of operations) to August 31, 2012
| | |
| Operations ($): | | |
| Investment income—net | 9,274 | |
| Net realized gain (loss) on investments | 90,604 | |
| Net unrealized appreciation (depreciation) on investments | 387,041 | |
| Net Increase (Decrease) in Net Assets | | |
| Resulting from Operations | 486,919 | |
| Capital Stock Transactions ($): | | |
| Net proceeds from shares sold: | | |
| Class A Shares | 61,471 | |
| Class C Shares | 31,000 | |
| Class I Shares | 2,986,500 | |
| Cost of shares redeemed: | | |
| Class A Shares | (4,858 | ) |
| Class I Shares | (5,088 | ) |
| Increase (Decrease) in Net Assets | | |
| from Capital Stock Transactions | 3,069,025 | |
| Total Increase (Decrease) in Net Assets | 3,555,944 | |
| Net Assets ($): | | |
| Beginning of Period | — | |
| End of Period | 3,555,944 | |
| Undistributed investment income—net | 10,957 | |
| Capital Share Transactions (Shares): | | |
| Class A | | |
| Shares sold | 4,562 | |
| Shares redeemed | (340 | ) |
| Net Increase (Decrease) in Shares Outstanding | 4,222 | |
| Class C | | |
| Shares sold | 2,273 | |
| Class I | | |
| Shares sold | 238,854 | |
| Shares redeemed | (350 | ) |
| Net Increase (Decrease) in Shares Outstanding | 238,504 | |
| See notes to financial statements. | | |
14
FINANCIAL HIGHLIGHTS
The following table describes the performance for each share class for the period from December 20, 2011 (commencement of operations) to August 31, 2012.All information (except portfolio turnover rate) reflects financial results for a single fund share. Total return shows how much your investment in the fund would have increased (or decreased) during the period, assuming you had reinvested all dividends and distributions.These figures have been derived from the fund’s financial statements.
| | | | | |
| | Class A | | Class C | | Class I |
| | Shares | | Shares | | Shares |
| Per Share Data ($): | | | | | |
| Net asset value, beginning of period | 12.50 | | 12.50 | | 12.50 |
| Investment Operations: | | | | | |
| Investment income (loss)—neta | .02 | | (.05 | ) | .04 |
| Net realized and unrealized | | | | | |
| gain (loss) on investments | 1.97 | | 1.97 | | 1.98 |
| Total from Investment Operations | 1.99 | | 1.92 | | 2.02 |
| Net asset value, end of period | 14.49 | | 14.42 | | 14.52 |
| Total Return (%)b | 15.92 | c | 15.36 | c | 16.16 |
| Ratios/Supplemental Data (%): | | | | | |
| Ratio of total expenses to average net assetsd | 7.51 | | 8.09 | | 7.13 |
| Ratio of net expenses to average net assetsd | 1.20 | | 1.95 | | .95 |
| Ratio of net investment income (loss) | | | | | |
| to average net assetsd | .18 | | (.53 | ) | .40 |
| Portfolio Turnover Rateb | 46.51 | | 46.51 | | 46.51 |
| Net Assets, end of period ($ x 1,000) | 61 | | 33 | | 3,462 |
| a | Based on average shares outstanding at each month end. |
| b | Not annualized. |
| c | Exclusive of sales charge. |
| d | Annualized. |
See notes to financial statements.
The Fund 15
NOTES TO FINANCIAL STATEMENTS
NOTE 1—Significant Accounting Policies:
Dreyfus Opportunistic U.S. Stock Fund (the “fund”) is a separate diversified series of Advantage Funds, Inc. (the “Company”), which is registered under the Investment Company Act of 1940, as amended (the “Act”), as an open-end management investment company and operates as a series company currently offering thirteen series, including the fund, which commenced operations on December 20, 2011.The fund’s investment objective is to seek long-term capital appreciation. The Dreyfus Corporation (the “Manager” or “Dreyfus”), a wholly-owned subsidiary of The Bank of New York Mellon Corporation (“BNY Mellon”), serves as the fund’s investment adviser.
MBSC Securities Corporation (the “Distributor”), a wholly-owned subsidiary of the Manager, is the distributor of the fund’s shares.The fund is authorized to issue 100 million shares of $.001 par value Common Stock in each of the following classes of shares: Class A, Class C and Class I. Class A shares are subject to a sales charge imposed at the time of purchase. Class C shares are subject to a contingent deferred sales charge (“CDSC”) imposed on Class C shares redeemed within one year of purchase. Class I shares are sold at net asset value per share only to institutional investors. Other differences between the classes include the services offered to and the expenses borne by each class, the allocation of certain transfer agency costs and certain voting rights. Income, expenses (other than expenses attributable to a specific class), and realized and unrealized gains or losses on investments are allocated to each class of shares based on its relative net assets.
As of August 31, 2012, MBC Investments Corp., an indirect subsidiary of BNY Mellon, held 800 Class A, 800 Class C and 238,400 Class I shares of the fund.
The Company accounts separately for the assets, liabilities and operations of each series. Expenses directly attributable to each series are
16
charged to that series’ operations; expenses which are applicable to all series are allocated among them on a pro rata basis.
The Financial Accounting Standards Board (“FASB”) Accounting Standards Codification is the exclusive reference of authoritative U.S. generally accepted accounting principles (“GAAP”) recognized by the FASB to be applied by nongovernmental entities. Rules and interpretive releases of the Securities and Exchange Commission (“SEC”) under authority of federal laws are also sources of authoritative GAAP for SEC registrants. The fund’s financial statements are prepared in accordance with GAAP, which may require the use of management estimates and assumptions.Actual results could differ from those estimates.
The Company enters into contracts that contain a variety of indemnifications.The fund’s maximum exposure under these arrangements is unknown.The fund does not anticipate recognizing any loss related to these arrangements.
(a) Portfolio valuation: The fair value of a financial instrument is the amount that would be received to sell an asset or paid to transfer a liability in an orderly transaction between market participants at the measurement date (i.e., the exit price). GAAP establishes a fair value hierarchy that prioritizes the inputs of valuation techniques used to measure fair value.This hierarchy gives the highest priority to unadjusted quoted prices in active markets for identical assets or liabilities (Level 1 measurements) and the lowest priority to unobservable inputs (Level 3 measurements).
Additionally, GAAP provides guidance on determining whether the volume and activity in a market has decreased significantly and whether such a decrease in activity results in transactions that are not orderly. GAAP requires enhanced disclosures around valuation inputs and techniques used during annual and interim periods.
The Fund 17
NOTES TO FINANCIAL STATEMENTS (continued)
Various inputs are used in determining the value of the fund’s investments relating to fair value measurements.These inputs are summarized in the three broad levels listed below:
Level 1—unadjusted quoted prices in active markets for identical investments.
Level 2—other significant observable inputs (including quoted prices for similar investments, interest rates, prepayment speeds, credit risk, etc.).
Level 3—significant unobservable inputs (including the fund’s own assumptions in determining the fair value of investments).
The inputs or methodology used for valuing securities are not necessarily an indication of the risk associated with investing in those securities.
Changes in valuation techniques may result in transfers in or out of an assigned level within the disclosure hierarchy. Valuation techniques used to value the fund’s investments are as follows:
Investments in securities are valued at the last sales price on the securities exchange or national securities market on which such securities are primarily traded. Securities listed on the National Market System for which market quotations are available are valued at the official closing price or, if there is no official closing price that day, at the last sales price. Securities not listed on an exchange or the national securities market, or securities for which there were no transactions, are valued at the average of the most recent bid and asked prices, except for open short positions, where the asked price is used for valuation purposes. Bid price is used when no asked price is available. Registered investment companies that are not traded on an exchange are valued at their net asset value. All of the preceding securities are categorized within Level 1 of the fair value hierarchy.
Fair valuing of securities may be determined with the assistance of a pricing service using calculations based on indices of domestic securities and other appropriate indicators, such as prices of relevant American Depository Receipts and financial futures. Utilizing these
18
techniques may result in transfers between Level 1 and Level 2 of the fair value hierarchy.
When market quotations or official closing prices are not readily available, or are determined not to reflect accurately fair value, such as when the value of a security has been significantly affected by events after the close of the exchange or market on which the security is principally traded (for example, a foreign exchange or market), but before the fund calculates its net asset value, the fund may value these investments at fair value as determined in accordance with the procedures approved by the Company’s Board of Directors. Certain factors may be considered when fair valuing investments such as: fundamental analytical data, the nature and duration of restrictions on disposition, an evaluation of the forces that influence the market in which the securities are purchased and sold, and public trading in similar securities of the issuer or comparable issuers. These securities are either categorized as Level 2 or 3 depending on the relevant inputs used.
For restricted securities where observable inputs are limited, assumptions about market activity and risk are used and are categorized within Level 3 of the fair value hierarchy.
The following is a summary of the inputs used as of August 31, 2012 in valuing the fund’s investments:
| | | | |
| | | Level 2—Other | Level 3— | |
| | Level 1— | Significant | Significant | |
| | Unadjusted | Observable | Unobservable | |
| | Quoted Prices | Inputs | Inputs | Total |
| Assets ($) | | | | |
| Investments in Securities: | | | |
| Equity Securities— | | | | |
| Domestic† | 3,320,611 | — | — | 3,320,611 |
| Equity Securities— | | | | |
| Foreign† | 173,190 | — | — | 173,190 |
| Mutual Funds | 67,275 | — | — | 67,275 |
† See Statement of Investments for additional detailed categorizations.
TheFund 19
NOTES TO FINANCIAL STATEMENTS (continued)
(b) Securities transactions and investment income: Securities transactions are recorded on a trade date basis. Realized gains and losses from securities transactions are recorded on the identified cost basis. Dividend income is recognized on the ex-dividend date and interest income, including, where applicable, accretion of discount and amortization of premium on investments, is recognized on the accrual basis.
(c) Affiliated issuers: Investments in other investment companies advised by Dreyfus are defined as “affiliated” in the Act. Investments in affiliated investment companies for the period ended August 31, 2012 were as follows:
| | | | | | | |
| Affiliated | | | | | | | |
| Investment | Value | | | | Value | | Net |
| Company | 12/20/2011 | ($) | Purchases ($) | Sales ($) | 8/31/2012 | ($) | Assets (%) |
| Dreyfus | | | | | | | |
| Institutional | | | | | | | |
| Preferred | | | | | | | |
| Plus Money | | | | | | | |
| Market Fund | — | | 3,547,731 | 3,480,456 | 67,275 | | 1.9 |
(d) Dividends to shareholders: Dividends are recorded on the ex-dividend date. Dividends from investment income-net and dividends from net realized capital gains, if any, are normally declared and paid annually, but the fund may make distributions on a more frequent basis to comply with the distribution requirements of the Internal Revenue Code of 1986, as amended (the “Code”).To the extent that net realized capital gains can be offset by capital loss carryovers, it is the policy of the fund not to distribute such gains. Income and capital gain distributions are determined in accordance with income tax regulations, which may differ from GAAP.
(e) Federal income taxes: It is the policy of the fund to continue to qualify as a regulated investment company, if such qualification is in the best interests of its shareholders, by complying with the applicable provisions of the Code, and to make distributions of taxable income sufficient to relieve it from substantially all federal income and excise taxes.
As of and during the period ended August 31, 2012, the fund did not have any liabilities for any uncertain tax positions.The fund recognizes
20
interest and penalties, if any, related to uncertain tax positions as income tax expense in the Statement of Operations. During the period, the fund did not incur any interest or penalties.
The tax year for the period ended August 31, 2012 remains subject to examination by the Internal Revenue Service and state taxing authorities.
At August 31, 2012, the components of accumulated earnings on a tax basis were as follows: undistributed ordinary income $101,561 and unrealized appreciation $387,041.
During the period ended August 31, 2012, as a result of permanent book to tax differences, primarily due to the tax treatment for fund start-up costs, the fund increased accumulated undistributed investment income-net by $1,683 and decreased paid-in capital by the same amount. Net assets and net asset value per share were not affected by this reclassification.
NOTE 2—Management Fee and Other Transactions With Affiliates:
(a) Pursuant to a management agreement with the Manager, the management fee is computed at an annual rate of .75% of the value of the fund’s average daily net assets and is payable monthly.
The Manager has contractually agreed, until January 1, 2013, to waive receipt of its fees and/or assume the expenses of the fund so that the expenses of none of the classes (excluding Rule 12b-1 Distribution Plan fees, Shareholder Services Plan fees, taxes, interest expense, brokerage commissions and extraordinary expenses) exceed .95% of the value of the fund’s average daily net assets.The reduction in expenses, pursuant to the undertaking, amounted to $146,282 during the period ended August 31, 2012.
During the period ended August 31, 2012, the Distributor retained $5 from commissions earned on sales of the fund’s Class A shares.
The Fund 21
NOTES TO FINANCIAL STATEMENTS (continued)
(b) Under the Distribution Plan adopted pursuant to Rule 12b-1 under the Act, Class C shares pay the Distributor for distributing its shares at an annual rate of .75% of the value of the average daily net assets of Class C shares. During the period ended August 31, 2012, Class C shares were charged $121 pursuant to the Distribution Plan.
(c) Under the Shareholder Services Plan, Class A and Class C shares pay the Distributor at an annual rate of .25% of the value of their average daily net assets for the provision of certain services.The services provided may include personal services relating to shareholder accounts, such as answering shareholder inquiries regarding the fund and providing reports and other information, and services related to the maintenance of shareholder accounts.The Distributor may make payments to Service Agents (securities dealers, financial institutions or other industry professionals) in respect of these services.The Distributor determines the amounts to be paid to Service Agents. During the period ended August 31, 2012, Class A and Class C shares were charged $71 and $40, respectively, pursuant to the Shareholder Services Plan.
The fund has arrangements with the transfer agent and the custodian whereby the fund may receive earnings credits when positive cash balances are maintained, which are used to offset transfer agency and custody fees. For financial reporting purposes, the fund includes net earnings credits as an expense offset in the Statement of Operations.
The fund compensates Dreyfus Transfer, Inc. (“DTI”), a wholly-owned subsidiary of the Manager, under a transfer agency agreement for providing transfer agency services for the fund and, since May 29, 2012, cash management services related to fund subscriptions and redemptions. During the period ended August 31, 2012, the fund was charged $219 for transfer agency services and $3 for cash management services. These fees are included in Shareholder servicing costs in the Statement of Operations.
The fund compensatesThe Bank of NewYork Mellon under a custody agreement for providing custodial services for the fund. During the period ended August 31, 2012, the fund was charged $2,139 pursuant to the custody agreement.
22
Prior to May 29, 2012, the fund compensated The Bank of NewYork Mellon under a cash management agreement for performing cash management services related to fund subscriptions and redemptions. During the period ended August 31, 2012, the fund was charged $12 pursuant to the cash management agreement, which is included in Shareholder servicing costs in the Statement of Operations.These fees were partially offset by earnings credits of $1.
During the period ended August 31, 2012, the fund was charged $5,835 for services performed by the Chief Compliance Officer and his staff.
The components of “Due to The Dreyfus Corporation and affiliates” in the Statement of Assets and Liabilities consist of: management fees $2,228, Distribution Plan fees $21, Shareholder Services Plan fees $18, custodian fees $1,397, Chief Compliance Officer fees $4,243 and transfer agency per account fees $47, which are offset against an expense reimbursement currently in effect in the amount of $7,621.
(d) Each Board member also serves as a Board member of other funds within the Dreyfus complex. Annual retainer fees and attendance fees are allocated to each fund based on net assets.
NOTE 3—Securities Transactions:
The aggregate amount of purchases and sales of investment securities, excluding short-term securities, during the period ended August 31, 2012, amounted to $4,524,014 and $1,507,552, respectively.
At August 31, 2012, the cost of investments for federal income tax purposes was $3,174,035; accordingly, accumulated net unrealized appreciation on investments was $387,041, consisting of $474,298 gross unrealized appreciation and $87,257 gross unrealized depreciation.
The Fund 23
REPORT OF INDEPENDENT REGISTERED
PUBLIC ACCOUNTING FIRM
Shareholders and Board of Directors Dreyfus Opportunistic U.S. Stock Fund
We have audited the accompanying statement of assets and liabilities, including the statement of investments, of Dreyfus Opportunistic U.S. Stock Fund (one of the series comprising Advantage Funds, Inc.) as of August 31, 2012, and the related statements of operations and changes in net assets and financial highlights for the period from December 20, 2011 (commencement of operations) to August 31, 2012.These financial statements and financial highlights are the responsibility of the Fund’s management. Our responsibility is to express an opinion on these financial statements and financial highlights based on our audit.
We conducted our audit in accordance with the standards of the Public Company Accounting Oversight Board (United States).Those standards require that we plan and perform the audit to obtain reasonable assurance about whether the financial statements and financial highlights are free of material misstatement.We were not engaged to perform an audit of the Fund’s internal control over financial reporting. Our audit included consideration of internal control over financial reporting as a basis for designing audit procedures that are appropriate in the circumstances, but not for the purpose of expressing an opinion on the effectiveness of the Fund’s internal control over financial reporting.Accordingly, we express no such opinion. An audit also includes examining, on a test basis, evidence supporting the amounts and disclosures in the financial statements and financial highlights, assessing the accounting principles used and significant estimates made by management, and evaluating the overall financial statement presentation. Our procedures included confirmation of securities owned as of August 31, 2012 by correspondence with the custodian and others. We believe that our audit provides a reasonable basis for our opinion.
In our opinion, the financial statements and financial highlights referred to above present fairly, in all material respects, the financial position of Dreyfus Opportunistic U.S. Stock Fund at August 31, 2012, and the results of its operations, the changes in its net assets and the financial highlights for the period from December 20, 2011 to August 31, 2012, in conformity with U.S. generally accepted accounting principles.

New York, New York
October 29, 2012
24
PROXY RESULTS (Unaudited)
The Company held a special meeting of shareholders on August 3, 2012.The proposal considered at the meeting, and the results, are as follows:
| | | |
| | | Shares | |
| | Votes For | | Authority Withheld |
| To elect additional Board Members: | | | |
| Lynn Martin† | 90,334,756 | | 3,252,629 |
| Robin A. Melvin† | 90,449,622 | | 3,137,763 |
| Philip L. Toia† | 90,229,928 | | 3,357,457 |
† Each new Board Member’s term commenced on September 1, 2012.
In addition Peggy C. Davis, Joseph S. DiMartino, David P. Feldman, Ehud Houminer and Dr. Martin Peretz continue
as Board Members of the Company.
The Fund 25
BOARD MEMBERS INFORMATION (Unaudited)

26
The Fund 27
OFFICERS OF THE FUND (Unaudited)
28

The Fund 29
For More Information

Telephone Call your financial representative or 1-800-DREYFUS
Mail The Dreyfus Family of Funds, 144 Glenn Curtiss Boulevard, Uniondale, NY 11556-0144
The fund files its complete schedule of portfolio holdings with the Securities and Exchange Commission (“SEC”) for the first and third quarters of each fiscal year on Form N-Q. The fund’s Forms N-Q are available on the SEC’s website at http://www.sec.gov and may be reviewed and copied at the SEC’s Public Reference Room in Washington, DC. Information on the operation of the Public Reference Room may be obtained by calling 1-800-SEC-0330.
A description of the policies and procedures that the fund uses to determine how to vote proxies relating to portfolio securities, and information regarding how the fund voted these proxies for the most recent 12-month period ended June 30 is available at http://www.dreyfus.com and on the SEC’s website at http://www.sec.gov. The description of the policies and procedures is also available without charge, upon request, by calling 1-800-DREYFUS.

|
| © 2012 MBSC Securities Corporation |
Dreyfus
Strategic Value Fund
ANNUAL REPORT August 31, 2012

Save time. Save paper. View your next shareholder report online as soon as it’s available. Log into www.dreyfus.com and sign up for Dreyfus eCommunications. It’s simple and only takes a few minutes.
The views expressed in this report reflect those of the portfolio manager only through the end of the period covered and do not necessarily represent the views of Dreyfus or any other person in the Dreyfus organization. Any such views are subject to change at any time based upon market or other conditions and Dreyfus disclaims any responsibility to update such views.These views may not be relied on as investment advice and, because investment decisions for a Dreyfus fund are based on numerous factors, may not be relied on as an indication of trading intent on behalf of any Dreyfus fund.
Not FDIC-Insured • Not Bank-Guaranteed • May Lose Value
| |
| | Contents |
| |
| |
| | THE FUND |
| 2 | A Letter from the Chairman and CEO |
| 3 | Discussion of Fund Performance |
| 6 | Fund Performance |
| 8 | Understanding Your Fund’s Expenses |
| 8 | Comparing Your Fund’s Expenses |
| With Those of Other Funds |
| 9 | Statement of Investments |
| 14 | Statement of Assets and Liabilities |
| 15 | Statement of Operations |
| 16 | Statement of Changes in Net Assets |
| 18 | Financial Highlights |
| 21 | Notes to Financial Statements |
| 34 | Report of Independent Registered |
| | Public Accounting Firm |
| 35 | Important Tax Information |
| 36 | Proxy Results |
| 37 | Information About the Renewal of |
| | the Fund’s Management Agreement |
| 42 | Board Members Information |
| 44 | Officers of the Fund |
| |
| FOR MORE INFORMATION |
|
| | Back Cover |
Dreyfus
Strategic Value Fund
The Fund

A LETTER FROM THE CHAIRMAN AND CEO
Dear Shareholder:
We are pleased to present this annual report for Dreyfus Strategic Value Fund, covering the 12-month period from September 1, 2011, through August 31, 2012. For information about how the fund performed during the reporting period, as well as general market perspectives, we provide a Discussion of Fund Performance on the pages that follow.
U.S. equities proved unusually volatile over the past year, as prices rose and fell according to investors’ changing expectations of global and domestic economic conditions. When viewed over a longer time frame, however, the pace of U.S. economic growth has been relatively consistent at about half the average rate achieved in prior recoveries. Even U.S. employment numbers, which have been volatile over short periods, averaged slightly better than 150,000 new jobs a month so far in 2012, roughly unchanged from the monthly average in 2011.
The sustained but subpar U.S. expansion appears likely to continue over the foreseeable future. On one hand, the economy has responded to a variety of stimulative measures, most notably an aggressively accommodative monetary policy. On the other hand, the prospect of automatic spending cuts and tax hikes scheduled for the end of 2012 has weighed on economic growth by contributing to a temporary postponement of spending decisions among consumers and businesses. Indeed, the ability of the U.S. political system to address both this “fiscal cliff” and long-term deficit reduction could go a long way toward shaping the 2013 market environment.As always, we urge you to speak regularly with your financial advisor to discuss how changing economic conditions may affect your investments.
Thank you for your continued confidence and support.

Jonathan R. Baum
Chairman and Chief Executive Officer
The Dreyfus Corporation
September 17, 2012
2

DISCUSSION OF FUND PERFORMANCE
For the period of September 1, 2011, through August 31, 2012, as provided by Brian Ferguson, Portfolio Manager
Fund and Market Performance Overview
For the 12-month period ended August 31, 2012, Dreyfus Strategic Value Fund’s Class A shares produced a total return of 12.31%, Class C shares produced a total return of 11.50% and Class I shares produced a total return of 12.57%.1 The fund’s benchmark, the Russell 1000 Value Index, produced a total return of 17.30% for the same period.2
Changing economic sentiment fueled heightened market volatility, as stock market declines in September 2011 and during the spring of 2012 were more than offset by gains at other times of the reporting period. The fund produced lower returns than its benchmark, largely due to shortfalls in the information technology, materials and consumer staples sectors.
The Fund’s Investment Approach
The fund seeks capital appreciation.We identify potential investments through extensive quantitative and fundamental research.The fund will focus on individual stock selection (a “bottom-up” approach), emphasizing three key factors: value, quantitative screens track traditional measures, such as price-to-earnings, price-to-book and price-to-sales ratios, which are analyzed and compared against the market; sound business fundamentals, a company’s balance sheet and income data are examined to determine the company’s financial history; and positive business momentum, a company’s earnings and forecast changes are analyzed and sales and earnings trends are reviewed to determine the company’s financial condition or the presence of a catalyst that will trigger a price increase near- to mid-term.
The fund typically sells a stock when we believe there is a more attractive alternative, the stock’s valuation is excessive, or there are deteriorating fundamentals, such as a loss of competitive advantage, a failure in management execution or deteriorating capital structure.
The Fund 3
DISCUSSION OF FUND PERFORMANCE (continued)
Markets Reacted to Shifting Macroeconomic Developments
The reporting period began in the midst of major stock market declines. One credit-rating agency’s downgrade of long-term U.S. government debt, an intensifying debt crisis in Europe, and inflation-fighting programs in China in the weeks prior to the start of the reporting period triggered a flight away from stocks and other risky assets. Fortunately, better U.S. economic data and new remedial measures from European and Chinese policymakers arrested the decline during the fall.
By the beginning of 2012, U.S. stocks were rallying amid domestic employment gains, a quantitative easing program in Europe, and less restrictive monetary and fiscal policies in China. Investors grew more tolerant of risks, focusing more intently on company fundamentals and less on macroeconomic developments. However, these positive influences were called into question during the spring, when the U.S. labor market’s rebound slowed, measures designed to relieve fiscal pressures in Europe encountered resistance, and the Chinese economy remained sluggish.The summer saw the market rally resume amid more encouraging economic news, and the Russell 1000Value Index ended the reporting period with double-digit gains.
Consumer Discretionary and Health Care Stocks Buoyed Fund Results
While the fund participated in the reporting period’s gains to a significant degree, its relative performance was undermined by weak stock selections in the information technology sector, where video game maker Electronic Arts struggled with management changes, a disappointing new product and an industry-wide shift to an online distribution model. In the materials sector, falling commodity prices stemming from an economic slowdown in the emerging markets hurt the stock prices of Freeport-McMoRan Copper & Gold and chemicals manufacturer Celanese. Finally, the fund’s stock selections in the consumer staples sector fell short of market averages, primarily due to competitive pressures affecting battery maker Energizer Holdings.
The fund achieved better relative results in the utilities sector, where it avoided the area’s weakness by maintaining an underweighted position amid generally rich valuations. In the consumer discretionary sector,
4
investors welcomed News Corp.’s decision to split the company into a fast growing media segment and a slow growing publishing segment. In addition, homebuilders Toll Brothers and PulteGroup along with retailer Home Depot responded well to the early stages of a housing market recovery. In other areas, oil refinerValero Energy reported strong earnings and announced a separation of its retail business to unlock value.
Adopting a Constructive Investment Posture
Although headwinds from Europe and the emerging markets remain, we believe that a gradual U.S. economic recovery is likely to persist. Our value-oriented investment process has identified a number of attractive opportunities in the information technology sector, where non-cyclical trends toward cloud computing and mobile wireless could send stocks of well-positioned companies higher.We also have continued to find attractive values in the media industry. On the other hand, we have identified fewer stocks meeting our investment criteria in the traditionally defensive utilities and telecommunications sectors.
September 17, 2012
Please note, the position in any security highlighted with italicized typeface was sold during the
reporting period.
Equity funds are subject generally to market, market sector, market liquidity, issuer and investment
style risks, among other factors, to varying degrees, all of which are more fully described in the
fund’s prospectus.
The fund’s performance will be influenced by political, social and economic factors affecting
investments in foreign companies. Special risks associated with investments in foreign companies
include exposure to currency fluctuations, less liquidity, less developed or less efficient trading
markets, lack of comprehensive company information, political instability and differing auditing
and legal standards.These risks are enhanced in emerging market countries. Please read the
prospectus for further discussion of these risks.
1 Total return includes reinvestment of dividends and any capital gains paid and does not take into
consideration the maximum initial sales charge in the case of Class A shares, or the applicable
contingent deferred sales charges imposed on redemptions in the case of Class C shares. Had these
charges been reflected, returns would have been lower. Past performance is no guarantee of future
results. Share price and investment return fluctuate such that upon redemption fund shares may be
worth more or less than their original cost.The fund’s returns reflect the absorption of certain fund
expenses by The Dreyfus Corporation pursuant to an agreement in effect through December 31,
2013, at which time it may be extended, terminated or modified. Had these expenses not been
absorbed, the fund’s returns would have been lower.
2 SOURCE: LIPPER INC. — Reflects the reinvestment of dividends and, where applicable,
capital gain distributions.The Russell 1000 Value Index is an unmanaged index which measures
the performance of those Russell 1000 companies with lower price-to-book ratios and lower
forecasted growth values. Investors cannot invest directly in any index.
The Fund 5
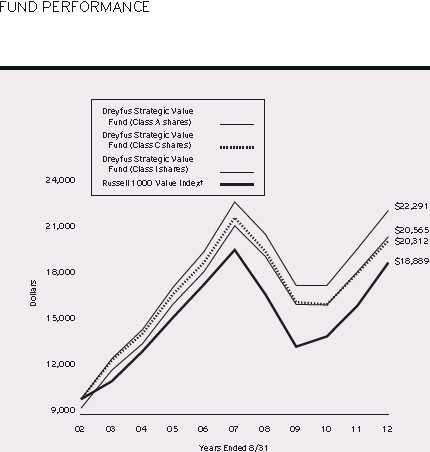
Comparison of change in value of $10,000 investment in Dreyfus Strategic Value Fund Class A
shares, Class C shares and Class I shares and the Russell 1000 Value Index
† Source: Lipper Inc.
Past performance is not predictive of future performance.
The above graph compares a $10,000 investment made in each of the Class A, Class C and Class I shares of Dreyfus
Strategic Value Fund on 8/31/02 to a $10,000 investment made in the Russell 1000 Value Index (the “Index”) on
that date.All dividends and capital gain distributions are reinvested.
The fund’s performance shown in the line graph above takes into account the maximum initial sales charge on Class A
shares and all other applicable fees and expenses on all classes.The Index uses company price-to-book ratios and
long-term growth rates to calculate a composite ranking, which is used to determine if a stock is “growth” or “value.”
Unlike a mutual fund, the Index is not subject to charges, fees and other expenses. Investors cannot invest directly in
any index. Further information relating to fund performance, including expense reimbursements, if applicable, is
contained in the Financial Highlights section of the prospectus and elsewhere in this report.
6
| | | | | | |
| Average Annual Total Returns as of 8/31/12 | | | | | |
| | 1 | Year | 5 Years | | 10 Years | |
| Class A shares | | | | | | |
| with maximum sales charge (5.75%) | 5.87 | % | –1.86 | % | 7.48 | % |
| without sales charge | 12.31 | % | –0.69 | % | 8.12 | % |
| Class C shares | | | | | | |
| with applicable redemption charge † | 10.50 | % | –1.43 | % | 7.34 | % |
| without redemption | 11.50 | % | –1.43 | % | 7.34 | % |
| Class I shares | 12.57 | % | –0.49 | % | 8.35 | % |
| Russell 1000 Value Index | 17.30 | % | –0.85 | % | 6.57 | % |
Past performance is not predictive of future performance.The fund’s performance shown in the graph and table does not
reflect the deduction of taxes that a shareholder would pay on fund distributions or the redemption of fund shares.
† The maximum contingent deferred sales charge for Class C shares is 1% for shares redeemed within one year of the
date of purchase.
The Fund 7
UNDERSTANDING YOUR FUND’S EXPENSES (Unaudited)
As a mutual fund investor, you pay ongoing expenses, such as management fees and other expenses. Using the information below, you can estimate how these expenses affect your investment and compare them with the expenses of other funds.You also may pay one-time transaction expenses, including sales charges (loads) and redemption fees, which are not shown in this section and would have resulted in higher total expenses. For more information, see your fund’s prospectus or talk to your financial adviser.
Review your fund’s expenses
The table below shows the expenses you would have paid on a $1,000 investment in Dreyfus Strategic Value Fund from March 1, 2012 to August 31, 2012. It also shows how much a $1,000 investment would be worth at the close of the period, assuming actual returns and expenses.
Expenses and Value of a $1,000 Investment
assuming actual returns for the six months ended August 31, 2012
| | | | | | |
| | | Class A | | Class C | | Class I |
| Expenses paid per $1,000† | | $4.96 | | $8.74 | | $3.70 |
| Ending value (after expenses) | | $1,013.20 | | $1,009.40 | | $1,014.20 |
COMPARING YOUR FUND’S EXPENSES WITH THOSE OF OTHER FUNDS (Unaudited)
Using the SEC’s method to compare expenses
The Securities and Exchange Commission (SEC) has established guidelines to help investors assess fund expenses. Per these guidelines, the table below shows your fund’s expenses based on a $1,000 investment, assuming a hypothetical 5% annualized return. You can use this information to compare the ongoing expenses (but not transaction expenses or total cost) of investing in the fund with those of other funds.All mutual fund shareholder reports will provide this information to help you make this comparison. Please note that you cannot use this information to estimate your actual ending account balance and expenses paid during the period.
Expenses and Value of a $1,000 Investment
assuming a hypothetical 5% annualized return for the six months ended August 31, 2012
| | | | | | |
| | | Class A | | Class C | | Class I |
| Expenses paid per $1,000† | | $4.98 | | $8.77 | | $3.71 |
| Ending value (after expenses) | | $1,020.21 | | $1,016.44 | | $1,021.47 |
† Expenses are equal to the fund’s annualized expense ratio of .98% for Class A, 1.73% for Class C and .73%
for Class I, multiplied by the average account value over the period, multiplied by 184/366 (to reflect the one-half
year period).
8
STATEMENT OF INVESTMENTS
August 31, 2012
| | | |
| Common Stocks—99.7% | Shares | | Value ($) |
| Automobiles & Components—2.0% | | | |
| Delphi Automotive | 198,740 | | 6,019,835 |
| General Motors | 191,111 | a | 4,080,220 |
| Johnson Controls | 426,190 | | 11,596,630 |
| | | | 21,696,685 |
| Banks—8.6% | | | |
| Comerica | 349,540 | | 10,734,373 |
| Fifth Third Bancorp | 634,145 | | 9,600,955 |
| PNC Financial Services Group | 179,490 | | 11,157,098 |
| SunTrust Banks | 227,760 | | 5,732,719 |
| U.S. Bancorp | 615,370 | | 20,559,512 |
| Wells Fargo & Co. | 1,094,480 | | 37,245,154 |
| | | | 95,029,811 |
| Capital Goods—6.3% | | | |
| Eaton | 301,050 | b | 13,462,956 |
| General Electric | 2,072,640 | | 42,924,374 |
| Honeywell International | 226,910 | | 13,262,889 |
| | | | 69,650,219 |
| Consumer Durables & Apparel—3.1% | | | |
| Newell Rubbermaid | 714,530 | | 12,811,523 |
| Pulte Group | 393,400 | a | 5,381,712 |
| PVH | 91,060 | | 8,550,534 |
| Toll Brothers | 232,090 | a | 7,593,985 |
| | | | 34,337,754 |
| Consumer Services—1.9% | | | |
| Carnival | 468,780 | | 16,257,290 |
| International Game Technology | 333,810 | | 4,102,525 |
| | | | 20,359,815 |
| Diversified Financials—10.7% | | | |
| Ameriprise Financial | 179,590 | | 9,861,287 |
| Capital One Financial | 217,570 | | 12,299,232 |
| Citigroup | 459,597 | | 13,654,627 |
| Discover Financial Services | 145,310 | | 5,627,856 |
| Franklin Resources | 60,550 | | 7,108,570 |
| Goldman Sachs Group | 101,700 | | 10,751,724 |
| Invesco | 233,600 | | 5,531,648 |
The Fund 9
STATEMENT OF INVESTMENTS (continued)
| | | | |
| Common Stocks (continued) | Shares | | | Value ($) |
| Diversified Financials (continued) | | | | |
| JPMorgan Chase & Co. | 734,008 | | | 27,261,057 |
| Moody’s | 328,180 | | | 12,995,928 |
| NASDAQ OMX Group | 181,790 | | | 4,157,537 |
| TD Ameritrade Holding | 493,590 | | | 8,445,325 |
| | | | | 117,694,791 |
| Energy—12.7% | | | | |
| Anadarko Petroleum | 110,910 | | | 7,682,736 |
| Cameron International | 410,778 | a | | 22,473,664 |
| EOG Resources | 195,025 | | | 21,121,208 |
| Exxon Mobil | 113,130 | | | 9,876,249 |
| Marathon Petroleum | 112,490 | | | 5,821,358 |
| Occidental Petroleum | 449,140 | | | 38,181,391 |
| Schlumberger | 216,780 | | | 15,690,536 |
| Valero Energy | 624,110 | | | 19,509,679 |
| | | | | 140,356,821 |
| Exchange Traded Funds—.4% | | | | |
| iShares Russell 1000 Value Index Fund | 67,310 | | | 4,737,278 |
| Food & Staples Retailing—1.2% | | | | |
| CVS Caremark | 180,200 | | | 8,208,110 |
| Wal-Mart Stores | 60,810 | | | 4,414,806 |
| | | | | 12,622,916 |
| Food, Beverage & Tobacco—5.7% | | | | |
| Coca-Cola Enterprises | 278,690 | | | 8,229,716 |
| ConAgra Foods | 441,890 | | | 11,095,858 |
| Dean Foods | 501,710 | a | | 8,238,078 |
| Kraft Foods, Cl. A | 402,780 | | | 16,727,453 |
| PepsiCo | 262,270 | | | 18,996,216 |
| | | | | 63,287,321 |
| Health Care Equipment & Services—3.7% | | | | |
| Baxter International | 216,940 | | | 12,730,039 |
| Cigna | 198,190 | | | 9,071,156 |
| Humana | 107,370 | | | 7,524,490 |
| McKesson | 105,950 | | | 9,229,305 |
| Medtronic | 50,960 | | | 2,072,034 |
| | | | | 40,627,024 |
10
| | | | |
| Common Stocks (continued) | Shares | | | Value ($) |
| Household & | | | | |
| Personal Products—.9% | | | | |
| Energizer Holdings | 150,410 | | | 10,363,249 |
| Insurance—6.4% | | | | |
| American International Group | 119,440 | a | | 4,100,375 |
| Aon | 199,995 | | | 10,391,740 |
| Chubb | 209,870 | | | 15,507,294 |
| Marsh & McLennan | 469,050 | | | 16,027,439 |
| MetLife | 440,679 | | | 15,040,373 |
| Prudential Financial | 180,760 | | | 9,853,228 |
| | | | | 70,920,449 |
| Materials—3.9% | | | | |
| Celanese, Ser. A | 135,270 | | | 5,175,430 |
| Dow Chemical | 365,100 | | | 10,701,081 |
| Eastman Chemical | 99,270 | | | 5,485,660 |
| International Paper | 305,540 | | | 10,559,462 |
| LyondellBasell Industries, Cl. A | 119,010 | b | | 5,812,448 |
| Mosaic | 92,110 | | | 5,334,090 |
| | | | | 43,068,171 |
| Media—8.4% | | | | |
| CBS, Cl. B | 151,748 | | | 5,514,522 |
| News, Cl. A | 1,047,730 | | | 24,506,405 |
| Omnicom Group | 319,270 | | | 16,400,900 |
| Time Warner | 260,046 | | | 10,804,911 |
| Viacom, Cl. B | 269,990 | | | 13,502,200 |
| Walt Disney | 439,090 | | | 21,721,782 |
| | | | | 92,450,720 |
| Pharmaceuticals, Biotech & | | | | |
| Life Sciences—10.3% | | | | |
| Eli Lilly & Co. | 115,950 | | | 5,207,315 |
| Johnson & Johnson | 362,277 | | | 24,428,338 |
| Merck & Co. | 637,770 | | | 27,455,999 |
| Mylan | 229,270 | a | | 5,403,894 |
| Pfizer | 1,910,610 | | | 45,587,155 |
| Thermo Fisher Scientific | 103,060 | | | 5,910,491 |
| | | | | 113,993,192 |
The Fund 11
STATEMENT OF INVESTMENTS (continued)
| | | |
| Common Stocks (continued) | Shares | | Value ($) |
| Retailing—1.7% | | | |
| American Eagle Outfitters | 323,910 | | 7,203,758 |
| Macy’s | 286,560 | | 11,551,234 |
| | | | 18,754,992 |
| Semiconductors & Semiconductor | | | |
| Equipment—1.0% | | | |
| Texas Instruments | 381,070 | | 11,066,273 |
| Software & Services—2.2% | | | |
| Google, Cl. A | 8,182 | a | 5,605,406 |
| Oracle | 602,650 | | 19,073,873 |
| | | | 24,679,279 |
| Technology Hardware & Equipment—6.1% | | | |
| Cisco Systems | 1,006,170 | | 19,197,724 |
| Corning | 398,410 | | 4,776,936 |
| EMC | 312,470 | a | 8,214,836 |
| QUALCOMM | 407,180 | | 25,025,283 |
| SanDisk | 239,440 | a | 9,869,717 |
| | | | 67,084,496 |
| Transportation—2.0% | | | |
| FedEx | 157,970 | | 13,842,911 |
| Union Pacific | 66,720 | | 8,102,477 |
| | | | 21,945,388 |
| Utilities—.5% | | | |
| NRG Energy | 275,830 | | 5,886,212 |
| Total Common Stocks | | | |
| (cost $1,057,608,558) | | | 1,100,612,856 |
| |
| Other Investment—.0% | | | |
| Registered Investment Company; | | | |
| Dreyfus Institutional Preferred | | | |
| Plus Money Market Fund | | | |
| (cost $405,098) | 405,098 | c | 405,098 |
12
| | | | |
| Investment of Cash Collateral | | | | |
| for Securities Loaned—1.3% | Shares | | Value ($) | |
| Registered Investment Company; | | | | |
| Dreyfus Institutional Cash Advantage Fund | | | | |
| (cost $13,857,632) | 13,857,632 | c | 13,857,632 | |
| Total Investments (cost $1,071,871,288) | 101.0 | % | 1,114,875,586 | |
| Liabilities, Less Cash and Receivables | (1.0 | %) | (11,448,296 | ) |
| Net Assets | 100.0 | % | 1,103,427,290 | |
a Non-income producing security.
b Security, or portion thereof, on loan.At August 31, 2012, the value of the fund’s securities on loan was
$13,617,465 and the value of the collateral held by the fund was $13,857,632.
c Investment in affiliated money market mutual fund.
| | | |
| Portfolio Summary (Unaudited)† | | |
| |
| | Value (%) | | Value (%) |
| Energy | 12.7 | Software & Services | 2.2 |
| Diversified Financials | 10.7 | Automobiles & Components | 2.0 |
| Pharmaceuticals, | | Transportation | 2.0 |
| Biotech & Life Sciences | 10.3 | Consumer Services | 1.9 |
| Banks | 8.6 | Retailing | 1.7 |
| Media | 8.4 | Money Market Investments | 1.3 |
| Insurance | 6.4 | Food & Staples Retailing | 1.2 |
| Capital Goods | 6.3 | Semiconductors & | |
| Technology Hardware & Equipment | 6.1 | Semiconductor Equipment | 1.0 |
| Food, Beverage & Tobacco | 5.7 | Household & Personal Products | .9 |
| Materials | 3.9 | Utilities | .5 |
| Health Care Equipment & Services | 3.7 | Exchange Traded Funds | .4 |
| Consumer Durables & Apparel | 3.1 | | 101.0 |
| |
| † Based on net assets. | | | |
| See notes to financial statements. | | | |
The Fund 13
STATEMENT OF ASSETS AND LIABILITIES
August 31, 2012
| | | | |
| | | Cost | Value | |
| Assets ($): | | | | |
| Investments in securities—See Statement of Investments (including | | | |
| securities on loan, valued at $13,617,465)—Note 1(b): | | | |
| Unaffiliated issuers | | 1,057,608,558 | 1,100,612,856 | |
| Affiliated issuers | | 14,262,730 | 14,262,730 | |
| Cash | | | 190,575 | |
| Receivable for shares of Common Stock subscribed | | 2,378,102 | |
| Dividends and securities lending income receivable | | | 2,033,216 | |
| Prepaid expenses | | | 64,488 | |
| | | | 1,119,541,967 | |
| Liabilities ($): | | | | |
| Due to The Dreyfus Corporation and affiliates—Note 3(c) | | 895,754 | |
| Liability for securities on loan—Note 1(b) | | | 13,857,632 | |
| Payable for shares of Common Stock redeemed | | | 1,012,796 | |
| Interest payable—Note 2 | | | 524 | |
| Accrued expenses | | | 347,971 | |
| | | | 16,114,677 | |
| Net Assets ($) | | | 1,103,427,290 | |
| Composition of Net Assets ($): | | | | |
| Paid-in capital | | | 1,112,511,889 | |
| Accumulated undistributed investment income—net | | | 6,771,693 | |
| Accumulated net realized gain (loss) on investments | | (58,860,590 | ) |
| Accumulated net unrealized appreciation | | | | |
| (depreciation) on investments | | | 43,004,298 | |
| Net Assets ($) | | | 1,103,427,290 | |
| |
| |
| Net Asset Value Per Share | | | | |
| | Class A | Class C | Class I | |
| Net Assets ($) | 875,702,887 | 47,823,929 | 179,900,474 | |
| Shares Outstanding | 29,911,752 | 1,712,476 | 6,131,345 | |
| Net Asset Value Per Share ($) | 29.28 | 27.93 | 29.34 | |
| |
| See notes to financial statements. | | | | |
14
| | |
| STATEMENT OF OPERATIONS | | |
| Year Ended August 31, 2012 | | |
| |
| |
| |
| |
| Investment Income ($): | | |
| Income: | | |
| Cash dividends (net of $7,141 foreign taxes withheld at source): | | |
| Unaffiliated issuers | 20,720,932 | |
| Affiliated issuers | 2,530 | |
| Income from securities lending—Note 1(b) | 31,745 | |
| Total Income | 20,755,207 | |
| Expenses: | | |
| Management fee—Note 3(a) | 7,571,797 | |
| Shareholder servicing costs—Note 3(c) | 3,555,257 | |
| Distribution fees—Note 3(b) | 384,547 | |
| Prospectus and shareholders’ reports | 152,412 | |
| Directors’ fees and expenses—Note 3(d) | 115,199 | |
| Professional fees | 109,617 | |
| Custodian fees—Note 3(c) | 79,141 | |
| Registration fees | 78,612 | |
| Loan commitment fees—Note 2 | 10,734 | |
| Interest expense—Note 2 | 8,592 | |
| Miscellaneous | 82,756 | |
| Total Expenses | 12,148,664 | |
| Less—reduction in expenses due to undertaking—Note 3(a) | (2,272,053 | ) |
| Less—reduction in fees due to earnings credits—Note 3(c) | (1,537 | ) |
| Net Expenses | 9,875,074 | |
| Investment Income—Net | 10,880,133 | |
| Realized and Unrealized Gain (Loss) on Investments—Note 4 ($): | | |
| Net realized gain (loss) on investments | 50,702,015 | |
| Net unrealized appreciation (depreciation) on investments | 67,676,661 | |
| Net Realized and Unrealized Gain (Loss) on Investments | 118,378,676 | |
| Net Increase in Net Assets Resulting from Operations | 129,258,809 | |
| |
| See notes to financial statements. | | |
The Fund 15
STATEMENT OF CHANGES IN NET ASSETS
| | | | |
| | Year Ended August 31, | |
| | 2012 | a | 2011 | |
| Operations ($): | | | | |
| Investment income—net | 10,880,133 | | 5,824,302 | |
| Net realized gain (loss) on investments | 50,702,015 | | 97,982,582 | |
| Net unrealized appreciation | | | | |
| (depreciation) on investments | 67,676,661 | | (22,195,946 | ) |
| Net Increase (Decrease) in Net Assets | | | | |
| Resulting from Operations | 129,258,809 | | 81,610,938 | |
| Dividends to Shareholders from ($): | | | | |
| Investment income—net: | | | | |
| Class A Shares | (6,241,886 | ) | (4,284,720 | ) |
| Class C Shares | — | | (4,026 | ) |
| Class I Shares | (1,577,119 | ) | (712,083 | ) |
| Total Dividends | (7,819,005 | ) | (5,000,829 | ) |
| Capital Stock Transactions ($): | | | | |
| Net proceeds from shares sold: | | | | |
| Class A Shares | 128,488,839 | | 180,463,006 | |
| Class B Shares | 1,565 | | 107,295 | |
| Class C Shares | 3,786,516 | | 14,905,564 | |
| Class I Shares | 62,326,740 | | 124,773,051 | |
| Net assets received in connection | | | | |
| with reorganizations—Note 1 | 353,949,950 | | — | |
| Dividends reinvested: | | | | |
| Class A Shares | 5,700,603 | | 3,979,862 | |
| Class C Shares | — | | 3,009 | |
| Class I Shares | 1,049,597 | | 589,826 | |
| Cost of shares redeemed: | | | | |
| Class A Shares | (233,145,452 | ) | (193,366,113 | ) |
| Class B Shares | (2,713,308 | ) | (2,963,623 | ) |
| Class C Shares | (18,582,801 | ) | (16,686,438 | ) |
| Class I Shares | (94,829,486 | ) | (73,748,652 | ) |
| Increase (Decrease) in Net Assets | | | | |
| from Capital Stock Transactions | 206,032,763 | | 38,056,787 | |
| Total Increase (Decrease) in Net Assets | 327,472,567 | | 114,666,896 | |
| Net Assets ($): | | | | |
| Beginning of Period | 775,954,723 | | 661,287,827 | |
| End of Period | 1,103,427,290 | | 775,954,723 | |
| Undistributed investment income—net | 6,771,693 | | 3,710,565 | |
16
| | | | |
| | Year Ended August 31, | |
| | 2012 | a | 2011 | |
| Capital Share Transactions: | | | | |
| Class Ab | | | | |
| Shares sold | 4,714,718 | | 6,288,752 | |
| Shares issued in connection with | | | | |
| reorganizations—Note 1 | 10,646,596 | | — | |
| Shares issued for dividends reinvested | 224,162 | | 143,263 | |
| Shares redeemed | (8,492,414 | ) | (6,868,340 | ) |
| Net Increase (Decrease) in Shares Outstanding | 7,093,062 | | (436,325 | ) |
| Class Bb | | | | |
| Shares sold | 67 | | 3,785 | |
| Shares issued in connection with | | | | |
| reorganizations—Note 1 | 13,936 | | — | |
| Shares redeemed | (102,676 | ) | (110,504 | ) |
| Net Increase (Decrease) in Shares Outstanding | (88,673 | ) | (106,719 | ) |
| Class C | | | | |
| Shares sold | 144,504 | | 535,560 | |
| Shares issued in connection with | | | | |
| reorganizations—Note 1 | 250,370 | | — | |
| Shares issued for dividends reinvested | — | | 113 | |
| Shares redeemed | (709,697 | ) | (620,905 | ) |
| Net Increase (Decrease) in Shares Outstanding | (314,823 | ) | (85,232 | ) |
| Class I | | | | |
| Shares sold | 2,268,678 | | 4,337,271 | |
| Shares issued in connection with | | | | |
| reorganizations—Note 1 | 2,618,126 | | — | |
| Shares issued for dividends reinvested | 41,258 | | 21,247 | |
| Shares redeemed | (3,495,457 | ) | (2,580,629 | ) |
| Net Increase (Decrease) in Shares Outstanding | 1,432,605 | | 1,777,889 | |
a Effective as of the close of business on March 13, 2012, the fund no longer offers Class B shares.
b During the period ended August 31, 2012, 54,767 Class B shares representing $1,434,811, were automatically
converted to 52,280 Class A shares and during the period ended August 31, 2011, 49,753 Class B shares
representing $1,350,217 were automatically converted to 47,592 Class A shares.
See notes to financial statements.
The Fund 17
FINANCIAL HIGHLIGHTS
The following tables describe the performance for each share class for the fiscal periods indicated.All information (except portfolio turnover rate) reflects financial results for a single fund share.Total return shows how much your investment in the fund would have increased (or decreased) during each period, assuming you had reinvested all dividends and distributions.These figures have been derived from the fund’s financial statements.
| | | | | | | | | | |
| | | | Year Ended August 31, | | | |
| Class A Shares | 2012 | | 2011 | | 2010 | | 2009 | | 2008 | |
| Per Share Data ($): | | | | | | | | | | |
| Net asset value, beginning of period | 26.27 | | 23.30 | | 23.50 | | 28.42 | | 33.56 | |
| Investment Operations: | | | | | | | | | | |
| Investment income—neta | .30 | | .21 | | .14 | | .22 | | .27 | |
| Net realized and unrealized | | | | | | | | | | |
| gain (loss) on investments | 2.91 | | 2.95 | | (.20 | ) | (4.88 | ) | (3.21 | ) |
| Total from Investment Operations | 3.21 | | 3.16 | | (.06 | ) | (4.66 | ) | (2.94 | ) |
| Distributions: | | | | | | | | | | |
| Dividends from investment income—net | (.20 | ) | (.19 | ) | (.14 | ) | (.26 | ) | (.29 | ) |
| Dividends from net realized | | | | | | | | | | |
| gain on investments | — | | — | | — | | — | | (1.91 | ) |
| Total Distributions | (.20 | ) | (.19 | ) | (.14 | ) | (.26 | ) | (2.20 | ) |
| Net asset value, end of period | 29.28 | | 26.27 | | 23.30 | | 23.50 | | 28.42 | |
| Total Return (%)b | 12.31 | | 13.52 | | (.29 | ) | (16.14 | ) | (9.39 | ) |
| Ratios/Supplemental Data (%): | | | | | | | | | | |
| Ratio of total expenses | | | | | | | | | | |
| to average net assets | 1.20 | | 1.20 | | 1.22 | | 1.27 | | 1.16 | |
| Ratio of net expenses | | | | | | | | | | |
| to average net assets | .98 | | .98 | | 1.05 | | 1.26 | | 1.16 | |
| Ratio of net investment income | | | | | | | | | | |
| to average net assets | 1.07 | | .74 | | .56 | | 1.09 | | .88 | |
| Portfolio Turnover Rate | 95.38 | | 88.37 | | 91.83 | | 119.48 | | 107.46 | |
| Net Assets, end of period ($ x 1,000) | 875,703 | | 599,377 | | 541,877 | | 505,409 | | 526,723 | |
a Based on average shares outstanding at each month end.
b Exclusive of sales charge.
See notes to financial statements.
18
| | | | | | | | | |
| | | Year Ended August 31, | | | |
| Class C Shares | 2012 | 2011 | | 2010 | | 2009 | | 2008 | |
| Per Share Data ($): | | | | | | | | | |
| Net asset value, beginning of period | 25.05 | 22.24 | | 22.45 | | 27.17 | | 32.22 | |
| Investment Operations: | | | | | | | | | |
| Investment income (loss)—neta | .08 | (.00 | )b | (.05 | ) | .07 | | .04 | |
| Net realized and unrealized | | | | | | | | | |
| gain (loss) on investments | 2.80 | 2.81 | | (.16 | ) | (4.67 | ) | (3.09 | ) |
| Total from Investment Operations | 2.88 | 2.81 | | (.21 | ) | (4.60 | ) | (3.05 | ) |
| Distributions: | | | | | | | | | |
| Dividends from investment income—net | — | (.00 | )b | — | | (.12 | ) | (.09 | ) |
| Dividends from net realized | | | | | | | | | |
| gain on investments | — | — | | — | | — | | (1.91 | ) |
| Total Distributions | — | (.00 | )b | — | | (.12 | ) | (2.00 | ) |
| Net asset value, end of period | 27.93 | 25.05 | | 22.24 | | 22.45 | | 27.17 | |
| Total Return (%)c | 11.50 | 12.64 | | (.94 | ) | (16.83 | ) | (10.05 | ) |
| Ratios/Supplemental Data (%): | | | | | | | | | |
| Ratio of total expenses | | | | | | | | | |
| to average net assets | 1.97 | 1.93 | | 1.95 | | 2.04 | | 1.92 | |
| Ratio of net expenses | | | | | | | | | |
| to average net assets | 1.73 | 1.73 | | 1.80 | | 2.03 | | 1.91 | |
| Ratio of net investment income | | | | | | | | | |
| (loss) to average net assets | .32 | (.01 | ) | (.19 | ) | .34 | | .13 | |
| Portfolio Turnover Rate | 95.38 | 88.37 | | 91.83 | | 119.48 | | 107.46 | |
| Net Assets, end of period ($ x 1,000) | 47,824 | 50,792 | | 46,986 | | 43,593 | | 53,065 | |
a Based on average shares outstanding at each month end.
b Amount represents less than $.01 per share.
c Exclusive of sales charge.
See notes to financial statements.
The Fund 19
FINANCIAL HIGHLIGHTS (continued)
| | | | | | | | | | |
| | | | Year Ended August 31, | | | |
| Class I Shares | 2012 | | 2011 | | 2010 | | 2009 | | 2008 | |
| Per Share Data ($): | | | | | | | | | | |
| Net asset value, beginning of period | 26.30 | | 23.31 | | 23.48 | | 28.45 | | 33.58 | |
| Investment Operations: | | | | | | | | | | |
| Investment income—neta | .37 | | .28 | | .21 | | .25 | | .24 | |
| Net realized and unrealized | | | | | | | | | | |
| gain (loss) on investments | 2.90 | | 2.94 | | (.21 | ) | (4.91 | ) | (3.13 | ) |
| Total from Investment Operations | 3.27 | | 3.22 | | — | | (4.66 | ) | (2.89 | ) |
| Distributions: | | | | | | | | | | |
| Dividends from investment income—net | (.23 | ) | (.23 | ) | (.17 | ) | (.31 | ) | (.33 | ) |
| Dividends from net realized | | | | | | | | | | |
| gain on investments | — | | — | | — | | — | | (1.91 | ) |
| Total Distributions | (.23 | ) | (.23 | ) | (.17 | ) | (.31 | ) | (2.24 | ) |
| Net asset value, end of period | 29.34 | | 26.30 | | 23.31 | | 23.48 | | 28.45 | |
| Total Return (%) | 12.57 | | 13.83 | | (.07 | ) | (16.06 | ) | (9.21 | ) |
| Ratios/Supplemental Data (%): | | | | | | | | | | |
| Ratio of total expenses | | | | | | | | | | |
| to average net assets | .97 | | 1.10 | | 1.12 | | 1.12 | | 1.11 | |
| Ratio of net expenses | | | | | | | | | | |
| to average net assets | .73 | | .73 | | .82 | | 1.11 | | 1.09 | |
| Ratio of net investment income | | | | | | | | | | |
| to average net assets | 1.33 | | .98 | | .81 | | 1.25 | | 1.02 | |
| Portfolio Turnover Rate | 95.38 | | 88.37 | | 91.83 | | 119.48 | | 107.46 | |
| Net Assets, end of period ($ x 1,000) | 179,900 | | 123,565 | | 68,071 | | 35,976 | | 79,567 | |
| |
| a Based on average shares outstanding at each month end. | | | | | | | | | |
| See notes to financial statements. | | | | | | | | | | |
20
NOTES TO FINANCIAL STATEMENTS
NOTE 1—Significant Accounting Policies:
Dreyfus StrategicValue Fund (the “fund”) is a separate diversified series of Advantage Funds, Inc. (the “Company”), which is registered under the Investment Company Act of 1940, as amended (the “Act”), as an open-end management investment company and operates as a series company currently offering thirteen series, including the fund. The fund’s investment objective is to seek capital appreciation.The Dreyfus Corporation (the “Manager” or “Dreyfus”), a wholly-owned subsidiary of The Bank of New York Mellon Corporation (“BNY Mellon”), serves as the fund’s investment adviser.
As of the close of business on November 16, 2011, pursuant to an Agreement and Plan of Reorganization previously approved by the Company’s Board of Directors, all of the assets, subject to the liabilities, of The Dreyfus/Laurel FundsTrust–Dreyfus CoreValue Fund (“CoreValue”) were transferred to the fund in exchange for corresponding classes of shares of Common Stock of the fund of equal value.The purpose of the transaction was to combine two funds with comparable investment objectives and strategies. Shareholders of Class A, Class B, Class C and Class I shares of CoreValue received Class A, Class B, Class C and Class I shares of the fund, respectively, in each case in an amount equal to the aggregate net asset value of their investment in CoreValue at the time of the exchange. Shareholders of Institutional shares of Core Value received Class I shares of the fund.The exchange ratio for each class was as follows: Class A–.85 to 1, Class B–.88 to 1, Class C–.88 to 1, Class I–.85 to 1 and Institutional shares–.85 to 1.The net asset value of the fund’s shares on the close of business on November 16, 2011, after the reorganization, was $26.32 for Class A, $25.04 for Class B, $25.06 for Class C
The Fund 21
NOTES TO FINANCIAL STATEMENTS (continued)
and $26.36 for Class I shares, and a total of 10,622,681 Class A shares, 13,936 Class B shares, 248,377 Class C shares and 894,770 Class I shares were issued to shareholders of CoreValue in the exchange.The exchange was a tax-free event to the CoreValue shareholders.
The net unrealized (depreciation) on investments and net assets prior to the acquisition as of the merger date for Core Value and the fund, were as follows:
| | | |
| | Unrealized | | |
| | (Depreciation) ($) | | Net Assets ($) |
| Core Value | (5,850,903 | ) | 309,705,260 |
| Dreyfus Strategic Value Fund | (8,474,274 | ) | 747,196,897 |
| Total | (14,325,177 | ) | 1,056,902,157 |
As of the close of business on November 21, 2011, pursuant to an Agreement and Plan of Reorganization previously approved by the Company’s Board of Directors, all of the assets, subject to the liabilities, of Dreyfus Premier Investment Funds–Dreyfus Large Cap Value Fund (“Large CapValue”) were transferred to the fund in exchange for corresponding classes of shares of Common Stock of the fund of equal value.The purpose of the transaction was to combine two funds with comparable investment objectives and strategies. Shareholders of Class A, Class C and Class I shares of Large CapValue received Class A, Class C and Class I shares of the fund, respectively, in each case in an amount equal to the aggregate net asset value of their investment in Large Cap Value at the time of the exchange.The exchange ratio for each class was as follows: Class A–.29 to 1, Class C–.30 to 1 and Class I–.29 to 1.The net asset value of the fund’s shares on the close of business on November 21, 2011, after the reorganization, was $25.26 for Class A, $24.05 for Class C and $25.30 for Class I shares, and a total of 23,915 Class A shares, 1,993 Class C shares and 1,723,356 Class I shares were issued to shareholders of Large Cap Value in the exchange.The exchange was a tax-free event to the Large CapValue shareholders.
22
The net unrealized (depreciation) on investments and net assets prior to the acquisition as of the merger date for Large Cap Value and the fund, were as follows:
| | | |
| | Unrealized | | |
| | (Depreciation) ($) | | Net Assets ($) |
| Large Cap Value | (6,325,006 | ) | 44,244,690 |
| Dreyfus Strategic Value Fund | (58,431,566 | ) | 1,012,274,866 |
| Total | (64,756,572 | ) | 1,056,519,556 |
Assuming the mergers of Core Value and Large Cap Value had been completed on September 1, 2011, the fund’s pro forma results in the Statement of Operations during the period ended August 31, 2012 would have been as follows:
| | |
| Net investment income | $ | 11,500,1151 |
| Net realized and unrealized gain (loss) on investments | | 116,534,1502 |
| Net increase (decrease) in net assets | | |
| resulting from operations | | 128,034,265 |
| 1 | $10,880,133 as reported in the Statement of Operations plus $497,209 Core Value and $122,773 Large Cap Value pre-merger. |
| 2 | $118,378,676 as reported in the Statement of Operations plus $140,846 Core Value and $(1,985,372) Large Cap Value pre-merger. |
Because the combined funds have been managed as a single integrated fund since the mergers were completed, it is not practicable to separate the amounts of revenue and earnings of Core Value and Large Cap Value that have been included in the fund’s Statement of Operations during the period ended August 31, 2012.
MBSC Securities Corporation (the “Distributor”), a wholly-owned subsidiary of the Manager, is the distributor of the fund’s shares. The fund is authorized to issue 600 million shares of $.001 par value Common Stock. The fund currently offers three classes of shares: Class A (400 million shares authorized), Class C (100 million shares authorized) and Class I (100 million shares authorized). Class A shares
The Fund 23
NOTES TO FINANCIAL STATEMENTS (continued)
are subject to a sales charge imposed at the time of purchase. Class C shares are subject to a contingent deferred sales charge (“CDSC”) imposed on Class C shares redeemed within one year of purchase. Class I shares are sold at net asset value per share only to institutional investors. The Company’s Board of Directors approved, effective as of the close of business on March 13, 2012, the transfer of shares authorized from Class B to Class A shares. Class B shares were subject to a CDSC imposed on Class B share redemptions made within six years of purchase and automatically converted to Class A shares after six years.The fund no longer offers Class B shares. Effective March 13, 2012, all outstanding Class B shares were automatically converted to Class A shares. Other differences between the classes include the services offered to and the expenses borne by each class, the allocation of certain transfer agency costs and certain voting rights. Income, expenses (other than expenses attributable to a specific class), and realized and unrealized gains or losses on investments are allocated to each class of shares based on its relative net assets.
The Company accounts separately for the assets, liabilities and operations of each series. Expenses directly attributable to each series are charged to that series’ operations; expenses which are applicable to all series are allocated among them on a pro rata basis.
The Financial Accounting Standards Board (“FASB”) Accounting Standards Codification is the exclusive reference of authoritative U.S. generally accepted accounting principles (“GAAP”) recognized by the FASB to be applied by nongovernmental entities. Rules and interpretive releases of the Securities and Exchange Commission (“SEC”) under authority of federal laws are also sources of authoritative GAAP for SEC registrants. The fund’s financial statements are prepared in accordance with GAAP, which may require the use of management estimates and assumptions.Actual results could differ from those estimates.
The Company enters into contracts that contain a variety of indemnifications.The fund’s maximum exposure under these arrangements is unknown.The fund does not anticipate recognizing any loss related to these arrangements.
24
(a) Portfolio valuation: The fair value of a financial instrument is the amount that would be received to sell an asset or paid to transfer a liability in an orderly transaction between market participants at the measurement date (i.e., the exit price). GAAP establishes a fair value hierarchy that prioritizes the inputs of valuation techniques used to measure fair value.This hierarchy gives the highest priority to unadjusted quoted prices in active markets for identical assets or liabilities (Level 1 measurements) and the lowest priority to unobservable inputs (Level 3 measurements).
Additionally, GAAP provides guidance on determining whether the volume and activity in a market has decreased significantly and whether such a decrease in activity results in transactions that are not orderly. GAAP requires enhanced disclosures around valuation inputs and techniques used during annual and interim periods.
Various inputs are used in determining the value of the fund’s investments relating to fair value measurements.These inputs are summarized in the three broad levels listed below:
Level 1—unadjusted quoted prices in active markets for identical investments.
Level 2—other significant observable inputs (including quoted prices for similar investments, interest rates, prepayment speeds, credit risk, etc.).
Level 3—significant unobservable inputs (including the fund’s own assumptions in determining the fair value of investments).
The inputs or methodology used for valuing securities are not necessarily an indication of the risk associated with investing in those securities.
Changes in valuation techniques may result in transfers in or out of an assigned level within the disclosure hierarchy. Valuation techniques used to value the fund’s investments are as follows:
The Fund 25
NOTES TO FINANCIAL STATEMENTS (continued)
Investments in securities are valued at the last sales price on the securities exchange or national securities market on which such securities are primarily traded. Securities listed on the National Market System for which market quotations are available are valued at the official closing price or, if there is no official closing price that day, at the last sales price. Securities not listed on an exchange or the national securities market, or securities for which there were no transactions, are valued at the average of the most recent bid and asked prices, except for open short positions, where the asked price is used for valuation purposes. Bid price is used when no asked price is available. Registered investment companies that are not traded on an exchange are valued at their net asset value. All of the preceding securities are categorized within Level 1 of the fair value hierarchy.
Fair valuing of securities may be determined with the assistance of a pricing service using calculations based on indices of domestic securities and other appropriate indicators, such as prices of relevant American Depository Receipts and financial futures. Utilizing these techniques may result in transfers between Level 1 and Level 2 of the fair value hierarchy.
When market quotations or official closing prices are not readily available, or are determined not to reflect accurately fair value, such as when the value of a security has been significantly affected by events after the close of the exchange or market on which the security is principally traded (for example, a foreign exchange or market), but before the fund calculates its net asset value, the fund may value these investments at fair value as determined in accordance with the procedures approved by the Company’s Board of Directors. Certain factors may be considered when fair valuing investments such as: fundamental analytical data, the nature and duration of restrictions on disposition, an evaluation of the forces that influence the market in which the securities are purchased and sold, and public trading in similar securities of the issuer or comparable issuers. These securities are either categorized as Level 2 or 3 depending on the relevant inputs used.
26
For restricted securities where observable inputs are limited, assumptions about market activity and risk are used and are categorized within Level 3 of the fair value hierarchy.
The following is a summary of the inputs used as of August 31, 2012 in valuing the fund’s investments:
| | | | |
| | | Level 2—Other | Level 3— | |
| | Level 1— | Significant | Significant | |
| | Unadjusted | Observable | Unobservable | |
| | Quoted Prices | Inputs | Inputs | Total |
| Assets ($) | | | | |
| Investments in Securities: | | | |
| Equity Securities— | | | | |
| Domestic† | 1,095,875,578 | — | — | 1,095,875,578 |
| Exchange Traded | | | | |
| Funds | 4,737,278 | — | — | 4,737,278 |
| Mutual Funds | 14,262,730 | — | — | 14,262,730 |
| † See Statement of Investments for additional detailed categorizations. | |
At August 31, 2012, there were no transfers between Level 1 and Level 2 of the fair value hierarchy.
(b) Securities transactions and investment income: Securities transactions are recorded on a trade date basis. Realized gains and losses from securities transactions are recorded on the identified cost basis. Dividend income is recognized on the ex-dividend date and interest income, including, where applicable, accretion of discount and amortization of premium on investments, is recognized on the accrual basis.
Pursuant to a securities lending agreement with The Bank of New York Mellon, a subsidiary of BNY Mellon and an affiliate of Dreyfus, the fund may lend securities to qualified institutions. It is the fund’s policy that, at origination, all loans are secured by collateral of at least 102% of the value of U.S. securities loaned and 105% of the value of foreign securities loaned. Collateral equivalent to at least 100% of the market value of securities on loan is maintained at all times. Collateral is either in the form of cash, which can be invested in certain money
The Fund 27
NOTES TO FINANCIAL STATEMENTS (continued)
market mutual funds managed by the Manager, U.S. Government and Agency securities or letters of credit.The fund is entitled to receive all income on securities loaned, in addition to income earned as a result of the lending transaction. Although each security loaned is fully collateralized, the fund bears the risk of delay in recovery of, or loss of rights in, the securities loaned should a borrower fail to return the securities in a timely manner. During the period ended August 31, 2012, The Bank of New York Mellon earned $13,605 from lending portfolio securities, pursuant to the securities lending agreement.
(c) Affiliated issuers: Investments in other investment companies advised by Dreyfus are defined as “affiliated” in the Act. Investments in affiliated investment companies for the period ended August 31, 2012 were as follows:
| | | | | | | |
| Affiliated | | | | | | | |
| Investment | Value | | | | Value | | Net |
| Company | 8/31/2011 | ($) | Purchases ($) | Sales ($) | 8/31/2012 | ($) | Assets (%) |
| Dreyfus | | | | | | | |
| Institutional | | | | | | | |
| Preferred | | | | | | | |
| Plus Money | | | | | | | |
| Market Fund | 174,000 | | 256,142,240 | 255,911,142 | 405,098 | | .0 |
| Dreyfus | | | | | | | |
| Institutional | | | | | | | |
| Cash | | | | | | | |
| Advantage | | | | | | | |
| Fund | 42,142,311 | | 185,808,806 | 214,093,485 | 13,857,632 | | 1.3 |
| Total | 42,316,311 | | 441,951,046 | 470,004,627 | 14,262,730 | | 1.3 |
(d) Dividends to shareholders: Dividends are recorded on the ex-dividend date. Dividends from investment income-net and dividends from net realized capital gains, if any, are normally declared and paid annually, but the fund may make distributions on a more frequent basis to comply with the distribution requirements of the Internal Revenue Code of 1986, as amended (the “Code”).To the extent that net realized capital gains can be offset by capital loss carryovers, it is the policy of the fund not to distribute such gains. Income and capital gain distributions are determined in accordance with income tax regulations, which may differ from GAAP.
28
(e) Federal income taxes: It is the policy of the fund to continue to qualify as a regulated investment company, if such qualification is in the best interests of its shareholders, by complying with the applicable provisions of the Code, and to make distributions of taxable income sufficient to relieve it from substantially all federal income and excise taxes.
As of and during the period ended August 31, 2012, the fund did not have any liabilities for any uncertain tax positions.The fund recognizes interest and penalties, if any, related to uncertain tax positions as income tax expense in the Statement of Operations. During the period, the fund did not incur any interest or penalties.
Each of the tax years in the four-year period ended August 31, 2012 remains subject to examination by the Internal Revenue Service and state taxing authorities.
At August 31, 2012, the components of accumulated earnings on a tax basis were as follows: undistributed ordinary income $6,771,693, accumulated capital losses $50,426,980 and unrealized appreciation $36,841,750. In addition, the fund had $2,271,062 of capital losses realized after October 31, 2011, which were deferred for tax purposes to the first day of the following fiscal year.
Under the Regulated Investment Company Modernization Act of 2010 (the “2010 Act”), the fund is permitted to carry forward capital losses incurred in taxable years beginning after December 22, 2010 (“post-enactment losses”) for an unlimited period. Furthermore, post-enactment capital loss carryovers retain their character as either short-term or long-term capital losses rather than short-term as they were under previous statute.The 2010 Act requires post-enactment losses to be utilized before the utilization of losses incurred in taxable years prior to the effective date of the 2010 Act (“pre-enactment losses”). As a result of this ordering rule, pre-enactment losses may be more likely to expire unused.
The accumulated capital loss carryover is available for federal income tax purposes to be applied against future net realized capital gains, if any, realized subsequent to August 31, 2012. If not applied, $4,344,434 of
The Fund 29
NOTES TO FINANCIAL STATEMENTS (continued)
the carryover expires in fiscal year 2018.As a result of the fund’s merger with Dreyfus Premier Intrinsic Value Fund, capital losses of $186,781 are available to offset future gains, if any. Based on certain provisions in the Code, the amount of losses which can be utilized in subsequent years is subject to an annual limitation. This acquired capital loss will expire in fiscal year 2015.As a result of the fund’s merger with Dreyfus Core Value Fund, capital losses of $36,396,034 are available to offset future gains, if any. Based on certain provisions in the Code, the amount of losses which can be utilized in subsequent years is subject to an annual limitation. This acquired capital loss will expire in fiscal year 2017. As a result of the fund’s merger with Dreyfus Large Cap Value Fund, capital losses of $9,499,731 are available to offset future gains, if any. Based on certain provisions in the Code, the amount of losses which can be utilized in subsequent years is subject to an annual limitation. $8,340,124 of this acquired capital loss will expire in fiscal year 2017 and $1,159,607 will expire in fiscal year 2018.
The tax character of distributions paid to shareholders during the fiscal periods ended August 31, 2012 and August 31, 2011 were as follows: ordinary income $7,819,005 and $5,000,829, respectively.
During the period ended August 31, 2012, as a result of permanent book to tax differences, primarily due to the tax treatment for capital loss carryovers and wash sales from fund mergers, the fund decreased accumulated net realized gain (loss) on investments by $58,449,996 and increased paid-in capital by the same amount. Net assets and net asset per share were not affected by this reclassification.
NOTE 2—Bank Lines of Credit:
The fund participates with other Dreyfus-managed funds in a $225 million unsecured credit facility led by Citibank, N.A. and a $300 million unsecured credit facility provided by The Bank of New York Mellon (each, a “Facility”), each to be utilized primarily for temporary or emergency purposes, including the financing of redemptions. In
30
connection therewith, the fund has agreed to pay its pro rata portion of commitment fees for each Facility. Interest is charged to the fund based on rates determined pursuant to the terms of the respective Facility at the time of borrowing.
The average amount of borrowings outstanding under the Facilities during the period ended August 31, 2012 was approximately $717,200, with a related weighted average annualized interest rate of 1.19%.
NOTE 3—Management Fee and Other Transactions with Affiliates:
(a) Pursuant to a management agreement with the Manager, the management fee is computed at the annual rate of .75% of the value of the fund’s average daily net assets and is payable monthly.The Manager has contractually agreed to waive receipt of its fees and/or assume the expenses of the fund until December 31, 2013, so that the expenses of Class A, Class C and Class I shares (excluding taxes, interest expense, brokerage commissions, commitment fees on borrowings and extraordinary expenses) do not exceed .98%, 1.73% and .73% of the value of the respective class shares’ average daily net assets. The Manager had contractually agreed to waive receipt of its fees and/or assume the expenses of the fund from September 1, 2011 through November 16, 2011 and from November 17, 2011 through March 13, 2012, so that the net operating expenses of Class B shares (exclusive of certain expenses as described above) did not exceed 1.94% and 1.90%, respectively, of the value of Class B’s average daily net assets.The reduction in expenses, pursuant to the undertaking, amounted to $2,272,053 during the period ended August 31, 2012.
During the period ended August 31, 2012, the Distributor retained $18,646 from commissions earned on sales of the fund’s Class A shares, and $862 and $11,554 from CDSCs on redemptions of the fund’s Class B and Class C shares, respectively.
The Fund 31
NOTES TO FINANCIAL STATEMENTS (continued)
(b) Under the Distribution Plan adopted pursuant to Rule 12b-1 under the Act, Class B shares paid and Class C shares pay the Distributor for distributing their shares at an annual rate of .75% of the value of the average daily net assets of Class B and Class C shares. During the period ended August 31, 2012, Class B and Class C shares were charged $6,521 and $378,026, respectively, pursuant to the Distribution Plan.
(c) Under the Shareholder Services Plan, Class A and Class C shares pay and Class B shares paid the Distributor at an annual rate of .25% of the value of their average daily net assets for the provision of certain services. The services provided may include personal services relating to shareholder accounts, such as answering shareholder inquiries regarding the fund and providing reports and other information, and services related to the maintenance of shareholder accounts. The Distributor may make payments to Service Agents (securities dealers, financial institutions or other industry professionals) in respect of these services. The Distributor determines the amounts to be paid to Service Agents. During the period ended August 31, 2012, Class A, Class B and Class C shares were charged $1,971,539, $2,173 and $126,009, respectively, pursuant to the Shareholder Services Plan.
The fund has arrangements with the transfer agent and the custodian whereby the fund may receive earnings credits when positive cash balances are maintained, which are used to offset transfer agency and custody fees. For financial reporting purposes, the fund includes net earnings credits as an expense offset in the Statement of Operations.
The fund compensates Dreyfus Transfer, Inc. (“DTI”), a wholly-owned subsidiary of the Manager, under a transfer agency agreement for providing transfer agency services for the fund and, since May 29, 2012, cash management services related to fund subscriptions and redemptions. During the period ended August 31, 2012, the fund was charged $292,449 for transfer agency services and $4,600 for cash management services. Cash management fees were partially offset by earnings credits of $542. These fees are included in Shareholder servicing costs in the Statement of Operations.
32
The fund compensatesThe Bank of NewYork Mellon under a custody agreement for providing custodial services for the fund. During the period ended August 31, 2012, the fund was charged $79,141 pursuant to the custody agreement.
Prior to May 29, 2012, the fund compensated The Bank of New York Mellon under a cash management agreement for performing cash management services related to fund subscriptions and redemptions. During the period ended August 31, 2012, the fund was charged $33,730 pursuant to the cash management agreement, which is included in Shareholder servicing costs in the Statement of Operations.These fees were partially offset by earnings credits of $995.
During the period ended August 31, 2012, the fund was charged $6,392 for services performed by the Chief Compliance Officer and his staff.
The components of “Due toThe Dreyfus Corporation and affiliates” in the Statement of Assets and Liabilities consist of: management fees $698,994, Distribution Plan fees $30,434, Shareholder Services Plan fees $194,855, custodian fees $28,244, Chief Compliance Officer fees $4,243 and transfer agency per account fees $81,824, which are offset against an expense reimbursement currently in effect in the amount of $142,840.
(d) Each Board member also serves as a Board member of other funds within the Dreyfus complex. Annual retainer fees and attendance fees are allocated to each fund based on net assets.
NOTE 4—Securities Transactions:
The aggregate amount of purchases and sales of investment securities, excluding short-term securities, during the period ended August 31, 2012, amounted to $1,181,162,942 and $959,024,538, respectively.
At August 31, 2012, the cost of investments for federal income tax purposes was $1,078,033,836; accordingly, accumulated net unrealized appreciation on investments was $36,841,750, consisting of $88,968,989 gross unrealized appreciation and $52,127,239 gross unrealized depreciation.
The Fund 33
REPORT OF INDEPENDENT REGISTERED
PUBLIC ACCOUNTING FIRM
Shareholders and Board of Directors
Dreyfus Strategic Value Fund
We have audited the accompanying statement of assets and liabilities, including the statement of investments, of Dreyfus Strategic Value Fund (one of the series comprising Advantage Funds, Inc.) as of August 31, 2012, and the related statement of operations for the year then ended, the statement of changes in net assets for each of the two years in the period then ended, and the financial highlights for each of the five years in the period then ended.These financial statements and financial highlights are the responsibility of the Fund’s management. Our responsibility is to express an opinion on these financial statements and financial highlights based on our audits.
We conducted our audits in accordance with the standards of the Public Company Accounting Oversight Board (United States).Those standards require that we plan and perform the audit to obtain reasonable assurance about whether the financial statements and financial highlights are free of material misstatement.We were not engaged to perform an audit of the Fund’s internal control over financial reporting. Our audits included consideration of internal control over financial reporting as a basis for designing audit procedures that are appropriate in the circumstances, but not for the purpose of expressing an opinion on the effectiveness of the Fund’s internal control over financial reporting. Accordingly, we express no such opinion.An audit also includes examining, on a test basis, evidence supporting the amounts and disclosures in the financial statements and financial highlights, assessing the accounting principles used and significant estimates made by management, and evaluating the overall financial statement presentation. Our procedures included confirmation of securities owned as of August 31, 2012 by correspondence with the custodian and others.We believe that our audits provide a reasonable basis for our opinion.
In our opinion, the financial statements and financial highlights referred to above present fairly, in all material respects, the financial position of Dreyfus StrategicValue Fund at August 31, 2012, the results of its operations for the year then ended, the changes in its net assets for each of the two years in the period then ended, and the financial highlights for each of the five years in the period then ended, in conformity with U.S. generally accepted accounting principles.

| |
| | New York, New York |
| 34 | October 29, 2012 |
IMPORTANT TAX INFORMATION (Unaudited)
For federal tax purposes, the fund hereby reports 100% of the ordinary dividends paid during the fiscal year ended August 31, 2012 as qualifying for the corporate dividends received deduction. Also certain dividends paid by the fund may be subject to a maximum tax rate of 15%, as provided for by the Jobs and GrowthTax Relief Reconciliation Act of 2003. Of the distributions paid during the fiscal year, $7,819,005 represents the maximum amount that may be considered qualified dividend income. Shareholders will receive notification in early 2013 of the percentage applicable to the preparation of their 2012 income tax returns.
The Fund 35
PROXY RESULTS (Unaudited)
The Company held a special meeting of shareholders on August 3, 2012.The proposal considered at the meeting, and the results, are as follows:
| | | |
| | | Shares | |
| | Votes For | | Authority Withheld |
| To elect additional Board Members: | | | |
| Lynn Martin† | 90,334,756 | | 3,252,629 |
| Robin A. Melvin† | 90,449,622 | | 3,137,763 |
| Philip L. Toia† | 90,229,928 | | 3,357,457 |
† Each new Board Member’s term commenced on September 1, 2012.
In addition Peggy C. Davis, Joseph S. DiMartino, David P. Feldman, Ehud Houminer and Dr. Martin Peretz continue
as Board Members of the Company.
36
INFORMATION ABOUT THE RENEWAL OF THE
FUND’S MANAGEMENT AGREEMENT (Unaudited)
At a meeting of the fund’s Board of Directors held on March 6, 2012, the Board considered the renewal of the fund’s Management Agreement pursuant to which Dreyfus provides the fund with investment advisory and administrative services (the “Agreement”). The Board members, none of whom are “interested persons” (as defined in the Investment Company Act of 1940, as amended) of the fund, were assisted in their review by independent legal counsel and met with counsel in executive session separate from Dreyfus representatives. In considering the renewal of the Agreement, the Board considered all factors that it believed to be relevant, including those discussed below.The Board did not identify any one factor as dispositive, and each Board member may have attributed different weights to the factors considered.
Analysis of Nature, Extent, and Quality of Services Provided to the Fund.The Board considered information previously provided to them in presentations from Dreyfus representatives regarding the nature, extent, and quality of the services provided to funds in the Dreyfus fund complex, and Dreyfus representatives confirmed that there had been no material changes in this information. Dreyfus provided the number of open accounts in the fund, the fund’s asset size and the allocation of fund assets among distribution channels. Dreyfus also had previously provided information regarding the diverse intermediary relationships and distribution channels of funds in the Dreyfus fund complex and Dreyfus’ corresponding need for broad, deep, and diverse resources to be able to provide ongoing shareholder services to each distribution channel, including the distribution channel(s) for the fund.
The Board also considered research support available to, and portfolio management capabilities of, the fund’s portfolio management personnel and that Dreyfus also provides oversight of day-to-day fund operations, including fund accounting and administration and assistance in meeting legal and regulatory requirements.The Board also considered Dreyfus’ extensive administrative, accounting, and compliance infrastructures.The Board also considered portfolio management’s brokerage policies and practices (including policies and practices regarding soft dollars) and the standards applied in seeking best execution.
The Fund 37
INFORMATION ABOUT THE RENEWAL OF THE FUND’S
MANAGEMENT AGREEMENT (Unaudited) (continued)
Comparative Analysis of the Fund’s Performance and Management Fee and Expense Ratio.The Board reviewed reports prepared by Lipper, Inc. (“Lipper”), an independent provider of investment company data, which included information comparing (1) the fund’s performance with the performance of a group of comparable funds (the “Performance Group”) and with a broader group of funds (the “Performance Universe”), all for various periods ended December 31, 2011, and (2) the fund’s actual and contractual management fees and total expenses with those of a group of comparable funds (the “Expense Group”) and with a broader group of funds (the “Expense Universe”), the information for which was derived in part from fund financial statements available to Lipper as of the date of its analysis. Dreyfus previously had furnished the Board with a description of the methodology Lipper used to select the Performance Group and Performance Universe and the Expense Group and Expense Universe.
Dreyfus representatives stated that the usefulness of performance comparisons may be affected by a number of factors, including different investment limitations that may be applicable to the fund and comparison funds.They also noted that performance generally should be considered over longer periods of time, although it is possible that long-term performance can be adversely affected by even one period of significant underperformance so that a single investment decision or theme has the ability to affect disproportionately long-term performance. The Board discussed the results of the comparisons and noted that the fund’s total return performance was variously above and below the Performance Group and Performance Universe medians, being above the Performance Group and Performance Universe medians in half the periods. Dreyfus also provided a comparison of the fund’s calendar year total returns to the returns of the fund’s benchmark index, and the Dreyfus representatives noted that the fund’s total return was above the return of the index in six of the ten years.
The Board also reviewed the range of actual and contractual management fees and total expenses of the Expense Group and Expense Universe funds and discussed the results of the comparisons.The Board noted that
38
the fund’s contractual management fee was below the Expense Group median and the fund’s actual management fee and total expenses were below the Expense Group and Expense Universe medians.
Dreyfus representatives noted that Dreyfus has contractually agreed to waive receipt of its fees and/or assume the expenses of the fund, until December 31, 2013, so that the expenses of Class A, Class C and Class I shares (excluding taxes, interest expense, brokerage commissions, commitment fees on borrowings and extraordinary expenses) do not exceed .98%, 1.73% and .73% of the value of the respective class of shares’ average daily net assets.
Dreyfus representatives reviewed with the Board the management or investment advisory fees (1) paid by funds advised or administered by Dreyfus that are in the same Lipper category as the fund and (2) paid to Dreyfus or the Dreyfus-affiliated primary employer of the fund’s primary portfolio manager(s) for advising any separate accounts and/or other types of client portfolios that are considered to have similar investment strategies and policies as the fund (the “Similar Clients”), and explained the nature of the Similar Clients. They discussed differences in fees paid and the relationship of the fees paid in light of any differences in the services provided and other relevant factors. The Board considered the relevance of the fee information provided for the Similar Clients to evaluate the appropriateness and reasonableness of the fund’s management fee.
Analysis of Profitability and Economies of Scale. Dreyfus representatives reviewed the expenses allocated and profit received by Dreyfus and the resulting profitability percentage for managing the fund, and the method used to determine the expenses and profit. The Board concluded that the profitability results were not unreasonable, given the services rendered and service levels provided by Dreyfus.The Board also noted the expense limitation arrangement and its effect on Dreyfus’ profitability. The Board previously had been provided with information prepared by an independent consulting firm regarding Dreyfus’ approach to allocat-
The Fund 39
INFORMATION ABOUT THE RENEWAL OF THE FUND’S
MANAGEMENT AGREEMENT (Unaudited) (continued)
ing costs to, and determining the profitability of, individual funds and the entire Dreyfus fund complex.The consulting firm also had analyzed where any economies of scale might emerge in connection with the management of a fund.
The Board’s counsel stated that the Board should consider the profitability analysis (1) as part of their evaluation of whether the fees under the Agreement bear a reasonable relationship to the mix of services provided by Dreyfus, including the nature, extent and quality of such services, and (2) in light of the relevant circumstances for the fund and the extent to which economies of scale would be realized if the fund grows and whether fee levels reflect these economies of scale for the benefit of fund shareholders. Dreyfus representatives also noted that, as a result of shared and allocated costs among funds in the Dreyfus fund complex, the extent of economies of scale could depend substantially on the level of assets in the complex as a whole, so that increases and decreases in complex-wide assets can affect potential economies of scale in a manner that is disproportionate to, or even in the opposite direction from, changes in the fund’s asset level.The Board also considered potential benefits to Dreyfus from acting as investment adviser and noted the soft dollar arrangements in effect for trading the fund’s investments.
At the conclusion of these discussions, the Board agreed that it had been furnished with sufficient information to make an informed business decision with respect to the renewal of the Agreement. Based on the discussions and considerations as described above, the Board concluded and determined as follows.
The Board concluded that the nature, extent and quality of the services provided by Dreyfus are adequate and appropriate.
The Board generally was satisfied with the fund’s overall performance.
The Board concluded that the fee paid to Dreyfus was reasonable in light of the considerations described above.
40
The Board determined that the economies of scale which may accrue to Dreyfus and its affiliates in connection with the management of the fund had been adequately considered by Dreyfus in connection with the fee rate charged to the fund pursuant to the Agreement and that, to the extent in the future it were determined that material economies of scale had not been shared with the fund, the Board would seek to have those economies of scale shared with the fund.
The Board considered these conclusions and determinations, along with information received on a routine and regular basis throughout the year. In addition, it should be noted that the Board’s consideration of the contractual fee arrangements for this fund had the benefit of a number of years of reviews of prior or similar agreements during which lengthy discussions took place between the Board and Dreyfus representatives. Certain aspects of the arrangements may receive greater scrutiny in some years than in others, and the Board’s conclusions may be based, in part, on their consideration of the same or similar arrangements in prior years.The Board determined that renewal of the Agreement was in the best interests of the fund and its shareholders.
The Fund 41
BOARD MEMBERS INFORMATION (Unaudited)
42
The Fund 43
OFFICERS OF THE FUND (Unaudited)
44
The Fund 45
For More Information

Telephone Call your financial representative or 1-800-DREYFUS
Mail The Dreyfus Family of Funds, 144 Glenn Curtiss Boulevard, Uniondale, NY 11556-0144
The fund files its complete schedule of portfolio holdings with the Securities and Exchange Commission (“SEC”) for the first and third quarters of each fiscal year on Form N-Q. The fund’s Forms N-Q are available on the SEC’s website at http://www.sec.gov and may be reviewed and copied at the SEC’s Public Reference Room in Washington, DC. Information on the operation of the Public Reference Room may be obtained by calling 1-800-SEC-0330.
A description of the policies and procedures that the fund uses to determine how to vote proxies relating to portfolio securities, and information regarding how the fund voted these proxies for the most recent 12-month period ended June 30 is available at http://www.dreyfus.com and on the SEC’s website at http://www.sec.gov. The description of the policies and procedures is also available without charge, upon request, by calling 1-800-DREYFUS.

|
| © 2012 MBSC Securities Corporation |
Dreyfus
Structured Midcap Fund
ANNUAL REPORT August 31, 2012

Save time. Save paper. View your next shareholder report online as soon as it’s available. Log into www.dreyfus.com and sign up for Dreyfus eCommunications. It’s simple and only takes a few minutes.
The views expressed in this report reflect those of the portfolio manager only through the end of the period covered and do not necessarily represent the views of Dreyfus or any other person in the Dreyfus organization. Any such views are subject to change at any time based upon market or other conditions and Dreyfus disclaims any responsibility to update such views.These views may not be relied on as investment advice and, because investment decisions for a Dreyfus fund are based on numerous factors, may not be relied on as an indication of trading intent on behalf of any Dreyfus fund.
Not FDIC-Insured • Not Bank-Guaranteed • May Lose Value
| |
| | Contents |
| |
| |
| | THE FUND |
| 2 | A Letter from the Chairman and CEO |
| 3 | Discussion of Fund Performance |
| 6 | Fund Performance |
| 8 | Understanding Your Fund’s Expenses |
| 8 | Comparing Your Fund’s Expenses |
| With Those of Other Funds |
| 9 | Statement of Investments |
| 15 | Statement of Assets and Liabilities |
| 16 | Statement of Operations |
| 17 | Statement of Changes in Net Assets |
| 19 | Financial Highlights |
| 22 | Notes to Financial Statements |
| 32 | Report of Independent Registered |
| | Public Accounting Firm |
| 33 | Proxy Results |
| 34 | Information About the Renewal of |
| the Fund’s Management and |
| | Sub-Investment Advisory Agreements |
| 39 | Board Members Information |
| 41 | Officers of the Fund |
| |
| FOR MORE INFORMATION |
|
| | Back Cover |
Dreyfus
Structured Midcap Fund
The Fund

A LETTER FROM THE CHAIRMAN AND CEO
Dear Shareholder:
We are pleased to present this annual report for Dreyfus Structured Midcap Fund, covering the 12-month period from September 1, 2011, through August 31, 2012. For information about how the fund performed during the reporting period, as well as general market perspectives, we provide a Discussion of Fund Performance on the pages that follow.
U.S. equities proved unusually volatile over the past year, as prices rose and fell according to investors’ changing expectations of global and domestic economic conditions. When viewed over a longer time frame, however, the pace of U.S. economic growth has been relatively consistent at about half the average rate achieved in prior recoveries. Even U.S. employment numbers, which have been volatile over short periods, averaged slightly better than 150,000 new jobs a month so far in 2012, roughly unchanged from the monthly average in 2011.
The sustained but subpar U.S. expansion appears likely to continue over the foreseeable future. On one hand, the economy has responded to a variety of stimulative measures, most notably an aggressively accommodative monetary policy. On the other hand, the prospect of automatic spending cuts and tax hikes scheduled for the end of 2012 has weighed on economic growth by contributing to a temporary postponement of spending decisions among consumers and businesses. Indeed, the ability of the U.S. political system to address both this “fiscal cliff” and long-term deficit reduction could go a long way toward shaping the 2013 market environment.As always, we urge you to speak regularly with your financial advisor to discuss how changing economic conditions may affect your investments.
Thank you for your continued confidence and support.

Jonathan R. Baum
Chairman and Chief Executive Officer
The Dreyfus Corporation
September 17, 2012
2

DISCUSSION OF FUND PERFORMANCE
For the period of September 1, 2011, through August 31, 2012, as provided by Warren Chiang, Jocelin Reed, Ronald Gala and C. Wesley Boggs, Portfolio Managers
Fund and Market Performance Overview
For the 12-month period ended August 31, 2012, Dreyfus Structured Midcap Fund’s Class A shares produced a total return of 14.68%, Class C shares returned 13.79% and Class I shares returned 14.91%.1 In comparison, the Standard & Poor’s MidCap 400 Index (“S&P 400 Index”), the fund’s benchmark, produced a total return of 12.75% for the same period.2
Changing economic sentiment fueled heightened market volatility as stock market declines in September 2011 and during the spring of 2012 were more than offset by gains at other times of the reporting period. The fund produced higher returns than its benchmark, largely due to the efficacy of the quality factors considered by our quantitative stock selection process.
The Fund’s Investment Approach
The fund seeks long-term capital growth.To pursue this goal, the fund invests at least 80% of its net assets in the stocks of companies included in the S&P 400 Index or the Russell Midcap Index at the time of purchase.The fund’s stock investments may include common stocks, preferred stocks and convertible securities of U.S. and foreign issuers.We construct the portfolio through a “bottom-up” structured approach focusing on stock selection as opposed to making proactive decisions as to industry sector exposure.The approach seeks to identify undervalued securities through a quantitative process that ranks stocks based on value measures, behavioral/momentum factors and earnings quality metrics. We attempt to maintain a diversified portfolio with industry groups relative to the S&P 400 Index.
Markets Reacted to Shifting Macroeconomic Developments
The reporting period began in the midst of a major stock market decline.
One credit-rating agency’s downgrade of long-term U.S. government
The Fund 3
DISCUSSION OF FUND PERFORMANCE (continued)
debt, an intensifying debt crisis in Europe, and inflation-fighting programs in China in the weeks prior to the start of the reporting period triggered a flight away from stocks and toward traditional safe havens, and the downward slide continued in September 2011. Fortunately, better U.S. economic data and new remedial measures from European and Chinese policymakers arrested the decline during the fall.
By the beginning of 2012, U.S. stocks were rallying amid U.S. employment gains, a quantitative easing program in Europe, and less restrictive monetary and fiscal policies in China. Investors grew more tolerant of risks, focusing more intently on company fundamentals and less on macroeconomic news. However, these positive influences were called into question during the spring, when the U.S. labor market’s rebound slowed, measures designed to relieve fiscal pressures in Europe encountered resistance, and the Chinese economy remained sluggish.The summer saw the market rally resume amid more encouraging economic data, and the S&P 400 Index ended the reporting period with double-digit gains. Nonetheless, midcap stocks generally lagged their large- and small-cap counterparts.
Strong Stock Selections Buoyed Fund Performance
The fund’s disciplined, quantitative stock selection process worked well during the reporting period as quality, valuation, and behavioral factors all proved predictive of stock price changes. Our approach was particularly effective in the energy sector, where strong stock selections included refiner Tesoro, which reported strong quarterly earnings, initiated a stock buyback program, raised its dividend and acquired a new plant in California. In the consumer staples sector, Constellation Brands announced plans to acquire the remaining ownership interest in a joint venture, triggering stock price gains and the stock’s sale from the portfolio at a richer valuation.Among information technology companies, data management specialist Fair Isaac gained value after posting better-than-expected earnings and raising the future earnings guidance it provides to analysts. Strong relative performance in the financials sector was fueled by a number of commercial banks when lending volumes improved.
Disappointments during the reporting period were especially evident in the capital goods sector, where machinery producer Gardner Denver reduced its future earnings guidance and suffered unexpected manage-
4
ment changes. For-profit postsecondary educator ITT Educational Services was hurt by weaker-than-expected quarterly earnings amid industry-wide concerns regarding admission practices. Results from the health care sector were undermined by the fund’s lack of exposure to Regeneron Pharmaceuticals, which did not meet our valuation criteria. Weakness in the health care sector was offset to a degree by better results from medical equipment provider ResMed, which reported higher earnings and profit margins.
Taking Advantage of Volatility-Driven Opportunities
Although we expect heightened levels of market volatility to persist over the near term, our disciplined, bottom-up security selection process has continued to uncover opportunities to purchase fundamentally strong midcap companies at low valuations compared to historical norms.We have taken advantage of periodic market downturns by buying more attractively priced shares in the companies that meet our investment criteria. By the same token, when markets rise, we have trimmed the fund’s exposure to more richly valued holdings, redeploying the proceeds to stocks that better meet our investment criteria.
September 17, 2012
Equity funds are subject generally to market, market sector, market liquidity, issuer and investment
style risks, among other factors, to varying degrees, all of which are more fully described in the
fund’s prospectus.
Stocks of small- and/or midcap companies often experience sharper price fluctuations than stocks
of large-cap companies.
1 Total return includes reinvestment of dividends and any capital gains paid, and does not take into
consideration the maximum initial sales charge in the case of Class A shares, or the applicable
contingent deferred sales charges imposed on redemptions in the case of Class C shares. Had these
charges been reflected, returns would have been lower. Past performance is no guarantee of future
results. Share price, yield and investment return fluctuate such that upon redemption fund shares
may be worth more or less than their original cost.
2 SOURCE: LIPPER INC. — Reflects reinvestment of dividends and, where applicable, capital
gain distributions.The Standard & Poor’s MidCap 400 Index is a widely accepted, unmanaged
total return index measuring the performance of the midsize company segment of the U.S. market.
Investors cannot invest directly in any index.
The Fund 5
FUND PERFORMANCE
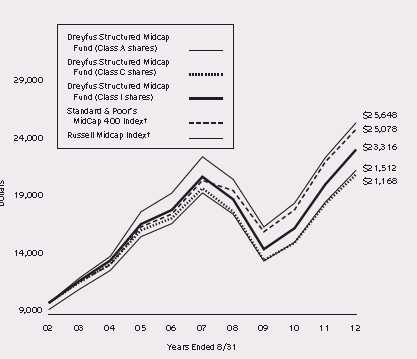
Comparison of change in value of $10,000 investment in Dreyfus Structured Midcap Fund
Class A shares, Class C shares and Class I shares with the Standard & Poor’s MidCap 400
Index and the Russell Midcap Index
† Source: Lipper Inc.
Past performance is not predictive of future performance.
The above graph compares a $10,000 investment made in each of the Class A, Class C and Class I shares of Dreyfus
Structured Midcap Fund on 8/31/02 to a $10,000 investment made in each of the Standard & Poor’s MidCap 400
Index (the “S&P 400 Index”) and the Russell Midcap Index on that date.All dividends and capital gain
distributions are reinvested.
The fund’s performance shown in the line graph above takes into account the maximum initial sales charge on Class A
shares and all other applicable fees and expenses on all classes.The S&P 400 Index is a widely accepted, unmanaged
total return index measuring the performance of the midsize company segment of the U.S. market.The Russell Midcap
Index is a widely accepted, unmanaged index of medium-cap stock market performance. Unlike a mutual fund, the
indices are not subject to charges, fees and other expenses. Investors cannot invest directly in any index. Further
information relating to fund performance, including expense reimbursements, if applicable, is contained in the Financial
Highlights section of the prospectus and elsewhere in this report.
6
| | | | | | |
| Average Annual Total Returns as of 8/31/12 | | | | | |
| | 1 | Year | 5 Years | | 10 Years | |
| Class A shares | | | | | | |
| with maximum sales charge (5.75%) | 8.08 | % | 0.73 | % | 7.96 | % |
| without sales charge | 14.68 | % | 1.93 | % | 8.60 | % |
| Class C shares | | | | | | |
| with applicable redemption charge † | 12.79 | % | 1.19 | % | 7.79 | % |
| without redemption | 13.79 | % | 1.19 | % | 7.79 | % |
| Class I shares | 14.91 | % | 2.16 | % | 8.83 | % |
| Standard & Poor’s MidCap 400 Index | 12.75 | % | 3.97 | % | 9.63 | % |
| Russell Midcap Index | 13.30 | % | 2.47 | % | 9.88 | % |
Past performance is not predictive of future performance.The fund’s performance shown in the graph and table does not
reflect the deduction of taxes that a shareholder would pay on fund distributions or the redemption of fund shares.
† The maximum contingent deferred sales charge for Class C shares is 1% for shares redeemed within one year of the
date of purchase.
The Fund 7
UNDERSTANDING YOUR FUND’S EXPENSES (Unaudited)
As a mutual fund investor, you pay ongoing expenses, such as management fees and other expenses. Using the information below, you can estimate how these expenses affect your investment and compare them with the expenses of other funds.You also may pay one-time transaction expenses, including sales charges (loads) and redemption fees, which are not shown in this section and would have resulted in higher total expenses. For more information, see your fund’s prospectus or talk to your financial adviser.
Review your fund’s expenses
The table below shows the expenses you would have paid on a $1,000 investment in Dreyfus Structured Midcap Fund from March 1, 2012 to August 31, 2012. It also shows how much a $1,000 investment would be worth at the close of the period, assuming actual returns and expenses.
Expenses and Value of a $1,000 Investment
assuming actual returns for the six months ended August 31, 2012
| | | | | | |
| | | Class A | | Class C | | Class I |
| Expenses paid per $1,000† | | $7.06 | $ | $10.62 | $ | $5.35 |
| Ending value (after expenses) | $ | $1,006.60 | $ | $1,003.10 | $ | $1,008.40 |
COMPARING YOUR FUND’S EXPENSES WITH THOSE OF OTHER FUNDS (Unaudited)
Using the SEC’s method to compare expenses
The Securities and Exchange Commission (SEC) has established guidelines to help investors assess fund expenses. Per these guidelines, the table below shows your fund’s expenses based on a $1,000 investment, assuming a hypothetical 5% annualized return. You can use this information to compare the ongoing expenses (but not transaction expenses or total cost) of investing in the fund with those of other funds.All mutual fund shareholder reports will provide this information to help you make this comparison. Please note that you cannot use this information to estimate your actual ending account balance and expenses paid during the period.
Expenses and Value of a $1,000 Investment
assuming a hypothetical 5% annualized return for the six months ended August 31, 2012
| | | | | | |
| | | Class A | | Class C | | Class I |
| Expenses paid per $1,000† | | $7.10 | | $10.68 | | $5.38 |
| Ending value (after expenses) | | $1,018.10 | | $1,014.53 | | $1,019.81 |
† Expenses are equal to the fund’s annualized expense ratio of 1.40% for Class A, 2.11% for Class C and 1.06%
for Class I, multiplied by the average account value over the period, multiplied by 184/366 (to reflect the one-half
year period).
8
STATEMENT OF INVESTMENTS
August 31, 2012
| | | |
| Common Stocks—98.3% | Shares | | Value ($) |
| Automobiles & Components—1.5% | | | |
| Thor Industries | 31,100 | | 977,784 |
| WABCO Holdings | 600 | a | 35,232 |
| | | | 1,013,016 |
| Banks—3.7% | | | |
| Associated Banc-Corp | 66,200 | | 857,952 |
| Cathay General Bancorp | 25,100 | | 410,887 |
| Comerica | 5,900 | | 181,189 |
| Huntington Bancshares | 17,100 | | 112,860 |
| Regions Financial | 14,300 | | 99,528 |
| Webster Financial | 33,900 | | 721,392 |
| Zions Bancorporation | 7,600 | | 146,300 |
| | | | 2,530,108 |
| Capital Goods—9.9% | | | |
| Aecom Technology | 26,700 | a | 517,713 |
| Alliant Techsystems | 13,700 | | 671,163 |
| Chicago Bridge & Iron Co. | 8,600 | | 316,652 |
| Gardner Denver | 14,500 | | 874,060 |
| Granite Construction | 17,700 | | 487,989 |
| IDEX | 2,500 | | 99,650 |
| ITT | 28,700 | | 571,130 |
| KBR | 13,800 | | 373,842 |
| Lennox International | 20,700 | | 983,457 |
| Lincoln Electric Holdings | 24,100 | | 994,125 |
| Textron | 11,200 | | 299,264 |
| Timken | 13,600 | | 546,176 |
| | | | 6,735,221 |
| Commercial & Professional | | | |
| Services—2.2% | | | |
| Deluxe | 30,600 | | 868,122 |
| Herman Miller | 31,800 | | 622,008 |
| | | | 1,490,130 |
| Consumer Durables & Apparel—2.0% | | | |
| Carter’s | 19,000 | a | 1,058,490 |
| Tupperware Brands | 5,900 | | 315,532 |
| | | | 1,374,022 |
The Fund 9
STATEMENT OF INVESTMENTS (continued)
| | | |
| Common Stocks (continued) | Shares | | Value ($) |
| Consumer Services—3.5% | | | |
| Bally Technologies | 1,700 | a,b | 75,293 |
| Bob Evans Farms | 24,100 | | 948,094 |
| H&R Block | 40,900 | | 677,304 |
| International Speedway, Cl. A | 7,200 | | 191,592 |
| ITT Educational Services | 6,100 | a,b | 195,261 |
| Penn National Gaming | 7,800 | a | 306,462 |
| | | | 2,394,006 |
| Diversified Financials—4.4% | | | |
| American Capital | 21,800 | a | 239,582 |
| Discover Financial Services | 7,900 | | 305,967 |
| Greenhill & Co. | 11,600 | b | 506,340 |
| Moody’s | 1,800 | | 71,280 |
| NASDAQ OMX Group | 15,500 | | 354,485 |
| SEI Investments | 41,300 | | 898,275 |
| Waddell & Reed Financial, Cl. A | 21,000 | | 621,600 |
| | | | 2,997,529 |
| Energy—8.3% | | | |
| Denbury Resources | 11,600 | a | 179,684 |
| Helix Energy Solutions Group | 52,300 | a | 921,526 |
| HollyFrontier | 25,600 | | 1,031,424 |
| Kosmos Energy | 40,800 | a | 394,944 |
| Marathon Petroleum | 1,400 | | 72,450 |
| Murphy Oil | 6,800 | | 349,044 |
| Oceaneering International | 13,600 | | 728,144 |
| Plains Exploration & Production | 16,400 | a | 644,848 |
| Tesoro | 15,300 | | 608,022 |
| Tidewater | 14,300 | | 678,249 |
| | | | 5,608,335 |
| Food, Beverage & Tobacco—2.0% | | | |
| Smithfield Foods | 23,600 | a | 455,952 |
| Universal | 19,300 | b | 915,399 |
| | | | 1,371,351 |
| Health Care Equipment & Services—6.4% | | | |
| Hill-Rom Holdings | 27,500 | | 762,575 |
| Humana | 7,800 | | 546,624 |
| ResMed | 35,800 | b | 1,345,006 |
10
| | | |
| Common Stocks (continued) | Shares | | Value ($) |
| Health Care Equipment & | | | |
| Services (continued) | | | |
| Thoratec | 26,200 | a | 887,918 |
| Universal Health Services, Cl. B | 19,500 | | 779,025 |
| | | | 4,321,148 |
| Household & Personal Products—2.1% | | | |
| Church & Dwight | 15,900 | | 870,366 |
| Energizer Holdings | 8,500 | | 585,650 |
| | | | 1,456,016 |
| Insurance—3.8% | | | |
| Assurant | 9,900 | | 348,975 |
| Everest Re Group | 1,200 | | 124,392 |
| Lincoln National | 6,100 | | 141,642 |
| Protective Life | 15,300 | | 432,225 |
| Reinsurance Group of America | 19,200 | | 1,127,808 |
| StanCorp Financial Group | 12,100 | | 377,762 |
| | | | 2,552,804 |
| Materials—4.4% | | | |
| Domtar | 9,200 | | 666,448 |
| Huntsman | 7,600 | | 109,288 |
| Minerals Technologies | 14,400 | | 976,464 |
| NewMarket | 4,100 | | 1,009,092 |
| Steel Dynamics | 17,900 | | 218,738 |
| | | | 2,980,030 |
| Media—1.5% | | | |
| Scholastic | 17,200 | | 525,460 |
| Valassis Communications | 20,300 | a,b | 508,921 |
| | | | 1,034,381 |
| Pharmaceuticals, Biotech & | | | |
| Life Sciences—5.1% | | | |
| Agilent Technologies | 9,500 | | 353,020 |
| Charles River Laboratories International | 15,000 | a | 544,800 |
| Mettler-Toledo International | 6,800 | a | 1,122,748 |
| Techne | 6,200 | | 425,134 |
| United Therapeutics | 7,000 | a | 378,840 |
| Warner Chilcott, Cl. A | 47,300 | | 644,226 |
| | | | 3,468,768 |
The Fund 11
STATEMENT OF INVESTMENTS (continued)
| | | |
| Common Stocks (continued) | Shares | | Value ($) |
| Real Estate—8.4% | | | |
| BRE Properties | 12,100 | | 604,032 |
| CBL & Associates Properties | 39,300 | | 839,841 |
| Hospitality Properties Trust | 27,700 | c | 666,739 |
| Kimco Realty | 5,200 | | 105,664 |
| Liberty Property Trust | 15,900 | c | 586,392 |
| Macerich | 2,798 | c | 166,677 |
| Mack-Cali Realty | 33,900 | | 905,130 |
| National Retail Properties | 18,400 | b | 571,504 |
| Rayonier | 25,900 | c | 1,268,841 |
| | | | 5,714,820 |
| Retailing—6.2% | | | |
| Aaron’s | 19,400 | | 579,478 |
| Advance Auto Parts | 5,500 | | 391,160 |
| ANN | 14,900 | a | 530,142 |
| Best Buy | 9,500 | b | 168,530 |
| Big Lots | 900 | a | 27,396 |
| Dillard’s, Cl. A | 6,100 | | 457,988 |
| GameStop, Cl. A | 14,800 | b | 282,384 |
| O’Reilly Automotive | 5,900 | a | 501,205 |
| PetSmart | 16,100 | | 1,141,812 |
| Williams-Sonoma | 2,600 | | 106,652 |
| | | | 4,186,747 |
| Semiconductors & Semiconductor | | | |
| Equipment—1.9% | | | |
| LSI | 53,000 | a | 412,870 |
| Silicon Laboratories | 22,800 | a | 871,872 |
| | | | 1,284,742 |
| Software & Services—9.0% | | | |
| Acxiom | 23,700 | a | 404,322 |
| CA | 35,900 | | 934,477 |
| Cadence Design Systems | 72,500 | a | 957,000 |
| DST Systems | 17,215 | | 875,899 |
12
| | | |
| Common Stocks (continued) | Shares | | Value ($) |
| Software & Services (continued) | | | |
| FactSet Research Systems | 5,500 | b | 507,485 |
| Fair Isaac | 16,400 | | 700,444 |
| Symantec | 49,200 | a | 877,236 |
| Synopsys | 26,700 | a | 881,901 |
| | | | 6,138,764 |
| Technology Hardware & Equipment—5.6% | | | |
| Brocade Communications Systems | 45,900 | a | 266,220 |
| Diebold | 16,300 | | 531,054 |
| Dolby Laboratories, Cl. A | 8,800 | a,b | 291,984 |
| Lexmark International, Cl. A | 24,100 | b | 523,211 |
| Plantronics | 22,200 | | 791,652 |
| QLogic | 32,500 | a | 395,525 |
| Tech Data | 19,900 | a | 966,742 |
| | | | 3,766,388 |
| Telecommunication Services—.4% | | | |
| Telephone & Data Systems | 12,370 | | 303,313 |
| Transportation—1.4% | | | |
| Alaska Air Group | 28,500 | a | 956,175 |
| Utilities—4.6% | | | |
| Cleco | 18,100 | | 740,833 |
| Hawaiian Electric Industries | 28,300 | | 750,799 |
| IDACORP | 22,500 | | 932,625 |
| NV Energy | 37,800 | | 663,012 |
| | | | 3,087,269 |
| Total Common Stocks | | | |
| (cost $63,076,437) | | | 66,765,083 |
| |
| Other Investment—1.4% | | | |
| Registered Investment Company; | | | |
| Dreyfus Institutional Preferred | | | |
| Plus Money Market Fund | | | |
| (cost $926,928) | 926,928 | d | 926,928 |
The Fund 13
STATEMENT OF INVESTMENTS (continued)
| | | | |
| Investment of Cash Collateral | | | | |
| for Securities Loaned—6.8% | Shares | | Value ($) | |
| Registered Investment Company; | | | | |
| Dreyfus Institutional Cash Advantage Fund | | | | |
| (cost $4,597,205) | 4,597,205 | d | 4,597,205 | |
| Total Investments (cost $68,600,570) | 106.5 | % | 72,289,216 | |
| Liabilities, Less Cash and Receivables | (6.5 | %) | (4,398,315 | ) |
| Net Assets | 100.0 | % | 67,890,901 | |
a Non-income producing security.
b Security, or portion thereof, on loan.At August 31, 2012, the value of the fund’s securities on loan was $4,497,249
and the value of the collateral held by the fund was $4,597,205.
c Investment in real estate investment trust.
d Investment in affiliated money market mutual fund.
| | | |
| Portfolio Summary (Unaudited)† | | |
| |
| | Value (%) | | Value (%) |
| Capital Goods | 9.9 | Banks | 3.7 |
| Software & Services | 9.0 | Consumer Services | 3.5 |
| Real Estate | 8.4 | Commercial & Professional Services | 2.2 |
| Energy | 8.3 | Household & Personal Products | 2.1 |
| Money Market Investments | 8.2 | Consumer Durables & Apparel | 2.0 |
| Health Care Equipment & Services | 6.4 | Food, Beverage & Tobacco | 2.0 |
| Retailing | 6.2 | Semiconductors & | |
| Technology Hardware & Equipment | 5.6 | Semiconductor Equipment | 1.9 |
| Pharmaceuticals, | | Media | 1.5 |
| Biotech & Life Sciences | 5.1 | Automobiles & Components | 1.5 |
| Utilities | 4.6 | Transportation | 1.4 |
| Diversified Financials | 4.4 | Telecommunication Services | .4 |
| Materials | 4.4 | | |
| Insurance | 3.8 | | 106.5 |
| |
| † Based on net assets. | | | |
| See notes to financial statements. | | | |
14
STATEMENT OF ASSETS AND LIABILITIES
August 31, 2012
| | | | |
| | | Cost | Value | |
| Assets ($): | | | | |
| Investments in securities—See Statement of Investments (including | | | |
| securities on loan, valued at $4,497,249)—Note 1(b): | | | |
| Unaffiliated issuers | | 63,076,437 | 66,765,083 | |
| Affiliated issuers | | 5,524,133 | 5,524,133 | |
| Cash | | | 70,038 | |
| Dividends and securities lending income receivable | | | 312,956 | |
| Receivable for shares of Common Stock subscribed | | | 44,290 | |
| Prepaid expenses | | | 19,441 | |
| | | | 72,735,941 | |
| Liabilities ($): | | | | |
| Due to The Dreyfus Corporation and affiliates—Note 3(c) | | 73,625 | |
| Liability for securities on loan—Note 1(b) | | | 4,597,205 | |
| Payable for shares of Common Stock redeemed | | | 100,167 | |
| Accrued expenses | | | 74,043 | |
| | | | 4,845,040 | |
| Net Assets ($) | | | 67,890,901 | |
| Composition of Net Assets ($): | | | | |
| Paid-in capital | | | 80,768,446 | |
| Accumulated undistributed investment income—net | | | 312,634 | |
| Accumulated net realized gain (loss) on investments | | | (16,878,825 | ) |
| Accumulated net unrealized appreciation | | | | |
| (depreciation) on investments | | | 3,688,646 | |
| Net Assets ($) | | | 67,890,901 | |
| |
| |
| Net Asset Value Per Share | | | | |
| | Class A | Class C | Class I | |
| Net Assets ($) | 26,786,206 | 10,468,424 | 30,636,271 | |
| Shares Outstanding | 1,251,369 | 528,673 | 1,410,164 | |
| Net Asset Value Per Share ($) | 21.41 | 19.80 | 21.73 | |
| |
| See notes to financial statements. | | | | |
The Fund 15
| | |
| STATEMENT OF OPERATIONS | | |
| Year Ended August 31, 2012 | | |
| |
| |
| |
| |
| Investment Income ($): | | |
| Income: | | |
| Cash dividends: | | |
| Unaffiliated issuers | 1,130,660 | |
| Affiliated issuers | 446 | |
| Income from securities lending—Note 1(b) | 80,246 | |
| Total Income | 1,211,352 | |
| Expenses: | | |
| Management fee—Note 3(a) | 460,046 | |
| Shareholder servicing costs—Note 3(c) | 198,188 | |
| Distribution fees—Note 3(b) | 79,956 | |
| Registration fees | 47,036 | |
| Professional fees | 43,359 | |
| Prospectus and shareholders’ reports | 25,579 | |
| Custodian fees—Note 3(c) | 22,366 | |
| Directors’ fees and expenses—Note 3(d) | 4,760 | |
| Loan commitment fees—Note 2 | 28 | |
| Miscellaneous | 13,912 | |
| Total Expenses | 895,230 | |
| Less—reduction in fees due to earnings credits—Note 3(c) | (56 | ) |
| Net Expenses | 895,174 | |
| Investment Income—Net | 316,178 | |
| Realized and Unrealized Gain (Loss) on Investments—Note 4 ($): | | |
| Net realized gain (loss) on investments | 2,218,394 | |
| Net unrealized appreciation (depreciation) on investments | 5,332,767 | |
| Net Realized and Unrealized Gain (Loss) on Investments | 7,551,161 | |
| Net Increase in Net Assets Resulting from Operations | 7,867,339 | |
| |
| See notes to financial statements. | | |
16
STATEMENT OF CHANGES IN NET ASSETS
| | | | |
| | Year Ended August 31, | |
| | 2012 | a | 2011 | |
| Operations ($): | | | | |
| Investment income (loss)—net | 316,178 | | (271,585 | ) |
| Net realized gain (loss) on investments | 2,218,394 | | 18,979,741 | |
| Net unrealized appreciation | | | | |
| (depreciation) on investments | 5,332,767 | | 4,085,751 | |
| Net Increase (Decrease) in Net Assets | | | | |
| Resulting from Operations | 7,867,339 | | 22,793,907 | |
| Dividends to Shareholders from ($): | | | | |
| Investment income—net: | | | | |
| Class I Shares | — | | (55,786 | ) |
| Capital Stock Transactions ($): | | | | |
| Net proceeds from shares sold: | | | | |
| Class A Shares | 8,549,668 | | 9,548,620 | |
| Class B Shares | 685 | | 57,321 | |
| Class C Shares | 922,672 | | 959,967 | |
| Class I Shares | 9,549,383 | | 15,154,007 | |
| Dividends reinvested: | | | | |
| Class I Shares | — | | 54,008 | |
| Cost of shares redeemed: | | | | |
| Class A Shares | (8,909,071 | ) | (27,849,252 | ) |
| Class B Shares | (810,709 | ) | (1,148,902 | ) |
| Class C Shares | (2,029,092 | ) | (2,585,597 | ) |
| Class I Shares | (6,228,456 | ) | (50,356,931 | ) |
| Increase (Decrease) in Net Assets | | | | |
| from Capital Stock Transactions | 1,045,080 | | (56,166,759 | ) |
| Total Increase (Decrease) in Net Assets | 8,912,419 | | (33,428,638 | ) |
| Net Assets ($): | | | | |
| Beginning of Period | 58,978,482 | | 92,407,120 | |
| End of Period | 67,890,901 | | 58,978,482 | |
| Undistributed investment income—net | 312,634 | | — | |
The Fund 17
STATEMENT OF CHANGES IN NET ASSETS (continued)
| | | | |
| | Year Ended August 31, | |
| | 2012 | a | 2011 | |
| Capital Share Transactions: | | | | |
| Class Ab | | | | |
| Shares sold | 416,867 | | 502,019 | |
| Shares redeemed | (446,624 | ) | (1,511,372 | ) |
| Net Increase (Decrease) in Shares Outstanding | (29,757 | ) | (1,009,353 | ) |
| Class Bb | | | | |
| Shares sold | 20 | | 3,071 | |
| Shares redeemed | (44,609 | ) | (63,501 | ) |
| Net Increase (Decrease) in Shares Outstanding | (44,589 | ) | (60,430 | ) |
| Class C | | | | |
| Shares sold | 48,653 | | 51,812 | |
| Shares redeemed | (108,987 | ) | (147,845 | ) |
| Net Increase (Decrease) in Shares Outstanding | (60,334 | ) | (96,033 | ) |
| Class I | | | | |
| Shares sold | 462,837 | | 760,264 | |
| Shares issued for dividends reinvested | — | | 2,539 | |
| Shares redeemed | (324,158 | ) | (2,501,967 | ) |
| Net Increase (Decrease) in Shares Outstanding | 138,679 | | (1,739,164 | ) |
a Effective as of the close of business on March 13, 2012, the fund no longer offers Class B shares.
b During the period ended August 31, 2012, 12,108 Class B shares representing $223,031 were automatically
converted to 11,198 Class A shares and during the period ended August 31, 2011, 20,076 Class B shares
representing $366,375 were automatically converted to 18,687 Class A shares.
See notes to financial statements.
18
FINANCIAL HIGHLIGHTS
The following tables describe the performance for each share class for the fiscal periods indicated.All information (except portfolio turnover rate) reflects financial results for a single fund share.Total return shows how much your investment in the fund would have increased (or decreased) during each period, assuming you had reinvested all dividends and distributions.These figures have been derived from the fund’s financial statements.
| | | | | | | | | |
| | | Year Ended August 31, | | | |
| Class A Shares | 2012 | 2011 | | 2010 | | 2009 | | 2008 | |
| Per Share Data ($): | | | | | | | | | |
| Net asset value, beginning of period | 18.67 | 15.20 | | 13.62 | | 17.80 | | 20.93 | |
| Investment Operations: | | | | | | | | | |
| Investment income (loss)—neta | .11 | (.05 | ) | .04 | | .09 | | .06 | |
| Net realized and unrealized | | | | | | | | | |
| gain (loss) on investments | 2.63 | 3.52 | | 1.59 | | (4.20 | ) | (1.93 | ) |
| Total from Investment Operations | 2.74 | 3.47 | | 1.63 | | (4.11 | ) | (1.87 | ) |
| Distributions: | | | | | | | | | |
| Dividends from investment income—net | — | — | | (.05 | ) | (.07 | ) | — | |
| Dividends from net realized | | | | | | | | | |
| gain on investments | — | — | | — | | — | | (1.26 | ) |
| Total Distributions | — | — | | (.05 | ) | (.07 | ) | (1.26 | ) |
| Net asset value, end of period | 21.41 | 18.67 | | 15.20 | | 13.62 | | 17.80 | |
| Total Return (%)b | 14.68 | 22.83 | | 11.97 | | (23.02 | ) | (9.37 | ) |
| Ratios/Supplemental Data (%): | | | | | | | | | |
| Ratio of total expenses | | | | | | | | | |
| to average net assets | 1.41 | 1.43 | | 1.36 | | 1.52 | | 1.22 | |
| Ratio of net expenses | | | | | | | | | |
| to average net assets | 1.41 | 1.43 | | 1.36 | | 1.51 | | 1.22 | |
| Ratio of net investment income | | | | | | | | | |
| (loss) to average net assets | .55 | (.29 | ) | .27 | | .74 | | .32 | |
| Portfolio Turnover Rate | 93.44 | 77.12 | | 84.88 | | 102.59 | | 88.40 | |
| Net Assets, end of period ($ x 1,000) | 26,786 | 23,916 | | 34,811 | | 46,780 | | 60,795 | |
a Based on average shares outstanding at each month end.
b Exclusive of sales charge.
See notes to financial statements.
The Fund 19
FINANCIAL HIGHLIGHTS (continued)
| | | | | | | | | | |
| | | | Year Ended August 31, | | | |
| Class C Shares | 2012 | | 2011 | | 2010 | | 2009 | | 2008 | |
| Per Share Data ($): | | | | | | | | | | |
| Net asset value, beginning of period | 17.40 | | 14.25 | | 12.82 | | 16.78 | | 19.96 | |
| Investment Operations: | | | | | | | | | | |
| Investment income (loss)—neta | (.04 | ) | (.17 | ) | (.07 | ) | .00 | b | (.08 | ) |
| Net realized and unrealized | | | | | | | | | | |
| gain (loss) on investments | 2.44 | | 3.32 | | 1.50 | | (3.96 | ) | (1.84 | ) |
| Total from Investment Operations | 2.40 | | 3.15 | | 1.43 | | (3.96 | ) | (1.92 | ) |
| Distributions: | | | | | | | | | | |
| Dividends from net realized | | | | | | | | | | |
| gain on investments | — | | — | | — | | — | | (1.26 | ) |
| Net asset value, end of period | 19.80 | | 17.40 | | 14.25 | | 12.82 | | 16.78 | |
| Total Return (%)c | 13.79 | | 22.11 | | 11.15 | | (23.60 | ) | (10.10 | ) |
| Ratios/Supplemental Data (%): | | | | | | | | | | |
| Ratio of total expenses | | | | | | | | | | |
| to average net assets | 2.14 | | 2.09 | | 2.11 | | 2.23 | | 2.01 | |
| Ratio of net expenses | | | | | | | | | | |
| to average net assets | 2.14 | | 2.09 | | 2.11 | | 2.22 | | 2.00 | |
| Ratio of net investment income | | | | | | | | | | |
| (loss) to average net assets | (.20 | ) | (.95 | ) | (.49 | ) | .01 | | (.46 | ) |
| Portfolio Turnover Rate | 93.44 | | 77.12 | | 84.88 | | 102.59 | | 88.40 | |
| Net Assets, end of period ($ x 1,000) | 10,468 | | 10,246 | | 9,764 | | 11,499 | | 22,554 | |
a Based on average shares outstanding at each month end.
b Amount represents less than $.01 per share.
c Exclusive of sales charge.
See notes to financial statements.
20
| | | | | | | | | |
| | | Year Ended August 31, | | | |
| Class I Shares | 2012 | 2011 | | 2010 | | 2009 | | 2008 | |
| Per Share Data ($): | | | | | | | | | |
| Net asset value, beginning of period | 18.91 | 15.39 | | 13.79 | | 18.05 | | 21.18 | |
| Investment Operations: | | | | | | | | | |
| Investment income (loss)—neta | .16 | (.02 | ) | .09 | | .12 | | .10 | |
| Net realized and unrealized | | | | | | | | | |
| gain (loss) on investments | 2.66 | 3.56 | | 1.61 | | (4.26 | ) | (1.97 | ) |
| Total from Investment Operations | 2.82 | 3.54 | | 1.70 | | (4.14 | ) | (1.87 | ) |
| Distributions: | | | | | | | | | |
| Dividends from investment income—net | — | (.02 | ) | (.10 | ) | (.12 | ) | — | |
| Dividends from net realized | | | | | | | | | |
| gain on investments | — | — | | — | | — | | (1.26 | ) |
| Total Distributions | — | (.02 | ) | (.10 | ) | (.12 | ) | (1.26 | ) |
| Net asset value, end of period | 21.73 | 18.91 | | 15.39 | | 13.79 | | 18.05 | |
| Total Return (%) | 14.91 | 22.97 | | 12.37 | | (22.78 | ) | (9.25 | ) |
| Ratios/Supplemental Data (%): | | | | | | | | | |
| Ratio of total expenses | | | | | | | | | |
| to average net assets | 1.22 | 1.30 | | 1.05 | | 1.18 | | 1.04 | |
| Ratio of net expenses | | | | | | | | | |
| to average net assets | 1.22 | 1.30 | | 1.05 | | 1.17 | | 1.03 | |
| Ratio of net investment income | | | | | | | | | |
| (loss) to average net assets | .78 | (.12 | ) | .57 | | 1.01 | | .51 | |
| Portfolio Turnover Rate | 93.44 | 77.12 | | 84.88 | | 102.59 | | 88.40 | |
| Net Assets, end of period ($ x 1,000) | 30,636 | 24,045 | | 46,340 | | 46,124 | | 61,738 | |
| |
| a Based on average shares outstanding at each month end. | | | | | | | | |
| See notes to financial statements. | | | | | | | | | |
The Fund 21
NOTES TO FINANCIAL STATEMENTS
NOTE 1—Significant Accounting Policies:
Dreyfus Structured Midcap Fund (the “fund”) is a separate diversified series of Advantage Funds, Inc. (the “Company”) which is registered under the Investment Company Act of 1940, as amended (the “Act”), as an open-end management investment company and operates as a series company offering thirteen series, including the fund.The fund’s investment objective is to seek long-term capital growth.The Dreyfus Corporation (the “Manager” or “Dreyfus”), a wholly-owned subsidiary of The Bank of New York Mellon Corporation (“BNY Mellon”), serves as the fund’s investment adviser. Mellon Capital Management Corporation (“Mellon Capital”), an affiliate of Dreyfus, serves as the fund’s sub-investment adviser.
MBSC Securities Corporation (the “Distributor”), a wholly-owned subsidiary of Dreyfus, is the distributor of the fund’s shares.The fund is authorized to issue 500 million shares of $.001 par value Common Stock.The fund currently offers three classes of shares: Class A (300 million shares authorized), Class C (100 million shares authorized) and Class I (100 million shares authorized). Class A shares are subject to a sales charge imposed at the time of purchase. Class C shares are subject to a contingent deferred sales charge (“CDSC”) imposed on Class C shares redeemed within one year of purchase. Class I shares are sold at net asset value per share only to institutional investors.The Company’s Board of Directors approved, effective as of the close of business on March 13, 2012, the transfer of shares authorized from Class B to Class A shares. Class B shares were subject to a CDSC imposed on Class B share redemptions made within six years of purchase and automatically converted to Class A shares after six years. The fund no longer offers Class B shares. Effective March 13, 2012, all outstanding Class B shares were automatically converted to Class A shares. Other differences between the classes include the services offered to and the expenses borne by each class, the allocation of certain transfer agency costs and certain voting rights. Income, expenses (other than expenses attributable to a specific class), and realized and unrealized gains or losses on investments are allocated to each class of shares based on its relative net assets.
22
The Company accounts separately for the assets, liabilities and operations of each series. Expenses directly attributable to each series are charged to that series’ operations; expenses which are applicable to all series are allocated among them on a pro rata basis.
The Financial Accounting Standards Board (“FASB”) Accounting Standards Codification is the exclusive reference of authoritative U.S. generally accepted accounting principles (“GAAP”) recognized by the FASB to be applied by nongovernmental entities. Rules and interpretive releases of the Securities and Exchange Commission (“SEC”) under authority of federal laws are also sources of authoritative GAAP for SEC registrants. The fund’s financial statements are prepared in accordance with GAAP, which may require the use of management estimates and assumptions.Actual results could differ from those estimates.
The Company enters into contracts that contain a variety of indemnifications.The fund’s maximum exposure under these arrangements is unknown.The fund does not anticipate recognizing any loss related to these arrangements.
(a) Portfolio valuation: The fair value of a financial instrument is the amount that would be received to sell an asset or paid to transfer a liability in an orderly transaction between market participants at the measurement date (i.e., the exit price). GAAP establishes a fair value hierarchy that prioritizes the inputs of valuation techniques used to measure fair value.This hierarchy gives the highest priority to unadjusted quoted prices in active markets for identical assets or liabilities (Level 1 measurements) and the lowest priority to unobservable inputs (Level 3 measurements).
Additionally, GAAP provides guidance on determining whether the volume and activity in a market has decreased significantly and whether such a decrease in activity results in transactions that are not orderly. GAAP requires enhanced disclosures around valuation inputs and techniques used during annual and interim periods.
The Fund 23
NOTES TO FINANCIAL STATEMENTS (continued)
Various inputs are used in determining the value of the fund’s investments relating to fair value measurements.These inputs are summarized in the three broad levels listed below:
Level 1—unadjusted quoted prices in active markets for identical investments.
Level 2—other significant observable inputs (including quoted prices for similar investments, interest rates, prepayment speeds, credit risk, etc.).
Level 3—significant unobservable inputs (including the fund’s own assumptions in determining the fair value of investments).
The inputs or methodology used for valuing securities are not necessarily an indication of the risk associated with investing in those securities.
Changes in valuation techniques may result in transfers in or out of an assigned level within the disclosure hierarchy. Valuation techniques used to value the fund’s investments are as follows:
Investments in securities are valued at the last sales price on the securities exchange or national securities market on which such securities are primarily traded. Securities listed on the National Market System for which market quotations are available are valued at the official closing price or, if there is no official closing price that day, at the last sales price. Securities not listed on an exchange or the national securities market, or securities for which there were no transactions, are valued at the average of the most recent bid and asked prices, except for open short positions, where the asked price is used for valuation purposes. Bid price is used when no asked price is available. Registered investment companies that are not traded on an exchange are valued at their net asset value. All of the preceding securities are categorized within Level 1 of the fair value hierarchy.
Fair valuing of securities may be determined with the assistance of a pricing service using calculations based on indices of domestic securities and other appropriate indicators, such as prices of relevant American Depository Receipts and financial futures. Utilizing these techniques may result in transfers between Level 1 and Level 2 of the fair value hierarchy.
24
When market quotations or official closing prices are not readily available, or are determined not to reflect accurately fair value, such as when the value of a security has been significantly affected by events after the close of the exchange or market on which the security is principally traded (for example, a foreign exchange or market), but before the fund calculates its net asset value, the fund may value these investments at fair value as determined in accordance with the procedures approved by the Company’s Board of Directors. Certain factors may be considered when fair valuing investments such as: fundamental analytical data, the nature and duration of restrictions on disposition, an evaluation of the forces that influence the market in which the securities are purchased and sold, and public trading in similar securities of the issuer or comparable issuers.These securities are either categorized as Level 2 or 3 depending on the relevant inputs used.
For restricted securities where observable inputs are limited, assumptions about market activity and risk are used and are categorized within Level 3 of the fair value hierarchy.
The following is a summary of the inputs used as of August 31, 2012 in valuing the fund’s investments:
| | | | |
| | | Level 2—Other | Level 3— | |
| | Level 1— | Significant | Significant | |
| | Unadjusted | Observable | Unobservable | |
| | Quoted Prices | Inputs | Inputs | Total |
| Assets ($) | | | | |
| Investments in Securities: | | | |
| Equity Securities— | | | | |
| Domestic† | 66,765,083 | — | — | 66,765,083 |
| Mutual Funds | 5,524,133 | — | — | 5,524,133 |
| † See Statement of Investments for additional detailed categorizations. | |
At August 31, 2012, there were no transfers between Level 1 and Level 2 of the fair value hierarchy.
(b) Securities transactions and investment income: Securities transactions are recorded on a trade date basis. Realized gains and losses from securities transactions are recorded on the identified cost basis.
The Fund 25
NOTES TO FINANCIAL STATEMENTS (continued)
Dividend income is recognized on the ex-dividend date and interest income, including, where applicable, accretion of discount and amortization of premium on investments, is recognized on the accrual basis.
Pursuant to a securities lending agreement with The Bank of New York Mellon, a subsidiary of BNY Mellon and an affiliate of Dreyfus, the fund may lend securities to qualified institutions. It is the fund’s policy that, at origination, all loans are secured by collateral of at least 102% of the value of U.S. securities loaned and 105% of the value of foreign securities loaned. Collateral equivalent to at least 100% of the market value of securities on loan is maintained at all times. Collateral is either in the form of cash, which can be invested in certain money market mutual funds managed by Dreyfus, U.S. Government and Agency securities or letters of credit.The fund is entitled to receive all income on securities loaned, in addition to income earned as a result of the lending transaction. Although each security loaned is fully collateralized, the fund bears the risk of delay in recovery of, or loss of rights in, the securities loaned should a borrower fail to return the securities in a timely manner. During the period ended August 31, 2012, The Bank of New York Mellon earned $34,391 from lending portfolio securities, pursuant to the securities lending agreement.
(c) Affiliated issuers: Investments in other investment companies advised by Dreyfus are defined as “affiliated” in the Act. Investments in affiliated investment companies for the period ended August 31, 2012 were as follows:
| | | | | | | |
| Affiliated | | | | | | | |
| Investment | Value | | | | Value | | Net |
| Company | 8/31/2011 | ($) | Purchases ($) | Sales ($) | 8/31/2012 | ($) | Assets (%) |
| Dreyfus | | | | | | | |
| Institutional | | | | | | | |
| Preferred | | | | | | | |
| Plus Money | | | | | | | |
| Market | | | | | | | |
| Fund | 203,000 | | 11,635,707 | 10,911,779 | 926,928 | | 1.4 |
| Dreyfus | | | | | | | |
| Institutional | | | | | | | |
| Cash | | | | | | | |
| Advantage | | | | | | | |
| Fund | 17,823,756 | | 105,590,671 | 118,817,222 | 4,597,205 | | 6.8 |
| Total | 18,026,756 | | 117,226,378 | 129,729,001 | 5,524,133 | | 8.2 |
26
(d) Dividends to shareholders: Dividends are recorded on the ex-dividend date. Dividends from investment income-net and dividends from net realized capital gains, if any, are normally declared and paid annually, but the fund may make distributions on a more frequent basis to comply with the distribution requirements of the Internal Revenue Code of 1986, as amended (the “Code”).To the extent that net realized capital gains can be offset by capital loss carryovers, it is the policy of the fund not to distribute such gains. Income and capital gain distributions are determined in accordance with income tax regulations, which may differ from GAAP.
(e) Federal income taxes: It is the policy of the fund to continue to qualify as a regulated investment company, if such qualification is in the best interests of its shareholders, by complying with the applicable provisions of the Code, and to make distributions of taxable income sufficient to relieve it from substantially all federal income and excise taxes.
As of and during the period ended August 31, 2012, the fund did not have any liabilities for any uncertain tax positions.The fund recognizes interest and penalties, if any, related to uncertain tax positions as income tax expense in the Statement of Operations. During the period, the fund did not incur any interest or penalties.
Each of the tax years in the four-year period ended August 31, 2012 remains subject to examination by the Internal Revenue Service and state taxing authorities.
At August 31, 2012, the components of accumulated earnings on a tax basis were as follows: undistributed ordinary income $312,634, accumulated capital losses $16,849,775 and unrealized appreciation $3,659,596.
Under the Regulated Investment Company Modernization Act of 2010 (the “2010 Act”), the fund is permitted to carry forward capital losses incurred in taxable years beginning after December 22, 2010 (“post-enactment losses”) for an unlimited period. Furthermore, post-enactment capital loss carryovers retain their character as either short-term or long-term capital losses rather than short-term as they
The Fund 27
NOTES TO FINANCIAL STATEMENTS (continued)
were under previous statute. The 2010 Act requires post-enactment losses to be utilized before the utilization of losses incurred in taxable years prior to the effective date of the 2010 Act (“pre-enactment losses”).As a result of this ordering rule, pre-enactment losses may be more likely to expire unused.
The accumulated capital loss carryover is available for federal income tax purposes to be applied against future net realized capital gains, if any, realized subsequent to August 31, 2012. If not applied, the carryover expires in fiscal 2018.
The tax character of distributions paid to shareholders during the fiscal periods ended August 31, 2012 and August 31, 2011 were as follows: ordinary income $0 and $55,786, respectively.
During the period ended August 31, 2012, as a result of permanent book to tax differences, primarily due to the tax treatment for prior year net operating loss adjustment, the fund decreased accumulated undistributed investment income-net by $3,544 and increased paid-in capital by the same amount. Net assets and net asset value per share were not affected by this reclassification.
NOTE 2—Bank Lines of Credit:
The fund participates with other Dreyfus-managed funds in a $225 million unsecured credit facility led by Citibank, N.A. and a $300 million unsecured credit facility provided by The Bank of New York Mellon (each, a “Facility”), each to be utilized primarily for temporary or emergency purposes, including the financing of redemptions. In connection therewith, the fund has agreed to pay its pro rata portion of commitment fees for each Facility. Interest is charged to the fund based on rates determined pursuant to the terms of the respective Facility at the time of borrowing. During the period ended August 31, 2012, the fund did not borrow under the Facilities.
28
NOTE 3—Management Fee, Sub-Investment Advisory Fee and Other Transactions With Affiliates:
(a) Pursuant to a management agreement with Dreyfus, the management fee is computed at the annual rate of .75% of the value of the fund’s average daily net assets and is payable monthly.
Pursuant to a sub-investment advisory agreement between Dreyfus and Mellon Capital, the sub-investment advisory fee is payable monthly by Dreyfus, and is based upon the value of the fund’s average daily net assets, computed at the following annual rates:
| | |
| Average Net Assets | | |
| 0 up to $100 million | .25 | % |
| $100 million up to $1 billion | .20 | % |
| $1 billion up to $1.5 billion | .16 | % |
| In excess of $1.5 billion | .10 | % |
During the period ended August 31, 2012, the Distributor retained $1,875 from commissions earned on sales of the fund’s Class A shares and $3,739 and $170 from CDSCs on redemptions of the fund’s Class B and Class C shares, respectively.
(b) Under the Distribution Plan adopted pursuant to Rule 12b-1 under the Act, Class B shares paid and Class C shares pay the Distributor for distributing their shares at an annual rate of .75% of the value of the average daily net assets of Class B and Class C shares. During the period ended August 31, 2012, Class B and Class C shares were charged $1,865 and $78,091, respectively, pursuant to the Distribution Plan.
(c) Under the Shareholder Services Plan, Class A and Class C shares pay and Class B shares paid the Distributor at an annual rate of .25% of the value of their average daily net assets for the provision of certain services.The services provided may include personal services relating
The Fund 29
NOTES TO FINANCIAL STATEMENTS (continued)
to shareholder accounts, such as answering shareholder inquiries regarding the fund and providing reports and other information, and services related to the maintenance of shareholder accounts. The Distributor may make payments to Service Agents (securities dealers, financial institutions or other industry professionals) in respect of these services.The Distributor determines the amounts to be paid to Service Agents. During the period ended August 31, 2012, Class A, Class B and Class C shares were charged $63,278, $622 and $26,030, respectively, pursuant to the Shareholder Services Plan.
The fund has arrangements with the transfer agent and the custodian whereby the fund may receive earnings credits when positive cash balances are maintained, which are used to offset transfer agency and custody fees. For financial reporting purposes, the fund includes net earnings credits as an expense offset in the Statement of Operations.
The fund compensates DreyfusTransfer, Inc. (“DTI”), a wholly-owned subsidiary of Dreyfus, under a transfer agency agreement for providing transfer agency services for the fund and, since May 29, 2012, cash management services related to fund subscriptions and redemptions. During the period ended August 31, 2012, the fund was charged $13,174 for transfer agency services and $163 for cash management services. Cash management fees were partially offset by earnings credits of $19. These fees are included in Shareholder servicing costs in the Statement of Operations.
The fund compensatesThe Bank of NewYork Mellon under a custody agreement for providing custodial services for the fund. During the period ended August 31, 2012, the fund was charged $22,366 pursuant to the custody agreement.
Prior to May 29, 2012, the fund compensated The Bank of New York Mellon under a cash management agreement for performing cash management services related to fund subscriptions and redemptions. During
30
the period ended August 31, 2012, the fund was charged $1,317 pursuant to the cash management agreement, which is included in Shareholder servicing costs in the Statement of Operations.These fees were partially offset by earnings credits of $37.
During the period ended August 31, 2012, the fund was charged $6,392 for services performed by the Chief Compliance Officer and his staff.
The components of “Due to The Dreyfus Corporation and affiliates” in the Statement of Assets and Liabilities consist of: management fees $42,648, Distribution Plan fees $6,698, Shareholder Services Plan fees $7,819, custodian fees $8,259, Chief Compliance Officer fees $4,243 and transfer agency per account fees $3,958.
(d) Each Board member also serves as a Board member of other funds within the Dreyfus complex. Annual retainer fees and attendance fees are allocated to each fund based on net assets.
NOTE 4—Securities Transactions:
The aggregate amount of purchases and sales of investment securities, excluding short-term securities, during the period ended August 31, 2012, amounted to $57,318,023 and $56,997,867, respectively.
At August 31, 2012, the cost of investments for federal income tax purposes was $68,629,620; accordingly, accumulated net unrealized appreciation on investments was $3,659,596, consisting of $7,348,480 gross unrealized appreciation and $3,688,884 gross unrealized depreciation.
The Fund 31
REPORT OF INDEPENDENT REGISTERED
PUBLIC ACCOUNTING FIRM
Shareholders and Board of Directors
Dreyfus Structured Midcap Fund
We have audited the accompanying statement of assets and liabilities, including the statement of investments, of Dreyfus Structured Midcap Fund (one of the series comprising Advantage Funds, Inc.) as of August 31, 2012, and the related statement of operations for the year then ended, the statement of changes in net assets for each of the two years in the period then ended, and the financial highlights for each of the five years in the period then ended. These financial statements and financial highlights are the responsibility of the Fund’s management. Our responsibility is to express an opinion on these financial statements and financial highlights based on our audits.
We conducted our audits in accordance with the standards of the Public Company Accounting Oversight Board (United States).Those standards require that we plan and perform the audit to obtain reasonable assurance about whether the financial statements and financial highlights are free of material misstatement.We were not engaged to perform an audit of the Fund’s internal control over financial reporting. Our audits included consideration of internal control over financial reporting as a basis for designing audit procedures that are appropriate in the circumstances, but not for the purpose of expressing an opinion on the effectiveness of the Fund’s internal control over financial reporting. Accordingly, we express no such opinion.An audit also includes examining, on a test basis, evidence supporting the amounts and disclosures in the financial statements and financial highlights, assessing the accounting principles used and significant estimates made by management, and evaluating the overall financial statement presentation. Our procedures included confirmation of securities owned as of August 31, 2012 by correspondence with the custodian and others.We believe that our audits provide a reasonable basis for our opinion.
In our opinion, the financial statements and financial highlights referred to above present fairly, in all material respects, the financial position of Dreyfus Structured Midcap Fund at August 31, 2012, the results of its operations for the year then ended, the changes in its net assets for each of the two years in the period then ended, and the financial highlights for each of the five years in the period then ended, in conformity with U.S. generally accepted accounting principles.

New York, New York
October 29, 2012
32
PROXY RESULTS (Unaudited)
The Company held a special meeting of shareholders on August 3, 2012.The proposal considered at the meeting, and the results, are as follows:
| | | |
| | | Shares | |
| | Votes For | | Authority Withheld |
| To elect additional Board Members: | | | |
| Lynn Martin† | 90,334,756 | | 3,252,629 |
| Robin A. Melvin† | 90,449,622 | | 3,137,763 |
| Philip L. Toia† | 90,229,928 | | 3,357,457 |
† Each new Board Member’s term commenced on September 1, 2012.
In addition Peggy C. Davis, Joseph S. DiMartino, David P. Feldman, Ehud Houminer and Dr. Martin Peretz continue
as Board Members of the Company.
The Fund 33
INFORMATION ABOUT THE RENEWAL OF THE
FUND’S MANAGEMENT AND SUB-INVESTMENT
ADVISORY AGREEMENTS (Unaudited)
At a meeting of the fund’s Board of Directors held on March 6, 2012, the Board considered the renewal of the fund’s Management Agreement, pursuant to which Dreyfus provides the fund with investment advisory and administrative services (the “Agreement”), and the Sub-Investment Advisory Agreement (together, the “Agreements”), pursuant to which Mellon Capital Management Corporation (the “Sub-Adviser”) provides day-to-day management of the fund’s investments.The Board members, none of whom are “interested persons” (as defined in the Investment Company Act of 1940, as amended) of the fund, were assisted in their review by independent legal counsel and met with counsel in executive session separate from representatives of Dreyfus and the Sub-Adviser. In considering the renewal of the Agreements, the Board considered all factors that it believed to be relevant, including those discussed below. The Board did not identify any one factor as dispositive, and each Board member may have attributed different weights to the factors considered.
Analysis of Nature, Extent, and Quality of Services Provided to the Fund.The Board considered information previously provided to them in presentations from Dreyfus representatives regarding the nature, extent, and quality of the services provided to funds in the Dreyfus fund complex, and Dreyfus representatives confirmed that there had been no material changes in this information. Dreyfus provided the number of open accounts in the fund, the fund’s asset size and the allocation of fund assets among distribution channels. Dreyfus also had previously provided information regarding the diverse intermediary relationships and distribution channels of funds in the Dreyfus fund complex and Dreyfus’ corresponding need for broad, deep, and diverse resources to be able to provide ongoing shareholder services to each distribution channel, including the distribution channel(s) for the fund.
The Board also considered research support available to, and portfolio management capabilities of, the fund’s portfolio management personnel and that Dreyfus also provides oversight of day-to-day fund operations, including fund accounting and administration and assistance in meeting legal and regulatory requirements.The Board also considered Dreyfus’ extensive administrative, accounting, and compliance infrastructures, as
34
well as Dreyfus’ supervisory activities over the Sub-Adviser.The Board also considered portfolio management’s brokerage policies and practices (including policies and practices regarding soft dollars) and the standards applied in seeking best execution.
Comparative Analysis of the Fund’s Performance and Management Fee and Expense Ratio.The Board reviewed reports prepared by Lipper, Inc. (“Lipper”), an independent provider of investment company data, which included information comparing (1) the fund’s performance with the performance of a group of comparable funds (the “Performance Group”) and with a broader group of funds (the “Performance Universe”), all for various periods ended December 31, 2011, and (2) the fund’s actual and contractual management fees and total expenses with those of a group of comparable funds (the “Expense Group”) and with a broader group of funds (the “Expense Universe”), the information for which was derived in part from fund financial statements available to Lipper as of the date of its analysis. Dreyfus previously had furnished the Board with a description of the methodology Lipper used to select the Performance Group and Performance Universe and the Expense Group and Expense Universe.
Dreyfus representatives stated that the usefulness of performance comparisons may be affected by a number of factors, including different investment limitations that may be applicable to the fund and comparison funds.They also noted that performance generally should be considered over longer periods of time, although it is possible that long-term performance can be adversely affected by even one period of significant underperformance so that a single investment decision or theme has the ability to affect disproportionately long-term perfor-mance.The Board discussed the results of the comparisons and noted that the fund’s total return performance was above the Performance Group and Performance Universe medians for the various periods, except the five-year period when the fund’s performance was at the Performance Group median and below the Performance Universe median.The Board also noted that the fund’s performance ranked in
The Fund 35
INFORMATION ABOUT THE RENEWAL OF THE FUND’S MANAGEMENT
AND SUB-INVESTMENT ADVISORY AGREEMENTS (Unaudited) (continued)
the first quartile of the Performance Universe for the two most recent periods ended December 31st. Dreyfus also provided a comparison of the fund’s calendar year total returns to the returns of the fund’s benchmark index.
The Board also reviewed the range of actual and contractual management fees and total expenses of the Expense Group and Expense Universe funds and discussed the results of the comparisons.The Board noted that the fund’s contractual management fee was below the Expense Group median, the fund’s actual management fee was above the Expense Group and Expense Universe medians and the fund’s total expenses were above the Expense Group median and below the Expense Universe median.
Dreyfus representatives reviewed with the Board the management or investment advisory fees (1) paid by funds advised or administered by Dreyfus that are in the same Lipper category as the fund and (2) paid to Dreyfus or the Sub-Adviser or its affiliates for advising any separate accounts and/or other types of client portfolios that are considered to have similar investment strategies and policies as the fund (the “Similar Clients”), and explained the nature of the Similar Clients.They discussed differences in fees paid and the relationship of the fees paid in light of any differences in the services provided and other relevant factors.The Board considered the relevance of the fee information provided for the Similar Clients to evaluate the appropriateness and reasonableness of the fund’s management fee.
The Board considered the fee to the Sub-Adviser in relation to the fee paid to Dreyfus by the fund and the respective services provided by the Sub-Adviser and Dreyfus.The Board also noted the Sub-Adviser’s fee is paid by Dreyfus (out of its fee from the fund) and not the fund.
Analysis of Profitability and Economies of Scale. Dreyfus representatives reviewed the expenses allocated and profit received by Dreyfus and the resulting profitability percentage for managing the fund, and the method
36
used to determine the expenses and profit. The Board concluded that the profitability results were not unreasonable, given the services rendered and service levels provided by Dreyfus.The Board previously had been provided with information prepared by an independent consulting firm regarding Dreyfus’ approach to allocating costs to, and determining the profitability of, individual funds and the entire Dreyfus fund complex. The consulting firm also had analyzed where any economies of scale might emerge in connection with the management of a fund.
The Board’s counsel stated that the Board should consider the profitability analysis (1) as part of their evaluation of whether the fees under the Agreements bear a reasonable relationship to the mix of services provided by Dreyfus and the Sub-Adviser, including the nature, extent and quality of such services, and (2) in light of the relevant circumstances for the fund and the extent to which economies of scale would be realized if the fund grows and whether fee levels reflect these economies of scale for the benefit of fund shareholders. Since Dreyfus, and not the fund, pays the Sub-Adviser pursuant to the Sub-Investment Advisory Agreement, the Board did not consider the Sub-Adviser’s profitability to be relevant to its deliberations. Dreyfus representatives noted that a discussion of economies of scale is predicated on a fund having achieved a substantial size with increasing assets and that, if a fund’s assets had been stable or decreasing, the possibility that Dreyfus may have realized any economies of scale would be less. Dreyfus representatives also noted that, as a result of shared and allocated costs among funds in the Dreyfus fund complex, the extent of economies of scale could depend substantially on the level of assets in the complex as a whole, so that increases and decreases in complex-wide assets can affect potential economies of scale in a manner that is disproportionate to, or even in the opposite direction from, changes in the fund’s asset level. The Board also considered potential benefits to Dreyfus and the Sub-Adviser from acting as investment adviser and sub-investment adviser, respectively, and noted the soft dollar arrangements in effect for trading the fund’s investments.
The Fund 37
INFORMATION ABOUT THE RENEWAL OF THE FUND’S MANAGEMENT
AND SUB-INVESTMENT ADVISORY AGREEMENTS (Unaudited) (continued)
At the conclusion of these discussions, the Board agreed that it had been furnished with sufficient information to make an informed business decision with respect to the renewal of the Agreements. Based on the discussions and considerations as described above, the Board concluded and determined as follows.
The Board concluded that the nature, extent and quality of the services provided by Dreyfus and the Sub-Adviser are adequate and appropriate.
The Board was satisfied with the fund’s performance.
The Board concluded that the fees paid to Dreyfus and the Sub- Adviser were reasonable in light of the considerations described above.
The Board determined that the economies of scale which may accrue to Dreyfus and its affiliates in connection with the management of the fund had been adequately considered by Dreyfus in connection with the fee rate charged to the fund pursuant to the Agreement and that, to the extent in the future it were determined that material economies of scale had not been shared with the fund, the Board would seek to have those economies of scale shared with the fund.
The Board considered these conclusions and determinations, along with information received on a routine and regular basis throughout the year. In addition, it should be noted that the Board’s consideration of the contractual fee arrangements for this fund had the benefit of a number of years of reviews of prior or similar agreements during which lengthy discussions took place between the Board and Dreyfus representatives. Certain aspects of the arrangements may receive greater scrutiny in some years than in others, and the Board’s conclusions may be based, in part, on their consideration of the same or similar arrangements in prior years.The Board determined that renewal of the Agreements was in the best interests of the fund and its shareholders.
38
BOARD MEMBERS INFORMATION (Unaudited)

The Fund 39
BOARD MEMBERS INFORMATION (Unaudited) (continued)
40
OFFICERS OF THE FUND (Unaudited)

The Fund 41
OFFICERS OF THE FUND (Unaudited) (continued)

42
For More Information
Telephone Call your financial representative or 1-800-DREYFUS
Mail The Dreyfus Family of Funds, 144 Glenn Curtiss Boulevard, Uniondale, NY 11556-0144
The fund files its complete schedule of portfolio holdings with the Securities and Exchange Commission (“SEC”) for the first and third quarters of each fiscal year on Form N-Q. The fund’s Forms N-Q are available on the SEC’s website at http://www.sec.gov and may be reviewed and copied at the SEC’s Public Reference Room in Washington, DC. Information on the operation of the Public Reference Room may be obtained by calling 1-800-SEC-0330.
A description of the policies and procedures that the fund uses to determine how to vote proxies relating to portfolio securities, and information regarding how the fund voted these proxies for the most recent 12-month period ended June 30 is available at http://www.dreyfus.com and on the SEC’s website at http://www.sec.gov. The description of the policies and procedures is also available without charge, upon request, by calling 1-800-DREYFUS.

|
| © 2012 MBSC Securities Corporation |
Dreyfus
Technology Growth Fund
ANNUAL REPORT August 31, 2012

Save time. Save paper. View your next shareholder report online as soon as it’s available. Log into www.dreyfus.com and sign up for Dreyfus eCommunications. It’s simple and only takes a few minutes.
The views expressed in this report reflect those of the portfolio manager only through the end of the period covered and do not necessarily represent the views of Dreyfus or any other person in the Dreyfus organization. Any such views are subject to change at any time based upon market or other conditions and Dreyfus disclaims any responsibility to update such views.These views may not be relied on as investment advice and, because investment decisions for a Dreyfus fund are based on numerous factors, may not be relied on as an indication of trading intent on behalf of any Dreyfus fund.
Not FDIC-Insured • Not Bank-Guaranteed • May Lose Value
| |
| | Contents |
| |
| | THE FUND |
| 2 | A Letter from the Chairman and CEO |
| 3 | Discussion of Fund Performance |
| 6 | Fund Performance |
| 8 | Understanding Your Fund’s Expenses |
| 8 | Comparing Your Fund’s Expenses |
| With Those of Other Funds |
| 9 | Statement of Investments |
| 12 | Statement of Assets and Liabilities |
| 13 | Statement of Operations |
| 14 | Statement of Changes in Net Assets |
| 16 | Financial Highlights |
| 19 | Notes to Financial Statements |
| 30 | Report of Independent Registered |
| | Public Accounting Firm |
| 31 | Proxy Results |
| 32 | Information About the Renewal of |
| | the Fund’s Management Agreement |
| 37 | Board Members Information |
| 39 | Officers of the Fund |
| |
| FOR MORE INFORMATION |
|
| | Back Cover |
Dreyfus
Technology Growth Fund
The Fund

A LETTER FROM THE CHAIRMAN AND CEO
Dear Shareholder:
We are pleased to present this annual report for Dreyfus Technology Growth Fund, covering the 12-month period from September 1, 2011, through August 31, 2012. For information about how the fund performed during the reporting period, as well as general market perspectives, we provide a Discussion of Fund Performance on the pages that follow.
U.S. equities proved unusually volatile over the past year, as prices rose and fell according to investors’ changing expectations of global and domestic economic conditions. When viewed over a longer time frame, however, the pace of U.S. economic growth has been relatively consistent at about half the average rate achieved in prior recoveries. Even U.S. employment numbers, which have been volatile over short periods, averaged slightly better than 150,000 new jobs a month so far in 2012, roughly unchanged from the monthly average in 2011.
The sustained but subpar U.S. expansion appears likely to continue over the foreseeable future. On one hand, the economy has responded to a variety of stimulative measures, most notably an aggressively accommodative monetary policy. On the other hand, the prospect of automatic spending cuts and tax hikes scheduled for the end of 2012 has weighed on economic growth by contributing to a temporary postponement of spending decisions among consumers and businesses. Indeed, the ability of the U.S. political system to address both this “fiscal cliff” and long-term deficit reduction could go a long way toward shaping the 2013 market environment.As always, we urge you to speak regularly with your financial advisor to discuss how changing economic conditions may affect your investments.
Thank you for your continued confidence and support.

Jonathan R. Baum
Chairman and Chief Executive Officer
The Dreyfus Corporation
September 17, 2012
2

DISCUSSION OF FUND PERFORMANCE
For the period of September 1, 2011, through August 31, 2012, as provided by Barry K. Mills, CFA, Portfolio Manager
Fund and Market Performance Overview
For the 12-month period ended August 31, 2012, Dreyfus Technology Growth Fund’s Class A shares produced a total return of 16.30%, Class C shares returned 15.33% and Class I shares returned 16.71%.1 In comparison, the fund’s benchmarks, the Morgan Stanley High Technology 35 Index (“MS High Tech 35 Index”) and the Standard & Poor’s 500 Composite Stock Price Index (“S&P 500 Index”), produced total returns of 16.19% and 17.98%, respectively, over the same period.2,3 Changing economic data fueled heightened market volatility during the reporting period as investors shifted from a defensive investment posture to a constructive stance and back and forth again.The fund’s Class A and I shares produced higher returns than the MS High Tech 35 Index, primarily due to its focus on long-term secular trends that lifted the fortunes of well-positioned companies.
The Fund’s Investment Approach
The fund seeks capital appreciation by investing in growth companies of any size that we regard as leading producers or beneficiaries of technological innovation.The fund’s investment process centers on a multi-dimensional approach that looks for opportunities across emerging growth, cyclical or stable growth companies.The fund seeks companies that appear to have strong earnings momentum, positive earnings revisions, favorable growth, product or market cycles and/or favorable valuations.
Macroeconomic Developments Fueled Market Volatility
The reporting period began in the midst of a major decline in U.S. and global equity markets. The unprecedented downgrade of one credit-rating agency’s assessment of long-term U.S. government debt, an intensifying debt crisis in Europe and inflationary pressures in China triggered a flight away from stocks and toward traditional safe havens,
The Fund 3
DISCUSSION OF FUND PERFORMANCE (continued)
such as U.S. Treasury securities. Fortunately, better U.S. economic data and new remedial measures from European policymakers soon arrested the decline, and market sentiment began to improve during the fall of 2011.
By the beginning of 2012, U.S. stocks were rallying in the midst of U.S. employment gains, a quantitative easing program in Europe that helped avert a more severe banking crisis, and the easing of restrictive monetary and fiscal policies in China. Investors grew more tolerant of risks, and they focused on global companies expected to benefit from better business conditions. These positive influences were called into question during the spring when the U.S. labor market’s rebound slowed and measures designed to relieve fiscal pressures in Europe encountered political resistance. However, the summer of 2012 saw another round of encouraging economic data, and the S&P 500 Index ended the reporting period near multi-year highs.
In addition to these macroeconomic developments, the technology sector was influenced by several positive secular trends, most notably the increasing popularity of cloud computing and mobile devices. Some companies led the new technologies’ advance and gained value, while others were slow to adapt to the changing marketplace and were left behind.
Security Selection Strategy Buoyed Fund Results
An early focus on the cloud computing and mobility trends helped the fund participate more fully than the MS High Tech 35 Index in some of the technology sector’s better performers. For example, online media giant Google and electronics innovator Apple fared particularly well in the smartphone and tablet computer categories, while the fund avoided Nokia, Research in Motion and Erickson, which continued to struggle with disappointing new smartphone products.
The trend toward greater mobility also hurt makers of traditional personal computers, such as Dell and Hewlett-Packard, both of which the fund avoided. Instead, we focused on suppliers of components used in smartphones and tablets, such as semiconductor manufacturer Skyworks Solutions, and content delivery specialists, such as Akamai Technologies and F5 Networks. Other winners over the reporting period included software developerTaleo, which was acquired at a substantial premium to its stock price at the time.
4
Disappointments during the reporting period included LED lighting maker Cree, where sluggish demand and pricing pressures eroded profit margins. Videogame developer Electronic Arts continued to struggle with an industry-wide shift from store-purchased software to online content delivery. Late in the reporting period, data management company Informatica was hurt by reduced earnings guidance from management in response to sales force issues and the company’s exposure to European markets.The fund also encountered shortfalls related to poor timing in the purchase and sale of disk drive producer SeagateTechnology and lack of exposure to online auctioneer eBay.
Positioned for Secular Growth
While we remain concerned regarding sluggish U.S. economic growth and continued turmoil in Europe, we believe that the positive, secular technology trends that helped drive the fund’s gains over the reporting period remain intact. In addition, we expect business spending on technology to accelerate later this year, potentially benefiting companies with productivity-enhancing products and services. Conversely, we have continued to find relatively few opportunities among companies selling legacy technologies.
September 17, 2012
Please note, the position in any security highlighted with italicized typeface was sold during the reporting period.
Equity funds are subject generally to market, market sector, market liquidity, issuer and investment style risks, among other factors, to varying degrees, all of which are more fully described in the fund’s prospectus.
The technology sector has been among the most volatile sectors of the stock market. Technology companies involve greater risk because their revenue and/or earnings tend to be less predictable and some companies may be experiencing significant losses.
| 1 | Total return includes reinvestment of dividends and any capital gains paid, and does not take into consideration the maximum initial sales charge in the case of Class A shares, or the applicable contingent deferred sales charge imposed on redemptions in the case of Class C shares. Had these charges been reflected, returns would have been lower. Past performance is no guarantee of future results. Share price, yield and investment return fluctuate such that upon redemption, fund shares may be worth more or less than their original cost. |
| 2 | SOURCE: BLOOMBERG L.P. — Reflects reinvestment of net dividends and, where applicable, capital gain distributions.The Morgan Stanley High Technology 35 Index is an unmanaged, equal dollar-weighted index of 35 stocks from the electronics-based subsectors.The index does not take into account fees and expenses to which the fund is subject. Investors cannot invest directly in any index. |
| 3 | SOURCE: LIPPER INC. — Reflects monthly reinvestment of dividends and, where applicable, capital gain distributions.The Standard & Poor’s 500 Composite Stock Price Index is a widely accepted, unmanaged index of U.S. stock market performance.The index does not take into account fees and expenses to which the fund is subject. Investors cannot invest directly in any index. |
The Fund 5
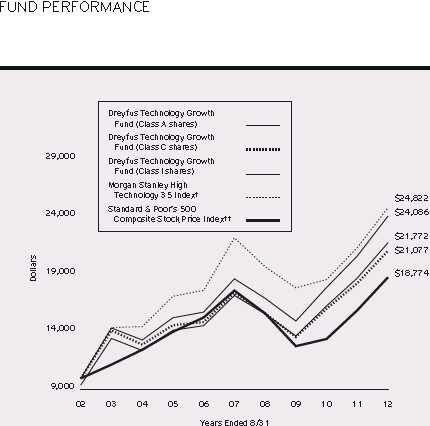
Comparison of change in value of $10,000 investment in Dreyfus Technology Growth Fund Class A shares, Class C shares and Class I shares with the Morgan Stanley High Technology 35 Index and the Standard & Poor’s 500 Composite Stock Price Index
† Source: Bloomberg L.P.
Source: Lipper Inc.
Past performance is not predictive of future performance.
The above graph compares a $10,000 investment made in each of the Class A, Class C and Class I shares of Dreyfus Technology Growth Fund on 8/31/02 to a $10,000 investment made in each of the Standard & Poor’s 500 Composite Stock Price Index (the “S&P 500 Index”) and the Morgan Stanley High Technology 35 Index (the “MS High Tech 35 Index”) on that date.All dividends and capital gain distributions are reinvested.
The fund’s performance shown in the line graph above takes into account the maximum initial sales charge on Class A shares and all other applicable fees and expenses on all classes.The S&P 500 Index is a widely accepted, unmanaged index of U.S. stock market performance.The MS High Tech 35 Index reflects reinvestment of net dividends and, where applicable, capital gain distributions.The MS High Tech 35 Index is an unmanaged, equal dollar-weighted index from the electronics-based subsectors. Unlike a mutual fund, the indices are not subject to charges, fees and other expenses. Investors cannot invest directly in any index. Further information relating to fund performance, including expense reimbursements, if applicable, is contained in the Financial Highlights section of the prospectus and elsewhere in this report.
6
| | | | | | |
| Average Annual Total Returns as of 8/31/12 | | | | | | |
| |
| | 1 | Year | 5 Years | | 10 Years | |
| Class A shares | | | | | | |
| with maximum sales charge (5.75%) | 9.62 | % | 3.59 | % | 8.09 | % |
| without sales charge | 16.30 | % | 4.82 | % | 8.73 | % |
| Class C shares | | | | | | |
| with applicable redemption charge † | 14.33 | % | 3.89 | % | 7.74 | % |
| without redemption | 15.33 | % | 3.89 | % | 7.74 | % |
| Class I shares | 16.71 | % | 5.24 | % | 9.19 | % |
| Morgan Stanley | | | | | | |
| High Technology 35 Index | 16.19 | % | 2.26 | % | 9.51 | % |
| Standard & Poor’s 500 | | | | | | |
| Composite Stock Price Index | 17.98 | % | 1.28 | % | 6.50 | % |
Past performance is not predictive of future performance.The fund’s performance shown in the graph and table does not reflect the deduction of taxes that a shareholder would pay on fund distributions or the redemption of fund shares.
† The maximum contingent deferred sales charge for Class C shares is 1% for shares redeemed within one year of the
date of purchase.
The Fund 7
UNDERSTANDING YOUR FUND’S EXPENSES (Unaudited)
As a mutual fund investor, you pay ongoing expenses, such as management fees and other expenses. Using the information below, you can estimate how these expenses affect your investment and compare them with the expenses of other funds.You also may pay one-time transaction expenses, including sales charges (loads) and redemption fees, which are not shown in this section and would have resulted in higher total expenses. For more information, see your fund’s prospectus or talk to your financial adviser.
Review your fund’s expenses
The table below shows the expenses you would have paid on a $1,000 investment in Dreyfus Technology Growth Fund from March 1, 2012 to August 31, 2012. It also shows how much a $1,000 investment would be worth at the close of the period, assuming actual returns and expenses.
Expenses and Value of a $1,000 Investment
assuming actual returns for the six months ended August 31, 2012
| | | | | | |
| | | Class A | | Class C | | Class I |
| Expenses paid per $1,000† | | $7.22 | | $11.31 | | $5.42 |
| Ending value (after expenses) | | $995.90 | | $991.60 | | $997.80 |
COMPARING YOUR FUND’S EXPENSES WITH THOSE OF OTHER FUNDS (Unaudited)
Using the SEC’s method to compare expenses
The Securities and Exchange Commission (SEC) has established guidelines to help investors assess fund expenses. Per these guidelines, the table below shows your fund’s expenses based on a $1,000 investment, assuming a hypothetical 5% annualized return. You can use this information to compare the ongoing expenses (but not transaction expenses or total cost) of investing in the fund with those of other funds.All mutual fund shareholder reports will provide this information to help you make this comparison. Please note that you cannot use this information to estimate your actual ending account balance and expenses paid during the period.
Expenses and Value of a $1,000 Investment
assuming a hypothetical 5% annualized return for the six months ended August 31, 2012
| | | | | | |
| | | Class A | | Class C | | Class I |
| Expenses paid per $1,000† | | $7.30 | | $11.44 | | $5.48 |
| Ending value (after expenses) | | $1,017.90 | | $1,013.77 | | $1,019.71 |
† Expenses are equal to the fund’s annualized expense ratio of 1.44% for Class A, , 2.26% for Class C and 1.08%
for Class I, multiplied by the average account value over the period, multiplied by 184/366 (to reflect the one-half
year period).
8
STATEMENT OF INVESTMENTS
August 31, 2012
| | | | |
| Common Stocks—98.9% | Shares | | | Value ($) |
| Communications Equipment—10.2% | | | | |
| | | |
| Ciena | 651,920 | a,b | | 8,911,746 |
| F5 Networks | 83,250 | b | | 8,116,043 |
| QUALCOMM | 179,360 | | | 11,023,466 |
| | | | | 28,051,255 |
| Computers & Peripherals—10.2% | | | | |
| Apple | 28,108 | | | 18,698,566 |
| SanDisk | 228,680 | b | | 9,426,190 |
| | | | | 28,124,756 |
| Electronic Equipment & Instruments—2.1% | | | | |
| Amphenol, Cl. A | 96,390 | | | 5,867,259 |
| Household Durables—1.8% | | | | |
| Garmin | 121,160 | a | | 4,888,806 |
| Internet & Catalog Retail—7.5% | | | | |
| Amazon.com | 59,630 | b | | 14,801,955 |
| Priceline.com | 9,900 | b | | 5,985,243 |
| | | | | 20,787,198 |
| Internet Software & Services—14.3% | | | | |
| Akamai Technologies | 376,950 | b | | 14,139,394 |
| Google, Cl. A | 15,448 | b | | 10,583,270 |
| LinkedIn, Cl. A | 119,690 | b | | 12,842,737 |
| LogMeIn | 78,850 | b | | 1,733,123 |
| | | | | 39,298,524 |
| IT Services—10.5% | | | | |
| Cognizant Technology Solutions, Cl. A | 128,117 | b | | 8,235,361 |
| MasterCard, Cl. A | 13,120 | | | 5,548,448 |
| Paychex | 192,970 | | | 6,418,182 |
| Teradata | 112,250 | b | | 8,573,655 |
| | | | | 28,775,646 |
| Semiconductors & Semiconductor | | | | |
| Equipment—23.7% | | | | |
| Analog Devices | 269,050 | | | 10,692,047 |
| Broadcom, Cl. A | 364,110 | b | | 12,936,828 |
| Skyworks Solutions | 418,950 | b | | 12,761,217 |
| | | |
The Fund 9
STATEMENT OF INVESTMENTS (continued)
| | | |
| Common Stocks (continued) | Shares | | Value ($) |
| Semiconductors & Semiconductor | | | |
| Equipment (continued) | | | |
| Taiwan Semiconductor Manufacturing, ADR | 556,500 | | 8,180,550 |
| Texas Instruments | 338,690 | | 9,835,558 |
| Xilinx | 323,080 | | 10,955,643 |
| | | | 65,361,843 |
| Software—18.6% | | | |
| Citrix Systems | 76,280 | b | 5,926,193 |
| Fortinet | 138,370 | b | 3,668,189 |
| Informatica | 139,878 | b | 4,560,023 |
| Oracle | 315,526 | | 9,986,398 |
| Red Hat | 127,180 | b | 7,127,167 |
| Salesforce.com | 80,510 | b | 11,688,442 |
| VMware, Cl. A | 92,020 | b | 8,193,461 |
| | | | 51,149,873 |
| Total Common Stocks | | | |
| (cost $216,211,280) | | | 272,305,160 |
| |
| Limited Partnership Interests—.3% | | | |
| Semiconductors & Semiconductor Equipment | | | |
| Bluestream Ventures, LPb,d | | | |
| (cost $2,329,314) | | | 744,551 |
| |
| Other Investment—1.0% | | | |
| Registered Investment Company; | | | |
| Dreyfus Institutional Preferred | | | |
| Plus Money Market Fund | | | |
| (cost $2,891,277) | 2,891,277 | c | 2,891,277 |
10
| | | | |
| Investment of Cash Collateral | | | | |
| for Securities Loaned—2.4% | Shares | | Value ($) | |
| Registered Investment Company; | | | | |
| Dreyfus Institutional Cash Advantage Fund | | | | |
| (cost $6,528,041) | 6,528,041 | c | 6,528,041 | |
| Total Investments (cost $227,959,912) | 102.6 | % | 282,469,029 | |
| Liabilities, Less Cash and Receivables | (2.6 | %) | (7,105,887 | ) |
| Net Assets | 100.0 | % | 275,363,142 | |
ADR—American Depository Receipts
a Security, or portion thereof, on loan.At August 31, 2012, the value of the fund’s securities on loan was $6,435,364
and the value of the collateral held by the fund was $6,528,041.
b Non-income producing security.
c Investment in affiliated money market mutual fund.
d Securities restricted as to public resale. Investment in restricted securities with aggregate value of $744,551
representing .3% of net assets (see below).
| | | | |
| Issuer | Acquisition Date | Cost ($) | Net Assets (%) | Valuation ($)† |
| Bluestream | | | | |
| Ventures, LP | 4/30/2004-6/11/2008 | 2,329,314 | .3 | 744,551 |
† The valuation of these securities has been determined in good faith by management under the direction of the
Board of Directors.
| | | |
| Portfolio Summary (Unaudited)†† | | |
| |
| | Value (%) | | Value (%) |
| Semiconductors & | | Computers & Peripherals | 10.2 |
| Semiconductor Equipment | 24.0 | Internet & Catalog Retail | 7.5 |
| Software | 18.6 | Money Market Investments | 3.4 |
| Internet Software & Services | 14.3 | Electronic Equipment & Instruments | 2.1 |
| IT Services | 10.5 | Household Durables | 1.8 |
| Communications Equipment | 10.2 | | 102.6 |
| |
| †† Based on net assets. | | | |
| See notes to financial statements. | | | |
The Fund 11
STATEMENT OF ASSETS AND LIABILITIES
August 31, 2012
| | | | |
| | | Cost | Value | |
| Assets ($): | | | | |
| Investments in securities—See Statement of Investments (including | | | |
| securities on loan, valued at $6,435,364)—Note 1(b): | | | |
| Unaffiliated issuers | | 218,540,594 | 273,049,711 | |
| Affiliated issuers | | 9,419,318 | 9,419,318 | |
| Dividends and securities lending income receivable | | | 120,208 | |
| Receivable for shares of Common Stock subscribed | | 115,346 | |
| Prepaid expenses | | | 57,862 | |
| | | | 282,762,445 | |
| Liabilities ($): | | | | |
| Due to The Dreyfus Corporation and affiliates—Note 3(c) | | 326,782 | |
| Cash overdraft due to Custodian | | | 15,357 | |
| Liability for securities on loan—Note 1(b) | | | 6,528,041 | |
| Payable for shares of Common Stock redeemed | | | 301,146 | |
| Accrued expenses | | | 227,977 | |
| | | | 7,399,303 | |
| Net Assets ($) | | | 275,363,142 | |
| Composition of Net Assets ($): | | | | |
| Paid-in capital | | | 246,103,884 | |
| Accumulated net realized gain (loss) on investments | | (25,249,859 | ) |
| Accumulated net unrealized appreciation | | | | |
| (depreciation) on investments | | | 54,509,117 | |
| Net Assets ($) | | | 275,363,142 | |
| |
| |
| Net Asset Value Per Share | | | | |
| | Class A | Class C | Class I | |
| Net Assets ($) | 234,452,234 | 27,427,880 | 13,483,028 | |
| Shares Outstanding | 6,815,914 | 898,075 | 371,979 | |
| Net Asset Value Per Share ($) | 34.40 | 30.54 | 36.25 | |
| |
| See notes to financial statements. | | | | |
12
| | |
| STATEMENT OF OPERATIONS | | |
| Year Ended August 31, 2012 | | |
| |
| |
| |
| |
| Investment Income ($): | | |
| Income: | | |
| Cash dividends (net of $55,356 foreign taxes withheld at source): | | |
| Unaffiliated issuers | 2,085,207 | |
| Affiliated issuers | 8,308 | |
| Income from securities lending—Note 1(b) | 29,851 | |
| Total Income | 2,123,366 | |
| Expenses: | | |
| Management fee—Note 3(a) | 2,058,370 | |
| Shareholder servicing costs—Note 3(c) | 1,563,240 | |
| Distribution fees—Note 3(b) | 215,112 | |
| Prospectus and shareholders’ reports | 131,935 | |
| Professional fees | 63,529 | |
| Registration fees | 60,786 | |
| Directors’ fees and expenses—Note 3(d) | 22,847 | |
| Custodian fees—Note 3(c) | 21,326 | |
| Loan commitment fees—Note 2 | 3,550 | |
| Miscellaneous | 13,052 | |
| Total Expenses | 4,153,747 | |
| Less—reduction in fees due to earnings credits—Note 3(c) | (1,241 | ) |
| Net Expenses | 4,152,506 | |
| Investment (Loss)—Net | (2,029,140 | ) |
| Realized and Unrealized Gain (Loss) on Investments—Note 4 ($): | | |
| Net realized gain (loss) on investments | 10,302,134 | |
| Net unrealized appreciation (depreciation) on investments | 30,650,215 | |
| Net Realized and Unrealized Gain (Loss) on Investments | 40,952,349 | |
| Net Increase in Net Assets Resulting from Operations | 38,923,209 | |
| |
| See notes to financial statements. | | |
The Fund 13
STATEMENT OF CHANGES IN NET ASSETS
| | | | |
| | Year Ended August 31, | |
| | 2012 | a | 2011 | |
| Operations ($): | | | | |
| Investment (loss)—net | (2,029,140 | ) | (2,884,755 | ) |
| Net realized gain (loss) on investments | 10,302,134 | | 54,452,468 | |
| Net unrealized appreciation | | | | |
| (depreciation) on investments | 30,650,215 | | (4,148,147 | ) |
| Net Increase (Decrease) in Net Assets | | | | |
| Resulting from Operations | 38,923,209 | | 47,419,566 | |
| Capital Stock Transactions ($): | | | | |
| Net proceeds from shares sold: | | | | |
| Class A Shares | 40,332,346 | | 73,277,053 | |
| Class B Shares | 16,245 | | 119,693 | |
| Class C Shares | 1,540,108 | | 6,194,425 | |
| Class I Shares | 10,088,336 | | 17,293,125 | |
| Cost of shares redeemed: | | | | |
| Class A Shares | (64,521,416 | ) | (134,780,551 | ) |
| Class B Shares | (1,105,881 | ) | (1,911,070 | ) |
| Class C Shares | (5,935,073 | ) | (4,591,033 | ) |
| Class I Shares | (13,857,506 | ) | (5,485,144 | ) |
| Increase (Decrease) in Net Assets | | | | |
| from Capital Stock Transactions | (33,442,841 | ) | (49,883,502 | ) |
| Total Increase (Decrease) in Net Assets | 5,480,368 | | (2,463,936 | ) |
| Net Assets ($): | | | | |
| Beginning of Period | 269,882,774 | | 272,346,710 | |
| End of Period | 275,363,142 | | 269,882,774 | |
14
| | | | |
| | Year Ended August 31, | |
| | 2012 | a | 2011 | |
| Capital Share Transactions: | | | | |
| Class Ab | | | | |
| Shares sold | 1,191,526 | | 2,332,287 | |
| Shares redeemed | (2,016,252 | ) | (4,126,739 | ) |
| Net Increase (Decrease) in Shares Outstanding | (824,726 | ) | (1,794,452 | ) |
| Class Bb | | | | |
| Shares sold | 394 | | 4,231 | |
| Shares redeemed | (37,833 | ) | (66,286 | ) |
| Net Increase (Decrease) in Shares Outstanding | (37,439 | ) | (62,055 | ) |
| Class C | | | | |
| Shares sold | 45,899 | | 212,946 | |
| Shares redeemed | (203,519 | ) | (158,309 | ) |
| Net Increase (Decrease) in Shares Outstanding | (157,620 | ) | 54,637 | |
| Class I | | | | |
| Shares sold | 294,207 | | 501,403 | |
| Shares redeemed | (403,044 | ) | (160,979 | ) |
| Net Increase (Decrease) in Shares Outstanding | (108,837 | ) | 340,424 | |
a Effective as of the close of business on March 13, 2012, the fund no longer offers Class B shares.
b During the period ended August 31, 2012, 20,762 Class B shares representing $613,816 were automatically
converted to 18,272 Class A shares and during the period ended August 31, 2011, 32,681 Class B shares
representing $945,338 were automatically converted to 29,067 Class A shares.
See notes to financial statements.
The Fund 15
FINANCIAL HIGHLIGHTS
The following tables describe the performance for each share class for the fiscal periods indicated.All information (except portfolio turnover rate) reflects financial results for a single fund share.Total return shows how much your investment in the fund would have increased (or decreased) during each period, assuming you had reinvested all dividends and distributions.These figures have been derived from the fund’s financial statements.
| | | | | | | | | | |
| | | | Year Ended August 31, | | | |
| Class A Shares | 2012 | | 2011 | | 2010 | | 2009 | | 2008 | |
| Per Share Data ($): | | | | | | | | | | |
| Net asset value, beginning of period | 29.58 | | 25.75 | | 21.63 | | 24.63 | | 27.18 | |
| Investment Operations: | | | | | | | | | | |
| Investment (loss)—neta | (.22 | ) | (.25 | ) | (.27 | ) | (.13 | ) | (.15 | ) |
| Net realized and unrealized | | | | | | | | | | |
| gain (loss) on investments | 5.04 | | 4.08 | | 4.39 | | (2.87 | ) | (2.40 | ) |
| Total from Investment Operations | 4.82 | | 3.83 | | 4.12 | | (3.00 | ) | (2.55 | ) |
| Net asset value, end of period | 34.40 | | 29.58 | | 25.75 | | 21.63 | | 24.63 | |
| Total Return (%)b | 16.30 | | 14.87 | | 19.05 | | (12.22 | ) | (9.35 | ) |
| Ratios/Supplemental Data (%): | | | | | | | | | | |
| Ratio of total expenses | | | | | | | | | | |
| to average net assets | 1.45 | | 1.36 | | 1.51 | | 1.70 | | 1.52 | |
| Ratio of net expenses | | | | | | | | | | |
| to average net assets | 1.45 | | 1.36 | | 1.51 | | 1.67 | | 1.44 | |
| Ratio of net investment (loss) | | | | | | | | | | |
| to average net assets | (.67 | ) | (.79 | ) | (1.09 | ) | (.72 | ) | (.59 | ) |
| Portfolio Turnover Rate | 69.20 | | 90.28 | | 110.92 | | 122.48 | | 126.37 | |
| Net Assets, end of period ($ x 1,000) | 234,452 | | 226,016 | | 242,999 | | 214,170 | | 257,360 | |
a Based on average shares outstanding at each month end.
b Exclusive of sales charge.
See notes to financial statements.
16
| | | | | | | | | | |
| | | | Year Ended August 31, | | | |
| Class C Shares | 2012 | | 2011 | | 2010 | | 2009 | | 2008 | |
| Per Share Data ($): | | | | | | | | | | |
| Net asset value, beginning of period | 26.48 | | 23.25 | | 19.71 | | 22.69 | | 25.24 | |
| Investment Operations: | | | | | | | | | | |
| Investment (loss)—neta | (.43 | ) | (.47 | ) | (.45 | ) | (.29 | ) | (.34 | ) |
| Net realized and unrealized | | | | | | | | | | |
| gain (loss) on investments | 4.49 | | 3.70 | | 3.99 | | (2.69 | ) | (2.21 | ) |
| Total from Investment Operations | 4.06 | | 3.23 | | 3.54 | | (2.98 | ) | (2.55 | ) |
| Net asset value, end of period | 30.54 | | 26.48 | | 23.25 | | 19.71 | | 22.69 | |
| Total Return (%)b | 15.33 | | 13.89 | | 17.96 | | (13.13 | ) | (10.10 | ) |
| Ratios/Supplemental Data (%): | | | | | | | | | | |
| Ratio of total expenses | | | | | | | | | | |
| to average net assets | 2.27 | | 2.21 | | 2.44 | | 2.76 | | 2.37 | |
| Ratio of net expenses | | | | | | | | | | |
| to average net assets | 2.27 | | 2.21 | | 2.43 | | 2.73 | | 2.28 | |
| Ratio of net investment (loss) | | | | | | | | | | |
| to average net assets | (1.49 | ) | (1.63 | ) | (2.03 | ) | (1.78 | ) | (1.43 | ) |
| Portfolio Turnover Rate | 69.20 | | 90.28 | | 110.92 | | 122.48 | | 126.37 | |
| Net Assets, end of period ($ x 1,000) | 27,428 | | 27,954 | | 23,274 | | 21,655 | | 29,434 | |
a Based on average shares outstanding at each month end.
b Exclusive of sales charge.
See notes to financial statements.
The Fund 17
FINANCIAL HIGHLIGHTS (continued)
| | | | | | | | | | |
| | | | Year Ended August 31, | | | |
| Class I Shares | 2012 | | 2011 | | 2010 | | 2009 | | 2008 | |
| Per Share Data ($): | | | | | | | | | | |
| Net asset value, beginning of period | 31.06 | | 26.94 | | 22.55 | | 25.54 | | 28.08 | |
| Investment Operations: | | | | | | | | | | |
| Investment (loss)—neta | (.11 | ) | (.14 | ) | (.20 | ) | (.07 | ) | (.06 | ) |
| Net realized and unrealized | | | | | | | | | | |
| gain (loss) on investments | 5.30 | | 4.26 | | 4.59 | | (2.92 | ) | (2.48 | ) |
| Total from Investment Operations | 5.19 | | 4.12 | | 4.39 | | (2.99 | ) | (2.54 | ) |
| Net asset value, end of period | 36.25 | | 31.06 | | 26.94 | | 22.55 | | 25.54 | |
| Total Return (%) | 16.71 | | 15.30 | | 19.47 | | (11.71 | ) | (9.04 | ) |
| Ratios/Supplemental Data (%): | | | | | | | | | | |
| Ratio of total expenses | | | | | | | | | | |
| to average net assets | 1.08 | | 1.01 | | 1.19 | | 1.28 | | 1.24 | |
| Ratio of net expenses | | | | | | | | | | |
| to average net assets | 1.08 | | 1.01 | | 1.19 | | 1.24 | | 1.16 | |
| Ratio of net investment (loss) | | | | | | | | | | |
| to average net assets | (.32 | ) | (.42 | ) | (.76 | ) | (.39 | ) | (.22 | ) |
| Portfolio Turnover Rate | 69.20 | | 90.28 | | 110.92 | | 122.48 | | 126.37 | |
| Net Assets, end of period ($ x 1,000) | 13,483 | | 14,932 | | 3,782 | | 2,350 | | 21,889 | |
| |
| a Based on average shares outstanding at each month end. | | | | | | | | | |
| See notes to financial statements. | | | | | | | | | | |
18
NOTES TO FINANCIAL STATEMENTS
NOTE 1—Significant Accounting Policies:
Dreyfus Technology Growth Fund (the “fund”) is a separate diversified series of Advantage Funds, Inc. (the “Company”), which is registered under the Investment Company Act of 1940, as amended (the “Act”), as an open-end management investment company and operates as a series company that offers thirteen series, including the fund.The fund’s investment objective is to seek capital appreciation. The Dreyfus Corporation (the “Manager” or “Dreyfus”), a wholly-owned subsidiary of The Bank of New York Mellon Corporation (“BNY Mellon”), serves as the fund’s investment adviser.
MBSC Securities Corporation (the “Distributor”), a wholly-owned subsidiary of the Manager, is the distributor of the fund’s shares. The fund is authorized to issue 500 million shares of $.001 par value Common Stock.The fund currently offers three classes of shares: Class A (300 million shares authorized), Class C (100 million shares authorized) and Class I (100 million shares authorized). Class A shares are subject to a sales charge imposed at the time of purchase. Class C shares are subject to a contingent deferred sales charge (“CDSC”) imposed on Class C shares redeemed within one year of purchase. Class I shares are sold at net asset value per share only to institutional investors. The Company’s Board of Directors approved, effective as of the close of business on March 13, 2012, the transfer of shares authorized from Class B to Class A shares. Class B shares were subject to a CDSC imposed on Class B share redemptions made within six years of purchase and automatically converted to Class A shares after six years.The fund no longer offers Class B shares. Effective March 13, 2012, all outstanding Class B shares were automatically converted to Class A shares. Other differences between the classes include the services offered to and the expenses borne by each class, the allocation of certain transfer agency costs and certain voting rights. Income, expenses (other than expenses attributable
The Fund 19
NOTES TO FINANCIAL STATEMENTS (continued)
to a specific class), and realized and unrealized gains or losses on investments are allocated to each class of shares based on its relative net assets.
The Company accounts separately for the assets, liabilities and operations of each series. Expenses directly attributable to each series are charged to that series’ operations; expenses which are applicable to all series are allocated among them on a pro rata basis.
The Financial Accounting Standards Board (“FASB”) Accounting Standards Codification is the exclusive reference of authoritative U.S. generally accepted accounting principles (“GAAP”) recognized by the FASB to be applied by nongovernmental entities. Rules and interpretive releases of the Securities and Exchange Commission (“SEC”) under authority of federal laws are also sources of authoritative GAAP for SEC registrants. The fund’s financial statements are prepared in accordance with GAAP, which may require the use of management estimates and assumptions.Actual results could differ from those estimates.
The Company enters into contracts that contain a variety of indemnifications.The fund’s maximum exposure under these arrangements is unknown.The fund does not anticipate recognizing any loss related to these arrangements.
(a) Portfolio valuation: The fair value of a financial instrument is the amount that would be received to sell an asset or paid to transfer a liability in an orderly transaction between market participants at the measurement date (i.e., the exit price). GAAP establishes a fair value hierarchy that prioritizes the inputs of valuation techniques used to measure fair value.This hierarchy gives the highest priority to unadjusted quoted prices in active markets for identical assets or liabilities (Level 1 measurements) and the lowest priority to unobservable inputs (Level 3 measurements).
Additionally, GAAP provides guidance on determining whether the volume and activity in a market has decreased significantly and whether such a decrease in activity results in transactions that are not orderly. GAAP requires enhanced disclosures around valuation inputs and techniques used during annual and interim periods.
20
Various inputs are used in determining the value of the fund’s investments relating to fair value measurements.These inputs are summarized in the three broad levels listed below:
Level 1—unadjusted quoted prices in active markets for identical investments.
Level 2—other significant observable inputs (including quoted prices for similar investments, interest rates, prepayment speeds, credit risk, etc.).
Level 3—significant unobservable inputs (including the fund’s own assumptions in determining the fair value of investments).
The inputs or methodology used for valuing securities are not necessarily an indication of the risk associated with investing in those securities.
Changes in valuation techniques may result in transfers in or out of an assigned level within the disclosure hierarchy. Valuation techniques used to value the fund’s investments are as follows:
Investments in securities are valued at the last sales price on the securities exchange or national securities market on which such securities are primarily traded. Securities listed on the National Market System for which market quotations are available are valued at the official closing price or, if there is no official closing price that day, at the last sales price. Securities not listed on an exchange or the national securities market, or securities for which there were no transactions, are valued at the average of the most recent bid and asked prices, except for open short positions, where the asked price is used for valuation purposes. Bid price is used when no asked price is available. Registered investment companies that are not traded on an exchange are valued at their net asset value.All of the preceding securities are categorized within Level 1 of the fair value hierarchy.
Fair valuing of securities may be determined with the assistance of a pricing service using calculations based on indices of domestic securities and other appropriate indicators, such as prices of relevant ADRs and financial futures. Utilizing these techniques may result in transfers between Level 1 and Level 2 of the fair value hierarchy.
The Fund 21
NOTES TO FINANCIAL STATEMENTS (continued)
When market quotations or official closing prices are not readily available, or are determined not to reflect accurately fair value, such as when the value of a security has been significantly affected by events after the close of the exchange or market on which the security is principally traded (for example, a foreign exchange or market), but before the fund calculates its net asset value, the fund may value these investments at fair value as determined in accordance with the procedures approved by the Company’s Board of Directors. Certain factors may be considered when fair valuing investments such as: fundamental analytical data, the nature and duration of restrictions on disposition, an evaluation of the forces that influence the market in which the securities are purchased and sold, and public trading in similar securities of the issuer or comparable issuers.These securities are either categorized as Level 2 or 3 depending on the relevant inputs used.
The fair value of the fund’s interest in a limited partnership represents the amount that the fund could reasonably expect to receive from the limited partnership if the fund’s capital was withdrawn from the limited partnership at the time of valuation, based on information available at the time the valuation is made and that the fund believes to be reliable. The valuation utilizes financial information supplied by the limited partnership with adjustments made daily for any underlying exchange traded securities. Limited partnerships are categorized within Level 3 of the fair value hierarchy.
For restricted securities where observable inputs are limited, assumptions about market activity and risk are used and are categorized within Level 3 of the fair value hierarchy.
The following is a summary of the inputs used as of August 31, 2012 in valuing the fund’s investments:
| | | | |
| | | Level 2—Other | Level 3— | |
| | Level 1— | Significant | Significant | |
| | Unadjusted | Observable | Unobservable | |
| | Quoted Prices | Inputs | Inputs | Total |
| Assets ($) | | | | |
| Investments in Securities: | | | |
| Equity Securities— | | | | |
| Domestic† | 264,124,610 | — | — | 264,124,610 |
22
| | | | |
| | | Level 2—Other | Level 3— | |
| | Level 1— | Significant | Significant | |
| | Unadjusted | Observable | Unobservable | |
| | Quoted Prices | Inputs | Inputs | Total |
| Assets ($) (continued) | | | | |
| Equity Securities— | | | | |
| Foreign† | 8,180,550 | — | — | 8,180,550 |
| Limited Partnership | | | | |
| Interests† | — | — | 744,551 | 744,551 |
| Mutual Funds | 9,419,318 | — | — | 9,419,318 |
| |
| † See Statement of Investments for additional detailed categorizations. | |
At August 31, 2012, there were no transfers between Level 1 and Level 2 of the fair value hierarchy.
The following is a reconciliation of Level 3 assets for which significant unobservable inputs were used to determine fair value:
| | |
| | Limited Partnership | |
| | Interests ($) | |
| Balance as of 8/31/2011 | 1,377,689 | |
| Realized gain (loss) | — | |
| Change in unrealized appreciation (depreciation) | (342,272 | ) |
| Purchases | — | |
| Sales | — | |
| Distributions | (290,866 | ) |
| Transfers into Level 3 | — | |
| Transfers out of Level 3 | — | |
| Balance as of 8/31/2012 | 744,551 | |
| The amount of total gains (losses) for the period | | |
| included in earnings attributable to the change in | | |
| unrealized gains (losses) relating to investments | | |
| still held at 8/31/2012 | (342,272 | ) |
(b) Securities transactions and investment income: Securities transactions are recorded on a trade date basis. Realized gains and losses from securities transactions are recorded on the identified cost basis. Dividend income is recognized on the ex-dividend date and interest income, including, where applicable, accretion of discount and amortization of premium on investments, is recognized on the accrual basis.
The Fund 23
NOTES TO FINANCIAL STATEMENTS (continued)
Pursuant to a securities lending agreement with The Bank of New York Mellon, a subsidiary of BNY Mellon and an affiliate of Dreyfus, the fund may lend securities to qualified institutions. It is the fund’s policy that, at origination, all loans are secured by collateral of at least 102% of the value of U.S. securities loaned and 105% of the value of foreign securities loaned. Collateral equivalent to at least 100% of the market value of securities on loan is maintained at all times. Collateral is either in the form of cash, which can be invested in certain money market mutual funds managed by the Manager, U.S. Government and Agency securities or letters of credit.The fund is entitled to receive all income on securities loaned, in addition to income earned as a result of the lending transaction. Although each security loaned is fully collateralized, the fund bears the risk of delay in recovery of, or loss of rights in, the securities loaned should a borrower fail to return the securities in a timely manner. During the period ended August 31, 2012, The Bank of New York Mellon earned $9,950 from lending portfolio securities, pursuant to the securities lending agreement.
(c) Affiliated issuers: Investments in other investment companies advised by Dreyfus are defined as “affiliated” in the Act. Investments in affiliated investment companies for the period ended August 31, 2012 were as follows:
| | | | | | | |
| Affiliated | | | | | | | |
| Investment | Value | | | | Value | | Net |
| Company | 8/31/2011 | ($) | Purchases ($) | Sales ($) | 8/31/2012 | ($) | Assets (%) |
| Dreyfus | | | | | | | |
| Institutional | | | | | | | |
| Preferred | | | | | | | |
| Plus Money | | | | | | | |
| Market | | | | | | | |
| Fund | 9,636,000 | | 98,095,439 | 104,840,162 | 2,891,277 | | 1.0 |
| Dreyfus | | | | | | | |
| Institutional | | | | | | | |
| Cash | | | | | | | |
| Advantage | | | | | | | |
| Fund | 21,812,769 | | 148,881,304 | 164,166,032 | 6,528,041 | | 2.4 |
| Total | 31,448,769 | | 246,976,743 | 269,006,194 | 9,419,318 | | 3.4 |
(d) Dividends to shareholders: Dividends are recorded on the ex-dividend date. Dividends from investment income-net and dividends
24
from net realized capital gains, if any, are normally declared and paid annually, but the fund may make distributions on a more frequent basis to comply with the distribution requirements of the Internal Revenue Code of 1986, as amended (the “Code”).To the extent that net realized capital gains can be offset by capital loss carryovers, it is the policy of the fund not to distribute such gains. Income and capital gain distributions are determined in accordance with income tax regulations, which may differ from GAAP.
(e) Federal income taxes: It is the policy of the fund to continue to qualify as a regulated investment company, if such qualification is in the best interests of its shareholders, by complying with the applicable provisions of the Code, and to make distributions of taxable income sufficient to relieve it from substantially all federal income and excise taxes.
As of and during the period ended August 31, 2012, the fund did not have any liabilities for any uncertain tax positions.The fund recognizes interest and penalties, if any, related to uncertain tax positions as income tax expense in the Statement of Operations. During the period, the fund did not incur any interest or penalties.
Each of the tax years in the four-year period ended August 31, 2012 remains subject to examination by the Internal Revenue Service and state taxing authorities.
At August 31, 2012, the components of accumulated earnings on a tax basis were as follows: accumulated capital losses $15,876,628 and unrealized appreciation $53,552,037. In addition, the fund had $8,416,151 of capital losses realized after October 31, 2011, which were deferred for tax purposes to the first day of the following fiscal year.
Under the Regulated Investment Company Modernization Act of 2010 (the “2010 Act”), the fund is permitted to carry forward capital losses incurred in taxable years beginning after December 22, 2010 (“post-enactment losses”) for an unlimited period. Furthermore, post-enactment capital loss carryovers retain their character as either short-term or long-
The Fund 25
NOTES TO FINANCIAL STATEMENTS (continued)
term capital losses rather than short-term as they were under previous statute.The 2010 Act requires post-enactment losses to be utilized before the utilization of losses incurred in taxable years prior to the effective date of the 2010 Act (“pre-enactment losses”).As a result of this ordering rule, pre-enactment losses may be more likely to expire unused.
The accumulated capital loss carryover is available for federal income tax purposes to be applied against future net realized capital gains, if any, realized subsequent to August 31, 2012. If not applied, $15,159,711 of the carryover expires in fiscal year 2017 and $716,917 expires in fiscal year 2018.
During the period ended August 31, 2012, as a result of permanent book to tax differences, primarily due to the tax treatment for net operating losses, limited partnerships and a capital loss carryover expiration, the fund increased accumulated undistributed investment income-net by $2,029,140, increased accumulated net realized gain (loss) on investments by $57,983,854 and decreased paid-in capital by $60,012,994. Net assets and net asset value per share were not affected by this reclassification.
NOTE 2—Bank Lines of Credit:
The fund participates with other Dreyfus-managed funds in a $225 million unsecured credit facility led by Citibank, N.A. and a $300 million unsecured credit facility provided by The Bank of New York Mellon (each, a “Facility”), each to be utilized primarily for temporary or emergency purposes, including the financing of redemptions. In connection therewith, the fund has agreed to pay its pro rata portion of commitment fees for each Facility. Interest is charged to the fund based on rates determined pursuant to the terms of the respective Facility at the time of borrowing. During the period ended August 31, 2012, the fund did not borrow under the Facilities.
NOTE 3—Management Fee and Other Transactions with Affiliates:
(a) Pursuant to a management agreement with the Manager, the management fee is computed at the annual rate of .75% of the value of the fund’s average daily net assets and is payable monthly.
26
During the period ended August 31, 2012, the Distributor retained $8,487 from commissions earned on sales of the fund’s Class A shares and $511 and $813 from CDSCs on redemptions of the fund’s Class B and Class C shares, respectively.
(b) Under the Distribution Plan adopted pursuant to Rule 12b-1 under the Act, Class B shares paid and Class C shares pay the Distributor for distributing their shares at an annual rate of .75% of the value of the average daily net assets of Class B and Class C shares. During the period ended August 31, 2012, Class B and Class C shares were charged $3,089 and $212,023, respectively, pursuant to the Distribution Plan.
(c) Under the Shareholder Services Plan, Class A and Class C shares pay and Class B shares paid the Distributor at an annual rate of .25% of the value of their average daily net assets for the provision of certain services. The services provided may include personal services relating to shareholder accounts, such as answering shareholder inquiries regarding the fund and providing reports and other information, and services related to the maintenance of shareholder accounts. The Distributor may make payments to Service Agents (securities dealers, financial institutions or industry professionals) in respect of these services. The Distributor determines the amounts to be paid to Service Agents. During the period ended August 31, 2012, Class A, Class B and Class C shares were charged $574,845, $1,030 and $70,674, respectively, pursuant to the Shareholder Services Plan.
The fund has arrangements with the transfer agent and the custodian whereby the fund may receive earnings credits when positive cash balances are maintained, which are used to offset transfer agency and custody fees. For financial reporting purposes, the fund includes net earnings credits as an expense offset in the Statement of Operations.
The fund compensates Dreyfus Transfer, Inc. (“DTI”), a wholly-owned subsidiary of the Manager, under a transfer agency agreement for providing transfer agency services for the fund and, since May 29, 2012, cash management services related to fund subscriptions and redemptions. During the period ended August 31, 2012, the fund was charged $261,740 for transfer agency services and $3,658 for cash management
The Fund 27
NOTES TO FINANCIAL STATEMENTS (continued)
services. Cash management fees were partially offset by earnings credits of $431.These fees are included in Shareholder servicing costs in the Statement of Operations.
The fund compensates The Bank of New York Mellon under a custody agreement for providing custodial services for the fund. During the period ended August 31, 2012, the fund was charged $21,326 pursuant to the custody agreement.
Prior to May 29, 2012, the fund compensated The Bank of New York Mellon under a cash management agreement for performing cash management services related to fund subscriptions and redemptions. During the period ended August 31, 2012, the fund was charged $29,278 pursuant to the cash management agreement, which is included in Shareholder servicing costs in the Statement of Operations.These fees were partially offset by earnings credits of $810.
During the period ended August 31, 2012, the fund was charged $6,392 for services performed by the Chief Compliance Officer and his staff.
The components of “Due to The Dreyfus Corporation and affiliates” in the Statement of Assets and Liabilities consist of: management fees $174,993, Distribution Plan fees $17,397, Shareholder Services Plan fees $55,534, custodian fees $8,000, Chief Compliance Officer fees $4,243 and transfer agency per account fees $66,615.
(d) Each Board member also serves as a Board member of other funds within the Dreyfus complex. Annual retainer fees and attendance fees are allocated to each fund based on net assets.
28
NOTE 4—Securities Transactions:
The aggregate amount of purchases and sales of investment securities, excluding short-term securities, during the period ended August 31, 2012 amounted to $183,569,429 and $209,043,529, respectively.
At August 31, 2012, the cost of investments for federal income tax purposes was $228,916,992; accordingly, accumulated net unrealized appreciation on investments was $53,552,037, consisting of $59,131,446 gross unrealized appreciation and $5,579,409 gross unrealized depreciation.
The Fund 29
REPORT OF INDEPENDENT REGISTERED
PUBLIC ACCOUNTING FIRM
Shareholders and Board of Directors
Dreyfus Technology Growth Fund
We have audited the accompanying statement of assets and liabilities, including the statement of investments, of DreyfusTechnology Growth Fund (one of the series comprising Advantage Funds, Inc.) as of August 31, 2012, and the related statement of operations for the year then ended, the statement of changes in net assets for each of the two years in the period then ended, and the financial highlights for each of the five years in the period then ended.These financial statements and financial highlights are the responsibility of the Fund’s management. Our responsibility is to express an opinion on these financial statements and financial highlights based on our audits.
We conducted our audits in accordance with the standards of the Public Company Accounting Oversight Board (United States).Those standards require that we plan and perform the audit to obtain reasonable assurance about whether the financial statements and financial highlights are free of material misstatement.We were not engaged to perform an audit of the Fund’s internal control over financial reporting. Our audits included consideration of internal control over financial reporting as a basis for designing audit procedures that are appropriate in the circumstances, but not for the purpose of expressing an opinion on the effectiveness of the Fund’s internal control over financial reporting. Accordingly, we express no such opinion. An audit also includes examining, on a test basis, evidence supporting the amounts and disclosures in the financial statements and financial highlights, assessing the accounting principles used and significant estimates made by management, and evaluating the overall financial statement presentation. Our procedures included confirmation of securities owned as of August 31, 2012 by correspondence with the custodian and others.We believe that our audits provide a reasonable basis for our opinion.
In our opinion, the financial statements and financial highlights referred to above present fairly, in all material respects, the financial position of Dreyfus Technology Growth Fund at August 31, 2012, the results of its operations for the year then ended, the changes in its net assets for each of the two years in the period then ended, and the financial highlights for each of the five years in the period then ended, in conformity with U.S. generally accepted accounting principles.

New York, New York
October 29, 2012
30
PROXY RESULTS (Unaudited)
The Company held a special meeting of shareholders on August 3, 2012.The proposal considered at the meeting, and the results, are as follows:
| | | |
| | | Shares | |
| | Votes For | | Authority Withheld |
| To elect additional Board Members: | | | |
| Lynn Martin† | 90,334,756 | | 3,252,629 |
| Robin A. Melvin† | 90,449,622 | | 3,137,763 |
| Philip L. Toia† | 90,229,928 | | 3,357,457 |
† Each new Board Member’s term commenced on September 1, 2012.
In addition Peggy C. Davis, Joseph S. DiMartino, David P. Feldman, Ehud Houminer and Dr. Martin Peretz continue
as Board Members of the Company.
The Fund 31
INFORMATION ABOUT THE RENEWAL OF THE
FUND’S MANAGEMENT AGREEMENT (Unaudited)
At a meeting of the fund’s Board of Directors held on March 6, 2012, the Board considered the renewal of the fund’s Management Agreement pursuant to which Dreyfus provides the fund with investment advisory and administrative services (the “Agreement”). The Board members, none of whom are “interested persons” (as defined in the Investment Company Act of 1940, as amended) of the fund, were assisted in their review by independent legal counsel and met with counsel in executive session separate from Dreyfus representatives. In considering the renewal of the Agreement, the Board considered all factors that it believed to be relevant, including those discussed below.The Board did not identify any one factor as dispositive, and each Board member may have attributed different weights to the factors considered.
Analysis of Nature, Extent, and Quality of Services Provided to the Fund.The Board considered information previously provided to them in presentations from Dreyfus representatives regarding the nature, extent, and quality of the services provided to funds in the Dreyfus fund complex, and Dreyfus representatives confirmed that there had been no material changes in this information. Dreyfus provided the number of open accounts in the fund, the fund’s asset size and the allocation of fund assets among distribution channels. Dreyfus also had previously provided information regarding the diverse intermediary relationships and distribution channels of funds in the Dreyfus fund complex and Dreyfus’ corresponding need for broad, deep, and diverse resources to be able to provide ongoing shareholder services to each distribution channel, including the distribution channel(s) for the fund.
The Board also considered research support available to, and portfolio management capabilities of, the fund’s portfolio management personnel and that Dreyfus also provides oversight of day-to-day fund operations, including fund accounting and administration and assistance in meeting legal and regulatory requirements.The Board also considered Dreyfus’ extensive administrative, accounting, and compliance infrastructures.The Board also considered portfolio management’s brokerage policies and practices (including policies and practices regarding soft dollars) and the standards applied in seeking best execution.
32
Comparative Analysis of the Fund’s Performance and Management Fee and Expense Ratio.The Board reviewed reports prepared by Lipper, Inc. (“Lipper”), an independent provider of investment company data, which included information comparing (1) the fund’s performance with the performance of a group of comparable funds (the “Performance Group”) and with a broader group of funds (the “Performance Universe”), all for various periods ended December 31, 2011, and (2) the fund’s actual and contractual management fees and total expenses with those of a group of comparable funds (the “Expense Group”) and with a broader group of funds (the “Expense Universe”), the information for which was derived in part from fund financial statements available to Lipper as of the date of its analysis. Dreyfus previously had furnished the Board with a description of the methodology Lipper used to select the Performance Group and Performance Universe and the Expense Group and Expense Universe.
Dreyfus representatives stated that the usefulness of performance comparisons may be affected by a number of factors, including different investment limitations that may be applicable to the fund and comparison funds.The Board discussed the results of the comparisons and noted that the fund’s total return performance was variously above and below the Performance Group and Performance Universe medians for the various periods, being above the Performance Group and Performance Universe medians in the majority of the periods. Dreyfus also provided a comparison of the fund’s calendar year total returns to the returns of the fund’s benchmark index.
The Board also reviewed the range of actual and contractual management fees and total expenses of the Expense Group and Expense Universe funds and discussed the results of the comparisons.The Board noted that the fund’s contractual management fee was below the Expense Group median, and the fund’s actual management fee and total expenses were below the Expense Group and Expense Universe medians.
The Fund 33
INFORMATION ABOUT THE RENEWAL OF THE FUND’S
MANAGEMENT AGREEMENT (Unaudited) (continued)
Dreyfus representatives reviewed with the Board the management or investment advisory fees (1) paid by funds advised or administered by Dreyfus that are in the same Lipper category as the fund and (2) paid to Dreyfus or the Dreyfus-affiliated primary employer of the fund’s primary portfolio manager(s) for advising any separate accounts and/or other types of client portfolios that are considered to have similar investment strategies and policies as the fund (the “Similar Clients”), and explained the nature of the Similar Clients.They discussed differences in fees paid and the relationship of the fees paid in light of any differences in the services provided and other relevant factors. The Board considered the relevance of the fee information provided for the Similar Clients to evaluate the appropriateness and reasonableness of the fund’s management fee.
Analysis of Profitability and Economies of Scale. Dreyfus representatives reviewed the expenses allocated and profit received by Dreyfus and the resulting profitability percentage for managing the fund, and the method used to determine the expenses and profit. The Board concluded that the profitability results were not unreasonable, given the services rendered and service levels provided by Dreyfus. The Board previously had been provided with information prepared by an independent consulting firm regarding Dreyfus’ approach to allocating costs to, and determining the profitability of, individual funds and the entire Dreyfus fund complex. The consulting firm also had analyzed where any economies of scale might emerge in connection with the management of a fund.
The Board’s counsel stated that the Board should consider the profitability analysis (1) as part of their evaluation of whether the fees under the Agreement bear a reasonable relationship to the mix of services provided by Dreyfus, including the nature, extent and quality of such services, and (2) in light of the relevant circumstances for the fund and the extent to which economies of scale would be realized if the fund grows and whether fee levels reflect these economies of scale
34
for the benefit of fund shareholders. Dreyfus representatives noted that a discussion of economies of scale is predicated on a fund having achieved a substantial size with increasing assets and that, if a fund’s assets had been stable or decreasing, the possibility that Dreyfus may have realized any economies of scale would be less. Dreyfus representatives also noted that, as a result of shared and allocated costs among funds in the Dreyfus fund complex, the extent of economies of scale could depend substantially on the level of assets in the complex as a whole, so that increases and decreases in complex-wide assets can affect potential economies of scale in a manner that is disproportionate to, or even in the opposite direction from, changes in the fund’s asset level. The Board also considered potential benefits to Dreyfus from acting as investment adviser and noted the soft dollar arrangements in effect for trading the fund’s investments.
At the conclusion of these discussions, the Board agreed that it had been furnished with sufficient information to make an informed business decision with respect to the renewal of the Agreement. Based on the discussions and considerations as described above, the Board concluded and determined as follows.
The Board concluded that the nature, extent and quality of the services provided by Dreyfus are adequate and appropriate.
The Board generally was satisfied with the fund’s performance.
The Board concluded that the fee paid to Dreyfus was reasonable in light of the considerations described above.
The Board determined that the economies of scale which may accrue to Dreyfus and its affiliates in connection with the management of the fund had been adequately considered by Dreyfus in connection with the fee rate charged to the fund pursuant to the Agreement and that, to the extent in the future it were determined that material economies of scale had not been shared with the fund, the Board would seek to have those economies of scale shared with the fund.
The Fund 35
INFORMATION ABOUT THE RENEWAL OF THE FUND’S
MANAGEMENT AGREEMENT (Unaudited) (continued)
The Board considered these conclusions and determinations, along with information received on a routine and regular basis throughout the year. In addition, it should be noted that the Board’s consideration of the contractual fee arrangements for this fund had the benefit of a number of years of reviews of prior or similar agreements during which lengthy discussions took place between the Board and Dreyfus representatives. Certain aspects of the arrangements may receive greater scrutiny in some years than in others, and the Board’s conclusions may be based, in part, on their consideration of the same or similar arrangements in prior years.The Board determined that renewal of the Agreement was in the best interests of the fund and its shareholders.
36
BOARD MEMBERS INFORMATION (Unaudited)
The Fund 37
BOARD MEMBERS INFORMATION (Unaudited) (continued)
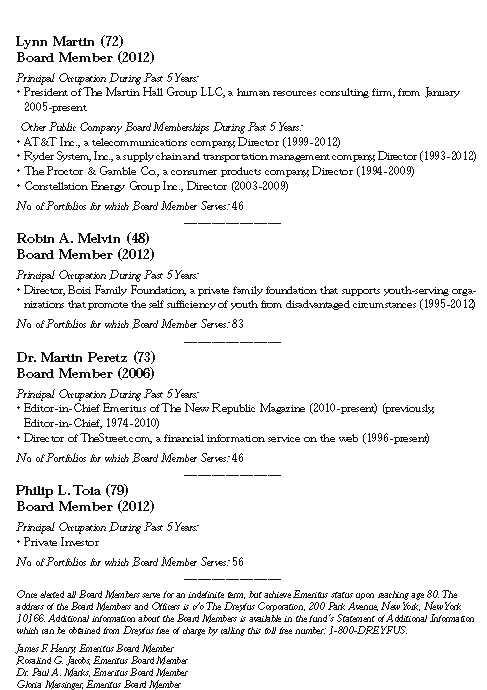
38
OFFICERS OF THE FUND (Unaudited)
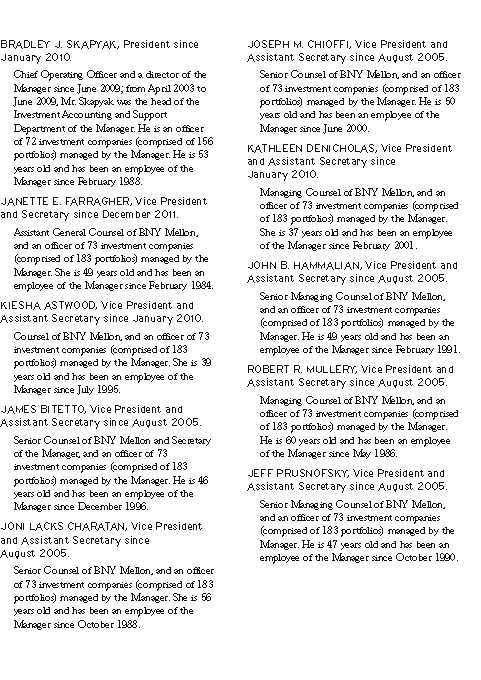
The Fund 39
OFFICERS OF THE FUND (Unaudited) (continued)
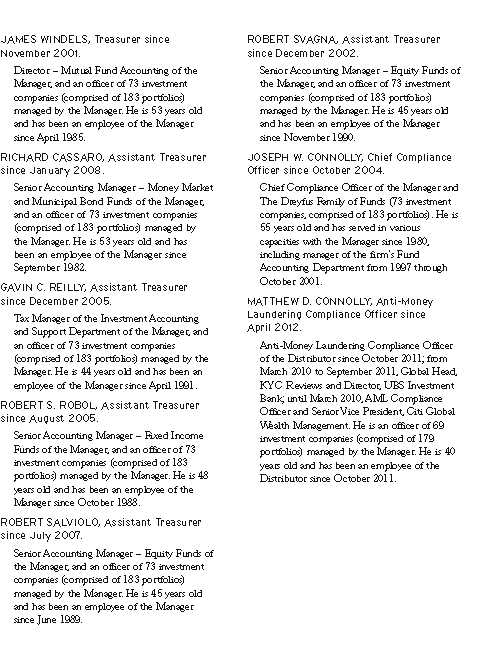
40
For More Information

Telephone Call your financial representative or 1-800-DREYFUS
Mail The Dreyfus Family of Funds, 144 Glenn Curtiss Boulevard, Uniondale, NY 11556-0144
The fund files its complete schedule of portfolio holdings with the Securities and Exchange Commission (“SEC”) for the first and third quarters of each fiscal year on Form N-Q. The fund’s Forms N-Q are available on the SEC’s website at http://www.sec.gov and may be reviewed and copied at the SEC’s Public Reference Room in Washington, DC. Information on the operation of the Public Reference Room may be obtained by calling 1-800-SEC-0330.
A description of the policies and procedures that the fund uses to determine how to vote proxies relating to portfolio securities, and information regarding how the fund voted these proxies for the most recent 12-month period ended June 30 is available at http://www.dreyfus.com and on the SEC’s website at http://www.sec.gov. The description of the policies and procedures is also available without charge, upon request, by calling 1-800-DREYFUS.

|
| © 2012 MBSC Securities Corporation |
Item 2. Code of Ethics.
The Registrant has adopted a code of ethics that applies to the Registrant's principal executive officer, principal financial officer, principal accounting officer or controller, or persons performing similar functions. There have been no amendments to, or waivers in connection with, the Code of Ethics during the period covered by this Report.
Item 3. Audit Committee Financial Expert.
The Registrant's Board has determined that David P. Feldman, a member of the Audit Committee of the Board, is an audit committee financial expert as defined by the Securities and Exchange Commission (the "SEC"). David P. Feldman is "independent" as defined by the SEC for purposes of audit committee financial expert determinations.
Item 4. Principal Accountant Fees and Services.
(a) Audit Fees. The aggregate fees billed for each of the last two fiscal years (the "Reporting Periods") for professional services rendered by the Registrant's principal accountant (the "Auditor") for the audit of the Registrant's annual financial statements or services that are normally provided by the Auditor in connection with the statutory and regulatory filings or engagements for the Reporting Periods, were $222,792 in 2011 and $226,766 in 2012.
(b) Audit-Related Fees. The aggregate fees billed in the Reporting Periods for assurance and related services by the Auditor that are reasonably related to the performance of the audit of the Registrant's financial statements and are not reported under paragraph (a) of this Item 4 were $48,000 in 2011 and $36,000 in 2012. These services consisted of one or more of the following: (i) agreed upon procedures related to compliance with Internal Revenue Code section 817(h), (ii) security counts required by Rule 17f-2 under the Investment Company Act of 1940, as amended, (iii) advisory services as to the accounting or disclosure treatment of Registrant transactions or events and (iv) advisory services to the accounting or disclosure treatment of the actual or potential impact to the Registrant of final or proposed rules, standards or interpretations by the Securities and Exchange Commission, the Financial Accounting Standards Boards or other regulatory or standard-setting bodies.
The aggregate fees billed in the Reporting Periods for non-audit assurance and related services by the Auditor to the Registrant's investment adviser (not including any sub-investment adviser whose role is primarily portfolio management and is subcontracted with or overseen by another investment adviser), and any entity controlling, controlled by or under common control with the investment adviser that provides ongoing services to the Registrant ("Service Affiliates"), that were reasonably related to the performance of the annual audit of the Service Affiliate, which required pre-approval by the Audit Committee were $-0- in 2011 and $-0- in 2012.
(c) Tax Fees. The aggregate fees billed in the Reporting Periods for professional services rendered by the Auditor for tax compliance, tax advice, and tax planning ("Tax Services") were $24,023 in 2011 and $31,905 in 2012. These services consisted of: (i) review or preparation of U.S. federal, state, local and excise tax returns; (ii) U.S. federal, state and local tax planning, advice and assistance regarding statutory, regulatory or administrative developments; (iii) tax advice regarding tax qualification matters and/or treatment of various financial instruments held or proposed to be acquired or held, and (iv) determination of Passive Foreign Investment Companies. The aggregate fees billed in the Reporting Periods for Tax Services by the Auditor to Service Affiliates, which required pre-approval by the Audit Committee were $-0- in 2011 and $-0- in 2012.
-3-
SSL-DOCS2 70128344v15
(d) All Other Fees. The aggregate fees billed in the Reporting Periods for products and services provided by the Auditor, other than the services reported in paragraphs (a) through (c) of this Item, were $1,424 in 2011 and $6,662 in 2012. These services consisted of a review of the Registrant's anti-money laundering program.
The aggregate fees billed in the Reporting Periods for Non-Audit Services by the Auditor to Service Affiliates, other than the services reported in paragraphs (b) through (c) of this Item, which required pre-approval by the Audit Committee, were $-0- in 2011 and $200,000 in 2012.
(e)(1) Audit Committee Pre-Approval Policies and Procedures. The Registrant's Audit Committee has established policies and procedures (the "Policy") for pre-approval (within specified fee limits) of the Auditor's engagements for non-audit services to the Registrant and Service Affiliates without specific case-by-case consideration. The pre-approved services in the Policy can include pre-approved audit services, pre-approved audit-related services, pre-approved tax services and pre-approved all other services. Pre-approval considerations include whether the proposed services are compatible with maintaining the Auditor's independence. Pre-approvals pursuant to the Policy are considered annually.
(e)(2) Note: None of the services described in paragraphs (b) through (d) of this Item 4 were approved by the Audit Committee pursuant to paragraph (c)(7)(i)(C) of Rule 2-01 of Regulation S-X.
(f) None of the hours expended on the principal accountant's engagement to audit the registrant's financial statements for the most recent fiscal year were attributed to work performed by persons other than the principal account's full-time, permanent employees.
Non-Audit Fees. The aggregate non-audit fees billed by the Auditor for services rendered to the Registrant, and rendered to Service Affiliates, for the Reporting Periods were $16,103,335 in 2011 and $41,730,768 in 2012.
Auditor Independence. The Registrant's Audit Committee has considered whether the provision of non-audit services that were rendered to Service Affiliates, which were not pre-approved (not requiring pre-approval), is compatible with maintaining the Auditor's independence.
Item 5. Audit Committee of Listed Registrants.
Not applicable. [CLOSED-END FUNDS ONLY]
Item 6. Investments.
(a) Not applicable.
Item 7. Disclosure of Proxy Voting Policies and Procedures for Closed-End Management Investment Companies.
Not applicable. [CLOSED-END FUNDS ONLY]
Item 8. Portfolio Managers of Closed-End Management Investment Companies.
Not applicable. [CLOSED-END FUNDS ONLY, beginning with reports for periods ended on and after December 31, 2005]
Item 9. Purchases of Equity Securities by Closed-End Management Investment Companies and �� Affiliated Purchasers.
-4-
SSL-DOCS2 70128344v15
Not applicable. [CLOSED-END FUNDS ONLY]
Item 10. Submission of Matters to a Vote of Security Holders.
There have been no material changes to the procedures applicable to Item 10.
Item 11. Controls and Procedures.
(a) The Registrant's principal executive and principal financial officers have concluded, based on their evaluation of the Registrant's disclosure controls and procedures as of a date within 90 days of the filing date of this report, that the Registrant's disclosure controls and procedures are reasonably designed to ensure that information required to be disclosed by the Registrant on Form N-CSR is recorded, processed, summarized and reported within the required time periods and that information required to be disclosed by the Registrant in the reports that it files or submits on Form N-CSR is accumulated and communicated to the Registrant's management, including its principal executive and principal financial officers, as appropriate to allow timely decisions regarding required disclosure.
(b) There were no changes to the Registrant's internal control over financial reporting that occurred during the second fiscal quarter of the period covered by this report that have materially affected, or are reasonably likely to materially affect, the Registrant's internal control over financial reporting.
Item 12. Exhibits.
(a)(1) Code of ethics referred to in Item 2.
(a)(2) Certifications of principal executive and principal financial officers as required by Rule 30a-2(a) under the Investment Company Act of 1940.
(a)(3) Not applicable.
(b) Certification of principal executive and principal financial officers as required by Rule 30a-2(b) under the Investment Company Act of 1940.
-5-
SSL-DOCS2 70128344v15
SIGNATURES
Pursuant to the requirements of the Securities Exchange Act of 1934 and the Investment Company Act of 1940, the Registrant has duly caused this Report to be signed on its behalf by the undersigned, thereunto duly authorized.
Advantage Funds, Inc.
By: /s/ Bradley J. Skapyak |
Bradley J. Skapyak, President |
Date: | October 22, 2012 |
|
Pursuant to the requirements of the Securities Exchange Act of 1934 and the Investment Company Act of 1940, this Report has been signed below by the following persons on behalf of the Registrant and in the capacities and on the dates indicated. |
|
By: /s/ Bradley J. Skapyak |
Bradley J. Skapyak, President |
Date: | October 22, 2012 |
|
By: /s/ James Windels |
James Windels, Treasurer |
Date: | October 22, 2012 |
|
EXHIBIT INDEX
(a)(1) Code of ethics referred to in Item 2.
(a)(2) Certifications of principal executive and principal financial officers as required by Rule 30a-2(a) under the Investment Company Act of 1940. (EX-99.CERT)
(b) Certification of principal executive and principal financial officers as required by Rule 30a-2(b) under the Investment Company Act of 1940. (EX-99.906CERT)