UNITED STATES
SECURITIES AND EXCHANGE COMMISSION
Washington, D.C. 20549
FORM N-CSR
CERTIFIED SHAREHOLDER REPORT OF REGISTERED MANAGEMENT
INVESTMENT COMPANIES
Investment Company Act file number | 811-7123 |
| |
| ADVANTAGE FUNDS, INC. | |
| | |
| | |
| c/o The Dreyfus Corporation 200 Park Avenue New York, New York 10166 | |
| | |
| | |
| Michael A. Rosenberg, Esq. 200 Park Avenue New York, New York 10166 | |
| | |
|
Registrant's telephone number, including area code: | (212) 922-6000 |
| |
Date of fiscal year end: | 8/31 | |
Date of reporting period: | 8/31/11 | |
| | | | | | | |
Advantage Funds, Inc.
-Dreyfus Emerging Leaders Fund
-Dreyfus International Value Fund
-Dreyfus Opportunistic Midcap Value Fund
-Dreyfus Opportunistic Small Cap Fund
-Dreyfus Strategic Value Fund
-Dreyfus Structured Midcap Fund
-Dreyfus Technology Growth Fund
FORM N-CSR
Item 1. Reports to Stockholders.
|
| Dreyfus |
| Emerging Leaders Fund |
ANNUAL REPORT August 31, 2011

Save time. Save paper. View your next shareholder report online as soon as it’s available. Log into www.dreyfus.com and sign up for Dreyfus eCommunications. It’s simple and only takes a few minutes.
The views expressed in this report reflect those of the portfolio manager only through the end of the period covered and do not necessarily represent the views of Dreyfus or any other person in the Dreyfus organization. Any such views are subject to change at any time based upon market or other conditions and Dreyfus disclaims any responsibility to update such views.These views may not be relied on as investment advice and, because investment decisions for a Dreyfus fund are based on numerous factors, may not be relied on as an indication of trading intent on behalf of any Dreyfus fund.
Not FDIC-Insured • Not Bank-Guaranteed • May Lose Value
| | Contents |
| | THE FUND |
| 2 | A Letter from the Chairman and CEO |
| 3 | Discussion of Fund Performance |
| 6 | Fund Performance |
| 7 | Understanding Your Fund’s Expenses |
| 7 | Comparing Your Fund’s Expenses With Those of Other Funds |
| 8 | Statement of Investments |
| 12 | Statement of Assets and Liabilities |
| 13 | Statement of Operations |
| 14 | Statement of Changes in Net Assets |
| 15 | Financial Highlights |
| 16 | Notes to Financial Statements |
| 26 | Report of Independent Registered Public Accounting Firm |
| 27 | Important Tax Information |
| 28 | Information About the Renewal of the Fund’s Management Agreement |
| 33 | Board Members Information |
| 35 | Officers of the Fund |
| | FOR MORE INFORMATION |
| | Back Cover |
Dreyfus
Emerging Leaders Fund
The Fund

A LETTER FROM THE CHAIRMAN AND CEO
Dear Shareholder:
We are pleased to present this annual report for Dreyfus Emerging Leaders Fund, covering the 12-month period from September 1, 2010, through August 31, 2011. For information about how the fund performed during the reporting period, as well as general market perspectives, we provide a Discussion of Fund Performance on the pages that follow.
Although stocks rallied strongly through the first quarter of 2011 due to expectations of a more robust economic recovery, the reporting period ended amid sharply deteriorating investor sentiment due to disappointing economic data, an escalating sovereign debt crisis in Europe and a contentious debate regarding taxes, spending and borrowing in the United States. In the final month of the reporting period, a major credit rating agency downgraded U.S. long-term debt, marking the first time in history that U.S.Treasury securities were not assigned the highest possible credit rating. Stocks proved volatile in this tumultuous environment, as the stalled economy caused most market sectors to give back many of the reporting period’s previous gains.
The economic outlook currently is clouded by heightened market volatility and political infighting, but we believe that a sustained, moderate global expansion is more likely than a double-dip recession. Inflationary pressures appear to be waning in most countries, including the United States, as energy prices have retreated from their highs.The Federal Reserve Board has signaled its intention to maintain an aggressively accommodative monetary policy, which may help offset the financial stresses caused by recent fiscal policy choices in the United States and Europe. To assess how these and other developments may affect your investments, we encourage you, as always, to speak with your financial advisor.
Thank you for your continued confidence and support.

Jonathan R. Baum
Chairman and Chief Executive Officer
The Dreyfus Corporation
September 15, 2011
2

DISCUSSION OF FUND PERFORMANCE
For the period of September 1, 2010, through August 31, 2011, as provided by David A. Daglio, Primary Portfolio Manager
Fund and Market Performance Overview
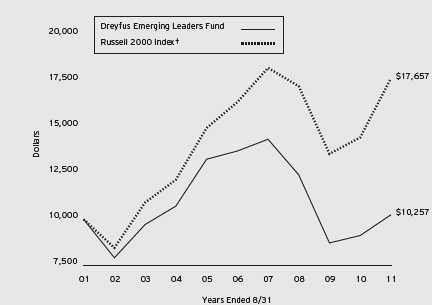
For the 12-month period ended August 31, 2011, Dreyfus Emerging Leaders Fund produced a total return of 12.28%.1 In comparison, the Russell 2000 Index (the “Index”) produced a total return of 22.19%.2
The changes in the investment environment over the last year were dra-matic.The period began with renewed optimism as the Federal Reserve launched its second round of quantitative easing and a resumption of stronger domestic economic growth occurred. By its end, world economic growth had slowed, a U.S. government default had been narrowly averted and the European financial system was under siege.
Investor sentiment shifted quickly with the changing environment. Rational longer-term perspectives gave way to a complete focus on only the very short term.As a result, the fund’s focus on future earnings, cash flow, and relative performance, combined with a soft patch of stock selection, detracted from the fund’s performance relative to the benchmark.
The Fund’s Investment Approach
The fund seeks capital growth. Stocks are selected for the fund’s portfolio based primarily on bottom-up fundamental analysis. The fund’s portfolio managers use a disciplined investment process that relies, in general, on proprietary fundamental research and valuation. Generally, elements of the process include analysis of mid-cycle business prospects, estimation of the intrinsic value of the company and the identification of a revaluation trigger. Intrinsic value is based on the combination of the valuation assessment of the company’s operating divisions with the firm’s economic balance sheet. Mid-cycle estimates, growth prospects and competitive advantages are some of the factors used in the valuation assessment. A company’s stated and hidden liabilities and assets are included in the portfolio managers’ economic balance sheet calculation. Sector overweights and underweights are a function of the relative attractiveness of securities within the fund’s investable universe. The fund’s portfolio managers invest in stocks that they believe have attractive reward to risk opportunities and may actively adjust the fund’s portfolio to reflect new developments.
DISCUSSION OF FUND PERFORMANCE (continued)
Economic Concerns Sparked Heightened Market Volatility
Investors’ economic outlooks improved markedly amid expectations of a stronger economic recovery early in the reporting period, sending stock prices higher. However, the rally was interrupted in February 2011 when political unrest in the Middle East led to sharply rising energy prices, and again in March when natural and nuclear disasters in Japan threatened one of the world’s largest economies. Nonetheless, investors proved resilient and U.S. stocks rebounded quickly from these unexpected shocks.
In late April, investor sentiment began to deteriorate in earnest when Greece appeared headed for default on its sovereign debt, economic data proved disappointing and a contentious debate regarding U.S. government spending and borrowing intensified. Stocks suffered heightened volatility over the summer of 2011 as newly risk-averse investors generally disregarded the long-term strengths of individual companies in favor of reacting to near-term macroeconomic develop-ments.The reporting period ended on a pessimistic note after a major credit-rating agency downgraded U.S.Treasury bonds.
Deteriorating Investor Sentiment Dampened Fund Results
The fund’s investment approach focuses on companies that we believe to be priced below their real worth and that have strong earnings and cash flow prospects over the next one to three years. The approach fell out of favor during the May to August time period when investors proved unwilling to look beyond the next several months for their investment horizon. Relative performance was negatively impacted by this development.
The fund’s investment team also hit a soft patch of weak stock selection. A few holdings and industry overweights hampered our returns. Meritor, a leading manufacturer of axles and drivetrains for trucks, experienced higher than expected raw materials costs and announced a delay in its earnings recovery. Lennox International, one of the oldest and most established names in heating and air conditioning systems, suffered from a lack of new orders.Velti, one of the most interesting prospects in the nascent market of advertising on cellular phones, struggled in a market environment that demanded short-term earnings results. An overweighted position in machinery stocks based on the belief that U.S. manufacturing is in the middle of a multi-year renaissance gave back earlier gains. Positions in building products struggled as limited evidence of a turn in residential construction appeared during the reporting period.
4
Weakness in these areas was offset to a degree by better results in other market sectors. In the energy sector, natural gas producers Gulfport Energy, SandRidge Energy and Cabot Oil & Gas benefited from increased production activity when commodity prices moved higher. In the health care sector, drug developer King Pharmaceuticals advanced when it accepted an acquisition offer, while takeover speculation also lifted the stocks of Pain Therapeutics and Onyx Pharmaceuticals. Several industrials holdings fared well, including wire-and-cables producer WESCO International and mechanical transmissions maker Altra Holdings.
Uncertainty Creates Opportunity
We remain committed to finding companies priced below their real worth that are positioned to deliver strong earnings and cash flow over the next few years.While there are a number of concerns dominating the current investment landscape, we believe that investors’ current focus on short-term results is likely to shift to a long-term perspective in time. As in the past, when a greater level of clarity returns to the market, we would expect our approach to regain favor and more competitive returns to be delivered in that more traditional environment. In the meantime, we have found what we believe are a number of exciting investment opportunities in the industrials, consumer discretionary and information technology sectors.We have found fewer opportunities in the materials sector, where moderating commodity prices could put pressure on earnings, and in the utilities sector, where few companies meet our valuation standards.
September 15, 2011
| |
| | Please note, the position in any security highlighted with italicized typeface was sold during the |
| | reporting period. |
| | Equity funds are subject generally to market, market sector, market liquidity, issuer and investment |
| | style risks, among other factors, to varying degrees, all of which are more fully described in the |
| | fund’s prospectus. |
| | Stocks of small- and/or midcap companies often experience sharper price fluctuations than stocks |
| | of large-cap companies. |
| 1 | Total return includes reinvestment of dividends and any capital gains paid. Past performance is no |
| | guarantee of future results. Share price and investment return fluctuate such that upon redemption, |
| | fund shares may be worth more or less than their original cost. |
| 2 | SOURCE: LIPPER INC. — Reflects reinvestment of dividends and, where applicable, capital |
| | gain distributions.The Russell 2000 Index is an unmanaged index of small-cap stock |
| | performance and is composed of the 2,000 smallest companies in the Russell 3000 Index.The |
| | Russell 3000 Index is composed of the 3,000 largest U.S. companies based on total market |
| | capitalization. Investors cannot invest directly in any index. |
FUND PERFORMANCE

| | | | | | |
| Average Annual Total Returns as of 8/31/11 | | |
| | 1Year | 5 Years | 10 Years |
| Fund | 12.28% | –5.63% | 0.25% |
| Russell 2000 Index | 22.19% | 1.53% | 5.85% |
|
| † Source: Lipper Inc. |
| Past performance is not predictive of future performance.The fund’s performance shown in the graph and table does not |
| reflect the deduction of taxes that a shareholder would pay on fund distributions or the redemption of fund shares. |
| The above graph compares a $10,000 investment made in Dreyfus Emerging Leaders Fund on 8/31/01 to a |
| $10,000 investment made in the Russell 2000 Index (the “Index”) on that date. All dividends and capital gain |
| distributions are reinvested. |
| The fund’s performance shown in the line graph above takes into account all applicable fees and expenses.The Russell |
| 2000 Index is an unmanaged index and is composed of the 2,000 smallest companies in the Russell 3000 Index.The |
| Russell 3000 Index is composed of 3,000 of the largest U.S. companies by market capitalization. Unlike a mutual |
| fund, the Index is not subject to charges, fees and other expenses. Investors cannot invest directly in any index. Further |
| information relating to fund performance, including expense reimbursements, if applicable, is contained in the Financial |
| Highlights section of the prospectus and elsewhere in this report. |
6
UNDERSTANDING YOUR FUND’S EXPENSES (Unaudited)
As a mutual fund investor, you pay ongoing expenses, such as management fees and other expenses. Using the information below, you can estimate how these expenses affect your investment and compare them with the expenses of other funds.You also may pay one-time transaction expenses, including sales charges (loads) and redemption fees, which are not shown in this section and would have resulted in higher total expenses. For more information, see your fund’s prospectus or talk to your financial adviser.
Review your fund’s expenses
The table below shows the expenses you would have paid on a $1,000 investment in Dreyfus Emerging Leaders Fund from March 1, 2011 to August 31, 2011. It also shows how much a $1,000 investment would be worth at the close of the period, assuming actual returns and expenses.
Expenses and Value of a $1,000 Investment
assuming actual returns for the six months ended August 31, 2011
| | |
| Expenses paid per $1,000† | $ | 7.12 |
| Ending value (after expenses) | $ | 788.30 |
COMPARING YOUR FUND’S EXPENSES
WITH THOSE OF OTHER FUNDS (Unaudited)
Using the SEC’s method to compare expenses
The Securities and Exchange Commission (SEC) has established guidelines to help investors assess fund expenses. Per these guidelines, the table below shows your fund’s expenses based on a $1,000 investment, assuming a hypothetical 5% annualized return. You can use this information to compare the ongoing expenses (but not transaction expenses or total cost) of investing in the fund with those of other funds.All mutual fund shareholder reports will provide this information to help you make this comparison. Please note that you cannot use this information to estimate your actual ending account balance and expenses paid during the period.
Expenses and Value of a $1,000 Investment
assuming a hypothetical 5% annualized return for the six months ended August 31, 2011
| | |
| Expenses paid per $1,000† | $ | 8.03 |
| Ending value (after expenses) | $ | 1,017.24 |
|
| † Expenses are equal to the fund’s annualized expense ratio of 1.58%, multiplied by the average account value over |
| the period, multiplied by 184/365 (to reflect the one-half year period). |
|
| STATEMENT OF INVESTMENTS |
| August 31, 2011 |
| | |
| Common Stocks—115.0% | Shares | Value ($) |
| Consumer Discretionary—40.0% | | |
| Accuride | 58,390a | 492,228 |
| American Axle & Manufacturing Holdings | 52,284a | 488,855 |
| Dana Holding | 154,600a | 1,971,150 |
| DFC Global | 109,230a,b | 2,410,706 |
| Equifax | 48,650 | 1,572,854 |
| Express | 101,870 | 1,944,698 |
| Group 1 Automotive | 63,610 | 2,655,718 |
| Guess? | 23,910 | 815,570 |
| Herman Miller | 56,250 | 1,117,688 |
| ICF International | 83,550a | 1,894,078 |
| Kelly Services, Cl. A | 165,550 | 2,516,360 |
| Liz Claiborne | 601,450a,b | 3,139,569 |
| Meritage Homes | 139,630a,b | 2,615,270 |
| Meritor | 287,870a,b | 2,432,502 |
| Oshkosh | 83,350a | 1,643,662 |
| Saks | 296,060a,b | 2,865,861 |
| Standard-Pacific | 335,180a,b | 861,413 |
| Steelcase, Cl. A | 133,250 | 1,103,310 |
| Tower International | 75,620a | 1,054,143 |
| TrueBlue | 33,650a | 472,782 |
| Williams-Sonoma | 76,470 | 2,531,922 |
| Wright Express | 65,870a | 2,775,762 |
| | | 39,376,101 |
| Consumer Staples—1.2% | | |
| Dole Food | 61,290a,b | 690,738 |
| Primo Water | 74,210b | 524,665 |
| | | 1,215,403 |
| Energy—8.2% | | |
| Endeavour International | 109,600a,b | 1,080,656 |
| Forest Oil | 61,110a | 1,189,812 |
| Gulfport Energy | 83,480a | 2,412,572 |
| Resolute Energy | 112,270a | 1,514,522 |
| SandRidge Energy | 263,320a,b | 1,932,769 |
| | | 8,130,331 |
8
| | |
| Common Stocks (continued) | Shares | Value ($) |
| Financial—10.9% | | |
| Brown & Brown | 81,380 | 1,709,794 |
| Employers Holdings | 91,760 | 1,122,225 |
| Jones Lang LaSalle | 39,630 | 2,651,643 |
| Nelnet, Cl. A | 24,360 | 467,712 |
| Och-Ziff Capital | | |
| Management Group, Cl. A | 98,450 | 1,117,407 |
| Popular | 207,050 a | 430,664 |
| Portfolio Recovery Associates | 25,060 a,b | 1,832,638 |
| PrivateBancorp | 86,910 | 771,761 |
| Starwood Property Trust | 33,100 c | 612,350 |
| | | 10,716,194 |
| Health Care—10.4% | | |
| Align Technology | 69,580 a,b | 1,328,978 |
| Durect | 171,500 a | 286,405 |
| Emergent BioSolutions | 158,740 a | 2,868,432 |
| Hanger Orthopedic Group | 167,940 a | 3,153,913 |
| Onyx Pharmaceuticals | 20,930 a | 712,248 |
| Sagent Pharmaceuticals | 33,210 | 763,498 |
| Salix Pharmaceuticals | 18,880 a | 574,896 |
| United Therapeutics | 13,020 a | 561,813 |
| | | 10,250,183 |
| Industrial—12.6% | | |
| Columbus McKinnon | 100,700 a | 1,452,094 |
| Con-way | 29,770 | 761,814 |
| Granite Construction | 84,710 b | 1,756,038 |
| Griffon | 60,350 a | 527,459 |
| Landstar System | 44,640 | 1,807,474 |
| Lennox International | 31,900 | 995,918 |
| Orion Marine Group | 91,980 a,b | 591,431 |
| Saia | 35,290 a | 422,421 |
| Sterling Construction | 45,800 a | 584,408 |
| Trinity Industries | 44,670 b | 1,231,105 |
| UTi Worldwide | 168,700 | 2,285,042 |
| | | 12,415,204 |
STATEMENT OF INVESTMENTS (continued)
| | |
| Common Stocks (continued) | Shares | Value ($) |
| Information Technology—21.1% | | |
| Brocade Communications Systems | 158,940a | 615,098 |
| CSG Systems International | 102,250a,b | 1,366,060 |
| DealerTrack Holdings | 176,960a | 3,312,691 |
| Encore Wire | 60,310 | 1,351,547 |
| Hubbell, Cl. B | 12,460 | 736,760 |
| MICROS Systems | 58,340a | 2,780,484 |
| Microsemi | 122,270a,b | 1,898,853 |
| ScanSource | 99,460a,b | 3,078,287 |
| SYKES Enterprises | 53,080a | 830,702 |
| Take-Two Interactive Software | 77,020a | 1,018,204 |
| Velti | 220,620a | 2,087,065 |
| Vishay Intertechnology | 47,750a,b | 544,350 |
| Watts Water Technologies, Cl. A | 40,810 | 1,155,739 |
| | | 20,775,840 |
| Materials—4.7% | | |
| Cytec Industries | 4,660 | 211,564 |
| Georgia Gulf | 56,250a,b | 1,191,937 |
| Mohawk Industries | 26,650a | 1,320,508 |
| Omnova Solutions | 98,520a | 434,473 |
| Zoltek | 162,250a,b | 1,427,800 |
| | | 4,586,282 |
| Telecommunications—5.9% | | |
| Cbeyond | 73,220a | 680,214 |
| GeoEye | 94,500a | 3,418,065 |
| JDS Uniphase | 134,680a | 1,746,800 |
| | | 5,845,079 |
| Total Common Stocks | | |
| (cost $124,868,784) | | 113,310,617 |
10
| | | | |
| Other Investment—.1% | Shares | Value ($) |
| Registered Investment Company; | | |
| Dreyfus Institutional Preferred | | |
| Plus Money Market Fund | | |
| (cost $46,000) | 46,000d | 46,000 |
| |
| Investment of Cash Collateral | | |
| for Securities Loaned—15.9% | | |
| Registered Investment Company; | | |
| Dreyfus Institutional Cash Advantage Fund | | |
| (cost $15,699,771) | 15,699,771d | 15,699,771 |
| |
| Total Investments (cost $140,614,555) | 131.0% | 129,056,388 |
| Liabilities, Less Cash and Receivables | (31.0%) | (30,526,025) |
| Net Assets | 100.0% | 98,530,363 |
|
| a Non-income producing security. |
| b Security, or portion thereof, on loan.At August 31, 2011, the value of the fund’s securities on loan was |
| $15,043,900 and the value of the collateral held by the fund was $15,699,771. |
| c Investment in real estate investment trust. |
| d Investment in affiliated money market mutual fund. |
| | | |
| Portfolio Summary (Unaudited)† | | |
| |
| | Value (%) | | Value (%) |
| |
| Consumer Discretionary | 40.0 | Energy | 8.2 |
| Information Technology | 21.1 | Telecommunications | 5.9 |
| Money Market Investments | 16.0 | Materials | 4.7 |
| Industrial | 12.6 | Consumer Staples | 1.2 |
| Financial | 10.9 | | |
| Health Care | 10.4 | | 131.0 |
| |
| † Based on net assets. | | | |
| See notes to financial statements. | | | |
|
| STATEMENT OF ASSETS AND LIABILITIES |
| August 31, 2011 |
| | | |
| | Cost | Value |
| Assets ($): | | |
| Investments in securities—See Statement of Investments (including | | |
| securities on loan, valued at $15,043,900)—Note 1(b): | | |
| Unaffiliated issuers | 124,868,784 | 113,310,617 |
| Affiliated issuers | 15,745,771 | 15,745,771 |
| Cash | | 3,928 |
| Receivable for investment securities sold | | 2,353,641 |
| Dividends and securities lending income receivable | | 39,996 |
| Receivable for shares of Common Stock subscribed | | 833 |
| Prepaid expenses | | 20,802 |
| | | 131,475,588 |
| Liabilities ($): | | |
| Due to The Dreyfus Corporation and affiliates—Note 3(b) | | 134,045 |
| Liability for securities on loan—Note 1(b) | | 15,699,771 |
| Payable for shares of Common Stock redeemed | | 14,706,544 |
| Payable for investment securities purchased | | 2,227,604 |
| Accrued expenses | | 177,261 |
| | | 32,945,225 |
| Net Assets ($) | | 98,530,363 |
| Composition of Net Assets ($): | | |
| Paid-in capital | | 151,727,851 |
| Accumulated net realized gain (loss) on investments | | (41,639,321) |
| Accumulated net unrealized appreciation | | |
| (depreciation) on investments | | (11,558,167) |
| Net Assets ($) | | 98,530,363 |
| Shares Outstanding | | |
| (100 million shares of $.001 par value shares of Common Stock authorized) | 5,696,751 |
| Net Asset Value, offering and redemption price per share ($) | | 17.30 |
| |
| See notes to financial statements. | | |
12
|
| STATEMENT OF OPERATIONS |
| Year Ended August 31, 2011 |
| | |
| Investment Income ($): | |
| Income: | |
| Cash dividends: | |
| Unaffiliated issuers | 1,395,196 |
| Affiliated issuers | 2,146 |
| Income from securities lending—Note 1 (b) | 83,992 |
| Total Income | 1,481,334 |
| Expenses: | |
| Management fee—Note 3(a) | 1,332,732 |
| Shareholder servicing costs—Note 3(b) | 612,098 |
| Professional fees | 112,322 |
| Prospectus and shareholders’ reports | 64,799 |
| Custodian fees—Note 3(b) | 30,706 |
| Registration fees | 16,924 |
| Directors’ fees and expenses—Note 3(c) | 9,747 |
| Loan commitment fees—Note 2 | 2,048 |
| Miscellaneous | 9,744 |
| Total Expenses | 2,191,120 |
| Less—reduction in fees due to earnings credits—Note 3(b) | (569) |
| Net Expenses | 2,190,551 |
| Investment (Loss)—Net | (709,217) |
| Realized and Unrealized Gain (Loss) on Investments—Note 4 ($): | |
| Net realized gain (loss) on investments | 23,782,308 |
| Net unrealized appreciation (depreciation) on investments | (2,153,626) |
| Net Realized and Unrealized Gain (Loss) on Investments | 21,628,682 |
| Net Increase in Net Assets Resulting from Operations | 20,919,465 |
| |
| See notes to financial statements. | |
STATEMENT OF CHANGES IN NET ASSETS
| | | | |
| | Year Ended August 31, |
| | 2011 | 2010 |
| Operations ($): | | |
| Investment (loss)—net | (709,217) | (77,479) |
| Net realized gain (loss) on investments | 23,782,308 | 4,443,160 |
| Net unrealized appreciation | | |
| (depreciation) on investments | (2,153,626) | 2,996,662 |
| Net Increase (Decrease) in Net Assets | | |
| Resulting from Operations | 20,919,465 | 7,362,343 |
| Dividends to Shareholders from ($): | | |
| Investment income—net | (22,307) | (289,551) |
| Capital Stock Transactions ($): | | |
| Net proceeds from shares sold | 7,120,073 | 6,198,985 |
| Dividends reinvested | 21,930 | 285,155 |
| Cost of shares redeemed | (54,238,609) | (25,781,361) |
| Increase (Decrease) in Net Assets | | |
| from Capital Stock Transactions | (47,096,606) | (19,297,221) |
| Total Increase (Decrease) in Net Assets | (26,199,448) | (12,224,429) |
| Net Assets ($): | | |
| Beginning of Period | 124,729,811 | 136,954,240 |
| End of Period | 98,530,363 | 124,729,811 |
| Undistributed investment income—net | — | 20,961 |
| Capital Share Transactions (Shares): | | |
| Shares sold | 352,602 | 375,478 |
| Shares issued for dividends reinvested | 1,001 | 17,583 |
| Shares redeemed | (2,750,320) | (1,578,660) |
| Net Increase (Decrease) in Shares Outstanding | (2,396,717) | (1,185,599) |
| |
| See notes to financial statements. | | |
14
FINANCIAL HIGHLIGHTS
The following table describes the performance for the fiscal periods indicated. Total return shows how much your investment in the fund would have increased (or decreased) during each period, assuming you had reinvested all dividends and distributions.These figures have been derived from the fund’s financial statements.
| | | | | | | | | | |
| | | Year Ended August 31, | |
| | 2011 | 2010 | 2009 | 2008 | 2007 |
| Per Share Data ($): | | | | | |
| Net asset value, beginning of period | 15.41 | 14.76 | 24.19 | 33.88 | 41.32 |
| Investment Operations: | | | | | |
| Investment income (loss)—neta | (.10) | (.01) | .05 | .08 | .04 |
| Net realized and unrealized | | | | | |
| gain (loss) on investments | 1.99 | .69b | (7.62) | (4.27) | 2.28 |
| Total from Investment Operations | 1.89 | .68 | (7.57) | (4.19) | 2.32 |
| Distributions: | | | | | |
| Dividends from | | | | | |
| investment income—net | (.00)c | (.03) | (.07) | (.00)c | — |
| Dividends from net realized | | | | | |
| gain on investments | — | — | (1.79) | (5.50) | (9.76) |
| Total Distributions | (.00)c | (.03) | (1.86) | (5.50) | (9.76) |
| Net asset value, end of period | 17.30 | 15.41 | 14.76 | 24.19 | 33.88 |
| Total Return (%) | 12.28 | 4.62 | (29.73) | (13.39) | 4.68 |
| Ratios/Supplemental Data (%): | | | | | |
| Ratio of total expenses | | | | | |
| to average net assets | 1.48 | 1.45 | 1.55 | 1.38 | 1.33 |
| Ratio of net expenses | | | | | |
| to average net assets | 1.48 | 1.40 | 1.43 | 1.37 | 1.33 |
| Ratio of net investment income | | | | | |
| (loss) to average net assets | (.48) | (.05) | .33 | .31 | .11 |
| Portfolio Turnover Rate | 98.84 | 181.65 | 54.47 | 65.98 | 67.66 |
| Net Assets, end of period ($ x 1,000) | 98,530 | 124,730 | 136,954 | 261,379 | 446,201 |
|
| a Based on average shares outstanding at each month end. |
| b Amount includes litigation proceeds received by the fund amounting to $.15 per share for the year ended |
| August 31, 2010. |
| c Amount represents less than $.01 per share. |
See notes to financial statements.
NOTES TO FINANCIAL STATEMENTS
NOTE 1—Significant Accounting Policies:
Dreyfus Emerging Leaders Fund (the “fund”) is a separate diversified series of Advantage Funds, Inc. (the “Company”), which is registered under the Investment Company Act of 1940, as amended (the “Act”), as an open-end management investment company and operates as a series company that offers thirteen series, including the fund.The fund’s investment objective is to seek capital growth.The Dreyfus Corporation (the “Manager” or “Dreyfus”), a wholly-owned subsidiary of The Bank of NewYork Mellon Corporation (“BNY Mellon”), serves as the fund’s investment adviser. MBSC Securities Corporation (the “Distributor”), a wholly-owned subsidiary of the Manager, is the distributor of the fund’s shares, which are sold to the public without a sales charge.
The Company accounts separately for the assets, liabilities and operations of each series. Expenses directly attributable to each series are charged to that series’ operations; expenses which are applicable to all series are allocated among them on a pro rata basis.
The Financial Accounting Standards Board (“FASB”) Accounting Standards Codification (“ASC”) is the exclusive reference of authoritative U.S. generally accepted accounting principles (“GAAP”) recognized by the FASB to be applied by nongovernmental entities. Rules and interpretive releases of the Securities and Exchange Commission (“SEC”) under authority of federal laws are also sources of authoritative GAAP for SEC registrants. The fund’s financial statements are prepared in accordance with GAAP, which may require the use of management estimates and assumptions.Actual results could differ from those estimates.
The Company enters into contracts that contain a variety of indemnifications.The fund’s maximum exposure under these arrangements is unknown.The fund does not anticipate recognizing any loss related to these arrangements.
(a) Portfolio valuation: The fair value of a financial instrument is the amount that would be received to sell an asset or paid to transfer a liability in an orderly transaction between market participants at the
16
measurement date (i.e. the exit price). GAAP establishes a fair value hierarchy that prioritizes the inputs of valuation techniques used to measure fair value.This hierarchy gives the highest priority to unadjusted quoted prices in active markets for identical assets or liabilities (Level 1 measurements) and the lowest priority to unobservable inputs (Level 3 measurements).
Additionally, GAAP provides guidance on determining whether the volume and activity in a market has decreased significantly and whether such a decrease in activity results in transactions that are not orderly. GAAP requires enhanced disclosures around valuation inputs and techniques used during annual and interim periods.
Various inputs are used in determining the value of the fund’s investments relating to fair value measurements.These inputs are summarized in the three broad levels listed below:
Level 1—unadjusted quoted prices in active markets for identical investments.
Level 2—other significant observable inputs (including quoted prices for similar investments, interest rates, prepayment speeds, credit risk, etc.).
Level 3—significant unobservable inputs (including the fund’s own assumptions in determining the fair value of investments).
The inputs or methodology used for valuing securities are not necessarily an indication of the risk associated with investing in those securities.
Changes in valuation techniques may result in transfers in or out of an assigned level within the disclosure hierarchy. Valuation techniques used to value the fund’s investments are as follows:
Investments in securities are valued at the last sales price on the securities exchange or national securities market on which such securities are primarily traded. Securities listed on the National Market System for which market quotations are available are valued at the official closing price or, if there is no official closing price that day, at the last sales price.
NOTES TO FINANCIAL STATEMENTS (continued)
Securities not listed on an exchange or the national securities market, or securities for which there were no transactions, are valued at the average of the most recent bid and asked prices, except for open short positions, where the asked price is used for valuation purposes. Bid price is used when no asked price is available. Registered investment companies that are not traded on an exchange are valued at their net asset value. All preceding securities are categorized as Level 1 in the hierarchy.
Fair valuing of securities may be determined with the assistance of a pricing service using calculations based on indices of domestic securities and other appropriate indicators, such as prices of relevant American Depository Receipts and futures contracts. Utilizing these techniques may result in transfers between Level 1 and Level 2 of the fair value hierarchy.
When market quotations or official closing prices are not readily available, or are determined not to reflect accurately fair value, such as when the value of a security has been significantly affected by events after the close of the exchange or market on which the security is principally traded (for example, a foreign exchange or market), but before the fund calculates its net asset value, the fund may value these investments at fair value as determined in accordance with the procedures approved by the Board of Directors. Certain factors may be considered when fair valuing investments such as: fundamental analytical data, the nature and duration of restrictions on disposition, an evaluation of the forces that influence the market in which the securities are purchased and sold, and public trading in similar securities of the issuer or comparable issuers.These securities are either categorized as Level 2 or 3 depending on the relevant inputs used.
For restricted securities where observable inputs are limited, assumptions about market activity and risk are used and are categorized as Level 3 in the hierarchy.
18
The following is a summary of the inputs used as of August 31, 2011 in valuing the fund’s investments:
| | | | |
| | | Level 2—Other | Level 3— | |
| | Level 1— | Significant | Significant | |
| | Unadjusted | Observable | Unobservable | |
| | Quoted Prices | Inputs | Inputs | Total |
| Assets ($) | | | | |
| Investments in Securities: | | | |
| Equity Securities— | | | | |
| Domestic† | 108,938,510 | — | — | 108,938,510 |
| Equity Securities— | | | | |
| Foreign† | 4,372,107 | — | — | 4,372,107 |
| Mutual Funds | 15,745,771 | — | — | 15,745,771 |
| † See Statement of Investments for additional detailed categorizations. | |
In January 2010, FASB issued Accounting Standards Update (“ASU”) No. 2010-06 “Improving Disclosures about FairValue Measurements” (“ASU 2010-06”). The portions of ASU 2010-06 which require reporting entities to prepare new disclosures surrounding amounts and reasons for significant transfers in and out of Level 1 and Level 2 fair value measurements as well as inputs and valuation techniques used to measure fair value for both recurring and nonrecurring fair value measurements that fall in either Level 2 or Level 3 have been adopted by the fund. No significant transfers between Level 1 or Level 2 fair value measurements occurred at August 31, 2011.
In May 2011, FASB issued ASU No. 2011-04 “Amendments to Achieve Common Fair Value Measurement and Disclosure Requirements in GAAP and International Financial Reporting Standards (“IFRS”)” (“ASU 2011-04”). ASU 2011-04 includes common requirements for measurement of and disclosure about fair value between GAAP and IFRS. ASU 2011-04 will require reporting entities to disclose the following information for fair value measurements categorized within
NOTES TO FINANCIAL STATEMENTS (continued)
Level 3 of the fair value hierarchy: quantitative information about the unobservable inputs used in the fair value measurement, the valuation processes used by the reporting entity and a narrative description of the sensitivity of the fair value measurement to changes in unobservable inputs and the interrelationships between those unobservable inputs. In addition, ASU 2011-04 will require reporting entities to make disclosures about amounts and reasons for all transfers in and out of Level 1 and Level 2 fair value measurements.The new and revised disclosures are effective for interim and annual reporting periods beginning after December 15, 2011. At this time, management is evaluating the implications of ASU 2011-04 and its impact on the financial statements.
(b) Securities transactions and investment income: Securities transactions are recorded on a trade date basis. Realized gains and losses from securities transactions are recorded on the identified cost basis. Dividend income is recognized on the ex-dividend date and interest income, including, where applicable, accretion of discount and amortization of premium on investments, is recognized on the accrual basis.
Pursuant to a securities lending agreement with The Bank of New York Mellon, a subsidiary of BNY Mellon and an affiliate of Dreyfus, the fund may lend securities to qualified institutions. It is the fund’s policy that, at origination, all loans are secured by collateral of at least 102% of the value of U.S. securities loaned and 105% of the value of foreign securities loaned. Collateral equivalent to at least 100% of the market value of securities on loan is maintained at all times. Collateral is either in the form of cash, which can be invested in certain money market mutual funds managed by the Manager, U.S. Government and Agency securities or letters of credit.The fund is entitled to receive all income on securities loaned, in addition to income earned as a result of the lending transaction. Although each security loaned is fully collateralized, the fund bears the risk of delay in recovery of, or loss of rights in, the securities loaned should a borrower fail to return the securities in a timely manner. During the period ended August 31, 2011, The Bank of New York Mellon earned $27,997 from lending portfolio securities, pursuant to the securities lending agreement.
20
(c) Affiliated issuers: Investments in other investment companies advised by Dreyfus are defined as “affiliated” in the Act.
The fund may invest in shares of certain affiliated investment companies also advised or managed by Dreyfus. Investments in affiliated investment companies for the period ended August 31, 2011 were as follows:
| | | | | | | |
| Affiliated | | | | | | | |
| Investment | Value | | | | Value | | Net |
| Company | 8/31/2010 | ($) | Purchases ($) | Sales ($) | 8/31/2011 | ($) | Assets (%) |
| Dreyfus | | | | | | | |
| Institutional | | | | | | | |
| Preferred | | | | | | | |
| Plus Money | | | | | | | |
| Market Fund | 1,597,000 | | 57,155,000 | 58,706,000 | 46,000 | | .1 |
| Dreyfus | | | | | | | |
| Institutional | | | | | | | |
| Cash | | | | | | | |
| Advantage | | | | | | | |
| Fund | 10,922,389 | | 161,642,696 | 156,865,314 | 15,699,771 | | 15.9 |
| Total | 12,519,389 | | 218,797,696 | 215,571,314 | 15,745,771 | | 16.0 |
(d) Dividends to shareholders: Dividends are recorded on the ex-dividend date. Dividends from investment income-net and dividends from net realized capital gains, if any, are normally declared and paid annually, but the fund may make distributions on a more frequent basis to comply with the distribution requirements of the Internal Revenue Code of 1986, as amended (the “Code”).To the extent that net realized capital gains can be offset by capital loss carryovers, it is the policy of the fund not to distribute such gains. Income and capital gain distributions are determined in accordance with income tax regulations, which may differ from GAAP.
(e) Federal income taxes: It is the policy of the fund to continue to qualify as a regulated investment company, if such qualification is in the best interests of its shareholders, by complying with the applicable provisions of the Code, and to make distributions of taxable income sufficient to relieve it from substantially all federal income and excise taxes.
As of and during the period ended August 31, 2011, the fund did not have any liabilities for any uncertain tax positions.The fund recognizes
NOTES TO FINANCIAL STATEMENTS (continued)
interest and penalties, if any, related to uncertain tax positions as income tax expense in the Statement of Operations. During the period, the fund did not incur any interest or penalties.
Each of the tax years in the four-year period ended August 31, 2011 remains subject to examination by the Internal Revenue Service and state taxing authorities.
At August 31, 2011, the components of accumulated earnings on a tax basis were as follows: accumulated capital losses $41,631,021 and unrealized depreciation $11,566,467.
The accumulated capital loss carryover is available for federal income tax purposes to be applied against future net securities profits, if any, realized subsequent to August 31, 2011. If not applied, the carryover expires in fiscal 2018.
The tax character of distributions paid to shareholders during the fiscal periods ended August 31, 2011 and August 31, 2010 were as follows: ordinary income $22,307 and $289,551, respectively.
During the period ended August 31, 2011, as a result of permanent book to tax differences, primarily due to the tax treatment for net operating losses and real estate investment trusts, the fund increased accumulated undistributed investment income-net by $710,563, decreased accumulated net realized gain (loss) on investments by $521 and decreased paid-in capital by $710,042. Net assets and net asset value per share were not affected by this reclassification.
NOTE 2—Bank Lines of Credit:
The fund participates with other Dreyfus-managed funds in a $225 million unsecured credit facility led by Citibank, N.A. and a $300 million unsecured credit facility provided by The Bank of New York Mellon (each, a “Facility”), each to be utilized primarily for temporary or emergency purposes, including the financing of redemptions. In connection therewith, the fund has agreed to pay its pro rata portion of commitment fees for each Facility. Interest is charged to the fund based on rates determined pursuant to the terms of the respective
22
Facility at the time of borrowing. During the period ended August 31, 2011, the fund did not borrow under the Facilities.
NOTE 3—Management Fee and Other Transactions With Affiliates:
(a) Pursuant to a management agreement with the Manager, the management fee is computed at the annual rate of .90% of the value of the fund’s average daily net assets and is payable monthly.The Manager had agreed from September 1, 2010 through March 31, 2011, to waive receipt of its fees and/or assume the expenses of the fund so that the total annual fund operating expenses (excluding shareholder services fees, taxes, brokerage commissions, interest on borrowings and extraordinary expenses) did not exceed 1.15% of the value of the funds average daily net assets. At August 31, 2011, there were no reductions in management fee, pursuant to the undertakings.
(b) Under the Shareholder Services Plan, the fund pays the Distributor at an annual rate of .25% of the value of the fund’s average daily net assets for the provision of certain services. The services provided may include personal services relating to shareholder accounts, such as answering shareholder inquiries regarding the fund and providing reports and other information, and services related to the maintenance of shareholder accounts. The Distributor may make payments to Service Agents (a securities dealer, financial institution or other industry professional) in respect of these services.The Distributor determines the amounts to be paid to Service Agents. During the period ended August 31, 2011, the fund was charged $370,203 pursuant to the Shareholder Services Plan.
The fund compensates Dreyfus Transfer, Inc., a wholly-owned subsidiary of the Manager, under a transfer agency agreement for providing personnel and facilities to perform transfer agency services for the fund. During the period ended August 31, 2011, the fund was charged $76,431 pursuant to the transfer agency agreement, which is included in Shareholder servicing costs in the Statement of Operations.
NOTES TO FINANCIAL STATEMENTS (continued)
The fund has arrangements with the custodian and cash management bank whereby the fund may receive earnings credits when positive cash balances are maintained, which are used to offset custody and cash management fees. For financial reporting purposes, the fund includes net earnings credits as an expense offset in the Statement of Operations.
The fund compensates The Bank of New York Mellon under a cash management agreement for performing cash management services related to fund subscriptions and redemptions. During the period ended August 31, 2011, the fund was charged $12,412 pursuant to the cash management agreement, which is included in Shareholder servicing costs in the Statement of Operations.These fees were partially offset by earnings credits of $569.
The fund also compensates The Bank of New York Mellon under a custody agreement for providing custodial services for the fund. During the period ended August 31, 2011, the fund was charged $30,706 pursuant to the custody agreement.
During the period ended August 31, 2011, the fund was charged $7,225 for services performed by the Chief Compliance Officer.
The components of “Due to The Dreyfus Corporation and affiliates” in the Statement of Assets and Liabilities consist of: management fees $85,285, shareholder services plan fees $23,690, custodian fees $10,000, chief compliance officer fees $3,253 and transfer agency per account fees $11,817.
(c) Each Board member also serves as a Board member of other funds within the Dreyfus complex. Annual retainer fees and attendance fees are allocated to each fund based on net assets.
24
NOTE 4—Securities Transactions:
The aggregate amount of purchases and sales of investment securities, excluding short-term securities, during the period ended August 31, 2011 amounted to $142,850,598 and $173,595,860, respectively.
At August 31, 2011, the cost of investments for federal income tax purposes was $140,622,855; accordingly, accumulated net unrealized depreciation on investments was $11,566,467, consisting of $5,083,863 gross unrealized appreciation and $16,650,330 gross unrealized depreciation.
NOTE 5—Plan of Reorganization:
On April 7, 2011, the fund’s Board of Directors approved the merger of the fund and Dreyfus Opportunistic Small Cap Fund (the “Acquiring Fund”). On September 15, 2011, the shareholders of the fund approved a Plan of Reorganization to allow the fund to transfer all of its assets in a tax-free reorganization to the Acquiring Fund, in exchange solely for shares of the Acquiring Fund having an aggregate net asset value equal to the value of the fund’s net assets and the assumption by the Acquiring Fund of the fund’s stated liabilities (the “Reorganization”).The shares of the Acquiring Fund received by the fund in the Reorganization will be distributed by the fund to its shareholders in liquidation of the fund, after which the fund will cease operations and will be terminated as a series of the Company.The Reorganization is anticipated to occur on or about November 28, 2011.
REPORT OF INDEPENDENT REGISTERED
PUBLIC ACCOUNTING FIRM
Shareholders and Board of Directors
Dreyfus Emerging Leaders Fund
We have audited the accompanying statement of assets and liabilities, including the statement of investments, of Dreyfus Emerging Leaders Fund (one of the series comprising Advantage Funds, Inc.) as of August 31, 2011, and the related statement of operations for the year then ended, the statement of changes in net assets for each of the two years in the period then ended, and financial highlights for each of the years indicated therein.These financial statements and financial highlights are the responsibility of the Fund’s management. Our responsibility is to express an opinion on these financial statements and financial highlights based on our audits.
We conducted our audits in accordance with the standards of the Public Company Accounting Oversight Board (United States).Those standards require that we plan and perform the audit to obtain reasonable assurance about whether the financial statements and financial highlights are free of material misstatement.We were not engaged to perform an audit of the Fund’s internal control over financial reporting. Our audits included consideration of internal control over financial reporting as a basis for designing audit procedures that are appropriate in the circumstances, but not for the purpose of expressing an opinion on the effectiveness of the Fund’s internal control over financial reporting.Accordingly, we express no such opinion. An audit also includes examining, on a test basis, evidence supporting the amounts and disclosures in the financial statements and financial highlights, assessing the accounting principles used and significant estimates made by management, and evaluating the overall financial statement presentation. Our procedures included confirmation of securities owned as of August 31, 2011 by correspondence with the custodian and others.We believe that our audits provide a reasonable basis for our opinion.
In our opinion, the financial statements and financial highlights referred to above present fairly, in all material respects, the financial position of Dreyfus Emerging Leaders Fund at August 31, 2011, the results of its operations for the year then ended, the changes in its net assets for each of the two years in the period then ended, and the financial highlights for each of the indicated years, in conformity with U.S. generally accepted accounting principles.

|
| New York, New York |
| October 27, 2011 |
26
IMPORTANT TAX INFORMATION (Unaudited)
For federal tax purposes, the fund hereby designates 100% of the ordinary dividends paid during the fiscal year ended August 31, 2011 as qualifying for the corporate dividends received deduction.Also certain dividends paid by the fund may be subject to a maximum tax rate of 15%, as provided for by the Jobs and Growth Tax Relief Reconciliation Act of 2003. Of the distributions paid during the fiscal year, $22,307 represents the maximum amount that may be considered qualified dividend income. Shareholders will receive notification in early 2012 of the percentage applicable to the preparation of their 2011 income tax returns.
|
| INFORMATION ABOUT THE RENEWAL OF THE |
| FUND’S MANAGEMENT AGREEMENT (Unaudited) |
At a meeting of the fund’s Board of Directors held on March 1, 2011, the Board considered the renewal of the fund’s Management Agreement pursuant to which Dreyfus provides the fund with investment advisory and administrative services (the “Agreement”). The Board members, none of whom are “interested persons” (as defined in the Investment Company Act of 1940, as amended) of the fund, were assisted in their review by independent legal counsel and met with counsel in executive session separate from representatives of Dreyfus. In considering the renewal of the Agreement, the Board considered all factors that it believed to be relevant, including those discussed below.The Board did not identify any one factor as dispositive, and each Board member may have attributed different weights to the factors considered.
Analysis of Nature, Extent, and Quality of Services Provided to the Fund.The Board members considered information previously provided to them in presentations from representatives of Dreyfus regarding the nature, extent, and quality of the services provided to funds in the Dreyfus fund complex, and representatives of Dreyfus confirmed that there had been no material changes in this information. Dreyfus provided the number of open accounts in the fund, the fund’s asset size and the allocation of fund assets among distribution channels. Dreyfus also had previously provided information regarding the diverse intermediary relationships and distribution channels of funds in the Dreyfus fund complex and Dreyfus’ corresponding need for broad, deep, and diverse resources to be able to provide ongoing shareholder services to each distribution channel, including the distribution channel(s) for the fund.
The Board members also considered research support available to, and portfolio management capabilities of, the fund’s portfolio management personnel and that Dreyfus also provides oversight of day-to-day fund operations, including fund accounting and administration and assistance in meeting legal and regulatory requirements.The Board members also
28
considered Dreyfus’ extensive administrative, accounting, and compliance infrastructures.The Board also considered portfolio management’s brokerage policies and practices (including policies and practices regarding soft dollars) and the standards applied in seeking best execution.
Comparative Analysis of the Fund’s Performance and Management Fee and Expense Ratio.The Board members reviewed reports prepared by Lipper, Inc. (“Lipper”), an independent provider of investment company data, which included information comparing (1) the fund’s performance with the performance of a group of comparable funds (the “Performance Group”) and with a broader group of funds (the “Performance Universe”), all for various periods ended December 31, 2010 and (2) the fund’s actual and contractual management fees and total expenses with those of a group of comparable funds (the “Expense Group”) and with a broader group of funds (the “Expense Universe”), the information for which was derived in part from fund financial statements available to Lipper as of December 31, 2010. Dreyfus previously had furnished the Board with a description of the methodology Lipper used to select the Performance Group and Performance Universe and the Expense Group and Expense Universe.
Dreyfus representatives stated that the usefulness of performance comparisons may be affected by a number of factors, including different investment limitations that may be applicable to the fund and comparison funds. The Board members discussed the results of the comparisons and noted that the fund’s total return performance was below the Performance Group and Performance Universe medians for the various periods, except for the one-year period when the fund’s performance was above the Performance Group and Performance Universe medians and ranked in the first quartile. Dreyfus also provided a comparison of the fund’s calendar year total returns to the returns of the fund’s benchmark index.
|
| INFORMATION ABOUT THE RENEWAL OF THE FUND’S |
| MANAGEMENT AGREEMENT (Unaudited) (continued) |
The Board members also reviewed the range of actual and contractual management fees and total expenses of the Expense Group and Expense Universe funds and discussed the results of the comparisons. They noted that the fund’s contractual management fee was below the Expense Group median, the fund’s actual management fee was below the Expense Group and Expense Universe medians and the fund’s total expenses were above the Expense Group and the Expense Universe medians.The Board also considered the current fee waiver and expense reimbursement arrangement undertaken by Dreyfus.
Representatives of Dreyfus reviewed with the Board members the management or investment advisory fees (1) paid by funds advised or administered by Dreyfus that are in the same Lipper category as the fund and (2) paid to Dreyfus or the Dreyfus-affiliated primary employer of the fund’s primary portfolio manager for advising any separate accounts and/or other types of client portfolios that are considered to have similar investment strategies and policies as the fund (the “Similar Clients”), and explained the nature of the Similar Clients.They discussed differences in fees paid and the relationship of the fees paid in light of any differences in the services provided and other relevant factors.The Board members considered the relevance of the fee information provided for the Similar Clients to evaluate the appropriateness and reasonableness of the fund’s management fee.
Analysis of Profitability and Economies of Scale. Dreyfus’ representatives reviewed the expenses allocated and profit received by Dreyfus and the resulting profitability percentage for managing the fund, and the method used to determine the expenses and profit. The Board concluded that the profitability results were not unreasonable, given the services rendered and service levels provided by Dreyfus. The Board also noted the expense limitation arrangement and its effect on Dreyfus’ profitability. The Board previously had been provided with information prepared by an independent consulting firm regarding Dreyfus’ approach to allocating costs to, and determining the prof-
30
itability of, individual funds and the entire Dreyfus fund complex.The consulting firm also had analyzed where any economies of scale might emerge in connection with the management of a fund.
The Board’s counsel stated that the Board members should consider the profitability analysis (1) as part of their evaluation of whether the fees under the Agreement bear a reasonable relationship to the mix of services provided by Dreyfus, including the nature, extent and quality of such services, and (2) in light of the relevant circumstances for the fund and the extent to which economies of scale would be realized if the fund grows and whether fee levels reflect these economies of scale for the benefit of fund shareholders. Dreyfus representatives noted that, as a result of shared and allocated costs among funds in the Dreyfus funds complex, the extent of economies of scale could depend substantially on the level of assets in the complex as a whole, so that increases and decreases in complex-wide assets can affect potential economies of scale in a manner that is disproportionate to, or even in the opposite direction from, changes in the fund’s asset level. The Board members also considered potential benefits to Dreyfus from acting as investment adviser and noted the soft dollar arrangements in effect for trading the fund’s investments.
At the conclusion of these discussions, the Board agreed that it had been furnished with sufficient information to make an informed business decision with respect to the renewal of the Agreement. Based on the discussions and considerations as described above, the Board concluded and determined as follows.
The Board concluded that the nature, extent and quality of the services provided by Dreyfus are adequate and appropriate.
The Board was concerned with the fund’s relative performance and agreed to closely monitor performance.
The Board concluded that the fee paid to Dreyfus was reasonable in light of the considerations described above.
|
| INFORMATION ABOUT THE RENEWAL OF THE FUND’S |
| MANAGEMENT AGREEMENT (Unaudited) (continued) |
The Board determined that the economies of scale which may accrue to Dreyfus and its affiliates in connection with the management of the fund had been adequately considered by Dreyfus in connection with the fee rate charged to the fund pursuant to the Agreement and that, to the extent in the future it were determined that material economies of scale had not been shared with the fund, the Board would seek to have those economies of scale shared with the fund.
The Board members considered these conclusions and determinations, along with information received on a routine and regular basis throughout the year. In addition, it should be noted that the Board’s consideration of the contractual fee arrangements for this fund had the benefit of a number of years of reviews of prior or similar agreements during which lengthy discussions took place between the Board members and Dreyfus representatives. Certain aspects of the arrangements may receive greater scrutiny in some years than in others, and the Board members’ conclusions may be based, in part, on their consideration of the same or similar arrangements in prior years. The Board members determined that renewal of the Agreement was in the best interests of the fund and its shareholders.
32
BOARD MEMBERS INFORMATION (Unaudited)
|
| Joseph S. DiMartino (67) |
| Chairman of the Board (1995) |
| Principal Occupation During Past 5Years: |
| • Corporate Director and Trustee |
| Other Public Company Board Memberships During Past 5Years: |
| • CBIZ (formerly, Century Business Services, Inc.), a provider of outsourcing functions for small |
| and medium size companies, Director (1997-present) |
| • Sunair Services Corporation, a provider of certain outdoor-related services to homes and |
| businesses, Director (2005-2009) |
| • The Newark Group, a provider of a national market of paper recovery facilities, paperboard |
| mills and paperboard converting plants, Director (2000-2010) |
| No. of Portfolios for which Board Member Serves: 167 |
| ——————— |
| Peggy C. Davis (68) |
| Board Member (2006) |
| Principal Occupation During Past 5Years: |
| • Shad Professor of Law, New York University School of Law |
| • Writer and teacher in the fields of evidence, constitutional theory, family law, social sciences |
| and the law, legal process and professional methodology and training |
| No. of Portfolios for which Board Member Serves: 53 |
| ——————— |
| David P. Feldman (71) |
| Board Member (1996) |
| Principal Occupation During Past 5Years: |
| • Corporate Director and Trustee |
| Other Public Company Board Memberships During Past 5Years: |
| • BBH Mutual Funds Group (4 registered mutual funds), Director (1992-present) |
| • QMed, Inc. a healthcare company, Director (1999-2007) |
| No. of Portfolios for which Board Member Serves: 50 |
BOARD MEMBERS INFORMATION (Unaudited) (continued)
|
| Ehud Houminer (71) |
| Board Member (1993) |
| Principal Occupation During Past 5Years: |
| • Executive-in-Residence at the Columbia Business School, Columbia University (1992-present) |
| Other Public Company Board Memberships During Past 5Years: |
| • Avnet Inc., an electronics distributor, Director (1993-present) |
| No. of Portfolios for which Board Member Serves: 64 |
| ——————— |
| Dr. Martin Peretz (72) |
| Board Member (2006) |
| Principal Occupation During Past 5Years: |
| • Editor-in-Chief Emeritus of The New Republic Magazine (2010-present) (previously, |
| Editor-in-Chief, 1974-2010) |
| • Director of TheStreet.com, a financial information service on the web (1996-present) |
| No. of Portfolios for which Board Member Serves: 35 |
| ——————— |
Once elected all Board Members serve for an indefinite term, but achieve Emeritus status upon reaching age 80.The address of the Board Members and Officers is in c/o The Dreyfus Corporation, 200 Park Avenue, NewYork, NewYork 10166.Additional information about the Board Members is available in the fund’s Statement of Additional Information which can be obtained from Dreyfus free of charge by calling this toll free number: 1-800-DREYFUS.
James F. Henry, Emeritus Board Member
Dr. Paul A. Marks, Emeritus Board Member
Gloria Messinger, Emeritus Board Member
34
OFFICERS OF THE FUND (Unaudited)
BRADLEY J. SKAPYAK, President since January 2010.
Chief Operating Officer and a director of the Manager since June 2009. From April 2003 to June 2009, Mr. Skapyak was the head of the Investment Accounting and Support Department of the Manager. He is an officer of 75 investment companies (comprised of 167 portfolios) managed by the Manager. He is 52 years old and has been an employee of the Manager since February 1988.
MICHAEL A. ROSENBERG, Vice President and Secretary since August 2005.
Assistant General Counsel of BNY Mellon, and an officer of 76 investment companies (comprised of 192 portfolios) managed by the Manager. He is 51 years old and has been an employee of the Manager since October 1991.
KIESHA ASTWOOD, Vice President and Assistant Secretary since January 2010.
Counsel of BNY Mellon, and an officer of 76 investment companies (comprised of 192 portfolios) managed by the Manager. She is 38 years old and has been an employee of the Manager since July 1995.
JAMES BITETTO, Vice President and Assistant Secretary since August 2005.
Senior Counsel of BNY Mellon and Secretary of the Manager, and an officer of 76 investment companies (comprised of 192 portfolios) managed by the Manager. He is 45 years old and has been an employee of the Manager since December 1996.
JONI LACKS CHARATAN, Vice President and Assistant Secretary since August 2005.
Senior Counsel of BNY Mellon, and an officer of 76 investment companies (comprised of 192 portfolios) managed by the Manager. She is 55 years old and has been an employee of the Manager since October 1988.
JOSEPH M. CHIOFFI, Vice President and Assistant Secretary since August 2005.
Senior Counsel of BNY Mellon, and an officer of 76 investment companies (comprised of 192 portfolios) managed by the Manager. He is 49 years old and has been an employee of the Manager since June 2000.
KATHLEEN DENICHOLAS, Vice President and Assistant Secretary since January 2010.
Managing Counsel of BNY Mellon, and an officer of 76 investment companies (comprised of 192 portfolios) managed by the Manager. She is 36 years old and has been an employee of the Manager since February 2001.
JANETTE E. FARRAGHER, Vice President and Assistant Secretary since August 2005.
Assistant General Counsel of BNY Mellon, and an officer of 76 investment companies (comprised of 192 portfolios) managed by the Manager. She is 48 years old and has been an employee of the Manager since February 1984.
JOHN B. HAMMALIAN, Vice President and Assistant Secretary since August 2005.
Senior Managing Counsel of BNY Mellon, and an officer of 76 investment companies (comprised of 192 portfolios) managed by the Manager. He is 48 years old and has been an employee of the Manager since February 1991.
M. CRISTINA MEISER, Vice President and Assistant Secretary since January 2010.
Senior Counsel of BNY Mellon, and an officer of 76 investment companies (comprised of 192 portfolios) managed by the Manager. She is 41 years old and has been an employee of the Manager since August 2001.
OFFICERS OF THE FUND (Unaudited) (continued)
ROBERT R. MULLERY, Vice President and Assistant Secretary since August 2005.
Managing Counsel of BNY Mellon, and an officer of 76 investment companies (comprised of 192 portfolios) managed by the Manager. He is 59 years old and has been an employee of the Manager since May 1986.
JEFF PRUSNOFSKY, Vice President and Assistant Secretary since August 2005.
Senior Managing Counsel of BNY Mellon, and an officer of 76 investment companies (comprised of 192 portfolios) managed by the Manager. He is 46 years old and has been an employee of the Manager since October 1990.
JAMES WINDELS, Treasurer since November 2001.
Director – Mutual Fund Accounting of the Manager, and an officer of 76 investment companies (comprised of 192 portfolios) managed by the Manager. He is 52 years old and has been an employee of the Manager since April 1985.
RICHARD CASSARO, Assistant Treasurer since January 2008.
Senior Accounting Manager – Money Market and Municipal Bond Funds of the Manager, and an officer of 76 investment companies (comprised of 192 portfolios) managed by the Manager. He is 52 years old and has been an employee of the Manager since September 1982.
GAVIN C. REILLY, Assistant Treasurer since December 2005.
Tax Manager of the Investment Accounting and Support Department of the Manager, and an officer of 76 investment companies (comprised of 192 portfolios) managed by the Manager. He is 43 years old and has been an employee of the Manager since April 1991.
ROBERT ROBOL, Assistant Treasurer since August 2005.
Senior Accounting Manager – Fixed Income Funds of the Manager, and an officer of 76 investment companies (comprised of 192 portfolios) managed by the Manager. He is 47 years old and has been an employee of the Manager since October 1988.
ROBERT SALVIOLO, Assistant Treasurer since July 2007.
Senior Accounting Manager – Equity Funds of the Manager, and an officer of 76 investment companies (comprised of 192 portfolios) managed by the Manager. He is 44 years old and has been an employee of the Manager since June 1989.
ROBERT SVAGNA, Assistant Treasurer since December 2002.
Senior Accounting Manager – Equity Funds of the Manager, and an officer of 76 investment companies (comprised of 192 portfolios) managed by the Manager. He is 44 years old and has been an employee of the Manager since November 1990.
36
JOSEPH W. CONNOLLY, Chief Compliance Officer since October 2004.
Chief Compliance Officer of the Manager and The Dreyfus Family of Funds (76 investment companies, comprised of 192 portfolios). From November 2001 through March 2004, Mr. Connolly was first Vice-President, Mutual Fund Servicing for Mellon Global Securities Services. In that capacity, Mr. Connolly was responsible for managing Mellon’s Custody, Fund Accounting and Fund Administration services to third-party mutual fund clients. He is 54 years old and has served in various capacities with the Manager since 1980, including manager of the firm’s Fund Accounting Department from 1997 through October 2001.
STEPHEN J. STOREN, Anti-Money Laundering Compliance Officer since May 2011.
Chief Compliance Officer of the Distributor, and the Anti-Money Laundering Compliance Officer of 72 investment companies (comprised of 188 portfolios) managed by the Manager. He is 56 years old and has been an employee of the Distributor since October 1999.
Ticker Symbol: DRELX
Telephone 1-800-DREYFUS
Mail The Dreyfus Family of Funds, 144 Glenn Curtiss Boulevard, Uniondale, NY 11556-0144 E-mail Send your request to info@dreyfus.com Internet Information can be viewed online or downloaded at: http://www.dreyfus.com
The fund files its complete schedule of portfolio holdings with the Securities and Exchange Commission (“SEC”) for the first and third quarters of each fiscal year on Form N-Q. The fund’s Forms N-Q are available on the SEC’s website at http://www.sec.gov and may be reviewed and copied at the SEC’s Public Reference Room in Washington, DC. Information on the operation of the Public Reference Room may be obtained by calling 1-800-SEC-0330.
A description of the policies and procedures that the fund uses to determine how to vote proxies relating to portfolio securities, and information regarding how the fund voted these proxies for the the most recent 12-month period ended June 30 is available at http://www.dreyfus.com and on the SEC’s website at http://www.sec.gov. The description of the policies and procedures is also available without charge, upon request, by calling 1-800-DREYFUS.

|
| Dreyfus |
| International |
| Value Fund |

Save time. Save paper. View your next shareholder report online as soon as it’s available. Log into www.dreyfus.com and sign up for Dreyfus eCommunications. It’s simple and only takes a few minutes.
The views expressed in this report reflect those of the portfolio manager only through the end of the period covered and do not necessarily represent the views of Dreyfus or any other person in the Dreyfus organization. Any such views are subject to change at any time based upon market or other conditions and Dreyfus disclaims any responsibility to update such views.These views may not be relied on as investment advice and, because investment decisions for a Dreyfus fund are based on numerous factors, may not be relied on as an indication of trading intent on behalf of any Dreyfus fund.
Not FDIC-Insured • Not Bank-Guaranteed • May Lose Value
| | Contents |
| | THE FUND |
| 2 | A Letter from the Chairman and CEO |
| 3 | Discussion of Fund Performance |
| 6 | Fund Performance |
| 8 | Understanding Your Fund’s Expenses |
| 8 | Comparing Your Fund’s Expenses With Those of Other Funds |
| 9 | Statement of Investments |
| 15 | Statement of Assets and Liabilities |
| 16 | Statement of Operations |
| 17 | Statement of Changes in Net Assets |
| 19 | Financial Highlights |
| 23 | Notes to Financial Statements |
| 35 | Report of Independent Registered Public Accounting Firm |
| 36 | Important Tax Information |
| 37 | Information About the Renewal of the Fund’s Management Agreement |
| 42 | Board Members Information |
| 44 | Officers of the Fund |
| | FOR MORE INFORMATION |
| | Back Cover |
Dreyfus
International Value Fund
The Fund

A LETTER FROM THE CHAIRMAN AND CEO
Dear Shareholder:
We are pleased to present this annual report for Dreyfus International Value Fund, covering the 12-month period from September 1, 2010, through August 31, 2011. For information about how the fund performed during the reporting period, as well as general market perspectives, we provide a Discussion of Fund Performance on the pages that follow.
Although stocks in some markets rallied strongly through the end of 2010 due to expectations of a more robust economic recovery, the reporting period ended amid broadly deteriorating investor sentiment due to disappointing global economic data, an escalating sovereign debt crisis in Europe and a contentious debate regarding taxes, spending and borrowing in the United States. In the final month of the reporting period, a major credit rating agency downgraded U.S. long-term debt, marking the first time in history that U.S.Treasury securities were not assigned the highest possible credit rating. Stocks in markets throughout the world proved volatile in this tumultuous environment, as the stalled U.S. and global economies caused many market sectors to give back a portion of the reporting period’s previous gains.
The global economic outlook currently is clouded by heightened market volatility and geopolitical instability, but we believe that a sustained, moderate global expansion is more likely than a double-dip recession. Inflationary pressures appear to be waning in most countries, including the United States, as energy prices have retreated from their highs.Various central banks have signaled their intention to maintain accommodative monetary policies, which may help offset the financial stresses expected from recent fiscal policy choices in the United States and Europe. To assess how these and other developments may affect your investments, we encourage you, as always, to speak with your financial advisor.
Thank you for your continued confidence and support.

Jonathan R. Baum
Chairman and Chief Executive Officer
The Dreyfus Corporation
September 15, 2011
2

DISCUSSION OF FUND PERFORMANCE
For the period of September 1, 2010, through August 31, 2011, as provided by D. Kirk Henry, Senior Portfolio Manager
Fund and Market Performance Overview
For the 12-month period ended August 31, 2011, Dreyfus International Value Fund’s Class A shares produced a total return of 4.32%, Class B shares returned 3.14%, Class C shares returned 3.48% and Class I shares returned 4.67%.1 In comparison, the fund’s benchmark, the Morgan Stanley Capital International Europe,Australasia, Far East Index (“MSCI EAFE Index”), produced a total return of 10.01% for the same period.2
Strong corporate earnings buoyed international stocks over the reporting period’s first half, but macroeconomic challenges later erased many of those gains.The fund produced lower returns than its benchmark, as the valuation factors considered by our investment process fell out of favor among investors.
The Fund’s Investment Approach
The fund seeks long-term capital growth.The fund ordinarily invests most of its assets in securities of foreign companies which Dreyfus considers to be value companies.
The fund’s investment approach is value-oriented and research-driven. In selecting stocks, we attempt to identify potential investments through extensive quantitative and fundamental research. Emphasizing individual stock selection over economic or industry trends, the fund focuses on three key factors: value, or how a stock is valued relative to its intrinsic worth based on traditional value measures; business health, or overall efficiency and profitability as measured by return on assets and return on equity; and business momentum, or the presence of a catalyst (such as corporate restructuring, change in management or spin-off) that will trigger a price increase near term to midterm.
The fund typically sells a stock when it is no longer considered a value company, appears less likely to benefit from the current market and economic environment, shows deteriorating fundamentals or declining momentum, or falls short of our expectations.
Macroeconomic Developments Challenged Global Markets
Expectations of continued global economic recovery prevailed through the first quarter of 2011, supporting investor sentiment and earnings of
DISCUSSION OF FUND PERFORMANCE (continued)
international companies.While global markets continued to advance during the spring of 2011, investors grew concerned about several economic challenges, including a sovereign debt crisis in Europe, inflationary pressures in China and rising energy prices stemming from political unrest in the Middle East. In March, catastrophic natural and nuclear disasters struck Japan, causing disruptions in the global industrial supply chain. However, most equity markets rebounded quickly, and the MSCI EAFE Index hit new highs for the reporting period in April.
By May, investor sentiment began to deteriorate in earnest. U.S. economic growth proved more sluggish than expected, and investors worried about a contentious debate regarding government spending and borrowing. In Europe, the debt problems facing Ireland, Portugal, Spain and Italy intensified, and Greece faced the possibility of default. Consequently, international markets lost much of the ground they had gained earlier.
Valuation Criteria Fell Out of Favor
Companies that met near-term expectations tended to hold up well in this environment, but those that fell short were punished, often regardless of attractive valuations and longer-term fundamental strengths. In Hong Kong, apparel retailer Esprit Holdings suffered amid slower economic growth in European markets despite apparent progress in engineering a turnaround. German electric utilities RWE and E.ON were hurt by the government’s decision to phase out nuclear power, and the fund did not own some of the German carmakers that captured market share from idled Japanese companies. Some metals-and-mining companies in Australia buoyed the benchmark’s return but did not meet our investment criteria. A number of French financial companies struggled with exposure to the troubled debt of nearby nations, and food retailer Carrefour encountered competitive pressures. In Japan, technology companies Ricoh, Fujitsu and NEC were hurt by earthquake-related disruptions, while Nintendo encountered disappointing sales of a new gaming product. U.K. catalog retailer Home Retail Group and the Netherlands’ Koninklijke Philips Electronics also detracted from relative performance.
The fund achieved better results through lack of exposure to Greece and an underweighted position in Spain. In Norway, aluminum producer Norsk Hydro benefited from rising commodity prices. Financial institutions in Singapore, including DBS Group Holdings and United Overseas Bank, proved well positioned to finance the region’s growth.
4
U.K. insurance company Resolution also fared relatively well.The health care sector benefited as investors turned to traditionally defensive market sectors, bolstering pharmaceutical developers Sanofi, Roche Holding and Novartis. Finally, Japanese telecommunications firm KDDI climbed on the strength of a recent corporate restructuring and stock repurchase program.
Identifying Opportunities Despite Global Challenges
Although we expect the global recovery to persist, current challenges could affect some regions and industry groups more than others.We have found few opportunities among financial companies in the European Union, but some in Japan and the United Kingdom look more attractive to us.We also have identified what we believe to be compelling values among consumer discretionary companies, and we have continued to seek growth opportunities in the health care sector.
September 15, 2011
| |
| | Please note, the position in any security highlighted with italicized typeface was sold during the |
| | reporting period. |
| | Equity funds are subject generally to market, market sector, market liquidity, issuer and investment |
| | style risks, among other factors, to varying degrees, all of which are more fully described in the |
| | fund’s prospectus. |
| | The fund’s performance will be influenced by political, social and economic factors affecting |
| | investments in foreign companies. Special risks associated with investments in foreign companies |
| | include exposure to currency fluctuations, less liquidity, less developed or less efficient trading |
| | markets, lack of comprehensive company information, political instability and differing auditing |
| | and legal standards.These risks are enhanced in emerging market countries. Please read the |
| | prospectus for further discussion of these risks. |
| 1 | Total return includes reinvestment of dividends and any capital gains paid, and does not take into |
| | consideration the maximum initial sales charge in the case of Class A shares, or the applicable |
| | contingent deferred sales charges imposed on redemptions in the case of Class B and Class C |
| | shares. Had these charges been reflected, returns would have been lower. Past performance is no |
| | guarantee of future results. Share price, yield and investment return fluctuate such that upon |
| | redemption, fund shares may be worth more or less than their original cost.The fund’s returns reflect |
| | the absorption of certain fund expenses by The Dreyfus Corporation pursuant to an agreement in |
| | effect through January 1, 2012, at which time it may be extended, terminated or modified. Had |
| | these expenses not been absorbed, the fund’s returns would have been lower. |
| 2 | SOURCE: LIPPER INC. — Reflects reinvestment of net dividends and, where applicable, |
| | capital gain distributions.The Morgan Stanley Capital International Europe,Australasia, Far East |
| | (MSCI EAFE) Index is an unmanaged index composed of a sample of companies representative |
| | of the market structure of European and Pacific Basin countries.The Index does not take into |
| | account fees and expenses to which the fund is subject. Investors cannot invest directly in any index. |
FUND PERFORMANCE
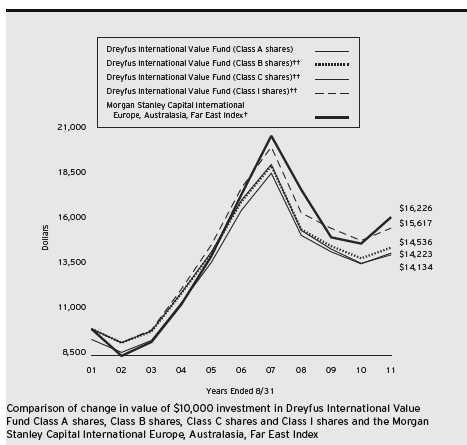
| |
| † | Source: Lipper Inc. |
| †† | The total return figures presented for Class B and Class C shares of the fund reflect the performance of the fund’s |
| | Class A shares for the period prior to November 15, 2002 (the inception date for Class B and Class C shares |
| | respectively), adjusted to reflect the applicable sales load for each share class. The total return figures presented for |
| | Class I shares of the fund reflect the performance of the fund’s Class A shares for the period prior to November 15, |
| | 2002 (the inception date for Class I shares). |
| Past performance is not predictive of future performance. |
| The above graph compares a $10,000 investment made in each of the Class A, Class B, Class C and Class I shares of |
| Dreyfus International Value Fund on 8/31/01 to a $10,000 investment made in the Morgan Stanley Capital |
| International Europe,Australasia, Far East Index (the “Index”) on that date.All dividends and capital gain |
| distributions are reinvested. |
| The fund’s performance shown in the line graph above takes into account the maximum initial sales charge on Class A |
| shares and all other applicable fees and expenses on all classes. Performance for Class B shares assumes the conversion of |
| Class B shares to Class A shares at the end of the sixth year following the date of purchase.The Index is an unmanaged |
| index composed of a sample of companies representative of the market structure of European and Pacific Basin countries. |
| Unlike a mutual fund, the Index is not subject to charges, fees and other expenses. Investors cannot invest directly in any |
| index. Further information relating to fund performance, including expense reimbursements, if applicable, is contained in |
| the Financial Highlights section of the prospectus and elsewhere in this report. |
6
| | | | | | | |
| Average Annual Total Returns as of 8/31/11 | | | |
| |
| Inception |
| | Date | 1Year | 5 Years | 10 Years |
| Class A shares | | | | |
| with maximum sales charge (5.75%) | 9/29/95 | –1.65% | –4.19% | 3.59% |
| without sales charge | 9/29/95 | 4.32% | –3.05% | 4.20% |
| Class B shares | | | | |
| with applicable redemption charge † | 11/15/02 | –0.86% | –4.17% | 3.81%††† |
| without redemption | 11/15/02 | 3.14% | –3.92% | 3.81%††† |
| Class C shares | | | | |
| with applicable redemption charge †† | 11/15/02 | 2.48% | –3.80% | 3.52%††† |
| without redemption | 11/15/02 | 3.48% | –3.80% | 3.52%††† |
| Class I shares | 11/15/02 | 4.67% | –2.62% | 4.56%††† |
| Morgan Stanley Capital | | | | |
| International Europe, | | | | |
| Australasia, Far East Index | | 10.01% | –1.48% | 4.96% |
| |
| Past performance is not predictive of future performance.The fund’s performance shown in the graph and table does not |
| reflect the deduction of taxes that a shareholder would pay on fund distributions or the redemption of fund shares. |
| † | The maximum contingent deferred sales charge for Class B shares is 4%.After six years Class B shares convert to |
| | Class A shares. |
| †† | The maximum contingent deferred sales charge for Class C shares is 1% for shares redeemed within one year of the |
| | date of purchase. |
| ††† | The total return performance figures presented for Class B and Class C shares of the fund reflect the performance of |
| | the fund’s Class A shares for the period prior to November 15, 2002 (the inception date for Class B and Class C |
| | shares respectively), adjusted to reflect the applicable sales load for each share class.The total return performance |
| | figures presented for Class I shares of the fund reflect the performance of the fund’s Class A shares for the period |
| | prior to November 15, 2002 (the inception date for Class I shares). |
UNDERSTANDING YOUR FUND’S EXPENSES (Unaudited)
As a mutual fund investor, you pay ongoing expenses, such as management fees and other expenses. Using the information below, you can estimate how these expenses affect your investment and compare them with the expenses of other funds.You also may pay one-time transaction expenses, including sales charges (loads) and redemption fees, which are not shown in this section and would have resulted in higher total expenses. For more information, see your fund’s prospectus or talk to your financial adviser.
Review your fund’s expenses
The table below shows the expenses you would have paid on a $1,000 investment in Dreyfus International Value Fund from March 1, 2011 to August 31, 2011. It also shows how much a $1,000 investment would be worth at the close of the period, assuming actual returns and expenses.
| | | | | | | | |
| Expenses and Value of a $1,000 Investment | | | | | | |
| assuming actual returns for the six months ended August 31, 2011 | | | | |
| | | Class A | | Class B | | Class C | | Class I |
| Expenses paid per $1,000† | $ | 6.82 | $ | 12.63 | $ | 10.31 | $ | 4.91 |
| Ending value (after expenses) | $ | 853.80 | $ | 848.30 | $ | 850.30 | $ | 855.00 |
|
| COMPARING YOUR FUND’S EXPENSES |
| WITH THOSE OF OTHER FUNDS (Unaudited) |
Using the SEC’s method to compare expenses
The Securities and Exchange Commission (SEC) has established guidelines to help investors assess fund expenses. Per these guidelines, the table below shows your fund’s expenses based on a $1,000 investment, assuming a hypothetical 5% annualized return. You can use this information to compare the ongoing expenses (but not transaction expenses or total cost) of investing in the fund with those of other funds.All mutual fund shareholder reports will provide this information to help you make this comparison. Please note that you cannot use this information to estimate your actual ending account balance and expenses paid during the period.
| | | | | | | | |
| Expenses and Value of a $1,000 Investment | | | | | | |
| assuming a hypothetical 5% annualized return for the six months ended August 31, 2011 |
| | | Class A | | Class B | | Class C | | Class I |
| Expenses paid per $1,000† | $ | 7.43 | $ | 13.74 | $ | 11.22 | $ | 5.35 |
| Ending value (after expenses) | $ | 1017.85 | $ | 1,011.54 | $ | 1,014.06 | $ | 1,019.91 |
|
| † Expenses are equal to the fund’s annualized expense ratio of 1.46% for Class A, 2.71% for Class B, 2.21% for |
| Class C and 1.05% for Class I, multiplied by the average account value over the period, multiplied by 184/365 (to |
| reflect the one-half year period). |
8
|
| STATEMENT OF INVESTMENTS |
| August 31, 2011 |
| | | |
| Common Stocks—98.3% | Shares | Value ($) |
| Australia—5.1% | | |
| Billabong International | 169,170 | 622,068 |
| BlueScope Steel | 484,227 | 424,443 |
| National Australia Bank | 100,780 | 2,555,320 |
| Nufarm | 237,772a | 973,455 |
| Primary Health Care | 465,518 | 1,542,604 |
| Qantas Airways | 353,980a | 594,066 |
| QBE Insurance Group | 162,120 | 2,446,964 |
| Toll Holdings | 251,139 | 1,302,003 |
| | | 10,460,923 |
| Belgium—.3% | | |
| Delhaize Group | 10,780 | 722,858 |
| Brazil—1.9% | | |
| Banco Santander Brasil, ADS | 134,120 | 1,290,234 |
| Petroleo Brasileiro, ADR | 50,900 | 1,478,645 |
| Tele Norte Leste Participacoes, ADR | 90,050 | 1,179,655 |
| | | 3,948,534 |
| China—2.9% | | |
| Beijing Capital International Airport, Cl. H | 1,952,000 | 932,646 |
| China Dongxiang Group | 3,151,000 | 708,240 |
| China Railway Group, Cl. H | 1,814,000 | 521,890 |
| Foxconn International Holdings | 1,910,000a | 949,376 |
| Guangzhou Automobile Group, Cl. H | 864,194 | 935,692 |
| Huaneng Power International, ADR | 8,590 | 168,020 |
| Huaneng Power International, Cl. H | 1,714,000 | 840,946 |
| PetroChina, ADR | 7,931 | 1,019,134 |
| | | 6,075,944 |
| Finland—1.6% | | |
| Nokia | 513,250 | 3,317,759 |
| France—11.9% | | |
| Alstom | 35,540 | 1,650,287 |
| Carrefour | 106,950 | 2,851,426 |
| Credit Agricole | 111,440 | 1,091,924 |
| EDF | 46,910 | 1,436,667 |
| France Telecom | 135,785 | 2,594,220 |
| GDF Suez | 56,920 | 1,795,154 |
STATEMENT OF INVESTMENTS (continued)
| | | |
| Common Stocks (continued) | Shares | Value ($) |
| France (continued) | | |
| Lagardere | 17,140 | 586,114 |
| Sanofi | 54,681 | 3,979,285 |
| Societe Generale | 50,934 | 1,709,165 |
| Total | 93,490 | 4,565,450 |
| Vivendi | 96,732 | 2,357,368 |
| | | 24,617,060 |
| Germany—7.6% | | |
| Aixtron | 26,460 | 593,140 |
| Allianz | 14,810 | 1,526,017 |
| Bayer | 27,730 | 1,788,146 |
| Celesio | 48,640 | 809,805 |
| Commerzbank | 500,010a | 1,486,081 |
| Daimler | 21,926 | 1,186,475 |
| Deutsche Bank | 31,420 | 1,274,827 |
| Deutsche Telekom | 94,850 | 1,199,829 |
| E.ON | 164,740 | 3,610,062 |
| Muenchener Rueckversicherungs | 9,390 | 1,225,715 |
| RWE | 25,024 | 940,009 |
| | | 15,640,106 |
| Hong Kong—3.7% | | |
| China Mobile, ADR | 16,530 | 845,840 |
| Esprit Holdings | 1,379,370 | 3,871,027 |
| Hang Seng Bank | 156,700 | 2,308,481 |
| Pacific Basin Shipping | 1,329,000 | 643,517 |
| | | 7,668,865 |
| India—.6% | | |
| Reliance Industries, GDR | 36,794b | 1,274,176 |
| Israel—1.8% | | |
| Teva Pharmaceutical Industries, ADR | 91,790 | 3,796,434 |
| Italy—3.2% | | |
| Banco Popolare | 82,490 | 141,485 |
| Buzzi Unicem | 27,120a | 271,925 |
| ENI | 46,395 | 933,045 |
| Finmeccanica | 201,746 | 1,501,198 |
10
| | | |
| Common Stocks (continued) | Shares | Value ($) |
| Italy (continued) | | |
| Saras | 1,657,310a | 3,013,984 |
| Unipol Gruppo Finanziario | 1,472,794a | 704,091 |
| | | 6,565,728 |
| Japan—21.4% | | |
| Astellas Pharma | 26,700 | 1,003,560 |
| East Japan Railway | 33,100 | 1,977,700 |
| Fujitsu | 206,000 | 1,038,475 |
| INPEX | 216 | 1,452,788 |
| Kao | 57,200 | 1,512,733 |
| Kirin Holdings | 66,000 | 874,024 |
| Matsumotokiyoshi Holdings | 62,000 | 1,262,348 |
| Medipal Holdings | 192,600 | 1,770,803 |
| Mitsubishi UFJ Financial Group | 669,900 | 3,009,607 |
| NEC | 254,000a | 517,487 |
| Nintendo | 3,870 | 677,263 |
| Nippon Express | 276,000 | 1,149,850 |
| Nomura Holdings | 200,400 | 840,125 |
| Panasonic | 189,700 | 2,004,275 |
| Ricoh | 232,800 | 2,097,845 |
| Sekisui House | 112,000 | 1,003,422 |
| Seven & I Holdings | 55,700 | 1,467,972 |
| Shimachu | 25,000 | 582,147 |
| Shimizu | 219,000 | 978,164 |
| Shin-Etsu Chemical | 46,920 | 2,359,175 |
| Sumitomo Mitsui Financial Group | 93,200 | 2,744,756 |
| Sumitomo Mitsui Trust Holdings | 353,560 | 1,191,308 |
| Taiyo Nippon Sanso | 283,000 | 2,095,612 |
| Tokyo Electron | 33,500 | 1,599,092 |
| Tokyo Gas | 229,000 | 1,049,745 |
| Tokyo Steel Manufacturing | 243,800 | 2,298,859 |
| Toyoda Gosei | 71,400 | 1,279,363 |
| Toyota Motor | 93,000 | 3,320,648 |
| Yamada Denki | 13,850 | 1,011,121 |
| | | 44,170,267 |
STATEMENT OF INVESTMENTS (continued)
| | | |
| Common Stocks (continued) | Shares | Value ($) |
| Netherlands—3.5% | | |
| Aegon | 272,135a | 1,224,361 |
| Heineken | 9,780 | 489,534 |
| Koninklijke Philips Electronics | 156,429 | 3,309,965 |
| Royal Dutch Shell, Cl. A | 66,285 | 2,216,673 |
| | | 7,240,533 |
| Norway—.3% | | |
| Norsk Hydro | 114,408 | 698,488 |
| Russia—.2% | | |
| Gazprom, ADR | 24,600 | 306,270 |
| Singapore—2.1% | | |
| DBS Group Holdings | 265,539 | 2,921,524 |
| United Overseas Bank | 88,654 | 1,365,550 |
| | | 4,287,074 |
| South Africa—1.0% | | |
| Murray & Roberts Holdings | 183,040 | 727,868 |
| Standard Bank Group | 94,340 | 1,346,269 |
| | | 2,074,137 |
| South Korea—2.0% | | |
| KB Financial Group, ADR | 17,434 | 719,676 |
| Korea Electric Power | 22,710a | 480,021 |
| Korea Electric Power, ADR | 57,744a | 606,889 |
| Korea Exchange Bank | 184,150 | 1,392,970 |
| KT, ADR | 19,520 | 333,597 |
| SK Telecom, ADR | 36,310 | 583,865 |
| | | 4,117,018 |
| Spain—1.3% | | |
| Banco Bilbao Vizcaya Argentaria | 149,664 | 1,362,614 |
| Gamesa Corp Tecnologica | 208,202 | 1,258,232 |
| | | 2,620,846 |
| Sweden—3.4% | | |
| Husqvarna, Cl. B | 191,560 | 1,001,374 |
12
| | | |
| Common Stocks (continued) | Shares | Value ($) |
| Sweden (continued) | | |
| Investor, Cl. B | 55,370 | 1,091,422 |
| Svenska Cellulosa, Cl. B | 137,580 | 1,856,023 |
| Telefonaktiebolaget LM Ericsson, Cl. B | 277,920 | 3,135,721 |
| | | 7,084,540 |
| Switzerland—6.9% | | |
| Adecco | 22,880a | 1,068,405 |
| Lonza Group | 18,540a | 1,220,509 |
| Novartis | 76,186 | 4,442,489 |
| Roche Holding | 27,190 | 4,760,823 |
| UBS | 185,338a | 2,683,991 |
| | | 14,176,217 |
| Taiwan—.4% | | |
| United Microelectronics | 2,234,720 | 870,485 |
| United Kingdom—15.2% | | |
| Anglo American | 57,193 | 2,383,699 |
| BAE Systems | 311,409 | 1,391,668 |
| BP | 566,393 | 3,700,223 |
| easyJet | 105,840a | 589,995 |
| Home Retail Group | 956,458 | 1,979,585 |
| HSBC Holdings | 673,094 | 5,863,063 |
| Lonmin | 114,113 | 2,432,193 |
| QinetiQ Group | 318,490 | 641,602 |
| Reed Elsevier | 102,346 | 835,674 |
| Resolution | 306,491 | 1,325,410 |
| Royal Dutch Shell, Cl. A | 58,719 | 1,968,325 |
| Tesco | 447,713 | 2,751,557 |
| Unilever | 113,132 | 3,790,472 |
| Vodafone Group | 666,468 | 1,741,820 |
| | | 31,395,286 |
| Total Common Stocks | | |
| (cost $254,693,479) | | 203,129,548 |
STATEMENT OF INVESTMENTS (continued)
| | | |
| Other Investment—.5% | Shares | Value ($) |
| Registered Investment Company; | | |
| Dreyfus Institutional Preferred Plus Money Market Fund | | |
| (cost $1,100,000) | 1,100,000c | 1,100,000 |
| |
| Total Investments (cost $255,793,479) | 98.8% | 204,229,548 |
| Cash and Receivables (Net) | 1.2% | 2,424,697 |
| Net Assets | 100.0% | 206,654,245 |
|
| ADR—American Depository Receipts |
| ADS—American Depository Shares |
| GDR—Global Depository Receipts |
| a Non-income producing security. |
| b Security exempt from registration under Rule 144A of the Securities Act of 1933.This security may be resold in |
| transactions exempt from registration, normally to qualified institutional buyers.At August 31, 2011, this security |
| was valued at $1,274,176 or .6% of net assets. |
| c Investment in affiliated money market mutual fund. |
| | | |
| Portfolio Summary (Unaudited)† | | |
| |
| | Value (%) | | Value (%) |
| Financial | 22.7 | Materials | 7.6 |
| Health Care | 12.1 | Information Technology | 7.2 |
| Consumer Discretionary | 11.3 | Utilities | 5.3 |
| Energy | 10.6 | Telecommunication Services | 4.1 |
| Industrial | 9.8 | Money Market Investment | .5 |
| Consumer Staples | 7.6 | | 98.8 |
| |
| † Based on net assets. | | | |
| See notes to financial statements. | | | |
14
|
| STATEMENT OF ASSETS AND LIABILITIES |
| August 31, 2011 |
| | | | | |
| | | | Cost | Value |
| Assets ($): | | | | |
| Investments in securities—See Statement of Investments: | | | |
| Unaffiliated issuers | | | 254,693,479 | 203,129,548 |
| Affiliated issuers | | | 1,100,000 | 1,100,000 |
| Cash | | | | 369,859 |
| Cash denominated in foreign currencies | | 848,156 | 848,549 |
| Receivable for investment securities sold | | | 956,551 |
| Dividends and interest receivable | | | | 955,314 |
| Receivable for shares of Common Stock subscribed | | | 65,310 |
| Prepaid expenses | | | | 18,781 |
| | | | | 207,443,912 |
| Liabilities ($): | | | | |
| Due to The Dreyfus Corporation and affiliates—Note 3(c) | | | 234,051 |
| Payable for investment securities purchased | | | 326,256 |
| Payable for shares of Common Stock redeemed | | | 113,441 |
| Unrealized depreciation on forward foreign | | | |
| currency exchange contracts—Note 4 | | | 621 |
| Accrued expenses | | | | 115,298 |
| | | | | 789,667 |
| Net Assets ($) | | | | 206,654,245 |
| Composition of Net Assets ($): | | | | |
| Paid-in capital | | | | 323,187,719 |
| Accumulated undistributed investment income—net | | | 5,768,709 |
| Accumulated net realized gain (loss) on investments | | | (70,783,475) |
| Accumulated net unrealized appreciation (depreciation) | | | |
| on investments and foreign currency transactions | | | (51,518,708) |
| Net Assets ($) | | | | 206,654,245 |
| |
| |
| Net Asset Value Per Share | | | | |
| | Class A | Class B | Class C | Class I |
| Net Assets ($) | 102,605,503 | 477,724 | 11,572,626 | 91,998,392 |
| Shares Outstanding | 9,599,987 | 45,450 | 1,100,912 | 8,618,934 |
| Net Asset Value Per Share ($) | 10.69 | 10.51 | 10.51 | 10.67 |
| |
| See notes to financial statements. | | | | |
|
| STATEMENT OF OPERATIONS |
| Year Ended August 31, 2011 |
| | |
| Investment Income ($): | |
| Income: | |
| Cash dividends (net of $817,888 foreign taxes withheld at source): | |
| Unaffiliated issuers | 8,492,801 |
| Affiliated issuers | 6,971 |
| Interest | 1,761 |
| Total Income | 8,501,533 |
| Expenses: | |
| Management fee—Note 3(a) | 2,591,312 |
| Shareholder servicing costs—Note 3(c) | 581,443 |
| Custodian fees—Note 3(c) | 134,338 |
| Distribution fees—Note 3(b) | 120,659 |
| Professional fees | 65,468 |
| Registration fees | 59,864 |
| Prospectus and shareholders’ reports | 14,679 |
| Directors’ fees and expenses—Note 3(d) | 14,373 |
| Interest expense—Note 2 | 5,471 |
| Loan commitment fees—Note 2 | 3,494 |
| Miscellaneous | 36,447 |
| Total Expenses | 3,627,548 |
| Less—reduction in management fee due to undertaking—Note 3(a) | (126,749) |
| Less—reduction in fees due to earnings credits—Note 3(c) | (232) |
| Net Expenses | 3,500,567 |
| Investment Income—Net | 5,000,966 |
| Realized and Unrealized Gain (Loss) on Investments—Note 4 ($): | |
| Net realized gain (loss) on investments and foreign currency transactions | 24,284,735 |
| Net realized gain (loss) on forward foreign currency exchange contracts | 17,667 |
| Net Realized Gain (Loss) | 24,302,402 |
| Net unrealized appreciation (depreciation) on | |
| investments and foreign currency transactions | (17,597,496) |
| Net unrealized appreciation (depreciation) on | |
| forward foreign currency exchange contracts | (3,552) |
| Net Unrealized Appreciation (Depreciation) | (17,601,048) |
| Net Realized and Unrealized Gain (Loss) on Investments | 6,701,354 |
| Net Increase in Net Assets Resulting from Operations | 11,702,320 |
| See notes to financial statements. | |
16
STATEMENT OF CHANGES IN NET ASSETS
| | | | |
| | Year Ended August 31, |
| | 2011 | 2010 |
| Operations ($): | | |
| Investment income—net | 5,000,966 | 3,399,155 |
| Net realized gain (loss) on investments | 24,302,402 | 5,619,024 |
| Net unrealized appreciation | | |
| (depreciation) on investments | (17,601,048) | (20,728,637) |
| Net Increase (Decrease) in Net Assets | | |
| Resulting from Operations | 11,702,320 | (11,710,458) |
| Dividends to Shareholders from ($): | | |
| Investment income—net: | | |
| Class A Shares | (1,435,975) | (2,038,164) |
| Class B Shares | — | (1,623) |
| Class C Shares | (49,595) | (101,287) |
| Class I Shares | (1,769,232) | (1,116,415) |
| Total Dividends | (3,254,802) | (3,257,489) |
| Capital Stock Transactions ($): | | |
| Net proceeds from shares sold: | | |
| Class A Shares | 16,430,509 | 22,461,132 |
| Class B Shares | 66,687 | 80,494 |
| Class C Shares | 421,682 | 1,204,094 |
| Class I Shares | 50,489,524 | 70,574,876 |
| Dividends reinvested: | | |
| Class A Shares | 1,362,852 | 1,813,960 |
| Class B Shares | — | 1,277 |
| Class C Shares | 24,457 | 49,720 |
| Class I Shares | 1,536,803 | 930,477 |
| Cost of shares redeemed: | | |
| Class A Shares | (32,734,376) | (64,561,481) |
| Class B Shares | (2,141,296) | (3,131,940) |
| Class C Shares | (4,311,644) | (4,331,776) |
| Class I Shares | (59,952,698) | (7,831,530) |
| Increase (Decrease) in Net Assets | | |
| from Capital Stock Transactions | (28,807,500) | 17,259,303 |
| Total Increase (Decrease) in Net Assets | (20,359,982) | 2,291,356 |
| Net Assets ($): | | |
| Beginning of Period | 227,014,227 | 224,722,871 |
| End of Period | 206,654,245 | 227,014,227 |
| Undistributed investment income—net | 5,768,709 | 3,116,352 |
STATEMENT OF CHANGES IN NET ASSETS (continued)
| | | | |
| | Year Ended August 31, |
| | 2011 | 2010 |
| Capital Share Transactions: | | |
| Class Aa | | |
| Shares sold | 1,392,368 | 1,975,937 |
| Shares issued for dividends reinvested | 119,339 | 156,773 |
| Shares redeemed | (2,777,334) | (5,713,158) |
| Net Increase (Decrease) in Shares Outstanding | (1,265,627) | (3,580,448) |
| Class Ba | | |
| Shares sold | 5,686 | 7,049 |
| Shares issued for dividends reinvested | — | 112 |
| Shares redeemed | (182,585) | (285,227) |
| Net Increase (Decrease) in Shares Outstanding | (176,899) | (278,066) |
| Class C | | |
| Shares sold | 35,827 | 106,222 |
| Shares issued for dividends reinvested | 2,166 | 4,346 |
| Shares redeemed | (369,728) | (395,024) |
| Net Increase (Decrease) in Shares Outstanding | (331,735) | (284,456) |
| Class I | | |
| Shares sold | 4,200,758 | 6,261,787 |
| Shares issued for dividends reinvested | 135,164 | 80,701 |
| Shares redeemed | (5,117,980) | (704,712) |
| Net Increase (Decrease) in Shares Outstanding | (782,058) | 5,637,776 |
|
| a During the period ended August 31, 2011, 74,673 Class B shares representing $882,387 were automatically |
| converted to 73,675 Class A shares and during the period ended August 31, 2010, 110,793 Class B shares |
| representing $1,217,242 were automatically converted to 108,816 Class A shares. |
See notes to financial statements.
18
FINANCIAL HIGHLIGHTS
The following tables describe the performance for each share class for the fiscal periods indicated.All information (except portfolio turnover rate) reflects financial results for a single fund share.Total return shows how much your investment in the fund would have increased (or decreased) during each period, assuming you had reinvested all dividends and distributions.These figures have been derived from the fund’s financial statements.
| | | | | | | | | | |
| | | Year Ended August 31, | |
| Class A Shares | 2011 | 2010 | 2009 | 2008 | 2007 |
| Per Share Data ($): | | | | | |
| Net asset value, beginning of period | 10.37 | 11.02 | 12.30 | 20.21 | 20.91 |
| Investment Operations: | | | | | |
| Investment income—neta | .20 | .15 | .15 | .27 | .23 |
| Net realized and unrealized | | | | | |
| gain (loss) on investments | .26 | (.65) | (1.01) | (2.93) | 2.25 |
| Total from Investment Operations | .46 | (.50) | (.86) | (2.66) | 2.48 |
| Distributions: | | | | | |
| Dividends from investment income—net | (.14) | (.15) | (.42) | (.32) | (.33) |
| Dividends from net realized | | | | | |
| gain on investments | — | — | — | (4.93) | (2.85) |
| Total Distributions | (.14) | (.15) | (.42) | (5.25) | (3.18) |
| Net asset value, end of period | 10.69 | 10.37 | 11.02 | 12.30 | 20.21 |
| Total Return (%)b | 4.32 | (4.66) | (5.97) | (18.56) | 12.47 |
| Ratios/Supplemental Data (%): | | | | | |
| Ratio of total expenses | | | | | |
| to average net assets | 1.54 | 1.54 | 1.84 | 1.57 | 1.52 |
| Ratio of net expenses | | | | | |
| to average net assets | 1.49 | 1.54 | 1.84 | 1.56 | 1.52 |
| Ratio of net investment income | | | | | |
| to average net assets | 1.70 | 1.29 | 1.66 | 1.71 | 1.11 |
| Portfolio Turnover Rate | 60.72 | 55.35 | 69.63 | 46.96 | 61.70 |
| Net Assets, end of period ($ x 1,000) | 102,606 | 112,716 | 159,260 | 228,308 | 498,696 |
| |
| a | Based on average shares outstanding at each month end. |
| b | Exclusive of sales charge. |
See notes to financial statements.
FINANCIAL HIGHLIGHTS (continued)
| | | | | | | | | | |
| | | Year Ended August 31, | |
| Class B Shares | 2011 | 2010 | 2009 | 2008 | 2007 |
| Per Share Data ($): | | | | | |
| Net asset value, beginning of period | 10.19 | 10.78 | 11.93 | 19.72 | 20.46 |
| Investment Operations: | | | | | |
| Investment income—neta | .04 | .05 | .06 | .12 | .07 |
| Net realized and unrealized | | | | | |
| gain (loss) on investments | .28 | (.64) | (.96) | (2.82) | 2.21 |
| Total from Investment Operations | .32 | (.59) | (.90) | (2.70) | 2.28 |
| Distributions: | | | | | |
| Dividends from investment income—net | (.00)b | (.00)b | (.25) | (.16) | (.17) |
| Dividends from net realized | | | | | |
| gain on investments | — | — | — | (4.93) | (2.85) |
| Total Distributions | (.00)b | (.00)b | (.25) | (5.09) | (3.02) |
| Net asset value, end of period | 10.51 | 10.19 | 10.78 | 11.93 | 19.72 |
| Total Return (%)c | 3.14 | (5.44) | (6.96) | (19.20) | 11.65 |
| Ratios/Supplemental Data (%): | | | | | |
| Ratio of total expenses | | | | | |
| to average net assets | 2.50 | 2.35 | 2.81 | 2.40 | 2.27 |
| Ratio of net expenses | | | | | |
| to average net assets | 2.47 | 2.35 | 2.81 | 2.39 | 2.27 |
| Ratio of net investment income | | | | | |
| to average net assets | .32 | .41 | .69 | .82 | .35 |
| Portfolio Turnover Rate | 60.72 | 55.35 | 69.63 | 46.96 | 61.70 |
| Net Assets, end of period ($ x 1,000) | 478 | 2,265 | 5,395 | 9,325 | 20,597 |
| |
| a | Based on average shares outstanding at each month end. |
| b | Amount represents less than $.01 per share. |
| c | Exclusive of sales charge. |
See notes to financial statements.
20
| | | | | | | | | | |
| | | Year Ended August 31, | |
| Class C Shares | 2011 | 2010 | 2009 | 2008 | 2007 |
| Per Share Data ($): | | | | | |
| Net asset value, beginning of period | 10.19 | 10.84 | 11.98 | 19.79 | 20.52 |
| Investment Operations: | | | | | |
| Investment income—neta | .11 | .06 | .08 | .14 | .08 |
| Net realized and unrealized | | | | | |
| gain (loss) on investments | .25 | (.65) | (.96) | (2.85) | 2.21 |
| Total from Investment Operations | .36 | (.59) | (.88) | (2.71) | 2.29 |
| Distributions: | | | | | |
| Dividends from investment income—net | (.04) | (.06) | (.26) | (.17) | (.17) |
| Dividends from net realized | | | | | |
| gain on investments | — | — | — | (4.93) | (2.85) |
| Total Distributions | (.04) | (.06) | (.26) | (5.10) | (3.02) |
| Net asset value, end of period | 10.51 | 10.19 | 10.84 | 11.98 | 19.79 |
| Total Return (%)b | 3.48 | (5.49) | (6.71) | (19.16) | 11.71 |
| Ratios/Supplemental Data (%): | | | | | |
| Ratio of total expenses | | | | | |
| to average net assets | 2.31 | 2.33 | 2.63 | 2.32 | 2.22 |
| Ratio of net expenses | | | | | |
| to average net assets | 2.26 | 2.33 | 2.63 | 2.32 | 2.22 |
| Ratio of net investment income | | | | | |
| to average net assets | .91 | .56 | .87 | .91 | .40 |
| Portfolio Turnover Rate | 60.72 | 55.35 | 69.63 | 46.96 | 61.70 |
| Net Assets, end of period ($ x 1,000) | 11,573 | 14,604 | 18,607 | 30,965 | 65,715 |
| |
| a | Based on average shares outstanding at each month end. |
| b | Exclusive of sales charge. |
See notes to financial statements.
FINANCIAL HIGHLIGHTS (continued)
| | | | | | | | | | |
| | | Year Ended August 31, | |
| Class I Shares | 2011 | 2010 | 2009 | 2008 | 2007a |
| Per Share Data ($): | | | | | |
| Net asset value, beginning of period | 10.36 | 11.02 | 12.31 | 20.27 | 20.96 |
| Investment Operations: | | | | | |
| Investment income—netb | .28 | .22 | .19 | .34 | .28 |
| Net realized and unrealized | | | | | |
| gain (loss) on investments | .22 | (.68) | (.98) | (2.93) | 2.28 |
| Total from Investment Operations | .50 | (.46) | (.79) | (2.59) | 2.56 |
| Distributions: | | | | | |
| Dividends from investment income—net | (.19) | (.20) | (.50) | (.44) | (.40) |
| Dividends from net realized | | | | | |
| gain on investments | — | — | — | (4.93) | (2.85) |
| Total Distributions | (.19) | (.20) | (.50) | (5.37) | (3.25) |
| Net asset value, end of period | 10.67 | 10.36 | 11.02 | 12.31 | 20.27 |
| Total Return (%) | 4.67 | (4.37) | (5.21) | (18.25) | 12.91 |
| Ratios/Supplemental Data (%): | | | | | |
| Ratio of total expenses | | | | | |
| to average net assets | 1.15 | 1.22 | 1.37 | 1.21 | 1.15 |
| Ratio of net expenses | | | | | |
| to average net assets | 1.09 | 1.22 | 1.36 | 1.20 | 1.15 |
| Ratio of net investment income | | | | | |
| to average net assets | 2.29 | 1.93 | 2.09 | 2.16 | 1.36 |
| Portfolio Turnover Rate | 60.72 | 55.35 | 69.63 | 46.96 | 61.70 |
| Net Assets, end of period ($ x 1,000) | 91,998 | 97,429 | 41,460 | 42,444 | 74,932 |
| |
| a | Effective June 1, 2007, Class R shares were redesignated as Class I shares. |
| b | Based on average shares outstanding at each month end. |
See notes to financial statements.
22
NOTES TO FINANCIAL STATEMENTS
NOTE 1—Significant Accounting Policies:
Dreyfus International Value Fund (the “fund”) is a separate diversified series of Advantage Funds, Inc. (the “Company”), which is registered under the Investment Company Act of 1940, as amended (the “Act”), as an open-end management investment company and operates as a series company offering thirteen series, including the fund.The fund’s investment objective is to seek long-term capital growth.The Dreyfus Corporation (the “Manager” or “Dreyfus”), a wholly-owned subsidiary of The Bank of New York Mellon Corporation (“BNY Mellon”), serves as the fund’s investment adviser.
MBSC Securities Corporation (the “Distributor”), a wholly-owned subsidiary of the Manager, is the distributor of the fund’s shares. The fund is authorized to issue 500 million shares of $.001 par value Common Stock.The fund currently offers four classes of shares: Class A (200 million shares authorized), Class B (100 million shares authorized), Class C (100 million shares authorized) and Class I (100 million shares authorized). Class A shares are subject to a sales charge imposed at the time of purchase. Class B shares are subject to a contingent deferred sales charge (“CDSC”) imposed on Class B share redemptions made within six years of purchase and automatically convert to Class A shares after six years. The fund no longer offers Class B shares, except in connection with dividend reinvestment and permitted exchanges of Class B shares. Class C shares are subject to a CDSC on Class C shares redeemed within one year of purchase. Class I shares are sold at net asset value per share only to institutional investors. Other differences between the classes include the services offered to and the expenses borne by each class, the allocation of certain transfer agency costs and certain voting
NOTES TO FINANCIAL STATEMENTS (continued)
rights. Income, expenses (other than expenses attributable to a specific class), and realized and unrealized gains or losses on investments are allocated to each class of shares based on its relative net assets.
The Company accounts separately for the assets, liabilities and operations of each series. Expenses directly attributable to each series are charged to that series’ operations; expenses which are applicable to all series are allocated among them on a pro rata basis.
The Financial Accounting Standards Board (“FASB”) Accounting Standards Codification (“ASC”) is the exclusive reference of authoritative U.S. generally accepted accounting principles (“GAAP”) recognized by the FASB to be applied by nongovernmental entities. Rules and interpretive releases of the Securities and Exchange Commission (“SEC”) under authority of federal laws are also sources of authoritative GAAP for SEC registrants.The fund’s financial statements are prepared in accordance with GAAP, which may require the use of management estimates and assump-tions.Actual results could differ from those estimates.
The Company enters into contracts that contain a variety of indemnifications. The fund’s maximum exposure under these arrangements is unknown.The fund does not anticipate recognizing any loss related to these arrangements.
(a) Portfolio valuation: The fair value of a financial instrument is the amount that would be received to sell an asset or paid to transfer a liability in an orderly transaction between market participants at the measurement date (i.e. the exit price). GAAP establishes a fair value hierarchy that prioritizes the inputs of valuation techniques used to measure fair value. This hierarchy gives the highest priority to unadjusted quoted prices in active markets for identical assets or liabilities (Level 1 measurements) and the lowest priority to unobservable inputs (Level 3 measurements).
24
Additionally, GAAP provides guidance on determining whether the volume and activity in a market has decreased significantly and whether such a decrease in activity results in transactions that are not orderly. GAAP requires enhanced disclosures around valuation inputs and techniques used during annual and interim periods.
Various inputs are used in determining the value of the fund’s investments relating to fair value measurements.These inputs are summarized in the three broad levels listed below:
Level 1—unadjusted quoted prices in active markets for identical investments.
Level 2—other significant observable inputs (including quoted prices for similar investments, interest rates, prepayment speeds, credit risk, etc.).
Level 3—significant unobservable inputs (including the fund’s own assumptions in determining the fair value of investments).
The inputs or methodology used for valuing securities are not necessarily an indication of the risk associated with investing in those securities.
Changes in valuation techniques may result in transfers in or out of an assigned level within the disclosure hierarchy. Valuation techniques used to value the fund’s investments are as follows:
Investments in securities are valued at the last sales price on the securities exchange or national securities market on which such securities are primarily traded. Securities listed on the National Market System for which market quotations are available are valued at the official closing price or, if there is no official closing price that day, at the last sales price. Securities not listed on an exchange or the national securities market, or securities for which there were no transactions, are valued at the average
NOTES TO FINANCIAL STATEMENTS (continued)
of the most recent bid and asked prices, except for open short positions, where the asked price is used for valuation purposes. Bid price is used when no asked price is available. Registered investment companies that are not traded on an exchange are valued at their net asset value.All preceding securities are categorized as Level 1 in the hierarchy.
Fair valuing of securities may be determined with the assistance of a pricing service using calculations based on indices of domestic securities and other appropriate indicators, such as prices of relevant ADRs and futures contracts. Utilizing these techniques may result in transfers between Level 1 and Level 2 of the fair value hierarchy.
When market quotations or official closing prices are not readily available, or are determined not to reflect accurately fair value, such as when the value of a security has been significantly affected by events after the close of the exchange or market on which the security is principally traded (for example, a foreign exchange or market), but before the fund calculates its net asset value, the fund may value these investments at fair value as determined in accordance with the procedures approved by the Board of Directors. Certain factors may be considered when fair valuing investments such as: fundamental analytical data, the nature and duration of restrictions on disposition, an evaluation of the forces that influence the market in which the securities are purchased and sold, and public trading in similar securities of the issuer or comparable issuers. These securities are either categorized as Level 2 or 3 depending on the relevant inputs used.
For restricted securities where observable inputs are limited, assumptions about market activity and risk are used and are categorized as Level 3 in the hierarchy.
Investments denominated in foreign currencies are translated to U.S. dollars at the prevailing rates of exchange. Forward foreign currency exchange contracts (“forward contracts”) are valued at the forward rate. These securities are generally categorized as Level 2 in the hierarchy.
26
The following is a summary of the inputs used as of August 31, 2011 in valuing the fund’s investments:
| | | | | | |
| | | Level 2—Other | | Level 3— | | |
| | Level 1— | Significant | | Significant | | |
| | Unadjusted | Observable | | Unobservable | | |
| | Quoted Prices | Inputs | | Inputs | Total | |
| Assets ($) | | | | | | |
| Investments in Securities: | | | | | |
| Equity Securities— | | | | | | |
| Foreign† | 203,129,548 | — | | — | 203,129,548 | |
| Mutual Funds | 1,100,000 | — | | — | 1,100,000 | |
| Liabilities ($) | | | | | | |
| Other Financial | | | | | | |
| Instruments: | | | | | | |
| Forward Foreign | | | | | | |
| Currency Exchange | | | | | |
| Contracts†† | — | (621 | ) | — | (621 | ) |
| |
| † | See Statement of Investments for additional detailed categorizations. |
| †† | Amount shown represents unrealized depreciation at period end. |
In January 2010, FASB issued Accounting Standards Update (“ASU”) No. 2010-06 “Improving Disclosures about FairValue Measurements” (“ASU 2010-06”). The portions of ASU 2010-06 which require reporting entities to prepare new disclosures surrounding amounts and reasons for significant transfers in and out of Level 1 and Level 2 fair value measurements as well as inputs and valuation techniques used to measure fair value for both recurring and nonrecurring fair value measurements that fall in either Level 2 or Level 3 have been adopted by the fund. No significant transfers between Level 1 or Level 2 fair value measurements occurred at August 31, 2011.
In May 2011, FASB issued ASU No. 2011-04 “Amendments to Achieve Common Fair Value Measurement and Disclosure Requirements in GAAP and International Financial Reporting Standards (“IFRS”)” (“ASU 2011-04”). ASU 2011-04 includes common requirements for measurement of and disclosure about fair value between GAAP and
NOTES TO FINANCIAL STATEMENTS (continued)
IFRS. ASU 2011-04 will require reporting entities to disclose the following information for fair value measurements categorized within Level 3 of the fair value hierarchy: quantitative information about the unobservable inputs used in the fair value measurement, the valuation processes used by the reporting entity and a narrative description of the sensitivity of the fair value measurement to changes in unobservable inputs and the interrelationships between those unobservable inputs. In addition, ASU 2011-04 will require reporting entities to make disclosures about amounts and reasons for all transfers in and out of Level 1 and Level 2 fair value measurements.The new and revised disclosures are effective for interim and annual reporting periods beginning after December 15, 2011. At this time, management is evaluating the implications of ASU 2011-04 and its impact on the financial statements.
(b) Foreign currency transactions: The fund does not isolate that portion of the results of operations resulting from changes in foreign exchange rates on investments from the fluctuations arising from changes in the market prices of securities held. Such fluctuations are included with the net realized and unrealized gain or loss on investments.
Net realized foreign exchange gains or losses arise from sales of foreign currencies, currency gains or losses realized on securities transactions between trade and settlement date, and the difference between the amounts of dividends, interest and foreign withholding taxes recorded on the fund’s books and the U.S. dollar equivalent of the amounts actually received or paid. Net unrealized foreign exchange gains and losses arise from changes in the value of assets and liabilities other than investments resulting from changes in exchange rates. Foreign currency gains and losses on investments are included with net realized and unrealized gain or loss on investments.
(c) Securities transactions and investment income: Securities transactions are recorded on a trade date basis. Realized gains and losses from securities transactions are recorded on the identified cost basis. Dividend income is recognized on the ex-dividend date and interest income, including, where applicable, accretion of discount and amortization of premium on investments, is recognized on the accrual basis.
28
Investing in foreign markets may involve special risks and considerations not typically associated with investing in the U.S. These risks include revaluation of currencies, high rates of inflation, repatriation restrictions on income and capital, and adverse political and economic developments. Moreover, securities issued in these markets may be less liquid, subject to government ownership controls and delayed settlements, and their prices may be more volatile than those of comparable securities in the U.S.
(d) Affiliated issuers: Investments in other investment companies advised by Dreyfus are defined as “affiliated” in the Act.
The fund may invest in shares of certain affiliated investment companies also advised or managed by Dreyfus. Investments in affiliated investment companies for the period ended August 31, 2011 were as follows:
| | | | | | | |
| Affiliated | | | | | | | |
| Investment | Value | | | | Value | | Net |
| Company | 8/31/2010 | ($) | Purchases ($) | Sales ($) | 8/31/2011 | ($) | Assets (%) |
| Dreyfus | | | | | | | |
| Institutional | | | | | | | |
| Preferred | | | | | | | |
| Plus Money | | | | | | | |
| Market Fund | 2,425,000 | | 75,480,000 | 76,805,000 | 1,100,000 | | .5 |
Certain affiliated investment companies also advised or managed by Dreyfus may also invest in the fund. At August 31, 2011, Dreyfus Diversified International Fund held 80% of the outstanding Class I shares of the fund.
(e) Dividends to shareholders: Dividends are recorded on the ex-dividend date. Dividends from investment income-net and dividends from net realized capital gains, if any, are normally declared and paid annually, but the fund may make distributions on a more frequent basis to comply with the distribution requirements of the Internal Revenue Code of 1986, as amended (the “Code”).To the extent that net realized capital gains can be offset by capital loss carryovers, it is the policy of the fund not to distribute such gains. Income and capital gain distributions are determined in accordance with income tax regulations, which may differ from GAAP.
NOTES TO FINANCIAL STATEMENTS (continued)
(f) Federal income taxes: It is the policy of the fund to continue to qualify as a regulated investment company, if such qualification is in the best interests of its shareholders, by complying with the applicable provisions of the Code, and to make distributions of taxable income sufficient to relieve it from substantially all federal income and excise taxes.
As of and during the period ended August 31, 2011, the fund did not have any liabilities for any uncertain tax positions.The fund recognizes interest and penalties, if any, related to uncertain tax positions as income tax expense in the Statement of Operations. During the period, the fund did not incur any interest or penalties.
Each of the tax years in the four-year period ended August 31, 2011 remains subject to examination by the Internal Revenue Service and state taxing authorities.
At August 31, 2011, the components of accumulated earnings on a tax basis were as follows: undistributed ordinary income $5,926,024, accumulated capital losses $66,276,161 and unrealized depreciation $56,138,288. In addition, the fund had $45,049 of passive foreign investment company losses realized after October 31, 2010, which were deferred for tax purposes to the first day of the following fiscal year.
The accumulated capital loss carryover is available for federal income tax purposes to be applied against future net securities profits, if any, realized subsequent to August 31, 2011. If not applied, $24,770,979 of the carryover expires in fiscal 2017 and $41,505,182 expires in fiscal 2018.
The tax character of distributions paid to shareholders during the fiscal periods ended August 31, 2011 and August 31, 2010 were as follows: ordinary income $3,254,802 and $3,257,489, respectively.
During the period ended August 31, 2011, as a result of permanent book to tax differences, primarily due to the tax treatment for foreign exchange gains and losses and passive foreign investment companies, the fund increased accumulated undistributed investment income-net by $906,193 and decreased accumulated net realized gain (loss) on investments by the same amount. Net assets and net asset value per share were not affected by this reclassification.
30
NOTE 2—Bank Lines of Credit:
The fund participates with other Dreyfus-managed funds in a $225 million unsecured credit facility led by Citibank, N.A. and a $300 million unsecured credit facility provided by The Bank of New York Mellon, a subsidiary of BNY Mellon and an affiliate of Dreyfus (each, a “Facility”), each to be utilized primarily for temporary or emergency purposes, including the financing of redemptions. In connection therewith, the fund has agreed to pay its pro rata portion of commitment fees for each Facility. Interest is charged to the fund based on rates determined pursuant to the terms of the respective Facility at the time of borrowing.
The average amount of borrowings outstanding under the Facilities during the period ended August 31, 2011 was approximately $403,800, with a related weighted average annualized interest rate of 1.35%.
NOTE 3—Management Fee and Other Transactions with Affiliates:
(a) Pursuant to a management agreement with the Manager, the management fee is computed at the annual rate of 1% of the value of the fund’s average daily net assets and is payable monthly.
Effective March 9, 2011, the Manager has agreed to waive a portion of the fund’s management fee, in the amount of .10% of the value of the fund’s average daily net assets, until January 1, 2012.The reduction in management fee, pursuant to the undertaking, amounted to $126,749 during the period ended August 31, 2011.
During the period ended August 31, 2011, the Distributor retained $2,318 from commissions earned on sales of the fund’s Class A shares and $3,423 and $1,081 from CDSCs on redemptions of the fund’s Class B and Class C shares, respectively.
NOTES TO FINANCIAL STATEMENTS (continued)
(b) Under the Distribution Plan (the “Plan”) adopted pursuant to Rule 12b-1 under the Act, Class B and Class C shares pay the Distributor for distributing their shares at an annual rate of .75% of the value of the average daily net assets of Class B and Class C shares. During the period ended August 31, 2011, Class B and Class C shares were charged $10,500 and $110,159, respectively, pursuant to the Plan.
(c) Under the Shareholder Services Plan, Class A, Class B and Class C shares pay the Distributor at an annual rate of .25% of the value of their average daily net assets for the provision of certain services.The services provided may include personal services relating to shareholder accounts, such as answering shareholder inquiries regarding the fund and providing reports and other information, and services related to the maintenance of shareholder accounts. The Distributor may make payments to Service Agents (a securities dealer, financial institution or other industry professional) in respect of these services. The Distributor determines the amounts to be paid to Service Agents. During the period ended August 31, 2011, Class A, Class B and Class C shares were charged $300,722, $3,500 and $36,720, respectively, pursuant to the Shareholder Services Plan.
The fund compensates Dreyfus Transfer, Inc., a wholly-owned subsidiary of the Manager, under a transfer agency agreement for providing personnel and facilities to perform transfer agency services for the fund. During the period ended August 31, 2011, the fund was charged $54,714 pursuant to the transfer agency agreement, which is included in Shareholder servicing costs in the Statement of Operations.
The fund has arrangements with the custodian and cash management bank whereby the fund may receive earnings credits when positive cash balances are maintained, which are used to offset custody and cash management fees. For financial reporting purposes, the fund includes net earnings credits as an expense offset in the Statement of Operations.
The fund compensates The Bank of New York Mellon under a cash management agreement for performing cash management services related to fund subscriptions and redemptions. During the period ended August 31, 2011, the fund was charged $5,013 pursuant to the
32
cash management agreement, which is included in Shareholder servicing costs in the Statement of Operations.These fees were partially offset by earnings credits of $232.
The fund also compensates The Bank of New York Mellon under a custody agreement for providing custodial services for the fund. During the period ended August 31, 2011, the fund was charged $134,338 pursuant to the custody agreement.
During the period ended August 31, 2011, the fund was charged $7,225 for services performed by the Chief Compliance Officer.
The components of “Due to The Dreyfus Corporation and affiliates” in the Statement of Assets and Liabilities consist of: management fees $173,346, Rule 12b-1 distribution plan fees $7,625, shareholder services plan fees $24,032, custodian fees $36,314, chief compliance officer fees $3,253 and transfer agency per account fees $6,700, which are offset against an expense reimbursement currently in effect in the amount of $17,219.
(d) Each Board member also serves as a Board member of other funds within the Dreyfus complex. Annual retainer fees and attendance fees are allocated to each fund based on net assets.
(e) A 2% redemption fee is charged and retained by the fund on certain shares redeemed within sixty days following the date of issuance subject to exceptions, including redemptions made through the use of the fund’s exchange privilege. During the period ended August 31, 2011, redemption fees charged and retained by the fund amounted to $42. Effective December 15, 2010, the fund will no longer assess a redemption fee on shares that are redeemed or exchanged.
NOTE 4—Securities Transactions:
The aggregate amount of purchases and sales of investment securities, excluding short-term securities and forward contracts, during the period ended August 31, 2011 amounted to $150,885,175 and $175,447,437, respectively.
NOTES TO FINANCIAL STATEMENTS (continued)
Forward Foreign Currency Exchange Contracts: The fund enters into forward contracts in order to hedge its exposure to changes in foreign currency exchange rates on its foreign portfolio holdings, to settle foreign currency transactions or as a part of its investment strategy. When executing forward contracts, the fund is obligated to buy or sell a foreign currency at a specified rate on a certain date in the future. With respect to sales of forward contracts, the fund incurs a loss if the value of the contract increases between the date the forward contract is opened and the date the forward contract is closed.The fund realizes a gain if the value of the contract decreases between those dates. With respect to purchases of forward contracts, the fund incurs a loss if the value of the contract decreases between the date the forward contract is opened and the date the forward contract is closed.The fund realizes a gain if the value of the contract increases between those dates. Any realized gain or loss which occurred during the period is reflected in the Statement of Operations.The fund is exposed to foreign currency risk as a result of changes in value of underlying financial instruments. The fund is also exposed to credit risk associated with counterparty nonperformance on these forward contracts, which is typically limited to the unrealized gain on each open contract.The following summarizes open forward contracts at August 31, 2011:
| | | | | |
| | Foreign | | | | |
| Forward Foreign Currency | Currency | | | Unrealized | |
| Exchange Contracts | Amount | Proceeds ($) | Value ($) | (Depreciation) ($) | |
| Sales: | | | | | |
| Japanese Yen, | | | | | |
| Expiring 9/1/2011 | 22,261,017 | 290,106 | 290,727 | (621 | ) |
The following summarizes the average market value of derivatives outstanding during the period ended August 31, 2011:
| |
| | Average Market Value ($) |
| Forward contracts | 3,300,767 |
At August 31, 2011, the cost of investments for federal income tax purposes was $260,413,059; accordingly, accumulated net unrealized depreciation on investments was $56,183,511, consisting of $5,706,399 gross unrealized appreciation and $61,889,910 gross unrealized depreciation.
34
REPORT OF INDEPENDENT REGISTERED
PUBLIC ACCOUNTING FIRM
Shareholders and Board of Directors
Dreyfus International Value Fund
We have audited the accompanying statement of assets and liabilities, including the statement of investments, of Dreyfus International Value Fund (one of the series comprising Advantage Funds, Inc.) as of August 31, 2011, and the related statement of operations for the year then ended, the statement of changes in net assets for each of the two years in the period then ended, and financial highlights for each of the years indicated therein.These financial statements and financial highlights are the responsibility of the Fund’s management. Our responsibility is to express an opinion on these financial statements and financial highlights based on our audits.
We conducted our audits in accordance with the standards of the Public Company Accounting Oversight Board (United States).Those standards require that we plan and perform the audit to obtain reasonable assurance about whether the financial statements and financial highlights are free of material misstatement.We were not engaged to perform an audit of the Fund’s internal control over financial reporting. Our audits included consideration of internal control over financial reporting as a basis for designing audit procedures that are appropriate in the circumstances, but not for the purpose of expressing an opinion on the effectiveness of the Fund’s internal control over financial reporting. Accordingly, we express no such opinion.An audit also includes examining, on a test basis, evidence supporting the amounts and disclosures in the financial statements and financial highlights, assessing the accounting principles used and significant estimates made by management, and evaluating the overall financial statement presentation. Our procedures included confirmation of securities owned as of August 31, 2011 by correspondence with the custodian and others.We believe that our audits provide a reasonable basis for our opinion.
In our opinion, the financial statements and financial highlights referred to above present fairly, in all material respects, the financial position of Dreyfus International Value Fund at August 31, 2011, the results of its operations for the year then ended, the changes in its net assets for each of the two years in the period then ended, and the financial highlights for each of the indicated years, in conformity with U.S. generally accepted accounting principles.

New York, New York
October 27, 2011
IMPORTANT TAX INFORMATION (Unaudited)
In accordance with federal tax law, the fund elects to provide each shareholder with their portion of the fund’s foreign taxes paid and the income sourced from foreign countries.Accordingly, the fund hereby makes the following designations regarding its fiscal year ended August 31, 2011:
—the total amount of taxes paid to foreign countries was $794,725
—the total amount of income sourced from foreign countries was $9,310,689.
Where required by federal tax law rules, shareholders will receive notification of their proportionate share of foreign taxes paid and foreign sourced income for the 2011 calendar year with Form 1099-DIV which will be mailed in early 2012.Also certain dividends paid by the fund may be subject to a maximum tax rate of 15%, as provided for by the Jobs and Growth Tax Relief Reconciliation Act of 2003. Of the distributions paid during the fiscal year, $3,254,802 represents the maximum amount that may be considered qualified dividend income.
36
|
| INFORMATION ABOUT THE RENEWAL OF THE |
| FUND’S MANAGEMENT AGREEMENT (Unaudited) |
At a meeting of the fund’s Board of Directors held on March 1, 2011, the Board considered the renewal of the fund’s Management Agreement pursuant to which Dreyfus provides the fund with investment advisory and administrative services (the “Agreement”). The Board members, none of whom are “interested persons” (as defined in the Investment Company Act of 1940, as amended) of the fund, were assisted in their review by independent legal counsel and met with counsel in executive session separate from representatives of Dreyfus. In considering the renewal of the Agreement, the Board considered all factors that it believed to be relevant, including those discussed below.The Board did not identify any one factor as dispositive, and each Board member may have attributed different weights to the factors considered.
Analysis of Nature, Extent, and Quality of Services Provided to the Fund.The Board members considered information previously provided to them in presentations from representatives of Dreyfus regarding the nature, extent, and quality of the services provided to funds in the Dreyfus fund complex, and representatives of Dreyfus confirmed that there had been no material changes in this information. Dreyfus provided the number of open accounts in the fund, the fund’s asset size and the allocation of fund assets among distribution channels. Dreyfus also had previously provided information regarding the diverse intermediary relationships and distribution channels of funds in the Dreyfus fund complex and Dreyfus’ corresponding need for broad, deep, and diverse resources to be able to provide ongoing shareholder services to each distribution channel, including the distribution channel(s) for the fund.
The Board members also considered research support available to, and portfolio management capabilities of, the fund’s portfolio management personnel and that Dreyfus also provides oversight of day-to-day fund operations, including fund accounting and administration and assistance in meeting legal and regulatory requirements.The Board members also considered Dreyfus’ extensive administrative, accounting, and compliance infrastructures.The Board also considered portfolio man-
|
| INFORMATION ABOUT THE RENEWAL OF THE FUND’S |
| MANAGEMENT AGREEMENT (Unaudited) (continued) |
agement’s brokerage policies and practices (including policies and practices regarding soft dollars) and the standards applied in seeking best execution.
Comparative Analysis of the Fund’s Performance and Management Fee and Expense Ratio. The Board members reviewed reports prepared by Lipper, Inc. (“Lipper”), an independent provider of investment company data, which included information comparing (1) the fund’s performance with the performance of a group of comparable funds (the “Performance Group”) and with a broader group of funds (the “Performance Universe”), all for various periods ended December 31, 2010, and (2) the fund’s actual and contractual management fees and total expenses with those of a group of comparable funds (the “Expense Group”) and with a broader group of funds (the “Expense Universe”), the information for which was derived in part from fund financial statements available to Lipper as of December 31, 2010. Dreyfus previously had furnished the Board with a description of the methodology Lipper used to select the Performance Group and Performance Universe and the Expense Group and Expense Universe.
Dreyfus representatives stated that the usefulness of performance comparisons may be affected by a number of factors, including different investment limitations that may be applicable to the fund and comparison funds.The Board members discussed the results of the comparisons and noted that the fund’s total return performance was variously above and below the Performance Group and Performance Universe medians. Dreyfus also provided a comparison of the fund’s calendar year total returns to the returns of the fund’s benchmark index, which showed a tendency to underperform the index in calendar years of positive performance and to outperform the index in calendar years of negative performance. Management noted that the fund’s relative returns in the last year were negatively affected by its focus on high-quality companies at a time when smaller, more speculative stocks fared better.
The Board members also reviewed the range of actual and contractual management fees and total expenses of the Expense Group and Expense Universe funds and discussed the results of the comparisons.
38
They noted that the fund’s contractual management fee was above the Expense Group median and the fund’s actual management fee and total expenses were above the Expense Group and Expense Universe medians. A representative of Dreyfus noted that Dreyfus has contractually agreed from March 9, 2011 until January 1, 2012 to waive receipt of a portion of the fund’s management fee in the amount of .10% of the value of the fund’s average daily total assets.
Representatives of Dreyfus reviewed with the Board members the management or investment advisory fees (1) paid by funds advised or administered by Dreyfus that are in the same Lipper category as the fund and (2) paid to Dreyfus or the Dreyfus-affiliated primary employer of the fund’s primary portfolio manager for advising any separate accounts and/or other types of client portfolios that are considered to have similar investment strategies and policies as the fund (the “Similar Clients”), and explained the nature of the Similar Clients. They discussed differences in fees paid and the relationship of the fees paid in light of any differences in the services provided and other relevant factors.The Board members considered the relevance of the fee information provided for the Similar Clients to evaluate the appropriateness and reasonableness of the fund’s management fee.
Analysis of Profitability and Economies of Scale. Dreyfus’ representatives reviewed the expenses allocated and profit received by Dreyfus and the resulting profitability percentage for managing the fund, and the method used to determine the expenses and profit. The Board concluded that the profitability results were not unreasonable, given the services rendered and service levels provided by Dreyfus. The Board previously had been provided with information prepared by an independent consulting firm regarding Dreyfus’ approach to allocating costs to, and determining the profitability of, individual funds and the entire Dreyfus fund complex. The consulting firm also had analyzed where any economies of scale might emerge in connection with the management of a fund.
|
| INFORMATION ABOUT THE RENEWAL OF THE FUND’S |
| MANAGEMENT AGREEMENT (Unaudited) (continued) |
The Board’s counsel stated that the Board members should consider the profitability analysis (1) as part of their evaluation of whether the fees under the Agreement bear a reasonable relationship to the mix of services provided by Dreyfus, including the nature, extent and quality of such services, and (2) in light of the relevant circumstances for the fund and the extent to which economies of scale would be realized if the fund grows and whether fee levels reflect these economies of scale for the benefit of fund shareholders. Dreyfus representatives noted that, as a result of shared and allocated costs among funds in the Dreyfus funds complex, the extent of economies of scale could depend substantially on the level of assets in the complex as a whole, so that increases and decreases in complex-wide assets can affect potential economies of scale in a manner that is disproportionate to, or even in the opposite direction from, changes in the fund’s asset level. The Board members also considered potential benefits to Dreyfus from acting as investment adviser and noted the soft dollar arrangements in effect for trading the fund’s investments.
At the conclusion of these discussions, the Board agreed that it had been furnished with sufficient information to make an informed business decision with respect to the renewal of the Agreement. Based on the discussions and considerations as described above, the Board concluded and determined as follows.
The Board concluded that the nature, extent and quality of the services provided by Dreyfus are adequate and appropriate.
The Board generally was satisfied with the fund’s overall performance, in light of the considerations described above.
The Board concluded that the fee paid to Dreyfus was reasonable in light of the considerations described above.
40
The Board determined that the economies of scale which may accrue to Dreyfus and its affiliates in connection with the management of the fund had been adequately considered by Dreyfus in connection with the fee rate charged to the fund pursuant to the Agreement and that, to the extent in the future it were determined that material economies of scale had not been shared with the fund, the Board would seek to have those economies of scale shared with the fund.
The Board members considered these conclusions and determinations, along with information received on a routine and regular basis throughout the year. In addition, it should be noted that the Board’s consideration of the contractual fee arrangements for this fund had the benefit of a number of years of reviews of prior or similar agreements during which lengthy discussions took place between the Board members and Dreyfus representatives. Certain aspects of the arrangements may receive greater scrutiny in some years than in others, and the Board members’ conclusions may be based, in part, on their consideration of the same or similar arrangements in prior years. The Board members determined that renewal of the Agreement was in the best interests of the fund and its shareholders.
BOARD MEMBERS INFORMATION (Unaudited)
|
| Joseph S. DiMartino (67) |
| Chairman of the Board (1995) |
| Principal Occupation During Past 5Years: |
| • Corporate Director and Trustee |
| Other Public Company Board Memberships During Past 5Years: |
| • CBIZ (formerly, Century Business Services, Inc.), a provider of outsourcing functions for small |
| and medium size companies, Director (1997-present) |
| • Sunair Services Corporation, a provider of certain outdoor-related services to homes and |
| businesses, Director (2005-2009) |
| • The Newark Group, a provider of a national market of paper recovery facilities, paperboard |
| mills and paperboard converting plants, Director (2000-2010) |
| No. of Portfolios for which Board Member Serves: 167 |
| ——————— |
| Peggy C. Davis (68) |
| Board Member (2006) |
| Principal Occupation During Past 5Years: |
| • Shad Professor of Law, New York University School of Law |
| • Writer and teacher in the fields of evidence, constitutional theory, family law, social sciences |
| and the law, legal process and professional methodology and training |
| No. of Portfolios for which Board Member Serves: 53 |
| ——————— |
| David P. Feldman (71) |
| Board Member (1996) |
| Principal Occupation During Past 5Years: |
| • Corporate Director and Trustee |
| Other Public Company Board Memberships During Past 5Years: |
| • BBH Mutual Funds Group (4 registered mutual funds), Director (1992-present) |
| • QMed, Inc. a healthcare company, Director (1999-2007) |
| No. of Portfolios for which Board Member Serves: 50 |
42
|
| Ehud Houminer (71) |
| Board Member (1993) |
| Principal Occupation During Past 5Years: |
| • Executive-in-Residence at the Columbia Business School, Columbia University (1992-present) |
| Other Public Company Board Memberships During Past 5Years: |
| • Avnet Inc., an electronics distributor, Director (1993-present) |
| No. of Portfolios for which Board Member Serves: 64 |
| ——————— |
| Dr. Martin Peretz (72) |
| Board Member (2006) |
| Principal Occupation During Past 5Years: |
| • Editor-in-Chief Emeritus of The New Republic Magazine (2010-present) (previously, |
| Editor-in-Chief, 1974-2010) |
| • Director of TheStreet.com, a financial information service on the web (1996-present) |
| No. of Portfolios for which Board Member Serves: 35 |
| ——————— |
Once elected all Board Members serve for an indefinite term, but achieve Emeritus status upon reaching age 80.The address of the Board Members and Officers is in c/o The Dreyfus Corporation, 200 Park Avenue, NewYork, NewYork 10166.Additional information about the Board Members is available in the fund’s Statement of Additional Information which can be obtained from Dreyfus free of charge by calling this toll free number: 1-800-DREYFUS.
James F. Henry, Emeritus Board Member
Dr. Paul A. Marks, Emeritus Board Member
Gloria Messinger, Emeritus Board Member
OFFICERS OF THE FUND (Unaudited)
BRADLEY J. SKAPYAK, President since January 2010.
Chief Operating Officer and a director of the Manager since June 2009. From April 2003 to June 2009, Mr. Skapyak was the head of the Investment Accounting and Support Department of the Manager. He is an officer of 75 investment companies (comprised of 167 portfolios) managed by the Manager. He is 52 years old and has been an employee of the Manager since February 1988.
MICHAEL A. ROSENBERG, Vice President and Secretary since August 2005.
Assistant General Counsel of BNY Mellon, and an officer of 76 investment companies (comprised of 192 portfolios) managed by the Manager. He is 51 years old and has been an employee of the Manager since October 1991.
KIESHA ASTWOOD, Vice President and Assistant Secretary since January 2010.
Counsel of BNY Mellon, and an officer of 76 investment companies (comprised of 192 portfolios) managed by the Manager. She is 38 years old and has been an employee of the Manager since July 1995.
JAMES BITETTO, Vice President and Assistant Secretary since August 2005.
Senior Counsel of BNY Mellon and Secretary of the Manager, and an officer of 76 investment companies (comprised of 192 portfolios) managed by the Manager. He is 45 years old and has been an employee of the Manager since December 1996.
JONI LACKS CHARATAN, Vice President and Assistant Secretary since August 2005.
Senior Counsel of BNY Mellon, and an officer of 76 investment companies (comprised of 192 portfolios) managed by the Manager. She is 55 years old and has been an employee of the Manager since October 1988.
JOSEPH M. CHIOFFI, Vice President and Assistant Secretary since August 2005.
Senior Counsel of BNY Mellon, and an officer of 76 investment companies (comprised of 192 portfolios) managed by the Manager. He is 49 years old and has been an employee of the Manager since June 2000.
KATHLEEN DENICHOLAS, Vice President and Assistant Secretary since January 2010.
Managing Counsel of BNY Mellon, and an officer of 76 investment companies (comprised of 192 portfolios) managed by the Manager. She is 36 years old and has been an employee of the Manager since February 2001.
JANETTE E. FARRAGHER, Vice President and Assistant Secretary since August 2005.
Assistant General Counsel of BNY Mellon, and an officer of 76 investment companies (comprised of 192 portfolios) managed by the Manager. She is 48 years old and has been an employee of the Manager since February 1984.
JOHN B. HAMMALIAN, Vice President and Assistant Secretary since August 2005.
Senior Managing Counsel of BNY Mellon, and an officer of 76 investment companies (comprised of 192 portfolios) managed by the Manager. He is 48 years old and has been an employee of the Manager since February 1991.
M. CRISTINA MEISER, Vice President and Assistant Secretary since January 2010.
Senior Counsel of BNY Mellon, and an officer of 76 investment companies (comprised of 192 portfolios) managed by the Manager. She is 41 years old and has been an employee of the Manager since August 2001.
44
ROBERT R. MULLERY, Vice President and Assistant Secretary since August 2005.
Managing Counsel of BNY Mellon, and an officer of 76 investment companies (comprised of 192 portfolios) managed by the Manager. He is 59 years old and has been an employee of the Manager since May 1986.
JEFF PRUSNOFSKY, Vice President and Assistant Secretary since August 2005.
Senior Managing Counsel of BNY Mellon, and an officer of 76 investment companies (comprised of 192 portfolios) managed by the Manager. He is 46 years old and has been an employee of the Manager since October 1990.
JAMES WINDELS, Treasurer since November 2001.
Director – Mutual Fund Accounting of the Manager, and an officer of 76 investment companies (comprised of 192 portfolios) managed by the Manager. He is 52 years old and has been an employee of the Manager since April 1985.
RICHARD CASSARO, Assistant Treasurer since January 2008.
Senior Accounting Manager – Money Market and Municipal Bond Funds of the Manager, and an officer of 76 investment companies (comprised of 192 portfolios) managed by the Manager. He is 52 years old and has been an employee of the Manager since September 1982.
GAVIN C. REILLY, Assistant Treasurer since December 2005.
Tax Manager of the Investment Accounting and Support Department of the Manager, and an officer of 76 investment companies (comprised of 192 portfolios) managed by the Manager. He is 43 years old and has been an employee of the Manager since April 1991.
ROBERT ROBOL, Assistant Treasurer since August 2005.
Senior Accounting Manager – Fixed Income Funds of the Manager, and an officer of 76 investment companies (comprised of 192 portfolios) managed by the Manager. He is 47 years old and has been an employee of the Manager since October 1988.
ROBERT SALVIOLO, Assistant Treasurer since July 2007.
Senior Accounting Manager – Equity Funds of the Manager, and an officer of 76 investment companies (comprised of 192 portfolios) managed by the Manager. He is 44 years old and has been an employee of the Manager since June 1989.
ROBERT SVAGNA, Assistant Treasurer since December 2002.
Senior Accounting Manager – Equity Funds of the Manager, and an officer of 76 investment companies (comprised of 192 portfolios) managed by the Manager. He is 44 years old and has been an employee of the Manager since November 1990.
OFFICERS OF THE FUND (Unaudited) (continued)
JOSEPH W. CONNOLLY, Chief Compliance Officer since October 2004.
Chief Compliance Officer of the Manager and The Dreyfus Family of Funds (76 investment companies, comprised of 192 portfolios). From November 2001 through March 2004, Mr. Connolly was first Vice-President, Mutual Fund Servicing for Mellon Global Securities Services. In that capacity, Mr. Connolly was responsible for managing Mellon’s Custody, Fund Accounting and Fund Administration services to third-party mutual fund clients. He is 54 years old and has served in various capacities with the Manager since 1980, including manager of the firm’s Fund Accounting Department from 1997 through October 2001.
STEPHEN J. STOREN, Anti-Money Laundering Compliance Officer since May 2011.
Chief Compliance Officer of the Distributor, and the Anti-Money Laundering Compliance Officer of 72 investment companies (comprised of 188 portfolios) managed by the Manager. He is 56 years old and has been an employee of the Distributor since October 1999.
46
For More Information
Telephone Call your financial representative or 1-800-DREYFUS
Mail The Dreyfus Family of Funds, 144 Glenn Curtiss Boulevard, Uniondale, NY 11556-0144
The fund files its complete schedule of portfolio holdings with the Securities and Exchange Commission (“SEC”) for the first and third quarters of each fiscal year on Form N-Q. The fund’s Forms N-Q are available on the SEC’s website at http://www.sec.gov and may be reviewed and copied at the SEC’s Public Reference Room in Washington, DC. Information on the operation of the Public Reference Room may be obtained by calling 1-800-SEC-0330.
A description of the policies and procedures that the fund uses to determine how to vote proxies relating to portfolio securities, and information regarding how the fund voted these proxies for the most recent 12-month period ended June 30 is available at http://www.dreyfus.com and on the SEC’s website at http://www.sec.gov. The description of the policies and procedures is also available without charge, upon request, by calling 1-800-DREYFUS.

|
| Dreyfus |
| Opportunistic |
| Midcap Value Fund |
ANNUAL REPORT August 31, 2011

Save time. Save paper. View your next shareholder report online as soon as it’s available. Log into www.dreyfus.com and sign up for Dreyfus eCommunications. It’s simple and only takes a few minutes.
The views expressed in this report reflect those of the portfolio manager only through the end of the period covered and do not necessarily represent the views of Dreyfus or any other person in the Dreyfus organization. Any such views are subject to change at any time based upon market or other conditions and Dreyfus disclaims any responsibility to update such views.These views may not be relied on as investment advice and, because investment decisions for a Dreyfus fund are based on numerous factors, may not be relied on as an indication of trading intent on behalf of any Dreyfus fund.
Not FDIC-Insured • Not Bank-Guaranteed • May Lose Value
| | Contents |
| | THE FUND |
| 2 | A Letter from the Chairman and CEO |
| 3 | Discussion of Fund Performance |
| 6 | Fund Performance |
| 8 | Understanding Your Fund’s Expenses |
| 8 | Comparing Your Fund’s Expenses With Those of Other Funds |
| 9 | Statement of Investments |
| 12 | Statement of Assets and Liabilities |
| 13 | Statement of Operations |
| 14 | Statement of Changes in Net Assets |
| 16 | Financial Highlights |
| 19 | Notes to Financial Statements |
| 29 | Report of Independent Registered Public Accounting Firm |
| 30 | Information About the Renewal of the Fund’s Management Agreement |
| 35 | Board Members Information |
| 37 | Officers of the Fund |
| | FOR MORE INFORMATION |
| | Back Cover |
Dreyfus
Opportunistic
Midcap Value Fund
The Fund

A LETTER FROM THE CHAIRMAN AND CEO
Dear Shareholder:
We are pleased to present this annual report for Dreyfus Opportunistic MidcapValue Fund, covering the 12-month period from September 1, 2010, through August 31, 2011. For information about how the fund performed during the reporting period, as well as general market perspectives, we provide a Discussion of Fund Performance on the pages that follow.
Although stocks rallied strongly through the first quarter of 2011 due to expectations of a more robust economic recovery, the reporting period ended amid sharply deteriorating investor sentiment due to disappointing economic data, an escalating sovereign debt crisis in Europe and a contentious debate regarding taxes, spending and borrowing in the United States. In the final month of the reporting period, a major credit rating agency downgraded U.S. long-term debt, marking the first time in history that U.S.Treasury securities were not assigned the highest possible credit rating. Stocks proved volatile in this tumultuous environment, as the stalled economy caused most market sectors to give back many of the reporting period’s previous gains.
The economic outlook currently is clouded by heightened market volatility and political infighting, but we believe that a sustained, moderate global expansion is more likely than a double-dip recession. Inflationary pressures appear to be waning in most countries, including the United States, as energy prices have retreated from their highs. The Federal Reserve Board has signaled its intention to maintain an aggressively accommodative monetary policy, which may help offset the financial stresses caused by recent fiscal policy choices in the United States and Europe.To assess how these and other developments may affect your investments, we encourage you, as always, to speak with your financial advisor.
Thank you for your continued confidence and support.

Jonathan R. Baum
Chairman and Chief Executive Officer
The Dreyfus Corporation
September 15, 2011
2

DISCUSSION OF FUND PERFORMANCE
For the period of September 1, 2010, through August 31, 2011, as provided by David A. Daglio, Primary Portfolio Manager
Fund and Market Performance Overview
For the 12-month period ended August 31, 2011, Dreyfus Opportunistic Midcap Value Fund’s Class A shares produced a total return of 17.03%, Class C shares returned 16.09% and Class I shares returned 17.29%.1 In comparison, the fund’s benchmark, the Russell MidcapValue Index (the “Index”), produced a 17.51% total return for the same period.2
The changes in the investment environment over the last year were dramatic. The period began with renewed optimism as the Federal Reserve Board launched its second round of quantitative easing and a resumption of stronger domestic economic growth occurred. By its end, a U.S. government default had been narrowly averted and the European financial system was under siege.
Investor sentiment shifted quickly with the changing environment. Rational longer term perspectives gave way to a complete focus on only the very short term. As a result, the fund’s focus on future earnings, cash flow, and relative performance, combined with a soft patch of stock selection, only modestly detracted from the fund’s performance relative to the benchmark.
The Fund’s Investment Approach
The fund seeks to surpass the performance of the Index by investing in midcap companies, which we consider as having market capitalizations between $1 billion and $25 billion at the time of purchase. We identify potential investments through extensive fundamental research conducted by the team’s dedicated sector specialists.
When selecting stocks, the fund will focus on individual stock selection, emphasizing three key factors: discount from intrinsic valuation, strong mid-cycle fundamentals and a revaluation catalyst.
We typically sell a stock when we no longer consider it attractively valued, when it appears less likely to benefit from the current market and economic environment, when it shows deteriorating fundamentals or when its performance falls short of our expectations.
DISCUSSION OF FUND PERFORMANCE (continued)
Economic Concerns Sparked Heightened Market Volatility
Investors’ economic outlooks improved markedly amid expectations of a stronger economic recovery early in the reporting period, sending stock prices broadly higher. Subsequent improvements in unemployment and consumer spending also supported higher stock prices through the first quarter of 2011. However, the rally was interrupted in February when political unrest in the Middle East led to sharply rising energy prices, and again in March when natural and nuclear disasters in Japan threatened one of the world’s largest economies. Nonetheless, investors proved resilient and U.S. stocks rebounded quickly from these unexpected shocks.
In late April, investor sentiment began to deteriorate in earnest when Greece appeared headed for default on its sovereign debt, economic data proved disappointing and a contentious debate regarding U.S. government spending and borrowing intensified. Stocks suffered heightened volatility over the summer of 2011 as newly risk-averse investors generally disregarded the long-term strengths of individual companies in favor of reacting to near-term macroeconomic develop-ments.The reporting period ended on a pessimistic note after a major credit-rating agency downgraded U.S.Treasury bonds.
Deteriorating Investor Sentiment Dampened Fund Results
The fund’s investment approach focuses on companies that we believe to be priced below their real worth and that have strong earnings and cash flow prospects over the next one to three years.The approach fell out of favor during the May to August time period when investors proved unwilling to look beyond the next several months for their investment horizon. Relative performance was negatively impacted by this development.
A wide variety of stocks assisted performance. Abercrombie and Fitch was one of our top contributors. Our analysis of the company’s U.S. operational turnaround and its European growth potential was validated during the period. JDS Uniphase was purchased for the hidden value of its cash, tax loss carry forward as well as its positioning in optical network technology. Alliance Data Systems was identified as significantly undervalued with promising trends in credit card processing volumes. The stock rose steadily for most of the last year on steadily improving fundamentals. Underweighting the lagging financials sector also added to relative performance.
The year also had some positions that detracted from performance. Shaw Group was hurt by the lack of large orders for its engineering
4
and construction business. The acceptance of Quest Software’s cloud computing software did not develop in line with our investment thesis and the holding was sold from the fund. Forest Oil came under pressure as smaller energy stocks moved lower in tandem with the summer price decline of crude oil. Overweights in the building products and household durable area caused a modest drag on performance as evidence of a turn in residential construction remained deferred.
Uncertainty Creates Opportunity
We remain committed to finding companies priced below their real worth that are positioned to deliver strong earnings and cash flow over the next few years.While there are a number of concerns dominating the current investment landscape, we believe that investors’ current focus on short-term results is likely to shift to a long term perspective in time. As in the past, when a greater level of clarity returns to the market, we would expect our approach to regain favor and more competitive returns to be delivered in that more traditional environment. In the meantime, we have found what we believe are a number of exciting investment opportunities in the industrials, consumer discretionary and information technology sectors.We have found fewer opportunities in the financials sector, where we remain concerned about the fundamental prospects of commercial banks and REITs.We are also underweight the utilities sector, where few companies meet our valuation standards.
September 15, 2011
| |
| | Please note, the position in any security highlighted with italicized typeface was sold during the |
| | reporting period. |
| | Equity funds are subject generally to market, market sector, market liquidity, issuer and investment |
| | style risks, among other factors, to varying degrees, all of which are more fully described in the |
| | fund’s prospectus. |
| | Stocks of small- and/or midcap companies often experience sharper price fluctuations than stocks |
| | of large-cap companies. |
| 1 | Total return includes reinvestment of dividends and any capital gains paid and does not take into |
| | consideration the maximum initial sales charge in the case of Class A shares, or the applicable |
| | contingent deferred sales charge imposed on redemptions in the case of Class C shares. Had these |
| | charges been reflected, returns would have been lower. Past performance is no guarantee of future |
| | results. Share price and investment return fluctuate such that upon redemption, fund shares may be |
| | worth more or less than their original cost. |
| 2 | SOURCE: LIPPER INC. — Reflects reinvestment of dividends and, where applicable, capital |
| | gain distributions.The Russell Midcap Value Index is a widely accepted, unmanaged index of |
| | medium-cap stock market performance and measures the performance of those Russell midcap |
| | companies with lower price-to-book ratios and lower forecasted growth values. Investors cannot |
| | invest directly in any index. |
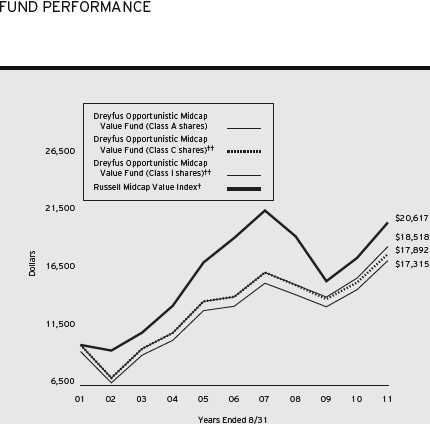

| |
| † | Source: Lipper Inc. |
| †† | The total return figures presented for Class C shares of the fund reflect the performance of the fund’s Class A shares |
| | for the period prior to May 30, 2008 (the inception date for Class C shares), adjusted to reflect the applicable sales |
| | load for that share class.The total return figures presented for Class I shares of the fund reflect the performance of the |
| | fund’s Class A shares for the period prior to May 30, 2008 (the inception date for Class I shares). |
| Past performance is not predictive of future performance. |
| The above graph compares a $10,000 investment made in each of the Class A, Class C and Class I shares of Dreyfus |
| Opportunistic Midcap Value Fund on 8/31/01 to a $10,000 investment made in the Russell Midcap Value Index (the |
| “Index”) on that date.All dividends and capital gain distributions are reinvested. |
| Effective 1/1/2011, Dreyfus Midcap Value Fund changed its name to Dreyfus Opportunistic Midcap Value Fund. |
| The fund’s performance shown in the line graph above takes into account the maximum initial sales charge on Class A |
| shares and all other applicable fees and expenses on all classes.The Index is a widely accepted, unmanaged index of |
| medium-cap stock market performance and measures the performance of those Russell Midcap companies with lower |
| price-to-book ratios and lower forecasted growth values. Unlike a mutual fund, the Index is not subject to charges, fees |
| and other expenses. Investors cannot invest directly in any index. Further information relating to fund performance, |
| including expense reimbursements, if applicable, is contained in the Financial Highlights section of the prospectus and |
| elsewhere in this report. |
6
| | | | | | | |
| Average Annual Total Returns as of 8/31/11 | | | |
| |
| Inception | | | |
| | Date | 1Year | 5 Years | 10 Years |
| Class A shares | | | | |
| with maximum sales charge (5.75%) | 9/29/95 | 10.29% | 4.09% | 5.64% |
| without sales charge | 9/29/95 | 17.03% | 5.33% | 6.27% |
| Class C shares | | | | |
| with applicable redemption charge † | 5/30/08 | 15.09% | 4.78%†† | 5.99%†† |
| without redemption | 5/30/08 | 16.09% | 4.78%†† | 5.99%†† |
| Class I shares | 5/30/08 | 17.29% | 5.50%†† | 6.36%†† |
| Russell Midcap Value Index | | 17.51% | 1.36% | 7.50% |
Past performance is not predictive of future performance.The fund’s performance shown in the graph and table does not reflect the deduction of taxes that a shareholder would pay on fund distributions or the redemption of fund shares.
| |
| † | The maximum contingent deferred sales charge for Class C shares is 1% for shares redeemed within one year of the |
| | date of purchase. |
| †† | The total return performance figures presented for Class C shares of the fund reflect the performance of the fund’s |
| | Class A shares for the period prior to May 30, 2008 (the inception date for Class C shares), adjusted to reflect the |
| | applicable sales load for that share class.The total return performance figures presented for Class I shares of the fund |
| | reflect the performance of the fund’s Class A shares for the period prior to May 30, 2008 (the inception date for |
| | Class I shares). |
UNDERSTANDING YOUR FUND’S EXPENSES (Unaudited)
As a mutual fund investor, you pay ongoing expenses, such as management fees and other expenses. Using the information below, you can estimate how these expenses affect your investment and compare them with the expenses of other funds.You also may pay one-time transaction expenses, including sales charges (loads) and redemption fees, which are not shown in this section and would have resulted in higher total expenses. For more information, see your fund’s prospectus or talk to your financial adviser.
Review your fund’s expenses
The table below shows the expenses you would have paid on a $1,000 investment in Dreyfus Opportunistic Midcap Value Fund from March 1, 2011 to August 31, 2011. It also shows how much a $1,000 investment would be worth at the close of the period, assuming actual returns and expenses.
Expenses and Value of a $1,000 Investment
assuming actual returns for the six months ended August 31, 2011
| | | | | | |
| | | Class A | | Class C | | Class I |
| Expenses paid per $1,000† | $ | 5.49 | $ | 9.19 | $ | 4.65 |
| Ending value (after expenses) | $ | 844.60 | $ | 841.20 | $ | 845.30 |
COMPARING YOUR FUND’S EXPENSES
WITH THOSE OF OTHER FUNDS (Unaudited)
Using the SEC’s method to compare expenses
The Securities and Exchange Commission (SEC) has established guidelines to help investors assess fund expenses. Per these guidelines, the table below shows your fund’s expenses based on a $1,000 investment, assuming a hypothetical 5% annualized return. You can use this information to compare the ongoing expenses (but not transaction expenses or total cost) of investing in the fund with those of other funds.All mutual fund shareholder reports will provide this information to help you make this comparison. Please note that you cannot use this information to estimate your actual ending account balance and expenses paid during the period.
Expenses and Value of a $1,000 Investment
assuming a hypothetical 5% annualized return for the six months ended August 31, 2011
| | | | | | |
| | | Class A | | Class C | | Class I |
| Expenses paid per $1,000† | $ | 6.01 | $ | 10.06 | $ | 5.09 |
| Ending value (after expenses) | $ | 1,019.26 | $ | 1,015.22 | $ | 1,020.16 |
|
| Expenses are equal to the fund’s annualized expense ratio of 1.18% for Class A, 1.98% for Class C and 1.00% |
| for Class I, multiplied by the average account value over the period, multiplied by 184/365 (to reflect the one-half |
| year period). |
8
|
| STATEMENT OF INVESTMENTS |
| August 31, 2011 |
| | | |
| Common Stocks—99.6% | Shares | Value ($) |
| Consumer Discretionary—20.4% | | |
| Abercrombie & Fitch, Cl. A | 448,090 | 28,503,005 |
| CBS, Cl. B | 1,039,960 | 26,050,998 |
| D.R. Horton | 3,201,000 | 33,674,520 |
| Dana Holding | 1,214,607a | 15,486,239 |
| Guess? | 442,780 | 15,103,226 |
| Lowe’s | 1,524,820 | 30,389,663 |
| Mohawk Industries | 713,472a | 35,352,538 |
| Newell Rubbermaid | 2,305,590 | 31,909,366 |
| Viacom, Cl. B | 133,040 | 6,417,850 |
| Williams-Sonoma | 427,630 | 14,158,829 |
| | | 237,046,234 |
| Consumer Staples—1.7% | | |
| Kroger | 849,960 | 20,025,058 |
| Energy—6.7% | | |
| Cabot Oil & Gas | 347,640 | 26,371,970 |
| Consol Energy | 294,580 | 13,450,523 |
| EQT | 121,550 | 7,271,121 |
| Forest Oil | 482,780a | 9,399,727 |
| Pioneer Natural Resources | 207,940 | 16,254,670 |
| SandRidge Energy | 662,860a | 4,865,392 |
| | | 77,613,403 |
| Financial—11.3% | | |
| CB Richard Ellis Group, Cl. A | 1,851,712a | 28,071,954 |
| Fifth Third Bancorp | 1,352,440 | 14,362,913 |
| Jones Lang LaSalle | 68,730 | 4,598,724 |
| Lincoln National | 745,650 | 15,472,237 |
| Popular | 4,051,340a | 8,426,787 |
| TD Ameritrade Holding | 1,228,690 | 18,897,252 |
| Willis Group Holdings | 821,060 | 32,128,078 |
| Zions Bancorporation | 534,290 | 9,318,018 |
| | | 131,275,963 |
| Health Care—8.9% | | |
| CareFusion | 235,340a | 6,027,057 |
| CIGNA | 297,880 | 13,922,911 |
| Salix Pharmaceuticals | 278,050a | 8,466,622 |
STATEMENT OF INVESTMENTS (continued)
| | | |
| Common Stocks (continued) | Shares | Value ($) |
| Health Care (continued) | | |
| St. Jude Medical | 382,500 | 17,419,050 |
| Thermo Fisher Scientific | 473,890a | 26,030,778 |
| United Therapeutics | 401,610a | 17,329,471 |
| Warner Chilcott, Cl. A | 830,380 | 14,166,283 |
| | | 103,362,172 |
| Industrial—21.1% | | |
| Con-way | 334,870 | 8,569,323 |
| Equifax | 523,610 | 16,928,311 |
| Herman Miller | 286,860 | 5,699,908 |
| Hubbell, Cl. B | 417,760 | 24,702,149 |
| Ingersoll-Rand | 698,430 | 23,404,389 |
| Lennox International | 272,460 | 8,506,201 |
| Masco | 1,011,980 | 8,976,263 |
| Oshkosh | 282,750a | 5,575,830 |
| Regal-Beloit | 336,700 | 19,794,593 |
| Robert Half International | 916,590 | 21,924,833 |
| Shaw Group | 689,632a | 16,075,322 |
| SPX | 133,610 | 7,601,073 |
| Stanley Black & Decker | 527,770 | 32,711,185 |
| Textron | 1,171,134 | 19,757,031 |
| Trinity Industries | 886,790 | 24,439,932 |
| | | 244,666,343 |
| Information Technology—19.9% | | |
| Alliance Data Systems | 323,240a | 30,193,848 |
| Avnet | 705,283a | 18,506,626 |
| BMC Software | 617,240a | 25,066,116 |
| Broadcom, Cl. A | 855,410a | 30,495,366 |
| Cypress Semiconductor | 640,750a | 10,149,480 |
| Electronic Arts | 1,204,820a | 27,204,836 |
| Intuit | 785,350 | 38,741,315 |
| JDS Uniphase | 454,690a | 5,897,329 |
| MICROS Systems | 553,060a | 26,358,840 |
| TE Connectivity | 444,580 | 13,613,040 |
| Vishay Intertechnology | 380,697a | 4,339,946 |
| | | 230,566,742 |
10
| | | | |
| Common Stocks (continued) | | Shares | | Value ($) |
| Materials—3.7% | | | | |
| Crown Holdings | | 312,250 | a | 11,075,507 |
| Sherwin-Williams | | 426,000 | | 32,265,240 |
| | | | | 43,340,747 |
| Telecommunication Services—2.7% | | | |
| Frontier Communications | | 4,157,220 | | 31,137,578 |
| Utilities—3.2% | | | | |
| Ameren | | 217,980 | | 6,596,075 |
| Great Plains Energy | | 826,453 | | 16,157,156 |
| Questar | | 734,970 | | 13,773,338 |
| | | | | 36,526,569 |
| |
| Total Investments (cost $1,146,810,771) | 99.6 | % | 1,155,560,809 |
| Cash and Receivables (Net) | | .4 | % | 4,318,161 |
| Net Assets | | 100.0 | % | 1,159,878,970 |
| |
| a Non-income producing security. | | | | |
| |
| |
| |
| Portfolio Summary (Unaudited)† | | | |
| | Value (%) | | | Value (%) |
| Industrial | 21.1 | Materials | | 3.7 |
| Consumer Discretionary | 20.4 | Utilities | | 3.2 |
| Information Technology | 19.9 | Telecommunication Services | | 2.7 |
| Financial | 11.3 | Consumer Staples | | 1.7 |
| Health Care | 8.9 | | | |
| Energy | 6.7 | | | 99.6 |
| |
| † Based on net assets. | | | | |
| See notes to financial statements. | | | | |
|
| STATEMENT OF ASSETS AND LIABILITIES |
| August 31, 2011 |
| | | |
| | | Cost | Value |
| Assets ($): | | | |
| Investments in securities—See Statement of Investments | 1,146,810,771 | 1,155,560,809 |
| Cash | | | 1,515,874 |
| Receivable for investment securities sold | | | 22,178,253 |
| Dividends and securities lending income receivable | | 1,526,158 |
| Receivable for shares of Common Stock subscribed | | 908,760 |
| Prepaid expenses | | | 80,614 |
| | | | 1,181,770,468 |
| Liabilities ($): | | | |
| Due to The Dreyfus Corporation and affiliates—Note 3(c) | | 1,054,070 |
| Bank loan payable—Note 2 | | | 10,100,000 |
| Payable for investment securities purchased | | | 6,057,608 |
| Payable for shares of Common Stock redeemed | | | 4,053,895 |
| Interest payable—Note 2 | | | 27,759 |
| Accrued expenses | | | 598,166 |
| | | | 21,891,498 |
| Net Assets ($) | | | 1,159,878,970 |
| Composition of Net Assets ($): | | | |
| Paid-in capital | | | 992,425,359 |
| Accumulated undistributed investment income—net | | 8,220,923 |
| Accumulated net realized gain (loss) on investments | | 150,482,650 |
| Accumulated net unrealized appreciation | | | |
| (depreciation) on investments | | | 8,750,038 |
| Net Assets ($) | | | 1,159,878,970 |
| |
| |
| Net Asset Value Per Share | | | |
| | Class A | Class C | Class I |
| Net Assets ($) | 1,057,495,318 | 22,343,078 | 80,040,574 |
| Shares Outstanding | 33,902,046 | 738,917 | 2,564,189 |
| Net Asset Value Per Share ($) | 31.19 | 30.24 | 31.21 |
| |
| See notes to financial statements. | | | |
12
|
| STATEMENT OF OPERATIONS |
| Year Ended August 31, 2011 |
| | |
| Investment Income ($): | |
| Income: | |
| Cash dividends: | |
| Unaffiliated issuers | 26,887,774 |
| Affiliated issuers | 31,225 |
| Income from securities lending—Note 1(b) | 134,614 |
| Total Income | 27,053,613 |
| Expenses: | |
| Management fee—Note 3(a) | 11,297,783 |
| Shareholder servicing costs—Note 3(c) | 5,651,306 |
| Distribution fees—Note 3(b) | 118,110 |
| Prospectus and shareholders’ reports | 98,925 |
| Custodian fees—Note 3(c) | 98,763 |
| Professional fees | 74,552 |
| Directors’ fees and expenses—Note 3(d) | 71,362 |
| Registration fees | 70,469 |
| Interest expense—Note 2 | 35,644 |
| Loan commitment fees—Note 2 | 34,094 |
| Miscellaneous | 36,199 |
| Total Expenses | 17,587,207 |
| Less—reduction in fees due to earnings credits—Note 3(c) | (1,249) |
| Net Expenses | 17,585,958 |
| Investment Income—Net | 9,467,655 |
| Realized and Unrealized Gain (Loss) on Investments—Note 4 ($): | |
| Net realized gain (loss) on investments | 209,634,155 |
| Net unrealized appreciation (depreciation) on investments | (44,876,492) |
| Net Realized and Unrealized Gain (Loss) on Investments | 164,757,663 |
| Net Increase in Net Assets Resulting from Operations | 174,225,318 |
| |
| See notes to financial statements. | |
STATEMENT OF CHANGES IN NET ASSETS
| | | | |
| | Year Ended August 31, |
| | 2011 | 2010 |
| Operations ($): | | |
| Investment income (loss)—net | 9,467,655 | (238,982) |
| Net realized gain (loss) on investments | 209,634,155 | 184,674,359 |
| Net unrealized appreciation | | |
| (depreciation) on investments | (44,876,492) | (85,913,761) |
| Net Increase (Decrease) in Net Assets | | |
| Resulting from Operations | 174,225,318 | 98,521,616 |
| Dividends to Shareholders from ($): | | |
| Investment income—net: | | |
| Class A Shares | — | (2,770,648) |
| Class C Shares | — | (10,623) |
| Class I Shares | — | (102,778) |
| Total Dividends | — | (2,884,049) |
| Capital Stock Transactions ($): | | |
| Net proceeds from shares sold: | | |
| Class A Shares | 432,391,865 | 350,844,684 |
| Class C Shares | 22,778,559 | 5,597,069 |
| Class I Shares | 112,663,999 | 25,437,590 |
| Dividends reinvested: | | |
| Class A Shares | — | 2,728,543 |
| Class C Shares | — | 10,534 |
| Class I Shares | — | 85,656 |
| Cost of shares redeemed: | | |
| Class A Shares | (628,571,460) | (329,279,606) |
| Class C Shares | (3,870,375) | (1,662,435) |
| Class I Shares | (39,986,018) | (19,041,934) |
| Increase (Decrease) in Net Assets | | |
| from Capital Stock Transactions | (104,593,430) | 34,720,101 |
| Total Increase (Decrease) in Net Assets | 69,631,888 | 130,357,668 |
| Net Assets ($): | | |
| Beginning of Period | 1,090,247,082 | 959,889,414 |
| End of Period | 1,159,878,970 | 1,090,247,082 |
| Undistributed investment income—net | 8,220,923 | — |
14
| | | | |
| | Year Ended August 31, |
| | 2011 | 2010 |
| Capital Share Transactions: | | |
| Class A | | |
| Shares sold | 12,421,736 | 12,855,086 |
| Shares issued for dividends reinvested | — | 104,743 |
| Shares redeemed | (18,601,120) | (12,315,815) |
| Net Increase (Decrease) in Shares Outstanding | (6,179,384) | 644,014 |
| Class C | | |
| Shares sold | 655,348 | 203,460 |
| Shares issued for dividends reinvested | — | 408 |
| Shares redeemed | (116,712) | (62,529) |
| Net Increase (Decrease) in Shares Outstanding | 538,636 | 141,339 |
| Class I | | |
| Shares sold | 3,143,657 | 892,989 |
| Shares issued for dividends reinvested | — | 3,214 |
| Shares redeemed | (1,206,834) | (718,116) |
| Net Increase (Decrease) in Shares Outstanding | 1,936,823 | 178,087 |
| |
| See notes to financial statements. | | |
FINANCIAL HIGHLIGHTS
The following tables describe the performance for each share class for the fiscal periods indicated.All information (except portfolio turnover rate) reflects financial results for a single fund share.Total return shows how much your investment in the fund would have increased (or decreased) during each period, assuming you had reinvested all dividends and distributions.These figures have been derived from the fund’s financial statements.
| | | | | | | | | |
| | | Year Ended August 31, | |
| Class A Shares | 2011 | 2010 | 2009 | 2008a | 2007 |
| Per Share Data ($): | | | | | |
| Net asset value, beginning of period | 26.65 | 24.03 | 25.95 | 33.32 | 31.62 |
| Investment Operations: | | | | | |
| Investment income (loss)—netb | .22 | (.01) | .09 | .03 | .12 |
| Net realized and unrealized | | | | | |
| gain (loss) on investments | 4.32 | 2.70c | (1.98) | (1.68) | 4.52 |
| Total from Investment Operations | 4.54 | 2.69 | (1.89) | (1.65) | 4.64 |
| Distributions: | | | | | |
| Dividends from investment income—net | — | (.07) | (.03) | (.05) | (.06) |
| Dividends from net realized | | | | | |
| gain on investments | — | — | — | (5.67) | (2.88) |
| Total Distributions | — | (.07) | (.03) | (5.72) | (2.94) |
| Net asset value, end of period | 31.19 | 26.65 | 24.03 | 25.95 | 33.32 |
| Total Return (%)d | 17.03 | 11.20 | (7.22) | (6.59) | 14.96 |
| Ratios/Supplemental Data (%): | | | | | |
| Ratio of total expenses | | | | | |
| to average net assets | 1.17 | 1.18 | 1.23 | 1.20 | 1.18 |
| Ratio of net expenses | | | | | |
| to average net assets | 1.17 | 1.18 | 1.22 | 1.20 | 1.18 |
| Ratio of net investment income | | | | | |
| (loss) to average net assets | .64 | (.02) | .48 | .10 | .35 |
| Portfolio Turnover Rate | 114.02 | 122.17 | 170.88 | 144.14 | 165.55 |
| Net Assets, end of period | | | | | |
| ($ x 1,000) | 1,057,495 | 1,068,338 | 947,716 | 776,889 | 1,047,706 |
|
| a The fund commenced offering four classes of shares on May 30, 2008 and existing shares were redesignated |
| Class A shares. |
| b Based on average shares outstanding at each month end. |
| c Amount includes litigation proceeds received by the fund amounting to $.02 per share for the year ended |
| August 31, 2010. |
| d Exclusive of sales charge. |
See notes to financial statements.
16
| | | | | | | | |
| | | Year Ended August 31, | |
| Class C Shares | 2011 | 2010 | 2009 | 2008a |
| Per Share Data ($): | | | | |
| Net asset value, beginning of period | 26.05 | 23.72 | 25.89 | 28.17 |
| Investment Operations: | | | | |
| Investment (loss)—netb | (.16) | (.23) | (.10) | (.05) |
| Net realized and unrealized | | | | |
| gain (loss) on investments | 4.35 | 2.67c | (1.99) | (2.23) |
| Total from Investment Operations | 4.19 | 2.44 | (2.09) | (2.28) |
| Distributions: | | | | |
| Dividends from investment income—net | — | (.11) | (.08) | — |
| Net asset value, end of period | 30.24 | 26.05 | 23.72 | 25.89 |
| Total Return (%)d | 16.09 | 10.29 | (7.98) | (8.55)e |
| Ratios/Supplemental Data (%): | | | | |
| Ratio of total expenses to average net assets | 2.00 | 2.02 | 1.88 | 2.07f |
| Ratio of net expenses to average net assets | 2.00 | 2.02 | 1.88 | 2.06f |
| Ratio of net investment (loss) | | | | |
| to average net assets | (.48) | (.83) | (.48) | (.76)f |
| Portfolio Turnover Rate | 114.02 | 122.17 | 170.88 | 144.14 |
| Net Assets, end of period ($ x 1,000) | 22,343 | 5,218 | 1,398 | 26 |
|
| a From May 30, 2008 (commencement of initial offering) to August 31, 2008. |
| b Based on average shares outstanding at each month end. |
| c Amount includes litigation proceeds received by the fund amounting to $.02 per share for the year ended |
| August 31, 2010. |
| d Exclusive of sales charge. |
| e Not annualized. |
| f Annualized. |
See notes to financial statements.
FINANCIAL HIGHLIGHTS (continued)
| | | | | | | |
| | | Year Ended August 31, | |
| Class I Shares | 2011 | 2010 | 2009 | 2008a |
| Per Share Data ($): | | | | |
| Net asset value, beginning of period | 26.61 | 23.98 | 25.95 | 28.17 |
| Investment Operations: | | | | |
| Investment income—netb | .18 | .10 | .15 | .00c |
| Net realized and unrealized | | | | |
| gain (loss) on investments | 4.42 | 2.69d | (2.02) | (2.22) |
| Total from Investment Operations | 4.60 | 2.79 | (1.87) | (2.22) |
| Distributions: | | | | |
| Dividends from investment income—net | — | (.16) | (.10) | — |
| Net asset value, end of period | 31.21 | 26.61 | 23.98 | 25.95 |
| Total Return (%) | 17.29 | 11.64 | (7.05) | (8.37)e |
| Ratios/Supplemental Data (%): | | | | |
| Ratio of total expenses to average net assets | .96 | .84 | .84 | 1.17f |
| Ratio of net expenses to average net assets | .96 | .84 | .83 | 1.16f |
| Ratio of net investment income | | | | |
| to average net assets | .53 | .38 | .69 | .06f |
| Portfolio Turnover Rate | 114.02 | 122.17 | 170.88 | 144.14 |
| Net Assets, end of period ($ x 1,000) | 80,041 | 16,691 | 10,775 | 9 |
|
| a From May 30, 2008 (commencement of initial offering) to August 31, 2008. |
| b Based on average shares outstanding at each month end. |
| c Amount represents less than $.01 per share. |
| d Amount includes litigation proceeds received by the fund amounting to $.02 per share for the year ended |
| August 31, 2010. |
| e Not annualized. |
| f Annualized. |
See notes to financial statements.
18
NOTES TO FINANCIAL STATEMENTS
NOTE 1—Significant Accounting Policies:
Dreyfus Opportunistic Midcap Value Fund (the “fund”) is a separate diversified series of Advantage Funds, Inc. (the “Company”), which is registered under the Investment Company Act of 1940, as amended (the “Act”), as an open-end management investment company and operates as a series company offering thirteen series, including the fund.The fund’s investment objective seeks to surpass the performance of the Russell Midcap Value Index. The Dreyfus Corporation (the “Manager” or “Dreyfus”), a wholly-owned subsidiary of The Bank of New York Mellon Corporation (“BNY Mellon”), serves as the fund’s investment adviser.
At a meeting of the Board of Directors held on December 14, 2010, the Board approved, effective January 1, 2011, to change the name of the fund from “Dreyfus Midcap Value Fund” to “Dreyfus Opportunistic Midcap Value Fund”.
MBSC Securities Corporation (the “Distributor”), a wholly-owned subsidiary of the Manager, is the distributor of the fund’s shares.The fund is authorized to issue 600 million shares of $.001 par value Common Stock. The fund currently offers three classes of shares: Class A (350 million shares authorized), Class C (125 million shares authorized) and Class I (125 million shares authorized). Class C shares are subject to a contingent deferred sales charge (“CDSC”) imposed on Class C shares redeemed within one year of purchase. Class I shares are sold at net asset value per share only to institutional investors. Other differences between the classes include the services offered to and the expenses borne by each class, the allocation of certain transfer agency costs and certain voting rights. Income, expenses (other than expenses attributable to a specific class), and realized and unrealized gains or losses on investments are allocated to each class of shares based on its relative net assets.
NOTES TO FINANCIAL STATEMENTS (continued)
The Company accounts separately for the assets, liabilities and operations of each series. Expenses directly attributable to each series are charged to that series’ operations; expenses which are applicable to all series are allocated among them on a pro rata basis.
The Financial Accounting Standards Board (“FASB”) Accounting Standards Codification (“ASC”) is the exclusive reference of authoritative U.S. generally accepted accounting principles (“GAAP”) recognized by the FASB to be applied by nongovernmental entities. Rules and interpretive releases of the Securities and Exchange Commission (“SEC”) under authority of federal laws are also sources of authoritative GAAP for SEC registrants. The fund’s financial statements are prepared in accordance with GAAP, which may require the use of management estimates and assumptions.Actual results could differ from those estimates.
The Company enters into contracts that contain a variety of indemnifications. The fund’s maximum exposure under these arrangements is unknown.The fund does not anticipate recognizing any loss related to these arrangements.
(a) Portfolio valuation: The fair value of a financial instrument is the amount that would be received to sell an asset or paid to transfer a liability in an orderly transaction between market participants at the measurement date (i.e. the exit price). GAAP establishes a fair value hierarchy that prioritizes the inputs of valuation techniques used to measure fair value.This hierarchy gives the highest priority to unadjusted quoted prices in active markets for identical assets or liabilities (Level 1 measurements) and the lowest priority to unobservable inputs (Level 3 measurements).
Additionally, GAAP provides guidance on determining whether the volume and activity in a market has decreased significantly and whether such a decrease in activity results in transactions that are not orderly. GAAP requires enhanced disclosures around valuation inputs and techniques used during annual and interim periods.
20
Various inputs are used in determining the value of the fund’s investments relating to fair value measurements.These inputs are summarized in the three broad levels listed below:
Level 1—unadjusted quoted prices in active markets for identical investments.
Level 2—other significant observable inputs (including quoted prices for similar investments, interest rates, prepayment speeds, credit risk, etc.).
Level 3—significant unobservable inputs (including the fund’s own assumptions in determining the fair value of investments).
The inputs or methodology used for valuing securities are not necessarily an indication of the risk associated with investing in those securities.
Changes in valuation techniques may result in transfers in or out of an assigned level within the disclosure hierarchy. Valuation techniques used to value the fund’s investments are as follows:
Investments in securities are valued at the last sales price on the securities exchange or national securities market on which such securities are primarily traded. Securities listed on the National Market System for which market quotations are available are valued at the official closing price or, if there is no official closing price that day, at the last sales price. Securities not listed on an exchange or the national securities market, or securities for which there were no transactions, are valued at the average of the most recent bid and asked prices, except for open short positions, where the asked price is used for valuation purposes. Bid price is used when no asked price is available. Registered investment companies that are not traded on an exchange are valued at their net asset value. All preceding securities are categorized as Level 1 in the hierarchy.
Fair valuing of securities may be determined with the assistance of a pricing service using calculations based on indices of domestic securities and other appropriate indicators, such as prices of relevant
NOTES TO FINANCIAL STATEMENTS (continued)
American Depository Receipts and futures contracts. Utilizing these techniques may result in transfers between Level 1 and Level 2 of the fair value hierarchy.
When market quotations or official closing prices are not readily available, or are determined not to reflect accurately fair value, such as when the value of a security has been significantly affected by events after the close of the exchange or market on which the security is principally traded (for example, a foreign exchange or market), but before the fund calculates its net asset value, the fund may value these investments at fair value as determined in accordance with the procedures approved by the Board of Directors. Certain factors may be considered when fair valuing investments such as: fundamental analytical data, the nature and duration of restrictions on disposition, an evaluation of the forces that influence the market in which the securities are purchased and sold, and public trading in similar securities of the issuer or comparable issuers. These securities are either categorized as Level 2 or 3 depending on the relevant inputs used.
For restricted securities where observable inputs are limited, assumptions about market activity and risk are used and are categorized as Level 3 in the hierarchy.
The following is a summary of the inputs used as of August 31, 2011 in valuing the fund’s investments:
| | | | |
| | | Level 2—Other | Level 3— | |
| | Level 1— | Significant | Significant | |
| | Unadjusted | Observable | Unobservable | |
| | Quoted Prices | Inputs | Inputs | Total |
| Assets ($) | | | | |
| Investments in Securities: | | | |
| Equity Securities— | | | | |
| Domestic† | 1,123,432,731 | — | — | 1,123,432,731 |
| Equity Securities— | | | | |
| Foreign† | 32,128,078 | — | — | 32,128,078 |
| |
| † | See Statement of Investments for additional detailed categorizations. |
22
In January 2010, FASB issued Accounting Standards Update (“ASU”) No. 2010-06 “Improving Disclosures about FairValue Measurements” (“ASU 2010-06”). The portions of ASU 2010-06 which require reporting entities to prepare new disclosures surrounding amounts and reasons for significant transfers in and out of Level 1 and Level 2 fair value measurements as well as inputs and valuation techniques used to measure fair value for both recurring and nonrecurring fair value measurements that fall in either Level 2 or Level 3 have been adopted by the fund. No significant transfers between Level 1 or Level 2 fair value measurements occurred at August 31, 2011.
In May 2011, FASB issued ASU No. 2011-04 “Amendments to Achieve Common Fair Value Measurement and Disclosure Requirements in GAAP and International Financial Reporting Standards (“IFRS”)” (“ASU 2011-04”). ASU 2011-04 includes common requirements for measurement of and disclosure about fair value between GAAP and IFRS. ASU 2011-04 will require reporting entities to disclose the following information for fair value measurements categorized within Level 3 of the fair value hierarchy: quantitative information about the unobservable inputs used in the fair value measurement, the valuation processes used by the reporting entity and a narrative description of the sensitivity of the fair value measurement to changes in unobservable inputs and the interrelationships between those unobservable inputs. In addition, ASU 2011-04 will require reporting entities to make disclosures about amounts and reasons for all transfers in and out of Level 1 and Level 2 fair value measurements.The new and revised disclosures are effective for interim and annual reporting periods beginning after December 15, 2011. At this time, management is evaluating the implications of ASU 2011-04 and its impact on the financial statements.
(b) Securities transactions and investment income: Securities transactions are recorded on a trade date basis. Realized gains and losses from securities transactions are recorded on the identified cost basis.
NOTES TO FINANCIAL STATEMENTS (continued)
Dividend income is recognized on the ex-dividend date and interest income, including, where applicable, accretion of discount and amortization of premium on investments, is recognized on the accrual basis.
Pursuant to a securities lending agreement with The Bank of New York Mellon, a subsidiary of BNY Mellon and an affiliate of Dreyfus, the fund may lend securities to qualified institutions. It is the fund’s policy that, at origination, all loans are secured by collateral of at least 102% of the value of U.S. securities loaned and 105% of the value of foreign securities loaned. Collateral equivalent to at least 100% of the market value of securities on loan is maintained at all times. Collateral is either in the form of cash, which can be invested in certain money market mutual funds managed by Dreyfus, U.S. Government and Agency securities or letters of credit.The fund is entitled to receive all income on securities loaned, in addition to income earned as a result of the lending transaction. Although each security loaned is fully collateralized, the fund bears the risk of delay in recovery of, or loss of rights in, the securities loaned should a borrower fail to return the securities in a timely manner. During the period ended August 31, 2011, The Bank of New York Mellon earned $57,692 from lending portfolio securities, pursuant to the securities lending agreement.
(c) Affiliated issuers: Investments in other investment companies advised by Dreyfus are defined as “affiliated” in the Act.
The fund may invest in shares of certain affiliated investment companies also advised or managed by Dreyfus. Investments in affiliated investment companies for the period ended August 31, 2011 were as follows:
| | | | | | |
| Affiliated | | | | | | |
| Investment | Value | | | Value | Net |
| Company | 8/31/2010 ($) | Purchases ($) | Sales ($) | 8/31/2011 ($) | Assets (%) |
| Dreyfus | | | | | | |
| Institutional | | | | | |
| Preferred | | | | | |
| Plus Money | | | | | |
| Market Fund | — | 659,172,000 | 659,172,000 | — | — |
| Dreyfus | | | | | | |
| Institutional | | | | | |
| Cash | | | | | | |
| Advantage | | | | | |
| Fund | 76,719,345 | 1,051,618,608 | 1,128,337,953 | — | — |
24
(d) Dividends to shareholders: Dividends are recorded on the ex-dividend date. Dividends from investment income-net and dividends from net realized capital gains, if any, are normally declared and paid annually, but the fund may make distributions on a more frequent basis to comply with the distribution requirements of the Internal Revenue Code of 1986, as amended (the “Code”).To the extent that net realized capital gains can be offset by capital loss carryovers, it is the policy of the fund not to distribute such gains. Income and capital gain distributions are determined in accordance with income tax regulations, which may differ from GAAP.
(e) Federal income taxes: It is the policy of the fund to continue to qualify as a regulated investment company, if such qualification is in the best interests of its shareholders, by complying with the applicable provisions of the Code, and to make distributions of taxable income sufficient to relieve it from substantially all federal income and excise taxes.
As of and during the period ended August 31, 2011, the fund did not have any liabilities for any uncertain tax positions.The fund recognizes interest and penalties, if any, related to uncertain tax positions as income tax expense in the Statement of Operations. During the period, the fund did not incur any interest or penalties.
Each of the tax years in the four-year period ended August 31, 2011 remains subject to examination by the Internal Revenue Service and state taxing authorities.
At August 31, 2011, the components of accumulated earnings on a tax basis were as follows: undistributed ordinary income $22,468,678, undistributed capital gains $156,580,736 and unrealized depreciation $11,595,803.
The tax character of distributions paid to shareholders during the fiscal periods ended August 31, 2011 and August 31, 2010 were as follows: ordinary income $0 and $2,884,049, respectively.
During the period ended August 31, 2011, as a result of permanent book to tax differences, primarily due to the tax treatment for real
NOTES TO FINANCIAL STATEMENTS (continued)
estate investment trusts and limited partnerships, the fund decreased accumulated undistributed investment income-net by $1,246,732, increased accumulated net realized gain (loss) on investments by $1,219,103 and increased paid-in capital by $27,629. Net assets and net asset value per share were not affected by this reclassification.
NOTE 2—Bank Lines of Credit:
The fund participates with other Dreyfus-managed funds in a $225 million unsecured credit facility led by Citibank, N.A. and a $300 million unsecured credit facility provided by The Bank of New York Mellon (each, a “Facility”), each to be utilized primarily for temporary or emergency purposes, including the financing of redemptions. In connection therewith, the fund has agreed to pay its pro rata portion of commitment fees for each Facility. Interest is charged to the fund based on rates determined pursuant to the terms of the respective Facility at the time of borrowing.
The average amount of borrowings outstanding under the Facilities during the period ended August 31, 2011 was approximately $2,591,200, with a related weighted average annualized interest rate of 1.38%.
NOTE 3—Management Fee and Other Transactions With Affiliates:
(a) Pursuant to a management agreement with the Manager, the management fee is computed at the annual rate of .75% of the value of the fund’s average daily net assets and is payable monthly.
During the period ended August 31, 2011, the Distributor retained $91,859 from commissions earned on sales of the fund’s Class A shares and $4,176 from CDSCs on redemptions of the fund’s Class C shares.
(b) Under the Distribution Plan (the “Plan”) adopted pursuant to Rule 12b-1 under the Act, Class C shares pay the Distributor for distributing its shares at an annual rate of .75% of the value of its average daily net assets. During the period ended August 31, 2011, Class C shares were charged $118,110 pursuant to the Plan.
26
(c) Under the Shareholder Services Plan (“Shareholder Services Plan”), Class A and Class C shares pay the Distributor at an annual rate of .25% of the value of their average daily net assets for the provision of certain services.The services provided may include personal services relating to shareholder accounts, such as answering shareholder inquiries regarding Class A and Class C shares and providing reports and other information, and services related to the maintenance of shareholder accounts. The Distributor may make payments to Service Agents (a securities dealer, financial institution or industry professional) in respect of these services. The Distributor determines the amounts to be paid to Service Agents. During the period ended August 31 2011, Class A and Class C shares were charged $3,607,889 and $39,370, respectively, pursuant to the Shareholder Services Plan.
The fund compensates Dreyfus Transfer, Inc., a wholly-owned subsidiary of the Manager, under a transfer agency agreement for providing personnel and facilities to perform transfer agency services for the fund. During the period ended August 31, 2011, the fund was charged $173,218 pursuant to the transfer agency agreement, which is included in Shareholder servicing costs in the Statement of Operations.
The fund has arrangements with the custodian and cash management bank whereby the fund may receive earnings credits when positive cash balances are maintained, which are used to offset custody and cash management fees. For financial reporting purposes, the fund includes net earnings credits as an expense offset in the Statement of Operations.
The fund compensates The Bank of New York Mellon under a cash management agreement for performing cash management services related to fund subscriptions and redemptions. During the period ended August 31, 2011, the fund was charged $28,649 pursuant to the cash management agreement, which is included in Shareholder servicing costs in the Statement of Operations.These fees were partially offset by earnings credits of $1,249.
NOTES TO FINANCIAL STATEMENTS (continued)
The fund also compensates The Bank of New York Mellon under a custody agreement for providing custodial services for the fund. During the period ended August 31, 2011, the fund was charged $98,763 pursuant to the custody agreement.
During the period ended August 31, 2011, the fund was charged $7,225 for services performed by the Chief Compliance Officer.
The components of “Due to The Dreyfus Corporation and affiliates” in the Statement of Assets and Liabilities consist of: management fees $745,741, Rule 12b-1 distribution plan fees $13,890, shareholder services plan fees $231,651, custodian fees $32,000, chief compliance officer fees $3,253 and transfer agency per account fees $27,535.
(d) Each Board member also serves as a Board member of other funds within the Dreyfus complex. Annual retainer fees and attendance fees are allocated to each fund based on net assets.
NOTE 4—Securities Transactions:
The aggregate amount of purchases and sales of investment securities, excluding short-term securities, during the period ended August 31, 2011, amounted to $1,676,615,145 and $1,775,745,617, respectively.
At August 31, 2011, the cost of investments for federal income tax purposes was $1,167,156,612; accordingly, accumulated net unrealized depreciation on investments was $11,595,803, consisting of $107,604,387 gross unrealized appreciation and $119,200,190 gross unrealized depreciation.
28
|
| REPORT OF INDEPENDENT REGISTERED |
| PUBLIC ACCOUNTING FIRM |
Shareholders and Board of Directors Dreyfus Opportunistic Midcap Value Fund
We have audited the accompanying statement of assets and liabilities, including the statement of investments, of Dreyfus Opportunistic MidcapValue Fund (formerly Dreyfus MidcapValue Fund) (one of the series comprising Advantage Funds, Inc.) as of August 31, 2011, and the related statement of operations for the year then ended, the statement of changes in net assets for each of the two years in the period then ended, and financial highlights for each of the periods indicated therein.These financial statements and financial highlights are the responsibility of the Fund’s management. Our responsibility is to express an opinion on these financial statements and financial highlights based on our audits.
We conducted our audits in accordance with the standards of the Public Company Accounting Oversight Board (United States).Those standards require that we plan and perform the audit to obtain reasonable assurance about whether the financial statements and financial highlights are free of material misstatement.We were not engaged to perform an audit of the Fund’s internal control over financial reporting. Our audits included consideration of internal control over financial reporting as a basis for designing audit procedures that are appropriate in the circumstances, but not for the purpose of expressing an opinion on the effectiveness of the Fund’s internal control over financial reporting. Accordingly, we express no such opinion.An audit also includes examining, on a test basis, evidence supporting the amounts and disclosures in the financial statements and financial highlights, assessing the accounting principles used and significant estimates made by management, and evaluating the overall financial statement presentation. Our procedures included confirmation of securities owned as of August 31, 2011 by correspondence with the custodian and others. We believe that our audits provide a reasonable basis for our opinion.
In our opinion, the financial statements and financial highlights referred to above present fairly, in all material respects, the financial position of Dreyfus Opportunistic Midcap Value Fund at August 31, 2011, the results of its operations for the year then ended, the changes in its net assets for each of the two years in the period then ended, and the financial highlights for each of the indicated periods, in conformity with U.S. generally accepted accounting principles.

|
| New York, New York |
| October 27, 2011 |
|
| INFORMATION ABOUT THE RENEWAL OF THE |
| FUND’S MANAGEMENT AGREEMENT (Unaudited) |
At a meeting of the fund’s Board of Directors held on March 1, 2011, the Board considered the renewal of the fund’s Management Agreement pursuant to which Dreyfus provides the fund with investment advisory and administrative services (the “Agreement”). The Board members, none of whom are “interested persons” (as defined in the Investment Company Act of 1940, as amended) of the fund, were assisted in their review by independent legal counsel and met with counsel in executive session separate from representatives of Dreyfus. In considering the renewal of the Agreement, the Board considered all factors that it believed to be relevant, including those discussed below.The Board did not identify any one factor as dispositive, and each Board member may have attributed different weights to the factors considered.
Analysis of Nature, Extent, and Quality of Services Provided to the Fund.The Board members considered information previously provided to them in presentations from representatives of Dreyfus regarding the nature, extent, and quality of the services provided to funds in the Dreyfus fund complex, and representatives of Dreyfus confirmed that there had been no material changes in this information. Dreyfus provided the number of open accounts in the fund, the fund’s asset size and the allocation of fund assets among distribution channels. Dreyfus also had previously provided information regarding the diverse intermediary relationships and distribution channels of funds in the Dreyfus fund complex and Dreyfus’ corresponding need for broad, deep, and diverse resources to be able to provide ongoing shareholder services to each distribution channel, including the distribution channel(s) for the fund.
The Board members also considered research support available to, and portfolio management capabilities of, the fund’s portfolio management personnel and that Dreyfus also provides oversight of day-to-day fund operations, including fund accounting and administration and assistance in meeting legal and regulatory requirements.The Board members also considered Dreyfus’ extensive administrative, accounting, and compli-
30
ance infrastructures.The Board also considered portfolio management’s brokerage policies and practices (including policies and practices regarding soft dollars) and the standards applied in seeking best execution.
Comparative Analysis of the Fund’s Performance and Management Fee and Expense Ratio. The Board members reviewed reports prepared by Lipper, Inc. (“Lipper”), an independent provider of investment company data, which included information comparing (1) the fund’s performance with the performance of a group of comparable funds (the “Performance Group”) and with a broader group of funds (the “Performance Universe”), all for various periods ended December 31, 2010, and (2) the fund’s actual and contractual management fees and total expenses with those of a group of comparable funds (the “Expense Group”) and with a broader group of funds (the “Expense Universe”), the information for which was derived in part from fund financial statements available to Lipper as of December 31, 2010. Dreyfus previously had furnished the Board with a description of the methodology Lipper used to select the Performance Group and Performance Universe and the Expense Group and Expense Universe.
Dreyfus representatives stated that the usefulness of performance comparisons may be affected by a number of factors, including different investment limitations that may be applicable to the fund and comparison funds. The Board members discussed the results of the comparisons and noted that the fund’s total return performance was above the Performance Group and Performance Universe medians, ranking in the first quartile for most of the periods. Dreyfus also provided a comparison of the fund’s calendar year total returns to the returns of the fund’s benchmark index.
The Board members also reviewed the range of actual and contractual management fees and total expenses of the Expense Group and Expense Universe funds and discussed the results of the comparisons.They noted
|
| INFORMATION ABOUT THE RENEWAL OF THE FUND’S |
| MANAGEMENT AGREEMENT (Unaudited) (continued) |
that the fund’s contractual management fee was at the Expense Group median, the fund’s actual management fee was above the Expense Group and Expense Universe medians and the fund’s total expenses were below the Expense Group and the Expense Universe medians.
Representatives of Dreyfus reviewed with the Board members the management or investment advisory fees (1) paid by funds advised or administered by Dreyfus that are in the same Lipper category as the fund and (2) paid to Dreyfus or the Dreyfus-affiliated primary employer of the fund’s primary portfolio manager for advising any separate accounts and/or other types of client portfolios that are considered to have similar investment strategies and policies as the fund (the “Similar Clients”), and explained the nature of the Similar Clients.They discussed differences in fees paid and the relationship of the fees paid in light of any differences in the services provided and other relevant factors.The Board members considered the relevance of the fee information provided for the Similar Clients to evaluate the appropriateness and reasonableness of the fund’s management fee.
Analysis of Profitability and Economies of Scale. Dreyfus’ representatives reviewed the expenses allocated and profit received by Dreyfus and the resulting profitability percentage for managing the fund, and the method used to determine the expenses and profit.The Board concluded that the profitability results were not unreasonable, given the services rendered and service levels provided by Dreyfus.The Board previously had been provided with information prepared by an independent consulting firm regarding Dreyfus’ approach to allocating costs to, and determining the profitability of, individual funds and the entire Dreyfus fund complex. The consulting firm also had analyzed where any economies of scale might emerge in connection with the management of a fund.
The Board’s counsel stated that the Board members should consider the profitability analysis (1) as part of their evaluation of whether the fees under the Agreement bear a reasonable relationship to the mix of
32
services provided by Dreyfus, including the nature, extent and quality of such services, and (2) in light of the relevant circumstances for the fund and the extent to which economies of scale would be realized if the fund grows and whether fee levels reflect these economies of scale for the benefit of fund shareholders. Dreyfus representatives noted that, as a result of shared and allocated costs among funds in the Dreyfus funds complex, the extent of economies of scale could depend substantially on the level of assets in the complex as a whole, so that increases and decreases in complex-wide assets can affect potential economies of scale in a manner that is disproportionate to, or even in the opposite direction from, changes in the fund’s asset level. The Board members also considered potential benefits to Dreyfus from acting as investment adviser and noted the soft dollar arrangements in effect for trading the fund’s investments.
At the conclusion of these discussions, the Board agreed that it had been furnished with sufficient information to make an informed business decision with respect to the renewal of the Agreement. Based on the discussions and considerations as described above, the Board concluded and determined as follows.
The Board concluded that the nature, extent and quality of the services provided by Dreyfus are adequate and appropriate.
The Board was satisfied with the fund’s performance.
The Board concluded that the fee paid to Dreyfus was reasonable in light of the considerations described above.
The Board determined that the economies of scale which may accrue to Dreyfus and its affiliates in connection with the management of the fund had been adequately considered by Dreyfus in connection with the fee rate charged to the fund pursuant to the Agreement and that, to the extent in the future it were determined that material economies of scale had not been shared with the fund, the Board would seek to have those economies of scale shared with the fund.
|
| INFORMATION ABOUT THE RENEWAL OF THE FUND’S |
| MANAGEMENT AGREEMENT (Unaudited) (continued) |
The Board members considered these conclusions and determinations, along with information received on a routine and regular basis throughout the year. In addition, it should be noted that the Board’s consideration of the contractual fee arrangements for this fund had the benefit of a number of years of reviews of prior or similar agreements during which lengthy discussions took place between the Board members and Dreyfus representatives. Certain aspects of the arrangements may receive greater scrutiny in some years than in others, and the Board members’ conclusions may be based, in part, on their consideration of the same or similar arrangements in prior years. The Board members determined that renewal of the Agreement was in the best interests of the fund and its shareholders.
34
BOARD MEMBERS INFORMATION (Unaudited)
|
| Joseph S. DiMartino (67) |
| Chairman of the Board (1995) |
| Principal Occupation During Past 5Years: |
| • Corporate Director and Trustee |
| Other Public Company Board Memberships During Past 5Years: |
| • CBIZ (formerly, Century Business Services, Inc.), a provider of outsourcing functions for small |
| and medium size companies, Director (1997-present) |
| • Sunair Services Corporation, a provider of certain outdoor-related services to homes and |
| businesses, Director (2005-2009) |
| • The Newark Group, a provider of a national market of paper recovery facilities, paperboard |
| mills and paperboard converting plants, Director (2000-2010) |
| No. of Portfolios for which Board Member Serves: 167 |
| ——————— |
| Peggy C. Davis (68) |
| Board Member (2006) |
| Principal Occupation During Past 5Years: |
| • Shad Professor of Law, New York University School of Law |
| • Writer and teacher in the fields of evidence, constitutional theory, family law, social sciences |
| and the law, legal process and professional methodology and training |
| No. of Portfolios for which Board Member Serves: 53 |
| ——————— |
| David P. Feldman (71) |
| Board Member (1996) |
| Principal Occupation During Past 5Years: |
| • Corporate Director and Trustee |
| Other Public Company Board Memberships During Past 5Years: |
| • BBH Mutual Funds Group (4 registered mutual funds), Director (1992-present) |
| • QMed, Inc. a healthcare company, Director (1999-2007) |
| No. of Portfolios for which Board Member Serves: 50 |
BOARD MEMBERS INFORMATION (Unaudited) (continued)
|
| Ehud Houminer (71) |
| Board Member (1993) |
| Principal Occupation During Past 5Years: |
| • Executive-in-Residence at the Columbia Business School, Columbia University (1992-present) |
| Other Public Company Board Memberships During Past 5Years: |
| • Avnet Inc., an electronics distributor, Director (1993-present) |
| No. of Portfolios for which Board Member Serves: 64 |
| ——————— |
| Dr. Martin Peretz (72) |
| Board Member (2006) |
| Principal Occupation During Past 5Years: |
| • Editor-in-Chief Emeritus of The New Republic Magazine (2010-present) (previously, |
| Editor-in-Chief, 1974-2010) |
| • Director of TheStreet.com, a financial information service on the web (1996-present) |
| No. of Portfolios for which Board Member Serves: 35 |
| ——————— |
Once elected all Board Members serve for an indefinite term, but achieve Emeritus status upon reaching age 80.The address of the Board Members and Officers is in c/o The Dreyfus Corporation, 200 Park Avenue, NewYork, NewYork 10166.Additional information about the Board Members is available in the fund’s Statement of Additional Information which can be obtained from Dreyfus free of charge by calling this toll free number: 1-800-DREYFUS.
James F. Henry, Emeritus Board Member
Dr. Paul A. Marks, Emeritus Board Member
Gloria Messinger, Emeritus Board Member
36
OFFICERS OF THE FUND (Unaudited)
BRADLEY J. SKAPYAK, President since January 2010.
Chief Operating Officer and a director of the Manager since June 2009. From April 2003 to June 2009, Mr. Skapyak was the head of the Investment Accounting and Support Department of the Manager. He is an officer of 75 investment companies (comprised of 167 portfolios) managed by the Manager. He is 52 years old and has been an employee of the Manager since February 1988.
MICHAEL A. ROSENBERG, Vice President and Secretary since August 2005.
Assistant General Counsel of BNY Mellon, and an officer of 76 investment companies (comprised of 192 portfolios) managed by the Manager. He is 51 years old and has been an employee of the Manager since October 1991.
KIESHA ASTWOOD, Vice President and Assistant Secretary since January 2010.
Counsel of BNY Mellon, and an officer of 76 investment companies (comprised of 192 portfolios) managed by the Manager. She is 38 years old and has been an employee of the Manager since July 1995.
JAMES BITETTO, Vice President and Assistant Secretary since August 2005.
Senior Counsel of BNY Mellon and Secretary of the Manager, and an officer of 76 investment companies (comprised of 192 portfolios) managed by the Manager. He is 45 years old and has been an employee of the Manager since December 1996.
JONI LACKS CHARATAN, Vice President and Assistant Secretary since August 2005.
Senior Counsel of BNY Mellon, and an officer of 76 investment companies (comprised of 192 portfolios) managed by the Manager. She is 55 years old and has been an employee of the Manager since October 1988.
JOSEPH M. CHIOFFI, Vice President and Assistant Secretary since August 2005.
Senior Counsel of BNY Mellon, and an officer of 76 investment companies (comprised of 192 portfolios) managed by the Manager. He is 49 years old and has been an employee of the Manager since June 2000.
KATHLEEN DENICHOLAS, Vice President and Assistant Secretary since January 2010.
Managing Counsel of BNY Mellon, and an officer of 76 investment companies (comprised of 192 portfolios) managed by the Manager. She is 36 years old and has been an employee of the Manager since February 2001.
JANETTE E. FARRAGHER, Vice President and Assistant Secretary since August 2005.
Assistant General Counsel of BNY Mellon, and an officer of 76 investment companies (comprised of 192 portfolios) managed by the Manager. She is 48 years old and has been an employee of the Manager since February 1984.
JOHN B. HAMMALIAN, Vice President and Assistant Secretary since August 2005.
Senior Managing Counsel of BNY Mellon, and an officer of 76 investment companies (comprised of 192 portfolios) managed by the Manager. He is 48 years old and has been an employee of the Manager since February 1991.
M. CRISTINA MEISER, Vice President and Assistant Secretary since January 2010.
Senior Counsel of BNY Mellon, and an officer of 76 investment companies (comprised of 192 portfolios) managed by the Manager. She is 41 years old and has been an employee of the Manager since August 2001.
OFFICERS OF THE FUND (Unaudited) (continued)
ROBERT R. MULLERY, Vice President and Assistant Secretary since August 2005.
Managing Counsel of BNY Mellon, and an officer of 76 investment companies (comprised of 192 portfolios) managed by the Manager. He is 59 years old and has been an employee of the Manager since May 1986.
JEFF PRUSNOFSKY, Vice President and Assistant Secretary since August 2005.
Senior Managing Counsel of BNY Mellon, and an officer of 76 investment companies (comprised of 192 portfolios) managed by the Manager. He is 46 years old and has been an employee of the Manager since October 1990.
JAMES WINDELS, Treasurer since November 2001.
Director – Mutual Fund Accounting of the Manager, and an officer of 76 investment companies (comprised of 192 portfolios) managed by the Manager. He is 52 years old and has been an employee of the Manager since April 1985.
RICHARD CASSARO, Assistant Treasurer since January 2008.
Senior Accounting Manager – Money Market and Municipal Bond Funds of the Manager, and an officer of 76 investment companies (comprised of 192 portfolios) managed by the Manager. He is 52 years old and has been an employee of the Manager since September 1982.
GAVIN C. REILLY, Assistant Treasurer since December 2005.
Tax Manager of the Investment Accounting and Support Department of the Manager, and an officer of 76 investment companies (comprised of 192 portfolios) managed by the Manager. He is 43 years old and has been an employee of the Manager since April 1991.
ROBERT ROBOL, Assistant Treasurer since August 2005.
Senior Accounting Manager – Fixed Income Funds of the Manager, and an officer of 76 investment companies (comprised of 192 portfolios) managed by the Manager. He is 47 years old and has been an employee of the Manager since October 1988.
ROBERT SALVIOLO, Assistant Treasurer since July 2007.
Senior Accounting Manager – Equity Funds of the Manager, and an officer of 76 investment companies (comprised of 192 portfolios) managed by the Manager. He is 44 years old and has been an employee of the Manager since June 1989.
ROBERT SVAGNA, Assistant Treasurer since December 2002.
Senior Accounting Manager – Equity Funds of the Manager, and an officer of 76 investment companies (comprised of 192 portfolios) managed by the Manager. He is 44 years old and has been an employee of the Manager since November 1990.
38
JOSEPH W. CONNOLLY, Chief Compliance Officer since October 2004.
Chief Compliance Officer of the Manager and The Dreyfus Family of Funds (76 investment companies, comprised of 192 portfolios). From November 2001 through March 2004, Mr. Connolly was first Vice-President, Mutual Fund Servicing for Mellon Global Securities Services. In that capacity, Mr. Connolly was responsible for managing Mellon’s Custody, Fund Accounting and Fund Administration services to third-party mutual fund clients. He is 54 years old and has served in various capacities with the Manager since 1980, including manager of the firm’s Fund Accounting Department from 1997 through October 2001.
STEPHEN J. STOREN, Anti-Money Laundering Compliance Officer since May 2011.
Chief Compliance Officer of the Distributor, and the Anti-Money Laundering Compliance Officer of 72 investment companies (comprised of 188 portfolios) managed by the Manager. He is 56 years old and has been an employee of the Distributor since October 1999.
For More Information

Telephone Call your financial representative or 1-800-DREYFUS
Mail The Dreyfus Family of Funds, 144 Glenn Curtiss Boulevard, Uniondale, NY 11556-0144
The fund files its complete schedule of portfolio holdings with the Securities and Exchange Commission (“SEC”) for the first and third quarters of each fiscal year on Form N-Q. The fund’s Forms N-Q are available on the SEC’s website at http://www.sec.gov and may be reviewed and copied at the SEC’s Public Reference Room in Washington, DC. Information on the operation of the Public Reference Room may be obtained by calling 1-800-SEC-0330.
A description of the policies and procedures that the fund uses to determine how to vote proxies relating to portfolio securities, and information regarding how the fund voted these proxies for the most recent 12-month period ended June 30 is available at http://www.dreyfus.com and on the SEC’s website at http://www.sec.gov. The description of the policies and procedures is also available without charge, upon request, by calling 1-800-DREYFUS.

|
| Dreyfus |
| Opportunistic |
| Small Cap Fund |
ANNUAL REPORT August 31, 2011

Save time. Save paper. View your next shareholder report online as soon as it’s available. Log into www.dreyfus.com and sign up for Dreyfus eCommunications. It’s simple and only takes a few minutes.
The views expressed in this report reflect those of the portfolio manager only through the end of the period covered and do not necessarily represent the views of Dreyfus or any other person in the Dreyfus organization. Any such views are subject to change at any time based upon market or other conditions and Dreyfus disclaims any responsibility to update such views.These views may not be relied on as investment advice and, because investment decisions for a Dreyfus fund are based on numerous factors, may not be relied on as an indication of trading intent on behalf of any Dreyfus fund.
Not FDIC-Insured • Not Bank-Guaranteed • May Lose Value
| | Contents |
| | THE FUND |
| 2 | A Letter from the Chairman and CEO |
| 3 | Discussion of Fund Performance |
| 6 | Fund Performance |
| 7 | Understanding Your Fund’s Expenses |
| 7 | Comparing Your Fund’s Expenses With Those of Other Funds |
| 8 | Statement of Investments |
| 12 | Statement of Assets and Liabilities |
| 13 | Statement of Operations |
| 14 | Statement of Changes in Net Assets |
| 15 | Financial Highlights |
| 16 | Notes to Financial Statements |
| 26 | Report of Independent Registered Public Accounting Firm |
| 27 | Important Tax Information |
| 28 | Information About the Renewal of the Fund’s Management Agreement |
| 32 | Board Members Information |
| 34 | Officers of the Fund |
| | FOR MORE INFORMATION |
| | Back Cover |
Dreyfus
Opportunistic
Small Cap Fund
The Fund

A LETTER FROM THE CHAIRMAN AND CEO
Dear Shareholder:
We are pleased to present this annual report for Dreyfus Opportunistic Small Cap Fund, covering the 12-month period from September 1, 2010, through August 31, 2011. For information about how the fund performed during the reporting period, as well as general market perspectives, we provide a Discussion of Fund Performance on the pages that follow.
Although stocks rallied strongly through the first quarter of 2011 due to expectations of a more robust economic recovery, the reporting period ended amid sharply deteriorating investor sentiment due to disappointing economic data, an escalating sovereign debt crisis in Europe and a contentious debate regarding taxes, spending and borrowing in the United States. In the final month of the reporting period, a major credit rating agency downgraded U.S. long-term debt, marking the first time in history that U.S.Treasury securities were not assigned the highest possible credit rating. Stocks proved volatile in this tumultuous environment, as the stalled economy caused most market sectors to give back many of the reporting period’s previous gains.
The economic outlook currently is clouded by heightened market volatility and political infighting, but we believe that a sustained, moderate global expansion is more likely than a double-dip recession. Inflationary pressures appear to be waning in most countries, including the United States, as energy prices have retreated from their highs.The Federal Reserve Board has signaled its intention to maintain an aggressively accommodative monetary policy, which may help offset the financial stresses caused by recent fiscal policy choices in the United States and Europe. To assess how these and other developments may affect your investments, we encourage you, as always, to speak with your financial advisor.
Thank you for your continued confidence and support.

Jonathan R. Baum
Chairman and Chief Executive Officer
The Dreyfus Corporation
September 15, 2011
2

DISCUSSION OF FUND PERFORMANCE
For the period of September 1, 2010, through August 31, 2011, as provided by David A. Daglio, Primary Portfolio Manager
Fund and Market Performance Overview
For the 12-month period ended August 31, 2011, Dreyfus Opportunistic Small Cap Fund produced a total return of 12.57%.1 In comparison, the Russell 2000 Index (the “Index”) produced a total return of 22.19%.The Russell 2000 Value Index returned 16.86% for the same reporting period.2
The changes in the investment environment over the last year were dra-matic.The reporting period began with renewed optimism as the Federal Reserve Board launched its second round of quantitative easing and a resumption of stronger domestic economic growth occurred. By its end, world economic growth had slowed, a U.S. government default had been narrowly averted and the European financial system was under siege.
Investor sentiment shifted quickly with the changing environment. Rational longer term perspectives gave way to a complete focus on only the very short term.As a result, the fund’s focus on future earnings, cash flow, and relative performance, combined with a soft patch of stock selection, detracted from the fund’s performance relative to the benchmark.
The Fund’s Investment Approach
The fund seeks capital appreciation. The fund normally invests at least 80% of its assets in the stocks of small cap companies. Stocks are selected for the fund’s portfolio based primarily on bottom-up fundamental analysis. The fund’s portfolio manager uses a disciplined investment process that relies, in general, on proprietary fundamental research and valuation. Generally, elements of the process include analysis of mid-cycle business prospects, estimation of the intrinsic value of the company and the identification of a revaluation trigger. Intrinsic value is based on the combination of the valuation assessment of the company’s operating divisions with the firm’s economic balance sheet. Mid-cycle estimates, growth prospects and competitive advantages are some of the factors used in the valuation assessment.A company’s stated and hidden liabilities and assets are included in the portfolio manager’s economic balance sheet calculation. Sector overweights and underweights are a function of the relative attractiveness of securities within the fund’s investable universe. The fund’s portfolio managers invest in stocks that they believe have attractive reward to risk opportunities and may actively adjust the fund’s portfolio to reflect new developments.
DISCUSSION OF FUND PERFORMANCE (continued)
Economic Concerns Sparked Heightened Market Volatility
Investors’ economic outlooks improved markedly amid expectations of a stronger economic recovery early in the reporting period, sending stock prices higher. However, the rally was interrupted in February 2011 when political unrest in the Middle East led to sharply rising energy prices, and again in March when natural and nuclear disasters in Japan threatened one of the world’s largest economies. Nonetheless, investors proved resilient, and U.S. stocks rebounded quickly from these unexpected shocks.
In late April, investor sentiment began to deteriorate in earnest when Greece appeared headed for default on its sovereign debt, economic data proved disappointing and a contentious debate regarding U.S. government spending and borrowing intensified. Stocks suffered heightened volatility over the summer of 2011 as newly risk-averse investors generally disregarded the long-term strengths of individual companies in favor of reacting to near-term macroeconomic develop-ments.The reporting period ended on a pessimistic note after a major credit-rating agency downgraded U.S.Treasury bonds.
Deteriorating Investor Sentiment Dampened Fund Results
The fund’s investment approach focuses on companies that we believe to be priced below their real worth and that have strong earnings and cash flow prospects over the next one to three years.The approach fell out of favor during the May to August time period when investors proved unwilling to look beyond the next several months for their investment horizon. Relative performance was negatively impacted by this development.
The fund’s investment team also hit a soft patch of weak stock selection. A few holdings and industry overweights hampered our returns. Meritor, a leading manufacturer of axles and drivetrains for trucks, experienced higher than expected raw materials costs and announced a delay in its earnings recovery. Lennox International, one of the oldest and most established names in heating and air conditioning systems suffered from a lack of new orders.Velti, one of the most interesting prospects in the nascent market of advertising on cellular phones, struggled in a market environment that demanded short term earnings results. An overweighted position in machinery stocks based on the belief that U.S. manufacturing is in the middle of a multi-year renaissance gave back earlier gains. Positions in building products struggled as limited evidence of a turn in residential construction appeared during the reporting period.
Weakness in these areas was offset to a degree by better results in other market sectors. In the energy sector, natural gas producers Gulfport
4
Energy, SandRidge Energy and Cabot Oil & Gas benefited from increased production activity when commodity prices moved higher. In the health care sector, drug developer King Pharmaceuticals advanced when it accepted an acquisition offer, while takeover speculation also lifted the stocks of Pain Therapeutics and Onyx Pharmaceuticals. Several industrials holdings fared well, including wire-and-cables producer WESCO International and mechanical transmissions maker Altra Holdings.
Uncertainty Creates Opportunity
We remain committed to finding companies priced below their real worth that are positioned to deliver strong earnings and cash flow over the next few years.While there are a number of concerns dominating the current investment landscape, we believe that investors’ current focus on short-term results is likely to shift to a long term perspective in time. As in the past, when a greater level of clarity returns to the market, we would expect our approach to regain favor and more competitive returns to be delivered in that more traditional environment. In the meantime, we have found what we believe are a number of exciting investment opportunities in the industrials, consumer discretionary and information technology sectors and are held in your fund. We have found fewer opportunities in the materials sector, where moderating commodity prices could put pressure on earnings, and in the utilities sector, where few companies meet our valuation standards.
September 15, 2011
| |
| | Please note, the position in any security highlighted with italicized typeface was sold during the |
| | reporting period. |
| | Equity funds are subject generally to market, market sector, market liquidity, issuer and investment |
| | style risks, among other factors, to varying degrees, all of which are more fully described in the |
| | fund’s prospectus. |
| | Stocks of small cap companies often experience sharper price fluctuations than stocks of |
| | large-cap companies. |
| 1 | Total return includes reinvestment of dividends and any capital gains paid. Past performance is no |
| | guarantee of future results. Share price and investment return fluctuate such that upon redemption, |
| | fund shares may be worth more or less than their original cost. |
| 2 | SOURCE: LIPPER INC. — Reflects the reinvestment of dividends and, where applicable, |
| | capital gain distributions.The Russell 2000 Index is an unmanaged index of small-cap stock |
| | performance and is composed of the 2,000 smallest companies in the Russell 3000 Index.The |
| | Russell 3000 Index is composed of the 3,000 largest U.S. companies based on total market |
| | capitalization.The Russell 2000 Value Index is an unmanaged index, which measures the |
| | performance of those Russell 2000 companies with lower price-to-book ratios and lower forecasted |
| | growth values. Investors cannot invest directly in any index. |
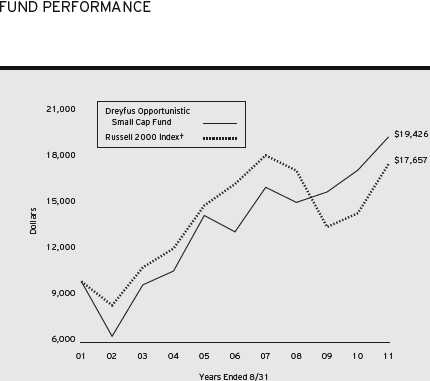

| | | | | | |
| Average Annual Total Returns as of 8/31/11 | | |
| | 1Year | 5 Years | 10 Years |
| Fund | 12.57% | 7.96% | 6.87% |
| Russell 2000 Index | 22.19% | 1.53% | 5.85% |
|
| † Source: Lipper Inc. |
| Past performance is not predictive of future performance.The fund’s performance shown in the graph and table does not |
| reflect the deduction of taxes that a shareholder would pay on fund distributions or the redemption of fund shares. |
| The above graph compares a $10,000 investment made in Dreyfus Opportunistic Small Cap Fund on 8/31/01 to a |
| $10,000 investment made in the Russell 2000 Index (the “Index”) on that date.All dividends and capital gain |
| distributions are reinvested. |
| The fund’s performance shown in the line graph above takes into account all applicable fees and expenses.The Index is |
| an unmanaged index of small-cap stock performance and is composed of the 2,000 smallest companies in the Russell |
| 3000 Index.The Russell 3000 Index is composed of the 3,000 largest U.S. companies based on total market |
| capitalization. Unlike a mutual fund, the Index is not subject to charges, fees and other expenses. Investors cannot invest |
| directly in any index. Further information relating to fund performance, including expense reimbursements, if applicable, is |
| contained in the Financial Highlights section of the prospectus and elsewhere in this report. |
6
UNDERSTANDING YOUR FUND’S EXPENSES (Unaudited)
As a mutual fund investor, you pay ongoing expenses, such as management fees and other expenses. Using the information below, you can estimate how these expenses affect your investment and compare them with the expenses of other funds.You also may pay one-time transaction expenses, including sales charges (loads) and redemption fees, which are not shown in this section and would have resulted in higher total expenses. For more information, see your fund’s prospectus or talk to your financial adviser.
Review your fund’s expenses
The table below shows the expenses you would have paid on a $1,000 investment in Dreyfus Opportunistic Small Cap Fund from March 1, 2011 to August 31, 2011. It also shows how much a $1,000 investment would be worth at the close of the period, assuming actual returns and expenses.
Expenses and Value of a $1,000 Investment
assuming actual returns for the six months ended August 31, 2011
| | |
| Expenses paid per $1,000† | $ | 5.23 |
| Ending value (after expenses) | $ | 789.70 |
COMPARING YOUR FUND’S EXPENSES
WITH THOSE OF OTHER FUNDS (Unaudited)
Using the SEC’s method to compare expenses
The Securities and Exchange Commission (SEC) has established guidelines to help investors assess fund expenses. Per these guidelines, the table below shows your fund’s expenses based on a $1,000 investment, assuming a hypothetical 5% annualized return. You can use this information to compare the ongoing expenses (but not transaction expenses or total cost) of investing in the fund with those of other funds.All mutual fund shareholder reports will provide this information to help you make this comparison. Please note that you cannot use this information to estimate your actual ending account balance and expenses paid during the period.
Expenses and Value of a $1,000 Investment
assuming a hypothetical 5% annualized return for the six months ended August 31, 2011
| | |
| Expenses paid per $1,000† | $ | 5.90 |
| Ending value (after expenses) | $ | 1,019.36 |
|
| † Expenses are equal to the fund’s annualized expense ratio of 1.16%, multiplied by the average account value over the |
| period, multiplied by 184/365 (to reflect the one-half year period). |
|
| STATEMENT OF INVESTMENTS |
| August 31, 2011 |
| | | |
| Common Stocks—99.9% | Shares | Value ($) |
| Consumer Discretionary—19.6% | | |
| American Axle & Manufacturing Holdings | 257,449a | 2,407,148 |
| Dana Holding | 773,610a,b | 9,863,528 |
| Express | 518,400 | 9,896,256 |
| Group 1 Automotive | 324,807b | 13,560,692 |
| Guess? | 83,610 | 2,851,937 |
| Liz Claiborne | 3,041,240a,b | 15,875,273 |
| Meritage Homes | 724,630a,b | 13,572,320 |
| Mohawk Industries | 143,580a,b | 7,114,389 |
| Saks | 1,490,250a,b | 14,425,620 |
| Standard-Pacific | 1,791,860a,b | 4,605,080 |
| Tower International | 379,385a | 5,288,627 |
| Williams-Sonoma | 387,580 | 12,832,774 |
| | | 112,293,644 |
| Consumer Staples—1.0% | | |
| Dole Food | 281,410a,b | 3,171,491 |
| Primo Water | 365,820b | 2,586,347 |
| | | 5,757,838 |
| Energy—7.2% | | |
| Endeavour International | 539,304a,b | 5,317,538 |
| Forest Oil | 301,600a,b | 5,872,152 |
| Gulfport Energy | 430,223a,b | 12,433,445 |
| Resolute Energy | 574,610a,b | 7,751,489 |
| SandRidge Energy | 1,377,130a,b | 10,108,134 |
| | | 41,482,758 |
| Financial—11.4% | | |
| Brown & Brown | 412,730 | 8,671,457 |
| DFC Global | 557,295a,b | 12,299,501 |
| Employers Holdings | 438,990 | 5,368,848 |
| Jones Lang LaSalle | 200,210 | 13,396,051 |
| Nelnet, Cl. A | 139,116b | 2,671,027 |
| Och-Ziff Capital Management Group, Cl. A | 474,970 | 5,390,910 |
| Popular | 1,057,230a | 2,199,038 |
| Portfolio Recovery Associates | 117,303a,b | 8,578,368 |
8
| | | |
| Common Stocks (continued) | Shares | Value ($) |
| Financial (continued) | | |
| PrivateBancorp | 417,207b | 3,704,798 |
| Starwood Property Trust | 161,120b,c | 2,980,720 |
| | | 65,260,718 |
| Health Care—9.4% | | |
| Align Technology | 343,020a,b | 6,551,682 |
| Durect | 809,311a,b | 1,351,549 |
| Emergent BioSolutions | 821,106a,b | 14,837,385 |
| Hanger Orthopedic Group | 830,628a,b | 15,599,194 |
| Omnicell | 147,400a,b | 2,305,336 |
| Onyx Pharmaceuticals | 103,030a,b | 3,506,111 |
| Sagent Pharmaceuticals | 176,577b | 4,059,505 |
| Salix Pharmaceuticals | 102,310a,b | 3,115,340 |
| United Therapeutics | 66,040a | 2,849,626 |
| | | 54,175,728 |
| Industrial—29.3% | | |
| Accuride | 286,890a | 2,418,483 |
| Columbus McKinnon | 469,668a | 6,772,613 |
| Commercial Vehicle Group | 160,670a | 1,155,217 |
| Con-way | 141,880b | 3,630,709 |
| Encore Wire | 292,330b | 6,551,115 |
| Equifax | 230,460 | 7,450,772 |
| GeoEye | 483,090a,b | 17,473,365 |
| Granite Construction | 422,510b | 8,758,632 |
| Griffon | 290,070a,b | 2,535,212 |
| Herman Miller | 285,373b | 5,670,362 |
| Hubbell, Cl. B | 57,610 | 3,406,479 |
| ICF International | 454,500a | 10,303,515 |
| Kelly Services, Cl. A | 821,860 | 12,492,272 |
| Landstar System | 224,880b | 9,105,391 |
| Lennox International | 235,136b | 7,340,946 |
| Meritor | 1,441,420a,b | 12,179,999 |
| Orion Marine Group | 447,940a,b | 2,880,254 |
| Oshkosh | 410,150a,b | 8,088,158 |
STATEMENT OF INVESTMENTS (continued)
| | | |
| Common Stocks (continued) | Shares | Value ($) |
| Industrial (continued) | | |
| Saia | 171,570a | 2,053,693 |
| Steelcase, Cl. A | 630,080b | 5,217,062 |
| Sterling Construction | 216,208a,b | 2,758,814 |
| SYKES Enterprises | 261,680a,b | 4,095,292 |
| Trinity Industries | 233,520b | 6,435,811 |
| TrueBlue | 138,240a,b | 1,942,272 |
| UTi Worldwide | 849,450 | 11,505,800 |
| Watts Water Technologies, Cl. A | 201,096b | 5,695,039 |
| | | 167,917,277 |
| Information Technology—18.6% | | |
| Brocade Communications Systems | 783,500a | 3,032,145 |
| CSG Systems International | 550,518a,b | 7,354,921 |
| DealerTrack Holdings | 916,621a,b | 17,159,145 |
| JDS Uniphase | 682,000a | 8,845,540 |
| MICROS Systems | 277,050a | 13,204,203 |
| Microsemi | 600,740a,b | 9,329,492 |
| ScanSource | 518,070a,b | 16,034,267 |
| Take-Two Interactive Software | 389,690a,b | 5,151,702 |
| Velti | 1,149,200a,b | 10,871,432 |
| Vishay Intertechnology | 235,360a,b | 2,683,104 |
| Wright Express | 315,110a | 13,278,735 |
| | | 106,944,686 |
| Materials—2.9% | | |
| Cytec Industries | 22,890 | 1,039,206 |
| Georgia Gulf | 288,370a,b | 6,110,560 |
| Omnova Solutions | 507,940a,b | 2,240,015 |
| Zoltek | 813,975b | 7,162,980 |
| | | 16,552,761 |
| Telecommunication Services—.5% | | |
| Cbeyond | 323,971a,b | 3,009,691 |
| Total Common Stocks | | |
| (cost $595,881,659) | | 573,395,101 |
10
| | | | |
| Investment of Cash Collateral | | |
| for Securities Loaned—18.5% | Shares | Value ($) |
| Registered Investment Company; | | |
| Dreyfus Institutional Cash Advantage Fund | | |
| (cost $106,126,483) | 106,126,483d | 106,126,483 |
| Total Investments (cost $702,008,142) | 118.4% | 679,521,584 |
| Liabilities, Less Cash and Receivables | (18.4%) | (105,623,142) |
| Net Assets | 100.0% | 573,898,442 |
|
| a Non-income producing security. |
| b Security, or portion thereof, on loan.At August 31, 2011, the value of the fund’s securities on loan was |
| $103,022,421 and the value of the collateral held by the fund was $106,126,483. |
| c Investment in real estate investment trust. |
| d Investment in affiliated money market mutual fund. |
| | | |
| Portfolio Summary (Unaudited)† | | |
| |
| | Value (%) | | Value (%) |
| |
| Industrial | 29.3 | Energy | 7.2 |
| Consumer Discretionary | 19.6 | Materials | 2.9 |
| Information Technology | 18.6 | Consumer Staples | 1.0 |
| Money Market Investment | 18.5 | Telecommunication Services | .5 |
| Financial | 11.4 | | |
| Health Care | 9.4 | | 118.4 |
| |
| † Based on net assets. | | | |
| See notes to financial statements. | | | |
|
| STATEMENT OF ASSETS AND LIABILITIES |
| August 31, 2011 |
| | | |
| | Cost | Value |
| Assets ($): | | |
| Investments in securities—See Statement of Investments (including | | |
| securities on loan, valued at $103,022,421)—Note 1(b): | | |
| Unaffiliated issuers | 595,881,659 | 573,395,101 |
| Affiliated issuers | 106,126,483 | 106,126,483 |
| Cash | | 444,003 |
| Receivable for investment securities sold | | 15,026,043 |
| Receivable for shares of Common Stock subscribed | | 549,550 |
| Dividends and securities lending income receivable | | 197,783 |
| Prepaid expenses | | 36,075 |
| | | 695,775,038 |
| Liabilities ($): | | |
| Due to The Dreyfus Corporation and affiliates—Note 3(b) | | 556,139 |
| Liability for securities on loan—Note 1(b) | | 106,126,483 |
| Payable for investment securities purchased | | 10,809,871 |
| Bank loan payable—Note 2 | | 3,500,000 |
| Payable for shares of Common Stock redeemed | | 693,705 |
| Interest payable—Note 2 | | 4,963 |
| Accrued expenses | | 185,435 |
| | | 121,876,596 |
| Net Assets ($) | | 573,898,442 |
| Composition of Net Assets ($): | | |
| Paid-in capital | | 544,807,350 |
| Accumulated net realized gain (loss) on investments | | 51,577,650 |
| Accumulated net unrealized appreciation | | |
| (depreciation) on investments | | (22,486,558) |
| Net Assets ($) | | 573,898,442 |
| Shares Outstanding | | |
| (100 million shares of $.001 par value Common Stock authorized) | | 23,043,796 |
| Net Asset Value, offering and redemption price per share ($) | | 24.90 |
| |
| See notes to financial statements. | | |
12
|
| STATEMENT OF OPERATIONS |
| Year Ended August 31, 2011 |
| | |
| Investment Income ($): | |
| Income: | |
| Cash dividends: | |
| Unaffiliated issuers | 6,354,239 |
| Affiliated issuers | 20,138 |
| Income from securities lending—Note 1(b) | 405,376 |
| Total Income | 6,779,753 |
| Expenses: | |
| Management fee—Note 3(a) | 5,471,182 |
| Shareholder servicing costs—Note 3(b) | 2,663,902 |
| Custodian fees—Note 3(b) | 76,343 |
| Professional fees | 65,104 |
| Prospectus and shareholders’ reports | 59,616 |
| Registration fees | 40,476 |
| Directors’ fees and expenses—Note 3(c) | 39,079 |
| Loan commitment fees—Note 2 | 14,357 |
| Interest expense—Note 2 | 8,379 |
| Miscellaneous | 28,607 |
| Total Expenses | 8,467,045 |
| Less—reduction in fees due to earnings credits—Note 3(b) | (1,422) |
| Net Expenses | 8,465,623 |
| Investment (Loss)—Net | (1,685,870) |
| Realized and Unrealized Gain (Loss) on Investments—Note 4 ($): | |
| Net realized gain (loss) on investments | 67,079,551 |
| Net unrealized appreciation (depreciation) on investments | (20,018,223) |
| Net Realized and Unrealized Gain (Loss) on Investments | 47,061,328 |
| Net Increase in Net Assets Resulting from Operations | 45,375,458 |
| |
| See notes to financial statements. | |
STATEMENT OF CHANGES IN NET ASSETS
| | | | |
| | Year Ended August 31, |
| | 2011 | 2010 |
| Operations ($): | | |
| Investment (loss)—net | (1,685,870) | (632,297) |
| Net realized gain (loss) on investments | 67,079,551 | 22,602,461 |
| Net unrealized appreciation | | |
| (depreciation) on investments | (20,018,223) | (31,416,536) |
| Net Increase (Decrease) in Net Assets | | |
| Resulting from Operations | 45,375,458 | (9,446,372) |
| Dividends to Shareholders from ($): | | |
| Investment income—net | (69,299) | — |
| Net realized gain on investments | (11,365,014) | — |
| Total Dividends | (11,434,313) | — |
| Capital Stock Transactions ($): | | |
| Net proceeds from shares sold | 419,140,444 | 552,552,976 |
| Dividends reinvested | 9,688,846 | — |
| Cost of shares redeemed | (365,811,210) | (265,565,927) |
| Increase (Decrease) in Net Assets | | |
| from Capital Stock Transactions | 63,018,080 | 286,987,049 |
| Total Increase (Decrease) in Net Assets | 96,959,225 | 277,540,677 |
| Net Assets ($): | | |
| Beginning of Period | 476,939,217 | 199,398,540 |
| End of Period | 573,898,442 | 476,939,217 |
| Capital Share Transactions (Shares): | | |
| Shares sold | 14,251,667 | 22,815,238 |
| Shares issued for dividends reinvested | 328,681 | — |
| Shares redeemed | (12,745,878) | (11,259,748) |
| Net Increase (Decrease) in Shares Outstanding | 1,834,470 | 11,555,490 |
| |
| See notes to financial statements. | | |
14
FINANCIAL HIGHLIGHTS
The following table describes the performance for the fiscal periods indicated. Total return shows how much your investment in the fund would have increased (or decreased) during each period, assuming you had reinvested all dividends and distributions.These figures have been derived from the fund’s financial statements.
| | | | | | | | | | |
| | | Year Ended August 31, | |
| | 2011 | 2010 | 2009 | 2008 | 2007 |
| Per Share Data ($): | | | | | |
| Net asset value, beginning of period | 22.49 | 20.65 | 20.20 | 27.07 | 23.12 |
| Investment Operations: | | | | | |
| Investment income (loss)—neta | (.07) | (.04) | (.00)b | .06 | .08 |
| Net realized and unrealized | | | | | |
| gain (loss) on investments | 2.97 | 1.88 | .73 | (1.52) | 4.90 |
| Total from Investment Operations | 2.90 | 1.84 | .73 | (1.46) | 4.98 |
| Distributions: | | | | | |
| Dividends from investment income—net | (.00)b | — | (.16) | (.10) | — |
| Dividends from net realized | | | | | |
| gain on investments | (.49) | — | (.12) | (5.31) | (1.03) |
| Total Distributions | (.49) | — | (.28) | (5.41) | (1.03) |
| Net asset value, end of period | 24.90 | 22.49 | 20.65 | 20.20 | 27.07 |
| Total Return (%) | 12.57 | 8.91 | 4.50 | (6.04) | 21.83 |
| Ratios/Supplemental Data (%): | | | | | |
| Ratio of total expenses | | | | | |
| to average net assets | 1.16 | 1.22 | 1.38 | 1.23 | 1.21 |
| Ratio of net expenses | | | | | |
| to average net assets | 1.16 | 1.22 | 1.37 | 1.23 | 1.21 |
| Ratio of net investment income | | | | | |
| (loss) to average net assets | (.23) | (.15) | (.00)c | .26 | .29 |
| Portfolio Turnover Rate | 123.29 | 128.47 | 194.30 | 175.45 | 165.75 |
| Net Assets, end of period ($ x 1,000) | 573,898 | 476,939 | 199,399 | 103,181 | 122,695 |
| |
| a | Based on average shares outstanding at each month end. |
| b | Amount represents less than $.01 per share. |
| c | Amount represents less than .01%. |
See notes to financial statements.
NOTES TO FINANCIAL STATEMENTS
NOTE 1—Significant Accounting Policies:
Dreyfus Opportunistic Small Cap Fund (the “fund”) is a separate diversified series of Advantage Funds, Inc. (the “Company”), which is registered under the Investment Company Act of 1940, as amended (the “Act”), as an open-end management investment company and operates as a series company that offers thirteen series, including the fund. The fund’s investment objective is to seek capital appreciation. The Dreyfus Corporation (the “Manager” or “Dreyfus”), a wholly-owned subsidiary of The Bank of New York Mellon Corporation (“BNY Mellon”), serves as the fund’s investment adviser. MBSC Securities Corporation (the “Distributor”), a wholly-owned subsidiary of the Manager, is the distributor of the fund’s shares, which are sold to existing shareholders without a sales charge.
The Company accounts separately for the assets, liabilities and operations of each series. Expenses directly attributable to each series are charged to that series’ operations; expenses which are applicable to all series are allocated among them on a pro rata basis.
The Financial Accounting Standards Board (“FASB”) Accounting Standards Codification (“ASC”) is the exclusive reference of authoritative U.S. generally accepted accounting principles (“GAAP”) recognized by the FASB to be applied by nongovernmental entities. Rules and interpretive releases of the Securities and Exchange Commission (“SEC”) under authority of federal laws are also sources of authoritative GAAP for SEC registrants. The fund’s financial statements are prepared in accordance with GAAP, which may require the use of management estimates and assumptions.Actual results could differ from those estimates.
The Company enters into contracts that contain a variety of indemnifications. The fund’s maximum exposure under these arrangements is unknown.The fund does not anticipate recognizing any loss related to these arrangements.
16
(a) Portfolio valuation: The fair value of a financial instrument is the amount that would be received to sell an asset or paid to transfer a liability in an orderly transaction between market participants at the measurement date (i.e. the exit price). GAAP establishes a fair value hierarchy that prioritizes the inputs of valuation techniques used to measure fair value.This hierarchy gives the highest priority to unadjusted quoted prices in active markets for identical assets or liabilities (Level 1 measurements) and the lowest priority to unobservable inputs (Level 3 measurements).
Additionally, GAAP provides guidance on determining whether the volume and activity in a market has decreased significantly and whether such a decrease in activity results in transactions that are not orderly. GAAP requires enhanced disclosures around valuation inputs and techniques used during annual and interim periods.
Various inputs are used in determining the value of the fund’s investments relating to fair value measurements.These inputs are summarized in the three broad levels listed below:
Level 1—unadjusted quoted prices in active markets for identical investments.
Level 2—other significant observable inputs (including quoted prices for similar investments, interest rates, prepayment speeds, credit risk, etc.).
Level 3—significant unobservable inputs (including the fund’s own assumptions in determining the fair value of investments).
The inputs or methodology used for valuing securities are not necessarily an indication of the risk associated with investing in those securities.
Changes in valuation techniques may result in transfers in or out of an assigned level within the disclosure hierarchy. Valuation techniques used to value the fund’s investments are as follows:
NOTES TO FINANCIAL STATEMENTS (continued)
Investments in securities are valued at the last sales price on the securities exchange or national securities market on which such securities are primarily traded. Securities listed on the National Market System for which market quotations are available are valued at the official closing price or, if there is no official closing price that day, at the last sales price. Securities not listed on an exchange or the national securities market, or securities for which there were no transactions, are valued at the average of the most recent bid and asked prices, except for open short positions, where the asked price is used for valuation purposes. Bid price is used when no asked price is available. Registered investment companies that are not traded on an exchange are valued at their net asset value. All preceding securities are categorized as Level 1 in the hierarchy.
Fair valuing of securities may be determined with the assistance of a pricing service using calculations based on indices of domestic securities and other appropriate indicators, such as prices of relevant American Depository Receipts and futures contracts. Utilizing these techniques may result in transfers between Level 1 and Level 2 of the fair value hiearchy.
When market quotations or official closing prices are not readily available, or are determined not to reflect accurately fair value, such as when the value of a security has been significantly affected by events after the close of the exchange or market on which the security is principally traded (for example, a foreign exchange or market), but before the fund calculates its net asset value, the fund may value these investments at fair value as determined in accordance with the procedures approved by the Board of Directors. Certain factors may be considered when fair valuing investments such as: fundamental analytical data, the nature and duration of restrictions on disposition, an evaluation of the forces that influence the market in which the securities are purchased and sold, and public trading in similar securities of the issuer or comparable issuers.These securities are either categorized as Level 2 or 3 depending on the relevant inputs used.
18
For restricted securities where observable inputs are limited, assumptions about market activity and risk are used and are categorized as Level 3 in the hierarchy.
The following is a summary of the inputs used as of August 31, 2011 in valuing the fund’s investments:
| | | | |
| | | Level 2—Other | Level 3— | |
| | Level 1— | Significant | Significant | |
| | Unadjusted | Observable | Unobservable | |
| | Quoted Prices | Inputs | Inputs | Total |
| Assets ($) | | | | |
| Investments in Securities: | | | |
| Equity Securities— | | | | |
| Domestic† | 551,017,869 | — | — | 551,017,869 |
| Equity Securities— | | | | |
| Foreign† | 22,377,232 | — | — | 22,377,232 |
| Mutual Funds | 106,126,483 | — | — | 106,126,483 |
| † See Statement of Investments for additional detailed categorizations. | |
In January 2010, FASB issued Accounting Standards Update (“ASU”) No. 2010-06 “Improving Disclosures about FairValue Measurements” (“ASU 2010-06”). The portions of ASU 2010-06 which require reporting entities to prepare new disclosures surrounding amounts and reasons for significant transfers in and out of Level 1 and Level 2 fair value measurements as well as inputs and valuation techniques used to measure fair value for both recurring and nonrecurring fair value measurements that fall in either Level 2 or Level 3 have been adopted by the fund. No significant transfers between Level 1 or Level 2 fair value measurements occurred at August 31, 2011.
In May 2011, FASB issued ASU No. 2011-04 “Amendments to Achieve Common Fair Value Measurement and Disclosure Requirements in GAAP and International Financial Reporting Standards (“IFRS”)” (“ASU 2011-04”). ASU 2011-04 includes common requirements for measurement of and disclosure about fair value between GAAP and IFRS. ASU 2011-04 will require reporting entities to disclose the
NOTES TO FINANCIAL STATEMENTS (continued)
following information for fair value measurements categorized within Level 3 of the fair value hierarchy: quantitative information about the unobservable inputs used in the fair value measurement, the valuation processes used by the reporting entity and a narrative description of the sensitivity of the fair value measurement to changes in unobservable inputs and the interrelationships between those unobservable inputs. In addition, ASU 2011-04 will require reporting entities to make disclosures about amounts and reasons for all transfers in and out of Level 1 and Level 2 fair value measurements.The new and revised disclosures are effective for interim and annual reporting periods beginning after December 15, 2011. At this time, management is evaluating the implications of ASU 2011-04 and its impact on the financial statements.
(b) Securities transactions and investment income: Securities transactions are recorded on a trade date basis. Realized gains and losses from securities transactions are recorded on the identified cost basis. Dividend income is recognized on the ex-dividend date and interest income, including, where applicable, accretion of discount and amortization of premium on investments, is recognized on the accrual basis.
Pursuant to a securities lending agreement with The Bank of New York Mellon, a subsidiary of BNY Mellon and an affiliate of Dreyfus, the fund may lend securities to qualified institutions. It is the fund’s policy that, at origination, all loans are secured by collateral of at least 102% of the value of U.S. securities loaned and 105% of the value of foreign securities loaned. Collateral equivalent to at least 100% of the market value of securities on loan is maintained at all times. Collateral is either in the form of cash, which can be invested in certain money market mutual funds managed by the Manager, U.S. Government and Agency securities or letters of credit.The fund is entitled to receive all income on securities loaned, in addition to income earned as a result of the lending transaction. Although each security loaned is fully collateralized, the fund bears the risk of delay in recovery of, or loss of
20
rights in, the securities loaned should a borrower fail to return the securities in a timely manner. During the period ended August 31, 2011,The Bank of New York Mellon earned $173,733 from lending portfolio securities, pursuant to the securities lending agreement.
(c) Affiliated issuers: Investments in other investment companies advised by Dreyfus are defined as “affiliated” in the Act.
The fund may invest in shares of certain affiliated investment companies also advised or managed by Dreyfus. Investments in affiliated investment companies for the period ended August 31, 2011 were as follows:
| | | | | | | |
| Affiliated | | | | | | | |
| Investment | Value | | | | Value | | Net |
| Company | 8/31/2010 | ($) | Purchases ($) | Sales ($) | 8/31/2011 | ($) | Assets (%) |
| Dreyfus | | | | | | | |
| Institutional | | | | | | | |
| Preferred | | | | | | | |
| Plus Money | | | | | | | |
| Market | | | | | | | |
| Fund | 14,362,000 | | 413,705,000 | 428,067,000 | — | | — |
| Dreyfus | | | | | | | |
| Institutional | | | | | | | |
| Cash | | | | | | | |
| Advantage | | | | | | | |
| Fund | 46,431,767 | | 1,476,979,037 | 1,417,284,321 | 106,126,483 | | 18.5 |
| Total | 60,793,767 | | 1,890,684,037 | 1,845,351,321 | 106,126,483 | | 18.5 |
(d) Dividends to shareholders: Dividends are recorded on the ex-dividend date. Dividends from investment income-net and dividends from net realized capital gains, if any, are normally declared and paid annually, but the fund may make distributions on a more frequent basis to comply with the distribution requirements of the Internal Revenue Code of 1986, as amended (the “Code”).To the extent that net realized capital gains can be offset by capital loss carryovers, it is the policy of the fund not to distribute such gains. Income and capital gain distributions are determined in accordance with income tax regulations, which may differ from GAAP.
NOTES TO FINANCIAL STATEMENTS (continued)
(e) Federal income taxes: It is the policy of the fund to continue to qualify as a regulated investment company, if such qualification is in the best interests of its shareholders, by complying with the applicable provisions of the Code, and to make distributions of taxable income sufficient to relieve it from substantially all federal income and excise taxes.
As of and during the period ended August 31, 2011, the fund did not have any liabilities for any uncertain tax positions.The fund recognizes interest and penalties, if any, related to uncertain tax positions as income tax expense in the Statement of Operations. During the period, the fund did not incur any interest or penalties.
Each of the tax years in the four-year period ended August 31, 2011 remains subject to examination by the Internal Revenue Service and state taxing authorities.
At August 31, 2011, the components of accumulated earnings on a tax basis were as follows: undistributed ordinary income $23,932,972, undistributed capital gains $36,789,600 and unrealized depreciation $31,631,480.
The tax character of distributions paid to shareholders during the fiscal periods ended August 31, 2011 and August 31, 2010 were as follows: ordinary income $3,834,539 and $0 and long-term capital gains $7,599,774 and $0, respectively.
During the period ended August 31, 2011, as a result of permanent book to tax differences, primarily due to the tax treatment for net operating losses and real estate investment trusts, the fund increased accumulated undistributed investment income-net by $1,755,169, decreased accumulated net realized gain (loss) on investments by $1,765,819 and increased paid-in capital by $10,650. Net assets and net asset value per share were not affected by this reclassification.
NOTE 2—Bank Lines of Credit:
The fund participates with other Dreyfus-managed funds in a $225 million unsecured credit facility led by Citibank, N.A. and a $300 million unsecured credit facility provided by The Bank of New York
22
Mellon (each, a “Facility”), each to be utilized primarily for temporary or emergency purposes, including the financing of redemptions. In connection therewith, the fund has agreed to pay its pro rata portion of commitment fees for each Facility. Interest is charged to the fund based on rates determined pursuant to the terms of the respective Facility at the time of borrowing.
The average amount of borrowings outstanding under the Facilities during the period ended August 31, 2011 was approximately $611,800 with a related weighted average annualized interest rate of 1.37%.
NOTE 3—Management Fee and Other Transactions With Affiliates:
(a) Pursuant to a management agreement with the Manager, the management fee is computed at the annual rate of .75% of the value of the fund’s average daily net assets and is payable monthly.
(b) Under the Shareholder Services Plan, the fund pays the Distributor at an annual rate of .25% of the value of the fund’s average daily net assets for the provision of certain services. The services provided may include personal services relating to shareholder accounts, such as answering shareholder inquiries regarding the fund and providing reports and other information, and services related to the maintenance of shareholder accounts. The Distributor may make payments to Service Agents (a securities dealer, financial institution or other industry professional) in respect of these services.The Distributor determines the amounts to be paid to Service Agents. During the period ended August 31, 2011, the fund was charged $1,823,727 pursuant to the Shareholder Services Plan.
The fund compensates Dreyfus Transfer, Inc., a wholly-owned subsidiary of the Manager, under a transfer agency agreement for providing personnel and facilities to perform transfer agency services for the fund. During the period ended August 31, 2011, the fund was charged $193,177 pursuant to the transfer agency agreement, which is included in Shareholder servicing costs in the Statement of Operations.
NOTES TO FINANCIAL STATEMENTS (continued)
The fund has arrangements with the custodian and cash management bank whereby the fund may receive earnings credits when positive cash balances are maintained, which are used to offset custody and cash management fees. For financial reporting purposes, the fund includes net earnings credits as an expense offset in the Statement of Operations.
The fund compensates The Bank of New York Mellon under a cash management agreement for performing cash management services related to fund subscriptions and redemptions. During the period ended August 31, 2011, the fund was charged $30,936 pursuant to the cash management agreement, which is included in Shareholder servicing costs in the Statement of Operations.These fees were partially offset by earnings credits of $1,422.
The fund also compensates The Bank of New York Mellon under a custody agreement for providing custodial services for the fund. During the period ended August 31, 2011, the fund was charged $76,343 pursuant to the custody agreement.
During the period ended August 31, 2011, the fund was charged $7,225 for services performed by the Chief Compliance Officer.
The components of “Due to The Dreyfus Corporation and affiliates” in the Statement of Assets and Liabilities consist of: management fees $369,629, shareholder services plan fees $123,210, custodian fees $27,120, chief compliance officer fees $3,253 and transfer agency per account fees $32,927.
(c) Each Board member also serves as a Board member of other funds within the Dreyfus complex. Annual retainer fees and attendance fees are allocated to each fund based on net assets.
24
NOTE 4—Securities Transactions:
The aggregate amount of purchases and sales of investment securities, excluding short-term securities, during the period ended August 31, 2011 amounted to $936,107,701 and $872,230,585, respectively.
At August 31, 2011, the cost of investments for federal income tax purposes was $711,153,064; accordingly, accumulated net unrealized depreciation on investments was $31,631,480, consisting of $41,134,636 gross unrealized appreciation and $72,766,116 gross unrealized depreciation.
NOTE 5—Plan of Reorganization:
On April 7, 2011, the Board of Directors approved the merger of the fund and Dreyfus Emerging Leaders Fund (the “Acquired Fund”).The merger was approved by shareholders of the Acquired Fund at a meeting held on September 15, 2011.The merger currently is anticipated to occur on or about November 28, 2011. On the date of the merger, which is a tax-free reorganization, the Acquired Fund will exchange all of its assets at net asset value, subject to liabilities, for an equivalent value of shares of the fund. Such shares will be distributed pro rata to shareholders of the Acquired Fund so that each shareholder receives a number of shares of the fund equal to the aggregate net asset value of the shareholder’s Acquired Fund shares.
REPORT OF INDEPENDENT REGISTERED
PUBLIC ACCOUNTING FIRM
Shareholders and Board of Directors Dreyfus Opportunistic Small Cap Fund
We have audited the accompanying statement of assets and liabilities, including the statement of investments, of Dreyfus Opportunistic Small Cap Fund (one of the series comprising Advantage Funds, Inc.) as of August 31, 2011, and the related statement of operations for the year then ended, the statement of changes in net assets for each of the two years in the period then ended, and financial highlights for each of the years indicated therein.These financial statements and financial highlights are the responsibility of the Fund’s management. Our responsibility is to express an opinion on these financial statements and financial highlights based on our audits.
We conducted our audits in accordance with the standards of the Public Company Accounting Oversight Board (United States).Those standards require that we plan and perform the audit to obtain reasonable assurance about whether the financial statements and financial highlights are free of material misstatement.We were not engaged to perform an audit of the Fund’s internal control over financial reporting. Our audits included consideration of internal control over financial reporting as a basis for designing audit procedures that are appropriate in the circumstances, but not for the purpose of expressing an opinion on the effectiveness of the Fund’s internal control over financial reporting. Accordingly, we express no such opinion.An audit also includes examining, on a test basis, evidence supporting the amounts and disclosures in the financial statements and financial highlights, assessing the accounting principles used and significant estimates made by management, and evaluating the overall financial statement presentation. Our procedures included confirmation of securities owned as of August 31, 2011 by correspondence with the custodian and others.We believe that our audits provide a reasonable basis for our opinion.
In our opinion, the financial statements and financial highlights referred to above present fairly, in all material respects, the financial position of Dreyfus Opportunistic Small Cap Fund at August 31, 2011, the results of its operations for the year then ended, the changes in its net assets for each of the two years in the period then ended, and the financial highlights for each of the indicated years, in conformity with U.S. generally accepted accounting principles.

New York, New York
October 27, 2011
26
IMPORTANT TAX INFORMATION (Unaudited)
For federal tax purposes, the fund hereby designates 16% of the ordinary dividends paid during the fiscal year ended August 31, 2011 as qualifying for the corporate dividends received deduction.Also certain dividends paid by the fund may be subject to a maximum tax rate of 15%, as provided for by the Jobs and GrowthTax Relief Reconciliation Act of 2003. Of the distributions paid during the fiscal year, $3,256,099 represents the maximum amount that may be considered qualified dividend income. The fund also hereby designates $.1630 per share as a short-term capital gain distribution and $.3290 per share as a long-term capital gain distribution paid on December 14, 2010. Shareholders will receive notification in early 2012 of the percentage applicable to the preparation of their 2011 income tax returns.
|
| INFORMATION ABOUT THE RENEWAL OF THE |
| FUND’S MANAGEMENT AGREEMENT (Unaudited) |
At a meeting of the fund’s Board of Directors held on March 1, 2011, the Board considered the renewal of the fund’s Management Agreement pursuant to which Dreyfus provides the fund with investment advisory and administrative services (the “Agreement”). The Board members, none of whom are “interested persons” (as defined in the Investment Company Act of 1940, as amended) of the fund, were assisted in their review by independent legal counsel and met with counsel in executive session separate from representatives of Dreyfus. In considering the renewal of the Agreement, the Board considered all factors that it believed to be relevant, including those discussed below.The Board did not identify any one factor as dispositive, and each Board member may have attributed different weights to the factors considered.
Analysis of Nature, Extent, and Quality of Services Provided to the Fund. The Board members considered information previously provided to them in presentations from representatives of Dreyfus regarding the nature, extent, and quality of the services provided to funds in the Dreyfus fund complex, and representatives of Dreyfus confirmed that there had been no material changes in this information. Dreyfus provided the number of open accounts in the fund, the fund’s asset size and the allocation of fund assets among distribution channels. Dreyfus also had previously provided information regarding the diverse intermediary relationships and distribution channels of funds in the Dreyfus fund complex and Dreyfus’ corresponding need for broad, deep, and diverse resources to be able to provide ongoing shareholder services to each distribution channel, including the distribution channel(s) for the fund.
The Board members also considered research support available to, and portfolio management capabilities of, the fund’s portfolio management personnel and that Dreyfus also provides oversight of day-to-day fund operations, including fund accounting and administration and assistance in meeting legal and regulatory requirements.The Board members also considered Dreyfus’ extensive administrative, accounting, and compliance infrastructures.The Board also considered portfolio management’s brokerage policies and practices (including policies and practices regarding soft dollars) and the standards applied in seeking best execution.
28
Comparative Analysis of the Fund’s Performance and Management Fee and Expense Ratio. The Board members reviewed reports prepared by Lipper, Inc. (“Lipper”), an independent provider of investment company data, which included information comparing (1) the fund’s performance with the performance of a group of comparable funds (the “Performance Group”) and with a broader group of funds (the “Performance Universe”), all for various periods ended December 31, 2010, and (2) the fund’s actual and contractual management fees and total expenses with those of a group of comparable funds (the “Expense Group”) and with a broader group of funds (the “Expense Universe”), the information for which was derived in part from fund financial statements available to Lipper as of December 31, 2010. Dreyfus previously had furnished the Board with a description of the methodology Lipper used to select the Performance Group and Performance Universe and the Expense Group and Expense Universe.
Dreyfus representatives stated that the usefulness of performance comparisons may be affected by a number of factors, including different investment limitations that may be applicable to the fund and comparison funds.The Board members discussed the results of the comparisons and noted that the fund’s total return performance was in the first quartile of the Performance Group and Performance Universe for all periods, except for the ten-year period when the fund’s total return performance was in the second quartile of the Performance Group. Dreyfus also provided a comparison of the fund’s calendar year total returns to the returns of the fund’s benchmark index.
The Board members also reviewed the range of actual and contractual management fees and total expenses of the Expense Group and Expense Universe funds and discussed the results of the comparisons. They noted that the fund’s contractual management fee was below the Expense Group median, the fund’s actual management fee was below the Expense Group and Expense Universe medians and the fund’s total expenses were above the Expense Group median and below the Expense Universe median.
|
| INFORMATION ABOUT THE RENEWAL OF THE FUND’S |
| MANAGEMENT AGREEMENT (Unaudited) (continued) |
Representatives of Dreyfus reviewed with the Board members the management or investment advisory fees (1) paid by funds advised or administered by Dreyfus that are in the same Lipper category as the fund and (2) paid to Dreyfus or the Dreyfus-affiliated primary employer of the fund’s primary portfolio manager for advising any separate accounts and/or other types of client portfolios that are considered to have similar investment strategies and policies as the fund (the “Similar Clients”), and explained the nature of the Similar Clients.They discussed differences in fees paid and the relationship of the fees paid in light of any differences in the services provided and other relevant factors. The Board members considered the relevance of the fee information provided for the Similar Clients to evaluate the appropriateness and reasonableness of the fund’s management fee.
Analysis of Profitability and Economies of Scale. Dreyfus’ representatives reviewed the expenses allocated and profit received by Dreyfus and the resulting profitability percentage for managing the fund, and the method used to determine the expenses and profit. The Board concluded that the profitability results were not unreasonable, given the services rendered and service levels provided by Dreyfus.The Board previously had been provided with information prepared by an independent consulting firm regarding Dreyfus’ approach to allocating costs to, and determining the profitability of, individual funds and the entire Dreyfus fund complex. The consulting firm also had analyzed where any economies of scale might emerge in connection with the management of a fund.
The Board’s counsel stated that the Board members should consider the profitability analysis (1) as part of their evaluation of whether the fees under the Agreement bear a reasonable relationship to the mix of services provided by Dreyfus, including the nature, extent and quality of such services, and (2) in light of the relevant circumstances for the fund and the extent to which economies of scale would be realized if the fund grows and whether fee levels reflect these economies of scale for the benefit of fund shareholders.They also noted that, as a result of shared and allocated costs among funds in the Dreyfus funds complex, the extent of economies of scale could depend substantially on the level of assets in the complex as a whole, so that increases and decreases in com-
30
plex-wide assets can affect potential economies of scale in a manner that is disproportionate to, or even in the opposite direction from, changes in the fund’s asset level. The Board members also considered potential benefits to Dreyfus from acting as investment adviser and noted the soft dollar arrangements in effect for trading the fund’s investments.
At the conclusion of these discussions, the Board agreed that it had been furnished with sufficient information to make an informed business decision with respect to the renewal of the Agreement. Based on the discussions and considerations as described above, the Board concluded and determined as follows.
The Board concluded that the nature, extent and quality of the services provided by Dreyfus are adequate and appropriate.
The Board was satisfied with the fund’s performance.
The Board concluded that the fee paid to Dreyfus was reasonable in light of the considerations described above.
The Board determined that the economies of scale which may accrue to Dreyfus and its affiliates in connection with the management of the fund had been adequately considered by Dreyfus in connection with the fee rate charged to the fund pursuant to the Agreement and that, to the extent in the future it were determined that material economies of scale had not been shared with the fund, the Board would seek to have those economies of scale shared with the fund.
The Board members considered these conclusions and determinations, along with information received on a routine and regular basis throughout the year. In addition, it should be noted that the Board’s consideration of the contractual fee arrangements for this fund had the benefit of a number of years of reviews of prior or similar agreements during which lengthy discussions took place between the Board members and Dreyfus representatives. Certain aspects of the arrangements may receive greater scrutiny in some years than in others, and the Board members’ conclusions may be based, in part, on their consideration of the same or similar arrangements in prior years. The Board members determined that renewal of the Agreement was in the best interests of the fund and its shareholders.
BOARD MEMBERS INFORMATION (Unaudited)
|
| Joseph S. DiMartino (67) |
| Chairman of the Board (1995) |
| Principal Occupation During Past 5Years: |
| • Corporate Director and Trustee |
| Other Public Company Board Memberships During Past 5Years: |
| • CBIZ (formerly, Century Business Services, Inc.), a provider of outsourcing functions for small |
| and medium size companies, Director (1997-present) |
| • Sunair Services Corporation, a provider of certain outdoor-related services to homes and |
| businesses, Director (2005-2009) |
| • The Newark Group, a provider of a national market of paper recovery facilities, paperboard |
| mills and paperboard converting plants, Director (2000-2010) |
| No. of Portfolios for which Board Member Serves: 167 |
| ——————— |
| Peggy C. Davis (68) |
| Board Member (2006) |
| Principal Occupation During Past 5Years: |
| • Shad Professor of Law, New York University School of Law |
| • Writer and teacher in the fields of evidence, constitutional theory, family law, social sciences |
| and the law, legal process and professional methodology and training |
| No. of Portfolios for which Board Member Serves: 53 |
| ——————— |
| David P. Feldman (71) |
| Board Member (1996) |
| Principal Occupation During Past 5Years: |
| • Corporate Director and Trustee |
| Other Public Company Board Memberships During Past 5Years: |
| • BBH Mutual Funds Group (4 registered mutual funds), Director (1992-present) |
| • QMed, Inc. a healthcare company, Director (1999-2007) |
| No. of Portfolios for which Board Member Serves: 50 |
32
|
| Ehud Houminer (71) |
| Board Member (1993) |
| Principal Occupation During Past 5Years: |
| • Executive-in-Residence at the Columbia Business School, Columbia University (1992-present) |
| Other Public Company Board Memberships During Past 5Years: |
| • Avnet Inc., an electronics distributor, Director (1993-present) |
| No. of Portfolios for which Board Member Serves: 64 |
| ——————— |
| Dr. Martin Peretz (72) |
| Board Member (2006) |
| Principal Occupation During Past 5Years: |
| • Editor-in-Chief Emeritus of The New Republic Magazine (2010-present) (previously, |
| Editor-in-Chief, 1974-2010) |
| • Director of TheStreet.com, a financial information service on the web (1996-present) |
| No. of Portfolios for which Board Member Serves: 35 |
| ——————— |
Once elected all Board Members serve for an indefinite term, but achieve Emeritus status upon reaching age 80.The address of the Board Members and Officers is in c/o The Dreyfus Corporation, 200 Park Avenue, NewYork, NewYork 10166.Additional information about the Board Members is available in the fund’s Statement of Additional Information which can be obtained from Dreyfus free of charge by calling this toll free number: 1-800-DREYFUS.
James F. Henry, Emeritus Board Member
Dr. Paul A. Marks, Emeritus Board Member
Gloria Messinger, Emeritus Board Member
OFFICERS OF THE FUND (Unaudited)
BRADLEY J. SKAPYAK, President since January 2010.
Chief Operating Officer and a director of the Manager since June 2009. From April 2003 to June 2009, Mr. Skapyak was the head of the Investment Accounting and Support Department of the Manager. He is an officer of 75 investment companies (comprised of 167 portfolios) managed by the Manager. He is 52 years old and has been an employee of the Manager since February 1988.
MICHAEL A. ROSENBERG, Vice President and Secretary since August 2005.
Assistant General Counsel of BNY Mellon, and an officer of 76 investment companies (comprised of 192 portfolios) managed by the Manager. He is 51 years old and has been an employee of the Manager since October 1991.
KIESHA ASTWOOD, Vice President and Assistant Secretary since January 2010.
Counsel of BNY Mellon, and an officer of 76 investment companies (comprised of 192 portfolios) managed by the Manager. She is 38 years old and has been an employee of the Manager since July 1995.
JAMES BITETTO, Vice President and Assistant Secretary since August 2005.
Senior Counsel of BNY Mellon and Secretary of the Manager, and an officer of 76 investment companies (comprised of 192 portfolios) managed by the Manager. He is 45 years old and has been an employee of the Manager since December 1996.
JONI LACKS CHARATAN, Vice President and Assistant Secretary since August 2005.
Senior Counsel of BNY Mellon, and an officer of 76 investment companies (comprised of 192 portfolios) managed by the Manager. She is 55 years old and has been an employee of the Manager since October 1988.
JOSEPH M. CHIOFFI, Vice President and Assistant Secretary since August 2005.
Senior Counsel of BNY Mellon, and an officer of 76 investment companies (comprised of 192 portfolios) managed by the Manager. He is 49 years old and has been an employee of the Manager since June 2000.
KATHLEEN DENICHOLAS, Vice President and Assistant Secretary since January 2010.
Managing Counsel of BNY Mellon, and an officer of 76 investment companies (comprised of 192 portfolios) managed by the Manager. She is 36 years old and has been an employee of the Manager since February 2001.
JANETTE E. FARRAGHER, Vice President and Assistant Secretary since August 2005.
Assistant General Counsel of BNY Mellon, and an officer of 76 investment companies (comprised of 192 portfolios) managed by the Manager. She is 48 years old and has been an employee of the Manager since February 1984.
JOHN B. HAMMALIAN, Vice President and Assistant Secretary since August 2005.
Senior Managing Counsel of BNY Mellon, and an officer of 76 investment companies (comprised of 192 portfolios) managed by the Manager. He is 48 years old and has been an employee of the Manager since February 1991.
M. CRISTINA MEISER, Vice President and Assistant Secretary since January 2010.
Senior Counsel of BNY Mellon, and an officer of 76 investment companies (comprised of 192 portfolios) managed by the Manager. She is 41 years old and has been an employee of the Manager since August 2001.
34
ROBERT R. MULLERY, Vice President and Assistant Secretary since August 2005.
Managing Counsel of BNY Mellon, and an officer of 76 investment companies (comprised of 192 portfolios) managed by the Manager. He is 59 years old and has been an employee of the Manager since May 1986.
JEFF PRUSNOFSKY, Vice President and Assistant Secretary since August 2005.
Senior Managing Counsel of BNY Mellon, and an officer of 76 investment companies (comprised of 192 portfolios) managed by the Manager. He is 46 years old and has been an employee of the Manager since October 1990.
JAMES WINDELS, Treasurer since November 2001.
Director – Mutual Fund Accounting of the Manager, and an officer of 76 investment companies (comprised of 192 portfolios) managed by the Manager. He is 52 years old and has been an employee of the Manager since April 1985.
RICHARD CASSARO, Assistant Treasurer since January 2008.
Senior Accounting Manager – Money Market and Municipal Bond Funds of the Manager, and an officer of 76 investment companies (comprised of 192 portfolios) managed by the Manager. He is 52 years old and has been an employee of the Manager since September 1982.
GAVIN C. REILLY, Assistant Treasurer since December 2005.
Tax Manager of the Investment Accounting and Support Department of the Manager, and an officer of 76 investment companies (comprised of 192 portfolios) managed by the Manager. He is 43 years old and has been an employee of the Manager since April 1991.
ROBERT ROBOL, Assistant Treasurer since August 2005.
Senior Accounting Manager – Fixed Income Funds of the Manager, and an officer of 76 investment companies (comprised of 192 portfolios) managed by the Manager. He is 47 years old and has been an employee of the Manager since October 1988.
ROBERT SALVIOLO, Assistant Treasurer since July 2007.
Senior Accounting Manager – Equity Funds of the Manager, and an officer of 76 investment companies (comprised of 192 portfolios) managed by the Manager. He is 44 years old and has been an employee of the Manager since June 1989.
ROBERT SVAGNA, Assistant Treasurer since December 2002.
Senior Accounting Manager – Equity Funds of the Manager, and an officer of 76 investment companies (comprised of 192 portfolios) managed by the Manager. He is 44 years old and has been an employee of the Manager since November 1990.
OFFICERS OF THE FUND (Unaudited) (continued)
JOSEPH W. CONNOLLY, Chief Compliance Officer since October 2004.
Chief Compliance Officer of the Manager and The Dreyfus Family of Funds (76 investment companies, comprised of 192 portfolios). From November 2001 through March 2004, Mr. Connolly was first Vice-President, Mutual Fund Servicing for Mellon Global Securities Services. In that capacity, Mr. Connolly was responsible for managing Mellon’s Custody, Fund Accounting and Fund Administration services to third-party mutual fund clients. He is 54 years old and has served in various capacities with the Manager since 1980, including manager of the firm’s Fund Accounting Department from 1997 through October 2001.
STEPHEN J. STOREN, Anti-Money Laundering Compliance Officer since May 2011.
Chief Compliance Officer of the Distributor, and the Anti-Money Laundering Compliance Officer of 72 investment companies (comprised of 188 portfolios) managed by the Manager. He is 56 years old and has been an employee of the Distributor since October 1999.
36
For More Information

Ticker Symbol: DSCVX
Telephone 1-800-DREYFUS
Mail The Dreyfus Family of Funds, 144 Glenn Curtiss Boulevard, Uniondale, NY 11556-0144 E-mail Send your request to info@dreyfus.com Internet Information can be viewed online or downloaded at: http://www.dreyfus.com
The fund files its complete schedule of portfolio holdings with the Securities and Exchange Commission (“SEC”) for the first and third quarters of each fiscal year on Form N-Q. The fund’s Forms N-Q are available on the SEC’s website at http://www.sec.gov and may be reviewed and copied at the SEC’s Public Reference Room in Washington, DC. Information on the operation of the Public Reference Room may be obtained by calling 1-800-SEC-0330.
A description of the policies and procedures that the fund uses to determine how to vote proxies relating to portfolio securities, and information regarding how the fund voted these proxies for the most recent 12-month period ended June 30 is available at http://www.dreyfus.com and on the SEC’s website at http://www.sec.gov. The description of the policies and procedures is also available without charge, upon request, by calling 1-800-DREYFUS.

|
| Dreyfus |
| Structured Midcap Fund |
ANNUAL REPORT August 31, 2011

Save time. Save paper. View your next shareholder report online as soon as it’s available. Log into www.dreyfus.com and sign up for Dreyfus eCommunications. It’s simple and only takes a few minutes.
The views expressed in this report reflect those of the portfolio manager only through the end of the period covered and do not necessarily represent the views of Dreyfus or any other person in the Dreyfus organization. Any such views are subject to change at any time based upon market or other conditions and Dreyfus disclaims any responsibility to update such views.These views may not be relied on as investment advice and, because investment decisions for a Dreyfus fund are based on numerous factors, may not be relied on as an indication of trading intent on behalf of any Dreyfus fund.

| |
| | Contents |
| |
| | THE FUND |
| 2 | A Letter from the Chairman and CEO |
| 3 | Discussion of Fund Performance |
| 6 | Fund Performance |
| 8 | Understanding Your Fund’s Expenses |
| 8 | Comparing Your Fund’s Expenses |
| With Those of Other Funds |
| 9 | Statement of Investments |
| 14 | Statement of Assets and Liabilities |
| 15 | Statement of Operations |
| 16 | Statement of Changes in Net Assets |
| 18 | Financial Highlights |
| 22 | Notes to Financial Statements |
| 32 | Report of Independent Registered |
| | Public Accounting Firm |
| 33 | Important Tax Information |
| 34 | Information About the Renewal of |
| the Fund’s Management and |
| | Sub-Investment Advisory Agreements |
| 39 | Board Members Information |
| 41 | Officers of the Fund |
| |
| FOR MORE INFORMATION |
|
| | Back Cover |
Dreyfus
Structured Midcap Fund
The Fund

A LETTER FROM THE CHAIRMAN AND CEO
Dear Shareholder:
We are pleased to present this annual report for Dreyfus Structured Midcap Fund, covering the 12-month period from September 1, 2010, through August 31, 2011. For information about how the fund performed during the reporting period, as well as general market perspectives, we provide a Discussion of Fund Performance on the pages that follow.
Although stocks rallied strongly through the first quarter of 2011 due to expectations of a more robust economic recovery, the reporting period ended amid sharply deteriorating investor sentiment due to disappointing economic data, an escalating sovereign debt crisis in Europe and a contentious debate regarding taxes, spending and borrowing in the United States. In the final month of the reporting period, a major credit rating agency downgraded U.S. long-term debt, marking the first time in history that U.S.Treasury securities were not assigned the highest possible credit rating. Stocks proved volatile in this tumultuous environment, as the stalled economy caused most market sectors to give back many of the reporting period’s previous gains.
The economic outlook currently is clouded by heightened market volatility and political infighting, but we believe that a sustained, moderate global expansion is more likely than a double-dip recession. Inflationary pressures appear to be waning in most countries, including the United States, as energy prices have retreated from their highs.The Federal Reserve Board has signaled its intention to maintain an aggressively accommodative monetary policy, which may help offset the financial stresses caused by recent fiscal policy choices in the United States and Europe. To assess how these and other developments may affect your investments, we encourage you, as always, to speak with your financial advisor.
Thank you for your continued confidence and support.

Jonathan R. Baum
Chairman and Chief Executive Officer
The Dreyfus Corporation
September 15, 2011
2

DISCUSSION OF FUND PERFORMANCE
For the period from September 1, 2010, through August 31, 2011, as provided by Patrick Slattery, Portfolio Manager
Fund and Market Performance Overview
For the 12-month period ended August 31, 2011, Dreyfus Structured Midcap Fund’s Class A shares produced a total return of 22.83%, Class B shares returned 21.82%, Class C shares returned 22.11% and Class I shares returned 22.97%.1 In comparison, the Standard & Poor’s MidCap 400 Index (“S&P 400 Index”), the fund’s benchmark, produced a total return of 22.89% for the same period.2
Midcap stocks rallied through the first quarter of 2011 amid expectations of continued economic recovery. However, several macroeconomic disappointments later erased many of those gains. The fund produced returns that were roughly in line with its benchmark, as strong results in the materials, consumer discretionary and health care sectors were balanced by disappointments in the consumer staples and telecommunications services sectors.
As a side note, beginning in June 2011, the fund is managed by the Active Equity Team of Mellon Capital Management Corporation. In addition to Patrick Slattery, team members include Jocelin A. Reed, C. Wesley Boggs,Warren Chiang, Ronald Gala and Langton Garvin.
The Fund’s Investment Approach
The fund seeks long-term capital growth.To pursue this goal, the fund invests at least 80% of its assets in the stocks of companies included in the S&P 400 Index or the Russell Midcap Index at the time of purchase. The fund’s stock investments may include common stocks, preferred stocks and convertible securities of U.S. and foreign issuers.We construct the portfolio through a “bottom-up” structured approach focusing on stock selection as opposed to making proactive decisions as to industry sector exposure.The approach seeks to identify undervalued securities through a quantitative process that ranks stocks based on value measures, behavioral/momentum factors and quality metrics.We attempt to maintain a neutral exposure to industry groups relative to the S&P 400 Index.
The Fund 3
DISCUSSION OF FUND PERFORMANCE (continued)
Shifting Sentiment Sparked Heightened Volatility
Investors’ outlooks improved markedly at the start of the reporting period when the Federal Reserve Board announced a second round of quantitative easing to jump-start the U.S. economy. Subsequent upturns in economic data and corporate earnings supported rising stock prices into the first quarter of 2011. However, the rally was interrupted in February when political unrest in the Middle East led to sharply rising energy prices, and in March when devastating natural and nuclear disasters in Japan threatened to disrupt the global industrial supply chain. Still, stocks generally recovered quickly from these unexpected shocks.
In late April, investor sentiment began to deteriorate in earnest when Greece appeared headed for default, U.S. economic data proved disappointing and a contentious debate in Congress regarding government spending and borrowing intensified. Stocks suffered bouts of heightened volatility as newly risk-averse investors shifted their focus to industry groups that historically have held up well under uncertain economic conditions. Midcap stocks produced slightly higher returns than large-cap stocks for the overall reporting period.
Stock Selections Produced Mixed Results
Our security selection strategy drove above-average returns in the materials sectors, where chemicals producer NewMarket posted improved financial results and raised its dividend. Among consumer discretionary companies, fashion accessories retailer Fossil announced better-than-expected earnings and raised future guidance, while footwear and apparel retailer Timberland benefited from an acquisition offer. Both names were sold out of the fund late in the reporting period. In the health care sector, the stock price of medical technology firm Kinetic Concepts more than doubled during the reporting period as the company achieved improved financial results and received a takeover offer, and health care insurer Humana initiated a dividend during the reporting period as earnings climbed amid reduced medical claims industrywide.A number of individual holdings also helped bolster the fund’s relative performance, including technology firm Cypress Semiconductor, which encountered robust demand for the microchips used in touch-screen displays for smartphones and tablet computers.
Laggards during the reporting period included names in the consumer staples sector, which proved to be the benchmark’s top performing
4
market sector.The fund did not own some of the stocks that fared well for the benchmark, such as coffee maker Green Mountain Coffee, which did not meet our valuation criteria. In the telecommunications services sector, service providerTelephone & Data Systems was hurt by intensifying competitive pressures in its wireless business. Results from the energy sector were constrained by consumable fuel producers such as Arch Coal, which suffered later in the reporting period due to production problems and economic concerns.
Focused on Value, Momentum and Quality
Although we are aware of the recent downturn in economic sentiment, we remain committed to our disciplined investment approach. The quantitative valuation criteria considered by our security selection process became less predictive of stock-price movements amid heightened market volatility late in the reporting period, but fundamental momentum and quality factors continued to help us identify stocks that, in our judgment, are likely to rank among the overall stock market’s better long-term performers regardless of the headwinds facing businesses over the near term. We expect valuation factors to become more effective when investors refocus on the fundamental strengths and weakness of individual companies rather than reacting to macroeconomic developments.
September 15, 2011
Please note, the position in any security highlighted in italicized typeface was sold during the reporting period.
Equity funds are subject generally to market, market sector, market liquidity, issuer and investment style risks, among other factors, to varying degrees, all of which are more fully described in the fund’s prospectus.
Stocks of small- and/or midcap companies often experience sharper price fluctuations than stocks of large-cap companies.
1 Total return includes reinvestment of dividends and any capital gains paid, and does not take into
consideration the maximum initial sales charge in the case of Class A shares, or the applicable
contingent deferred sales charges imposed on redemptions in the case of Class B and Class C
shares. Had these charges been reflected, returns would have been lower. Past performance is no
guarantee of future results. Share price, yield and investment return fluctuate such that upon
redemption, fund shares may be worth more or less than their original cost.
2 SOURCE: LIPPER INC. — Reflects reinvestment of dividends and, where applicable, capital
gain distributions.The Standard & Poor’s MidCap 400 Index is a widely accepted, unmanaged
total return index measuring the performance of the midsize company segment of the U.S. market.
Investors cannot invest directly in any index.
The Fund 5
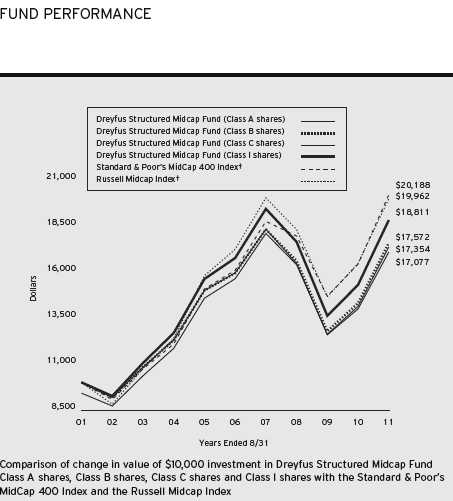
|
| † Source: Lipper Inc. |
| Past performance is not predictive of future performance. |
| The above graph compares a $10,000 investment made in Class A, Class B, Class C and Class I shares of Dreyfus |
| Structured Midcap Fund on 8/31/01 to a $10,000 investment made in the Standard & Poor’s MidCap 400 Index (the |
| “S&P 400 Index”) and the Russell Midcap Index on that date.All dividends and capital gain distributions are reinvested. |
| The fund’s performance shown in the line graph above takes into account the maximum initial sales charge on Class A |
| shares and all other applicable fees and expenses on all classes. Performance for Class B shares assumes the conversion of |
| Class B shares to Class A shares at the end of the sixth year following the date of purchase.The S&P 400 Index is a |
| widely accepted, unmanaged total return index measuring the performance of the midsize company segment of the U.S. |
| market.The Russell Midcap Index is a widely accepted, unmanaged index of medium-cap stock market performance. |
| Unlike a mutual fund, the indices are not subject to charges, fees and other expenses. Investors cannot invest directly in |
| any index. Further information relating to fund performance, including expense reimbursements, if applicable, is contained |
| in the Financial Highlights section of the prospectus and elsewhere in this report. |
6
| | | | | | |
| Average Annual Total Returns as of 8/31/11 | | |
| | 1Year | 5 Years | 10 Years |
| Class A shares | | | |
| with maximum sales charge (5.75%) | 15.75% | 0.92% | 5.67% |
| without sales charge | 22.83% | 2.12% | 6.30% |
| Class B shares | | | |
| with applicable redemption charge † | 17.82% | 0.91% | 5.80% |
| without redemption | 21.82% | 1.28% | 5.80% |
| Class C shares | | | |
| with applicable redemption charge †† | 21.11% | 1.39% | 5.50% |
| without redemption | 22.11% | 1.39% | 5.50% |
| Class I shares | 22.97% | 2.35% | 6.52% |
| Standard & Poor’s MidCap 400 Index | 22.89% | 4.65% | 7.28% |
| Russell Midcap Index | 21.28% | 2.99% | 7.16% |
Past performance is not predictive of future performance.The fund’s performance shown in the graph and table does not reflect the deduction of taxes that a shareholder would pay on fund distributions or the redemption of fund shares.
| |
| † | The maximum contingent deferred sales charge for Class B shares is 4%.After six years Class B shares convert to |
| | Class A shares. |
| †† | The maximum contingent deferred sales charge for Class C shares is 1% for shares redeemed within one year of the |
| | date of purchase. |
UNDERSTANDING YOUR FUND’S EXPENSES (Unaudited)
As a mutual fund investor, you pay ongoing expenses, such as management fees and other expenses. Using the information below, you can estimate how these expenses affect your investment and compare them with the expenses of other funds.You also may pay one-time transaction expenses, including sales charges (loads) and redemption fees, which are not shown in this section and would have resulted in higher total expenses. For more information, see your fund’s prospectus or talk to your financial adviser.
Review your fund’s expenses
The table below shows the expenses you would have paid on a $1,000 investment in Dreyfus Structured Midcap Fund from March 1, 2011 to August 31, 2011. It also shows how much a $1,000 investment would be worth at the close of the period, assuming actual returns and expenses.
Expenses and Value of a $1,000 Investment
assuming actual returns for the six months ended August 31, 2011
| | | | | | | | |
| | | Class A | | Class B | | Class C | | Class I |
| Expenses paid per $1,000† | $ | 7.20 | $ | 10.94 | $ | 10.22 | $ | 6.42 |
| Ending value (after expenses) | $ | 916.10 | $ | 912.00 | $ | 913.40 | $ | 916.10 |
COMPARING YOUR FUND’S EXPENSES WITH THOSE OF OTHER FUNDS (Unaudited)
Using the SEC’s method to compare expenses
The Securities and Exchange Commission (SEC) has established guidelines to help investors assess fund expenses. Per these guidelines, the table below shows your fund’s expenses based on a $1,000 investment, assuming a hypothetical 5% annualized return. You can use this information to compare the ongoing expenses (but not transaction expenses or total cost) of investing in the fund with those of other funds.All mutual fund shareholder reports will provide this information to help you make this comparison. Please note that you cannot use this information to estimate your actual ending account balance and expenses paid during the period.
Expenses and Value of a $1,000 Investment assuming a hypothetical 5% annualized return for the six months ended August 31, 2011
| | | | | | | | |
| | | Class A | | Class B | | Class C | | Class I |
| Expenses paid per $1,000† | $ | 7.58 | $ | 11.52 | $ | 10.76 | $ | 6.77 |
| Ending value (after expenses) | $ | 1,017.69 | $ | 1,013.76 | $ | 1,014.52 | $ | 1,018.50 |
† Expenses are equal to the fund’s annualized expense ratio of 1.49% for Class A, 2.27% for Class B, 2.12% for
Class C and 1.33% for Class I, multiplied by the average account value over the period, multiplied by 184/365
(to reflect the one-half year period).
8
STATEMENT OF INVESTMENTS
August 31, 2011
| | | |
| Common Stocks—100.0% | Shares | Value ($) |
| Consumer Discretionary—14.9% | | |
| American Greetings, Cl. A | 15,300a | 324,666 |
| ANN | 9,100a,b | 214,487 |
| Bob Evans Farms | 27,300a | 867,048 |
| Brinker International | 32,100a | 724,818 |
| Cheesecake Factory | 20,700a,b | 568,215 |
| ITT Educational Services | 9,400a,b | 678,304 |
| Meredith | 23,000a | 593,400 |
| O’Reilly Automotive | 13,300b | 862,904 |
| PetSmart | 16,200 | 683,316 |
| RadioShack | 33,900a | 441,039 |
| Scholastic | 15,800a | 438,608 |
| Signet Jewelers | 700 | 27,258 |
| Sotheby’s | 24,100a | 896,761 |
| TRW Automotive Holdings | 4,300b | 179,267 |
| Warnaco Group | 12,400a,b | 661,540 |
| Weight Watchers International | 400 | 24,208 |
| Williams-Sonoma | 17,800 | 589,358 |
| Wynn Resorts | 200 | 30,944 |
| | | 8,806,141 |
| Consumer Staples—6.9% | | |
| Church & Dwight | 27,800 | 1,210,412 |
| Coca-Cola Enterprises | 29,500 | 814,790 |
| Constellation Brands, Cl. A | 36,400b | 719,628 |
| Dr. Pepper Snapple Group | 800 | 30,784 |
| Smithfield Foods | 46,300a,b | 1,014,896 |
| Tootsie Roll Industries | 900 | 22,806 |
| Tyson Foods, Cl. A | 14,000 | 244,580 |
| | | 4,057,896 |
| Energy—10.3% | | |
| Arch Coal | 34,800 | 706,788 |
| Cimarex Energy | 11,200 | 796,208 |
| Murphy Oil | 1,700 | 91,086 |
| Oceaneering International | 28,400 | 1,212,396 |
| SEACOR Holdings | 8,300a | 736,542 |
| Southern Union | 1,400 | 58,632 |
The Fund 9
STATEMENT OF INVESTMENTS (continued)
| | | |
| Common Stocks (continued) | Shares | Value ($) |
| Energy (continued) | | |
| Superior Energy Services | 25,700a,b | 907,724 |
| Tesoro | 30,700b | 738,642 |
| Valero Energy | 34,900 | 792,928 |
| Whiting Petroleum | 700a,b | 32,977 |
| | | 6,073,923 |
| Financial—16.5% | | |
| American Financial Group | 21,350 | 710,528 |
| Apartment Investment & Management, Cl. A | 11,500a,c | 305,555 |
| Cathay General Bancorp | 65,100 | 834,582 |
| Comerica | 5,700 | 145,863 |
| Eaton Vance | 14,700a | 358,827 |
| Equity One | 2,600a,c | 46,826 |
| Fifth Third Bancorp | 2,700 | 28,674 |
| Highwoods Properties | 7,900a,c | 258,804 |
| Hospitality Properties Trust | 27,900c | 655,092 |
| Huntington Bancshares | 15,300 | 76,959 |
| Jones Lang LaSalle | 6,300 | 421,533 |
| KeyCorp | 100,100 | 664,664 |
| Liberty Property Trust | 8,300a,c | 281,702 |
| Macerich | 2,698c | 132,310 |
| Rayonier | 25,800a,c | 1,082,052 |
| Reinsurance Group of America | 10,600 | 565,722 |
| SEI Investments | 45,300 | 775,083 |
| SL Green Realty | 7,500c | 541,800 |
| StanCorp Financial Group | 14,700a | 449,085 |
| SVB Financial Group | 600b | 27,648 |
| Waddell & Reed Financial, Cl. A | 15,300 | 477,666 |
| Webster Financial | 47,400a | 857,940 |
| Weingarten Realty Investors | 1,300a,c | 31,681 |
| | | 9,730,596 |
| Health Care—9.9% | | |
| Agilent Technologies | 700b | 25,809 |
| AMERIGROUP | 2,400a,b | 118,728 |
| Charles River Laboratories International | 700b | 23,184 |
| Covance | 17,700a,b | 877,212 |
| Health Net | 10,800b | 266,652 |
10
| | | |
| Common Stocks (continued) | Shares | Value ($) |
| Health Care (continued) | | |
| Humana | 7,200 | 559,008 |
| IDEXX Laboratories | 9,100a,b | 725,998 |
| Kinetic Concepts | 10,300b | 695,662 |
| Life Technologies | 700a,b | 29,400 |
| LifePoint Hospitals | 5,100a,b | 187,170 |
| Myriad Genetics | 4,600b | 91,218 |
| Techne | 12,300 | 891,381 |
| United Therapeutics | 18,100b | 781,015 |
| Watson Pharmaceuticals | 8,200b | 550,384 |
| | | 5,822,821 |
| Industrial—11.9% | | |
| AGCO | 700b | 29,988 |
| Alaska Air Group | 16,100a,b | 929,453 |
| Copart | 877b | 37,746 |
| Corrections Corp. of America | 20,600b | 467,414 |
| Donaldson | 600 | 35,388 |
| Gardner Denver | 6,300 | 496,377 |
| Joy Global | 9,900 | 826,155 |
| KBR | 9,200 | 276,460 |
| Kennametal | 26,200 | 965,732 |
| Nordson | 17,500a | 768,250 |
| Pitney Bowes | 15,400a | 312,774 |
| Timken | 21,400 | 842,090 |
| Toro | 6,100a | 332,877 |
| URS | 20,100b | 704,907 |
| | | 7,025,611 |
| Information Technology—17.2% | | |
| ACI Worldwide | 17,200b | 514,452 |
| Arrow Electronics | 23,000b | 717,600 |
| BMC Software | 2,400b | 97,464 |
| Broadridge Financial Solutions | 1,400 | 29,148 |
| CA | 37,500 | 787,125 |
| Cadence Design Systems | 22,000a,b | 203,280 |
| Computer Sciences | 1,000 | 30,660 |
| Convergys | 20,800a,b | 221,520 |
| DST Systems | 17,415 | 817,112 |
The Fund 11
STATEMENT OF INVESTMENTS (continued)
| | | |
| Common Stocks (continued) | Shares | Value ($) |
| Information Technology (continued) | | |
| FactSet Research Systems | 10,000 | 879,000 |
| Fairchild Semiconductor International | 51,800b | 686,868 |
| IAC/InterActiveCorp | 16,900a,b | 668,057 |
| Integrated Device Technology | 3,900a,b | 22,074 |
| Lender Processing Services | 10,200a | 179,928 |
| LSI | 26,700b | 181,827 |
| Parametric Technology | 6,500a,b | 117,000 |
| Plantronics | 24,600a | 788,430 |
| QLogic | 41,600a,b | 581,152 |
| Solera Holdings | 8,300 | 486,795 |
| Synopsys | 26,900b | 696,172 |
| Tech Data | 13,500a,b | 635,580 |
| Vishay Intertechnology | 70,600a,b | 804,840 |
| | | 10,146,084 |
| Materials—5.3% | | |
| Cabot | 9,000 | 309,870 |
| Domtar | 12,200a | 979,904 |
| Minerals Technologies | 15,300a | 887,553 |
| NewMarket | 5,400a | 905,472 |
| Steel Dynamics | 2,100 | 26,733 |
| Westlake Chemical | 600a | 27,570 |
| | | 3,137,102 |
| Telecommunication Services—1.3% | | |
| Telephone & Data Systems | 28,700a | 735,581 |
| Utilities—5.8% | | |
| CMS Energy | 9,100a | 179,270 |
| Great Plains Energy | 49,100a | 959,905 |
| Hawaiian Electric Industries | 37,900a | 910,358 |
| NV Energy | 15,100 | 225,292 |
| PNM Resources | 3,300 | 49,368 |
| Questar | 55,300 | 1,036,322 |
| WGL Holdings | 800 | 33,088 |
| Wisconsin Energy | 800a | 25,312 |
| | | 3,418,915 |
| Total Common Stocks | | |
| (cost $60,598,791) | | 58,954,670 |
12
| | | | |
| Other Investment—.3% | Shares | | Value ($) | |
| Registered Investment Company; | | | | |
| Dreyfus Institutional Preferred | | | | |
| Plus Money Market Fund | | | | |
| (cost $203,000) | 203,000 | d | 203,000 | |
| |
| Investment of Cash Collateral | | | | |
| for Securities Loaned—30.2% | | | | |
| Registered Investment Company; | | | | |
| Dreyfus Institutional Cash | | | | |
| Advantage Fund | | | | |
| (cost $17,823,756) | 17,823,756 | d | 17,823,756 | |
| |
| Total Investments (cost $78,625,547) | 130.5 | % | 76,981,426 | |
| Liabilities, Less Cash and Receivables | (30.5 | %) | (18,002,944 | ) |
| Net Assets | 100.0 | % | 58,978,482 | |
a Security, or portion thereof, on loan.At August 31, 2011, the value of the fund’s securities on loan was
$17,449,627 and the value of the collateral held by the fund was $17,823,756.
b Non-income producing security.
c Investment in real estate investment trust.
d Investment in affiliated money market mutual fund.
| | | |
| Portfolio Summary (Unaudited)† | | |
| |
| | Value (%) | | Value (%) |
| |
| Money Market Investments | 30.5 | Health Care | 9.9 |
| Information Technology | 17.2 | Consumer Staples | 6.9 |
| Financial | 16.5 | Utilities | 5.8 |
| Consumer Discretionary | 14.9 | Materials | 5.3 |
| Industrial | 11.9 | Telecommunication Services | 1.3 |
| Energy | 10.3 | | 130.5 |
| |
| † Based on net assets. | | | |
| See notes to financial statements. | | | |
The Fund 13
STATEMENT OF ASSETS AND LIABILITIES
August 31, 2011
| | | | | |
| | | | Cost | Value |
| Assets ($): | | | | |
| Investments in securities—See Statement of Investments (including | | |
| securities on loan, valued at $17,449,627)—Note 1(b): | | | |
| Unaffiliated issuers | | | 60,598,791 | 58,954,670 |
| Affiliated issuers | | | 18,026,756 | 18,026,756 |
| Cash | | | | 130,004 |
| Dividends and securities lending income receivable | | | 85,186 |
| Receivable for shares of Common Stock subscribed | | | 71,905 |
| Prepaid expenses | | | | 30,129 |
| | | | | 77,298,650 |
| Liabilities ($): | | | | |
| Due to The Dreyfus Corporation and affiliates—Note 3(c) | | | 65,431 |
| Liability for securities on loan—Note 1(b) | | | 17,823,756 |
| Payable for shares of Common Stock redeemed | | | 272,624 |
| Accrued expenses | | | | 158,357 |
| | | | | 18,320,168 |
| Net Assets ($) | | | | 58,978,482 |
| Composition of Net Assets ($): | | | | |
| Paid-in capital | | | | 79,719,822 |
| Accumulated net realized gain (loss) on investments | | | (19,097,219) |
| Accumulated net unrealized appreciation | | | |
| (depreciation) on investments | | | | (1,644,121) |
| Net Assets ($) | | | | 58,978,482 |
| |
| |
| Net Asset Value Per Share | | | | |
| | Class A | Class B | Class C | Class I |
| Net Assets ($) | 23,915,694 | 771,989 | 10,246,103 | 24,044,696 |
| Shares Outstanding | 1,281,126 | 44,589 | 589,007 | 1,271,485 |
| Net Asset Value Per Share ($) | 18.67 | 17.31 | 17.40 | 18.91 |
| |
| See notes to financial statements. | | | | |
14
| | |
| STATEMENT OF OPERATIONS | |
| Year Ended August 31, 2011 | |
| |
| |
| |
| |
| Investment Income ($): | |
| Income: | |
| Cash dividends; | |
| Unaffiliated issuers | 1,135,932 |
| Affiliated issuers | 1,318 |
| Income from securities lending—Note 1(b) | 5,851 |
| Total Income | 1,143,101 |
| Expenses: | |
| Management fee—Note 3(a) | 734,284 |
| Shareholder servicing costs—Note 3(c) | 444,708 |
| Distribution fees—Note 3(b) | 95,776 |
| Professional fees | 49,894 |
| Prospectus and shareholders’ reports | 28,140 |
| Registration fees | 25,206 |
| Custodian fees—Note 3(c) | 12,854 |
| Directors’ fees and expenses—Note 3(d) | 5,392 |
| Loan commitment fees—Note 2 | 2,803 |
| Interest expense—Note 2 | 309 |
| Miscellaneous | 15,434 |
| Total Expenses | 1,414,800 |
| Less—reduction in fees due to earnings credits—Note 3(c) | (114) |
| Net Expenses | 1,414,686 |
| Investment (Loss)—Net | (271,585) |
| Realized and Unrealized Gain (Loss) on Investments—Note 4 ($): | |
| Net realized gain (loss) on investments | 18,979,741 |
| Net unrealized appreciation (depreciation) on investments | 4,085,751 |
| Net Realized and Unrealized Gain (Loss) on Investments | 23,065,492 |
| Net Increase in Net Assets Resulting from Operations | 22,793,907 |
| |
| See notes to financial statements. | |
The Fund 15
STATEMENT OF CHANGES IN NET ASSETS
| | | | |
| | Year Ended August 31, |
| | 2011 | 2010 |
| Operations ($): | | |
| Investment income (loss)—net | (271,585) | 340,616 |
| Net realized gain (loss) on investments | 18,979,741 | 13,969,824 |
| Net unrealized appreciation | | |
| (depreciation) on investments | 4,085,751 | (261,939) |
| Net Increase (Decrease) in Net Assets | | |
| Resulting from Operations | 22,793,907 | 14,048,501 |
| Dividends to Shareholders from ($): | | |
| Investment income—net: | | |
| Class A Shares | — | (150,648) |
| Class I Shares | (55,786) | (348,790) |
| Total Dividends | (55,786) | (499,438) |
| Capital Stock Transactions ($): | | |
| Net proceeds from shares sold: | | |
| Class A Shares | 9,548,620 | 15,618,802 |
| Class B Shares | 57,321 | 2,680 |
| Class C Shares | 959,967 | 377,043 |
| Class I Shares | 15,154,007 | 11,934,738 |
| Dividends reinvested: | | |
| Class A Shares | — | 133,029 |
| Class I Shares | 54,008 | 346,096 |
| Cost of shares redeemed: | | |
| Class A Shares | (27,849,252) | (33,353,051) |
| Class B Shares | (1,148,902) | (866,390) |
| Class C Shares | (2,585,597) | (3,441,338) |
| Class I Shares | (50,356,931) | (18,409,429) |
| Increase (Decrease) in Net Assets | | |
| from Capital Stock Transactions | (56,166,759) | (27,657,820) |
| Total Increase (Decrease) in Net Assets | (33,428,638) | (14,108,757) |
| Net Assets ($): | | |
| Beginning of Period | 92,407,120 | 106,515,877 |
| End of Period | 58,978,482 | 92,407,120 |
| Undistributed investment income—net | — | 57,646 |
16
| | | | |
| | Year Ended August 31, |
| | 2011 | 2010 |
| Capital Share Transactions: | | |
| Class Aa | | |
| Shares sold | 502,019 | 989,480 |
| Shares issued for dividends reinvested | — | 8,952 |
| Shares redeemed | (1,511,372) | (2,143,237) |
| Net Increase (Decrease) in Shares Outstanding | (1,009,353) | (1,144,805) |
| Class Ba | | |
| Shares sold | 3,071 | 192 |
| Shares redeemed | (63,501) | (60,344) |
| Net Increase (Decrease) in Shares Outstanding | (60,430) | (60,152) |
| Class C | | |
| Shares sold | 51,812 | 25,223 |
| Shares redeemed | (147,845) | (236,940) |
| Net Increase (Decrease) in Shares Outstanding | (96,033) | (211,717) |
| Class I | | |
| Shares sold | 760,264 | 750,763 |
| Shares issued for dividends reinvested | 2,539 | 23,058 |
| Shares redeemed | (2,501,967) | (1,106,922) |
| Net Increase (Decrease) in Shares Outstanding | (1,739,164) | (333,101) |
a During the period ended August 31, 2011, 20,076 Class B shares representing $366,375 were automatically
converted to 18,687 Class A shares and during the period ended August 31, 2010, 10,691 Class B shares
representing $146,551 were automatically converted to 10,029 Class A shares.
See notes to financial statements.
The Fund 17
FINANCIAL HIGHLIGHTS
The following tables describe the performance for each share class for the fiscal periods indicated.All information (except portfolio turnover rate) reflects financial results for a single fund share.Total return shows how much your investment in the fund would have increased (or decreased) during each period, assuming you had reinvested all dividends and distributions.These figures have been derived from the fund’s financial statements.
| | | | | | | | | | |
| | | Year Ended August 31, | |
| Class A Shares | 2011 | 2010 | 2009 | 2008 | 2007 |
| Per Share Data ($): | | | | | |
| Net asset value, beginning of period | 15.20 | 13.62 | 17.80 | 20.93 | 18.57 |
| Investment Operations: | | | | | |
| Investment income (loss)—neta | (.05) | .04 | .09 | .06 | .05 |
| Net realized and unrealized | | | | | |
| gain (loss) on investments | 3.52 | 1.59 | (4.20) | (1.93) | 2.85 |
| Total from Investment Operations | 3.47 | 1.63 | (4.11) | (1.87) | 2.90 |
| Distributions: | | | | | |
| Dividends from investment income—net | — | (.05) | (.07) | — | — |
| Dividends from net realized | | | | | |
| gain on investments | — | — | — | (1.26) | (.54) |
| Total Distributions | — | (.05) | (.07) | (1.26) | (.54) |
| Net asset value, end of period | 18.67 | 15.20 | 13.62 | 17.80 | 20.93 |
| Total Return (%)b | 22.83 | 11.97 | (23.02) | (9.37) | 15.76 |
| Ratios/Supplemental Data (%): | | | | | |
| Ratio of total expenses | | | | | |
| to average net assets | 1.43 | 1.36 | 1.52 | 1.22 | 1.22 |
| Ratio of net expenses | | | | | |
| to average net assets | 1.43 | 1.36 | 1.51 | 1.22 | 1.22 |
| Ratio of net investment income | | | | | |
| (loss) to average net assets | (.29) | .27 | .74 | .32 | .26 |
| Portfolio Turnover Rate | 77.12 | 84.88 | 102.59 | 88.40 | 122.16 |
| Net Assets, end of period ($ x 1,000) | 23,916 | 34,811 | 46,780 | 60,795 | 106,762 |
a Based on average shares outstanding at each month end.
b Exclusive of sales charge.
See notes to financial statements.
18
| | | | | | | | | | |
| | | Year Ended August 31, | |
| Class B Shares | 2011 | 2010 | 2009 | 2008 | 2007 |
| Per Share Data ($): | | | | | |
| Net asset value, beginning of period | 14.21 | 12.79 | 16.77 | 19.96 | 17.87 |
| Investment Operations: | | | | | |
| Investment (loss)—neta | (.18) | (.08) | (.01) | (.09) | (.12) |
| Net realized and unrealized | | | | | |
| gain (loss) on investments | 3.28 | 1.50 | (3.97) | (1.84) | 2.75 |
| Total from Investment Operations | 3.10 | 1.42 | (3.98) | (1.93) | 2.63 |
| Distributions: | | | | | |
| Dividends from net realized | | | | | |
| gain on investments | — | — | — | (1.26) | (.54) |
| Net asset value, end of period | 17.31 | 14.21 | 12.79 | 16.77 | 19.96 |
| Total Return (%)b | 21.82 | 11.10 | (23.73) | (10.16) | 14.91 |
| Ratios/Supplemental Data (%): | | | | | |
| Ratio of total expenses | | | | | |
| to average net assets | 2.20 | 2.21 | 2.34 | 2.07 | 2.09 |
| Ratio of net expenses | | | | | |
| to average net assets | 2.20 | 2.21 | 2.34 | 2.07 | 2.08 |
| Ratio of net investment (loss) | | | | | |
| to average net assets | (1.00) | (.58) | (.11) | (.53) | (.62) |
| Portfolio Turnover Rate | 77.12 | 84.88 | 102.59 | 88.40 | 122.16 |
| Net Assets, end of period ($ x 1,000) | 772 | 1,492 | 2,113 | 4,030 | 5,798 |
a Based on average shares outstanding at each month end.
b Exclusive of sales charge.
See notes to financial statements.
The Fund 19
FINANCIAL HIGHLIGHTS (continued)
| | | | | | | | | | |
| | | Year Ended August 31, | |
| Class C Shares | 2011 | 2010 | 2009 | 2008 | 2007 |
| Per Share Data ($): | | | | | |
| Net asset value, beginning of period | 14.25 | 12.82 | 16.78 | 19.96 | 17.86 |
| Investment Operations: | | | | | |
| Investment income (loss)—neta | (.17) | (.07) | .00b | (.08) | (.11) |
| Net realized and unrealized | | | | | |
| gain (loss) on investments | 3.32 | 1.50 | (3.96) | (1.84) | 2.75 |
| Total from Investment Operations | 3.15 | 1.43 | (3.96) | (1.92) | 2.64 |
| Distributions: | | | | | |
| Dividends from net realized | | | | | |
| gain on investments | — | — | — | (1.26) | (.54) |
| Net asset value, end of period | 17.40 | 14.25 | 12.82 | 16.78 | 19.96 |
| Total Return (%)c | 22.11 | 11.15 | (23.60) | (10.10) | 14.91 |
| Ratios/Supplemental Data (%): | | | | | |
| Ratio of total expenses | | | | | |
| to average net assets | 2.09 | 2.11 | 2.23 | 2.01 | 2.01 |
| Ratio of net expenses | | | | | |
| to average net assets | 2.09 | 2.11 | 2.22 | 2.00 | 2.01 |
| Ratio of net investment income | | | | | |
| (loss) to average net assets | (.95) | (.49) | .01 | (.46) | (.55) |
| Portfolio Turnover Rate | 77.12 | 84.88 | 102.59 | 88.40 | 122.16 |
| Net Assets, end of period ($ x 1,000) | 10,246 | 9,764 | 11,499 | 22,554 | 28,984 |
a Based on average shares outstanding at each month end.
b Amount represents less than $.01 per share.
c Exclusive of sales charge.
See notes to financial statements.
20
| | | | | | | | | | |
| | | Year Ended August 31, | |
| Class I Shares | 2011 | 2010 | 2009 | 2008 | 2007a |
| Per Share Data ($): | | | | | |
| Net asset value, beginning of period | 15.39 | 13.79 | 18.05 | 21.18 | 18.75 |
| Investment Operations: | | | | | |
| Investment income (loss)—netb | (.02) | .09 | .12 | .10 | .09 |
| Net realized and unrealized | | | | | |
| gain (loss) on investments | 3.56 | 1.61 | (4.26) | (1.97) | 2.88 |
| Total from Investment Operations | 3.54 | 1.70 | (4.14) | (1.87) | 2.97 |
| Distributions: | | | | | |
| Dividends from investment income—net | (.02) | (.10) | (.12) | — | — |
| Dividends from net realized | | | | | |
| gain on investments | — | — | — | (1.26) | (.54) |
| Total Distributions | (.02) | (.10) | (.12) | (1.26) | (.54) |
| Net asset value, end of period | 18.91 | 15.39 | 13.79 | 18.05 | 21.18 |
| Total Return (%) | 22.97 | 12.37 | (22.78) | (9.25) | 15.99 |
| Ratios/Supplemental Data (%): | | | | | |
| Ratio of total expenses | | | | | |
| to average net assets | 1.30 | 1.05 | 1.18 | 1.04 | 1.13 |
| Ratio of net expenses | | | | | |
| to average net assets | 1.30 | 1.05 | 1.17 | 1.03 | 1.07 |
| Ratio of net investment income | | | | | |
| (loss) to average net assets | (.12) | .57 | 1.01 | .51 | .41 |
| Portfolio Turnover Rate | 77.12 | 84.88 | 102.59 | 88.40 | 122.16 |
| Net Assets, end of period ($ x 1,000) | 24,045 | 46,340 | 46,124 | 61,738 | 30,071 |
a Effective June 1, 2007, Class R shares were redesignated as Class I shares.
b Based on average shares outstanding at each month end.
See notes to financial statements.
The Fund 21
NOTES TO FINANCIAL STATEMENTS
NOTE 1—Significant Accounting Policies:
Dreyfus Structured Midcap Fund (the “fund”) is a separate diversified series of Advantage Funds, Inc. (the “Company”) which is registered under the Investment Company Act of 1940, as amended (the “Act”), as an open-end management investment company and operates as a series company offering thirteen series, including the fund.The fund’s investment objective is to seek long-term capital growth.The Dreyfus Corporation (the “Manager” or “Dreyfus”), a wholly-owned subsidiary of The Bank of New York Mellon Corporation (“BNY Mellon”), serves as the fund’s investment adviser. Mellon Capital Management Corporation (“Mellon Capital”), an affiliate of Dreyfus, serves as the fund’s sub-investment adviser.
MBSC Securities Corporation (the “Distributor”), a wholly-owned subsidiary of Dreyfus, is the distributor of the fund’s shares.The fund is authorized to issue 500 million shares of $.001 par value Common Stock. The fund currently offers four classes of shares: Class A (200 million shares authorized), Class B (100 million shares authorized), Class C (100 million shares authorized) and Class I (100 million shares authorized). Class A shares are subject to a sales charge imposed at the time of purchase. Class B shares are subject to a contingent deferred sales charge (“CDSC”) imposed on Class B share redemptions made within six years of purchase and automatically convert to Class A shares after six years. The fund no longer offers Class B shares except in connection with dividend reinvestment and permitted exchanges of Class B shares. Class C shares are subject to a CDSC imposed on Class C shares redeemed within one year of purchase. Class I shares are sold at net asset value per share only to institutional investors. Other differences between the classes include the services offered to and the expenses borne by each class, the allocation of certain transfer agency costs and certain voting rights. Income, expenses (other than expenses attributable to a specific class), and realized and unrealized gains or losses on investments are allocated to each class of shares based on its relative net assets.
22
The Company accounts separately for the assets, liabilities and operations of each series. Expenses directly attributable to each series are charged to that series’ operations; expenses which are applicable to all series are allocated among them on a pro rata basis.
The Financial Accounting Standards Board (“FASB”) Accounting Standards Codification (“ASC”) is the exclusive reference of authoritative U.S. generally accepted accounting principles (“GAAP”) recognized by the FASB to be applied by nongovernmental entities. Rules and interpretive releases of the Securities and Exchange Commission (“SEC”) under authority of federal laws are also sources of authoritative GAAP for SEC registrants. The fund’s financial statements are prepared in accordance with GAAP, which may require the use of management estimates and assumptions.Actual results could differ from those estimates.
The Company enters into contracts that contain a variety of indemnifications. The fund’s maximum exposure under these arrangements is unknown.The fund does not anticipate recognizing any loss related to these arrangements.
(a) Portfolio valuation: The fair value of a financial instrument is the amount that would be received to sell an asset or paid to transfer a liability in an orderly transaction between market participants at the measurement date (i.e. the exit price). GAAP establishes a fair value hierarchy that prioritizes the inputs of valuation techniques used to measure fair value.This hierarchy gives the highest priority to unadjusted quoted prices in active markets for identical assets or liabilities (Level 1 measurements) and the lowest priority to unobservable inputs (Level 3 measurements).
Additionally, GAAP provides guidance on determining whether the volume and activity in a market has decreased significantly and whether such a decrease in activity results in transactions that are not orderly. GAAP requires enhanced disclosures around valuation inputs and techniques used during annual and interim periods.
The Fund 23
NOTES TO FINANCIAL STATEMENTS (continued)
Various inputs are used in determining the value of the fund’s investments relating to fair value measurements.These inputs are summarized in the three broad levels listed below:
Level 1—unadjusted quoted prices in active markets for identical investments.
Level 2—other significant observable inputs (including quoted prices for similar investments, interest rates, prepayment speeds, credit risk, etc.).
Level 3—significant unobservable inputs (including the fund’s own assumptions in determining the fair value of investments).
The inputs or methodology used for valuing securities are not necessarily an indication of the risk associated with investing in those securities.
Changes in valuation techniques may result in transfers in or out of an assigned level within the disclosure hierarchy. Valuation techniques used to value the fund’s investments are as follows:
Investments in securities are valued at the last sales price on the securities exchange or national securities market on which such securities are primarily traded. Securities listed on the National Market System for which market quotations are available are valued at the official closing price or, if there is no official closing price that day, at the last sales price. Securities not listed on an exchange or the national securities market, or securities for which there were no transactions, are valued at the average of the most recent bid and asked prices, except for open short positions, where the asked price is used for valuation purposes. Bid price is used when no asked price is available. Registered investment companies that are not traded on an exchange are valued at their net asset value.All preceding securities are categorized as Level 1 in the hierarchy.
Fair valuing of securities may be determined with the assistance of a pricing service using calculations based on indices of domestic securities and other appropriate indicators, such as prices of relevant American Depository Receipts and futures contracts. Utilizing these techniques may result in transfers between Level 1 and Level 2 of the fair value hierarchy.
24
When market quotations or official closing prices are not readily available, or are determined not to reflect accurately fair value, such as when the value of a security has been significantly affected by events after the close of the exchange or market on which the security is principally traded (for example, a foreign exchange or market), but before the fund calculates its net asset value, the fund may value these investments at fair value as determined in accordance with the procedures approved by the Board of Directors. Certain factors may be considered when fair valuing investments such as: fundamental analytical data, the nature and duration of restrictions on disposition, an evaluation of the forces that influence the market in which the securities are purchased and sold, and public trading in similar securities of the issuer or comparable issuers. These securities are either categorized as Level 2 or 3 depending on the relevant inputs used.
For restricted securities where observable inputs are limited, assumptions about market activity and risk are used and are categorized as Level 3 in the hierarchy.
The following is a summary of the inputs used as of August 31, 2011 in valuing the fund’s investments:
| | | | |
| | | Level 2—Other | Level 3— | |
| | Level 1— | Significant | Significant | |
| | Unadjusted | Observable | Unobservable | |
| | Quoted Prices | Inputs | Inputs | Total |
| Assets ($) | | | | |
| Investments in Securities: | | | |
| Equity Securities— | | | | |
| Domestic† | 58,927,412 | — | — | 58,927,412 |
| Equity Securities— | | | | |
| Foreign† | 27,258 | — | — | 27,258 |
| Mutual Funds | 18,026,756 | — | — | 18,026,756 |
| † See Statement of Investments for additional detailed categorizations. | |
In January 2010, FASB issued Accounting Standards Update (“ASU”) No. 2010-06 “Improving Disclosures about FairValue Measurements” (“ASU 2010-06”). The portions of ASU 2010-06 which require
The Fund 25
NOTES TO FINANCIAL STATEMENTS (continued)
reporting entities to prepare new disclosures surrounding amounts and reasons for significant transfers in and out of Level 1 and Level 2 fair value measurements as well as inputs and valuation techniques used to measure fair value for both recurring and nonrecurring fair value measurements that fall in either Level 2 or Level 3 have been adopted by the fund. No significant transfers between Level 1 or Level 2 fair value measurements occurred at August 31, 2011.
In May 2011, FASB issued ASU No. 2011-04 “Amendments to Achieve Common Fair Value Measurement and Disclosure Requirements in GAAP and International Financial Reporting Standards (“IFRS”)” (“ASU 2011-04”). ASU 2011-04 includes common requirements for measurement of and disclosure about fair value between GAAP and IFRS. ASU 2011-04 will require reporting entities to disclose the following information for fair value measurements categorized within Level 3 of the fair value hierarchy: quantitative information about the unobservable inputs used in the fair value measurement, the valuation processes used by the reporting entity and a narrative description of the sensitivity of the fair value measurement to changes in unobservable inputs and the interrelationships between those unobservable inputs. In addition, ASU 2011-04 will require reporting entities to make disclosures about amounts and reasons for all transfers in and out of Level 1 and Level 2 fair value measurements.The new and revised disclosures are effective for interim and annual reporting periods beginning after December 15, 2011. At this time, management is evaluating the implications of ASU 2011-04 and its impact on the financial statements.
(b) Securities transactions and investment income: Securities transactions are recorded on a trade date basis. Realized gains and losses from securities transactions are recorded on the identified cost basis. Dividend income is recognized on the ex-dividend date and interest income, including, where applicable, accretion of discount and amortization of premium on investments, is recognized on the accrual basis.
Pursuant to a securities lending agreement with The Bank of New York Mellon, a subsidiary of BNY Mellon and an affiliate of Dreyfus,
26
the fund may lend securities to qualified institutions. It is the fund’s policy that, at origination, all loans are secured by collateral of at least 102% of the value of U.S. securities loaned and 105% of the value of foreign securities loaned. Collateral equivalent to at least 100% of the market value of securities on loan is maintained at all times. Collateral is either in the form of cash, which can be invested in certain money market mutual funds managed by Dreyfus, U.S. Government and Agency securities or letters of credit.The fund is entitled to receive all income on securities loaned, in addition to income earned as a result of the lending transaction. Although each security loaned is fully collateralized, the fund bears the risk of delay in recovery of, or loss of rights in, the securities loaned should a borrower fail to return the securities in a timely manner. During the period ended August 31, 2011, The Bank of New York Mellon earned $2,508 from lending portfolio securities, pursuant to the securities lending agreement.
(c) Affiliated issuers: Investments in other investment companies advised by Dreyfus are defined as “affiliated” in the Act.
The fund may invest in shares of certain affiliated investment companies also advised or managed by Dreyfus. Investments in affiliated investment companies for the period ended August 31, 2011 were as follows:
| | | | | | | |
| Affiliated | | | | | | | |
| Investment | Value | | | | Value | | Net |
| Company | 8/31/2010 | ($) | Purchases ($) | Sales ($) | 8/31/2011 | ($) | Assets (%) |
| Dreyfus | | | | | | | |
| Institutional | | | | | | | |
| Preferred | | | | | | | |
| Plus Money | | | | | | | |
| Market Fund | — | | 17,620,000 | 17,417,000 | 203,000 | | .3 |
| Dreyfus | | | | | | | |
| Institutional | | | | | | | |
| Cash | | | | | | | |
| Advantage | | | | | | | |
| Fund† | 6,591,157 | | 51,617,360 | 40,384,761 | 17,823,756 | | 30.2 |
| Total | 6,591,157 | | 69,237,360 | 57,801,761 | 18,026,756 | | 30.5 |
† On June 7, 2011, Dreyfus Institutional Cash Advantage Plus Fund was acquired by Dreyfus
Institutional Cash Advantage Fund, resulting in a transfer of shares.
The Fund 27
NOTES TO FINANCIAL STATEMENTS (continued)
(d) Dividends to shareholders: Dividends are recorded on the ex-dividend date. Dividends from investment income-net and dividends from net realized capital gains are normally declared and paid annually, but the fund may make distributions on a more frequent basis to comply with the distribution requirements of the Internal Revenue Code of 1986, as amended (the “Code”).To the extent that net realized capital gains can be offset by capital loss carryovers, it is the policy of the fund not to distribute such gains. Income and capital gain distributions are determined in accordance with income tax regulations, which may differ from GAAP.
(e) Federal income taxes: It is the policy of the fund to continue to qualify as a regulated investment company, if such qualification is in the best interests of its shareholders, by complying with the applicable provisions of the Code, and to make distributions of taxable income sufficient to relieve it from substantially all federal income and excise taxes.
As of and during the period ended August 31, 2011, the fund did not have any liabilities for any uncertain tax positions.The fund recognizes interest and penalties, if any, related to uncertain tax positions as income tax expense in the Statement of Operations. During the period, the fund did not incur any interest or penalties.
Each of the tax years in the four-year period ended August 31, 2011 remains subject to examination by the Internal Revenue Service and state taxing authorities.
At August 31, 2011, the components of accumulated earnings on a tax basis were as follows: accumulated capital losses $19,027,724 and unrealized depreciation $1,713,616.
The accumulated capital loss carryover is available for federal income tax purposes to be applied against future net securities profits, if any, realized subsequent to August 31, 2011. If not applied, the carryover expires in fiscal 2018.
The tax character of distributions paid to shareholders during the fiscal periods ended August 31, 2011 and August 31, 2010 were as follows: ordinary income $55,786 and $499,438, respectively.
28
During the period ended August 31, 2011, as a result of permanent book to tax differences, primarily due to the tax treatment for net operating losses, the fund increased accumulated undistributed investment income-net by $269,725 and decreased paid-in capital by the same amount. Net assets and net asset value per share were not affected by this reclassification.
NOTE 2—Bank Lines of Credit:
The fund participates with other Dreyfus-managed funds in a $225 million unsecured credit facility led by Citibank, N.A. and a $300 million unsecured credit facility provided by The Bank of New York Mellon (each, a “Facility”), each to be utilized primarily for temporary or emergency purposes, including the financing of redemptions. In connection therewith, the fund has agreed to pay its pro rata portion of commitment fees for each Facility. Interest is charged to the fund based on rates determined pursuant to the terms of the respective Facility at the time of borrowing.
The average amount of borrowings outstanding under the Facilities during the period ended August 31, 2011 was approximately $22,700, with a related weighted average annualized interest rate of 1.36%.
NOTE 3—Management Fee, Sub-Investment Advisory Fee and Other Transactions With Affiliates:
(a) Pursuant to a management agreement with Dreyfus, the management fee is computed at the annual rate of .75% of the value of the fund’s average daily net assets and is payable monthly.
Pursuant to a sub-investment advisory agreement between Dreyfus and Mellon Capital, the sub-investment advisory fee is payable monthly by Dreyfus, and is based upon the value of the fund’s average daily net assets, computed at the following annual rates:
| | |
| Average Net Assets | |
| 0 up to $100 million | .25% |
| $100 million up to $1 billion | .20% |
| $1 billion up to $1.5 billion | .16% |
| In excess of $1.5 billion | .10% |
The Fund 29
NOTES TO FINANCIAL STATEMENTS (continued)
During the period ended August 31, 2011, the Distributor retained $3,029 from commissions earned on sales of the fund’s Class A shares and $3,832 and $381 from CDSCs on redemptions of the fund’s Class B and Class C shares, respectively.
(b) Under the Distribution Plan (the “Plan”) adopted pursuant to Rule 12b-1 under the Act, Class B and Class C shares pay the Distributor for distributing their shares at an annual rate of .75% of the value of the average daily net assets of Class B and Class C shares. During the period ended August 31, 2011, Class B and Class C shares were charged $10,219 and $85,557, respectively, pursuant to the Plan.
(c) Under the Shareholder Services Plan, Class A, Class B and Class C shares pay the Distributor at an annual rate of .25% of the value of their average daily net assets for the provision of certain services.The services provided may include personal services relating to shareholder accounts, such as answering shareholder inquiries regarding the fund and providing reports and other information, and services related to the maintenance of shareholder accounts. The Distributor may make payments to Service Agents (a securities dealer, financial institution or other industry professional) in respect of these services.The Distributor determines the amounts to be paid to Service Agents. During the period ended August 31, 2011, Class A, Class B and Class C shares were charged $73,350, $3,406 and $28,519, respectively, pursuant to the Shareholder Services Plan.
The fund compensates Dreyfus Transfer, Inc., a wholly-owned subsidiary of Dreyfus, under a transfer agency agreement for providing personnel and facilities to perform transfer agency services for the fund. During the period ended August 31, 2011, the fund was charged $32,408 pursuant to the transfer agency agreement, which is included in Shareholder servicing costs in the Statement of Operations.
The fund has arrangements with the custodian and cash management bank whereby the fund may receive earnings credits when positive cash balances are maintained, which are used to offset custody and cash management fees. For financial reporting purposes, the fund includes net earnings credits as an expense offset in the Statement of Operations.
30
The fund compensates The Bank of New York Mellon under a cash management agreement for performing cash management services related to fund subscriptions and redemptions. During the period ended August 31, 2011, the fund was charged $2,461 pursuant to the cash management agreement, which is included in Shareholder servicing costs in the Statement of Operations.These fees were partially offset by earnings credits of $114.
The fund also compensates The Bank of New York Mellon under a custody agreement for providing custodial services for the fund. During the period ended August 31, 2011, the fund was charged $12,854 pursuant to the custody agreement.
During the period ended August 31, 2011, the fund was charged $7,225 for services performed by the Chief Compliance Officer.
The components of “Due to The Dreyfus Corporation and affiliates” in the Statement of Assets and Liabilities consist of: management fees $36,828, Rule 12b-1 distribution plan fees $6,838, shareholder services plan fees $7,205, custodian fees $4,340, chief compliance officer fees $3,253 and transfer agency per account fees $6,967.
(d) Each Board member also serves as a Board member of other funds within the Dreyfus complex. Annual retainer fees and attendance fees are allocated to each fund based on net assets.
NOTE 4—Securities Transactions:
The aggregate amount of purchases and sales of investment securities, excluding short-term securities, during the period ended August 31, 2011, amounted to $74,227,848 and $130,013,162, respectively.
At August 31, 2011, the cost of investments for federal income tax purposes was $78,695,042; accordingly, accumulated net unrealized depreciation on investments was $1,713,616, consisting of $4,029,230 gross unrealized appreciation and $5,742,846 gross unrealized depreciation.
The Fund 31
REPORT OF INDEPENDENT REGISTERED
PUBLIC ACCOUNTING FIRM
Shareholders and Board of Directors
Dreyfus Structured Midcap Fund
We have audited the accompanying statement of assets and liabilities, including the statement of investments, of Dreyfus Structured Midcap Fund (one of the series comprising Advantage Funds, Inc.) as of August 31, 2011, and the related statement of operations for the year then ended, the statement of changes in net assets for each of the two years in the period then ended and financial highlights for each of the years indicated therein.These financial statements and financial highlights are the responsibility of the Fund’s management. Our responsibility is to express an opinion on these financial statements and financial highlights based on our audits.
We conducted our audits in accordance with the standards of the Public Company Accounting Oversight Board (United States).Those standards require that we plan and perform the audit to obtain reasonable assurance about whether the financial statements and financial highlights are free of material misstatement.We were not engaged to perform an audit of the Fund’s internal control over financial reporting. Our audits included consideration of internal control over financial reporting as a basis for designing audit procedures that are appropriate in the circumstances, but not for the purpose of expressing an opinion on the effectiveness of the Fund’s internal control over financial reporting. Accordingly, we express no such opinion.An audit also includes examining, on a test basis, evidence supporting the amounts and disclosures in the financial statements and financial highlights, assessing the accounting principles used and significant estimates made by management, and evaluating the overall financial statement presentation. Our procedures included confirmation of securities owned as of August 31, 2011 by correspondence with the custodian and others. We believe that our audits provide a reasonable basis for our opinion.
In our opinion, the financial statements and financial highlights referred to above present fairly, in all material respects, the financial position of Dreyfus Structured Midcap Fund at August 31, 2011, the results of its operations for the year then ended, the changes in its net assets for each of the two years in the period then ended, and the financial highlights for each of the indicated years, in conformity with U.S. generally accepted accounting principles.

New York, New York
October 27, 2011
32
IMPORTANT TAX INFORMATION (Unaudited)
For federal tax purposes, the fund hereby designates 100% of the ordinary dividends paid during the fiscal year ended August 31, 2011 as qualifying for the corporate dividends received deduction.Also certain dividends paid by the fund may be subject to a maximum tax rate of 15%, as provided for by the Jobs and Growth Tax Relief Reconciliation Act of 2003. Of the distributions paid during the fiscal year, $55,786 represents the maximum amount that may be considered qualified dividend income. Shareholders will receive notification in early 2012 of the percentage applicable to the preparation of their 2011 income tax returns.
The Fund 33
INFORMATION ABOUT THE RENEWAL OF THE
FUND’S MANAGEMENT AND SUB-INVESTMENT
ADVISORY AGREEMENTS (Unaudited)
At a meeting of the fund’s Board of Directors held on March 1, 2011, the Board considered the renewal of the fund’s Management Agreement, pursuant to which Dreyfus provides the fund with investment advisory and administrative services (the “Agreement”), and the Sub-Investment Advisory Agreement (together, the “Agreements”), pursuant to which Mellon Capital Management Corporation (the “Sub-Adviser”) provides day-to-day management of the fund’s investments.The Board members, none of whom are “interested persons” (as defined in the Investment Company Act of 1940, as amended) of the fund, were assisted in their review by independent legal counsel and met with counsel in executive session separate from representatives of Dreyfus and the Sub-Adviser. In considering the renewal of the Agreements, the Board considered all factors that it believed to be relevant, including those discussed below. The Board did not identify any one factor as dispositive, and each Board member may have attributed different weights to the factors considered.
Analysis of Nature, Extent, and Quality of Services Provided to the Fund.The Board members considered information previously provided to them in presentations from representatives of Dreyfus regarding the nature, extent, and quality of the services provided to funds in the Dreyfus fund complex, and representatives of Dreyfus confirmed that there had been no material changes in this information. Dreyfus provided the number of open accounts in the fund, the fund’s asset size and the allocation of fund assets among distribution channels. Dreyfus also had previously provided information regarding the diverse intermediary relationships and distribution channels of funds in the Dreyfus fund complex and Dreyfus’ corresponding need for broad, deep, and diverse resources to be able to provide ongoing shareholder services to each distribution channel, including the distribution channel(s) for the fund.
The Board members also considered research support available to, and portfolio management capabilities of, the fund’s portfolio management personnel and that Dreyfus also provides oversight of day-to-day fund operations, including fund accounting and administration and assistance
34
in meeting legal and regulatory requirements.The Board members also considered Dreyfus’ extensive administrative, accounting, and compliance infrastructures, as well as Dreyfus’ supervisory activities over the Sub-Adviser. The Board also considered portfolio management’s brokerage policies and practices (including policies and practices regarding soft dollars) and the standards applied in seeking best execution.
Comparative Analysis of the Fund’s Performance and Management Fee and Expense Ratio. The Board members reviewed reports prepared by Lipper, Inc. (“Lipper”), an independent provider of investment company data, which included information comparing (1) the fund’s performance with the performance of a group of comparable funds (the “Performance Group”) and with a broader group of funds (the “Performance Universe”), all for various periods ended December 31, 2010, and (2) the fund’s actual and contractual management fees and total expenses with those of a group of comparable funds (the “Expense Group”) and with a broader group of funds (the “Expense Universe”), the information for which was derived in part from fund financial statements available to Lipper as of December 31, 2010. Dreyfus previously had furnished the Board with a description of the methodology Lipper used to select the Performance Group and Performance Universe and the Expense Group and Expense Universe.
Dreyfus representatives stated that the usefulness of performance comparisons may be affected by a number of factors, including different investment limitations that may be applicable to the fund and comparison funds.The Board members discussed the results of the comparisons and noted that the fund’s total return performance was in the first or second quartile of the Performance Group and Performance Universe for all periods, except for the four- and five-year periods when the fund’s total return performance was in the third quartile of the Performance Universe. Dreyfus also provided a comparison of the fund’s calendar year total returns to the returns of the fund’s benchmark index.
The Fund 35
INFORMATION ABOUT THE RENEWAL OF THE FUND’S MANAGEMENT
AND SUB-INVESTMENT ADVISORY AGREEMENTS (Unaudited) (continued)
The Board members also reviewed the range of actual and contractual management fees and total expenses of the Expense Group and Expense Universe funds and discussed the results of the comparisons. They noted that the fund’s contractual management fee was below the Expense Group median, the fund’s actual management fee was at the Expense Group median and above the Expense Universe median and the fund’s total expenses were below the Expense Group and at the Expense Universe medians.
Representatives of Dreyfus reviewed with the Board members the management or investment advisory fees (1) paid by funds advised or administered by Dreyfus that are in the same Lipper category as the fund and (2) paid to Dreyfus or the Sub-Adviser or its affiliates for advising any separate accounts and/or other types of client portfolios that are considered to have similar investment strategies and policies as the fund (the “Similar Clients”), and explained the nature of the Similar Clients.They discussed differences in fees paid and the relationship of the fees paid in light of any differences in the services provided and other relevant factors.The Board members considered the relevance of the fee information provided for the Similar Clients to evaluate the appropriateness and reasonableness of the fund’s management fee.
The Board considered the fee to the Sub-Adviser in relation to the fee paid to Dreyfus by the fund and the respective services provided by the Sub-Adviser and Dreyfus.The Board also noted the Sub-Adviser’s fee is paid by Dreyfus (out of its fee from the fund) and not the fund.
Analysis of Profitability and Economies of Scale. Dreyfus’ representatives reviewed the expenses allocated and profit received by Dreyfus and the resulting profitability percentage for managing the fund, and the method used to determine the expenses and profit. The Board concluded that the profitability results were not unreasonable, given the services rendered and service levels provided by Dreyfus.The Board previously had
36
been provided with information prepared by an independent consulting firm regarding Dreyfus’ approach to allocating costs to, and determining the profitability of, individual funds and the entire Dreyfus fund complex. The consulting firm also had analyzed where any economies of scale might emerge in connection with the management of a fund.
The Board’s counsel stated that the Board members should consider the profitability analysis (1) as part of their evaluation of whether the fees under the Agreements bear a reasonable relationship to the mix of services provided by Dreyfus and the Sub-Adviser, including the nature, extent and quality of such services, and (2) in light of the relevant circumstances for the fund and the extent to which economies of scale would be realized if the fund grows and whether fee levels reflect these economies of scale for the benefit of fund shareholders. Since Dreyfus, and not the fund, pays the Sub-Adviser pursuant to the Sub-Investment Advisory Agreement, the Board did not consider the Sub-Adviser’s profitability to be relevant to its deliberations. Dreyfus representatives noted that a discussion of economies of scale is predicated on a fund having achieved a substantial size with increasing assets and that, if a fund’s assets had been stable or decreasing, the possibility that Dreyfus may have realized any economies of scale would be less.They also noted that, as a result of shared and allocated costs among funds in the Dreyfus funds complex, the extent of economies of scale could depend substantially on the level of assets in the complex as a whole, so that increases and decreases in complex-wide assets can affect potential economies of scale in a manner that is disproportionate to, or even in the opposite direction from, changes in the fund’s asset level. The Board members also considered potential benefits to Dreyfus and the Sub-Adviser from acting as investment adviser and sub-investment adviser, respectively, and noted that there were no soft dollar arrangements in effect for trading the fund’s investments.
The Fund 37
INFORMATION ABOUT THE RENEWAL OF THE FUND’S MANAGEMENT
AND SUB-INVESTMENT ADVISORY AGREEMENTS (Unaudited) (continued)
At the conclusion of these discussions, the Board agreed that it had been furnished with sufficient information to make an informed business decision with respect to the renewal of the Agreements. Based on the discussions and considerations as described above, the Board concluded and determined as follows.
The Board concluded that the nature, extent and quality of the services provided by Dreyfus and the Sub-Adviser are adequate and appropriate.
The Board was satisfied with the fund’s performance.
The Board concluded that the fees paid to Dreyfus and the Sub- Adviser were reasonable in light of the considerations described above.
The Board determined that the economies of scale which may accrue to Dreyfus and its affiliates in connection with the management of the fund had been adequately considered by Dreyfus in connection with the fee rate charged to the fund pursuant to the Agreement and that, to the extent in the future it were determined that material economies of scale had not been shared with the fund, the Board would seek to have those economies of scale shared with the fund.
The Board members considered these conclusions and determinations, along with information received on a routine and regular basis throughout the year. In addition, it should be noted that the Board’s consideration of the contractual fee arrangements for this fund had the benefit of a number of years of reviews of prior or similar agreements during which lengthy discussions took place between the Board members and Dreyfus representatives. Certain aspects of the arrangements may receive greater scrutiny in some years than in others, and the Board members’ conclusions may be based, in part, on their consideration of the same or similar arrangements in prior years. The Board members determined that renewal of the Agreements was in the best interests of the fund and its shareholders.
38
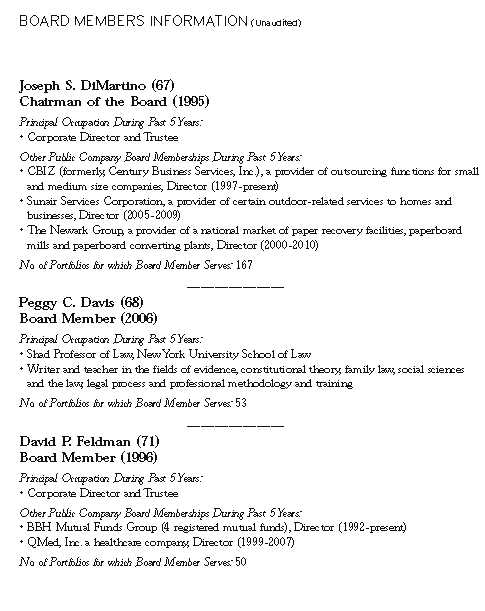
The Fund 39
40

The Fund 41
42
The Fund 43
For More Information
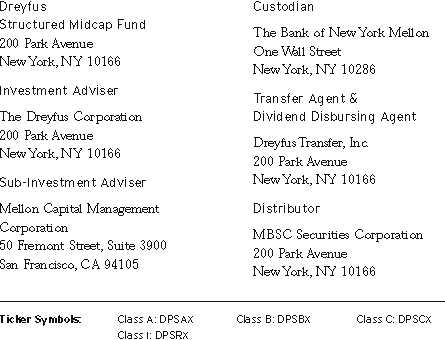
Telephone Call your financial representative or 1-800-DREYFUS
Mail The Dreyfus Family of Funds, 144 Glenn Curtiss Boulevard, Uniondale, NY 11556-0144
The fund files its complete schedule of portfolio holdings with the Securities and Exchange
Commission (“SEC”) for the first and third quarters of each fiscal year on Form N-Q. The
fund’s Forms N-Q are available on the SEC’s website at http://www.sec.gov and may be
reviewed and copied at the SEC’s Public Reference Room in Washington, DC. Information on
the operation of the Public Reference Room may be obtained by calling 1-800-SEC-0330.
A description of the policies and procedures that the fund uses to determine how to vote
proxies relating to portfolio securities, and information regarding how the fund voted
these proxies for the most recent 12-month period ended June 30 is available at
http://www.dreyfus.com and on the SEC’s website at http://www.sec.gov. The
description of the policies and procedures is also available without charge,
upon request, by calling 1-800-DREYFUS.

|
| © 2011 MBSC Securities Corporation |
|
| Dreyfus |
| Strategic Value Fund |
ANNUAL REPORT August 31, 2011

Save time. Save paper. View your next shareholder report online as soon as it’s available. Log into www.dreyfus.com and sign up for Dreyfus eCommunications. It’s simple and only takes a few minutes.
The views expressed in this report reflect those of the portfolio manager only through the end of the period covered and do not necessarily represent the views of Dreyfus or any other person in the Dreyfus organization. Any such views are subject to change at any time based upon market or other conditions and Dreyfus disclaims any responsibility to update such views.These views may not be relied on as investment advice and, because investment decisions for a Dreyfus fund are based on numerous factors, may not be relied on as an indication of trading intent on behalf of any Dreyfus fund.
Not FDIC-Insured • Not Bank-Guaranteed • May Lose Value
| | Contents |
| | THE FUND |
| 2 | A Letter from the Chairman and CEO |
| 3 | Discussion of Fund Performance |
| 6 | Fund Performance |
| 8 | Understanding Your Fund’s Expenses |
| 8 | Comparing Your Fund’s Expenses With Those of Other Funds |
| 9 | Statement of Investments |
| 13 | Statement of Assets and Liabilities |
| 14 | Statement of Operations |
| 15 | Statement of Changes in Net Assets |
| 17 | Financial Highlights |
| 21 | Notes to Financial Statements |
| 32 | Report of Independent Registered Public Accounting Firm |
| 33 | Important Tax Information |
| 34 | Information About the Renewal of the Fund’s Management Agreement |
| 39 | Board Members Information |
| 41 | Officers of the Fund |
| | FOR MORE INFORMATION |
| | Back Cover |
Dreyfus
Strategic Value Fund
The Fund

A LETTER FROM THE CHAIRMAN AND CEO
Dear Shareholder:
We are pleased to present this annual report for Dreyfus Strategic Value Fund, covering the 12-month period from September 1, 2010, through August 31, 2011. For information about how the fund performed during the reporting period, as well as general market perspectives, we provide a Discussion of Fund Performance on the pages that follow.
Although stocks rallied strongly through the first quarter of 2011 due to expectations of a more robust economic recovery, the reporting period ended amid sharply deteriorating investor sentiment due to disappointing economic data, an escalating sovereign debt crisis in Europe and a contentious debate regarding taxes, spending and borrowing in the United States. In the final month of the reporting period, a major credit rating agency downgraded U.S. long-term debt, marking the first time in history that U.S.Treasury securities were not assigned the highest possible credit rating. Stocks proved volatile in this tumultuous environment, as the stalled economy caused most market sectors to give back many of the reporting period’s previous gains.
The economic outlook currently is clouded by heightened market volatility and political infighting, but we believe that a sustained, moderate global expansion is more likely than a double-dip recession. Inflationary pressures appear to be waning in most countries, including the United States, as energy prices have retreated from their highs.The Federal Reserve Board has signaled its intention to maintain an aggressively accommodative monetary policy, which may help offset the financial stresses caused by recent fiscal policy choices in the United States and Europe. To assess how these and other developments may affect your investments, we encourage you, as always, to speak with your financial advisor.
Thank you for your continued confidence and support.

Jonathan R. Baum
Chairman and Chief Executive Officer
The Dreyfus Corporation
September 15, 2011
2

DISCUSSION OF FUND PERFORMANCE
For the period of September 1, 2010, through August 31, 2011, as provided by Brian Ferguson, Portfolio Manager
Fund and Market Performance Overview
For the 12-month period ended August 31, 2011, Dreyfus Strategic Value Fund’s Class A shares produced a total return of 13.52%, Class B shares produced a total return of 12.39%, Class C shares produced a total return of 12.64% and Class I shares produced a total return of 13.83%.1 The fund’s benchmark, the Russell 1000 Value Index, produced a total return of 14.37% for the same period.2
Stocks generally rallied early in the reporting period as an economic recovery appeared to gain traction, but renewed macroeconomic concerns later caused the market to give back many of its previous gains. The fund’s returns were lower than its benchmark, due primarily to an emphasis on some of the more economically sensitive market sectors over the final months of the reporting period.
The Fund’s Investment Approach
The fund seeks capital appreciation. We identify potential investments through extensive quantitative and fundamental research.The fund will focus on individual stock selection (a “bottom-up” approach), emphasizing three key factors: value, when quantitative screens track traditional measures, such as price-to-earnings, price-to-book and price-to-sales ratios, and then these ratios are analyzed and compared against the market; sound business fundamentals, when a company’s balance sheet and income data are examined to determine the company’s financial history; and positive business momentum, when a company’s earnings and forecast changes are analyzed and sales and earnings trends are reviewed to determine the company’s financial condition or the presence of a catalyst that will trigger a price increase near- to mid-term.
The fund typically sells a stock when we believe there is a more attractive alternative, the stock’s valuation is excessive or there are deteriorating fundamentals, such as a loss of competitive advantage, a failure in management execution or deteriorating capital structure.
DISCUSSION OF FUND PERFORMANCE (continued)
Shifting Sentiment Sparked Heightened Market Volatility
Market sentiment improved markedly at the start of the reporting period after the Federal Reserve Board announced a new round of quantitative easing and investors looked forward to better business conditions. Gains in employment, consumer spending and corporate earnings subsequently supported higher stock prices into the first quarter of 2011. However, the market rally was interrupted in February 2011 when political unrest in the Middle East led to sharply rising crude oil prices, and again in March when catastrophic natural and nuclear disasters in Japan disrupted the global industrial supply chain. Nonetheless, investors proved resilient, and the U.S. stock market rebounded relatively quickly from these unexpected shocks.
Investor sentiment began to deteriorate in earnest in late April when Greece again appeared headed for default on its sovereign debt. In addition, U.S. economic data proved more disappointing than expected, and investors reacted cautiously to a contentious debate regarding U.S. government spending and borrowing. Stocks suffered bouts of heightened volatility when newly risk-averse investors shifted their focus from economically sensitive industry groups and relatively speculative companies to those that historically have held up well under uncertain economic conditions.Value-oriented stocks produced lower returns, on average, than growth-oriented stocks in this environment.
Stock Selections Produced Mixed Results
Although the fund participated in the market’s overall gains to a significant degree, its relative performance was undermined by a pro-cyclical tilt in the consumer discretionary sector. In addition, household goods producer Newell Rubbermaid reduced its profit forecast due to sluggish consumer spending, and apparel seller Guess? encountered lower same-store sales and weaker store traffic in Europe. In the energy sector, our lack of exposure to integrated oil giant Chevron constrained results compared to the benchmark, and better results from other energy holdings were not sufficient to fully offset its adverse impact on relative performance.
On the other hand, our security selection strategy proved more successful in the industrials sector, where machinery producers Caterpillar, Dover and Cummins advanced amid robust demand from the emerging markets
4
and reconstruction efforts in Japan. In the materials sector, metals-and-mining giant Freeport McMoRan Copper & Gold benefited from rising commodity prices, and chemicals producer Celanese encountered strong demand for its products in China.
Seeking Opportunities Among Attractively Valued Stocks
Despite ongoing headwinds, we believe the economic expansion is likely to persist. Indeed, the stock market seems recently to have reacted more to macroeconomic developments than to the fundamental strengths and weaknesses of individual companies. In our analysis, many stocks have declined to lower valuations than are warranted by their fundamentals, including companies with the ability to grow in a variety of economic climates.
As of the end of the reporting period, our bottom-up security selection process has identified a number of opportunities in the consumer discretionary sector, where valuations of media companies appear especially attractive. Fewer stocks in the financials sector have satisfied our value-oriented investment criteria.
September 15, 2011
| |
| | Please note, the position in any security highlighted with italicized typface was sold during the |
| | reporting period. |
| | Equity funds are subject generally to market, market sector, market liquidity, issuer and investment |
| | style risks, among other factors, to varying degrees, all of which are more fully described in the |
| | fund’s prospectus. |
| 1 | Total return includes reinvestment of dividends and any capital gains paid and does not take into |
| | consideration the maximum initial sales charge in the case of Class A shares, or the applicable |
| | contingent deferred sales charges imposed on redemptions in the case of Class B and Class C |
| | shares. Had these charges been reflected, returns would have been lower. Past performance is no |
| | guarantee of future results. Share price and investment return fluctuate such that upon redemption, |
| | portfolio shares may be worth more or less than their original cost.The fund’s returns reflect the |
| | absorption of certain fund expenses by The Dreyfus Corporation pursuant to an agreement in |
| | effect through January 1, 2012, at which time it may be extended, terminated or modified. Had |
| | these expenses not been absorbed, the fund’s returns would have been lower. |
| 2 | SOURCE: LIPPER INC. — Reflects the reinvestment of dividends and, where applicable, |
| | capital gain distributions.The Russell 1000 Value Index is an unmanaged index which measures |
| | the performance of those Russell 1000 companies with lower price-to-book ratios and lower |
| | forecasted growth values. Investors cannot invest directly in any index. |
FUND PERFORMANCE
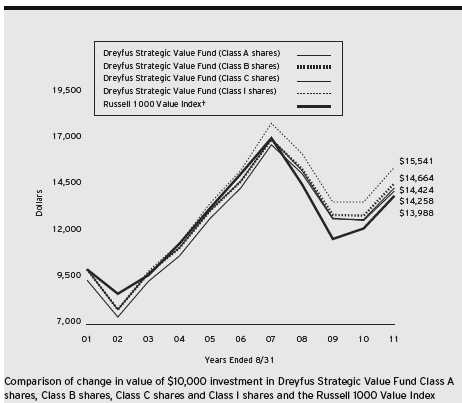
|
| † Source: Lipper Inc. |
| Past performance is not predictive of future performance. |
| The above graph compares a $10,000 investment made in each of the Class A, Class B, Class C and Class I shares of |
| Dreyfus Strategic Value Fund on 8/31/01 to a $10,000 investment made in the Russell 1000 Value Index (the |
| “Index”) on that date.All dividends and capital gain distributions are reinvested. |
| The fund’s performance shown in the line graph above takes into account the maximum initial sales charge on Class A |
| shares and all other applicable fees and expenses on all classes. Performance for Class B shares assumes the conversion of |
| Class B shares to Class A shares at the end of the sixth year following the date of purchase.The Index uses company |
| price-to-book ratios and long-term growth rates to calculate a composite ranking, which is used to determine if a stock is |
| “growth” or “value.” Unlike a mutual fund, the Index is not subject to charges, fees and other expenses. Investors cannot |
| invest directly in any index. Further information relating to fund performance, including expense reimbursements, if |
| applicable, is contained in the Financial Highlights section of the prospectus and elsewhere in this report. |
6
| | | | | | |
| Average Annual Total Returns as of 8/31/11 | | |
| |
| | 1Year | 5 Years | 10 Years |
| Class A shares | | | |
| with maximum sales charge (5.75%) | 7.00% | –1.17% | 3.73% |
| without sales charge | 13.52% | 0.01% | 4.35% |
| Class B shares | | | |
| with applicable redemption charge † | 8.39% | –1.22% | 3.90% |
| without redemption | 12.39% | –0.87% | 3.90% |
| Class C shares | | | |
| with applicable redemption charge †† | 11.64% | –0.74% | 3.61% |
| without redemption | 12.64% | –0.74% | 3.61% |
| Class I shares | 13.83% | 0.21% | 4.51% |
| Russell 1000 Value Index | 14.37% | –1.62% | 3.41% |
| |
| Past performance is not predictive of future performance.The fund’s performance shown in the graph and table does not |
| reflect the deduction of taxes that a shareholder would pay on fund distributions or the redemption of fund shares. |
| † | The maximum contingent deferred sales charge for Class B shares is 4%.After six years Class B shares convert to |
| | Class A shares. |
| †† | The maximum contingent deferred sales charge for Class C shares is 1% for shares redeemed within one year of the |
| | date of purchase. |
UNDERSTANDING YOUR FUND’S EXPENSES (Unaudited)
As a mutual fund investor, you pay ongoing expenses, such as management fees and other expenses. Using the information below, you can estimate how these expenses affect your investment and compare them with the expenses of other funds.You also may pay one-time transaction expenses, including sales charges (loads) and redemption fees, which are not shown in this section and would have resulted in higher total expenses. For more information, see your fund’s prospectus or talk to your financial adviser.
Review your fund’s expenses
The table below shows the expenses you would have paid on a $1,000 investment in Dreyfus Strategic Value Fund from March 1, 2011 to August 31, 2011. It also shows how much a $1,000 investment would be worth at the close of the period, assuming actual returns and expenses.
| | | | | | | | |
| Expenses and Value of a $1,000 Investment | | | | | | |
| assuming actual returns for the six months ended August 31, 2011 | | | | |
| | | Class A | | Class B | | Class C | | Class I |
| Expenses paid per $1,000† | $ | 4.61 | $ | 9.10 | $ | 8.12 | $ | 3.43 |
| Ending value (after expenses) | $ | 865.60 | $ | 861.40 | $ | 862.30 | $ | 866.80 |
COMPARING YOUR FUND’S EXPENSES
WITH THOSE OF OTHER FUNDS (Unaudited)
Using the SEC’s method to compare expenses
The Securities and Exchange Commission (SEC) has established guidelines to help investors assess fund expenses. Per these guidelines, the table below shows your fund’s expenses based on a $1,000 investment, assuming a hypothetical 5% annualized return. You can use this information to compare the ongoing expenses (but not transaction expenses or total cost) of investing in the fund with those of other funds.All mutual fund shareholder reports will provide this information to help you make this comparison. Please note that you cannot use this information to estimate your actual ending account balance and expenses paid during the period.
| | | | | | | | |
| Expenses and Value of a $1,000 Investment | | | | | | |
| assuming a hypothetical 5% annualized return for the six months ended August 31, 2011 |
| | | Class A | | Class B | | Class C | | Class I |
| Expenses paid per $1,000† | $ | 4.99 | $ | 9.86 | $ | 8.79 | $ | 3.72 |
| Ending value (after expenses) | $ | 1,020.27 | $ | 1,015.43 | $ | 1,016.48 | $ | 1,021.53 |
† Expenses are equal to the fund’s annualized expense ratio of .98% for Class A, 1.94% for Class B, 1.73% for Class C and .73% for Class I, multiplied by the average account value over the period, multiplied by 184/365 (to reflect the one-half year period).
8
|
| STATEMENT OF INVESTMENTS |
| August 31, 2011 |
| | | | |
| Common Stocks—99.6% | Shares | | | Value ($) |
| Consumer Discretionary—15.2% | | | | |
| Carnival | 326,870 | | | 10,796,516 |
| CBS, Cl. B | 150,660 | | | 3,774,033 |
| General Motors | 127,304 | | | 3,059,115 |
| Guess? | 172,200a | | 5,873,742 |
| Home Depot | 241,520 | | | 8,061,938 |
| Johnson Controls | 379,830 | | | 12,108,980 |
| Newell Rubbermaid | 425,090 | | | 5,883,246 |
| News, Cl. A | 519,550 | | | 8,972,628 |
| NVR | 4,710a,b | | 2,997,915 |
| Omnicom Group | 528,270 | | | 21,421,348 |
| Staples | 258,110 | | | 3,804,541 |
| Time Warner | 364,850 | | | 11,551,151 |
| Toll Brothers | 189,870a,b | | 3,263,865 |
| Viacom, Cl. B | 129,160 | | | 6,230,678 |
| Walt Disney | 304,600 | | | 10,374,676 |
| | | | | 118,174,372 |
| Consumer Staples—8.1% | | | | |
| ConAgra Foods | 155,590 | | | 3,799,508 |
| CVS Caremark | 283,950 | | | 10,196,645 |
| Dr. Pepper Snapple Group | 244,010 a | | | 9,389,505 |
| Energizer Holdings | 155,570a,b | | | 11,742,424 |
| Kraft Foods, Cl. A | 228,010 | | | 7,984,910 |
| PepsiCo | 302,390 | | | 19,482,988 |
| | | | | 62,595,980 |
| Energy—15.9% | | | | |
| Alpha Natural Resources | 196,850 | a,b | | 6,509,830 |
| Anadarko Petroleum | 252,720 | | | 18,638,100 |
| EOG Resources | 83,778 | | | 7,757,005 |
| Exxon Mobil | 220,910 | | | 16,356,176 |
| Hess | 61,810 | | | 3,667,805 |
| Occidental Petroleum | 391,070 | | | 33,921,412 |
| Schlumberger | 470,000 | | | 36,716,400 |
| | | | | 123,566,728 |
| Exchange Traded Funds—.5% | | | | |
| iShares Russell 1000 Value Index Fund | 62,910a | | 3,873,998 |
STATEMENT OF INVESTMENTS (continued)
| | | | |
| Common Stocks (continued) | Shares | | | Value ($) |
| Financial—19.9% | | | | |
| American Express | 84,290 | | | 4,190,056 |
| Ameriprise Financial | 194,120 | | | 8,871,284 |
| AON | 178,290 | | | 8,331,492 |
| Capital One Financial | 209,540a | | | 9,649,317 |
| Citigroup | 422,860 | | | 13,129,803 |
| Comerica | 343,840 | | | 8,798,866 |
| Franklin Resources | 34,950 | | | 4,191,204 |
| JPMorgan Chase & Co. | 669,158 | | | 25,133,574 |
| Marsh & McLennan | 287,770 | | | 8,552,524 |
| MetLife | 346,609 | | | 11,646,061 |
| Moody’s | 122,520a | | 3,777,292 |
| PNC Financial Services Group | 142,100 | | | 7,124,894 |
| Prudential Financial | 141,390a | | | 7,099,192 |
| SunTrust Banks | 339,610 | | | 6,758,239 |
| TD Ameritrade Holding | 338,250 a | | | 5,202,285 |
| Wells Fargo & Co. | 831,330 | | | 21,697,713 |
| | | | | 154,153,796 |
| Health Care—15.4% | | | | |
| Amgen | 159,770 | | | 8,852,057 |
| Baxter International | 101,190 | | | 5,664,616 |
| CIGNA | 160,080 | | | 7,482,139 |
| Johnson & Johnson | 253,640 | | | 16,689,512 |
| McKesson | 107,840 | | | 8,619,651 |
| Medtronic | 110,020 | | | 3,858,401 |
| Merck & Co. | 451,890 | | | 14,966,597 |
| Mylan | 192,530b | | 3,996,923 |
| Pfizer | 1,615,190 | | | 30,656,306 |
| Thermo Fisher Scientific | 73,940 | | | 4,061,524 |
| UnitedHealth Group | 208,740 | | | 9,919,325 |
| Watson Pharmaceuticals | 68,340b | | | 4,586,981 |
| | | | | 119,354,032 |
| Industrials—9.7% | | | | |
| Caterpillar | 96,000 | | | 8,736,000 |
10
| | | |
| Common Stocks (continued) | Shares | Value ($) |
| Industrials (continued) | | |
| Cooper Industries | 65,380 | 3,097,704 |
| Dover | 198,050 | 11,391,836 |
| Eaton | 130,290 | 5,595,956 |
| General Electric | 1,326,830 | 21,640,597 |
| Honeywell International | 71,310 | 3,409,331 |
| Hubbell, Cl. B | 66,060 | 3,906,128 |
| Owens Corning | 212,080b | 6,163,045 |
| Pitney Bowes | 197,476a | 4,010,738 |
| Stanley Black & Decker | 63,990 | 3,966,100 |
| Thomas & Betts | 75,500b | 3,297,840 |
| | | 75,215,275 |
| Information Technology—10.0% | | |
| Accenture, Cl. A | 131,890 | 7,067,985 |
| AOL | 264,128a,b | 4,115,114 |
| BMC Software | 228,400b | 9,275,324 |
| Cisco Systems | 749,050 | 11,745,104 |
| Corning | 187,790 | 2,822,484 |
| eBay | 133,200b | 4,111,884 |
| Electronic Arts | 652,380a,b | 14,730,740 |
| Oracle | 205,560 | 5,770,069 |
| QUALCOMM | 358,920 | 18,470,023 |
| | | 78,108,727 |
| Materials—4.1% | | |
| Air Products & Chemicals | 46,410 | 3,799,587 |
| Celanese, Ser. A | 154,220 | 7,249,882 |
| Cliffs Natural Resources | 66,880 | 5,541,008 |
| Dow Chemical | 302,160 | 8,596,452 |
| Freeport-McMoRan Copper & Gold | 135,240 | 6,375,214 |
| | | 31,562,143 |
| Utilities—.8% | | |
| Exelon | 137,700 | 5,937,624 |
| Total Common Stocks | | |
| (cost $785,039,129) | | 772,542,675 |
STATEMENT OF INVESTMENTS (continued)
| | | | |
| Other Investment—.0% | Shares | | Value ($) | |
| Registered Investment Company; | | | | |
| Dreyfus Institutional Preferred | | | | |
| Plus Money Market Fund | | | | |
| (cost $174,000) | 174,000 | c | 174,000 | |
| |
| Investment of Cash Collateral | | | | |
| for Securities Loaned—5.4% | | | | |
| Registered Investment Company; | | | | |
| Dreyfus Institutional Cash | | | | |
| Advantage Fund | | | | |
| (cost $42,142,311) | 42,142,311 | c | 42,142,311 | |
| |
| Total Investments (cost $827,355,440) | 105.0 | % | 814,858,986 | |
| Liabilities, Less Cash and Receivables | (5.0 | %) | (38,904,263 | ) |
| Net Assets | 100.0 | % | 775,954,723 | |
|
| a Security, or portion thereof, on loan.At August 31, 2011, the value of the fund’s securities on loan was |
| $41,321,678 and the value of the collateral held by the fund was $42,142,311. |
| b Non-income producing security. |
| c Investment in affiliated money market mutual fund. |
| | | |
| Portfolio Summary (Unaudited)† | | |
| |
| | Value (%) | | Value (%) |
| Financial | 19.9 | Consumer Staples | 8.1 |
| Energy | 15.9 | Money Market Investments | 5.4 |
| Health Care | 15.4 | Materials | 4.1 |
| Consumer Discretionary | 15.2 | Utilities | .8 |
| Information Technology | 10.0 | Exchange Traded Funds | .5 |
| Industrials | 9.7 | | 105.0 |
| |
| † Based on net assets. | | | |
| See notes to financial statements. | | | |
12
|
| STATEMENT OF ASSETS AND LIABILITIES |
| August 31, 2011 |
| | | | | |
| | | | Cost | Value |
| Assets ($): | | | | |
| Investments in securities—See Statement of Investments (including | | |
| securities on loan, valued at $41,321,678 )—Note 1(b): | | |
| Unaffiliated issuers | | | 785,039,129 | 772,542,675 |
| Affiliated issuers | | | 42,316,311 | 42,316,311 |
| Cash | | | | 434,048 |
| Receivable for investment securities sold | | | 9,998,884 |
| Dividends and securities lending income receivable | | | 1,709,284 |
| Receivable for shares of Common Stock subscribed | | | 786,690 |
| Prepaid expenses | | | | 56,380 |
| | | | | 827,844,272 |
| Liabilities ($): | | | | |
| Due to The Dreyfus Corporation and affiliates—Note 3(c) | | 513,341 |
| Liability for securities on loan—Note 1(b) | | | 42,142,311 |
| Payable for investment securities purchased | | | 6,208,992 |
| Payable for shares of Common Stock redeemed | | | 2,712,590 |
| Interest payable—Note 2 | | | | 299 |
| Accrued expenses | | | | 312,016 |
| | | | | 51,889,549 |
| Net Assets ($) | | | | 775,954,723 |
| Composition of Net Assets ($): | | | | |
| Paid-in capital | | | | 835,853,221 |
| Accumulated undistributed investment income—net | | | 3,710,565 |
| Accumulated net realized gain (loss) on investments | | | (51,112,609) |
| Accumulated net unrealized appreciation | | | |
| (depreciation) on investments | | | | (12,496,454) |
| Net Assets ($) | | | | 775,954,723 |
| |
| |
| Net Asset Value Per Share | | | | |
| | Class A | Class B | Class C | Class I |
| Net Assets ($) | 599,377,328 | 2,220,740 | 50,791,501 | 123,565,154 |
| Shares Outstanding | 22,818,690 | 88,673 | 2,027,299 | 4,698,740 |
| Net Asset Value Per Share ($) | 26.27 | 25.04 | 25.05 | 26.30 |
| See notes to financial statements. | | | | |
|
| STATEMENT OF OPERATIONS |
| Year Ended August 31, 2011 |
| | |
| Investment Income ($): | |
| Income: | |
| Cash dividends: | |
| Unaffiliated issuers | 13,967,965 |
| Affiliated issuers | 4,126 |
| Income from securities lending—Note 1(b) | 38,904 |
| Total Income | 14,010,995 |
| Expenses: | |
| Management fee—Note 3(a) | 6,114,990 |
| Shareholder servicing costs—Note 3(c) | 3,153,388 |
| Distribution fees—Note 3(b) | 448,904 |
| Registration fees | 76,474 |
| Custodian fees—Note 3(c) | 74,362 |
| Professional fees | 70,775 |
| Prospectus and shareholders’ reports | 64,366 |
| Directors’ fees and expenses—Note 3(d) | 36,591 |
| Loan commitment fees—Note 2 | 11,512 |
| Interest expense—Note 2 | 9,261 |
| Miscellaneous | 31,689 |
| Total Expenses | 10,092,312 |
| Less—reduction in management fee due to undertaking—Note 3(a) | (1,903,729) |
| Less—reduction in fees due to earnings credits—Note 3(c) | (1,890) |
| Net Expenses | 8,186,693 |
| Investment Income—Net | 5,824,302 |
| Realized and Unrealized Gain (Loss) on Investments—Note 4 ($): | |
| Net realized gain (loss) on investments | 97,982,582 |
| Net unrealized appreciation (depreciation) on investments | (22,195,946) |
| Net Realized and Unrealized Gain (Loss) on Investments | 75,786,636 |
| Net Increase in Net Assets Resulting from Operations | 81,610,938 |
| See notes to financial statements. | |
14
STATEMENT OF CHANGES IN NET ASSETS
| | | | |
| | Year Ended August 31, |
| | 2011 | 2010 |
| Operations ($): | | |
| Investment income—net | 5,824,302 | 3,494,498 |
| Net realized gain (loss) on investments | 97,982,582 | 33,640,084 |
| Net unrealized appreciation | | |
| (depreciation) on investments | (22,195,946) | (44,683,108) |
| Net Increase (Decrease) in Net Assets | | |
| Resulting from Operations | 81,610,938 | (7,548,526) |
| Dividends to Shareholders from ($): | | |
| Investment income—net: | | |
| Class A Shares | (4,284,720) | (2,992,381) |
| Class C Shares | (4,026) | — |
| Class I Shares | (712,083) | (343,308) |
| Total Dividends | (5,000,829) | (3,335,689) |
| Capital Stock Transactions ($): | | |
| Net proceeds from shares sold: | | |
| Class A Shares | 180,463,006 | 204,668,293 |
| Class B Shares | 107,295 | 530,511 |
| Class C Shares | 14,905,564 | 14,609,303 |
| Class I Shares | 124,773,051 | 70,120,896 |
| Dividends reinvested: | | |
| Class A Shares | 3,979,862 | 2,748,505 |
| Class C Shares | 3,009 | — |
| Class I Shares | 589,826 | 261,221 |
| Cost of shares redeemed: | | |
| Class A Shares | (193,366,113) | (164,295,662) |
| Class B Shares | (2,963,623) | (4,190,163) |
| Class C Shares | (16,686,438) | (10,383,196) |
| Class I Shares | (73,748,652) | (34,724,567) |
| Increase (Decrease) in Net Assets | | |
| from Capital Stock Transactions | 38,056,787 | 79,345,141 |
| Total Increase (Decrease) in Net Assets | 114,666,896 | 68,460,926 |
| Net Assets ($): | | |
| Beginning of Period | 661,287,827 | 592,826,901 |
| End of Period | 775,954,723 | 661,287,827 |
| Undistributed investment income—net | 3,710,565 | 2,887,092 |
STATEMENT OF CHANGES IN NET ASSETS (continued)
| | | | |
| | Year Ended August 31, |
| | 2011 | 2010 |
| Capital Share Transactions: | | |
| Class Aa | | |
| Shares sold | 6,288,752 | 8,209,417 |
| Shares issued for dividends reinvested | 143,263 | 111,411 |
| Shares redeemed | (6,868,340) | (6,576,727) |
| Net Increase (Decrease) in Shares Outstanding | (436,325) | 1,744,101 |
| Class Ba | | |
| Shares sold | 3,785 | 22,098 |
| Shares redeemed | (110,504) | (175,083) |
| Net Increase (Decrease) in Shares Outstanding | (106,719) | (152,985) |
| Class C | | |
| Shares sold | 535,560 | 607,753 |
| Shares issued for dividends reinvested | 113 | — |
| Shares redeemed | (620,905) | (436,880) |
| Net Increase (Decrease) in Shares Outstanding | (85,232) | 170,873 |
| Class I | | |
| Shares sold | 4,337,271 | 2,787,942 |
| Shares issued for dividends reinvested | 21,247 | 10,606 |
| Shares redeemed | (2,580,629) | (1,409,827) |
| Net Increase (Decrease) in Shares Outstanding | 1,777,889 | 1,388,721 |
| |
| a | During the period ended August 31, 2011, 49,753 Class B shares representing $1,350,217 were automatically |
| | converted to 47,592 Class A shares and during the period ended August 31, 2010, 86,705 Class B shares |
| | representing $2,077,411 were automatically converted to 83,143 Class A shares. |
| See notes to financial statements. |
16
FINANCIAL HIGHLIGHTS
The following tables describe the performance for each share class for the fiscal periods indicated. All information (except portfolio turnover rate) reflects financial results for a single fund share.Total return shows how much your investment in the fund would have increased (or decreased) during each period, assuming you had reinvested all dividends and distributions.These figures have been derived from the fund’s financial statements.
| | | | | | | | | | |
| | | Year Ended August 31, | |
| Class A Shares | 2011 | 2010 | 2009 | 2008 | 2007 |
| Per Share Data ($): | | | | | |
| Net asset value, beginning of period | 23.30 | 23.50 | 28.42 | 33.56 | 30.75 |
| Investment Operations: | | | | | |
| Investment income—neta | .21 | .14 | .22 | .27 | .31 |
| Net realized and unrealized | | | | | |
| gain (loss) on investments | 2.95 | (.20) | (4.88) | (3.21) | 4.60 |
| Total from Investment Operations | 3.16 | (.06) | (4.66) | (2.94) | 4.91 |
| Distributions: | | | | | |
| Dividends from | | | | | |
| investment income—net | (.19) | (.14) | (.26) | (.29) | (.21) |
| Dividends from net realized | | | | | |
| gain on investments | — | — | — | (1.91) | (1.89) |
| Total Distributions | (.19) | (.14) | (.26) | (2.20) | (2.10) |
| Net asset value, end of period | 26.27 | 23.30 | 23.50 | 28.42 | 33.56 |
| Total Return (%)b | 13.52 | (.29) | (16.14) | (9.39) | 16.32 |
| Ratios/Supplemental Data (%): | | | | | |
| Ratio of total expenses | | | | | |
| to average net assets | 1.20 | 1.22 | 1.27 | 1.16 | 1.18 |
| Ratio of net expenses | | | | | |
| to average net assets | .98 | 1.05 | 1.26 | 1.16 | 1.18 |
| Ratio of net investment income | | | | | |
| to average net assets | .74 | .56 | 1.09 | .88 | .94 |
| Portfolio Turnover Rate | 88.37 | 91.83 | 119.48 | 107.46 | 64.86 |
| Net Assets, end of period ($ x 1,000) | 599,377 | 541,877 | 505,409 | 526,723 | 433,687 |
| |
| a | Based on average shares outstanding at each month end. |
| b | Exclusive of sales charge. |
| See notes to financial statements. |
FINANCIAL HIGHLIGHTS (continued)
| | | | | | | | | | |
| | | Year Ended August 31, | |
| Class B Shares | 2011 | 2010 | 2009 | 2008 | 2007 |
| Per Share Data ($): | | | | | |
| Net asset value, beginning of period | 22.28 | 22.53 | 27.23 | 32.21 | 29.62 |
| Investment Operations: | | | | | |
| Investment income (loss)—neta | (.06) | (.08) | .04 | .02 | .05 |
| Net realized and unrealized | | | | | |
| gain (loss) on investments | 2.82 | (.17) | (4.68) | (3.09) | 4.43 |
| Total from Investment Operations | 2.76 | (.25) | (4.64) | (3.07) | 4.48 |
| Distributions: | | | | | |
| Dividends from investment income—net | — | — | (.06) | — | — |
| Dividends from net realized | | | | | |
| gain on investments | — | — | — | (1.91) | (1.89) |
| Total Distributions | — | — | (.06) | (1.91) | (1.89) |
| Net asset value, end of period | 25.04 | 22.28 | 22.53 | 27.23 | 32.21 |
| Total Return (%)b | 12.39 | (1.11) | (16.98) | (10.12) | 15.42 |
| Ratios/Supplemental Data (%): | | | | | |
| Ratio of total expenses | | | | | |
| to average net assets | 2.08 | 2.00 | 2.24 | 1.97 | 1.96 |
| Ratio of net expenses | | | | | |
| to average net assets | 1.94 | 1.90 | 2.23 | 1.97 | 1.96 |
| Ratio of net investment income | | | | | |
| (loss) to average net assets | (.22) | (.32) | .18 | .05 | .16 |
| Portfolio Turnover Rate | 88.37 | 91.83 | 119.48 | 107.46 | 64.86 |
| Net Assets, end of period ($ x 1,000) | 2,221 | 4,353 | 7,850 | 16,480 | 16,606 |
| |
| a | Based on average shares outstanding at each month end. |
| b | Exclusive of sales charge. |
| See notes to financial statements. |
18
| | | | | | | | | | |
| | | Year Ended August 31, | |
| Class C Shares | 2011 | 2010 | 2009 | 2008 | 2007 |
| Per Share Data ($): | | | | | |
| Net asset value, beginning of period | 22.24 | 22.45 | 27.17 | 32.22 | 29.65 |
| Investment Operations: | | | | | |
| Investment income (loss)—neta | (.00)b | (.05) | .07 | .04 | .05 |
| Net realized and unrealized | | | | | |
| gain (loss) on investments | 2.81 | (.16) | (4.67) | (3.09) | 4.44 |
| Total from Investment Operations | 2.81 | (.21) | (4.60) | (3.05) | 4.49 |
| Distributions: | | | | | |
| Dividends from investment income—net | (.00)b | — | (.12) | (.09) | (.03) |
| Dividends from net realized | | | | | |
| gain on investments | — | — | — | (1.91) | (1.89) |
| Total Distributions | (.00)b | — | (.12) | (2.00) | (1.92) |
| Net asset value, end of period | 25.05 | 22.24 | 22.45 | 27.17 | 32.22 |
| Total Return (%)c | 12.64 | (.94) | (16.83) | (10.05) | 15.45 |
| Ratios/Supplemental Data (%): | | | | | |
| Ratio of total expenses | | | | | |
| to average net assets | 1.93 | 1.95 | 2.04 | 1.92 | 1.91 |
| Ratio of net expenses | | | | | |
| to average net assets | 1.73 | 1.80 | 2.03 | 1.91 | 1.91 |
| Ratio of net investment income | | | | | |
| (loss) to average net assets | (.01) | (.19) | .34 | .13 | .17 |
| Portfolio Turnover Rate | 88.37 | 91.83 | 119.48 | 107.46 | 64.86 |
| Net Assets, end of period ($ x 1,000) | 50,792 | 46,986 | 43,593 | 53,065 | 30,079 |
| |
| a | Based on average shares outstanding at each month end. |
| b | Amount represents less than $.01 per share. |
| c | Exclusive of sales charge. |
| See notes to financial statements. |
FINANCIAL HIGHLIGHTS (continued)
| | | | | | | | | | |
| | | Year Ended August 31, | |
| Class I Shares | 2011 | 2010 | 2009 | 2008 | 2007a |
| Per Share Data ($): | | | | | |
| Net asset value, beginning of period | 23.31 | 23.48 | 28.45 | 33.58 | 30.78 |
| Investment Operations: | | | | | |
| Investment income—netb | .28 | .21 | .25 | .24 | .39 |
| Net realized and unrealized | | | | | |
| gain (loss) on investments | 2.94 | (.21) | (4.91) | (3.13) | 4.59 |
| Total from Investment Operations | 3.22 | — | (4.66) | (2.89) | 4.98 |
| Distributions: | | | | | |
| Dividends from investment income—net | (.23) | (.17) | (.31) | (.33) | (.29) |
| Dividends from net realized | | | | | |
| gain on investments | — | — | — | (1.91) | (1.89) |
| Total Distributions | (.23) | (.17) | (.31) | (2.24) | (2.18) |
| Net asset value, end of period | 26.30 | 23.31 | 23.48 | 28.45 | 33.58 |
| Total Return (%) | 13.83 | (.07) | (16.06) | (9.21) | 16.57 |
| Ratios/Supplemental Data (%): | | | | | |
| Ratio of total expenses | | | | | |
| to average net assets | 1.10 | 1.12 | 1.12 | 1.11 | 1.00 |
| Ratio of net expenses | | | | | |
| to average net assets | .73 | .82 | 1.11 | 1.09 | 1.00 |
| Ratio of net investment income | | | | | |
| to average net assets | .98 | .81 | 1.25 | 1.02 | 1.14 |
| Portfolio Turnover Rate | 88.37 | 91.83 | 119.48 | 107.46 | 64.86 |
| Net Assets, end of period ($ x 1,000) | 123,565 | 68,071 | 35,976 | 79,567 | 7,200 |
| |
| a | Effective June 1, 2007, Class R shares were redesignated as Class I shares. |
| b | Based on average shares outstanding at each month end. |
| See notes to financial statements. |
20
NOTES TO FINANCIAL STATEMENTS
NOTE 1—Significant Accounting Policies:
Dreyfus Strategic Value Fund (the “fund”) is a separate diversified series of Advantage Funds, Inc. (the “Company”), which is registered under the Investment Company Act of 1940, as amended (the “Act”), as an open-end management investment company and operates as a series company currently offering thirteen series, including the fund. The fund’s investment objective is to seek capital appreciation. The Dreyfus Corporation (the “Manager” or “Dreyfus”), a wholly-owned subsidiary of The Bank of New York Mellon Corporation (“BNY Mellon”), serves as the fund’s investment adviser.
MBSC Securities Corporation (the “Distributor”), a wholly-owned subsidiary of the Manager, is the distributor of the fund’s shares.The fund is authorized to issue 600 million shares of $.001 par value Common Stock.The fund currently offers four classes of shares: Class A (300 million shares authorized), Class B (100 million shares authorized), Class C (100 million shares authorized) and Class I (100 million shares authorized).Class A shares are subject to a sales charge imposed at the time of purchase. Class B shares are subject to a contingent deferred sales charge (“CDSC”) imposed on Class B share redemptions made within six years of purchase and automatically convert to Class A shares after six years.The fund no longer offers Class B shares, except in connection with dividend reinvestment and permitted exchanges of Class B shares. Class C shares are subject to a CDSC imposed on Class C shares redeemed within one year of purchase. Class I shares are sold at net asset value per share only to institutional investors. Other differences between the classes include the services offered to and the expenses borne by each class, the allocation of certain transfer agency costs and certain voting rights. Income, expenses (other than expenses attributable to a specific class), and realized and unrealized gains or losses on investments are allocated to each class of shares based on its relative net assets.
NOTES TO FINANCIAL STATEMENTS (continued)
The Company accounts separately for the assets, liabilities and operations of each series. Expenses directly attributable to each series are charged to that series’ operations; expenses which are applicable to all series are allocated among them on a pro rata basis.
The Financial Accounting Standards Board (“FASB”) Accounting Standards Codification (“ASC”) is the exclusive reference of authoritative U.S. generally accepted accounting principles (“GAAP”) recognized by the FASB to be applied by nongovernmental entities. Rules and interpretive releases of the Securities and Exchange Commission (“SEC”) under authority of federal laws are also sources of authoritative GAAP for SEC registrants. The fund’s financial statements are prepared in accordance with GAAP, which may require the use of management estimates and assumptions.Actual results could differ from those estimates.
The Company enters into contracts that contain a variety of indemnifications.The fund’s maximum exposure under these arrangements is unknown.The fund does not anticipate recognizing any loss related to these arrangements.
(a) Portfolio valuation: The fair value of a financial instrument is the amount that would be received to sell an asset or paid to transfer a liability in an orderly transaction between market participants at the measurement date (i.e. the exit price). GAAP establishes a fair value hierarchy that prioritizes the inputs of valuation techniques used to measure fair value.This hierarchy gives the highest priority to unadjusted quoted prices in active markets for identical assets or liabilities (Level 1 measurements) and the lowest priority to unobservable inputs (Level 3 measurements).
Additionally, GAAP provides guidance on determining whether the volume and activity in a market has decreased significantly and whether such a decrease in activity results in transactions that are not orderly. GAAP requires enhanced disclosures around valuation inputs and techniques used during annual and interim periods.
22
Various inputs are used in determining the value of the fund’s investments relating to fair value measurements.These inputs are summarized in the three broad levels listed below:
Level 1—unadjusted quoted prices in active markets for identical investments.
Level 2—other significant observable inputs (including quoted prices for similar investments, interest rates, prepayment speeds, credit risk, etc.).
Level 3—significant unobservable inputs (including the fund’s own assumptions in determining the fair value of investments).
The inputs or methodology used for valuing securities are not necessarily an indication of the risk associated with investing in those securities.
Changes in valuation techniques may result in transfers in or out of an assigned level within the disclosure hierarchy. Valuation techniques used to value the fund’s investments are as follows:
Investments in securities are valued at the last sales price on the securities exchange or national securities market on which such securities are primarily traded. Securities listed on the National Market System for which market quotations are available are valued at the official closing price or, if there is no official closing price that day, at the last sales price. Securities not listed on an exchange or the national securities market, or securities for which there were no transactions, are valued at the average of the most recent bid and asked prices, except for open short positions, where the asked price is used for valuation purposes. Bid price is used when no asked price is available. Registered investment companies that are not traded on an exchange are valued at their net asset value. All preceding securities are categorized as Level 1 in the hierarchy.
Fair valuing of securities may be determined with the assistance of a pricing service using calculations based on indices of domestic securities and other appropriate indicators, such as prices of relevant
NOTES TO FINANCIAL STATEMENTS (continued)
American Depository Receipts and futures contracts. Utilizing these techniques may result in transfers between Level 1 and Level 2 of the fair value hierarchy.
When market quotations or official closing prices are not readily available, or are determined not to reflect accurately fair value, such as when the value of a security has been significantly affected by events after the close of the exchange or market on which the security is principally traded (for example, a foreign exchange or market), but before the fund calculates its net asset value, the fund may value these investments at fair value as determined in accordance with the procedures approved by the Board of Directors. Certain factors may be considered when fair valuing investments such as: fundamental analytical data, the nature and duration of restrictions on disposition, an evaluation of the forces that influence the market in which the securities are purchased and sold, and public trading in similar securities of the issuer or comparable issuers. These securities are either categorized as Level 2 or 3 depending on the relevant inputs used.
For restricted securities where observable inputs are limited, assumptions about market activity and risk are used and are categorized as Level 3 in the hierarchy.
The following is a summary of the inputs used as of August 31, 2011 in valuing the fund’s investments:
| | | | |
| | Level 1— | Level 2—Other | Level 3— | |
| | Unadjusted | Significant | Significant | |
| | Quoted | Observable | Unobservable | |
| | Prices | Inputs | Inputs | Total |
| Assets ($) | | | | |
| Investments in Securities: | | | |
| Equity Securities— | | | | |
| Domestic† | 768,668,677 | — | — | 768,668,677 |
| Mutual Funds/ | | | | |
| Exchange | | | | |
| Traded Funds | 46,190,309 | — | — | 46,190,309 |
| |
| † See Statement of Investments for additional detailed categorizations. | |
In January 2010, FASB issued Accounting Standards Update (“ASU”) No. 2010-06 “Improving Disclosures about FairValue Measurements”
24
(“ASU 2010-06”). The portions of ASU 2010-06 which require reporting entities to prepare new disclosures surrounding amounts and reasons for significant transfers in and out of Level 1 and Level 2 fair value measurements as well as inputs and valuation techniques used to measure fair value for both recurring and nonrecurring fair value measurements that fall in either Level 2 or Level 3 have been adopted by the fund. No significant transfers between Level 1 or Level 2 fair value measurements occurred at August 31, 2011.
In May 2011, FASB issued ASU No. 2011-04 “Amendments to Achieve Common Fair Value Measurement and Disclosure Requirements in GAAP and International Financial Reporting Standards (“IFRS”)” (“ASU 2011-04”). ASU 2011-04 includes common requirements for measurement of and disclosure about fair value between GAAP and IFRS. ASU 2011-04 will require reporting entities to disclose the following information for fair value measurements categorized within Level 3 of the fair value hierarchy: quantitative information about the unobservable inputs used in the fair value measurement, the valuation processes used by the reporting entity and a narrative description of the sensitivity of the fair value measurement to changes in unobservable inputs and the interrelationships between those unobservable inputs. In addition, ASU 2011-04 will require reporting entities to make disclosures about amounts and reasons for all transfers in and out of Level 1 and Level 2 fair value measurements. The new and revised disclosures are effective for interim and annual reporting periods beginning after December 15, 2011. At this time, management is evaluating the implications of ASU 2011-04 and its impact on the financial statements.
(b) Securities transactions and investment income: Securities transactions are recorded on a trade date basis. Realized gains and losses from securities transactions are recorded on the identified cost basis. Dividend income is recognized on the ex-dividend date and interest income, including, where applicable, accretion of discount and amortization of premium on investments, is recognized on the accrual basis.
NOTES TO FINANCIAL STATEMENTS (continued)
Pursuant to a securities lending agreement with The Bank of New York Mellon, a subsidiary of BNY Mellon and an affiliate of Dreyfus, the fund may lend securities to qualified institutions. It is the fund’s policy that, at origination, all loans are secured by collateral of at least 102% of the value of U.S. securities loaned and 105% of the value of foreign securities loaned. Collateral equivalent to at least 100% of the market value of securities on loan is maintained at all times. Collateral is either in the form of cash, which can be invested in certain money market mutual funds managed by the Manager, U.S. Government and Agency securities or letters of credit.The fund is entitled to receive all income on securities loaned, in addition to income earned as a result of the lending transaction. Although each security loaned is fully collateralized, the fund bears the risk of delay in recovery of, or loss of rights in, the securities loaned should a borrower fail to return the securities in a timely manner. During the period ended August 31, 2011, The Bank of New York Mellon earned $16,673 from lending portfolio securities, pursuant to the securities lending agreement.
(c) Affiliated issuers: Investments in other investment companies advised by Dreyfus are defined as “affiliated” in the Act.
The fund may invest in shares of certain affiliated investment companies also advised or managed by Dreyfus. Investments in affiliated investment companies for the period ended August 31, 2011 were as follows:
| | | | | | | |
| Affiliated | | | | | | | |
| Investment | Value | | | | Value | | Net |
| Company | 8/31/2010 | ($) | Purchases ($) | Sales ($) | 8/31/2011 | ($) | Assets (%) |
| Dreyfus | | | | | | | |
| Institutional | | | | | | | |
| Preferred | | | | | | | |
| Plus Money | | | | | | | |
| Market Fund | 495,000 | | 177,469,000 | 177,790,000 | 174,000 | | .0 |
| Dreyfus | | | | | | | |
| Institutional | | | | | | | |
| Cash | | | | | | | |
| Advantage | | | | | | | |
| Fund | 3,332,626 | | 529,792,170 | 490,982,485 | 42,142,311 | | 5.4 |
| Total | 3,827,626 | | 707,261,170 | 668,772,485 | 42,316,311 | | 5.4 |
26
(d) Dividends to shareholders: Dividends are recorded on the ex-dividend date. Dividends from investment income-net and dividends from net realized capital gains, if any, are normally declared and paid annually, but the fund may make distributions on a more frequent basis to comply with the distribution requirements of the Internal Revenue Code of 1986, as amended (the “Code”).To the extent that net realized capital gains can be offset by capital loss carryovers, it is the policy of the fund not to distribute such gains. Income and capital gain distributions are determined in accordance with income tax regulations, which may differ from GAAP.
(e) Federal income taxes: It is the policy of the fund to continue to qualify as a regulated investment company, if such qualification is in the best interests of its shareholders, by complying with the applicable provisions of the Code, and to make distributions of taxable income sufficient to relieve it from substantially all federal income and excise taxes.
As of and during the period ended August 31, 2011, the fund did not have any liabilities for any uncertain tax positions.The fund recognizes interest and penalties, if any, related to uncertain tax positions as income tax expense in the Statement of Operations. During the period, the fund did not incur any interest or penalties.
Each of the tax years in the four-year period ended August 31, 2011 remains subject to examination by the Internal Revenue Service and state taxing authorities.
At August 31, 2011, the components of accumulated earnings on a tax basis were as follows: undistributed ordinary income $3,710,565, accumulated capital losses $47,474,086 and unrealized depreciation $16,134,977.
The accumulated capital loss carryover is available for federal income tax purposes to be applied against future net securities profits, if any, realized subsequent to August 31, 2011. If not applied, $43,463,536 of the carryover expires in fiscal 2018.
NOTES TO FINANCIAL STATEMENTS (continued)
As a result of the fund’s merger with Dreyfus Premier Intrinsic Value Fund, capital losses of $4,010,550 are available to offset future gains, if any. Based on certain provisions in the Code, the amount of losses which can be utilized in subsequent years is subject to an annual lim-itation.This acquired capital loss will expire in fiscal 2015.
The tax character of distributions paid to shareholders during the fiscal periods ended August 31, 2011 and August 31, 2010 were as follows: ordinary income $5,000,829 and $3,335,689, respectively.
NOTE 2—Bank Lines of Credit:
The fund participates with other Dreyfus-managed funds in a $225 million unsecured credit facility led by Citibank, N.A. and a $300 million unsecured credit facility provided by The Bank of New York Mellon (each, a “Facility”), each to be utilized primarily for temporary or emergency purposes, including the financing of redemptions. In connection therewith, the fund has agreed to pay its pro rata portion of commitment fees for each Facility. Interest is charged to the fund based on rates determined pursuant to the terms of the respective Facility at the time of borrowing.
The average amount of borrowings outstanding under the Facilities during the period ended August 31, 2011 was approximately $667,100 with a related weighted average annualized interest rate of 1.39%.
NOTE 3—Management Fee and Other Transactions with Affiliates:
(a) Pursuant to a management agreement with the Manager, the management fee is computed at the annual rate of .75% of the value of the fund’s average daily net assets and is payable monthly.The Manager has contractually agreed to waive receipt of its fees and/or assume the expenses of the fund until January 1, 2012, so that the net operating expenses of Class A, Class B, Class C and Class I shares (excluding taxes, interest, brokerage commissions, commitment fees on borrowings and extraordinary expenses) do not exceed .98%, 1.94%, 1.73% and .73% of the value of the respective class shares average daily net
28
assets.The reduction in management fee, pursuant to the undertakings, amounted to $1,903,729 during the period ended August 31, 2011.
During the period ended August 31, 2011, the Distributor retained $45,257 from commissions earned on sales of the fund’s Class A shares, and $2,798 and $10,206 from CDSCs on redemptions of the fund’s Class B and Class C shares, respectively.
(b) Under the Distribution Plan (the “Plan”) adopted pursuant to Rule 12b-1 under the Act, Class B and Class C shares pay the Distributor for distributing their shares at an annual rate of .75% of the value of the average daily net assets of Class B and Class C shares. During the period ended August 31, 2011, Class B and Class C shares were charged $26,104 and $422,800, respectively, pursuant to the Plan.
(c) Under the Shareholder Services Plan, Class A, Class B and Class C shares pay the Distributor at an annual rate of .25% of the value of their average daily net assets for the provision of certain services.The services provided may include personal services relating to shareholder accounts, such as answering shareholder inquiries regarding the fund and providing reports and other information, and services related to the maintenance of shareholder accounts. The Distributor may make payments to Service Agents (a securities dealer, financial institution or other industry professional) in respect of these services. The Distributor determines the amounts to be paid to Service Agents. During the period ended August 31, 2011, Class A, Class B and Class C shares were charged $1,608,149, $8,701 and $140,934, respectively, pursuant to the Shareholder Services Plan.
The fund compensates Dreyfus Transfer, Inc., a wholly-owned subsidiary of the Manager, under a transfer agency agreement for providing personnel and facilities to perform transfer agency services for the fund. During the period ended August 31, 2011, the fund was charged $273,718 pursuant to the transfer agency agreement, which is included in Shareholder servicing costs in the Statement of Operations.
NOTES TO FINANCIAL STATEMENTS (continued)
The fund has arrangements with the custodian and cash management bank whereby the fund may receive earnings credits when positive cash balances are maintained, which are used to offset custody and cash management fees. For financial reporting purposes, the fund includes net earnings credits as an expense offset in the Statement of Operations.
The fund compensates The Bank of New York Mellon under a cash management agreement for performing cash management services related to fund subscriptions and redemptions. During the period ended August 31, 2011, the fund was charged $41,828 pursuant to the cash management agreement, which is included in Shareholder servicing costs in the Statement of Operations.These fees were partially offset by earnings credits of $1,890.
The fund also compensates The Bank of New York Mellon under a custody agreement for providing custodial services for the fund. During the period ended August 31, 2011, the fund was charged $74,362 pursuant to the custody agreement.
During the period ended August 31, 2011, the fund was charged $7,225 for services performed by the Chief Compliance Officer.
The components of “Due to The Dreyfus Corporation and affiliates” in the Statement of Assets and Liabilities consist of: management fees $479,529, Rule 12b-1 distribution plan fees $32,986, shareholder services plan fees $135,127, custodian fees $25,600, chief compliance officer fees $3,253 and transfer agency per account fees $48,772, which are offset against an expense reimbursement currently in effect in the amount of $211,926.
(d) Each Board member also serves as a Board member of other funds within the Dreyfus complex. Annual retainer fees and attendance fees are allocated to each fund based on net assets.
30
NOTE 4—Securities Transactions:
The aggregate amount of purchases and sales of investment securities, excluding short-term securities, during the period ended August 31, 2011, amounted to $746,452,609 and $714,185,476, respectively.
At August 31, 2011, the cost of investments for federal income tax purposes was $830,993,963; accordingly, accumulated net unrealized depreciation on investments was $16,134,977, consisting of $39,604,620 gross unrealized appreciation and $55,739,597 gross unrealized depreciation.
NOTE 5—Plan of Reorganization:
On April 7, 2011, the fund’s Board of Directors authorized the fund to acquire the assets of two other Dreyfus-managed funds, Dreyfus Core Value Fund and Dreyfus Large Cap Value Fund (each an “Acquired Fund”), in separate tax-free reorganizations. The shareholders of each Acquired Fund approved the merger on August 11, 2011. On the date of the merger, the fund will acquire all of the assets of each Acquired Fund in exchange for Class A, C and I shares of the fund (and, with respect to the merger involving the Dreyfus Core Value Fund, Class B and Institutional shares of the fund) and the assumption by the fund of the respective Acquired Fund’s stated liabilities. Each Acquired Fund would then distribute those shares pro rata to holders of its corresponding classes of shares in liquidation of the respective Acquired Fund.The merger of Dreyfus Core Value Fund is expected to occur on or about November 16, 2011, and the merger of Dreyfus Large CapValue Fund is expected to occur on or about November 21, 2011.
|
| REPORT OF INDEPENDENT REGISTERED |
| PUBLIC ACCOUNTING FIRM |
Shareholders and Board of Directors
Dreyfus Strategic Value Fund
We have audited the accompanying statement of assets and liabilities, including the statement of investments, of Dreyfus StrategicValue Fund (one of the series comprising Advantage Funds, Inc.) as of August 31, 2011, and the related statement of operations for the year then ended, the statement of changes in net assets for each of the two years in the period then ended and financial highlights for each of the years indicated therein.These financial statements and financial highlights are the responsibility of the Fund’s management. Our responsibility is to express an opinion on these financial statements and financial highlights based on our audits.
We conducted our audits in accordance with the standards of the Public Company Accounting Oversight Board (United States).Those standards require that we plan and perform the audit to obtain reasonable assurance about whether the financial statements and financial highlights are free of material misstatement.We were not engaged to perform an audit of the Fund’s internal control over financial reporting. Our audits included consideration of internal control over financial reporting as a basis for designing audit procedures that are appropriate in the circumstances, but not for the purpose of expressing an opinion on the effectiveness of the Fund’s internal control over financial reporting. Accordingly, we express no such opinion. An audit also includes examining, on a test basis, evidence supporting the amounts and disclosures in the financial statements and financial highlights, assessing the accounting principles used and significant estimates made by management, and evaluating the overall financial statement presentation. Our procedures included confirmation of securities owned as of August 31, 2011 by correspondence with the custodian and others.We believe that our audits provide a reasonable basis for our opinion.
In our opinion, the financial statements and financial highlights referred to above present fairly, in all material respects, the financial position of Dreyfus StrategicValue Fund at August 31, 2011, the results of its operations for the year then ended, the changes in its net assets for each of the two years in the period then ended, and the financial highlights for each of the indicated years, in conformity with U.S. generally accepted accounting principles.

New York, New York
October 27, 2011
32
IMPORTANT TAX INFORMATION (Unaudited)
For federal tax purposes, the fund hereby designates 100% of the ordinary dividends paid during the fiscal year ended August 31, 2011 as qualifying for the corporate dividends received deduction.Also certain dividends paid by the fund may be subject to a maximum tax rate of 15%, as provided for by the Jobs and Growth Tax Relief Reconciliation Act of 2003. Of the distributions paid during the fiscal year, $5,000,829 represents the maximum amount that may be considered qualified dividend income. Shareholders will receive notification in early 2012 of the percentage applicable to the preparation of their 2011 income tax returns.
|
| INFORMATION ABOUT THE RENEWAL OF THE |
| FUND’S MANAGEMENT AGREEMENT (Unaudited) |
At a meeting of the fund’s Board of Directors held on March 1, 2011, the Board considered the renewal of the fund’s Management Agreement pursuant to which Dreyfus provides the fund with investment advisory and administrative services (the “Agreement”). The Board members, none of whom are “interested persons” (as defined in the Investment Company Act of 1940, as amended) of the fund, were assisted in their review by independent legal counsel and met with counsel in executive session separate from representatives of Dreyfus. In considering the renewal of the Agreement, the Board considered all factors that it believed to be relevant, including those discussed below.The Board did not identify any one factor as dispositive, and each Board member may have attributed different weights to the factors considered.
Analysis of Nature, Extent, and Quality of Services Provided to the Fund.The Board members considered information previously provided to them in presentations from representatives of Dreyfus regarding the nature, extent, and quality of the services provided to funds in the Dreyfus fund complex, and representatives of Dreyfus confirmed that there had been no material changes in this information. Dreyfus provided the number of open accounts in the fund, the fund’s asset size and the allocation of fund assets among distribution channels. Dreyfus also had previously provided information regarding the diverse intermediary relationships and distribution channels of funds in the Dreyfus fund complex and Dreyfus’ corresponding need for broad, deep, and diverse resources to be able to provide ongoing shareholder services to each distribution channel, including the distribution channel(s) for the fund.
The Board members also considered research support available to, and portfolio management capabilities of, the fund’s portfolio management personnel and that Dreyfus also provides oversight of day-to-day fund operations, including fund accounting and administration and assistance in meeting legal and regulatory requirements.The Board members also considered Dreyfus’ extensive administrative, accounting, and compliance infrastructures.The Board also considered portfolio management’s brokerage policies and practices (including policies and practices regarding soft dollars) and the standards applied in seeking best execution.
34
Comparative Analysis of the Fund’s Performance and Management Fee and Expense Ratio. The Board members reviewed reports prepared by Lipper, Inc. (“Lipper”), an independent provider of investment company data, which included information comparing (1) the fund’s performance with the performance of a group of comparable funds (the “Performance Group”) and with a broader group of funds (the “Performance Universe”), all for various periods ended December 31, 2010, and (2) the fund’s actual and contractual management fees and total expenses with those of a group of comparable funds (the “Expense Group”) and with a broader group of funds (the “Expense Universe”), the information for which was derived in part from fund financial statements available to Lipper as of December 31, 2010. Dreyfus previously had furnished the Board with a description of the methodology Lipper used to select the Performance Group and Performance Universe and the Expense Group and Expense Universe.
Dreyfus representatives stated that the usefulness of performance comparisons may be affected by a number of factors, including different investment limitations that may be applicable to the fund and comparison funds. The Board members discussed the results of the comparisons and noted that the fund’s total return performance was above the Performance Group and Performance Universe medians, ranking in the first quartile for most of the periods. Dreyfus also provided a comparison of the fund’s calendar year total returns to the returns of the fund’s benchmark index.
The Board members also reviewed the range of actual and contractual management fees and total expenses of the Expense Group and Expense Universe funds and discussed the results of the comparisons. They noted that the fund’s contractual management fee was above the Expense Group median, the fund’s actual management fee was above the Expense Group median and below the Expense Universe median and the fund’s total expenses were below the Expense Group and Expense Universe medians.
|
| INFORMATION ABOUT THE RENEWAL OF THE FUND’S |
| MANAGEMENT AGREEMENT (Unaudited) (continued) |
A representative of Dreyfus noted that Dreyfus has contractually agreed to waive receipt of its fees and/or assume the expenses of the fund, until January 1, 2012, so that annual direct operating expenses of the fund’s Class A, B, C, and I shares (excluding taxes, interest, brokerage commissions, commitment fees on borrowings and extraordinary expenses) do not exceed .98%, 1.94%, 1.73%, and .73%, respectively, of the respective class shares average daily net assets.
Representatives of Dreyfus reviewed with the Board members the management or investment advisory fees (1) paid by funds advised or administered by Dreyfus that are in the same Lipper category as the fund and (2) paid to Dreyfus or the Dreyfus-affiliated primary employer of the fund’s primary portfolio manager for advising any separate accounts and/or other types of client portfolios that are considered to have similar investment strategies and policies as the fund (the “Similar Clients”), and explained the nature of the Similar Clients.They discussed differences in fees paid and the relationship of the fees paid in light of any differences in the services provided and other relevant factors.The Board members considered the relevance of the fee information provided for the Similar Clients to evaluate the appropriateness and reasonableness of the fund’s management fee.
Analysis of Profitability and Economies of Scale. Dreyfus’ representatives reviewed the expenses allocated and profit received by Dreyfus and the resulting profitability percentage for managing the fund, and the method used to determine the expenses and profit. The Board concluded that the profitability results were not unreasonable, given the services rendered and service levels provided by Dreyfus. The Board also noted the expense limitation arrangement and its effect on Dreyfus’ profitability. The Board previously had been provided with information prepared by an independent consulting firm regarding Dreyfus’ approach to allocating costs to, and determining the profitability of, individual funds and the entire Dreyfus fund complex.The consulting firm also had analyzed where any economies of scale might emerge in connection with the management of a fund.
The Board’s counsel stated that the Board members should consider the profitability analysis (1) as part of their evaluation of whether the
36
fees under the Agreement bear a reasonable relationship to the mix of services provided by Dreyfus, including the nature, extent and quality of such services, and (2) in light of the relevant circumstances for the fund and the extent to which economies of scale would be realized if the fund grows and whether fee levels reflect these economies of scale for the benefit of fund shareholders. Dreyfus representatives noted that, as a result of shared and allocated costs among funds in the Dreyfus funds complex, the extent of economies of scale could depend substantially on the level of assets in the complex as a whole, so that increases and decreases in complex-wide assets can affect potential economies of scale in a manner that is disproportionate to, or even in the opposite direction from, changes in the fund’s asset level. The Board members also considered potential benefits to Dreyfus from acting as investment adviser and noted the soft dollar arrangements in effect for trading the fund’s investments.
At the conclusion of these discussions, the Board agreed that it had been furnished with sufficient information to make an informed business decision with respect to the renewal of the Agreement. Based on the discussions and considerations as described above, the Board concluded and determined as follows.
The Board concluded that the nature, extent and quality of the services provided by Dreyfus are adequate and appropriate.
The Board was satisfied with the fund’s performance.
The Board concluded that the fee paid to Dreyfus was reasonable in light of the considerations described above.
The Board determined that the economies of scale which may accrue to Dreyfus and its affiliates in connection with the management of the fund had been adequately considered by Dreyfus in connection with the fee rate charged to the fund pursuant to the Agreement and that, to the extent in the future it were determined that material economies of scale had not been shared with the fund, the Board would seek to have those economies of scale shared with the fund.
|
| INFORMATION ABOUT THE RENEWAL OF THE FUND’S |
| MANAGEMENT AGREEMENT (Unaudited) (continued) |
The Board members considered these conclusions and determinations, along with information received on a routine and regular basis throughout the year. In addition, it should be noted that the Board’s consideration of the contractual fee arrangements for this fund had the benefit of a number of years of reviews of prior or similar agreements during which lengthy discussions took place between the Board members and Dreyfus representatives. Certain aspects of the arrangements may receive greater scrutiny in some years than in others, and the Board members’ conclusions may be based, in part, on their consideration of the same or similar arrangements in prior years. The Board members determined that renewal of the Agreement was in the best interests of the fund and its shareholders.
38
BOARD MEMBERS INFORMATION (Unaudited)
|
| Joseph S. DiMartino (67) |
| Chairman of the Board (1995) |
| Principal Occupation During Past 5Years: |
| • Corporate Director and Trustee |
| Other Public Company Board Memberships During Past 5Years: |
| • CBIZ (formerly, Century Business Services, Inc.), a provider of outsourcing functions for small |
| and medium size companies, Director (1997-present) |
| • Sunair Services Corporation, a provider of certain outdoor-related services to homes and |
| businesses, Director (2005-2009) |
| • The Newark Group, a provider of a national market of paper recovery facilities, paperboard mills |
| and paperboard converting plants, Director (2000-2010) |
| No. of Portfolios for which Board Member Serves: 167 |
| ——————— |
| Peggy C. Davis (68) |
| Board Member (2006) |
| Principal Occupation During Past 5Years: |
| • Shad Professor of Law, New York University School of Law |
| • Writer and teacher in the fields of evidence, constitutional theory, family law, social sciences and |
| the law, legal process and professional methodology and training |
| No. of Portfolios for which Board Member Serves: 53 |
| ——————— |
| David P. Feldman (71) |
| Board Member (1996) |
| Principal Occupation During Past 5Years: |
| • Corporate Director and Trustee |
| Other Public Company Board Memberships During Past 5Years: |
| • BBH Mutual Funds Group (4 registered mutual funds), Director (1992-present) |
| • QMed, Inc. a healthcare company, Director (1999-2007) |
| No. of Portfolios for which Board Member Serves: 50 |
BOARD MEMBERS INFORMATION (Unaudited) (continued)
|
| Ehud Houminer (71) |
| Board Member (1993) |
| Principal Occupation During Past 5Years: |
| • Executive-in-Residence at the Columbia Business School, Columbia University (1992-present) |
| Other Public Company Board Memberships During Past 5Years: |
| • Avnet Inc., an electronics distributor, Director (1993-present) |
| No. of Portfolios for which Board Member Serves: 0 |
| ——————— |
| Dr. Martin Peretz (72) |
| Board Member (2006) |
| Principal Occupation During Past 5Years: |
| • Editor-in-Chief Emeritus of The New Republic Magazine (2010-present) (previously, |
| Editor-in-Chief, 1974-2010) |
| • Director of TheStreet.com, a financial information service on the web (1996-present) |
| No. of Portfolios for which Board Member Serves: 35 |
| ——————— |
Once elected all Board Members serve for an indefinite term, but achieve Emeritus status upon reaching age 80.The address of the Board Members and Officers is in c/o The Dreyfus Corporation, 200 Park Avenue, NewYork, NewYork 10166.Additional information about the Board Members is available in the fund’s Statement of Additional Information which can be obtained from Dreyfus free of charge by calling this toll free number: 1-800-DREYFUS.
James F. Henry, Emeritus Board Member
Dr. Paul A. Marks, Emeritus Board Member
Gloria Messinger, Emeritus Board Member
40
OFFICERS OF THE FUND (Unaudited)
BRADLEY J. SKAPYAK, President since January 2010.
Chief Operating Officer and a director of the Manager since June 2009. From April 2003 to June 2009, Mr. Skapyak was the head of the Investment Accounting and Support Department of the Manager. He is an officer of 75 investment companies (comprised of 167 portfolios) managed by the Manager. He is 52 years old and has been an employee of the Manager since February 1988.
MICHAEL A. ROSENBERG, Vice President and Secretary since August 2005.
Assistant General Counsel of BNY Mellon, and an officer of 76 investment companies (comprised of 192 portfolios) managed by the Manager. He is 51 years old and has been an employee of the Manager since October 1991.
KIESHA ASTWOOD, Vice President and Assistant Secretary since January 2010.
Counsel of BNY Mellon, and an officer of 76 investment companies (comprised of 192 portfolios) managed by the Manager. She is 38 years old and has been an employee of the Manager since July 1995.
JAMES BITETTO, Vice President and Assistant Secretary since August 2005.
Senior Counsel of BNY Mellon and Secretary of the Manager, and an officer of 76 investment companies (comprised of 192 portfolios) managed by the Manager. He is 45 years old and has been an employee of the Manager since December 1996.
JONI LACKS CHARATAN, Vice President and Assistant Secretary since August 2005.
Senior Counsel of BNY Mellon, and an officer of 76 investment companies (comprised of 192 portfolios) managed by the Manager. She is 55 years old and has been an employee of the Manager since October 1988.
JOSEPH M. CHIOFFI, Vice President and Assistant Secretary since August 2005.
Senior Counsel of BNY Mellon, and an officer of 76 investment companies (comprised of 192 portfolios) managed by the Manager. He is 49 years old and has been an employee of the Manager since June 2000.
KATHLEEN DENICHOLAS, Vice President and Assistant Secretary since January 2010.
Managing Counsel of BNY Mellon, and an officer of 76 investment companies (comprised of 192 portfolios) managed by the Manager. She is 36 years old and has been an employee of the Manager since February 2001.
JANETTE E. FARRAGHER, Vice President and Assistant Secretary since August 2005.
Assistant General Counsel of BNY Mellon, and an officer of 76 investment companies (comprised of 192 portfolios) managed by the Manager. She is 48 years old and has been an employee of the Manager since February 1984.
JOHN B. HAMMALIAN, Vice President and Assistant Secretary since August 2005.
Senior Managing Counsel of BNY Mellon, and an officer of 76 investment companies (comprised of 192 portfolios) managed by the Manager. He is 48 years old and has been an employee of the Manager since February 1991.
M. CRISTINA MEISER, Vice President and Assistant Secretary since January 2010.
Senior Counsel of BNY Mellon, and an officer of 76 investment companies (comprised of 192 portfolios) managed by the Manager. She is 41 years old and has been an employee of the Manager since August 2001.
OFFICERS OF THE FUND (Unaudited) (continued)
ROBERT R. MULLERY, Vice President and Assistant Secretary since August 2005.
Managing Counsel of BNY Mellon, and an officer of 76 investment companies (comprised of 192 portfolios) managed by the Manager. He is 59 years old and has been an employee of the Manager since May 1986.
JEFF PRUSNOFSKY, Vice President and Assistant Secretary since August 2005.
Senior Managing Counsel of BNY Mellon, and an officer of 76 investment companies (comprised of 192 portfolios) managed by the Manager. He is 46 years old and has been an employee of the Manager since October 1990.
JAMES WINDELS, Treasurer since November 2001.
Director – Mutual Fund Accounting of the Manager, and an officer of 76 investment companies (comprised of 192 portfolios) managed by the Manager. He is 52 years old and has been an employee of the Manager since April 1985.
RICHARD CASSARO, Assistant Treasurer since January 2008.
Senior Accounting Manager – Money Market and Municipal Bond Funds of the Manager, and an officer of 76 investment companies (comprised of 192 portfolios) managed by the Manager. He is 52 years old and has been an employee of the Manager since September 1982.
GAVIN C. REILLY, Assistant Treasurer since December 2005.
Tax Manager of the Investment Accounting and Support Department of the Manager, and an officer of 76 investment companies (comprised of 192 portfolios) managed by the Manager. He is 43 years old and has been an employee of the Manager since April 1991.
ROBERT ROBOL, Assistant Treasurer since August 2005.
Senior Accounting Manager – Fixed Income Funds of the Manager, and an officer of 76 investment companies (comprised of 192 portfolios) managed by the Manager. He is 47 years old and has been an employee of the Manager since October 1988.
ROBERT SALVIOLO, Assistant Treasurer since July 2007.
Senior Accounting Manager – Equity Funds of the Manager, and an officer of 76 investment companies (comprised of 192 portfolios) managed by the Manager. He is 44 years old and has been an employee of the Manager since June 1989.
ROBERT SVAGNA, Assistant Treasurer since August 2005.
Senior Accounting Manager – Equity Funds of the Manager, and an officer of 76 investment companies (comprised of 192 portfolios) managed by the Manager. He is 44 years old and has been an employee of the Manager since November 1990.
42
JOSEPH W. CONNOLLY, Chief Compliance Officer since October 2004.
Chief Compliance Officer of the Manager and The Dreyfus Family of Funds (76 investment companies, comprised of 192 portfolios). From November 2001 through March 2004, Mr. Connolly was first Vice-President, Mutual Fund Servicing for Mellon Global Securities Services. In that capacity, Mr. Connolly was responsible for managing Mellon’s Custody, Fund Accounting and Fund Administration services to third-party mutual fund clients. He is 54 years old and has served in various capacities with the Manager since 1980, including manager of the firm’s Fund Accounting Department from 1997 through October 2001.
STEPHEN J. STOREN, Anti-Money Laundering Compliance Officer since May 2011.
Chief Compliance Officer of the Distributor, and the Anti-Money Laundering Compliance Officer of 72 investment companies (comprised of 188 portfolios) managed by the Manager. He is 56 years old and has been an employee of the Distributor since October 1999.
|
| Dreyfus |
| Technology Growth Fund |
ANNUAL REPORT August 31, 2011

Save time. Save paper. View your next shareholder report online as soon as it’s available. Log into www.dreyfus.com and sign up for Dreyfus eCommunications. It’s simple and only takes a few minutes.
The views expressed in this report reflect those of the portfolio manager only through the end of the period covered and do not necessarily represent the views of Dreyfus or any other person in the Dreyfus organization. Any such views are subject to change at any time based upon market or other conditions and Dreyfus disclaims any responsibility to update such views.These views may not be relied on as investment advice and, because investment decisions for a Dreyfus fund are based on numerous factors, may not be relied on as an indication of trading intent on behalf of any Dreyfus fund.
Not FDIC-Insured • Not Bank-Guaranteed • May Lose Value
| | Contents |
| | THE FUND |
| 2 | A Letter from the Chairman and CEO |
| 3 | Discussion of Fund Performance |
| 6 | Fund Performance |
| 8 | Understanding Your Fund’s Expenses |
| 8 | Comparing Your Fund’s Expenses With Those of Other Funds |
| 9 | Statement of Investments |
| 12 | Statement of Assets and Liabilities |
| 13 | Statement of Operations |
| 14 | Statement of Changes in Net Assets |
| 16 | Financial Highlights |
| 20 | Notes to Financial Statements |
| 31 | Report of Independent Registered Public Accounting Firm |
| 32 | Information About the Renewal of the Fund’s Management Agreement |
| 36 | Board Members Information |
| 38 | Officers of the Fund |
| | FOR MORE INFORMATION |
| | Back Cover |
Dreyfus
Technology Growth Fund
The Fund

A LETTER FROM THE CHAIRMAN AND CEO
Dear Shareholder:
We are pleased to present this annual report for Dreyfus Technology Growth Fund, covering the 12-month period from September 1, 2010, through August 31, 2011. For information about how the fund performed during the reporting period, as well as general market perspectives, we provide a Discussion of Fund Performance on the pages that follow.
Although stocks rallied strongly through the first quarter of 2011 due to expectations of a more robust economic recovery, the reporting period ended amid sharply deteriorating investor sentiment due to disappointing economic data, an escalating sovereign debt crisis in Europe and a contentious debate regarding taxes, spending and borrowing in the United States. In the final month of the reporting period, a major credit rating agency downgraded U.S. long-term debt, marking the first time in history that U.S.Treasury securities were not assigned the highest possible credit rating. Stocks proved volatile in this tumultuous environment, as the stalled economy caused most market sectors to give back many of the reporting period’s previous gains.
The economic outlook currently is clouded by heightened market volatility and political infighting, but we believe that a sustained, moderate global expansion is more likely than a double-dip recession. Inflationary pressures appear to be waning in most countries, including the United States, as energy prices have retreated from their highs.The Federal Reserve Board has signaled its intention to maintain an aggressively accommodative monetary policy, which may help offset the financial stresses caused by recent fiscal policy choices in the United States and Europe. To assess how these and other developments may affect your investments, we encourage you, as always, to speak with your financial advisor.
Thank you for your continued confidence and support.

Jonathan R. Baum
Chairman and Chief Executive Officer
The Dreyfus Corporation
September 15, 2011
2

DISCUSSION OF FUND PERFORMANCE
For the period of September 1, 2010, through August 31, 2011, as provided by Barry K. Mills, CFA, Portfolio Manager
Fund and Market Performance Overview
For the 12-month period ended August 31, 2011, Dreyfus Technology Growth Fund’s Class A shares produced a total return of 14.87%, Class B shares returned 13.73%, Class C shares returned 13.89% and Class I shares returned 15.30%.1 In comparison, the fund’s benchmarks, the Morgan Stanley High Technology 35 Index (“MS High Tech 35 Index”) and the Standard & Poor’s 500 Composite Stock Price Index (“S&P 500 Index”), produced total returns of 14.90% and 18.48%, respectively, over the same period.2,3
Although stocks generally rallied through the first quarter of 2011 as investors looked forward to a more robust economic recovery, disappointing economic data and other macroeconomic developments subsequently caused them to give back a portion of those gains. Technology stocks generally lagged market averages for the overall reporting period as investors shifted their focus to more defensive areas of the stock market.The fund’s Class A shares produced a return in line with the MS High Tech 35 Index, mainly due to investments in companies in the vanguard of emerging technological trends.
The Fund’s Investment Approach
The fund seeks capital appreciation by investing in growth companies of any size that we regard as leading producers or beneficiaries of technological innovation.The fund’s investment process centers on a multi-dimensional approach that looks for opportunities across emerging growth, cyclical or stable growth companies.The fund seeks companies that appear to have strong earnings momentum, positive earnings revisions, favorable growth, product or market cycles and/or favorable valuations.
Shifting Sentiment Sparked Heightened Volatility
Investors’ outlooks improved dramatically at the start of the reporting period when the Federal Reserve Board announced a second round of quantitative easing to jump-start the U.S. economy. Subsequent improve-
DISCUSSION OF FUND PERFORMANCE (continued)
ments in economic data and corporate earnings lent further support to rising stock prices. The rally was interrupted in February 2011 when political unrest in the Middle East led to sharply rising crude oil prices, and again in March when devastating natural and nuclear disasters in Japan threatened one of the world’s largest economies. Nonetheless, stocks rebounded quickly from these unexpected shocks.
In late April, investor sentiment began to deteriorate in earnest when Greece appeared headed for default on its sovereign debt, U.S. economic data proved disappointing and the debate regarding U.S. government spending and borrowing intensified.Technology stocks suffered bouts of heightened volatility as newly risk-averse investors shifted their focus from economically sensitive industry groups to those that historically have held up well under uncertain conditions. In addition, the technology sector was dampened by disappointments among some large companies that may have been unprepared for the popularity of smartphones, tablet computers and the shift toward “cloud computing,” in which businesses manage data and applications over the Internet.
Accelerating Trends Lifted Several Fund Holdings
The fund’s results in a choppy investment environment were bolstered by its focus on companies at the forefront of these trends. Top performers over the first half of 2011 included semiconductor maker Motorola Mobility Holdings, which was buoyed by an acquisition offer from online media giant Google. Enterprise data management specialist Teradata benefited from robust demand for data warehousing and business intelligence applications. Video game maker Electronic Arts was bolstered by a new product cycle centered on digital downloads of gaming software. DVD rental giant Netflix continued to gain value as it built more robust on-demand streaming capabilities. In addition, the fund did not own some of the reporting period’s laggards, such as hardware manufacturer Hewlett-Packard, Blackberry maker Research In Motion and networking giant Cisco Systems.
Disappointments included Akamai Technologies, which suffered amid lower-than-expected demand for bandwidth among Internet content providers.The fund’s relative performance was undermined by its lack of exposure to Internet auction house eBay, which gained value due to strength in its electronic payments processing business. Finally, the fund was hurt by unfortunate timing in the purchase of graphics processor specialist NVIDIA.
4
Focusing on Secular Growth
Although technology stocks generally became more attractively valued by the reporting period’s end, we have maintained a highly selective approach.We have continued to focus on companies that we believe are poised to benefit from secular trends, such as cloud computing and greater adoption of mobile devices, rather than those that tend to rise and fall with the broader economy. Although we have established a correspondingly underweighted position among more mature companies that, in our analysis, are not as well positioned to participate in today’s technological trends, we are monitoring the fundamentals of semiconductor companies and capital goods producers for signs of a potential cyclical upturn as inventories become depleted. In our judgment, these strategies position the fund well for the future regardless of the near-term strength and sustainability of the economic recovery.
September 15, 2011
| |
| | Please note, the position in any security highlighted with italicized typeface was sold during the |
| | reporting period. |
| | Equity funds are subject generally to market, market sector, market liquidity, issuer and investment |
| | style risks, among other factors, to varying degrees, all of which are more fully described in the |
| | fund’s prospectus. |
| | The technology sector has been among the most volatile sectors of the stock market. |
| | Technology companies involve greater risk because their revenue and/or earnings tend to be |
| | less predictable and some companies may be experiencing significant losses. |
| 1 | Total return includes reinvestment of dividends and any capital gains paid, and does not take into |
| | consideration the maximum initial sales charge in the case of Class A shares, or the applicable |
| | contingent deferred sales charges imposed on redemptions in the case of Class B and Class C |
| | shares. Had these charges been reflected, returns would have been lower. Past performance is no |
| | guarantee of future results. Share price, yield and investment return fluctuate such that upon |
| | redemption, fund shares may be worth more or less than their original cost. |
| 2 | SOURCE: BLOOMBERG L.P. — Reflects reinvestment of net dividends and, where |
| | applicable, capital gain distributions.The Morgan Stanley High Technology 35 Index is an |
| | unmanaged, equal dollar-weighted index of 35 stocks from the electronics-based subsectors.The |
| | index does not take into account fees and expenses to which the fund is subject. Investors cannot |
| | invest directly in any index. |
| 3 | SOURCE: LIPPER INC. — Reflects monthly reinvestment of dividends and, where applicable, |
| | capital gain distributions.The Standard & Poor’s 500 Composite Stock Price Index is a widely |
| | accepted, unmanaged index of U.S. stock market performance.The index does not take into account |
| | fees and expenses to which the fund is subject. Investors cannot invest directly in any index. |
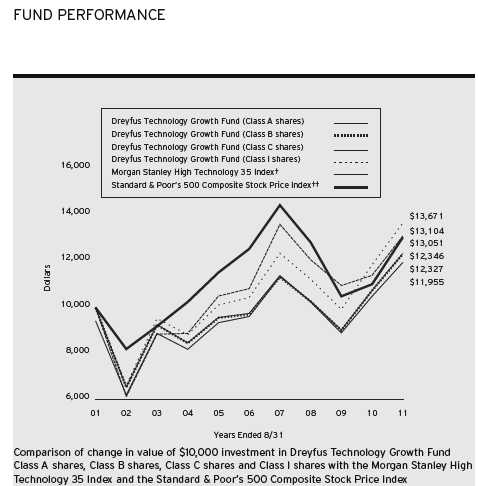
| |
| † | Source: Bloomberg L.P. |
| †† | Source: Lipper Inc. |
| Past performance is not predictive of future performance. |
| The above graph compares a $10,000 investment made in Class A, Class B, Class C and Class I shares of Dreyfus |
| Technology Growth Fund on 8/31/01 to a $10,000 investment made in each of the Standard & Poor’s 500 |
| Composite Stock Price Index (the “S&P 500 Index”) and the Morgan Stanley High Technology 35 Index (the “MS |
| High Tech 35 Index”) on that date.All dividends and capital gain distributions are reinvested. |
| The fund’s performance shown in the line graph above takes into account the maximum initial sales charge on Class A |
| shares and all other applicable fees and expenses on all classes. Performance for Class B shares assumes the conversion of |
| Class B shares to Class A shares at the end of the sixth year following the date of purchase.The S&P 500 Index is a |
| widely accepted, unmanaged index of U.S. stock market performance.The MS High Tech 35 Index reflects reinvestment |
| of net dividends and, where applicable, capital gain distributions.The MS High Tech 35 Index is an unmanaged, equal |
| dollar-weighted index from the electronics-based subsectors. Unlike a mutual fund, the indices are not subject to charges, |
| fees and other expenses. Investors cannot invest directly in any index. Further information relating to fund performance, |
| including expense reimbursements, if applicable, is contained in the Financial Highlights section of the prospectus and |
| elsewhere in this report. |
6
| | | | | | |
| Average Annual Total Returns as of 8/31/11 | | | |
| |
| | 1Year | 5 Years | 10 Years |
| Class A shares | | | |
| with maximum sales charge (5.75%) | 8.27% | 3.89% | 2.13% |
| without sales charge | 14.87% | 5.13% | 2.74% |
| Class B shares | | | |
| with applicable redemption charge † | 9.73% | 3.66% | 2.11% |
| without redemption | 13.73% | 4.01% | 2.11% |
| Class C shares | | | |
| with applicable redemption charge †† | 12.89% | 4.18% | 1.80% |
| without redemption | 13.89% | 4.18% | 1.80% |
| Class I shares | 15.30% | 5.55% | 3.18% |
| Morgan Stanley High | | | |
| Technology 35 Index | 14.90% | 3.89% | 2.74% |
| Standard & Poor’s 500 | | | |
| Composite Stock Price Index | 18.48% | 0.78% | 2.70% |
Past performance is not predictive of future performance.The fund’s performance shown in the graph and table does not reflect the deduction of taxes that a shareholder would pay on fund distributions or the redemption of fund shares.
| |
| † | The maximum contingent deferred sales charge for Class B shares is 4%.After six years Class B shares convert to |
| | Class A shares. |
| †† | The maximum contingent deferred sales charge for Class C shares is 1% for shares redeemed within one year of the |
| | date of purchase. |
UNDERSTANDING YOUR FUND’S EXPENSES (Unaudited)
As a mutual fund investor, you pay ongoing expenses, such as management fees and other expenses. Using the information below, you can estimate how these expenses affect your investment and compare them with the expenses of other funds.You also may pay one-time transaction expenses, including sales charges (loads) and redemption fees, which are not shown in this section and would have resulted in higher total expenses. For more information, see your fund’s prospectus or talk to your financial adviser.
Review your fund’s expenses
The table below shows the expenses you would have paid on a $1,000 investment in Dreyfus Technology Growth Fund from March 1, 2011 to August 31, 2011. It also shows how much a $1,000 investment would be worth at the close of the period, assuming actual returns and expenses.
Expenses and Value of a $1,000 Investment
assuming actual returns for the six months ended August 31, 2011
| | | | | | | | |
| | | Class A | | Class B | | Class C | | Class I |
| Expenses paid per $1,000† | $ | 6.66 | $ | 10.50 | $ | 10.46 | $ | 4.87 |
| Ending value (after expenses) | $ | 872.60 | $ | 868.90 | $ | 869.00 | $ | 874.40 |
COMPARING YOUR FUND’S EXPENSES
WITH THOSE OF OTHER FUNDS (Unaudited)
Using the SEC’s method to compare expenses
The Securities and Exchange Commission (SEC) has established guidelines to help investors assess fund expenses. Per these guidelines, the table below shows your fund’s expenses based on a $1,000 investment, assuming a hypothetical 5% annualized return. You can use this information to compare the ongoing expenses (but not transaction expenses or total cost) of investing in the fund with those of other funds.All mutual fund shareholder reports will provide this information to help you make this comparison. Please note that you cannot use this information to estimate your actual ending account balance and expenses paid during the period.
Expenses and Value of a $1,000 Investment
assuming a hypothetical 5% annualized return for the six months ended August 31, 2011
| | | | | | | | |
| | | Class A | | Class B | | Class C | | Class I |
| Expenses paid per $1,000† | $ | 7.17 | $ | 11.32 | $ | 11.27 | $ | 5.24 |
| Ending value (after expenses) | $ | 1,018.10 | $ | 1,013.96 | $ | 1,014.01 | $ | 1,020.01 |
|
| † Expenses are equal to the fund’s annualized expense ratio of 1.41% for Class A, 2.23% for Class B, 2.22% for |
| Class C and 1.03% for Class I, multiplied by the average account value over the period, multiplied by 184/365 (to |
| reflect the one-half year period). |
8
|
| STATEMENT OF INVESTMENTS |
| August 31, 2011 |
| | | |
| Common Stocks—95.4% | Shares | Value ($) |
| Consumer Discretionary—8.7% | | |
| Amazon.com | 76,180a | 16,400,792 |
| Priceline.com | 13,330a | 7,161,676 |
| | | 23,562,468 |
| Information Technology—86.7% | | |
| Accenture, Cl. A | 151,080 | 8,096,377 |
| Akamai Technologies | 394,350a | 8,652,039 |
| Apple | 37,008a | 14,241,789 |
| Atmel | 591,120a | 5,385,103 |
| BMC Software | 197,691a | 8,028,232 |
| Citrix Systems | 63,370a | 3,829,449 |
| Cognizant Technology Solutions, Cl. A | 92,547a | 5,872,107 |
| Corning | 445,230b | 6,691,807 |
| Cree | 166,670a,b | 5,405,108 |
| Electronic Arts | 468,118a | 10,570,104 |
| EMC | 242,590a | 5,480,108 |
| F5 Networks | 133,090a | 10,862,806 |
| Fortinet | 148,040a | 2,832,005 |
| Google, Cl. A | 21,068a | 11,396,945 |
| Informatica | 143,420a | 5,992,088 |
| International Business Machines | 89,750 | 15,428,922 |
| Logmein | 84,390a,b | 2,637,188 |
| Motorola Mobility Holdings | 197,527a | 7,450,718 |
| NetApp | 240,950a | 9,064,539 |
| Oracle | 449,226 | 12,609,774 |
| Paychex | 252,300 | 6,807,054 |
STATEMENT OF INVESTMENTS (continued)
| | | |
| Common Stocks (continued) | Shares | | Value ($) |
| Information Technology (continued) | | | |
| QUALCOMM | 343,970 | | 17,700,696 |
| Riverbed Technology | 428,720 | a,b | 10,623,682 |
| Salesforce.com | 76,780 | a,b | 9,885,425 |
| SanDisk | 244,890 | a | 8,975,219 |
| Taleo, Cl. A | 134,970 | a,b | 3,483,576 |
| Teradata | 172,030 | a | 9,007,491 |
| VMware, Cl. A | 73,050 | a,b | 6,892,998 |
| | | | 233,903,349 |
| Total Common Stocks | | | |
| (cost $232,444,585) | | | 257,465,817 |
| |
| Limited Partnership Interests—.5% | | | |
| Information Technology | | | |
| Bluestream Ventures, LPa,d | | | 1,377,689 |
| Ingenex, LPa,d | | | 0 |
| Total Limited Partnership Interests | | | |
| (cost $2,540,019) | | | 1,377,689 |
| |
| Other Investment—3.6% | | | |
| Registered Investment Company; | | | |
| Dreyfus Institutional Preferred | | | |
| Plus Money Market Fund | | | |
| (cost $9,636,000) | 9,636,000 | c | 9,636,000 |
10
| | | | |
| Investment of Cash Collateral | | |
| for Securities Loaned—8.1% | Shares | Value ($) |
| Registered Investment Company; | | |
| Dreyfus Institutional Cash Advantage Fund | | |
| (cost $21,812,769) | 21,812,769c | 21,812,769 |
| Total Investments (cost $266,433,373) | 107.6% | 290,292,275 |
| Liabilities, Less Cash and Receivables | (7.6%) | (20,409,501) |
| Net Assets | 100.0% | 269,882,774 |
|
| a Non-income producing security. |
| b Security, or portion thereof, on loan.At August 31, 2011, the value of the fund’s securities on loan was |
| $21,689,614 and the value of the collateral held by the fund was $21,812,769. |
| c Investment in affiliated money market mutual fund. |
| d Securities restricted as to public resale. Investment in restricted securities with aggregate value of $1,377,689 |
| representing .5% of net assets (see below). |
| | | |
| Issuer | Acquisition Date | Cost ($) | Valuation ($)† |
| Bluestream Ventures, LP | 4/30/2004-6/11/2008 | 2,540,019 | 1,377,689 |
| Ingenex, LP | 4/30/2004 | 0 | 0 |
|
| † The valuation of these securities has been determined in good faith by management under the direction of the |
| Board of Directors. |
| | | |
| Portfolio Summary (Unaudited)†† | | |
| | Value (%) | | Value (%) |
| Information Technology | 87.2 | Consumer Discretionary | 8.7 |
| Money Market Investments | 11.7 | | 107.6 |
| †† Based on net assets. | | | |
| See notes to financial statements. | | | |
|
| STATEMENT OF ASSETS AND LIABILITIES |
| August 31, 2011 |
| | | | | |
| | | | Cost | Value |
| Assets ($): | | | | |
| Investments in securities—See Statement of Investments (including | | |
| securities on loan, valued at $21,689,614)—Note 1(c): | | | |
| Unaffiliated issuers | | | 234,984,604 | 258,843,506 |
| Affiliated issuers | | | 31,448,769 | 31,448,769 |
| Cash | | | | 185,481 |
| Receivable for investment securities sold | | | 2,914,059 |
| Dividends and securities lending income receivable | | | 165,344 |
| Receivable for shares of Common Stock subscribed | | | 91,515 |
| Prepaid expenses | | | | 48,144 |
| | | | | 293,696,818 |
| Liabilities ($): | | | | |
| Due to The Dreyfus Corporation and affiliates—Note 3(c) | | | 305,936 |
| Liability for securities on loan—Note 1(c) | | | 21,812,769 |
| Payable for shares of Common Stock redeemed | | | 865,568 |
| Payable for investment securities purchased | | | 579,935 |
| Accrued expenses | | | | 249,836 |
| | | | | 23,814,044 |
| Net Assets ($) | | | | 269,882,774 |
| Composition of Net Assets ($): | | | | |
| Paid-in capital | | | | 339,559,719 |
| Accumulated net realized gain (loss) on investments | | | (93,535,847) |
| Accumulated net unrealized appreciation | | | |
| (depreciation) on investments | | | | 23,858,902 |
| Net Assets ($) | | | | 269,882,774 |
| |
| |
| Net Asset Value Per Share | | | | |
| | Class A | Class B | Class C | Class I |
| Net Assets ($) | 226,016,109 | 980,239 | 27,954,324 | 14,932,102 |
| Shares Outstanding | 7,640,640 | 37,439 | 1,055,695 | 480,816 |
| Net Asset Value Per Share ($) | 29.58 | 26.18 | 26.48 | 31.06 |
| |
| See notes to financial statements. | | | | |
12
|
| STATEMENT OF OPERATIONS |
| Year Ended August 31, 2011 |
| | |
| Investment Income ($): | |
| Income: | |
| Cash dividends: | |
| Unaffiliated issuers | 1,843,602 |
| Affiliated issuers | 24,064 |
| Income from securities lending—Note 1(c) | 49,652 |
| Total Income | 1,917,318 |
| Expenses: | |
| Management fee—Note 3(a) | 2,517,834 |
| Shareholder servicing costs—Note 3(c) | 1,809,259 |
| Distribution fees—Note 3(b) | 238,994 |
| Registration fees | 59,747 |
| Professional fees | 55,369 |
| Prospectus and shareholders’ reports | 44,526 |
| Custodian fees—Note 3(c) | 26,161 |
| Directors’ fees and expenses—Note 3(d) | 17,047 |
| Loan commitment fees—Note 2 | 6,283 |
| Interest expense—Note 2 | 2,295 |
| Miscellaneous | 27,039 |
| Total Expenses | 4,804,554 |
| Less—reduction in fees due to earnings credits—Note 3(c) | (2,481) |
| Net Expenses | 4,802,073 |
| Investment (Loss)—Net | (2,884,755) |
| Realized and Unrealized Gain (Loss) on Investments—Note 4 ($): | |
| Net realized gain (loss) on investments | 54,452,468 |
| Net unrealized appreciation (depreciation) on investments | (4,148,147) |
| Net Realized and Unrealized Gain (Loss) on Investments | 50,304,321 |
| Net Increase in Net Assets Resulting from Operations | 47,419,566 |
| |
| See notes to financial statements. | |
STATEMENT OF CHANGES IN NET ASSETS
| | | | |
| | Year Ended August 31, |
| | 2011 | 2010 |
| Operations ($): | | |
| Investment (loss)—net | (2,884,755) | (3,055,240) |
| Net realized gain (loss) on investments | 54,452,468 | 44,043,141 |
| Net unrealized appreciation | | |
| (depreciation) on investments | (4,148,147) | 2,028,102 |
| Net Increase (Decrease) in Net Assets | | |
| Resulting from Operations | 47,419,566 | 43,016,003 |
| Capital Stock Transactions ($): | | |
| Net proceeds from shares sold: | | |
| Class A Shares | 73,277,053 | 63,577,756 |
| Class B Shares | 119,693 | 62,278 |
| Class C Shares | 6,194,425 | 2,226,125 |
| Class I Shares | 17,293,125 | 2,209,883 |
| Cost of shares redeemed: | | |
| Class A Shares | (134,780,551) | (72,968,858) |
| Class B Shares | (1,911,070) | (2,352,700) |
| Class C Shares | (4,591,033) | (4,314,517) |
| Class I Shares | (5,485,144) | (1,307,828) |
| Increase (Decrease) in Net Assets | | |
| from Capital Stock Transactions | (49,883,502) | (12,867,861) |
| Total Increase (Decrease) in Net Assets | (2,463,936) | 30,148,142 |
| Net Assets ($): | | |
| Beginning of Period | 272,346,710 | 242,198,568 |
| End of Period | 269,882,774 | 272,346,710 |
14
| | | | |
| | Year Ended August 31, |
| | 2011 | 2010 |
| Capital Share Transactions : | | |
| Class Aa | | |
| Shares sold | 2,332,287 | 2,519,878 |
| Shares redeemed | (4,126,739) | (2,986,756) |
| Net Increase (Decrease) in Shares Outstanding | (1,794,452) | (466,878) |
| Class Ba | | |
| Shares sold | 4,231 | 2,154 |
| Shares redeemed | (66,286) | (108,462) |
| Net Increase (Decrease) in Shares Outstanding | (62,055) | (106,308) |
| Class C | | |
| Shares sold | 212,946 | 94,331 |
| Shares redeemed | (158,309) | (192,046) |
| Net Increase (Decrease) in Shares Outstanding | 54,637 | (97,715) |
| Class I | | |
| Shares sold | 501,403 | 86,308 |
| Shares redeemed | (160,979) | (50,098) |
| Net Increase (Decrease) in Shares Outstanding | 340,424 | 36,210 |
|
| a During the period ended August 31, 2011, 32,681 Class B shares representing $945,338 were automatically |
| converted to 29,067 Class A shares and during the period ended August 31, 2010, 59,639 Class B shares |
| representing $1,280,271 were automatically converted to 53,689 Class A shares. |
See notes to financial statements.
FINANCIAL HIGHLIGHTS
The following tables describe the performance for each share class for the fiscal periods indicated.All information (except portfolio turnover rate) reflects financial results for a single fund share.Total return shows how much your investment in the fund would have increased (or decreased) during each period, assuming you had reinvested all dividends and distributions.These figures have been derived from the fund’s financial statements.
| | | | | | | | | | |
| | | Year Ended August 31, | |
| Class A Shares | 2011 | 2010 | 2009 | 2008 | 2007 |
| Per Share Data ($): | | | | | |
| Net asset value, beginning of period | 25.75 | 21.63 | 24.63 | 27.18 | 23.03 |
| Investment Operations: | | | | | |
| Investment (loss)—neta | (.25) | (.27) | (.13) | (.15) | (.21) |
| Net realized and unrealized | | | | | |
| gain (loss) on investments | 4.08 | 4.39 | (2.87) | (2.40) | 4.36 |
| Total from Investment Operations | 3.83 | 4.12 | (3.00) | (2.55) | 4.15 |
| Net asset value, end of period | 29.58 | 25.75 | 21.63 | 24.63 | 27.18 |
| Total Return (%)b | 14.87 | 19.05 | (12.22) | (9.35) | 18.02 |
| Ratios/Supplemental Data (%): | | | | | |
| Ratio of total expenses | | | | | |
| to average net assets | 1.36 | 1.51 | 1.70 | 1.52 | 1.46 |
| Ratio of net expenses | | | | | |
| to average net assets | 1.36 | 1.51 | 1.67 | 1.44 | 1.42 |
| Ratio of net investment (loss) | | | | | |
| to average net assets | (.79) | (1.09) | (.72) | (.59) | (.82) |
| Portfolio Turnover Rate | 90.28 | 110.92 | 122.48 | 126.37 | 28.80 |
| Net Assets, end of period ($ x 1,000) | 226,016 | 242,999 | 214,170 | 257,360 | 366,083 |
| |
| a | Based on average shares outstanding at each month end. |
| b | Exclusive of sales charge. |
See notes to financial statements.
16
| | | | | | | | | | |
| | | Year Ended August 31, | |
| Class B Shares | 2011 | 2010 | 2009 | 2008 | 2007 |
| Per Share Data ($): | | | | | |
| Net asset value, beginning of period | 23.02 | 19.55 | 22.57 | 25.10 | 21.51 |
| Investment Operations: | | | | | |
| Investment (loss)—neta | (.49) | (.48) | (.33) | (.34) | (.43) |
| Net realized and unrealized | | | | | |
| gain (loss) on investments | 3.65 | 3.95 | (2.69) | (2.19) | 4.02 |
| Total from Investment Operations | 3.16 | 3.47 | (3.02) | (2.53) | 3.59 |
| Net asset value, end of period | 26.18 | 23.02 | 19.55 | 22.57 | 25.10 |
| Total Return (%)b | 13.73 | 17.75 | (13.38) | (10.08) | 16.69 |
| Ratios/Supplemental Data (%): | | | | | |
| Ratio of total expenses | | | | | |
| to average net assets | 2.35 | 2.62 | 3.03 | 2.38 | 2.51 |
| Ratio of net expenses | | | | | |
| to average net assets | 2.35 | 2.62 | 3.00 | 2.30 | 2.47 |
| Ratio of net investment (loss) | | | | | |
| to average net assets | (1.78) | (2.25) | (2.03) | (1.46) | (1.91) |
| Portfolio Turnover Rate | 90.28 | 110.92 | 122.48 | 126.37 | 28.80 |
| Net Assets, end of period ($ x 1,000) | 980 | 2,290 | 4,024 | 8,634 | 18,097 |
| |
| a | Based on average shares outstanding at each month end. |
| b | Exclusive of sales charge. |
See notes to financial statements.
FINANCIAL HIGHLIGHTS (continued)
| | | | | | | | | | |
| | | Year Ended August 31, | |
| Class C Shares | 2011 | 2010 | 2009 | 2008 | 2007 |
| Per Share Data ($): | | | | | |
| Net asset value, beginning of period | 23.25 | 19.71 | 22.69 | 25.24 | 21.58 |
| Investment Operations: | | | | | |
| Investment (loss)—neta | (.47) | (.45) | (.29) | (.34) | (.40) |
| Net realized and unrealized | | | | | |
| gain (loss) on investments | 3.70 | 3.99 | (2.69) | (2.21) | 4.06 |
| Total from Investment Operations | 3.23 | 3.54 | (2.98) | (2.55) | 3.66 |
| Net asset value, end of period | 26.48 | 23.25 | 19.71 | 22.69 | 25.24 |
| Total Return (%)b | 13.89 | 17.96 | (13.13) | (10.10) | 16.96 |
| Ratios/Supplemental Data (%): | | | | | |
| Ratio of total expenses | | | | | |
| to average net assets | 2.21 | 2.44 | 2.76 | 2.37 | 2.32 |
| Ratio of net expenses | | | | | |
| to average net assets | 2.21 | 2.43 | 2.73 | 2.28 | 2.28 |
| Ratio of net investment (loss) | | | | | |
| to average net assets | (1.63) | (2.03) | (1.78) | (1.43) | (1.69) |
| Portfolio Turnover Rate | 90.28 | 110.92 | 122.48 | 126.37 | 28.80 |
| Net Assets, end of period ($ x 1,000) | 27,954 | 23,274 | 21,655 | 29,434 | 40,090 |
| |
| a | Based on average shares outstanding at each month end. |
| b | Exclusive of sales charge. |
See notes to financial statements.
18
| | | | | | | | | | |
| | | Year Ended August 31, | |
| Class I Shares | 2011 | 2010 | 2009 | 2008 | 2007a |
| Per Share Data ($): | | | | | |
| Net asset value, beginning of period | 26.94 | 22.55 | 25.54 | 28.08 | 23.71 |
| Investment Operations: | | | | | |
| Investment (loss)—netb | (.14) | (.20) | (.07) | (.06) | (.11) |
| Net realized and unrealized | | | | | |
| gain (loss) on investments | 4.26 | 4.59 | (2.92) | (2.48) | 4.48 |
| Total from Investment Operations | 4.12 | 4.39 | (2.99) | (2.54) | 4.37 |
| Net asset value, end of period | 31.06 | 26.94 | 22.55 | 25.54 | 28.08 |
| Total Return (%) | 15.30 | 19.47 | (11.71) | (9.04) | 18.43 |
| Ratios/Supplemental Data (%): | | | | | |
| Ratio of total expenses | | | | | |
| to average net assets | 1.01 | 1.19 | 1.28 | 1.24 | 1.08 |
| Ratio of net expenses | | | | | |
| to average net assets | 1.01 | 1.19 | 1.24 | 1.16 | 1.04 |
| Ratio of net investment (loss) | | | | | |
| to average net assets | (.42) | (.76) | (.39) | (.22) | (.44) |
| Portfolio Turnover Rate | 90.28 | 110.92 | 122.48 | 126.37 | 28.80 |
| Net Assets, end of period ($ x 1,000) | 14,932 | 3,782 | 2,350 | 21,889 | 5,458 |
| |
| a | Effective June 1, 2007, Class R shares were redesignated as Class I shares. |
| b | Based on average shares outstanding at each month end. |
See notes to financial statements.
NOTES TO FINANCIAL STATEMENTS
NOTE 1—Significant Accounting Policies:
Dreyfus Technology Growth Fund (the “fund”) is a separate diversified series of Advantage Funds, Inc. (the “Company”), which is registered under the Investment Company Act of 1940, as amended (the “Act”), as an open-end management investment company and operates as a series company that offers thirteen series, including the fund.The fund’s investment objective is to seek capital appreciation. The Dreyfus Corporation (the “Manager” or “Dreyfus”), a wholly-owned subsidiary of The Bank of New York Mellon Corporation (“BNY Mellon”), serves as the fund’s investment adviser.
MBSC Securities Corporation (the “Distributor”), a wholly-owned subsidiary of the Manager, is the distributor of the fund’s shares. The fund is authorized to issue 500 million shares of $.001 par value Common Stock.The fund currently offers four classes of shares: Class A (200 million shares authorized), Class B (100 million shares authorized), Class C (100 million shares authorized) and Class I (100 million shares authorized). Class A shares are subject to a sales charge imposed at the time of purchase. Class B shares are subject to a contingent deferred sales charge (“CDSC”) imposed on Class B share redemptions made within six years of purchase and automatically convert to Class A shares after six years. The fund no longer offers Class B shares, except in connection with dividend reinvestment and permitted exchanges of Class B shares. Class C shares are subject to a CDSC imposed on Class C shares redeemed within one year of purchase. Class I shares are sold at net asset value per share only to institutional investors. Other differences between the classes include the services offered to and the expenses borne by each class, the allocation of certain transfer agency costs and certain voting rights. Income, expenses (other than expenses attributable to a specific class), and realized and unrealized gains or losses on investments are allocated to each class of shares based on its relative net assets.
The Company accounts separately for the assets, liabilities and operations of each series. Expenses directly attributable to each series are
20
charged to that series’ operations; expenses which are applicable to all series are allocated among them on a pro rata basis.
The Financial Accounting Standards Board (“FASB”) Accounting Standards Codification (“ASC”) is the exclusive reference of authoritative U.S. generally accepted accounting principles (“GAAP”) recognized by the FASB to be applied by nongovernmental entities. Rules and interpretive releases of the Securities and Exchange Commission (“SEC”) under authority of federal laws are also sources of authoritative GAAP for SEC registrants. The fund’s financial statements are prepared in accordance with GAAP, which may require the use of management estimates and assumptions.Actual results could differ from those estimates.
The Company enters into contracts that contain a variety of indemnifications. The fund’s maximum exposure under these arrangements is unknown.The fund does not anticipate recognizing any loss related to these arrangements.
(a) Portfolio valuation: The fair value of a financial instrument is the amount that would be received to sell an asset or paid to transfer a liability in an orderly transaction between market participants at the measurement date (i.e. the exit price). GAAP establishes a fair value hierarchy that prioritizes the inputs of valuation techniques used to measure fair value.This hierarchy gives the highest priority to unadjusted quoted prices in active markets for identical assets or liabilities (Level 1 measurements) and the lowest priority to unobservable inputs (Level 3 measurements).
Additionally, GAAP provides guidance on determining whether the volume and activity in a market has decreased significantly and whether such a decrease in activity results in transactions that are not orderly. GAAP requires enhanced disclosures around valuation inputs and techniques used during annual and interim periods.
NOTES TO FINANCIAL STATEMENTS (continued)
Various inputs are used in determining the value of the fund’s investments relating to fair value measurements.These inputs are summarized in the three broad levels listed below:
Level 1—unadjusted quoted prices in active markets for identical investments.
Level 2—other significant observable inputs (including quoted prices for similar investments, interest rates, prepayment speeds, credit risk, etc.).
Level 3—significant unobservable inputs (including the fund’s own assumptions in determining the fair value of investments).
The inputs or methodology used for valuing securities are not necessarily an indication of the risk associated with investing in those securities.
Changes in valuation techniques may result in transfers in or out of an assigned level within the disclosure hierarchy. Valuation techniques used to value the fund’s investments are as follows:
Investments in securities are valued at the last sales price on the securities exchange or national securities market on which such securities are primarily traded. Securities listed on the National Market System for which market quotations are available are valued at the official closing price or, if there is no official closing price that day, at the last sales price. Securities not listed on an exchange or the national securities market, or securities for which there were no transactions, are valued at the average of the most recent bid and asked prices, except for open short positions, where the asked price is used for valuation purposes. Bid price is used when no asked price is available. Registered investment companies that are not traded on an exchange are valued at their net asset value.All preceding securities are categorized as Level 1 in the hierarchy.
Fair valuing of securities may be determined with the assistance of a pricing service using calculations based on indices of domestic securities and other appropriate indicators, such as prices of relevant American Depository Receipts and futures contracts. Utilizing
22
these techniques may result in transfers between Level 1 and Level 2 of the fair value hierarchy.
When market quotations or official closing prices are not readily available, or are determined not to reflect accurately fair value, such as when the value of a security has been significantly affected by events after the close of the exchange or market on which the security is principally traded (for example, a foreign exchange or market), but before the fund calculates its net asset value, the fund may value these investments at fair value as determined in accordance with the procedures approved by the Board of Directors. Certain factors may be considered when fair valuing investments such as: fundamental analytical data, the nature and duration of restrictions on disposition, an evaluation of the forces that influence the market in which the securities are purchased and sold, and public trading in similar securities of the issuer or comparable issuers.These securities are either categorized as Level 2 or 3 depending on the relevant inputs used.
For restricted securities where observable inputs are limited, assumptions about market activity and risk are used and are categorized as Level 3 in the hierarchy.
The following is a summary of the inputs used as of August 31, 2011 in valuing the fund’s investments:
| | | | |
| | | Level 2—Other | Level 3— | |
| | Level 1— | Significant | Significant | |
| | Unadjusted | Observable | Unobservable | |
| | Quoted Prices | Inputs | Inputs | Total |
| Assets ($) | | | | |
| Investments in Securities: | | | |
| Equity Securities— | | | | |
| Domestic† | 257,465,817 | — | — | 257,465,817 |
| Limited Partnership | | | | |
| Interests† | — | — | 1,377,689 | 1,377,689 |
| Mutual Funds | 31,448,769 | — | — | 31,448,769 |
| |
| † | See Statement of Investments for additional detailed categorizations. |
NOTES TO FINANCIAL STATEMENTS (continued)
The following is a reconciliation of Level 3 assets for which significant unobservable inputs were used to determine fair value:
| | |
| | Limited Partnership |
| | Interests ($) |
| Balance as of 8/31/2010 | 1,854,217 |
| Realized gain (loss) | 1,021,103 |
| Change in unrealized appreciation (depreciation) | 164,768 |
| Purchases | — |
| Sales | (1,662,399) |
| Transfers into Level 3 | — |
| Transfers out of Level 3 | — |
| Balance as of 8/31/2011 | 1,377,689 |
| The amount of total gains (losses) for the period | |
| included in earnings attributable to the change in | |
| unrealized gains (losses) relating to investments | |
| still held at 8/31/2011 | 164,768 |
In January 2010, FASB issued Accounting Standards Update (“ASU”) No. 2010-06 “Improving Disclosures about Fair Value Measurements” (“ASU 2010-06”). ASU 2010-06 require reporting entities to prepare new disclosures surrounding amounts and reasons for significant transfers in and out of Level 1 and Level 2 fair value measurements as well as inputs and valuation techniques used to measure fair value for both recurring and nonrecurring fair value measurements that fall in either Level 2 or Level 3. No significant transfers between Level 1 or Level 2 fair value measurements occurred at August 31, 2011. ASU No. 2010-06 also requires reporting entities to make new disclosures about information on purchases, sales, issuances and settlements on a gross basis in the reconciliation of activity in Level 3 fair value measurements.These new and revised disclosures have been adopted by the fund.
In May 2011, FASB issued ASU No. 2011-04 “Amendments to Achieve Common Fair Value Measurement and Disclosure Requirements in GAAP and International Financial Reporting Standards (“IFRS”)” (“ASU 2011-04”). ASU 2011-04 includes common requirements for measurement of and disclosure about fair value between GAAP and IFRS. ASU 2011-04 will require reporting entities to disclose the following information for fair value measurements categorized within
24
Level 3 of the fair value hierarchy: quantitative information about the unobservable inputs used in the fair value measurement, the valuation processes used by the reporting entity and a narrative description of the sensitivity of the fair value measurement to changes in unobservable inputs and the interrelationships between those unobservable inputs. In addition, ASU 2011-04 will require reporting entities to make disclosures about amounts and reasons for all transfers in and out of Level 1 and Level 2 fair value measurements.The new and revised disclosures are effective for interim and annual reporting periods beginning after December 15, 2011. At this time, management is evaluating the implications of ASU 2011-04 and its impact on the financial statements.
(b) Foreign currency transactions: The fund does not isolate that portion of the results of operations resulting from changes in foreign exchange rates on investments from the fluctuations arising from changes in the market prices of securities held. Such fluctuations are included with the net realized and unrealized gain or loss on investments.
Net realized foreign exchange gains or losses arise from sales of foreign currencies, currency gains or losses realized on securities transactions between trade and settlement dates, and the difference between the amounts of dividends, interest and foreign withholding taxes recorded on the fund’s books and the U.S. dollar equivalent of the amounts actually received or paid. Net unrealized foreign exchange gains and losses arise from changes in the value of assets and liabilities other than investments resulting from changes in exchange rates. Foreign currency gains and losses on investments are included with net realized and unrealized gain or loss on investments.
(c) Securities transactions and investment income: Securities transactions are recorded on a trade date basis. Realized gains and losses from securities transactions are recorded on the identified cost basis. Dividend income is recognized on the ex-dividend date and interest income, including, where applicable, accretion of discount and amortization of premium on investments, is recognized on the accrual basis.
NOTES TO FINANCIAL STATEMENTS (continued)
Pursuant to a securities lending agreement with The Bank of New York Mellon, a subsidiary of BNY Mellon and an affiliate of Dreyfus, the fund may lend securities to qualified institutions. It is the fund’s policy that, at origination, all loans are secured by collateral of at least 102% of the value of U.S. securities loaned and 105% of the value of foreign securities loaned. Collateral equivalent to at least 100% of the market value of securities on loan is maintained at all times. Collateral is either in the form of cash, which can be invested in certain money market mutual funds managed by the Manager, U.S. Government and Agency securities or letters of credit.The fund is entitled to receive all income on securities loaned, in addition to income earned as a result of the lending transaction. Although each security loaned is fully collateralized, the fund bears the risk of delay in recovery of, or loss of rights in, the securities loaned should a borrower fail to return the securities in a timely manner. During the period ended August 31, 2011, The Bank of New York Mellon earned $16,551 from lending portfolio securities, pursuant to the securities lending agreement.
(d) Affiliated issuers: Investments in other investment companies advised by Dreyfus are defined as “affiliated” in the Act.
The fund may invest in shares of certain affiliated investment companies also advised or managed by Dreyfus. Investments in affiliated investment companies for the period ended August 31, 2011 were as follows:
| | | | | |
| Affiliated | | | | | |
| Investment | Value | | | Value | Net |
| Company | 8/31/2010 ($) | Purchases ($) | Sales ($) | 8/31/2011 ($) | Assets (%) |
| Dreyfus | | | | | |
| Institutional | | | | | |
| Preferred | | | | | |
| Plus Money | | | | | |
| Market | | | | | |
| Fund | 10,784,000 | 172,372,000 | 173,520,000 | 9,636,000 | 3.6 |
| Dreyfus | | | | | |
| Institutional | | | | | |
| Cash | | | | | |
| Advantage | | | | | |
| Fund | 10,791,457 | 385,415,789 | 374,394,477 | 21,812,769 | 8.1 |
| Total | 21,575,457 | 557,787,789 | 547,914,477 | 31,448,769 | 11.7 |
26
(e) Dividends to shareholders: Dividends are recorded on the ex-dividend date. Dividends from investment income-net and dividends from net realized capital gains, if any, are normally declared and paid annually, but the fund may make distributions on a more frequent basis to comply with the distribution requirements of the Internal Revenue Code of 1986, as amended (the “Code”).To the extent that net realized capital gains can be offset by capital loss carryovers, it is the policy of the fund not to distribute such gains. Income and capital gain distributions are determined in accordance with income tax regulations, which may differ from GAAP.
(f) Federal income taxes: It is the policy of the fund to continue to qualify as a regulated investment company, if such qualification is in the best interests of its shareholders, by complying with the applicable provisions of the Code, and to make distributions of taxable income sufficient to relieve it from substantially all federal income and excise taxes.
As of and during the period ended August 31, 2011, the fund did not have any liabilities for any uncertain tax positions.The fund recognizes interest and penalties, if any, related to uncertain tax positions as income tax expense in the Statement of Operations. During the period, the fund did not incur any interest or penalties.
Each of the tax years in the four-year period ended August 31, 2011 remains subject to examination by the Internal Revenue Service and state taxing authorities.
At August 31, 2011, the components of accumulated earnings on a tax basis were as follows: accumulated capital losses $89,102,131 and unrealized appreciation $19,425,186.
The accumulated capital loss carryover is available for federal income tax purposes subject to annual limitations on the utilization pursuant to Section 382 of the Internal Revenue Code. If not applied, $73,225,503 of the carryover expires in fiscal 2012, $15,159,711 expires in fiscal 2017 and $716,917 expires in fiscal 2018.
NOTES TO FINANCIAL STATEMENTS (continued)
During the period ended August 31, 2011, as a result of permanent book to tax differences, primarily due to the tax treatment for net operating losses, limited partnerships and a capital loss carryover expiration, the fund increased accumulated undistributed investment income-net by $2,884,755, increased accumulated net realized gain (loss) on investments by $18,169,135 and decreased paid-in capital by $21,053,890. Net assets and net asset value per share were not affected by this reclassification.
NOTE 2—Bank Lines of Credit:
The fund participates with other Dreyfus-managed funds in a $225 million unsecured credit facility led by Citibank, N.A. and a $300 million unsecured credit facility provided by The Bank of New York Mellon (each, a “Facility”), each to be utilized primarily for temporary or emergency purposes, including the financing of redemptions. In connection therewith, the fund has agreed to pay its pro rata portion of commitment fees for each Facility. Interest is charged to the fund based on rates determined pursuant to the terms of the respective Facility at the time of borrowing.
The average amount of borrowings outstanding under the Facilities during the period ended August 31, 2011 was approximately $163,300 with a related weighted average annualized interest rate of 1.41%.
NOTE 3—Management Fee and Other Transactions with Affiliates:
(a) Pursuant to a management agreement with the Manager, the management fee is computed at the annual rate of .75% of the value of the fund’s average daily net assets and is payable monthly.
During the period ended August 31, 2011, the Distributor retained $22,460 from commissions earned on sales of the fund’s Class A shares and $3,297 and $3,311 from CDSCs on redemptions of the fund’s Class B and Class C shares, respectively.
28
(b) Under the Distribution Plan (the “Plan”) adopted pursuant to Rule 12b-1 under the Act, Class B and Class C shares pay the Distributor for distributing their shares at an annual rate of .75% of the value of the average daily net assets of Class B and Class C shares. During the period ended August 31, 2011, Class B and Class C shares were charged $14,275 and $224,719, respectively, pursuant to the Plan.
(c) Under the Shareholder Services Plan, Class A, Class B and Class C shares pay the Distributor at an annual rate of .25% of the value of their average daily net assets for the provision of certain services.The services provided may include personal services relating to shareholder accounts, such as answering shareholder inquiries regarding the fund and providing reports and other information, and services related to the maintenance of shareholder accounts. The Distributor may make payments to Service Agents (a securities dealer, financial institution or industry professional) in respect of these services. The Distributor determines the amounts to be paid to Service Agents. During the period ended August 31, 2011, Class A, Class B and Class C shares were charged $730,947, $4,758 and $74,907, respectively, pursuant to the Shareholder Services Plan.
The fund compensates Dreyfus Transfer, Inc., a wholly-owned subsidiary of the Manager, under a transfer agency agreement for providing personnel and facilities to perform transfer agency services for the fund. During the period ended August 31, 2011, the fund was charged $182,161 pursuant to the transfer agency agreement, which is included in Shareholder servicing costs in the Statement of Operations.
The fund has arrangements with the custodian and cash management bank whereby the fund may receive earnings credits when positive cash balances are maintained, which are used to offset custody and cash management fees. For financial reporting purposes, the fund includes net earnings credits as an expense offset in the Statement of Operations.
NOTES TO FINANCIAL STATEMENTS (continued)
The fund compensates The Bank of New York Mellon under a cash management agreement for performing cash management services related to fund subscriptions and redemptions. During the period ended August 31, 2011, the fund was charged $54,435 pursuant to the cash management agreement, which is included in Shareholder servicing costs in the Statement of Operations.These fees were partially offset by earnings credits of $2,481.
The fund also compensates The Bank of New York Mellon under a custody agreement for providing custodial services for the fund. During the period ended August 31, 2011, the fund was charged $26,161 pursuant to the custody agreement.
During the period ended August 31, 2011, the fund was charged $7,225 for services performed by the Chief Compliance Officer.
The components of “Due to The Dreyfus Corporation and affiliates” in the Statement of Assets and Liabilities consist of: management fees $169,199, Rule 12b-1 distribution plan fees $17,962, shareholder services plan fees $53,292, custodian fees $8,000, chief compliance officer fees $3,253 and transfer agency per account fees $54,230.
(d) Each Board member also serves as a Board member of other funds within the Dreyfus complex. Annual retainer fees and attendance fees are allocated to each fund based on net assets.
NOTE 4—Securities Transactions:
The aggregate amount of purchases and sales of investment securities, excluding short-term securities, during the period ended August 31, 2011 amounted to $288,095,002 and $333,106,238, respectively.
At August 31, 2011, the cost of investments for federal income tax purposes was $270,867,089; accordingly, accumulated net unrealized appreciation on investments was $19,425,186, consisting of $47,374,448 gross unrealized appreciation and $27,949,262 gross unrealized depreciation.
30
|
| REPORT OF INDEPENDENT REGISTERED |
| PUBLIC ACCOUNTING FIRM |
Shareholders and Board of Directors
Dreyfus Technology Growth Fund
We have audited the accompanying statement of assets and liabilities, including the statement of investments, of Dreyfus Technology Growth Fund (one of the series comprising Advantage Funds, Inc.) as of August 31, 2011, and the related statement of operations for the year then ended, the statement of changes in net assets for each of the two years in the period then ended, and financial highlights for each of the years indicated therein.These financial statements and financial highlights are the responsibility of the Fund’s management. Our responsibility is to express an opinion on these financial statements and financial highlights based on our audits.
We conducted our audits in accordance with the standards of the Public Company Accounting Oversight Board (United States).Those standards require that we plan and perform the audit to obtain reasonable assurance about whether the financial statements and financial highlights are free of material misstatement.We were not engaged to perform an audit of the Fund’s internal control over financial reporting. Our audits included consideration of internal control over financial reporting as a basis for designing audit procedures that are appropriate in the circumstances, but not for the purpose of expressing an opinion on the effectiveness of the Fund’s internal control over financial reporting. Accordingly, we express no such opinion.An audit also includes examining, on a test basis, evidence supporting the amounts and disclosures in the financial statements and financial highlights, assessing the accounting principles used and significant estimates made by management, and evaluating the overall financial statement presentation. Our procedures included confirmation of securities owned as of August 31, 2011 by correspondence with the custodian and others.We believe that our audits provide a reasonable basis for our opinion.
In our opinion, the financial statements and financial highlights referred to above present fairly, in all material respects, the financial position of Dreyfus Technology Growth Fund at August 31, 2011, the results of its operations for the year then ended, the changes in its net assets for each of the two years in the period then ended, and the financial highlights for each of the indicated years, in conformity with U.S. generally accepted accounting principles.

|
| New York, New York |
| October 27, 2011 |
|
| INFORMATION ABOUT THE RENEWAL OF THE |
| FUND’S MANAGEMENT AGREEMENT (Unaudited) |
At a meeting of the fund’s Board of Directors held on March 1, 2011, the Board considered the renewal of the fund’s Management Agreement pursuant to which Dreyfus provides the fund with investment advisory and administrative services (the “Agreement”). The Board members, none of whom are “interested persons” (as defined in the Investment Company Act of 1940, as amended) of the fund, were assisted in their review by independent legal counsel and met with counsel in executive session separate from representatives of Dreyfus. In considering the renewal of the Agreement, the Board considered all factors that it believed to be relevant, including those discussed below.The Board did not identify any one factor as dispositive, and each Board member may have attributed different weights to the factors considered.
Analysis of Nature, Extent, and Quality of Services Provided to the Fund.The Board members considered information previously provided to them in presentations from representatives of Dreyfus regarding the nature, extent, and quality of the services provided to funds in the Dreyfus fund complex, and representatives of Dreyfus confirmed that there had been no material changes in this information. Dreyfus provided the number of open accounts in the fund, the fund’s asset size and the allocation of fund assets among distribution channels. Dreyfus also had previously provided information regarding the diverse intermediary relationships and distribution channels of funds in the Dreyfus fund complex and Dreyfus’ corresponding need for broad, deep, and diverse resources to be able to provide ongoing shareholder services to each distribution channel, including the distribution channel(s) for the fund.
The Board members also considered research support available to, and portfolio management capabilities of, the fund’s portfolio management personnel and that Dreyfus also provides oversight of day-to-day fund operations, including fund accounting and administration and assistance in meeting legal and regulatory requirements.The Board members also considered Dreyfus’ extensive administrative, accounting, and compliance infrastructures.The Board also considered portfolio management’s brokerage policies and practices (including policies and practices regarding soft dollars) and the standards applied in seeking best execution.
32
Comparative Analysis of the Fund’s Performance and Management Fee and Expense Ratio. The Board members reviewed reports prepared by Lipper, Inc. (“Lipper”), an independent provider of investment company data, which included information comparing (1) the fund’s performance with the performance of a group of comparable funds (the “Performance Group”) and with a broader group of funds (the “Performance Universe”), all for various periods ended December 31, 2010, and (2) the fund’s actual and contractual management fees and total expenses with those of a group of comparable funds (the “Expense Group”) and with a broader group of funds (the “Expense Universe”), the information for which was derived in part from fund financial statements available to Lipper as of December 31, 2010. Dreyfus previously had furnished the Board with a description of the methodology Lipper used to select the Performance Group and Performance Universe and the Expense Group and Expense Universe.
Dreyfus representatives stated that the usefulness of performance comparisons may be affected by a number of factors, including different investment limitations that may be applicable to the fund and comparison funds. The Board members discussed the results of the comparisons and noted that the fund’s total return performance was at or above the Performance Group and Performance Universe medians for most of the periods (in the first quartile of the Performance Group and Performance Universe for the one- and three-year periods). Dreyfus also provided a comparison of the fund’s calendar year total returns to the returns of the fund’s benchmark index.
The Board members also reviewed the range of actual and contractual management fees and total expenses of the Expense Group and Expense Universe funds and discussed the results of the comparisons. They noted that the fund’s contractual management fee was below the Expense Group median and that the fund’s actual management fee and total expense ratio were below the Expense Group and Expense Universe medians.
|
| INFORMATION ABOUT THE RENEWAL OF THE FUND’S |
| MANAGEMENT AGREEMENT (Unaudited) (continued) |
Representatives of Dreyfus reviewed with the Board members the management or investment advisory fees (1) paid by funds advised or administered by Dreyfus that are in the same Lipper category as the fund and (2) paid to Dreyfus or the Dreyfus-affiliated primary employer of the fund’s primary portfolio manager for advising any separate accounts and/or other types of client portfolios that are considered to have similar investment strategies and policies as the fund (the “Similar Clients”), and explained the nature of the Similar Clients.They discussed differences in fees paid and the relationship of the fees paid in light of any differences in the services provided and other relevant factors.The Board members considered the relevance of the fee information provided for the Similar Clients to evaluate the appropriateness and reasonableness of the fund’s management fee.
Analysis of Profitability and Economies of Scale. Dreyfus’ representatives reviewed the expenses allocated and profit received by Dreyfus and the resulting profitability percentage for managing the fund, and the method used to determine the expenses and profit.The Board concluded that the profitability results were not unreasonable, given the services rendered and service levels provided by Dreyfus.The Board previously had been provided with information prepared by an independent consulting firm regarding Dreyfus’ approach to allocating costs to, and determining the profitability of, individual funds and the entire Dreyfus fund complex. The consulting firm also had analyzed where any economies of scale might emerge in connection with the management of a fund.
The Board’s counsel stated that the Board members should consider the profitability analysis (1) as part of their evaluation of whether the fees under the Agreement bear a reasonable relationship to the mix of services provided by Dreyfus, including the nature, extent and quality of such services, and (2) in light of the relevant circumstances for the fund and the extent to which economies of scale would be realized if the fund grows and whether fee levels reflect these economies of scale for the benefit of fund shareholders.They also noted that, as a result of shared and allocated costs among funds in the Dreyfus funds complex, the extent of economies of scale could depend substantially on the level of assets in the complex as a whole, so that increases and decreases in complex-wide
34
assets can affect potential economies of scale in a manner that is disproportionate to, or even in the opposite direction from, changes in the fund’s asset level.The Board members also considered potential benefits to Dreyfus from acting as investment adviser and noted the soft dollar arrangements in effect for trading the fund’s investments.
At the conclusion of these discussions, the Board agreed that it had been furnished with sufficient information to make an informed business decision with respect to the renewal of the Agreement. Based on the discussions and considerations as described above, the Board concluded and determined as follows.
The Board concluded that the nature, extent and quality of the services provided by Dreyfus are adequate and appropriate.
The Board was satisfied with the fund’s performance.
The Board concluded that the fee paid to Dreyfus was reasonable in light of the considerations described above.
The Board determined that the economies of scale which may accrue to Dreyfus and its affiliates in connection with the management of the fund had been adequately considered by Dreyfus in connection with the fee rate charged to the fund pursuant to the Agreement and that, to the extent in the future it were determined that material economies of scale had not been shared with the fund, the Board would seek to have those economies of scale shared with the fund.
The Board members considered these conclusions and determinations, along with information received on a routine and regular basis throughout the year. In addition, it should be noted that the Board’s consideration of the contractual fee arrangements for this fund had the benefit of a number of years of reviews of prior or similar agreements during which lengthy discussions took place between the Board members and Dreyfus representatives. Certain aspects of the arrangements may receive greater scrutiny in some years than in others, and the Board members’ conclusions may be based, in part, on their consideration of the same or similar arrangements in prior years. The Board members determined that renewal of the Agreement was in the best interests of the fund and its shareholders.
BOARD MEMBERS INFORMATION (Unaudited)
|
| Joseph S. DiMartino (67) |
| Chairman of the Board (1995) |
| Principal Occupation During Past 5Years: |
| • Corporate Director and Trustee |
| Other Public Company Board Memberships During Past 5Years: |
| • CBIZ (formerly, Century Business Services, Inc.), a provider of outsourcing functions for small |
| and medium size companies, Director (1997-present) |
| • Sunair Services Corporation, a provider of certain outdoor-related services to homes and |
| businesses, Director (2005-2009) |
| • The Newark Group, a provider of a national market of paper recovery facilities, paperboard |
| mills and paperboard converting plants, Director (2000-2010) |
| No. of Portfolios for which Board Member Serves: 167 |
| ——————— |
| Peggy C. Davis (68) |
| Board Member (2006) |
| Principal Occupation During Past 5Years: |
| • Shad Professor of Law, New York University School of Law |
| • Writer and teacher in the fields of evidence, constitutional theory, family law, social sciences |
| and the law, legal process and professional methodology and training |
| No. of Portfolios for which Board Member Serves: 53 |
| ——————— |
| David P. Feldman (71) |
| Board Member (1996) |
| Principal Occupation During Past 5Years: |
| • Corporate Director and Trustee |
| Other Public Company Board Memberships During Past 5Years: |
| • BBH Mutual Funds Group (4 registered mutual funds), Director (1992-present) |
| • QMed, Inc. a healthcare company, Director (1999-2007) |
| No. of Portfolios for which Board Member Serves: 50 |
36
|
| Ehud Houminer (71) |
| Board Member (1993) |
| Principal Occupation During Past 5Years: |
| • Executive-in-Residence at the Columbia Business School, Columbia University (1992-present) |
| Other Public Company Board Memberships During Past 5Years: |
| • Avnet Inc., an electronics distributor, Director (1993-present) |
| No. of Portfolios for which Board Member Serves: 64 |
| ——————— |
| Dr. Martin Peretz (72) |
| Board Member (2006) |
| Principal Occupation During Past 5Years: |
| • Editor-in-Chief Emeritus of The New Republic Magazine (2010-present) (previously, |
| Editor-in-Chief, 1974-2010) |
| • Director of TheStreet.com, a financial information service on the web (1996-present) |
| No. of Portfolios for which Board Member Serves: 35 |
| ——————— |
Once elected all Board Members serve for an indefinite term, but achieve Emeritus status upon reaching age 80.The address of the Board Members and Officers is in c/o The Dreyfus Corporation, 200 Park Avenue, NewYork, NewYork 10166.Additional information about the Board Members is available in the fund’s Statement of Additional Information which can be obtained from Dreyfus free of charge by calling this toll free number: 1-800-DREYFUS.
James F. Henry, Emeritus Board Member
Dr. Paul A. Marks, Emeritus Board Member
Gloria Messinger, Emeritus Board Member
OFFICERS OF THE FUND (Unaudited)
BRADLEY J. SKAPYAK, President since January 2010.
Chief Operating Officer and a director of the Manager since June 2009. From April 2003 to June 2009, Mr. Skapyak was the head of the Investment Accounting and Support Department of the Manager. He is an officer of 75 investment companies (comprised of 167 portfolios) managed by the Manager. He is 52 years old and has been an employee of the Manager since February 1988.
MICHAEL A. ROSENBERG, Vice President and Secretary since August 2005.
Assistant General Counsel of BNY Mellon, and an officer of 76 investment companies (comprised of 192 portfolios) managed by the Manager. He is 51 years old and has been an employee of the Manager since October 1991.
KIESHA ASTWOOD, Vice President and Assistant Secretary since January 2010.
Counsel of BNY Mellon, and an officer of 76 investment companies (comprised of 192 portfolios) managed by the Manager. She is 38 years old and has been an employee of the Manager since July 1995.
JAMES BITETTO, Vice President and Assistant Secretary since August 2005.
Senior Counsel of BNY Mellon and Secretary of the Manager, and an officer of 76 investment companies (comprised of 192 portfolios) managed by the Manager. He is 45 years old and has been an employee of the Manager since December 1996.
JONI LACKS CHARATAN, Vice President and Assistant Secretary since August 2005.
Senior Counsel of BNY Mellon, and an officer of 76 investment companies (comprised of 192 portfolios) managed by the Manager. She is 55 years old and has been an employee of the Manager since October 1988.
JOSEPH M. CHIOFFI, Vice President and Assistant Secretary since August 2005.
Senior Counsel of BNY Mellon, and an officer of 76 investment companies (comprised of 192 portfolios) managed by the Manager. He is 49 years old and has been an employee of the Manager since June 2000.
KATHLEEN DENICHOLAS, Vice President and Assistant Secretary since January 2010.
Managing Counsel of BNY Mellon, and an officer of 76 investment companies (comprised of 192 portfolios) managed by the Manager. She is 36 years old and has been an employee of the Manager since February 2001.
JANETTE E. FARRAGHER, Vice President and Assistant Secretary since August 2005.
Assistant General Counsel of BNY Mellon, and an officer of 76 investment companies (comprised of 192 portfolios) managed by the Manager. She is 48 years old and has been an employee of the Manager since February 1984.
JOHN B. HAMMALIAN, Vice President and Assistant Secretary since August 2005.
Senior Managing Counsel of BNY Mellon, and an officer of 76 investment companies (comprised of 192 portfolios) managed by the Manager. He is 48 years old and has been an employee of the Manager since February 1991.
M. CRISTINA MEISER, Vice President and Assistant Secretary since January 2010.
Senior Counsel of BNY Mellon, and an officer of 76 investment companies (comprised of 192 portfolios) managed by the Manager. She is 41 years old and has been an employee of the Manager since August 2001.
38
ROBERT R. MULLERY, Vice President and Assistant Secretary since August 2005.
Managing Counsel of BNY Mellon, and an officer of 76 investment companies (comprised of 192 portfolios) managed by the Manager. He is 59 years old and has been an employee of the Manager since May 1986.
JEFF PRUSNOFSKY, Vice President and Assistant Secretary since August 2005.
Senior Managing Counsel of BNY Mellon, and an officer of 76 investment companies (comprised of 192 portfolios) managed by the Manager. He is 46 years old and has been an employee of the Manager since October 1990.
JAMES WINDELS, Treasurer since November 2001.
Director – Mutual Fund Accounting of the Manager, and an officer of 76 investment companies (comprised of 192 portfolios) managed by the Manager. He is 52 years old and has been an employee of the Manager since April 1985.
RICHARD CASSARO, Assistant Treasurer since January 2008.
Senior Accounting Manager – Money Market and Municipal Bond Funds of the Manager, and an officer of 76 investment companies (comprised of 192 portfolios) managed by the Manager. He is 52 years old and has been an employee of the Manager since September 1982.
GAVIN C. REILLY, Assistant Treasurer since December 2005.
Tax Manager of the Investment Accounting and Support Department of the Manager, and an officer of 76 investment companies (comprised of 192 portfolios) managed by the Manager. He is 43 years old and has been an employee of the Manager since April 1991.
ROBERT ROBOL, Assistant Treasurer since August 2005.
Senior Accounting Manager – Fixed Income Funds of the Manager, and an officer of 76 investment companies (comprised of 192 portfolios) managed by the Manager. He is 47 years old and has been an employee of the Manager since October 1988.
ROBERT SALVIOLO, Assistant Treasurer since July 2007.
Senior Accounting Manager – Equity Funds of the Manager, and an officer of 76 investment companies (comprised of 192 portfolios) managed by the Manager. He is 44 years old and has been an employee of the Manager since June 1989.
ROBERT SVAGNA, Assistant Treasurer since December 2002.
Senior Accounting Manager – Equity Funds of the Manager, and an officer of 76 investment companies (comprised of 192 portfolios) managed by the Manager. He is 44 years old and has been an employee of the Manager since November 1990.
OFFICERS OF THE FUND (Unaudited) (continued)
JOSEPH W. CONNOLLY, Chief Compliance Officer since October 2004.
Chief Compliance Officer of the Manager and The Dreyfus Family of Funds (76 investment companies, comprised of 192 portfolios). From November 2001 through March 2004, Mr. Connolly was first Vice-President, Mutual Fund Servicing for Mellon Global Securities Services. In that capacity, Mr. Connolly was responsible for managing Mellon’s Custody, Fund Accounting and Fund Administration services to third-party mutual fund clients. He is 54 years old and has served in various capacities with the Manager since 1980, including manager of the firm’s Fund Accounting Department from 1997 through October 2001.
STEPHEN J. STOREN, Anti-Money Laundering Compliance Officer since May 2011.
Chief Compliance Officer of the Distributor, and the Anti-Money Laundering Compliance Officer of 72 investment companies (comprised of 188 portfolios) managed by the Manager. He is 56 years old and has been an employee of the Distributor since October 1999.
40
For More Information

Telephone Call your financial representative or 1-800-DREYFUS
Mail The Dreyfus Family of Funds, 144 Glenn Curtiss Boulevard, Uniondale, NY 11556-0144
The fund files its complete schedule of portfolio holdings with the Securities and Exchange Commission (“SEC”) for the first and third quarters of each fiscal year on Form N-Q. The fund’s Forms N-Q are available on the SEC’s website at http://www.sec.gov and may be reviewed and copied at the SEC’s Public Reference Room in Washington, DC. Information on the operation of the Public Reference Room may be obtained by calling 1-800-SEC-0330.
A description of the policies and procedures that the fund uses to determine how to vote proxies relating to portfolio securities, and information regarding how the fund voted these proxies for the most recent 12-month period ended June 30 is available at http://www.dreyfus.com and on the SEC’s website at http://www.sec.gov. The description of the policies and procedures is also available without charge, upon request, by calling 1-800-DREYFUS.

Item 2. Code of Ethics.
The Registrant has adopted a code of ethics that applies to the Registrant's principal executive officer, principal financial officer, principal accounting officer or controller, or persons performing similar functions. There have been no amendments to, or waivers in connection with, the Code of Ethics during the period covered by this Report.
Item 3. Audit Committee Financial Expert.
The Registrant's Board has determined that David P. Feldman, a member of the Audit Committee of the Board, is an audit committee financial expert as defined by the Securities and Exchange Commission (the "SEC"). Mr. David P. Feldman is "independent" as defined by the SEC for purposes of audit committee financial expert determinations.
Item 4. Principal Accountant Fees and Services.
(a) Audit Fees. The aggregate fees billed for each of the last two fiscal years (the "Reporting Periods") for professional services rendered by the Registrant's principal accountant (the "Auditor") for the audit of the Registrant's annual financial statements or services that are normally provided by the Auditor in connection with the statutory and regulatory filings or engagements for the Reporting Periods, were $200,225 in 2010 and $222,792 in 2011.
(b) Audit-Related Fees. The aggregate fees billed in the Reporting Periods for assurance and related services by the Auditor that are reasonably related to the performance of the audit of the Registrant's financial statements and are not reported under paragraph (a) of this Item 4 were $43,674 in 2010 and $48,000 in 2011. These services consisted of one or more of the following: (i) agreed upon procedures related to compliance with Internal Revenue Code section 817(h), (ii) security counts required by Rule 17f-2 under the Investment Company Act of 1940, as amended, (iii) advisory services as to the accounting or disclosure treatment of Registrant transactions or events and (iv) advisory services to the accounting or disclosure treatment of the actual or potential impact to the Registrant of final or proposed rules, standards or interpretations by the Securities and Exchange Commission, the Financial Accounting Standards Boards or other regulatory or standard-setting bodies.
The aggregate fees billed in the Reporting Periods for non-audit assurance and related services by the Auditor to the Registrant's investment adviser (not including any sub-investment adviser whose role is primarily portfolio management and is subcontracted with or overseen by another investment adviser), and any entity controlling, controlled by or under common control with the investment adviser that provides ongoing services to the Registrant ("Service Affiliates"), that were reasonably related to the performance of the annual audit of the Service Affiliate, which required pre-approval by the Audit Committee were $- in 2010 and $- in 2011.
(c) Tax Fees. The aggregate fees billed in the Reporting Periods for professional services rendered by the Auditor for tax compliance, tax advice, and tax planning ("Tax Services") were $25,525 in 2010 and $24,023 in 2011. These services consisted of: (i) review or preparation of U.S. federal, state, local and excise tax returns; (ii) U.S. federal, state and local tax planning, advice and assistance regarding statutory, regulatory or administrative developments; (iii) tax advice regarding tax qualification matters and/or treatment of various financial instruments held or proposed to be acquired or held, and (iv) determination of Passive Foreign Investment Companies. The aggregate fees billed in the Reporting Periods for Tax Services by the Auditor to Service Affiliates, which required pre-approval by the Audit Committee were $- in 2010 and $- in 2011.
(d) All Other Fees. The aggregate fees billed in the Reporting Periods for products and services provided by the Auditor, other than the services reported in paragraphs (a) through (c) of this Item, were $4,672 in 2010 and $1,424 in 2011. These services consisted of a review of the Registrant's anti-money laundering program.
The aggregate fees billed in the Reporting Periods for Non-Audit Services by the Auditor to Service Affiliates, other than the services reported in paragraphs (b) through (c) of this Item, which required pre-approval by the Audit Committee, were $- in 2010 and $- in 2011.
(e)(1) Audit Committee Pre-Approval Policies and Procedures. The Registrant's Audit Committee has established policies and procedures (the "Policy") for pre-approval (within specified fee limits) of the Auditor's engagements for non-audit services to the Registrant and Service Affiliates without specific case-by-case consideration. The pre-approved services in the Policy can include pre-approved audit services, pre-approved audit-related services, pre-approved tax services and pre-approved all other services. Pre-approval considerations include whether the proposed services are compatible with maintaining the Auditor's independence. Pre-approvals pursuant to the Policy are considered annually.
(e)(2) Note: None of the services described in paragraphs (b) through (d) of this Item 4 were approved by the Audit Committee pursuant to paragraph (c)(7)(i)(C) of Rule 2-01 of Regulation S-X.
(f) None of the hours expended on the principal accountant's engagement to audit the registrant's financial statements for the most recent fiscal year were attributed to work performed by persons other than the principal account's full-time, permanent employees.
Non-Audit Fees. The aggregate non-audit fees billed by the Auditor for services rendered to the Registrant, and rendered to Service Affiliates, for the Reporting Periods were $28,173,266 in 2010 and $16,103,335 in 2011.
Auditor Independence. The Registrant's Audit Committee has considered whether the provision of non-audit services that were rendered to Service Affiliates, which were not pre-approved (not requiring pre-approval), is compatible with maintaining the Auditor's independence.
Item 5. Audit Committee of Listed Registrants.
Not applicable. [CLOSED-END FUNDS ONLY]
Item 6. Investments.
(a) Not applicable.
Item 7. Disclosure of Proxy Voting Policies and Procedures for Closed-End Management Investment Companies.
Not applicable. [CLOSED-END FUNDS ONLY]
Item 8. Portfolio Managers of Closed-End Management Investment Companies.
Not applicable. [CLOSED-END FUNDS ONLY, beginning with reports for periods ended on and after December 31, 2005]
Item 9. Purchases of Equity Securities by Closed-End Management Investment Companies and Affiliated Purchasers.
Not applicable. [CLOSED-END FUNDS ONLY]
Item 10. Submission of Matters to a Vote of Security Holders.
There have been no material changes to the procedures applicable to Item 10.
Item 11. Controls and Procedures.
(a) The Registrant's principal executive and principal financial officers have concluded, based on their evaluation of the Registrant's disclosure controls and procedures as of a date within 90 days of the filing date of this report, that the Registrant's disclosure controls and procedures are reasonably designed to ensure that information required to be disclosed by the Registrant on Form N-CSR is recorded, processed, summarized and reported within the required time periods and that information required to be disclosed by the Registrant in the reports that it files or submits on Form N-CSR is accumulated and communicated to the Registrant's management, including its principal executive and principal financial officers, as appropriate to allow timely decisions regarding required disclosure.
(b) There were no changes to the Registrant's internal control over financial reporting that occurred during the second fiscal quarter of the period covered by this report that have materially affected, or are reasonably likely to materially affect, the Registrant's internal control over financial reporting.
Item 12. Exhibits.
(a)(1) Code of ethics referred to in Item 2.
(a)(2) Certifications of principal executive and principal financial officers as required by Rule 30a-2(a) under the Investment Company Act of 1940.
(a)(3) Not applicable.
(b) Certification of principal executive and principal financial officers as required by Rule 30a-2(b) under the Investment Company Act of 1940.
SIGNATURES
Pursuant to the requirements of the Securities Exchange Act of 1934 and the Investment Company Act of 1940, the Registrant has duly caused this Report to be signed on its behalf by the undersigned, thereunto duly authorized.
Advantage Funds, Inc.
By: /s/ Bradley J. Skapyak |
Bradley J. Skapyak, President |
Date: | October 24, 2011 |
|
Pursuant to the requirements of the Securities Exchange Act of 1934 and the Investment Company Act of 1940, this Report has been signed below by the following persons on behalf of the Registrant and in the capacities and on the dates indicated. |
|
By: /s/ Bradley J. Skapyak |
Bradley J. Skapyak, President |
Date: | October 24, 2011 |
|
By: /s/ James Windels |
James Windels, Treasurer |
Date: | October 24, 2011 |
|
EXHIBIT INDEX
(a)(1) Code of ethics referred to in Item 2.
(a)(2) Certifications of principal executive and principal financial officers as required by Rule 30a-2(a) under the Investment Company Act of 1940. (EX-99.CERT)
(b) Certification of principal executive and principal financial officers as required by Rule 30a-2(b) under the Investment Company Act of 1940. (EX-99.906CERT)
